
ALTAVRA | Emini - Stock Index Futures and Options on Futures
Upload
khangminh22Category
view
0download
0
ED 102 317
AUTHORTITLE
INSTITUTION
REPORT NOPUB DATENOTEAVAILABLE FROM
DOCUMENT RESUME
CE 003 017
Adams, Forrest H. Ed.; Mendenhall, Robert C., Ed.Evaluation of Cardiology Training and ManpowerRequirements.American Coll. of Cardiology, Bethesda, Md.; NationalHeart and Lung Inst. (DREW /PHS), Bethesda, Md.;University of Southern California, Los Angeles.School of Medicine.?HEW-NIH-74-62373333p.National Technical Information .-lrvices, Springfield,Virginia 22151 (DREW- Publication No. NIM-74-623)
EDRS PRICE MF-$0.76 HC-$17.13 PLUS POSTAGEDESCRIPTORS Content Analysis; Data Analysis; *Educational Needs;
Futures (of Society); *Health Occupations; HigherEducation; Manpower Development; *Manpower Needs;*Medical Education; Medical Services; *NationalSurveys; Professional Training; Program Descriptions;Research Projects; Summative Evaluation; Tables(Data); Training Objectives
IDENTIFIERS *Cardiology; Needs Assessment
ABSTRACTBegun in June, 1971 and completed in October 1973,
the study had the following specific goals: to define thecardiologist's role; to determine cardiology training programobjectives; to determine manpower needs for cardiologists; and todetermine the educational needs of cardiologists. The majorinformation was sought from all active cardiologists and allcardiology training programs in the United States and employed theuse of questionnaires, log-diaries, content analysis, and interviews.The data furnishes an estimate of present and future manpower needsfor cardiologists in the fields of patient care, teaching, andresearch within the United States. It also provides a description ofthe current practice of cardiology and identifies deficiencies inexisting training programs in cardiology. Further, the study projectsthe future activities of the cardiologist, an aid in planning futuretraining experiences for them. Contributors to the study include: W.H. Abelmann, S. Abrahamson, F. H. Adams, N. O. Fowler, P. L. ?rammer,R. W. Gifford, Jr., R. A. Girard, W. P. Harvey, H. N. Hultgren, F. Y.K. Lau, H. D. McIntosh, R. C. Mendenhall, W. D. Nelligan, W. H.Pritchard, A. Soffer, and H. J. C. Swan. (MW)

BEST COPY AVAILABLE
Report of an
lki 11 91 Ui NOulio)1II
SCOPE OF mums? NOTICE
The ERIC Facility has *manedthis document pocentneto: aIn out leFfilelhent. thn documentIt alto of interest to the clewinghouses noted to the tight. Index.mg should reflect then specialpoints of view.
Sap v52 g
Tit 5]) 5)15
2
U I DEPARTMENT Oft NBAI.T14.EDUCATION & WELFARENATIONAL INSTITUTE OF
EDUCATIONTHIS DOCUMENT HAS SEEN Qum()DUCE() EXACTLY AS RECEIVED FROMTHE PERSON OR ORGANIZATION ORIGINAT ING IT POINTS OF VIEW OR OPINIONSSTATED DO NOT NECESSARILY REMSENT OFFICIAL NATIONAL INSTITUTE OFEDUCATION POSITION OR POLICY

NOTICE
This report was prepared as an account of work sponsored by the
National Heart and Lung Institute. It is printed as received.
It is not to be construed as a report, opinion, or recommendation
of the National Heart and Lung Institute.
Availability:
Printed in the United States of America
Available from
National Technical Information Services
Springfield, Virginia 22151
3

EVALUATION OF CARDIOLOGY TRAINING
AND MANPOWER REQUIREMENTS
Edited byForrest H. Adams, M.D.
andRobert C. Mendenhall, M. S.
Supported under Contract 4tINIIH 71-2516 from the NationalHeart and Lung Institute, National Institutes of Health tothe A'-Jrican College of Cardiology, 9650 Rockville Pike,Be the sda Maryland.
Subcontract to "Tniversity of Southern California School ofMedicine, Division: of Research in Medical Education forstudy design, analysis and reporting.
DHEW Publication No. (NIH) 74-623
r . . 4
1

2
CONTRIBUTORS
Walter H. Abelmann, M.D., Professor of Medicine, Harvard Medical School
Stephen Abrahamson, Ph.D., Professor and Chairman, Department of MedicalEducation, University of Southern California School of Medicine
Forrest H. Adams, M.D., Professor of Pediatrics (Cardiology), Head, Divisionof Cardiology, University of California, Los Angeles School ofMedicine
Noble 0. Fowler, M.D., Professor of Medicine, Director, Division of Car-diology, University of Cincinnati College of Medicine
Peter L. Frommer, M.D., Associate Director for Cardiology, Division of Heartand Vascular Diseases, National Heart and Ix gig Institute, NationalInstitutes of Health
Ray W. GifF.ord, Jr.,, M.D., Head, Department of Hyp,rtension and Nephrology,Cleveland Clinic Foundation
Roger A. Girard, Ph.D., Resenrch Associate, Department of Medical Educa-tion, University of Southern California School of Medicine
W. Proctor Harvey, M.D.. Professor of Medicine, Director, Division ofCardiology, Georgetown University School of Medicine
Herbert N. Hultgren, M.D.: Professor of Medicins, Stanford UniversitySchool of Medicine and Chief, Cardiology Service, Palo Alto V.A.Hospital
Francis Y. K. Lau, M.D., Professor of Medicine, University of SouthernCalifornia School of Medicine, Chief of Cardiology USC-LAC Medi-cal Center
Henry D. McIntosh, M.D., Professor and Chairman, Department of MedicineBaylor University School of Medicine
Robert C. Mendenhall, M.S., Research Associate, Department of MedicalEducation, University of Southern California School of Medicine
William D. Nelligan, E/zecutive Director, American College of Cardiology
Walter H. Pritchard, M.D., Professor of Medicine, Case Western ReserveSchool of Medicine
Alfred Soifer, M.D., Executive Director, American College of Chest Physicians4:
IL T. C. Swan, M.D. [Director, Department of Cardiology, Cedars SinaiMedical Center
5

3
PREFACE
Beginning in June 1967, the National Heart and Lung Institute supported astudy conducted by the Sub-Board of Pediatric Cardiology of the AmericanBoard of Pediatrics entitled "Evaluation of Pediatric Cardiology: Training andTesting." This study involving all of the diplomates of the Board of PediatricCardiology had 3 major goals:
1. To define the professional roles and essential competence of thepediatric cardiologist
2. To develop and evaluate approaches for assessing the competenceof the pediatric cardiologist, and
3. To determine the broad objectives of training programs in pediatriccardiology.
From the outset, the Board realized that professional competence in medicaleducation relevant to testing techniques and evaluation. would be necessaryfor the successful completion of the project. Accordingly, a sub-contractfor appropriate portions of the work was let to the Division of Research inMedical Education, University of Southern California School of Medicine underthe direction of Doctor Stephen Abrahamson. The study, the first of its kindof medical specialists, proved to be very successful as 93 percent of thediplomates participated in various aspects. Subsequently, several paperswere published describing the findings of the study including an assessment ofthe manpower and training requirements in the field of pediatric cardiology) 2 3.
It occurred to several of us involved in the study of pediatric cardiologists,that the techniques utilized in it could be applied to other specialty groups.As an officer of the American College of Cardiology, I realized how little wein the College knew about our colleagues in adult cardiology. We knew rela-tively little about their primary training in cardiology and how well this train-ing was meeting their current professional needs. Such information seemedvital to continuing educational programs such as those offered by the variousprofessional societies as well as the universities. Most of us could only guesswhat most cardiologists did with their professional time, and what they con-
1Foster, J. T., et.al., "Analysis of an Oral Examination Used in SpecialtyBoard Certification," J. Ivied. Educ., 44:951, 1969.
2Adams, F. H., et.al., "The Review and Revision of Certification Proceduresin Pediatric Cardiology, " J. Med. Educ., 47:796, 1972.
3Adams, F. H., et.al., "Manpower and Training Requirements in PediatricCardiology, " Pediat. 51:913, 1973.

4
sidered to be gaps in their knowledge and expertise. No one could provideus all of the names and addresses of the various training programs in cardiol-ogy in the United States. Furthermore, nothing was known regarding the con-tent, quality and duration of training offered by each of the institutions, norhow many training positions were available. Finally, it was apparent to usthat we needed much more information about the national and regional distribution of cardiologists if we were to be of assistance in "Building a NationalHealth-Care System"*.
With the above as background, the American College of Cardiology in April1971, sought and obtained a contract with the National Heart and Lung Insti-tute to conduct a study with the following specific purposes.
1. To define the current professional roles of the cardiologist.
2. To determine the objectives of training programs in cardiology.
3. To determine the current and future manpower needs of cardiologists.
4. To determine the current and future educational needs of cardiolo-gists.
In order to provide the study with a broad base of expertise and orientation,it was deemed advisable to establish an Advisory ommittee under my chair-manship consisting of individuals representing the major professional groupsinterested in cardiology. Accordingly, the following organizations agreed tobe represented by the individuals listed after each:
American College of Cardiology - H. I. C. Swan, M.D.American Heart Association - Walter H. Pritchard, M.D.American College of Chest Physicians - Alfred Soifer, M.D.Association of University Cardiologists - W. Proctor Harvey, M.D.Subspecialty Board in Cardiovascular Disease - Noble 0. Fowler, M.D.
In view of the fact that the Division of Research in Medical Education (DRME),University of Southern California School of Medicine, had been so successfulin assisting the pediatric cardiologists to obtain answers to their questions,it was decided by the Advisory Committee to invite them (DRME) to assist inthis second study of adult cardiologists. Doctor Abrahamson and members ofhis staff at DRME were already well acquainted with many of the terms, con-cepts, and problems of cardiologists from the first study. Thus, they accept-ed the invitation to assist the American College of Cardiology in conductingcertain phases of the study and a subcontract for appropriate portions of thework was let to them.
Eventually two individuals on the Advisory Committee were replaced by othersfrom the same organization. Walter H. Abelmann, M.D. replaced W. ProctorHarvey, M.D.; and Ray W. Gifford, Jr. M.D. replaced Alfred Softer, M.D.
*Committee for Economic Development, April 1973.

5
In the final phases of the study, the Advisory Committee received considerablehelp and guidance from two additional individuals: Herbert N. Hultgren, M.D.,Chairman, Subspecialty Board in Cardiovascular Disease; and Henry D. McIntosh,M.D., President-Elect, American College of Cardiology.
Throughout the entire study, Mr. Robert C. Mendenhall, Associate ProjectDirector, was the individual most respensibla for the development of the surveyinstruments and for analysis of the data generated by them. Mr. William D.Ns Iligan, Executive Director of the AmerL ~ College of Cardiology, organized,attended and contributed to all of the me gs of the Advisory Committee,Doctor Peter L. Frommer, Project Officer, National Heart and Lung Institute,and members of his staff also contributed significantly to all phases of thestudy.
Forrest H. Adams, M.D.Principal InvestigatorAmerican College of Cardiology

6
1 to 127 add 12136 to 272 add 13289 to end add 14
TABLE ae CCNTENTS
SUMMARY AND RECOMMENDATIONS ix
1. DEVELOPMENT OF THE STUDY 1
Forrest H. Adams, Stephen Abrahamson and Robert C. Mendenhall
Background to the Problem 1
Organizational Approach to the Problem . OOOOOOOOOO 2
Organizational Relationships 3
Study Populations 3Study Focus and Methods 4Study Design Process OOOOOOOOO OOOOO 5
Summary OOOOOOOO OOOOO OOOOOOOO OOOOOOOO . 5
2. STUDY RESEARCH DESIGN 6
Robert C. Mendenhall, Stephen Abrahamson, Roger Girard andFrancis Y. K. Lau
Introduction ******************** ******* 6Classification Criteria and Analytical Variables 7
The Total Study Design 9Phase One: Definition of the Study Population 9Phase Two: Identification of Cardiologists by Type and
Activity Status - Initial Cardiology Survey . ******* 10Phase Three: Log-Diary Study of Professional Activities -
Cardiology Professional Diary ************* 18Phase Four: Cardiologists' Training, Training Needs and
!3ractices Study - Cardiologists' Training Survey 39Phase Five: Cardiology Training Programs Study 57Refined Estimates in Cardiologists' Activity Times, Practice
Characteristics and Proportions Board Certified 78Summary and Recommendations 81
3. CURRENT STATUS OF MANPOWER IN CARDIOLOGY 82
Walter H. Pritchard and Walter H. Abelmann
Introduction 82Total Physician Manpower in the United States ******** 82Cardiology Manpower in the United States 86Mode of Practice of Cardiologists 86Board Certification of Cardiologists . 86Distribution of Cardiologists in the United States .. ***** 91Distribution of Cardiologists in Metropolitan Areas lIl 91Referral of Patients to Cardiologists 96
a

7
Distance Travelled by Patient to Cafctiolcgists 96Cardioinuists' Ace and Years Since tacree . 96Summary and Recommendations ,, 96
4. ROLES AND PROFILES OF THE CARDIOLOGISTS 103
H. J. C. Swan and Ray W. Gifford, Jr.
Background 00000 0000000 00000000000000 103Adult Cardiologists 103
Roles and Profiles of Cardiologists 104Summary and Recommendations 00000 00000000 127
S. TRAINING PROGRAMS IN CARDIOLOGY 136
Noble O. Fowler, Herbert N. HUltgren and Henry D. McIntosh
Introduction 136Number and Distribution of Training Programs .. 00000 136Content and Duration of Training 139
Faculty in Cardiology 143
Facilities and Materials ************ 150
Training Manpower 153
Funding for Training in Cardiology 153
Adequacy of Training Programs for Current Practice Needs 153
Summary and Recommendations 155
6. CONTINUING EDUCATION, EDUCATIONAL NEEDS ANDSTANDARDS ****** 158
Forrest H. Adams
Introduction 158Comments of Cardiologists Regarding Educational Needs 159Comments of Cardiology Training Program Directora Regarding
Educational Needs 166
Summary and Conclusions 167
7. FUTURE MANPOWER NEEDS IN CARDIOLOGY 168
Walter H. Pritchard and Walter H. Abelmann
Introduction 168Manpower Needs Based on Changes in Cardiologist/Population
Ratio 168
Manpower Needs and Training Programs for Different Typesof Cardiologists 170
Comments 174Problems of Distribution of Cardiologists 175
. 10

8
Summery and Recommendatiors 177
8. THE ADVISORY COMMITTEE'S DATA BASE . . 178
Robert C. Mendenhall and the USC DRME Staff
Introduction ************ ********** .4.4,0 " 178USC DRUM Cardiology Project Staff ***** ************ 178Current Cardiology Manpower and its Distribution 181Cardiology Professional Diary ***** 218Cardiologist:' Training Study ****** 272Cardiovascular Disease Training Programs Study 289Manpower Projections ************ ********** a 308Needs for the Future 313
Summary and Recommendations *************** 316
DATA SOURCES
Five data sources are used repeatedly in the tables and figures in this report.Rather than describe them each time they are used, they are noted as a "SourceNumber" on the particular table or figure. The sources and the assigned num-bers are:
1. American Medical Association Physician Biographical File Statisticsrelated to cardiologists;
2. Initial Cardiology Survey - sent to all cardiologists;
3. Cardiology Professional Diary - a sample of cardiologists;
4. Cardiovascular Training Programs Survey - sent to 334 training institu-tions of which 329 had cardiovascular training programs meeting studycriteria;
S. Cardiologists' Training Survey - a sample of cardiologists.
Other references to data sources and reference sources appear on the tableor figure with full notation.
11

9
SUMMARY AND RECOMMENDATIONS*
1. The American College of Cardiology sought and obtained a contract withthe National Heart and Lung Institute, National Institutes of Health, forthe following purposes:
o to define the current professional roles of the cardiologist;
o to determine the objectives of training programs in cardiology;
o to determine the current and future manpower needs for cardiologists;
u to determine the current and future educational needs for cardiologists;
o to review and to prepare the results of the study in a form appropriatefor dissemination through usual professional channels and to makerecommendations to the National Heart and Lung Institute for improv-ing the availability of manpower in this field.
The study began June 30, 1971, and was completed October 31, 1973.
2. The research methodology used in this investigation was very comprehen-sive and included four different data collection procedures.
a An i tial classi ice on uesUonnaire Cardiolo Surve
This provided the baseline data regarding practice characteristicsagainst which information gathered later could be compared and fromwhich final decisions about sampling design for other studies couldbe made.
b. A d cjiLlitkaaf activities ardiolo y Professional Diary):
This was used to obtain detailed information about cardiologist pro-fessional activities. Parenthetically, we believe that it was themost useful of the study instruments employed in the study of cardiol-ogists.
c. A training experiences questionnnire (Cardiolosiist's Training Survey):
Cardiologists' training experiences and needs were described throughuse of a questionnaire.
*In making these recommendations, we do so fully cogri.zant of the fact thatsignificant changes were underway at the time the study was being done, theeffect of which has not (indeed, cannot) be estimated at this time.
12. .

10
d. Training programs questionnaire (Cardiovascular Training Pre ramsSurvey:
Training program directors were asked to describe program content,objectives, capabilities and staffing, through a questionnaire.
The methodology used in this study, if revised periodically, would yielda data base from which trends could be determined to assist in planningfor the future .
3. There were 10,691 cardiologists in active practice in the United Statesand approximately 1,000 in training in December, 1971. This gives aratio of 5.6 cardiologists per 100,000 population. Whether this is anoptimal ratio to be maintained in the future cannot be stated. Theirnumbers seem to be distributed about equally between the Primary Car-diologist (one who estimates that he spends 50 percent or more of hisprofessional time providing care for patients with cardiac problems) andthe Secondary Cardiologist (less than 50 percent). Approximately 70percent are based in offices not in institutions, About 50 percent of allcardiologists are certified in internal medicine and 10 percent certifiedin cardiovascular disease.
Per population density, cardiologists are irregularly distributed, tendingto concentrate inthe metropolitan centers of the Northeast, MiddleAtlantic, and Pacific regions. These areas contain the large cities hav-ing the heaviest concentru:lon of medical schools. The East SouthCc ntral, West South Central, and West North Central regions containsignificantly fewer numbers of cardiologists per 100,000 population.
On the basis of a cardiologist-to-population ratio of 6 per 100,000, itis projected that approximately 4,600 more cardiologists are needed inthe next five years. The problem of maldistribution and some otherfactors altering the projected needs are not reflected in that projection.
4. Four general profiles of cardiologists were identified on the basis oftypes of activity: Primary Non-Institutional; Secondary Non-Institutional;Primary Institutional and Secondary Institutional. Clearly, certain ac-tivities overlapped from one category to another, but the general activi-ties appeared to differ to a degree sufficient to justify separation. Thesefour divisions of cardiologists described by the survey can perhaps beidentified by more appropriate terms than Institutional or Non-Institution-al, Primary or Secondary. That is, the group of Non-Institutional PrimaryCardiologists may be looked upon as Clinical Cardiologists, while theSecondary Non-Institutional Cardiologist is usually the Internist -Car-diologist. The Institutional Primary Cardiologists devoting more than50 percent of their time to problems of cardiovascular disease wouldlikely include a substantive proportion of Cardiac Specialists, whilethe Institutional Secondary Cardiologists might include both the

11
Academic Cardiolorgst and those physicians collected under "other" whomight have an infrequent occupation, for example, cardiac rehabilitation.A brief conceptual description based upon the data of this study of func-tions and activities of these four caiegorie:- of cardiologists is describedin the report.
S. There are 329 programs in the United States which offer at least one yearof organized training in cardiology within an approved internal medicinetraining program. These programs have an average of four trainees perprogram. Approximately 711 trainees completed their training in 1972
and 791 trainees did so in 1973.
Training facilities in the United States have expanded over the past tenyears and, based on training directors' estimates, will continue to do
so. It is possible to accept $8 percent more trainees during the nextfive years. Clearly, to achieve this would require increased funding.
A shortage of staff members presently exists in many training programs.Twenty-nine percent of programs have an average of two staff positionsbudgeted but unfilled - a total of approximately 150-180 positions. Iftraining programs expand over a five-year period (1973 to 1978) to in-crease the number of trainees by 58 percent, an average of 2.6 additionalstaff members will be required for each program. This is an increaseof approximately 800 to 850 new staff members.
The present system for training of cardiologists in the United Statesshould be continued, taking into account the recommendations of theSubspecialty Board of Cardiovascular Disease.
Federal support for training certain groups of cardiologists, particularlythe Academic Cardiologist (Secondary Institutional), should be continuedat a rate commensurate with population changes and related demands fortrained cardiologists.
The cardiology training needs of internists and generalists (SecondaryNon-Institutional) should be continually evaluated and their trainingwithin programs of internal medicine modified accordingly.
Programs need differentiation as to which of the four types of cardiolo-gist is being trained, with the numbers trained adjusted to geographicarea needs. This implies a level of program planning not currentlypracticed but one which, nevertheless, is required if the minimum ratiosof cardiologists to population are to be realized.
Directors of cardiology training programs should receive continuing in-formation as to the needs of their graduates, including a copy of thisstudy report, a report from the American Board of Internal Medicine re-garding areas of deficiency in car1o4ascular training based on the

12
results of examination of their trainees, and an annual meeting with theother directors of similar programs.
6. The continuing educational needs of the cardiologists are currently variedand diverse. They appear to be influenced by (1) the type and contentof his original training and (2) the role and age of the cardiologist. Inthe future, continuing educational needs will be influenced by (1) therole of certification in a national health care system, (2) regional con-siderations, (3) advances in medical knowledge, and (4) stable funding.
7. The standards for cardiovascular diagnosis and surgical centers developedby the American Heart Association and the Inter-Society Commission forHeart Disease Resources should be implemented.
IL This study provides, for the first time, data which furnish an estimateof present and future manpower needs for cardiologists in the fields ofpatient care, teaching, and research within the United States. Thedata collected provide a description of the current practice of cardiologyand identify deficiencies in existing training programs in cardiology.Further, this study projects the future activities of the cardiologist, andthus will aid in Manning training experiences for them. The data collect-ed should be of value to individuals, hospitals, universities, govern-mental agencies, and voluntary health agencies which are concernedwith providing administrative, financial, and educational support fortraining programs in cardiology, and which require cardiologists forpatient care, teaching, and research activities.
15

13
CHAPTER 1
DEVELOPMENT OF THE STUDY
Forrest H. Adams, Stephen Abrahamson and Robert C. Mendenhall
BACKGROUND TO THE PROBLEM
Cardiovascular disease, particularly atherosclerosis, represents today thegreatest and most important health problem in the United States as well as inmany parts of the world. Cardiovascular disease accounts for over one-halfthe deaths in the United States': Every American male at age 20 has onechance in five of having a heart attack (usually myocardial infarction) beforethe age of 60. It is estimated that over 14.6 million American adults havedefinite heart disease and an additional 13.0 million have suspected heartdisease. This represents 24.9 percent of the adult American population2.
Each year approximately 200,000 of the heart disease deaths occur in moonsunder the age of 65 with men affected 3.5 to 1 as compared with women&Thus, unfortunately, this disease often appears during the most productiveyears. It has been stated that the cost of disability in patients survivingcoronary disease is in excess of 4 billion dollars per year3. It is obviousthat the total loss to the nation is incalculable. Based on our present knowl-edge, it is a realistic premise that cardiovascular disease will increase inthis country rather than decrease.
Recently introduced methods in the diagnosis and treatment of cardiovasculardiseases are effective only if skilled physicians and other personnel becomeavailable to deliver optimal health care. It is obvious that support for teachingand research activities must proceed in parallel. Urgently needed was anevaluation of manpower requirements in cardiology to make these benefitsavailable to all.
The officers of the American College of Cardiology realized how limited ourknowledge was regarding cardiologists: their training; their contthuing edu-cational needs; their roles and their competencies; their locations and typesof practice. Furthermore, there existed no complete list of training programsavailable in cardiology in the United States and thus the content, quality,duration of training, and number of positions offered was unknown.
Vital Statistics of the United ,States 1967. Vol. 2, Part A, 1969.
2 .tea D se- = A Sta e 1. - PHS Publication No. 1000.Series 11, No. 6, September 1964.
3 Felton, I.S. and Cole, R., pirculqtton 27:957-962, 1963.16

14
For the above reasons, the American College of Cardiology sought and )btaineda contract with the National Heart and Lung Institute, National Instii.tites ofHealth for the following purposes:
o To define the current professional roles of the cardir:logist;
o To determine the objectives of training programs in cardiology;
o To determine the current and future manpower needs of cardiologists ;
o To determine the current and future %:..ucational needs of cardiologists;
o To review and to prepare the rev--,lts of the study in a form appropriatefor dissemination through usuc professional channels and to makerecommendations to the National Heart and Lung Institute for improvingthe availability of manpower in this field.
The study began June 30, 1971 and was completed October 31, 1973.
ORGANIZATIONAL APPRMCH TO THE PROBLEM
In its proposal to the National Heart and Lung Institute to conduct a compre-hensive study of -ardiology training and manpower requirements, the AmericanCollege of Careology recognized that such a study would be most effectiveas a blueprint for change if it had a Principal Investigator and an AdvisoryCommittee whose members were broadly representative of major societies andorganizations concerned with cardiovascular disease. The Advisory Committee,thus, included members from each fo the following organizations:
American College of Cardiology
American Heart Association
American College of Chest Physicians
Association of University Cardiologists
Subspecialty Board in Cardiovascular Disease
Furthermore, it was part of the overall project plan from its inception to con-sult with the American Medical Association and the American Board of InternalMedicine as the study progressed for advice in certain areas and for infor-mation which might enhance the study.
The American College of Cardiology sought a research organization which hadworked in the physician manpower and assessment area previously and chosethe University of Southern California School of Medicine's Division of Research
1.7

15
in Medical Education (DRME) as its principal research resourze because DRMEhad performed a similar study of pediatric cardiology. Indeed, the overallresearch plan proposed was developed jointly by the American College ofCardiology and DRME.
ORGANIZATIONAL RELATIONSHIPS
Conceptually and in actual fact, the American College of Cardiology throughits Principal Investigator had responsibility for the project throughout thedevelopmental, implementation and analysis phases. The Advisory Committeeparticipated in survey instrument design, provided counsel regarding the numberand types of cardiologists and/or institutions to be included in each study phaseand recommended the level of analysis which each of the studies received.The Advisory Committee did so in recognition of the fact that after the data werecollected, it was their responsibility to generate substantive evaluative state-ments and conclusions.
Following the agreements reached with the American College of Cardiology'sPrincipal Investigator and the Advisory Committee, University of SouthernCalifornia's DRME Cardiology Project Staff under a subcontract designed thestudies, tested the instruments, conducted the studies, and provided the datadeemed most appropriate to the ultimate study tasks. Thus, while the datawere obtained by University of Southern California's DRME from study designswhich they developed, the ultimate responsibility for the study's interpretiveconclusions and recommendations were the ^American° College of Cardiology's.
STUDY POPULATIONS
For the purposes of the study, cardiologists were defined as all physicians whowere one or more of the following:
o Physicians listed by the American Medical Association as havingeither a primary or secondary specialty interest in cardiovasculardisease;
o Fellows of the American College of Cardiology;
o Fellows of the Council of Clinical Cardiology of the American HeartAssociation;
o Diplomates of the Subspecialty Board in Cardiovascular Disease.V
(Radiologists, surgeons, pediatric cardiologists, and pathologistswere excluded even if they met one of the criteria noted above.)
18

16
It was recognized that such a listing of cardiologists would be quite redundant;however, one study objective was to identify all cardiologists and thereforethe redundancy was acceptable. The resultant roster cf. 12,175 cardiologistsin active practice, training, and retired included 10,691 In active practice ofwhom less than 3 percent came from sources other than the American MedicalAssociation's listing.
Training Proarms were defined as full-time cardiovascular training programs ofat least one year's duration. This definition was developed during the studywhen it became apparent that there were no listings of cardiovascular diseasetraining programs and there were no criteria for determining which of thetraining programs offered the variety and depth of training experiences whichmight reasonably prepare a physician for certification in cardiology.
The source listing for training programs was provided by the American MedicalAssociation and consisted of all institutions in the United States with approvedresidencies in to Mitcltqlrul. It was assumed that very few cardiovasculardisease training] programs would be found in institutions which did not have anapproved training program in internal medicine. This study included 329 in-stitutions involved in cardiovascular disease training.
STUDY FOCUS AND METHODS
The major information in this study was sought from all active cardiolooistsand all cardiology _raining_ortxtrams in the United States. The cardiologistswere ultimately divided into a number of subgroups for various types of analyses.Two major groups were empirically defined as Primary Cardiologists (thosepracticing cardiology more than 50 percent of their time) and Secondary Cardi-ologists (those practicing cardiology less than 50 percent of their time). TheAdvisory Committee also agreed to examine secondary data, (i.e., that whichwas not generated by the investigations), in those instances where such datacould reasonably enhance their recommendations.
The methods employed in the investigation were proven behavioral sciencetechniques: questionnaires; log-diaries; content analysis and interviews. Thespecific study designs which were used most successfully involved questionnairesand a log-diary. The latter, as conceptualized, is an instrument uniquelysuited to this type of study.
STUDY DESIGNS
With a major study premise being that those who provide services to patients,perform research, provide teaching, and design and carry out the training pro-grams are the best possible source of data regarding both current practices andimmediate and future needs, a research plan was developed which drew almostexclusively on these individuals and institutions for data.
19

17
The cardiologists participated in three study phases:
1. An initial classification questionnaire to all:.
2. A log diary to a stratified random sample:
3. A training experiences and needs questionnaire to a stratified randomsample.
All cardiology training programs participated either through completion of adetailed questionnaire or through an interview conducted by telephone.
Detailed study design considerations will be discussed in the next chapter.Our investigations generated much information regarding training programs whichexceeded the needs of the Advisory Committee. A data base was created whichcould profitably be exploited more than this study required.
STUDY DESIGN PROCESS
At the very beginning, the Advisory Committee participated directly with theUniversity of Southern California DRME Project Staff in the identification ofthe appropriate areas of investigation for each of the study phases. The ProjectStaff then developed en initial set of questions for obtaining the information.The questions were reviewed and altered by the Advisory Committee and theNHL! Project Officer and then the particular study instrument was given itsfinal format. Upon completion of this review, the particular instrument with itssampling rationale was sent to the federal Office of Management Budget (OMB)for their internal review and assignment of a survey control number. OMB alsohad recommendations which were incorporated in the final design.
While the preceding may sound unduly complicated and complex, it had thepositive effect of involving all interested parties in the details of the surveydesign process. The process consumed many months and required preparationof several drafts of each study instrument.
SUMMARY
This study provides, for the first time, data which furnish an estimate of presentand future manpower needs for cardiologists in the fields of patient care, teaching,and research within the United States. The data collected provide a descriptionof the current practice of cardiology and identify deficiencies in existing trainingprograms in cardiology. Further, this study projects the future activities of thecardiologists, and thus, will aid in planning training and experience for them.The data collected should be of value to individuals, hospitals, universities,governmental agencies, and voluntary health agencies who are concerned with pro-viding administrative, financial and educational support for training programs incardiology, and who require cardiologists for patient care, teaching and researchactivities. Z. . 20

18
CHAPTER 2
STUDY RESEARCH DESIGN
Robert C. Mendenhall, Stephen Abrahamson, Roger Girard andFrancis Y. K. Lau
The research objectives (discussed in the preceding chapter) and a series ofrelated research questions established the general characteristics of the over-all research design. In the area of manpower or training requirements, thefollowing information was considered essential - particularly those factorsrelated to the cardiologist's actual practice:
o the type(s) of patients treated and their cardiovascular disorders;
o the methods employed in patient treatment and management;
o the degree to which the particular practice involved research and/or teaching and the topics of that research and/or teaching;
o the relative allocation of cardiologist time to the range of profes-sionally-related activities (as the cardiologist defines them);
o whether the preparatory training and continuing educational oppor-tunities are considered adequate by the cardiologists;
o whether the supportive facilities (personnel sad equipment) areconsidered adequate by the cardiologists;
o the practice areas in which the cardiologist feels his training was(and is) deficient;
o the assessment of manpower adequacy and needs by cardiologistsand training program directors.
In the training programs area, the study focus was on:
o characteristics and content of training programs;
o qualifications of training program staffs;
o resources to support training programs;
o the current and anticipated trainee graduate rates;
o continuing educational programs.
21
19
Two study designs were developed and used to obtain information in each ofthe areas enumerated.
Each study was conceptualized as an integral component of the total researchdesign. Certain descriptors from one study were carried to another, either inidentical form or in a form which could be converted to the previous form. Thiswas done to permit comparisons between responses of the same participantsto common questions asked in different study designs. This connection wasstrategically important methodologically (and just as important empirically)because it permitted refinements to estimates which would not otherwise havebeen possible, The application of this linked approach will be noted in thediscussion of log-diary findings compared to classification questionnairefindings and in the analysis of the proportion of cardiologists certified in1973 compared to 1971.
The relationship of specific study methods and designs to the study's objec-tives and research questions is shown in Figure I. The column, "AdvisoryCommittee" denotes both an information source and the source of final inter-pretation of study findings.
CLASSIFICATION CRITERIA AND ANALYTICAL VARIABLES
The studies of cardiologists and the institutions which train them suggestedcertain characteristics which were useful indices of differences and of com-monalities in terms which were relevant to either cardiologist profiles ortraining program profiles. The appropriateness of selection of variables wouldappear to be intuitively obvious in some instances; for others, the rationalefor selection is not so apparent. All variables included in the final analyseswere chosen only after extensive analysis demonstrated that they did, indeed,provide the desired discrimination.
The Advisory Committee and USC DRME were aware of general differences intypes of practices and of some of the factors which contributed to those dif-ferences. This awareness led to the initial dichotomy of "Primary Cardiolo-gist" and "Secondary Cardiologist" and the differentiation as to type ofpractice which employment arrangements would describe. Ten variableswhich describe cardiologist practices and four which describe training programswere used as primary study classification and analysis variables. By "primaryvariable" we simply mean that the variable was used in one or more majoranalyses as one of the dimensions considered.
The primary variables used in cardiologist analyses are listed below.
o Droportion of Time to Celtic loov,
o Cert.. J11.1.11.1dca embershim
, 22

20FIGURE 1
STUDY OBIECTIVES RELATED TOCONTRIBUTING DATA SOURCES AND STUDY DESIGNS
Study Objectivesend
Rilatod Research Questions
6,-I
Information Sources
1
0to
1E e,t
Iel
I 3cid i rDEFINE CURRENT PROFESSIONALROLES
Pittfessional activitiesTotal time to professional activitiesTotal cardiology professional timeNumber of patients seenNumber of patients with cardiacdiagnoses
Number of patients without cardiacdiagnosis
Patient demographyTypology of cardiac conditionsTypology of non-cardiac conditionsPatients seen as a consultantPatients where cardiologist is
printery care physicianInd** of cardiologist skillsCardiologist's use of timeCardiologist's optimum time useCardiologist's prepay Urn and
certifications regarding services!Wootton of cardiac population tobe seen by audiologists
Professional role: description
X X X
a*x
xx
x
X
xxxa
x
xaxax
xxx
x
X
x
a
a
X
x
x
It X
xx
a
x
K
a
xx
DETERMINE TRAINING PROGRAMOBJECTIVES
.Identify training programsDistribution and number of programsProgram characteristicsProgram plans and objectivesTraining program assessment
X
xxx
x
X
xxaxx
X
x
x
X
xxxxx
X
x
DETERMINE CURRENT AND FUTURECARDIOLOGIST MANPOWER NEEDS
Distribution of cardiologistsspecialty, practice, age,certification status
Number of cardiologists trainedNumber of cardiologists in trainingAltura training plansOptimum cardiologist population
ratios
X x X
x x xa
a
x
a
x
a
x
xax
K
x
x
x
K
x
DETERMINE CURRENT AND FUTURECARDIOLOGIST EDUCATIONAL NEEDS
Cardiologist's assessmentsTraining director's assessmentsEvaluation of assessments
X X
a
X
x
K
At
X
x
X
a
X denotes information obtained through the source chocked

21
a Practice Mode or E_mployment Arrancements
o A e: C 1 r21 Relatd IL IM21&11ism
o Medical Service Community
o Distance to Care
o Patierlt Sour s _.(Watie Referral)
o es orL
o tient s S GS or Second C a Condition
o Geo ae 1......,,sugMilpsediolo 's PrateThe primary variables used in training program analyses were:
o ber of Trainees
o Usualrainitg .a.1Pro ams
o R d me in rams b -1 th n oaths
o ik2sEgagsligstAgn
THE TOTAL STUDY DESIGN
This will be discussed by phases. For the mast part, the phases actuallyoccurred in the sequence discussed. Those related to cardiology studies willbe presented first. Those pertaining to the study of cardiovascular trainingprograms will follow. The rationale for selection of primary study variableshas been presented in earlier sections and will not be repeated again.
PHASE ONE: DEFINITION OF THE STUDY POPULATION
The American Medical Association's Physician Biographical File listing ofphysicians who classified themselves as either "primary" or "secondary" incardiology constituted the master file against which all other files were check-ed. Only the AMA file was available in a computerized tape format; all otherswere printed or typed lists of members. Exhaustive checking of the non-AMAsources identified approximately 300 additional board certified cardiologists(Internal Medicine or Cardiovascular Disease) whose names were not in theAMA file. Normally, the fact that the AMA file contained 97 percent of allnames used would have justified using this file alone. However, with therequirement for the investigation being to identify Aticardiologists and to
24

22
identify those who were certified, the research of other files was justified.
bampar of Ci.....1121....rdioo sts
All data related to numbers of cardiologists were adjusted to the counts as ofDecember, 1971. This was done to obtain the most accurate possible esti-mates of manpower at the end of a calendar year. There were 12.175 cerdiol-o ts t...sal_...m.pzaaliu)11gale to study. This number included physicians identi-fied by the AMA as retired and in-training as well as those in an active prac-tice status. Since both retirement and in-training are statuses subject tochange, the entire eligible population was contacted in the initial surveystudy phase.
PHASE TWO: IDENTIFICATION OF CARDIOLOGISTS BY TYPE AND ACTIVITYSTATUS - INITIAL CARDIOLOGY SURVEY
1§A4LattecAme.
The primary purpose of this study phase was to determine the strata withinthe specialty practice which should be studied in depth. To accomplish thisit was necessary to obtain patient care, research/teaching statistics, andcardiological procedures and activity statistics which positively correlatedwith type of specialty and practice. The factors noted in each of these areasas related to specialty and practice were expected to define the types ofcardiologists for subsequent studies.
The secondary purpose of the study was to determine the geographical distri-bution of cardiologists by specialty and other related factors such as age,types of certification and practice arrangements. These distribution statistics,along with the data provided by the AMA regarding cardiologist location, wouldbe used to answer the question, "where are cardiologists practicing?"
Since the interest was in what cardiologists acttaft do, then differenceswithin that group had to be known before selecting a smaller group for detailedstudy. Factors to be considered included (1) physician's type of practice,(2) his relative time commitments to the specialty, and (3) on an overall basis,how his time is committed among patient care, other professional, and non-professional activities. The Initial Cardiology Survey provided these factsand established a basis for stratification for analyses and subsequent studies.This study also described the potential service population, defined whetherthe individual physician was primarily a referral practitioner or not and in-dicated how long he has been in practice. Each of these indices is importantin an assessment of cardiology as a medical specialty.
. 25

23
Study Questions
The study obtained information in the following areas:
o time in primary and secondary specialty
o year received medical degree
o an estimate of the population within the cardiologist's service area
o professional time in general activity categories
o patient sources and distances patients travel
o employment arrangements
o performance of selected cardiological activities
purvey Instrument
The Initial Cardiology Survey, designed as a classification questionnaire, wasa one-page form which could be completed in approximately IS minutes. Itwas pre-tested for clarity and utility with physicians whose practices coveredthe range of practice types expected within the surveyed population. Figure 2is the survey form used in this study phase.
Study Strata
Sampling might have been employed with this study but was not because of aninterest in obtaining the widest possible response (1) as evidence that allcardiologists had been given the opportunity to participate and (2) to increasethe confidence in the estimates which would be made regarding actual geograph-ical location of practicing cardiologists.
Field Study Procedures
Three contacts were made with the surveyed population through first-classreturn-postage-guaranteed mailings. Different covering letters and differentcolored forms were used in each mailing. This study phase extended fromDecember 16, 1971 to April 6, 1972. The return rates by mailings were:
40 percent from the initial mailing;
28 percent from the second mailing;
9 percent from the third mailing.
26

24
FIGURE 2
cant:noway amity IOMR Approvel
This short survey tom will proof.. natievie of how cerelolorrit Is Mellow" national'? And II44 "4 Imo"bodlolitwo tar *Una Osseo of the Confining! Molmourot Study. . PleatsIlnev4 en oreetione. Includino yaw beet **Moat* of somber* oli6;erilleTtliater24"261111wheThom you to your help.
CITY 0 STRUT
STATE
MAR YOU RECEIVED MD
YOUR MEDICAL OItCIALTIitMowry Speciality
Tom of Precuts In Primary Specteity% tivor falia Spent lit This SPecielty
YOUR MEDICAL SERVICE COMMUNITY
About how many people live within s IS oliomoue of your office? (Please checkthe fume which is closest to the ourshor.)
REMO 0$0.000 o
100.000 0700.000 -
400.000 Q$00.000 0
ROCOCO o1.030.000 o7.000.000 01.000.000 - 0
14000.000 0$.000.000 0
VP CODE
Secoltdery SPeciallyYears at Mates Is Seconder/ Specie tn.._It me sign Spent In Ma modally
esa* estimate tho poicant*Oe of your SUMRation% who live within the disionoas indioetedInns your of
toss then $ wiles
fres I le IR alias
from II to 1$ adios
flee IS le 11$ "Mee
Over U sites
tuna
.11/1.1.
Total 10411,
P2C.ARIMNO YOUR PROITSSIONAL TIME AND NOW IT M COMMITTED. Plasma Wow% the total rotten% bYand the godton of that total which pass sp cartliolooy application.
MOW Mont Can liaa involvtiM maaarchileoching
Medical Raffetch - iavolvifte WNW owe
&WM* liseeellis o07 involving Went 0510
Medical boobies - InvOlvtell p.Wet Case
Medico' Teething an Wahine paUent true
AdolnietreUve (office. coreteittme, Melt swamOneattive orgsnissiToe. etc.)
Prolossional (loontels. outings. peon. etc.)
Maus pet Will Dsvotad to Medical ActIvities
YOUR PATMNT SOUntil. Durino the peat three ponthe.whet proportion of your cardiac petiolate coma Dote:
YAWN your own practice
Rata red by other physic:4one
Itolemod by wog ewe 0000ate
Rellarrod by theauwilvea. bellyor Moods
Rafetrod tie an scanty (lesharftepoopany. onion. sic.)
Other Direelfyl
Percent
Parcent of DotalProbleeional toocaltOMMCIAR---
Porcent of ROOMYTime Applied toger.ilopoir
*MI 'Irma 00Activity Doe auto up to 100%
tots) 100%
It not curyanily professionally ectivo. Mad,. ...re°
YOUR EMPLOYMENT ARRANGEMENTS. Povilielitieplaysont arranoermints may be Involved toyour practice. Please estimate your involvementle each:
grgavnient Annual
Salts 'sole
SW, Pertnarship or otherion-stoup egratioesont
bianiALMEI
0=11.
=1.0OrooP
liOsPitsb VW Wee
M1111111110
Medical Schaal
1=111
Other Employment (SPeceld:
IIIIMPIIM1111111111
CUM:ACV ACTNITIER. Do you perUolpete to or parionn any of the lolloodne:mica 6), ALL EMS? nit.)
Moe olverultant for elletllee pUONle
Office LCD lisodoe --- --- 0Hospital coesultaat foe cardiaa patlante - 0
tupostal ECU nwidar 0
Tairir1011
Hospital costoary oars unit coisoiltior- 0
Cord loo dlosnoslic oventositoprophy 0
Cardiac coUratssisalloa ...... --
MS COMMITS TI QUESTIONNAIRE. TIMM YOU TOR YOUR COOPERA11011.
27

25
Response Rates and Characteristics of Respondents
Table 1 summarizes the response statistics for this survey and indicates thenumbers that were not usable and for what reasons. This table notes that
77 percent of all eligible cardiologists responded;
80 percent of the active cardiologists responded;
68 percent of the active population provided returns which were used inthe study analyses.
The table, read from left to right, gives the type of cardiologist in broadlydescriptive terms and the overall number for each type in the portion labeled"Cardiology Study Population." In the rows of figures which follow, thepercentages relate to the total number for each stratum. Thus, 8053 ques-tionnaires were received from the non-federal active physicians for a responserate of 80.2 percent; losses due to "non-use" factors reduced the number in-cluded in the analyses ("Use" column) to 6984 (68.6 percent) and the truenon-respondents for this type of cardiologist amounted to 19.8 percent of thetotal. It is also evident from the "Active Subtotal" column that the responserate was 80 percent; non-use rate was 11 percent; use rate 69 percent andnon-respondents amounted to 20 percent.
The lower half of this table accounts for those cardiologist strata of only per-ipheral interest to the study. The survey form was not designed for the prac-tice situation or interest of these cardiologists except for the "In Training"stratum or the "Retired" who might have resumed active practice. The numbersassociated with each "Cardiology Study Population Strata" were obtained ex-clusively from the secondary data sources used to define the eligible popula-tion. Those associated with the column, "Non Respondents, " are also fromthe secondary sources. The "Respondent Classification" numbers describethe questionnaires received and, therefore, reflect an updated cardiologistpractice classification. Some known shifts in classification occurred:
o 63 "in-training" cardiologists responded as active;
o 56 cardiologists were reported as deceased - 46 from the "retired"group:
o an unknown number of "active" cardiologists responded as "retired" -probably at least as many as those noted above for "in-training"shifts.
Mrs in Estimates Attributable t
Since the entire population of cardiologists was surveyed, sampling error, perse, is not an issue. However, prior to considering the effects of non-response,
f . . 2s

26
TABLE 1
CARDIOLOGIST STUDY POPULATION STRATA BYRESPONDENT CATEGORIES
Cardiology StudyPopulation
RespondentClassification Non
Respondents
Type Number Received I Non-Use* Use
Non-Federal 10,040 8053 1169 6884 1987(active) % of type (100.0) (80.2) (11.6) (68.6) (19.8)
Federal 651 472 53 .419 179(active) % of type (100.0) (72.5) ( 8.1) (64.4) (27.5)
....._.....Active Subtotal 10,691 8525 1222 7303 2166
% of Subtotal (100.0) (79.7) (11.4) (68.3) (20.3)
In Training 1042 571 147 424 471
% of type (100.0) (54.8) (14.1) (40.7) (45.2)
Retired/Deceased 411 262 56 206 149% of type (100.0) (63.7) (13.6) (50.1) (36.3)
Osteopath** 31 0 0 0 31
% of type (100.0) ( 0.0) ( 0.0) ( 0.0) (100.0)
TOTAL 12,175 9358 1425 7933 2817
% of Total (100.0) (76.9) (11.7) (65.2) (23.'1)
*Non-Use includes:Deceased 56Non-deliverable (active) 748Non-usable (active) 474Non-usable (training) 147
**Osteopathic physicians were not surveyed.
29

27
it should be noted that if the 7303 questionnaire respcndents were assumedto constitute a random sample of the 10,691 active cardiologists, the samplingerror (standard error for estimating population percentages front sampling per-centages) would be less than one-half percent.
eras and a Effect r s
Achieving an 80 percent response ;1' from the active cardiologists effectivelyeliminates error attributable to s cc :cling. The question remains: "Are therecharacteristics attributable to d . 20 percent who did not respond which shouldbe taken into account.before a .tcluding that the respondents truly representthe total population?" The ata provided by the AMA on the entire physicianfile were examined in comparison to those cardiologists who responded tothe survey. Table 2 Jere nte one of the comparisons made for cardiologistsby age groups. Dint- aces in the two populations would be expec `cid ineither the younger . group (cardiologists still in training or just completingtraining) and tiro 1. per age group. From inspection, there are no importantdifferences in ft' age groups for the entire population and those achiovedthrough rem .11'..tnts to the survey.
Geogratriv tAl distribution is a factor of considerable importance to the study.To what extent do the respondents actually reflect the distributions for thetots; pulation? Table 3 presents the data to assess' potential differences.The pper portion of the table gives frequency distributions for all active
Biologists first, as a total of all cardiologists by primary or secondary4mmItment; second, as .percentages within each census division for the active
practice cardiologists who responded and those who did not. Comparing thepercentages for the two, the Middle Atlantic responded a little below the pro-portion they represent nationally and the two west divisions responded a little.
above their national proportions. The differences, however, are very small.
The lower half of the table presents Primary Cardiologists as a total and asrespondents and Secondary Cardiologists in the same format. The differencesbetween population and respondents for both Primary and Secondary Cardiolo-gists are negligible.
We conclude from this table and Table 2 that the cardiologists who respondedadequately represent the total population of cardiologists at the level ofdifferentiation to be used in the study.
confidence Associated with the Estimate of 10.691 Active cvditoiegists
The totals for active cardiologists (10,691 with 5661 Primary and 5030 Secon-dary) are accurate within one or two percentage points for a count as ofDecember, 1971. The factors contributing to this assessmenz are as follows.

TA
BL
E 2
PAR
TIC
IPA
TIN
G C
AR
DIO
LO
GIS
TS
BY
AG
E G
RO
UPS
CO
MPA
RE
D T
O A
MA
PH
YSI
CIA
NFI
LE
AG
E G
RO
UPS
RE
SPO
ND
ING
CA
RD
IOL
OG
IST
SA
GE
GR
OU
PIN
GS
Und
er 4
0 Y
ears
40-5
9 Y
ears
Usa
ble
Ret
urns
Act
ive
Car
diol
ogis
ts
Tra
inee
s
.N
on-U
sabl
e R
etur
nsN
on -
Del
iver
able
C.)
ilmh
Non
-Use
Ret
ired
Dec
ease
d11
11N
1111
10.
2024 398
250
129
3908 24
233
203 10
Tot
al R
espo
nden
ts
% o
f T
otal
AM
A P
hysi
cian
File
% o
f T
otal
2801 (2
9.9)
3667 (3
0.2)
4378 (4
6.8)
5684 (4
6.8)
Act
ive
Res
pond
ents
with
Usa
ble
Dat
a %
of
Tot
al20
24 (27.
7)39
08 (53.
5)
60 a
nd O
ver
1371 2
412
142
206 46
2179 (2
3.3)
2793 (2
3.0)
TO
TA
L
7303 42
4
895
474
206
56
9358 (1
00.0
)
1214
4(1
00.0
)
1371 (1
8.8)
7303 (1
00.0
)

TA
BL
E 3
DIST
RIB
UT
ION
OF N
AT
ION
'S CA
RD
IOL
OG
ISTS:
SPCC
IAL
TY
BY
CE
NSU
S DIV
ISION
1611.,
3asD
AC
TIV
ITY
STA
TU
S
SPZC
:AL
TY
National
Total
NO
RT
HE
AST
SOU
TH
NO
RT
H C
EN
TR
AL
WE
STT
'OSSE
SS1ON
SA
POtria0
o23v.0 cz f.:
i" C.
v *2 .Z
. c ZO
2ui :4-
a 1Z
o E
a 8
co 1r,
Gt,
sc.
eg 8
=
1. -et co:4 0
a -a... L
-in ci 6
czo211`qC.
i 7u :.-
t -: 2=
te iti
,.Cb)t
1..!: C 3 rtso!o-pcsi
6239
5431
533
405
938
1709
1565
1013
932
1945
167
159
405
324
903
820
i99
300
223
146
909
720
69
40
9
.2029
?rrcary
Seconcary
7ote,11,670
3274326
7291723
599369
1629109
Less T
rainees
14; Active
NC
ardiologists1%
Pc sport:le:452N
979
10,(91100.0
7303100.0
105
8337.8
5807.9
276
299828.0
194526.6
172
177316.6
121016.6
8
3183.0
2333.0
46
6836.4
4796.6
185
153814.4
104614.3
42
5575.2
397S.4
32
3373.2
2543.5-
106
152314.2
107514.7
6
1031.0
660.9
1
280.3
180.2
Pn-rary AC
tiVe C
ardio:Kists1
5661100.0
3962100.0
4628.2
3318.3
157027.7
105026.5
91916.2
63216.0
1632.9
1263.2
3796.7
2746.9
79614.1
55314.0
2734.8
2015.1
1993.5
1584.0
82714.6
58914.8
651.1
431.1
s0.1
50.1
N9,..
Respor.dents2
X%
Searistdery Active C
ardiolocists15030100.0
33411C
O.0
3717.4
2497.5
142828.4
89526.8
85417.0
57817.3
1553.1
1073.2
3046.0
2056.1
74214.8
49314.8
284-
5.6
1965.8
138.
2.7
962.9
69613.8
48614.6
380.8
230.7
200.4
130.4
NS
Re s por.do rats2
X%
1Licludes respondent and non-respondent
distributions as a composite.
2Useable returns from
Initial Cardiology Survey.
ry
tO

30
o The AMA data were accurate within three or four percent with dif-ferences primarily in the classification of practice status for theyoung cardiologist or the old cardiologist.
Analysis of cardiologist distributions based on the Initial CardiologySurvey data and the AMA data indicated 979 cardiologists in training.The survey to training program directors (discussed as Phase Five)identified 970 in training at this same time period.
o A total of 56 cardiologists were reported as deceased. This couldbe off by as much as 100 percent and still result in a difference ofonly 56.
o Those who actually are retired might be more numerous than reported.About 50 percent of those over 60 responded. Assuming that one-fourth of those who did not respond should be classified inactive,the over-estimate due to this factor would still be only about 100.
o The cumulative effect of the most extreme possible em to consideris about 150 too many in the active classification category. Thisamounts to an error of less than 2 percent.
Table 3 provided frequency distribution data for all cardiologists by Primaryand Secondary Cardiologist in various combinations. It is a basic tableused in the Advisory Committee discussion of manpower and provided thebase for subsequent selection of cardiologists for specific studies.
It is extremely important to keep this table in context. The distributions arepertinent only for the time period when the data were obtained. Projectionsfrom this basic table must take the lamed time interval between December,1971 and the projected date into account. Changes in total numbers, in pro-portions of Primary and Secondary Cardiologists and in actual age compositionwill occur with the passage of time. The relative proportion of younger car-diologists entering their active practices and those leaving active practicewill alter the age distributions. The concluding section in this chapter dis-cusses projection factors and provides an estimate of the number of activecardiologists at year-end 1973.
PHASE THREE: LOG-DIARY STUDY OF PROFESSIONAL ACTIVITIES - CARDIOLOGYPROFESSIONAL DIARY
General conceptual design for this study was initiated in parallel ts similaractivities for the Initial Cardiology Survey. A log-diary of professional activi-ties was an integral study phase in all project planning.
The log-diary was designed to obtain:

31
o precise measures of time committed to professional activitiesdescribed in the cardiologist's own words;
o precise measures of time devoted to each patient transaction andto teaching and research as they occur;
o essential data to generate patient profiles which by (1) their re-ported frequency or (2) the methods employed in patient managementassociated with patient problems, might suggest potential trainingarea;
o assessment of the extent to which the cardiologist is practicing asa specialist or generalist through analysis of his patient statisticsregarding clinical problem, referral and time;
o comprehensive statistics (by type of cardiologist) on the incidenceof cardiac and non-cardiac disorders within practices for thosephysicians classified as cardiologists;
o indices of types of teaching and research activity for types ofcardiologists;
o information to validate data obtained through the Initial CardiologySurvey.
Survey Instrument
The instrument in use demonstrated the feasibility of having physicians withlarge patient-load practices keep (1) detailed records regarding each signifi-cant event which occurred during a professional day and (2) very detailedinfcnnation of a diagnostic, treatment, and management nature. With the ex-ception of the "Activity Overview" section - a general activity summary sec-tion for recording all types of professional activities - all significant dataregarding the various patient transactions were recorded in symbol form byselecting from a set of classification categories. Similar specificity wasobtained regarding the physician's teaching and research activities.
The 364 participating physicians recorded more than 20,000 patient transac-tions over a five-day period. It is believed that this detailed level of record-ing was due to the logical structure of the survey form, organized in five sec-tions, with each section in the sequence which was most likely to apply tomost participants. Furthermore, the sections were color coded and of increas-ing page width so that the physician could easily move from one section toanother, depending on his recording need. The entire log-diary was limitedto a size which fit conveniently in a man's suit pocket (or white lab coat) sothat it could be carried easily. The recording categories were carefully re-viewed by DRIa's advisory committee and tested in a variety of field practicesituations before the forms were actually considered satisfactory.
. . 34

32
The participants were given (1) detailed instructions regarding completion ofthe log-diary and (2) a sample diary with "typical" entries for each of thesections. The sample diary not only illustrated what might be appropriate asan entry; it also established a "standard" for recording which was adhered toby most of the participating cardiologists.
The level of detail requested was established by the Advisory Committee whowere not satisfied with merely knowing that a patient was "seen" during aspecific time period for cardiac or non-cardiac reasons. Their desire was tobe able to identify each patient by (1) age, (2) sex, (3) ethnicity, (4) distancetraveled to care, (5) whether the patient was a new one or an old one, and (6)whether the physician considered the patient as his "own" or treated afterreferral. Similarly, specificity was desired for the diagnostic conditions wherethe interest was in creating a disease-specific profile which included both non-cardiac and cardiac disorders and further indicated which was primary - thecardiac or the non-cardiac. Fourteen non-cardiac and nineteen cardiac pro-blems were provided to the cardiologist for his use in describing his patientsand each was assigned a number to be used in the recording. The treatmentand/or disposition was relatively gross, consisting of only eight numberedchoices, The cardiologist was instructed to use as many of the non-cardiac,cardiac, and treatment/disposition choices as were appropriate to each patient.
The interest in detailed data regarding dianostic testing necessitated the useof a special form for this purpose. Some redundancy was crested by this formsince the physician would record "ordered tests" on the summary patient careform and then provide the details regarding those tests on the laboratory anddiagnostic test form. Ideally, the two forms might better have been combined;however, the design constraint to make the overall form simple to carry wher-ever the physician went required a separate sheet. As with the patient diag-nostic and disposition form, this laboratory recording form permitted recordingseventeen different diagnostic tests and, through a letter symbol, the physi-cian's role in each of the tests recorded. Selected patient descriptors wereincluded on this form to assist in linking the two sets of patient related data.
Alphabetic symbols were employed in both the teaching and research forms todescribe the salient characteristics of these activities. In addition, a briefdescriptive phrase regarding the activity was obtained.
Figure 3 illustrates the five recording forms (without showing the full pageallowed for recording). These are, in order from the top, forms for (1) ActivityOverview, (2) Patient Care, (3) Laboratory, (4) Research, and (5) Teaching.When it is remembered that each number or letter designates what would other-wise have been a descriptive phrase, the richness of the data which this studyinstrument obtained becomes apparent. Of equal importance from a methodolog-ical and cost point of view is the fact that such "pre-coded" data are in a for-mat which only has to be checked for legibility prior to preparing the data forcomputer processing.

BEST COPY AVAILABLE
FIGURE 3
LOGDIARY RECORDING FORMAT
33
USE FOR ALL ACTIVITIES EXCEPT FOR DETAILS REGARDING CLINICAL. TEACHING AND RESEARCH
DATE. /0,47/72
TIME forACTIVITY
BEGIN END
SUMMARY FOR DAY:Adrnoustsetivt, PHdsPonal, PenonN. Treed. POI6Ortit.Lboteiore. Tentung, Research. Vocation. Ike eemples opposite Ns pesd1
WAITE A PHRASE DEscniemo EACH ACTIVITY
/?cod see', 037C14C;CO *V, Z14
USE TO RECORD PATIENT CLINICAL PROBLEMS AND THEIR DISPOSITION EXCEPT FOR TESTS
DATE /0 V2PATIENT DISCNIPTORS PROBLEMS 100 end DISPOSITION
Flom Retards Motaireattl attephell !torn CODING KEYIf Seen On
RoMedi, ICUINMATE
4.*.it 4.°se 4)
4To 0/
II(V
%:4 =0 sect,c,
General Da
nontatchee aL
Cardiac Da Ra and/or
Action
DATE 0/0 7
USE TD RECORD CLINICAL TEST ORDERED, PERFORMED AND INTERPRETED
PATIENTDESCRIPTORS
RECORD ALL TESTS PERFORMED IN NUMBERED COLUMNSRefer to numbeted hat on °pp." page
FOR EACH TEST PERFORMED. Ind+cade svIteeset you'A ORDERED 0,9 PERFORMED it:C INTERPRETED II
2 3 4 5 6 9 8 9 10 11 12 13 14 15 16 17
TIME forACTIVITY
DEGO. / END
USE TO RECORD AND DESCRIBE YOUR RESEARCH
CI If CKInvolvmqDATE AV/ 7 /7.2
TIME lotACTIVITY
Begin f E nd
to 6
DATE: /col.7/72.
TIME lotACTIVITY
Pawn / End
7P0
RV:* ARCH PRODIAM
Plitt elestriptive statement
IAmphfy on npposige paleit mote space is needed)
AND litcono FOR ALL Al.PLiCAIllrafiraM1esrANR11 01.1iting your note Teem
4,01.5cdp2/2. at. /9leaPearl O e)
bki 0/'WI I
Gororzary L.acvUSE TO RECORD AND DESCRIBE YOUR TEACHING.
/1/
40 4. it44.1. Ott
Y- 3
1E ACHIM'. IIVi I. andNI MI II 1 AI Inia fitcro.1 MI null
SE I TINGMETHODS HOLE
48'1*
ff 4. .
I
4. 40eti CT
4:;) elv cv
I/ I N C
TOPIC
Natalia* In 'gum
Plort).44.7 regre, i).7 a nee 54(14,
fron) przvs 6u.s er45,0

34
Figures 4, 5, 6, 7, 8, and 9, present the instructions to the participants andthe actual recording forms and related recording cateogires for each of theCardiology Professional Diary sections.
MEOW C2L orLADjaac el nrti ts
The process to employ in contacting the participants was a major concern inthe development of the sampling plan because the diary would demand aboutthirty minutes' time for each of five days. On the one hand, the concern wasto obtain appropriate ratios of each type of cardiologist as respondents. Onthe other, if the return rate was low then the impact of non-respondents indetermining the viability of the data increased. The objective was to achieveas high a return rate as time and resources would permit. Two options wereavailable in contacting the participants:
o Have the Advisory Committee personally contact those who wereselected and encourage their participation. This "peer-to-peer"contact would enhance the return rate.
o Make the initial contacts with participants by mail and follow-upcontacts by telephone by members of the project staff. Rely uponthe letterhead and explanatory letter to stimulate willingness toparticipate.
The latter option was followed. This required acceptance of a usable responserate of 50 percent for planning purposes. In actuality the usable rate wasabout SS percent and the gross return rate about 63 percent. Willingness towork with a usable respondent group of SS percent of those contacted is de-fendable ord_y_because (1) a great deal was known about the population fromwhich the[ary participants were drawn and hence comparisons could be madeto ensure that those declining were not different from those agreeing to par-ticipate and (2) a record was kept of refusals to participate and the reasonsgiven.
Log-Diary Cardiologist Types
The initial classification questionnaire was used to identify general practicecharacteristics including such elements as (1) perceived allocation of timeto patient care, teaching, research, administration and other professionalactivities; (2) distribution of patients according to a) distance traveled toreceive care and b) whether or not the patient was a referral; (3) an indicationof types of procedures employed in the practice (selected to represent degreesof complexity in performance); (4) a time estimate of involvement in variouspractice arrangements.
From analyses of these variables it was concluded that for the log-diary studyof what actually transpired within a practice, activities of four groupings
. 37

BEST COPY AVAILABLE
FIGURE 4
INSTRUCTIONS TOCARDIOLOGY PROFESSIONAL DIARY PARTICIPANTS
CARDIOLOGY PROFESSIONAL DIARY INSTRUCTIONS
IT IS EXTREMELY IMPORTANT TO OBTAIN A FUU. RECORD OFYOUR PROFESSIONAL DAY . . FROM THE TIME IT STARTSTO THE TIME IT ENDS. Each participating physician has a due tobegin his recording. The dates have been selected to ensure a vestment.sure response for each day of the week. PLEASE BE SURE TO STARTON THE DAY AND DATE INDICATED ON YOUR DIARY ANDCONTINUE UNINTERRUPTED FOR FIVE CONSECUTIVE DAYS.
IF YOU ARE GOING TO BE ON VACATION OR AWAY FROMYOUR PRACTICE FOR TWO OR MORE OF THE DESIGNATEDRECORDING DAYS. CALL US COLLECT FOR A NEW RECORD.INC TIME PERIOD.
RECORDING INSTRUCTIONS:
Record the date In the space provided in the upper left cometd each neordinik rem. Stan on a new page foe tub new dayWhere pottilge. a Uri of categories to choose (tons has been developed.This Coding Op is on the page opposite the particular wordingsection. The categories allow you to select a number and zeroed itrather than write a word or phrase. This will save you much time andmake our analysis much easier.
DIARY RECORDING SHEETS. The number of recrdine sheetsprovided may be excessive for sonic individuals and for callus them maynot le enough. PLEASE USE THE DIARY FOR ONE DAY ANDEVALUATE YOUR OtiN RECORDING REQUIREMENTS. If you findthat you need more sheets than provided. please call us collect Wined.batty and we will send an additional booklet or sheets. Neese keep shedreg booklet
Please record alt professional and profnsionatIvolated activities. Alsoinclude events that commie Diouf-Kant amounts of toot. g g.oravel 01
meals. A SAMPLE DIARY HAS OLEN PREPARED TO ILLUSTRATETHE TYPE OF ENTRY DESIRED IN EACH SECTION. PLEASEREFER TO 711IS BEEt.RE YOU BEGIN YOUR RECORDING.
The sections of the diary are painted according to the types of activity.Their sequence tottetponds to the frequency of use by most physiriantFor example, all will use the Acclivity Overview tertian but many willnot use other the Teaching or Research sections.
Stan your day svilenevri you consider your professional daybegins. boo arm Tune and Lard Tune (Of the grimily anddumbe it according to the particular section's recordingcall Ries.
48
35
Summary notation Cot el activities should be given in the antseetion,Activity OfePrieW. Details toe Patient Care, Laboratoryand Dssencistie Testing, Research and Teaching ate to be giventit the designated sections. See the sample diary tot examples.
Make a new entry foe each new activity.
Types of uthitha for each feelkwuACTIVITY OVERVIEW. Use this section to dewribe ell artittlatIn summary Toni. Such activities as sdnunistrative, ;notational.Wire operation, tissel end patient client are recorded only hers.
PATIENT CARE. Use this section for clinical activities (excepttests) wherever they are provided. If tests see performed is that
so note and carry the activity to the Testing Section. Thetime end should be recorded al the end of the patient umiakLABORATORY AND DIAGNOSTIC TESTING. The categoriesare selfeaplanstoty. Use this section If the patient smite is onlyin Elise:es or as a continuation of the more extensive patient este.
RESEARCH. The categories era sdf.expisnatoty. Oast do noremark you may remove all but one of the Research recordingpages from your diary. In that event, write 'Ito reteerrh" on theremaining page.
TEACHING. De sire to cheek ill columns and tote: the numberof Individuals taught. If you do no traehota you may gamy, allbut one of the Teaching recording pages from your diary. In thatevent, wtte etacking"on the remaining page.
This Diary Study is the most Important of the studies which AdvisoryCommittee on Cardiology Training end Manpower Requirements ladoing. From this, we will be able to determine wins tatdudollsts NIactually tolled upon to do. Later study phases will obtain informationreputing training and staining needs.
YOUR COOPERATION AND PARTICIPATION IS VITALLY INPORTANT. THE. OUAUTY OF VIE STUDY AND ITS RECOMMEND.ATIONS DEPENDS UPON HOW YOU HELP US.
PLEASE RETURN YOUR COMPLETED DIARY IN TILE SEADDRISSLD POSTAGE PAID ENVELOPE PROVIDED. NAIL IT TOUS AS QUICKLY AS YOU CAN.
THANK YOU FOR YOUR HEM CALL US COLLECT AT (213)3254511, tatenton 349. IF YOU HAVE ANY PROBLFAIS.

36
BEST COPY AVAILABLE
FIGURE 5
SAMPLE PAGE FROM CARDIOLOGY PROFESSIONAL DIARY
ACTIVITIES OVERVIEW
CODING KEY:
ADMINISTRATIVE, PROFESSIONAL, PERSONAL, TRAVEL andsignificant time interruptions are recorded only in this section. Someexamples are:
Drive to officeReid Circulation and Annals of Infernal AfedicirtoDinner conference with CCU CommitteeAfternoon vactionDictationConsult with secretaryConsult with Dr. JonesPrepare Insurance formaReview patient chartsPhone calls and correspondenceDrive to airportFly to New YorkVisited friend In hospital
For PATIENT CARE, TESTING. RESEARCH and TEACHING, noteonly the total time In each of these arta in this section. For exam*:
Patients in officePatients at hospitalRead ECGt in laboratoryResearch with hamstersTeaching students and nurses at hospital
USE FOR ALL ACTIVITIES EXCEPT FOR DETAILS REGARDING CLINICAL TEACHING AND RESEARCH
DATE:
-4TIME forACTIVITY
BEGIN/ END
.1IMMON.
SUMMARY FOR DAY:Administrative. Professional, Personal. Travel, Patients.Laboratory. Teaching. Research. Vacation. Met examples opposite this page)
WRITE A PHRASE DESCRIBING EACH ACTIVITY
=.10.alm

BEST Wei AVAILABLE FIGURE 6
SAMPLE PAGE FROM CARDIOLOGY PROFESSIONAL DIARY
PATIENT CLINICAL PROBLEMS
CODING KEY:1. ACTIVITY TIME New towr 'muffle* forNth pat* u.
I. PATIENT DESCRIPTORS Dots host Itown111 elloot Tow stiff mos. *toot ETHNIC W 0 (Other)
Otstsnott to D.R. ill Omel. Gi Po* Ii, pilt*M tremor) kr CV!, s.a S attIot 2 mkt. Now/Old to your pottiesOtte *ohm your combos and won ins. &error hoot Other oltysivono to mottos.
3. PROBLEMS (DO. TREATMENT (Rol indlot DISPOSITION !Amon)Sever soptoptiotentsgoty or tffy...es 10, oat% orml sword turotbo Rave P vortoti or s tot otiose must test
to Woo* thlht MOW Wilton to V* poottA twit/44w) protOotos.
C. 11 teen on Rounds of ICU. record 111 vow NO and 121 Atilt*, IINT000wwTtl 'Role PPOINM. eit,erm. Poto.01*Tooth !Wont§ lontdto11. vwlf. ViOtine totontodhcol StoRtil.
GENERAL PROBLEMS (01t)NoniCardise
1. RESPiIRION2. Roma3. Neurological4. Castroilntesimal5, MusculosketetelB. Psychosomatic
Inontardisc)7. Genito-Urinary8, Dermatological9. Obstetrics/Gyn.
10. Endocrine11. EENT12. None13. Checkup14. OTHER Ispecify)
CARDIAC PROBLEMS ID*)
1. Heart failure, Molt, MIRAHeart failure, chronic, Mere
3. Acute myocardial 'Mutation4. Pulmonary embolism5. Pericardial disease6. Coronary atherosclerosis
without infareation7. Hypertension8. Rheumatic9. Cardiomyopathy
10. Arrhythmia11. Infectious12. Peripheral vascular disease13. Cerebral vascular distal*14. Psychosomatic (eaidst)15. Post cardiac surgery16. Pacemaker evaluation17. CongenitalM. None19. OTHER (specify) -.
37
TREATMENT IRO AND/ORDISPOSITION (Action)
1, Prescribed drum2. Ordered routine tab tests3. Ordered ECG4. Ordered more elaborate non
invasive studies, e.g., phono, apex5. Ordered catheterization tests6. Evaluation for cardiovascular
luf9H1/7. Evaluation for other surgery8. OTHER (specify) ,
USE TO RECORD PATIENT CLINICAL PROBLEMS AND THEIR DISPOSITION EXCEPT FOR TESTS
,TE PATIENT
k*Ar 4ty
4
From
4il? 07
ti.0do
DISCRIPTORSRecords
4 4:'et?' I)/
.s%
g./
PROBLEMS IDal and DISPOSITION
Use Numbered C.aregrreies from CODING KEY
11 Seen On
Rounds. ICUIINDICATE
4sA. 42°,
4 I 'Z'soo 67/
TIMEACTIVITY
BEGIN
for
ND ct44
to
General Du41); noncardiac
4:1*/
Cardiac Du
fo,
Rs and/or
Action t.co,
rrrM
........I .........
40

38
BEST COPY AVAILABLE FIGURE 7
SAMPLE PAGE FROM CARDIOLOGY PROFESSIONAL DIARY
CLINICAL TESTS
CODING KEy:
I. ACTIVITY TIME New time sequence for each patient.
2. PATIENT DESCRIPTORS An abbreviated set is all that is needed since the patient will appear in the PATIENT CAREsection in most instances. Data obtained from patient's chart. Nurse or assistant may record.
3. LABORATORY AND TESTING Make an entry for each test performed. If a test or procedure was used and is not onthe list, DESCRIBE IN COLUMN 17 and then record.
4. YOUR INVOLVEMENT For each test performed, indicate whether you lA1 ordered it: (B) performed it and/or (C) inteipmed et.You will probably use more than one letter with each test.
LABORATORY AND DIAGNOSTIC TESTING PROCEDURES
I. Electrocardiogram2. Vectorcardiogram3. Phonocerdiogram4. Echo, apex or other non-invasive techniques5. Exercise testing6. Cardiac fluoroscopy7. Chest Xray9. Right and/or left heart catheterization9. Right and/or left heart catheterization with angiogram
10. Flotation catheterization11. Selective coronary erteriogram12. Pulmonary angiogram13. Noncoronary arteriogram14. His bundle recordingIS. Pacemaker insertion16. Pacemaker evaluationIT. OTHER: Specify and record
USE TO RECORD CLINICAL TEST ORDERED, PERFORMED AND INTERPRETED
DATE:
rco0
-I0ao-C*
C)
0tn
m
2CI
PATIENTDESCRIPTORS
TIME forACTIVITY et ,..
coSe 0/
4, A- Z "4'1to &t9 to 4-y 01
.st1BEGIN / END
RECORD ALL TESTS PERFORMED IN NUMBERED COLUMNSRefer to numbered list on Apposite par
FOR EACH TEST PERFORMED, indicate whether youA ORDERED et. B PERFORMED it; C INTERPRETED it
7 8 9 10 11 12 13 14 15 16 17
1
I I I

FIGU
RE
8
SAM
PLE
PAG
E FR
OM
CA
RD
IOL
OG
YPR
OFE
SSION
AL
DIA
RY
RE
SEA
RC
H
US
E T
O R
EC
OR
D A
ND
DE
SC
RIB
E Y
OU
R R
ES
EA
RC
H
DA
TE
:
TIM
E for
AC
TIV
ITY
Begin
End
RE
SE
AR
CH
PR
OB
LEM
Brief &
snip:Iva statement
(Am
plify on apposits pageif m
om space is needed)
CH
EC
K A
ND
RE
CO
RD
FO
R A
LL AP
PLIC
AB
LE C
AT
EC
. TIE
SInvolving
LocationU
tilizingY
our Role
1 tan
4 Of
deli'
4=9 044 41,*
0,4/
0.ecli` 41
4/
0*P
etQ
0.

FIG
UR
E 9
SA
MP
LE P
AG
E F
RO
M C
AR
DIO
LOG
Y P
RO
FE
SS
ION
AL D
IAR
Y
=A
C H
ING
US
E T
O R
EC
OR
D A
ND
DE
SC
RIB
E Y
OU
R T
EA
CH
ING
DA
TE
:
TIM
E for
AC
TIV
ITY
co
End
4.
TE
AC
HIN
GL
EV
EL
andSE
TT
ING
.NU
MB
ER
TA
UG
HT
Record an used
ME
TH
OD
ST
OP
IC4101111e W
IN IN
1111011111111110
&
4V
IP A
Z/
Describe in a phase
X2O

41
differed sufficiently to justify identification and independent analysis. WhileUSC DRME and the ACC Advisory Committee were fully cognizant of the factthat the specializations within cardiological practice extend well beyond thefour groupings selected, it was agreed that these groups would supply suffi-cient information to meet the major objectives for this study stage. The fourtypes of cardiologists identified for this log-diary study were:
1. Primary Cardiologists in a non-institutional practice setting (approx-imately 37 percent of the study population);
2. Secondary Cardiologists in a non-institutional practice setting(approximately 41 percent of the study population);
3. Primary Cardiologists in an institutional practice setting (approxi-mately 16 percent of the study population);
4. Secondary Cardiologists in an institutional practice setting (approx-imately 6 percent of the study population).
The non-institutional practice includes those practice arrangements whichtraditionally are described as "solo, " "group," and "partnership." It isrecognized that the concept of "corporation" is omitted in.this classificationand that the difference between "partnership" and "group" is a relativelyobscure one - particularly when the numbers of individuals involved in thearrangement are small. However, initial data did not show significant dif-ferences in activity profiles among thew) groups and they were combined onthat basis.
The institutional practice includes hospital and "hospital-like" arrangementsand employment by medical schools. It does not include individuals whoseemployment is with federal agencies (e.g., NIH, VA); nor does it includecomparable employment arrangements on the state, county or municipal level.
Sampling Population
The population for the diary sample consisted of the non-federal respondentsto the first mailing of the Initial Cardiology Survey. The decision to limitthe sampling population to this group was reached after extensive comparisonsbetween response groups revealed no important differences attributable towhether they responded to the first, second, or third mailing. A controllabledifference would be the numbers of Primary or Secondary Cardiologists re-sponding since this was one of the stratification criteria used in describingthe four groups to study. A non-controllable difference would be associatedwith proportion of time to activities, proportion of patients in a referral status -any factor which was not part of the stratification plan. Analyses were runto provide cu-, :ative statistics on the two respondent groups used in reach-ing the conw that there were no important difference attributable to
44

42
when they responded. Analyses were made to compem the Cardiology Profes-sional Diary sampling strata with the total rest), riding population to the InitialCardiology Survey. The fliffarences between tbs. V.v." gruups are negligible asthey relate to geographical location, patient distance to care, practice arrange-ments, size of medirml service community and proportion of time given tosummarized professional activities. The groups sed for the Cardiology Pro-fessional Diary study has a little more time in cardiological activities, re-ceived more referral patients and had more members who are board certified,Certified in Cardiology and/or members of the ACC. With the exception ofboard certified cardiologists where 10 percent more have this status, thedifferences cited are all less than 5 percent. As a profile, the differencesmight suggest a slightly better "qualified" group of cardiologists than thosewho were not included but even the areas where the difference is greatest hadno apparent effect on the activities which cardiologists perform.
The reasons for using the first respondents as the sampling population, onceit was determined that no important bias would result from the action, were(1) the motivation of participants and (2) the fact that the first study was notcompleted at the time the log-diary study had to begin. Motivation was im-portant because the log-diary was a complex time-consuming instrument.Knowing the complexity of the instrument, it was only logical to work with arespondent group who hae. willincly participated previously - as long asdoing so would not bias the results. Cardiologists who responded to theInitial Cardiology Survey only after a second or third mailing wer:: questionablepotential respondents to th5s longer survey instrument.
Sampling Plan
The basis of the sampling plan was the desirability, expressed by alt groupsinvolved in the study through Advisory Committee action, of obtaining separatestatistical estimates within reesonable error margins for each of the four car-diologist types described previously.
The log-diary population consisted of 3,266 active cardiologists who respondedto the Cardiology Survey during the first response period. The four cardiologisttypes were treated as separate populations (major strata) as follows:
1. Primary Cardiologist, Non-InstitutionalEmployment
2. Primary Cardiologist, InstitutionalEmployment
3. Secondary Cardiologist, Non-InstitutionalEmployment
45
(N=1295)
(N= 530)
(N=1192)

4. Secondary Cardiologist, InstitutionalEmployment
Other (not included)
(N= 107)
(N= 142)
43
"Other" includes a wide array of non-patient care and now-research or teachingroles such as working with pharmaceutical houses, insurance firms, law firms,and the like. Exclusion of "Other" reduced the log-diary population to 3,124.
Each of these major strata was sampled according to the following rationale.The confidence interval for an obtained sample percentage of 50 percent wasset at t 5 percent (68 percent confidence level). Since confidence intervalsare a maximum for sample percentages of 50 percent, actual confidence inter-vals were anticipated to be somewhat narrower. The basic relationship involvedin determining the required sample size for each stratum is expressed in theequation below.
CI a Zpil p)
nL,
CI = Confidence Interval
P = value of the sampled proportion
n = sample size
N = size of the stratum or population
n
Z = the normal deviation associated with the desired probabilitylevel (Z=1 for a probability of 68 percent, Z=1.96 for a proba-bility of 95 percent)
Given the above constraints on the Confidence Interval, sample sizes for thestrata can be determined by this formula:
n = 100N (It is rate of return)N + 100 R
Sample sizes are shown t, .r the four log-diary strata in Table 4.
The actual sample was bas.:.d on the conservative possibility of a return rateas low as 50 percent. This was set because of the known difficulty participantswould have in maintaining the log-diary, the time involved in keeping it, andthe introduction of the survey instrument by mail rather than personal contact.
46

44
TABLE 4
SAMPLE SIZES REQUIRED FOR STANDARD ERROROF FIVE PERCENTa
Specialty/PracticeTYPe N
ammor
Assuming Usable Returns At:
100% 75% 50%Actual._
Sample
,
PrimaryNon-Institutional 1295 93 124 186 192
PrimaryInstitutional 530 84 112 168 171
SecondaryNon-Institutional 1192 92 123 184 187
SecondaryInstitutional 107 52 69 104 106
aFor sample percentages of 50 percent
bSample augmented to ensure representation from all states
47

BEST COPY AVAILABLE 45
In addition to the stratification variables, some concern was raised about therepresentativeness of the samples with respect to geographic and populationvariables. Therefore, each stratum was divided into 40 cells created by com-bining 10 geographic regions and four community sizes, and then sampled pro-portionately according to the size of the cells within the stratum.
Differences in the data obtained from the 40 cells were not anticipated, and inaddition, sampling error for these cells was uncontrolled. For these reasons,no statistical estimates were planned with respect to geographic region orcommunity size. The proportional sampling, however, could result in a re-duction of sampling error for the major strata.
Each of the 40 cells was sampled by the sampling fraCtion used for the majorstrata (.144, .310, .154 and 1.000 respectively). However, certain adjacentsmall cells were collapsed based OS COMISIiif size so that there were 30, 30,29 and 25 cells used. The strata were collapsed to four types of carcilorogists,four community sizes and ten census divisions for analyses.
Participation Rates
The actual rate of return, based on usable diaries, was 55.5 percent (basedon total returns the rate was 63 percent), as shown in Table 5. Primary Cardi-ologists responded at a 58.6 percent rate, compared with 51.5 percent forSecondary Cardiologists. A somewhat higher willingness to respond on thepart of the Primary Cardiologist is also indicated in Table 5 by the higherpercentage of this group in the sampling population (the respondents to thefirst mailing) than in the total respondent group.
The distribution of usable returns among the four strata was, of course, pur-posely created according to the sampling plan. By applying the weights shownin column (f) of Table 5, the strata are reweighted in accordance with thedistribution in the total respondent group.
Table 6 compares the total respondent population, sampling population, sampleand sample returns on the basis of census division, the only deviation beingan under representation of the Middle Atlantic region in the diary returns relativeto the sample and sampling populations. Table 7 compares the sample and thesample returns in a cross-tabulation of strata by census division.
Sam lit12,g12.As previously discussed, samples were drawn from each of the four strata sothat the standard error for estimating percentages within each, stratum wouldbe a maximum of 5 percent under the most conservative assumptions. Actualerrors could be anticipated to be somewhat lower.
48

TA
BL
E 5
CA
RD
IOL
OG
IST
S' P
RO
FESS
ION
AL
DIA
RY
PA
RT
ICIP
AT
ION
RA
TE
S:B
Y S
PEC
IAL
TY
/PR
AC
TIC
E T
YPE
Spec
ialty
/Pra
ctic
e T
ype
Car
diol
ogis
tsN
atio
nally
aSa
mpl
ing
Popu
latio
nD
iary
Dia
rySa
mpl
eU
sabl
eR
etur
nsd
Ret
urn
Rat
ee
Adj
ustm
ent
Wei
ght f
grSa
mpl
e
N1
%N
-
%N
N%
%
Prim
ary:
Non
-Ins
titut
iona
l24
11(3
7.5)
1295
(41.
4)19
211
1(3
0.5)
57.8
%1.
25
Inst
itutio
nal
1056
(16.
4)53
0(1
7.0)
171
102
(28.
0)59
.6%
0.58
Seco
ndar
y:N
on-I
nstit
utio
nal
2612
(40.
6)11
92(3
8.2)
187
97(2
6.6)
51.9
%1.
53
Inst
itutio
nal
357
( 5.
5)10
7(
3.4)
106
54(1
4.8)
50.9
%0.
37fr
4N
TO
TA
L64
36(1
00.0
)s1
24(1
00.0
)65
636
4(1
00.0
)55
.5%
, a Act
ive
non-
fede
ral c
ardi
olog
ists
with
kno
wn
spec
ialty
and
pra
ctic
e ch
arac
teri
stic
sb
Res
pond
ents
fro
m (
a) to
fir
st m
ailin
g of
Ini
tial C
ardi
olog
y Su
rvey
c Sam
ple
from
(b)
des
crib
ed o
n pa
ges
d Act
ual r
etur
ns f
rom
(c)
e(d)
div
ided
by
(c)
/Wei
ght ap
plie
d to
(d)
to a
chie
ve p
erce
ntag
e di
stri
butio
n co
mpa
rabl
e to
(a)
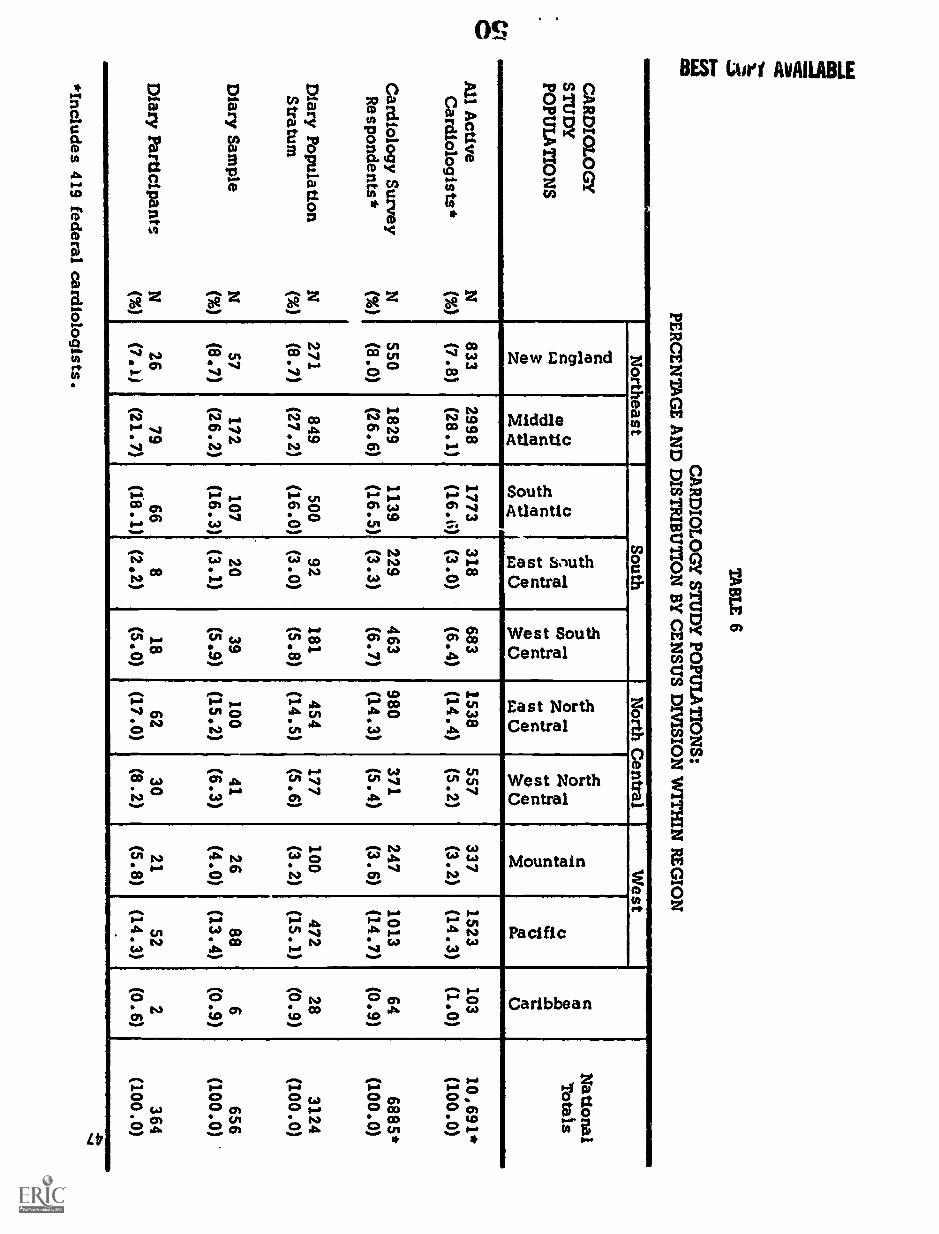
TA
BL
E 6
CA
RD
IOL
OG
Y ST
UD
Y PO
PUL
AT
ION
S:PE
RC
EN
TA
GE
AN
D D
ISTR
IBU
TIO
N B
Y C
EN
SUS D
IVISIO
N W
ITH
IN R
EG
ION
CA
RD
IOL
OG
YST
UD
YPO
PUL
AT
ION
S
Northeast
SouthN
orth Central
West
ci0U
National
Totals
13toScr. 4
Z
ai
to
.i. .1
a6 ag
.c...g-42 B
'4 8
6o0ra118
f..aZ il
a 8
6i.1). . 4
%'A
. .
5 6,
cI't,
.4..)....
a. ID
.
All Active
N833
2998
1773
318
683
1538
557
337
1523
103
10,691*
Cardiologists*
(%)
(7.8)
(28.1)
(16.6)
(3.0)
(6.4)
(14.4)
(5.2)
(3.2)
(14.3)
(1.0)
(100.0)
Cardiology Survey
N550
1829
1139
229
463
980
371
247
1013
64
6885*
Respondents*
(%)
(8.0)
(26.6)
(16.5)
(3.3)
(6.7)
(14.3)(5.4)
(3.6)(14.7)
(0.9)
(100.0)
Diary Population
N271
849
500
92
181
454
177
100
472
28
3124
Stratum
(%)
(8.7)
(27.2)
(16.0)
(3.0)
(5.8)
(14.5)
(5.6)
(3.2)
(15.1)
(0.9)
(100.0)
Diary Sample
N57
172
107
20
39
100
41
26
88
6656
(%)
(8.7)
(26.2)
(16.3)(3.1)
(5.9)(15.2)
(6.3)
(4.0)
(13.4)
(0.9)
(100.0)
.
Diary Participants
N26
7966
818
6230
2152
2364
(%)
(7. J.(21.7)
(18.1)(2.2)
(5.0)
(17.0)
(8.2)(5.8)
(14.3)(0.6)
(100.0)
*Includes 419 federal cardiologists.

CI4
TA
BL
E 7
PER
CE
NT
AG
E A
ND
DIST
RIB
UT
ION
OF C
AR
DIO
LO
GY
PRO
FESSIO
NA
L D
IAR
Y PA
RT
ICIPA
NT
S:A
LL
OC
AT
ION
S WIT
HIN
SPEC
IAL
TY
AN
D PR
AC
TIC
E B
Y C
EN
SUS D
IVISIO
N W
ITH
IN R
EG
ION
4
SPEC
IAL
TY
AN
DPR
AC
TIC
E
Northeast
SouthN
orth Central
West
c0.o.0S.00
,
Nstional
Totals
socmcsa3mZ
J.D. V
Is c.002gi
Vf c00IL
V
..0co 0binc418
IS00(A ..-4
.. Bw
c3U
f0zifclic4343
.
f0t?Ca C
;LI
I
gf0i`
04es..
r)0a.
Primary C
ardiologist
N(%)
N(%)
7(6.3)
6(5.9)
23(20.7)
26(25.5)
18(16.3)
18(17.7)
4(3.6)
2(2.0)
4(3.6)
5(4.9)
P.
20(18.0)
13(12.6)
4(3.6)
11(10.8)
9(8.1)
6(5.9)
20(1° .0)
15(14.7)
2(1.8)
0(0.0)
,
111(100.0)
102(100.0)
Non-Institutional
Institutional
Sub Total
N(%)
136.1)4923.0)
3616.9)62.8
94.23315.5
157.0)15
1
7.03516.4
20.9)213100.0)
Secondary Cardiologist
N(%)
N(%)
8(8.3)
5(9.3)
22(22.7)
8(14.8)
19(19.6)
11(20.4)
1(1.0)
1(1.9)
4(4.1)
5(9.3)
15(15.5)
14(25.9)
11(11.3)
4(7.4)
3(3.1)
3(5.6)
14(14.4)
3(5.6)
0(0.0)
0(0.0)
97(100.0)
54(100.0)
Non-Institutional
Institutional
Sub Total
N(%)
13(8.6)30
(19.9)_30
(19.9),2(1.3)
9(6.0)29(19.2)
15(9.9)6(4.0)
17(11.2)
0(0.0)151
(100.0)A
ll Cardiologists
N(%)
26(7.1)79
(21.7)66
(18.1)8(2.2)
18(5.0)62
(17.0)30(8.2)
21(5.8)52
(14.3)2(0.6)
364(100.0)

49
When en obtained sample percentage is 50 percent, the standard error is amaximum, with percentages deviating in either direction from 50 percent havingsmaller associated error. In addition, response rates were higher than con-servative estimates - 55.1 percent usable diaries were achieved rather than50 percent. Taking these factors into account, aetimates for the standarderrors of percentages obtained in the leg-diary study can be made. A detailedanalysis of expected standard errors for each stratum and for stratum compositeswas made, :'his analysis may be summarizes as follows:
For individual strata, the errors are
o between 4 and 5 percent for sampled percentages in mid-range(30 to 70 percent);
o between 3 and 4 percent for sampled15 to 30 and 70 to 85 percent;
o between 2 and 3 percent for sampled85 to 95 percent;
percentages in the ranges of
percentages from 5 to 15 and
o about one percent for extreme percentages.
In the case of sample percentages for All Cardiologists" (a weighted com-posite across strata), the erros are expected to be only about half as large asthose for individual strata, even assuming no gains from stratification. To theextent that sample percentages vary from stratum to stratum, as opposed tovariation within the s67ata, error in the composite coats may be even lower.
Biaf 1; Reseopse Attributable to Tine
Bias could emanate from factors associated with the time-period given to aparticular p`Tsician for Lis five-6ay recording. Those factors might be uniqueto his practice situation or attributable to an unusual set of environmentalevents. The study did extend over five months (from June through Loctober) andthere was a major flood along the entire Eastern seaboard at the beginning ofthe study. It is not necessary to speculate regarding whether or not such eventsinfluenced the study since a question was included with the diary addressed tothe typicality issue. The question asked, "Is this time period typical of yourpractice? If NO, how does it differ?" The analysis of responses to thisquestion did not establish a clear pattern of atypicality even though about24 percent checked that theft time period was not typical. To summarize theanalysis for all cardiologists:
o 16 percent checked the time was slower than usual4 percent checked the time was faster than usual4 percent gave no reason or statement
52

50
o reasons given for atypicality - applicable about equally to the slowand fast practices were
vacation or summer 6.9 percent
office patient load 5.5 percent
hospital patient load 4.1 percent
no teaching rounds 3.0 percent
laboratory work 2.2 percent
research 0.8 percent
environmental factors 0.8 percent
medical school teaching 0.5 percent
The diaries from those indicating atypical factors were individually comparedwith other diaries of the same type. This comparison did not establish eitherparticularly heavy-load or light-load practices. DRME concludes from theselimited data that whiltyariations were reported, they were not systematic(i.e., in the same direction) with the possible exception of the summer effecton institutional practices. Perhaps the fact that the study extended from theend of one school year into the beginning of the next allowed the InstitutionalCardiologists a choice of participation times which most accurately reflectedtheir normal practice situation.
Affects of Non-Bs:pow, op ptudv Conclusions
DRME has reviewed the respondent date in terms of all known and potentialsources of bias as these might affect the four types of cardiologist respondents.The effect of differential response on a geographic basis has been examinedas well. The conclusion reached is that the data do not have significantbiasing elements associated with them at the primary sampling level - the levelof the four types of cardiologists. However, there are some differences be-tween the respondents and non-respondents based on comparable data fromthe AMA supplied data and the Initial Cardiology Survey. The actual detailedanalysis is found in Appendix A. The conclusions reached from this analysisare as follows.
1. Cardiologists more heavily involved in cardiology are more likelyto respond to the log-diary. This willingness to participate isexpected on the part of Primary Cardiologists as compared toSecondary Cardiologists. In addition, the fact that the studywas conducted under the auspices of the American College ofCardiology produced a larger return rate among members of thatgroup. 53

51
2. The older cardiologists did not respond in as high a percentage astheir younger counterparts.
3. Cardiologists in solo practice and in hosptial-based practicesresponded at a lower rate than those in either partnerships orgroup practice. This might be attributable to differences in theavailability of support staffs to assist with patient-descriptivedata for the log-diary.
4. The lower response-rate for the Urban Middle Atlantic cardiologistis not readily explainable. Although the age distribution in this areais higher than in other Jreas a comparison based on age showed atendency toward non-response for solo and hospital-based cardi-ologists noted earlier might be a factor since these are more heavilyconcentrated in the Urban Middle Atlantic areas.
PHASE FOUR: CARDIOLOGISTS' TRAINING, TRAINING NEEDS AND PRACTICESSTUDY - CARDIOLOGISTS' TRAINING SURVEY
In this study, the project obtained data on the training cardiologists receivedbefore entering practice, their assessment of needs for training, and theirassessment of the adequacy of cardiological manpower in their practice areas.This study and another, involving the institutions which train cardiologists(Phase Five), provide direct assessments regarding the training matters ofconcern to the Advisory Committee.
Both studies asked the same questions regarding topics in training and similarquestions in the area of actual training completed. The design symmetry wasincorporated to allow direct comparisons between the trainers' required trainingand the trainees' assessment of its adequacy in a practice setting.
Study Obtectives
I. To determine the amount of post-doctoral training (expressed inyears) for residencies and fellowships.
2. To verify initial estimates of the proportion of cardiologists who areBoard-Certified in either Internal Medicine or Cardiology.
3, To determine topical areas in which the cardiologist was trained,his assessment of relevancy of training to his practice, and hisjudgment regarding the training's importance to others in practicessimilar to his.
4. To determine his needs for continuing education: in what areas,with what frequency, and by what means.
54

52
5. To obtain his assessment of manpower adequacy for both Primaryand Secondary Cardiologists in his particular geographic area.
Study Instrument
The eleven- page questionnaire design permitted either recording of factualdata (e.g., "where received residency training and number or years in training")or checking of a response choice most closely approaching the statement whichwould have been made had the question been open-ended. This proceduresimplified the respondent's tasks and provided the project staff with uniformresponse data. The first three sections focused on characteristics of the cardi-ologist's current practice and his training for practice. The fourth sectionasked about continuing education - frequencey of participation and recommen-dations for programs. The fifth section asked for an assessment of manpoweradequacy. The final section invited narrative recommendations in either man-power or training areas.
Field testing occurred in the Los Angeles area. Cardiologists whose ages andpractices were representative of those to whom the instrument would be sentparticipated in this test. The final instrument reflected their recommendationsas well as some provided by the Advisory Committee and NMI.
The development of the questionnaire extended over about one calendar year,during which time it was an agenda item for each of the Advisory Committee'smeetings. Initially the plan had been to obtain information regarding functionsand responsibilities of support staffs and similar organizational questions;these were omitted by the Committee who deemed it more important to obtaina comparatively detailed assessment of the parameters of individual's trainingand assessment of what ought to be offered for each type of training. Theactual survey instrument follows and is referenced as Figure 10.
Study Scrata
Analysis of the Initial Cardiology Survey data suggested that some differencesin the training area might be associated with their age and with age-relatedmeasures. The Committee was particularly interested in the training receivedby cardiologists whose ages were less than 40, although they had an interestin the training experiences of older cardiologists as well. It was believedthat the younger cardiologists' assessments of training programs would be muchmore appropriate than those of the older cardiologists' because substantivechanges in formal cardiovascular training have occurred during the past tenyears. Because of the special importance of young cardiologists in assessingtraining program adequacy, the sampling plan was designed to obtain moreparticipants from this age group.
55

BEST COPY AVAILABLE
COMMITTEE:FORREST H ADAMS. M D
ChotrootaLot Anodes. Celtfovote
WALTER H ABELMANN. M DACIPt84110111 ofthOPINSIOBOOON. 3.ttethrttuts
NOBLE 0 FOWLER. M.DSobtiterooh) Dodd toCetdoorestolat DowseComtism" Obto
RAY W GIFFORD. JR M Deferettets College ofClots PbyttrlAllClerelood. Obs,
W'ALTFR H PRITCHARD. M.Cotouti cc Cloned Cehltolog,slonettreo HAW 111100411,0111atookod. Obto
H 3. C SWAN M D.Amens." College of CitologyLos Aeries. Celsfonlie
STEPHEN ABRAHAMSON. PH DProws Po mo.thot tont, of Soatberss CalsioroieLos Angeles, Cohlorose
FIGURE 10
loon ApprovedOMB No bBS.73029App lisp 12/31/73
AMERICAN COLLEGE OF CARDIOLOGY9650 ROCKVILLE PIKE 13ETHESDA. MARYLAND 30014 PHONE 301 530.1600
ADVISORY COMMITTEE ON CARDIOLOGY TRAININGAND MANPOWER REQUIREMENTS
CARDIOLOGIST'S TRAINING SURVEY
SAMPLE LABEL
00000-30C-0-0000
John A. Doe, M.D.Anytown, U.S.A.
Your participation is vitally important. If you have any questions please call our Associate Project Director, R. C.Mendenhall, at (213) 225-1511, extension 349, collect.
Please return your completed form to our Cardiology Manpower Study Project, University of Southern CaliforniaSchool of Medicine, Division of Research in Medical Education in the self-addressed stamped envelope whichaccompanied the survey. If you misplaced it, the address is 2025 Zonal Avenue, Los Angeles, California 90033.
56
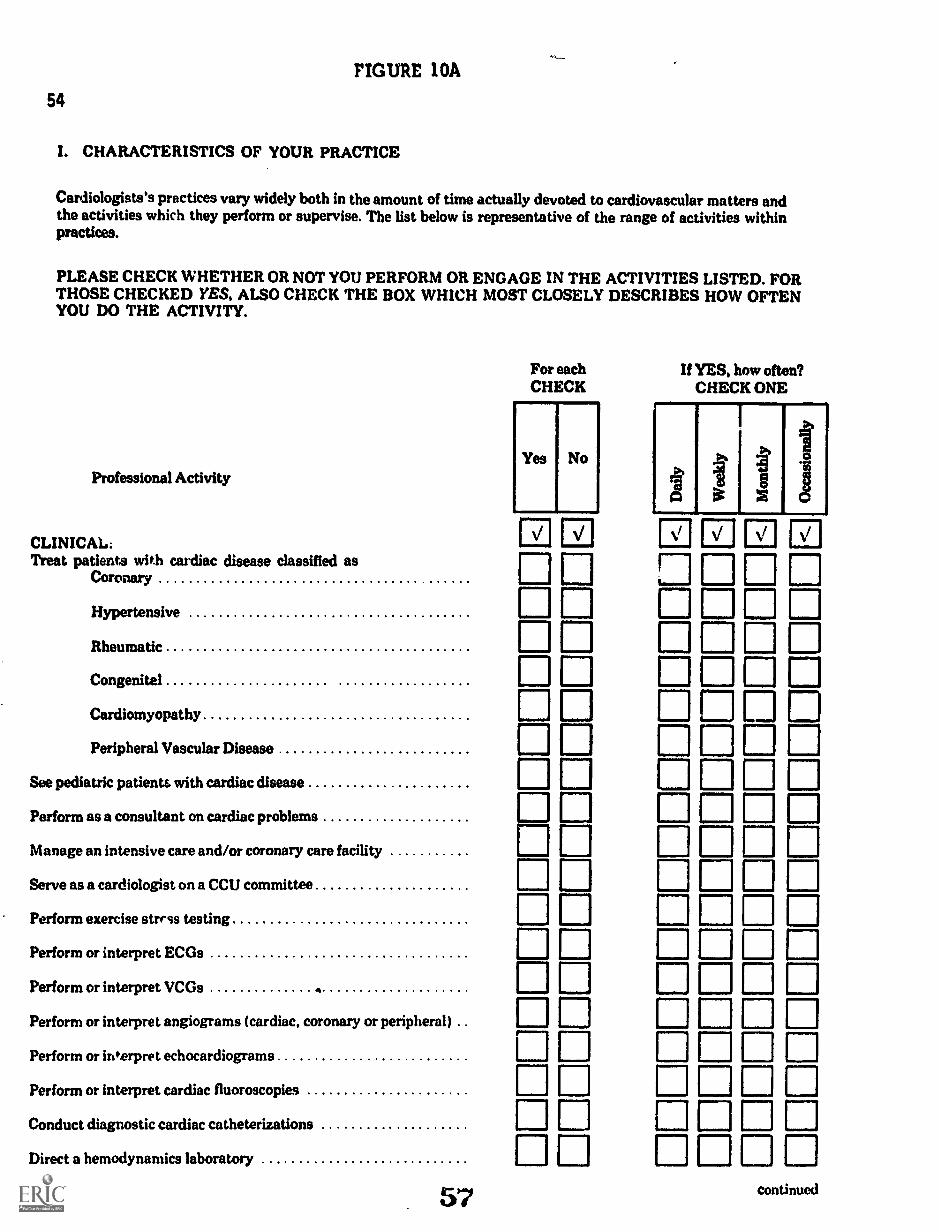
FIGURE 10A
54
I. CHARACTERISTICS OF YOUR PRACTICE
Cardiologists's practices vary widely both in the amount of time actually devoted to cardiovascular matters andthe activities which they perform or supervise. The list below is representative of the range of activities withinpractices.
PLEASE CHECK WHETHER OR NOT YOU PERFORM OR ENGAGE IN THE ACTIVITIES LISTED. FORTHOSE CHECKED YES, ALSO CHECK THE BOX WHICH MOST CLOSELY DESCRIBES HOW OFTENYOU DO THE ACTIVITY.
Professional Activity
CLINICAL:Treat patients with cardiac disease classified as
Coronary
Hypertensive
Rheumatic
Congenital
Cardiomyopathy
Peripheral Vascular Disease
See pediatric patients with cardiac disease
Perform as a consultant on cardiac problems
Manage an intensive care and/or coronary care facility
Serve as a cardiologist on a CCU committee
Perform exercise strrss testing
Perform or interpret ECGs
Perform or interpret VCGs 4
Perform or interpret angiograms (cardiac, coronary or peripheral)
Perform or interpret echocardiograms
Perform or interpret cardiac fluoroscopies
Conduct diagnostic cardiac catheterization
Direct a hemodynamics laboratory
57
For eachCHECK
Yes No
If YES, how often?CHECK ONE
1 lb
1
,.,
1
Ii
ED El
continued

FIGURE 1011
I. CHARACTERISTICS OF YOUR PRACTICE (Continued)
Professional Activity
RESEARCH:Conduct clinical research
Conduct basic laboratory research
TEACHING:Teach nursing staff on clinical rounds or classroom
Teach medical students, interns, residents and/or fellows inclinical and laboratory settings
Teach medical students, interns, residents and/or fellows informal classroom settings
Teach others to perform cardiac diagnostic xray procedures
Teach others to perform cardiac catheterizations
Teach tether diagnostic techniques: ECG, VCG, etc
Participate in professional seminars, workshops and symposiaas a consultant cardiologist
II. YOUR TYPE OF PRACTICE
For eachCHECK
Yes No
Ili
El 00
El 00a
55
If YES, how often?CHECK ONE
f:.,
1
a%
g
a ti mDODOEl ODDDI= 0D ODDD ODO0 E=El C=D ODODODO
A year ago, we asked you questions about the amount of time which you devote to different activities and theemployment arrangements for your practice. We need a current summary of (a) your involvement in cardiology and(b) your practice arrangement. PLEASE CHECK THE STATEMENTS BELOW WHICH BEST DESCRIBEYOUR PRACTICE.
1. My practice is:
Primarily in cardiology (over 50 percent time)
Secondarily in cardiology (under 50 percent time)
2. My practice arrangements are predominantly:NonInstitutional (Solo, Group, Partnership)
Institutional (Medical School, Hospital)
58
Check BestDescriptors
ri
Iii

FIGURE 10C56
III. YOUR TRAINING IN CARDIOVASCULAR DISEASES, ITS ADEQUACY AND YOUR RECOMMEND-ATIONS FOR THE TRAINING OF OTHER CARDIOLOGISTS
1. How many years of post-doctoral clinical training did you have before enteringyour own continuous practice?
(years)
2. Are you board certified in internal medicine?
3. Are you board certified in a specialty other than internal medicine?If yes, certified in
(describe)
4. Are you subspecialty board certified in cardiovascular disease?
CHECK ONEYes No
5. Please indicate the types, dates and locations for your post-doctoral training:
Type of Training Yearlal Institution Institution City
Internship
ResidencyInternal MedicineOther I name):
Fellow in Cardiology*
*At least one year of full-time training
59
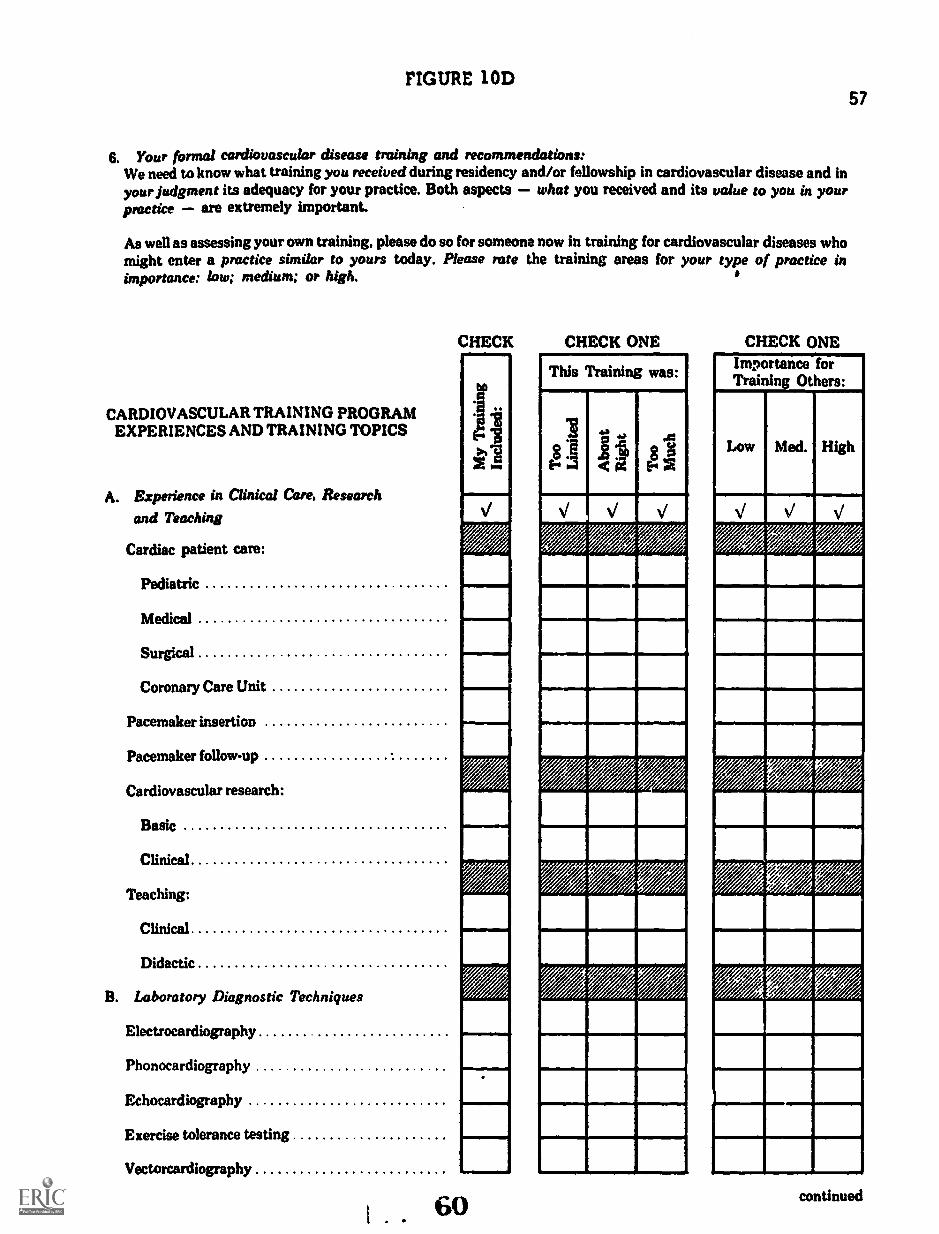
FIGURE 10D
6. Your formal cardiovascular disease training and recommendations:We need to know what training you received during residency and/or fellowship in cardiovascular disease and inyour Judgment its adequacy for your practice. Both aspects what you received and its value to you in yourpractice are extremely important.
As well as assessing your own training, please do so for someone now in training for cardiovascular diseases whomight enter a practice similar to yours today. Please rate the training areas for your type of practice inimportance: low; medium; or high.
CARDIOVASCULAR TRAINING PROGRAMEXPERIENCES AND TRAINING TOPICS
A. Experience in Clinical Care, Research
and Teaching
Cardiac patient care:
Pediatric
Medical
Surgical
Coronary Care Unit
Pacemaker insertion
Pacemaker follow-up
Cardiovascular research:
Basic
Clinical
Teaching:
Clinical
Didactic
B. Laboratory Diagnostic Techniques
Electrocardiography
Phonocardiography
Echocardiography
Exercise tolerance testing
Vectorcardiography
CHECK
bU
CHECK ONE
This Training was:
8E
v
1161111
VZ-,71,1,14
CHECK ONEImportance forTraining Others:
57
continued

FIGURE 10E58
CARDIOVASCULAR TRAINING PROGRAMEXPERIENCES AND TRAINING TOPICS
B. Laboratory Diagnostic Techniques (continued)
Angiography:
Cardiac
Coronary
Peripheral
Cardiac catheterization
SwanGanz right heart catheterization
C. Laboratory and Classroom Instruction
CV anatomy
CV physiology
CV biochemistry
CV pathology
CV epidemiology
CV pharmacology
CV radiology
Pulmonary physiology
Hypertensive renal disease
Peripheral vascular disease
Cerebral vascular disease
Biostatistics
Bioengineering
CHECK CHECK ONE CHECK ONE
This Training was:
V V V
Importance forTraining Others:
Med. High

FIGURE IOF59
IV. CONTINUING EDUCATION, ITS ADEQUACY AND RECOMMENDATIONS1. Your Needs for Continuing Education Programs:
As a practicing physician with a significant involvement in cardiovascular patient care, you are in a betterposition to assess your own needs for further formal training than anyone else. Your assessment is vitallyimportant to us.
For your own training, please check the areas or topics of interest, the lengta of course desired and how often itshould be offered to you
c
TYPE OF TRAINING
A. CLASSROOM INSTRUCTION OR SEMINARS
General medical cardiology
CV surgery
Pediatric cardiology
CV anatomy
CV physiology
CV biochemistry
CV pathology
CV epidemiology
CV pharmacology
CV radiology
Pulmonary physiology
Hypertensive renal disease
Peripheral vascular disease
Cerebral vascular disease
Biostatistics
Bioengineering
Electrocardiography
Phonocardiography
sininw.16.1.I
1101111M
V
MMISIMIMIRIM'
PINSIIIIMIIIMIO
111111011111111111
Imommomowl
INIOMINISESII
62
OWN TRAINING
HOW OFFERED
r §Sti
VI
continued
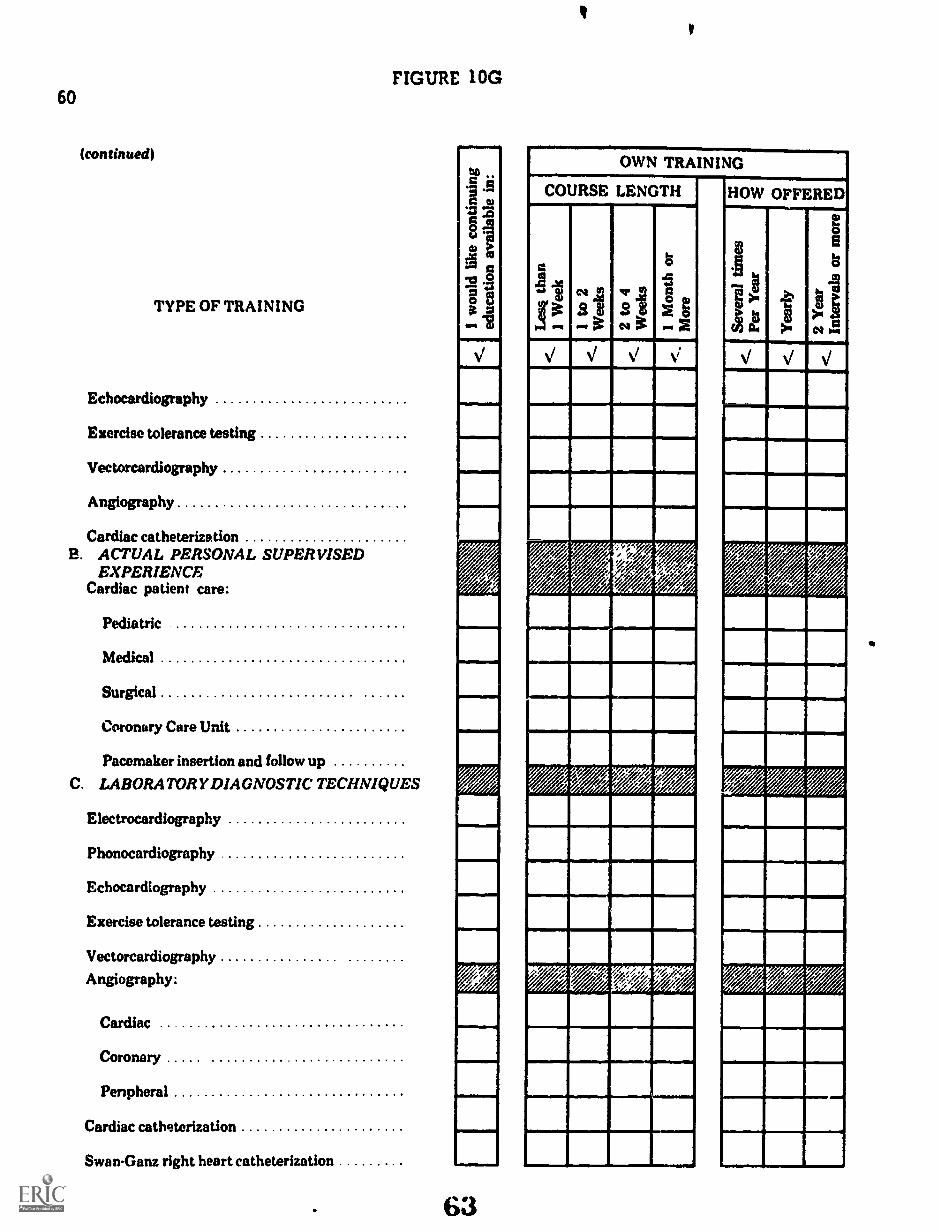
60
(continued)
TYPE OF TRAINING
FIGURE 10G
Echocardiography
Exercise tolerance testing
Vectorcardiography
Angiography
Cardiac catheterizationB. ACTUAL PERSONAL SUPERVISED
EXPERIENCECardiac patient care:
Pediatric
Medical
Surgical
Coronary Care Unit
Pacemaker insertion and follow up
C. LABORATORY DIAGNOSTIC TECHNIQUES
Electrocardiography
Phonocardiography
Echocardiography
Exercise tolerance testing
Vectorcardiography
Angiography:
Cardiac
Coronary
Penpheral
Cardiac catheterization
SwanGanz right heart catheterization
63
OWN TRAINING
COURSE LENGTH HOW OFFERED
0
N
.1347A VA
rei

FIGURE 10H
2. Participation in Continuing Education Programs
In formulating recommendations regarding educational programs, it will be important to know how often youand other cardiologists actually participate in different types of programs.
A. How often do you participate in continuing education courses in cardiovascular diseases?
(Check One)
More than once a year
Once a year
Every 1 to 2 years
Every 2 to 3 years
B. Do you consider the opportunities offered:
(Check one)
0 adequateinadequate
0 Every 3 to 5 years
0 Every 5 to 10 years
Enj Do not participate
no opinion
61
C. How often do you attend national meetings devoted exclusively to cardiology (i.e., broad scope scientificmeetings not "postgraduate" courses)?
(Check One)
ElMore than once a year Ej Every 3 to 5 years
EDOnce a year El Every 5 to 10 years
Every 1 to 2 years EI Do not participate
Every 2 to 3 years
D. How often do you attend national or regional meetings having substantial cardiology sessions (i.e., broadscope scientific meetings not "postgraduate" courses)?
(Check One)
EiMore than once a year
Once a year
Every 1 to 2 years
E] Every 2 to 3 years
64
ElEvery 3 to 5 years
Every 5 to 10 years
ElDo not participate

62 FIGURE ior
V. ASSESSMENT OF CARDIOLOGY MANPOWER
In your geographical area only, please Indicate whether or not more cardiologists with either a primary orsecondary commitment to cardiology are needed.
In my geographical area: CHECK ONE
Too About TooFew Right ManyA. The number of physi-
cians whose practiceinvolves a primary com-mitment to cardiovascu-lar disease is:
B. The number of physi-cians whose practiceinvolves a secondarycommitment to cardio-vascular disease is:
VI. RECOMMENDATIONS: The Advisory Committee and National Heart and Lung Institute will be grateful forany recommendations which you have regarding either (1) cardiology manpower; (2) training of cardiologyresidents/fellows; or (3) the continuing education for cardiologists in practice.
1. Cardiology manpower:
0111..1
63

FIGURE 107
2. Training of cardiology residents/fellows:
63
3. Continuing education for cardiologists in practice:
66

64
The four types of cardiologists studied in the log-diary study were used inthis study. These, divided into two age groups (under 40 and 40 years ormore), resulted in eight for individual study and analyses.
SAMPLING PLAN
Cardiologists under age 40 were sampled with the maximum standard errorset at 3 percent. Those over age 40 were sampled with the maximum standarderror at 5 percent. The more stringent sampling procedure for the under-40 agegroup was used because the responses of the younger group were considered moreimportant in training program assessments and recommendations.
Table 8 presents the sampling plan. The sampling plan was developed under theassumption that only two age groups would be studied; .1) under 40 years oldand (2) from 40 to 60 years old. Federal reviewers (OMB) insisted on includingthe cardiologists older than 60. Rather than revise the plan with a consequentreduced number required in the middle age group, the samples for the agegroup 40 through 59 were augmented by samples taken from the age group 60and over. These samples were drawn in the same proportions as the samplesfrom the 40 through 59 age groups, which permitted analysis of data either asin the original sampling plan, or analysis based on a combination of both agegroups. For these reasons, the combined sample is larger than would havebeen required if only the combined group (all cardiologists 40 years and over)were of interest.
All cardiologist who were in-training in December 1971 received this surveyalthough they were not included in the active cardiologist analyses. Therationale for their inclusion was the belief that (1) while their training mightstill be in process, useful insights would accrue from their responses to thosequestions which were training program specific; (2) some shifts from "in-training" to "active" might be identified.
egaimian_..§1Rate
The study extended over 86 calendar days. Two mailings with accompanyingsurvey instruments and one final letter encouraging participation consitutedthe contact methods for this study. The total response rate was 73 percent.
Figure 11 displays the percent of toal survey forms received by data collectiondays, distinguishing among those obtained from one mailing, those from asecond, and those that responded after a third mailing. (The percentages sumto 100 percent and are read, 30 percent received during first 10 days, etc.)The interest in Figure 11 is primarily methodological although it does indicateminimum lapsed times to achieve responbu rates greater than 70 percent andthe yield in returns which sequential requests produce.
67

65
TABLE 8
SAMPLE SIZES REQUIRED FOR CARDIOLOGISTS' TRAINING SURVEY'
Specialty/Practice Typeand Age Groups N
Assuming Usable Returns at: ActualSample
100% 75% 50%
UNDER 40 YEARS
Primary:Non-Institutional 565 186 248 372 373
Institutional 733 201 268 402 403
Secondary:Non-Institutional 483 177 236 354 354
Institutional 180 109 145 180 180
40 AND OVER
Primary:Non-Institutional 1881 92 123 184 250*
Institutional 614 84 112 168 190*
Secondary:Non-Institutional 2174 93 124 186 269*
Institutional 304 71 95 142 176*
Subtotal 6934 1013 1351 1988 2195
FELLOWS 424 424
TOTAL 7358 2619
1Strata 1-4 sampled for 3 percent standard error;Strata 5-8 sampled for 5 percent standard error
*Samples augmented to achieve representation for over 60 years of age groups

30r
25
ex 2
01- U
- 01
1- z 1.1.
1
CC
CL
.10
FIG
UR
E 1
1
CA
RD
IOLO
GIS
T'S
TR
AIN
ING
SU
RV
EY
PE
RC
EN
T O
F T
OT
AL
RE
TU
RN
SB
Y S
ELE
CT
ED
TIM
E P
ER
IOD
S IZE
FIR
ST
MA
ILIN
G z
60.
7%
SE
CO
ND
MA
ILIN
G z
31.
9%
TH
IRD
MA
ILIN
G =
7.5
%offOret.
$1,11040i1
1011
17
18-2
425
-28
29-3
839
-45
46-5
2 53
-59
60-6
6 67
-73
74-7
9 80
-86
SE
QU
EN
TIA
L D
AT
A C
OLL
EC
TIO
N D
AY
S

67
§m ay
Table 9 presents the distribution for respondents by age and type of cardi-ologist. It inch les percentages received, not usable and actually used inanalyses. It is apparent from this table that the Primary Cardiologists res-ponded better than the Secondary Cardiologists. Based on usable returns, andnot including cardiology Fellows, the overall rate of return for the trainingsurvey was 68.7 percent. As in the diary study, Primary Cardiologists res-ponded at a higher rate (73.2 percent) than Secondardy Cardiologists (63,2percent). Non-institutional Cardiologists under 40 years of age respondedat a somewhat higher rate (72.2 percent) than either Institutional Cardiologistsunder 40 (66.6 percent), or than Non- institutional Cardiologists 40 years andover (67.6 percent). The analysis of non-respondents which follows providesmore complete data on tendencies toward non-response.
The essential sampling objectives were met and in most instances exceededfor each of the eight groups sampled. Weighting, applied to each stratum,adjusts the respondents to reflect the proportion of the total cardiologistpopulation which they represent.
While weighting will put the respondent group in its proper perspective relatedto other groups, a question emerges concerning the selectivity in respondentswhich different response rates may indicate. A detailed analysis of respon-dents compared to non-respondents using Initial Cardiology Survey and AMAbiographical data was conducted to determine the potential effects of thenon-respondent group. This is reported in detail in Appendix A. Conclusionsfrom that analysis are similar to those reported for the log-diary study.
o Those cardiologists more heavily involved in cardiology (primary)responded better than those with a minor cardiology commitment(secondary). This tendency was greater than a similar tendencynoted in the log-diary study, due to the fact that the log-diarypopulation (first wave questionnaire respondents) already con-tained selectively more cardiology specialists than the studypopulation for the training survey (all questionnaire respondents).
o Younger cardiologists engaged in solo and hospital-basedpractices responded at a lower rate than those in other prac-tice arrangements.
o No important geographical or population differences were found.
o No important differences related to professional activities werefound.
Since stratification for this study was based on (1) primary or secondary cardi-ologist in (2) non-institutional or institutional practice settings and (3) by agegroups, the variability noted is accounted for through the sampling plan except

68
TABLE 9
CARDIOLOGISTS' TRAINING SURVEY PARTICIPATION RATES:SPECIALTY/PRACTICE TYPE AND AGE GROUPS
BY PROPORTIONS WITHIN SAMPLING CATEGORIES
.Specialty/Practioe Type
andAge Groups Population Sample'
.
Usable ReturneeReturtRate'
AdjustmentWeight for
Samples
N % N 96. N % %
UNDER 40 YEARS
Primary:Non-Institutional 565 ( 8.0) 373 (17.0) 282 (18.7) 75.6% .428
Institutional 733 (10.6) 403 (18.4) 288 (19.1) 71.5% .555
Second :.y:Non-Institutional 483 ( 7.0) 354 (16.1) 243 (16.1) 68.6% .435
Institutional 180 ( 2.6) 180 ( 8.2) 100 ( 6.6) 55.6% .392
40 AND OVER
Primary:Non-Institutional 1881 (27.1) 250 (11.3) 178 (11.8) 71.2% 2.299
Institutional 614 ( 8.9) 190 ( 8.6) 142 ( 9.4) 74.7% .946
Secondary:Non-Institutional 2174 (31.4) 269 (12.2) 173 (11.4) 64.3% 2.739
Institutional 304 ( 4.4) 176 ( 8.0) 103 ( 6.8) 58.5% .645
Subtotal 6934 (100.0) 2195 (100.0) 1509 (100.0) 68.7%
FELLOWS 424 424 234 55.2%.....m.........11111~
TOTAL 7358 2619 1743 66.6%
, IIIMMIMiii=MI
aAll private and federal cardiologists responding to initial questionnaire, less those unclassifiable withrespect to strata
bSample as described in Table
CDoes not include 235 non-usable returns
d(c) divided by (b)
eWeight applied to (c) to achieve percentage distribution comparable to (a)
71

69
for the young cardiologist in solo and hospital-based practice. However,deviation from the sample mean in both instances is less than 2 percent.
The relationship of the respondent group to the sample and, in turn, to thetotal cardiology population is shown in Table 10. Comparing the sample withthe participants, the differences are inconsequential. The differences be-tween the sample and the line noted as "Training Population Stratum" areexpected since Middle Atlantic has proportionately more 2,101 cardiologistsand South Atlantic has proportionately more younter, cardiologists than othergeographic divisions.
Se lin ed f r Cardiolo ists T a ni Sury = Data
The sampling plan discussion made the observation that conservative assump-tions regarding obtained percentages could be expected to result in standarderrors substantially lower than (1) the 5 percent used for cardiologists 60 yearsold and over; (2) the 3 percent used for cardiologists under age 40. Com-paratively lower error rates were achieved in this study than in the log-diarystudy because of higher response rates in all age groups. The detailed errorrates that could be expected for sampled percentages obtained from this sur-vey are presented in Chaper 8. These are summarized in Table 11.
PHASE FIVE: CARDIOLOGY TRAINING PROGRAMS STUDY
This study, addressed to institutions providing full-time cardiovasculartraining of at least one year duration, consumed more Advisory Committee andDRME Project Staff time in its conception than any of the other study phases.The time was required because (1) there was no existing list of institutionsoffering the type of training of interest; (2) there were no formally acceptedstandards for such trifling programs; and (3) a compromise related to "desiredlevel of detail" and "likely level of response" was required through each ofthe iterations of the study design - a problem never fully resolved to allparty's satisfaction.
The resultant survey instrument was very complex, one which would readilybe answered only by those who attached the same level of importance to itas was given by the investigators. None of the sections called for data whichcould be easily obtained from a single source; most of them required compila-tion by the responding individuals.
The objectives may be summarized as follows.
1. Determine the number of cardiovascular training programs, theirloc- `ion, and the affiliations which they have with other institutions.

TA
BL
E 10
=m
um H
UG
H=
SUR
VE
Y PO
TH
IAT
ION
S:ltiSZ
OIT
AG
Z A
ND
DIST
IUN
TIO
N I Y
CE
NSU
SD
iVISIO
N W
ITllnt R
ISKIN
Hartbeest
SouthN
orth Coate)
...
West
a1..U
1
ts=
trattorielT
amils
Com
ItslmlY
Studyroputauces
II3C
Ia°is
1 A03 4
6'ltsfa 0
G
2la iid
,.m
4 a
1-3v
i..X
..1e.
AU
Active
N
Cardiologists
(S)
Cerdtalogy SU
IVIff
NR
espmuL
ude(5)
Trebles Population
NStratum
(H)
Tratalas
N
Semple
(11)
Tratelop
N
PertIcipiuste(%
)
833
2998(7.8)
(28.0)
580
1946
(7.9)(26.6)
SS1
1032(7.9)
(26.4)
181523
(8.2)(23.8)
128352
0.0(23.3)
1773318
6113
(16.6)(3.0)
(6.4)
1210
233
479
06.0(3.0)
(6.6)
116222$
462(16.0
(3.3)(6.7)
42072
146(19.1)
(3.3)(6.7)
28749
100(19.0)
(3.3)(6.6)
1538567
(14.4)(5.2)
1046
397
(14.3)(5.4;
988366
(14.2)(5.3)
29911$
(13.6)(S.5)
21378
(14.0)(5.2)
337
1523
(3.1)(14.2)
245
107$
(3.5)(14.7)
2471020
(3.6)(14.7)
75327
(3.4)(14.9)
53226
(3.5)(SSA
)
103
28
(1.0)(0.3)
66
14
(0.9)(0.2)
.
6117
(0.9)(0.2)
2014
(0.9)(0.6)
149
(0.91(0.6)
10.691
(100.0)
7.303
(100.0)
6.934(100.0)
2.195(100.0)
1.509(100.0)

71
TABLE 11
CARDIOLOGY PROFESSIONAL DIARYEXPECTED ERRORS WITH OBTAINED PERCENTAGES
Age Group Less than 40 Years,Not Including Secondary Institutional)
ObtainedSample Percentages Expected Error
30-70% 2.0-2.5%
15-29%, 71-85% 1.5-2.0%
5-14%, 86-95% 1.0-1.5%
5%, 95% 1.0%
Age Group 40 Years and Over,Plus Secondary Institutional Under 40 Years1
ObtainedSample Percentages Expected Error
30-70% 3.0-4.0%
15-29%, 71-85% 2.5-3.5%
5-14%, 86-95% 1.5-2.5%
5%, 95% 1.0%
Because Secondary Non-institutional Cardiologists responded at a muchlower rate than other groups within the younger age classification, errorsassociated with this group are on the same order of magnitude as in the40-years-and-over age classification.
For percentages obtained for the weighted composite across strata (allcardiologists) expected errors range from about 1.0 percent in the midrangeto less than 0.5 percent at the extremes.

72
2. Determine the general characteristics of their facilities and serviceswith particular reference to those directly applicable to cardiovasculardisease training.
3. Determine the composition of the training program staffs.
4. Letermine the qualifications of the training program staff and theirrelative time commitments to components of the training program.
S. Determine criteria for admission to programs as well as opportunitiesavailable for training.
6. Determine the training program director's objectives for the trainingprogram: what does he believe his graduates are prepared to do?
7. Determine who is trained by the cardiovascular training programstaff with specific indication of required hours in designated topicaland experience areas.
8. Determine sources of fiscal support for the training program.
9. Determine perception of adequacy of staff, potential for programexpansion, and the number of additional trainees which could beadded (1) without staff increase and (2) with staff increase.
10. Determine the type of continuing educational programs sponsoredby the institution.
11. Obtain recommendations for cardiovascular training program im-provement.
Survey Instrument
The Cardiovascular Training Programs Survey incorporated questions whichAdvisory Committee members felt were necessary and those of primary interestto the National Heart and Lung Institute. Questions related to types oftraining experience were obtained from a questionnaire which the SubspecialtyBoard in Cardiovascular Disease had previously developed for their use inassessing the training experiences of their candidates. The resultant datacan be used by the Board as "baseline measures" of training which they con-sider appropriate, if not required. The questions regarding continuingeducation reflect the special interest of the American College of Cardiology.Other questions were uniformly interesting to the Advisory Committee, NHLIand the USC Project Staff.
75

73
The survey instrument was pretested in the Los Angeles area in institutionsthe characteristics of which were similar to the anticipated range of institu-tions to be contacted.
Upon completion of the field test, the conclusion was that the questions wereclear and that they could be answered, but that answering them would requirevery positive interest in the study on the part of those to whom it was ad-dressed. The Cardiovascular Training Program Survey form is identified asFigure 12.
Study Population
The population was defined from a listing provided by the AMA of all institutionswith approved residencies in Internal Medicine. From this list of 534 hospitalsand other agencies, it was expected that the institutions providing the "cardio-vascular training of at least one year's duration" could be identified. Whileit was possible that this list might not encompass the study universe, thelikelihood of important omissions was considered remote. The 534 listedinstitutions include 528 hospitals and yielded 329 which had training programswhich met the study criteria.
Field Study Methods
There were two study objectives which influenced the methods for dataacquisition: the first, to obtain an accurate count of all cardiovascular train-ing programs and their current number of trainees; the second, to obtain com-plete responses from as many institutions as possible.
The survey form was mailed to all 534 potentially eligible institutions. Non-responding institutions were contacted by telephone and their Chief of Medicineand/or Chief of Cardiology was asked whether or not he had a program. If hehad one, he was asked how many trainees were currently participants in thatprogram.
Characteristic of the Responding and Non-Responding Institutions
Response and non-response analyses are extremely difficult to make in thisinstance because so few facts are known about thos. institutions which didnot respond. The number of training institutions, number of internal medicineresidency positions and the number of trainees at the institutions consitituteall that is known about each of the 329 programs. Any conclusions which aremade pert pining to the toal population of 329 other than those just noted mustnecessarily assume that either the non-respondents are identical to the re-spondents or that they differ by only minor factors. The available data whichapply to all training institutions suggest only minor differences between re-spondents and non-respondents.

BEST COPY AVAILABLE74.
CONIMITTEE:
MRREST H ADAMS. M DChmtwooLos Aorerles,
WALTER H ABELMANN. M DA Jso.t.thore ofOM ilia) Catoft0lOrltlBoston. Aforsochosons
NOB! E 0 EOw'.ER. M D.So6spers.rity b .,d toCeitorostkhit DtstosoCumin." O',o
RAY W GlftORD. JR . M.DAntenedit Coats* ofCfsots Phy.ststiosCif:el.:fa Ohio
WALTER H PRITCHARD. M DCOSeittl 041 ClIffled CithiflOIOSPolosere.do Heats 4810(00804Cleveland. Ohm
H 1. C SWAN. M DAnimt.to Ccli. Re of C.,4,0108)Los Amides. Coleforto
STEPHEN ABRAHAMSON. PH DNOM t Dust torVorr only of CatfovotaLos Assekt Cablovosa
FIGURE 12form ApprovedOMB No. 68.572187
AMERICAN COLLEGE OF CARDIOLOGY0050 ROCKVILLE PIKE BETHESDA. MARYLAND 20014 PHONE 301 530.1600
ADVISORY COMMITTEE ON CARDIOLOGY TRAININGAND MANPOWER REQUIREMENTS
CARDIOVASCULAR TRAINING PROGRAMS SURVEY
SAMPLE LABEL
000-0000-000
DIRECTORDepartment of Internal MedicineHospitalAnytown, I/ S .A.
111%.*.W 1i 111111 )011t 141114:14:d 1.11111) lit 0111 C.1411011112,y N1.1111)0AVI 1110C4.1. UllIVC111) S.1%1111%111 CA11.111114
5.11001 it1 IN,Nton ut Ite.e.m.11) 1n NIed1..0 I tith.-.1tion III V11.1thile01 S1.11111Ied IATIIIIK. VIM')nn,e) If )ou nnpl.t,cd It. the .tulle.' h .2025 ln.11 Avenue. Ims Angelo. CJIttolow 90033.

FIGURE 12A
CARDIOVASCULAR TRAINING PROGRAMS SURVEY
The purpose of this survey is to obtain information which describes current training in cardiovascular diseases In the
United States. While the primary focus is upon those training programs which provide trainees with full-time training of
at least one year's duration, we are also interested in the cardiovascular disease training which is offered to medicine
residents and interns. Training programs in pediatric cardiology and cardiovascular surgery are the subject If separate
study. This survey is concerned only with those cardiovascular training programs which are within departments of
internal medicine.
Many cardiovascular training programs draw upon the facilities and resources of several hospitals And institutions. If
yours is one of these, please combine the statistics for the institutions involved, reporting the combined figure for the
training program as a whole. Please also name these hospitals and institutions in the space provided below. On the other
hand, a few institutions may have more than one training program in cardiovascular disease which are such distinct
entities that they should be treated separately. Duplicate forms are readily available for this purpose.
It is very important to have accurate information. Rather than guess or merely estimate where actual figures are
requested, please leave a question blank.
Mere is no need to gather new data if data have been. collected for other purposes within the past year. For example,
hospital accreditation procedures ask for much of the utilization data which we are requesting and your cardiovascular
division probably collects the specific statistics related to services and their uses and laboratory tests for their internal
use. The Committee will welcome any suggestions related to cardiovascular training which you care to offer in the
concluding section of the st tvey.
This survey is divided into seven sections. The first contains questions related to the services and facilities available in
your hospital(s). The remainder contains questions related to cardiovascular disease training. You may wish to involve
the hospital administrator in answering the first, and your cardiovascular program director in answering the remaining
sections.
Your participation is vitally important. If you have any questions or need additional forms, please call our Associate
Director, R. C. Mendenhall, at (213) 225-1511. extension 349, collect.
YOUR INSTITUTION(name) (address)
Does your institution offer full-time cardiovasculartraining programs of at least one year duration?(CHECK ONE) Yes No 0
If you checked no, PLEASE RETURN THE FORM NOW IN THE ENVELOPE PROVIDED. Thank you.
if yes, how many years training do the mivrity One Two Three
receive; (CHECK ONE)
Are other institutions and hospitals affiliated withyour training program? (CHECK ONE)
If yes, please list the affiliated institutions andhospitals:
Yes No
NAME ADDRFSS
1.
2.
3.
4.
78
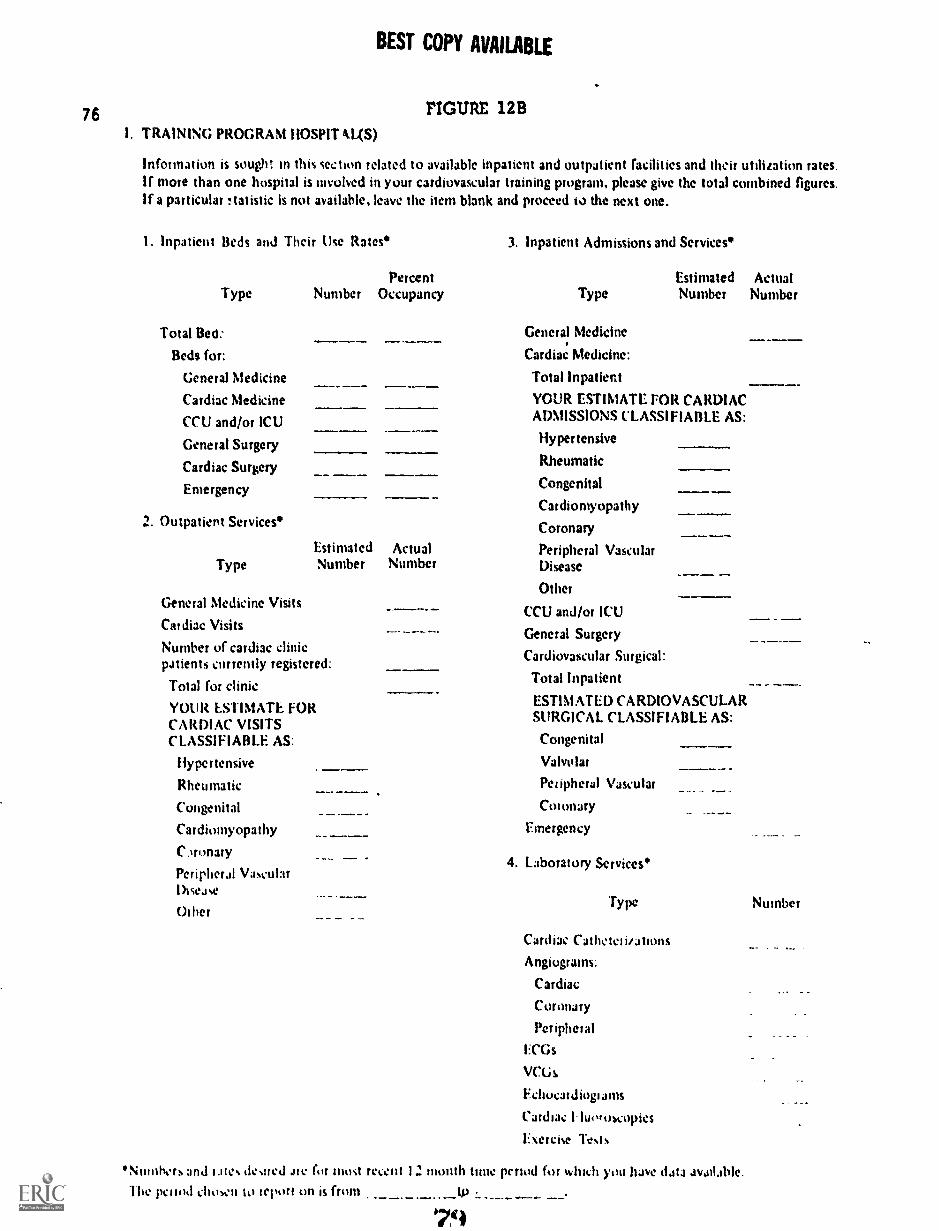
76
BEST COPY AVAILABLE
FIGURE 12 B
I. TRAINING PROGRAM HOSPIT kL(S)
Information is sought in this section related to available inpatient and outpatient facilities and their utilization rates.If more than one hospital is involved in your cardiovascular training program, please give the total combined figures.If a particular !tatistic is not available, leave the item blank and proceed to the next one.
I. Inpatient Beds and Their Use Rates 3. Inpatient Admissions and Services*
Type
Total Bed:
Beds for:
General Medicine
Cardiac Medicine
CCU and/or ICU
General Surgery
Cardiac Surgery
Emergency
2. Outpatient Services
Percent Estimated ActualNumber Occupancy
..
Estimated ActualType Number Number
General Medicine Visits
Cardiac Visits
Number of cardiac clinicpatients currently registered:
Total for clinic
YOUR ESTIMATE FORCARDIAC VISITSCLASSIFIABLE AS:
Hypertensive
Rheumatic
Congenital
CardionlyopathyCmonary
Peripheral VascularDisease
Usher
'Numbers and tales desired ate for must recent
Type Number Number
General Medicine
Cardiac Medicine:
Total Inpatient
YOUR ESTIMATE FOR CARDIACADMISSIONS CLASSIFIABLE AS:
Hypertensive
Rheumatic
Congenital
Carthomyopathy
Coronary
Peripheral VascularDisease
Other
CCU and/or ICU
General Surgery
Cardiovascular Surgical:
Total Inpatient
ESTIMATED CARDIOVASCULARSURGICAL CLASSIFIABLE AS:
Congenital
Valvular
Peripheral Vascular
Coi onary
Emergency
4. Laboratory Services*
Type
Cardiac CI thew' i/atiuns
Angiograms.
Cardiac
Coronary
Peripheral
ECG%
Va.'s
Fehocardiugiams
Cardnie
1:. Cf Ci1C Test s
12 month time period for which you have data available.
1 he polo,' chown to teport on is from tP
79
Number

BEST COPY AVAILABLEFIGURE 12C
II. CARDIOVASCULAR TRAINING PROGRAM STAFF
several 'Hy within 1., or hosintd(s) mar contribute to the cardi)raNcidar fralthig program. We Wed to knowthe number of phystuialli trim arc sigifiantle involved in the training program. their backgrounds and how their
tout- lc allot wed 1he following questions will give us the needed inhumation.
Please give the total number of pinfessional staff Who contribute directly to your cardiovascular disease training
program by.
other divit'-n ldJ Pinn m cardlovasculo division and b. Primarily in
Part timePdtttIttle
full timeFull.time
na. your pill time stall only, we need to know their specialties, assignments and how their time is allocated
across prop,im related actisities. Space is prosided to record time given to interns, noncardiovascular residencies
and to cal.110%,,,cui jr 1,31,1010es or fellowships. DO NO1 RECORD THE PHYSICIAN'S NAME.
77
VIIMMOIMIMWON.
Kt %Pi AS11111111 %NI) HAI -kt;140UND PROGRAM
io %,173? 74 il4 -.S.:1
6
AMEN,
:PI-KCEN f 01 TIME TOAND 1,11.1All I) ACTIVITIES
Oilier
litIc
,.,
Pt1.11f1.11
%ge
spcs1.111% 1,1Pimit% sc,oratt
an.!%not Ale.%ot Interest
&met/Int Mac.astitsi/A.47--
Ilomi I. elOwck 311
iiii..iiiunhe autlli kew.1101
Twining
I3.P '-'4-J
F4-1$
L., ce
/0
Prof;Jm
0
E2S
9
('hnicit
,1,
e.67; :E''' rf -:z 7,
/o
,,../17"15
122ir.,, GI
16
c82
&6
g
4..........4Pro)e.morial
C5::..
t)::...
E1.:
it
...
?$rs
4
ve
inx
"-
s.
.0-a r,
t= ..,..,_.--...--,-?..:
Z
iL
=g,0.;3
zo
.m
Y.;acZ
AO
t5
7La+.odera----
.1........-
.
Ar......-...
S
,i -.o.
11
I= --
14-.. ..---
............. I
/5 1 - _ A
---,.,
80

78 FIGURE 12D
Ill. CARDIOVASCULAR TRAINING PROGRAM
BEST COPY AVAILABLE
A cardiovascular program trainee is anyone spending at least one year, in cardiovascular training, whetherthe individual is designated as a resident, fellow or trainee. Individuals receiving less than full.time cardiovasculartraining are considered medical program trainees.
I . For your cordir way. ulcer iwitgratn trOMCCS 0,11.1%
What arc the minimum required years of post-M.0.training for entry into your program? CHECKONE BOX ONLY.
OverNone One Two Three Three
E
Num'oer of cardiovascular trainees in your program:
a. For the current year (1972.73)!low many positions did you have
How many applicants
How marl), positions filled
How many will complete theprogram this year
b. For the last year (1971.72)How many positions did you have
How many were filled
How many completed theprogram that year
e. For the rr:i.r before (1970.71)
How many positions did you have
How many were filled
How many completed theprogram that year
S. On the average, how many conferences and roundsrelated to cardiovascular training are scheduled inyour institution(s) per week?Number:Of these, what percent arc
Grand Rounds
Ward Rounds
CCU and/or ICU
Cardiac Medicine
Other (specify)
7. Are there active eNdiovascitlar research programsin your institution? ChecA one.
Yes No
If you checked yes, would you describethe programs as primarily
Clinical
NonlinicalBoth
. 81
2 What is the minimum period of rime an individualis accepted for your specialired cardiovasculartraining program?
Minimum Time .____(in months)
What is the usual period of time elected by yourcardiovascular residents/fellows?
Usua! Period of Time(in months)
4. \That are the career plans of trainees completingyour program in the specified years. Pleaseindicate number whose primary activity is
expected to be in the following area:
1971.72 072.73
Clinical practice
Academic medicine, i.e.clinical research, basicresearch and teaching
Other
Unknown
6. Do you provide your trainees any of the followinginstructional aids? Please check their availability.
Yes No
Self Teaching Rooms
Video Taping
Audio Taping
Cardiovascular DivisionLibrary in hospital
lleart Sound Tapes
S. Does your program have any of the facilities listedbelow which are available for research? Cited allthat apply.
Type Available
Animal laboratory
Itatliologikal laboratory
Biudieinical laboratory
Ilemodiagnostic laboratory
00

FIGURE 12E9. Training Program Subject Areas and Experiences. Most institutions offering specialty training in cardiovascurar
disease will also offer a component of that training to their other medical residents. In both instances, minimumor required amounts of time in sp:cified areas arc usually stipulated. it is important for us to know theseminimums for cardiovascular trainees.
This question is divided into instructional areas and experiences which are applicable t most programs. Not allwill offer each type of training. For those imp/tea/de to your program, please check in the designated cohmut ifthe experience is offered. FOR 1.111: CARDIOVASCULAR PROGRAM TRAINEES, ALSO RECORD THEREQUIRED HOURS in the last column. THE HOURS REQUESTED ARE FOR THE TOTAL TRAININGTIME PERIOD. That is, if cardiovascular training covers two years, the hours desired cover that two year span.
A. Experience in Clinical Care, Research and Teaching
Cardiac patient care:
Pediatric
Medical
Surgical
C ardiovascular research:
Basic
Clinical
Teaching:
Clinical
Didactic
B. Laboratory Diagnostic Techniques
Electrocardiography
Phonocardiography
Echocardiography
Exercise tolerance testing
Vectorcardiography
Angiography:
Cardiac
Coronary
Peripheral
Cardiac catheterization
Pacemaker insertion
Pacemaker followup
Swan.Gani right heart catheteritalion
C. Laboratory and Cl.issrnom Instruction for Trainees
CV anatomy
CV physiology
CV biochemistry
CV pathology
CV 'epidemiology
CV pliarnacolog
CV radiology
Pl11111litUry physiology
I lypct tensisc renal discase
Peripheral vaseptir disease
Cerebral vascular disease
Biostatistics
Bioengineering
onCinterns Nettical
,Re)idynse
Mill MN
CanlitwascularTrainee
V Hours
/MN
/UM
////// HIM
////// //////
79

FIGURE 12F
80
10. Program directors and their institutions have different objectives for their cardiovascular training programs..Please
check all of the following:
Upon completion of our program, the majority of our trainees am able to:
Manage an intensive care and/or coronary care facility
Conduct diagnostic cardiac catheterizations
Direct a hemodynamics lab
Serve as cardiologist consultant on a CCU committee
Perform as a cardiologist consultant in all clinical areas
Conduct clinical research
Conduct basi. laboratory research
Teach graduate students and residents in clinical and laboratory settings
Teach medical students, residents and fellows in both clinical and formal
classroom settings
Participate in professional seminars, workshops and symposia as con-sultant cardiologists
Are eligible for subspecialty board certification in cardiovascular diseases
Perform and teach others to perform cardiac diagnostic x-ray procedures
Perform and teach others to perform non-invasive laboratory techniques
such as ... (list)
Yee No
1:3
121
o
0 01:3
O 0O 0
1.3
O 001:3
0o
0

FIGURE 12GAl
IV. TRAINING PROGRAM SUPPORT V. POTENTIAL FOR EXPANSION OF YOUR PROGRAM
Please note the number of grants from the agenciesindicated and the total dollar support they provide tothe cardiovascular training program.
Type of Support Number Dollars(total
amount1. Training grants and fellowships for each
category)
Federal Government Agency
NH LI
Other NIH
Other
Nan-Federal GovernmentAgency
Non.Government Agency
AHA
Local Heart Association
Foundation
Other
2. Research grants contributing to the cardiovasculartraining program. (Record dollars for only thetraining portion.)
Federal Government Agency
NHLI
Other NIH
Other
Non-Federal GovernmentAgency
Non-Government Agency
AHA
Local Heart Association
Foundation
Other
3. Own institution funds, including fees frompatients, etc. (Do not include any governmentsuppot t.)
1. Given present staff and resources, could you takeadditional trainees in your current cardiovascularprogram? if yes, please record how many could beadded to the program years enumerated below.
Program Year
1
2
3
Number wecould add
2. Do you have staff positions which are budgetedcurrently unfilled in the cardiovascular division?
Yes 1:1 No ID
If yes, how many?
3. Given your present training load, how manyadditional staff positions would you considercurrently desirable in the cardiovascular division toprovide for optimal teaching and research.
4. Please estimate the percentage increase from yourpresent level in your cardiovascular training load(number of pre- and post-doctoral students andtrainees) which you might eApect in five yearstime.
Given this increase in training load, what numberof additional staff positions would you considerdesirable for the cardiovascular division in fiveyears time in order to provide for optimal teachingand research?

82 FIGURE 12HVI. CONTINUING EDUCATION COURSES AT YOUR INSTITUTION
1. Does your institution offer continuing education courses to physicians in the cardiovascular field? 'Included shouldbe circumscribed courses of one full day as a minimum, or extended courses of at least one hour per week.)(CHECK ONE)
Yes
If you answered yes, what percent per year are given for physicians
a. In the local area b. At the national level
2. For the courses which you offer, we need to know the number offered and the number of participants by threetypes for the past three years. The types are noted below. If these data are not readily available in all instances.simply complete those portions which you can.
Courses byType
1970 1971 1972,
Numberof
MUMS
Numberof
Panieipants
,
Numberof
courses
Numberof
Pat' tiCipants
Numberof
courses
Numberof
Panic.ipants
Less than two weeks -fulltime
.
MEW
More than two weeks-full-time
Extended at least one hour perweek for 3 months or more
3. Please indicate the numbers of courses in their general subject areas for the total three years.
General Medical Cardiology
CV Physiology
CV Surgery
CV Pharmacology
CV Radiology
CV Pathology
Other (list):
Number

FIGURE 12I
VII. RECOMMENDATIONS REGARDING PROGRAM IMPROVEMENTS
We would appreciate receiving your comments about how cardiovascular training programs could or should beimproved in order to provide optimal training experiences. These might concern curriculum, facilities, staff or anyother aspect of a training program.
Regarding formal initial cardiovascular training:

84PIGURE 121
Regarding continuing education for physicians:
b7

85
Internal Medicine Residencies
Table 12 compares the non-respondents to the respondents on a program sizemeasure constructed from grouping internal medicine residencies by (1) lowerquartile, (2) two mid-quartiles and (3) upper quartile. From this table itappears that there are no important differences in response patterns attributableto size of internal medicine training programs. These groupings are referredto in Chapters 5 and 8 as Type I, Type II and Type III programs. The differencesin size of internal medicine residency programs between the questionnaire re-spondents and non-respondents are minimal.
taam1202:cgQarcjic2gx....ima.Tra s
The 190 responding programs have 760 trainees for an average of 4.0 perinstitution. The 139 non-responding program institutions have 518 traineesfor an average of 3.7 per institution. The average number of trainees for allprogram institutions is 3.9. An estimate of trainees based on the 190 ques-tionnaire respondents and their mean number of trainees would suggest 1,316trainees for all programs rather than 1,278 as obtained through the questionnairesurvey and telephone survey. The estimating error would be about 3 percent,indicating the programs among the non-respondents were slightly smaller.Figure 13 presents a distribution for trainees by programs responding to thesurvey and those declining to participate.
Training Program Configurations
The 329 programs are describable in terms of the training arrangements whichthey have with other training institutions. These configurations range frominstitutions which are totally self-contained (provide all of the training andhave no affiliations) to institutions which provide some portion of the trainingand hence are "satellites" of a parent institution. Three categories of"primary" and one of "secondary" were identified in this study. They are:
1. Primary Veining Program. A training program with at least onecardiovascular trainee position which is independent of any otherprogram:
a. lists no affiliations or dependent programs; or
b. lists affiliations of a staff exchange character with otherprimary programs and/or medical schools; or
c. lists at least one dependent (secondary) program and mayor may not show an affiliation with other primary programs.

86
TABLE 12
CARDIOVASCULAR TRAINING PROGRAMS:DISTRIBUTION OF INTERNAL MEDICINE RESIDENCIES
BY RESPONDENT CATEGORIES
CardiovascularTraining Programs
QuestionnaireRespondents
'TelephoneRespondents All
N N % N
Type I: Internal MedicineResidencies = 1 to 15 50 26.3 38 27.3 88 26.8
Type II: Internal MedicineResidencies = 16 to 41 91 47.9 64 46.0 155 47.1
Type III: Internal MedicineResidencies = 42 and over 49 25.8 37 26.7 86 26.1
ALL INSTITUTIONS 190 100.0 139 100.0 329 100.0
. 69

87
OOP
OEM
Emomm;
IIII ME II a:I 73 3: RE!
1111111:02
wZ
o. : :44 : v xi*
!,, : 1-' 1". r :2,"0
p t t _
0 sn inet in CSI
'WV IDO Jd JO INDad
90
a0
88
2. Secondary 901_Iinpr rem, A cardiovascular training programwhich provides a portion of the trainee's total training, receivesits trainees from a primary program, and provides this trainingas directed by a primary program.
The distribution of these three primary types of training programs and onesecondary type by institutions responding to the survey form and those re-sponding only to telephone queries is given in Table 13. A geographicallyoriented display of the location of the 329 training institutions is presentedin Chapter Five (Figure 1).
ors Associated with Cardiovascular v Data
The preceding section presented available information which applies to boththe institutions responding to the questionnaire survey and those respondingonly by telephone. It indicated minor differences in the two groups, none beinglarge enough to indicate that biases would result from working with the respon-dent data only.
Although there was no sampling for the Cardiovascular Training Programs Survey(all 534 eligible institutions were contacted and positive responses obtained),the fact that 57.9 percent of the institutions actually respond with surveyquestionnaire data makes it necessary to attempt to estimate the error associatedwith these data.
There is insufficient information available on the non-respondents to performan analysis comparable to that performed for the Diary and Training surveys.However, standard errors for percentages derived from the Institutional Surveydata can be estimated under the assumption that the respondents represent arandom sample drawn from the institution population.
The data from the Institutional Survey were analyzed according to the followinggroupings:
1. all responding institutions
2. all responding institutions divided into two groups based on lengthof training program
3. all responding institutio..-.. divided into three groups based on sizeof program
4. all responding institutions divided into three units for program in size,and further divided by the two groupings for length of program
Since the subdivision of responding institutions results in small numbers ofresponding institutions in the category, errors would be expected to be larger

TABLE 13
CARDIOVASCULAR TRAINING INSTITUTIONS:AFFILIATE STATUS BY RESPONDENT CLASSIFICATIONS
89
Type of Affiliation
QuestionnaireRespondents
TelephoneRespondents All
j % N % N %0..1
Primary withno affiliation 47 24.7 25 18.0 72 21.9
Primary withprimary affiliation 119 62.6 71 51.1 190 57.8
Primary withsecondary affiliation 18 9.5 10 7.2 28 8.5
Secondary only 6 3.2 33 23.7 39 11.8
TOTAL 190 100.0 139 100.0 329 100.0
.., .....i.mm..........mmm....m....i.miwmy .
90
for the sub-groups. These errors are shown in Table 14, and are made underthe assumption that the respondents in each group represent a random sampleof that group.
If the programs are divided by both size (three categories) and program length(two categories), then only the estimates for the large programs and moderatesize programs which are over 24 months in duration have error estimates com-parable to those noted for the 24 month programs. Divisions at this fine alevel should not be interpreted statistically; rather the interpretations shouldbe limited to the trend differences as compared to those for either of the twotypes of programs or for all programs.
REFINED ESTIMATES IN CARDIOLOGISTS' ACTIVITY TIMES, PRACTICECHARACTERISTICS AND PROPORTIONS BOARD CERTIFIED
me ofessional Acti ities d tice Char
The Initial Cardiology Survey and the Cardiology Professional Diary study ob-tained comparable data in professional activities and in such practice charac-teristics as referral and non-referral and distances patients travel for care.Comparing the two information sources, there is a consistent tendency for thecardiologist to give higher estimates of activities than recorded in the log-diary when the activity is one of prominent importance in his type of practice.For activities which are considered of only minor importance, the estimatetends to be lower than that which is provided as recorded activity. For example,research-oriented cardiologists estimate this activity time at 26 percent com-pared to a diary-recorded percentage of 18, while others in non-institutionalsettings have percentage differences of about 1 percent. Those in predominantlypatient-care practice arrangements over-estimate that activity time while theirinstitutional counterparts under-estimate this time. The effect of these differ-ences is discussed in Chapter 4, "Roles and Profiles of the Cardiologist".Supportive tables for the discussion are found in Chapter 13.
The differences may not be critical if the interest is only in broadly descriptiveinformation. However, if the intent is to use these data in developing proZilesof professional activity which are used to create estimates of "effective cardi-ologist time" or to determine the proportion of cardiologists' practices whichis primary care arid non-primuy care, then the log-diary data should be used.Failure to do so would result in distorted professional activity profiles.
arcg.tiakaimuat Ilar End 1971 and Year End 1973
Evidence from each of the study phases suggests that the age distribution forcardiologists at the end of 1971 is different from that at the end of 1973. It

Al
TABLE 14
CARDIOVASCULAR TRAINING PROGRAM ESTIMATED RESPONDENT ERRORS
Study Stratum Number
All Training Institutions 190
Error Estimate Attributable toRespondents Compared to Population
VINIMMIIMINIMMININIMIIIIIMIIIMIND
2.3 percent
Training Programs Less than24 Months
Training Programs 24 Monthsor More
51
139
4.5 percent
2.7 percent
Type I Internal MedicineTraining Programs
Type II Internal MedicineTraining Programs
Type III Internal MedicineTraining Programs
50
91
49
4.6 percent
3.3 percent
4.7 percent
all

92
differs in inportant respects from actuarial data' projected for the end of 1976and from anticipated new cardiologists from the known training programs. Thetrend is for more young cardiologists to enter the active practice of cardiologythan for others to leave it. The implications of this shift are discussed inChapter 7. The relevant, detailed statistical tables are found in Chapter 8.
The changes which should be noted at this time pertain to percentages ofcardiologists who are (1) board-certified in Internal Medicine and/or (2) sub-specialty-board-certified in cardiology.
and o o is s CertifiecIntern 1 Medicine
The Initial Cardiology Survey indicated that approximately 53 percent of allactive cardiologists are board certified. Extrapolating from the numbers ofphysicians certified by the American Board of Internal Medicine (ABIM) duringthe two years and assuming that cardiologists account for about 15 percent ofthis total, the probable number certified at year end 1973 is 60 percent.
Cardiologists Certified in Cardiovascular Disease
The Initial Cardiology Survey indicates that 9.6 percent are certified by theSub-Specialty Board in Cardiovascular Disease. Taking into account theABIM's statistics for certification during this time period and the entries intoand exits from active practice, the rate is probably no greater than 10 percent.
It must be remembered that both percentages apply to the total cardiologypopulation 47 percent of which have less than 50 percent of their time incardiology.
Number of Cardiologists at December 31, 1973
Actuarial statistics applied to the cardiologist population for forecastingchanges were obtained from a study of physicians from 1967 through 2002.2Estimates of cardiologists completing their training and presumably enteringactive practices as cardiologists were obtained from training program directors.These and related factors influencing the cardiologists population are utilizedin the manpower estimates discussed in Chapter 7. The detailed tables andtheir potential uses are discussed in Chapter 8. The loss and gain factors,applied to the 10,691 cardiologists in active practice at year end 1971.resultin an estimated 11,768 in active practice at year end 1973.
1 Blumberg, M. S , _Vends and Projections of Physicians in the Un tecL. States1967-2002. The Carnegie Foundation for the Advancement of Teaching,Berkeley, California, 1971.
2 &id, 95

93
SUMMARY AND RECOMMENDATIONS
This chapter has summarized the overall study design, specific study designsand the relationships between one study phase and another. The utility ofeach study phase's survey approach was discussed as well as the confidencewhich one may place in the statistics generated by a particular study phase.Estimates were made regarding changes in the cardiology manpower pool duringthe two-year study, including the proportions certified either in Internal Medicineor in Cardiovascular Disease.
. . 56

94
CHAPTER 3
CURRENT STATUS OF MANPOWER IN CARDIOLOGY
Walter H. Pritchard and Walter H. Abelmann
INTRODUCTION
As already stated cardiovascular diseasen currently represent a major healthproblem in the United States and account .or over 50 percent of the deaths. It isobvious that new methods of diagnosis and treatment will be effective onlyif skilled physicians and other personnel are available to deliver optimal healthcare to patients with such illnesses. Thus, there is a need to identify thenumber of cardiologists, the characteristics of their mode of practice, theirqualifications, their regional distribution and other items of importance inunderstanding the present status of the manpower pool.
It must be realized, however, that the cardiologists surveyed in this studyprobably only care for a limited segment of the total number of patients seekingcare for cardiovascular problems. Primary care physicians composed of generalinternists and practitioners probably care for at least as large a number ofpatients with heart disease as does the cardiologist group represented in thisstudy. Cardiologists, however, are more concerned with patients having com-plex problems requiring more sophisticated diagnostic and therapeutic proceduresas well as giving care to the type of patients seen by primary care physicians.
TOTAL PHYSICIAN MANPOWER IN THE UNITED STATES
In order to view in perspective the present studies of the specialty of cardi-ology, information was collected concerning the total physician manpower poolnow available for health care in the United States. This was obtained forcertain broad categories, although it is recognized that more detailed studieshave been and are being conducted by other specialty groups.
The population of the United States at the time of this study was approximately206,000,000 people. As shown in Table I the total number of active physicianswas estimated to be 311,000 giving a ratio of physicians per 100,000 popu-lation of 150.9. If this latter figure is broadly reduced further, we find ratiosof physicians per 100,000 population to be as follows: general practice - 28.1,surgical specialties - 41.8, and medical specialties - 81.0.
For our purposes, we have divided the country into nine census divisicns ex-cluding Puerto Rico and the Canal Zone. The latter division will be ignoredbecause of likely differences in medical and patient population practices.This Caribbean group represents only 1.3 percent of the total population.

95
From Table 1 we find that the greatest population densities in order of magni-tude are in the following areas: East North Central, Middle Atlantic, SouthAtlantic, and Pacific. Thereafter, a distinct break in population densityoccurs and we find fewer people in the West South Central, West NorthCentral, East South Central, New England, and Mountain areas.
Table 2 summarizes some of the important findings relative to physician ratiosby broad specialty areas and by census division. The table is of considerableinterest and may be interpreted as showing the following:
I. There are differing total physician ratios to population in censustracts of both high population and low population density.
2. There are certain similarities in total physician ratios in someareas of widely differing population densities, i.e., East NorthCentral, West North Central, West South Central, areas in whichthe ratios fall within a general medium range.
3. High ratios of physician to 100,000 population occur in widelydifferent geographic population density areas, i.e., in denselypopulated areas of the Middle Atlantic and Pacific zones thephysician ratio is similar to that in New England which has nextto the smallest number of people in its area.
4. The East South Central area falls much below the national averagein total physicians /100, 000 but approximates the national averageratio in the number of general practitioners per population beinglow by virtue primarily of its lack of medical and surgical specialists.
5. With the exception of the Pacific and Mountain areas where theratios are greatest, there is a fairly uniform ratio of general practitionersin all areas irrespective of size.
6. In general, there are about twice as many medical as surgical special-ists per 100,000 population in over half the regions. Exceptionsare noted in the West South Central, West North Central, and EastSouth Central areas. The discrepancy here may be assumed tobe caused by the lack of medical specialists rather than an excessof surgical specialists since the total number of physicians per100,000 is also less than the average in these areas.
Many causes may be ascribed to this relative maldistribution, but foremostare those of socio-economic differences and educational, both general and medi-cal, opportunities in the areas of greater physician grouping. More will bestated later about this.

TUIZ 1
121653C161111 PUS 131071011612011 AND MIT= 20 600U1A11101811:(21:13111111 =OM 111:11111.1=111) URC01LITC1100/134423
PA11435 pet 140.020 3OPU11113011
TWOUCUIII 0408
atcasity Gamine
All Active Physiciansfredena3
110144detal
Toed
All Amer Scram
AU Active General Rama
AU Amy. Medial Specisities
NationalTotalPrandation205.123.257100%
NewtimbalPaula=11.841.6631.3%
warns 8=0Atlantic AthinuePapa/Mice Pau lean37.113.040 30,671.33718.1% 34.9%
litnaber Ratio Number Patio Number MUD330.624 160.7 211.43a 197.9 74 435 200.1
Number Ratio4$ US 156.4
Dist-SarthCanalPoptiaturn12.1103.4706.26
licabor Patio14,036 309.6
29,201 1.405 3.124 7.262 1.207
281,344 20,311 67.350 37.560 12.122
320,845 220.0 23.672 164.7 70.446 189.4 44.829 146.2 11.262 406.6
41.8 42.2 $0.3 42.1 32.7
18.1 35.7 28.3 34.0 34.7
61.0 108.1 110.0 80.0 47.0
Z saga Midlal /EMI sr_ apm.," Cardic loge2
Internal ladles*
Ora Sae lalties
166.611
1.661 3.0
20.3
57.7
13,013
Wat-southCanalPapeleam19420.5600.4%
Last -NorthCoevalPopsirmice40,252.47619.5%
limber Ratio Mater Ratio24.574 117.2 93 465 132.9
2.1110
20.463
23.373 121.0
36.0
27.4
117.6
2.504
40.163
0.666 US.,
34.0
36.11
64.$
leat-NorthCentralTopalatlan16.313.1077.9%
PriamV.I., Canal
Ucaniaht Pattie ZanePoyalation Itrauletton Population8,281,561 26,332,631 2.713.0334.8% 112.9% 1.36
Nada Ratio heave hobo Matter Rao21.174 :32 2 12 747 153.9 51.942 199.8
1.464
18.4111
20.315 124.1
34.8
28.2
61.6
Number Ratio6,801 221.5
APO emit 770
Cant Notamtslacito
1,466 4,552 3,430
10,3641 43.675 3.411
11.834 142.0 48,227 183.3 2,912
40.7 41.0
30.7 35.0
71.5 0/.0
218.2
55.2
41.2
120.6
Count NotAerniatee
42.210 110.8 24.34i 80.0
4.6 3.3
28.6 20.5
77.7 26.3
33.1 21.0
4.4 8.3
4.2 8.0
24.3 37.1
lanai Ungicat and Cesdkaccep
Primary Cattlitc leqyZ
Secoadary Card Soloa2
Oita In anal Medicinal
23.2
1.0
2.6
1/.7
33.7
4.2
3.4
25.8
6,1117 47.0
1.3
11.0
32.0
11.335 $7.6
2.1
13.1
42.3
15,965 64.6
3.2
16.2
42.1
10,033 61.8
1.8
16.1
43.3
5.033 71.5
2.7
16.3
21.730 97.0
3.4
23.5
70.1
1,170 120.0
2.1
24.6
23.4
13.2
1.8
1.2
10.7
Ilipeadty monplas earl data canahtla to all eztapt areolariats obtalimd Sam AreqUID bledioU asociatinm.a51akILT1111Ma11112111/IS40 JIIMILMIL167I
'OM ablated taxa laud Cardiology tamp.
L'Othar karma itadltrine total lea Ma caller than Wahl Is Oa taw slats 03 larnala 01 as aspomdsega WOOin MI area tether than 300 moons.
Mi. Swan of the OHMS. 111.41. Cetera cf arms latIonsI mber et biamitente. final Saari PC al Al Vatted Stria Nummary
10.4
3.3
2.0
14.2
U.3
1.8
1.0
14.7
26.1
3.4
2.7
20.8
27.4
1.5
1.1
33.4

97
TABLE 2
Distribution Ratios of Physicians to Population:Census Division By Selected Specialty Groupings
Census Division
Population (M)
Ratios Per 100,000 Population
TotalGeneralPractice
MedicalSpecialists Surgery
Middle Atlantic 37.2 189.4 28.2 110.8 50.3
New England 11.8 184.7 25.7 109.9 49.2
Pacific 26.5 181.3 35.9 97.0 49.0
South Atlantic 30.7 146.2 24.0 80.0 42.1
Mountain 8.3 142.9 30.7 71.5 40.7
East North Central 40.3 125,9 26.6 64.5 34.8
West North Central 16.3 124.5 28.9 61.6 34.0
West South Central 19.3 121.0 27.4 57.6 36.0
East South Central 12.8 104.4 24.7 47.0 32.7
ANICatell11014.1
Source: 1, 2
100

98
CARDIOLOGY MANPOWER IN THE UNITED STATES
As shown in Table 3 our data indicate there are 10,691 cardiologists inactive practice in the United States. This gives a ratio of cardiologists topopulation of 5.1/100,000. There are an additional 979 cardiologists intraining making a total number active or in training of 11,670, Trainees thusconstitute 8.4 percent of the total manpower pool of cardiologists.
Cardiologists were classified further into Primary and Secondary types. APrimary Cardiologist gave at least 50 percent of his time to the practice ofcardiology. If his estimated percent of effort in cardiology was less than50 percent, he was classified as a Secondary Cardiologist and his primaryclassification was in another medical specialty. By this arbitrary classifi-cation, there were 5,661 individuals identified as Primary Cardiologists(53 percent of total), and 5,030 or 47 percent fall into the Secondary type.The ratio of S .1/100,000 changes little if trainees are included because ofthe small number of trainees involved.
MODE OF PRACTICE OF CARDIOLOGISTS
The great majority (72 percent) of all cardiologists locate their base of practiceoutside institutions and are classified as Non-Institutional Cardiologists asshown in Table 4. Fifty-four percent of them or 39 percent of all cardiologistsare in solo practice and 21 percent of Non-Institutional Cardiologists are over60 years of age.
Institutional Cardiologists comprise a smaller group (22 percent) of youngermen with only 5.4 percent of them over 60 years of age. Approximately50 percent of them are under the age of 40. This group represents thosecardiologists more recently trained and generally responsible for the moresophisticated technical and research aspects of cardiac problems referred toinstitutions.
BOARD CERTIFICATION OF CARDIOLOGISTS
Certification by specialty boards indicates formal acceptance of practice com-petence within standards set by the examining bodies. The process of boardcertification is a strong force in developing clinical expertise in the given.specialty. Although 56 percent of all Non-Institutional Cardiologists arecertified by the American Board of Internal Medicine, only 9 percent of them arealso certified by the Subspecialty Board in Cardiovascular Disease (tables 5and 6). Proportionally fewer Institutional Cardiologists, 49 percent, arecertified by the American Board of Internal Medicine but 14 percent are alsocertified by the Subspecialty Board in Cardiovascular Disease. These findingson certification were somewhat unexpected but there are no data from which tomake a value judgment that board certification indicates better individual clinicalperformance, the main goal of all boards.
101

TA
BLE
3
DIS
TR
IBU
TIO
N O
F N
AT
ION
'S C
AR
DIO
LOG
IST
S:
CE
NS
US
DIV
ISIO
N T
AC
TIV
ITY
ST
AT
US
AN
D S
PE
CIA
LTY
AC
TIV
ITY
ST
AT
US
AN
DS
PE
CIA
LTY
Nat
iona
l
Tot
al
NO
RT
HE
AS
TS
OU
TH
NO
RT
H C
EN
TR
AL
,
s.c
...6
.23 Z
1, 2 a.
o 14 t.
)i t
I
WT
ST
cu
C 1.,.
POSS
ESS
ION
S
AP
OIF
PO
cu
c-
Crt
; t3
017
00
cz
is2
a
I
VC
Z
ton-
5 0 I 2C
C O
.0
t
.c z o co) . c
.- :.. cl
07;
c, c
I-(2
'0
To
C.)
.S.
-6
uC
fa.
.. >
ha
Act
ive
Car
diol
ogis
ts
Prim
ary
- R
esp.
Prim
ary
- N
. Res
p.
Sec
onda
ry -
Res
p.S
econ
dary
-N
.R
esp.
3962
:699
331
131
1050
520
632
287
126
3727
410
355
324
320
1 7215
841
589
238
43 22 65 23 15 38
S 3.
8 13 7 20
5661
3341
1689
462
249
122
1570
895
533
919
578
226
163
107 48
379
205 99
7% 493
249
273
196 88 i94
199
96 42 138
827
486
210
5030
371
1428
854
155
30-!
742
696
Tot
al10
691
033
2998
1773
318
683
1538
557
337
1523
103
28
Car
diol
ogis
ts In
Tra
inin
g
Prim
ary
- R
eap.
Prim
ary
- N
. Res
p.
Sec
onda
ry -
Res
p.S
econ
dary
- N
. Res
p.
298
280
44 2755 84
61 331 3
13 1350
_31
107
25 53
17 927
7
39 43 V 12 12 24
1 3 4 0 2 2
0 1 7 0 0 0
578
126
2
71 9 25
139
43 94 137
94 21 57
4 0 4
26 7 13
26
S 11
24
4 4 840
134
784
2078
16
Tot
al97
910
527
617
28
4618
542
3210
66
1
.,
ALC
ardi
oloa
ssts
6239
5431
533
41§,
938
1709
1565
1013
932
167
159
405
221
729
903
820
299 Kt
599
223
146
369
909
720
69 40 109
9 20 29
Prim
ary
Sec
onda
ry
Tot
al11
.670
3274
1945
326
1723
1629
.Sur
vey
resp
onde
nts
Sur
vey
non-
resp
onde
nts
Sou
rce:
2

TA
BL
E 4
DISTRIBUTION AND PERCENTAGE OF CARDIOLOGISTS WITHIN PRACTICE MODE:
BY AGE GROUPINGS
0
PRACTICE MODE
Under 40 Years
40 through 59 Years
60 Years and
Ove
rA
ll C
ardi
olog
ists
Num
ber
(N)
Perc
ent (
16)
Number (N)
Percent (%)
Number (N)
Percent (%)
Number (N)
Percent (%)
Non
-Ins
titut
iona
l
Solo
349
5.0
1581
22.6
810
11.6
2740
39.2
Part
ners
hip
328
4.7
629
9.0
114
1.6
1071
15.3
Gro
up30
44.
459
18.
510
21.
599
714
.3C
ombi
natio
n (O
ther
)*65
0.9
139
2.0
350.
523
93.
4
Sub
Tot
al10
4615
.029
4042
.110
6115
.250
4772
.2
Inst
itutio
nal
Hos
pita
l41
35.
929
34.
254
0.8
760
10.9
Med
ical
Sch
ool
257
3.7
310
4.4
250.
459
28.
5C
ombi
natio
n (O
ther
)*92
1.3
871.
28
0.1
187
2.7
Sub
Tot
al76
210
.969
09.
987
1.3
1539
22.1
Oth
er*
.
Maj
ority
Oth
er17
32.
515
02.
145
0.6
368
5.3
Com
bine
d O
ther
20.
018
0.3
70.
127
0.4
.Su
b T
otal
175
2.5
168
2.4
520.
739
55.
7
TO
TA
L19
8328
.437
9854
.412
0017
.269
8110
0.0
*In
tabl
es, i
n se
ctio
ns w
hich
fol
low
, the
se "
Oth
er"
type
s ar
e co
mbi
ned
as "
Oth
er"
beca
use,
for
all
prac
tical
pur
pose
s, th
eyin
clud
e ei
ther
(1)
indi
vidu
als
who
se p
ract
ice
invo
lves
med
ical
sch
ool/h
ospi
tal p
lus
som
e no
n-in
stitu
tiona
l or
(2)
are
fede
ral
card
iolo
gist
s w
hc s
impl
y ch
ecke
d "O
ther
" fo
r th
eir
empl
oym
ent.
Sour
ce: 2
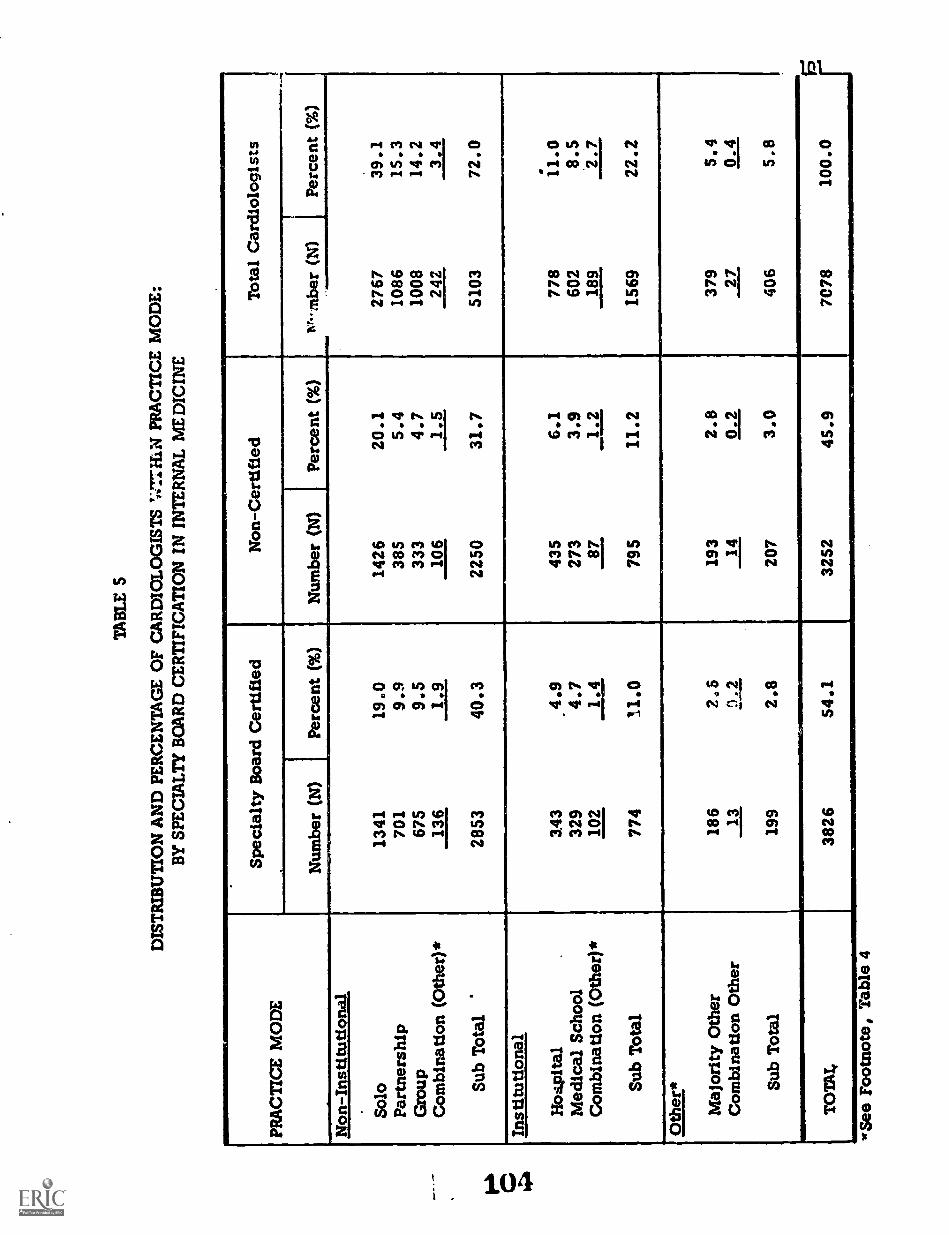
TA
BL
E 5
DIS
TR
IBU
TIO
N A
ND
PE
RC
EN
TA
GE
OF
CA
RD
IOL
OG
IST
S '4
7:71
.101
PR
AC
TIC
E M
OD
E:
BY
SPE
CIA
LT
Y B
OA
RD
CE
RT
IFIC
AT
ION
IN
IN
TE
RN
AL
ME
DIC
INE
Spec
ialty
Boa
rd C
ertif
ied
Non
-Cer
tifie
dT
otal
Car
diol
ogis
tsPR
AC
TIC
E M
OD
E, N
umbe
r (N
)Pe
rcen
t (%
)N
umbe
r (N
)Pe
rcen
t (%
)T
Ar-
mbe
r (N
1Pe
rcen
t (%
)
Non
-Ins
titut
iona
l
Solo
1341
19.0
1426
20.1
2767
39.1
Part
ners
hip
701
9.9
385
5.4
1086
15.3
Gro
up67
59.
533
34.
710
0814
.2C
ombi
natio
n (O
ther
)*13
61.
910
61.
524
23.
4
Sub
Tot
al'
2853
40.3
2250
31.7
5103
72.0
Inst
itutio
nal
Ho4
Pita
l3.
43.4
.943
56.
177
811
.0M
edic
al S
choo
l32
94.
727
33.
960
28.
5C
ombi
natio
n (O
ther
)*10
21.
487
1.2
189
2.7
Sub
Tot
al77
411
.079
511
.215
6922
.2
Oth
er*
Maj
ority
Oth
er18
62,
, 519
32.
837
95,
9C
ombi
natio
n O
ther
130.
214
0.2
270.
4
Sub
Tot
al19
92.
820
73.
040
65.
8
1
TO
TA
L38
2654
.132
5245
.970
7810
0.0
See
Foot
note
, Tab
le 4

TA
BL
E 6
DIS
TR
IBU
TIO
N A
ND
PE
RC
EN
TA
GE
OF
CA
RD
IOL
OG
IST
S W
ITH
IN P
RA
CT
ICE
MO
DE
:B
Y S
UB
SPE
CIA
LT
Y B
OA
RD
CE
RT
IFIC
AT
ION
nkt
CA
RD
IOV
ASC
UL
AR
DIS
EA
SE
Subs
peci
alty
Boa
rd C
ertif
ied
Non
-Cer
tifie
dT
otal
Car
diol
ogis
tsPR
AC
TIC
E M
OD
E
Num
ber
(N)
Perc
ent (
%)
Num
ber
1.1)
Perc
ent (
%)
Num
ber
(N)
Perc
ent (
%)
Non
-Ins
titut
iona
l
Solo
187
2.6
2580
36.5
2767
39.1
Part
ners
hip
105
1.5
981
13.8
1086
15.3
Gro
up11
41.
689
412
.610
0814
.2C
ombi
natio
n (O
ther
)*31
0.4
211
3.0
242
3.4
Sub
Tot
al43
76.
146
6665
.951
0372
.0
Inst
itutio
nal
Hos
pita
l67
1.0
711
10.0
778
11.0
Med
ical
Sch
oll
115
1.6
487
6.9
602
8.5
Com
bina
tion
(Oth
er)*
290.
416
02.
318
92.
7
Sub
Tot
al21
1.
3.0
1358
19.2
1569
22.2
Oth
er*
Maj
ority
Oth
er36
0.5
343
4.9
379
5.4
Com
bina
tion
Oth
er1
0.0
260.
427
0.4
Sub
Tot
al37
0.5
369
5.3
406
5.8
TO
TA
L68
59.
663
9390
.470
7810
0.0
*See
rne
tnnt
eT
anie
4

103
DISTRIBUTION OF CARDIOLOGISTS IN THE UNITED STATES
The ratios of cardiologists to population by census division are Shown inTable 7. Maldistribution of cardiologists is apparent. The national ratioof active cardiologists is 5.1. It is noted from this table and also Isom Table 8
reconstructed from Table 7 that the greatest number of cardiologists/100, 000is in the North East section of the country with the Middle Atlantic regionbeing 8.0 and the New England region 7.0/100,000 population. South Atlanticand Pacific regions follow with 5.6 and 5.7/100,000, Lowest is East SouthCentral with 2.5 cardiologists per 100,000. All other regions are somewhatabove this ratio but are below the 5.1 national average. With the exceptionof the West North Central area where the ratio of Primary to Secondary Cardi-ologists is unity, Primary Cardiologists are slightly more numerous across thepopulation than are the Secondary type. The ratio of cardiologists in trainingto population density roughly corresponds with the practicing cardiologists'ratio within a given census division.
Table 8 also shows that within wide differences in geography, populationdensities, total physicians, and medical specialists/100,000, the ratio ofcardiologists to medical specialists is within a rather narrow range of from5.3 to 7.3 percent with a median value of 5.8 percent.
DISTRIBUTION OF CARDIOLOGISTS IN METROPOLITAN AREAS
In cities of over one million population (Table 9) it can be seen that the largestnumber of cardiologists /100, 000 are located in cities of the east and westcoastal areas. This is also shown graphically in Figure 1. Certain metro-politan areas, however, have ratios much below the national average of 5.1,i.e., Milwaukee (3.3), Kansas City (4.0), Louisville (3.3), and Detroit(3.9). Most others scatter somewhat above the national average. Thesediscrepancies may again be due to varying socio-economic and educationalfactors causing regional maldistribution.
In most of these larger cities, which have increased ratios over the nationallevel of 5.1, there is a medical school with its affiliated hospitals. In mostof the cities with the larger numbers of cardiologists per 100,000 there aretwo or more schools per city. In New York, Boston, and Philadelphia, citieswith the greatest numbers of cardiologists per 100,000, there are three ormore medical schools.
It is quite probable that among other factors, medical schools and theiraffiliated hospitals offer educational attractions and practice opportunitiesthat lead to a greater concentration of cardiologists and probably other spe-cialists in their communities. It is also evident, however, that the presenceof a medical school and its metropolitan hospitals does not assure a communityof a large number of cardiologists.
106

TA
BL
E 7
CA
RD
IOL
OG
IST'S R
AT
IOS T
OPO
PUL
AT
ION
1:4:b
CE
NSU
S DIV
ISION
BY
SPEC
IAL
TY
AN
D A
CT
IVIT
Y ST
AT
US
CA
R raoL
ixasrs
Aczyny ST
AT
US
205,923.959
National
Total
rT
S.1.t.i
1 * itt.;tiklvi.-
1.St
POSSE
SSION
SIke, A
ro
osto40vl2Z
t%C
il.AL:
a04,20azins
20.11%
e.esein.
alet
S4).ar:x
2.":
clsi
40gtra8=
6 $.'.
*/3
iai
141) ...._.47401 06
iai
...
it.o.:
LI"
a 441%4'
4
011co
rtC."01%
1
74
0:
.._.. e.t 44ivi
ii .
f .IV
27.2;a..;
212
...
At tifr0:ttioloolsts
Maur).
2.73.9
4.23.0
1.32.0
2.01.7
2.43.1
2.4N
otA
vailableSecondary
1.4LA
II3-I-
LI
La
L&
Li
LLLL
Li14
Totai
5.17.0
1.05.6
2.53.6
3.83.1
1.15.7
3.8
C.erdsoloists In T
raining.
Primary
.,.6
.4.3
*0.0.1
.3.2
.3.3
1.5
Secondary2
4.4
alP.aff
AA
SA0,1
IA-
.11,1
Total
.S.9
.6.6
0.0.2
.S.2
.3.3
1.5
NISA
Valoasts
Primary
3.04.5
4.63.3
1.32.1
2.21.0
2.73.4
2.5
Secondary2 6
,3 44.2
3.0Li
LiLi
LiLs.
LiLa
Total
5.6
_7.98.8
6.32.5
3.14.3
3.64.5
6.11.0
a >.1
'U.S.
&dealt of the G
enius. U.S. O
HM
S/ of Population: 1970.N
umber of Inhabitants. M
al Report PC
tl)A
l OM
NI SO
WS Sitalotr
Source: 2

105
TABLE 8
Distribution Ratios of Medical Specialists and CardiologistsTo Population According to Census Division
Census Division
Population (M)
Ratios Per 100,000 Population
TotalMedical
Specialists Cardiologists
Cardiology -Medical
Specialists
Middle Atlantic 37.2 189.4 110.8 8.0 7.3%
New England 11.8 184.7 109.0 7.0 6.4%
Pacific 26.5 181.3 97.0 5.7 5.8%
South Atlantic 30.7 146.2 80.0 5.8 7.6%
Mountain 8.3 142.9 71.5 4.1 5.7%
East North Central 40.3 125.9 64.5 3.8 5,9%
West North Central 16.3 124.5 61.6 3.4 5.6%
West South Central 19.3 121.0 57.6 3.6 6.3%
East South Central 12.8 104.4 47.0 2.5 5.3%
Source: 1, 2
lob

106
TABLE 9
CARDIOLOGISTS' RATIOS TO POPULATION:BY RANK-ORDERED METROPOLITAN AREAS OVER 1,000,000 POPULATION
Metropolitan Areal Population2Primary CD
Ratio per 100 MSecondary CDRatio per 100 M
All CDsRatio per 100 M,
New York 16,062,700 5.6 5.5 11.0Los Angeles 8,568,000 4.0 3.7 7.7Chicago 7,797,400 2.8 2.S 5.3Philadelphia 5,177,000 S.1 3.3 8.4Baltimore-Washington, D.C. 4,803,900 5.8 3.8 9.5Detroit 4,693,000 2.4 1.4 3.9San Francisco 4,529,200 4.3 3.5 7.9Boston 3,549,000 6.6 3.5 10.1St. Louis 2,490,300 2.6 2.8 S.SCleveland 2,367,500 3.8 3.2 7.0Dallas-Fort Worth 2,303,000 1.9 2.5 4.5Pittsburgh 2,242,300 3.3 2.7 6.0Minneapolis-St. Paul 2,226,300 3.3 2.6 5.9Houston 2,153,700 3.6 2.1 5.7Miami 2,128,300 9.0 8.0 17.0Seattle-Everett-Tacoma 1,998,200 3.6 1.5 5.1Milwaukee 1,957,000 1.7 1.5 3.3Atlanta 1,893.600 2.6 3.7 6.3Cincinnati 1,849,900 2.8 2.S 5.3Kansas City 1,546,800 2.0 1.9 4.)Buffalo 1,490,800 3.1 2.4 5.4Memphis 1,405,600 1.9 1.4 3.2Providence 1,327,000 3.4 2.9 6.3San Diego 1,300,000 4.2 2.5 6.7Indianapolis 1,295,400 3.2 2.2 5.3Columbus 1,246,000 2.7 2.3 5.1Portland 1,200,400 2.8 2.3 5.2Tampa-St. Petersburg 1,171,600 3.7 4.2 7.9New Orleans 1,117,100 3.5 2.0 S.SSan Antonio 1,116,100 3.3 2.3 5.6Denver 1,115,100 5.0 2.4 7.4Louisville 1,085.,900 2.0 1.3 3.3Dayton 1,073,900 2.4 1.5 3.9New Haven 1,067,200 3.7 3.8 7.4Greensboro-Winston, Salem 1,066,400 1.5 2.5 4.0Phoenix 1,058,200 2.6 2.1 4.6Norfolk-Newport News 1,051,500 1.2 1.4 2.7
1Metropolitan area as defined by three digit zip code combinations.
2Population estimates related to zip code areas based on 1969 populationestimates, "Rand McNally Zip Code Atlas, 1970."
Source: 1, 2
109

RA
TIO
OF
CA
RD
IOLO
GIS
TS
'T
O P
OP
ULA
TIO
N (
100
m}
PE
R Z
IP C
OD
E A
RE
AS
WIT
HIN
ST
AT
ES
:DE
CE
MB
ER
197
1
0010
091
1
1.0
TO
19
F771
2 0
TO
2 9
3.0
TO
3 9
E:=
14
0 T
O 4
95
0 T
O 5
.960
TO
6,9
7 0
TO
9.9
10 0
& O
VE
R
#.ro
DE
NO
TE
S M
AJO
R P
OP
ULA
TIO
NC
EN
TE
R A
SS
OC
IAT
ED
WIT
H Z
IPA
RE
A0

108
REFERRAL OF PATIENTS TO CARDIOLOGISTS
Approximately 60 percent of all patients seen by cardiologists come from theirown practice with 40 percent referred by other physicians or agencies (Table 10).The referral pattern was essentially the same for both Board Certified and non-certified cardiologists in Internal Medicine.
On the other hand cardiologists with Subspecialty Board Certification in Cardio-vascular Disease stated that 53 percent of their patients were referred by otherphysicians or agencies (Table 11). There seemed to be no marked differencesin referral pattern according to census divisions,
DISTANCE TRAVELL.713 BY PATIENT TO CARDIOLOGISTS
As shown in Table 12, approximately 60 percent of the cardiologists' patientstravelled five miles or greater to be seen. For some areas of the country, thepercentage of patients who travelled greater than 25 miles marled considerably.
CARDIOLOGISTS' AGE AND YEARS SINCE DEGREE
The average age of all cardiologists is 47.8 years (Table 13). Primary Cardi-ologists on an average are three years younger than Secondary Cardiologists(46.7 vs. 49.9) and Federal Cardiologists are seven years younger than Non-Federal Cardiologists (41.0 vs. 48.2). As would be expected from the above,Federal Cardiologists have graduated from medical school more recently (byseven years) than Non-Federal, and Primary Cardiologists more recently (bythree years) than Secondary as shown in Table 14.
Data on the age distribution of cardiologists show 26 percent are betveen25 and 39 years of age; 55 percent are between 40 and 59 years of age; and21 percent are 60 and over. Some regional differences exist. These arediscussed in Chapter 8.
SUMMARY AND RECOMMENDATIONS
There are 10,691 cardiologists in active practice in the United States andapproximately 1,000 in training. This gives a ratio of 5.6 cardiologists per100,000 population. Whether this is an optimal ratio to be maintained inthe future cannot be stated. Their numbers seem to be distributed aboutequally between the Primary Cardiologist and the Secondary Cardiologist.Approximately 70 percent are office based outside institutions and about50 percent of all cardiologists are certified in Internal Medicine and 10 per-cent certified in Cardiovascular Disease.

TA
BL
E 10
PER
CE
NT
AG
E O
F CA
RD
IAC
FAT
TE
NS R
EFE
RR
ED
TO
PHY
SICIA
NB
Y T
YPE
OF R
EFE
RR
AL
SOU
RC
E:
CE
NSU
S DIV
ISION
BY
BO
AR
D C
ER
TIFIC
AT
ION
BO
AR
DC
ER
TIFIC
AT
ION
Group
Total
NO
RT
HE
AST
SOU
TH
NO
RT
H C
EN
TR
AL
A........
WE
STPO
SSESSIO
NS
APO
/FE,
laCii0 cZ
41
-
=15 c1:1 02 Z
cs 11ui dz
-.tr) 0$
.br0la 4.)
.cSfl,'...
$ gr; 8
fts_,
Z 0
4.,.. , 0
i71;
z tji 8
c1.c02I3e
.
i 1F.
a 81
9 -t.: I
2k A
<
Board C
ertifiedD
istribution N)
3769315
944647
122241
SS6210
144S56
2311
Toe of R
eferral:
59.7
33.3
7.1
61.4
32.0
6.6
63.3
30.4
6.4
58.7
33.7
7.6
54.1
36.7
9.1
55.7
34.8
9.5
56.;
3e.2
5.7
57.5
37.7
4.8
66.5
26.8
6.7
60.0
32.0
8.0
59.7
29.2
11.1
17.7
38.6
43.6
own practice
from other physicians
other (agencies)
Non-B
oard Certified
Distribution (N
)3160
231899
504102
218434
16797
46140
7
Type of R
eferral:
61.8
29.4
8.7
63.6
29.9
6.1
66.3
23.9
9.9
60.2
30.1
9.7
60.0
32.0
8.0
57.7
32.1
10.2
62.2
30.1
7.6
61.9
35.5
2.6
59.7
33.S
6.8
56.6
34.3
9.1
63.8
24.2
12.1
29.3
25.7
45.0
own practice
from other physicians
other (agencies)
Source: 2

TA
BL
E 11
PER
CE
NT
AG
E O
F CA
RD
IAC
PAT
IEN
TS R
EFE
RR
ED
TO
PHY
SICIA
NB
Y T
YPE
OF R
EFE
RR
AL
SOU
RC
E:
CE
NSU
S DIV
ISION
BY
CA
RD
IOL
OG
Y SU
BSPE
CIA
LT
Y B
OA
RD
IN C
AR
DIO
VA
SCU
LA
R D
ISEA
SE C
ER
TIFIC
AT
ION
CA
RD
IOL
OG
YSU
BSPE
CIA
LT
Y B
OA
RD
IN C
AR
DIO
VA
SCU
LA
RD
ISEA
SE C
ER
TIFIC
AT
ION
Group
Total
NO
RT
HE
AST
SOU
TH
I.../R
TH
CE
NIItA
LI
WE
STPO
SSESSIO
NS
P.POir PO
12cS c.z z
u
.0 ,2 Z
ow.s -
c4 .7
Io ...,C
O 4
7, =IS 6
f.vs ;s
il 6'
.ctZ 1;. ce *la 0
Zli
ii 8
.20Cg2
.2ua.
CI15L
I
..: 31>
a
?..1e2.....
Cardiology C
ertifiedD
istribution al670
52164
11826
6096
4530
72S
2
Type of R
eferral:
own practice
46.549.7
48.645.9
35.744.5
46.542.8
48.446.3
73.45.0
fromother physicians
45.842.3
43.145.6
50.849.1
47.753.3
45.145.1
4.495.0
other (agencies)7.7
7.98.3
8.513.6
6.45.8
3.96.5
8.622.2
0.0
Non - C
ardiology Certified
Distribution (N
)6259
4941679
1033198
399894
332211
94558
16
Type of R
eferral:
own practice
62.263.6
66.360.9
59.658.5
60.161.7
66.059.4
61.324.4
from other physicians
30.030.1)
25.630.6
32.431.1
33.334.4
27.332.1
27.925.9
other (agencies)7.9
6.28.1
8.58.0
10.46.6
3.86.8
8.510.8
49.7
Source: 2

711312 12
PER
CE
NT
AG
E O
F CA
RD
IAC
PAT
IEN
TS B
Y M
ILE
AG
E D
ISTA
NC
E FR
OM
PHY
SICIA
N:
CE
NSU
S DIV
ISION
BY
PHY
SICIA
N A
GE
GR
OU
PING
S
PHY
SICIA
NA
GE
GR
OU
PING
SG
roup
Total
..I. 0-,L
)SO
UT
HN
OR
TH
CE
NT
RA
LPO
SSESSIO
NS
A kit 'A
ll
la3 7::C
o gz ...;
e I.:lo clo
e... 7.x <
1'')
. c. as...C
ad
f.zo...C
O 0
I....a c0L
a C..)
..0 ,..C
O:. Z
1 s
f.Is ....1 2.. 200
N.
61 1/40
f.tz -s e.. r,e cIti 8
.1
e2.u
Sv.u
iO
.vs.i...............w
#
61283
i ...la. 30,
41,
P. 1)
1 q A
0a.10
Less T
han 40 Years
nistrsbution IN)
1801161
382362
57127
25292
1410
1441eaget
38.8
48.5
12.7
43.9
46.9
9.2
49.6
45.4
5.0
37.2
48.7
14.1
28.4
46.3
25.3
31.6
48.4
20.0
35.1
50.7
14.1
26.2
45.2
28.6
40.8
46.6
12.6
35.8
52.9
11.3-
30.8
61.1
8.1
37.7
44.7
17.6
ltss than 5
5 to 25
ovet 25
40 Through 59 Y
earsD
Astrsoution (N
)3586
254926
574136
242532
191132
55441
4
Mileage:
41.8
48.5
9.8
47.4
45.7
6.9
49.4
45.3
5.3
40.9
48.6
10.6
25.7
54.9
19.4
32.6
49.1
18.2
38.4
52.9
8.7
30.1
46.3
23.6
40.3
46.9
12.7
42.4
50.1
7.5
47.0
47.1
S.9
50.0
32.5
17.5
less than 5
5 to 25
.)..er 25
60 Years A
nd Over
Distr.v..stion (N
)1135
99435
14022
60157
6228
128.,,
40.0
Mileage
43.7
49.3
6.9
42.8
50.1
7.1
52.6
43.5
3.9
40.1
52.4
7.5
36.1
51.9
12.0
35.3
52.6
12.1
34.0
59.8
6.1
29.1
51.1
19.8
46.1
42.7
11.3
42.5
50.5
6.9
30.0
61.2
8.8
0.0
0.0
0.0
less than 5
5 to 25
over 25
Source: 2

NT
AB
LE
13
AV
ER
AG
E P
HY
SIC
IAN
AG
E B
Y P
HY
SIC
IAN
CL
ASS
IFIC
AT
ION
:B
Y S
PEC
IAL
TY
PHY
SIC
IAN
CL
ASS
IFIC
AT
ION
SPE
CIA
LT
Y
AL
LC
AR
DIO
LO
GIS
TS
.Pr
imar
yC
ardi
olog
ist
Seco
ndar
yC
ardi
olog
ist
year
sN
year
sN
year
sN
Non
-Fed
eral
Fede
ral
Ave
rage
Age
46.7
39.5
46.2
3629 28
9
49.9
44.3
49.7
3158 12
5
48.2
41.9
47.8
6787 414
Tot
al N
umbe
r (N
)39
1832
8372
01
Sour
ce: 2

TA
BL
E 1
4
AV
ER
AG
E Y
EA
RS
SIN
CE
DO
CT
OR
OF
ME
DIC
INE
DE
GR
EE
:B
Y S
PEC
IAL
TY
SPE
CIA
LT
Y
AL
LC
AR
DIO
LO
GIS
TS
PHY
SIC
IAN
CL
ASS
IFIC
AT
ION
Prim
ary
Car
diol
o is
tSe
cond
ary
Car
diol
ogis
t
year
sN
year
sN
year
sN
Non
-Fed
eral
Fede
ral
Ave
rage
Yea
rs
21 14 20
3670 292
24 19 24
3212 12
7
22 15 22
6882 419
Tot
al N
umbe
r (N
)39
6233
3973
01
Sour
ce: 2

114
Per population density, cardiologist are irregularly distributed tending toconcentrate in the metropolitan centers of the North East, Middle Atlantic andPacific regions. These areas contain the large cities having the heaviestconcentration of medical schools. The East South Central, West SouthCentral and West North Central regions contain significantly fewer numbersof cardiologists per 100,000 population.
The numbers of general practitioners /100, 000 do not vary greatly in mostparts of the country, although there are approximately twice as many medicalspecialists as surgeons /100, 000 population in a majority of the census divi-sion regions.
Factors related to manpower maldistributions are many and complex. Ourrecommendations regarding more desirable manpower to population ratios andtechniques to realize them are discussed at the conclusion of Chapter Seven.
117

CHAPTER 4
ROLES AND PROFILES OF THE CARDIOLOGISTS
H.J.C. Swan and Ray W. Gifford, J.
BACKGROUND
115
The study conducted by the Sub-Board of Pediatric Cardiology) .2 has alreadybeen referred to in the Preface and the results of it are a reasonable startingpoint for the material covered in this chapter.
The Sub-Board of Pediatric Cardiology reviewed among other matters, theprofessional activities of all pediatric cardiologists who were board certifiedas of tune 1967. The response rate was 93 percent. The professional activi-ties of the pediatric cardiologist were categorized as (1) professional - includ-ing maintenance of learning skills, (2) clinical application of professionalskills, (3) research, (4) teaching and (5) administrative.
Only 8 percent of the pediatric cardiologists were in full time private practice.Ninety-two percent were either in academic positions or in full time non-academic hospital practice. Nevertheless, clinical (patient care} activitiesdominated the activities of these physicians averaging 62 percent of the time.This ranged from 44 percent of the time for the acacemic (senior) group, to81 percent of time for those in private practice.
ADULT CARDIOLOGISTS
Historically, adult cardiology has been regarded as a component of internalmedicine. The emergence of cardiology as a subspecialty occurred by reasonsof the increase in special knowledge and newer diagnostic and therapeutictechniques in the field. Also, a large number of persons in the populationwith significant disease suffer from disorders of the cardiovascular system.
The subspecialty of pediatric cardiology developed in part because of rapidadvances in the field of congenital heart disease associated with the intro-duction of cardiac catheterization and cardiovascular surgery in the early1950's. In contrast, specific and innovative changes in the management ofadult cardiovascular diseases occurred gradually and by reason of the morecomplex nature of such problems, demanded a more varied pattern of profes-
1Adams, F.H., et.al.: "The Review and Revision of Certification Proceduresin Pediatric Cardiology." J. Med. Educ. 47:796, 1972.
2Adams , F.H. et.al.: "Manpower and Training Requirements In PediatricCardiology." Pediat. 51:813, 1973.
116
sional activities. Hence, we are making the assumption that the adult cardi-ologist cannot be described by a single profile.
ROLES AND PROFILES OF CARDIOLOCISTS
The professional activities of duakadiAza&9 were identified by two tech-niques: an initial classification questionnaire to all who listed cardiovasculardisease as a professional activity with the American Medical Association; andlog-diary analysis of the activities of a stratified random sample of these phy-sicians. Since the number of federally employed physicians was small (2.3percent - Table 1) in comparison to those of the non-federally employed, thedata that will follow are those of the non-federally employed group. Theresponses of 6,436 non-federally employed cardiologists indicated that 1,413or 22 percent were engaged in Institutional Practice, while 5,023 or 78 percentwere engaged in Non - institutional (private, solo, group, office) Practice.
The initial classification questionnaire allowed a separation of cardiologistsinto those who spent greater than 50 percent of professional time in cardiology --designated Primary Cardiologists -- and those who spent less than SO percentof time in cardiology -- designated o!istsCar Hence, physi-cians in Institutional or Non-Institutional Practice could be then subdividedinto the additional categ ries -- Primary or Secondary.
Table 2 shows the percentage of professional activity time and proportion oftime to cardiology by specialty. As a group, all cardiologists indicated that81 percent of professional activity time was devoted to patient care includingteaching and research with patients. Primary Cardiologists indicated that6S percent of their time was devoted to clinical care of patients with cardio-vascular disease including time spent in teaching and research involvingpatients. The Primary Cardiologist carried out substantively more researchand teaching than did the Secondary Cardiologist. A substantive portion (17percent) of the total time of the Primary Cardiologist was devoted to teaching.Administrative and professional (journals, meetings, etc.) activities amountedto approximately 12 percent for all cardiologists and did not differ betweenPrimary and Secondary Cardiologists (Table 3).
The general types of cerdiologic activity for all cardiologists is defined inTable 4. The great majority of cardiologists acted as consultants in theoffice or hospital for cardiac patients and read electrocardiograms. PrimaryCardiologists conducted most of the catheterization procedures.
In attempting to define the distribution and percentage of cardiologists accord-ing to the Institutional and Non-Institutional practice modes, a significantdifference was identified according to age groupings (Table 5). Twenty-eightpercent of the cardiologists were under the age of 40 years and 53 percent ofthese were in Non-Institutional practice equally divided among solo, partner-.ships, and group modality. Fifty-four percent of the physicians were betwevin
119

117
TABLE 1
AVERAGE PERCENT OF TIME IN DIRECT PATIENT CARE:SPECIALTY AND PRACTICE BY
FEDERAL AND NON-FEDERAL CARDIOLOGISTS
Specialtyend
Practice
Average Percent of Time in Activity
Federal Non-Federal Combined Total
N 96
Non-Institutional
Primary
Secondary
13 75.7
5 78.0
2411 76.7
2612 82.7
Subtotal
Institutional.
Primary
Secondary
18 76.3
107 31.0
31 53.0
5023 79.8
1056 32.4
357 36.6
2424 76.7
2617 82.7
5041 79.8
1163 32.3
388 37.9
Subtotal
TOTAL
138 35.9 1413 33.5 1551 33.7
156 40.6 6436 69.6 6592 68.9
Source: 2
140

TA
BL
E 2
PER
CE
NT
AG
E O
F PR
OFE
SSIO
NA
L A
CT
IVIT
Y T
IME
AN
D P
RO
POR
TIO
N O
F T
IME
TO
CA
RD
IOL
OG
YB
Y S
PEC
IAL
TY
AN
D S
EL
EC
TE
D A
CT
IVIT
Y C
LA
SSIF
ICA
TIO
N
SEL
EC
TE
D A
CT
IVIT
YC
IASS
IFIC
AT
ION
SPE
CIA
LT
Y
Prim
ary
Car
diol
ogis
tSe
cond
ary
Car
diol
ogis
tA
LL
CA
RD
IOL
OG
IST
S(N
=39
10)
(N=
3256
)(N
=71
66)
% o
f%
to%
of
% to
% o
f%
toto
tal
CD
tota
lC
Dto
tal
CD
CL
INIC
AL
CA
RE
79.5
65.0
83.7
32.9
t
81.4
50.6
.D
irec
t Pat
ient
Car
e.
Res
earc
h w
ith P
atie
nts
.T
each
ing
with
Pat
ient
s
RE
SEA
RC
H10
.59.
73.
71.
97.
56.
2.
With
Pat
ient
s.
With
out P
atie
nts
TE
AC
HIN
G16
.513
.78.
63.
912
.99.
3'°
)With
Pat
ient
sW
ithou
t Pat
ient
s
Sour
ce: 2

TA
BLE
3
PER
CE
NT
AG
E O
F PR
OFE
SSIO
NA
L A
CT
IVIT
Y T
IME
AN
D P
RO
POR
TIO
N O
F T
IME
TO
CA
RD
IOL
OG
YB
Y S
PEC
IAL
TY
TY
PE O
F A
CT
IVIT
Y
SPE
CIA
LT
Y
Prim
ary
Car
diol
oais
tSe
cond
ary
Car
diol
oais
tA
LL
CA
RD
IOL
OG
IST
S,1
X71
6610
32 6
% o
ftk
-A31
% to CD
% o
fto
tal
% to CD
% o
fto
tal
% to CD
Dir
ect P
atie
nt C
are
60.8
48.8
75.3
28.9
67.3
39.9
Res
earc
h w
its P
atie
nt C
are
6.2
5.7
1.8
1.0
4.2
3.6
Tea
chin
g w
ith P
atie
nt C
are
12.6
10.5
6.6
3.0
9.9
7.1
Sub
Tot
alC
linic
al79
.565
.083
.732
.981
,450
.6
Res
earc
h w
ithou
t Pat
ient
Car
e4.
44.
01.
90.
93.
32.
6
Tea
chin
g w
ithou
t Pat
tern
Car
e3.
93.
22.
00.
93.
02.
2
Sub
Tot
al -
Non
-Clin
ical
8.3
7.2
3.9
1.8
5.3
4.8
Res
earc
h an
d T
each
ino
,
Adm
inis
trat
ive
6.8
0.0
7.5
0.0
7.1
0.0
Prof
essi
onal
5.4
0.0
4.3
0.0
5.1
0.0
TO
TA
L10
0.0
72.2
99.9
34.7
99.9
S5.4
Sou
rce:
2

TA
BL
E 4
PER
CE
NT
AG
E O
F PH
YSI
CIA
NS
PER
FOR
MIN
G S
EL
EC
TE
DT
YPE
S O
F C
AR
DIO
LO
GY
AC
TIV
ITIE
S:B
Y S
PEC
IAL
TY
TY
PE O
FA
CT
IVIT
Y
SPE
CIA
LT
Y
AL
LC
AR
DIO
LO
GIS
TS
Prim
ary
Car
diol
ogis
tSe
cond
ary
Car
diol
ogis
t(N
=38
76)
(N=
3169
)(N
=70
45)
Off
ice
Con
sulta
nt f
orC
ardi
ac P
atie
nts
84.1
87.7
85.7
Off
ice
EC
G R
eade
r71
.581
.776
.1
Hos
pita
l Con
sulta
nt f
orC
ardi
ac P
atie
nts
92.9
.
80.6
87.4
Hos
pita
l EC
G R
eade
r77
.060
.969
.8
Hos
pita
l CC
U C
omm
ittee
64.8
53.2
59.6
Car
diac
Dia
gnos
ticR
oent
geno
grap
hy37
.314
.827
.2
Car
diac
Cat
hete
riza
tion
40.9
7 . 9
26.0
Sour
ce: 2

TA
BL
E 5
DIS
TR
IBU
TIO
N A
ND
PE
RC
EN
TA
GE
OF
CA
RD
IOL
OG
IST
SW
ITH
IN P
RA
CT
ICE
MO
DE
:B
Y A
GE
GR
OU
PIN
GS
PRA
CT
ICE
MO
DE
Und
er 4
0 Y
ears
40 th
roug
h 59
Yea
rs60
Yea
rs a
nd O
ver
All
Car
diol
ogis
ts
Num
ber
(N)
Perc
ent (
%)
Num
ber
(N)
Perc
ent (
%)
Num
ber
(N)
Perc
ent (
%)
Num
ber
(N)
Perc
ent (
%)
Non
-Ins
titut
iona
l
Solo
349
5.0
1581
22.6
810
11.6
2740
39.2
Part
ners
hip
328
4.7
629
9.0
114
1.6
1071
15.3
Gro
up30
44.
459
18.
510
21.
599
714
.3
Com
bina
tion
(Oth
er)*
650.
913
92.
035
0.5
239
3.4
Sub Total
1046
15.0
2940
42.1
1061
15.2
5047
72.2
Inst
itutio
nal
Hos
pita
l41
35.
929
34.2
54
0.8
760
10.9
Med
ical
Sch
ool
257
3.7
310
4.4
250.
459
28.
5
Com
bina
tion
(Oth
er)*
921.
387
1.2
80.
118
72.
7 -
Sub
Tot
al76
210
.969
09.
987
1.3
1539
22.1
Oth
er*
Maj
ority
Oth
er17
32.
515
02.
145
0.6
368
5.3
Com
bine
d O
ther
20.
018
0.3
70.
127
0.4
Sub Total
175
2.5
:.68
2.4
52
0.7
395
5.7
TO
TA
L19
8328
.437
9854
.41200
17.2
6981
100.
0
*In
tabl
es, i
n se
ctio
ns w
hich
fol
low
, the
se"O
ther
" ty
pes
are
com
bine
d as
"O
ther
" be
caus
e,fo
r al
l pra
ctic
al p
urpo
ses,
they
incl
ude
eith
er (
1) in
divi
dual
s w
hose
pra
ctic
e in
volv
es m
edic
alsc
hool
/hos
pita
l plu
s so
me
non-
inst
itutio
nal o
r (2
) ar
efe
dera
l
cardiologists who simply checked
"Oth
er"
for
thei
r em
ploy
men
t.So
urce
: 2

122
the ages 40 and 59, and in contrast to the younger group, 77 percent of thecardiologists in this age group were Non-Institutional and more than half ofthese were in solo practice. This trend was even greater in physicians 60years and older, representing 17 percent of the entire group. Nearly 90 per-cent of the older cardiologists were in the Non-Institutional mode and 76 per-cent of these were in solo practice. Thirty-eight percent of those physiciansbelow the age of 40 were Institutionally employed with a dominance in hospitalas opposed to medical school positions. Eighteen percent of physicians 40through 59 years were Institutionally employed equally divided between hospitaland medical school distribution, while only 7 percent of those 60 years or overwere Institutionally employed.
The distribution of cardiologists by practice mode and specialty board (in-ternal medicine) certification is demonstrated in Table 6. While a majority(55 percent) of Non-Institutional Cardiologists were certified, certified ornon-certified physicians were equally represented in Institutions.
Table 7 demonstrates the distribution of cardiologists by subspecialty boardcertification in cardiovascular disease. Less than 9 percent of Non- Institu-tional Cardiologists and 13 percent of Institutional Cardiologists were sub-specialty certified, The latter category included 19 percent of medical cardi-ologists, and 9 percent of hospital cardiologists.
When we examine the functional activities of all cardiologist by age group-ings (Table 8), virtually all undertook similar duties as regards office con-sultation for cardiac patients, reading of office electrocardiograms and pro-viding hospital consultation for cardiac patients. Cardiologists less than40 years spent less time reading office electrocardiograms. Physicians underthe age of 60 years participated more frequently as electrocardiographic readersin the hospital and on the coronary care unit committees than did older physicians.In the application of new and special skills, including cardiac diagnostic roent-genography and cardiac catheterization there was significantly greater listingof activity in these categories in physicians under the age of 40. In contrast,cardiologists 60 years and over participated to minimal degree in these activities.Whereas 50 percent of physicians of less than 40 conducted cardiac catheteri-ations, only 2.6 percent of physicians over the age of 60 provide these services.When these activities were examined within the categories of Primary or SecondaryCardiologist (Table 4) there was a reduction in the participation of the SecondaryCardiologists in the more highly skilled activities: hospital ECG readers; CCUCommittee; diagnostic roentgenography; and cardiac catheterization. The distri-bution of activities by age of cardiologist is open to amny interpretations andmay change in the future as an adequate number of physicians are trained in arequired skill, or new skills are developed.
Table 9 demonstrates in detail the distribution of professional activity timeand the proportion of time concerned with cardiology. Among Non-Institu-
125

TA
BL
E 6
DIS
TR
IBU
TIO
N A
ND
PE
F.C
EN
TA
GE
OF
CA
RD
IOL
OG
IST
S W
ITH
IN P
RA
CT
ICE
MO
DE
:B
Y S
PEC
IAL
TY
BO
AR
D C
ER
TIF
ICA
TIO
N I
N I
NT
ER
NA
L M
ED
ICIN
E
Spec
ialty
Boa
rd C
ertif
ied
Non
-Cer
tifie
dT
otal
Car
diol
ogis
tsPR
AC
TIC
E M
OD
E
Num
ber
(N)
Perc
ent (
%)
Num
ber
(N)
Perc
ent (
%)
Non
- I
nstit
utio
nal
Solo
1341
19.0
1426
20.1
2767
39.1
Par
tner
ship
701
9.9
385
5.4
1086
15.3
Gro
up67
59.
533
34.
710
0814
.2C
ombi
natio
n(O
ther
)*13
61.
910
61.
524
23.
4
Sub Total
2853
40.3
2250
.31
.751
0372
.0
Inst
itutio
nal
Hos
pita
l34
34.
943
56.
177
811
.0M
edic
al S
choo
l32
94.
727
33.
960
28.
5C
ombi
natio
n {O
ther
)*10
21.
487
1.2
189
2.7
Sub Total
774
11.0
/95
11.2
1569
22.2
Oth
er*
Maj
ority
Oth
er18
62.
619
32.
837
95.
4C
ombi
natio
n O
ther
130.
214
0.2
270.
4
Sub
Tot
al19
92.
820
73.
040
65.
8
TO
TA
L38
2654
.132
5245
.970
7810
0.0
*See
Foo
tnot
e, T
able
5

TA
BL
E 7
DIS
TR
IBU
TIO
N A
ND
PE
RC
EN
TA
GE
OF
CA
RD
IOL
OG
IST
S W
ITH
IN P
RA
CT
ICE
MO
DE
:B
Y S
UB
SPE
CIA
LT
Y B
OA
RD
CE
RT
IFIC
AT
ION
IN
CA
RD
IOV
ASC
UL
AR
DIS
EA
SE
.
PRA
CT
ICE
MO
DE
Subs
peci
alty
Boa
rd C
ertif
ied
,
Non
-Cer
tifie
dT
otal
Car
diol
ogis
ts
Num
ber
(N)
Perc
ent (
%)
Num
ber
(N)
1Pe
rcen
t (%
)N
umbe
r (N
)Pe
rcen
t (%
)
Non
-Ins
titut
iona
l
Solo
187
2.6
2580
36.5
2767
39.1
Part
ners
hip
105
1.5
981
13.8
1086
15.3
Gro
up11
41.
689
412
.610
0814
.2C
ombi
natio
n (O
ther
)*31
0.4
211
3.0
242
3.4
Sub
Tot
al43
76.
146
6665
.951
0372
.0
Inst
itutio
nal
Hos
pita
l67
1.0
711
10.0
778
n-. o
-M
edic
al S
choo
l11
51.
648
76.
960
28.
5C
ombi
natio
n (O
ther
) *
290.
416
02.
318
92.
7
Sub
Tot
al21
13.
013
5819
.215
6922
.2
Oth
er*
Maj
ority
Oth
er36
0.5
343
4.9
379
5.4
Com
bina
tion
Oth
er1
0.0
260.
427
0.4
Sub
Tot
al37
0.5
369
5.3
406
5.8
.....0
1 TO
TA
L68
59.
663
9390
.470
7810
0.0
T '-
1

TA
BL
E 8
PER
CE
NT
AG
E O
F PH
YSI
CIA
NS
PER
FOR
MIN
G S
EL
EC
TE
DT
YPE
S O
F C
AR
DIO
LO
GY
AC
TIV
ITIE
S:B
Y P
HY
SIC
IAN
AG
E G
RO
UPI
NG
S
PHY
SIC
IAN
AG
E G
RO
UPI
NG
S
AL
LC
AR
DIO
LO
GIS
TS
(N=
6954
)
TY
PE O
FA
CT
IVIT
YL
ess
than
40
Yea
rs(N
=19
64)
40 to
59
Yea
rs(N
=37
82)
60 Y
ears
or
Ove
r(N
=12
08)
Off
ice
Con
sulta
nt f
orC
ardi
ac P
atie
nts
76.0
90.1
88.1
85.7
Off
ice
EC
G R
eade
r66
.180
.379
.376
.1
Hos
pita
l Con
sulta
nt f
orC
ardi
ac P
atie
nts
91.0
89.8
74.3
87.5
Hos
pita
l EC
G R
eade
r76
.571
.155
.569
.9
Hos
pita
l CC
U C
omm
ittee
61.4
69.2
42.6
59.6
Car
diac
Dia
gnos
ticR
oent
geno
grap
hy42
.123
.713
.827
.2
Car
diac
Cat
hete
riza
tion
51.4
20.5
2.6
26.1
I
Sour
ce: 2

01
TA
BL
E 9
CliR
DIO
LO
GIS
TS
BY
PR
AC
TIC
E M
OD
E:
PER
CE
NT
AG
E O
F PR
OFE
SSIO
NA
L A
CT
IVIT
Y T
IME
AN
D P
RO
POR
TIO
N O
F T
IME
TC
CA
RD
IOL
OG
Y
PRA
CT
ICE
MO
DE
TY
PEQ
FA
CT
IVIT
Y
Dis
trib
utio
n(N
)T
otal
N -
6987
Tim
e
Allo
catio
n
Dir
ect
Patie
ntC
are
Res
earc
hw
ithPa
tient
Car
.
Tea
chin
gw
ithPa
tient
(-Im
o
Sub
Tot
alC
linic
al
Res
earc
hw
ithou
tPa
tient
Car
e
Tea
chin
gw
ithou
tPa
tient
Car
e
Sub
Tot
al,
Res
. &
Tea
chA
dmin
istr
ativ
Prof
essi
onal
NO
N -
IN
STIT
UT
ION
AL
.:
Solo
Na2
724
% o
f to
tal
81.3
1.3
5.6
88.2
0.5
1.6
2.1
4.7
4.9
% to
CD
45.8
1.0
3.6
50.3
0.3
1.1
1.4
0.D
0.0
Part
ners
hip
N -
1079
% o
f to
tal
80.0
1.3
6.7
88.0
0.4
1.9
2.3
4.9
4.7
% to
CD
46.0
1.1
4.7
51.9
0.3
1.4
1.7
0.0
0.0
Gro
upN
-99
7%
of
tota
l79
.21.
76.
787
.60.
71.
72.
45.
04.
9%
to C
D45
.61.
34.
551
.50.
61.
21.
80.
00.
0
80.6
45.8
1.4
1.1
6.1
4.0
88:r
-0.
550
.90.
41. 1.
?.1.
60.
00.
0Su
b T
otal
N -
4800
% o
f to
tal
% to
CD
INST
ITU
TIO
NA
L:
Hos
pita
lN
a771
% o
f to
tal
45.4
10.2
18.3
73.8
5.6
4.9
10.5
10.0
5.6
% to
CD
32.1
9.0
14.1
55,2
4.6
3.8
8.4
0.0
0.0
Med
ical
Sch
ool
N-5
97%
of
tota
l19
.514
.822
.356
.716.2
8.9
25.1
12.6
5.7
% to
CD
15.8
13.2
17.3
46.2
12.8
6.1
18.9
0.0
0.0
% o
f to
tal
34.1
12.2
20.0
66.3
10.2
6.6
1&.9
11.1
5.6
Sub
Tot
alN
-136
8%
to C
D25
.010
.815
.551
.38.
24.
813
.00.
00.
0
Oth
erN
-819
% o
f to
te45
.67.
315
.468
.37.
14.
811
.913
.95.
8%
to C
D29
.66.
312
.147
.95.9
7.4
13.3
0.0
0.0
Sour
ce: 2
127
tional physicians, 81 percent of time was estimated to be spent in directpatient care of which 57 percent was related to cardiovascular disease. Thenature of the Non-Institutional practice (solo, partnership or group) made nodifference to either the allocation of time or its distribution to cardiovasculardisease. In contrast, 34 percent of the activity of Institutionally employedphysicians was devoted to patient care, but close to 73 percent of the timeallocated to patient care was devoted to cardiovascular disease. When otheractivities associated with patient care (research, teaching) were included,74 percent of the time of hospital physicians was devoted to some patientrelated activity, while 57 percent of the time allocation of medical schoolphysicians was so defined. However, the medical school based Institutionalphysicians showed greater activity in non-clinical research and teaching andapproximately the same expenditure of time in administrative and professionalfields as their hospital employed colleagues.
Identifying clinical related activities, there were striking differences (Table10) between the Institutional and Non-Institutional groups. The Non-Institu-tional physicians provided office consultation and electrocardiographic read-ing in the great majority of instances. In the partnership and group category,they also demonstrated significant frequency of services in cardiac catheteri-zation and cardiac diagnostic roentgenoiogy. The solo practitioners contributedextensively as hospital ECG readers, hospital consultants, and members ofthe hospital CCU Committee. In contrast to Non-Institutional physicians,only 55 percent of Institutionally based physicians provided office consulta-tion, and 37 percent provided office ECG interpretation. Institutional phy-sicians reported similar clinical activities irrespective of whether they werebased in a hospital or medical school. Fifty-six percent of the physiciansInstitutionally employed provided cardiac catheterization services.
Analysis of Log-Diary Data
To determine the accuracy of the initial classification questionnaire Table 11compares the estimated data with the recorded log-diary data from the samephysicians. In the physicians in Non-Institutional practice there was anunderestimation by 100 percent of the amount of time devoted to administra-tive activities and professional advancement. This was equally true forboth the Primary and Secondary Cardiologists . As a consequence the estima-tion of time devoted to direct patient care exceeded the recorded time byapproximately 6 percent. The Non-Institutionally based physician was reason-ably precise in his estimates concerning teaching with and without patients.However, he overestimated the time devoted to research which was for practi-cal purposes negligible. The Institutionally based physician grossly over-estimated the time devoted to research with patients: 15 percent for Primaryand 9 percent for Secondary as against 2 percent recorded for both. TheInstitutionally based cardiologists also overestimated the time devoted toteaching with patients: 24 percent estimated versus 13 percent recorded forthe Primary Cardiologist and 18 percent versus 9 percent for the Secondary

TA
BLE
10
PE
RC
EN
TA
GE
OF
CA
RD
IOLO
GIS
TS
BY
PR
AC
TIC
E M
OD
E:
BY
SE
LEC
TE
D T
YP
ES
OF
CA
RD
IOLO
GY
AC
T T
VM
ES
PR
AC
TIC
E M
OD
ED
istr
ibut
ion
(N)
Offi
ce C
onsu
l-O
ffice
EC
Gra
nt
T Y
IiliR
eade
r
Qr
A T
tVIT
IES
Hos
pita
lH
ospi
tal
TH
ospi
tal
Con
sulta
ntE
CG
Ree
der
CC
U C
omm
itte
Car
diac
Die
gnos
Car
diac
Got
ha-
ticX
-ray
teriz
atio
n
NO
N -
INS
Trr
uTIC
NA
L:
Sol
o
Par
tner
ship
Gro
up
2723
1081
1002
95.5
97.1
97.2
87.2
91.6
91.0
89.7
91.8
92.3
65.1
73.5
77.1
58.4
68.8
71.1
Sub
Tot
al48
0696
.289
.090
.769
.S
19.7
26.3
27.8
12.8
28.6
29.7
63.4
22.8
19.9
INS
TIT
UT
ION
AL
Hos
pita
l
Med
ical
Sch
ool
OT
HE
R
752
547
51.6
61.1
38.6
35.8
89.1
87.2
75.0
64.2
S6.
040
.8
41.1
34.6
S6.
0
55.9
Sub
Tot
al12
99S
S.6
37.4
88.3
70.S
49.7
38.2
56.0
771
71.5
TO
TA
L68
76
60.8
85.0
72.0
54.1
37.4
85.8
76.1
87.6
70.0
S9.
827
.4
41.5
inim
mi
I29
.1
Sou
rce:
2

TA
BL
E 11
CA
RD
IOL
OG
ISTS' A
CT
IVIT
Y T
IME
AS R
EPO
RT
ED
ON
CL
ASSIFIC
AT
ION
QU
EST
ION
NA
IRE
AN
D R
EC
OR
DE
D IN
LO
G-D
IAR
Y:*
AC
TIV
ITIE
S BY
SPEC
IAL
TY
AN
D T
YPE
OF PR
AC
TIC
E
Type of A
ctivity
Direct Patient C
areel;
Teaching w
ith Patients
Teaching w
ithout Patients
Research w
ith Patients
Research w
ithout Patients
11.-fessional
General A
dministration
76.6
8.3
2.1
2.4
0.4
5.3
4.9
TO
TA
L100.0
Non - Institutional
Institutional
Primary
N=
11170.9
6.6
2.4
0.2
1.4
10.1
8.4
82.575.7
5.54.0
1.31.2
0.80.2
0.10.8
4.09.3
5.88.8
27.736.9
23.613.2
7.36.8
14.82.0
11.016.0
5.913.7
9.711.4
Cr%
014
C0 I.,as
04
Va0
T. z4°
104)
0
SecondaryN
=102
Primary
N=
9700Z
go>
1ro g
0...4 0
-arn =
144 0
Di
to eo.4
0 Or
I
14CA014
0 t0
0(11
rts
0
100.0100.0
100.0100.0
100.0
SecondaryN
=54
tc;
CT
0.4
39.640.3
18.18.5
8.39.5
8.61.8
4.55.5
5.112.5
20.821.9
100.0100.0
*Com
parative differences are conservative since log-diary travel time w
as not included inpercentage calculations.

130
Cardiologist. The Primary Institutional Cardiologist underestimated the timedevoted to research without patients while the Secondary Institutional Cardi-ologitt closely estimated this activity. All groups underestimated the timedevoted to administrative and professional activities by nearly 100 percent.
The log-diary analysis (Table 12) revealed that the average working day forall cardiologists including travel was 10 hours. There was no significantdifference as to whether the individual was in Non-Institutional or Institution-al practice or had Primary or Secondary time commitment in cardiology. Thereporting of a high proportion of time (23 percent) of the Secondary Institu-tional physicians in administrative activities possibly reflects the inclusionof department chairmen, deans, and section heads in this categorization. Non-Institutional physicians devoted a considerable time to teaching with patientsand professional advancement (15 percent for the Primary and 13 percent forthe Secondary Cardiologist). Although these times were less than those ofInstitutional Cardiologists, it nevertheless represented a sizeable proportionof the Non-Institutional practitioners' investment in so-called academicaffairs . Of note again is the remarkably small proportion of time devoted toresearch with patients by Institutional Cardiologists. The greater proportionof time devoted to professional activities by the Institutional Cardiologistsprobably reflects preparation for lectures, writing papers, review of journalmaterial, etc. A sustantive proportion of the time of Primary InstitutionalCardiologists is devoted to research without patients and probably indicatesbasic science activities.
Table 13 relates to the activity of cardiologists on weekends. In the Non-Institutional subcategories, approximately 3 hours per day were expendedin direct patient care. Only in the Primary Institutional practice categorywas substantially less time spent in direct patient care (1 1/2 hours per day).Teaching with patients is also a feature of all subcategories and probablyreflected the inclusion of house officers on rounds. A noteworthy fact isthe designation of between one half and three quarters of en hour per day toprofessional advancement by all categories of cardiologists, with the greatesttime commitment indicated by the Non-Institutional Secondary Cardiologists.This reflects a significant dedication of such physicians to continued learningand professional advancement. Primary Institutional Cardiologists also con-ducted significant research without patients on weekend time.
Table 14 presents log-diary data regarding the distribution of patient en-counters by office and hospital for Non-Institutional and Institutional Primaryand Secondary Cardiologists. Using the "weighted" data it shows that theNon-Institutional Cardiologists were responsible for in excess of 95 percentof patient office encounters and 85 percent of patient hospital encounters.This demonstrates clearly the dominance of Non-Institutional based cardiol-ogists as providers of clinical care in the survey. The Primary InstitutionalCardiologist rendered significantly more care within the hospital than did theSecondary Institutional group.
133

TA
BL
E 1
2
PER
CE
NT
AG
E A
ND
DIS
TR
IBU
TIO
N O
F C
AR
DIO
LO
GIS
TS'
DA
ILY
WE
EK
DA
Y T
IME
*IN
PR
OFE
SSIO
NA
L A
CT
IVIT
IES
BY
SPE
CIA
LT
Y A
ND
PR
AC
TIC
E
NO
N-I
NST
ITU
TIO
NA
LPR
AC
TIC
EIN
STIT
UT
ION
AL
PRA
CT
ICE
,
TY
PE O
FA
CT
IVIT
YPr
imar
y(
Seco
ndar
yPr
imar
y1
Seco
ndar
yD
AIL
Y T
IME
DA
ILY
TIM
E
Min
utes
%M
inut
esM
inut
es%
M. n
utes
Dir
ect P
atie
nt C
are
409
7244
977
217
3722
238
Res
earc
h w
ith P
atie
nts
20
10
142
102
Res
earc
h w
ithou
t Pat
ient
s6
15
190
1532
6
Tea
chin
g w
ith P
atie
nts
356
224
8314
529
Tea
chin
g w
ithou
t Pat
ient
s15
36
138
660
10
Adm
inis
trat
ion
489
529
6912
132
23
Prof
essi
onal
529
519
8114
7112
Sub
Tot
al T
ime
Per
Day
-Min
utes
567
100%
586
101%
592
100%
579
100%
-Hou
rs9.
59.
89.
99.
7T
rave
l**
4947
511B
3
Tot
al T
ime
Per
Day
-Min
utes
616
633
643
642
-Hou
rs10.3
10.6
10.7
10.7
*Fiv
e da
y w
ork
wee
k.**
Tra
vel:
incl
udes
long
dis
tanc
e du
e to
lim
ited
amou
nt o
f tim
e (1
to 9
min
utes
per
day
).So
urce
: 3

TA
BL
E 1
2
PER
CE
NT
AG
E A
ND
DIS
TR
IBU
TIO
N O
F C
AR
DIO
LO
GIS
TS'
DA
ILY
WE
EK
DA
Y T
IME
*IN
PR
OFE
SSIO
NA
L A
CT
IVIT
IES
BY
SPE
CIA
LT
Y A
ND
PR
AC
TIC
E
TY
PE O
FA
CT
IVIT
Y
NO
N-I
NST
ITU
TIO
NA
LPR
AC
TIC
EIN
STIT
UT
ION
AL
PRA
CT
ICE
Prim
ary
Seco
ndar
yPr
imar
yI
Seco
ndar
yD
AIL
Y T
IME
DA
ILY
TIM
E
Min
utes
%M
inut
es%
Min
utes
%M
inut
es%
Dir
ect P
atie
nt C
are
409
7244
977
217
3722
238
Res
earc
h w
ith P
atie
nts
20
10
142
102
Res
earc
h w
ithou
t Pat
ient
s6
15
190
1532
6
Tea
chin
g w
ith P
atie
nts
356
224
8314
529
Tea
chin
g w
ithou
t Pat
ient
s15
36
138
660
10
Adm
inis
trat
ion
489
529
6912
132
23
Prof
essi
onal
529
519
8114
7112
Sub
Tot
al T
ime
Per
Day
-Min
utes
567
100%
586
101%
592
100%
579
100%
-Hou
rs9.
59.
89.
99.
7T
tave
l**
4947
5163
Tot
al T
ime
Per
Day
-Min
utes
616
633
643
642
(-H
ours
10.3
10.6
10.7
,10
.7*F
ive
day
wor
k w
eek.
**T
tave
l: in
clud
es lo
ng d
ista
nce
due
to li
mite
d am
ount
of
time
(I to
9 m
inut
espe
r da
y).
Sour
ce: 3

TA
BL
E 1
3
PER
CE
NT
AG
E A
ND
DIS
TR
IBU
TIO
N O
F C
AR
DIO
LO
GIS
TS
DA
ILY
WE
EK
EN
D T
IME
IN P
RO
FESS
ION
AL
AC
TIV
ITIE
S B
Y S
PEC
IAL
TY
AN
D P
RA
CT
ICE
TY
PE O
FA
CT
IVIT
Y
,
NO
N-I
NST
ITU
TIO
NA
LPR
AC
TIC
EIN
STIT
UT
ION
AL
PRA
CT
ICE
Prim
ary
ISe
cond
ary
Prim
ary
1Se
cond
ary
DA
ILY
TIM
ED
AIL
Y T
IME
Min
utes
%M
inut
es%
Min
utes
%M
inut
es%
Dir
ect P
atie
nt C
are
Res
earc
h w
ith P
atie
nts
Res
earc
h w
ithou
t Pat
ient
s
Tea
chin
g w
ith P
atie
nts
Tea
chin
g w
ithou
t Pat
ient
s
Adm
inis
trat
ion
Prof
essi
onal
179 1 8 25 4 23 39
64
0 3 9 1 8 14
200 2 0 19 3 25 44
68 0 0 7 1 9 15
96
1 50 20 20 21 37
39
0 20 8 8 9 15
144 6 11 11 5 28 34
60 3 5 5 2 12 14
Sub
Tot
al T
ime
Per
Day
-Min
utes
-Hou
rsT
rave
l**
279 4.
730
99%
293 4.
925
100%
245 4.
135
99%
239 4.
023
101%
Tot
al T
ime
Per
Day
-Min
utes
-Hou
rs...
.....
H30
9 5.2
5231
8 53...
5.3
280 4.
7
._
262 4.
4*W
eeke
nds:
Sat
urda
y an
d Su
nday
.**
Tra
vel:
incl
udes
long
dis
tanc
e du
e to
lim
ited
amou
nt o
f tim
e (1
to 9
min
utes
per
day
).So
urce
: 3

TA
BL
E 1
9
CA
RD
IOL
OG
IST
'S C
ON
TA
CT
S W
ITH
PA
TIE
NT
S:W
EIG
HT
ED
AN
D U
NW
EIG
HT
ED
PA
TIE
NT
EN
CO
UN
TE
RS
BY TYPE OF SETTING
BY
SPE
CIA
LT
Y A
ND
PR
AC
TIC
E
Typ
e of
Set
ting
Non
-Ins
titut
iona
lIn
stitu
tiona
l...
.A
ll
%
Prim
ary
N%
Seco
ndar
yN
%
Prim
ary
N%
Seco
ndar
yN
%
Car
diol
ogis
tsN
Off
ice
Unw
eigh
ted
3748
36.3
5334
51.7
655
6.3
590
5.7
10327
100.0
Wei
ghte
d46
1034
.581
5561
.138
02.8
218
1.6
13363
100.0
Hos
pita
l
Unw
eigh
ted
3370
38.0
2674
30.1
1743
19.6
1092
12.3
8879
100.0
Wei
ghte
d41
4542
.940
9142.4
1011
10.5
404
4.2
9651
100.0
Com
bine
d
Unw
eigh
ted
7118
37.0
8008
41.7
2398
12.5
1682
8.8
1920
610
0.0
Wei
ghte
d87
5538
.112
251
53.2
1391
6.0
622
2.7
23014
100.0
i
Sour
ce: 3

135
Table IS indicates by category the site and referral pattern and cardiac andnon-cardiac encounters. In the relative percentage of referrals and PrimaryCardiac encounters, the Primary Institutional Cardiologist differed from hisNon-Institutional colleagues, in that he accounted for 12.9 percent of refer-rals and only 3 percent of patients originated from his own practice. Non-Institutional Primary Cardiologists representing, 37.5 percent of all cardiolo-gists, reported 34.3 percent of patients from his own practice and 45.4 per-cent of the referral patients. Corresponding values for the Secondary Non-Institutional Cardiologist (40.6 percent of all cardiologists) were 60.6 and37.3 percent.
Table 16 examines the age categories of patients seen by practicing cardiolo-gists. The number and percentage of encounters are related to the nationalpopulation distribution as of 1970, in the right column. In this survey, adisproportionately small number of patients between the ages of 0 and 35 areseen by cardiologists. Between the ages of 35 and 44, patients were seenby these physicians in proportion to their prevalence in the 1970 population.Above 45 years there is a rapid increase in the numbers of patients seen bycardiologists. Thus, patient encounters above the age of 65 amounted to 33percent of all office encounters in an office setting, and 42 percent of thosein a hospital setting as compared to the prevalence in the population of thisage category of approximately 10 percent.
Table 17 from the diary report confirms certain substantive differences betweenpractice activities. Of considerable significance is the overall allocation oftime of the Non-Institutional practitioner (74 percent) devoted to patient care,while approximately 39 percent of the activity of Institutional practitionerswas so allocated. Only in the category of laboratory and diagnostic testing -reflecting cardiac catheterization and coronary arteriography - do PrimaryInstitutional practitioners provide a greater level of participation in patientcare than Non-Institutional practitioners. Little or no research was conductedby the Non - Institutional practitioner, but a substantive amount of teachingwith patients which amounted to about 50 percent of the time devoted to thisactivity by the Institutional practitioner was so reported. With the exceptionof the Secondary Institutional practioner (presumably department heads, deansetc.) who devoted 22 percent of his time to administration, all categorieshad a similar distribution of administrative time (about 10 percent).
The distribution of cardiac problems in office and hospital settings is shownin Table 18. The category "none" includes patients with another prim".rymedical diagnosis or in some cases those patients referred for anethesiacheck, evaluation of innocent murmurs and for cardiac catheterization and foundto he normal (some of these will be listed under "none"). The cardiac problemsmost frequently encountered in the office were coronary atherosclerosis with-out acute myocardial infarction, hypertension with chronic heart failure, acutemyocardial infarction, arrhythmias and a wide variety of other cardiac andvascular abnorih tlities. Except for the anticipated higher prevalence of acutemyocardial infarction and severe heart failure, a similar pattern was seen in
128

136
TABLE 15
CARDIOLOGISTS' PATIENT DISTRIBUTION:PRACTICE CHARACTERISTICS PERCENT DISTRIBUTION BY SPECIALTY AND PRACTICE
Practice and PatientCharacteristics
Non-Institutional InstitutionalAUPrimary Secondary Primary Secondary
Percent of Cardiologists 37.6 40.7 16.2 5.5 100.0
Percent of Patient EncountersOffice 34.S 61.1 2.8 1.6 100.0Hospital 42.9 42.4 10.5 4.2 100.0Combined 38.1 53.2 6.0 2.7 100.0
Percent of PatientsOffice 35.5 60.1 2.7 1.7 100.0Hospital 41.7 39.9 13.2 5.2 100.0Combined 37,3 54.1 5.8 2.7 100.0
Percent of Patients withinOwn Practice
Office 32.1 64.5 1.9 1.6 100.0Hospital 38.9 S2.4 5.5 3.2 100.0Combined 34.3 60.6 3.0 2.1 100.0
Percent of Patients-ReferralOffice 42.2 48.6 7.2 2.0 100.0Hospital 47.1 31.2 16.1 5.6 100.0Combined 45.4 37.3 12.9 4.3 100.0
Percent of Primary CardiacEncounters
Office r 5 49.4 4.7 1.4 100.0Hospital 4:...d 32.5 13.8 3.9 100.0Combined
lucent of Primary
47.0 41.5 9.0 2.6 100.0
Non-Cardiac EncpuDte;sOffice 26.2 70.6 1.3 1.9 100.0Hospital 36.6 52.2 6.4 4.7 100.0Combined 301.1 63.8 3.2 2.9 100.0
Source: 3
139

137
TABLE 16
CARDIOLOGISTS' PATENTS: AGE CROUPSBY TYPE OF SETTING COMPARED TO NATIONAL AGE
GROUPED NORMS
AGE GROUPS(in years)
OFFICE HOSPITAL COMBINED NATIONAL NORMS (1970)
% % % % N
4 and Under 0.6 0.6 0.6 8.4 17,119,245
5 through 14 1.8 1.3 1.6 20.1 40,892,234
15 through 24 8.2 4.8 7.2 17.4 35,302,039
25 through 34 7.7 4.9 6.9 12.2 24,845,947
35 through 44 10.8 9.9 10.5 11.4 23,132,821
45 through 54 17.8 15.6 17.2 11.4 23,158,493
55 through 64 20.0 20.7 20.2 9.2 18,660,224
65 through 74 20.8 24.1 21.8 6.1 12,439,678
75 through 84 10.4 14.5 11.6 3.8 7,662,196
85 and Over 1.9 3.6 2.4 *
TOTAL 100.0 100.0 100.0 100.0 203,212,877.1...
'National Norms: U.S. Bureau of the CensusCensus of Population 1970General Social and Economic CharacteristicsFinal Report PC (1)-C1 United States Summary
*Census categories group all who are 75 and over.
Source: 3
140

TA
BL
E 1
7
CA
TE
GO
RIE
S O
F C
AR
DIO
LO
GIS
TS'
AV
ER
AG
E D
AIL
Y A
CT
IVIT
Y T
IME
:T
YPE
OF
AC
TIV
ITY
BY
SPE
CIA
LT
Y A
ND
PR
AC
TIC
E
Typ
e of
Act
ivity
.
Non
-Ins
titut
iona
lIn
stitu
tiona
l
......
......
...1.
All
Car
diol
ogis
ts*
Prim
ary
Seco
ndar
yPr
imar
ySe
cond
ary
% o
fT
ime
Hou
rs%
of
Tim
e'H
ours
% o
fT
ime
Hou
rs%
of
Tim
eH
ours
% o
fT
ime
Hou
rsI
4.
DIR
EC
T P
AT
IEN
T C
AR
EU
nspe
cifi
ed1.
85.
01.
64.
23.
1H
ospi
tal
23.7
21.0
15.3
15.0
20.9
Off
ice
30.3
36.7
3.2
6.7
27.2
Non
-sch
edul
ed, E
mer
genc
y1.
82.
10.
81.
61.
8L
ab a
nd D
iagn
ostic
Tes
ts5.
43.
89.
04.
75.
3E
xten
ded
Car
e Fa
cilit
ies
0.4
1.0
0.0
1.8
0.6
Patie
nt R
ecor
ds, C
hart
s7.
56.
17.
06.
36.
7Su
btot
al70
.95.
975
.76.
636
.93.
140
.33.
465
.65.
6T
EA
CH
ING
With
Pat
ient
s6.
64.
013
.28.
56.
7W
ithou
t Pat
ient
s2.
41.
26.
89.
53.
0Su
btot
al9.
00.
85.
20.
520
.01.
718
.01.
59.
70.
8R
ESE
AR
CH
With
Pat
ient
s0.
20.
22.
01.
80.
6W
ithou
t Pat
ient
s1.
40.
816
.05.
53.
9Su
btot
al1.
60.
11.
00.
118
.01.
57.
30,
64.
50.
4PR
OFE
SSIO
NA
L10
.10.
89.
30.
813
.71.
212
.51.
110
.40.
9G
EN
ER
AL
AD
MIN
IST
RA
TIO
N8.
40.
78.
80.
811
.41.
021
.91.
99.
80.
8
TO
TA
L10
0.0
8.3
100.
08.
810
0.0
8.5
100.
08.
511
00.0
8.5
4....
......
....,
.
*Per
cent
ages
bas
ed o
n w
eigh
ted
freq
uenc
ies,
adj
uste
dto
the
prop
ortio
n of
all
card
iolo
gist
s th
at e
ach
card
iolo
gist
type
rep
rese
nts.
Souc
e: 3

139TABLE 18
CARDIOLOGISTS' PATIENTS WITH PRIMARY CARDIAC DIAGNOSES:RANK ORDERED PERCENTAGE OF OCCURRENCE
BY TYPE OF SETTING
Primary Cardiac Diagnosis
Type of Setting
Office Hospital Combined% %
Percent of Total 70.2 29.8 100.0
Coronary Atherosclerosis without InfarctionHypertensionAcute Myocardial InfarctionHeart Failure: Chronic, SevereNoneRheumaticArrhythmiaCerebral Vascular DiseasePeripheral Vascular DiseaseHeart Failure: Acute, SevereOtherPulmonary EmbolismPsychosomatic (Cardiac)Post Cardiac SurgeryCongenitalCardiomyopathyPacemaker EvaluationPericardial DiseaseInfectious
29.326.54.97.07.15.03.93.03.01.31.90.81.71.21.31.20.60.30.0
19.99.1
18.110,23.85.24.54.13.36.22.23.11.32.51.81.91.31.20.3
26.120.79.48.15.85.14.13.43.12.92.01.61.61.61.51.40.90.60.1
Total 100.0 100.0 100.0
Source: 3
142

140
the hospital. Extremely few encounters were reported relative to activitiessuch as pacemaker evaluation (0.6 - 1.3 percent). A small but significantprevalence (1.5 percent) of congenital heart disease was reported by thesephysicians. This is summarized in Figure 1. It was to be expected that theproportion of acute myocardial infarction and scut'* severe cardiac failure seenin the hospital exceeded that seen in the office by a factor of four. On thecontrary, the prevalence of hypertension identified as a problem in office set-ting was twice that of its prevalence in the hospital. Figure 2 presents thepercent of non-cardiac diagnoses for all cardiologists. The distribution is asmight be anticipated.
The choice of cardiac diagnostic and therapeutic modalities according topatient diagnosis is indicated in Table 19. There was a significantly greateruse of non-invasive procedures , cardiac catheterization and evaluation forcardiac surgery in the hospital than in the office. A high percentage of patientswith congenital heart disease, rheumatic heart disease, cardiomyopathy andinfection (presumably bacterial-endocarditis) were considered for cardiaccatheterization. A relatively small percentage of patients with coronary ath-erosclerosis were so referred. Evaluation for cardiac surgery was recommendedin patients with congenital heart disease, "infections" and rheumatic diseasePi a high proportion of instances. Evaluation of cardiovascular surgery in anoffice or hospital setting was undertaken for a very small proportion of patientswith coronary atherosclerosis.
Table 20 shows those diagnostic tests and procedures recommended by dif-ferent categories of physicians. Vectorcardiography, phoncardiography, andnon-invasion techniques as well as right or left heart catheterization withor without angiography were utilized dominantly by Institutional Primary Car -diologis is ,
Figure 3 indicates the allocation of time by the cardiologist to the patient inthe office and hospital. The physician averaged between 6 and 15 minutes tovisit both the office and hospitalized patient. A second peak of time distri-bution between 26 and 30 minutes for both the office and hospital patient may inindicate the average duration of first visits. Only in a very small proportionof instances did the duration of physician-patient contact exceed 60 minutes,in either the hospital or office setting.
SUMMARY AND RECOMMENDATIONS
As expected, this study has shown that many older cardiologists who obtain-ed training prior to the extensive use of cardiac catheterization and cardio-vascular surgery are using their valuable professional skills in clinical diag-nosis, electrocardiography, the management of arrhythmias and the drugtherapy of heart disease. On the other hand, younger physicians who arerecent graduates of contemporary training programs, are utilizing strikinglydifferent techniques and hence contribute through a different form of practice,.

FIGURE I
CARDIOLOGIST'S PATIENTS WITH PRIMARY CARDIAC DIAGNOSIS
PrimaryCardiac Diagnosis
0
Coronary AtherosclerosisWithout Infarction
Hypertension
Acute Myocardial Infarction
Heart Failure Chronic, Severe
None
Rheumatic
Arrhythmia
Cerebral Vascular Disease
Peripheral Vascular Disease
Heart Failure: Acute, Severe
Other
Pulmonary Embolism
Psychosomatic (Cardiac)
Post Cardiac Surgery
Congenital
Cardiomyopathy
Pacemaker Evaluation
Pericardial Disease
Infectious
Source: 3
141
Percent Of Al ICardiac Diagnoses
1 2 3 4 5 6 7 8 9 10 20 25 30I I I
26.1
20.7
4........;::::Sy.... ::: v.* .
ti 8.1
*?::A::*?,..wamo4 4.1
w.ttk. 3.4
tomm,wm 3 1WMwMd4tk;OJw0e.Ds
-25=31M..
2.0
mrsii 1.6mead 1.6
,IWa:71 1.6
1.5
0.9
0.6
0.1
2.9
144
5.1
5.8
9.4

FIG
UR
E 2
CA
RD
IOLO
GIS
TS
' PA
TE
NT
S W
ITH
PR
IMA
RY
NO
N-C
AR
DIA
CD
IAG
NO
SIS
Prim
ary
Non
-C
ardi
acD
iagn
osis
Res
pira
tory
Gas
troi
ntes
tinal
Mus
culo
siel
etal
Che
ck-u
p
End
ocrin
e
Psy
chia
tric
Non
e
Neu
rolo
gica
l
Oth
er
Gen
itour
inar
y
E E
NT
Der
mat
olog
ical
Obs
tetr
ics/
Gyn
acol
ogy
Ren
al
Hem
ic a
nd L
ymph
atic
Per
cent
Of
Non
-Car
diac
Dia
gnos
esI
36
78
91.
0 12 1,3
114
01
34
5
::::::
::::K
::::::
::::::
::::::
::::::
::::::
::::::
::::::
::::::
::::::
**::*
::::::
::j 1
3.8
::::..
:.:.:.
:.:.:.
:.:.:.
:.:.:.
:.:.:.
.:::;:
::::::
::::::
::::::
::::::
:::j 9
.4

TA
BL
E 19
ALL CARDIOLOGISTS:
PERCENTAGE
OP
CH
OIC
E or
SELECTED DISPOSITIONS
Obd
APPLIED TO PATIENTS WITH PRIMARY CARDIAC DIAGNOSE
Disposition or Tama !sant
Prim
ary Cardiac D
iagnosis (Percent R
eceiving Trestm
eig for each Diagnosis C
ondition)
Type
23I
ifVs
SiS
sz s
Ias
. o2
V
I8
S
es
ZE
-a
>
SIPrescribed
Drugs
Ordered Routine
Lab Tests
Ordered
ECG
Ordered Other
Non -Invasive
C; C
;Studies
Ordered Catheter-
ization Test
Evaluation
forCardiovascular
Surgery
Evaluation for
Other S
urgery
OH0H0HOH0H0H0H
76.0
66.4
32.6
39.7
25.7
27.7
2.8
6.1
1.3
4.9
0.8
3.3
0.51.1
64.183.7
75.7
66.9
67.9
76.7
83.6
71.4
47.9
83.6
83.7
83.1
72.0
62.6
36.7
59.1
72.3
57.4
66.8
61.6
52.1
27.9
35.7
37.0
27.3
24.6
31.2
32.7
38.1
36.0
31.8
52.4
51.0
47.8
48.2
36.2
30.7
34.3
42.0
32.0
27.0
38.7
32.4
26.1
44.7
27.2
19.2
28.4
19.2
29.9
48.4
47.9
35.2
33.4
37.7
29.6
16.1
25.2
19.6
24.5
30.0
33.2
6.7
5.4
2.1
1.5
6.6
3.1
1.0
5.4
13.8
2.9
5.2
6.7
2.7
8.5
14.3
6.2
4.5
10.7
19.7
6.3
1.8
0.5
1.7
3.9
2.2
0.2
3.0
2.9
2.3
3.1
1.6
7.4
8.8
6.9
0.5
13.8
17.2
1.9
13.4
1.8
0.3
0.6
4111,4111,
1.4
2.6
0.3
1.5
3.5
1.1
0.4
3.5
1.5
14.9
2.S
3.9
13.4
0.9
0.3
1.0
0.6
0.4
1.3
2.6
1.9
1.2
0.81.1
1.0
Office
Patients
Nwa976:
Percent with
Specific Diagnosis
Hospital Patients
Nw=2636:
Percent w
ithS
pecificDiagnosis
1.3
7.0
4.9
0.8
0.3
29.3
26.5
5.0
1.2
3.9
6.2
10.2
18.1
3.1
1.2
19.9
9.1
S.2
1.9
4.5
0.3
71.2
82.8
71.0
S2.4
41.7
32.6
60.S
68.6
59.9
68.3
34.0
26.2
25.5
40.8
36.1
32.2
27.3
30.4
41.8
35.7
30.7
38.6
15.4
32.0
11.0
12.6
42.9
21.2
56.5
40.3
11.3
16.2
44.3
17.1
27.5
22.8
1.0
1.7
4.0
4.8
3.7
9.7
6.0
2.6
12.S
1.8
7.8
19.2
1.9
0.6
5.8
9.1
6.2
2.S
4.5
4.6
6.2
26.9
2.4
2.4
3.9
S.9
0.S
3.2
6.8
15.1
2:4
2.0
1.71.1
6.1
3.0
3.0
1.7
1.2
0.6
1.3
3.3
4.1
1.3
2.5
1.3
1.8
insufficient Data
" 'Type of Searing':
Ociffic: Hhospital.
Nw
indicates weighted frequency counts, adjusted to the proportion
of ell cardiologists then each cardiologist type represents.
Source: 3

144
TABLE 20
CARDIOLOGISTS' UTILIZATION OF CARDIACDIAGNOSTIC TESTS AND PROCEDURES
PERCENT OF USE BY SPECIALTY AND PRACTICE
Non-Institutional InstitutionalAllType of Test Primary econdary Primary Secondary
Electrocardiogram 78.4 75.5 77.2 77.4 77.1
Vectorcardlogram 1.1 0.9 8.8 0.2 2.0
Phonocardiogram 2.2 0.4 5.5 0.5 1.8
Non-Invasive Techniques 1.8 0.2 5.9 0.4 1.6
Exercise Testing 3.8 4.0 5.2 1.6 3.9
Cardiac Fluoroscopy 3.0 2.4 5.4 0.4 2.8
Chest X-ray 18.9 28.3 15.5 17.6 2*/ .2
R or L Heart Catheterization 0.5 0.7 3.3 0.3 0.9
R or L Heart Catheterizationwith Angiogram 1.4 0.4 9.3 2.0 1.9
Flotation Catheterization - - 0.5 0.1 -
Selective CoronaryArteriogram 1.2 0.4 6.2 0.5 1.4
Pulmonary Angiogram 0.1 - 1.1 0.5 0.1
Non-Coronary Arteriogram 0.3 - 0.7 0.8 0.2
HIS Bundle Recording 0.1 - 1.2 - 0.1
Pacemaker Insertion 0.6 - 1.3 0.2 0.4
Pacemaker Evaluation 0.7 0.1 1.5 0.4 0.5
Other 2.8 3.6 2.3 10.1 3.7
Routine Lab Tests 12.2 20.1 3.2 7.4 14.1
Source: 3 147
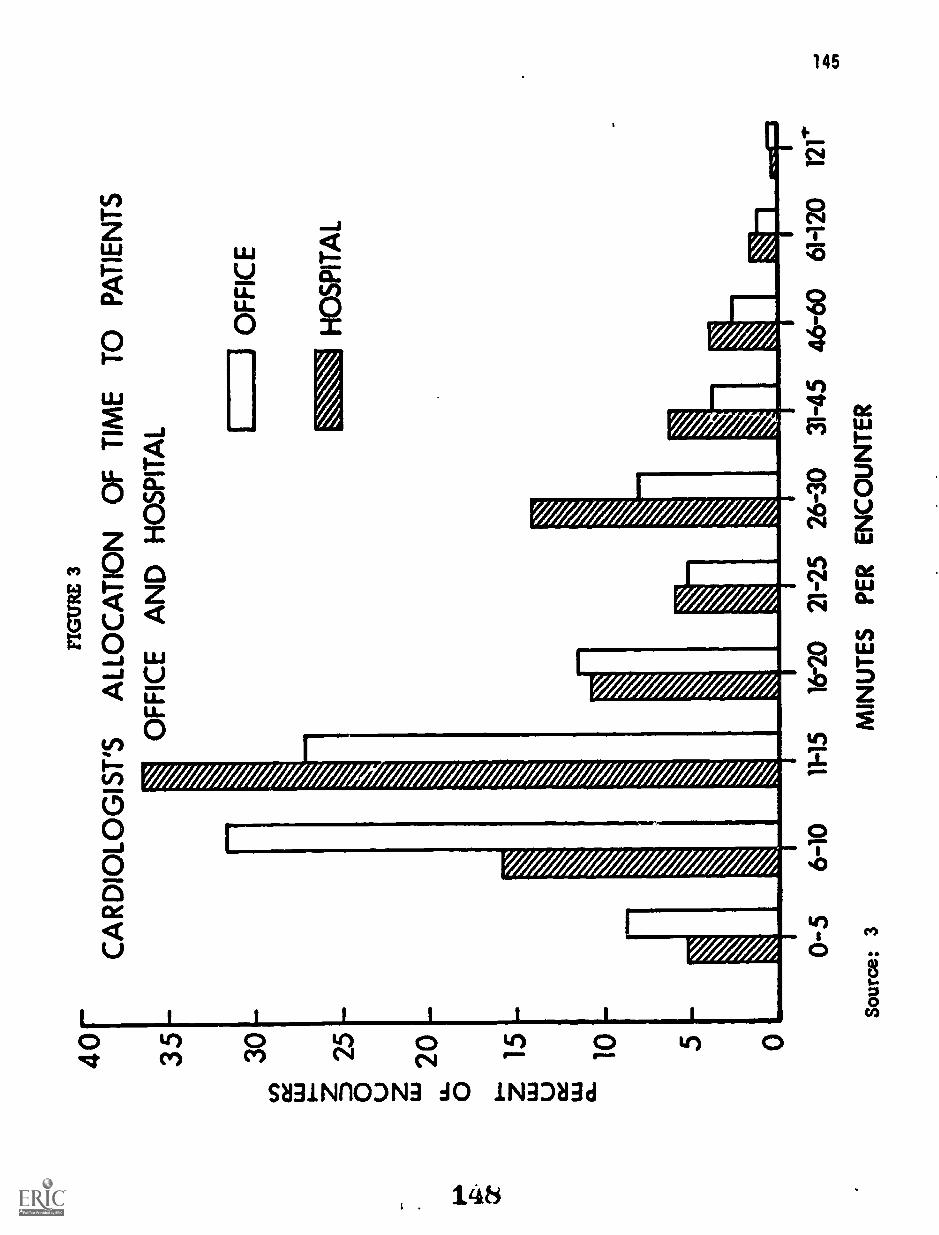
40 35 30tf) LL
J
25
0 I"20
0 z ;15
U cc 'Li
10
FIG
UR
E 3
CA
RD
IOLO
GIS
T'S
ALL
OC
AT
ION
OF
TIM
E T
O P
AT
IEN
TS
OF
FIC
E A
ND
HO
SP
ITA
L
OF
FIC
E
HO
SP
ITA
L
0-5
6-10
11-1
516
-20
21-2
526
-30
31-4
546
-60
6H20
12
Sour
ce: 3
MIN
UT
ES
PE
R E
NC
OU
NT
ER

146
Four general types of profiles of cardiologists were identified on the basisof types of activity. Clearly, specific activities extended from one categoryto another, but the general activities appeared to differ to a degree sufficientto justify separation. These four divisions of cardiologists described by thesurvey can perhaps be identified by more appropriate terms than Institutionalor Non - institutional, Primary or Secondary. Thus, the group of Non-Institu-tional Primary Cardiologists may be looked upon as Clinical Cardiololists,while the Secondary Non-Institutional Cardiologist is usually the Xnternist-Carlliolmist. The Institutional Primary Cardiologists devoting more than 50percent of their time to problems of cardiovascular disease would likely in-clude a substantive number of Cardiac Specialipts while the InstitutionalSecondary Cardiologists might include both the Academic Cardiologist andthose physicians conveniently collected under "other" who might have aninfrequent occupation, for example, cardiac rehabilitation. A brief concep-tual description based upon the data of this study of functions and activitiesof these four categories of cardiologists follows.
Internist-Q22ELL.diI i t,. This physician usually functions as a aolopractitioner or may be associated with a small group. In larger grouppractices (greater than 20 members) this physician may see the majorityof patients with signigicant problems of cardiovascular medicine withina department of internal medicine. However, he is usually private-officebased and may be in the older age bracket, He sees a wide variety ofboth selected and non-selected cardiovascular problems either as aprimary care physician or as a referral physician in his community. Hewill usually perform and interpret his own electrocardiograms and mayserve in an electrocardiographic laboratory as an interpreter of records.He will be knowledgeable of and have access to other laboratory pro-cedures in cardiovascular disease but will rely on others to perfrom them.He will provide general internal medical and cardiac care for most of hisown patients in the hospital and may rely on other cardiac specialistsfor support in more complex diagnostic procedures such as cardiaccatheterization, and in the management of serious and critical cardio-vascular disease or arrhythmias. He is not involved in research but hemay be involved in teaching medical students, house officers, and nurses.He is Board eligible in Intrrnal Medicine and may be Board certified.
Clinical Cardiologist. This physician performs many of the functionsof the Internist-Cardiologist but applies more of his time to specialproblems of cardiovascular disease. He is primarily office based butmay have substantive hospital responsibilities. He is usually in soloor small group practice but may be en important physician in a salariedinstitutional setting. In the latter circumstance he will maintain asimilar practice pattern seeing a substantive number of referred cardiacoutpatients. He will spend more time than the Internist-Cardiologistin consultation on cardiovascular problems in one or more communityhospitals. He will participate in the hospital ECG Department as aninterpreter of ronnrds and frequently as the chief 'f the heart station.
149

147
He will participate in a coronary care unit and may function as ohs enof the coronary care unit committee for his community ho e willdo little or no research but may report interesting clinical phenomena tomeetings of the hospital staff. He will have more hospital teachingresponsibilities for nurses, house officers, and medical students thanthe internist. He may have an association on a part-time basis witha teaching hospital and may hold clinical faculty rank. He may be com-pensated on a part-time or fee-for-service basis by a community hospitalor other institution. This type of physician will usually be Board Certifiedin Internal Medicine and will have had some specialty training in generalcardiology with particular emphasis on electrocardiographic interpretationand intensive coronary care. Many of the younger Clinical Cardiologistswill have acquired skills in cardiac catheterization and coronary angio-graphy during their training and may serve on catheterization teams inteaching hospitals. These special skills are not necessary, however,for the clinical cardiologist although he should know indications forthese procedures and how to interpret the data. It is probably that in thefuture more and more clinical cardiologists will utilize newer non-inva-sive diagnostic techniques.
The above two groups of cardiologists, both predominantly based in solo or smallgroup Non-Institutional practice, care for 80 percent of cardiology patientsseen by physicians who identify themselves as having special interests orskills in cardiovascular disease. However, this patient population accountsfor an unknown but probably small portion of all patients suffering from dis-eases of the heart and blood vessels. It is assumed that the primary care ofsuch patients is accomplished by internists or family practitioners.
giausagoka. The Cardiac Specialist is generally younger and aproduct of more formal training programs developed in the middle to late1950's and subsequently. He will usually be Certified in Internal Medi-cine and in the Subspecialty of Cardiovascular Disease. At the presenttime he frequently is concerned with activities in cardiology usuallyrequiring special skills or expertise. In addition, he will frequentlysee patients with cardiovascular disease in consultation, may provideprimary care to a small group of patients with cardiovascular diseaseor other internal medicine problems. This physician will be trained andcompetent in cardiac catheterization and frequently in coronary arterio-graphy. He will be capable and familiar with modern non-invasivetechniques. He will have a greater knowledge and competency in morespecialized cardiovascular areas, that is the management of hypertension,valvular heart disease, cardiac arrhythmias, acute myocardial infarction,selection of patients for cardiovascular surgery and frequently will havesome knowledge of congenital heart disease. He also will be an interpre-ter of electrocardiograms, phonocardiograms , echocardiograms, etc. Hemay be chief of the heart stations, director of the cardiac catheterizationlaboratory or director of a coronary care unit. Although he providesclinical consultation, much of his practice and his value to community
150

148
practice is based upon the special skills with which training in the morerecent past has provided him. The Cardiac Specialist will be competentin the conduct of clinical investigation although it is unusual for him tohave highly developed skills or motivation. He will be engaged in inves-tigation related directly to the disease state of patients who come underhis care. He will contribute to the medical literature in this respectwith clinical descriptions of unusual cardiovascular disease. He willreport the results of special procedures and tests in interesting or un-usual clinical circumstances. It is only rarely that he will conduct basiclaboratory investigations. He will be actively involved ir the teachingof medical students, house officers, and nurses. He will be capable ofwriting modern guidelines for optimal care of cardiac patients in hiscommunity hospital and in the promulgation of such information to thecommunity at large. He will usually be Institutionally based but maycombine this with an office practice within or outside of the institution.He will usually be salaried by the institution but a wide variety offinancial arrangements for compensation will exist. His patients areusually physician-referred, often from internists, Internist-Cardiologistsor Clinical Cardiologists. This physician is younger than those in Non-Institutional practice by virtue of the recent expansion of technology inthe field of cardiology.
Academic Cardiologist. The Academic Cardiologist is not definable with-in a single profile but is an individual who may devote his time to severalimportant categories of activity. He will not spend the majority of histime in direct patient care. It is usual, however, for his responsibilitiesto be divided between teaching in a clinical setting, research in a clinicalor basic setting, administration and clinical care in that order of relativeeffort. The background of the Academic Cardiologist usually involvescertification in internP1 medicine and frequently in cardiovascular dis-eases. His training has involved cardiac catheterization as well aselectrocardiography and clinical cardiology. He has usually devoted1-2 years to cardiovascular research, frequently in the basic scienceareas. The age of such individuals is similar to the Clinical Cardiologist -older than the cardiac specialist and younger than the Internist-Cardiolo-gist. He is institutionally based and usually institutionally compensated.He will frequently be director of professional programs and perhaps of apatient service area such as a heart station.
The above four categories describe in a general way the present activitiesof adult cardiologists and hence serve to define a distribution of physicianskills. Clearly they do not represent a rigid categorization either of specificprofessional skills or personal professional arrangements. Consideration ofthe data may allow prediction of training needs and geographic distribution.
Recommendations regarding the content and type of training for the various cate-gories of cardiologists are found in Chapters Five and Six. Those pertaining tothe numbers required in each category are found in Chapter Seven.
151
149
CHAPTER 5
TRAINING PROGRAMS IN CARDIOLOGY
Noble 0. Fowler, Herbert N. Hultgren, and Henry D. McIntosh
INTRODUCTION
A major objective of this study was to identify and doscrilx: in some detail thenumber, distribution, content, quality, duration, faculty, facilities and certainother aspects of training programs in cardiology in the United States today.Such information, as well as number of trainees positions available, filled andpotential for expansion was unknown prior to the study, but it seemed essentialin considering the manpower needs in cardiology.
Training Programs were defined as full-time cardiovascular training programs ofat least one year's duration. This definition was developed during the studywhen it became apparent that there were no listings of cardiovascular diseasetraining programs. The source listing for training programs was provided bythe American Medical Association and consisted of approximately 500 insti-tutions in the United States with approved residencies in lnteri:ue,_..dicine.This study included 329 institutions involved in cardiovascular diseasetraining.
NUMBER AND DISTRIBUTION OF TRAINING PROGRAMS
There were 534 institutions and organizations either responsible for or con-ducting internal medicine training programs at the beginning of 1973. Ofthese, 329 offered at least one year of training in cardiology, with Viemajority (73 percent) providing training of two years duration.
The data in this report are based on the returns of a questionnaire from directorsof 190 of the 329 programs who responded to the questionnaire. All estimationshave been projected for the 329 programs with the assumption that the non-responding programs were similar to the programs responding to the question-naire. The validity of this assumption is discussed in the section on methods(Chapter 2). The number of training programs in non-approved hospitals isprobably small and was excluded from this report.
Figure 1 shows the geographical distribution of the 329 training programs incardiology by state, census division and region. As might be expected, thetraining programs were most numerous in the areas of high population density.
Table 1 shows the total number of trainees in the 329 programs for the years1970-1973. In addition, Table 1 shows the average number of trainees perprogram by year with an estimate of the number of trainees completing thetraining each year. It is obvious that theomber for each variable has increased
t.).

FIG
UR
E I
DIS
TR
IBU
TIO
N O
F C
AR
DIO
VA
SCU
LA
R T
RA
ININ
G P
RO
GR
AM
S
...a
Mid
dle
Atla
ntic
N=
9I
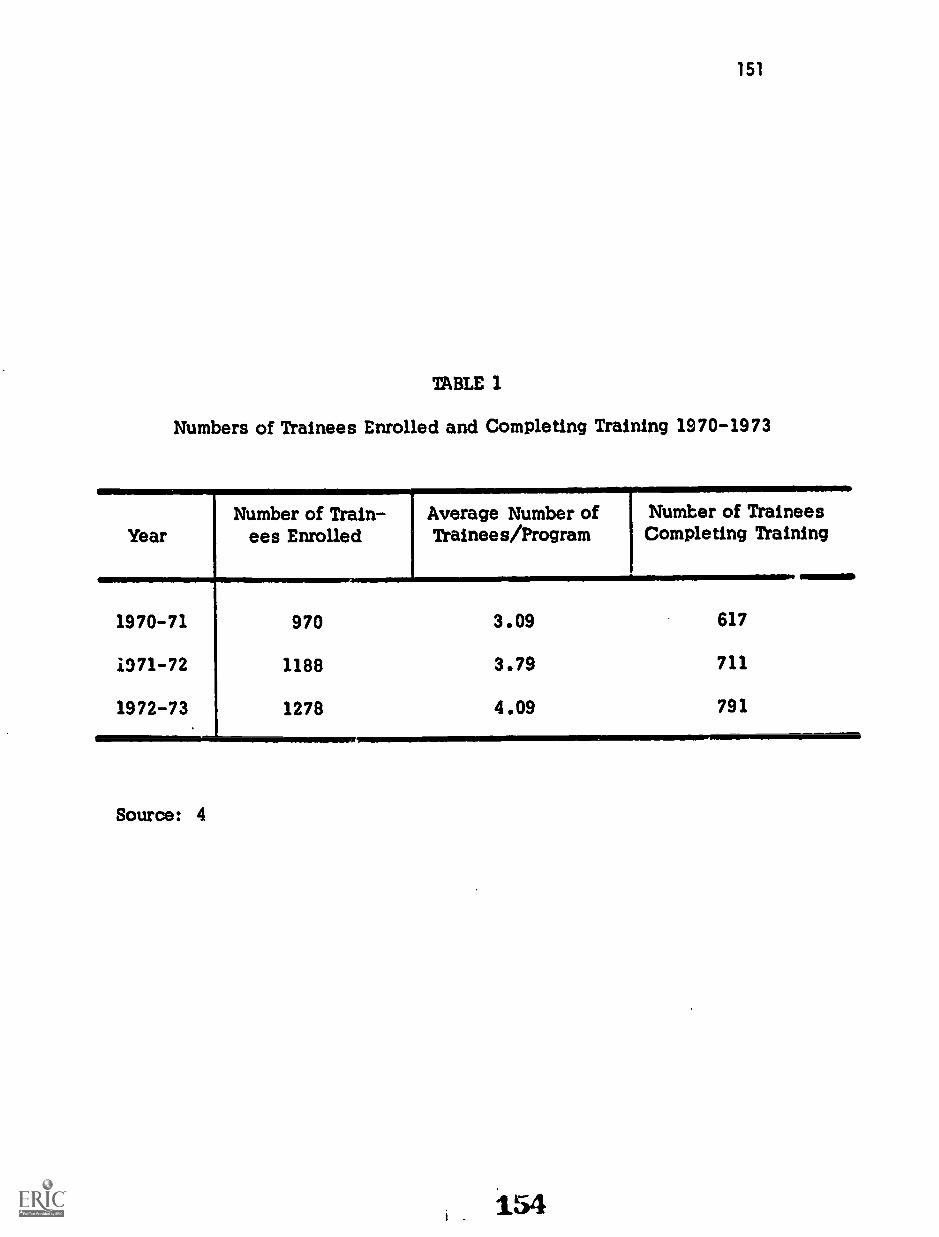
151
TABLE 1
Numbers of Trainees Enrolled and Completing Training 1970-1973
YearNumber of Train-
ees EnrolledAverage Number ofTrainees/Program
Number of TraineesCompleting Training
1970-71 970 3.09 617
071-72 1188 3.79 711
1972-73 1278 4.09 791
Source: 4
154

152
over the past three years and that we can anticipate having about 800 individualscomplete their training each year. The actual number may be somewhat largerdue to trainees completing programs in non-approved hospitals and trainees whotake their final year of training in positions outside of a cardiology programsuch as a final year of medical residency or an instructorship.
It is of interest to note that cardiologists tend to practice in areas close towhere they were trained. This is shown in Figures 2 and 3. They may haveselected their training program based on an area where they plan to practice .Either selection before initiating training or during training seems to have theeffect of locating the majority of cardiologists.
Candidates who are seeking certification in the subspecialty of cardiovasculardisease have increased over the past four years as evidenced by the numberstaking the oral and written examination. Data obtained from the SubspecialtyBoard on Cardiovascular Disease indicate consistent increases from 1969thraugh 1972 as follows:
Oral Examinations in 1969 for 84 candidates with 64 certifiedOral Examinations in 1970 for 126 candidates with 92 certifiedOral Examinations in 1971 for 135 candidates with 119 certified
Written Examinations in 1972 for 543 candidates with 431 passingthe examination.
CONTENT AND DURATION OF TRAINING
Considerable variability was found in the content of the various cardiologytraining programs surveyed. Some of the variability was due to whether theprogram offered was of one or two years duration. At the present time, it isnot known to what extent the different programs can and are able to meet thehigh standards of training experience recommended by the Subspecialty Boardin Cardiovascular Disease. The detailed recommendations of this Board appearin Chapter 8, page 293. Major elements of their recommendation include: ac-quisition of clinical skills used in diagnosis, mastery of laboratory techniques,instruction and experience in management of various types of heart disease,and opportunity for research. They stress the importance of a certain coreexperience provided in sufficient depth and with sufficient emphasis onscholarship, self-instruction and development of critical judgement, so thatthe trainee-product of the program will not become dated after he has enteredhis chosen profession.
As shown in Table 2, most of the trainees entering cardiology training programshave had two years of post-M.D. training prior to entering the program. Forty-nine percent of the programs required two years, and 46 percent required threeyears. Thus, less than half of the entering trainees (46 percent) have fulfilled
155

FIG
UR
E 2
NA
TIO
NA
L Z
IP C
OD
E A
RE
AS
PRO
POR
TIO
N O
F C
AR
DIO
LO
GIS
TS
WIT
H F
EL
LO
WSH
IP T
RA
ININ
GPR
AC
TIC
ING
IN
AR
EA
WH
ER
E T
RA
INE
D(d
efin
ed b
y na
tiona
l zip
cod
e ar
ea b
ound
arie
s)
Sour
ce: 4

FIG
UR
E 3
NA
TIO
NA
L Z
IP C
OD
E A
RE
AS
PRO
POR
TIO
N O
F C
AR
DIO
LO
GIS
TS
PRA
CT
ICIN
GIN
AR
EA
WH
ER
E L
AST
TR
AIN
ED
(def
ined
by
natio
nal z
ip c
ode
area
bou
ndar
ies)
Sour
ce: 4

155
TABLE 2
MINIMUM REQUIRED YEARS OF POST-MD TRAINING:PERCENTAGE DISTRIBUTION BY NUMBER OF YEARS AND
THREE TYPES OF TRAINING I1STSTITUTIONS1
Numberof Years
.
AllPrograms
Type IPrograms
Type IIPrograms
Type IIIPrograms
N=190 N=50 N=91 N=49
% % % S
No Answer 1.1 2.0 0.0 2.0
One 1.6 2.0 2.2 0.0
Two 48.9 56.0 48.2 42.9
Three 45.8 36.0 36.2 55.1
Over Three 2.6 4.0 3.3 0.0
AI.
1Vaining institutions categorized based on number of internal medicineresidencies: Type I = 1 to 15; Type II = 16 to 41; Type III = 42 and over.
Source: 4
158

156
the requirements for Board Certification in Internal Medicine before beginningtheir cardiovascular disease training.
The time spent by trainees in cardiology training programs varies, in part,depending upon the career objectives of the trainee. A minimum of two yearsof training in cardiology is required for Subspecialty Board Certification inCardiovascular Disease. Approximately 73 percent of the training programsprovide two-years assuming they will train their candidates to the level ofSubspecialty Board requirements. The average number of hours offered or:squired by broad categories in the two-year programs are shown in Table 3.
According to estimates made by cardiology training program directors, themajority of their trainees received sufficient training to perform adequatelyin most areas. There are differences in skills acquired according to whetherthe training is for one year or for two years. Table 4 indicates the percentageof program directors who indicated their trainees had the skills upon programcompletion.
It is clear that striking differences existed between some programs in regardto content. Some of these differences are shown in Figures 4, 5, and 6 whichdisplay the frequency distribution curves for: cardiac catheterization, electro-cardiography, and echocardiography. Such data are valuable in determine howmany training programs are providing proper experiences in the different categoriesconsidered to be important.
FACULTY IN CARDIOLOGY
In 1973 the average training program had 4.6 full-time professional staff membersand 3.7 part-time staff members, primarily in the division of cardiology, contri-buting directly to the program (Table 5). In addition, there were 1.9 full-timeand 1.8 part-time staff members, primarily in other divisions, who also contri-buted to the program. Thus, the faculty manpower devoted to training programswas considerable with 2,734 cardiologists (full-time and part-time), primarilyin the cardiology division, who devoted part of their time to the training of1,278 trainees .
The full-time staff devoted from 60 to 67 percent of their professional time tothe cardiology training program. The findings were as follows:
Program Directors 67 percent
Associate Directors 65 percent
Cardiology Staff 59 percent
Non-Cardiology Staff 61 percent
159

TABLE 3
AVERAGE NUMBER OF HOURS IN SPECIFIC TRAINING AREAS
IN TWO-YEAR PROGRAMS
Training Area Hours
Cardiac Patient CarePediatric 209
Medical 1140
Surgical 279
Cardiovascular ResearchClinical 384
Basic 350
TeachingClinical 298
Didactic 112
Laboratory Diagnostic TechniquesAngiography 423
Cardiac Catheterization 481
Echocardiography 114
Electrocardiography 331
Exercise Testing 130
Pacemaker Insertion 8]
Phonocardiography 130
Vectorcardiography 77
Laboratory and Classroom Instruction inBasic Sciences and Clinical Disease 494
TOTAL HOURS 5033
Source: 4
157

158
TABLE 4
PERCENTAGE OF DIRECTORS INDICATING SKILL COMPETENCEOF TRAINEES UPON COMPLETION OF TRAINING
One-Year Two-Year AllSkill Area Programs Programs Programs
N-51 N139 N0190
Manage an intensive care orcoronary care facility 98 97 97
Teach students, house staffor fellows 94 98 97
Perform as a consultantcardiologist 87 98 95
Perform and teach others non-invasive lab techniques 83 90 88
Conduct diagnostic cardiaccatheterization 60 96 86
Eligible for cardiologysubspecialty boards 51 99 86
Conduct clinical research 66 82 78
Perform and teach cardiacdiagnostic x-ray procedures 49 84 74
Conduct basic laboratoryresearch 6 16 13
Source: 4
161

20
FIGU
RE
4
AL
L T
RA
ININ
G PR
OG
RA
MS D
ISTR
IBU
TIO
N O
FR
EQ
UIR
ED
HO
UR
S INC
AR
DIA
C C
AT
HE
TE
RIZ
AT
ION
(76 Percent Responding)
100- 200- 300- 400- 500- 600- 700- 800-1000- 1100
99199
299399 499
599699
799899
1099 AN
DO
VE
R
ME
AN
HO
UR
S IN
CA
RD
IAC
CA
TH
ER
IZA
TIO
NSource: 4
(EX
CLU
DIN
G S
WA
N -G
AN
Z A
ND
AN
GIO
GR
AP
HY
)

30
Source: 4
50
FIGU
RE
5
AL
L T
RA
ININ
G PR
OG
RA
MS D
ISTR
IBU
TIO
N O
F RE
QU
IRE
DH
OU
RS IN
EL
EC
TR
OC
AR
DIO
GR
APH
Y(96 Percent R
esponding)
1-100-
200-300-
99199
299399
ME
AN
HO
UR
S IN
ELE
CT
RO
CA
RD
IOG
RA
PH
Y
400-500-
600-700-
800499
599699
799A
ND
OV
ER
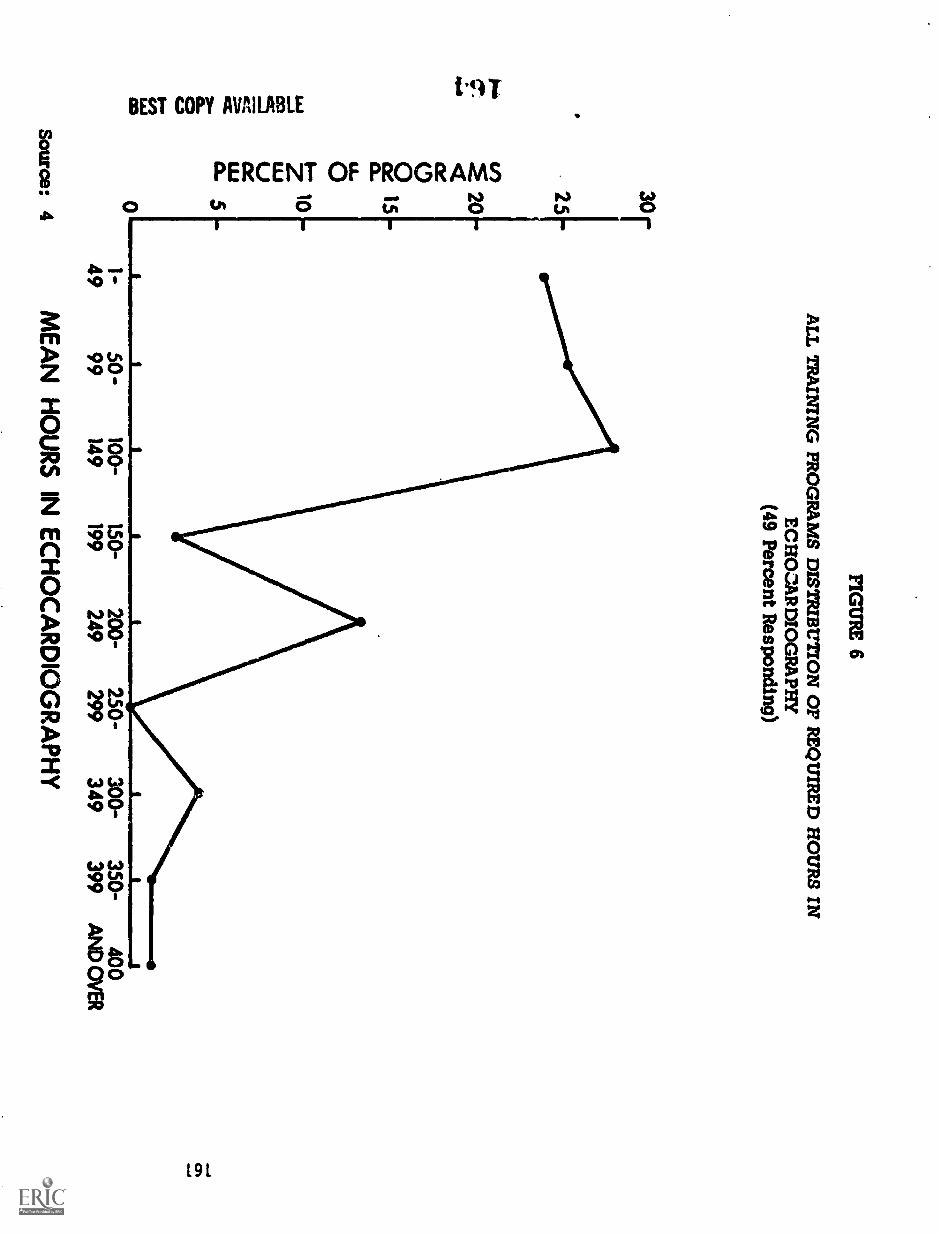
3°r
2520
ce0ce 15a_u.O
0L
LJ
CZ
a- 5
FIGU
RE
6
AL
L T
RA
ININ
G PR
OG
RA
MS D
ISTR
IBU
TIO
N O
F RE
QU
IRE
D H
OU
RS IN
EC
HO
ZA
RD
IOG
RA
PHY
(49 Percent Responding)
1-50 -
4999
Source: 4M
EA
N
100-150-
200-250-
300-350-
400149
199249
299349
399A
ND
OV
ER
HO
UR
SIN
EC
HO
CA
RD
IOG
RA
PH
Y

162
TABLES
NUMBER OF PROFESSIONAL STAFF IN CARDIOVASCULARDISEASE TRAINING PROGRAMS
Staff by Division Mean/Program Total ProgramsN329
Primarily in CardiovascularDivision
Part-Time 3.71 1220.8
Full-Time 4.69 1513.4
sub-total 2734.0
Primarily in Other Divisions
Part-Time 1.82 598.8
Full-Time 1.91 628.4
sub-total 1227.2
TOTAL 3961.2
Source: 4
165'

163
The numbers of faculty per program are means. Thus, some programs may haveas many as 21 faculty, while others may have no full-time faculty. In fact,about 5 percent of the training programs had n2, full-time faculty!
A shortage of faculty appears to exist in some training programs. Twenty-ninepercent of the 329 programs had an average of 1.87 staff positions budgetedbut unfilled - a total of about 150-180 positions. It is evident, however, thatthe majority had adequate faculty, since program directors indicated that withtheir existing facilities and staff they could accommodate an additional 665trainees if funds for trainees were available.
The staff of most training programs were highly qualified. As an average, 69percent of the full-time staff were Board Certified in Internal Medicine, and 25percent were certified in the Subspecialty Board in Cardiovascular Disease.
Training program directors estimated that an average of 2.63 additional staffpositions will be required from 1973 to 1978 if they are to increase their traineecapacity by 58 percent over that period. This represents a total estimatedfive year increase in staff of between 800 and 850. These figures do not in-clude additional staff needed for new programs that might start during thistime period, and it assumes that existing programs will continue.
FACILITIES AND MATERIALS
Important elements in a cardiology training program are the numbers of cardiacpatients seen: in the hospital, in the outpatient clinic, and in the variouscardiovascular laboratories. Table 6 shows the mean values for some aspectsof the above, obtained from the questionnaire to the training program directors.These statistics are means for all hospitals and for all training programs.While variation was large, the statistics are broadly descriptive of overallresources.
Table 7 shows the mean percentage of outpatient and inpatient visits per yearby general diagnosis. As would be expected, coronary, hypertensive, andrheumatic heart disease were the most common problems seen.
Ninety-four percent of the program directors indicated that they had facilitiesfor research. In 40 percent, the research was clinical; in 5 percent it wasbasic; and in SS percent it was combined.
On an average,. each training program performed 583 cardiovascular surgicalprocedures per year. The percentages by major category were as follows:coronary 36 percent, valvular 25 percent, peripheral vascular 23 percent,congenital 13 percent, and others 3 percent.

Mean Number____I
164
TABLE 6
Hospital Facilities and Laboratory Services for theAverage Cardiovascular Training Program
Facilities and Services 1
1
Inpatient BedsGeneral MedicineCardiac Medicine *CCU or ICUCardiac Surgery
Inpatient Admissions per Year
2042219
13
General Medicine 4,936Cardiac Medicine 1061CCU or ICU 838Cardiac Surgery 583
Outpatient ServicesGeneral Medicine Visits per Year 23,106Cardiac Medicine Visits per Yea_ 2,712
Laboratory Procedures per YearAngiograms 555Cardiac Catheterizations 368Echocardiograms 162
Electrocardiograms 21,264Exercise Tests 315Vectorcardiograms 291
* These beds are not necessarily segregated beds on aseparate cardiology service, but include segregated bedsas well as beds on a general medical service which areoccupied by patients with primary cardiac problems beingevaluated by the cardiology service. These figures mayunderestimate the number of beds, since some program direc-tors only included segregated beds in their report. No dataare available regarding the number of training programs thathave segregated beds or separate designated cardiologyservice beds.
Source: 4
167

165
TABLE 7
PERCENTAGE DISTRIBUTION OF PATIENTS SEENBY CARDIAC DIAGNOSIS IN TRAINING PROGRAMS
Cardiac DiagnosisPercent ofCardiologyOutpatient
Visits per Year
Percent ofCardiologyInpatient
Visits per Year
Hypertension 20 16
Rheumatic 18 14
Congenital 7 4
Cardiomyopathy 7 6
Coronary 39 47
Peripheral vascular 4 6
Other 5 7
Source: 4

166
TRAINING MANPOWER
It is evident that training programs in the United States have been expandingover the past several years (Figure 7). Continued expansion would no doubthave occurred if the funding policies in effect prior to 1973 were continued.Present program directors estimate that their cardiology programs could ac-commodate 58 percent more trainees over a five-year period if appropriatefunds for this expansion were available.
Thus, it can be estimated that if appropriate funds were available, by 1978 atotal of 1,250 to 1,300 cardiologists could complete their training that year.This estimate does not include trainees from new training programs that mightbe started after 1973, and it assumes that existing training programs wouldcontinue.
Two-thirds of the present programs (1972-73) could accommodate an averageof 1.7 additional trainees in the first year with their existing staffs andfacilities if trainee stipends were available. Thus, an estimated 200 addi-tional physicians could be added immediately to existing training programs.Increases beyond this level would require additional funding for program staffs,trainee stipends and training facilities.
FUNDING FOR TRAINING IN CARDIOLOGY
It was difficult to get a valid picture of how most cardiology training programswere supported. Fifty-seven percent of the program directors indicated theyreceived support from their own institution; 27 percent received support fromthe National Heart and Lung Institute; and 24 percent received support fromtheir local heart association. As might be expected, research support wasreported from many sources.
ADEQUACY OF TRAINING PROGRAMS FOR CURRENT PRACTICE NEEDS
This question can be answered by examining what cardiologists do in practiceand what present training programs provide. This comparison has certainlimitations, however. While a cardiologist in practice may perform fewangiograms or cardiac catheterizations, he must understand the indicationsfor and risks of these procedures and be able to evaluate the data from thesestudies. Thus, the fact that cardiologists in practice perform few suchspecialized studies should not indicate that less time should be devoted tosuch techniques in the training program. For this reason, a second type ofevaluation is also presented in this report - how do cardiologists in practiceevaluate their own training in terms of deficiencies and redundancies? Theanswers to these questions are presented in the next chapter on "ContinuingEducation, Educational Needs and Standards."
169

8000
7000
6000
5000
4000
3000
2000
1000
500
150-
100-
50-
FIGURE 7 167
O Residency positions tilledin Internal Medicine
Candidates certifiedin Internal Medicine
a Candidates certifiedin Cardiology
f:11.°r 1 I T 111
63 64 65 66 67 68 89 70 71 72
Years
TEN YEAR TREND IN NUMBER OFINTERNAL MEDICINE RESIDENCIES, INTERNAL MEDICINE
CERTIFICATES, AND CARDIOLOGY CERTIFICATION*
*Reference source: American Board Internal Medicine
170

168
Are these needs being met by current training programs realizing that thecardiologists responded in terms of the training they received five to tenyears ago? Only a very general speculation can be permitted on this point.It is clear that cardiologists believe that electrocardiography was an ade-quate part of their training experience five to ten years ago. It is unlikelythat there is less electrocardiography in present training programs, and thegeneral experience is that more electrocardiography is currently being offeredconsidering the rapid increase in electrocardiograms performed in all cardi-ology programs over the past five to ten years. It is also evident that fiveto ten years ago very few non-invasive studies (phonocardiograms, echo-cardiograms, exercise tests) were done. In present programs the fact thatmore time is spent on these non-invasive techniques than on electrocardiographysuggests that this deficiency has been corrected in present training programs.
SUMMARY AND RECOMMENDATIONS
There are 329 programs in the United States which offer at least one year oforganized training in cardiology in an approved internal medicine trainingprogram. These programs have an average of four trainees per program.Approximately 711 trainees completed their training in 1972 and 791 traineesdid so in 1973. Most of the trainees will be Certified in Internal Medicineand approximately 15 to 20 percent will become certified in CardiovascularDisease. Approximately two-thirds of-the trainees plan to enter private prac-tice, while one-third plan careers in academic medicine.
Training facilities in the United States have expanded over the past ten years,and, based on training directors' estimates, will continue to do so. It ispossible to take on 58 percent more trainees during the next five years. Clearly,to achieve this would require increased funding. These training programscould accommodate 200 more trainees at the present time without additionalfaculty or space.
The average cardiology training program has 4.6 full time and 3.7 part-timeprofessional staff in the cardiology division contributing to the training program.In addition, there are 1.9 full-time and 1.8 part-time staff from other divisionswho contribute to the program. The full time professional staff is highly quali-fied. A shortage of staff members presently exists in many training programs.Twenty-nine percent of programs have an average of two staff positions budgetedbut unfilled - a total of approximately 150-180 positions. If training programsexpand over a five-year period from 1973-1978 to increase the number oftrainees by 58 percent, an average of 2.63 additional staff members will berequired for the average program. This is an increase of approximately 800-850new staff members.
Trainees entering training programs have had either two years of prior trainingin internal medicine (49 percent) or three years of training (46 percent).
1.21

169
Most training programs offer experience in all areas required for certificationin the Subspecialty Board in Cardiovascular Disease, and t: practice ofmodern cardiology in the office or institutional setting. $ u.se programs donot provide a complete experience in all areas, however.
Our recommendations are:
1. The present system for training of cardiologists in the UnitedStates should be continued, taking into account the recom-mendations of the Subspecialty Board of Cardiovascular Disease.
2. Federal support for training certain groups of cardiologistsparticularly the Academic Cardiologist (Primary Institutional),should be continued at a rate commensurate with populationchanges and related demands for trained cardiologists. Thesetraining programs for the Academic Cardiologist should besmaller in number but better in quality and more comprehensivein nature than the programs available for the Internist Cardi-ologist (Secondary Non-Institutional) or the Clinical Cardiologist(Primary Non-Institutional).
3. The cardiology training needs of internists and generalists(Secondary Non-Institutional) should be continually evaluatedand their training modified accordingly. Evidence regardingthe number of patients seen by these physicians and thediversity of their problems indicate a clear need for compre-hensive cardiovascular training for these specialists.
4. Programs need clear differentiation as to which of the four typesof cardiologist is being trained, with the numbers trained ad-justed to geographic-area needs. This implies a level of programplanning not currently practiced but one which, nevertheless, isrequired if the minimum ratios of cardiologists to populationdiscussed in Chapter 7 are to be realized.
5. Directors of cardiology training programs should receive con-tinuing information as to the needs of their graduates including:
a. a copy of this study re- lrt,
b. a report from the American Board of Internal Medicineregarding areas of deficiency in cardiovascular trainingbased on the results of examination of their trainees;
c. an annual meeting with the other directors of similarprograms.

170
In making these recommendations, we do so fully cognizant of the fact thatsignificant changes were underway at the time the study was being done,the effect of which has not (indeed, cannot) be estimated at this time. Inessence, we assumed a "steady state" of federal support to many facets ofthe training programs which may or may not be forthcoming in the future. Itis one thing to imply that hospitals can pick up certain costs; it is quiteanother to demonstrate that this might happen.
Currently, medical schools and training hospitals supporting cardiologytraining programs rely heavily on government funding. We have not examinedalternative approaches to federal support as part of this study, although theneed for such investigation is fully acknowledged. Furthermore, there is a needfor federal funding to provide support for basic science research and teachingin keeping with the significant advances in this area. This component willnot ordinarily be available from the clinical faculty of the hospital but mustbe provided by medical school academic cardiologists.
Cardiovasculdr training programs receive considerable clinical, teaching andresearch support from such disciplines as surgery, radiology, physiology,pharmacology, biomedical engineering. Although these fields have not beensurveyed by this study except as contributing manpower to the training staffs,their contributions are larger and important. These disciplines owe theirtremendous advances and expansion in recent years in part to federal support.The types of training programs recommended presuppose their continued in-volvement, if not increased participation. Manpower needs in these relatedfields, though not included in this study, are crucially important to cardiology.
173

171
CHAPTER 6
CONTINUING EDUCATION, EDUCATIONAL NEEDS AND STANDARDS
Forrest H. Adams
The cuntin'iing education of the physician (cardiologist) will undoubtedly as-sume increasing importance in the future. It has recently been stated' "med-ical education should be desi7ned as a true continuum extending from secon-dary school through college, medial school, hospital training, and post-graduate education." A number of factors undoubtedly influence the continu-ing education needs. We will attempt to highlight some of them in thischapter.
In this study most of the information relative to continuing educational needswas obtained from the Cardiologist's Training Survey instrument, It will berecalled that this survey instrument was sent to a random stratified sampleof 2,619 cardiologists. Approximately 80 percent answered the survey ofwhich 1,509 were deemed useable for analysis according to the followingbreakdown:
Institutional
Primary under 40 years 288Primary over 40 years 142Secondary under 40 years 100Secondary over 40 years 103
Non-Institutional
Primary under 40 years 282Primary over 40 years 178Secondary under 40 years 243Secondary over 40 years 173
TOTAL 1,509
The second source of continuing education needs was obtained from commentsmade by the Cardiology Training Program Directors. In this instance, it willbe recalled that 329 institutions stated that they had a training program incardiology. Only 190 institutions answered the questionnaire in writing andof this group only about 50 percent included comments concerning continuingeducational r.aeds.
lAnlyan, W.G. yhe Future of Medical Education. Duke University Press,Durham, N.C., 1973, page DC and page 131.
174
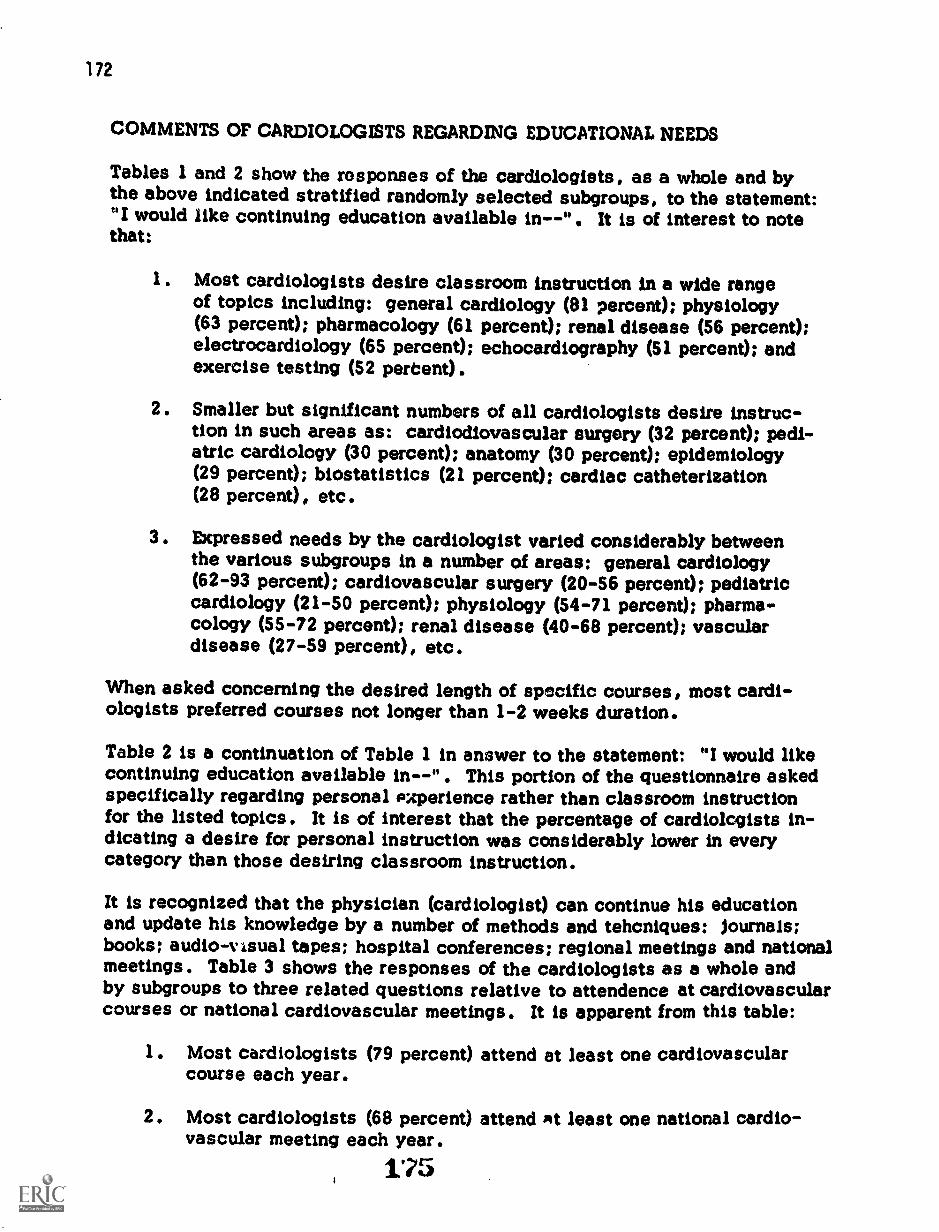
172
COMMENTS OF CARDIOLOGISTS REGARDING EDUCATIONAL NEEDS
Tables 1 and 2 show the responses of the cardiologists, as a whole and bythe above indicated stratified randomly selected subgroups, to the statement:"I would like continuing education available in--". It is of interest to notethat:
1. Most cardiologists desire classroom instruction in a wide rangeof topics including: general cardiology (81 percent); physiology(63 percent); pharmacology (61 percent); renal disease (56 percent);electrocardiology (65 percent); echocardiography (51 percent); andexercise testing (52 percent).
2. Smaller but significant numbers of all cardiologists desire instruc-tion in such areas as: cardiodlovascular surgery (32 percent); pedi-atric cardiology (30 percent); anatomy (30 percent); epidemiology(29 percent); biostatistics (21 percent); cardiac catheterization(28 percent), etc.
3. Expressed needs by the cardiologist varied considerably betweenthe various subgroups in a number of areas: general cardiology(62-93 percent); cardiovascular surgery (20-56 percent); pediatriccardiology (21-50 percent); physiology (54-71 percent); pharma-cology (55-72 percent); renal disease (40-68 percent); vasculardisease (27-59 percent), etc.
When asked concerning the desired length of specific courses, most cardi-ologists preferred courses not longer than 1-2 weeks duration.
Table 2 is a continuation of Table 1 in answer to the statement: "I would likecontinuing education available in--" . This portion of the questionnaire askedspecifically regarding personal experience rather than classroom instructionfor the listed topics. It is of interest that the percentage of cardiologists in-dicating a desire for personal instruction was considerably lower in everycategory than those desiring classroom instruction.
It is recognized that the physician (cardiologist) can continue his educationand update his knowledge by a number of methods and tehcniques: Journals;books; audio-visual tapes; hospital conferences; regional meetings and nationalmeetings. Table 3 shows the responses of the cardiologists as a whole andby subgroups to three related questions relative to attendence at cardiovascularcourses or national cardiovascular meetings. It is apparent from this table:
1. Most cardiologists (79 percent) attend at least one cardiovascularcourse each year.
2. Most cardiologists (68 percent) attend At least one national cardio-vascular meeting each year.
175

TABLE 1173
PERCENTAGE OF CARDIOLOGISTS DESIRING CONTINUING EDUCATION IN
ClassroomInstruction All
Institutional Non-Institutional.111PrimaryPrimary Secondary Secondary
Under Over Under! Over Under Over Under Over40 40 40 ) 40 40 40 40
General Cardiology 81 68 62 85 75 76 80 93 91
C-V Surgery 32 56 27 43 24 53 28 42 20
Pads Cardiology 30 50 28 39 26 47 28 31 21
Anatomy 30 29 20 32 30 32 29 36 32
Physiology 63 71 60 70 54 68 63 63 61
Biochemistry 40 44 44 44 42 42 43 32 36
Pathology 39 44 39 56 37 42 36 37 38
Epidemiology 29 34 30 47 29 35 25 31 25
Pharmacology 61 71 63 68 58 72 55 70 59
Ratiology 48 58 43 56 40 60 45 55 44
Renal Disease 56 40 42 61 50 49 55 62 68
Vascular Disease 45 28 27 42 43 37 42 49 59
Biostatistie.m 21 35 33 34 28 16 18 14 15
Bioengineering 23 36 31 32 24 19 23 16 19
Electrocardiography 65 60 49 73 51 62 64 75 72
Phonocardiography 41 44 32 SO 36 44 43 45 39
Echocardiography 51 71 54 54 37 69 49 51 44
Exercise Tolerance 52 53 40 52 33 60 52 66 54
TestingVectorcardiography 41 47 35 SS 36 45 41 43 38
Angiography 36 47 28 47 33 51 33 33 34
Cardiac Catheteri-zation
28 44 21 35 21 42 26 29 23
Source: 5
176

174
TABLE 2
PERCENTAGE Or CARDIOLOGISTS DESIRING CONTINUING EDUCATION IN
Personal Experienceand
LaboratoryTechniques
An
Personal Experience
Patient Care:
Pediatric
Medical
Surgical
Coronary Care
Pacemaker Insertion
Laboratory Techniques
Electrocardiography
Phonocardiography
Echocardiography
Exercise Testing
Vectorcardiography
Angiography
Catheterization
Institutit/...41
Primary
Under Over-.10 40
Non-In4titutional
Secondary
Under40
Over40
rrimary
Under Over40 40
Secondary
Uncitz 1 Over40 Alt
13 18 11 19 15 19 12 12 12
39 25 24 45 32 34 36 50 49
14 16 9 18 10 20 12 17 13
37 24 28 41 30 31 30 49 49
35 22 23 35 34 30 35 51 41
47 34 24 46 40 40 46 59 60
31 30 19 32 28 33 33 36 31
41 55 38 43 32 56 39 43 36
40 36 23 32 28 41 40 49 45
30 28 23 34 30 34 30 37 31
25 31 18 26 23 31 24 24 23
23 33 18 28 20 33 23 24 20
Source: 5
177

175
TABLE 3
PERCENTAGE OF CARDIOLOGISTS PARTICIPATING IN CARDIOVASCULARCOURSES OR NATIONAL CARDIOVASCULAR MEETINGS
Participation InContinuing Educa-tion Programs
All
Institutional Non-Institutional
IPrimary Secondary Primary Secondary
Under Over Under Over Under Over Under Over40 40 40 40 40 40 40 40
Participation .tnC-V Courses
Once/Year 56 68 43 52 65 65 47 45
Once/Year 23 25 10 29 20 20 19 30 27
Never 5 7 6 12 4 2 3 5
Participation inC-V Meetings
Once/Year 30 50 64 27 23 31 35 15 13
Once/Year 38 43 24 33 27 50 42 39 34
Never 5 1 1 17 11 2 1 7 11
OpportunitiesOffered
Adequate 74 74 75 73 71 76 77 73 72
Inadequate 16 15 8 16 14 17 15 20 19
Source: 5

176
3. The percentage of cardiolosits who attend no cardiovascularcourse or meetings ranges ,from 1-17 percent, depending uponthe subgroup. The average would appear to be less than 10percent.
4. Approximately 75 percent of the cardiologists believe the op-portunities offered are adequate.
An important factor affecting the continuing educational needs of the cardi-ologist could be his oriaknql tritinina experkences. Tables 4 and 5 containthe responses to the statement "Training in this Topic Too Limited". Itis apparent that:
1. Many cardiologists believe they received inadequate training ex-perience in : pediatric cardiology (47 percent); phonocardiography(41 percent); echocardiography (74 percent); vectorcardiography(55 percent); coronary angiography (50 percent); biochemistry(46 percenth physiology (43 percent); biostatistics (59 percent)and bioengineering (65 percent).
2. Differences between the subgroups varied considerably in a numberof areas: phonocardiography (29-59 percent); echocardiography(60-96 percent); coronary angiography (29-76 percent) and bio-engineering (53-96 percent).
By examining the responses of cardiologists who indicate (1) their trainingwas "too limited" and (2) such training is of either "medium" or "high"importance for the training of physicians going into cardiological practicessimilar to theirs, a measure of training inadequacy or insufficiency is ob-tained. From this perspective, training was seen as insufficient by overone-third of the respondents in the following areas:
Area Percent
CPC Pediatric 34Pacemaker follow-up 35Echocardiography 55Vectorcardiography 34Coronary angiography 42Peripheral angiography 39Swart-Ganz right heart
catheterization 44CV biochemistry 38Pulmonary physiology 40Biostatistics 39Bioengineering 41
. 179

177
TABLE 4
PERCENTAGE OF CARDIOLOGISTS INDICATING TRAINING TOO LIMITED
Type ofTraining
Experience in Clinic"'Care. Research a:14Teaching,
Cardiac Patient Care:
Pediatric
Medical
Surgical
Coronary Care Unit
Pacemaker Insertion
. Cardiovascular Research:
Basic
Clinical41)
LaboratoTech:haulm
Electrocardiography
Phonocardiography
Echocardiography
Exercise ToleranceTesting
Vectorcardiography
Angiography:
Cardiac
Coronary
Peripheral
Cardiac Catheterization
All
Institutional NonInstitutional
Primary Secondary Primary Secondary
Under40
Over40
Under40
Over40
Under40
Over40
Under40
Over40
47 47 32 55 44 48 43 47 57
10 3 4 1 10 2 11 6 17
35 33 34 33 36 25 35 29 46
30 20 44 17 33 22. 27 27 50
32 11 41 24 50 17 42 32 70
31 29 29 40 30 26 27 27 42
26 28 23 28 20 21 25 29 31
11 11 9 7 1.5 8 9 8 16
41 31 29 33 35 30 46 36 59
74 61 70 60 .71 72 75 78 .96
32 32 33 35 35 34 23 32 37
55 48 50 58 55 50 52 55 70
30 9 34 25 39 14 32 27 61
50 29 60 44 49 39 68 54 76
55 50 50 56 53 53 44 53 69
26 7 22 25 42 i3 32 26 48
Source: 5 180

178
TABLE 5
PERCENTAGE OF CARDIOLOGISTS INDICATING TRAINING TOO LIMITED
Laboratory andClass room
All
Institutional
Primary Secondary
Under Over Under OverInstruction 40 40 40 40
C-V Anatomy 31 37 38 42 35
C-V Physiology 25 22 26 27 33
C-V Biochemistry 46 50 54 44 59
C-V Pathology 28 40 21 43 27
C-V Epidemiology 39 54 50 57 33
C-V Pharmacology 30 35 28 3S 35
C-V Radiology 28 26 22 33 31
Pulmonary Physiology 43 47 39 50 34
Hypertensive Renal 25 39 29 30 18Disease
Peripheral Vascular 34 60 29 35 32Disease
Cerebral Vascular 32 56 39 28 41 q
DiseaseBiostatistics 59 1 60 59 63 64
Bioengineering 65 53 56 67 77 I
Source: 5
181
Non-Institutional
Pridiary Sedondary
Under Over40 40
36 29
27 18
45 47
34 27
41 38
25 28
30 26
40 42
29 21
40 32
46 29
58 60
55 65
Under40
Over40
28 26
24 29
35 44
25 24
31 32
22 33
31 32
38 49
18 22
32 28
24 22
44 63
55 86

179
The majority are in newly differentiated areas. Echocardiography training wasfound inadequate by over one-half of those responding.
Another important factor effecting the continuing educational needs of the cardi-ologist could be the role of certification and recertification in our future nationalhealth care systemi. It hab recently been recommended that "the feasibilityof recertification, relicensure, and the use of a scheme incentives as amechanism for motivating physicians to maintain a high level of professionalcompetence should be exploited"3. At the present time, less than 66 percentof all cardiologists have their boards in internal medicine, and less than 15 per-cent are certified in cardiovascular disease. If the requirements for practicingcardiology were made more stringent, it is likely that a large number of indi-viduals would need to have future training and course work in order to demon-strate competence in the field. The Physician Reassessment Test Programcurrently being jointly developed by the American College of Cardiology andthe American Heart Association could be of assistance in identifying for thecardiologist his areas of strength and weakness, thus pinpointing for himwhich courses might be most valuable to him.
COMMENTS OF CARDIOLOGY TRAINING PROGRAM DIRECTORS REGARDINGEDUCATIONAL NEEDS
As one of the groups most involved in the continuing education of the cardi-ologist, the comments of the training program directors seem quite relevant.Many directors recognize the need for varying levels of training and coursework in order to fit the varying roles and levels of competence required topractice cardiology. Thus not all cardiologists need to be trained in a similarfashion. A number of training program directors strongly recommend physician,assessment tests and recertification; some even recommended that these berequired now by all cardiologists.
Many of the directors of larger training programs believed one of the majorproblems was stable and adequate funding of their programs. A number statedthey needed additional faculty.
For many of the smaller training programs, a frequent point raised by thedirectors centered around the need for pooling of the teaching resources. Bythis, they meant patient material, types of procedures available, and audio-visual facilities particularly in the basic sciences. In regard to this latter
2 Building a National Health-Cart Systep. Committe for Economic Development,477 Madison Ave ., New York, N.Y., 1973.
3 Ibid.
182

180
point, the need for a core curriculum was frequently expressed. Several pro-gram directors suggested the need for a separate television channel for physicians,particularly for showing national scientific meetings.
SUMMARY AND CONCLUSIONS
The continuing educational needs of the cardiologists are currently varied anddiverse. They appear to be influenced by:
I. The type and content of his original training
2. The role and age of the cardiologist
In the future, continuing educational needs will be influenced by:
I. The role of certification and recertification in a national healthcare system
2. Regional considerations
3. Advances in medical knowledge
4. Stable funding
183

CHAPTER 7
FUTURE MANPOWER NEEDS IN CARDIOLOGY
Walter H. Pritchard and Walter H. Abelmann
INTRODUCTION
181
Evidence obtained from our study suggests that a laissez-faire or unplannedmedical system results in wide variations, inequalities and inadequacies inthe distribution of physician specialists including cardiologists. The inade-quacies of past planning for health manpower raise serious questions abouttraditional approaches to manpower studies and predictions for the future.On the other hand, Badgley and co-workers' recently critically reviewed sixmethods of assessment and projection of needs for health manpower. Theyare; (1) Health Personnel/Population Ratio; (2) Demographic Projection;(3) Need for Health Services; (4) Supply and Demand; (5) Functional Analysis;and (6) Target-Setting Approach.
The method used by us to assess manpower needs in cardiology is that ofanalyzing the number of active cardiologists available for patient care per100,000 population (Health Personnel/Population Ratio) : This has provideda figure from which correlations of different kinds have been made. Suchphysician ratios per 100,000 population can also be used to estimate futureneeds. The major limitation of this approach is that it is based on a ratio forwhich scientific and technical advances, changing demands and expectationsare not taken into account.
MANPOWER NEEDS BASED ON CHANGES IN CARDIOLOGIST /POPULATION RATIO
The overall ratio of cardiologists to population in the United States is 5.1/100,000(Table 7, Chapter Three). In one census division, the ratio is as high as8.0/100,000. If one assumes that the population will increase at the rate of1 percent per year, projections of the manpower needs in cardiology can bemade for following years using various ratios of cardiologists/100, 000 popu-lation. Table 1 shows such projections by census division through 1976 usingratios of 5,6, and 7 cardiologists per 100,000 population in all census divisions.Losses to the population of cardiologists from deaths and from retirements areestimated by using factors discussed in detail in Chapter Eight. An assumptionis made that the cardiologist over 65 will have a decreasing activity rate as acardiologist with the passage of time, even though he may classify himself asactive. For p'anning purposes it is estimated that the ohier cardiologist will
1 Badgley, R.F., Bloom, S., Mechanic, D., Pearson, J.C., and Wolfe, S."International Studies of Health Manpower: A Sociological Petspective",Medical Care. 9:235-252, 1971.
184

182 TABLE 1
Projection of Cardiology Manpower Needs: 1972 Through 1976
Census Division Population (M)
Ratios Per 100,000 Population
PresentRatio
Projected Ratios
5 6 7
Middle Atlantic 37.2 8.0 Im alb MD MD O.
New England 11.8 7.0 .1b --- - --
South Atlantic 30.7 5.8 alb 62 368
Pacific 26.5 5.7 alb moo 79 344
Mountain 8.3 4.1 74 157 240
East North Central 40.3 3.8 483 886 1288
West South Central 19.3 3.6 271 464 657
West North Central 16.3 3.4 262 425 588
East South Central 12.8 2.5 321 449 577
Total number needed in 1972 1411 2522 4062
Additional Cardiologists Needed by 1976 due t..:
Population growth @ 1%/year 530 637 743
Death and retirement 1063 1063 1063
Inactivity for over 65 age group 346 346 346
1939 2046 2152
Total Additional Manpower Needs Through 1976 3550 4568 6214
Active cardiologists through 1976 12632 13850 15496
:185

183
be 50 percent active.
Thus, if we had brought all regions of the country up to a ratio of six cardiolo-gists per 100,000 population (in 1972), we would have required 2,522 morecardiologists than we had. When we project ahead through the year 1976 takinginto account population growth, death and retirement, and inactivity of cardi-ologists over 65 years of age, 2,046 additional cardiologists would be requiredmaking a total of 4,568 needed.
If numbers of cardiologists and not their practice location are the only concernthen 4,560 cardiologists would be produced in a little over five years' time witheither an annual graduate output of 800 or with an incremental increase per yearof about 10 percent. The estimate of 4,568 required was made under the theo-retical assumption that these individuals would be distributed where they wereneeded. Clearly, two additional factors affect the time when this proposed ratiomight actually be achieved;
1. The classes of 1971-72 and 1972-73 have graduated and are inpractice at this time. It is not known where they are practicingbut in all likelihood they are disproportionately clustered inareas which have cardiologist to population ratios well above6.0 per 100,000.
2. With the 197172 and 1972-73 graduates already "in place" ,
achieving the suggested national norm of at least 6.0 per100,000 in all census divisions will require at least one yearand possibly more than the five indicated in the analysis.
From the Cardiovascular Training Program Questionnaire of 329 institutions pro-viding one or more years of training in cardiology, it was determined that theyhad 1,278 trainees. It was also estimated that approximately 800 will completetheir training each year. However, to meet the additional manpower require-ments of 4,568 cardiologists by 1976 estimated above, it would require anincrease of 100 to 900 for the number completing training each year. Since thetraining program directors indicated that they could accommodate 58 percentmore trainees if adequat3 funding and staffing were available, we probably haveadequate facilities for training cardiologists at the present time.
MANPOWER NEEDS AND TRAINING PROGRAMS FOR DIFFERENT TYPES OF
CARDIOLOGISTS
In estimating the total numbers needed by using the ratios of cardiologists per100,000 population, no consideration was given to the medical needs of cardi-ology or to the types of :" ardiologists to be trained. From the profile studiesof the cardiologists' re- 1, four types of cardiologists were identified:
1h6

184
Internist Cardiologist Non-Institutional, Secondary
Clinical Cardiologist Non-Institutional, Primary
Cardiac Specialist Institutional, Primary
Academic Cardiologist Institutional, Secondary
If we now look at training needs and projections in terms of these categories, theproblem can be brought into sharper focus.
Internist-Cardiologist (Non-Intitutlonal, Secondary) .
The Internist-Cardiologist will provide general medical and cardiac carefor most of his patients, but will rely on Cardiac Specialists for supportin the more complex cardiac problems. He will be familiar with diagnosticECG, acute infarction and will function as a primary physician but at ahi0er level than the generalist. There are presently approximately 500training programs in internal medicir e. The Internist-Cardiologist couldreceive his training in a program of internal medicine if it were to includesufficient clinical cardiology embracing the problems of hypertensioncoronary care, ECG X-ray interpretation, etc. A three year program ininternal medicine should include at least six months in cardiovasculardisease. Thus, his particular tasks would be to be aware of, and con-cerned with, the relatively routine management of common cardiac con-ditions and to become a competent electrocardiographer with skill levelsin these areas in excess of the average internist. He should have con-siderable exposure to the use of drugs in the management of heart diseaseparticularly diuretics and anti-arrhythmic agents. He would acquirethese specific skills by an extended activity in the heart station andin a coronary care unit. If his program in internal medicine cannot offerat least six months in cardiology, he should have a year of cardiologytraining elsewhere to insure competence in this area.
The number of Internist-Cardiologists should be large. Approximately4,500 physicians are currently identified in this particular role and moremight be needed. Improved programs in Internal Medicine could reducethe number of special cardiology training programs required. Sincethese programs are now financed by hospitals, they should not requiregovernment support.
Clinical Cardiologist (Non-Institutional. Primary).
This cardiologist is usually non-institutionally based but may be in aninstitutional setting and, in that event, will see a substantial numberof referred cardiac petients from his institution. He will spend moretime in consultation, may participate in the interpretation of electro-cardiographic records in a more formalized institutional department, and
187

185
may be a chief of a heart station in a smaller center. He has a knowledgeof the value of vectorcardiography, echocardiography, phonocardiography,cardiac catheterization and coronary arteriography. He does not neces-sarily practice these skills in a "hands-on" role. He will be more Jndemand for clinical consultations and may function also as a director ofa coronary care unit in a community hospital.
He will provide expert clinical care for cardiac problems end will workclosely with the more highly skilled Cardiac Specialist and AcademicCardiologist. He will also be called upon to help manage the post-operative problems of surgery, and arrhythmias, and although he may notbe primarily concerned with pacemaker and catheterization techniques,he must be aware of their application and their general use in patient care.
We believe he should have greater in depth training in cardiology than theInternist-Cardiologist. He requires two years of training in cardiology.This should be spent largely in electrocardiography, coronary care andsome of the more specialized clinical aspects of cardiology such asevaluation for cardiac surgery, etc. The individual should also spend3-4 months in the cardiac catheterization laboratory and in the indirectmeasurements laboratory. In this way, he will have intimate exposureto the indications for and the problems encountered in the proceduresand the interpretation of data derived from the procedures. Ideally, hewould also be involved in a clinical research project and would be know-ledgeable in assessing and contributing to clinical trials of drugs orsurgical procedures. A two year program in cardiology seems optimal.A minimum of one year in unusual circumstances might be sufficient.
The number of Clinical Cardiologists needed might be approximately sixto seven thousand. Hospital funding for these training programs shouldcontinue and need not be financed by the federal government.
Cardiac Specialist (institutional, primary)
He is identified as being generally younger, a product of a formal trainingprogram and is institutionally based. He may be a director of, or animportant physician in, a catheterization laboratory, but will also havegreater knowledge and competency in management of certain specificareas of clinical cardiology than the Clinical Cardiologist. He willdevote more of his time to research and teaching than the ClinicalCardiologist. If regionalization of cardiac care occurs, he will occupya position of great importance in the diagnosis and management of themore complex problems in a tertiary care center. He will be the con-sultant for major problems in this center as well as the specialist inthe catheterization laboratory and the non-invasive techniques laboratory.While certain of these individuals will spend their careers in an institution,some will provide these services from a private office. Ultimately theymay cease providing such service and attend more to the aspects of clinicalcardiology as they become older.
ISS

186
Attention should be given in training such that emphasis on clinical skillsfor this person, as well as tec:inical skills, are developed in the future.Training programs should assure the specialty of cardiology that theCardiac Specialist is not over-produced and that his present scope ofactivity is broadened to include a more extensive clinical base thanexists in some institutions today.
Standards for cardiac diagnostic and surgical centers have recently beendeveloped in a report submitted by a committee of the American HeartAssociation which recommends that those centers dealing with adultpatients with heart disease should perform a minimum of 250 cardiaccatheterizations and 150 operations employing extracorporeal circulationper year. Centers dealing with both pediatric and adult patients shouldperform a minimum of 350 catheterizations and 200 operations employingopen heart surgery per year. If such recommendations are eventuallyaccepted by agencies planning for future health care or by insurancecompanies presently funding these procedures, it will mean the eliminationof many smaller centers in community hospitals now performing too fewto qualify. It will restrict these efforts to groups of physicians higilyskilled in the procedures and to large centers. This is a desirable goalfor the future. It would be hoped that these centers would institutetraining programs which would be smaller in number but better inquality and more comprehensive in nature than the programs availablefor training for the Internist-Cardiologist or the Clinical Cardiologist.
The current number of physicians attempting Subspecialty Certificat!or:would indicate that current training programs are probably adequate toprovide the manpower pool for this group of cardiologists, bearing inmind the potentially useful duration of their careers could be as longas twenty years. Clearly there is a limit to the number of coronaryarteriographers and echocardiographers that are needed. One to twothousand of this type of physician appears to be reasonable in the totalnumber of practicing cardiologists.
Academic Cardiologist (Institutional, Secondary).
His role is not definable within a single profile and he will notspend the majority of his time in direct patient care. He will have someof the training and clinical expertise of those in other categories des-cribed above, such as at least one year in clinical cardiology, but hewill also be involved more in basic resP%,:n, clinical investigation,teaching or administration. The `-....ademic Cardiologist needs exposureto many, but not all, of the above disciplines and, in addition, trainingin basic science, the scientific method and basic and clinical research.Ms training should extend beyond a one-year cardiology fellowship toinclude two or three years of which one or more should be devoted entirelyto research.
189

187
The numbers of such individuals would be determined by the requirementsof scientists, instructors, leade:s and teachers. Three to five individualsper medical school with dispersion of some of these across communitylines would be the order of need. However, there would be several indivi-oua,s straddling an Academic or Cardiac Specialist career at all times, and,therefore, would be available to conduct some academic affairs within in-stitutions.
Presently there are too few of these people in this category and from ourstudy, it has been found that there are presently approximately two fund, edbut unfilled positions in each of the 190 programs responding completelyto the Training Program's Survey. Thus, there is an immediately definableand unmet need for this type of carelologist, although some of the positionscould also be filled presumably b" the group identified as the Cardiac Speci-alist. A reasonable estimate is that from 400 to 500 additional AcademicCardiologists should be developed from the training programs within thenext five years. These programs are most appropriate for sponsorshipby the federal government.
In summary of this section, it appears that there are four types of training pro-grams needed to provide the cardiology manpower for the future. The first isan improved program in card'ology for residents in internal medicine at any ofthe approximately 500 progrems already approved. The second is a one ortwo year program in clinical cardiology which could be given at any of the 329institutions providing longer training in cardiology. The third type of trainingcould be given in perhaps 100-150 institutions which possess a relativelysophisticated department of cardiology providing excellence in specific skillareas such as indirect methods, stress testing, cardiac catheterization andcoronary arteriography. The fourth type of program would be restricted to thoseinstitutions which, in addition to training Cardiac Specialists, can provide anacademic atmosphere and opportunities for research. Government fundingprobably is required for the Academic Cardiologist training program and possiblyalso for the Cardiac Specialist program.
COMMENTS
From the Cardiologists' Trainine Survey it was determined that 70 to 80 per-cent of them were of the opinion that there were about the correct number ofcardiologists in practice today. This may be true to accomplish today's goals,but it may not be true in view of the priority needs set forth in the report ofthe Chairman of the Heart and Blood Vessel Disease Panel of the National Heartand Lung Institute. The report of this panel made certain priority recommendationsin various areas of cardiology requiring greater emphasis in the future. If onewere to carry out these recommendations on atherosclerosis, thrombosis, hyper-tension, sudden death, myoce.rdial ischemia, heart failure and vascule: lesions,cardiologists will be needed in greater numbers than are present today.
190
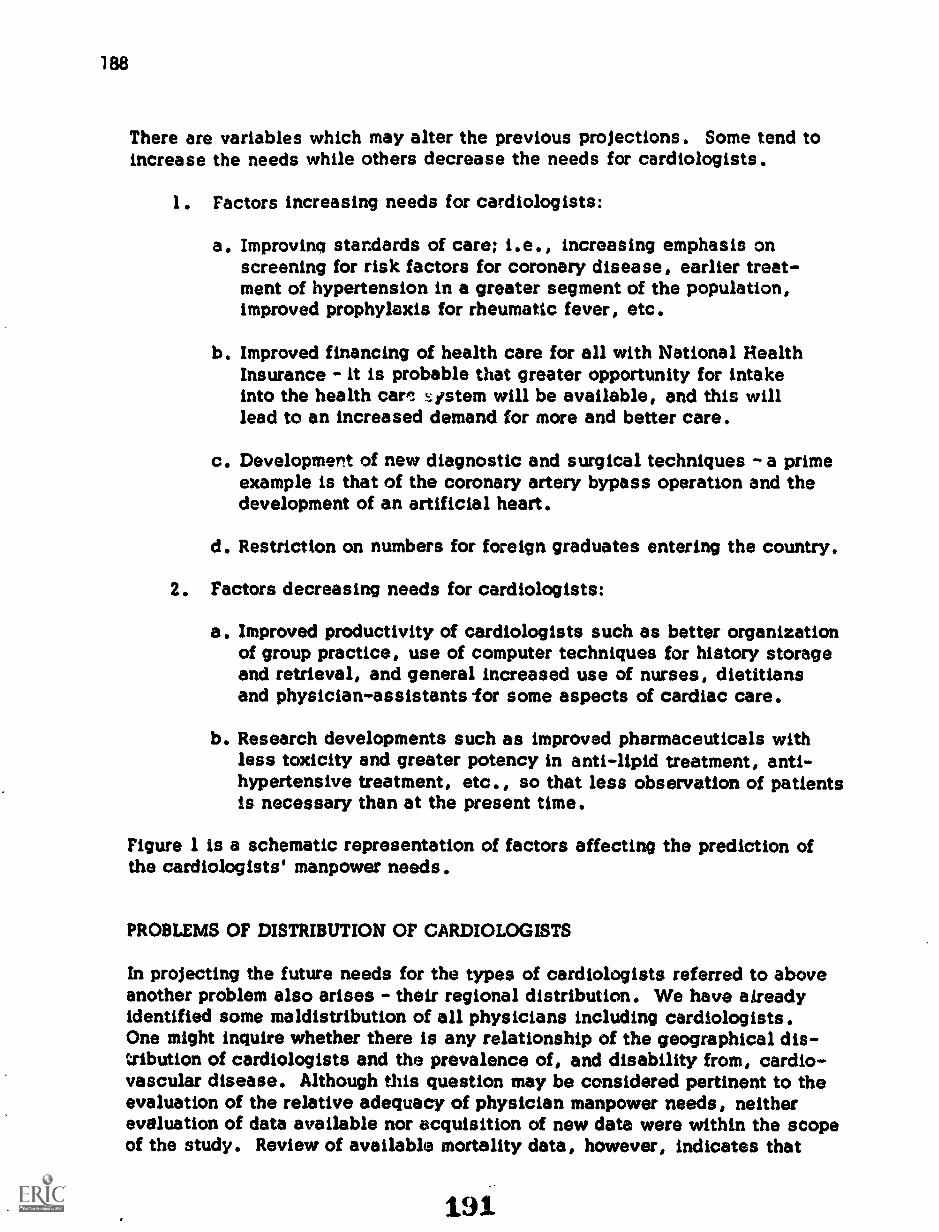
188
There are variables which may alter the previous projections. Some tend toincrease the needs while others decrease the needs for cardiologists.
1. Factors increasing needs for cardiologists:
a. Improving star.dards of care; i.e., increasing emphasis onscreening for risk factors for coronary disease, earlier treat-ment of hypertension in a greater segment of the population,improved prophylaxis for rheumatic fever, etc.
b. Improved financing of health care for all with National HealthInsurance - it is probable that greater opportunity for intakeinto the health care 4stem will be available, and this willlead to an increased demand for more and better care.
c. Development of new diagnostic and surgical techniques - a primeexample is that of the coronary artery bypass operation and thedevelopment of an artificial heart.
d. Restriction on numbers for foreign graduates entering the country.
2. Factors decreasing needs for cardiologists:
a. Improved productivity of cardiologists such as better organizationof group practice, use of computer techniques for history storageand retrieval, and general increased use of nurses, dietitiansand physician-assistants for some aspects of cardiac care.
b. Research developments such as improved pharmaceuticals withless toxicity and greater potency in anti-lipid treatment, anti-hypertensive treatment, etc., so that less observation of patientsis necessary than at the present time.
Figure 1 is a schematic representation of factors affecting the prediction ofthe cardiologists' manpower needs.
PROBLEMS OF DISTRIBUTION OF CARDIOLOGISTS
In projecting the future needs for the types of cardiologists referred to aboveanother problem also arises - their regional distribution. We have alreadyidentified some maldistribution of all physicians including cardiologists.One might inquire whether there is any relationship of the geographical dis-tribution of cardiologists and the prevalence of, and disability from, cardio-vascular disease. Although this question may be considered pertinent to theevaluation of the relative adequacy of physician manpower needs, neitherevaluation of data available nor acquisition of new data were within the scopeof the study. Review of available mortality data, however, indicates that
191

Figure 1
Schematic Representation of Factors Affecting
The Prediction of Cardiologist Manpower Needs
Size of Populationto be Served
Prevalenceof CV Disease\ 1
Demand forServices
189
Scientific Researchand Development
Socio-Economic , Basic andEducational and ContinuingPolitical Factors Education of
Cardiologists\zNumber of Cardiologists
NeededANN.
Rate of Changeof Number ofActive Cardiologists
Immigration Emigration
Retirement orChange ofProfessionalActivities ofCardiologists
Services Possible
/ I.11/4- Professional i
Efficiency ofa'Cardiologists
Rate at whichNon-Cardiologists andParamedical PersonnelAssume Responsibilities

190
significant regional differences exist in death rates from cardiovascular disease2.Thus, for example, the death rates for coronary heart disease for white malesaged 45 to 64 years are highest in the Middle Atlantic region, followed by therates for the South Atlantic and New England regions, and are lowest in theMountain region3, thus paralleling the distribution of cardiologists. On theother hand, the death rates from hypertensive disease are highest in the SouthAtlantic and East South Central reaions, for both whites and non-whites, inno evident relation to distribution of cardiologists4.
The question is - -can one be assured that the projected numbers of cardiologiststo be trained will locate in the areas of regional need? How can one preventthe North East and Middle Atlantic areas from further increasing their suirlywhile at the same time be assured that other areas such as the East SouthCentral will gather enough for its requirements ? This is a fairly crucial ques-tion, but until national goals of distribution are set and methods to implementthem developed, the present conditions will continue to operate to the dis-advantage of the deprived areas and thus further aggravate the present situation.
It has been stated recently that location of doctors may be more directly relatedto a state's per capita income regardless of the presence of medical schoolsin the area. The finding that many states with higher per capita income havemore doctors per 100,000 people than states with more medical schools couldease the agitation in some areas for the establishment of more schools to pro-duce more physicians. If this be true, then improvement of per capita incomeof the states may be more important than additional medical schools to pro-vide the attraction for physicians.
SUMMARY AND RECOMMENDATIONS
1. On the basis of a cardiologist to population ratio of 6 per 100,000, it isprojected that approximately 4,600 more cardiologists are needed inthe five year period ending December 1976.
2. Four functional types of cardiologists are identified and their suitablenumbers and their training needs are suggested.
3. The problem of maldistribution and some factors altering the projectedneeds are briefly discussed.
4. The standards for cardiovascular diagnosis and surgical centers developedby the American Heart Association and the Inter-Society Commission forHeart Disease Resources should be implemented.
2 Moriyama, 1.A., Krueger, D.E., and Stamler, J., Cardiovascular Disease inthe United States. Harvard University Press, Cambridge, 1971.
3 Ibid., p. 65.4 Ibid., p. 172.

CHAPTER 8
THE ADVISORY COMMITTEE'S DATA BASE
Robert C. Mendenhall and the USC DRME Staff
INTRODUCI'ION
191
The discussions in the preceding chapters were necessarily selective. TheAdvisory Committee, assisted by USC DRME, worked with technical reportsand analyses relating to each of the study's surveys and prepared the dis-cussions deemed appropriate for a final report. In this chapter, the statisticaltables and findings which support the preceding discussions are presented.However, data presented in earlier chapters are not repeated here unless theiromission would create obvious gaps in the presentation. With these data arAthose presented in the previous chapters, the reader has access to all databelieved to be important in the particular topical areas.
Data will be presented as they were obtained through each of the study phases.They will be presented for each of the survey instruments without regard to theirapplication to any one of the study's research objectives. Integration of dataobtained from the studies as it pertains to a research objective has been madein the Advisory Committee's presentations. Discussion will be limited to thatnecessary for an understanding of the data presented in a table or a series oftables. The utility of certain data will be noted as well as their limitations.
USC DRME CARDIOLOGY PROJECT STAFF
Many individuals within DRME and in organizations across the country per-formed important roles for this project. Some were involved almost continuously(as the DRME Staff), others assisted in a technical review capacity, and stillothers made the resources of their particular organization available as the studyneeded information. The list of individuals which follows is by no means ex-haustive; rather it singles out those whose involvement was essential or whosecontribution made a marked impact on the chapter and quality of the protect.
Beginning with individuals not part of the DRME:
Hi 'mon Castle, M.D., Chairman, Department of Family Medicine,University of Utah School of Medicine, contributed as a cardiologist,evaluator and physician who understands the characteristics of bothsmall urban area and rural medicine. Many useful ideas regardingthe design of study instruments were obtained from him.
194

192
George Mixter, M.D., Department of Medical Education, AmericanMedical Association, assisted in the design of the CardiovascularTraining Programs Survey and made his resources regarding trainingprograms available to us.
Cameron Brown, Department of Medical Education, American Medi-cal Association, assisted with the location of those institutionswhich train cardiologists.
James Haug, Survey Research Center, American Medical Association,provided the physician biographical data and address informationwhich constituted the source listing for over 95 percent of thephysicians in the study. These data permitted comparisons whichwere important methodologically and practically. He and his staffmade useful recommendations regarding content of study instrumentsas well.
Gene Roback, Survey Research Center, American Medical Association,reviewed study designs and provided extensive physician data. Shewas a ready and responsive source of information whenever requestswere made.
Donald T. Fredrickson, M.D. and Irving S. Wright, M.D., Inter-Society Commission for Heart Disease Resources, were particularlyhelpful during the early months of the study in assessing the adequacyof existing statistics regarding cardiovascular disease and reportsrelated to standards in cardiology.
David S. Blankenhorn, M.D., Professor of Medicine and Chief ofCardiology, USC School of Medicine, participated in study designplans and made his staff available for whatever pre-test activitieswere needed.
Francis Y 1( Lau, M.D., Professor of Medicine and Chief of Cardiology,Los Angeles County/USC Medical Center, was an active partner inall design, testing and analysis phases for the project. Dr. Lau'scontributions to the Cardiology Professional Diary and the Cardio-vascular Training Programs Survey designs were particularly important.
The DRME Staff participants:
ludilynn T. Foster, Ph.D., provided evaluation consultation and con-siderable encouragement at important study decision points. Shedeveloped the original DRME proposal and general design for the study.
Data preparation, statistical design, programming and computer pro-cessing was the responsibility of aoer A. Girard, Ph.D. In addition,he worked as a daily partner in formulating analysis plans and in
195

193
assessment of the data which were generated by those plans .Richard Neville, M.A., was equally involved in these activitiec.He worked closely with the analysis staff in formulating thespecific statistical analyses and performed the necessary pro-gramming to accomplish them.
Individuals who worked in conceptual design areas, in studyfield testing, in analysis planning and in actual analysis andinterpretation of results were with the project almost totally forno less than a year and in most Instances for the entire timeperiod.
Sharon Perrott, M .A participated in the last threestudies and had a major role in the log-diary analysesas well as the preparation of this report.
Kathryn McCreary, M.A., contributed to all study phaseswith primary responsibilities for the manpowev reports.
Dana Rico, M.S., contributed to each of the study phases,particularly the log-diary phase.
Beth Auqsburger, M.S., participated in both trainingstudies with a primary involvement in she study addressedto cardiologists.
Brenda Svanberg, participated in the initial cardiologysurvey and the data preparation activities for each of thestudies,
Technical editing assistance and advi,:e regarding level of detail forreporting was given by Muriel Wolkow, M.A.
Data preparation activities were extensive. Data had to be checked,coded and then prepared for eventual computer processing. Thoseprimarily involved in this activity included:
Phillip Abram'Deborah Abram'Monica JohanssonJeff MendenhallDorene WeinsteinStuart Wilbur
The secretarial staff under Maria Radovitch has been outstanding. Thosewho were most involved in this work include:
196

194
Roberta NatschkeMonica JohanssonAngela CrewSherry Roodhouse
The Inctructional Media Staff under William E. Millard, Ed.D., readilyaccommodated the project's demands for graphic works Lynda Dummel,Dan Garcia and their artists did the countless art work and design taskswhich were required.
CURRENT CARDIOLOGY MANPOWER AND ITS DISTRIBUTION
The tables and figures contained in Chapter Three were compiled from (1)statistics obtained through the Initial Cardiology Survey, (2) the "master file"of all eligible cardiologists, (3) the American Medical Association's statisticsregarding physician distributions by type of specialty, (4) the U.S. Bureau ofthe Census, U.S. Census of Population: 1970 and (5) Rand-McNally's ZIPCode Atlas: 1969. Data generated in this study were always used in preferenceto data from other sources. Secondary corroborative statistics (such as fromthe American Board of Internal Medicine) were used as appropriate and areclearly so designated when used. Table 1 presents distributive statistics forphysicians as of December, 1971.*
Statistical tables used by the Advisory Committee, but not included in theirdiscussion chapters, pertain to distributions by community size, practice ar-rangements, age groupings and certification. They are included here withlimited discussion for the reader who desires additional information.
Table 2 presents distributions for Primary Cardiologists and Secondary Cardi-ologists by community size.
The practice arrangements selected by cardiologists are summarized in Table 3.This table gives distributive statistics for Primary and Secondary Cardiologistsby specific practice arrangements under either Non-Institutional or Institutionalpractice. The distributions in this table are basic to all presentations whereindiscussions relate to the combination of Primary or Secondary and Institutionalor Non-Institutional. It will bca noted that:
o 64 percent of the Primary Cardiologists and 84 percent of theSecondary Cardiologists are in Non-Institutional practice.
o 31 percent of the Primary Cardiologists and 12 percent of theSecondary Cardiologists are in Institutiona) practice.
* This table also appears as Table 1 in Chapter Three.
197

1A822 I
811751C14/08 04111 134371111U1701i AND liATIOS 70 POIVIATIONI:
C2145115 C4V1510N ULM= MC141TV GOKNIPINGS
P11t51C1414 (1401
Mc lawn cacr3t11ic51
7041016 per 100.000 10801,4110111
Stationaltotal
Population
205,923,959100%
NeerEnglandPopulation
11,641,4635.1%
MiddleAtlantic
ropulation
37.190,04411.1%
SouthAtlhtlePopalation30,671,11734.0%
Cast -South
C410:41
Popokolop12.003.4706.2%
West-SouthConga;PoPialadon11,320,5601.4%
East-North044$41Fogulatios40,252.47611.5%
Warn-NorthC401:41
Pe1444$6016.311,1871.9%
bloonsain
PoiNdiedoa
8.201.5624.0%
Pricing
Otiouladoa
16,512,63112.1%
tuortifillos,
Clonal
parrPoiadetiori
1,711,0311.3%
Number Patio Number Patio Number Motto Number WI* 'Amber MU* Nvem$or Mateo 144.4.44 Sado Nvaeig Oaths Murder 840o Number Ammo Number Natio
e...11...n242111...A........2........,...........1101Alettelre5310etuf.1324 160.7 23,436 197.9 14.435 200.1 48,585 150.4 14,034 109.5 24,574 127.2 53,4115 112,9 1 21 574 132.7 11 /47weir 151.1ftrammmilWSI 142 195.0 5,004 221.5
All Active. Physicians
radars! 71.501 1,485 1,114 7,261 1,207 2.110 2.504 1,484 1,464 4.552 3,410
Non-rt.:legal 241.144 20,311 47.250 17,540 12,155 20.463 48.162 10,831 10,348 43,675 2,4414
total 310,645 150.1 21.674 164.7 70,444 161.4 44,811 144.1 13.362 104.4 23.373 121.0 50,144 125. 10,315 124.5 11.034 142.11 48,127 181.1 5,111 210.2
All Amt.* Savory 41.8 4/.2 50.3 42.1 12.7 34.4 14.0 14,0 40.2 81.0 55.2
Ora Ali Active Gensoti hectic* 26.1 25.7 /0.2 24.0 14.2 21.4 25.4 20.0 30.7 35.1 42.2
CZAll Active Weetticti Sprcialtirre 61.0 10.1 110.6 00.0 47.0 57.4 44.1 61.6 7I.5 17.0 120.8
mamma,
Yaggi3.14ettlead Sorciaitieg 166,955 81.0 13.011 101.1 42,218 110.8 24,541 00.0 4,017 47.4 11.115 S7 2$.1143 44.5 10,4tif 61.6 SAW 71,5 15,714 17.0 3.278 110.0
Primary Cardiology-7
5,441 3.0 4.5 4.6 3.1 1.1 1.1 2.2 1.0 1.7 3.4 2.5
IntenN11 Medicine 20.3 20.2 26.5 20.5 11.0 13.2 163 14.5 14.1 23.5 24.4
Other Specialties 37.7 76.2 /7.7 56.2 33.8 41.3 46.1 43,3 52.6 70.1 13.4
lawns! Medicine and Cardiology 23.3 33.7 33.1 23.8 13.2 11.3 14.4 11.) 18.9 24.4 27.4
Mowry Outttology2 3.0 4.5 4.0 3.3 1.1 2.1 1.1 1.0 2.7 1.4 2.5
Scceetsry CareliologY2 2.4 3.4 4.1 3.0 3.2 1./ 2.6 1.8 1.0 2.7 1.5
Other Internal Medici ne 11,7 15.6 24.3 12.5 10.2 113 14.2 14.1 14,4 20.0 23.4
imam
1St* claity groupings and dila pertaining total except osedsoiceelat 4444.144411nigi AN4,1440 Modica A 4446d*Clori.
plittilbation of PhYsicliirsa lb the United State* 3170.
'Data obtained bora Initial Cardiology Surray.
31.0thar iri6smal Matlictro total Sea little eteallat than rtight be We <s ea do** 03 swami of oar P444.4434440 awein this 4104 MORI" than 100 percent.
'U.S. liuriNes of the OMANI. U.S. CatiS11111 of POIPIUMSOft:Number oe' Intaitrtutote. nail import PC (1) - Al tweed swag swarsory
APO CM TIPO
Ceara Not4,4114144
Comet ?toeAvellabae

196
TABLE 2
DISTRIBUTION AND PERCENTAGE Or CARDIOLOGISTSWITHIN MEDICAL SERVICE COMMUNITY
BY SPECIALTY
MEDICALSERVICECOMMUNITYSIZEINTERNAL
PrimaryCardiology (CD)
SecondaryCardiology (CD)
AllCardiology (CD)
Number (N) Percent (%) Number (N) Percent (%) Number (N) Percent (%)
25,000 83 30.2 192 69.8 275 100.0
50,000 229 39.8 347 60.2 576 100.0
100,000 346 44.8 426 55.2 772 100.0
200,000 429 53.2 377 46.8 806 100.0
400,000 344 57.0 259 43.0 603 100.0
600,000 266 62.9 158 37.1 426 100.0
800,000 240 58.1 173 41.9 413 100.0
1,000,000 667 59.9 446 40.1 1113 100.0
2,000,006 386 61.6 241 38.4 627 100.0
3,000,000 238 59.9 159 40.1 397 100.0
4,000,000 120 55.6 96 44.4 216 100.0
5,000,000 479 55.8 379 44.2 858 100.0
TOTAL 3829 3253 7082
Source: 2
199

TA
BL
E 3
DIS
TR
IBU
TIO
N A
ND
PE
RC
EN
TA
GE
or
CA
RD
IOL
OG
IST
S W
ITH
INPR
AC
TIC
E M
OD
E:
BY
SPE
CIA
LT
Y
PRA
CT
ICE
MO
DE
Prim
ary
Seco
ndar
yA
ll C
ardi
olog
ists
.I
e c
'0k
1 1
-:
*0k
.I
er.
Tc
Non
-Ins
titut
iona
l
Solo
1246
32.7
1494
47.1
2740
39.2
Part
ners
hip
520
13.7
551
17.4
1071
15.3
Gro
up50
813
.348
915
.499
714
.3C
ombi
natio
n (O
ther
)14
93.
990
2.8
239_
3.4
Sub
Tot
al24
2363
.626
2482
.772
.2
Inst
itutio
nal
Hos
pita
l55
914
.720
16.
376
010
.9M
edic
al S
choo
l45
011
.814
24.
559
28.
5C
ombi
natio
n (O
ther
)15
24.
035
1.1
187
2.7
Sub
Tot
al11
6130
.537
811
.915
3922
.1
Oth
er Maj
ority
Oth
er20
95.
515
95,
036
85.
3C
ombi
natio
n O
ther
130.
414
0.4
27_0
.4
Sub
Tot
al22
25.
917
35.
439
55.
7
TO
TA
L38
0610
0.0
3175
100.
069
8110
0.0
Sour
ce: 2

198
Age as related to eptcialty and practice was important in several analyses.Table 4 provides age-grouped distributions by Non-Institutional and Institutionalpractice modes and by Primary and Secondary specialty. The 60 years-and-overgroup shows no significant differences. The 40 through 59 year age group differsfrom the other groups in important respects:
o 26 percent of Primary are in Institutional practices comparedto 11 percent for Secondary;
o 70 percent of Primary have Non-Institutional practices while85 percent of the Secondary are in this practice category.
The under 40 age group displays very large differences:
o 43 percent of the Primary and 71 percent of the Secondaryare in Non-Institutional practices;
s.) 47 percent of the Primary and 22 percent of the Secondaryhave Institutional practices.
The differences noted in the under 40 group may be partially explained by thepredominance of Primary Cardiologists in medical school and hospital-relatedclinical settings. Overall, the numbers are not very large and a preponderanceof Primary Cardiologists in the teaching-related activities would account formost of the differences.
Age Distribution by Census Divisions
The age composition of the physician group will have a direct bearing on thatgroup's stability over time. Ignoring for the moment the fact that the youngercardiologists will have the most recent exposure to the latest diagnostic andtreatment techniques and hence constitute a group which is qualitatively dif-ferent from the older cardiologists, the point at issue in the age distributiondata at this time is the stability of the cardiologist populeition in a particulararea. Tables 5, 6, and 7 provide age-grouped distribution by census divisionfor all active cardiologists. These data were generated from both AMA statisticsand survey findings. From inspection of Table 5 for cardiologists under age 40and Table 7 for cardiologists over age 60 it is observed:
o Middle Atlantic has the least favorable profile - 22 percentunder 40 and 29 percent over 60.
o New England has more under 40 (29 percent) than any areaexcept the South Atlantic but also has the next largest groupover 60 (22 percent). It would appear that this division isat least holding its own.
201

TA
BL
E 4
DIS
TR
IBU
TIO
N A
ND
PE
RC
EN
TA
GE
OF
CA
RD
IOL
OG
IST
S W
ITH
IN P
RA
CT
ICE
MO
DE
:B
Y A
GE
GR
OU
PIN
GS
AN
D P
RIM
AR
Y O
R S
EC
ON
DA
RY
SPE
CIA
LT
Y C
LA
SSIF
ICA
TIO
N
PRACTICE MODE
UNDER 40 YtARS
40JHRWcill 59 YtARS
60 YtARS All
OVER
Prim
es-.12C21X1rEY
N
Pantry
H
Sec
orry
Secorftary
im,
%N
x
PON-INSTITUTUDNAL
VO
RIN
NW
1011
1101
1111
111=
1110
1111
1111
111/
1111
1111
1111
1111
1111
01J1
1/
Solo
171
13.1
178
26.3
698
36.1
883
47.3
377
66.6
433
68.3
Partnership
181
13.8
147
21.7
28'
14.8
342
18.3
52
9.2
62
9.11
Group
169
12.9
135
20.0
295
15.3
296
15.9
44
7.8
58
9.1
Combineuon (other/
44
3.4
21
3.1
82
4.2
57
3.1
23
4.1
12
1.9
--__
---
----
Sub Total
t4;
565
43.2
481
71.1
1362
70.4
1578
84.6
496
87.7
565
89.1
INSTrITTIONAL
Hospital
320
24.5
93
13.8
204
10.5
89
4.8
35
6.2
19
3.3
Medical School
218
16.7
39
5.8
221
11.4
e9
4.8
11
1.9
14
2.2
Com
bina
tion
(oth
er)
77
5,9
152.2
68
3.5
19
1.0
71.2
10.7
--
Sub Total
615
47.1
147
21.8
493
25.5
197
10.6
53
9.3
34
5.4
1
OT
HE
R Majority other
126
9.6
47
7.0
70
1.7
80
4.3
13
2.3
32
5.0
Cool:61114d other
10.
11
0.1
80.4
10
0.5
40.7
--
3 -0.5
Sub
Tot
al127
9.7
48
7.1
78
4.1
904.
817
3.0
35
5.5
TO
TA
L1307
100,0
676
100.0
1933
100.0
1865
100.0
566
100.0
634
100.0
Sour
ce: 2

TA
BL
E 5
AG
E-G
RO
UPE
D D
IST
RIB
UT
ION
or
CA
RD
IOL
OG
IST
S B
Y C
EN
SUS
DIV
ISIO
N:
CA
RD
IOL
OG
IST
S U
ND
ER
FO
RT
Y Y
EA
RS
OL
D
Age
Gro
ups
Div
isio
n T
otal
Man
pow
erC
ensu
s D
ivis
ion
Sub
Age
,....
25-2
91
30-3
435
-39
Tot
alK
now
nO
ther
All
New
Eng
land
N7
7915
424
081
914
833
% o
f T
otal
29.3
100.
0
Mid
dle
Atla
ntic
N19
216
411
646
2942
5629
98%
of
Tot
al22
.010
0.0
Sout
h A
tlant
icN
1921
830
654
317
4726
1773
% o
f T
otal
31.1
100.
0
Eas
t-So
uth
Cen
tral
N1
2254
7730
711
19%
of
Tot
al25
.110
0.0
Wes
t-So
uth
Cen
tral
N5
8199
185
666
1768
3%
of
Tot
al27
.810
0.0
Eas
t-N
orth
Cen
tral
N11
134
239
384
1511
2715
38%
of
Tot
al25
.410
0.0
wes
t-N
orth
Cen
tral
N4
5083
137
532
2555
7%
of
Tot
al25
.810
0.0
Mou
ntai
nN
033
5487
324
1333
7%
of
Tot
al26
.910
0.0
Paci
fic
N8
130
262
400
1495
2815
23%
of
Tot
al26
.810
0.0
Car
ibbe
anN
07
2027
102
110
3%
of
Tot
al26
.510
0.0
Mili
tary
APO
/FPO
N2
127
2128
028
% o
f T
otal
75.0
100.
0...
......
......
......
......
......
......
......
......
......
......
.....
7698
2..m
unw
amm
op
1689
2747
1047
321
810
E91
TO
TA
LN %
of
Tot
al0.
79.
416
.126
.210
0.0
Sour
ce:
1, 2

TA
BL
E 6
Aa-
GR
OU
PED
DIS
TR
IBU
TIO
N O
F C
AR
DIO
LO
GIS
TS
BY
CE
NSU
SD
IVIS
ION
:C
AR
DIO
LO
GIS
TS
FRO
M F
OR
TY
TH
RO
UG
H F
IFT
Y-
NIN
EY
EA
RS
OL
D
Cen
sus
Div
isio
nA
ge G
roup
sD
ivis
ion
Tot
al M
anpo
wer
40-4
445
-49
50-5
455
-59
Sub
Tot
alA
geK
now
nI
Oth
er1
All
New
Eng
land
N13
110
097
7039
881
914
833
% o
f T
otal
48.6
100,
0
Mid
dle
Atla
ntic
N42
440
931
522
214
4029
4256
2998
% o
f T
otal
48.9
100.
0
Sout
h A
tlant
icr
272
294
222
145
933
1747
2617
73
% o
f T
otal
53.4
100.
0
Eas
t-So
uth
Cen
tral
N38
5350
4519
630
711
318
% o
f T
otal
60.6
100.
0
Wes
t-So
uth
Cen
tral
N11
710
4.
9857
376
666
1768
3
v. o
f T
otal
56.5
100.
0
Eas
t -N
orth
Cen
tral
N23
523
319
415
882
015
1127
1538
% o
f T
otal
54.3
100.
0
Wes
t-N
orth
Cen
tral
N79
8680
5229
753
225
557
% o
f T
otal
55.8
100.
0
Mou
ntai
nN
5667
443`
..19
932
413
337
% o
f T
out'
61.4
100.
0
Paci
fic
N24
324
419
717
786
114
9528
1523
% o
f T
otal
57.6
100.
0
Car
ibbe
anN
2814
1411
6710
21
103
% o
f T
otal
65.7
100.
0
Mili
tary
APO
/FPO
N7
00
07
280
28%
of
Tot
al25
.010
0.0
TO
MN
1630
1604
1311
1039
5584
1047
321
810
691
% o
f T
otal
15.6
15.3
12.5
9.9
55.3
100.
0
Sour
ce: 1
, 2

TA
BL
E 7
AG
E-G
RO
UPE
D D
IST
RIB
UT
ION
OF
CA
RD
IOL
OG
IST
S B
Y C
EN
SUS
DIV
ISIO
N:
CA
RD
ICL
OG
IST
S SI
XT
Y Y
EA
RS
OL
D A
ND
OV
ER
Cen
sus
Div
isio
nA
ge G
roup
s
Sub
Tot
al
Div
isio
n T
otal
Man
pow
er
60-6
465
-69
70-7
475
&O
ver
Age
Kno
wn
Oth
erA
ll
New
Eng
land
N85
5623
1718
181
914
833
% o
f T
otal
22.1
100.
0
Mid
dle
Atla
ntic
N38
224
215
379
856
2942
5629
98%
of
Tot
al29
.110
0.0
Sout
h A
tlant
icN
122
7839
3227
117
4726
1773
% o
f T
otal
15.5
100.
0
Eas
t-So
uth
Cen
tral
N19
185
244
307
1131
8%
of
Tot
al14
.310
0.0
Wes
t-So
uth
Cen
tral
N56
2712
1010
566
617
583
% o
f T
otal
15.8
100.
0
Eas
t-N
orth
Cen
tral
N14
074
5637
307
1511
2715
38%
of
Tot
al20
.310
0.0
Wes
t-N
orth
Cen
tral
N41
2618
1398
532
2555
7%
of
Tot
al18
.410
0.0
Mou
ntai
nN
1711
82
3832
413
337
% o
f T
otal
:7-7
100.
0
Paci
fic
N12
163
2822
234
3495
2815
23%
of
Tot
al15
.710
0.0
Car
ibbe
anN
32
21
810
21
103
% o
f T
otal
7.8
100.
0
Mili
tary
APo
/rPO
N0
00
00
280
28%
of
Tot
al0.
010
0.0
TO
TA
LN
986
597
344
215
2142
1047
321
810
691
% o
f T
otal
9.4
5.7
3.3
2.1
23:5
100.
0
Sour
ce:
2
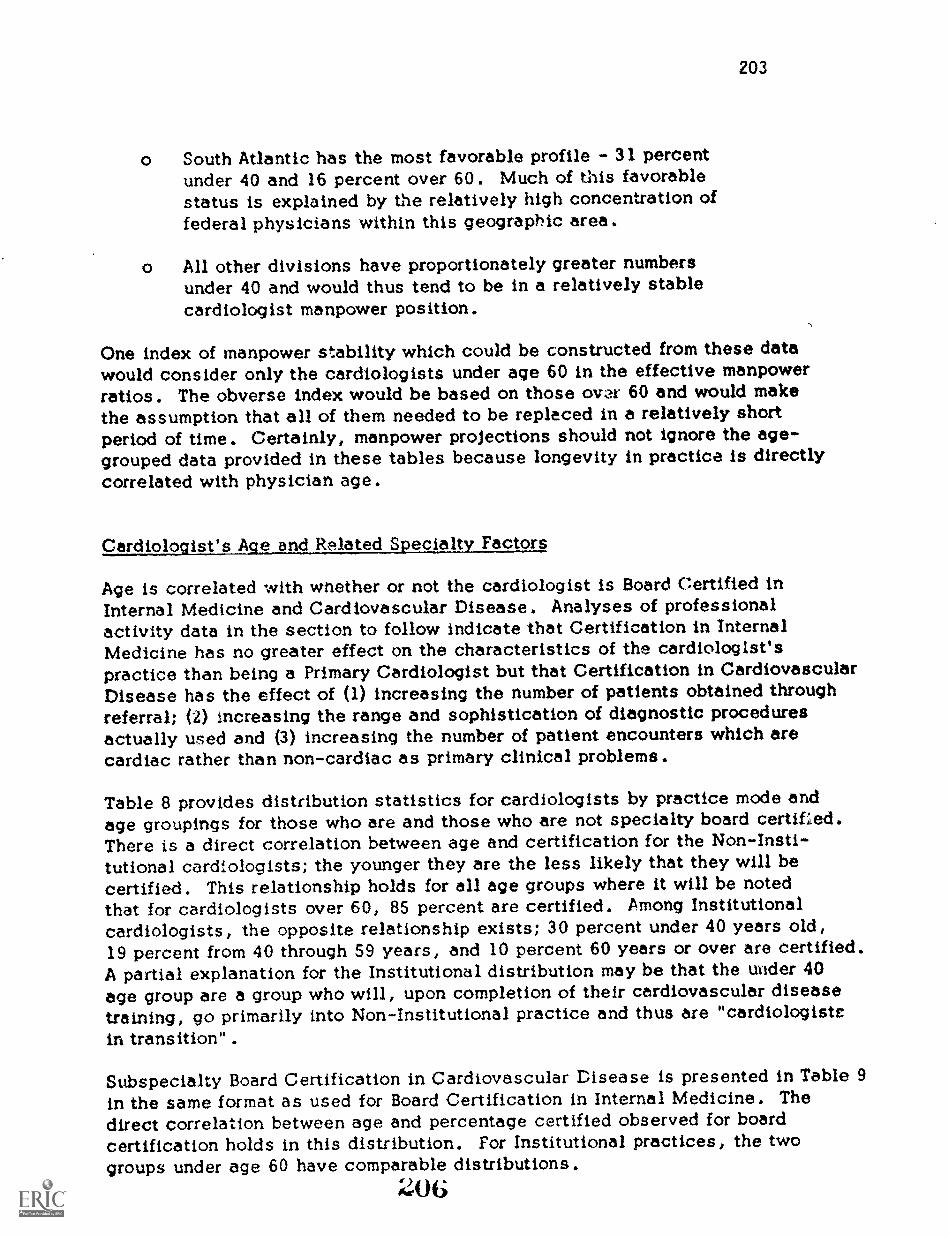
203
o South Atlantic has the most favorable profile - 31 percentunder 40 and 16 percent over 60. Much of this favorablestatus is explained by the relatively high concentration offederal physicians within this geographic area.
o All other divisions have proportionately greater numbersunder 40 and would thus tend to be in a relatively stablecardiologist manpower position.
One index of manpower stability which could be constructed from these datawould consider only the cardiologists under age 60 in the effective manpowerratios. The obverse index would be based on those over 60 and would makethe assumption that all of them needed to be replaced in a relatively shortperiod of time. Certainly, manpower projections should not ignore the age-grouped data provided in these tables because longevity in practice is directlycorrelated with physician age.
Cardiologist's Alt and Related Specialty Factors
Age is correlated with wnether or not the cardiologist is Board Certified inInternal Medicine and Cardiovascular Disease. Analyses of professionalactivity data in the section to follow indicate that Certification in InternalMedicine has no greater effect on the characteristics of the cardiologist'spractice than being a Primary Cardiologist but that Certification in CardiovascularDisease has the effect of (1) increasing the number of patients obtained throughreferral; (2) increasing the range and sophistication of diagnostic proceduresactually used and (3) increasing the number of patient encounters which arecardiac rather than non-cardiac as primary clinical problems.
Table 8 provides distribution statistics for cardiologists by practice mode andage groupings for those who are and those who are not specialty board certified.There is a direct correlation between age and certification for the Non-Insti-tutional cardiologists; the younger they are the less likely that they will becertified. This relationship holds for all age groups where it will be notedthat for cardiologists over 60, 85 percent are certified. Among Institutionalcardiologists, the opposite relationship exists; 30 percent under 40 years old,19 percent from 40 through 59 years, and 10 percent 60 years or over are certified.A partial explanation for the Institutional distribution may be that the under 40age group are a group who will, upon completion of their cardiovascular diseasetraining, go primarily into Non-Institutional practice and thus are "cardiologistsin transition" .
Subspecialty Board Certification in Cardiovascular Disease is presented in Table 9in the same format as used for Board Certification in Internal Medicine. Thedirect correlation between age and percentage certified observed for boardcertification holds in this distribution. For Institutional practices, the twogroups under age 60 have comparable distributions.
206

TA
BL
E 8
DIS
TR
IBU
TIO
N A
ND
PE
RC
EN
TA
GE
OF
CA
RD
IOL
OG
IST
S W
ITH
IN P
RA
CT
ICE
MO
DE
:B
Y A
GE
GR
OU
PIN
GS
AN
D S
PEC
IAL
TY
BO
AR
D C
ER
TIF
ICA
TIO
N S
TA
TU
S
PRA
CT
ICE
MO
DE
UN
DE
R 4
0 Y
EA
R.1
40 T
HR
OB
H 5
9 Y
EA
RS
60 Y
EA
RS
AN
D O
VE
RN
ot B
oard
Cer
tifie
dB
oard
Cer
tiiir
dN
ot B
oard
cert
lfir
Boa
rdSaaltied
Not
Boa
rd.
-,.
Boa
rd-
..
.
NO
N-I
NST
ITU
TIO
NA
L
Solo
217
18.5
132
16.3
762
50.9
819
35.A
447
77.2
363
58.5
Part
ners
hip
148
12.6
180
22.3
195
13.0
434
18.9
427.
372
11.6
-
,Gro
up13
711
.716
720
.716
511
.042
618
.531
5,4
7111
.4
Com
bina
tion
(Oth
er)*
423.
623
2.8
483.
291
4.0
162.
819
3.1
Sub
Tot
al54
446
.450
262
.111
7078
.117
7077
.053
692
.752
584
.6
IMST
ITyT
ION
AL
Hos
pita
l29
825
.411
514
.211
87.
917
57.
619
3.3
355.
6
Med
ical
Sch
ool
162
13.8
9511
.810
67.
120
48.
95
0.9
203.
2
Cor
ot in
atio
n (O
ther
)60
5.1
324.
025
1.7
627
20.
36
LI
Sub
tota
l52
044
.324
230
.024
916
.744
1
.....2..:
-
19.2
264.
561
9.8
OT
HE
R
Maj
ority
Oth
er11
09.
263
7.8
674.
583
3.6
162.
629
4.6
Com
bina
tion
(Oth
er)*
10.
11
0.1
120.
76
0.2
10.
26
1.0
Sub
Tot
al11
19.
364
7.9
195.
289
3.8
172.
835
5.6
......
......
......
......
......
......
......
......
......
......
...~.
......
~...
......
..0...
,.T
OT
AL
1175
100.0
808
100.0
1498
100.0
2300
100.0
579
100.0
621
100.0
Sour
ce: 2

TA
BL
E 9
DIS
TR
IBU
TIO
N A
ND
PE
RC
EN
TA
GE
OF
CA
RD
IOL
OG
IST
S W
ITH
IN P
RA
CT
ICE
MO
DE
:B
Y A
GE
GR
OU
PIN
GS
AN
D S
UB
SPE
CIA
LT
Y B
OA
RD
CE
RT
IFIC
AT
ION
ST
AT
US
LiN
DE
T!
40 Y
EA
RS
40 T
HR
OU
GH
Not
Cer
tifie
d
59 Y
EA
RS
Subs
peci
alty
Boa
rdC
ertif
ied
kg_y
im A
ND
OV
ER
Not
Subs
peci
alty
Boa
rdC
ertif
ied
iC
ertif
ied
PRA
CT
ICE
MO
D!:
Not
Ce:
tifie
dSu
bspe
cial
ty B
oard
Cer
tifie
d
... 1
......
.N
N
NO
N-I
NST
ITU
TIO
NA
L
Solo
340
18.1
99.
314
9844
.283
20.4
723
68.9
8757
.6
Part
ners
hip
309
16.5
1917
.456
216
.667
16.5
989,
3t6
10.6
Gro
up28
014
.924
22.0
516
15.2
7518.5
888.
414
9.3
Com
bina
tion
(Oth
er)*
603.
25
4.6
119
3.5
204.
929
2.8
64.
0
+c
s.i
Sub
Tot
allib
.ry
e
989
52.7
5752
.326
9579.5
245
60.3
938
89.4
123
81.5
INST
ITU
TIO
NA
L
Hos
pita
l39
621
.117
15.6
251
7.4
4210
.348
4.6
64,
0
Med
ical
Sch
ool
236
12.6
2119
.323
06.
880
19,7
141.
311
7.3
Com
bina
tion
(Oth
er)*
884.
74
3.7
672.
020
4.9
400
44
7.6
Sub
Tot
al72
038
.442
38.6
548
16.2
142
34.9
666.
321
13.9
OT
HE
R.-
.M
alor
ity O
ther
163
8.7
109.
113
23.
818
4.4
383.
67
4,6
Can
bina
tion
(Oth
er)*
20.
20
0.0
170.
51
0.4
70.7
..
00.0
Sub Total
165
8,9
10
9.1
149
4.3
194.
845
4.3
74.6
TOTAL
1874
100.
010
9100.0
3392
100.0
406
100.0
1049
100.0
151
100.0
* A
ge g
roup
ed c
ardi
olog
ist i
nclu
de o
nly
thos
e w
hose
age
is k
now
n
Sour
ce: 2

206
rears Since Medical Degree Relating to Certification
The average non-federal cardiologist was 48 years old; the federal cardiologistswere seven years younger. In Tables 10, 11, 12 and 13 the relationship of ageto Board Certification in internal Medicine and Subspecialty Board Certificationin Cardiovascular Disease is noted.
Years of prepartttion for practice and the average amounts of time in preparationare noted in the section of this chapter devoted to the Cardiologist's TrainingSurvey data and the Cardiovascular Training Programs Survey data.
General Characteristics of Cardiologists' Practices
The Advisory Committee in approaching the task of defining the roles whichcardiologists perform has focused on the activities which characterize differentpractice modalities. In essence, what cardiologists do is the primary categori-zation factor.
In the preceding section, tables supporting the Advisory Committee's manpowerdistribution analyses were presented. These included distributions by censusdivision, age and age-related factors, distributions by types of practice anddistributions by meeical service community size.
In this section, tables are presented pertaining to:
o Patient sources
o Distribution of time to professional activities
o Utilization of specialized skill is and knowledge
The tables support the discussion of cardiologists' roles provided in Chapter 4.In the section to follow, comparable data from the log-diary study will bepresented. The data have been tabulated in several ways to document thepresence or absence of one factor as a primary contributor to the particularstatistic.
o Tables 14 through 18 relate to referral
o Tables 19 through 22 relate to distance
o Tables 23 through 26 relate to practice mode
o Tables; 27 through 33 present the proportion of time In professionalactivities
0 9

TA
BL
E 1
0
AV
ER
AG
E Y
EA
RS
SIN
CE
DO
CT
OR
OF
ME
DIC
INE
DE
GR
EE
FO
R F
ED
ER
AL
PH
YSI
CIA
NS:
BY
SPE
CIA
LT
Y B
OA
RD
CE
RT
IFIC
AT
ION
AN
D P
RIM
AR
Y O
RSE
CO
ND
AR
Y S
PEC
IAL
TY
CL
ASS
IFIC
AT
ION
FED
ER
AL
PHY
SIC
IAN
CL
ASS
IFIC
AT
ION
SPE
CIA
LT
Y
AL
LFE
DE
RA
LC
AR
DIO
LO
GIS
TS
Prim
ary
Car
clio
loci
ist
Seco
ndar
yC
ardi
olog
ist
num
ber
(N)
year
snu
mbe
r (N
)ye
ars
year
snu
mbe
r (N
)
Non
-Boa
rd C
ertif
ied
Boa
rd C
ertif
ied
Ave
rage
Yea
rs
11 16 14
129
163
15 23 19
69 58
12 18 15
' 198 22
1
Tot
al N
umbe
r (N
)29
212
741
9
Sour
ce:
2

TA
BL
E 1
1
AV
ER
AG
E Y
EA
RS
SIN
CE
DO
CT
OR
OF
ME
DIC
INE
DE
GR
EE
FO
R N
ON
-FE
DE
RA
L P
HY
SIC
IAN
S:B
Y S
PEC
IAL
TY
BO
AR
D C
ER
TIF
ICA
TIO
N A
ND
PR
IMA
RY
OR
SEC
ON
DA
RY
SPE
CIA
LT
Y C
LA
SSIF
ICA
TIO
N
NO
N-F
ED
ER
AL
PHY
SIC
IAN
CL
ASS
IFIC
AT
ION
SPE
CIA
LT
Y
AL
LN
ON
-FE
DE
RA
LC
AR
DIO
LO
GIS
TS
Prim
ary
Car
diol
ogis
tSe
cond
ary
Car
diol
ist
year
snu
mbe
r (N
)ye
ars
num
ber
(N)
year
snu
mbe
r (N
)
Non
-Boa
rd C
ertif
ied
) I
Boa
rd C
ertif
ied
Ave
rage
Yea
rs
19 23 21
1526
2144
23 25 24
1637
1575
21 24 22
3162
3719
Tot
al N
umbe
r (N
)36
7032
1268
82
Sour
ce:
2

TA
BL
E 1
2
AV
ER
AG
E Y
EA
RS
SIN
CE
DO
CT
OR
OF
ME
DIC
INE
DE
GR
EE
FO
R F
ED
ER
AL
PH
YSI
CIA
NS:
BY
SU
BSP
EC
IAL
TY
BO
AR
D C
ER
TIF
ICA
TIO
N S
TA
TU
S A
ND
PR
IMA
RY
OR
SEC
ON
DA
RY
SPE
CIA
LT
Y C
LA
SSIF
ICA
TIO
N
FED
ER
AL
PHY
SIC
IAN
CL
ASS
IFIC
AT
ION
SPE
CIA
LT
Y
Prim
ary
Car
diol
ogis
t
year
snu
mbe
r (N
)
AL
L
Seco
ndar
yFE
DE
RA
L
Car
diol
ogis
tC
AR
DIO
LO
GIS
TS,
year
snu
mbe
r (N
)ye
ars
num
ber
(N)
Non
-sub
spec
ialty
Cer
tifie
d
Subs
peci
alty
Cer
tifie
d
Ave
rage
Yea
rs
Tot
al N
umbe
r (N
)
Sour
ce: 2
13 19 14
262 30
18 25 19
118
15
920 15
380 39
292
127
419

TA
BL
E 1
3
AV
ER
AG
E Y
EA
RS
SIN
CE
DO
CT
OR
OF
ME
DIC
INE
DE
GR
EE
FO
R N
ON
-FE
DE
RA
L P
HY
SIC
IAN
S:B
Y S
UB
SPE
CIA
LT
Y B
OA
RD
CE
RT
IFIC
AT
ION
ST
AT
US
AN
D P
RIM
AR
Y O
RSE
CO
ND
AR
Y S
PEC
IAL
TY
CL
ASS
IFIC
AT
ION
NO
N-F
ED
ER
AL
PHY
SIC
IAN
CL
ASS
IFIC
AT
ION
SPE
CIA
LT
Y
AL
LN
ON
-FE
DE
RA
LC
AR
DIO
LO
GIS
TS
Prim
ary
Car
diol
ogis
tSe
cond
ary
Car
diol
ogis
t
year
snu
mbe
r (N
)ye
ars
num
ber
(N)
year
snu
mbe
r (N
)
Non
-sub
spec
ialty
Cer
tifie
d
Subs
peci
alty
Cer
tifie
d
Ave
rage
Yea
rs
20 25 21
3087 58
3
24 32 24
3127 85
22 26 22
6214 66
8
Tot
al *
umbe
r (N
)36
7032
1268
82
Sour
ce: 2

TA
BLE
14
prnurrAor or C
AR
DIA
C T
AT
IINT
Snrauda T
oPH
YSIC
LA
NB
y TY
PE O
F RE
FER
RA
L SO
UR
CE
tC
EN
SUS orvIsioN
BY
PHY
SICIA
N A
GE
GR
OU
PING
S
PHY
SICIA
NA
GE
GR
OU
PING
S
Group
Total
NO
RT
HE
AST
SOU
TH
NO
RT
H C
EN
TR
AL
.M
POSSE
SSION
SST
APO
/TPO
.2
* c44
4,,Y
.
-c 41 :C
u-C
'.'cCli
:i.
-5ao -v;
a.
e t(44 0
.45o66 Ts
4;17
8, 40
. . .i3-c6'
r.a C.:
c-6Z ^-
,to
Zs Z
ii (1.5
c-7;
Zi)
0-47;
10a.
0'.. '43- cm
40 0r,
...:..5,
1%
.,.."
c. > N
I
2C0.4t
Less T
han 40 Years
ID
istribution (N)
1919170
414386
58137
26398
67298
1513
;Yoe of R
eferral:
own practice
44.446.6
46.4.46.3
44.337.9
39.950.8
46.643.5
48.017.7
from other physicians
43.744.0
40.142.6
47.944,2
47.747.2
40,646.4
30,727.3
other (agencies)11.8
8.813.5
11.17.7
17.912.4
2.012.9
41:/.121.3
55.0
40 Through 59 Y
earsD
istribution (N)
3709264
947596
139252
548203
140573
425
Tv.oe of R
eferral:
own practice
64.567.5
66,565.0
60.161.7
63.460.6
68.763.3
67.534.0
from other physicians
29.327.0
26.629,1
32.631.8
31.935.8
27.529.2
23,150.0
other (agencies)6.1
5.56.9
6.07.3
6.44.7
3.63.8
7.59,5
16.0
60Years
And
ON'er
Distribution (N
)1212
106463
15224
64166
6529
1385
0,0
TY
De of R
eferral.,
own practice
75.076.2
77,971.7
68.678.4
74,270.0
78.270.7
54.00.0
from other physicians
18.819.9
16.918.2
15.316,5
22,124.0
16.920.0
42.00.0
other {agencies)6.2
3.85.2
10.116,2
5.13.6
6.14.9
9.34,0
0.0
Source:
2

raiN)
TA
BL
E 15
PER
CE
NT
AG
E or C
AR
DIA
C PA
TIE
NT
S RE
FER
R.I.D
s TO
PHY
SICIA
NB
Y T
YPE
or RE
FER
RA
L SO
UR
CE
:C
EN
SUS D
IVISIO
N SY
SPEC
IAL
TY
........m.....u..m
...
CA
RD
IOL
OG
YSPECIALTY
Group
Total
NO
RT
HE
AST
S01.71
x5o -C
A 0
6t
-0 c4'(.4 Q
.=50.0 -.1
??,6.6'
...
A 4
; .1;
J(Of
.5ts:.. C*64 Q
y VIT
AL
..c-t'
70or* Z
A c
; ',
WE
ST
to
...C13a.
'4A
POSSE
SSION
S,
API/T
P0
.0C4;.';./4
3.;
.u
;a''C
'-0
02.1c
vA
75 c. ...co .4
,';,..i.
A.
ri.I
o QV
A ,... C
22
,34
.....w........
Primary C
ardio logistthstrAbhason (N)
3773309
1008
599
123
265
516
193
149
564
42
s
TYpt_ofReferral:
own pract.scap
50.4
50.0
55.5
48.8
46,9
46.S
45.5
47.7
53.1
49.3
60.1
10.0
from other physictims
41.2
41.9
36.6
41.5
41.9
42.3
46.8
49,2
38.0
42.2
26.1
30,0
other
iog enc. *es)8.4
6.97.9
9.711.2
11.27.7
3.2
8.9
8.5
13.8
60,0
Secondary Cardiologist
Dkstraoutson
(N)
3156
237
IC:,
552
101
194
474
184
92
453
21
13
Typt of R
elerral:
own practice
72.9
77.3
75.8
70.8
68.9
70.6
73.2
71.9
81.1
69.8
66.6
26.9
from other
physician*
19,9
17.1
15.8
21.9
25.6
21.4
21.5
23.6
15.8
21.7
25.8
35.0
other (agencies)7.1
5,6
8.3
7.3
5.5
7.9
5.3
4,6
3.2
8.5
7.6
31.1
Source: 2

TA
BL
E 16
PER
CE
NT
AG
E O
F CA
RD
IAC
PAT
IEN
TS R
EFE
RR
ED
TO
PHY
SICIA
NSY
TY
PE O
F RE
FER
RA
L SO
UR
CE
:C
EN
SUS D
IVISIO
N 82'1)0A
R!) C
ER
TIFIC
AT
ION
t 4Pi'm
s.iw
BO
AR
DC
ER
TIFIC
AT
ION
Group
Tot4i
NR
TH
EA
STSO
UT
HN
OR
CE
NT
RA
LW
EST
POSSE
SSION
SA
PO'
mcc3 -4. cZ
.1..:
* --a 45 ,..'
v
cr,,,
.c3cr,711.
i -4:,
4'c.a Q
cS.02
7: -i.
3c3
.cF5
Z -4";
.....z.
7.; cc 'I,i. (.)
.citiz -274; z
3(;
cu-1.748)a.
6?: -i-rt ci.c:
-t.
. cI ; ti
Rsi2
8o4rrS Ce.ifiec
Distribution (N
)3769
315944
647122
241556
210144
55623
11
rpe of Referral:
59.7
33.3
7.1
61.4
32.0
6.6
63.3
30,4
6,4
58.7
33.7
7.6
54.1
36.7
9,1
55.7
34,8
9.5
56.1
38.2
5.7
57.5
37,7
4.8
66.5
26.8
6,7
60.0
32.0
0.0
59,7
29.2
11.1
17.7
38.6
43.6
own practice
from other physicians
ot.ter (.!-;e ncies)
Non-B
oard Certified
Distribution (N
)3160
231099
504102
218434
16797
41;140
7
*Type of R
eferral:
61.8
29.4
8,7
63.6
29.9
6.1
66.3
23.9
9.9
60.2
30.1
9.7
60.0
32.0
8.0
57.7
32.1
10.2
62.2
30.1
7.6
61.9
35.5
2,6
59.7
33.5
6.8
56.6
34.3
9.1
63.8
24.2
12,1
29.3
25.7
45.0
own practice
from. of
physicians
other (agencies)
.....;
Source: 2

TA
BL
E 17
PER
CE
NT
AG
E O
F CA
RD
IAC
PAT
1EN
TS R
EFE
RR
ED
TO
PHY
SICIA
NB
Y T
YPE
OF R
EFE
RR
AL
SOU
RC
E:
CE
NSU
S DIV
ISION
HY
CA
RD
IOL
OG
Y SU
BSPE
CIA
LT
Y B
OA
RD
IN C
AR
DIO
VA
SCU
LA
R D
ISEA
SE C
ER
TIFIC
AT
ION
CA
RD
IOL
OG
YSU
BSPE
CIA
LT
Y B
OA
RD
IN C
AR
DIO
VA
SCU
LA
RD
ISEA
SE C
ER
TIFIC
AT
ION
Group
Total
NO
RT
HE
AST
SOU
TH
NO
RT
H C
EN
TR
AL
WE
STPO
SSESSIO
NS
APO
/FPO
it,c3,4 ,z .:
o-F3
...d1;:t
:c-
o=X
c43 40 Z
.c''.2 :I
t:c:I C
)
...tt7:4.
....,
SI c
i' C!
dc...ZS
z 4L
.,,..C
a C, )
..,Y5z --
. bS c3u
cZiC
0r),a.
8 i2
t.)2
.-
..: 2k >
g
.2a.'22.4
Carasolo9Y
Cerafle4
Distriout3or. (N
)670
52164
11826
6096
4S30
725
2
lx2e of Referral:
oval practice46.5
49.748.6
45.935.7
44.546.5
42.848.4
46.373.4
S.0
froth other Physicians45.8
42.343.1
45.6S0.8
49.147.7
53.345.1
45.14.4
95.0
other la9enoes)7.7
7.98.3
8.513.6
6.45.8
3.96.5
8.622.2
0.0
Non-C
ardlology Certaied
Dtstrioutton (N
)6259
4941679
1033198
399894
332211
94558
16
Type of R
eferral.
62.263.6
66.360.9
59.658.5
60.161.7
66.059.4
61.324.4
own practue
from other physicians
30.030.0
25.630.6
32.431.1
33.334.4
27.332.1
27.925.9
other (a Q encies)
7.96.2
8.18.5
8.010.4
6.63.8
6.88.5
10.849.7
..................................-...............................................................,
Source:2

TA
BL
E 18
PE
RC
EN
TA
GE
OF
CA
RD
IAC
PA
TIE
NT
S R
EF
ER
RE
D T
O P
HY
SIC
:AN
BY
TY
PE O
f RE
FER
RA
L SO
UR
CE
:C
EN
SUS
DIV
ISIO
N 8Y
AM
ER
ICA
NC
OL
LE
GE
Of' C
AR
DIO
LOG
Y M
EM
IUR
SH
/P
Am
ER
ICA
NC
OL
LE
GE
Or
CA
RD
IOLO
CJY
(.4.0 .0 .1M
EM
BE
RS
HIP
NO
RT
HE
AS
TS
OU
TH
NO
RT
1t CE
NT
RA
L
PO
SS
ES
SIO
NS
AP
V/E
PO
Group
Total
.r,c, 72,0 CZ
6.3
0u
-73'5
'V V
2 rc
''').
,c -45
V0 ...
n ...4-
c5....
v?2.....
4 C0 V4.40
.c...o011; te
(43
-5i
b....
2 0̂
!-
,tT
O Z
0 cyM
A ti
MA
{.)9
c;7d07
vZeof
a.40012:10:11.
357
0-2
v TOc
tit0 Q; ...)
t'0
Q4.
214
A . C
. . C . K
embership
Distsinxlon (N
)1
2265
f
ISE
666315
81154
291130
88
Type 01
Referrel:
58.0
134.8
7.1
56.4
36.9
6.6
66.6
27.0
6.4
53.6
37.6
8.8
48.6
41.4
10.0
46.4
44,4
9.3
54.5
39,1
6.4
54.6
40.9
4.S
58.8
34,2
7.0
58.1
35.1
6.4
60.2
31.9
7.9
27,5
27.5
45.0
own practice
from other
physicians
other (agencies)
Non -A
.C.C
. Mem
bershipD
ist/lb.:tr.-in (N)
46643d8
1177836
143305
699247
153660
4214
Type
of Referral:
f
61.5
29.9
8.2
64.7
28.8
6.2
63.7
27.3
9.0
61.5
30.1
8.4
61.5
30.7
7.9
61.9
28.0
10.1
60.6
32.8
6.6
62.0
34.5
3.5
66.7
26.8
6,6
'50.7
31.9
9.4
63.3
23.1
13.6
20.7
35,4
43.9nO.....aC
A
own practice
from other
physicians
theisigencies)
Source: 2

TA
BL
E 19
PER
CE
NT
AG
E O
F CA
RD
IAC
PAT
IEN
TS B
Y M
ILE
AG
E D
ISTA
NC
E FR
OM
PHY
SICIA
N:
CE
NSU
S DIV
ISION
S BY
SPEC
IAL
TY
tv
C7)
CA
RD
IOL
OG
YSPE
CIA
LT
YG
roup
Total
NR
,0
H,.;
HE
NT
RA
L1
WE
S;PO
SSESSIO
NS
APIC
..PPO
IDc3 s4) cZ V3
s.)
1.' -1:,
,cS .7.....<
.)
,c Z00 ...V)
ec
50 -,'I 2Z0 44:a U
..c5v.' 72; *4V
400
21;g
4?
4.;0
.c.6z -.
2
VW0
ci;0
-C.
z.:
07)Va.
u c;2
-1;
a c0 0
73cc.)
4Z
i ..: c°2_
r- > N
I<
Primary C
ardiologistD
;strib4;ttor, (N)
36022S4
963570
121249
500182
136546
383
:
Mileage:
less than 5
S to
25
over 25
36.8
49.5
13.8
39.1
50.3
10.6
46.1
47.3
6.6
35,6
48,5
15.9
24.1
50.1
25.8
28.5
48,7
22.8
31.6.
54.0
14.4
21,6
44.5
33.9
37.0
46.3
16.7
36.3
52.4
11.3
42.8
49.5
7.7
20.7
59.0
20.3
Secondary Cardiologist
Disuibution (N
)3004
226798
52198
18E454
17290
42622
11
Mileage:
46.4
47.6
6.0
53.4
42.7
3.9
55.0
42.2
2,8
43.3
49.8
6.9
31,4
55.1
13,5
38.5
49.7
11.8
42.8
52.6
4.6
36.3
49.2
14.5
48.0
45.6
6.4
45.5
49.3
5.2
38.6
52,8
8.5
46.8
36,4
16.8
less than 5
5 to 25
over 25
Source: 2

TA
BLE
20
PER
CE
.VT
AG
E O
F CA
RD
IAC
PAT
IEN
TS B
Y M
ILE
AG
E D
ISTA
NC
E FR
OM
PHY
SICIA
N:
CE
NSU
S DIV
ISION
BY
BO
AR
D C
ER
TIFIC
AT
ION
BO
AR
D,.
CE
RT
IFICA
MO
N',...
p
Group
Total
NO
RT
1EA
B I'
sotr: TO
R?
CE
NT
RA
LW
E T
POSSE
SSION
SA
PQ/M
)
..(:1cV
30,
, ,z L.4
u8.) -
T:3 V
5 z
u
3C0 -v, 4
.c-o0v.:-.1.3
...t:.., cto,,
4,6,
L)
.c-gup To.
i(7))
t-tZ -.3,
11; C. 4
4.30
.ch.Z
-136.
7t.4
al3 (43
c-2Cao
0....
7).vQ
.
61;2
u c- 4E
Xuo,.
.4.)
4V
-2
cE >
7 NI
Board C
ertifiedD
istribution 003630
302919
615120
230536
196138
54223
9
;Mileage:
less than 539.4
42,748.0
38.024.3
28.035.1
26.B42,7
41,136.3
40.2
5 to 2549.0
48.946,8
49.452.7
49.153.7
45.043.6
50.052.7
40.8
over 2511.5
8.55.2
12.623.0
22.911,2
28.213.7
8.911.0
19.0
Non-B
oard Certified
DiStriD
utior. (N)
2976218
842476
99205
418158
88430
375
)41.1eage:
less than 543.3
49.0
52.5
40.9
31.1
38.2
39.2
31.2
39.3
39.5
44.4
43.0
5to
25
48.1
.44.5
43.0
48.7
52.0
49.1
52,9
49.0
49,8
52.3
49.5
42.0
over25
8.6
6.6
4.5
10.4
16,9
12.7
7.9
19.8
11.0
8.2
6.1
15.0
sNppiopmmi.wmppmpmmm.N.....wmww.w...r.,..m..m................i.00.
Source: 2

TA
BL
E 21
PER
CE
NT
AG
E O
F CA
RD
IAC
PAT
IEN
T'S B
Y M
ILE
AG
E D
ISTA
NC
E FR
OM
PHY
SICIA
N:
CE
NSU
S DIV
ISION
BY
CA
RD
IOL
OG
Y SU
BSPE
CIA
LT
Y B
OA
RD
IN C
AR
DIO
VA
SCU
LA
R D
ISEA
SE C
ER
TIFIC
AT
ION
CO
CA
RD
IOL
OG
YSU
BSPE
CIA
LT
Y B
OA
RD
IN C
AR
DIO
VA
SCU
LA
RD
ISEA
SE C
ER
TIFIC
AT
ION
...............
Group
Total
NO
RT
HE
AST
SOU
TH
NO
RT
H C
EN
TR
AL
WE
STPO
SSESSIO
NS
APO
/FPO
vc44
-6C
r.)C
Z 1.4
c -0 Zitl V.2 Z
0-.0 ZsZ
i
0 ::C
r, <
zo(4 cr
`T
t44 °L4 (..)
f.oo(4 -I
EW
) Z'
Ci 6'
z -.31
b7. c44 °4., o
8-40
Z.
3U
c43..4
i'
(.);.7.
7344,...
-.2°41
001. j (A
2-oc2.
<
Cardiology C
ertifiedD
istribution (N)
64550
157115
24SS
9344
3171
41
MI:ea.ge:
',...i"less than 5
30,030.1
39.330.1
16.621.7
23.916,0
25,232.4
28,850.0
5 to 2549.9
57.450.5
48.454.5
44.653,5
38.150.0
49.667.5
50.0
over:4..220.1
12.510.2
21.528.9
33,817.6
45.924.8
18.03.8
0.0
Non-C
ardiology Certified
1:)i5tribution (N)
5961470
1604976
195380
861310
195901
5613
Mileage:
less than 542.4
46.951.2
40,428.7
34.437.8
30.643.9
41.042.2
40.5S to 25
48.545.9
44.449.2
52.149.8
53.348.0
45.451.1
49.540.5
over 259.1
7,14.4
10.519.2
15.88.9
21.410.7
7.98.3
18.9
Source: 2

TA
BL
E 22
PER
CE
NT
AG
E O
F CA
RD
IAC
PAT
IEN
TS B
Y M
ILE
AG
E D
ISTA
NC
E FR
OM
PHY
SICIA
NS:
CE
NSU
S DIV
ISION
BY
AM
ER
ICA
N C
OL
LE
GE
OF C
AR
DIO
LO
GY
ME
MB
ER
SHIP
AM
ER
ICA
N C
OL
LE
GE
OF
CA
RD
IOL
OG
Y (A
.C.C
.)M
EM
BE
RSH
IP
Group
Total
NO
RT
HE
AST
SOU
TH
NO
RT
HrN
TR
AL
IVE
:;TPO
SSESSIO
NS
Apozryi2_,_
41
2r-.0cca.
-lbcc36.4 /
C2 ;,..1
c.)4.) -ri Z-0 cZ
: V0: ...:
u--
,c ='5 0:0 V(I) <
b:°nto co1 b1' cc 41
c.a 1)
.cEtr, -,A
;;1!
.t..z 70'0 b74' c41 cl'
.c-z -i
21 -.4
. .c.
i' 4/3
c2c0r)O
.
a 430ot.? ;: ,1
A.C
.C. M
embership
Distribsition (N
)2164
147636
29879
143277
12686
35019
3
Mileage;
38.3
49,1
12.6
41.148.0
48.546.2
10.55.7
36.6
48.6
14.9
23.8
50.9
25.4
26,5
47,3
2:..7
35.0
53.3
12.0
23,3
49,0
27,7
35.037.6
49,752.2
15.310.2
40.658.3
50.128.3
9,413.3
less than 5
5 to 25
over 25
Non-A
.C.C
, Mem
bershipD
istribution (N)
4442373
1125793
140292
6772:1.8
140622
4111
Mileage:
42.6
48.4
9.1
47.051.3
46.5
44.3
6.64,1
40.3
47.3
10,4
2S,4
53.2
17.4
35.9
49.8
14.4
37,7
53.5
8.9
31,8
45.6
22.7
45.241.9
43.8
50.4
11.07.7
41,636.5
51.1
44.7
7.418.7
N
less than 5
5 to 25
over 25
Source: 2

t
TA
BL
E 23
DIST
RIB
UT
ION
AN
D PE
RC
EN
TA
GE
OF C
AR
DIO
LO
GIST
S WIT
HIN
PRA
CT
ICE
MO
DE
:B
Y SPE
CIA
LT
Y(PR
IMA
RY
AN
D SE
CO
ND
AR
Y IN
CA
RD
IOL
OG
Y, IN
TE
RN
AL
ME
DIC
INE
AN
D O
TH
ER
SPEC
IAL
TIE
S)
PRA
CT
ICE
MO
DE
NO
N-IN
ST
ITU
TIO
NA
L:
PRA
31-
SecondaryInternal M
ie.dictne
Solo956
34.6
Partnership403
3'1.1
Group
40640.3
-1) Total
17fic
INS
',7!70"ON
AL:
Hospital
397
51.0
h4v..l!.cal School
278
46.2
.10.0,01.M10.1004011M
OM
.P.M
...n
Total
675
4849
OT
HE
R39;
46.7
.11011111.11=0"
TO
TA
L2831
40.0
4.1./..MO
NO
.....MO
WN
IMW
INIA
NW
OO
MIN
IOW
AW
IION
IMIN
NO
MM
AIIO
MM
Source: 2
Ipa.
SecondaryO
ther SDcii0A
tieS
303
11.0
122
11.2
106
10.5
't 11
170
176
44140
1017
21.0
29.2
16.7
14.4L
SPEC
IAL
TY
ND
AR
'0 0A
LL
CA
RD
IOL
OG
Y
2767
1086
1008
100
100
100
Prim
aryInternal
1282
504
457
MetlIC
Ine
46.0
46.4
45.3
Primary
Other Sveclaltles
226
$739
.3-
8.2
5.2
3.9
S I
15820.3
53
6,8778
100
7S12.5
73
12.1602
100
16.9126
9.11380
10Q
23728.3
691
8.2837
100
271338.3
5177.3
7078100

TA
BL
E 24
PERCENTAGE C,F CARDIOLOGISTS BY PRACTICE MODE;
CENSUS
DIV
ISIO
N B
Y M
ED
ICA
L SE
RV
ICE
CO
MM
UN
:'.:Y P
OP
ULA
TIO
N G
RO
UP
ING
S*
PRACTICE MODE
Populauon
Group
I
Division
Total** i
Nw6895
NO
RT
HE
AS
T1
1 .3417
Zfo4
0I.
3t!
DISTRIBUTION
(N)
under 150,000
1574
158
341
302
73
over 150,000
i5311
392
1488
837
156
113350
NORTH CENTRAL
z0 7,3*
7.c
4.1(3
216
137
764
234
WEST
i POSSESSIONS
U
73174150863
NON-INS71TUTIONAL:
Solo
Partnership
Group
under 150,000
over 150,000
2153
AIM
ISM
IIIMM
ION
OM
ININ
IMIN
IN110
742
'
53.8
64.2
40.7
35.6
43.4
44.0
27.7
47.9
45.3
36.4
1995
Ii42.1
49.7
30.8
25.0
28.9
36.6
22.6
25.3
34.0
45.3
under 150,000
211
9.5
10.0
15.2
24,7
15,0
13.0
7.3
23.3
17.3
0.0
over 150,000
868
8.7
12.4
20,0
23.1
13.0
15.1
18.4
21.3
21.7
3.8
under 150,000
318
j13.9
9.7
17.9
21.9
23.9
29.6
40.1
19.2
21.3
9.1
over 150,000
681
11.7
5.6
14.5
20.5
19.4
13.4
24.4
17.2
16,2
1.9
Suo Total
JNST111:130.NAl.:
Hospital
Medical School
under 150,000
j1271
f77.2
3545
;62.i
over 150,000
83.9
73.8
82.2
82.3
86.6
75.2
90.4
84.0
45.5
67.7
65.2
68.6
66.3
65,1
65,4
63.8
71.8
50.9
1under 150,000
107
I9.5
8.8
6.0
0.0
7.1
7.9
3.6
2.7
8.0
0.0
over150,000
621
19.1
13.6
10.4
5.1
7.4
13.6
8.5
,0,2
$.7
15.1
under 150,000
66
5.1
0.9
8.9
8,2
3.5
2.3
7.3
0.0
0.7
18.2
over 150,000
507
6.6
7.1
11.0
28.6
13.4
9.3
16.7
12,6
8.1
9.4
Sue Total
Junder 150.000
over150,000
173
,14,6
112825,8
9.7
24.9
20.7
21.4
TOTAL
11110111001.1P
8.2
10.6
23.7
20.9
10.2
10.9
2.7
22.9
25.2
.21.8
under 150,000
:125
:8.2
6.5
11.3
9.1
7.1
3.2
over 150,000
I
643
11.7
11.f
13.4
7.7
12,9
12.0
under 150,000
,
1569
;100.0
100.0
100.0
100.0
100.0
100.0
100.0
J
over 150,000
i5316
i
100.0
100.0
100.0
100.0
100.0
100,0
100.0
13,9
6.8
9.4
14.4
8.7
18.2
16.8
24.5
7.3
36.4
11.4
24.5
Physician Iniate of poPiaiation within 25 mile radius of his officio.
"Excludes 14 APOIFPC.
Source: 2
100.0
100.0
100.0
100.0
4111.IiM
IOIN
IIIIMM
INO
MO
INIM
1111111
100.0
100.0

TA
BL
E 25
CA
RD
IOL
OG
ISTS B
Y PR
AC
TIC
E M
OD
E:
PER
CE
NT
AG
E O
F CA
RD
IAC
PAT
IEN
TS B
Y M
ILE
AG
E D
ISTA
NC
E FR
OM
PHY
SICIA
N
PRA
CT
ICE
MO
DE
Distribution (N
)
DIST
AN
CE
Less than 5 m
iles5 to 25 m
ilesover 25 m
iles
NO
N-IN
STIT
UT
ION
AL
:
2651
1044
964
47,3
41.5
38.9
47,7
50.9
48.3
4.9
7.5
12.8
Solo
Partnership
GroupSub T
otal4659
44.3p
48.5
INST
ITU
TIO
NA
L:
646
482
36.5
28.3
50.6
42.8
12.9
28.9
Hospital
Medical School
Sub Total
112833.0
47.319.7
C)T
UJR
66433.0
50.315.9
.CL
epiaLO
GISIS
6451
41.1
48.5
/10.2
Source:2

TA
BL
E 2
6
CA
RD
IOL
OG
IST
S B
Y P
RA
CT
ICE
Mor
e:PE
RC
EN
TA
GE
OF
PRO
FESS
ION
AL
AC
TIV
ITY
TIM
E A
ND
PR
OPO
RT
ION
Of
TIM
E T
O C
AR
DIO
LO
GY
L1
r 1
. . .
, . .
. ,r
A t.
..t i
viii
PRA
CT
ICE
MO
DE
Dir
ect
Res
earc
hT
each
ing
Dis
trib
utio
nT
ime
Patie
ntC
are
with
Patie
ntw
ithPa
tient
.Su
blot
all
Clin
ical
Res
earc
hw
ithou
tT
each
ing
with
out
Sub
Tot
alN
on-C
linic
aA
.dm
inis
trat
ivs
Prof
essi
onal
(N)
Cpirp
Cary
Patie
nt C
a r
ePa
tient
Car
eR
es.6
Tea
chT
otal
Allo
catio
n,..
:N
ON
-IN
STIT
UT
ION
AL
:
Solo
N*1
724
% o
f to
te81
.31.
35.
688
.20.
51.
62.
14.
74.
9%
to C
D45
.81.
03.
650
.30.
31.
11.
40.
00.
0
Part
ners
hip
N*1
079
% o
f to
te80
.01.
36.
788
.00.
41.
92.
34.
94.
7%
to C
D46
.01.
14.
751
.90.
31.
41.
70.
00.
,...1
Gro
upN
*997
% o
f to
ta79
.21.
76.
787
.60.
71.
72.
45.
04.
9%
to C
D45
.61.
34.
551
.50.
61.
21.
80.
00.
0
% o
f io
ta80
.%1.
4ti.
188
.00,
.74.
:4.
'Su
b T
otal
N*4
800
% to
CD
45.8
1.1
4.0
50.9
0.4
1.2
1,6
0.0
0.0
INST
ITU
TIO
NA
L:
Hos
pita
lN
*771
% o
r. to
tat
45.4
10.2
18.3
73.8
5.6
4.9
10.5
10.0
5.6
% i.
...' C
D32
.19.
Si
14.1
55.2
4.6
3.8
8.4
0.0
0.0
Med
ical
Sch
ool
N*5
97%
of
tote
19.5
14.8
22.3
56.7
16.2
8.9
25.1
12.6
5.7
% to
CD
15.8
13.2
17.3
46.2
12.8
6.1
18.9
0.0
0.0
% o
f to
te34
.112
.2v
20.0
66.3
10.2
6.6
16.9
11.1
5.6
Sub
tota
lN
* 13
68%
to C
D25
.010
.815
.551
.38.
24.
813
.00.
00.
0
Oth
erN
*819
% o
f to
ts45
.67.
315
.468
.37.
14.
811
.913
,95.
8%
to C
D29
.66.
312
.147
.95.
97.
413
.30.
00.
0
t#2
Sour
ce:
2
GJ

TA
BL
E 2
7
PER
CE
NT
AG
E O
F PR
OFE
SSIO
NA
L A
CT
IVIT
Y T
IME
AN
D P
RO
POR
TIO
N O
F T
IME
TO
CA
RD
IOL
OG
YB
Y S
PE;.:
...A
ISY
TY
PE O
F A
CT
IVIT
Y
SPE
CIA
LT
Y
Prim
ary
Car
diol
ogis
tSe
cond
ary
Car
diol
ogis
tA
LL
CA
RD
IOL
OG
IST
SN
*39
1032
571
66%
of
tota
l%
to CD
% 0
5.%
to CD
% o
fto
teI
% to CD
Dir
ect P
atie
nt C
are
60.8
48.8
75.3
28.9
67.3
39.9
Res
earc
h w
ith P
atie
nt C
are
6.2
5.7
1.8
1.0
4.2
3.6
Tea
chin
g w
ith P
atie
nt C
are
12.6
10.5
6.6
3.0
9.9
7.1
Sub
Tot
al -
Clin
ical
Z9.
565
.0$3
.732
.981
.450
.6
Res
earc
h w
ithou
t Pat
ient
Car
e4.
44.
01.
90.
93.
32.
6
Tea
chin
g w
ithou
t Pat
ient
Car
e3.
93.
22.
00.
93.
02.
2
Sub
Tot
al -
Non
- C
linic
al8.
37.
23.
91.
86.
34.
8R
esea
rch
and
Tea
chin
g
Adm
inis
trat
ive.
6.8
0.0
7.5
0.0
7.1
0.0
Prof
ess-
onal
5.4
0.0
4.3
0.0
5.1
0.0
IIIIII
ON
OW
NIII
Mal
al~
1101
1111
011
1101
1101
1111
1111
1111
1111
1111
11am
mes
ompi
mai
TO
TA
L10
0.0
72.2
99.9
34.7
99.9
55.4
Sour
ce: 2

TA
BLE
28
PER
CE
NT
AG
E O
f PRO
FESSIO
NA
LA
CT
IVIT
YT
IME
AN
D PR
OPO
RT
ION
Of T
IME
TO
CA
RD
IOL
OG
Y:
crNsus
DIV
ISIO
N B
YPR
IMA
RY
CA
RD
IOLO
GIS
T
i
Tim
eT
YP
E O
F A
CT
IVIT
YA
llocation
Total
Group
NO
RT
HE
AS
TS
OU
TH
CE
NT
RA
LW
ES
TP
OS
SE
SS
ION
S
AP
O/F
PO
6 -2
4.,.
- c&
Xgo
7o C
)c
..... 5
V.....
C0
A, >
g+,1
.4
loccS' .
4 c2: g..3
U4 -..
--rci"c.'
'V 0
2 Z
u---
.f..'.V
0tn <
70C
.)gp. --
.4
IQ4
c -1E
4go;
.40of 0.:.
-044 :I::c.
...
0 ....AO
.r
M g
V 44
4,,i 0
.0Z5
z...40, ,..4 c4 o,0
c0co.2
I
U---U*0c..
341P,
.0,0111.146~4.1101111110.011111010111.1.s..10.111M.0.1..............41k
1291029
55.362.0
44.449.7
7.36.0
6.75.4
13.012.7
10.510,5
628125
27060.3
67.962.0
48,354.6
50.6
7.24.3
5.86.9
3.94.8
11.310.2
13,39.8
8.110.9
5451448
l',K
da1
s
59.047.6
6.66.0
14.111.4
56.945.5
4.94.6
17.014.3
65.654,6
2.92.7
11.210.0
61.848.9
6.66.3
10.79.1
59.345.8
4.13.9
15.312.2
50.043.6
0.60.6
30.030.0
1114.11.1110.1101111100~.P.000110111011.1.,
..x.:ec: Fatten: C
are-
% cf total
60.85 t; C
D48.8
Research w
ith Patient C
areI
A. of total
j6..2
% t6 C
D5.7
Teaching w
ith Patient C
are5 of total
12.6%
to CD
10.5
St.:" T
otal - Clinical
9. If total79.5
75.680.7
S to C
D65.0
61.665.6
78.882.4
81.165.0
66.666.3
79.765.0
78.864.4
79.667,3
79.164.3
78.861.9
80.674.2
401001401.1.1.110.01=
01~1.1!ION
OM
MIN
OIM
ION
VO
INO
WIIM
WM
PIOW
NO
WN
ReSearC
:.w
ithout Patient
1%
of totalI
Case
5 to CD
I
Teav-^g w
ithout Patlen:
jS
. of totalC
arei
% to C
D
4.48.5
3.64.0
7.83.3
3.94.2
3.93.2
3.73.2
5.03.1
3.64.7
2.73.2
3.63.7
3.92.9
3.11.3
3.93.5
4.63.7
5.84.9
4.73.7
4.23.7
4.13.7
4.13.7
3.12.7
2.12.0
4.43.1
1.01.0
6.06.0
Su:, T
otal - Non-C
linical1
9. of total8.3
12.77.5
8.66.8
7.5R
esearch and TeachInc
i%
toC
D7.2
I11.5
6.57.6
5.86.5
8.57.2
10.58.6
8.37.4
7,26.4
6.55.1
7.07.0
AC
r5.'6.:V
eS
of total6.8
6.36.5
Prcte s:onal
S of total
15.4
s5.3
5.4
7.35.7
6.6
5.25.0
4.8
6.6
5.2
5.9
4.9
7.4
4.6
.7.3
6.4
9.6
5.1
4.0
8.4rso
TO
TA
:.C
:3) or TO
TA
L100.072.2
99.5130.1
73.172.1
99.999.9
100.072.6
72.472.8
100.072.2
100.173,0
99.974.7
100.070.7
100.067.0
100.081.2
Source:
2

Cif
5ac--C)
kaJC
O
TA
BL
E 29
PER
CE
NT
AG
E O
F PRO
FESSIO
NA
L A
CT
IVIT
Y T
IME
AN
D PR
C PO
RT
ION
OF T
IME
TO
CA
RD
IOL
OG
Y:
CE
NSU
S DIV
ISION
BY
stcoND
AR
, ;:-..utolotoGIsT
TY
PE O
F AC
TIV
ITY
Tim
e
Allocation
Total
Group
I-N
OR
TY
. EA
STSO
UT
HC
E. T
RA
E'W
EST
POSSE
SSION
SA
PO /FPO
T:Cv
X '''
to Fz ,.:
Uc -..7 ZC
4;--4
g.)'""
4 Z'5 40.....:(-
,e"50 ....0 4.0.
J- Z.
,Ta
V) ""
iA
: **c(1
,eZ 00
I0.
-4V
4'&
A 4,..1
Z,A
'a"6"
;1.5
1')
U--......
o00a.
OC
4'0
0cA
4....- c3
. 02.
a. > t.,1
4
MO
VIIM
IMI
1-'5-:
24n6
-71r
rA
7 r)
D::eci Paten: C
a:ej
% of total
I75.3
77.074.8
7o.r
.-
.-
.'%
to CD
28.928.8
28,930.2
30.930.2
29.126.(
29.627.8
29.714.5
kesearct; -"rata Fatieot Care
I%
of total1.8
1.51,9
1.82.6
1.21.7
2,1.4
2.12.0
0.0%
to CD
1.00.8
0.90.8
1.30.5
0.91,
1.31.2
1.40.0
Teacbino w
itr: Pat.4ent Ca'e
% of total
6.66.1
6,95.3
6.85.5
8.57.q
3.26,7
7.03,1
% to C
D3.0
3.13.0
2.42.6
2.54.1
3.52.0
3.14.4
1.7
SL,.;.,-- T
otal - CI:nscal
% of total
83.7e4.6
83.684.0
84.584.1
84.682,1
87.682.
78.476.0
% to C
D32.9
a2.732.8
33.534.8
33.234.1
31,132.9
32.135.6
16.2
Resea;c:-. ur:tnout raiser,:
% of total
1.92.0
2.21.9
3.41.7
1.51.p
0.42.3
1.10.0
Ca:e
j%
to CD
0.91.1
1.00.6
1.60,6
0.61.0
0.41.2
0.30.0
Teart4n; w
:tr,,ou: Patient9, of total
2.02.4
1.81.3
2.42.3
2.52.2
1.72.2
3.S2.1
Ca:e
i%
to CD
0.91.2
0.80.6
1.00.7
1.20.1
0.71.
1,30.9
St.o-Total - N
on-Clinical
:%
of total3.9
4.44.0
3.25.8
4,04,0
3.i2.1
4.54.6
2.1R
esea;,--,-.n and Teaching
% to cr,
i
1.82.3
1.81.2
2.61.3
1,81.1
2.12,2
1.60.9
kc..^^r.in:Lt:ative
i1
% of total
7.56.6
7.58.0
5.98,0
7.08.
5.77.7
10,915.4
P;:-...;ess;ooal1
% of total
11
4,34,3
4.94.8
3.93.9
4.45.7i
4.65,6
6.16.3
Ta"::::.
1
99.9D
==
. OF T
OT
AL
1
34.799,935.0
10034.6
10034.7
100.1100
100100
100100
100100
I
37.434.5
35.932.1
34.034.3
37.217.1
1....-
Source: 2

TABLE 30
PERCENTAGE OF PROFESSIONAL ACTA/17Y TIME AND PROPORTION OF TIME TO CARDIOLOGY:CENSUS DIVISION BY ALL CARDIOLOGISTS
TYPE Or ACTNITY
Time
Allocation
Total
Grou p
NORT.HEAST :LOUTH
c0 Q
s 4, "c"
; m0
Qcij,a
.c
2 -0". .1; Z
RA
.c-O2' - .
; Ze4 , i v
WESTPOSSESSIONS
AP
mc
3 -.c...Q z
4, u
:-.0" 76T.: Cw - .
Q
. C Z5 m0
.cBQ 1 4 ,
- Z. ,Q..
a7;
. a0
u. .c. ;
C
c. . -
AO
=
71 A G 1107 1100 7 7 C nc, ..Z.:ire::: rat,en: Ca:e % of total 67.3 64.4 67.5 68.2 71,2 66.6 66.2 64.4 72.1 67.0 62.8 66,6
% to CD 39.9 37.9 40.4 39.7 44.2 42.1 39.1 36.0 45.1 39.7 40,2 22.6
itesearcti with Patient Care %. of total 4.2 4.9 4.1 4.6 3.5 3.8 4.3 3.6 2.4 4,6 3,4 .2% to CD 3.6 4.2 3.3 4.0 2.7 3.0 3.7 3.1 2.2 4.0 3,0 .2
Teaching wttil Patient Care % of total 9.5 10.1 10.1 8.5 8.7 10.0 U.S 12.4 8.2 8.9 12,4 10.6% to CD 7.1 7.5 7.1 6.3 5.7 7.4 8.0 9.0 7.0 6.5 9.5 9.6
Sub To:al t Clinical % of to:al 81.4 79,4 82.3 81.3 83.4 82.4 82.0 80.5 82.7 80.5 78.6 77.3% to CD 50.6 49.6 50.8 50.0 52.6 52.4 50.8 46.1 54.3 50.2 52.7 32.3
p.............................................. Im
Ice S ea: Ct w;:nout Fat:ent S of total 3.3 5.8 2.9 3.5 3.2 2.8 2,7 3.8 2.8 3.3 1.8 .3co Care S to CD 2.6 5.0 2.2 2.7 2.2 2.1 2.2 3.0 2.5 2.6 1.5 .3
5firaC
Teacr.1 without PatientCa:t.
S a total% to CD
3.02.2
3.52.6
2.92.1
2.51.8
3.12.2
3.2 3.6 3.4 3.22.2 2.6 71.3 2.6
2.7 4.11.9 2.5
3.22.3
>o0- 5$.40-Total - Non-Clsolcal % of total 6.3 9.3 5.8 6.0 6.3 6,0 6,3 7.2 6.0 6.0 5,9 3.5C:oC....)
Researcr: ano Teaching % to CD 4.8 7.6 4.3 4.5 4.4 4.3 4,8 5.3 5.1 4.5 4.0 2.6
1.--
u.sco A.cr.4n,stra:,,e ,x, of total 7, 1 6.5 7 0 7.6 5.8 7.2 6.8 1.1 6,8 7.5 10.0 12.2
FlofessIonal % of total 5.1 4.9 5.1 5.0 4.5 4.4 4.9 5.3 4.6 6.0 5.5 7.1
TOTAL 99.9 10.3.1 99.9 99.9 100 100 100 100.1 100.1 100 100 100,1CD X Of TOTAL 55.4 57 2 55.1 54.5 57.0 56.7 $5.6 53.4 59.4 54.7 56.7 34.9
Source: 2

TA
BLE
31
AL
L A
CT
IVE
CA
RD
IOL
OG
ISTS:
PER
CE
NT
AC
Z O
fA
CT
IVIT
Y T
IME
AN
D PR
OPO
RT
ION
CE
TIM
E T
OC
AR
DIC
LO
GY
BY
SPEC
IAL
TY
AN
D PH
YSIC
IAN
AG
E G
RO
UPIN
GS
ru
rs..)co
TY
PEor
AC
TIV
ITY
PRIM
AR
YS
ON
DA
RY
AL
L C
AR
DIO
LO
GIST
S
{N*7069)
Less T
han40 Y
ears
(N'1324)
40 to 60Y
ears
(N01959)
60 Years
and Over
(Nix5$4)
Less T
han40 Y
ears
{N,,677)
40 to 60Y
ears
(Nu11893)
60 Years
and Over
(Nm
632)
% of
% to
% of
% to
% of
% to
% of
% to
% of
% to
%of
% to
% of
% to
totalC
Dtotal
CD
totalC
Dtot4I
CD
toutlC
Dtotal
CD
totalC
D.
Direct Patient C
are54.3
45.260.6
48.175.1
59.5/2.5
26.174.9
29.381.0
31.767.5
40.0
Research w
ith Patient Care
8.98.3
5.44,S,
2.82.4
1.91.1
1.8.9
1.6.9
4.23.6
Teaching w
ith Patient Carle
15.213.2
12.510.2
6.75. J
9.24.3
6.63.0
3.71.5
9.97.1
-,..'
oft'Sub T
otal - Clinical
78.466.7
78.563.2
85.666.9
83.631.5
83.333.2
86.334.1
81.650,7
Research w
ithout Patient Care
6.56.1
3.93.4
1.71.5
2.81.2
1.8.9
.9.2
.3.3
2.6
Teachino w
ithout Patient Care
4.23.6
4.13.4
2.31.8
2.91.3
2.0.9
.9.4
3.02.2
Sub Total - N
on-Clinical
10.79.7
8.06.8
4.03.3
5.72.5
3.81.8
1.8.6
6.34.8
Adm
inistrative5.3
8.25.4
5.58,2
7.27.0
Professional5.6
5.35.0
5.24.7
4.75.1
TO
TA
L100.0
76.4100.0
70.0100.0
70.2100.0
34.0100.0
35.0100.0
34.7100.0
55.5
Source :
2

TA
BL
E 32
AL
L A
CT
IVE
CA
RD
IOL
OG
ISTS:
PER
CE
NT
AG
E O
F PRO
FESSIO
NA
L A
CT
IVIT
Y T
IME
AN
D PR
OPO
RT
ION
OF T
IME
TO
CA
RD
IOL
OG
Y B
Y SPE
CIA
LT
Y A
ND
BO
AR
D C
ER
TIFIC
AT
ION
STA
TU
S
..........m.....m
.....p.o........ww
ww
ww
ww
ww
ww
.p,........
TY
PE O
F AC
TIV
ITY
PRIM
AR
Ydm
.SE
CO
ND
AR
Y
AL
L C
AR
DIO
LO
GIST
S
(N=
7166)
Board
Certified
(N=
2277)
Non-
Certified
(N=
1633)
Board
Certified
(N=
1597)
Non-
Certified
(N=
1659)%
of%
to%
of%
to%
of%
to%
of%
to%
of%
to
...................p..s.........m..,
totalC
Dtotal
CD
totalC
Dtotal
CD
totalC
D
Direct Patient C
are61.0
49.360.4
48.172.8
29.377.6
28.667.3
39.9
Research w
ith Patient Care
5.34.9
7.46.8
1.8.9
1.91.0
4 . 23.6
Teaching w
ith Patient Care
13.511.2
11.39.5
8.13.7
5.22.4
9.97.1
I.3
Sub Total - C
linical79.8
65.479.1
64.482.7
33.984.7
32.081.4
50.6
IA4
-J005R
esearch without Patient C
are3.3
3.06.0
5.51.6
.72.3
1.13.3
2.6C
C.211,ozc
Teaching w
ithout Patient Care
4.03.3
3.8'
3.12.3
1.01.8
.83.0
2.2
-a.CD
(...,I-v)
Su b Total - N
on-Clinical
7.36.3
9.88.6
3.91.7
4.11.9
6.34 . 8
LA
303
Adm
inistrative7.5
5.88.6
6.57.2
Professional5.4,
5.34.8
5.1
TO
:A.
100.071.7
100.073.0
100.035.6
100.033.9
100.055.4
Source:2

TA
BL
E 33
AL
L A
CT
IVE
CA
RD
IOL
OG
ISTS:
PER
CE
NT
AG
E O
F PRO
FESSIO
NA
L A
CT
IVIT
Y T
IME
AN
DPR
OPO
RT
ION
OF T
IME
'IDC
AR
DIO
LO
GY
BY
SPEC
IAL
TY
AN
D SU
BSPE
CIA
LT
Y B
OA
RD
CE
RT
IFICA
TIO
N ST
AT
US
PR
IM_ A
RY
SEC
ON
DA
RY
SubspecialtyN
on-Subspecially
Non -
Certified
Certified
Certified
AL
L C
AR
DIO
LO
GIST
STYPE IDFACWITY
(N=
598)(N =3 312)
(N=91)
(N =3165)
(N =7166)
1Sof
%to
1;of
l 0>
%of
1; to
%of
1: to
1;of
W,to
total
CD
total
CD
total
CD
total
CD
total
CD
Direct Patient Care
55.4
48.5
.61.7
48.8
53.0
23.5
75.9
29.1
67.3
39.9
ResearchaddIMWetOwe
6.4
6.0
6.1
5.6
4.6
2.2
1.8
.9
4.2
3.6
Teaching w
ith Patient.Care
16.4
13.9
11.9
9.8
11.0
5.2
6.5
3.0
9.9
7.1
.Sub T
otal - Clinical
78.2
68.4
79.7
64.2
68.6
30.9
84.2
33.0
81.4
50.6
:,
:Researchuddmmaltfadentaue
3.6
3.4
4.6
.4.1
1.0
.6
2.0
.9
3.3
2.6
TeachlwywithoultftUientatte
4.6
3.8
3.8
3.1
3.5
1.6
2.0
.9
3.0
2.2
Sub Total - N
on-Clinical
8.2
7.2
8.4
7.2
4.5
2.2
4.0
2.8
6.3
4.8
1siA
dministrative
8.1
6.6
21.3
7.1
7.2.!;
Professional
5.5
5.3
5.6
4.7
5.1
;1
,>;
TO
TA
L100.0
75.6
100.0
71.4
100.0
33.1
100.0
34.8
100.0
55.4
2a
Source: 2

231
o Tables 34 through 38 present statistics related to performanceof selected cardiology activities
Total Professional Time Compared to Total Cardiology Professional Time
The Initial Cardiology Survey questionnaire asked for two estimates of pro-fessional time. The first was an estimate of total professional time allocatedto the indicated category. The second was an estimate of the proportion ofthat time which pertained to cardiology. Thus, an individual could report"70 percent time in direct care of patients" and the proportion of that timeallocated to cardiology might be 100 percent. The calculation, which is nec-essary to determine total percent of professional activity time in a categorywhich is cardiology-specific, i.e., column 3 below, was made to permitrapid comparisons and derivation of ratios.
(1)Percent of TotalProfessional Time
Specialty Commited to
Primary 60.8
Secondary 75.3
x
x
(2)Percent of ActivityTime Applied toCardiology
80,3
38.4
(3)Percent of TotalTime Appliedto CD
ZS
48.8
28.9
Under the assumption that the P--imary Cardiologist is, by definition, a specialistin cardiovascular disane, one could consider the difference between the totalactivity time (60.8 percent) and the total activity time which is cardiovascular(48.8percent) as a measure of non - specialist patient care. This differenceamounts to 12 percent.
The example given of alternative ways of viewing the data contained in Table 27pertains to all professional activity tables in this section of the report.
CARDIOLOGY PROFESSIONAL DIARY
As noted treviously, the data obtained through the Cardiology ProfessionalDiary study provided the most reliable information regarding the time devotedto types of professional activities as well as the actual activities themselves.It would not ha--:e been possible, of course, to arrive at this conclusion con-cerning quality of data obtained without data both from a questionnaire andfrom a log-diary for comparisons.
In this section we will preselT. those statistics regarding professional activitiesobtained through use of the log-diary which are believed most pertinent tocardiologist's role definition.
"..13/1

TA
BL
E 3
4
PER
CE
NT
AG
E O
F PH
YSI
CIA
NS
PER
FOR
MIN
G S
EL
EC
TE
DT
YPE
S O
F C
AR
DIO
LO
GY
AC
TIV
ITIE
S:B
Y S
PEC
IAL
TY
rgm
nmsg
wm
mis
m.m
..NN
N.m
....m
wim
mm
aum
m..o
miia
...,.i
..i.m
.i.bm
mm SP
EC
IAL
TY
TY
PE O
FA
CT
IVIT
YPr
imar
ySe
cond
ary
AL
L
Car
diol
ogis
tC
ardi
olog
ist
CA
RD
IOL
OG
IST
S(N
=38
76)
(N=
3169
)(N
=70
45)
Off
ice
Con
sulta
nt f
orC
ardi
ac P
atie
nts
84.1
87.7
85.7
Off
ice
EC
G R
eade
r71
.581
.776
.1
Hos
pita
l Con
sulta
nt f
orC
ardi
ac P
atie
nts
92.9
80.6
87.4
Hos
pita
l EC
G R
eade
r77
.060
.969
.8
Hos
pita
l CC
U C
omm
ittee
64.8
53.2
59.6
Car
diac
Dia
gnos
ticR
oent
geno
grap
hy37
.314
.827
.2
Car
diac
Cat
hete
riza
tion
40.9
7.9
26.0
Sour
ce:
2

TA
BL
E 3
5
PER
CE
NT
AG
E O
r PH
YSI
CIA
NS
PER
FOR
MIN
G S
EL
EC
TE
DT
YPE
S O
F C
AR
DIO
LO
GY
AC
TIV
ITIE
S:
BY
PH
YSI
CIA
N A
GE
GR
OU
PIN
GS
AN
D P
RIM
AR
Y O
RSE
CO
ND
AR
Y S
PEC
IAL
TY
CL
ASS
IFIC
AT
ION
.4...
imm
emo-
...10
.....0
0000
0.00
.000
00.-
.6...
..m...
.460
4eam
s,60
YE
AR
S A
ND
OV
ER
AL
L A
GE
S
(14*
120
8)(N
a 64
54)
TY
PE O
FA
CT
IVIT
IES
LE
SS T
HA
N 4
0 Y
EA
RS
(N-
1964
)40
TO
59
YE
AR
S(N
- 37
82)
PRIM
AR
Y(N
& 1
310)
SEC
ON
DA
RY
(Ne.
654
)PR
IMA
RY
(N2,
1937
)SE
CO
ND
AR
Y(N
- 18
45)
Off
ice
Con
sulta
nt f
orC
ardi
ac P
auen
ts73
.082
.089
.390
.9
Off
ice
EG
G R
eade
r61
.076
.377
.283
.6
Hos
pita
l Con
sulta
nt f
orC
ardi
ac P
atie
nts
94.1
84.7
95.0
84.4
Hos
pita
l EC
G R
eade
r80
.368
.878
.763
.1
Hos
pita
l CC
U C
omm
ittee
62.6
59.0
71.6
56.4
Car
diac
Dia
gnos
ticR
oent
geno
grap
hy52
.122
.033
.613
.3
Car
diac
Cat
hete
riza
tion
70.0
20.6
35.1
7.9
PRIM
AR
YI
SEC
ON
DA
RY
(Nu
586)
(N-
622)
91.8
76.3
83,3
64.7
47.1
15.7 4.9
84.6
82.2
65.9
46.8
38.4
12.1 1.0
PRIM
AR
Y(N
i 383
3)SE
CO
ND
AR
Y(N
.,, 3
121)
84.1
87.8
71,5
81.8
92.9
80.8
77.1
61.1
64.8
53.4
37.2
14,9
42.4
9.1
Sour
ce:
2

TA
BL
E 3
6
PER
CE
NT
AG
E O
F PH
YSI
CIA
NS
PER
FOR
MIN
G S
EL
EC
TE
D T
YPE
S O
F C
AR
DIO
LO
GY
AC
TIV
ITIE
S,SY
PH
YSI
CIA
N A
GE
GR
OU
PIN
GS
AN
D S
PEC
IAL
TY
BO
AR
D C
ER
TIF
ICA
TIO
N S
TA
TU
S
LE
-SS
TH
AN
40
YE
AR
SN
it 19
64)
40 T
o 55
YE
AR
S(N
o 37
82)
60 Y
EA
RS
AN
D O
VE
R(N
o 12
08)
AL
L A
CE
S(N
. %5S
4)
TY
PE O
FA
CIT
VIT
Ir.S
BO
AR
DC
ER
TIF
XD
(0. 8
18)
NO
N-C
ER
TIF
IED
(N-
1146
)
BO
AR
DC
ER
TIF
IED
(N 2
309)
NO
N-C
ER
TIF
IED
(No.
147
3)
BO
AR
DC
ER
TIF
IED
(N-
638)
NO
N-C
ER
TIF
IED
(N-
570)
0 C
A R
D
CE
RT
IFIE
D(3
765
)N
O N
-C
E P
.T1
D(3
:19)
Of/
ice
Con
sulta
nt o
rC
ardi
ac P
atie
nts
86.1
68.8
91.4
88.0
91.8
83.9
90.3
60.3
Off
ice
EC
G R
eade
r72
.961
.379
.081
.177
.681
,2.4
74.0
Hos
pita
l Con
sulta
nt (
ccC
ardi
ac P
atie
nts
94.0
88.8
92.9
85.0
83.7
63.9
51.6
82.o
Hos
pita
l EC
G R
eade
rao.
773
.575
.464
.459
.950
.473
,4
Hos
pita
l CC
U C
omm
ittee
69.8
55.4
69.5
55.9
48.1
36.5
65.9
52.2
Car
diac
Dia
gnos
ticR
oent
geno
grap
hy43
.541
.125
.421
.014
.413
.227
.526
.8
Car
diac
Cat
hete
riza
tion
54.3
53.0
24.1
18.3
4.1
1.6
27.2
27.8
Sour
ce :
2

TA
BL
E 3
7
PER
CE
NT
AG
E o
r PH
YSI
CL
AN
S PE
RFO
RM
ING
SE
LE
CT
ED
TY
PES
OF
CA
RD
IOL
OG
YA
CT
IVIT
IES:
8Y P
HY
SIC
IAN
AG
E G
RO
UPI
NG
S A
ND
SU
BSP
EC
IAL
TY
BC
%R
D I
NC
AR
DIO
VA
SCU
LA
R D
ISE
ASE
CE
RT
IFIC
AT
ION
ST
AT
US
LE
SS T
HA
N 4
0 Y
EA
RS
(No
1964
)40
TO
59
YE
AR
SN
o 37
81)
60 Y
EA
RS
AN
D O
VE
R(N
o 12
08)
AL
L A
GE
S(N
o 69
54)
TY
Pt O
F,A
CT
IvIT
IES
SUB
SPE
CIA
LT
YC
ER
TIF
IED
(N-
110)
5.6%
NO
N-C
ER
TIF
IED
(No
Ic4)
944%
SUB
SPE
CIA
LT
YC
ER
TIF
IED
(No
406)
10. 7
%
NO
N -
CE
RT
IFIE
D(N
337
6)89
.3%
SUB
SPE
CIA
LT
YC
ER
TIF
IED
(No
156)
12.9
%
) O
N-C
ER
TIF
IED
(No.
105
2)87
.1%
SUB
SPE
CIA
LT
YC
ER
TIF
IED
672)
NO
N-C
ER
TIF
IED
(N. 8
292)
Witc
o C
onsu
ltar.
: for
Car
diac
Pst
sont
s88
.275
.291
.9$9
,089
.787
,890
.815
.2
Ofl
ice
EC
G R
tads
r71
,965
.773
.281
.763
.5SI
. 7
70.7
76.7
Hos
7im
1 C
onsu
ltant
for
Car
dsac
Psu
onts
97.3
90.6
97.0
89.0
61.5
72.2
95.1
86.
lloso
itil E
CG
Roe
der
82.7
76.1
83.0
69,7
59.6
54.1
77.5
59.1
ioso
LIA
1 C
CU
Com
mitt
al74
.560.6
74.9
62.9
44.9
42.3
67.9
58. $
Car
diac
Dus
gmos
tsc
Roo
rdos
noqr
sony
59.1
41.1
41.6
21.6
16.0
13.5
31.5
26.0
rtha
c C
athe
teri
zatio
n74
.552
.349
.518
.55.
12.
643
.325
.8
Si)u
rce
2

TA
BL
E 3
8
PER
CE
NT
AG
E O
F PH
YSI
CIA
NS
PER
FOR
MIN
G S
EL
EC
TE
DT
YPE
S O
F C
AR
DIO
LO
GY
AC
TIV
ITIE
S:B
Y M
ED
ICA
L S
ER
VIC
E C
OM
MU
NIT
Y P
OPU
LA
TIO
N G
RO
UPI
NG
S*
TY
PE O
FA
CT
IVIT
Y
ME
DIC
AL
SE
RV
ICE
CO
MM
UN
ITY
AL
LC
AR
DIO
LO
GIS
TS
(N=
6888
)
Popu
latio
n un
der
150,
000
(N=
1590
)
Popu
latio
n ov
er15
0,00
0(N
=52
98)
Off
ice
Con
sulta
nt f
orC
ardi
ac P
atie
nts
88.6
85.9
86.5
Off
ice
EC
G R
eade
r83
.974
.776
.8
Hos
pita
l Con
sulta
nt f
orC
ardi
ac P
atie
nts
88.6
87.2
87.6
Hos
pita
l EC
G R
eade
r79
.467
.170
.0
Hos
pita
l CC
U C
omm
ittee
71.8
56.5
60.0
Car
diac
Dia
gnos
ticR
oent
geno
grap
hy22
.828
.527
.2
Car
diac
Cat
hete
riza
tion
15.0
29.0
25.8
*Phy
sici
an e
stim
ate
of p
opul
atio
n w
ithin
a tw
enty
-fiv
e m
ile r
adiu
s of
his
off
ice.
Sour
ce:
2

237
This study was the principal method used to determine what the cardiologistsdo within the context of a professionei day. The characteristics of the log-diary, design considerations, sampling and analysis issues were discussedin Chapter Two, pages 18 through 39.
It will be remembered that there were 364 cardiologists who kept this log-diaryduring an assigned five-day time period. The recording times were selectedto ensure coverage of all days of the week at the same level. Having sampleddays as well as individuals, the resultant statistics reflect a typical day withina typical week.
The data are presented by the log-diary sections:
o Activity Overview
o Patient Care
o Laboratory & Diagnostic Testing
o Research
o Teaching
Activity Overview Data
Data are presented in this section by cardiologists days and by wilts applicableto activities which occurred on those days. It is important, therefore, to con-sider the base for the table in interpreting the data which it contains. Forexample, there were 1,906 cardiologist days; about 23,000 patient encounters;and approximately 17,000 patients involved. Footnotes indicate data thathas been weighteed to provide a distribution equivalent to that which worldhave been obtained if the cardiologists had been surveyed in proportion totheir actual numbers within a cardiologist-type.
Activity Overview Content Analysis Categories
The content analysis plan employed seven primary and six secondary classi-fication variables. The variable, "direct patient care" , was expanded tofive; unspecified "personal time" was expanded to two; "travel" was expandedto three. In all, 49 recording classificaV.on possibilites were established,of which only 29 categories were required. The content analysis plan is sum-marized below.
Z110

238
Figure I
Diary Activity Overview Content AnalysisClassification Categories
Primary ClassificationCategory
Direct Patient CareTeachingResearchProfessionalAdministrationPersonal
1. Less than 1/2 day2. 1/2 day or more
TravelI. Local Professional2. Long Distance Professional3. Personal
Secondary ClassificationCategory
General (unspecificed)Direct Patient Care
1. Hospital Patients2. Office Patients3. Emergency Patients4. Laboratory and Diagnostic
Testing5. Other
TeachingResearchProfessionalAdministration
The combinations of a primary with a secondary classifie:3tion category hadunique alpha numeric codes designated for ease of memori.nation and similarityto that which they described. The personal classification categories employedto account for the tetc.4 recorded time hove iv-A been used in any of the analyseswhich follow.
Allocation of Time to Professional Activities Comparing ClassificationQuestionnaire Responses to Los -Diary Responses
Table 39 provides percentages of time obtained from the Cardiology ProfessionalDiary and the Initial Classification Questionnaire for the same cardiologists.The differences in assessments based on retrospective judgment (classificationquestionnaire) and recordings as events occur (log-diary) are quite evident.The most significant conclusions from this table are as follows.
The analysis of this table indicates the areas in which the cardiologists' estimatesof time were least consistent with their recorded time. The cardiologists who'smajor commitment is in patient care over-estimated this category more than others(even with adjustments for travel); those whose unique expertise is in specializedresearch and teaching over estimated these activities more than others. Perhapsan individual's assessment of the amount of time allocated to activities is dir-ectly correlated with is personal assessment of the particular activity's importance;such a hypothesis is supported by the findings in this tabulation. Clearly, thetable shows indi.viduals do not consistently estimate their activity time accurately;that if precision is required, then an approach such as tl:e log-diary is necessary.
"41

CM
;
TA
BL
E 39
CA
RD
IOL
OG
ISTS' A
CT
IVIT
Y T
IME
AS R
EPO
RT
ED
ON
CL
ASSIFIC
AT
ION
QU
EST
ION
NA
IRE
AN
D R
EC
OR
DE
D IN
LO
G-D
IAR
Y:*
AC
TIV
ITIE
S BY
SPEC
IAL
TY
AN
D T
YPE
OF PR
AC
TIC
E
Type of A
ctivity
Non-Institutional
Institutional
Primary
N=
111Secondary
N=
102
..ro
0,1
(3)
Primary
N=
97Secondary
N=
54
0/0411111111111111101011101.111111101111111111111111111111111.1111.111101111111111110111111111111110.10111.1101111.1111111.1111
Direct Patient C
are76.6
70.9
Teaching w
ith Patients
Teaching w
ithout Patients
Research w
ith Patients
Research w
ithout Patients
Professional
General A
dministration
8..3
2.1
2.4
0.4
5.3
4.9
82.575.7
6.65.5
4.0
2.41.3
1.2
0.20.8
0.2
1.40.1
0.8
10.14.0
9.3
8.45.8
8.8
23.6
7.3
14.8
11.0
5.9
9.7
.o
0
'4%
36.934.6
40.3
13.218.1
8.5
6.88.3
9.5
2.08.6
1.8
16.04.5
5.5
13.75.1
12.5
11.420.8
21.9
100.0100.0
TO
TA
L100.0
100.0100.0
100.0100.0
100.0
*Com
parative differences are conservative since log-diary travel time w
as not included inpercentage calculations.

240
A most important conclusion for this project is that the estimated activitytimes obtained from the Initial Cardiology Survey reauires some adjustmentbefore they are used in manpower projections based on time commitments toprofessional activities.
Patient Care General Time Allocations
Table 40 provides the summary statistics for assessment of the detailed patient-r dated data presented in the patient care section. It is apparent from thistable that:
o Non-Institutional cardiologists devote twice as much timeto patient care as Institutional cardiologists. Their hospital-based time is 50 percent greater and with the exception ofthe Primary Institutional cardiologists, their time in laboratoryand diagnostic testing work is equal.
o Patient-related administration consumes about the same per-centage of time for all cardiologists.
o Teaching activities for Non-Institutional cerdioIngists consumeabout 8 percent of their time and are primarily focused on teach-ing support staffs to perform specifi tasks.
o Teaching for the Institutional cardiologist accounts for 19percent of their time and appl'.cs to all levels of physiciansand support staffs.
o Research is an insignificant time consumer for the Non-Institutionalcardiologist.
o Research for Institutional cardiologists accounts for about 13 per-cent of their time; for the Primary cardiologist it accounts for 18pc:-.3ent of his time.
o Professional time percentages are quite similar for Non-Institutionalas a group and for Institutional as a group. Institutional cardiolo-gists devote approximately 3 percent more time to professionalactivities than Non-Instituticnal - a very modest difference intime.
o General administration consumes close to 9 percent of Non-Institutional cardiologist's time, 11 percent of Primary Insti-tutional's and 22 percent of the Secondary Institutional cardi-ologist's time. The very large amount of time for the SecondaryInstitutional cardicicg5.st is partially ez7lained by his role asa medical school tend /or hospital administrator and planner.

TA
BL
E 4
0
CA
TE
GO
RIE
S O
F C
AR
DIO
LO
GIS
TS'
AV
ER
AG
E D
AIL
Y A
CT
IVIT
Y T
IME
:T
YPE
OF
AC
TIV
ITY
BY
SPE
CIA
LT
Y A
ND
PR
AC
TIC
E
Typ
e of
Act
ivity
Non
-Ins
titut
iona
lIn
stitu
tiona
lA
llC
ardi
olog
ists
*Pr
imar
ySe
cond
ary
Prim
ary
Seco
ndar
y
% o
fT
ime
Hou
rs%
of
Tim
eH
ours
% o
fT
ime
Hou
rs%
of
Tim
eH
ours
% o
fT
ime
Hou
rs
DIR
EC
T P
AT
IEN
T C
AR
EU
nspe
cifi
ed1.
85.
01.
64.
23.
1H
ospi
tal
23.7
21.0
15.3
15.0
20.9
Off
ice
30.3
36.7
3.2
6.7
27.2
Non
-sch
edul
ed, E
mer
genc
y1.
82.
10.
81.
61.
8L
ab a
nd D
iagn
ostic
Tes
ts5.
43.
89.
04.
75.
3E
xten
ded
Car
e Fa
cilit
ies
0.4
1.0
0.0
1.8
0.6
Patie
nt R
ecor
ds, C
hart
s7.
56.
17.
06.
36.
7Su
btot
al70
.95.
975
.76.
636
.93.
140
.33.
465
.65.
6
TE
AC
HIN
GW
ith P
atie
nts
6.6
4.0
13.2
8.5
6.7
With
out P
atie
nts
2.4
1.2
6,8
9.5
3.0
Subt
otal
9.0
0.8
,5.
20.
520
.01.
718
.01.
59.
70.
8
RE
SEA
RC
HW
ith P
atie
nts
0.2
0.2
2.0
1.8
0.5
With
out P
atie
nts
1.4
0.8
16.0
5.5
3.9
Subt
otal
1.6
0.1
1.0
0.1
13.0
1.5
7.3
0.6
4.5
0.4
PRO
FESS
ION
AL
10.1
0.8
9.3
0.8
13.7
1,2
12.5
1.1
-10.
40.
9
GE
NE
RA
L A
DM
INIS
TR
AT
ION
8.4
0.7
8.8
0.8
11.4
1.0
,21
.91.
99.
80.
8
TO
TA
L10
0.0
8.3
100.
08.
810
0.0
8.5
100.
08.
510
0.0
8.5
.110
..*P
erce
ntag
es b
ased
on
wei
ghte
d fr
eque
ncie
s, a
djus
ted
to th
e pr
opor
tion
of a
ll ca
rdio
logi
sts
that
eac
hca
rdio
logi
st ty
pe r
epre
sent
s.Sa
uce:
3

242
Tables 41 and 42 examine differences in proportion of time allocated to profes-sional activities by medical community size for each of the four types of cardi-ology practices.
Patient Care Overview
As with the activity overview section, the data are based en 1,906 cardiolo-gist days, approximately equally distributed across each of the seven daysin a week. Whereas the unit for presenting data in the preceding section wasthe cardiologist day, in this section it is based on patients or patient encounters.
An encounter describes each time a cardiologist saw a patient. A patient, onthe other hand, might be seen several times. If the interest is in practice vol-ume, then the encountermeasure is used. On the other hand, if it is in therelative occurrence of a particular condition within the patient population thenthe patient measure is used. The proportion of each type of cardiologist's prac-tice which involved seeing a patient more than once during the five-day periodis shown in Table 43.
Weighting the data (assigning frequency counts by each specialty type) isprobably more important in this section than in any other becallse by far thegreatest number of patients are seen and treated by the Non-Institutional cardi-tlogists. Table 44 presents patient encounter statistics for each type ofcardiologist and ins a combined statistic icr all cardiologists on (1) the baseas actually obtained through the study and (2) adjusted to reflect the proportionof all cardiologists that each type of specialist actually represents. Throughweighting, only the frequency count chances; there are no changes of a pro-portionate nature within a particular type of specialist's profile. There arechanges of both a frequency fount character and a proportionate character asone specialist type is compared to another. These changes are shown quiteclearly in Table 44 and illustrate why weighting is required.
Secondary Non-Institutional cardiologists contributed 8,008 patient encounterswhich, when weighted, is a contribution of 12,251. The proportion of eachstatistic allocated between office and hospital for encounter setting and theproportion in percentage terms is:
Unweighted'Number Percent
WeightedNumber Percent
Office 5,334 66.6 8,160 66.6
Hospital 2,674 33.4 4,091 33.4
Total 8,008 100.0 12,251 100.0

TA
BL
E 4
I
CA
RD
IOL
OG
IST
S IN
NO
N-I
NST
ITU
TIO
NA
L P
RA
CT
ICE
:D
IST
RIB
UT
ION
OF
AV
ER
AG
E T
IME
(M
INU
TE
S) I
N P
RO
FESS
ION
AL
AC
TIV
ITIE
SPE
R D
AY
BY
SPE
CIA
LT
Y A
ND
PR
AC
TIC
E B
Y C
OM
MU
NIT
Y S
IZE
*
IOW
Typ
e of
Act
ivity
Prim
ary
Secondary
All
over
unde
r15
0,00
015
0,00
0C
ombi
ned
Doc
tor
Day
s (N
w)
547
161
over
150,
000
150,
000
Combined
Over
150,000
under
150,000
Com
bine
d
708
509
257
766
1426
48f;
1906
Dir
ect P
atie
nt C
are
Res
earc
h w
ith P
atie
nts
NR
esea
rch
with
out P
atie
nts
vTea
chin
g w
ith P
atie
nts
Tea
chin
g w
ithou
t Pat
ient
s
Adm
inis
trat
ion
Prof
essi
onal
Tra
vel
Tot
al A
vera
ge M
inut
esper Day
Ave
rage
Hou
rspe
r D
ay
348.
2
1.1
6.1
34.8
11.0
44.2
48.5
46.6
371.
0
2.1
8.8
27.7
16.3
35.0
49.1
35.8
353.
4
1.3
6.7
33.2
12.2
42.1
48.6
44.2
385.4
1.2
4.7
24.1
4.1
44.8
53.9
47.8
416.8
1.1
15.1
395.9
0.8
3.5
21.1
7.5
5.3
48.6
46.1
38.3
49.9
32.7
41.6
566.0
560.1
564.1
9.4
9.3
9.4
J20.0
3.6
22.0
36.3
15.2
51.3
56.2
47.2
373.8
1.5
9.9'
28.8
14.5
46.0
44.0
36.4
333.
6
3.1
19.0
34.4
15.0
49.9
53.1
44.5
551.8
554.9
552.6
ts..1
9.2
9.3
9.2
GO
Com
mun
ity s
ize
defi
ned
by th
e ph
ysic
ians
as
appr
oxim
ate
num
ber
of p
eopl
e w
ithin
a r
adiu
s of
25
mile
s of
thei
r pr
actic
e lo
catio
n.N
indi
cate
s w
eigh
ted
frequency counts, adjusted
tothe proportion
of a
ll ca
rdio
logi
sts
that
eac
h ca
rdio
logi
st ty
pe r
epre
sent
s.
Sour
ce:
3

TA
BL
E 4
2
CARDIOLOGISTS
IN I
NST
ITU
TIO
NA
LPRACTICE;
DISTRIBUTION OF AVERAGE TIME
(MIN
UT
ES)
IN
PR
OFE
SSIO
NA
L A
CT
IVIT
IES
PER
DA
Y B
Y S
PEC
IAL
TY
AN
D P
RA
CT
ICE
BY
CO
MM
UN
ITY
SIZ
E**
Typ
e of
Act
ivity
Prim
ary
Secondary
All
over
150,000
under
150,000
Com
bine
dov
er15
0,00
0un
der
150,
000
Com
bine
dov
er15
0,00
0un
der
150,
000
Com
bine
d
Doctor Days (Nw)
283
41*
324
8721
*
plas
viol
gt...
....
108
1426
480
1906
Dir
ect P
atie
nt C
are
184.0
193.4
185.2
201.1
217.3*
204.2
320.0
373.8
333.6
Res
earc
h w
ith P
atie
nts
10.8
6.7*
10.3
10.1
4.5*
9.0
3.6
1.5
3.1
Res
earc
h w
ithou
t Pat
ient
s81.1
71.7*
79.9
32.7
51.8*
27.5
22.0
9.9
19.0
Tea
chin
g w
ith P
atie
nts
59.9
107.1*
65.8
40.8
53.9*
43.4
36.3
28.8
34.4
Tea
chin
g w
ithou
t Pat
ient
s32.3
40.6*
33.4
51.2
35.5*
48.1
15.2
14.5
15-0
Adm
inis
trat
ion
58.4
40.1*
56.1
110.5
109.5*
110.3
51.3
46.0
49.9
Professional
71.3
53.7*
69.1
65.2
54.5*
63.1
56.2
44.0
53.1
Travel
46.0
54.9*
47.1
54.9
50.4*
54.0
47.2
36.4
44.5
Total Average
Min
utes
per
Day
543.
856
8.2*
546.
956
6.5
531.
4*55
9.6
551.
8554.9
512.6
Ave
rage
Hou
rspe
r D
ay9.1
9.5*
9.1
9.4
8.9*
9.3
5.2
9.3
9.2
* T
he f
requ
enci
es a
re to
o sm
all t
o us
e th
ese
data
with
the
conf
iden
ce e
stab
lishe
d fo
r th
e to
tal s
tudy
.**
Com
mun
ity s
ize
defi
ned
by th
e ph
ysic
ians
as
appr
oxim
ate
num
ber
of p
eopl
e w
ithin
a r
adiu
s of
25
mile
s of
thei
r pr
actic
e lo
catio
n.N
W in
dica
tes
wei
ghte
d fr
eque
ncy
coun
ts, a
djus
ted
to th
e pr
opor
tion
of a
ll ca
rdio
logi
sts
that
eac
h ca
rdio
logi
st ty
pe r
epre
sent
s.
Sour
ce:
3

245
TABLE 43
SINGLE AND MULTIPLE PATIENT ENCOUNTERSDISTRIBUTION AND PERCENT BY SETTING AND BY SPECIALTY AND PRACTICE
aft. 111. rifmsamMaradarNamemegwydr....411MOMMINIMI.
Setting
411111111111111110 1111110ft _1
Office
Non-InstitutionalPrimary Secondary
InstitutionalPrimary 'Secondary All
Single Encounters(Patients)
Repeat Encounters
Office EncountersTotal
Hospital
Single Encounters(Patients)
Repeat Encounters
Hospital EncountersTotal
Combined
Single Encounters(Patients)
Repeat Encounters
Combined EncountersTotal
4255(92.3)
355_17.7)
4610(100.0)
2116(51.0)
2029(49.0)
4145(100.0)
6371(72,8)
2384(27.2)
8755(100.0)
7197(88.3)
958(11.7)
8155(100.0)
2029(49.6)
2062(60.4)_
4091(100.0)
9226(75.3)
3020(24.7)
12246(100.0)
324(85.3)
56(14.7)
380(100.0)
669(66.2)
342(33.8)
202 11978(92.4) (89.6)
16 1385(7.6) (10.4)
218 13363(100.0) (100.0)
265 5079(65.6) (52.6)
139 4572(34.4! (47.4)
1011 404 96511,100.0) (4.00.0) (100.0)
993 46" 17057(71.4) (75.0) (74.1)
398 155 5957(28.6) (25.01 (25.9)
1391 622 23014(100.0) (100.0) (100.0)
romMalldiallINIMIdeliONIMINE111106111soromm.11norimimeale1111M141..
N indicates weighted fr"]quency counts, adjusted to the proportion of allcardiologists that each cardiologist type represents.
Source: 3
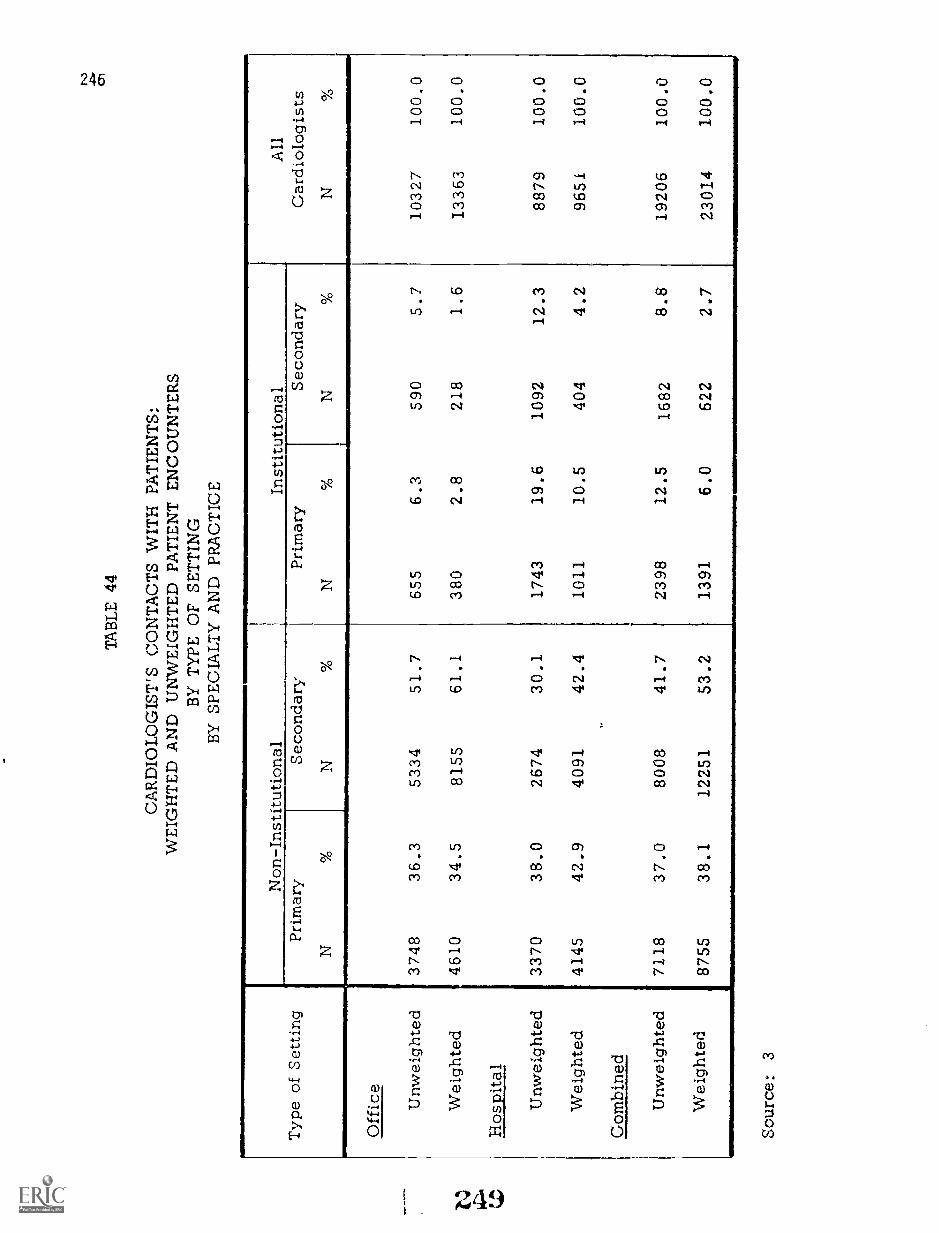
TA
BL
E 4
4
CA
RD
IOL
OG
IST
'S C
ON
TA
CT
S W
ITH
PA
TIE
NT
S:W
EIG
HT
ED
AN
D U
NW
EIG
HT
ED
PA
TIE
NT
EN
CO
UN
TE
RS
BY
TY
PE O
F SE
TT
ING
BY
SPE
CIA
LT
Y A
ND
PR
AC
TIC
E
Typ
e of
Set
ting
Non
-Ins
titut
iona
lIn
stitu
tiona
lPr
imar
ySe
cond
ary
N%
1N
%
All
Car
diol
ogis
tsN
Prim
ary
N%
Seco
ndar
yN
%
Off
ice
Unw
eigh
ted
3748
36.3
5334
51.7
655
6.3
590
5.7
1032
710
0.0
Wei
ghte
d46
1034
.581
5561
.138
02.
821
81.
613
363
100.
0
Hos
pita
l
Unw
eigh
ted
3370
38.0
2674
30.1
1743
19.6
1092
12.3
8879
100.
0
Wei
ghte
d41
4542
.940
9142
.410
1110
.540
44.
296
5110
0.0
Com
bine
d
Unw
eigh
ted
7118
37.0
8008
41.7
2398
12.5
1682
8.8
1920
610
0.0
Wei
ghte
d87
5538
.112251
53.2
1391
6.0
622
2.7
23014
100.0
Sour
ce:
3

247BEST COPY AVAILABLE
The effect of weighted and non-weighted frequencies in comparisons betweengroups is shown in the table above.
In no instance is log-diary data presented that has not been weighted wherefailure to do so would permit incorrect conclusions if the statistics presentedwere extended to all cardiologists.
Patient Care
Statistical tables have been prepared with each of the primary analysis variablesand patient descriptors as a major analysis dimension.
Age of patients for both cardiac and non-cardiac patients is presentedin Tables 45 .:rid 46.
Sex of NAtients for both cardiac and no-J.-I-cardiac patients is presentedin Tables 47 a;-,(1 48.
Patient Ethnicity. White (w), Black (B) and Other (0) were used inthe patient decriptors to denote ethnic art /tr racial differences.The categories did not meta*" Via differoatIation desired - possiblybecause or the ambicuity related to what constitutes "White" andwhat constitutes "Other". Keeping in mind the fact that "Other" isbadly under-reported, TF,ble 49 summarizes patient encounters bythis ethnic classification.
Distant to Care. It was expected that patients would travel fartherto see a Primary Cardiologist than to see a Secondary Cardiologist,and thz:t, in turn, proportionately more time would be given to thosecoming greater distances than to those in close proximity to thecardiologist. Tables 50 and 51 present distance related ste.tisticswhich support this assumption.
Patient Sources and Time. Tables 52, 53, and 54 ,.;xamine earth -ologist's patients by where seen and by whether they are referralpatients or patients within the cardiologist's practice. The timegiven to these classes of pc-tients in either the office or hospitalsettfng is presented in Tables 55 and 56. The relatively largernumber of patients seen by the specialist as referral patients isnot unexpected. One should not conclude that those noted as "ownpr:y.-tice" are not primarily cardiac; this latter allocation is dis-cussed in a later section.
Cardiologists' fatients Clinical Conditions
The clinical conditions encountered and reported by the cardiologists provide
rA.:60

248
TABLE 45
PRIMARY CARDIAC PATIENT'S AGE;COMBINED orricE AND HOSPITAL AGE-GROUPED PATIENTS
BY SPECIALTY AND PRACTICE(DISTRIBUTION IN PERCENT)
441111=010
Age Groups
"IllmiftlWrimmem
AllNon-Institutional
VIMME
InstitutionalPrimary Se co: Primary Secondary
APINIPIONZIPMIINIM
Combined Nw 3683 3346 720 200 7949
Percent of Total % 46.4 42.1 9.0 2,5 100.0
4 years and under 0.3 0.3 0.6 0.4 0.3
5 through 14 years 0.7 0.5 1.1 1.8 0.7
15 through 24 years 2.3 2.7 4.7 3.7 2.7
25 through 34 years 4.1 2.4 6.1 4.6 3.6
35 through 44 years 8.1 8.4 14.3 12.2 8.9
45 through 54 years 18.2 14.7 23.3 19.3 17.2
55 through 64 years 25.0 21.8 21..9 23.1 23.3
65 through 74 years 24.8 29.2 19.3 20.7 26.1
75 through 84 years 13.8 16.1 7.2 12.2 14.1
85 years and over 2.7 3.9 1.5 2.0 3.1
Totals.
100.0 100.0 100.0 100.0 100.0
Nw indicates weighted frequency counts, adjusted to the proportion of allcardiologists that each cardiologist type represents.Source: 3 251
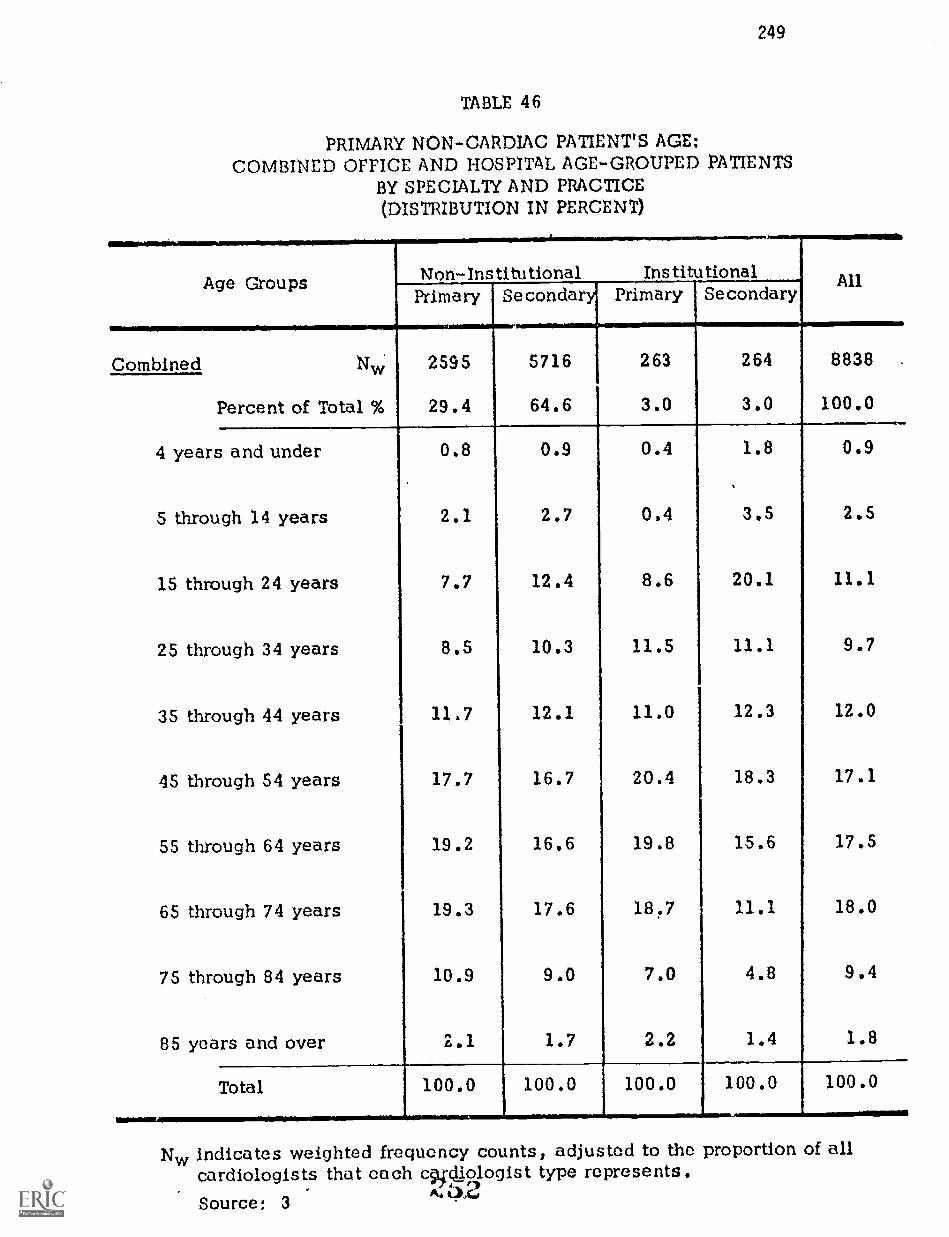
249
TABLE 46
PRIMARY NON-CARDIAC PATIENT'S AGE:COMBINED OFFICE AND HOSPITAL AGE-GROUPED PATIENTS
BY SPECIALTY AND PRACTICE(DISTRIBUTION IN PERCENT)
Age Groups Non-Institutional InstitutionalPrimary Secondary Primary Secondary
All
Combined 2595 5716 263 264 8838
Percent of Total % 29.4 64.6 3.0 3.0 100.0
4 years and under 0.8 0.9 0.4 1.8 0.9
5 through 14 years 2.1 2.7 0.4 3.5 2.5
15 through 24 years 7.7 12.4 8.6 20.1 11.1
25 through 34 years 8.5 10.3 11.5 11.1 9.7
35 through 44 years 11.7 12.1 11.0 12.3 12.0
45 through 54 years 17.7 16.7 20.4 18.3 17.1
55 through 64 years 19.2 16.6 19.8 15.6 17.5
65 through 74 years 19.3 17.6 18.7 11.1 18.0
75 through 84 years 10.9 9.0 7.0 4.8 9.4
85 years and over 2.1 1.7 2.2 1.4 1.8
Total 100.0 100.0 100.0 100.0 100.0
Nw indicates weighted frequency counts, adjusted to the proportion of allcardiologists that each c9pliologist type represents.Source: 3

250
TABLE 47
CARDIOLOGISTS' CARDIAC PATIENTS BY SEX:PATIENTS' SETTING BY TYPE BY SPECIALTY AND PRACTICE
Patient andType of Setting
Non-Institutional nstitutionalPrimary Secondary Primary Secondary All
Office Nw
Male
Female
2439 2526 244 78 5287
o 50.1
49.9
46.9
53.1
56.3 53.6
43.7 46.4
Total 100.0
Hospital
Male
Female
100.0
1256 843
100.0 100.0
476
52.3 50,6
47.,
Total
Combined
Male
Female
49.4
58.7
41.3
100.0 100.0 100.0
3695 3369 720
0/0
0/
50.8 47.)
49.2 52.1
57.9
42.1
123
57.7
42.3
100.0
201
56.1
43.9
48.9
51.1
100.0
2698
53.2
46.8
100.0
7985
50.3
49.7
Total 100.0 100.0 100.0 100.0NEW
100.0
Nw indicates weighted frequency counts, adjusted to the proportion of allcardiologists that each cardiologist type represents.
Source: 3

251
TABLE 48
CARDIOLOGISTS' NON CARDIAC PATIENTS BY SEX:PATIENTS' SETTING BY TYPE BY SPECIALTY AND PRACTICE
.r...................-..--,Patient and Non-Institutional Institutional
AllType of Setting Primary Secondary Pi-II-nary Secondary
Office Nw 1761 4592 78 123 6554
Male % 46.4 41.5 56.0 38.1 42.9
Female % 53.6 58.5 44.0 61.9 57.1
Total % 100.0 100.0 100.0 100.0 100.0
II:a. NEN/Mis ,
liosi,jtal Nw 846 1160 186 141 2333
Male % 48.0 44.7 51.6 52.9 46.9
Female % 52.0 55.3 48.4 47.1 53.1
Total % 100.0 100.0 100.0 100.0 100.0
Combined Nw 2607 5752 264 264 8887
1
Male % 46.9 42.1 52.9 46.0 44.0
Female % 53.1 57.9 47.1 54.0 56.0
Total 100.0 100.0 100.0 100.0 100.0
.........................................6...........Nw indicates weighted frequency counts, adjusted to the proportion of all
cardiologists that each cardiologist type represents.
Source: 3
254

252
TABLE 49
PATIENT ENCOUNTERS:DISTRIBUTION BY SETTING AND ETHNICITY BY SPECIALTY AND PRACTICE
Ethnicityand
Type of Setting
Non-Institutional Institutional AllPrimary Secondary Primary Secondary
Office Nw 4536 7928 366 216 13046
White 32.2 57.2 2.3 1.3 93.0
Black % 2.0 3.0 0.4 0.4 5.8
Other % 0.6 0.5 - 0.1 1.2
Total % 34.8 60.7 2.7 1.8 100.0.Hospital 4005 3891 983 403 9282
White % 39.2 38.5 8.8 3.9 90.4
Black % 2.7 3.4 1.6 0.4 8.1
Other % 1.0 0.3 0.2 1.5
Total % 42.9 42.2 10.6 4.3 100.0
Combined N 8541 11819 1349 619 22328
White % 35.1 49.5 5.0 2.3 91.9
Black 2.3 3.2 0.9 0.4 6.8
Other % 0.8 0.4 0.1 - 1.4
Total % 38.2 53.1 6.0 2.7 100.0
Nay indicates weighted frequency counts, adjusted to the proportion of allcardiologists that each cardiologist type represents.
Source: 3
dr, i` r--A.ralc)

TABLE 50
PATIENT DISTANCE TO CARE:ENCOUNTER SETTING AND DISTANCE INTERVALS BY SPECIALTY AND PRACTICE
Distanceand
Type of Setting
Non-Institutional Institutional AllPrimary Secondary Primary Secondary
Office Overall % 34.5 61.0 2.9 1.6 100.0
0-4 miles % 49.8 56.7 54.4 77.5 54.6
5-25 miles % 41.8 40.1 34.0 18.6 40.2
26 miles and over % 8.4 3.2 11.6 3.9 5.2
Total % 100.0 100.0 100.0 100.0 100.04,...........,.............,..
Hospital Overall % 43.0 42.3 10.5 4.2 100.0
0-4 miles % 68.0 66.0 47.4 61.0 64.7
5-25 miles % 22.8 27.3 34.1 29.7 26.2
26 miles and over % 9.2 6.7 18.5 9.3 9.1
Total 100.0 100.0 100.0 100.0 100.0
Combined Overall % 38.0 53.3 6.0 2.7 100.0
0-4 miles % 58.4 59.8 49.3 66.8 58.8
5-25 miles % 32.8 35.8 34.1 25.8 34.3
26 miles and over 8.8 4.4 16.6 7.4 6.9
Total % 100.0 100,0 100.0 100.0 100.0
Source: 3

254
TABLE 51
AVERAGE ENCOUNTER TIME BY PATIENT DISTANCE TO CARE:ENCOUNTER SETTING BY SPECIALTY AND PRACTICE
(AVERAGE TIME IN MINUTES)
Distance to CareDistance
Type of Setting
Non-Institutional InstitutionalAllPrimary Secondary Primary Se Gonda
Office Nw 4610 8159 380 218 13367
0-4 miles (Min.) 22.2 18.1 30.1 21.3 19.8
5-25 miles (Min.) 24.2 20.3 34.5 27.7 22,1
26 miles and over (Min.) 27.4 23.5 36.9 38.5 26.7
Hospital NW 4145 4091 1011 404 9651
0-4 miles (Min.) 16.5 15.2 21.4 20.9 16.5
5-25 miles (Min.) 19.6 16.1 26.8 17.4 18.9
26 miles and over (Min.) 19.4 10.9 32.6 24.6 19.8
Combined Nw 8755 12250 1391 622 23018
0-4 miles (Min.) 19.1 17.1 24.0 21.1 18.3
5-25 miles (Min.) 22.7 19,3 28.9 20.0 21.1
26 miles and over (Min.) 23.4 17.0 33.5 27.2 22,8
Nw indicates weighted frequency counts, adjusted to the proportion of allcardiologists that each cardiologist type represents.
Source: 3

255
TABLE 52
CARDIOLOGISTS' PATIENT SOURCES:ENCOUNTER SETTING BY SOURCE BY SPECIALTY AND PRACTICE
Patient Source andType of Setting
Non-Institutional InstitutionalAllPrimary Secondary Primary Secondary
Office Nw 4309 7874 361 210 12754
Referral % 21.5 13.6 44.2 21.1 17.2
Own Practice % 78.5 86.4 55.8 78.9 82.8
Total % 100.0 100.0 100.0 100.0 100.0
Hospital Nw 3862 3829 908 388 8987
f
Referral % 49.7 32.7 70.4 58.9 44.9
Own Practice % 50.3 67.3 29.6 41.1 55.1
Total % 100.0 100.0 100.0 100.0 100.0
Combined NW 8171 11703 1269 598 21741
Referral % 34.8 19.8 63.1 45.7 28.7
Own Practice % 65.2 80.2 36.9 54.3 71.3
Total % 100.0 100.0 100.0 100.0 100.0
Nw indicates weighted frequency counts, adjusted to the proportion of allcardiologists that each cardiologist type represents.
Source: 3

256
TABLE 53
CARDIOLOGISTS' CARDIAC PATIENT SOURCES:ENCOUNTER SETTING BY SOURCE BY SPECIALTY AND PRACTICE
Patient Source and
r
Non-Institutional InstitutionalAllType of Setting Primary Secondary Primary Secondary
Office Nw 2471 2838 273 80 5662
Referral % 25.0 13.9 44.1 21.7 20.3
Own Practice % 75.0 86.1 55.9 78.3 79.7
Total % 100.0 100.0 100.0 100.0 100.0
Llup_ital Nw 2392 1654 661 192 4899
Referral % 53.3 37.6 73.9 70.4 51.4
Own Practice % 46,7 62.4 26.1. 29.6 48.6
Total % 100.0 100.0 100.0 100.0 100.0
Combined 4863 4492 934 272 10561
Referral % 38.9 22.6 65.2 56.0 34.7
Own Practice % 61.1 77.4 34.8 44.0 65.3
Total % 100.0 100.0 100.0 100.0 100.0
Nw indicates weighted frequency counts, adjusted to the proportion of allcardiologists that each cardiologi,.' type represents.Source: 3
2 5 9

257
TABLE 54
CARDIOLOGISTS' NON-CARDIAC PATIENT SOURCES:ENCOUNTER SETTING BY SOURCE BY SPECIALTY AND PRACTICE
Patient Source andType of Setting
Non-Institutional InstitutionalAllPrimary Secondary Primary Secondary
Office NW, 1838 5036 88 130 7092
Referral % 16.3 13.3 43.4 20.7 14.6
Own Practice % 83.7 86.7 56.6 79.3 85.4
Total % 100.0 100.0 100.0 100.0 100.0............t.............,..............0.I.
Hospital Nw 1470 2175 247 196 4088
Referral % 44.0 29.8 65.0 47.9 37.9
Own Practice % 56.0 70.2 35,0 52.1 62.1
Total % 100.0 100.0 100.0 100.0 100.0
Combined Nw 3308 7211 335 326 11180
Referral % 28.6 18.3 59.3 37.1 23.1
Own Practice % 71.4 81.7 40.7 62.9 76.9
Total 100.0 100.0 100.0 100.0 100.0
Nw indicates weighted frecre, ncy counts, adjusted to the proportion of allcardiologists that each cardiologist type represents.
Source: 3
r 260

258
FIGURE 55
AVERAGE ENCOUNTER TIME WITH CARDIAC PATIENTS:ENCOUNTER SETTING BY PATIENT SOURCE BY SPECIALTY AND PRACTICE
(AVERAGE TIME IN MINUTES)
Patient Sourceand
Type of Setting
Non-InstitutionalPrimary Seconda
Office
Source:Referral
Own Practice
2471 2838
(Min.)
(Min.)
33.5
23.7
Hospital
Source:Referral
22.9
19.1
2392 1654
(Min.)
Own Practice (Min.)
Combined
Source:Referral
19.2
16.9
4863
15.5
15.4
4492
(Min.)
Own Practice (Min.)
23.9
21.1
18.3
18.0-iimmerourromireirmirlorreumpaskwirarrosarmarromr
InstitutionalAllPrimary Secondary
273 80 5662
40.7 32.9 30.6
26.5 23.7 21.3
661 192 4899
28.9 18.6 20.1
22.2 20.8 16.7
934 272 10561
31.2 20.2 23.4
24.2 22.3 19.7
NN, indicates weighted frequency counts, adjusted to the proportion of allcardiologists that each cardiologist type represents.
Source: 3
261

TABLE 56
AVERAGE ENCOUNTER TIME WITH NON-CARDIAC PATIENTS:ENCOUNTER SETTING BY PATIENT SOURCE BY SPECIALTY AND PRACTICE
(AVERAGE TIME IN MINUTES)
Patient Sourceand
Type of Setting
Non-Institutional Institutional AllPrimary Secondary Primary Secondary
Office Nvy 1838 5036 88 130 7092
Source:Referral (Min.) 26.0 23.4 44.0 25.9 25.0
Own Practice (Min.) 18.9 18.6 27.6 20.2 18.8
Nw 1470 247 196 4088,Hospital
Source:Referral (Min.) 18.0 15.0 28.0 21.3 18.0
Own Practice (Min.) 16.0 15.2 15.4 20.3 15.7
Combined Nay 3308 7211 335 326 11180
Source:Referral (Min.) 20.5 19.3 31.0 22.3 20.8
Own Practice (Min.) 17.9 17.7 19.9 20.2 17.9
Nw indicates weighted frequency counts, adjusted to the proportion of allcardiologists that each cardiologist type represents.
Source: 3
262

260
indices of the prevalence of cardiac disease within practices and the possibleemphases which shoule be given in the training of imaviduals to manage theseconditions, If one assumes that the situations cardioloaists actually encounterare indicators of what they should be able to manage, then programs can bedeveloped in those areas which (1) represent high occurrence conditions and/or(2) are sufficiently serious in their actual recognized setting to warrant train-ing going beyond the ability to identify the condition. The data which have beenanalyzed may permit Judgments regarding which of the conditions constitute thecore which all cardiologists should be capable of handling and which could behandled on a referral basis by others.
Tables 57 and 58 for primary cardiac conditions and Tables 59 and 60 forprimary non-cardiac conditions present the percentage distribution by eachtype of specialist for each of the diagnostic conditions. Tables 57 and 59give these percentages for all encounter locations. Tables 58 and 60 providethe percentages for patients seen in the office and in the hospital. The first(general) table for cardiac or non-cardiac is the overall choice frequency. Thesecond (allocating patients by location) provides inferential data related toseverity of the problem, i.e., those in the hospital are presumably sicker thanthose who are seen and released from the office. The data contained in thesetables may be seen as summary patient profiles according to the disease categoriesindicated for each of the types of cardiologist and for all cardiologists. Viewedas such they provide interesting insights regarding the primacy of either cardiacor non-cardiac conditions within cardiologists' practices. However, thesesummaries are overly simplistic since they do not take secondary cardiac ornon-cardiac concltions into acconnt - they are limited exclmively to primacy ofdisease condition.
Seventy-four percent of all primary car.11ac patients have one of six cardiacconditions. (Table 57.) These are:
o Coronary atherosclerosis, without infarction 26.1 percent
o ert ens ion 20.7 percent
o Acutemyocathial infarction C.4 percent
o Heart failure: chronic, severe 8.1 percent
o Rheumatic 5.1 percent
o Arrhythmia 4.1 percent
Table 58 provides distributions for the cardiologists' patients in the offic . andin the hospit:11. Each column totals 100 percent to permit comparisons of occur-rence by encounter setting (office or hospital) for particular disease condition.For example, acute myocardial infarction is reported by all cardiologists 4,9
i3

BEST COPY AVAILABLE
261
TABLE 57
PAY1£1413 WITH PIIINUitY CARDIAC DIAGNOSIS:CARDIAC DIAGNOSIS PLACENTA= AY SPECIAL1Y AND MC=
PrimaryCardiac Dia gyro sla
MiCardiologistsPrimary Seoondary Minify Secondary
Percent at )41Cardiac Diaonosts 46.3 42.2 4.0 1.5 100.0
Heart Failure:Aorta. 'oven 2.6 3.2 3,5 2.4 1.0
Heart ?athirstChronic. Sewn 6.8 4.? 7.6 7.1 8.1
Acute MyormodlalInfarction
flulirrovery
9.1 8.7 104 14.1 9.4
Embolism 1.4 1.1 1.2 0.9 1.1
Patios:dialMesas 0.6 0,1 1.0 0.1 8..i
CoronaryAtharoselerosii,without Infarction 20.0 24.1 17.6 20.2 lilaityperteruelon 20.3 23.4 8,0 23.0 20.?
Itheumovic 3.2 3.1 11.1 3.7 3.1
Carillosiyopethy 1.1 0.4 3.1 2.9 1.4
Arrhythmia 3.4 2.8 4.3 1.7 4.1
Disclious 11.1 - 0.3 - 0.1
INrigheral VaicularDisease 3.3 3,1 1.1 3.1 3,1
Carobral VascularDisease 2.6 4.7 1.3 1.4 3.4
Psychosomatic{Cardiac) 1.4 1.9 1.3 1.3 1,6
Post CardiacSurgery 2,1 0.1 2.3 2.0 1,6
PacernakotEvaluation 1.0 0.4 2.2 1.3 0.9
Congenital 1,7 0.7 445 0.4 1.1
No 3.7 4.0 1.9 1.? s.1
Other 2,1 1.4 4.8 2.2 1.0
TOTAL 100.0 100.0 100,0 100.0 100.0
.....-.ftw 3573 3126 711 114 7613
Nw indicates weightori firqueticy retorts, adjusted to thaw proportion at allcardiologist, that oath cardiologist type repro/ants.
Source: 3
ti bid

262
BEST COPY AVAILABLE
TABLE 58
PATIENTS WITH PRIMARY CARDIAC DIAGNOSIS:CARDIAC DIAGNOSIS PERCENTAGE by SPECIALTY AND PRACTICE
EY TYPE or SETTING
PrimaryCardiac DiagrDiagnosis
AllA
Cardiologistsitytnary e nda Primary SscorYleryOltice Hospital Who* Hospital (Mk. Hospital Milos *myna) 011101 Hospital
Tercant of All CardiacDiagnoses by Setting 46.1 4413 47.8 31.2 4.6 17.7 1.5 4.5 100.0 100.0
Per of DiagnosticCategories witidainnings:
Head 7a IluswiAtiute, Severs 0.8 6.2 1,9 7.1 0.2 3.1 .. 3.9 1.1 5.:.
Heart failure:Chronic, Severs 5.8 0.5 0.5 13.1 4.3 3.2 2.8 10.5 7.0 10.3
Aorta *MK:14*a*lalarctIon 4.3 15.1 5.3 18.3 4.0 13.9 5.7 19.5 4.9 18.1
PidieonaryEmbolism 1.2 3.4 0.5 2.0 1.2 2.8 1,5 0.4 3.1
PericardialMaass 0.3 1.3 0.4 0,9 0.2 1.3 0.3 1.2 0.3 1.2
CoronaryAtherosclerosis,without infarction 31.5 21.1 26.3 17.4 39.0 21.7 24.2 17,7 29.1 10.0
Hypertension 26.4 9.1 17.5 11.1 14.0 5.0 40.3 17.0 26,5 9.1
Rheumatic 5.11 4. 3.5 3.1 13,1 10.7 2.II 7.5 5.0 5.2
Carlicornyopathy 1.5 1.4 0,7 t.s 2.4 3.5 1.1 3,1 1.1 1.9
Arrhythmia 5.2 5.8 2.0 2.7 3.4 4.4 0.5 2.4 3.1 4.5
Infectious 0.1 0.1 - 0.2 - 1.0 - - - 0.3
Peripheral VascularDisease 3.3 3.3 2.8 3.8 1.2 1.8 2.4 4.8 3.0 3.3
Cerebral VascularOmuta. 2.1 Li 3.5 7.1 1.7 1.1 3.8 2,4 3.0 4.1
Psychosomatic(Cardiac) 1.4 1.3 2.1 1.3 1,0 1.3 2.9 0.3 1.7 1,3
Post CardiacSurgery 1.7 3.0 0.7 1.3 1.) 2.8 - 3.a 1.2 2.5
PacemakerEvaluation 0.9 1.3 0.4 0.4 0.7 3.0 2.4 0.5 0.6 1.3
Congenital 1.8 1.6 0.8 0.5 3,1 5.1 0,5 0.1 1.3 1.8
Wm* 3.2 4.2 10.6 4.7 2.3 1.1 7,0 6.7 7.1 3.1
Other 2.0 2.3 1.5 0.9 5.7 4.4 2.4 2.1 1.1) 2,1
TOTAL 100.0 100.0 100.0 100.0 100.0 100.0 100.0 100.0 100.0 100.0
Source: 3
265

BEST COPY AVAILABLE
26.3
TABLE 59
PATIENTS WITH PRIMARY NON - CARDIAC DIAGNOSIS:.NON - CARDIAC DIAGNOSIS PERCENTAGE BY SPECIALTY AND PRACTICE
Primary 'Non-Institutional InstitutionalPrimary [Secondary
AllCardiologistsNon-Cardiac Diagnosis Primary 'Secondary
Percent of All 29.4 64.6 3.0 3.0 100.0Non-Cardiac Diagnoses
Respiratory 14.0 13.6 17.14
14.7 13.8
Renal 2.4 1.9 4.6 2.9 2.2
Neurological 5.8 5,0 10,1 5.7 5.4
Glairo-Intestinal 15.2 13.1 14.9 10.3 13.1
Musculoskeletal 12.7 12,3 9.0 11.9 12.3
Psychiatric 7.0 8.4 5.1 8.8 7.9
Gerdto-Urinary 4.5 4.4 3.1 3.9 4.4
DernicitologLAI
i)ostetrics/
2.0 3.7 0.4 4.1 3.1
Gynecology 2.0 3.7 2.2 1.4 3.1
Endocrine 9.9 8.2 7.7 11.7 8.8
MIT 1.8 3.8 2.4 3.5 3.2
None 8.3 4,4 10,7 2.8 S.6
Checkup,Physical Exam 1.0 11.0 4.6 4.9 9.4
Other ' 4.9 5.3 5,5 11.2 5.4
Hemic andLymphatic 2.S 1.2 2.6 2.2 1.7
TOTAL 100.0 100.0 100,0 100.0 100.0
Nw 2431 5643 249 259 8580
Nw indicates weighted frequency counts, adjusted to the proportion of allcardiologists that each cardiologist type represents.
Source: 3
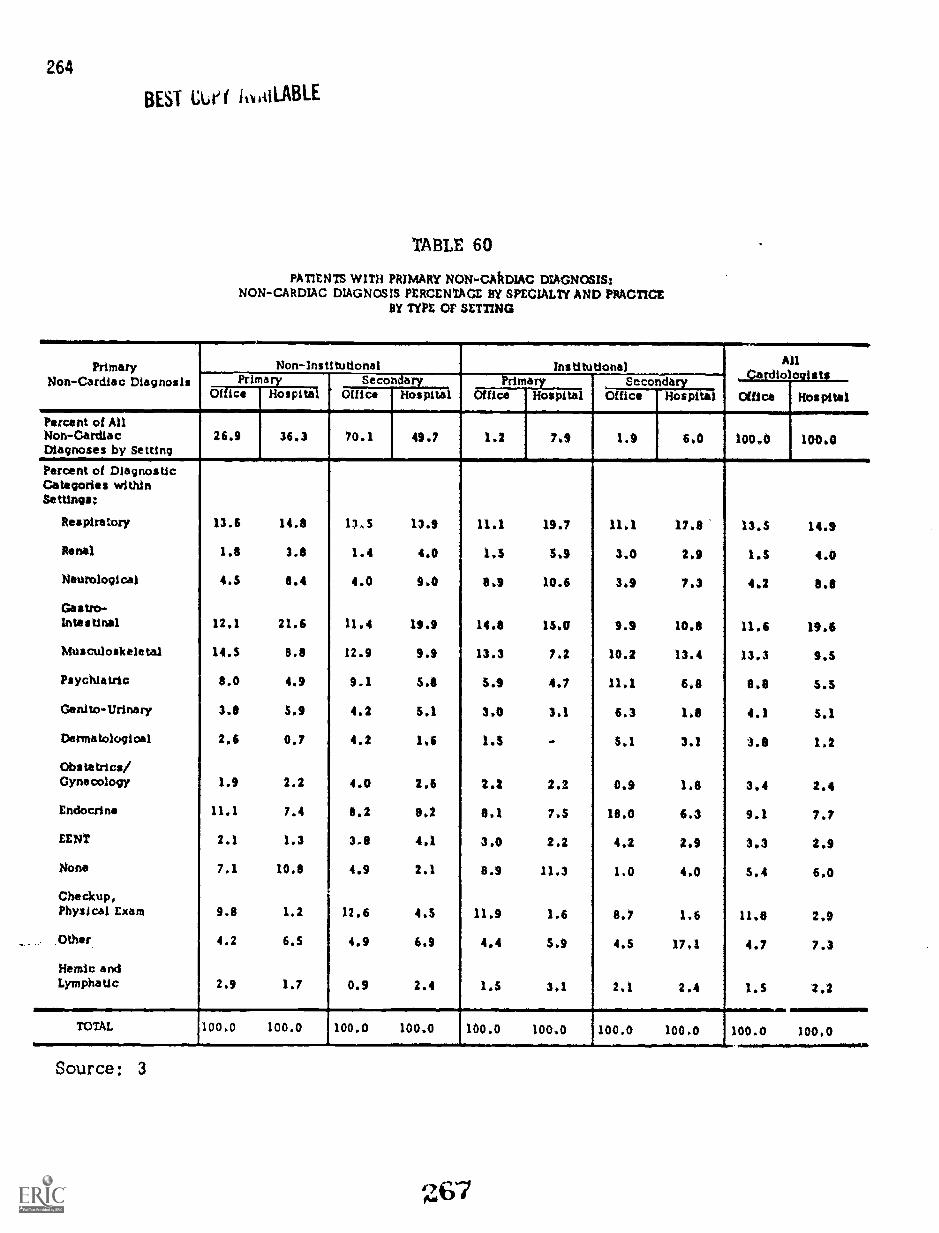
264
BEST Cue( ii BAILABLE
TABLE 60
PATIENTS WITH PRIMARY NON - CAkDIAC DIAGNOSIS!NON-CARDIAC DIAGNOSIS PERCENTAGE BY SPECIALTY AND PRACTICE
BY TYPE or SETTING
.......... ,..---,Primary
Non- Cardiac DiagnosisNon-Institutional institutional
1---
.---4Secondary
AllCardiologistsPrimary Secondary Primary
Office KospitalOffice Hospital Office Hospital Office Hospital Office Hospital
Percent of AllNon-Cardiac 26.9 36.3 70.1 49.7 1.2 7.9 1.9 6.0 100.0 100.0Diagnoses by Setting
Percent of Diagnostic--
Categories withinSettings!
Respiratory 13.6 14.9 13.5 13.9 11.1 19.7 11,1 17.8 13.5 14.9
Rana) 1.8 3.8 1.4 4.0 1.5 5.9 3.0 2.9 1,5 4.0
Neurological 4.5 8.4 4.0 9.0 8.9 10.6 3.9 7.3 4.2 6.8
Gastro-intestinal 12.1 21.6 11.4 19.9 14.9 13,0 9.9 10.9 11,6 19,6
Musculoskeletal 14.5 8.8 12.9 9.9 13.3 7.2 10.2 13.4 13.3 9.5
Psychiatric 8.0 4.9 9.1 5.1 5.9 4.7 11.1 6.8 8.8 5.5
Genito-Urinary 3.8 5.9 4.2 5.1 3.0 3.1 6.3 1.8 4.1 5.1
Dermatological 2.6 0.7 4.2 1,6 1.3 - 5.1 3.1 3.8 1.2
Obstetrics/Gynecology 1.9 2.2 4.0 2.6 2.2 2.2 0.9 1.8 3,4 2.4
Endocrine 11.1 7.4 8.2 8*2 8.1 7.5 18.0 6.3 9.1 7.7
LENT 2.1 1.3 3.8 4,1 3.0 2.2 4.2 2.9 3.3 2,9
None 7.1 10.8 4.9 2.1 8.9 11.3 1.0 4.0 5.4 6.0
Checkup,Physical Exam 9.8 1.2 12.6 4.5 11.9 1.6 8.7 1,6 11.8 2.9
Other 4.2 6.5 4.9 6.9 4,4 5.9 4.5 17,1 4.7 7.3
Hemic andLymphatic 2.9 1.7 0.9 2.4 1,5 3,1 2.1 2.4 1.5 2,2
TOTAL 1004 100.0 100.0 100.0 100.0 100.0 100.0 100.0 100.0 100.0
Source: 3

265
percent of the time for office patients and 18.1 percent of the time for hospitalpatients. There are no apparent anomalies in these distributions; conditionsof a minor nature are seen proportionately more in the office and those whichwould require extensive treatment facilities, at least in their advanced stages,are found more commonly in the hospital.
The primary non-cardiac distribution tables follow exactly the same formatas has been discussed for cardiac. Table 59 provides frequency of occurrencefor conditions by each type of specialty. Table 60 gives the same patient dataexcept that they are distributed between office and hospital.
The primary non-cardiac diagnostic data are presented (1) to complete thedescription of cardiologists' practice and (2) as contributory conditions toother, secondary cardiac conditions. The relationship of cardiac to non-cardiac is discussed and presented for selected primary conditions in thesection which follows .
While the occurrence of non-cardiac primary conditions has a wider distributiverange (more conditions with relatively high occurrence rates), five conditionsaccount for 58 percent of all primary non-cardiac patient diagnoses. These are:
o Respiratory 13.8 percent
o Gastro-inteF:tinal 13.7 percent
o Musculoskeletal 12.3 percent
o Check up (physical) 9.4 percent
o Endocrine 8.8 percent
Cardiac Ste. ecialty and Non-Sociaitycarq,
The log-diary obtained a cardiologist classification as to whether or not theseries of patient problem conditions noted was primarily cardiac or primarilynon - cardiac. This classification permitted analysis by the permutations notedin Tables 61, 62 and 63. There are eight patient condition groupings used inthese tables . The eight may be summarized by three categories, it may be notedthat for all cardiologists, approximately 47 percent 1 the patients were primarycardiac patients. (Table 61.) It is assumed that for both the Primary Cardiolo-gists and the Secondary Cardiologists that specialized care is being provided.It is not posaibie to differentiate hetween those patients which are referral andthose which are not from these particular tables.
The primary non-cardiac with associated cardiac Ftatistics describe patientswith multiple clinical problems. It Is assumed that both specialized and general
268

266BEST COPY AVAILABLE
TABLE 61
COMBINED OFFICE AND HOStITAL DIAGNOSTIC CONDITIONS:PRIMARY CARDIAC AND NON-CARDIAC WITH ASSOCIATED SECONDARY CONDITIONS
DISTRIBUTION BY PHYSICIAN SPECIALTY AND PRACTICE
DiagnosticConditions
Non-Institutional Ins titutionai
Nw
Primary
6004
Secondary Primary %Si oonclio ty All
8769 969 453 16195
Primary Cardiac
Cardiac Only
Cardiac with Cardiac
Cardiac with Non-Cardiac
Cardiac with Cardiac and Non-Cardiac
Cardiac Subtotal
26.1
12.9
12.8
7.7
59.5
11.9 33.2 20.3
5.5 9.2 7.2
11.4 19.2 11.5
6.9 12.6 3.8
35.7
7.4
Primary Non-Cardiac with Cardiac
Non-Cardiac with Cardiac
Non-Cardiac with Non-Cardiac and Cardiac
74.2 42.8
18.4 26.3
4.0 3.3
47.0
25.2
6.5
Non-CardLc and AssociatedCardiac Subtotal
Primary Non-Cardiac
Non-Cardiac Only
Non-Cardiac with Non-Cardiac
22.4 29.6 31.7
Non - Cardiac Subtotal
Total Diagnostic Conditions
12,8
1.9
14.7
23.5 2.7 24.4
3.9 0,7 3.2
19.3
3.0
27.4 3.4 I 27.6 21.3
100.0 100.0 100.0 100.0 100.0
Nw Indicates weighted frequency counts, adjusted to the proportion of all cardiologists that eachcardiologist type represents.
Source: 3

BEST COPY AVAILABLE
TABLE 62
267
OFFICE DIAGNOSTIC CONDITIONS:PRIMARY CARDIAC AND NON-CARDIAC WITH ASSOCIATED SECONDARY CONDITIONS
DISTRIBUTION BY PHYSICIAN SPECIALTY AND PRACTICE
DiagnosticConditions
Non-Institutional InstitutionalPdITirrtecondary
AllPrimary Secondary
1=11=1MMINOIMINIEMM=111.11
Nw 4027 6799 321 200 11337
Primary Cardiac
Cardiac Only 26.7 12.0 35.7 19.1 18.0
Cardiac with Cardiac 12.3 5.2 9.6 4.2 7.9
Cardiac with Non-Cardiac 12.2 10.5 20.4 10.6 11.3
Cardiac with Cardiac and Non-Cardiac 7.5 6.1 9.1 4.3 6.7
Cardiac Subtotal 59.7 33.8 75.5 30.2 43.8
Primary Non-Cardiac with Cardiac
Non-Cardiac with Cardiac 20.0 29.0 17.0 30.2 25.5
Non-Cardiac with Non-Cardiac and Cr:Iliac 4.3 7.0 3.1 2.2 5.8
Non-Cardiac and AssoclatadCardiac Subtotal 24.3 36.0 20.1 32.4 31.3
Primary Non-Cardiac
Non-Cardiac Only 15.1 26.1 3.1 25.7 21.7
Non-Cardiac with Non-Cardiac 1.9 4,1 1.1 3,7 S 3.2
Non-Cardiac Subtotal 17.0 30.2 4.4 29.4 24.9
TOW Diagnostic Condittons 100.0 100.0 100.0 100.0 100.0
Nw indicates weighted frequency counts, adjusted to the proportion of all cardiologists that eachcardiologis* type represents.
Source: 3
Aar

268
BEST COPY AVAILABLE
TABLE 63
HOSPITAL DIAGNOSTIC CONDITIONS;PRIMARY CARDIAC AND NON-CARDIAC WITH ASSOCIATED SECONDARY CONDITIONS
DISTRIBUTION BY PHYSICIAN SPECIALTY AND PRACTICE
DiagnosticConditions AllPrimary Secondary Primary Secondary
Nw 1977 1280 647 253 4857
Primary Cardiac
Cardiac Only 24.9 11.6 32.0 21.2 20.2
Cardiac with Cardiac 14.3 6.4 9.0 9.5 10.1
Cardiac with Non-Cardiac 14.3 14.5 18,6 12.3 14.8
Cardiac with Cardiac and Non-Cardiac 7.7 9.6 14.0 3.4 9.1
Cardiac Subtotal 61.2 42.1 73.6 46.4 54.2
Primary Non-Cardiac wqh Carditg
Non-Cardiac with Cardiac 23.0 27.6 19.1 23.2 24,4
Non-Cardiac with Non-Cardiac and Cardiac 5.6 12.5 4.3 4.2 8.2
Non-Cardiac and AssociatedCardiac Subtotal 28.6 40.1 23.4 27,4 32.6
Primary Non-Cardiag
Non-Cardiac Only 8,1 146 2.5 23.4 10.8
Non-Cardiac with Non-Cardiac 2,1 3.2 0.5 2.8 2.4
Non- Cardiac Subtotki 10.2 17.8 3.0 26.2 13,2
Total Diagnostic Condi tion 100.0 loo.n woo 100.0 100.0
Nw indicates weighted frequency counts, adjusted to the proportion of all cardiologists that eachcardiologist type represents*,
Source: 3

269
care is being provided in these instances. For all cardiologists, the 31.7percent are in this category. There is little difference between the two typesof Primary Cardiologists in the percentages - 25.8 compered to 22.4 percent.
The primary non-cardiac patient percentages describe a cia patients whoseproblems are predominantly non-specialty in character so far is diagnosis andtreatment is concerned. They clearly are not cardiac, although they might becomplex. Since the participants in this study have major commitments to cardi-ology, it is reasonable to assume that the majority of these patient's problemprofiles would be general in character and hence can be viewed as a measureof primary health care service provided.
Comparing Table 62 for office patients with Table 63 for hospital patients, itis clear that the significant bulk of the non-cardiac patients are seen in theoffice. This is particularly true for the Secondary Cardiologist in Non-Insti-tutional practice (30.2 percent compared to 17.8 percent). Overall, 24.9 per-cent of the office patients seen by cardiologists are primarily non-cardiac and13.2 percent of their hospital patients are in this category.
Time Related to Patient Problem Profile
Tables 64, 65 and 66 for patients in the office, hospital and as a combineddistribution, and with the patients grouped by primary and associated clinicalconditions, show a profile of almost no diffe.ence in the amount of time aparticular type of .specialist gives to patients. For the two Non-Institutionaltypes, the profiles stronclly suggest that time allocated is associated with avisit schedule. The Primary Cardiologist in Non-Institutional practice givesabout the same amount of time to all of his patient types. The total time spentwith patients for the Secondary Cardiologists in Institutional practice is moreakin to that given by the Primary Cardiologists in Non-Institutional practice.The Primary Cardielegist in Institutional practice gives significantly more timeto patients than any of the others; in fact, so much more time that on thisdimension alone it is safe to conclude that on the average his patients havemore complex problems. This specialist exceeds the average for all cardi-ologists in the primary cardiac categories by from seven to fifteen minutes -30 to 70 percent more average time per patient.
Association of a Primary Patient Problem with a Secondary Patient Problem
Tables 67, 68, 69 and 70 present the percent of occurrence for a secondarycondition in association with a primary condition. They also contain weightedfrequency counts for the particular primary con2ition to assist in evaluating theimportance of a particular percentage. The tables are read from left to right.The rows of figures pertain to a particular primary condition and its relationshipto all secondary conditions in that table. The percentages note the frequency

270
TABLE 64
CARDIOLOGISTS' OFFICE PATIENT ENCOUNTERS:AVERAGE TIME (IN MINUTES) WITH PATIENTS BY CARDIAC AND
NON-CARDIAC CONDITIONS BY SPECIALTY AND PRACTICE
Time andDiagnostic Conditions
Non-Institutional InstitutionalAll
(minutes)
Primary Secondary Primary Secondary(minutes) (minutes) (minutes) (minutes)
Primary Cardiac
25.3
27.2
26.2
25.8
17.6
18.9
19.9
20.7
33.0
30.8
33.0
30.6
24.5
20.8
28.3
27.0
22.S
23.9
23.1
23.1
Cardiac Only
Cardiac with Cardiac
Cardiac with Non-Cardiac
Cardiac with Cardiacand Non-Cardiac
Primary Non-Cardiac with
20.7
20.4
19.8
21.2
35,2
31.8
22.6
20.0
20.3
21.2
Cardiac
Non-Cardiac with Cardiac
Non-Cardiac with Non-Cardiac and Cardiac
Primary Non-Cardiac
19.8
24.7
17.4
21.7
26.0
26.0
20.5
22.4
18.1
22.3
Non-Cardiac Only
Non-Cardiac withNon-Cardiac
Source: 3

271
TABLE 65
CARDIOLOGISTS' HOSPITAL PATENT ENCOUNTERS:AVERAGE TIME (IN MINUTES) WITH PATIENTS BY CARDIAC AND
NON-CARDIAC CONDITIONS BY SPECIALTY AND PRACTICE
Time and Non-Institutional InstitutionalAll
Diagnostic Conditions Primary econdary Primary Secondary(minutes) (minutes) (minutes) (minutes) (minutes)
Primary Cardiac
17.2
18.6
18.5
17.7
15.1
15.9
14.5
17.1
28.9
24.3
28.1,
21.8
21.4
18.7
17.3
18.6
18.6
18.4
18.1
18.2
Cardiac Only
Cardiac with Cardiac,
Cardiac with Non-Cardiac)
Cardiac with Cardiacand Non-Cardiac
Primary Non-Cardiac with
15.3
16.8
15.2
14.6
23.9
21.9
21.6
21.9
16.2
15.7
Cardiac
Non-Cardiac with Cardiac
Non-Cardiac with Non-Cardiac and Cardiac
Prima ry Non -- Cardiac
16.2
16.6.
15.8
15.4
,
18.1
13.7
19.9
19.7
16.3
16.0
Non-Cardiac Only
Non-Cardiac withNon-Cardiac
Source: 3

272
TABLE 66
CARDIOLOGISTS' OFFICE AND HOSPITAL PATIENT ENCOUNTERS:AVERAGE TIME (IN MINUTES) WITH PATIENTS BY CARDIAC AND
NON-CARDIAC CONDITIONS BY SPECIALTY AND PRACTICE
Time andDiagnostic Conditions
Non-InstitutionalO econdary
InstitutionalPrimary 'Secondary AllPrimary
(minutes) (minutes) (minutes) (minutes) (minutes)
Primary Cardiac.
Cardiac Only 21.4 16.8 30.2 22.4 20.7
Cardiac with Cardiac 22.9 17.8 26.2 19.1 21.2
Cardiac with Non-Cardiac 22.3 17.6 29.6 20.4 20.7
Cardiac with Cardiacand Non-Cardiac 21.9 19.2 23.4 22.5 20.7
Primary Non-Cardiac withCardiac
Non-Cardiac with Cardiac 18.1 18.2 26.9 22.0 18.7
Non-Cardiac with Non-Cardiac and Cardiac 18.5 18.0 24.1 21.4 18.4
Primary Non - Cardiac,
18.8 17.0 21.4 20.0 17.6Non-Cardiac Only
Non-Cardiac withNon-Cardiac 20.6 19.9 19.8 21.0 20.1
Source: 3
275

BEST COPY AVAILABLE
TABLE 67
ALL CARDIOLOGISTS:PATIENTS WITH PROMO CARDIAC DIAGNOSIS AND PERCSNIAGS
DISTRIbUtION tON ASSOCIATrb SECONDARY CARDIAC DIAGNOSIS
273
ii
; 1
11
alXg8tg
*IV lot
00 00 00 00 00 00 CO o*6 04 4 66 4 4 0 6
88 88 O p 88 82 83 88M 44 O4 .4 .4 O. 0.4 4 M.4 ..N NMP1 VI WIW 00 WO T.
i *#4 Matt: 4;i1114 I:70 0 0
ft ri 0 N N* V; 44; 11 11 irv01 6
142
CI 0 IM4'0';
0a 4 4
I I I io .1 0 1 1 1 1 0 0 1 0
V% WO 0 .4 . 44 0 .4 .44 * 4 4. 4
v 0 0 CD .4 0 1 1 1 .4 .4 VD 4;1
0 es 04 .
114,6It 0) vt it It a o Of
Nn It writ 16 V .4 .4.44
.4; e. r4 44 c. 0 $ 4 4 $ 44 w, th
It P. 1 V: V: PZ,WO 46 Uft
4 CS64 0 .4 .4 44 41 i .* 1 1 rt N vn et
re . .4es
Iv, tv 40 1i 01 0 4 ft
.mt mei NI. m i. rim,
...
. .44 44 44 4, II 44 44 rt
0n NW N on ON...; c; 44 II vs 4 4; C; s 4
0 .4
n. ... nn . n Ir.4
.4 Na . 4 0 0 II .; .4 1 owl 4011: 01.4
Wm MO NW 0M 0 NM,.: 4 .: .; p: ..1 ..; 0: . ... i; p: 1 I
...... ..
oo no ow MN4 4 .44 4; 41: 4 t: .; .; .: .: . I
. .Sit 0
.4.4 MN M wi
0 n 441 0 Nt4104 1 0 1 C I C I 4 I $ 00
.:4:: Ir.! tri 0 OWaV ID
nIn 44 la 44 .4 . 1 ) 1 rt Ct 0 tat
a.2 1 ft +PO P. la CD V. WO
m0 WW 11 $» 1N 00 44N
41. 41 00 N W NW NO. . 44 :: 4 I V 0 n 1 V 44 441 N M
It Ir 1% 0 0 0 not.*
t I 1 CP 4 r; 1 I i+ 0 o4 '0 01411
0 454
22we oft
44646
IC)
NV0a 0 a
41
P. leb0 a
0 4600
11
»V0 .
0 r4
n.0 0
»VN
4NO
*se.
0.4.4.4
OW4 40 0
11
aC; )
t. V.Pi vr
11
41,1
SOSI
014
NO4V
0
0 0 0 a
22 83we 04 NM
DI 11
VI
4)1 4 4
CO nn4410 V.
e* lb +ft4 4
.41 0 0
Mn4
ti 4.4+4
OWa44 .4 40
0. .441 N Cif
0NI II
ion.
.4 t% 1 1
WO114; C;
0ft4 *
11 Ott
vr
44 I It: 4
sO 0, 00I 4
440 wv sft
ft
It+ 14
II
1.1.. 010 v4
wn oth0 4
444 *IP tit"
11
0 04
8840 04
II»
11
11
11
41
10
1)
II
tsa
I N.4
11
14
es
4 vo.4
4 1
11
1101
vo
i
11
0 0 t) Ca4
33 3204 04 M.#1# 104 0
.4 11
11 11
po
11 444114,
I. P44 4
11 CD We
00 4,m0*
.1 46 11
.4
111 :i
II If
0 44 04
1 V .4 N
11 4401»
41 1 r;11
Vs 1111 SO IP4 .
gr r$ 44 ehp4
.A4 N04 4 s
WO 0 W. 0
11 isMP
Ii
it Yov 4:1
to 0 et*
I we eat
11 14
40 0 C. 0 Ca C4 0 40 0 04 4 4 4 a
88 28 28 28 8804 04 NM WO P4 0 0 NN
WI4
10 10 11 11 14
0 PaV 0
11 0 4.4 41 14 01
net .44.4 41 11 1 .4
I. 0 V4a i
11 0 1 41 CD 0 0 10
01 .4
11 44$ 11 »II 14
IN
11 11161 11 1i
.111411 41 or11 ni
e 1.N, .
11 1» 11 .4.4 11
or 44 14. * t t4
04 0 04 04 1 # 04 0 04 0
w m N4)1» 1 1104 1
..4 4»04 4 41 4 0
m0 P. NI4
4% 1 4 4 re 1 4 1 44 4
Ft f4 SI CP CP 411, p4 4t as 04 s 4 4 4 II 4
fil IA F1 ei CD 0 WI re ONNM
lit I 4 41 14 41
n in NI
IS SOSI 141 t
011 .;) 11 11 1)
W 4, 44 1..4 w 4
1 WI 1 44 V, 00 1 11
0 41
41.41 11 414 1
11141C)
tISINsoutra
11441011163
POPIPIki Ikniki
Availortsoegthao tioig
10111P200)
onenvoirareAs4/
ateaajaBiro 14A al
66 011ija
.11140114/A 110.161013114
ancspoapn
.P.ohow
Agild°"°Trall0
"4"1"4(141
unsuinx4414
1411140.1101,11 3noopa
1611101CP11020r1V
MI14145/03
aseaajaPiPaoiss
64,WW3Amrumivinci
1.10119lepn
liWW0Ani4MV
111)110141c '*1110/410
:400r1011 11614
14.1114A05 11411.3V
:amity,' Mall
t0111Pu°3AJOIN)CCPOS oN
it 1,.. .11 i III -.5 °)). t ,2411 10 W
g :: A :4 a 4: nn ti.. :4 7, :I g i:
N 0
2 g
M in vs mrea;.! 2 nn
42 Ca
8t:W
r, r, rt to4 4111
;: g ;: 71
4, rs .4 0 th 4, 44 et o 4711#
$: te g tv; ri: :! Pt: 12 I:
O
4 Dm Pria) JOVISN
2 1' 1.: '.; 2 2 .2 2 4 g 2 A III JO00m NN Nw mwm W Npe
I. 0VD 4"NM
N N 0 r4SO V% 42% 44
t4 P4
44 CM 1, 01 th CD45 al Ut 0w4 4.0114
0 0 N 14 V 0 in to1 00 1.1 0 WO 010 4, 0 0M
.4
461.1)110S /0 *JAI OX OX OX OX OX Off; OX OX OX OX OX OX OX OX OX OX OX OX
!I
1
i e i 1 1il
1 A 1 e 4 10 a =40 4it i t 1 a e 1i 1 isLI is li 2L :A .,V
g'
4
IS
1i
4
1,44
C
i i
.I; 1:t. IStg um
ft
V
1111
lc- iA t! 1 t
**Type a Salting': ()wetly.: li-hospital.Nw Indicates weighted iniquiney counts, adjuatad to the proportion or all cardiologists that
Mach cardiologist Ws represents.try
Source: 3

PIUMAltr DIAGNOSISCARDIAC
witC0311:14Rf 1111$00111tD NOK-Cjatrise DAGNotarOrettent 01 T0111 far Each Cooditlea)
1......."
TYPE1 b4 i 7.
t*2
I1 ii:*g
z..... 0,Ir.
8z.40 i I
111
a.... 3/ 0!
t.sZ e
Al1 a as 1
aZ c8 6"
1io.z
ilr,10f o
21E g.4.L.
g
Meertleihme: 0 4$ S2.1 21.6 4.5 4.1 2.3 4.5 . - 0.4 - 2.3 - 100.0Acute,Savera H 166 60.6 11.3 2.6 2.6 3.5 2.7 2.2 2.2 0.3 1.5 5.6 0.6 - 1.6 - 100.0
Neer: Pathme: 0 372 51.7 11.4 1.4 3.1 5.4 5.2 1.0 2.6 - 0.4 11.7 1.2 1.2 0.6 1.1 100.0Chronic, Savage H 275 53.2 9.4 5.0 1.6 6.1 3.0 2.2 3.1 - 0.4 1.7 - 1.0 1.2 2.0 100.0
Acute 14yoteaS41 0 260 74.6 2.3 1.2 3.6 2.8 3.0 CS - 0.6 - 6.0 0.5 1.2 1.1 1.2 100.0Ietemodou H 461 74.8 5.3 0.7 2.0 5.6 1.6 0.1 1.7. - 0.1 5.2 0.2 0.1 1.1 0.5 100.0
Pulnummr, 0 45 67.4 10.9 1.3 5.6 7.4 3.4 1.3 - - - 2.7 100.0Emballam H 03 41.7 25.4 1.0 1.0 1.4 0.5 0.7 1.5 - 1.1 - 6.3 1.0 100.0
Pedeargal 0 10 75.3 1.4 . 9.4 - 2.3 - . 3.6 100.0Mums* H 32 73.5 - 4.6 1.5 3.$ - - 3.6 - - 4.6 - 100.0
Coronary) 0 1540 62.1 4.0 0.7 1.6 6.7 6.1 3.0 1.2 0.3 0.4 6.3 0.7 1.6 0.1 0.3 100.0Atheresclantsts
irlthoutlitterota.a
H 53* 63.7 6.2 1.3 2.1 4.8 4.7 3.2 3.0 0.2 0.5 3.6 0.3 1.0 1.4 1.0 100.0
MrierteeaSari 0 1405 6I.I 3.2 1.0 2.1 4.1 6.6 3.3 2.4 0.5 0.1 9.7 1.4 1.1 0.0 0.1 100.0It 246 52.7 3.3 1.4 2.4 7.3 2.7 3.4 6.1 0.1 2.5 16.1 0.6 - - 0.2 100.0
Rheumatic 0 267 77.6 2.0 0.4 1.6 3.2 2.? 3.0 - 1.6 4.7 - 2.1 0.4 0.5 100.0H 140 78.1 3.6 0.4 0.0 2.4 1.1 0.9 - 1.1 0.4 2.8 0.4 - - 100.0
Cardameampette, 0 62 84.1 4.0 - 2.0 2.0 2.0 - - . - - 2,5 2.5 0.9 100.0M 52 85.5 - 1.1 4.1 - 6.2 1.1 - - - - - - - 100.0
Aerhythrda 0 204 U.S 3.3 0.7 1.6 4.1 1.5 4.7 0.7 0.7. 1.3 9.4 0.6 - 0.6 1.2 100.0H 121 74.5 5.4 - 2.5 4.1 4.0 4.4 1.0 . - - 2.3 - 0.2 0.3 - 100.0
Irdeedsel 0 1 100.0 - - - - - . - .. - - 100.0H 4' l'7.1. 13.4 - - - . - . - 14.3 - - - - 100.0
Peripheral 0 157 55.1 6.3 - 1.6 4.3 9.8 2.0 1.0 1.6 0.0 5./ 2.5 3.3 0.0 1.0 100.0VommderOttreasa M 69 55.7 4.1 - 0.7 7.3 11.1 2.0 - - 12.3 1.7 - 1.0 1.7 100.0
Conetwellteragar 0 156 67.0 3.2 1.0 4.0 2.9 5.6 2.2 2.1 - 8.6 0.0 - 0.0 - 100.0tetras. H 110 46.1 7.0 2.6 17.2 4.2 7.0 0.5 5.3 1.1 - 3.7 - 1.4 2.1 - 100.0
Psychommearit 0 01 56.4 1.4 . 2.4 3.4 10.6 .2 1.7 - - 1.3 - 7.4 - - 100.0Mamlfac) H 34 54.4 8.1. 44 - - 13.4 12.6 - - 3.4 - 3.6 - - 100.0
Post Cardisc 0 62 00.4 - 2.4 3.9 0.1 0.6 1.1 - 2.4 - 2.4 4.0 100.0Urger/ H 66 79.2 4.2 0.6 3.6 4.6 0.0 - - 6.1 - - - - 100.0
Pacemaker 0 34 91.8 0.2 . - - - - . 100.0Zamiluadom it 34 81.1 1.7 3.7 3.4 - 7.2 - - 4.5 . - - 100.0
Cobgeratid 0 71 85.2 1.1 1.7 - 2.1 1.7 . 2.1 - . - 2.1 - 100.0H 41 02.6 3.1 . 2.5 2,4 0.8 - - 6.1 2.5 200.0
Other 0 102 73.7 1.5 1.2 1.2 4.6 2.4 3.0 0.4 1.5 - 1.2 1.1 4.1 3.6 - :00.0H 20 74.8 4.1 - 2.0 6.7 1.0 4.6 - 4.1 - 0.1 2.7 - 700.0

0'001
0'001
0.001
0'00I
0'00I
0'001
0'001
0'001
0'001
0'001
0"00I
0'001
0'001
WOO
0'001
0'001
0'001
O'DOI
0'001
0'001
0'001
0'001
0'001
0'001
0'001
0'001
0'001
0°001
--
S"C
6'11
C'Z-
t'2-
2'1
1"0
44.1--
l'O
5'0-
I'S
2'1
0'1
C*0
1'1
S'0
6"0
2'0-
5'1
1'1
6'0
---
S'0-
ED--
2'0
.2'0
Et-
S*0--
5"11--
t'0
ED
0'0
6'0-
9'0-
CO
---
5'0-------------,
-
9'0---
C'I--
1"2--
--
L*0-
6^0
2'0---
2'0-
9'0----
$'10
1'0
L'O
Z*0
CO
£'0----
2'0
-
("I-
2'0
1"2
9'0---
1'1-
L*0-
9'0
1'2-
2'2
EP
I'D
2'1
'Z1'1
COED---
5"0
-
11119
6"I--
ED-
L'O
S*2
2'1--
1'S-
1'1
9'0-
VI-
C'Z
9'0
1'1
4'2
C'S-
lt'l
S'0
re
--
-
g'i
-
S'O
-
--
2'0
-
--
--
et
2'0
6'2
-
-,,-
6'1
-
2'1
--
-
1-2
-
0'1
-
'-
-
0'1
4'0
1'0
2'2
-
6'0
-
5'0
1'0
9'0
2'0
6'2
-
led
-
'0
-
6*1
-
2'1
2'0
L'O
S'12
Et
t'T
Et
VOClCO
I'S
L'C
2'4
lel
2'
2'1
L'S
9'0
1'2
11'1
S'1
CI
T'S
6'1
"9
9.1
6'9
S't
43
5'1
-1'1
9*4
Et
-9'1
t'l
S't
l'
S'0
-t'S
-6'0
EL
-e0
I'
-6'0
6'9
-10i
6'S'
4'1
-CLI
S'I -
S'0
9'12'
-L't
1'91
1'0
Et
5'2I
-S'S
-9'4
C*1
S*0
2'02
-1'1
1'21
6'2
$'0
1*AT
-ED
ET
O'T
2'2
9'tI
S'0
Z't
4'01
I*0
t'T
2'4
2"0
6'0
I'll
11
5'0
CST
0 Z'I
0'11
-9'2
t'02
'art-
I'It
6'0
0'2
0'6
2'0
2'1
1'6
L'01
S'2
9'2
EC
S'S
C'e
l'
°12
SIT
I*EI
O'I/
2'2
1'11
El
4"6I
f't1
2*.4
S'C
S'01
0'01
$'01
2'6
S'SI
l'IT
**41
1"0
EST
9'11
VI-
9"0
S0----
2'0--
C't
1'0
.S*0--
1'0
1'1
2'0
I'D-
9'0
9'0
0'2-
9'0
CO
---
S0-
r0--
S'I-
4'0.',
-
9'2
9'0
2'/
11"0
S'I
Z*0
2'0
t'D
El
I'D
9'1-
0'S
S'I
1'1
--
6'0-
6'0
'0-
C'D
9'1
I'D-
VI--
CZ-
21
1'0
S'1
I'D
4'1
S*0
t*Z
6'0
C'I
ZTT'I
CO
t'S
-
2'1
-
ET Z
9'0
ED
--
2'1
-
6'0
-
--
VI
i'D
2'0
0'0
0'1
-
4'0-
--
I'C
9'4
O'T
--
1'0
WI
0'2
4'0
1'0
6'1
9'T
S'1
4'0
9*0
9.1
6'0
1'0
t'9
6'1
0'1
Z*1
5'6
0'2
6'Z
CO
l'IS
O'OL
0"19
CU
O'L
Lrig
2'20
O'SO
9'IS
9'2S
0'94
ea
9'16
1'01
4'19
1"99
C*69
0'4
9*S9
IrS5
9'69
0'6C
I'49
2'61
5'01.
6.11
9'99
IS
L6
Oa
001
L9214
L9
LIZ
091
56S
99Ill
62112
0I1:
692
AZI
SZS
ZZZ
142
451
SSL
SOZ
442
16
ID!
Ott
169
HDH0H0H0H0H0H0H0H0H0H0H0li0H0
nirtilMnA/
pueappaR
Jam)
imri pm
; 2.044*4 raps*
11131
imp*opul
J104101DsuA0
if,agA fo
190
relhotatingusa
4.11PuPal-afrom0
01.11erpoto4
tinsprooptozart
1mh:;,,47:7,
-nf....1z1
ti
nralemomeht
MPS
A.rompls all
Sr
°ow"`
5)
41.3 4,,,
Li'
.4,9,0
.132
..10- 0.
r. a3a
FPsa0 C r4:2
Pi0,-7.0 j ,<0
O
=.
2a.
/". i.EF
4 c
.20
..cn*02
S429gg d
0 2-,..
e q0 aa ea=
170 .
sr*0 I0
la'gjz g4
Ei
i al` X
P tj.23=
2.f.si
2:p ov....4 aofitw
.33
5",ig -,..7i Ea .3
PEI rn5. 08Q
F.'0 a
445-
: -.,
'-F.ai
3474.
N0ralPue0 Iran ifq Inn 30 21103.334)
SISCHIDYICI 011011110 C31100011SY 741Y0N002S
Oviakil*-11011
snonvactAIIIMIKII

0 a a 0
PRIMARY DIAGNOSIS
NON-CARDIAC
SEC
ON
DA
RY
ASS
OC
IAT
ED
NO
N -
CA
RD
IAC
DIA
GN
OSI
S(Percent of Total for Each Condition)
t
TOE
Z,
zt`
es
-c
g0i V
t 2V
10
a V i -i s
2 t0. ° i
*1..
N.
U g
S T
3
V
E 0 xg.2
1:1.
- g
1, 0 0 r.
cti
0 aIS
VI
IS ti
E u
0 or
i.0,
0to 7 i .
471 c
e og
fh.g
i2 z
-S
IUg
1-6
z,,.
-2.
Ie
E6' i..
,
0a
c.)
cciz
1z
8 c
iz
88
6*6
ekt
f0
a.) 1
.R
Respiratory
0883
79.1
-1.
20.8
4.0
4.5
2.7
1.1
0.3
0.5
3.4
I.0
1.0
0.2
0.2
100.0
H348
68.0
-3.7
4.9
8.3
4.0
1.2
2.8
0.2
-1.5
1.4
0.4
3.6
-100.0
Renal.
0101
71.5
-3.9
6.4
2.7
1.5
-1.2
1.5
5.5
1.5
1.2
1.9
1.2
100.0
H93
60.7
1.6
-5.5
5.0
6.6
-9.2
-5.2
1.6
1.6
3.0
-100.0
Neurtaogical
0277
66.2
1.1
--
6.2
12.3
3.8
1.7
2.8
0.6
2.8
0.6
1.1
0.6
0.2
100.0
H205
77`.5
4.1
1.8
-4.3
3.5
1.5
1.9
0.5
-2.4
0.9
-0,4
1.2
100.0
Gas tro-
0758
78.6
0.8
0.2
0.3
-5.0
5.3
2.7
0.5
0.8
2.7
1.0
1.6
0.3
0.2
100.0
Intestinal
H457
81.7
1.8
1.3
1.0
-4.7
2.8
1.0
-0.4
3.7
0.3
0.3
0.8
0.2
100.0
hiusculoskeletal
0871
84.0
0.8
0.2
0.4
1.9
-4.3
0.5
0.8
0.4
3.6
0.5
1.3
0.3
1.0
100.0
H222
75.8
2.8
1.4
2.1
1.4
-2.5
3.4
0.7
-5.2
0.3
0.7
3.0
0.7
100.0
Psychiatric
0575
80.8
1.1
0.2
0.5
1.1
2.1
-0.9
1.1
2.0
5.8
0.5
3.3
0.3
0.3
100.0
H127
76.7
2.9
.1.2
3.6
4.3
-1.0
1.0
0.3
6.6
-2.4
-100.0
Genito-Urinary
0269
87.8
-0.6
-1.1
2.6
0.6
-0.6
1.3
2.7
-0.6
1.1
1.0
100.0
H118
78.9
-1.0
3.6
1.6
1.0
2.3
-1.0
9.0
-0.3
1.3
-100.0
Dermatological
0247
92.3
--
-0.1
0.6
1.2
-0.6
2.9
0.5
1.2
0.6
-100.0
H29
73.3
--
-5.3
5.3
5.3
4.2
-1.3
-5.3
-100.0
Obstetrics/
(..i
221
83.0
0.7
-0.7
0.7
0.7
2.1
--
-5.4
0.7
4.8
0.6
0.6
100.0
Gyn
ecol
ogy
H56
75.8
5.5
-2.7
--
-5.0
--
11.0
...
100.0
Lndocdne
0599
86.2
1.1
0.9
0.6
1.6
1.4
1.5
1.1
1.4
0.7
-0.
81.
60.
60.
4100.0
H180
74.7
2.9
1.7
2.6
4.7
3.1
1.1
1.4
1.2
0.8
-2,4
0.8
2.3
0.3
100.0
EENT
0217
92.3
0.7
--
0.7
-0.7
--
3.5
-2.1
--
100.0
H67
68.4
3.2
--
4.1
4.6
--
8.7
-4.1
6.9
100.0
Checkup,
0772
90.8
1.1
-0.7
0.8
1.5
1.2
0.4
0.6
1.0
1.5
0.2
-0.2
-100.0
Phy3lcal Exam
H67
74.8
4.6
-2.3
-4.6
2.3
-9.1
2.3
--
100.0
Other
0308
92.2
-0.5
1.5
-1.1
3.6
0.1
1.0
--
100.0
H170
87.5
0.7
-1.2
0.2
2.4
0.9
0.9
-0.7
2.0
0.9
-2.6
100.0
HemIcand
097
98.4
1.6
--
--
--
--
--
--
100.0
Lymphatic
H51
97.6
--
--
--
--
--
-2.4
-100.0

277
of occurrence of a particular primary and secondary relationship, "All cardi-ologists" is the level for data presentation. Other permutation are available,such as Primary Non-Institutional, Primary Institutional, etc.
Patient Treatments and Dispositions
Two levels of data are available regarding what the physician does with hispatients once the clinical profile has been established. The first at a summarylevel and was presented immediately adjacent to the columns where the physicianrecorded the diagnostic characteristics and hence could be completed with verylittle effort. Table 71 presents these data for cardiac, Table 72 for non-cardiacand Table 73 for all disposition actions.
From the statistics for cardiac patients, Table 71, the following are noted:
o Drugs are prescribed for 76.0 percent of office patients aril66.4 percent of hospital patients. Differences are pronouncedbetween institutional practices and non-institutional practices:
- both types of Institutional practice usedrugs with approximately 55 percent oftheir patients;
in tIle Nc-q-Institutional settings,
o primary specialists use drugsabout 7.0 percent of the time;
o secondary specialists use drugsabout 78 percent of the time
o Routine laboratory tests are ordered by all cardiologists forapproximately 33 percent of office patients and 40 percentof hospital patients. Secondary Cardiologists in Non-Institutional practice have comparable rates in the officebut much higher in the hospital - 49 percent.
o ECGs are ordered by all cardiologists for about 26 percentof office patients and 28 percent of hospital patients.
o Other non-invasive studies Fire ordered by all cardiologistsin about 3 percent of the office situations and approximately6 percent of the hospital cases.
o Catheterizations were ordered to a limited extent for officepatients (less than 2 percent) and for approximately 5 percentof the hospital patients.
ZINO

TA
BL
E 7
1
CA
RD
IOL
OG
IST
S' P
AT
IEN
TS
WIT
H P
RIM
AR
Y C
AR
DIA
C C
ON
DIT
ION
S:A
VE
RA
GE
DIS
POSI
TIO
N A
CT
ION
S B
Y S
PEC
IAL
TY
AN
D P
RA
CT
ICE
Patie
ntD
ispo
sitio
nT
ype
ofSe
tting
**N
on-I
nstit
utio
nal
Inst
itutio
nal
All
Car
diol
ogis
tsPr
imar
ySe
cond
ary
Prim
ary
Seco
ndar
yA
vera
ge U
seA
vera
ge U
seA
vera
ge U
seA
vera
ge U
seA
vera
ge U
se
Pres
crib
ed0
73.6
80.6
53.9
42.0
76.0
Dru
gsH
64.6
76.4
57.5
52.0
66.4
Ord
ered
Rou
tine
030
.834
.433
.526
.132
.6L
ab T
ests
H35
.249
.436
.731
.839
.7
Ord
ered
027
.323
.432
:328
.025
.7E
CG
H25
.828
.531
.925
.827
.7
Ord
ered
Oth
er0
3.7
1.5
7.8
1.4
2.8
Non
-Inv
asiv
e St
udie
sH
4.7
5.8
'9.2
9.9
6.1
Ord
ered
Cat
hete
riza
tion
01.
10.
412
.41.
41.
3T
est
H2.
34.
212
.75.
74.
9
Eva
luat
ion
for
01.
20.
23.
30.
50.
8C
ardi
ovas
cula
r Su
rger
yH
1.3
2.7
9.3
4.2
3.3
Eva
luat
ion
for
00.
60.
21.
70.
90.
5O
ther
Sur
gery
li0.
61.
12,
32.
11.
1
Nw
*0
2364
2294
244
7749
761\
11.v
*H
1211
832
476
118
2636
*Inc
lude
s al
l pat
ient
s, w
heth
er o
r no
t dia
gnos
is r
epor
ted.
(App
roxi
mat
ely
five
(5)
per
cen
t hav
eno
dia
gnos
is.)
** "
Typ
e of
Se
tting
"0=
offi
ce: H
=ho
spita
l.N
w in
dica
tes
wei
ghte
d fr
eque
ncy
coun
ts, a
djus
ted
to th
e pr
opor
tion
of a
ll ca
rdio
logi
sts
that
each
car
diol
ogis
t typ
e re
pres
ents
. Sou
rce:
3

TA
BL
E 7
2
CA
RD
IOL
OG
IST
S' P
AT
IEN
TS
WIT
H P
RIM
AR
Y N
ON
-CA
RD
IAC
CO
ND
ITIO
NS:
AV
ER
AG
E D
ISPO
SIT
ION
AC
TIO
NS
BY
SPE
CIA
LT
YA
ND
PR
AC
TIC
E
Patie
ntD
ispo
sitio
nT
ype
ofSe
tting
**N
on-I
nstit
utio
nal .
Am
.
Inst
itutio
nal
All
Prim
ary
Seco
ndar
ym
ares
econ
ary
Car
diol
ogis
tsA
vera
ge U
seA
vera
ge U
seA
vera
ge U
seA
vera
ge U
seA
vera
ge U
se
Pres
crib
edD
rags
.O
rder
ed R
outin
eL
ab T
ests
Ord
ered
EC
G
Ord
ered
Oth
erN
on-I
nvas
ive
Stud
ies
Ord
ered
Cat
hete
riza
tion
1
Tes
t
Eva
luat
ion
for
Car
diov
ascu
lar
Surg
ery
Eva
luat
ion
for
Oth
er S
urge
ry
0 H.
0 H 0 H 0 H 0 H 0 H 0 H
65.9
61.4
28.9
34.6
13.5
17.7
.1.
23.
9
- 0.7
0.1
0.7
1.0
3.2
65.4
61.4
35.8
35.4
10.6
12.9 0.9
3.6
0.1
0.3
0.1
0.1
0.8
5.7
49.6
45.3
37.0
34.4
23.0
18.8 3.0
5.9
3.7
3.1
2.2
2.5
3.0
6.9
63.5
55.1
33.2
38.8 9.9
14.2 3.9
2.9
0.3
- - 0.3
0.6
3.4
I
65.3
59.6
33.9
35.2
11.5
15.2 1.0
3.8
0.1
0.6
0.2
0.5
0.9
4.7
Nw
*N
w*
0 H16
6444
9576
711
4778
122
171
136
6361
2220
*Inc
lude
s al
l pat
ient
s, w
heth
er o
r no
t dia
gnos
is r
epor
ted.
(App
roxi
mat
ely
five
(5)
per
cen
t hav
eno
dia
gnos
is.)
** "
Typ
e of
Set
ting"
: 0=
offi
ce; H
-4th
ospi
tal.
Nw
indi
cate
s w
eigh
ted
freq
uenc
y co
unts
, adj
uste
d to
the
prop
ortio
nof
all
card
iolo
gist
s th
atea
ch c
ardi
olog
ist t
ype
repr
esen
ts,.
Sour
ce: 3

TA
BL
E 7
3
DIS
POSI
TIO
NS
APP
LIE
D T
O P
AT
IEN
TS
BY
SPE
CIA
LT
Y A
ND
PR
AC
TIC
E B
Y T
YPE
OF
SET
TIN
G
Patie
ntD
ispo
sitio
n...
......
......
.-
Typ
e of
Setti
ng**
Non
-Ins
titut
iona
lIn
stitu
tiona
lA
llC
ardi
olog
ists
Prim
ary
Seco
ndar
yPr
imar
ySe
cond
ary
Pres
crib
ed0
69.5
70.2
52.8
66.8
69.4
Dru
gsH
63.2
67.0
$3.7
53.6
63.0
Ord
ered
Rou
tine
029
.735
.034
.330
.533
.0L
ab T
ests
H34
.940
.925
.935
.5-
37.5
Ord
ered
021
.515
.129
.916
.917
.8E
GG
H22
.619
.328
.119
.621
.8
Ord
ered
Oth
er0
2.7
1.1
6.6
2.9
1.8
Non
-n-v
asiv
e St
udie
sH
4.4
4.4
8.2
6.1
5.0
Ord
ered
Cat
hete
riza
tion
o0.
70.
210
.20.
70.
7T
est
H1.
71.
910
.02.
72.
9
Eva
luat
ion
for
00.
70.
13.
00.
20.
4C
ardi
ovas
cula
r Su
rger
yH
1.0
1.2
7.4
2.1
2.0
Eva
luat
ion
for
00.
80.
62.
00.
70.
7O
thE
;r S
urge
ryH
1.6
3.7
3.6
2.8
2.8
Oth
er0
8.2
7.2
9.5
9.4
7.7
(Spe
cify
)H
11.0
10.9
10.6
16.2
11.2
Ref
erra
l to
MD
01.
01.
10.
72.
21.
1or
Hos
pita
lH
1.3
0.5
0.4
0.8
0.8
NW
*0
4256
7201
324
202
1198
2N
w*
H21
1620
2966
926
550
78
*Inc
lude
s al
l pat
ient
s, w
heth
er o
r no
t dia
gnos
is r
epor
ted.
(A
ppro
xim
atel
yno
dia
gnos
is.)
***T
ype
of S
e' u
ng*:
O=
offi
ce: H
ithos
pita
l.N
w in
dica
tes
wei
ghte
d fr
eque
ncy
coun
ts, a
djus
ted
to th
e pr
opor
tion
of a
llea
ch c
ardi
olog
ist t
ype
repr
esen
ts.
Sour
ce:
3
five
(5)
per
cen
t hav
e
card
iolo
gist
s th
at

281
Surgicel evaluations had relatively low occurrence rates.
o The Primary Cardiologist in Institutional practice exceededthe averages noted for the hospital-based procedures.Specifically, for his hospital patients he had:
Other non-invasive studies 9.2 percent
Catheterization test 12.7 percent
- Cardiovascular surgicalevaluation 9,3 percent
- Other surgical evaluation 2.3 percent
Laboratory Testing procedures Performed
A specific section within the diary was provided for use by those ordering andperforming diagnostic testing. As actually used, this section captures infor-mation related exclusively to patients who had tests performed and, with minorexceptions, represents the test utilization profiles for cardiologists who actuallydo these tests. It specifically excludes any patient who did not require one ormore of the tests and who d.d not have the test(s) performed during the diaryrecording period.
Table 74 summarizes the test utilization profiles for each of the types of cardi-ologists. The reader will note a difference in the percentages for tests of com-parable character as reported in the patient clinical care summary (Tables 71-73) and as noted in this table. For example, in the patient clinical summarythe ECG percentages are less than 30 percent and in this laboratory testingsummary they account for 77 percent. For cardiac catheterizations in the patientclinical summary about 2 percent of the office patients and 5 percent of thehospital patients had such tests prescribed compared to an overall utilizationwithin the laboratory summary of about 3 percent. The differences in these twodata sources are explained by differences In the data bases from which they werederived. For Tables 71-72, the data apply to all patients and therefore are per-centages applicable to thet portion of a cardiologist's patienth which needed theprocedure(s). For Table 74 r on the other hand, only those tests which actuallywere performed en patients -mere reported.
Cardiologist's Research Activities
Table 75 summarizes the topical-consent areas for cardiologist's research as re-ported in the log-diary research section. Table 75 summarizes the proportion ofthe reported research which was recorded by each type of cardiologist as well asthe subjects used, the location and involvement of drugs and/or devices in thatresearch. 284

282
TABLE 74
CARDIOLOGISTS' UTILIZATION OF CARDIACDIAGNOSTIC TESTS AND PROCEDURES
PERCENT or USE BY SPECIALTY AND PRACTICE
11a. erteas.witiarmirM=iniliMainm,
Type of Test Non-Institutional,Primary Secondary Primary
InstitutionalSecondary
Electrocardiogram 78.4
Vectorcardiogram 1 . 1
Phonocardiogram 2.2
Non-Invasive Techniques 1.8
Exercise Testing 3.8
Cardiac Fluoroscopy 3.0
Chest X-ray 18.9
R or L Heart Catheterization 0.5
R or L Heart Catheterizationwith Angiogram 1.4
Flotation Catheterization
Selective CoronaryArteriogram 1.2
Pulmonary Anglogram 0.1
Non-Coronary Arteriogram 0.3
HIS Bundle Recording 0.1
Pacemaker Insertion 0.6
Pacemaker Evaluation 0.7
Other 2.8
Routine Lab Tests 12.2
Source: 3
75.5
0.9
0.4
0.2
4.0
2.4
28.3
0.7
0.4
0.4
0.1
3.6
20.1
All
77.2 77.4 77.1
8.8 0.2 2.0
5.5 0.5 1.8
5.9 0.4 1.6
5.2 1.6 3.9
5.4 0.4 2.8
15.5 17.6 22.2
3.3 0.3 0.9
9.3 2.0 1.9
0.5 0.1 -
6.2 0.5 1.4
1.1 0.5 0.1
0.7 0.8 0.2
1.2 - 0.1
1 . 3 0 . 2 0.4
1.5 0.4 0.5
2.3 10.1 3.7
3.2 7.4 14.1

283
TABLE 75
CARDIOLOGISTS' RESEARCHTOPICAL AREAS PERCENTAGE OP USE BY SPECIALTY AND PRACTICE
ResearchTopics
Non-Institutional InstitutionalAll
Primary Secdndary Primary Secondary
.........,
Proportion of Research 37 11 189 41 278
% 13.3 3.9 68,1 14.8 100.0
Research Topics:Physiology-Cardiology 10.0 - 21.5 20.7 19.0
General Research Activity,Non-Specific(Administrative, Discuss) 3.3 14.3* 18.4 12.6 15.4
Chronic Ischemic HeartDisease 6.7 28.6* 16.0 12.6 14.7
Other Research(Non-Cardiology) - - 12.9 15.3 11.0
Acute MyocardialInfarction 3.3 28.6* 6,7 22.5 9.5
Other GeneralCardiology Research 30.0 28.6* 4.3 9.0 9.3
Testing and DiagnosticTechniques 3,3 - 6.4 4.5 S.5
Symptomatic (Arrhythmia) 3,3 - 4.9 - 3.8
Peripheral VascularDisease 20.0 - - 2.7
Cardiac Surgery - - 3.4 - 2.3
Not Specified - 3,1 - 2,1
*The frequencies are too small to use thel;e data with the confidence establishedfor the total study.
Nw indicates weighted frequency counts, adjus.tod to the proportion of allcardiologists that each cardiologist type represents.Source: 3
2S6

284
TABLE 76
CARDIOLOGISTS) RESEARCH UTILIZATION OF SUI3TECTS,FACILITIES, DRUGS AND EQUIPMENT:
PERCENTAGE OF USE BY SPECIALTY AND PRACTICE
Research DescriptorsNon - Institutional
............Institutional
Primary Secondary Primary Secondary All
Proportion of Research Nw 37 11 189 41 278
13.3 3.s 68.1 14.8 100.0
Research Sub ects:
Human 96.7 100.0 56.7 74.8 66.4
Animal 1.8 - 32.2 20.7 25.4
Other* - - 8.3 2.7 6.0
Research Location:
Laboratory 23.3 57.1 49.4 36.9 44.4
Bedside 16.7 57.1 13.8 18.0 16.5
Emergency - CCU /ICU 3.3 28.6 1.2 10.8 4.0
Office 70.0 42.9 41.1 38.7 44.7
Research Utilization:
Drugs 33.3 85.7 28.5 39.6 33.0
Prosthetic Devices 3.3 - 4.3 0.9 3.5
Equipment 33.3 57.1 51.2 44.1 48.0
Nw indicates weighted frequency counts, actusted to the proportion of allcardiologists that each cardiologist type represents.
Source: 3 287

285
Cardist's Teaching Activities
Table 77 presents data related to teaching topics as prey anted by each of thetypes of cardiologists in the log-diary section related to teaching activities.Table 78 presents percentages of use of different facilities and locations inteaching.
CARDIOLOGIST'S TRAINING STUDY
This study was the last of three addressed to cardiologists. Its rationale andthe associated methodological issues are discussed in Chapter Two, pages39 through 57. The discussion in Chapter Six highlights findings as these re-late to indicated deficiencies in training. Data selected for presentation sup-plement the discussion in Chapter Five as well as the manpower projectionsdiscussion in Chapter Seven.
It will be remembered that the eic.7-1t study strata were selected on a stratifiedrandom basis with different sampling fractions for each strata. For thesereasons, it is inappropriate to generate statistics other than those presentedin the tables since to do so would give one or more groups a distortedweighting in such calculations.
Years of Formal
Tables 79, 80, and 81 provide statistics regarding the average amount oftraining received. Table 79 is a ta?-q2lation of the cardiologist's estimatesof total time in training; Table 80 is derived from detailed enumeration oftypes of training e.-,d documents a slight tendency to overestimating totaltraining years (differences between the value in the two tables). Table 81is important in that it is based on only those who actually had formal cardio-vascular disease training. Of significance to training program planners isthe fact that over 75 percent of all who are under 40 years old had about oneand one-half years of formal cardiovascular disease training.
Traininginsufficient or Inadequate
Cardiologists were asked to indicate where training needed to be augmentedfor someone who would enter a practice similar to their own. Emphasis wasgiven to their practice as the reference point, both for assessment of thetraining's adequacy and for assessment of its importance to others. Giventhis perspective for the assessment, it is reasonable to expect differences whichare attributable to the type of practice involved, the training received, and theage of the cardiologist responding. DRME defined training in an area as beinginappropriate if (I) the respondent fcr.nd his training "too limited" for his practice

286TABLE 77
CARDIOLOGISTS' TEACHING TOPICSTYPES or TEACHING PERCENTAGES. BY SPECIALTY AND PRACTICE
TeachingTopics
Non-lwittitional it*. t ihit tormAllPrimary Secondary Primary Secondary
Nw 228 181 308 88 804
X 28,3 22.5 38.3 11.0 100.0
Clinical AnnlicationsRounds and Case Reviews 51,5 41.1 43.9 46,7 45,7
Testing and Dx Techniques 20,5 11.0 30.9 17.7 22.0
Pacemaker, Artificial Valve 1.6 1.7 0 - 1,1
Subtotal 73.6 53.8 15.5 64,4 68.8
Formal lecturesNon- Cardiovascular Teaching 1.6 11.4 2.8 10,6 5,3
Non-Specific CardiacTeaching 1.6 2 5 3.6 10,1 3.5
General Medical Cardiology 3.8 5.1 2.1 3,4 3.4
CV Physiology 2.2 0.8 1 4.0 2.5 2.6
Administrative Meetings 3,0 2.6 1.7 2.3
Cardiac Surgery 0.5 - 0,6 0.8 0.5
Subtotal 13,5 19.8 15,7 29,1 17.6I
Specific Disease ConditionsAcute Myocardial infarction 9.2 18,1 1,5 3.9 7,6
Symptomatic (Arrhythmia) 1.6 3.4 1.9 1.3 2,1
Hypertensive Disease 1.1 - 1.3 - 0,8
Congenital Heart Disease 0.5 1,7 0,6 - 0.7
Chronic Rheumatic HeartDisease - 0.8 0.9 - 0.6
Chronic Ischemic HeartDisease 0.5 0,8 0.8 - 0.6
Pulmonary Heart Disease 0.8 0.6 1,3 0.5
Cardiontycpathy - - 0.8 0,3
Peripheral Vascular Disease - 0,8 y - 0.2
Angina Pectoris - - 0,2 - 0.1
Arteriosclerosis ._ 0,2 - 0,1
Subtotal 12.9 26.4 8.8 6,5 13.6
TOTAL 100.0 100.0 100.0 100.0 100.0
Percentages based on data weighted to adjust the respective specialty and practice types to the proportionthey represent within the total cardiologist population,
Nw indicates weighted frequency counts, adjusted to the ploportion of all cardiologists that each cardiologisttype represents.
Source: 3
289

287
TABLE 78
CARDIOLOGISTS' USE OP TEACHING SETTINGS:TEACHING SETTING PERCENTAGE* OF USE BY SPECIALTY AND PRACTICE
TeachingSetting
................-....Non -- Institutional Institutional
Primary Secondary Primary Secondary All
RoomsClassroom 10.8 13.6 6.2 4,6 9.0
Lecture Hall 7.6 5.1 5.3 8,0 6.2
Conference R,.)m 10.3 23.7 23.4 22.3 19.6
Office 4.3 4.2 13.6 18.9 9.4
Room Total 33.0 46.6 48.5 53.8 44.2
Clinical-PatientBedside 50.2 63.6 44.6 33.6 49.3
Emergency orIntensive Care 5.9 3.4 1.9 8.8 4.1
Laboratory 15.1 8.5 17.5 10.9 14.1
Clinical-PatientTotal 71.2 75.5 64.0 53.3 67.5
Percentage OverlapBetween Types ofSetting** 4.2 22.1 12.5 7.1 11.7
*Percentages based on data weighted to adjust the respective specialty andpractice types to the proportion they represent within the total cardiologistpopula tion
**The percentage overlap could occur between the "Clinical-Patient" categoriesor between the "Room"iand one or more of the "Clinical-Patient" categories.
Source: 3

288
TABLE 79
ALL ACTIVE CARDIOLOGISTS INDICATINGMEAN NUMBER OF YEARS OF POST-DOCTORAL
CLINICAL TRAINING BEFORE ENTERING CONTINUOUSPRACTICE BY SPECIALTY AND PRACTICE AND AGE GROW 'S
Specialty/Practice Typeand Age Groups
Number MeanYears
Under 40 years
Primary Non-Institutional 282 4.7
Primary Institutional 288 5.0
Secondary Non-Institutional 243 4.4
Secondary Institutional 100 4.6
Over 40 Years
Primary Non - Institutional. 178 4.6
Primary Institutional 142 5.5
Secondary Non-Institutional 173 3.9
Secondary Institutional 103 4.7
All Cardiologists 1509 4.5M,Fellows 234 5.1
anurce: 5
Z91

289
TABLE 80
CARDIOLOGISTS' AGE GROUP, SPECIALTY AND PRACTICE TYPEBY MEAN NUMBER OF YEARS OF INTERNSHIP, RESIDENCY
AND FELLOWSHIP TRAINING
Age Group, Specialtyand Type of Practice
Internship Residency CDFellowship
TotalClinicalTraining
X Years 5Z Years X Years R. Years
UNDER 40 YEARS
Primary:
Non-Institutional 1.0 1.8 1.6 4.4
Institutional 1.0 1.8 2.0 4.8
Secondary:
Non-Institutional 1.1 1.9 1.0 4.0
Institutonal 1.0 1.9 1.3 4.2
40 AND OVER
Primary:
Non-Institutional 1.2 2.0 0.8 4.0
Institutional 1.1 2.1 1.7 4.9
Secondary:
Non-Institutional 1.1 1.9 0.4 3.4
Institutional 1.2 2.1 0.7 4.0
ALL CARDIOLOGISTS 1.1 2.0 1.3 4.4
FELLOWS 1.0 1.7 1.8 4.5
Source: 5
292

290TABLE 81
CARDIOLOGISTS WHO HELD A CARDIOVASCULAR DISEASE FELLOWSHIP:CARDIOLOGISTS' AGE GROUP, SPECIALTY AND PRACTICE TYPE BY
MEAN NUMBER OF 'YEARS IN FELLOWSHIP PROGRAM AND PERCENTAGEIN SUCH PROGRAMS
Age Group, Specialty,and Type of Practice
CD FellowshipX Years
Fellowship HeldPercentage
Under 40 Years
Primary Non-Institutional 1.7 94.3
Primary Institutional 2.1 97.6
Secondary Non-Institutional 1.3 76.5
Secondary Institutional 1.7 78.0
Over 40 Years
Primary Non-Institutional 1.6 48.3
Primary Institutional 2.2 80.3
Secondary Non-Institutional 1.4 28.9
Secondary Institutional 1.6 46.6
All Cardiologists 1.7 56,,6
Fellows 1.9 94.0
Source: 5
;33

291
and of "medium" to "high" importance for the training of a physician goinginto a similar practice or (2) the respondent found his training "too much"in an area and of "low" importance to others.
Tables 82 and 83 provide statistics for those who (1) indicated that theirtraining was deficient in some respect and (2) said that such training was ofmoderate to high importance to others. The percentage for "insufficient" iscalculated only from those who indicated that they had that training. Table 82shows the number and percent of respondents who were trained in each areaas well as the percent who found that training insufficient. Thus, looking atTable 82, the first entry, 34.2 percent of the 53.2 percent trained in the areafound that training insufficient.
The types of deficient training considered most important are underscored inTable 82. These underscored values are found in Table 83 as the far right("All") column entry. Table 83 presents the summary tabulations from thepreceding table by (1) population, (2) practice, (3) age, (4) specialty and(5) fellowship, as discriminant variables. It is clear that the areas withgreatest perceived deficiency are those which represent relatively new advancesin cardiology. With Table 83, the educational planner can determine whetherprograms for all cardiologists are sufficient or whether select programs, focusingon any one of the analytical variables noted would be more appropriate.
Population Relate to Educational Needs
Population size was considered a potentially important dimension for educationalprogram planning. Tables 84, es, 86, 87, and 83 provide the percentages in-dicating training desired, opinions regarding adequacy of training which theyreceived and desires for, as well as actual participation in, continuingeducation programs of a national and/or regional character.
Assessment of Manpower Adequacy
Cardiologists were asked to indicate whether there were "too few", "aboutright" or "too many" cardiologists in their respective area. They were askedthis question for Primary Cardiologists and for Secondary Cardiologists . Tables89 and 90 provide summary statistics for each of the types of cardiologiststudied. Tables 91 and 92 provide similar statistics for all cardiologistsdivided into two population groupings. These data generally portray a levelof assessment indicating that the numbers are "aoout right"; however, on acensus division basis, the Eastern Seaboard and the West Coast respondentsmore often indicated "too many" cardiologists. These rata are more suggestivethan definitive. To be most useful the data would require further analyses tothe level of metropolitan areas which, if done, would result :n extremely smallnumbers that could only be used as indicators of possible over concentrationof cardiologists.
ik:taijr

292
TABLE 82
ALL ACTIVE CARDIOLOGISTS TRAINED IN CARDIOVASCULAR TOPICAL AREASAND PROPORTION OF THOSE TRAINED WHO romp THEIR TRAINING INSUFFICIENT
Cardiovascular Training Program Experiencesand Training Topics
RespondentsIndicatingTraining
Arummoimmrime
TrainingFound
Insufficient
N
Experience in Clinical Caret Research, and TeachingCardiac patient care; pediatric 803 53.2Cardiac patient care: medical 1227 81.3 8.7Cardiac patient care: surgical 796 52.8 29,1Cardiac patient care: coronary tare unit 571 37.8 27.7Pacemaker insertion 565 37.4 25.7Pacemaker follow-up 551 36.5 3419Cardiovascular research: basic 495 32,8 21.2Cardiovascular research: clinical 843 55:9 21.0Teaching: clinical 1072 71,0 13.1Teaching: didactic 854 56.6 17.3
1)boratory Diacnos tic' Technique,1133 75.1 11.0Electrocardiography
Phonocardiography 828 54,9 30.2Echocardiography 290 19.2 55.3Exercise tolerance testing 821 54.4 28.0Vec torcard log ra phy 595 39.4 2_311,Angiography: cardiac 671 44.5 24.2Angiography: coronary 469 31.1 42.0,Angiography: peripheral 406 26.9 38.8Cardiac catheterization 669 44.3 22.1Swan-Ganz right heart catheterization 260 17,2 44.0
Laboratory and Classroom InstructionCV anatomy 836 55.4 27.7CV physiology 893 59,2 21.7CV biochemistry 710 47,1 17,7CV pathology 876 58.1 26.4CV epidemiology 665 44,1 28.8CV pharmacology 827 54.8 27.5CV radiology 888 58,8 24.5Pulmonary physiology , 792 52.5 39.8Hypertensive renal disease 839 55.6 21.3Peripheral vascular disease 803 53.2 27.1Cerebral vascular disease 741 49,1 24,5Blostatistics 438 29.0 38.8Bioengineering 371 24,6 41.4
* Values underlined indicate that 1/3 or more of those having training in an area found thattraining insufficient,
Source: 5

BEST COPY AVAILABLE TABLE 83
CAADIOLOGISTS'IXAMING EXEXIENCEStnitCEPITAGE tir IIESPONDENYS 7INIDING TitAIWING INSUMCIENT
IV Stitt/TO PliktliCE CHARACTERISTICS
Cardiovascular 'Mining MegrimExpedience* end Training Topic.
hog anon
X
A. Experience In Minkel rare, Am erasand tacteing
Cardiac Patient tete:-Pediatric 31.1 3241
Midtoal 11.9 7.9
twitted 17.0 21.4
Coronary Care Wait 14.0 1141
Ps coleakew Weston 11.6 21./
Pateiteaker 10.3 MOCartliovaecularreaeirchl
Smelt ICA II.)
teachirolit
11.1 124
Clinical 13.11 13.0
Didactic 12,2 ICS
I. Labonetery tlitignototle technigue4
Eliectroaerdiogesphy 11.4 10.4
Phanocirdiegeephy 11.1 31.1
tr.nocentloglepley 41.1 14,1
Duddy' lelaestene Wade, Me 14,8
Vectoroarditegnsphy 31.0 14,1
Ang lognephytCardiac 11.0 11,6
C040n6r9 41.9 41.1
Periphand 19.0 18,1
Carditt cithoterisation 12.1 11.1
Swan- Gana right heart tetheterisetion 43.1 14,1
C. talectsiory and Clae noon betty COOS
CV aNIAmy 23.4 11,1
CV phylloicity 141.1 21.0
CV bicchicitalry 17.1 40.4
CV pathology 22.1 27.1
CV epldieenkiegy 10.7 10.1
CV phareenology 21.1 24,7
CV retUelegy 14.1 27,2
Pulmonary physiology 31.1 41.0
itypertenalve renal disease 20.1 21,7
Peripheral imecular diaaaaa 26.0 17.1
Cambria vatailar disease
itiostatiatits
14.1,
40,0
24.0
28.1
itioangineering 43.0 40.1
Practice
31.4 31.)
10,7 3.4
19.1 1149
10.4 13.4
10.1 11,1
37.2 31.1
19.1 14.1
10.4 12.1
17.1 14,1
11.1 10.1
33.4 14.1
31,1 14.4
16,1 30.6
31.1 104
11.1 10.8
48.4 14.0
41,2 11.0
24,/ 14.1
49.4 31.2
11.1 31,1
20,1 23.7
11.8 41.9
31.1 114
25.7 MS
26.1 30,1
23.0 21.4
40.1 34.4
20,3 24.1
21.2 31.4
12.2 31.2
31.2 44,1
41.r 41.9
Source: 5 As 96
293
hectic* Cheracterliticr
Alf
Age Specialty rellowohlte
14.1 14.1 MS 3941 17.3 11.9 34.2
1.0 11.4 ehl 12.3 4.1 11.7 1.2
14.0 3040 27.7 11.1 37.1 3147 213
12.1 31.3 34,1 31.7 Me 34.1 17.7
le,e 40.0 11.1 3364 1040 47.0 MI
31.4 31.1 3141 42.1 34.1 14.1 14.9
30.1 11.7 11.1 30.1 ICJ 210e 11,1
1341 10.3 11.1 10.7 10.1 1).0 114
1.1 11.1 9,1 11.1 9.7 10.1 11.1
17,4 17.3 11.3 20.3 lid 10.4 17,1
11.1 11.6 8,4 14.1 7,6 16.3 11.0
13.8 31.1 27,7 34.1 36.8 41.1 30.2
11.1 61,1 11.3 11.4 14.1 17.8 11.3
104 28.3 36.1 30.1 21.2 17.1 11.0
31,0 31.1 30.4 394 31,1 44.9 33.1
13.1 11.1 10.2 31,3 19.11 44.0 14.2
314 11,0 40.1 41.1 40.7 47.8 41.0
12.7 44.1 33.6 41.7 31.0 49.1 344
1147 11.2 17.1 31,1 17.0 47.3 12.1
31.9 1143 40.1 11.1 31,0 85.6 44.0
11,1 11,8 11.0 23.1 21.1 25.1 17.7/
22,0 20.1 20.0 24.2 20.7 23.2 f f
33.4 40.3 40.1 31.1 34.1 40.1 37.7
3141 21.3 27.8 24.4 27.2 24,4 16.4
33.6 26.0 31.7 24.0 10.1 25.6 28.6
27.2 27,7 21.0 27.0 29.0 24.1 2/.1
26,4 21.4 13,6 MO 24.1 21.1 14.1
34.4 30.7 40.1 38.1 31.6 33.7 31.6
23,7 20.0 24.0 17.1 22.3 11.5 21,1
33.0 23.0 21.1 24.0 21.0 23.5 21.1
41,1 21.) 27.6 20.6 27.7 10.4 24.1
38.0 40.1 31.0 37.4 16.1 47.1 34.0
35.2 44.4 41.1 41.2 37.6 12.5 41.4

294
BEST COPY AVAILABLE
TABLE 84
PERCENT OP ALL ACTIVE CARDIOLOGISTS INDICATING TYPE or TRAINING DESIREDIN CONTINUING EDUCATION BY COMMUNITY SIZE
TYPE or TRAINING
ALL ACTIVE CARDIOLOGISTS
Community Site All
Under ISOM Over 150M
N327 10.1182 No,1509
S
Classroom Instruction or SeminarsGeneral medical cardiology 80.8 81.3 81.1CV surgery 24.0 33.6 31.7Pediatric cardiology 28.3 30.4 29,9CV anatomy 35.4 28.5 29.9CV physiology 65.5 62.3 62.0CV biochomistry 38,6 40,6 40.1CV pathology 42.3 38,1 39,0CV epidemiology 29.6 28.4 28.6CV pharmacology 63.7 60.8 61,4CV radiology 46.1 48,4 47.9Pulmonary physiology 60,6 56,9 57.6Hypertensive renal diesels:, 65,3 53.8 56.2Peripheral vascular disease 53.1 42.2 44.5Cerebral vascular disease 53.3 39.7 42.6Sioatatistics 17.7 21,3 20.5Bilengitusering 20.4 24.0 23,2Electrocardiology 76.9 61,7 64.9Phonocardiology 38.8 41,6 40.9Echocardiography 46.2 52,9 51.4Dtetc Is* tolerance tasting 56,9 51.2 52.4Vectorcard lography 40.7 40.7 40.7Anglography 31.2 37,5 36.1Cardiac catheterisation
actual Personal Svoervleed Experience
22.5 29,7 28,1
In Cardiac Pat1Itn1 CamPediatric 14.8 13.1 13.4Medical 45.6 36.7 38,6Surgical 13.0 13.8 13,6Coronary care unit 45.0 34.5 36.0Pacemaker insertion and follow-up 44.3 32.0 35.2
LaboraioN Diagnostic _Tech:it/1w
Electrocardiography 58,1 44.2 47.iPhonocardlography 31.7 30.7 30.9Echocardiography 39.3 41.6 41.1Exercise tolerance testing 49.1 37,0 39.6Vectorcardiog:aphy 34.0 29.0 30.3Anglography: cardiac 25.5 24.3 24,6Anglography; coronary 28.2 26.6 26.9Amgiography: peripheral 20.6 15.4 16.5Cardiac catheterisation 18.5 24.8 23.4Swan-Gans right heart catheterisation 26.7 26.2 26,3
.4=1,ParSource: 5 2 97
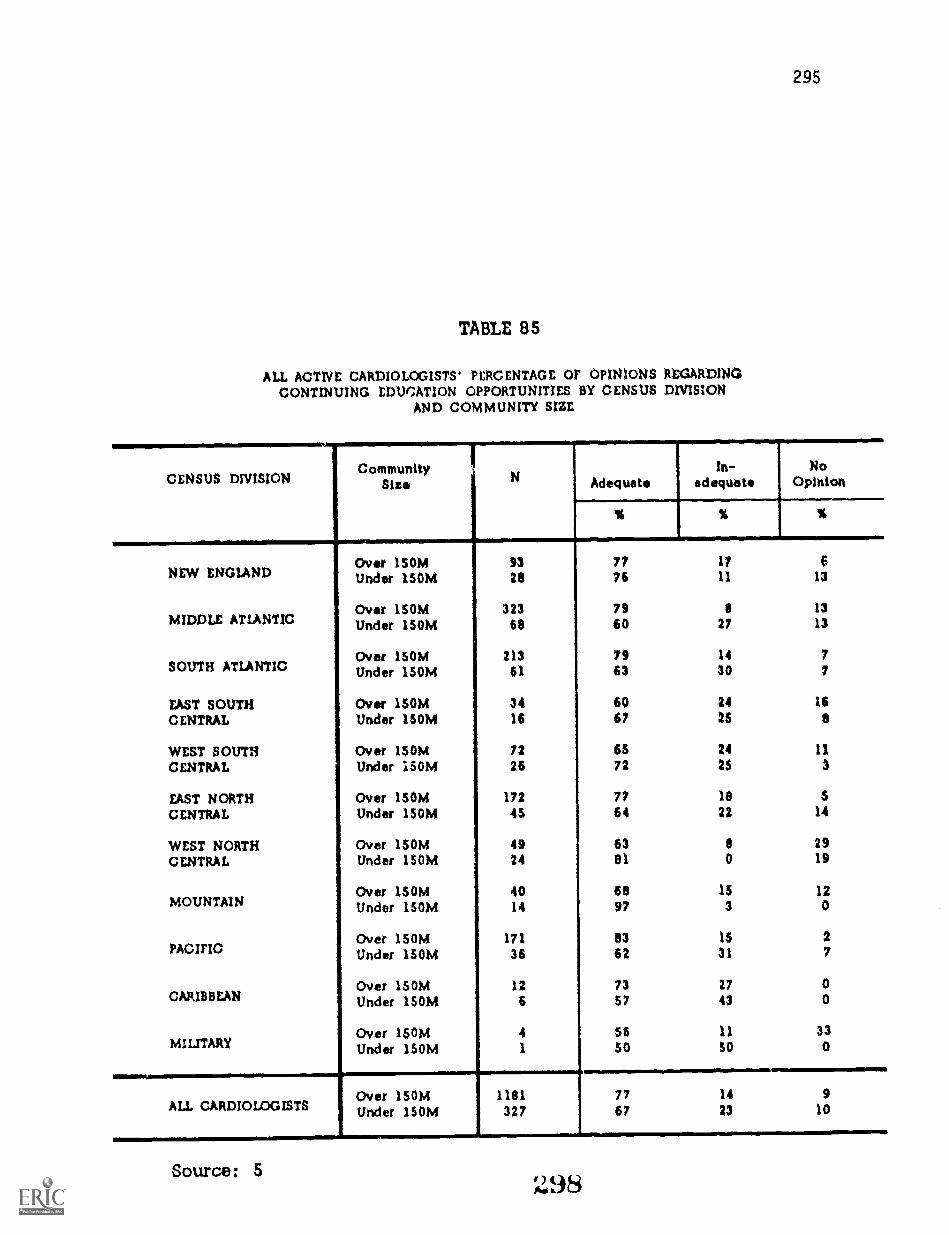
295
TABLE 85
ALL ACTIVE CARDIOLOGISTS' PERCENTAGE OF OPINIONS REGARDINGCONTINUING EDUCATION OPPORTUNITIES BY CENSUS DIVISION
AND COMMUNITY SIZE
CENSUS DIVISIONCommunity
Size N Adequatein-
adequateNo
Opinion
% % %
Over 1SOM 93 77 17 6NEW ENGIAND Under 150M 28 76 11 13
Over 150M 323 79 8 13MIDDLE ATLANTIC Under 150M 68 60 27 13
Over 150M 213 79 14 7SOUTH ATLANTIC Under 150M 61 63 30 7
EAST SOUTH Over 150M 34 60 24 16
CENTRAL Under 150N1 16 67 25 8
WEST SOUTH Over 15014 72 65 24 11CENTRAL Under i50M 26 72 25 3
EAST NORTH Over 150M 172 77 18 5
CENTRAL Under 150M 45 64 22 14
WEST NORTH Over 150/4 49 63 8 29CENTRAL Under 150M 24 al 0 19
Over 150M 40 60 15 12MOUNTAIN Under ISOM 14 97 3 0
Over 150M 171 83 15 2PACIFIC Under 150M 36 62 31 7
Over 150M 12 73 27 0CARIBBEAN Under 150M 6 $7 43 0
Over 150M 4 56 11 33MILITARY Under 150M 1 50 50 0
es
Over 150M 1181 77 14 9ALL CARDIOLOGISTS Under 150M 327 67 23 10
Source: 5 :4198

296
TABLE 86
ALL ACTIVE CARDIOLOGISTS' PERCENTAGE OF ATTENDANCEONCE A YEAR OR MORE AT NATIONAL OR REGIONAL MEETINGS
HAVING SUBSTANTIAL CARDIOLOGY SESSIONSBY CENSUS DIVISION AND COMMUNITY SIZE
CENSUS DNISION
NEW ENGLAND
MIDDLE ATLANTIC
SOUTH ATLANTIC
EAST SOUTHCENTRAL
WEST SOUTHCENTRAL
EAST NORTHCENTRAL
WEST NORTHCENTRAL
MOUNTAIN
PACIFIC
CARIBBEAN
MILITARY
ALL CARDIOLOGISTS
CommunitySize N
More thenOnce a Year
Oncea Year
Over 150M 93 40 28Under 150M 28 28 19
Over 150M 323 36 30Under 150M 68 29 30
Over 150M 213 35 28Under 150M 61 35 40
Over 150M 34 26 28Under 150M 16 20 45
Over 150M 72 40 24Under 150M 26 40 21
Over 150M 172 34 35Under 150M 45 43 24
Over 150M 49 30 26Under 150M 24 39 32
Over 150M 40 34 20Under 150M 14 49 43
Over 150M 171 43 26Under ISOM 36 27 39
Over 150M 12 63 18Under 150M 6 43 21
Over 150M 4 0 59Under 150M 0 50
Over 150M 1181 37 29Under 150M 327 34 32
Source: 5 299

297
TABLE 87
ALL ACTIVE CARDIOLOGISTS' PERCENTAGE or ATTENDANCEONCE A YEAR OR MORE AT NATIONAL MEETINGS DEVOTED
EXCLUSIVELY. TO CARDIOLOGY BY CENSUS DIVISION 4
AND COMMUNITY SIZE
CENSUS DIVISIONCommunity
SizeN
More thanOnce a Year
Oncea Year------.1_.
Over 150M 93 34 38NEW ENGLAND Under 150M 28 8 41
Over 150M 323 28 45MIDDLE ATLANTIC Under 150M 68 12 42
Over 150M 213 26 40SOUTH ATLANTIC Under 150M 61 26 29
EAST SOUTH Over 150M 34 22 30
CENTRAL Under 150M 16 6 28
WEST SOUTH Over 150M 72 44 26
CENTRAL Under 150M 26 12 39
EAST NORTH Over 150M 172 38 33
CENTRAL Under 150M 45 39 29
WEST NORTH Over 150M 4,C, 24 35
CENTRAL Under 150M 24 44 35
Over ISOM 40 29 36MOUNTAIN Under 150M 14 4 71
Over 150M 171 45 32PACIFIC Under 150M 36 11 40
Over 150M 12 20 77CARIBBEAN Under 150M 6 58 7
Over 150M 4 11 79MILITARY Under 150M 1 0 50
Over 150M 1181 33 38ALL CARDIOLOGISTS Under 150M 327 21 37
Source: 5
300

298
TABLE 88
ALL ACTIVE CARDIOLOGISTS' PERCENTAGE PARTICIPATING IN'CARDIOVASCULAR DISEASE CONTINUING EDUCATION COURSES
ONCE A YEAR OR MORE BY CENSUS DIVISIONAND COMMUNITY SIZE
CENSUS DIVISION CommunitySize N More than
Once a YearOnce
a Year
NEW ENGLAND Over ISOMUnder ISOM
9328
59 2258 18
Over ISOM 323 52 24MIDDLE ATLANTIC Under 150M 68 47 25
Over 150M 213 57 21Sant! ATLANTIC Under 150M 61 43 39
EAST SOUTH Over 150M 34 57 14CENTRAL Under 150M 16 43 25
WEST SOUTH Over 150M 72 44 26CENTRAL Under ISOM 26 67 9
EAST NORTH Over 150M 172 57 25CENTRAL Under 150M 45 67 18
WEST NORTH Over 150M 49 32 27CENTRAL Under 15014 24 76 18
MOUNTAINOver 150MUnder ISOM
4014
58 1771 30
Over 150M 171 68 17PACIFICUnder 150M 36 71 11
Over 150M 12 67 33CARIBBEAN Under 150M 6 64 36
Over 150M 4 26 48MILITARY Under 150M 1 100 0
Over 150M 1181 56 22ALL CARDIOLOGISTSISOM 327 58 23
Source: 5 301
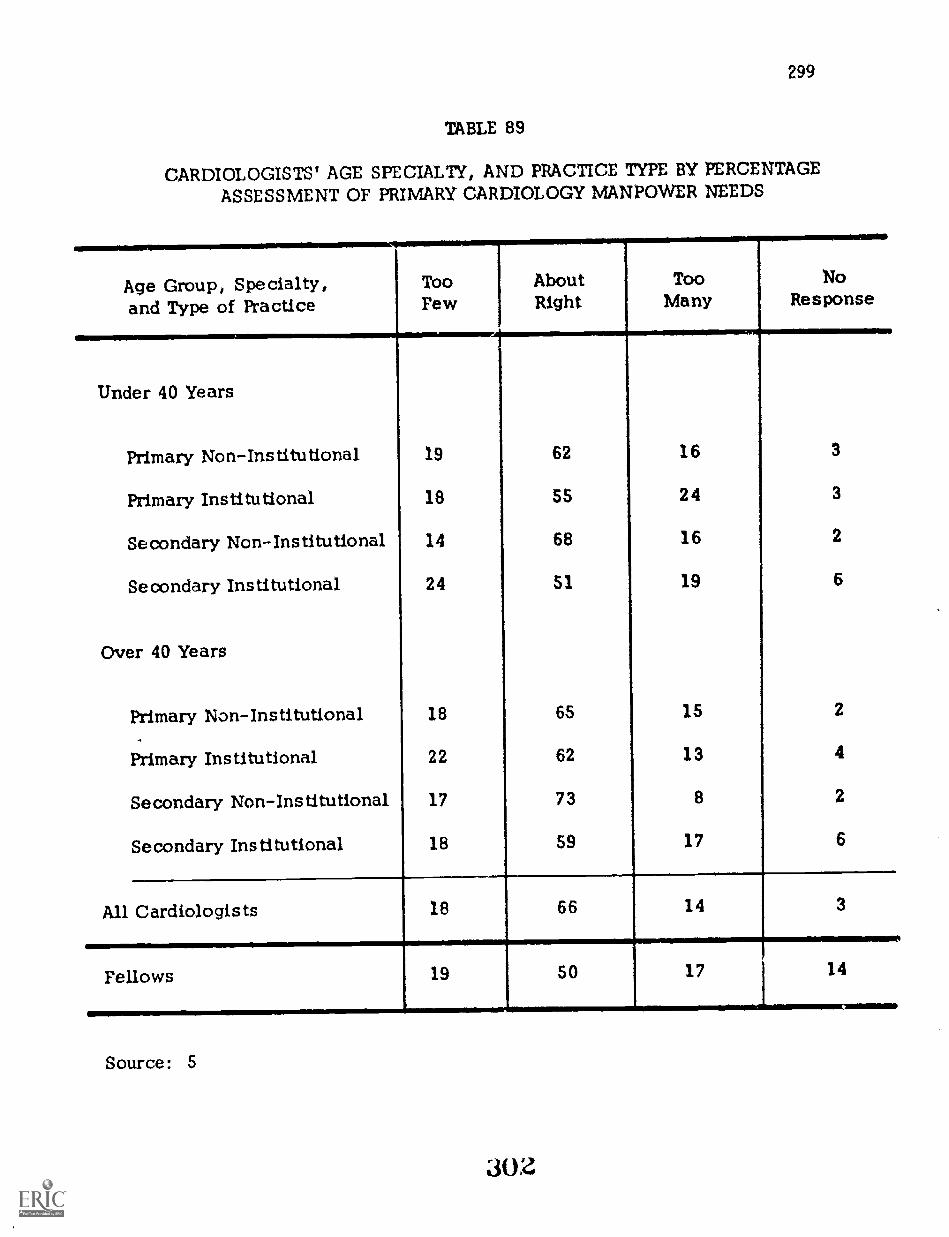
299
TABLE 89
CARDIOLOGISTS' AGE SPECIALTY, AND PRACTICE TYPE BY PERCENTAGE
ASSESSMENT OF PRIMARY CARDIOLOGY MANPOWER NEEDS
Age Group, Specialty,and Type of Practice
TooFew
AboutRight
TooMany
NoResponse
Under 40 Years
Primary Non-Institutional 19 62 16 3
Primary Institutional 18 55 24 3
Secondary Non-Institutional 14 68 16 2
Secondary Institutional 24 51 19 6
Over 40 Years
Primary Non-Institutional 18 65 15 2
Primary Institutional 22 62 13 4
Secondary Non-Institutional 17 73 8 2
Secondary Institutional 18 59 17 6
All Cardiologists 18 66 14 3
Fellows 19 50 17 14
Source: 5
30z

300
TABLE 90
CARDIOLOGISTS' AGE, SPECIALTY, AND PRACTICE TYPE BY PERCENTAGEASSESSMENT OF SECONDARY MANPOWER NEEDS
Age Group, Specialty,and Type of Practice
TooPew
AboutRight
TooMany
NoResponse
Under 40 Years
Primary Non-Institutional 14 56 25 5
Primary Institutional 14 56 26 5
Secondary Non-Institutional 10 68 18 4
Secondary Institutional 20 56 15 9
Over 40 Years
Primary Non-Institutional 12 63 21 4
Primary Institutional 16 65 13 6
Secondary Non-Institutional 14 76 9 2
Secondary Institutional 16 61 17 2
All Cardiologists 14 66 17 4
Fellows 11 53 20 16
Source: 5
303

301
TABLE 91
ALL ACTIVE CARDIOLOGISTS' PERCENTAGE ASSESSMENT Of PRIMARY CARDIOLOGY MANPOWERby CENSUS DIVISION AND COMMUNITY SIZE
CENSUS DNISIONCommunity
Size NTooFew
AboutRight
TooMany
NoResponse
% % S %
Over ISOM 93 15 12 18 SNEW ENG1AND Under 1SOM 28 14 al 3 2
Over ISOM 323 10 69 19 2MIDDLE ATLANTIC Under 1SOM 69 26 59 s 1
Over 1SOM 213 12 69 IS 4SOUTH ATLANTIC Under 150M 61 37 50 10 3
EAST SOUTH Over 1SOM 34 36 59 4 1
CENTRAL Under 150M 16 20 32 6 22
WEST SOUTH Over 150M 72 13 71 16 0
CENTRAL Under 1SOM 26 31 69 0 0
EAST NORTH Over ISOM 172 19 73 6 1
CENTRAL Under 1SOM 45 30 67 3 0
WEST NORTH Over 1SOM 49 21 62 9 9
CENTRAL Under 150M 24 56 40 0 4
Over ISOM 40 24 SS 16 SMOUNTAIN Under 1SOM 14 S 93 0 4
Over 1SOM 171 11 62 23 4PACIFIC Under 150M 36 18 63 18 1
Over 1SOM 12 * *CARIBBEAN Under 1SOM 6 * *
Over ISOM 4 I * * aMILITARY Under 150M 1 * 'a *
miam.....i.,Over 150M 1191 15 67 16
..m.
2
ALL CARDIOLOGISTS Under 150M 327 29 62 4 3
Numbers inadequate for analysis.
Source: 5
304

302
TABLE 92
ALL ACTIVE CARDIOLOGISTS' PERCENTAGE ASSESSMENT OF SECONDARY CARDIOLOGY MANPOWER BYCENSUS DIVISION AND COMMUNITY SIZE
CENSUS DIVISION CommunitySire N Too
FewAboutRight
TooMany
NoResponse
% % % %
Over 150M 93 7 71 16 6NEW ENGLAND Under 150M 28 13 82 3 2
Over 150M 323 7 67 23 3MIDDLE ATLANTIC Under 150M 68 17 68 14 1
Over 150M 213 13 64 17 6SOUTH ATLANTIC Under 150M 61 33 49 12 6
EAST SOUTH Over 150M 34 17 63 19 1CENTRAL Under 150M 16 11 80 0 9
WEST sown over 150M 72 11 70 28 1CENTRAL Under 150M 26 24 76 0 0
EAST NORTH Over 150M 172 14 73 13 0CENTRAL Under 150M 45 19 68 8 5
WEST NORTH Over 150M 49 15 71 9 3CENTRAL tinder 150M 24 58 36 0 6
Over 150M 40 10 68 15 7MOUNTAIN Under 150M 14 11 86 0 3
Over 150M 171 14 55 26 5PACIFIC Under 150M 36 21 59 17 3
Over 150M 12 * *CARIBBEAN Under 150M 8 0
MILITARYOver 150MUnder 150M
41
i lb
*1.Over 15DM 1191 11 66 19 4ALL CARDIOLOGISTS Under 150M 327 23 65 9 3
Numbers inadequate for analysis.
Source: 5
305

303
Practice Location Related to Where Trained
It is noted in Chapter Five that the majority of cardiologists trained within anarea practice in the same general area. Looking at where cardiologists prac-tice in relation to where trained as the next level of movement, i.e., percentagesgoing to a postal area census division other than were trained, the EasternSeaboard does quite well in retaining its manpower resources (movements areup and down the coast) and the Area 9 (Pacific) is the major choice area forall other training areas. Specifically, the Pacific obtains the following per-centages of those trained in indicated postal area!;:
Movement from Area 4
Movement from Area 5
Movement from Area 6
Movement from Area 7
Movement from Area 8
8.3 percent
11.9 percent
13,3 percent
10 . 9 percent
22.6 percent
The magnitude of this migration to the Pacific is seen when the cardiologistsfrom other areas are combined with those trained in the area; the Pacific re-tains 75.5 percent of all that they train but this number is only 56. 5 percentof all that they have.
CARDIOVASCULAR DISEASE TRAINING PROGRAMS STUDY
The methodology for this study is discussed in Chapter Two, pages 57 through78. Estimates were obtained concerning the availability of facilities withinand/or in association with training institutions, the number of diagnostic andtesting procedures performed, the type and number of clinical conditions seenand treated (a measure of training resources), as well as, an enumeration ofstaffs and their capabilities. These data are presented in Chapter Five.Statistics regarding requirements for training programs, the amount of timein training programs and the objectives which directors have for their programsare also presented in Chapter Five.
Physicians Trained in Cardiology
Tables 93, 94 and 95 summarize past, current and planned cardiovasculartraining program trainee statistics. Table 93 presents mean statistics for the190 programs which answered the survey form. Tables 94 and 95 extend thesedata to the 329 national programs. With these tables, the trends related togrowth as well as differences in growth patterns for types of programs aredocumented.
ap6

304
TABLE 93
AVERAGE NUMBER OF CARDIOVASCULAR TRAINEESBY PROGRAM LENGTH
Number of Cardiovascular Traineesby Category and Program Year
PROGRAM LENGTH *
Less than24 Months
(N=51)
24 Monthsor More(N=139)
X Number X Number
Number of Positions:1972-73 2.08 5.071971-72 1.78 4.621970-71 1.34 3.99
Number Positions Filled:1972-?3 1.86 4.911971-72 1.74 4.561970-71 1.32 3.76
Nutnber Completing Programthis Year:
1972-73 1.64 2.861971-72 1.66 2.501970-71 1.28 2.23
Number of Applicants (1972-73) 9.93 26.51
*Length for majority of candidates.
Source: 4
307

TABLE 94
NUMBER OF TRAINEES BY TRAINING PROGRAM LENGTH:1970-71 THROUGH 1972-73
Number ofProgram Length*
Cardiovascular Traineesby Category and
Less than24 Months
24 Monthsor More Total
Program YearN=88 N=241
Number Number Number
Number of Positions:
1972-73 174 1159 13331971-72 149 1056 12051970-71 112 912 1024
Number Positions Filled:
1972-73 155 1123 12781971-72 145 1043 11881970-71 110 860 970
Number CompletingProgram this Year:
1972-73 137 654 7911971-72 139 572 7111970-71 107 510 617
*Based on "usual amount of time" In program.Source: 4
dOS
305

306TABLE 95
CARDIOVASCULAR TRAINEES COMPLETING PROGRAM:GROWTH BASED ON PROGRAM DIRECTORS' ESTIMATES*
BY PROGRAM LENGTH
Program Years
Program Length
Less than24 Months
24 Monthsor More Total
N=88 N=241NumberNumber Number
Completed Program:
1971-72 139 572 7111972-73 137 654 791
Subtotal 276 1226 1502
Estimated Completion:
1973-74 150 719 8691974-75 165 791 9561975-76 182 870 1052
Subtotal 497 2380 2877
Five Year Total 773 3606 4379
Estimated Completion
1976-77 200 957 11571977-78 220 1053 1273
Subtotal 1420 2010 2430
Seven Year Total 1193 5616 6809
*58 percent estimate in five years, computed as 10 percent per year.
Source: 4
309

307
Training Program Directors' Program Objectives
Directors were asked whether or not their program graduates had capabilitiesin selected areas of cardiology upon completion of training. These responsescan be considered a statement of program objectives. Table 96 provides theresponse percentages for directors of both types of programs.
Directors were also given the opportunity to make written recommendationsconcerninri changes which they felt should occur in cardiovascular trainingprograms. These comments were used by the Advisory Committee in theirevaluations.
Suggested Cardiology Training Program Guidelines Pre arediarSubspecialty Board
The guidelines prepared by the Cardiovascular Subspecialty Board were cited bymany program directors. The statements below regarding guidelines for trainingprograms were provided by the current Chairman of the Subspecialty Board inCardiovascular Diseases and are recommended by the Advisory Committee foradoption.
Clinical training program in cardiology must of necessity be variedin content and emphasis reflecting the differing backgrounds, talentsand ambitions of trainees, as well as the large spectrum of oppor-tunities that may be found in training centers. Therefore it is dif-ficult to compose a description of an ideal program without runningthe risk of imposing a uniformity that could be suppressive of in-novation and progress. The following general guidelines are offeredwith the realization that good programs may exist with variousemphasis and that periodic review is necessary to avoid obsolescence.
1. Objectives of a Clinical Training Program in Cardiology. Ingeneral the trainees entering a clinical .;:raining program will em-bark on careers in either a practice of cardiology, or academicmedicine or some combination of the two. If the goal is practice ofcardiology, the extent to which this is possible as a specialty isdetermined by the locale of the practice, hospital facilities, associates,etc. Therefore the technical procedures which must be mastered willbe affected to some extent by the opportunities that will exist in thepractice area. Often, however, the ultimate goal is unclear to thetrainee at first. Not infrequently goals change as the traineeshipunfolds. Therefore a certain core experience would seem indicatedfor all trainees. This should be provided in sufficient depth andwith sufficient emphasis or scholarship, self-instruction anddevelopment of critical judgment , so that the trainee-product ofthe program will not become dated after he has entered his chosenprofession on completion of the experience.
3 10

308 TABLE 96
PERCENT OF CARDIOVASCULAR TRAINING PROGRAMSINDICATING TRAINEE SKILLS IN VARIOUS AREAS
13? PROGRAM LENGTH
Trainee Skills
Upon completion of our program, themajority of our trainees are able for
Pro ramLess than24 Months
04=51)
% Yes
Len th24 Months
or More(N=139)
Manage an intensive care and/or coronarycare facility
Conduct diagnostic cardiac catheterizations
Direct a hemodynamics lab
Serve as cardiologist consultant on a CCUcommittee
Perform as a cardiologist consultant in allclinical areas
Conduct clinical research
Conduct basic laboratory research
Teach graduate students and residents inclinical and laboratory settings
Teach medical students, residents andfellows in both clinical and formalclassroom settings
Participate in professional seminars, work-shops and symposia as consultantcardiologists
Are eligible for subspecialty board certi-fication in cardiovascular diseases
Perform and teach others to perform cardiacdiagnostic x-ray procedures
Perform and teach others to perform non-invasive laboratory techniques
Source: 4
% Yes
85.6
99.2
84.0
89.6
.311

309
2. figigaikintez. Trainees must have a thorough grounding in in-ternal medicine before embarking on the clinical training program.The proper understanding of the complications in fluid and electro-lyte problems, hematology, infectious disease, etc., occurring forinstance in post-operative open-heart surgical patients, indicatesthe need for mastery in-depth of the appropriate major areas of internalmedicine. This type of competence has in most instances been bestprovided by an internship plus two years of residency in an approvedprogram in internal medicine prior to starting the cardiology traineeship.
3. Location of the Frogrem. Although many of the best known programsoccur in university teaching hospitals it is certainly possible for asuperb program to be provided in a hospital not affiliated with auniversity center.
4. Contents of the Program.
a. The principal ingredients of a good clinical traineeship programin cardiology may be divided into four areas:
(1) Acquisition of clinical skills used in diagnosis.
(2) Mastery of laboratory techniques.
(3) Instruction and experience in management of various typesof heart disease.
(4) Opportunity for research.
The first three of these are obvious. The inclusion of research as animportant part of a clinical training program may require a word of ex-planation. Obviously most graduates of clinical training programswill, in the end, engage in practice. Is participation in clinical in-vestigation worthwhile for such an individual? It is eminently worth-while. The experience of identifying a problem worthy of study,going through the literature to see what is already known, workingout a protocol to study the probelm under skillful supervision, executingthe necessary studies, evaluating the results and writing up the wholestudy for presentation to colleagues in verbal or written form is animportant and instructive exercise. It may affect one's career goalsby attracting toward (or repelling from) academic medicine. Althoughproof of this is lacking, we believe that such an experience is one of thebest ways of encouraging life-long habits of scholarship and criticalthinking so necessary in the evaluation of newly proposed therapeuticmodalities, etc. It is recognized, however, that some trainees haveno interest in research and it is quite possible that their forced im-mersion in on-going investigative programs will be tedious and timewasting for all concerned.
312

310
b. Details of the core experience of a satisfactory training program.Besides knowledge of basic subjects such as cardiovascular anatomy,physiology, pathology, pharmacology, the following areas and sub-jects are considered important:
(1) Acquisition of clinical skills in diagnosis. The propercare of patients seen by a cardiologist requires accuracyin diagnosis. Even in the modern era of more and moreprecise laboratory methods, the bedside skills containedin history taking and physical examination remain ofcrucial importance. Therefore it is imperative that,through the experiences afforded by abundant patient con-tacts, the trainee sharpen his ability to utilize profitablythese basic clinical methods. The setting may vary withthe institution. However, an experienced director whocan check the findings and correct errors is of course nec-essary for the proper development of these important skills .
(2) Mastery of laboratory techniques. This list changesrapidly with the introduction of new methods. In many in-stances the laboratory methods supplement and strengthenthe clinical skills mentioned in (1) above. For instance)electrocardiography permits the verification of clinicallydiagnosed arrhythmias, phonocardiography enhancesauscultation - while graphic records of pulsatile phenomenaimprove the art of palpation of blood vessels and precordium.Catheterization and angiography provide physiologic andanatomic confirmation of conditions diagnosed at the bedside.Therefore for the optimal use of these technical methods aseducational (as well as diagnostic) tools the trainee shouldalways be required to state his opinion in writing in detailbefore resorting to the laboratory method.
A list of more important laboratory methods contained in thecare of a good program follows:
a. Electrocardiography - This remains the principallaboratory method used in cardiology. Mastery ofelectrocardiography is imperative. The interpretationof tracings under experienced supervision, coupledwith reading from standard text books and journalsshould provide an adequate experience. The numberof ECGs required for adequate training may be ex-ceeded in many busy hospitals. If the trainee isrequired to spend a very substantial portion of hisday in reading ECGs for service purposes, overand above his optimal educational requirements,this activity may dilute the value of the program.
313

311
b. Vectorcardiography - is available in many programsand is very useful as an educational and investigativetool. Participation is not imperative.
c. HIS Bundle Recording - The same may be said ofthis valuable new technique.
d. Phonocardiography - The trainee should be providedan opportunity to take and interpret phonocardiogramsunder proper supervision. This enhances the accuracyof bedside auscultation and enables one to appreciatethe graphic records appearing in the literature.
e. Ppexcardiography - The trainee should be encouragedto take his own multichannel records combining apex-cardiography with phono- and electrocardiograms . Hisskill in palpation will be enhanced by this experience.
f. Carotid and venous pulse tracings - The same istrue of these graphic recordings . The carotid tracingcombined with ECG and phone permits the measurementof systolic time intervals. At the present time an ade-quate training program Eiould include this technique.
g. Echocardiography - ability to interpret echocardio-grams.
h. Interpretation of cardiovascular roentgenograms,and special procedures and techniques used in thestudy of cardiovascular problems.
I. Interpretation of hemodynamic data obtained in thecardiac catheterization laboratory. Since catheterizationis in most centers one of the principal means of estab-lishing complex diagnoses and providing precise physi-ologic information it is a basic contributor to an effectiveprogram. The extent of personal participation by thetrainee may vary but a thorough understanding of thedata and ability to calculate results is absolutely nec-essary.
j . Experience in treadmill testing,
(3) Management of various types of heart disease. A broad ex-perience with the major types of heart disease encountered inthe United States is required. This elementary statement isincluded in view of the tendency in some centers for patient
314

312
material to be mainly concentrated on a limited spectrum of dis-ease owing to local referral patterns, surgical attractions andtherapeutic fads.
a. Coronary heart disease. A thorough understandingof its pathology, risk factors, natural history, prevention,diagnosis by history, physical examination, laboratory(treadmill testing, chemical studies, coronary arterio-graphy) and medical as well as surgical treatment is re-quired. An experience in a well run coronary care unitunder good supervision is a sine qua non of a good trainingprogram.
b. Hypertensive heart disease. Knowledge of theoriesregarding pathogenesis, the natural history, pathologyand pharmacologic treatment is needed.
a. Congenital heart disease. Embryology, alterationsin the circulation at birth, pathology, clinical presen-tation, laboratory diagnostic methods, surgical treat-ment, natural history of the principal types of congenitalcardiac malformations is necessary. A period of inten-sive exposure to pediatric cardiology is a valuable optionalexperience.
d. Rheumatic heart disease. KnntAiledge of the bacteri-ologic association, prey ention , pathology, complications,altered physiology, medical and surgical treatment
e. Other types of heart disease, Pericardial disease;Cardiac tumors; Syphilis; Cardiomyopathy; Car pulmonale;Parasitic heart disease; Traumatic heart disease; Psycho-genic factors.
f . Management of arrhythmias. This will includ'; monitoring,cardioversion, and pacemaking. The insertion of pacemakers,detection of malfunction and cooperative supervision ofambulatory patients with the help of nurses and surgeons areall necessary aspects of a good program,
g Y Pre-op and post-op management of open-heart surgicalcases.
Cardiologists' Career Objectives
Table 97 presents the mean number of program graduates with career objectivesin types of practice settings. Its importance is found in relating cardiologist
31

313
TABLE 97
AVERAGE NUMBER OF TRAINEES IN CARDIOLOGYCAREER AREAS BY PROGRAM LENGTH
Career Plans for Traineesby Category and
Program Year
PROGRAM LENGTH
Less than24 Months
(N=51)
24 Monthsor More(N=139)
X Number X Number
Clinical. Practice:1972-73 1.27
NruirmiNO
1.871971-72 1.17 1 1.73
Academic Medicine:1972-73 0.38 1,361971-72 0.31 1.16
Other:1972-73 0.04 1 0.051071-72 0.04 0,06
Unknown:1972-73 0.04 0,131971-72 0.02 0.04
Source: 4
316

314
objectives for practice to the objectives which the training directors indicatedfor their programs. Also, it indicates the probable distribution of newly graduatedcardiologists in types of practice arrangements - a fact of significance in man-power planning.
Program Support
Data were sought regarding types of financial support. Only the percentage ofprograms which obtained support from any of the sources noted was consideredreliable. Table 98 presents these statistics.
Training Progratin Characteristics
Significant differences were noted in the programs which are less than 24 monthsin duration and those of 24 months or more length.
Table 99 gives the distribution of programs by length and by program categories.From this table it will be apparent why the division at point of 24 months for twotypes of programs was chosen.
Table 100 is a summary of all response categories used in the portion of thesurvey instrument which asked about training program hours. Three responsepossibilities were used in this section:
o No response;
o A check, meaning that the training was offered but no estimate oftime was provided;
o Hours recorded, meaning that actual numbers were provided.
It is important to refer back to this table in assessing the statistics regardinghours of training because these statistics are calculated from the hours recordedonly.
Table 101 provides summary statistics for hours of training by both types ofprograms. Figures 2, 3 and 4 present comparable data graphically.
It is well to observe that the average program of less than 24 months durationhad approximately 70 'recuired training hours per week. The longer programshad approximately 55 required hours of training per week. Assuming that a70 hour week is normal for a trainee, those in the two-year programs have about15 hours each week for program electives. Only required hours have been pre-sented in tables and figures; one can only assume that sufficient resourcesexist within training programs to accommodate trainee interests in program elec-tives which might demand more time in any of the topical areas presented.
317
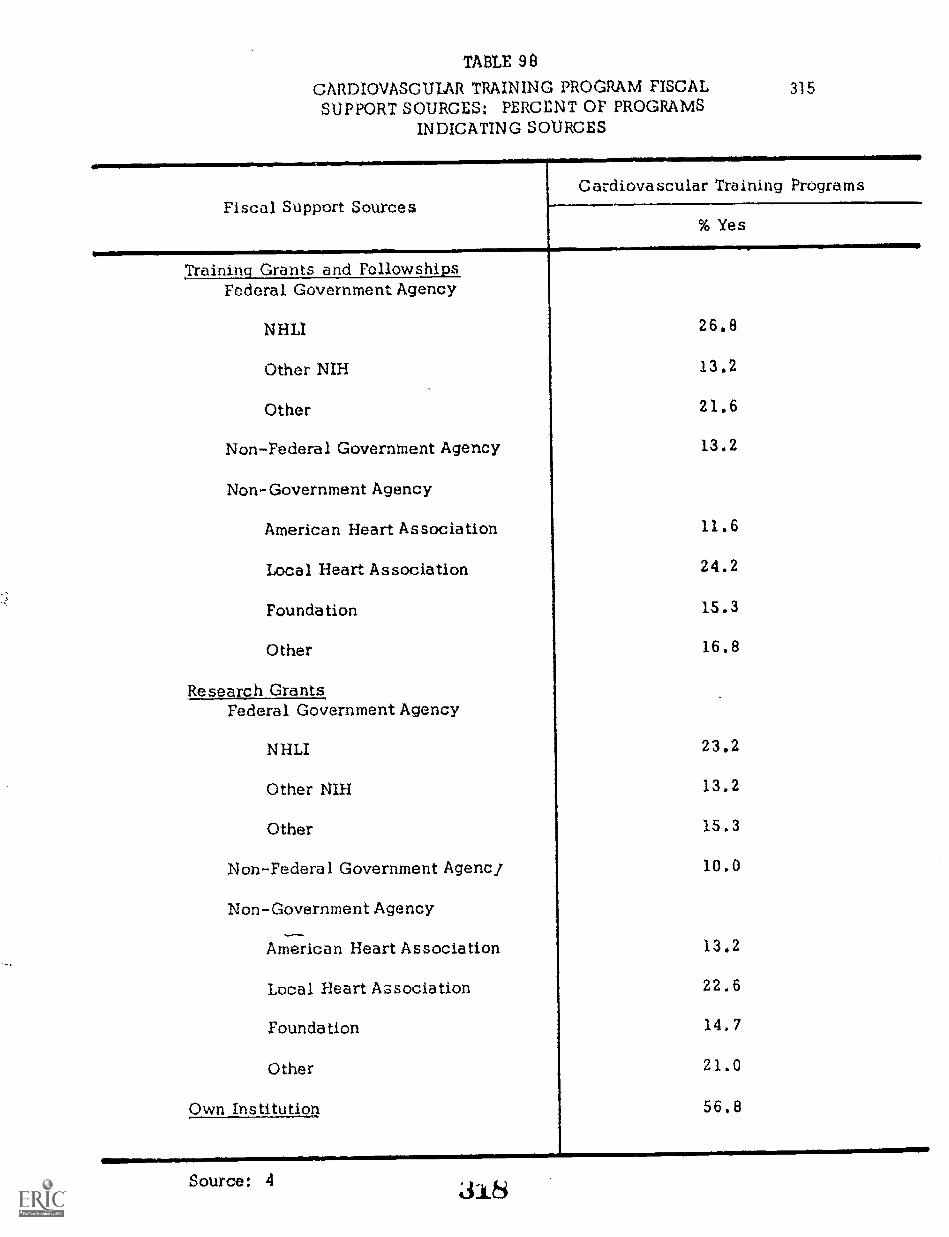
TABLE 98
CARDIOVASCULAR TRAINING PROGRAM FISCALSUPPORT SOURCES: PERCENT OF PROGRAMS
INDICATING SOURCES
315
Fiscal Support SourcesCardiovascular Training Programs
% Yes
Training Grants and Fellowships,Federal Government Agency
NHLI
Other NIH
Other
Non-Federal Government Agency
Non-Government Agency
American Heart Association
Local Heart Association
Foundation
Other
Research GrantsFederal Government Agency
NHLI
Other NIH
Other
Non-Federal Government Agencj
Non-Government Agency
American Heart Association
Local Heart Association
Foundation
Other
Own Institution
26.8
13.2
21.6
13.2
11.6
24.2
15.3
16,8
23,2
13.2
15.3
10,0
13.2
22.6
14.7
21.0
56.8
Source: 4 318

TA
BL
E 9
9
CA
RD
IOV
ASC
UL
AR
TR
AIN
ING
PR
OG
RA
M U
SUA
L M
ON
TH
S O
F T
RA
ININ
G:
PER
CE
NT
AG
E D
IST
RIB
UT
ION
FO
R T
HR
EE
TY
PES
OF
TR
AIN
ING
IN
STIT
UT
ION
S1
Usu
al M
onth
sof
Tra
inin
g
Typ
e I
Hos
pita
lsT
ype
II H
ospi
tals
Typ
e II
I H
ospi
tals
All
Hos
pita
ls
N%
N%
N%
N
12 M
onth
s26
52.0
1516
.52
4.1
4322
.6
18 M
onth
s1
2.0
77.
70
0.0
84.
2CO
fr-1,
Ci:
24 M
onth
s22
-.
44.0
6874
.746
93.9
136
71.6
30 M
onth
s0
0.0
11.
11
2.0
21.
1
36 M
onth
s1
2.0
00.
00
0.0
10.
5
TO
TA
L50
100.
091
100.
049
100.
019
010
0.0
Tra
inin
g in
stitu
tions
cat
egor
ized
bas
ed o
n nu
mbe
r of
inte
rnal
med
icin
e re
side
ncie
s:T
ype
I =
1 to
15;
Typ
e II
= 1
6 to
41;
Typ
e II
I =
42
and
over
.U
sual
mon
ths
prov
ided
by
the
inst
itutio
n.
Sour
ce: 4

Ch:.;
11V;
Lakalgay..1211002111C-IetMigiliigi
Electrocardiography
Phonocardlography
Echocardiography
Exercise tolerance testing
Vectorcardiography
Anglography: cardiac
Anglography: coronary
Angicgraphy: peripheral
Cardiac catheterization
Pacemaker insertion
Pacemaker follow-up
Swan -Ganz right heart catheterization
TA
BL
E 1
00
CARDIOVASCULAR
TR
AIN
ING
PR
OG
RA
M S
IMI
EC
T A
RE
AS
AN
D E
XPE
RIE
NC
CS:
ram
BY
IT
EM
RE
SPO
NSE
PERCENTAGE DISTRUHITION FOR PARTICIPATING ENSTITITTIONS BY PROGRAM LENGTH
Cardiovascular Training Program
Subject Areas and Experiences
Experience in Clinical Care. )eseerch,
rond Teaching
Cardiac patient care:
pediatric
Cardiac patient care:
medical
Cardiac patient care;
surgical
Cardiovascular research: basic
Cardiovascular research: clinical
Teaching:
clinical
Teaching:
didactic
Ialxxatory and Classroom Instructio
0(Trainees
CV anatomy
CV physiology
CV
biochemistry
CV pathology
CV epidemiology
CV
;Aor
tae c
olcqy
CV radiology
Pulmonary physiology
Hypertensive renal
dise
ase
Peripheral vascular disease
Cerebral vascular disease
Iliostotistics
Bioengineering
PROGRAM LENGTH
Imes than 24 Months (31.51)
..124 Months
or M
ore
(N.1
39)
No Response
Che
ck O
nly
Hou
rs R
'coe
d ad
No Response
Ohr
e( O
nly
N
Hou
rs R
ecor
ded
21
41.2
917.6
11
41.2
69
49.6
28
20.1
42
30.2
59.8
11
25.5
33
64.7
17
12.2
40
28.8
82
59.0
24
47.1
11
21.6
16
31.4
41
29.5
27
19.4
71
51.1
37
72.5
10
19.6
47.8
71
51.1
39
28.1
29
20.9
16
31.4
12
23.5
23
45.1
25
18.0
46
33.1
68
48.9
713.7
13
25.5
31
60.8
19
11.7
37
26.6
83
59.7
11
21.6
12
23.5
28
54.9
28
20.1
42
30.2
69
49.6
23.9
14
27.5
35
68.6
14
10.1
39
28.1
86
61.9
47.9
15
29.4
32
62.7
15
10.8
37
26.6
87
62.6
26
51.0
713.7
IS
35.3
57
41.0
25
18.0
57
41.0
59.8
15
29.4
31
60.8
22
15.8
38
27.3
79
56.8
10
19.6
17
33.3
24
47.1
36
25.9
32
23.0
71
51.1
11
21.6
16
31.4
24
47.1
15
10.8
43
30.9
81
58.3
14
27.5
14
27.5
23
45.1
19
13.7
43
30.9
77
55.4
34
66.7
B15.7
917.6
90
64.7
17
12.2
32
23.0
12
23.5
14
27.5
25
49.0
13
9.4
38
27.3
85
66.3
611.8
15
29.4
30
58.8
16
11.5
41
29.5
82
59.0
611.8
15
29.4
30
58.8
24
17.3
43
30.9
72
51.8
20
39.2
16
31.4
15
29.4
10
21.6
4521
.464
46.0
2243.1
12
23.5
17
33.3
62
44.6
27
19.4
50
36.0
17
33.3
13
25.5
21
41.2
40
28.8
31
22.3
68
48.9
28
54.9
917.6
14
27.5
77
55.4
22
15.8
40
25.8
20
39.2
10
19.6
21
41.2
45
32.4
27
19.4
67
48.2
34
66.7
815.7
917.6
93
66.9
17
12.2
29
20.9
20
39.2
II
21.6
20
Z9.2
62
44.6
24
17.3
53
38.1
21
41.2
10
19.6
20
39,2
50
36.0
29
20.9
60
43.2
22
43.1
II
21.6
18
35.3
71
51.1
25
20.1
40
28.8
24
47.1
10
19.6
17
33.3
72
51.8
26
18.7
41
29.5
30
58.5
917.6
12
21.5
93
66.9
181Z.9
28
20.1
33
64.7
$15.7
IO
19.6
101
72.7
17
12.2
21
is.r
46
90.2
47.8
I2.0
103
74.1
13
9.4
23
16.5
44
86.3
35.9
47.8
103
74.1
14
10.1
22
15.8
Sour
ce: 4

318
TABLE 101
CARDIOVASCULAR TRAINING PROGRAM SUBJECT AREAS ANDEXPERIENCES: AVERAGE HOTTRS AND PERCENT OF TOTAL IN
SUBJECT AREAS BY USUAL MONTHS FOR TOTAL PROGRAM
Cardiovascular Training Program SubjectAreas and Experiences
Less than 24 Months(N=S1)
24 Months or More(N=139)
X Hours X Hours
A. Clinical Care, Research and Teaching
Patient Care - Medical 947.4 26.1 1140.2 21.8Patient Care - Other 311.4 8.6 488.1 9.3Research - Basic and Clinical 398.6 10.9 734.7 14.1Teaching - Clinical ar d Didactic 254.7 7.0 409.5 7.8
Subtotal 1912.1 52.7 2772.5 53.0AMI014111MiiiMiliiIMMEMIIMMINNIMEmhIM1111i
13. Laboratory Diagnostic Techniques
Cardiac Catheterization andAngiography 676.7 18.6 973.5 18.6
Electrocardiogram 336.9 9.3 330.7 6.3Non-Invasive Testing
(PCG, Echo, Exercise Test, VCG) 295.4 8.1 451.3 8.6Pacemaker 114.5 3.2 154.4 3,0Swan-Ganz Catheterization 26.7 0.7 58.7 1,1
Subtotal 1450.2 39.9 1968.6 37.6
C. Formal Instruction for Trainees
Subtotal 268.4 7.4 494.4 9.4
TOTAL 3630.7 100.0 5235.5 100.0
Source: 4
321.

FIGU
RE
2R
EQ
UIR
ED
HO
UR
S IN C
LIN
ICA
L C
AR
E, R
ESE
AR
CH
AN
D T
EA
CH
ING
BY
PRO
GR
AM
LE
NG
TH
(.9
4±-
CP
C P
ED
IAT
RIC
ILI
OaC
PC
ME
DIC
AL
CP
C S
UR
GIC
AL
cxto
exB
AS
IC R
ES
EA
RC
HN
J
ex
UC
LNIC
AL R
ES
EA
RC
H
U
CU
NIC
AL T
EA
CH
ING
U
DID
AC
TIC
TE
AC
HIN
G
uia_
Source: 4
0
Frq P
RO
GR
AM
LES
S T
HA
NF
:; 24 MO
NT
HS
(N1251)
PR
OG
RA
M 24 M
ON
TH
SO
R M
OR
E (N
=139)
100200
360400
/196'0
1000 11001100
AV
ER
AG
E H
OU
RS
RE
QU
IRE
D

RE
QU
IRE
D T
IME
IN L
A
PAC
EM
AK
ER
INSE
RT
ION
FIGU
RE
3
TO
RY
DIA
GN
OST
IC T
EC
HN
IQU
ES B
Y L
EN
GT
H O
F PRO
GR
AM
CA
TH
ET
ER
IZA
TIO
N
--fAreW
/r/VS
.,A
NG
0GR
ApH
y.
7/0
VE
CT
CR
CA
RD
IOG
RA
PHY
EX
ER
CISE
TO
LE
RA
NC
E T
EST
ING
"""
EC
HO
CA
RD
ioGR
ApH
y
PIS:INC
:CA
RD
OG
RA
PHY
EI.E
CT
RO
CA
RD
IOG
RA
PHY
Source: 4
PRO
GR
AM
LE
SS TH
AN
24 MO
NT
HS (N
=51)
PRO
GR
AM
24 MO
NT
HS
OR
MO
RE
(N2139)
100200
300400
500600
AV
ER
AG
E H
OU
RS
RE
QU
IRE
D
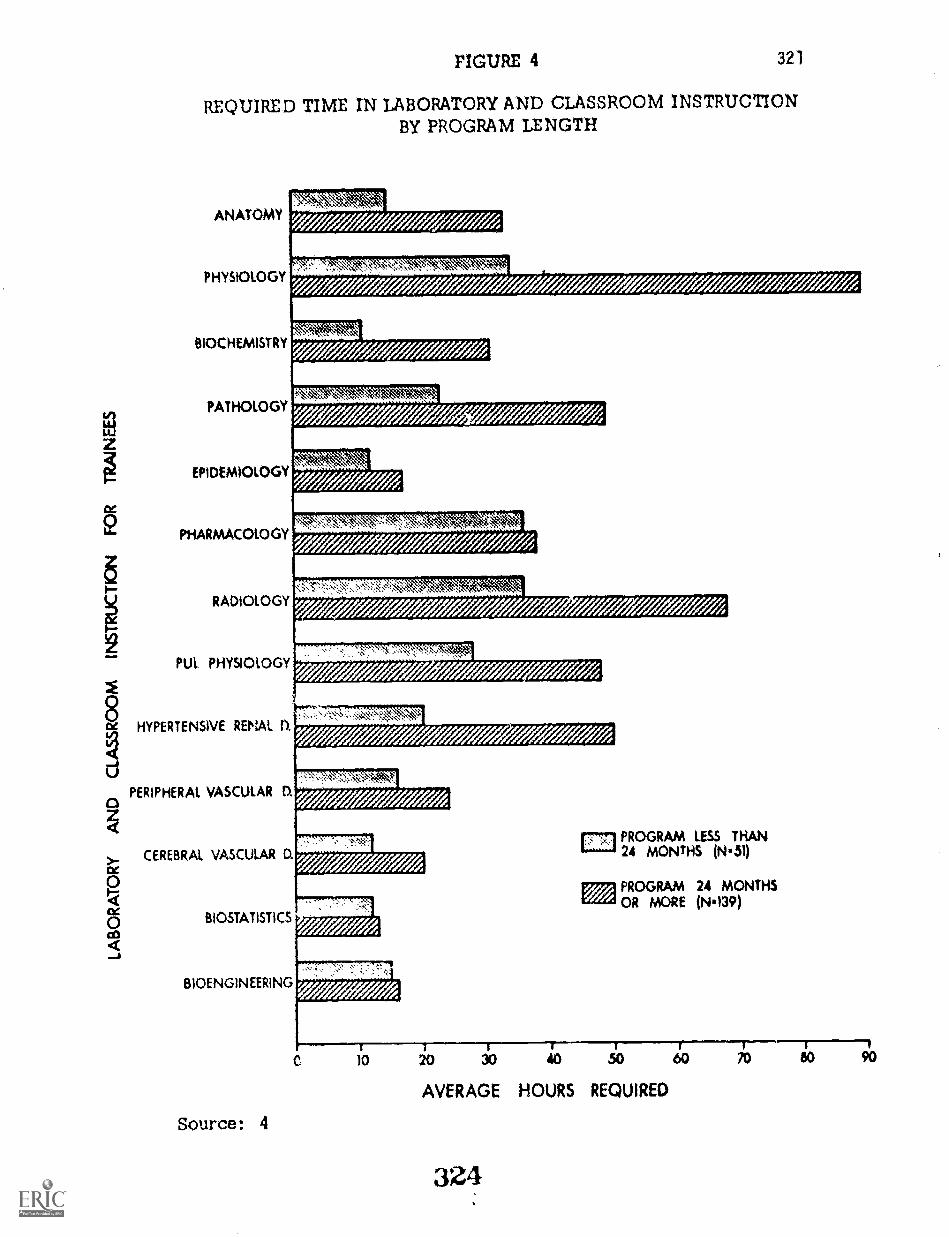
FIGURE 4 321
REQUIRED TIME IN LABORATORY AND CLASSROOM INSTRUCTIONBY PROGRAM LENGTH
ANATOMY
PHYSIOLOGY
BIOCHEMISTRY
PATHOLOGY
EPIDEMIOLOGY
PHARMACOLOGY
RADIOLOGY
PUL PHYSIOLOGY
HYPERTENSIVE RENAL O.
PERIPHERAL VASCULAR D.
CEREBRAL VASCULAR D.
BIOSTATISTICS
BIOENGINEERING
Source: 4
ffe
4
4-7-7-77-77-1
C
PROGRAM LESS THAN24 MONTHS (N'51)
PROGRAM 24 MONTHSOR MORE (N'139)
40 SO 40 510 60
AVERAGE HOURS REQUIRED
324
70 80 90

322
MANPOWER PROTECTIONS
Factors considered in preparing the manpower estimates for cardiologists inactive practice at year-end 1973 are discussed in Chapter Two, pages 78through 80. Those related to projections of need from year-end 1971 throughyear-end 1976 are discussed in detail in Chapter Seven.
lvianpower Needs for Year-End_1976
The active cardiologist manpower estimate of 10,691 at year-end 1971 must beadjusted to reflect (1) population growth rate estimates, (2) known and projectedgraduates from,cardiovlscular disease training programs and (3) death andretirement rates associated with physician age groups.
Population growth of 1 percent per year is a current planning assumption. Theprobable graduates each year from cardiovascular training programs were ob-tained from program directors through the Cardiovascular Training ProgramsSurvey. The factors associated with phl sician deaths and retirement werecalculated from data abstracted from Blumberg's study'. A final factor whichentered the equation was the possible expansion to training programs as in-dicated by training program directors.
Tables 102 and 103 provide statistics regarding changes in the cardiologistpopulation for the time period 1972 through 1976 and 1977 through 1981 res-pectively.
Manpower to Achieve a Ratio of 6.0 _p pr 100,000 Population
Chapter Seven presents a summary table for the effects on each of the censusdivisions if an objective of 6.0 per 100,000 population within five years isadopted. Table 104 indicates the numbers within the Primary Cardiologist andSecondary Cardiologist groups needed by geographic area to achieve this ratio.
Manpower at Year-End 1973
Using the data contained in Table 102, as well as known graduates fromtraining programs as indicated in Table 94, gives an estimate of approximately11,768 cardiologists at year-end 1973. The assumption here is that thegraduates of two program years (1971-72 and 1972-73) will be in active practiceand that the loss rates (described above) will apply.
1 Blumberg, Mark S., Trends and Projections of Physicians in the UnitedStates 1967-2002. Carnegie Commission on Higher Education, 1971.
325

323
TABLE 102
CARDIOLOGISTS ACTIVE ON DECEMBER 31, 1971:PROPORTION OF CARDIOLOGISTS ACTIVE IN 1972
AND ACTIVE THROUGH 1976
AgeGroups
Numberin
GrouplProportion
Living2NumberLiving
ProportionActive2
TotalActive
NetLosses
25-29 76 .9964 76 .996 75 1
30-34 982 .9875 970 .995 965 17
35-39 1689 .9835 1661 .994 , 1651 38
40-44 1630 .9687 1579 .992 1566 64
45-49 1604 .9457 1517 .990 1501 103
50-54 1311 .9411 1234 .988 1219 92
55-59 1039 .9111 947 .979 927 112
60-64 986 - .8676 855 .953 814 172
65-69 597 .8152 487 .878 427 170
70-74 344 .7175 247 .789 194 150
75 + 215 .5039 108 .662 3_
Total 10473 9681 9410 1063
1218 with no age data = 2.0 percent2"Trends and Projections of Physicians in the United States 1967-2002, " Mark S.
Blumberg, Carnegie Commission on Higher Education, 1971,326

324TABLE 103
CARDIOLOGISTS ACTIVE ON DECEMBER 31, 1971:PROPORTION OF CARDIOLOGISTS ACTIVE IN 1977
AND ACTIVE THROUGH 1981
AgeGroups
Numberin
GrouplProportion
Living2NumberLiving
ProportionActive2
TotalActive
NetLosses
25-29 -0- -0- -0- -0- -0- -0-
30-34 75 .9875 74 .995 74
35-39 965 .9835 949 .994 943 22
40-44 1651 .9687 1599 .992 1586 65
45-49 1566 .9457 1481 .990 1466 100
50-54 1501 .9411 1413 .988 1396 105
55-59 1219 .9111 1111 .979 1088 108
60-64 927 .8676 804 .953 766 161
65-69 814 .8152 664 .878 583 231
70-74 427 .7175 306 .789 241 186
75+ 265 .5039 134 .662 89 176\.
Total 9410 8535 8232 115 4......-
1218 with no age data = 2.0 percent2"Trencis and Projections of Physicians in the United States 1967-2002," Mark S.Blumberg, Carnegie Commission of High cation, 1971.

TA
BL
E 1
04
CA
RD
IOL
OG
IST
S B
Y P
RIM
AR
Y A
ND
SE
CO
ND
AR
Y S
PEC
IAL
TY
BY
CE
NSU
SD
IVIS
ION
NE
ED
ED
TO
AC
HIE
VE
NA
TIO
NA
L A
VE
RA
GE
S O
F 6.
0 PE
R 1
00 1
.000
POPU
LA
TIO
N(P
OPU
LA
TIO
N A
T D
EC
EM
BE
R 3
1, 1
971:
206
MIL
LIO
N)
Cen
sus
Div
isio
n
Prim
ary
Seco
ndar
yT
otal
Has
Nee
dsH
asN
eeds
Has
Rat
ioR
atio
Rat
ioR
atio
Rat
io
Num
ber
Nee
ded
New
Eng
land
11,8
41,6
33C
r;M
iddl
e A
tlant
ic37
,199
,040
Sout
h A
tlant
ic30
,671
,337
Eas
t-So
uth
Cen
tral
12,8
03,4
70W
est-
Sout
h C
entr
al19
1.32
0,56
0E
ast-
Nor
th C
entr
al40
,252
,476
Wes
t-N
orth
Cen
tral
16,3
19,1
87M
ount
ain
8,28
1,56
2Pa
cifi
c26
,522
,631
Car
ibbe
an
Mili
tary
462
3.9
371
3.1
833
7.0
1570
4.2
1428
3.8
2998
8.0
919
3.0
620.
285
42.
817
735.
862
163
1.3
244
1.9
155
1.2
205
1.6
318
2.5
449
379
2.0
232
1.2
304
1.6
232
1.2
683
3.6
464
796
2.0
483
1.2
742
1.8
403
1.0
1538
3.8
886
273
1.7
245
1.5
284
1.7
180
1.1
557
3.4
425
199
2.4
660.
813
81.
791
1.1
337
4.1
157
827
3.1
260.
169
62.
653
0.2
1523
5.7
79
6538
820
Num
ber
Nee
ded
1358
1164
2522

326
giaiologiets Certified by the Sybpnecteltv Board in Cardionsoular Disease
The Initial Cardiology Survey identified 9.6 percent with Certification in Cardio-vascular Disease, whereas the final cardiology survey (Cardiologists' TrainingQuestionnaire) indicated a percentage of 15.0 with this certification.
The differences in the two estimates are largely explained by recognizing that(1) the first survey in 1971 included active cardiologists regardless of the amountof time that they had been active and (2) the second survey in 1973 went to apopulation which had not had new personnel added to it for two years and hadexperienced losses related to retirement and death. In essence, the two popu-;lations were not identical in all respects. Analysis of whether or not thereare differences, and what the actual number of certified cardiologists mightbe must consider the following:
o The cardiologist population must be adjusted to year-end1973 - including both new cardiologists and populationlosses - yielding a new active total of 11,768.
o Subspecialty Board Certification actions added 203 to thetotal certified in December, 1971. The 982 known certifiedwould thus increase to 1,185.
The percentage of cardiologists who are Subspecialty Board Certified in Cardio-vascular Disease Is 10.1 with the adjustments just described. A differencebetween a percentage of 9.6 and 10.1 is considered neglible and quite possiblyis attributable to the reliability of data sources entering into those estimates.The conclusion is that there has been little change in this percentage and thatthe data presented throughout the report regarding this level of certification canbe used with conficence.
Number of Cardiolocietikard CertifiedLin Internal Medicine at Year-End 1973
This is more difficult to estimate because of many unknowns regarding actualcertifications for cardiologists as opposed to the total who are certified in thisspecialty. However, certain assumptions can be made to assist in an estimate:
o Approximately 30 percent of the physicians Certified in InternalMedicine can be classified as either Primary Cardiologists orSecondary Cardiologists.
o About 58000 physicians were certified in Internal Medicine in1971 and 1972. Cardiologists (30 percent of internists) mightaccount for as many as 1,500 of these Internal MedicineCertifications.
o About 3,850 Internal Medicine Certifications were granted in
329

327
1972. Cardiologists could account for 1,155 of these.
o The year-send 1971 cardiologist population had 10,691 memberswith 5,626 02.6 percent) certified in Internal Medicine.
o The year-end 1973 cardiologist population could have as manyas 6,900 (58.8 percent) Internal Medicine Certified.
o If we assumed that none of the 1971 certified was included inthe records used to,describe the year-end 1971 population,then as many as 7,100 (60.5 percent) might be Internal MedicineCertified.
This analysis leads to the conclusion that the most likely percentage who willbe Board Certified in Internal Medicine at year end 1973 is 60 percent. Thisrepresents an increase of about 3 percent per year over the two year time period.
Regarding the responses to the Cardiolosist Training Questionnaire, the conclusionis that here, too, the respondents "over-interpreted" and reported board eligiblestatus as well as board certified. Specifically, the over-reporting of 66,0 per-cent compared to 60.0 percent introduces an error of 6.0 percent to the collectivetotal,
Effect of the increased Certification in Internal Medicine study conclusions willfortunately be quite minor. This is because when the analysis vrias limited toPrimary Cardiologists, no important differences were fouill in any instanceswhere board certification was a factor. Only Cardiovascular Disease Certificationwas found to have an important effect on activities; and the analyses regardingproportions who have this certification status concluded with no important changesin percentages certified.
NEEDS FOR THE FUTURE
There are many factors which should enter into a comprehensive manpower pro-jection equation. Some are relatively simple to postulate; others are beyondthe scope of this study. Projections made for this report were limited to ratiosof manpower to population.
Factors which should be taken into account include the following:
o Is there evidence to support the hypothesis that selectedcardiovascular disease conditions are correlated withculturally produced factors, 1.e., population density,environmental stresses and/or environmental pollution? Ifthe answer is yes, t'en wherever such conditions can beisolated, the manpower-need projection should take thesefactors into account. ado
sai

328
o It is known that most cardiac disease conditions increase inincidence with the age of the individual(s). Differentialpopulation age composition, where known, should be recog-nized in the needs equation.
o It is known that certain cardiovascular disease conditionsoccur with greater frequency among males than females andwithin specific age groups. Sex and age factors should betaken into account if there is evidence of differential ratesin specific geographical areas.
o Unmet needs for cardiovascular disease care can be estimatedfrom analysis of those which are actually met. Voluminousdata of this type were obtained through the Professional Diarystudy. Assuming it is possible to postulate a percentage ofunmet needs based on those which have been and are beingmet, one can estimate the incremental increase in qualifiedcardiologists which would be required to meet all needs.The most difficult parameter in this estimate is the onewhich indicates "these are the things which cardiologisttype one, cardiologist type two, etc., should do..."
o Inequalities in ratios of both Primary and Secondary Cardi-ologists to population can be measured; and, based on theassumption that a particular ratio is minimum, the requte-ment to bring all areas of the country up to a st-ndard canbe computed. This technique has been used in this report.
o Demand for new and/or increased numbers of cardiologistswill have a direct impact on the numbers who are requiredfor (1) basic research and (2) teaching new cardiologists.The survey addressed to training institutions gives dataregarding training directors perceptions of (1) current un-filled needs and (2) additional staff required to be responsiveto anticipated demands, The current filled needs-estimatesare probably not debatable and thus sly ad enter the needsequation as stated. The future needs, however, representtraining directors assessments of the volume which they willbe asked to assume in the near future and, hence, are likelycolored by their perception of demand rather than actual need.Such future prediction should not be totally ignored; rather,they should be considered as one element of many which enterthe qualitative judgment regarding manpower needs . This wasdone in this report.
o Changing the access patterns for health care through suchtechniques as national health insurance will have a profoundeffect on manpower; no longer will it be a question of can
331

329
the individual obtain the economic resources to elicit andreceive his needed care. The research aspects of this studydid not look into possible effects of such a change.
o Changing the method of payment to the physician (as well asthe demands on his time) would have a significant effect onwhat was actually done. This study did not look into alternativehealth service delivery modalities. However, it is known thatin systems such as are found in New Zealand, England andScandinavia, ratios of physicians to population are quite dif-ferent from those in the United States.
o Effective time to cardiology for each of the types of cardiologistidentified in this study could easily be calculated by using theproportions identified through the Initial Cardiology Survey andfurther refined in the Cardiology Professional Diary study. Suchratios or proportions could utilize the proportion of total timein selected activities as well as the focus of that time onspecific types of activity. In patient care, for example, theprofile of patient problems &een and treated could be part ofthe time-activity analysis. This was not done for this reportbecause of funding limitations.
o Changing national health objectives could have a major impacton manpower. The estimates of need which have been made bythe project staff have been based on providing an equitabledistribution of today's type of cardiovascular disease care,by making the numbers of trained cardiologist required toachieve this equality available. For example, if "majorattacks" on cardiovascular disease prevention and/or iso-lation of all early stage hypertension cases were a goal, thenthe numbers of cardiologists postulated to achieve nationalequality in ratios to population might not be enough. The"state of the art" in cardiovascular disease care potential hasnot been taken into account in DRME's work but should, inour opinion, enter into the future plans for both acquisitionof and location of cardiologists of each specialty and practicetype.
o Changing the approach to health care services delivery couldalter the numbers required and the training which is given tothe cardiologists who would be members of the alternativedelivery systems. Greater efficiency and service effectiveness*,rough alternative delivery modes is possible. This study
not make an in-depth analysis of either existing deliverys, within the United States or known or postulated delivery
332

330
modes from other areas. A fruitful analysis in this area, nowthat a very extensive statistical data base regarding theprincipal facets of cardiovascular care has been created,would be a productive next step.
SUMMARY AND RECOMMENDATIONS
An extensive and comprehensive study of adult cardiologists has been completed.As voluminous as this reports has been, it has selected only those data deemedmost important in meeting the Advisory Committee's responsibilities. Themost pertinent point to make is that once these data have been analysed byresponsible organizations and individuals, the value of looking deeper in anyone of the study's data files will become known. Other analyses are possibleand may well be desirable. Through communication to the senior authors ofthis report and to the NHLI, the practicality of such analyses may be determined.Obviously, further analyses would involve time, money and people and wouldtherefore be done only if the NHLI or other funding source chose to sponsorthem.
333GPO 871.975
Copyright © 2022 FDOKUMEN