European Society of Cardiology: cardiovascular disease ...
84
............................................................................................................................................................................... European Society of Cardiology: cardiovascular disease statistics 2021 Adam Timmis (Chair Writing Group) 1 *, Panos Vardas 2,3 , Nick Townsend 4 , Aleksandra Torbica 5 , Hugo Katus 6 , Delphine De Smedt 7 , Chris P. Gale 8 , Aldo P. Maggioni 9 , Steffen E. Petersen 1 , Radu Huculeci 3 , Dzianis Kazakiewicz 3 , Victor de Benito Rubio 3 , Barbara Ignatiuk 10 , Zahra Raisi-Estabragh 1 , Agnieszka Pawlak 11 , Efstratios Karagiannidis 12 , Roderick Treskes 13 , Dan Gaita 14 , John F. Beltrame 15 , Alex McConnachie 16 , Isabel Bardinet 17 , Ian Graham 18 , Marcus Flather 19 , Perry Elliott 20 , Elias A. Mossialos 21 , Franz Weidinger 22 , Stephan Achenbach 23 , and Atlas Writing Group 1 William Harvey Research Institute, Queen Mary University London, London, UK; 2 Hygeia Hospitals Group, HHG, Athens, Greece; 3 European Heart Agency, European Society of Cardiology, Brussels, Belgium; 4 Department for Health, University of Bath, Bath, UK; 5 Centre for Research on Health and Social Care Management (CERGAS), Bocconi University, Milan, Italy; 6 Department of Internal Medicine and Cardiology, University of Heidelberg, Heidelberg, Germany; 7 Department of Public Health, Ghent University, Ghent, Belgium; 8 Medical Research Council Bioinformatics Centre, Leeds Institute for Cardiovascular and Metabolic Medicine, University of Leeds, Leeds, UK; 9 Research Center of Italian Association of Hospital Cardiologists (ANMCO), Florence, Italy; 10 Division of Cardiology, Ospedali Riuniti Padova Sud, Monselice, Italy; 11 Mossakowski Medical Research Centre Polish Academy of Sciences, Warsaw, Poland; 12 First Department of Cardiology, AHEPA University Hospital, Aristotle University of Thessaloniki, Thessaloniki, Greece; 13 Department of Cardiology, Leiden University Medical Center, Leiden, The Netherlands; 14 Universitatea de Medicina si Farmacie Victor Babes, Institutul de Boli Cardiovasculare, Timisoara, Romania; 15 University of Adelaide, Central Adelaide Local Health Network, Basil Hetzel Institute, Adelaide, Australia; 16 Robertson Centre for Biostatistics, University of Glasgow, Glasgow, UK; 17 European Society of Cardiology, Sophia Antipolis, France; 18 Tallaght University Hospital, Dublin, Ireland; 19 Norwich Medical School, University of East Anglia, Norwich, UK; 20 Institute of Cardiovascular Science, University College London, London, UK; 21 Department of Health Policy, London School of Economics, London, UK; 22 Department of Internal Medicine and Cardiology, Klinik Landstrasse, Vienna, Austria; and 23 Friedrich-Alexander-Universität Erlangen-Nürnberg, Erlangen, Germany Received 13 September 2021; revised 7 December 2021; accepted 16 December 2021 Aims This report from the European Society of Cardiology (ESC) Atlas Project updates and expands upon the widely cited 2019 report in presenting cardiovascular disease (CVD) statistics for the 57 ESC member countries. Methods and results Statistics pertaining to 2019, or the latest available year, are presented. Data sources include the World Health Organization, the Institute for Health Metrics and Evaluation, the World Bank, and novel ESC sponsored data on human and capital infrastructure and cardiovascular healthcare delivery. New material in this report includes socio- demographic and environmental determinants of CVD, rheumatic heart disease, out-of-hospital cardiac arrest, left- sided valvular heart disease, the advocacy potential of these CVD statistics, and progress towards World Health Organization (WHO) 2025 targets for non-communicable diseases. Salient observations in this report: (i) Females born in ESC member countries in 2018 are expected to live 80.8 years and males 74.8 years. Life expectancy is longer in high income (81.6 years) compared with middle-income (74.2 years) countries. (ii) In 2018, high-income countries spent, on average, four times more on healthcare than middle-income countries. (iii) The median PM 2.5 concentrations in 2019 were over twice as high in middle-income ESC member countries compared with high-in- come countries and exceeded the EU air quality standard in 14 countries, all middle-income. (iv) In 2016, more than one in five adults across the ESC member countries were obese with similar prevalence in high and low-income countries. The prevalence of obesity has more than doubled over the past 35 years. (v) The burden of CVD falls hardest on middle-income ESC member countries where estimated incidence rates are 30% higher compared with high-income countries. This is reflected in disability-adjusted life years due to CVD which are nearly four times * Corresponding author. Email [email protected] © The European Society of Cardiology 2022. All rights reserved. For permissions please email: [email protected] European Heart Journal (2022) 00,1–84 https://doi.org/10.1093/eurheartj/ehab892 SPECIAL ARTICLE Downloaded from https://academic.oup.com/eurheartj/advance-article/doi/10.1093/eurheartj/ehab892/6472699 by guest on 12 January 2022
-
Upload
khangminh22 -
Category
Documents
-
view
4 -
download
0
Transcript of European Society of Cardiology: cardiovascular disease ...

. . . . . . . . . . . . . . . . . . . . . . . . . . . . . . . . . . . . . . . . . . . . . . . . . . . . . . . . . . . . . . . . . . . . . . . . . . . . . . . . . . . . . . . . . . . . . . . . . . . . . . . . . . . . . . . . . . . . . . . . . . . . . . . . . . . . . . . . . . . . . . . . . . . . . . . . . . . . . . . . . . . . . . . . . . . . . . .
European Society of Cardiology:cardiovascular disease statistics 2021Adam Timmis (Chair Writing Group) 1*, Panos Vardas2,3, Nick Townsend 4,Aleksandra Torbica 5, Hugo Katus6, Delphine De Smedt 7, Chris P. Gale 8,Aldo P. Maggioni9, Steffen E. Petersen 1, Radu Huculeci3, Dzianis Kazakiewicz3,Victor de Benito Rubio3, Barbara Ignatiuk10, Zahra Raisi-Estabragh 1,Agnieszka Pawlak11, Efstratios Karagiannidis 12, Roderick Treskes13,Dan Gaita14, John F. Beltrame15, Alex McConnachie 16, Isabel Bardinet17,Ian Graham18, Marcus Flather19, Perry Elliott 20, Elias A. Mossialos 21,Franz Weidinger22, Stephan Achenbach23, and Atlas Writing Group1William Harvey Research Institute, Queen Mary University London, London, UK; 2Hygeia Hospitals Group, HHG, Athens, Greece; 3European Heart Agency, European Society ofCardiology, Brussels, Belgium; 4Department for Health, University of Bath, Bath, UK; 5Centre for Research on Health and Social Care Management (CERGAS), Bocconi University,Milan, Italy; 6Department of Internal Medicine and Cardiology, University of Heidelberg, Heidelberg, Germany; 7Department of Public Health, Ghent University, Ghent, Belgium;8Medical Research Council Bioinformatics Centre, Leeds Institute for Cardiovascular and Metabolic Medicine, University of Leeds, Leeds, UK; 9Research Center of ItalianAssociation of Hospital Cardiologists (ANMCO), Florence, Italy; 10Division of Cardiology, Ospedali Riuniti Padova Sud, Monselice, Italy; 11Mossakowski Medical Research CentrePolish Academy of Sciences, Warsaw, Poland; 12First Department of Cardiology, AHEPA University Hospital, Aristotle University of Thessaloniki, Thessaloniki, Greece;13Department of Cardiology, Leiden University Medical Center, Leiden, The Netherlands; 14Universitatea de Medicina si Farmacie Victor Babes, Institutul de Boli Cardiovasculare,Timisoara, Romania; 15University of Adelaide, Central Adelaide Local Health Network, Basil Hetzel Institute, Adelaide, Australia; 16Robertson Centre for Biostatistics, Universityof Glasgow, Glasgow, UK; 17European Society of Cardiology, Sophia Antipolis, France; 18Tallaght University Hospital, Dublin, Ireland; 19Norwich Medical School, University of EastAnglia, Norwich, UK; 20Institute of Cardiovascular Science, University College London, London, UK; 21Department of Health Policy, London School of Economics, London, UK;22Department of Internal Medicine and Cardiology, Klinik Landstrasse, Vienna, Austria; and 23Friedrich-Alexander-Universität Erlangen-Nürnberg, Erlangen, Germany
Received 13 September 2021; revised 7 December 2021; accepted 16 December 2021
Aims This report from the European Society of Cardiology (ESC) Atlas Project updates and expands upon the widely cited2019 report in presenting cardiovascular disease (CVD) statistics for the 57 ESC member countries.
Methodsand results
Statistics pertaining to 2019, or the latest available year, are presented. Data sources include the World HealthOrganization, the Institute for Health Metrics and Evaluation, the World Bank, and novel ESC sponsored data onhuman and capital infrastructure and cardiovascular healthcare delivery. New material in this report includes socio-demographic and environmental determinants of CVD, rheumatic heart disease, out-of-hospital cardiac arrest, left-sided valvular heart disease, the advocacy potential of these CVD statistics, and progress towards World HealthOrganization (WHO) 2025 targets for non-communicable diseases. Salient observations in this report: (i)Females born in ESC member countries in 2018 are expected to live 80.8 years and males 74.8 years. Life expectancyis longer in high income (81.6 years) compared with middle-income (74.2 years) countries. (ii) In 2018, high-incomecountries spent, on average, four times more on healthcare than middle-income countries. (iii) The median PM2.5
concentrations in 2019 were over twice as high in middle-income ESC member countries compared with high-in-come countries and exceeded the EU air quality standard in 14 countries, all middle-income. (iv) In 2016, morethan one in five adults across the ESC member countries were obese with similar prevalence in high and low-incomecountries. The prevalence of obesity has more than doubled over the past 35 years. (v) The burden of CVD fallshardest on middle-income ESC member countries where estimated incidence rates are �30% higher comparedwith high-income countries. This is reflected in disability-adjusted life years due to CVD which are nearly four times
* Corresponding author. Email [email protected]© The European Society of Cardiology 2022. All rights reserved. For permissions please email: [email protected]
European Heart Journal (2022) 00, 1–84https://doi.org/10.1093/eurheartj/ehab892
SPECIAL ARTICLE
Dow
nloaded from https://academ
ic.oup.com/eurheartj/advance-article/doi/10.1093/eurheartj/ehab892/6472699 by guest on 12 January 2022
. . . . . . . . . . . . . . . . . . . . . . . . . . . . . . . . . . . . . . . . . . . . . . . . . . . . . . . . . . . . . . . . . . . . . . . . . . . . . . . . . . . . . . . . . . . . . . . . . . . . . . . . . . . . . . . . . . . . . . . . . . . . . . . . . . . . . . . . . . . . . . . . . . . . . . . . . . . . . . . . . . . . . . . . . . . . . . .
. . . . . . . . . . . . . . . . . . . . . . . . . . . . . . . . . . . . . . . . . . . . . . . . . . . . . . . . . . . . . . . . . . . . . . . . . . . . . . . . . . . . . . . . . . . . . . . . . . . . . . . . . . . . . . . . . . . . . . . . . . . . . . . . . . . . . . . . . . . . . . . . . . . . . . . . . . . . . . . . . . . . . . . . . . . . . . .
as high in middle-income compared with high-income countries. (vi) The incidence of calcific aortic valve disease hasincreased seven-fold during the last 30 years, with age-standardized rates four times as high in high-income comparedwith middle-income countries. (vii) Although the total number of CVD deaths across all countries far exceeds thenumber of cancer deaths for both sexes, there are 15 ESC member countries in which cancer accounts for moredeaths than CVD in males and five-member countries in which cancer accounts for more deaths than CVD in fe-males. (viii) The under-resourced status of middle-income countries is associated with a severe procedural deficitcompared with high-income countries in terms of coronary intervention, ablation procedures, device implantation,and cardiac surgical procedures.
Conclusion Risk factors and unhealthy behaviours are potentially reversible, and this provides a huge opportunity to address thehealth inequalities across ESC member countries that are highlighted in this report. It seems clear, however, thatefforts to seize this opportunity are falling short and present evidence suggests that most of the WHO NCD targetsfor 2025 are unlikely to be met across ESC member countries.
- - - - - - - - - - - - - - - - - - - - - - - - - - - - - - - - - - - - - - - - - - - - - - - - - - - - - - - - - - - - - - - - - - - - - - - - - - - - - - - - - - - - - - - - - - - - - - - - - - - - - - - - - - - - - - - - - - - - - - - - - - - - - - - - - - - - - - - - - - - - - - - - - - - - - - - - - -
Graphical Abstract This 2021 report from the ESC Atlas Project provides contemporary cardiovascular disease (CVD) statistics for 57ESC member countries. It builds on the 2017 and 2019 reports with presentation of new data on sociodemographic and environmentaldeterminants of CVD. Huge inequalities in disease burden persist between high-income and middle-income ESC member countries andacross all member countries evidence suggests that most of the World Health Organization noncommunicable disease targets for 2025are unlikely to be met. Advocacy to increase awareness of policy makers, members of the public and other stakeholders about the continu-ing importance of CVD as the leading cause of death among ESC member countries is a responsibility for all who are involved in cardio-vascular research and healthcare.
Keywords Cardiovascular disease • Statistics • European Society of Cardiology • Health infrastructure • Service provision •
Risk factors • Mortality • Morbidity
2 A. Timmis et al.D
ownloaded from
https://academic.oup.com
/eurheartj/advance-article/doi/10.1093/eurheartj/ehab892/6472699 by guest on 12 January 2022
AbbreviationsAED Automatic external defibrillatorABI Ankle–brachial indexAMI Acute myocardial infarctionASMR Age-standardized mortality rateAF Atrial fibrillationAVD Aortic valve diseaseBMI Body mass indexCABG Coronary artery bypass graftCHD Coronary heart diseaseCHE Current healthcare expenditureCOI Cost of illnessCRT-P Cardiac resynchronization pacemaker
(‘biventricular pacemaker’)CRT-D Cardiac resynchronization pacemaker with
implantable cardioverter defibrillatorCVD Cardiovascular diseaseDALYs Disability-adjusted life yearsDb[A] A-weighted decibels€ EuroEHN European Heart NetworkEHRA European Heart Rhythm AssociationESC European Society of CardiologyESP European Standard PopulationEU European UnionEuReCa European Registry of Cardiac ArrestEHN European Heart NetworkFAO Food and Agriculture Organization of the United
NationsGBD Global burden of diseaseGDP Gross domestic productGNI Gross national incomeHEDIC Health Expenditures by Diseases and ConditionsHIC High-income countriesICD Implantable cardioverter-defibrillatorIHD Ischaemic heart diseaseIHME Institute for Health Metrics and EvaluationIQR Inter-quartile rangeLVAD Left ventricular assist deviceMIC Middle-income countriesMVD Mitral valve diseaseNCDs Noncommunicable diseasesNCD-RisC Noncommunicable Diseases Risk Factor
CollaborationNCS National cardiac societiesNHS National Health ServiceOECD Organisation for Economic Co-Operation and
DevelopmentOHCA Out-of-hospital cardiac arrestPAD Peripheral arterial diseasePCI Percutaneous coronary interventionPM2.5 Particulate matter ≤2.5 μm in diameterPPP Purchasing power parityPPB Parts per billionPVD Peripheral vascular disease
PYLL Potential years of life lostSES Socioeconomic statusSHA System of Health AccountsTAVI Transcatheter aortic valve implantationUK UKUSA USAUSD US dollarsWB World BankWHO World Health Organization
Executive summaryThis third report from the European Society of Cardiology (ESC)Atlas Project updates and expands upon the 2019 report in pre-senting cardiovascular disease (CVD) statistics for the 57 ESCmember countries.
Statistics pertaining to 2019, or the latest available year, are pre-sented—2020 COVID-19 pandemic data will be detailed in a laterreport.
New material in this report includes:
• Sociodemographic determinants of CVD• Environmental determinants of CVD• Rheumatic heart disease• Out-of-hospital cardiac arrest• World Health Organization (WHO) 2025 targets for noncom-municable diseases
• CVD advocacy roadmap
(1) European Society of Cardiology Atlas of Cardiology.The CVD statistics that constitute this report are drawn fromthe ESC Atlas of Cardiology (henceforth called the ESCAtlas) that is compiled and regularly updated by theEuropean Heart Agency in Brussels. Its key objectives are to:• Assess and compare CVD burden across ESC membercountries;
• Drive policy initiatives to help reduce inequalities in CVDburden;
• Map European CVD healthcare delivery;• Provide a one-stop source of CVD statistics for academics,clinicians, and other stakeholders.
(2) Data sources and presentation. The ESC Atlas is a repo-sitory of CVD data collected by groups such as the WHO,the Institute for Health Metrics and Evaluation (IHME), andthe World Bank (WB). It also includes novel ESC sponsoreddata on human and capital infrastructure and cardiovascular(CV) healthcare delivery obtained by bi-annual survey ofthe national CV professional societies of ESC membercountries.
Throughout this report, ESC member countries are categor-ized according to 2020 WB definitions as high-income andmiddle-income (a composite of lower-middle-income andupper-middle-income countries that includes Syrian ArabRepublic now designated as low-income) to permit stratifiedpresentations of CVD statistics by national income status.
European Society of Cardiology 3D
ownloaded from
https://academic.oup.com
/eurheartj/advance-article/doi/10.1093/eurheartj/ehab892/6472699 by guest on 12 January 2022

The data sources come with important limitations thatinclude:• adjustments to account for missing data applied by all dataproviders;
• differences in reporting practices causing variable precisionof national data estimates;
• misclassification bias due to miscoding of diagnostic groupsand death certificates;
• hidden within-country inequalities in disease burden andhealthcare delivery;
• aggregation of 2020 WB national classifications as detailedabove.The limitations as they apply to the quality, precision, and
availability of the data emphasize the need for agreed, stan-dardized data collection systems throughout the region.Meanwhile, cautious interpretation of the CVD statistics pre-sented in this report is recommended.
(3) National sociodemographic factors. Population ageingin high-income European countries, where fertility rateshave fallen below replacement levels, leads to sustainedhigh rates of CVD mortality. Populations are also ageing inmany middle-income countries as life expectancy increasesand this will exacerbate the growing burden of CVD.These epidemiological shifts are compounded by increasingurbanization across Europe which threatens CV health dueto overcrowding, air pollution, social deprivation, and stress.The growth of the elderly population across ESC membercountries increases the need for young immigrant groupsto supplement national workforces. Socioeconomic depriv-ation is common in these groups and is associated with arange of health inequalities such as hypertension, diabetes,and premature coronary heart disease. Health inequalitiesare also associated with other deprivation metrics includingunemployment and poor education which remain importantdrivers of ill health across all ESC member countries.
(4) Financial and economic burden of cardiovascular dis-ease. In order to meet the economic challenges of CVD,policymakers need access to reliable information aboutCVD healthcare costs and the broader impacts on nationaleconomies. Information is incomplete but shows that currenthealthcare expenditure (CHE) per capita varies widely, withhigh-income European countries spending four times moreon healthcare than many middle-income countries.Expenditure for CVD represents the highest component ofhealthcare cost, and in 2016 accounted for �16% of thespend in a selection of 11 high-income European countries.The European Heart Network has estimated that CVD coststhe EU economy more than €200 billion a year.
(5) Risk factors and health behaviours• Environmental risk factors. These include air pollutionand noise which account for over 75% of the CVD burdenattributable to the environment. In 2019, air pollution withparticulate matter ≤2.5 μm in diameter (PM2.5) exceededthe EU air quality standard in 14 middle-income countrieswhile noise exposure was estimated to exceed recom-mended residential limits in up to 40% of people living inthe EU.
• Health behaviours. Declines in the prevalence of smok-ing have made major contributions to CVD mortality re-ductions across ESC member countries but in manymiddle-income countries, where the prevalence of smok-ing among males remains high, declines in CVD mortalityhave been smaller. Physical inactivity (,150 min of moder-ate physical activity or ,75 min of vigorous physical activ-ity per week) affects an estimated one in three adults livingin ESC member countries and is more common in high-income compared with middle-income countries. Dietaryfactors associated with heightened CVD risk include trans-fatty acids and sugar, both of which are consumed in great-er quantity in high-income compared with middle-incomeESC member countries. High-income countries also con-sume larger amounts of sugar-sweetened beverages andlower amounts of vegetables and fruit.
• Clinical risk factors. Rates of elevated blood pressure(≥140/90 mmHg) across ESC member countries have de-clined by 35% in the last 35 years, but almost one in fourpeople remain affected. Systolic blood pressure is higherin males compared with females and in middle-incomecompared with high-income countries. During the last 40years, declines in total and non-HDL cholesterol concen-trations of about 15 and 20%, respectively, have been re-corded in high-income countries but in middle-incomecountries, where concentrations remain lower, littlechange has occurred. The prevalence of obesity (BMI≥30 kg/m2) has increased steeply across all ESC membercountries during the last 40 years and now affects morethan one in five adults. This has been associated with an in-creased prevalence of diabetes which, in 2019, affected 6.9and 5.8% of adults in middle-income and high-incomecountries. Obesity and diabetes have been describedas one of the biggest global health crises of the 21stcentury.
(6) Cardiovascular disease morbidity. During the last 30years, declines in the age-standardized incidence of CVDacross ESC member countries have been small and in sevenmiddle-income countries variable increases have been re-corded. Age-standardized incidence estimates for the majorcomponents of CVD, ischaemic heart disease (IHD) andstroke, were twice as high in middle-income comparedwith high-income countries and for IHD were also twice ashigh in males compared with females. For stroke, incidencerates were similar by sex. Incidence estimates for both disor-ders have declined by .25% during the last 30 years, predo-minately in high-income countries, but the continuing impactof IHD and stroke on population health remains devastatingfor both females and males with these disorders accountingfor an estimated 70 million disability-adjusted life years(DALYs) across ESC member countries in 2019. Rheumaticheart disease (RHD) is a disease of poverty driven by poorhousing and overcrowding and although incidence ratesacross ESC member countries have declined by �40%, inthe last 30 years, they remain twice as high in middle-incomecompared with high-income countries. Unlike RHD, calcificaortic valve disease has been recorded with increasing
4 A. Timmis et al.D
ownloaded from
https://academic.oup.com
/eurheartj/advance-article/doi/10.1093/eurheartj/ehab892/6472699 by guest on 12 January 2022
frequency in recent years, especially in high-income countrieswhere estimated incidence is four times higher comparedwith middle-income countries. The morbidity statistics re-corded in the ESC Atlas confirm persisting inequalities in dis-ease burden by sex and national income status. The statisticsemphasize the need for concerted application of CVD pre-vention policies, particularly in middle-income countrieswhere the need is greatest.
(7) Cardiovascular disease mortality. Death is one of themost accurately ascertained CVD outcomes and provides auseful measure of disease burden. CVD is the most commoncause of death in ESCmember countries with IHD accountingfor 45% of these deaths in females and 39% in males. The totalnumber of CVD deaths across all ESC member countries farexceeds thenumberof cancerdeaths for both sexes, but thereare 15 ESC member countries in which cancer accounts formore deaths than CVD in males and five-member countriesin which cancer accounts for more deaths than CVD in fe-males. All of these countries are classified as high income.There are large disparities between high- and middle-incomecountries in the proportion of premature deaths (,70 years)caused byCVD.Disparity is greater for females, with amedianof 36% of all premature deaths caused by CVD inmiddle-income countries compared with 16% in high-incomecountries. For males, the corresponding figures are 36 and24% in middle- and high-income countries, respectively.Age-standardized mortality rates (ASMRs) for CVD havebeen in decline since 1990 by 47% inmales and 42% in females.In high-income countries, reductions inASMRshave exceeded50% in both sexes but in middle-income countries, declineshave been smaller, not exceeding 15%, with some countriesexperiencing increases in ASMRs.
(8) Cardiovascular healthcare delivery. This ESC ATLASsurvey showed continuing heterogeneity in cardiological ser-vices in terms of human and capital resources and the deliv-ery of high-quality healthcare. Variation in the availability ofcardiologists suggests substantial under-provision in manycountries, with a notable sex imbalance (females comprisedfewer than a third of all cardiologists) potentially comprom-ising care quality. Middle-income member countries were of-ten under-resourced compared with high-income countrieswith numbers of cardiologists lower by a third, interventionalcardiologists lower by nearly a half, 24 h/7 day catheter la-boratory availability lower by a third and catheter labora-tories for treatment of structural heart disease lower bynearly two-fold. This structural deficit affecting personpower and facilities inevitably translated into a substantialprocedural deficit in middle-income compared with high-income countries in terms of coronary intervention, deviceimplantation, and cardiac surgical procedures. This mismatchbetween the therapeutic need of middle-income countriesand the available therapeutic resource requires actionthrough policy strategies to reduce the population burdenof CVD while increasing spending on human and capitalinfrastructure.
(9) World Health Organization noncommunicable dis-ease targets. The WHO has set noncommunicable disease
(NCD) targets relevant to global CV health to be achieved by2025 (with reference to 2010). The period 2010–2018 hasseen small declines in alcohol consumption across ESC mem-ber countries but our linear forecasts predict the WHO tar-get for a 10% relative reduction in harmful use of alcohol isunlikely to be met. Longitudinal data for smoking in ESCmember countries were patchy and incomplete but ap-peared to show a 20% decline in smoking prevalence acrossESC member countries between 2010 and 2018. This waslargely confined to high-income countries where our linearforecasts suggest the WHO smoking target will beachieved—yet, in middle-income countries, smoking preva-lence was higher and appeared to show little change be-tween 2010 and 2018. The WHO target for a 25%reduction in the prevalence of elevated blood pressure is un-likely to be met based on data for the period 2010–2015when the median prevalence of elevated blood pressureacross ESC member countries declined by only 3.4%.However, declines of .10% were recorded in females andmales living in high-income countries where our linear fore-casts suggest the WHO target is feasible if current trendscontinue. Analysis of paired 2010 and 2016 national datashowed a continuing upward trajectory in the prevalenceof obesity affecting .20% of people living in ESC membercountries, making it very unlikely the WHO call for a haltin the rise of obesity will be met by 2025. The WHO callfor a halt in the rise of diabetes will also not be met basedon data showing a nearly 30% increase in prevalence be-tween 2010 and 2015.
(10) The CVD advocacy roadmap.One hundred and thirteenmillion people across ESC member countries continue to livewith CVD. Notwithstanding declines in CVD mortality inmany countries, CVD remains the most common cause ofdeath within the region. Despite this, cancer is commonlyperceived as a more important health concern and attractsmore research funding compared with CVD. The ESC hascalled for advocacy programmes to inform policymakers ofthe societal harms of CVD and the need for targeted actionto reduce the burden of disease in those ESC member coun-tries where the burden is greatest. Five priorities have beenidentified in the ESC’s advocacy roadmap:• Changing popular perceptions of CVD to embrace the broadrange of disorders, including degenerative valve diseaseand congenital heart disorders, in order to better under-stand the need for new therapeutic strategies in advocatingfor patients living with non-preventable CVD.
• Making CVD a health priority, calling upon the voices of pa-tients and all stakeholders to be heard in bringing CVDonto the policy agendas of national decision-makers.
• Getting involved with decision-makers at the national level toestablish regional advocacy structures aimed at improvingCVD prevention and care.
• Promoting research and innovation by advocating for in-creased CVD research funding and reductions in the com-plexities of regulatory processes in order to facilitatetranslation of innovative research findings for clinical bene-fit of patients with CVD.
European Society of Cardiology 5D
ownloaded from
https://academic.oup.com
/eurheartj/advance-article/doi/10.1093/eurheartj/ehab892/6472699 by guest on 12 January 2022
• Coordinating and harmonizing ESC advocacy activities, recogniz-ing that the ESC is home to large numbers of dedicatedscientists and clinicians with unique expertise in CV scienceand healthcare. Harmonization of this workforce provideshuge potential for advocacy on behalf of the 113 millionpeople living with CVD across ESC member countries.
(11) Salient observations• Females born in ESC member countries in 2018 are ex-pected to live 80.8 years and males 74.8 years. Life expect-ancy is longer in high-income (81.6 years) compared withmiddle-income (74.2 years) countries.
• In 2018, high-income countries spent, on average, fourtimes more on healthcare than middle-income countries.
• The median PM2.5 concentrations in 2019 were over twiceas high in middle-income ESC member countries com-pared with high-income countries and exceeded the EUair quality standard in 14 countries, all middle income.
• In 2016, more than one in five adults across the ESC mem-ber countries were obese with similar prevalence in high-and low-income countries. The prevalence of obesity hasmore than doubled over the past 35 years.
• The burden of CVD falls hardest on middle-income ESCmember countries where estimated incidence rates are�30% higher compared with high-income countries. Thisis reflected in DALYs due to CVD which are nearly fourtimes as high in middle-income compared with high-income countries.
• The incidence of calcific aortic valve disease has increasedseven-fold during the last 30 years, with age-standardizedrates four times as high in high-income compared withmiddle-income countries.
• Although the total number of CVD deaths across all coun-tries far exceeds the number of cancer deaths for bothsexes, there are 15 ESC member countries in which cancerkills more males than CVD and five-member states inwhich this is the case for females. All of these countrieswere classified as high income.
• The under-resourced status of middle-income countries isassociated with a severe procedural deficit compared withhigh-income countries in terms of coronary intervention,ablation procedures, device implantation, and cardiac sur-gical procedures.
IntroductionThe European Society of Cardiology (ESC) Cardiovascular DiseaseStatistics, a biennial publication of the ESC European Heart Agencyin Brussels, is being published this year under unusual circum-stances. The COVID-19 pandemic, apart from its many victims,has damaged and disrupted not only national economies, but per-haps more importantly their health systems, services, priorities,and planning for communicable disease and noncommunicable dis-eases (NCDs), with all the consequences that entails.1,2
Healthcare planning faces difficulties and dilemmas, since in add-ition to the current demands of the pandemic, and communicablediseases in general, the huge deficits in the management of NCDs,
including cardiovascular (CV) and cerebrovascular diseases as wellas cancer, are continuing to expand, necessitating new investmentsin infrastructure, human resources, and research. In these circum-stances, decision-making needs to be based on reliable metricsthat shed light on requirements and data relating to the epidemi-ology and trends of these diseases, extending to the realities asso-ciated with their management.
The purpose of ESC Cardiovascular Disease Statistics is to mapall those factors that contribute to the development of cardiovas-cular diseases (CVD) as well as the data that characterize the qual-ity of CV care in the 57 ESC member countries.3 The statistics aredrawn from the ESC Atlas of Cardiology that is regularly updatedby the European Heart Agency in Brussels. The ESC Atlas is a re-pository of CVD-related statistics collected by groups such as theWorld Health Organization (WHO, the Organisation forEconomic Cooperation and Development (OECD), the Institutefor Health Metrics and Evaluation (IHME), and the World Bank(WB). It also includes novel data on human and capital infrastruc-ture provided by the national CV professional societies of ESCmember countries and obtained through bi-annual surveys spon-sored by the ESC.
The statistics reported in the ESC Atlas are the most recent thatare currently available and relate to 2019 or the latest availableyear. They will provide, therefore, a comparator data set for futureinvestigations of the CV consequences of the pandemic across ESCmember countries.
The key objectives of the ESC Atlasare to
• Assess and compare CVD burden across ESC membercountries;
• Drive policy initiatives to help reduce inequalities in CVDburden;
• Map European CVD healthcare delivery;• Provide a one-stop source of CVD statistics for academics,clinicians, and other stakeholders.
ESC Cardiovascular Statistics 2021 is the third report from theEuropean Heart Agency ESC Atlas programme.4,5 It builds on pre-vious reports in providing the most recently available 2019 CVDstatistics with new sections on national sociodemographic factorsand environmental risk factors that provide important context tothe epidemiological heterogeneity of CVD across ESC membercountries. The economic burden of CVD gets further consider-ation and there is a more detailed description of the morbid man-ifestations of CVD with new data on RHD, left-sided valvulardisease, and out-of-hospital cardiac arrest. Progress towardsmeeting theWHO’s NCD 2025 milestones is presented and thereis a discussion of the advocacy potential of the ESC Atlas.
We hope that those who study the evidence in this report—healthcare policymakers, healthcare professionals, healthcare ad-ministrators, media professionals, patients’ organizations, healthadvocates, and researchers—will recognize the importance ofthe metrics presented, but also of the overall project, as a leverto improve CVD prevention and treatment, and to reduce the
6 A. Timmis et al.D
ownloaded from
https://academic.oup.com
/eurheartj/advance-article/doi/10.1093/eurheartj/ehab892/6472699 by guest on 12 January 2022
healthcare gaps and inequalities among the 57 ESC membercountries.
Data sources and presentationThe CVD statistics that constitute this report were compiled aspart of the ESC’s ATLAS project by the European Heart HealthInstitute in Brussels. Key data sources include:
• European Society of Cardiology: statistics on national CV infra-structure and procedures derived from a 2020 survey of theNational Cardiac Societies (NCS) of all 57 ESC membercountries.
• World Health Organization: risk factor and mortality statistics.• Institute for Health Metrics and Evaluation: morbidity and dis-ease burden statistics from the Global burden of disease(GBD) study.
• World Bank: economic indicators.
For each CVD statistic and economic indicator, provenance andcompleteness are defined in the data provenance table (seeSupplementary material online, Table S1).
European Society of CardiologyCardiovascular Healthcare dataThe ESC Atlas contains more than 100 variables relating to humanand capital infrastructure and major CV interventions and servicesfrom 57 ESC member countries. Specific variables developed by atask force were included in a questionnaire circulated biennially tothe NCS of participating ESC member countries. The data col-lected were then subject to quality control procedures, includingcomparison with other data sources to identify outliers and illogic-al values. These values were discussed with the source NCS andcorrected where necessary. The data were reviewed by indepen-dent experts before final approval by the NCS. All original datasources were recorded for tracking purposes.3 The survey yieldsabsolute numbers for resources and procedures. Crude ratesper million people are computed fromWB population estimates.6
World Health Organization dataMortality data come from the WHO Mortality Database using theDecember 2019 update of age- and cause-specific mortality databy country.7 These data are publicly available. This manuscript pre-sents mortality data for 54 of the 57 ESC member countries. Nodata are presented for Algeria, Libya, or the Republic of Kosovo.The WHO database collates data on the absolute number of
medically certified deaths from national authorities based on theirvital registration systems. From these primary data, mortalityrates are calculated using country-level data on populationsize, obtained from the same database, as denominators.Age-standardized rates are estimated using the direct methodwith the 2013 European Standard Population (ESP) to controlfor cross-national differences in population age structures. The2013 ESP was developed as an update to the 1976 ESP by theEuropean Commission for the EU27 and European Free TradeAssociation countries to reflect better the age structure of the
current European population.8 Where rates are presented, mor-tality and population data for the same year are required.
The data presented in the WHO Mortality Database and in thisarticle are as submitted by individual countries to the WHO. Noadjustments have been made to account for potential bias in re-porting. As a result, the quality of mortality data varies betweencountries, with more accurate data for countries with well-functioning vital registration systems compared with those withweaker systems. Even for countries with strong vital registrationsystems, regional patterns of clinical diagnosis may limit cross-country comparability.
In general, the mortality data are up-to-date, with the most re-cent data for only 10 of the 54 countries dating from 2014 or be-fore. However, in some cases, individual countries are yet toprovide their most recent statistics, with the result that the infor-mation obtained from the WHO might not be as up-to-date asthat available from the databases of these individual countries.
National data on major risk factors are based on aggregated popu-lation data derived from theWHO and Noncommunicable DiseasesRisk Factor Collaboration (NCD-RisC). Estimates are age-standar-dized to facilitate international comparisons. Details of methodsand data sources are described in more depth elsewhere.9–11
Global Burden of Disease—Institute forHealth Metrics and Evaluation dataEstimates of CVD prevalence come from the GBD study, con-ducted by the IHME.12 The estimates are derived using modellingsoftware and data from health surveys, prospective cohorts, healthsystem administrative data, and registries.13,14 The GBD study alsoprovides estimates of disability-adjusted life years (DALYs) fromestimates of years living with CVD and years of life lost due toCVD mortality. The accuracy of modelled estimates is heavily de-pendent on the original data used. This can be a challenge whereonly sub-national, or small sample data are available, or in in-stances in which recent data have not been collected. Such esti-mates are, therefore, open to concerns regarding accuracy whendescribing the national level of CVD burden. In particular, it is pos-sible that estimates may change, as more recent data become avail-able and methods are modified, as has been found with other GBDhealth indicators.15 Furthermore, DALYs provide a useful but lim-ited tool to standardize and evaluate health status. Criticism hasextended to the implicit use of discounting (present health statusweighed more than future) and age weights (lower value given toyounger and older ages).16 The GBD has also received criticism inrecent years on methodology, culture, and qualitative difference inaddition to a lack of homogeneity in access to resources.17
Further criticism has focused on the difference in the populationestimates used by IHME to those used by UN agencies. The complex-ity and computational intensity of imputation and modelling used byIHMEmakes it challenging for others to explain how outputs relate tocountry data or to replicate the methods followed.15,18,19
World Bank dataData on various economic indicators come from the WB.20 Thesedata are drawn from official sources. In converting estimates ofgross national income (GNI) and GNI per capita from national
European Society of Cardiology 7D
ownloaded from
https://academic.oup.com
/eurheartj/advance-article/doi/10.1093/eurheartj/ehab892/6472699 by guest on 12 January 2022
currencies to US dollars (USD), the WB uses a specific conversionfactor to help reduce the impact of exchange rate fluctuations incross-country comparisons. The WB also provides national popu-lation data used for calculating rate estimates for ESC membercountries.
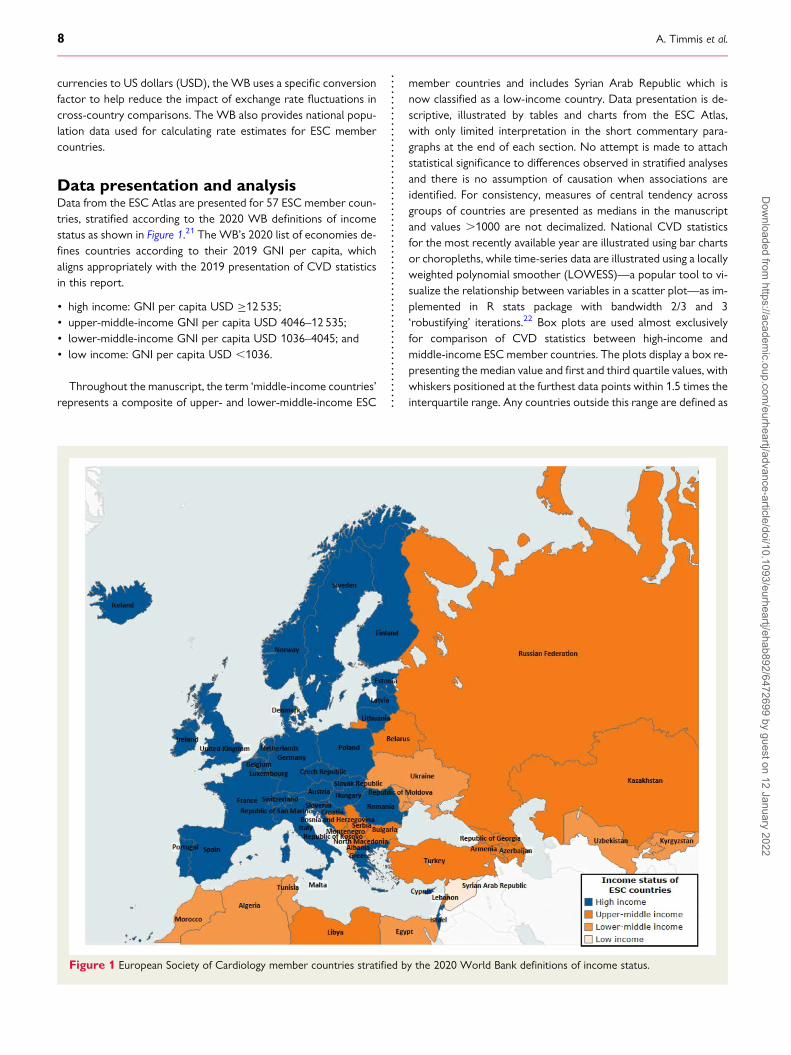
Data presentation and analysisData from the ESC Atlas are presented for 57 ESC member coun-tries, stratified according to the 2020 WB definitions of incomestatus as shown in Figure 1.21 The WB’s 2020 list of economies de-fines countries according to their 2019 GNI per capita, whichaligns appropriately with the 2019 presentation of CVD statisticsin this report.
• high income: GNI per capita USD ≥12 535;• upper-middle-income GNI per capita USD 4046–12 535;• lower-middle-income GNI per capita USD 1036–4045; and• low income: GNI per capita USD ,1036.
Throughout the manuscript, the term ‘middle-income countries’represents a composite of upper- and lower-middle-income ESC
member countries and includes Syrian Arab Republic which isnow classified as a low-income country. Data presentation is de-scriptive, illustrated by tables and charts from the ESC Atlas,with only limited interpretation in the short commentary para-graphs at the end of each section. No attempt is made to attachstatistical significance to differences observed in stratified analysesand there is no assumption of causation when associations areidentified. For consistency, measures of central tendency acrossgroups of countries are presented as medians in the manuscriptand values .1000 are not decimalized. National CVD statisticsfor the most recently available year are illustrated using bar chartsor choropleths, while time-series data are illustrated using a locallyweighted polynomial smoother (LOWESS)—a popular tool to vi-sualize the relationship between variables in a scatter plot—as im-plemented in R stats package with bandwidth 2/3 and 3‘robustifying’ iterations.22 Box plots are used almost exclusivelyfor comparison of CVD statistics between high-income andmiddle-income ESC member countries. The plots display a box re-presenting the median value and first and third quartile values, withwhiskers positioned at the furthest data points within 1.5 times theinterquartile range. Any countries outside this range are defined as
Figure 1 European Society of Cardiology member countries stratified by the 2020 World Bank definitions of income status.
8 A. Timmis et al.D
ownloaded from
https://academic.oup.com
/eurheartj/advance-article/doi/10.1093/eurheartj/ehab892/6472699 by guest on 12 January 2022
outliers and are plotted individually. For all figures, the provenanceof the data and its completeness is detailed in the table (seeSupplementary material online, Table S1).
LimitationsMuch of the data in the ESC Atlas are from the WHO, IHME, andWB, which together constitute the most credible sources of na-tional estimates of CVD and associated risk factors. The validityof the statistics these sources provide is a function of theprocedures applied in their collection that can be reviewed in thesource addresses provided in the data provenance table (seeSupplementary material online, Table S1). General limitations ofthe data include the adjustment applied by all the main providersto account for missing data, and differences in reporting practicessuch that the precision of the estimates they provide often variesby country. Misclassification bias due to miscoding of diagnosticgroups and death certificates is another potential limitation. Datacompleteness also varies by country and is defined in the data pro-venance table (see Supplementary material online, Table S1).The ESC Atlas does not provide information about within-countryinequalities.23,24 Moreover, inequalities between high- andmiddle-income countries are determined by comparing nationalmedians averaged across the groups, which obscures within-category inequalities. The presentation of the first and third quartilevalues around group medians helps mitigate this issue.The limitations as they apply to the quality, precision, and avail-
ability of the data are well recognized and are the subject of con-tinuous review by the data providers in seeking to improve thedata quality. Nevertheless, we emphasize the need for cautious in-terpretation of the CVD statistics presented in this report.
National sociodemographiccharacteristics
Population age structureCardiovascular disease in females and males becomes progres-sively more common as age increases. Reasons for this are com-plex but include:
• Extended exposure to risk factors such as hypertension and dys-lipidaemia that accrues with advancing years and increases CVDrisk.
• Beneficial effects of interventions that delay CVD onset and pro-long survival in patients with established disease.
Since older people are more likely to develop CVD, national agestructures have an important modifying influence on the burden ofdisease. In comparing CVD mortality statistics between ESCmember countries, therefore, age-standardized rates must beapplied using the European Standard Population (ESP) to allowfor differences in national age structures.25 Age standardizationin this manuscript uses the 2013 ESP update which providesgreater weighting for older age groups compared with the 1976ESP.8
Mortality due to CVD has declined in high-income ESC membercountries during the last five decades but continues to increase in
many of the middle-income countries where a substantial propor-tion of the disease burden now resides.5 These epidemiologicalshifts have been influenced by the ageing of populations accom-panied by their urbanization and globalization.26
National age structures can be visualized using population pyr-amids which illustrate the transitions that occur betweenmiddle-income and high-income countries (Figure 2).27 The widthof the pyramid represents the size of the population at a given age,with females on the right and males on the left. It is useful to com-pare the population pyramids for Egypt and the UK which can betaken to represent extreme exemplars in the age structures thatcharacterize ESC member countries. The pyramid for Egypt hasa broad base representing large numbers of newborns which inturn reflect high birth rates and high fertility rates. Beyond the firstyear of life, there is rapid attrition of population numbers as ageincreases such that the proportion of over 70s is very low.Contrast this with the UK pyramid, with its narrow base repre-senting a relatively low birth rate and a low percentage of youngerpeople. With advancing age, the population shows little attritionand remains stable into old age.
National age structures are not binary and across ESC membercountries exist in various phases of transition. In all high-incomecountries and many middle-income countries, age structures, asexemplified by the UK data in Figure 2, are characterized by ahigh proportion of older people while in Egypt and some of theless prosperous member countries, it is often the young who pre-dominate. As ageing increases in the middle-income countries ofthe ESC, it will accelerate the growing burden of CVD driven byurbanization, hypertension, and lifestyle changes. Ageing will alsoincrease in high-income countries and across Europe, the propor-tion of the population aged.65 years is predicted to exceed 30%by the end of the century (Figure 3). This will have important con-sequences for healthcare and national economies.
These national age structures are reflected in the sociodemo-graphic statistics for ESC member countries that are recorded inthe ESC Atlas.
Population age• National statistics, stratified by sex. In 2019, 17.2% [inter-quartile range (IQR) 12.1–20%] of the population across all ESCmember countries was aged .65 years, comprising 19.4% (IQR14.0–22.5%) of the female population and 14.6% (IQR 10.1–17.3%) of the male population (see Supplementary material on-line, Figure S1). The median population age in 2020 was 41.1(IQR 35.9–43.2) years, ranging from ,30 years in Algeria,Egypt, Kyrgyzstan, Lebanon, Libya, and Syrian Arab Republic to.45 years in Germany, Greece, Italy, Lithuania, and Portugal.
• Time-series data. With ageing of the population of ESCmember countries between 1970 and 2019, the proportionof over 65s increased from 9.2% (IQR 5.6–11.2%) to 17.2%(IQR 12.1–20.0%). Increases were similar in females [10.7%(IQR 6.7–13.0%) to 19.4% (IQR 14.0–22.5%)] and males[7.8% (IQR 4.7–9.4%) to 14.6% (IQR 10.1–17.3%)]. The medianpopulation age, across ESC member countries, increased from29.6 (IQR 22.0–32.5) years in 1970 to 41.1 (IQR 35.9–43.2)years in 2020 (Figure 4).
European Society of Cardiology 9D
ownloaded from
https://academic.oup.com
/eurheartj/advance-article/doi/10.1093/eurheartj/ehab892/6472699 by guest on 12 January 2022
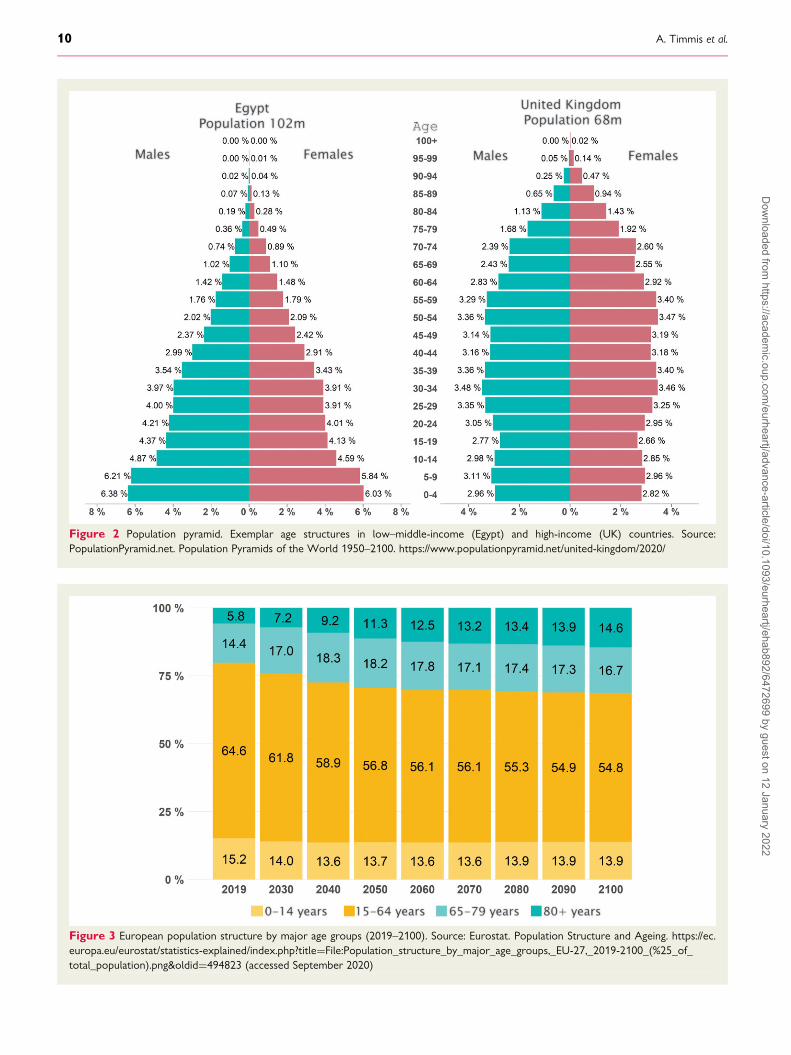
Figure 2 Population pyramid. Exemplar age structures in low–middle-income (Egypt) and high-income (UK) countries. Source:PopulationPyramid.net. Population Pyramids of the World 1950–2100. https://www.populationpyramid.net/united-kingdom/2020/
Figure 3 European population structure by major age groups (2019–2100). Source: Eurostat. Population Structure and Ageing. https://ec.europa.eu/eurostat/statistics-explained/index.php?title=File:Population_structure_by_major_age_groups,_EU-27,_2019-2100_(%25_of_total_population).png&oldid=494823 (accessed September 2020)
10 A. Timmis et al.D
ownloaded from
https://academic.oup.com
/eurheartj/advance-article/doi/10.1093/eurheartj/ehab892/6472699 by guest on 12 January 2022
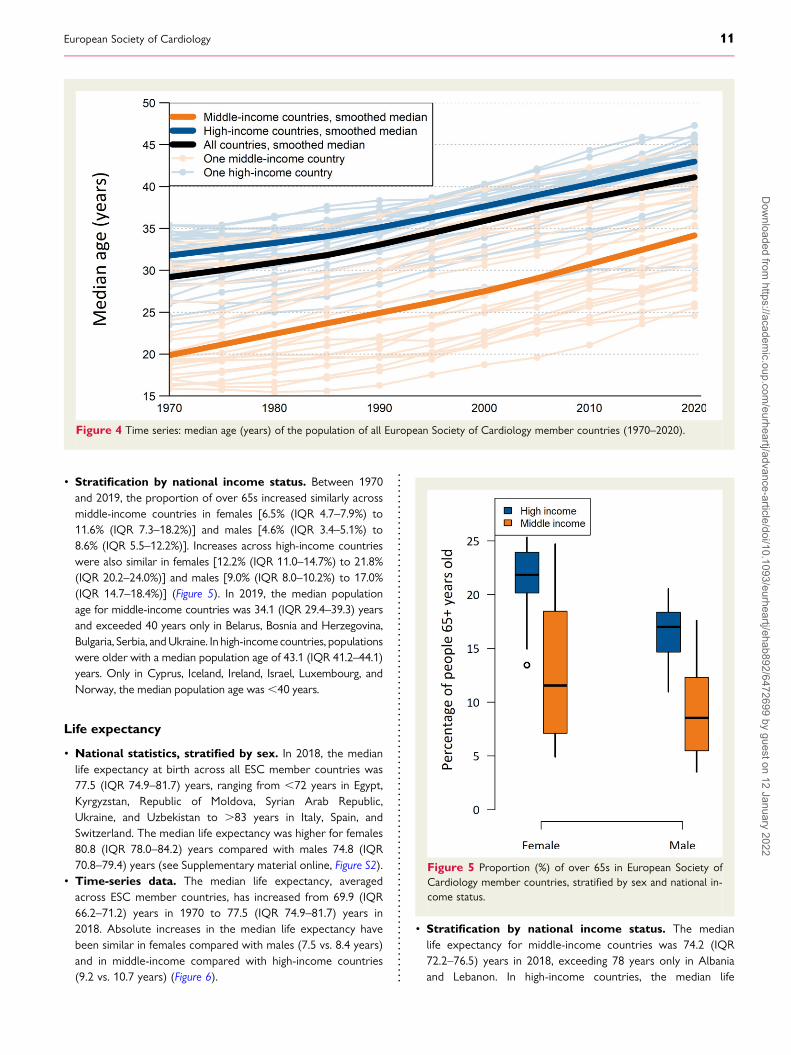
• Stratification by national income status. Between 1970and 2019, the proportion of over 65s increased similarly acrossmiddle-income countries in females [6.5% (IQR 4.7–7.9%) to11.6% (IQR 7.3–18.2%)] and males [4.6% (IQR 3.4–5.1%) to8.6% (IQR 5.5–12.2%)]. Increases across high-income countrieswere also similar in females [12.2% (IQR 11.0–14.7%) to 21.8%(IQR 20.2–24.0%)] and males [9.0% (IQR 8.0–10.2%) to 17.0%(IQR 14.7–18.4%)] (Figure 5). In 2019, the median populationage for middle-income countries was 34.1 (IQR 29.4–39.3) yearsand exceeded 40 years only in Belarus, Bosnia and Herzegovina,Bulgaria, Serbia, andUkraine. In high-incomecountries, populationswere older with a median population age of 43.1 (IQR 41.2–44.1)years. Only in Cyprus, Iceland, Ireland, Israel, Luxembourg, andNorway, the median population age was,40 years.
Life expectancy
• National statistics, stratified by sex. In 2018, the medianlife expectancy at birth across all ESC member countries was77.5 (IQR 74.9–81.7) years, ranging from ,72 years in Egypt,Kyrgyzstan, Republic of Moldova, Syrian Arab Republic,Ukraine, and Uzbekistan to .83 years in Italy, Spain, andSwitzerland. The median life expectancy was higher for females80.8 (IQR 78.0–84.2) years compared with males 74.8 (IQR70.8–79.4) years (see Supplementary material online, Figure S2).
• Time-series data. The median life expectancy, averagedacross ESC member countries, has increased from 69.9 (IQR66.2–71.2) years in 1970 to 77.5 (IQR 74.9–81.7) years in2018. Absolute increases in the median life expectancy havebeen similar in females compared with males (7.5 vs. 8.4 years)and in middle-income compared with high-income countries(9.2 vs. 10.7 years) (Figure 6).
• Stratification by national income status. The medianlife expectancy for middle-income countries was 74.2 (IQR72.2–76.5) years in 2018, exceeding 78 years only in Albaniaand Lebanon. In high-income countries, the median life
Figure 5 Proportion (%) of over 65s in European Society ofCardiology member countries, stratified by sex and national in-come status.
Figure 4 Time series: median age (years) of the population of all European Society of Cardiology member countries (1970–2020).
European Society of Cardiology 11D
ownloaded from
https://academic.oup.com
/eurheartj/advance-article/doi/10.1093/eurheartj/ehab892/6472699 by guest on 12 January 2022
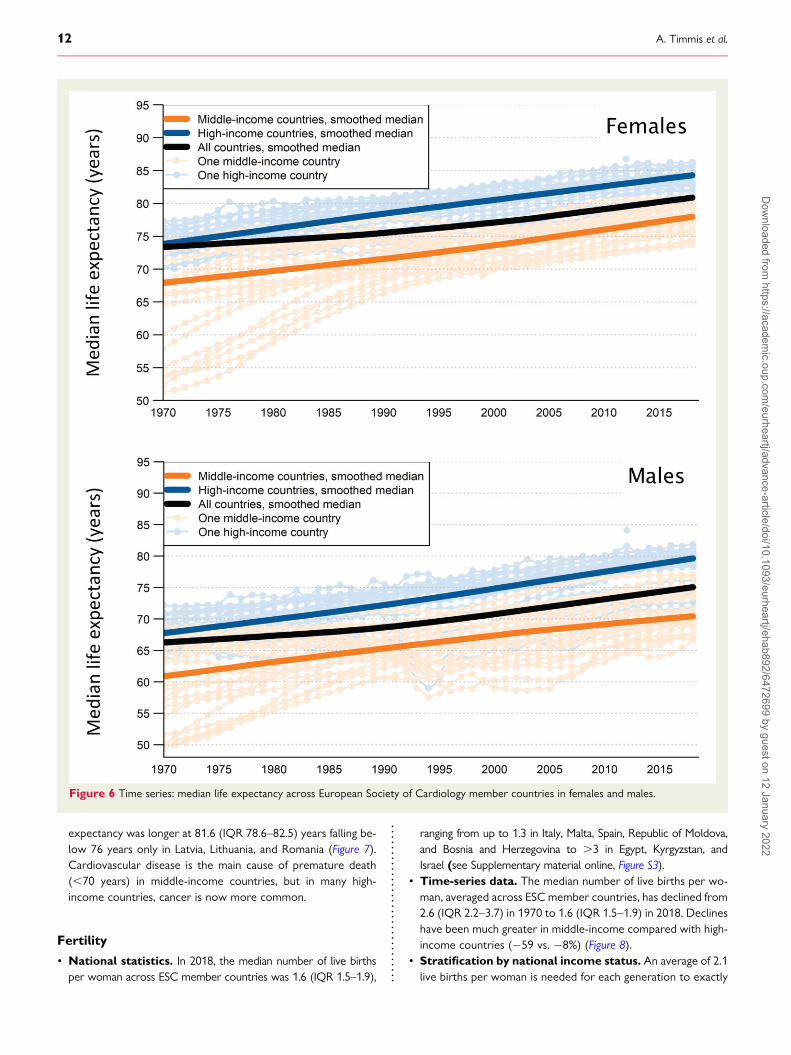
expectancy was longer at 81.6 (IQR 78.6–82.5) years falling be-low 76 years only in Latvia, Lithuania, and Romania (Figure 7).Cardiovascular disease is the main cause of premature death(,70 years) in middle-income countries, but in many high-income countries, cancer is now more common.
Fertility
• National statistics. In 2018, the median number of live birthsper woman across ESC member countries was 1.6 (IQR 1.5–1.9),
ranging from up to 1.3 in Italy, Malta, Spain, Republic of Moldova,and Bosnia and Herzegovina to .3 in Egypt, Kyrgyzstan, andIsrael (see Supplementary material online, Figure S3).
• Time-series data. The median number of live births per wo-man, averaged across ESC member countries, has declined from2.6 (IQR 2.2–3.7) in 1970 to 1.6 (IQR 1.5–1.9) in 2018. Declineshave been much greater in middle-income compared with high-income countries (−59 vs. −8%) (Figure 8).
• Stratification by national income status. An average of 2.1live births per woman is needed for each generation to exactly
Figure 6 Time series: median life expectancy across European Society of Cardiology member countries in females and males.
12 A. Timmis et al.D
ownloaded from
https://academic.oup.com
/eurheartj/advance-article/doi/10.1093/eurheartj/ehab892/6472699 by guest on 12 January 2022
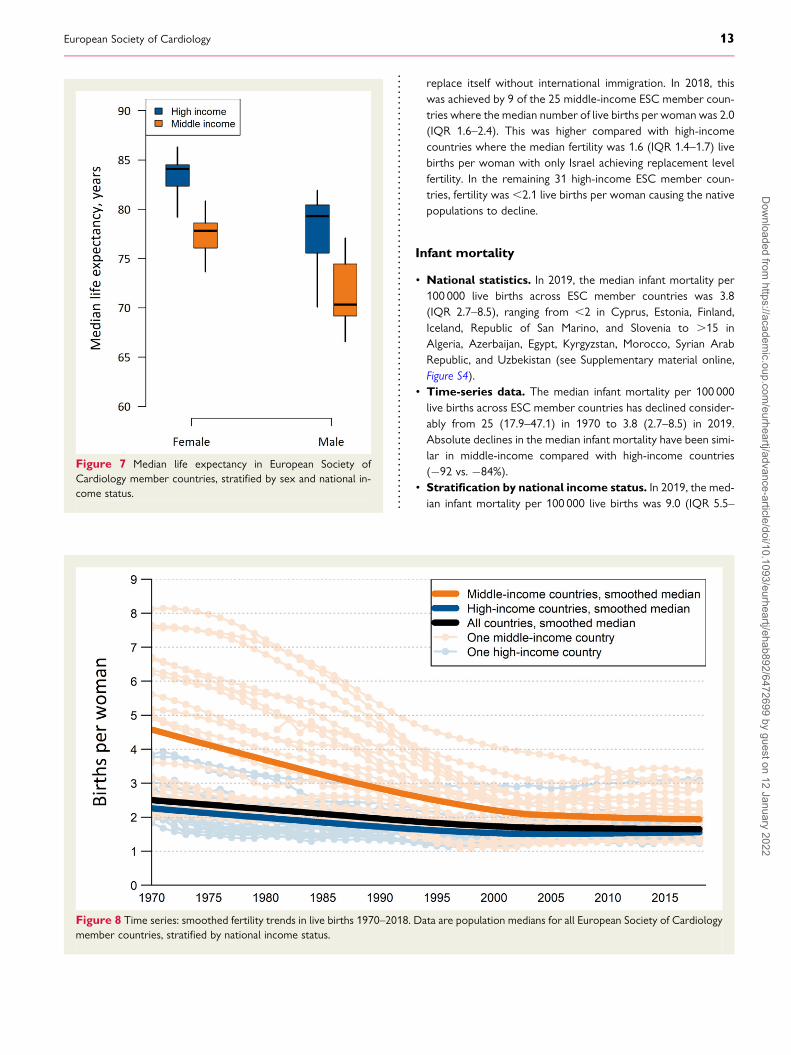
replace itself without international immigration. In 2018, thiswas achieved by 9 of the 25 middle-income ESC member coun-tries where the median number of live births per woman was 2.0(IQR 1.6–2.4). This was higher compared with high-incomecountries where the median fertility was 1.6 (IQR 1.4–1.7) livebirths per woman with only Israel achieving replacement levelfertility. In the remaining 31 high-income ESC member coun-tries, fertility was,2.1 live births per woman causing the nativepopulations to decline.
Infant mortality
• National statistics. In 2019, the median infant mortality per100 000 live births across ESC member countries was 3.8(IQR 2.7–8.5), ranging from ,2 in Cyprus, Estonia, Finland,Iceland, Republic of San Marino, and Slovenia to .15 inAlgeria, Azerbaijan, Egypt, Kyrgyzstan, Morocco, Syrian ArabRepublic, and Uzbekistan (see Supplementary material online,Figure S4).
• Time-series data. The median infant mortality per 100 000live births across ESC member countries has declined consider-ably from 25 (17.9–47.1) in 1970 to 3.8 (2.7–8.5) in 2019.Absolute declines in the median infant mortality have been simi-lar in middle-income compared with high-income countries(−92 vs. −84%).
• Stratification by national income status. In 2019, the med-ian infant mortality per 100 000 live births was 9.0 (IQR 5.5–
Figure 8 Time series: smoothed fertility trends in live births 1970–2018. Data are population medians for all European Society of Cardiologymember countries, stratified by national income status.
Figure 7 Median life expectancy in European Society ofCardiology member countries, stratified by sex and national in-come status.
European Society of Cardiology 13D
ownloaded from
https://academic.oup.com
/eurheartj/advance-article/doi/10.1093/eurheartj/ehab892/6472699 by guest on 12 January 2022
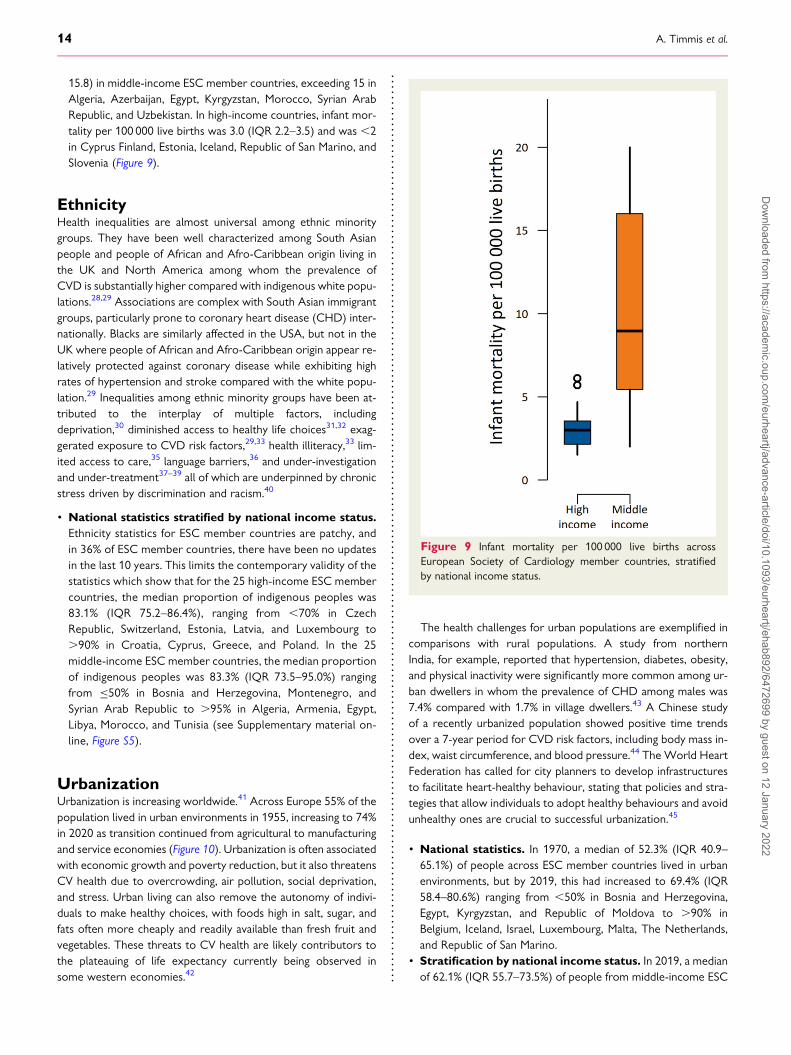
15.8) in middle-income ESC member countries, exceeding 15 inAlgeria, Azerbaijan, Egypt, Kyrgyzstan, Morocco, Syrian ArabRepublic, and Uzbekistan. In high-income countries, infant mor-tality per 100 000 live births was 3.0 (IQR 2.2–3.5) and was ,2in Cyprus Finland, Estonia, Iceland, Republic of San Marino, andSlovenia (Figure 9).
EthnicityHealth inequalities are almost universal among ethnic minoritygroups. They have been well characterized among South Asianpeople and people of African and Afro-Caribbean origin living inthe UK and North America among whom the prevalence ofCVD is substantially higher compared with indigenous white popu-lations.28,29 Associations are complex with South Asian immigrantgroups, particularly prone to coronary heart disease (CHD) inter-nationally. Blacks are similarly affected in the USA, but not in theUK where people of African and Afro-Caribbean origin appear re-latively protected against coronary disease while exhibiting highrates of hypertension and stroke compared with the white popu-lation.29 Inequalities among ethnic minority groups have been at-tributed to the interplay of multiple factors, includingdeprivation,30 diminished access to healthy life choices31,32 exag-gerated exposure to CVD risk factors,29,33 health illiteracy,33 lim-ited access to care,35 language barriers,36 and under-investigationand under-treatment37–39 all of which are underpinned by chronicstress driven by discrimination and racism.40
• National statistics stratified by national income status.Ethnicity statistics for ESC member countries are patchy, andin 36% of ESC member countries, there have been no updatesin the last 10 years. This limits the contemporary validity of thestatistics which show that for the 25 high-income ESC membercountries, the median proportion of indigenous peoples was83.1% (IQR 75.2–86.4%), ranging from ,70% in CzechRepublic, Switzerland, Estonia, Latvia, and Luxembourg to.90% in Croatia, Cyprus, Greece, and Poland. In the 25middle-income ESC member countries, the median proportionof indigenous peoples was 83.3% (IQR 73.5–95.0%) rangingfrom ≤50% in Bosnia and Herzegovina, Montenegro, andSyrian Arab Republic to .95% in Algeria, Armenia, Egypt,Libya, Morocco, and Tunisia (see Supplementary material on-line, Figure S5).
UrbanizationUrbanization is increasing worldwide.41 Across Europe 55% of thepopulation lived in urban environments in 1955, increasing to 74%in 2020 as transition continued from agricultural to manufacturingand service economies (Figure 10). Urbanization is often associatedwith economic growth and poverty reduction, but it also threatensCV health due to overcrowding, air pollution, social deprivation,and stress. Urban living can also remove the autonomy of indivi-duals to make healthy choices, with foods high in salt, sugar, andfats often more cheaply and readily available than fresh fruit andvegetables. These threats to CV health are likely contributors tothe plateauing of life expectancy currently being observed insome western economies.42
The health challenges for urban populations are exemplified incomparisons with rural populations. A study from northernIndia, for example, reported that hypertension, diabetes, obesity,and physical inactivity were significantly more common among ur-ban dwellers in whom the prevalence of CHD among males was7.4% compared with 1.7% in village dwellers.43 A Chinese studyof a recently urbanized population showed positive time trendsover a 7-year period for CVD risk factors, including body mass in-dex, waist circumference, and blood pressure.44 The World HeartFederation has called for city planners to develop infrastructuresto facilitate heart-healthy behaviour, stating that policies and stra-tegies that allow individuals to adopt healthy behaviours and avoidunhealthy ones are crucial to successful urbanization.45
• National statistics. In 1970, a median of 52.3% (IQR 40.9–65.1%) of people across ESC member countries lived in urbanenvironments, but by 2019, this had increased to 69.4% (IQR58.4–80.6%) ranging from ,50% in Bosnia and Herzegovina,Egypt, Kyrgyzstan, and Republic of Moldova to .90% inBelgium, Iceland, Israel, Luxembourg, Malta, The Netherlands,and Republic of San Marino.
• Stratification by national income status. In 2019, a medianof 62.1% (IQR 55.7–73.5%) of people from middle-income ESC
Figure 9 Infant mortality per 100 000 live births acrossEuropean Society of Cardiology member countries, stratifiedby national income status.
14 A. Timmis et al.D
ownloaded from
https://academic.oup.com
/eurheartj/advance-article/doi/10.1093/eurheartj/ehab892/6472699 by guest on 12 January 2022
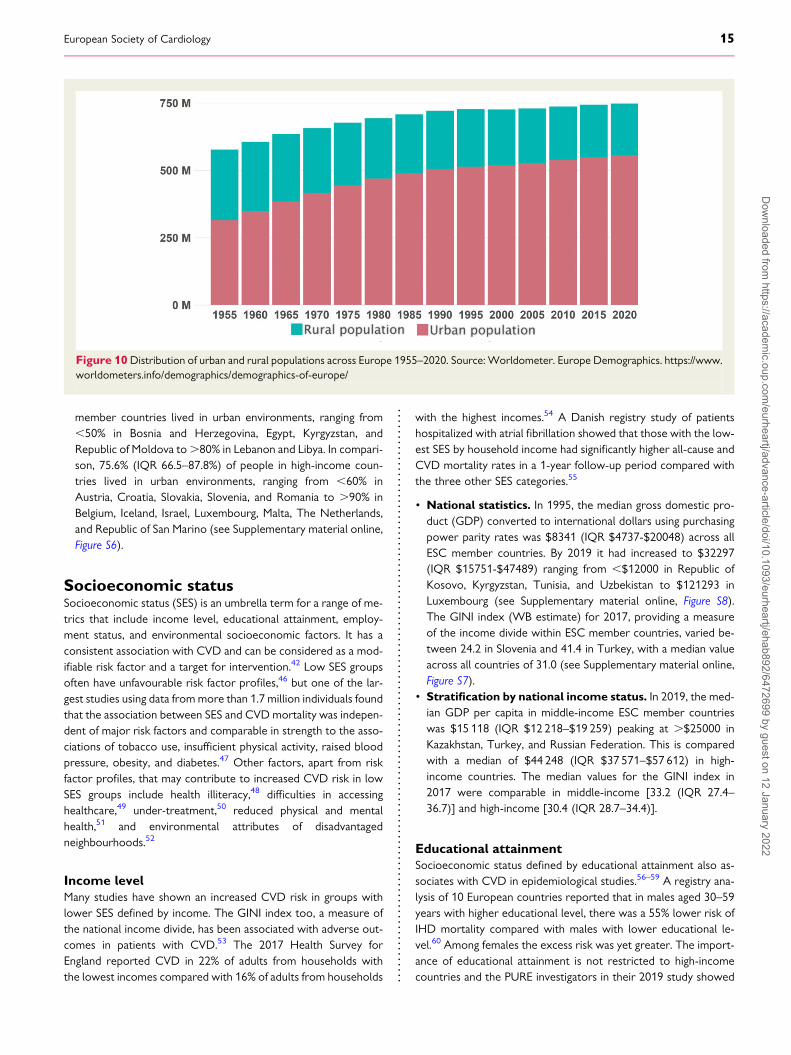
member countries lived in urban environments, ranging from,50% in Bosnia and Herzegovina, Egypt, Kyrgyzstan, andRepublic of Moldova to.80% in Lebanon and Libya. In compari-son, 75.6% (IQR 66.5–87.8%) of people in high-income coun-tries lived in urban environments, ranging from ,60% inAustria, Croatia, Slovakia, Slovenia, and Romania to .90% inBelgium, Iceland, Israel, Luxembourg, Malta, The Netherlands,and Republic of San Marino (see Supplementary material online,Figure S6).
Socioeconomic statusSocioeconomic status (SES) is an umbrella term for a range of me-trics that include income level, educational attainment, employ-ment status, and environmental socioeconomic factors. It has aconsistent association with CVD and can be considered as a mod-ifiable risk factor and a target for intervention.42 Low SES groupsoften have unfavourable risk factor profiles,46 but one of the lar-gest studies using data frommore than 1.7 million individuals foundthat the association between SES and CVD mortality was indepen-dent of major risk factors and comparable in strength to the asso-ciations of tobacco use, insufficient physical activity, raised bloodpressure, obesity, and diabetes.47 Other factors, apart from riskfactor profiles, that may contribute to increased CVD risk in lowSES groups include health illiteracy,48 difficulties in accessinghealthcare,49 under-treatment,50 reduced physical and mentalhealth,51 and environmental attributes of disadvantagedneighbourhoods.52
Income levelMany studies have shown an increased CVD risk in groups withlower SES defined by income. The GINI index too, a measure ofthe national income divide, has been associated with adverse out-comes in patients with CVD.53 The 2017 Health Survey forEngland reported CVD in 22% of adults from households withthe lowest incomes compared with 16% of adults from households
with the highest incomes.54 A Danish registry study of patientshospitalized with atrial fibrillation showed that those with the low-est SES by household income had significantly higher all-cause andCVD mortality rates in a 1-year follow-up period compared withthe three other SES categories.55
• National statistics. In 1995, the median gross domestic pro-duct (GDP) converted to international dollars using purchasingpower parity rates was $8341 (IQR $4737-$20048) across allESC member countries. By 2019 it had increased to $32297(IQR $15751-$47489) ranging from ,$12000 in Republic ofKosovo, Kyrgyzstan, Tunisia, and Uzbekistan to $121293 inLuxembourg (see Supplementary material online, Figure S8).The GINI index (WB estimate) for 2017, providing a measureof the income divide within ESC member countries, varied be-tween 24.2 in Slovenia and 41.4 in Turkey, with a median valueacross all countries of 31.0 (see Supplementary material online,Figure S7).
• Stratification by national income status. In 2019, the med-ian GDP per capita in middle-income ESC member countrieswas $15 118 (IQR $12 218–$19 259) peaking at .$25000 inKazakhstan, Turkey, and Russian Federation. This is comparedwith a median of $44 248 (IQR $37 571–$57 612) in high-income countries. The median values for the GINI index in2017 were comparable in middle-income [33.2 (IQR 27.4–36.7)] and high-income [30.4 (IQR 28.7–34.4)].
Educational attainmentSocioeconomic status defined by educational attainment also as-sociates with CVD in epidemiological studies.56–59 A registry ana-lysis of 10 European countries reported that in males aged 30–59years with higher educational level, there was a 55% lower risk ofIHD mortality compared with males with lower educational le-vel.60 Among females the excess risk was yet greater. The import-ance of educational attainment is not restricted to high-incomecountries and the PURE investigators in their 2019 study showed
Figure 10Distribution of urban and rural populations across Europe 1955–2020. Source: Worldometer. Europe Demographics. https://www.worldometers.info/demographics/demographics-of-europe/
European Society of Cardiology 15D
ownloaded from
https://academic.oup.com
/eurheartj/advance-article/doi/10.1093/eurheartj/ehab892/6472699 by guest on 12 January 2022
that people with a lower level of education in low-income andmiddle-income countries have a higher incidence of and mortalityfrom CVD compared with better-educated compatriots.61
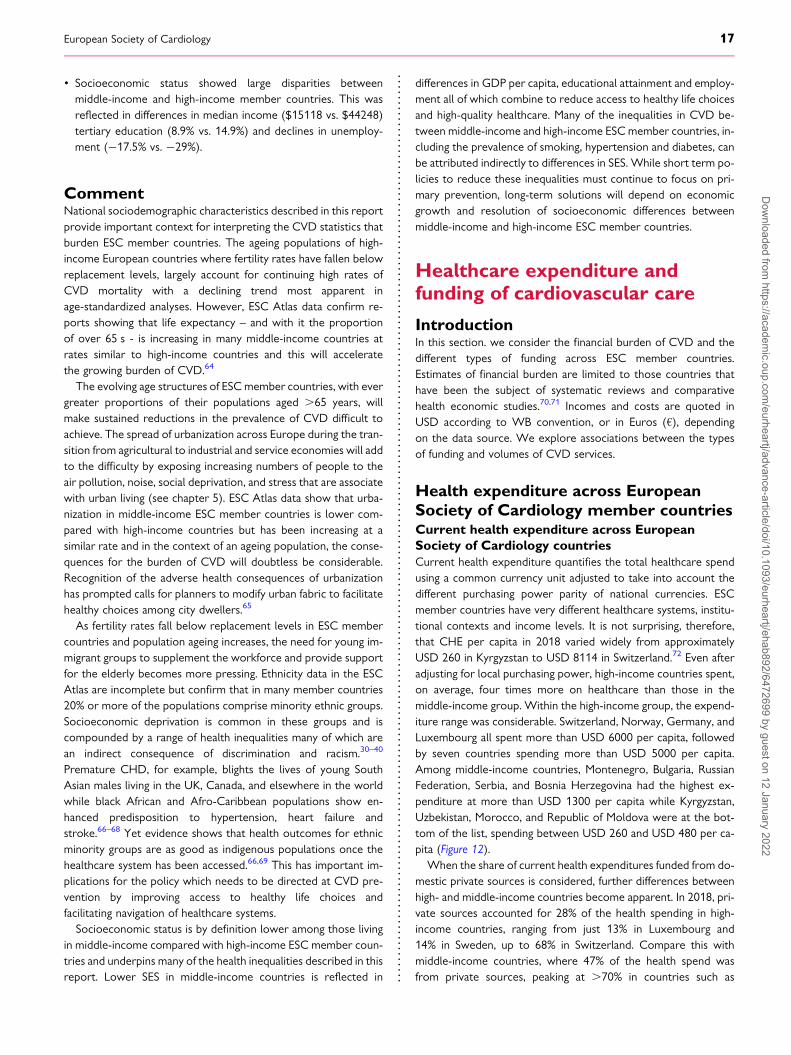
• National statistics. In 1970, a median of only 2.7% (IQR 1.6–3.9%) of people aged ≥15 years living in ESC member countriesreceived tertiary education but by 2010 this had increased to15.6% (IQR 12.4–26.8%) ranging from ,5% in Albania andSyrian Arab Republic to .20% in Greece, Cyprus, Ireland,Israel, Russian Federation, and Ukraine.
• Education in females. The median proportion of females withcompleted tertiary education in 2010 was only 12.5% (IQR 7.9–15.7%) across all ESC member countries and was lower inmiddle-income countries compared with high-income countries[9.0% (IQR 5.1–13.9%) vs. 13.7% (IQR 9.9–16.1%)] (seeSupplementary material online, Figure S9).
• Stratification by national income status. In middle-incomeESC member countries 8.9% (IQR 6.3–13.3%) of people re-ceived tertiary education compared with 14.9% (IQR 10.8–17.8%) of people living in high-income countries.
EmploymentEmployment as an index of SES is widely used by researchers andin a study of US adults, those who were unemployed had a .60%increase in the risk of CVD mortality during follow-up comparedwith those who were employed.62 A French study found a 20% in-crease in the risk of CHD associated with unemployment withmore than half explained by dietary and lifestyle mediators, mostnotably alcohol consumption and smoking.63
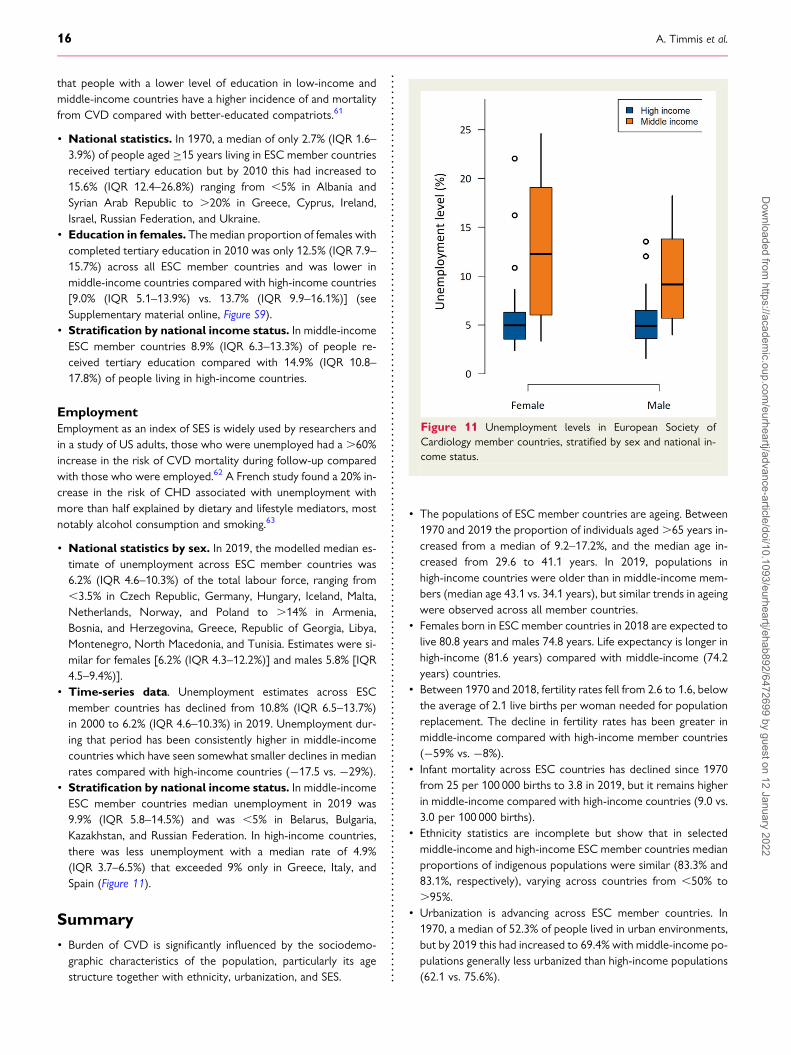
• National statistics by sex. In 2019, the modelled median es-timate of unemployment across ESC member countries was6.2% (IQR 4.6–10.3%) of the total labour force, ranging from,3.5% in Czech Republic, Germany, Hungary, Iceland, Malta,Netherlands, Norway, and Poland to .14% in Armenia,Bosnia, and Herzegovina, Greece, Republic of Georgia, Libya,Montenegro, North Macedonia, and Tunisia. Estimates were si-milar for females [6.2% (IQR 4.3–12.2%)] and males 5.8% [IQR4.5–9.4%)].
• Time-series data. Unemployment estimates across ESCmember countries has declined from 10.8% (IQR 6.5–13.7%)in 2000 to 6.2% (IQR 4.6–10.3%) in 2019. Unemployment dur-ing that period has been consistently higher in middle-incomecountries which have seen somewhat smaller declines in medianrates compared with high-income countries (−17.5 vs. −29%).
• Stratification by national income status. In middle-incomeESC member countries median unemployment in 2019 was9.9% (IQR 5.8–14.5%) and was ,5% in Belarus, Bulgaria,Kazakhstan, and Russian Federation. In high-income countries,there was less unemployment with a median rate of 4.9%(IQR 3.7–6.5%) that exceeded 9% only in Greece, Italy, andSpain (Figure 11).
Summary• Burden of CVD is significantly influenced by the sociodemo-graphic characteristics of the population, particularly its agestructure together with ethnicity, urbanization, and SES.
• The populations of ESC member countries are ageing. Between1970 and 2019 the proportion of individuals aged.65 years in-creased from a median of 9.2–17.2%, and the median age in-creased from 29.6 to 41.1 years. In 2019, populations inhigh-income countries were older than in middle-income mem-bers (median age 43.1 vs. 34.1 years), but similar trends in ageingwere observed across all member countries.
• Females born in ESC member countries in 2018 are expected tolive 80.8 years and males 74.8 years. Life expectancy is longer inhigh-income (81.6 years) compared with middle-income (74.2years) countries.
• Between 1970 and 2018, fertility rates fell from 2.6 to 1.6, belowthe average of 2.1 live births per woman needed for populationreplacement. The decline in fertility rates has been greater inmiddle-income compared with high-income member countries(−59% vs. −8%).
• Infant mortality across ESC countries has declined since 1970from 25 per 100 000 births to 3.8 in 2019, but it remains higherin middle-income compared with high-income countries (9.0 vs.3.0 per 100 000 births).
• Ethnicity statistics are incomplete but show that in selectedmiddle-income and high-income ESC member countries medianproportions of indigenous populations were similar (83.3% and83.1%, respectively), varying across countries from ,50% to.95%.
• Urbanization is advancing across ESC member countries. In1970, a median of 52.3% of people lived in urban environments,but by 2019 this had increased to 69.4% with middle-income po-pulations generally less urbanized than high-income populations(62.1 vs. 75.6%).
Figure 11 Unemployment levels in European Society ofCardiology member countries, stratified by sex and national in-come status.
16 A. Timmis et al.D
ownloaded from
https://academic.oup.com
/eurheartj/advance-article/doi/10.1093/eurheartj/ehab892/6472699 by guest on 12 January 2022
• Socioeconomic status showed large disparities betweenmiddle-income and high-income member countries. This wasreflected in differences in median income ($15118 vs. $44248)tertiary education (8.9% vs. 14.9%) and declines in unemploy-ment (−17.5% vs. −29%).
CommentNational sociodemographic characteristics described in this reportprovide important context for interpreting the CVD statistics thatburden ESC member countries. The ageing populations of high-income European countries where fertility rates have fallen belowreplacement levels, largely account for continuing high rates ofCVD mortality with a declining trend most apparent inage-standardized analyses. However, ESC Atlas data confirm re-ports showing that life expectancy – and with it the proportionof over 65 s - is increasing in many middle-income countries atrates similar to high-income countries and this will acceleratethe growing burden of CVD.64
The evolving age structures of ESCmember countries, with evergreater proportions of their populations aged .65 years, willmake sustained reductions in the prevalence of CVD difficult toachieve. The spread of urbanization across Europe during the tran-sition from agricultural to industrial and service economies will addto the difficulty by exposing increasing numbers of people to theair pollution, noise, social deprivation, and stress that are associatewith urban living (see chapter 5). ESC Atlas data show that urba-nization in middle-income ESC member countries is lower com-pared with high-income countries but has been increasing at asimilar rate and in the context of an ageing population, the conse-quences for the burden of CVD will doubtless be considerable.Recognition of the adverse health consequences of urbanizationhas prompted calls for planners to modify urban fabric to facilitatehealthy choices among city dwellers.65
As fertility rates fall below replacement levels in ESC membercountries and population ageing increases, the need for young im-migrant groups to supplement the workforce and provide supportfor the elderly becomes more pressing. Ethnicity data in the ESCAtlas are incomplete but confirm that in many member countries20% or more of the populations comprise minority ethnic groups.Socioeconomic deprivation is common in these groups and iscompounded by a range of health inequalities many of which arean indirect consequence of discrimination and racism.30–40
Premature CHD, for example, blights the lives of young SouthAsian males living in the UK, Canada, and elsewhere in the worldwhile black African and Afro-Caribbean populations show en-hanced predisposition to hypertension, heart failure andstroke.66–68 Yet evidence shows that health outcomes for ethnicminority groups are as good as indigenous populations once thehealthcare system has been accessed.66,69 This has important im-plications for the policy which needs to be directed at CVD pre-vention by improving access to healthy life choices andfacilitating navigation of healthcare systems.Socioeconomic status is by definition lower among those living
in middle-income compared with high-income ESC member coun-tries and underpins many of the health inequalities described in thisreport. Lower SES in middle-income countries is reflected in
differences in GDP per capita, educational attainment and employ-ment all of which combine to reduce access to healthy life choicesand high-quality healthcare. Many of the inequalities in CVD be-tween middle-income and high-income ESC member countries, in-cluding the prevalence of smoking, hypertension and diabetes, canbe attributed indirectly to differences in SES. While short term po-licies to reduce these inequalities must continue to focus on pri-mary prevention, long-term solutions will depend on economicgrowth and resolution of socioeconomic differences betweenmiddle-income and high-income ESC member countries.
Healthcare expenditure andfunding of cardiovascular care
IntroductionIn this section. we consider the financial burden of CVD and thedifferent types of funding across ESC member countries.Estimates of financial burden are limited to those countries thathave been the subject of systematic reviews and comparativehealth economic studies.70,71 Incomes and costs are quoted inUSD according to WB convention, or in Euros (€), dependingon the data source. We explore associations between the typesof funding and volumes of CVD services.
Health expenditure across EuropeanSociety of Cardiology member countriesCurrent health expenditure across EuropeanSociety of Cardiology countriesCurrent health expenditure quantifies the total healthcare spendusing a common currency unit adjusted to take into account thedifferent purchasing power parity of national currencies. ESCmember countries have very different healthcare systems, institu-tional contexts and income levels. It is not surprising, therefore,that CHE per capita in 2018 varied widely from approximatelyUSD 260 in Kyrgyzstan to USD 8114 in Switzerland.72 Even afteradjusting for local purchasing power, high-income countries spent,on average, four times more on healthcare than those in themiddle-income group. Within the high-income group, the expend-iture range was considerable. Switzerland, Norway, Germany, andLuxembourg all spent more than USD 6000 per capita, followedby seven countries spending more than USD 5000 per capita.Among middle-income countries, Montenegro, Bulgaria, RussianFederation, Serbia, and Bosnia Herzegovina had the highest ex-penditure at more than USD 1300 per capita while Kyrgyzstan,Uzbekistan, Morocco, and Republic of Moldova were at the bot-tom of the list, spending between USD 260 and USD 480 per ca-pita (Figure 12).
When the share of current health expenditures funded from do-mestic private sources is considered, further differences betweenhigh- and middle-income countries become apparent. In 2018, pri-vate sources accounted for 28% of the health spending in high-income countries, ranging from just 13% in Luxembourg and14% in Sweden, up to 68% in Switzerland. Compare this withmiddle-income countries, where 47% of the health spend wasfrom private sources, peaking at .70% in countries such as
European Society of Cardiology 17D
ownloaded from
https://academic.oup.com
/eurheartj/advance-article/doi/10.1093/eurheartj/ehab892/6472699 by guest on 12 January 2022
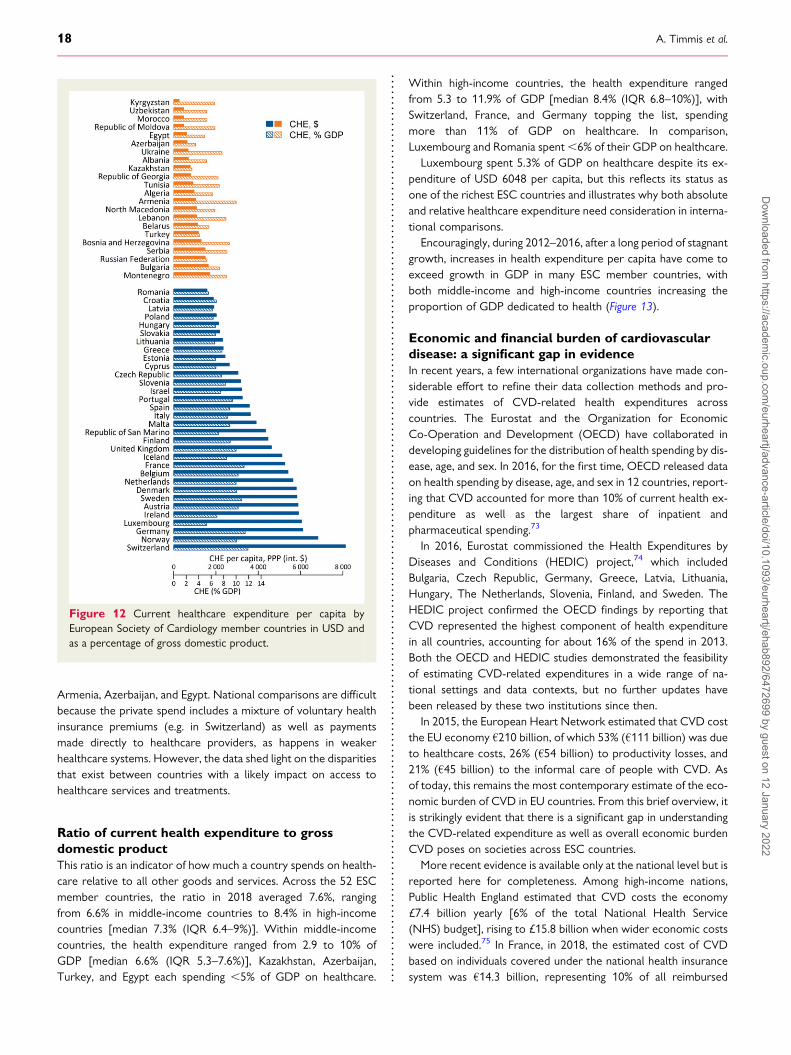
Armenia, Azerbaijan, and Egypt. National comparisons are difficultbecause the private spend includes a mixture of voluntary healthinsurance premiums (e.g. in Switzerland) as well as paymentsmade directly to healthcare providers, as happens in weakerhealthcare systems. However, the data shed light on the disparitiesthat exist between countries with a likely impact on access tohealthcare services and treatments.
Ratio of current health expenditure to grossdomestic productThis ratio is an indicator of how much a country spends on health-care relative to all other goods and services. Across the 52 ESCmember countries, the ratio in 2018 averaged 7.6%, rangingfrom 6.6% in middle-income countries to 8.4% in high-incomecountries [median 7.3% (IQR 6.4–9%)]. Within middle-incomecountries, the health expenditure ranged from 2.9 to 10% ofGDP [median 6.6% (IQR 5.3–7.6%)], Kazakhstan, Azerbaijan,Turkey, and Egypt each spending ,5% of GDP on healthcare.
Within high-income countries, the health expenditure rangedfrom 5.3 to 11.9% of GDP [median 8.4% (IQR 6.8–10%)], withSwitzerland, France, and Germany topping the list, spendingmore than 11% of GDP on healthcare. In comparison,Luxembourg and Romania spent,6% of their GDP on healthcare.
Luxembourg spent 5.3% of GDP on healthcare despite its ex-penditure of USD 6048 per capita, but this reflects its status asone of the richest ESC countries and illustrates why both absoluteand relative healthcare expenditure need consideration in interna-tional comparisons.
Encouragingly, during 2012–2016, after a long period of stagnantgrowth, increases in health expenditure per capita have come toexceed growth in GDP in many ESC member countries, withboth middle-income and high-income countries increasing theproportion of GDP dedicated to health (Figure 13).
Economic and financial burden of cardiovasculardisease: a significant gap in evidenceIn recent years, a few international organizations have made con-siderable effort to refine their data collection methods and pro-vide estimates of CVD-related health expenditures acrosscountries. The Eurostat and the Organization for EconomicCo-Operation and Development (OECD) have collaborated indeveloping guidelines for the distribution of health spending by dis-ease, age, and sex. In 2016, for the first time, OECD released dataon health spending by disease, age, and sex in 12 countries, report-ing that CVD accounted for more than 10% of current health ex-penditure as well as the largest share of inpatient andpharmaceutical spending.73
In 2016, Eurostat commissioned the Health Expenditures byDiseases and Conditions (HEDIC) project,74 which includedBulgaria, Czech Republic, Germany, Greece, Latvia, Lithuania,Hungary, The Netherlands, Slovenia, Finland, and Sweden. TheHEDIC project confirmed the OECD findings by reporting thatCVD represented the highest component of health expenditurein all countries, accounting for about 16% of the spend in 2013.Both the OECD and HEDIC studies demonstrated the feasibilityof estimating CVD-related expenditures in a wide range of na-tional settings and data contexts, but no further updates havebeen released by these two institutions since then.
In 2015, the European Heart Network estimated that CVD costthe EU economy €210 billion, of which 53% (€111 billion) was dueto healthcare costs, 26% (€54 billion) to productivity losses, and21% (€45 billion) to the informal care of people with CVD. Asof today, this remains the most contemporary estimate of the eco-nomic burden of CVD in EU countries. From this brief overview, itis strikingly evident that there is a significant gap in understandingthe CVD-related expenditure as well as overall economic burdenCVD poses on societies across ESC countries.
More recent evidence is available only at the national level but isreported here for completeness. Among high-income nations,Public Health England estimated that CVD costs the economy£7.4 billion yearly [6% of the total National Health Service(NHS) budget], rising to £15.8 billion when wider economic costswere included.75 In France, in 2018, the estimated cost of CVDbased on individuals covered under the national health insurancesystem was €14.3 billion, representing 10% of all reimbursed
Figure 12 Current healthcare expenditure per capita byEuropean Society of Cardiology member countries in USD andas a percentage of gross domestic product.
18 A. Timmis et al.D
ownloaded from
https://academic.oup.com
/eurheartj/advance-article/doi/10.1093/eurheartj/ehab892/6472699 by guest on 12 January 2022
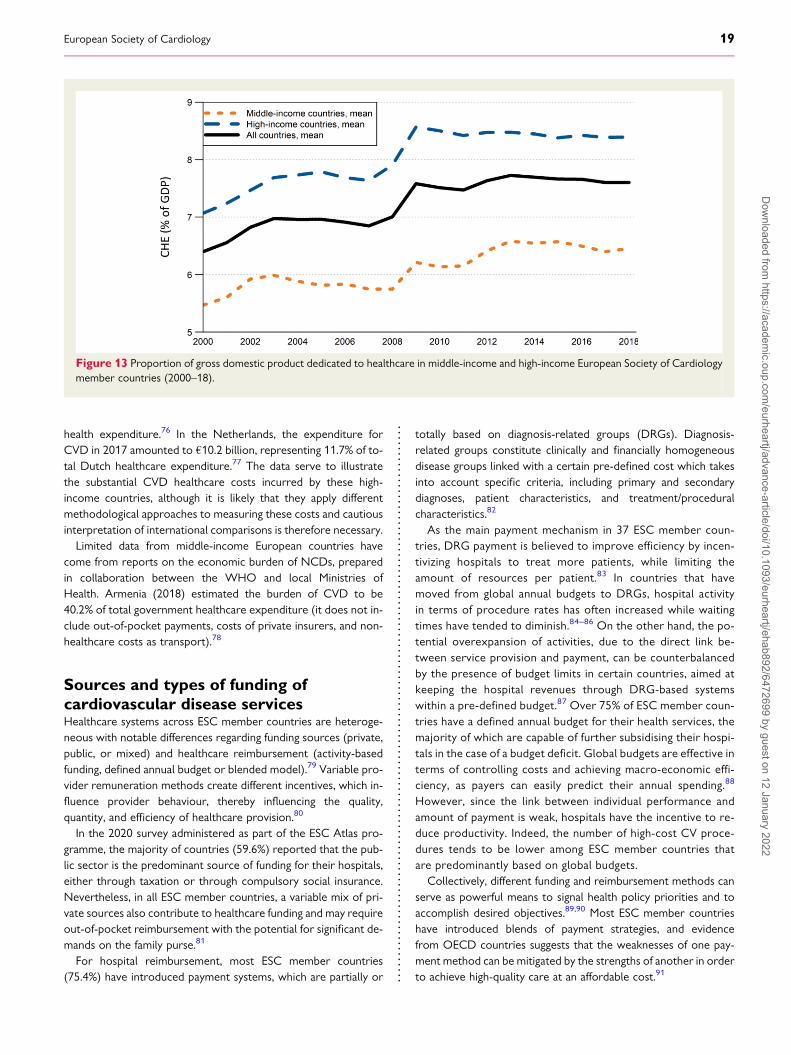
health expenditure.76 In the Netherlands, the expenditure forCVD in 2017 amounted to €10.2 billion, representing 11.7% of to-tal Dutch healthcare expenditure.77 The data serve to illustratethe substantial CVD healthcare costs incurred by these high-income countries, although it is likely that they apply differentmethodological approaches to measuring these costs and cautiousinterpretation of international comparisons is therefore necessary.Limited data from middle-income European countries have
come from reports on the economic burden of NCDs, preparedin collaboration between the WHO and local Ministries ofHealth. Armenia (2018) estimated the burden of CVD to be40.2% of total government healthcare expenditure (it does not in-clude out-of-pocket payments, costs of private insurers, and non-healthcare costs as transport).78
Sources and types of funding ofcardiovascular disease servicesHealthcare systems across ESC member countries are heteroge-neous with notable differences regarding funding sources (private,public, or mixed) and healthcare reimbursement (activity-basedfunding, defined annual budget or blended model).79 Variable pro-vider remuneration methods create different incentives, which in-fluence provider behaviour, thereby influencing the quality,quantity, and efficiency of healthcare provision.80
In the 2020 survey administered as part of the ESC Atlas pro-gramme, the majority of countries (59.6%) reported that the pub-lic sector is the predominant source of funding for their hospitals,either through taxation or through compulsory social insurance.Nevertheless, in all ESC member countries, a variable mix of pri-vate sources also contribute to healthcare funding and may requireout-of-pocket reimbursement with the potential for significant de-mands on the family purse.81
For hospital reimbursement, most ESC member countries(75.4%) have introduced payment systems, which are partially or
totally based on diagnosis-related groups (DRGs). Diagnosis-related groups constitute clinically and financially homogeneousdisease groups linked with a certain pre-defined cost which takesinto account specific criteria, including primary and secondarydiagnoses, patient characteristics, and treatment/proceduralcharacteristics.82
As the main payment mechanism in 37 ESC member coun-tries, DRG payment is believed to improve efficiency by incen-tivizing hospitals to treat more patients, while limiting theamount of resources per patient.83 In countries that havemoved from global annual budgets to DRGs, hospital activityin terms of procedure rates has often increased while waitingtimes have tended to diminish.84–86 On the other hand, the po-tential overexpansion of activities, due to the direct link be-tween service provision and payment, can be counterbalancedby the presence of budget limits in certain countries, aimed atkeeping the hospital revenues through DRG-based systemswithin a pre-defined budget.87 Over 75% of ESC member coun-tries have a defined annual budget for their health services, themajority of which are capable of further subsidising their hospi-tals in the case of a budget deficit. Global budgets are effective interms of controlling costs and achieving macro-economic effi-ciency, as payers can easily predict their annual spending.88
However, since the link between individual performance andamount of payment is weak, hospitals have the incentive to re-duce productivity. Indeed, the number of high-cost CV proce-dures tends to be lower among ESC member countries thatare predominantly based on global budgets.
Collectively, different funding and reimbursement methods canserve as powerful means to signal health policy priorities and toaccomplish desired objectives.89,90 Most ESC member countrieshave introduced blends of payment strategies, and evidencefrom OECD countries suggests that the weaknesses of one pay-ment method can be mitigated by the strengths of another in orderto achieve high-quality care at an affordable cost.91
Figure 13 Proportion of gross domestic product dedicated to healthcare in middle-income and high-income European Society of Cardiologymember countries (2000–18).
European Society of Cardiology 19D
ownloaded from
https://academic.oup.com
/eurheartj/advance-article/doi/10.1093/eurheartj/ehab892/6472699 by guest on 12 January 2022
Summary
• In 2018, high-income countries spent, on average, four timesmore on healthcare than middle-income countries.
• In 2018, the ratio of current health expenditure to GDP rangedfrom 6.6% in middle-income countries to 8.4% in high-incomecountries.
• In a 2016 OECD report from 12 countries, CVD accounted formore than 10% of current health expenditure as well as the lar-gest share of inpatient and pharmaceutical spending.
• The 2016 HEDIC project report from 11 European countriesconfirmed that CVD represented the highest component ofhealth expenditure, accounting for about 16% of the spend.
• In 2015, the European Heart Network estimated that CVD costthe EU economy €210 billion. This remains the most recent es-timate of the economic burden of CVD in EU countries.
• Public Health England estimated that CVD costs the economy£7.4 billion yearly (6% of the total NHS budget), rising to £15.8 billion when wider economic costs were included.
• The public sector is the predominant source of hospital fundingin .50% of ESC member countries.
• For hospital reimbursement, .75% of ESC member countrieshave introduced payment systems based on DRGs.
• The number of CV procedures tends to be higher among thoseESC member countries that use DRGs.
• More than 75% of ESC member countries have a defined annualbudget for health services, meaning that annual hospital ex-penses for each hospital must remain within certain limits.
CommentCVD has major economic consequences that affect individuals,health systems, and societies across the globe. It is estimatedthat total (medical and indirect) costs of CVD in the UnitedStates will double from USD 555 billion in 2015 to a staggeringUSD 1.1 trillion in 2035. Vl.92 Variable rises in costs of CVD arelikely to occur globally, reflecting the interaction of multiple fac-tors including:
• Completion of the epidemiological transition from infectious toNCD in many low-income countries where CVD has now be-come the leading cause of death,
• Population ageing,• Technological costs of management hardware.
In order to meet the economic challenges of CVD, policy-makers need access to reliable information about the directhealthcare costs of CVD and the broader impacts on nationaleconomies. As reported above, information about CVD-relatedhealth expenditures across European countries is sparse and re-stricted to a limited number of countries included in the OECDand HEDIC projects.76,77 The findings, however, have been con-sistent in showing that CVD represents the highest componentof healthcare expenditure accounting for about 16% of the na-tional spend. As populations age and technological costs increase,CVD will further erode national economies unless policymakersact to protect their populations against the disease burden.Nowhere is this more important than in the middle-income ESC
member countries where rates of CVD are highest and nationaleconomies are least able to fund its spiralling costs.
Environment, lifestyle, and clinicalrisk factorsEnvironmental, lifestyle, and clinical factors, have been identified askey determinants of CVD risk.93,94 The extent to which these fac-tors are amenable to modification determines their importance forrisk reduction at individual and population levels.95 The steep de-clines in CVDmortality seen in many high-income countries duringthe last 50 years have been driven largely by interventions targetedat-risk factor modification.96 In France, for example, populationCV health, based on a basket of lifestyle and risk factor metrics,has improved significantly during this period.97 In less prosperouseconomies, the adoption of western lifestyles has contributed toCVD taking over from infectious disease and dietary deprivationas the major cause of death.98 These epidemiological changesare a reminder that CVD is mainly a preventable disorder andthat modifications to risk factor prevalence provide the most ef-fective means of reducing the burden of disease in Europe andacross the world.99,100
Environmental risk factorsAir pollution and noise are responsible for over 75% of the diseaseburden attributable to environmental risk factors.94,101 Each year,an estimated 48 000 new cases of CHD* occur across Europe dueto environmental noise pollution.102 According to the WHO,about 58% of air-pollution-related mortality is caused by CVD.Migrant studies lend further support to the role of the environ-ment as a risk factor by showing that South Asians living in theUK have a higher CVD risk than those living in South Asia103 whileFinnish twins living in Sweden have lower rates of CHD than theirco-twins living in Finland,104 confirming that environmentalchanges can modify risk independently of genetic factors.
Air pollutionPollution with particulate matter and gases has various causes in-cluding residential and commercial energy use, agriculture, landtraffic, and power generation. It is a major health hazard responsi-ble for 7.6% of global DALYs94 and linked to 6.5 million prematuredeaths annually,105 rivalling the impact of smoking, hypertension,and physical inactivity on population health.106 Premature deathsassociated with exposure to fine particulate matter (PM2.5) areusually attributed to CVD and the European Union (EU) hasnow set an air quality standard for PM2.5 equal to 25 μg/m3.107
Although the link between PM2.5 exposure and CVD has been dif-ficult to confirm,108,109 the weight of evidence is supportive110,111
and the adverse effects of air pollution on population health arenot in dispute. Residential location moderates vulnerability to am-bient air pollution, with individuals living close to busy roads show-ing heightened susceptibility to CVD risk.112,113 It is estimated thatair pollution reduces the mean life expectancy in Europe by about2.2 years with an annual, attributable per capita mortality rate inEurope of 133/100 000 people per year.114
20 A. Timmis et al.D
ownloaded from
https://academic.oup.com
/eurheartj/advance-article/doi/10.1093/eurheartj/ehab892/6472699 by guest on 12 January 2022
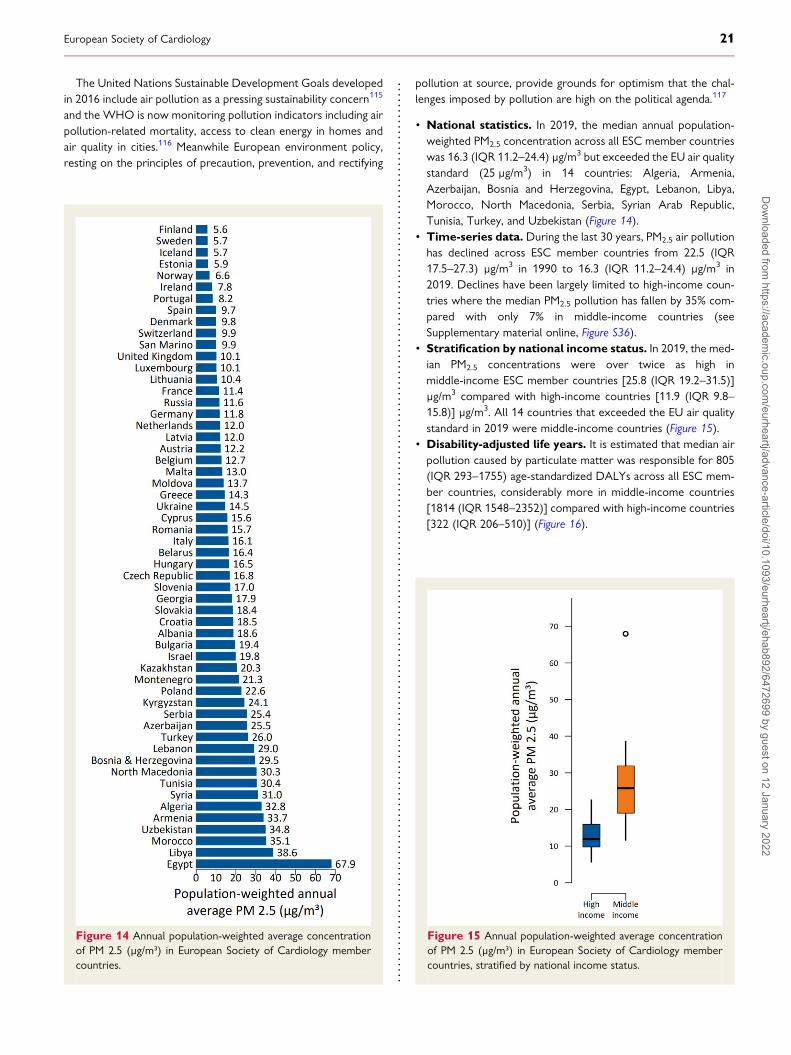
The United Nations Sustainable Development Goals developedin 2016 include air pollution as a pressing sustainability concern115
and the WHO is now monitoring pollution indicators including airpollution-related mortality, access to clean energy in homes andair quality in cities.116 Meanwhile European environment policy,resting on the principles of precaution, prevention, and rectifying
pollution at source, provide grounds for optimism that the chal-lenges imposed by pollution are high on the political agenda.117
• National statistics. In 2019, the median annual population-weighted PM2.5 concentration across all ESC member countrieswas 16.3 (IQR 11.2–24.4) μg/m3 but exceeded the EU air qualitystandard (25 μg/m3) in 14 countries: Algeria, Armenia,Azerbaijan, Bosnia and Herzegovina, Egypt, Lebanon, Libya,Morocco, North Macedonia, Serbia, Syrian Arab Republic,Tunisia, Turkey, and Uzbekistan (Figure 14).
• Time-series data. During the last 30 years, PM2.5 air pollutionhas declined across ESC member countries from 22.5 (IQR17.5–27.3) μg/m3 in 1990 to 16.3 (IQR 11.2–24.4) μg/m3 in2019. Declines have been largely limited to high-income coun-tries where the median PM2.5 pollution has fallen by 35% com-pared with only 7% in middle-income countries (seeSupplementary material online, Figure S36).
• Stratification by national income status. In 2019, the med-ian PM2.5 concentrations were over twice as high inmiddle-income ESC member countries [25.8 (IQR 19.2–31.5)]μg/m3 compared with high-income countries [11.9 (IQR 9.8–15.8)] μg/m3. All 14 countries that exceeded the EU air qualitystandard in 2019 were middle-income countries (Figure 15).
• Disability-adjusted life years. It is estimated that median airpollution caused by particulate matter was responsible for 805(IQR 293–1755) age-standardized DALYs across all ESC mem-ber countries, considerably more in middle-income countries[1814 (IQR 1548–2352)] compared with high-income countries[322 (IQR 206–510)] (Figure 16).
Figure 14 Annual population-weighted average concentrationof PM 2.5 (μg/m³) in European Society of Cardiology membercountries.
Figure 15 Annual population-weighted average concentrationof PM 2.5 (μg/m³) in European Society of Cardiology membercountries, stratified by national income status.
European Society of Cardiology 21D
ownloaded from
https://academic.oup.com
/eurheartj/advance-article/doi/10.1093/eurheartj/ehab892/6472699 by guest on 12 January 2022
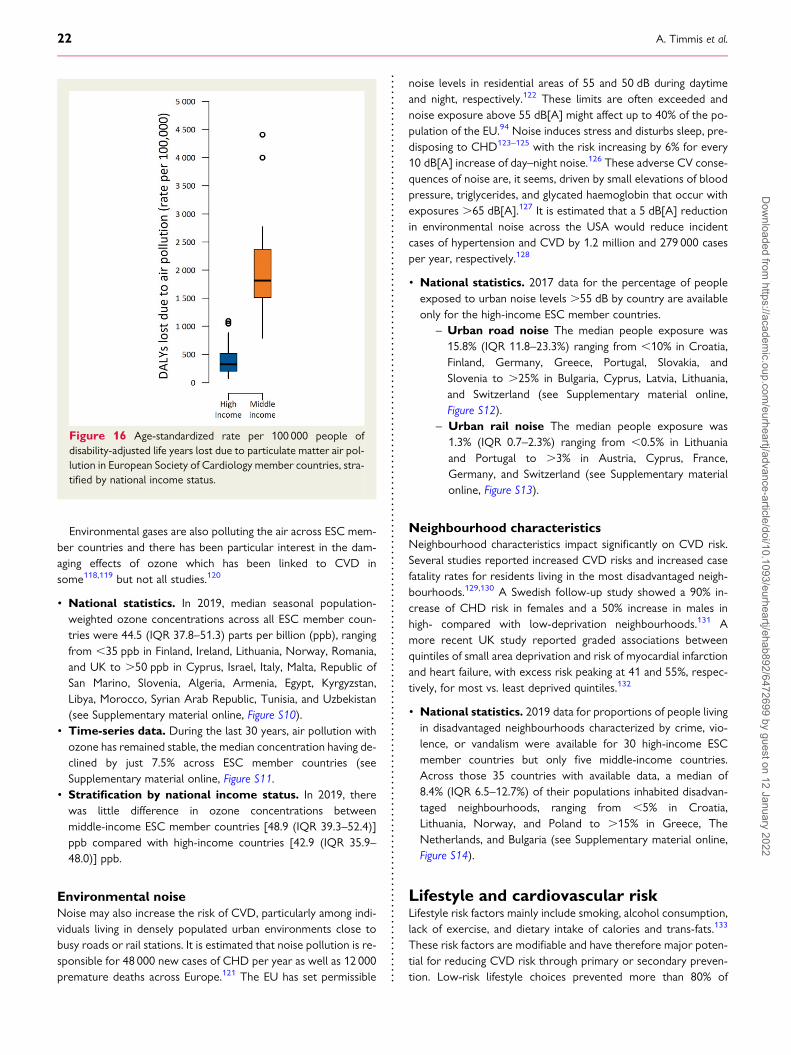
Environmental gases are also polluting the air across ESC mem-ber countries and there has been particular interest in the dam-aging effects of ozone which has been linked to CVD insome118,119 but not all studies.120
• National statistics. In 2019, median seasonal population-weighted ozone concentrations across all ESC member coun-tries were 44.5 (IQR 37.8–51.3) parts per billion (ppb), rangingfrom ,35 ppb in Finland, Ireland, Lithuania, Norway, Romania,and UK to .50 ppb in Cyprus, Israel, Italy, Malta, Republic ofSan Marino, Slovenia, Algeria, Armenia, Egypt, Kyrgyzstan,Libya, Morocco, Syrian Arab Republic, Tunisia, and Uzbekistan(see Supplementary material online, Figure S10).
• Time-series data. During the last 30 years, air pollution withozone has remained stable, the median concentration having de-clined by just 7.5% across ESC member countries (seeSupplementary material online, Figure S11.
• Stratification by national income status. In 2019, therewas little difference in ozone concentrations betweenmiddle-income ESC member countries [48.9 (IQR 39.3–52.4)]ppb compared with high-income countries [42.9 (IQR 35.9–48.0)] ppb.
Environmental noiseNoise may also increase the risk of CVD, particularly among indi-viduals living in densely populated urban environments close tobusy roads or rail stations. It is estimated that noise pollution is re-sponsible for 48 000 new cases of CHD per year as well as 12 000premature deaths across Europe.121 The EU has set permissible
noise levels in residential areas of 55 and 50 dB during daytimeand night, respectively.122 These limits are often exceeded andnoise exposure above 55 dB[A] might affect up to 40% of the po-pulation of the EU.94 Noise induces stress and disturbs sleep, pre-disposing to CHD123–125 with the risk increasing by 6% for every10 dB[A] increase of day–night noise.126 These adverse CV conse-quences of noise are, it seems, driven by small elevations of bloodpressure, triglycerides, and glycated haemoglobin that occur withexposures .65 dB[A].127 It is estimated that a 5 dB[A] reductionin environmental noise across the USA would reduce incidentcases of hypertension and CVD by 1.2 million and 279 000 casesper year, respectively.128
• National statistics. 2017 data for the percentage of peopleexposed to urban noise levels .55 dB by country are availableonly for the high-income ESC member countries.
– Urban road noise The median people exposure was15.8% (IQR 11.8–23.3%) ranging from ,10% in Croatia,Finland, Germany, Greece, Portugal, Slovakia, andSlovenia to .25% in Bulgaria, Cyprus, Latvia, Lithuania,and Switzerland (see Supplementary material online,Figure S12).
– Urban rail noise The median people exposure was1.3% (IQR 0.7–2.3%) ranging from ,0.5% in Lithuaniaand Portugal to .3% in Austria, Cyprus, France,Germany, and Switzerland (see Supplementary materialonline, Figure S13).
Neighbourhood characteristicsNeighbourhood characteristics impact significantly on CVD risk.Several studies reported increased CVD risks and increased casefatality rates for residents living in the most disadvantaged neigh-bourhoods.129,130 A Swedish follow-up study showed a 90% in-crease of CHD risk in females and a 50% increase in males inhigh- compared with low-deprivation neighbourhoods.131 Amore recent UK study reported graded associations betweenquintiles of small area deprivation and risk of myocardial infarctionand heart failure, with excess risk peaking at 41 and 55%, respec-tively, for most vs. least deprived quintiles.132
• National statistics. 2019 data for proportions of people livingin disadvantaged neighbourhoods characterized by crime, vio-lence, or vandalism were available for 30 high-income ESCmember countries but only five middle-income countries.Across those 35 countries with available data, a median of8.4% (IQR 6.5–12.7%) of their populations inhabited disadvan-taged neighbourhoods, ranging from ,5% in Croatia,Lithuania, Norway, and Poland to .15% in Greece, TheNetherlands, and Bulgaria (see Supplementary material online,Figure S14).
Lifestyle and cardiovascular riskLifestyle risk factors mainly include smoking, alcohol consumption,lack of exercise, and dietary intake of calories and trans-fats.133
These risk factors are modifiable and have therefore major poten-tial for reducing CVD risk through primary or secondary preven-tion. Low-risk lifestyle choices prevented more than 80% of
Figure 16 Age-standardized rate per 100 000 people ofdisability-adjusted life years lost due to particulate matter air pol-lution in European Society of Cardiology member countries, stra-tified by national income status.
22 A. Timmis et al.D
ownloaded from
https://academic.oup.com
/eurheartj/advance-article/doi/10.1093/eurheartj/ehab892/6472699 by guest on 12 January 2022
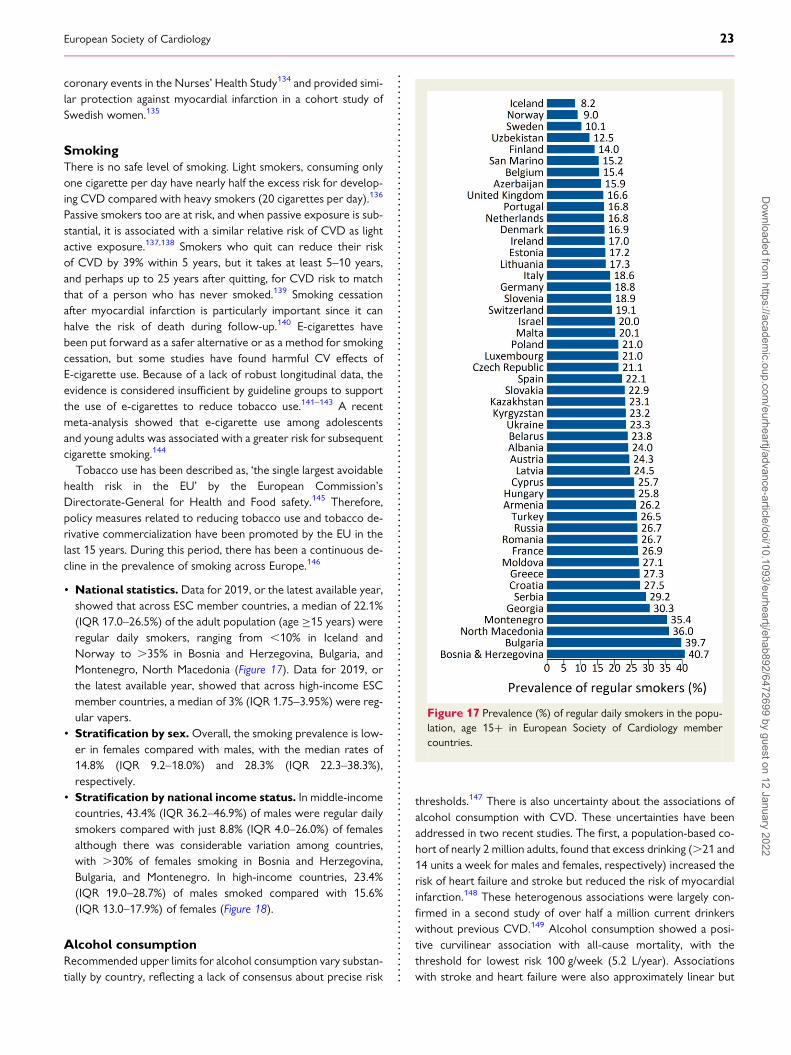
coronary events in the Nurses’ Health Study134 and provided simi-lar protection against myocardial infarction in a cohort study ofSwedish women.135
SmokingThere is no safe level of smoking. Light smokers, consuming onlyone cigarette per day have nearly half the excess risk for develop-ing CVD compared with heavy smokers (20 cigarettes per day).136
Passive smokers too are at risk, and when passive exposure is sub-stantial, it is associated with a similar relative risk of CVD as lightactive exposure.137,138 Smokers who quit can reduce their riskof CVD by 39% within 5 years, but it takes at least 5–10 years,and perhaps up to 25 years after quitting, for CVD risk to matchthat of a person who has never smoked.139 Smoking cessationafter myocardial infarction is particularly important since it canhalve the risk of death during follow-up.140 E-cigarettes havebeen put forward as a safer alternative or as a method for smokingcessation, but some studies have found harmful CV effects ofE-cigarette use. Because of a lack of robust longitudinal data, theevidence is considered insufficient by guideline groups to supportthe use of e-cigarettes to reduce tobacco use.141–143 A recentmeta-analysis showed that e-cigarette use among adolescentsand young adults was associated with a greater risk for subsequentcigarette smoking.144
Tobacco use has been described as, ‘the single largest avoidablehealth risk in the EU’ by the European Commission’sDirectorate-General for Health and Food safety.145 Therefore,policy measures related to reducing tobacco use and tobacco de-rivative commercialization have been promoted by the EU in thelast 15 years. During this period, there has been a continuous de-cline in the prevalence of smoking across Europe.146
• National statistics. Data for 2019, or the latest available year,showed that across ESC member countries, a median of 22.1%(IQR 17.0–26.5%) of the adult population (age ≥15 years) wereregular daily smokers, ranging from ,10% in Iceland andNorway to .35% in Bosnia and Herzegovina, Bulgaria, andMontenegro, North Macedonia (Figure 17). Data for 2019, orthe latest available year, showed that across high-income ESCmember countries, a median of 3% (IQR 1.75–3.95%) were reg-ular vapers.
• Stratification by sex.Overall, the smoking prevalence is low-er in females compared with males, with the median rates of14.8% (IQR 9.2–18.0%) and 28.3% (IQR 22.3–38.3%),respectively.
• Stratification by national income status. In middle-incomecountries, 43.4% (IQR 36.2–46.9%) of males were regular dailysmokers compared with just 8.8% (IQR 4.0–26.0%) of femalesalthough there was considerable variation among countries,with .30% of females smoking in Bosnia and Herzegovina,Bulgaria, and Montenegro. In high-income countries, 23.4%(IQR 19.0–28.7%) of males smoked compared with 15.6%(IQR 13.0–17.9%) of females (Figure 18).
Alcohol consumptionRecommended upper limits for alcohol consumption vary substan-tially by country, reflecting a lack of consensus about precise risk
thresholds.147 There is also uncertainty about the associations ofalcohol consumption with CVD. These uncertainties have beenaddressed in two recent studies. The first, a population-based co-hort of nearly 2 million adults, found that excess drinking (.21 and14 units a week for males and females, respectively) increased therisk of heart failure and stroke but reduced the risk of myocardialinfarction.148 These heterogenous associations were largely con-firmed in a second study of over half a million current drinkerswithout previous CVD.149 Alcohol consumption showed a posi-tive curvilinear association with all-cause mortality, with thethreshold for lowest risk 100 g/week (5.2 L/year). Associationswith stroke and heart failure were also approximately linear but
Figure 17 Prevalence (%) of regular daily smokers in the popu-lation, age 15+ in European Society of Cardiology membercountries.
European Society of Cardiology 23D
ownloaded from
https://academic.oup.com
/eurheartj/advance-article/doi/10.1093/eurheartj/ehab892/6472699 by guest on 12 January 2022
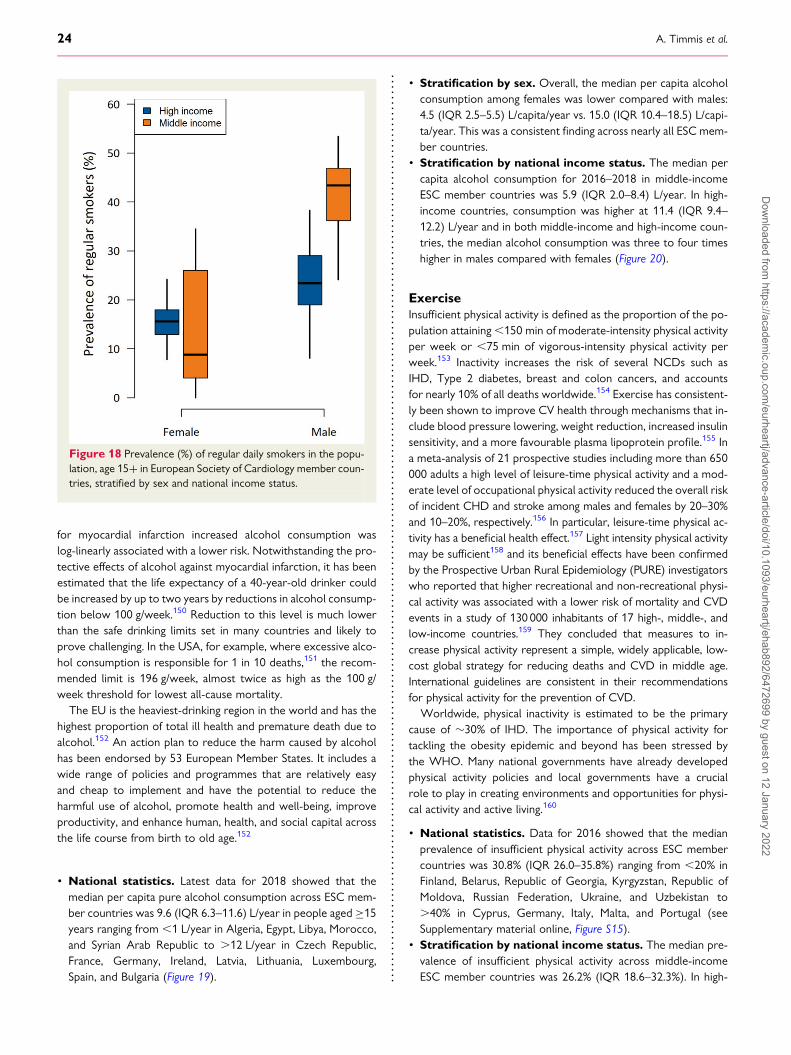
for myocardial infarction increased alcohol consumption waslog-linearly associated with a lower risk. Notwithstanding the pro-tective effects of alcohol against myocardial infarction, it has beenestimated that the life expectancy of a 40-year-old drinker couldbe increased by up to two years by reductions in alcohol consump-tion below 100 g/week.150 Reduction to this level is much lowerthan the safe drinking limits set in many countries and likely toprove challenging. In the USA, for example, where excessive alco-hol consumption is responsible for 1 in 10 deaths,151 the recom-mended limit is 196 g/week, almost twice as high as the 100 g/week threshold for lowest all-cause mortality.
The EU is the heaviest-drinking region in the world and has thehighest proportion of total ill health and premature death due toalcohol.152 An action plan to reduce the harm caused by alcoholhas been endorsed by 53 European Member States. It includes awide range of policies and programmes that are relatively easyand cheap to implement and have the potential to reduce theharmful use of alcohol, promote health and well-being, improveproductivity, and enhance human, health, and social capital acrossthe life course from birth to old age.152
• National statistics. Latest data for 2018 showed that themedian per capita pure alcohol consumption across ESC mem-ber countries was 9.6 (IQR 6.3–11.6) L/year in people aged ≥15years ranging from ,1 L/year in Algeria, Egypt, Libya, Morocco,and Syrian Arab Republic to .12 L/year in Czech Republic,France, Germany, Ireland, Latvia, Lithuania, Luxembourg,Spain, and Bulgaria (Figure 19).
• Stratification by sex. Overall, the median per capita alcoholconsumption among females was lower compared with males:4.5 (IQR 2.5–5.5) L/capita/year vs. 15.0 (IQR 10.4–18.5) L/capi-ta/year. This was a consistent finding across nearly all ESC mem-ber countries.
• Stratification by national income status. The median percapita alcohol consumption for 2016–2018 in middle-incomeESC member countries was 5.9 (IQR 2.0–8.4) L/year. In high-income countries, consumption was higher at 11.4 (IQR 9.4–12.2) L/year and in both middle-income and high-income coun-tries, the median alcohol consumption was three to four timeshigher in males compared with females (Figure 20).
ExerciseInsufficient physical activity is defined as the proportion of the po-pulation attaining,150 min of moderate-intensity physical activityper week or ,75 min of vigorous-intensity physical activity perweek.153 Inactivity increases the risk of several NCDs such asIHD, Type 2 diabetes, breast and colon cancers, and accountsfor nearly 10% of all deaths worldwide.154 Exercise has consistent-ly been shown to improve CV health through mechanisms that in-clude blood pressure lowering, weight reduction, increased insulinsensitivity, and a more favourable plasma lipoprotein profile.155 Ina meta-analysis of 21 prospective studies including more than 650000 adults a high level of leisure-time physical activity and a mod-erate level of occupational physical activity reduced the overall riskof incident CHD and stroke among males and females by 20–30%and 10–20%, respectively.156 In particular, leisure-time physical ac-tivity has a beneficial health effect.157 Light intensity physical activitymay be sufficient158 and its beneficial effects have been confirmedby the Prospective Urban Rural Epidemiology (PURE) investigatorswho reported that higher recreational and non-recreational physi-cal activity was associated with a lower risk of mortality and CVDevents in a study of 130 000 inhabitants of 17 high-, middle-, andlow-income countries.159 They concluded that measures to in-crease physical activity represent a simple, widely applicable, low-cost global strategy for reducing deaths and CVD in middle age.International guidelines are consistent in their recommendationsfor physical activity for the prevention of CVD.
Worldwide, physical inactivity is estimated to be the primarycause of �30% of IHD. The importance of physical activity fortackling the obesity epidemic and beyond has been stressed bythe WHO. Many national governments have already developedphysical activity policies and local governments have a crucialrole to play in creating environments and opportunities for physi-cal activity and active living.160
• National statistics. Data for 2016 showed that the medianprevalence of insufficient physical activity across ESC membercountries was 30.8% (IQR 26.0–35.8%) ranging from ,20% inFinland, Belarus, Republic of Georgia, Kyrgyzstan, Republic ofMoldova, Russian Federation, Ukraine, and Uzbekistan to.40% in Cyprus, Germany, Italy, Malta, and Portugal (seeSupplementary material online, Figure S15).
• Stratification by national income status. The median pre-valence of insufficient physical activity across middle-incomeESC member countries was 26.2% (IQR 18.6–32.3%). In high-
Figure 18 Prevalence (%) of regular daily smokers in the popu-lation, age 15+ in European Society of Cardiology member coun-tries, stratified by sex and national income status.
24 A. Timmis et al.D
ownloaded from
https://academic.oup.com
/eurheartj/advance-article/doi/10.1093/eurheartj/ehab892/6472699 by guest on 12 January 2022
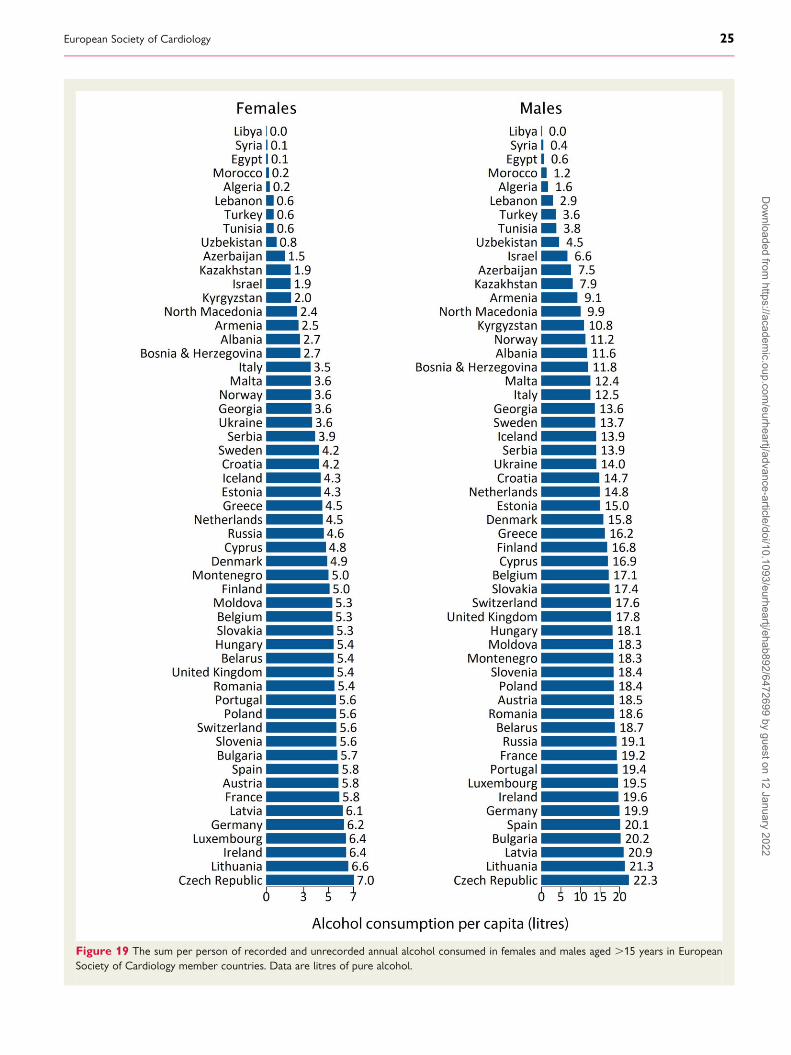
Figure 19 The sum per person of recorded and unrecorded annual alcohol consumed in females and males aged .15 years in EuropeanSociety of Cardiology member countries. Data are litres of pure alcohol.
European Society of Cardiology 25D
ownloaded from
https://academic.oup.com
/eurheartj/advance-article/doi/10.1093/eurheartj/ehab892/6472699 by guest on 12 January 2022
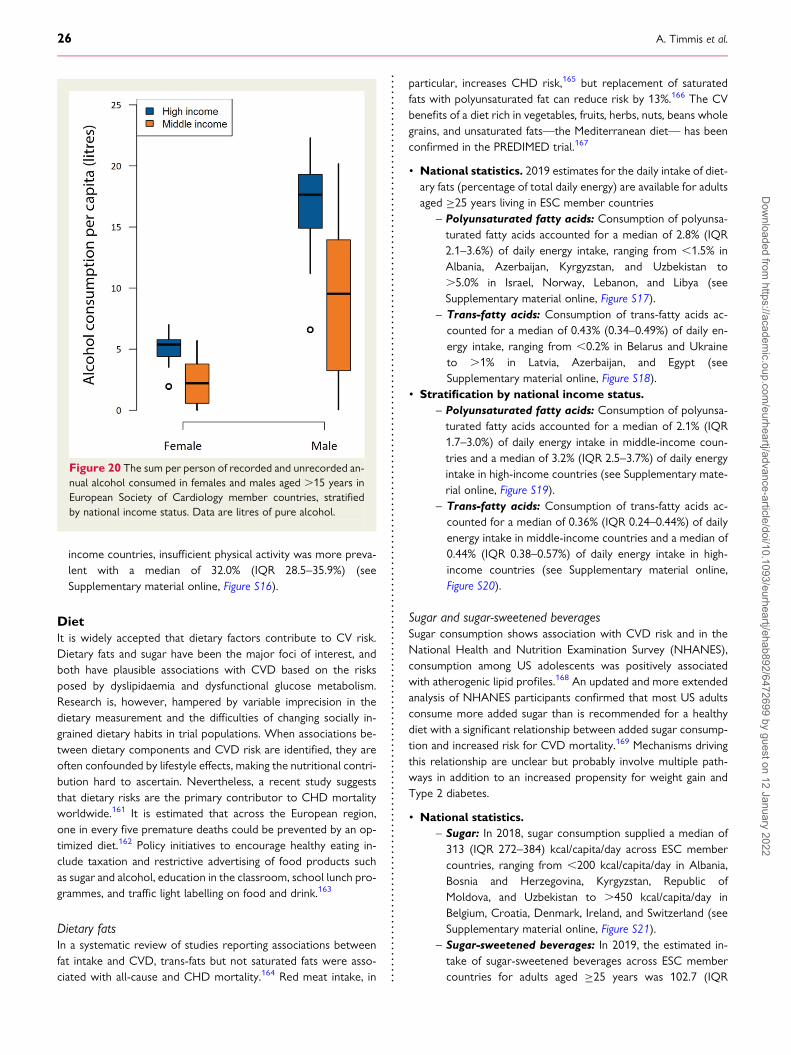
income countries, insufficient physical activity was more preva-lent with a median of 32.0% (IQR 28.5–35.9%) (seeSupplementary material online, Figure S16).
DietIt is widely accepted that dietary factors contribute to CV risk.Dietary fats and sugar have been the major foci of interest, andboth have plausible associations with CVD based on the risksposed by dyslipidaemia and dysfunctional glucose metabolism.Research is, however, hampered by variable imprecision in thedietary measurement and the difficulties of changing socially in-grained dietary habits in trial populations. When associations be-tween dietary components and CVD risk are identified, they areoften confounded by lifestyle effects, making the nutritional contri-bution hard to ascertain. Nevertheless, a recent study suggeststhat dietary risks are the primary contributor to CHD mortalityworldwide.161 It is estimated that across the European region,one in every five premature deaths could be prevented by an op-timized diet.162 Policy initiatives to encourage healthy eating in-clude taxation and restrictive advertising of food products suchas sugar and alcohol, education in the classroom, school lunch pro-grammes, and traffic light labelling on food and drink.163
Dietary fatsIn a systematic review of studies reporting associations betweenfat intake and CVD, trans-fats but not saturated fats were asso-ciated with all-cause and CHD mortality.164 Red meat intake, in
particular, increases CHD risk,165 but replacement of saturatedfats with polyunsaturated fat can reduce risk by 13%.166 The CVbenefits of a diet rich in vegetables, fruits, herbs, nuts, beans wholegrains, and unsaturated fats—the Mediterranean diet— has beenconfirmed in the PREDIMED trial.167
• National statistics. 2019 estimates for the daily intake of diet-ary fats (percentage of total daily energy) are available for adultsaged ≥25 years living in ESC member countries
– Polyunsaturated fatty acids: Consumption of polyunsa-turated fatty acids accounted for a median of 2.8% (IQR2.1–3.6%) of daily energy intake, ranging from ,1.5% inAlbania, Azerbaijan, Kyrgyzstan, and Uzbekistan to.5.0% in Israel, Norway, Lebanon, and Libya (seeSupplementary material online, Figure S17).
– Trans-fatty acids: Consumption of trans-fatty acids ac-counted for a median of 0.43% (0.34–0.49%) of daily en-ergy intake, ranging from ,0.2% in Belarus and Ukraineto .1% in Latvia, Azerbaijan, and Egypt (seeSupplementary material online, Figure S18).
• Stratification by national income status.– Polyunsaturated fatty acids: Consumption of polyunsa-turated fatty acids accounted for a median of 2.1% (IQR1.7–3.0%) of daily energy intake in middle-income coun-tries and a median of 3.2% (IQR 2.5–3.7%) of daily energyintake in high-income countries (see Supplementary mate-rial online, Figure S19).
– Trans-fatty acids: Consumption of trans-fatty acids ac-counted for a median of 0.36% (IQR 0.24–0.44%) of dailyenergy intake in middle-income countries and a median of0.44% (IQR 0.38–0.57%) of daily energy intake in high-income countries (see Supplementary material online,Figure S20).
Sugar and sugar-sweetened beveragesSugar consumption shows association with CVD risk and in theNational Health and Nutrition Examination Survey (NHANES),consumption among US adolescents was positively associatedwith atherogenic lipid profiles.168 An updated and more extendedanalysis of NHANES participants confirmed that most US adultsconsume more added sugar than is recommended for a healthydiet with a significant relationship between added sugar consump-tion and increased risk for CVD mortality.169 Mechanisms drivingthis relationship are unclear but probably involve multiple path-ways in addition to an increased propensity for weight gain andType 2 diabetes.
• National statistics.– Sugar: In 2018, sugar consumption supplied a median of313 (IQR 272–384) kcal/capita/day across ESC membercountries, ranging from ,200 kcal/capita/day in Albania,Bosnia and Herzegovina, Kyrgyzstan, Republic ofMoldova, and Uzbekistan to .450 kcal/capita/day inBelgium, Croatia, Denmark, Ireland, and Switzerland (seeSupplementary material online, Figure S21).
– Sugar-sweetened beverages: In 2019, the estimated in-take of sugar-sweetened beverages across ESC membercountries for adults aged ≥25 years was 102.7 (IQR
Figure 20 The sum per person of recorded and unrecorded an-nual alcohol consumed in females and males aged .15 years inEuropean Society of Cardiology member countries, stratifiedby national income status. Data are litres of pure alcohol.
26 A. Timmis et al.D
ownloaded from
https://academic.oup.com
/eurheartj/advance-article/doi/10.1093/eurheartj/ehab892/6472699 by guest on 12 January 2022

57.7–131.9) g/day, ranging from ,25 g/day in Armenia,Republic of Moldova, and Ukraine to .150 g/day inBelgium, Croatia, Ireland, Israel, Luxembourg, Malta,Netherlands, Poland, Romania, Republic of San Marino,and Spain (see Supplementary material online, Figure S22).
• Stratification by national income status.– Sugar: In 2018, sugar consumption supplied a median of291 (IQR 213–343) kcal/capita/day in middle-incomecountries, little different from the 306 (IQR 231–358)kcal/capita/day consumed in 2014. In high-income coun-tries, the 2018 sugar consumption was higher at 338(IQR 282–436) kcal/capita/day, slightly less than the 355(IQR 291–436) kcal/capita/day consumed in 2014.
– Sugar-sweetened beverages: In 2019, middle-incomecountries consumed a median of 56.9 (IQR 42.6–92.9)g/day of sugar-sweetened beverages, but in high-incomecountries, consumption was higher at 115.6 (IQR 99.9–156.2) g/day (see Supplementary material online,Figure S23).
Dietary sodiumA higher intake of dietary sodium is associated with increasedblood pressure levels.170,171 The maximum daily intake of dietarysodium recommended by the WHO is 2 g for adults but currentlymost populations consume much more.172 A recent systematic re-view and meta-analysis of randomized trials showed a dose–re-sponse relation between dietary sodium reduction and bloodpressure lowering that was greater for those with higher bloodpressure.173 A large and increasing number of countries nowhave salt reduction strategies in place, although activity remainslimited in low- and middle-income regions.174 The WHO hasadopted a global target of a 30% reduction in the mean populationintake of salt/sodium by 2025.175
• National statistics. In 2019, the median sodium intake acrossESC member countries in adults aged ≥25 years was 3.3 (IQR2.9–3.8) g/day, ranging from ,2.5 g/day in Estonia, Algeria,Lebanon, Libya, Morocco, Syrian Arab Republic, Tunisia, andTurkey to .5 g/day in Croatia, Czech Republic, Hungary,Romania, Slovakia, Slovenia, Albania, Bosnia and Herzegovina,Bulgaria, Montenegro, North Macedonia, and Serbia (seeSupplementary material online, Figure S24).
• Stratification by national income status. The median so-dium intake for middle-income countries was 3.5 (IQR 2.5–4.1) g/day, similar to high-income countries where the medianintake was 3.3 (IQR 3.2–3.8) g/day (see Supplementary materialonline, Figure S25).
Dietary fruit and vegetablesLow intake of fruit and vegetables increases the risk of NCDs,such as CHD and cancer. In a systematic review and dose–re-sponse meta-analysis of 95 prospective studies, a 200 g/day in-crement in intake of fruit, or vegetables, or fruit andvegetables combined, was associated with an 8–13% reductionin the relative risk of CVD.176 Progressive reductions in therisk of CVD and all-cause mortality were observed up to an in-take of 800 g/day of fruit and vegetables combined.176 These
findings are consistent with those reported in the ProspectiveUrban Rural Epidemiology [PURE] study of 135 335 individualsfrom 18 low-income, middle-income, and high-income coun-tries.177 Follow-up data from the Nurses’ Health Study andthe Health Professionals Follow-Up Study support public healthrecommendations to increase fruit and vegetable intake for theprevention of CVD, with maximum benefit obtained from 5 ser-vings per day.178
• National statistics. 2019 estimates of the median fruit and ve-getable consumption are available for adults aged ≥25 years liv-ing in ESC member countries.
– Fruit consumption: An estimated median of 155.4 (IQR112.8–195.4) g/day were consumed, ranging from,100 g/day in Latvia, Republic of Georgia, Kyrgyzstan,Republic of Moldova, and Ukraine to .250 g/day inGreece, Albania, Montenegro, and Turkey (seeSupplementary material online, Figure S26).
– Vegetable consumption: An estimated median of 203.2(IQR 165.1–306.3) g/day were consumed, ranging from,150 g/day in Czech Republic, Finland, France, Iceland,The Netherlands, Norway, and Sweden to .400 g/day inRomania, Armenia, Egypt, Turkey, and Uzbekistan (seeSupplementary material online, Figure S27).
• Stratification by national income status.– Fruit consumption: In middle-income countries, the med-ian fruit consumption was 170.9 (IQR 108.2–212.0) g/daywhich was higher compared with high-income countrieswith a median fruit consumption of 149.9 (IQR 113.4–180.6) g/day (see Supplementary material online,Figure S28).
– Vegetable consumption: In middle-income countries, themedian vegetable consumption was 290.7 (IQR 196.8–383.2) g/day which was higher compared with high-incomecountries with a median vegetables consumption of 194.8(IQR 153.1–223.9) g/day (see Supplementary material on-line, Figure S29).
Clinical risk factorsThe Framingham Heart Study, one of the first longitudinal studiesof CV epidemiology, identified major risk factors predisposing tothe development of CVD.179 More recently, the INTERHEARTstudy confirmed that hypertension, dyslipidaemia, diabetes, andobesity, together with psychological factors and the lifestyle fac-tors discussed above, account for .90% of the population attrib-utable risk of acute myocardial infarction (AMI).95 All these factorsare amenable to control or elimination with the potential to makea substantial reduction in incident CVD at the population level.180
Yet, risk factors are often poorly managed, even in high-risk pa-tients as shown in the primary care arm of the recentEUROASPIRE V survey. A large proportion of people at highCVD risk had poorly controlled blood pressure, lipid levels, or dia-betes and nearly half were obese (BMI ≥30 kg/m2). The investiga-tors concluded that there is considerable potential to reduce therisk of future CVD throughout Europe by delivery of improvedpreventive cardiology programmes.181
European Society of Cardiology 27D
ownloaded from
https://academic.oup.com
/eurheartj/advance-article/doi/10.1093/eurheartj/ehab892/6472699 by guest on 12 January 2022
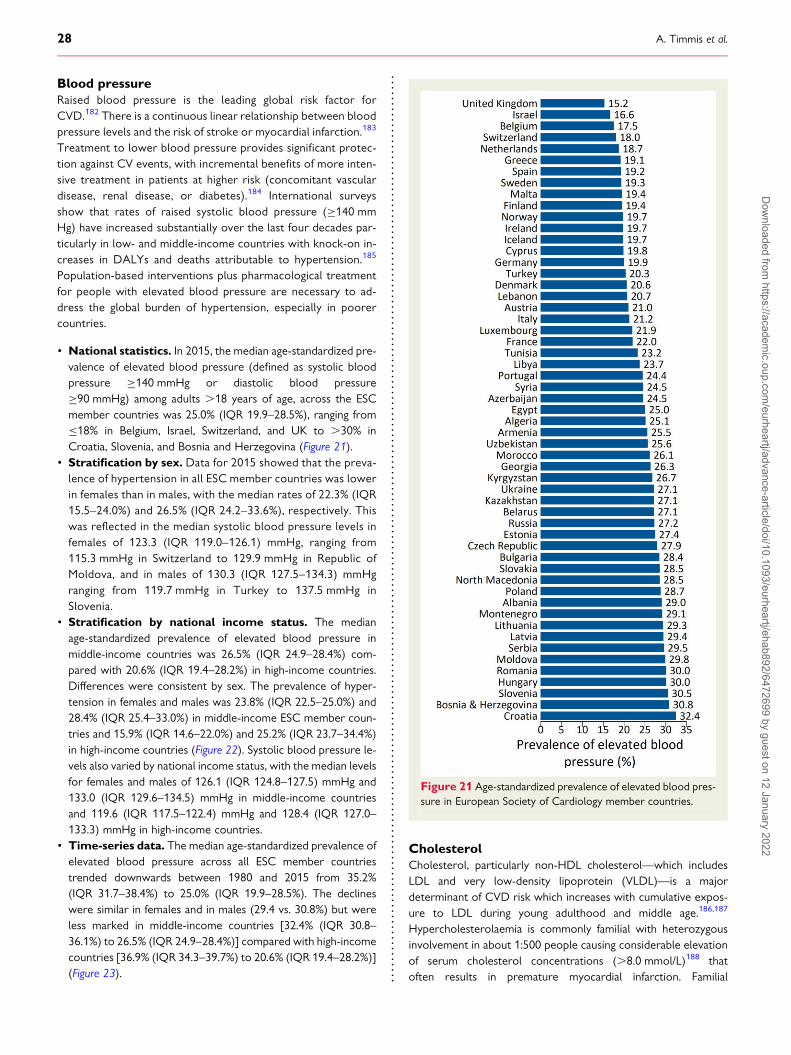
Blood pressureRaised blood pressure is the leading global risk factor forCVD.182 There is a continuous linear relationship between bloodpressure levels and the risk of stroke or myocardial infarction.183
Treatment to lower blood pressure provides significant protec-tion against CV events, with incremental benefits of more inten-sive treatment in patients at higher risk (concomitant vasculardisease, renal disease, or diabetes).184 International surveysshow that rates of raised systolic blood pressure (≥140 mmHg) have increased substantially over the last four decades par-ticularly in low- and middle-income countries with knock-on in-creases in DALYs and deaths attributable to hypertension.185
Population-based interventions plus pharmacological treatmentfor people with elevated blood pressure are necessary to ad-dress the global burden of hypertension, especially in poorercountries.
• National statistics. In 2015, the median age-standardized pre-valence of elevated blood pressure (defined as systolic bloodpressure ≥140 mmHg or diastolic blood pressure≥90 mmHg) among adults .18 years of age, across the ESCmember countries was 25.0% (IQR 19.9–28.5%), ranging from≤18% in Belgium, Israel, Switzerland, and UK to .30% inCroatia, Slovenia, and Bosnia and Herzegovina (Figure 21).
• Stratification by sex. Data for 2015 showed that the preva-lence of hypertension in all ESC member countries was lowerin females than in males, with the median rates of 22.3% (IQR15.5–24.0%) and 26.5% (IQR 24.2–33.6%), respectively. Thiswas reflected in the median systolic blood pressure levels infemales of 123.3 (IQR 119.0–126.1) mmHg, ranging from115.3 mmHg in Switzerland to 129.9 mmHg in Republic ofMoldova, and in males of 130.3 (IQR 127.5–134.3) mmHgranging from 119.7 mmHg in Turkey to 137.5 mmHg inSlovenia.
• Stratification by national income status. The medianage-standardized prevalence of elevated blood pressure inmiddle-income countries was 26.5% (IQR 24.9–28.4%) com-pared with 20.6% (IQR 19.4–28.2%) in high-income countries.Differences were consistent by sex. The prevalence of hyper-tension in females and males was 23.8% (IQR 22.5–25.0%) and28.4% (IQR 25.4–33.0%) in middle-income ESC member coun-tries and 15.9% (IQR 14.6–22.0%) and 25.2% (IQR 23.7–34.4%)in high-income countries (Figure 22). Systolic blood pressure le-vels also varied by national income status, with the median levelsfor females and males of 126.1 (IQR 124.8–127.5) mmHg and133.0 (IQR 129.6–134.5) mmHg in middle-income countriesand 119.6 (IQR 117.5–122.4) mmHg and 128.4 (IQR 127.0–133.3) mmHg in high-income countries.
• Time-series data. The median age-standardized prevalence ofelevated blood pressure across all ESC member countriestrended downwards between 1980 and 2015 from 35.2%(IQR 31.7–38.4%) to 25.0% (IQR 19.9–28.5%). The declineswere similar in females and in males (29.4 vs. 30.8%) but wereless marked in middle-income countries [32.4% (IQR 30.8–36.1%) to 26.5% (IQR 24.9–28.4%)] compared with high-incomecountries [36.9% (IQR 34.3–39.7%) to 20.6% (IQR 19.4–28.2%)](Figure 23).
CholesterolCholesterol, particularly non-HDL cholesterol—which includesLDL and very low-density lipoprotein (VLDL)—is a majordeterminant of CVD risk which increases with cumulative expos-ure to LDL during young adulthood and middle age.186,187
Hypercholesterolaemia is commonly familial with heterozygousinvolvement in about 1:500 people causing considerable elevationof serum cholesterol concentrations (.8.0 mmol/L)188 thatoften results in premature myocardial infarction. Familial
Figure 21 Age-standardized prevalence of elevated blood pres-sure in European Society of Cardiology member countries.
28 A. Timmis et al.D
ownloaded from
https://academic.oup.com
/eurheartj/advance-article/doi/10.1093/eurheartj/ehab892/6472699 by guest on 12 January 2022
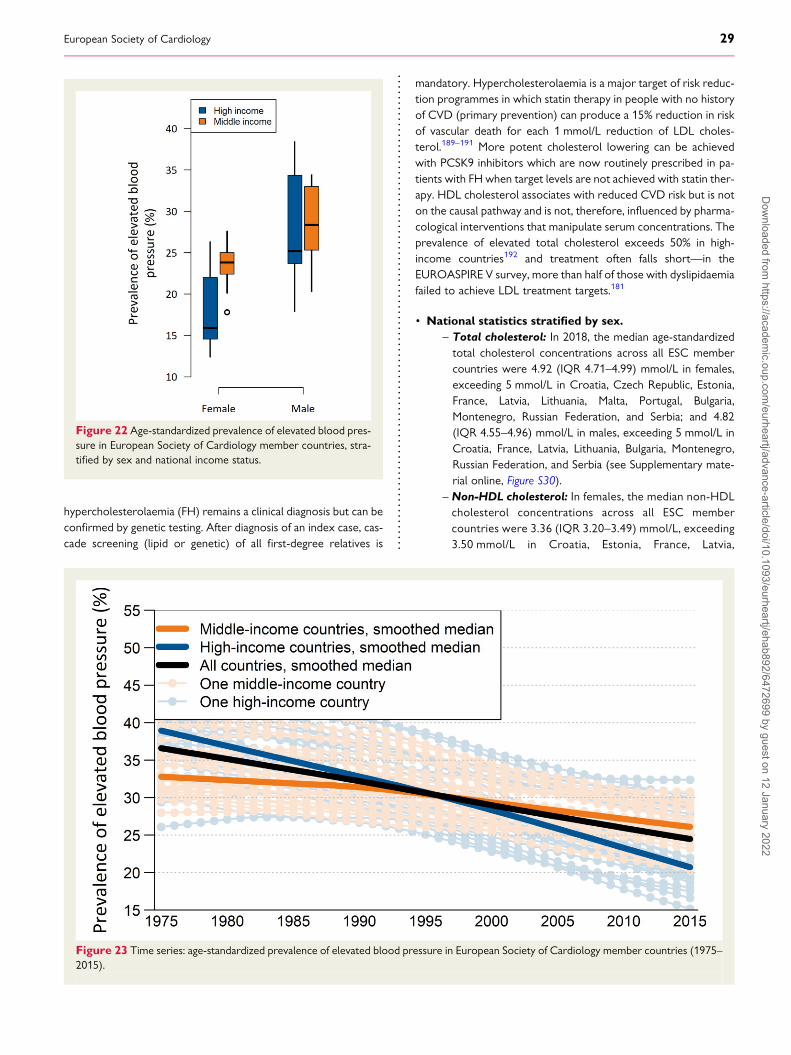
hypercholesterolaemia (FH) remains a clinical diagnosis but can beconfirmed by genetic testing. After diagnosis of an index case, cas-cade screening (lipid or genetic) of all first-degree relatives is
mandatory. Hypercholesterolaemia is a major target of risk reduc-tion programmes in which statin therapy in people with no historyof CVD (primary prevention) can produce a 15% reduction in riskof vascular death for each 1 mmol/L reduction of LDL choles-terol.189–191 More potent cholesterol lowering can be achievedwith PCSK9 inhibitors which are now routinely prescribed in pa-tients with FH when target levels are not achieved with statin ther-apy. HDL cholesterol associates with reduced CVD risk but is noton the causal pathway and is not, therefore, influenced by pharma-cological interventions that manipulate serum concentrations. Theprevalence of elevated total cholesterol exceeds 50% in high-income countries192 and treatment often falls short—in theEUROASPIRE V survey, more than half of those with dyslipidaemiafailed to achieve LDL treatment targets.181
• National statistics stratified by sex.– Total cholesterol: In 2018, the median age-standardizedtotal cholesterol concentrations across all ESC membercountries were 4.92 (IQR 4.71–4.99) mmol/L in females,exceeding 5 mmol/L in Croatia, Czech Republic, Estonia,France, Latvia, Lithuania, Malta, Portugal, Bulgaria,Montenegro, Russian Federation, and Serbia; and 4.82(IQR 4.55–4.96) mmol/L in males, exceeding 5 mmol/L inCroatia, France, Latvia, Lithuania, Bulgaria, Montenegro,Russian Federation, and Serbia (see Supplementary mate-rial online, Figure S30).
– Non-HDL cholesterol: In females, the median non-HDLcholesterol concentrations across all ESC membercountries were 3.36 (IQR 3.20–3.49) mmol/L, exceeding3.50 mmol/L in Croatia, Estonia, France, Latvia,
Figure 22 Age-standardized prevalence of elevated blood pres-sure in European Society of Cardiology member countries, stra-tified by sex and national income status.
Figure 23 Time series: age-standardized prevalence of elevated blood pressure in European Society of Cardiology member countries (1975–2015).
European Society of Cardiology 29D
ownloaded from
https://academic.oup.com
/eurheartj/advance-article/doi/10.1093/eurheartj/ehab892/6472699 by guest on 12 January 2022
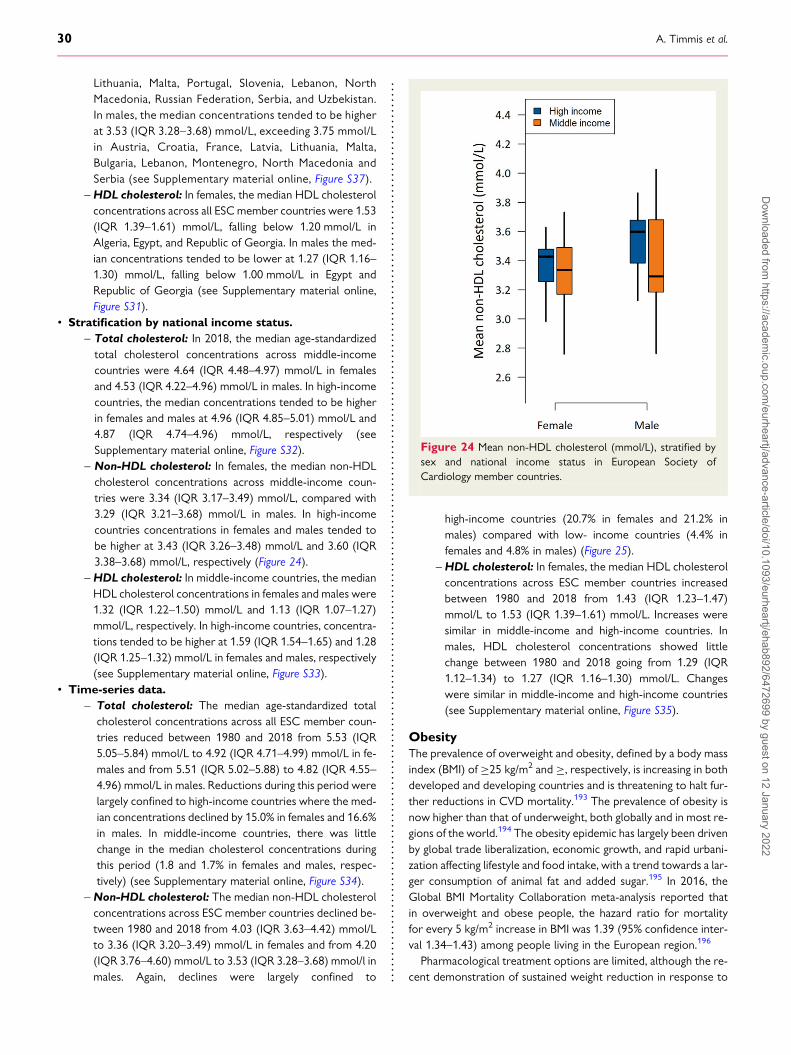
Lithuania, Malta, Portugal, Slovenia, Lebanon, NorthMacedonia, Russian Federation, Serbia, and Uzbekistan.In males, the median concentrations tended to be higherat 3.53 (IQR 3.28–3.68) mmol/L, exceeding 3.75 mmol/Lin Austria, Croatia, France, Latvia, Lithuania, Malta,Bulgaria, Lebanon, Montenegro, North Macedonia andSerbia (see Supplementary material online, Figure S37).
–HDL cholesterol: In females, the median HDL cholesterolconcentrations across all ESCmember countries were 1.53(IQR 1.39–1.61) mmol/L, falling below 1.20 mmol/L inAlgeria, Egypt, and Republic of Georgia. In males the med-ian concentrations tended to be lower at 1.27 (IQR 1.16–1.30) mmol/L, falling below 1.00 mmol/L in Egypt andRepublic of Georgia (see Supplementary material online,Figure S31).
• Stratification by national income status.– Total cholesterol: In 2018, the median age-standardizedtotal cholesterol concentrations across middle-incomecountries were 4.64 (IQR 4.48–4.97) mmol/L in femalesand 4.53 (IQR 4.22–4.96) mmol/L in males. In high-incomecountries, the median concentrations tended to be higherin females and males at 4.96 (IQR 4.85–5.01) mmol/L and4.87 (IQR 4.74–4.96) mmol/L, respectively (seeSupplementary material online, Figure S32).
– Non-HDL cholesterol: In females, the median non-HDLcholesterol concentrations across middle-income coun-tries were 3.34 (IQR 3.17–3.49) mmol/L, compared with3.29 (IQR 3.21–3.68) mmol/L in males. In high-incomecountries concentrations in females and males tended tobe higher at 3.43 (IQR 3.26–3.48) mmol/L and 3.60 (IQR3.38–3.68) mmol/L, respectively (Figure 24).
–HDL cholesterol: In middle-income countries, the medianHDL cholesterol concentrations in females and males were1.32 (IQR 1.22–1.50) mmol/L and 1.13 (IQR 1.07–1.27)mmol/L, respectively. In high-income countries, concentra-tions tended to be higher at 1.59 (IQR 1.54–1.65) and 1.28(IQR 1.25–1.32) mmol/L in females and males, respectively(see Supplementary material online, Figure S33).
• Time-series data.– Total cholesterol: The median age-standardized total
cholesterol concentrations across all ESC member coun-tries reduced between 1980 and 2018 from 5.53 (IQR5.05–5.84) mmol/L to 4.92 (IQR 4.71–4.99) mmol/L in fe-males and from 5.51 (IQR 5.02–5.88) to 4.82 (IQR 4.55–4.96) mmol/L in males. Reductions during this period werelargely confined to high-income countries where the med-ian concentrations declined by 15.0% in females and 16.6%in males. In middle-income countries, there was littlechange in the median cholesterol concentrations duringthis period (1.8 and 1.7% in females and males, respec-tively) (see Supplementary material online, Figure S34).
– Non-HDL cholesterol: The median non-HDL cholesterolconcentrations across ESC member countries declined be-tween 1980 and 2018 from 4.03 (IQR 3.63–4.42) mmol/Lto 3.36 (IQR 3.20–3.49) mmol/L in females and from 4.20(IQR 3.76–4.60) mmol/L to 3.53 (IQR 3.28–3.68) mmol/l inmales. Again, declines were largely confined to
high-income countries (20.7% in females and 21.2% inmales) compared with low- income countries (4.4% infemales and 4.8% in males) (Figure 25).
–HDL cholesterol: In females, the median HDL cholesterolconcentrations across ESC member countries increasedbetween 1980 and 2018 from 1.43 (IQR 1.23–1.47)mmol/L to 1.53 (IQR 1.39–1.61) mmol/L. Increases weresimilar in middle-income and high-income countries. Inmales, HDL cholesterol concentrations showed littlechange between 1980 and 2018 going from 1.29 (IQR1.12–1.34) to 1.27 (IQR 1.16–1.30) mmol/L. Changeswere similar in middle-income and high-income countries(see Supplementary material online, Figure S35).
ObesityThe prevalence of overweight and obesity, defined by a body massindex (BMI) of ≥25 kg/m2 and ≥, respectively, is increasing in bothdeveloped and developing countries and is threatening to halt fur-ther reductions in CVD mortality.193 The prevalence of obesity isnow higher than that of underweight, both globally and in most re-gions of the world.194 The obesity epidemic has largely been drivenby global trade liberalization, economic growth, and rapid urbani-zation affecting lifestyle and food intake, with a trend towards a lar-ger consumption of animal fat and added sugar.195 In 2016, theGlobal BMI Mortality Collaboration meta-analysis reported thatin overweight and obese people, the hazard ratio for mortalityfor every 5 kg/m2 increase in BMI was 1.39 (95% confidence inter-val 1.34–1.43) among people living in the European region.196
Pharmacological treatment options are limited, although the re-cent demonstration of sustained weight reduction in response to
Figure 24 Mean non-HDL cholesterol (mmol/L), stratified bysex and national income status in European Society ofCardiology member countries.
30 A. Timmis et al.D
ownloaded from
https://academic.oup.com
/eurheartj/advance-article/doi/10.1093/eurheartj/ehab892/6472699 by guest on 12 January 2022
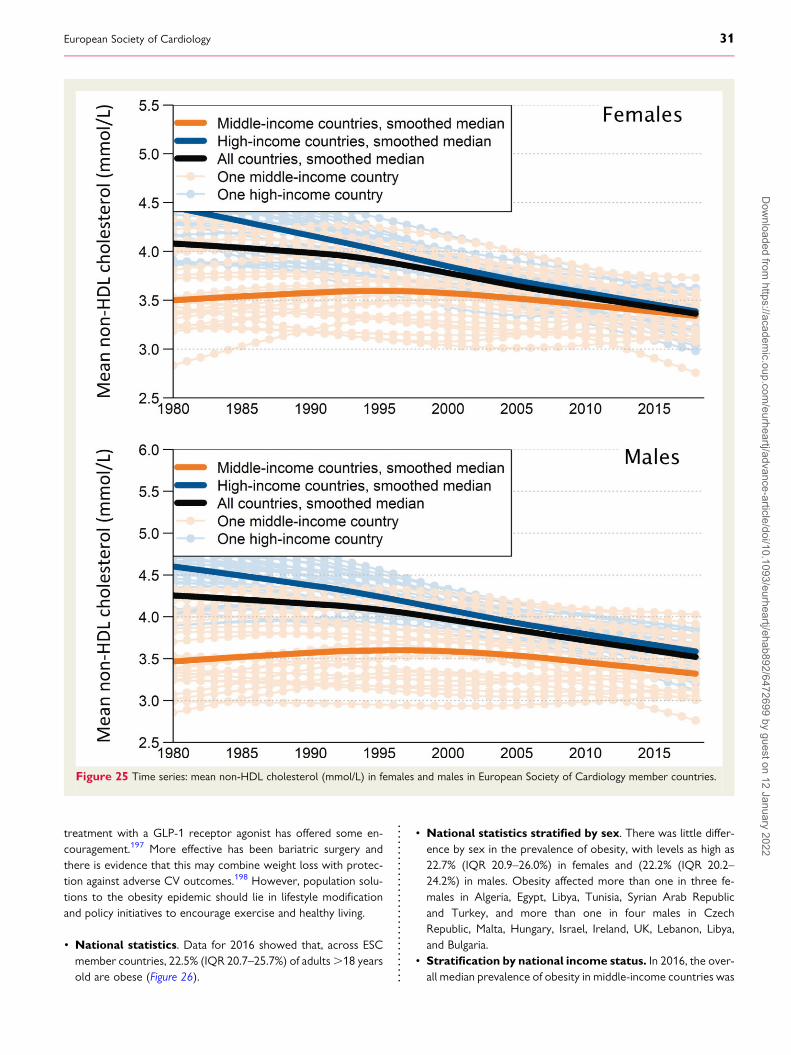
treatment with a GLP-1 receptor agonist has offered some en-couragement.197 More effective has been bariatric surgery andthere is evidence that this may combine weight loss with protec-tion against adverse CV outcomes.198 However, population solu-tions to the obesity epidemic should lie in lifestyle modificationand policy initiatives to encourage exercise and healthy living.
• National statistics. Data for 2016 showed that, across ESCmember countries, 22.5% (IQR 20.7–25.7%) of adults.18 yearsold are obese (Figure 26).
• National statistics stratified by sex. There was little differ-ence by sex in the prevalence of obesity, with levels as high as22.7% (IQR 20.9–26.0%) in females and (22.2% (IQR 20.2–24.2%) in males. Obesity affected more than one in three fe-males in Algeria, Egypt, Libya, Tunisia, Syrian Arab Republicand Turkey, and more than one in four males in CzechRepublic, Malta, Hungary, Israel, Ireland, UK, Lebanon, Libya,and Bulgaria.
• Stratification by national income status. In 2016, the over-all median prevalence of obesity in middle-income countries was
Figure 25 Time series: mean non-HDL cholesterol (mmol/L) in females and males in European Society of Cardiology member countries.
European Society of Cardiology 31D
ownloaded from
https://academic.oup.com
/eurheartj/advance-article/doi/10.1093/eurheartj/ehab892/6472699 by guest on 12 January 2022
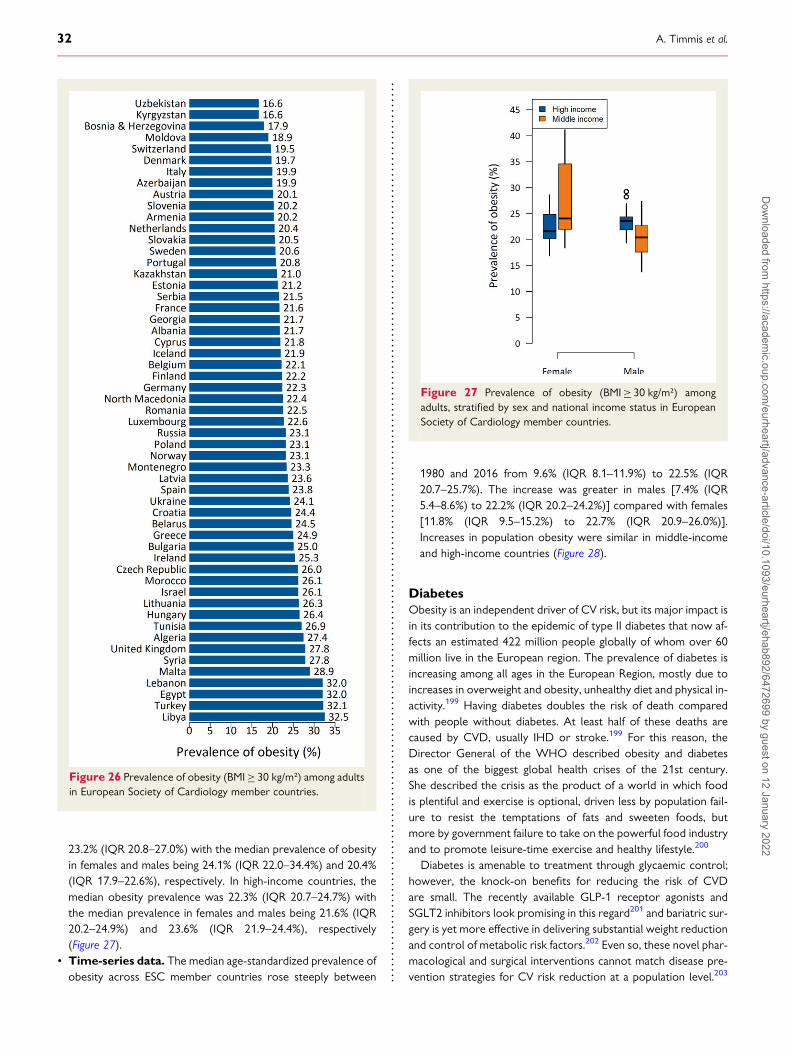
23.2% (IQR 20.8–27.0%) with the median prevalence of obesityin females and males being 24.1% (IQR 22.0–34.4%) and 20.4%(IQR 17.9–22.6%), respectively. In high-income countries, themedian obesity prevalence was 22.3% (IQR 20.7–24.7%) withthe median prevalence in females and males being 21.6% (IQR20.2–24.9%) and 23.6% (IQR 21.9–24.4%), respectively(Figure 27).
• Time-series data. The median age-standardized prevalence ofobesity across ESC member countries rose steeply between
1980 and 2016 from 9.6% (IQR 8.1–11.9%) to 22.5% (IQR20.7–25.7%). The increase was greater in males [7.4% (IQR5.4–8.6%) to 22.2% (IQR 20.2–24.2%)] compared with females[11.8% (IQR 9.5–15.2%) to 22.7% (IQR 20.9–26.0%)].Increases in population obesity were similar in middle-incomeand high-income countries (Figure 28).
DiabetesObesity is an independent driver of CV risk, but its major impact isin its contribution to the epidemic of type II diabetes that now af-fects an estimated 422 million people globally of whom over 60million live in the European region. The prevalence of diabetes isincreasing among all ages in the European Region, mostly due toincreases in overweight and obesity, unhealthy diet and physical in-activity.199 Having diabetes doubles the risk of death comparedwith people without diabetes. At least half of these deaths arecaused by CVD, usually IHD or stroke.199 For this reason, theDirector General of the WHO described obesity and diabetesas one of the biggest global health crises of the 21st century.She described the crisis as the product of a world in which foodis plentiful and exercise is optional, driven less by population fail-ure to resist the temptations of fats and sweeten foods, butmore by government failure to take on the powerful food industryand to promote leisure-time exercise and healthy lifestyle.200
Diabetes is amenable to treatment through glycaemic control;however, the knock-on benefits for reducing the risk of CVDare small. The recently available GLP-1 receptor agonists andSGLT2 inhibitors look promising in this regard201 and bariatric sur-gery is yet more effective in delivering substantial weight reductionand control of metabolic risk factors.202 Even so, these novel phar-macological and surgical interventions cannot match disease pre-vention strategies for CV risk reduction at a population level.203
Figure 26 Prevalence of obesity (BMI≥ 30 kg/m²) among adultsin European Society of Cardiology member countries.
Figure 27 Prevalence of obesity (BMI≥ 30 kg/m²) amongadults, stratified by sex and national income status in EuropeanSociety of Cardiology member countries.
32 A. Timmis et al.D
ownloaded from
https://academic.oup.com
/eurheartj/advance-article/doi/10.1093/eurheartj/ehab892/6472699 by guest on 12 January 2022
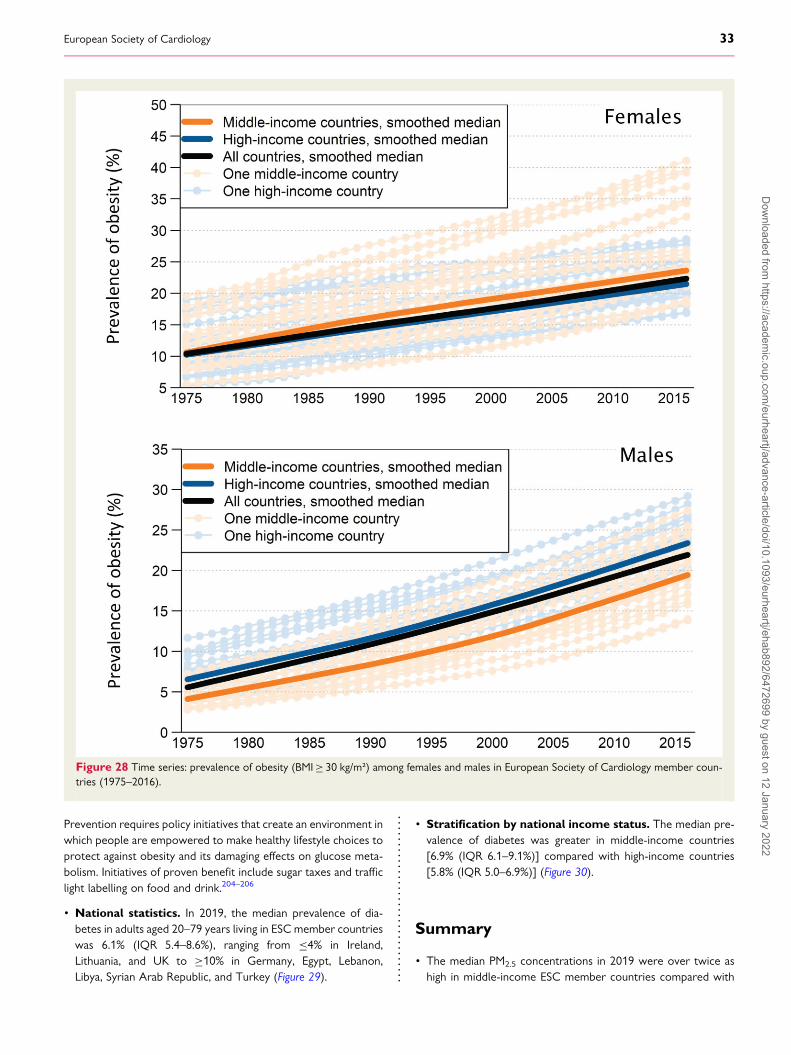
Prevention requires policy initiatives that create an environment inwhich people are empowered to make healthy lifestyle choices toprotect against obesity and its damaging effects on glucose meta-bolism. Initiatives of proven benefit include sugar taxes and trafficlight labelling on food and drink.204–206
• National statistics. In 2019, the median prevalence of dia-betes in adults aged 20–79 years living in ESC member countrieswas 6.1% (IQR 5.4–8.6%), ranging from ≤4% in Ireland,Lithuania, and UK to ≥10% in Germany, Egypt, Lebanon,Libya, Syrian Arab Republic, and Turkey (Figure 29).
• Stratification by national income status. The median pre-valence of diabetes was greater in middle-income countries[6.9% (IQR 6.1–9.1%)] compared with high-income countries[5.8% (IQR 5.0–6.9%)] (Figure 30).
Summary
• The median PM2.5 concentrations in 2019 were over twice ashigh in middle-income ESC member countries compared with
Figure 28 Time series: prevalence of obesity (BMI≥ 30 kg/m²) among females and males in European Society of Cardiology member coun-tries (1975–2016).
European Society of Cardiology 33D
ownloaded from
https://academic.oup.com
/eurheartj/advance-article/doi/10.1093/eurheartj/ehab892/6472699 by guest on 12 January 2022
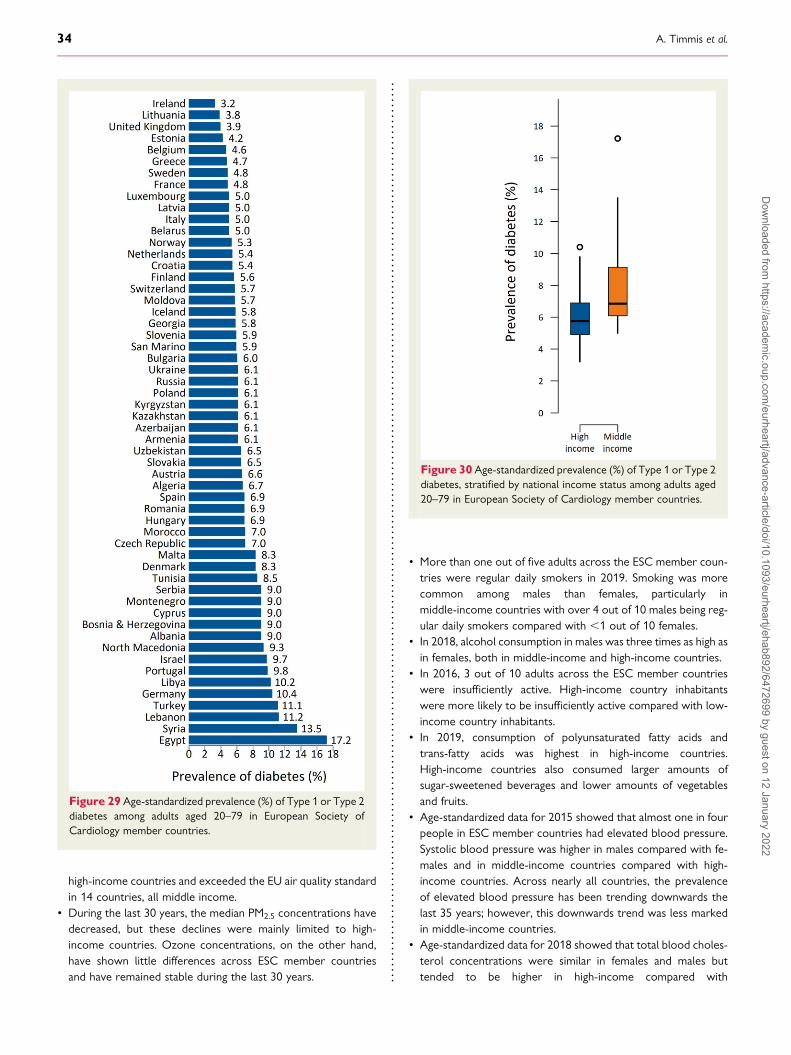
high-income countries and exceeded the EU air quality standardin 14 countries, all middle income.
• During the last 30 years, the median PM2.5 concentrations havedecreased, but these declines were mainly limited to high-income countries. Ozone concentrations, on the other hand,have shown little differences across ESC member countriesand have remained stable during the last 30 years.
• More than one out of five adults across the ESC member coun-tries were regular daily smokers in 2019. Smoking was morecommon among males than females, particularly inmiddle-income countries with over 4 out of 10 males being reg-ular daily smokers compared with ,1 out of 10 females.
• In 2018, alcohol consumption in males was three times as high asin females, both in middle-income and high-income countries.
• In 2016, 3 out of 10 adults across the ESC member countrieswere insufficiently active. High-income country inhabitantswere more likely to be insufficiently active compared with low-income country inhabitants.
• In 2019, consumption of polyunsaturated fatty acids andtrans-fatty acids was highest in high-income countries.High-income countries also consumed larger amounts ofsugar-sweetened beverages and lower amounts of vegetablesand fruits.
• Age-standardized data for 2015 showed that almost one in fourpeople in ESC member countries had elevated blood pressure.Systolic blood pressure was higher in males compared with fe-males and in middle-income countries compared with high-income countries. Across nearly all countries, the prevalenceof elevated blood pressure has been trending downwards thelast 35 years; however, this downwards trend was less markedin middle-income countries.
• Age-standardized data for 2018 showed that total blood choles-terol concentrations were similar in females and males buttended to be higher in high-income compared with
Figure 29 Age-standardized prevalence (%) of Type 1 or Type 2diabetes among adults aged 20–79 in European Society ofCardiology member countries.
Figure 30 Age-standardized prevalence (%) of Type 1 or Type 2diabetes, stratified by national income status among adults aged20–79 in European Society of Cardiology member countries.
34 A. Timmis et al.D
ownloaded from
https://academic.oup.com
/eurheartj/advance-article/doi/10.1093/eurheartj/ehab892/6472699 by guest on 12 January 2022
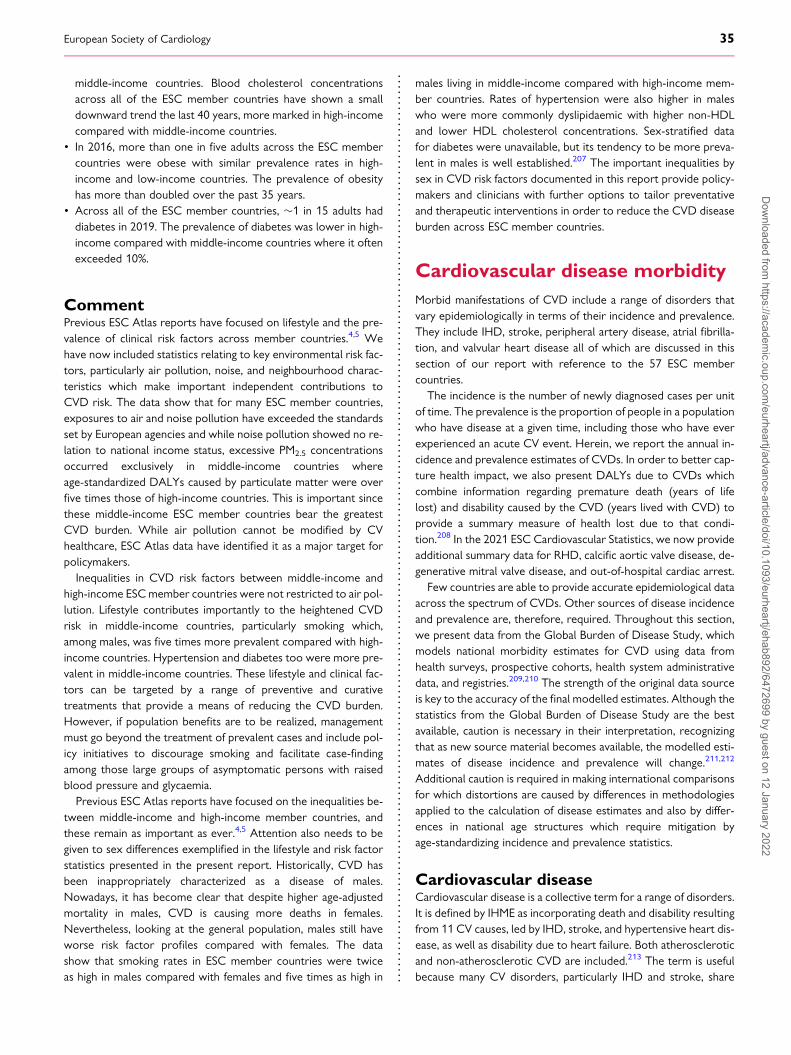
middle-income countries. Blood cholesterol concentrationsacross all of the ESC member countries have shown a smalldownward trend the last 40 years, more marked in high-incomecompared with middle-income countries.
• In 2016, more than one in five adults across the ESC membercountries were obese with similar prevalence rates in high-income and low-income countries. The prevalence of obesityhas more than doubled over the past 35 years.
• Across all of the ESC member countries, �1 in 15 adults haddiabetes in 2019. The prevalence of diabetes was lower in high-income compared with middle-income countries where it oftenexceeded 10%.
CommentPrevious ESC Atlas reports have focused on lifestyle and the pre-valence of clinical risk factors across member countries.4,5 Wehave now included statistics relating to key environmental risk fac-tors, particularly air pollution, noise, and neighbourhood charac-teristics which make important independent contributions toCVD risk. The data show that for many ESC member countries,exposures to air and noise pollution have exceeded the standardsset by European agencies and while noise pollution showed no re-lation to national income status, excessive PM2.5 concentrationsoccurred exclusively in middle-income countries whereage-standardized DALYs caused by particulate matter were overfive times those of high-income countries. This is important sincethese middle-income ESC member countries bear the greatestCVD burden. While air pollution cannot be modified by CVhealthcare, ESC Atlas data have identified it as a major target forpolicymakers.Inequalities in CVD risk factors between middle-income and
high-income ESCmember countries were not restricted to air pol-lution. Lifestyle contributes importantly to the heightened CVDrisk in middle-income countries, particularly smoking which,among males, was five times more prevalent compared with high-income countries. Hypertension and diabetes too were more pre-valent in middle-income countries. These lifestyle and clinical fac-tors can be targeted by a range of preventive and curativetreatments that provide a means of reducing the CVD burden.However, if population benefits are to be realized, managementmust go beyond the treatment of prevalent cases and include pol-icy initiatives to discourage smoking and facilitate case-findingamong those large groups of asymptomatic persons with raisedblood pressure and glycaemia.Previous ESC Atlas reports have focused on the inequalities be-
tween middle-income and high-income member countries, andthese remain as important as ever.4,5 Attention also needs to begiven to sex differences exemplified in the lifestyle and risk factorstatistics presented in the present report. Historically, CVD hasbeen inappropriately characterized as a disease of males.Nowadays, it has become clear that despite higher age-adjustedmortality in males, CVD is causing more deaths in females.Nevertheless, looking at the general population, males still haveworse risk factor profiles compared with females. The datashow that smoking rates in ESC member countries were twiceas high in males compared with females and five times as high in
males living in middle-income compared with high-income mem-ber countries. Rates of hypertension were also higher in maleswho were more commonly dyslipidaemic with higher non-HDLand lower HDL cholesterol concentrations. Sex-stratified datafor diabetes were unavailable, but its tendency to be more preva-lent in males is well established.207 The important inequalities bysex in CVD risk factors documented in this report provide policy-makers and clinicians with further options to tailor preventativeand therapeutic interventions in order to reduce the CVD diseaseburden across ESC member countries.
Cardiovascular disease morbidityMorbid manifestations of CVD include a range of disorders thatvary epidemiologically in terms of their incidence and prevalence.They include IHD, stroke, peripheral artery disease, atrial fibrilla-tion, and valvular heart disease all of which are discussed in thissection of our report with reference to the 57 ESC membercountries.
The incidence is the number of newly diagnosed cases per unitof time. The prevalence is the proportion of people in a populationwho have disease at a given time, including those who have everexperienced an acute CV event. Herein, we report the annual in-cidence and prevalence estimates of CVDs. In order to better cap-ture health impact, we also present DALYs due to CVDs whichcombine information regarding premature death (years of lifelost) and disability caused by the CVD (years lived with CVD) toprovide a summary measure of health lost due to that condi-tion.208 In the 2021 ESC Cardiovascular Statistics, we now provideadditional summary data for RHD, calcific aortic valve disease, de-generative mitral valve disease, and out-of-hospital cardiac arrest.
Few countries are able to provide accurate epidemiological dataacross the spectrum of CVDs. Other sources of disease incidenceand prevalence are, therefore, required. Throughout this section,we present data from the Global Burden of Disease Study, whichmodels national morbidity estimates for CVD using data fromhealth surveys, prospective cohorts, health system administrativedata, and registries.209,210 The strength of the original data sourceis key to the accuracy of the final modelled estimates. Although thestatistics from the Global Burden of Disease Study are the bestavailable, caution is necessary in their interpretation, recognizingthat as new source material becomes available, the modelled esti-mates of disease incidence and prevalence will change.211,212
Additional caution is required in making international comparisonsfor which distortions are caused by differences in methodologiesapplied to the calculation of disease estimates and also by differ-ences in national age structures which require mitigation byage-standardizing incidence and prevalence statistics.
Cardiovascular diseaseCardiovascular disease is a collective term for a range of disorders.It is defined by IHME as incorporating death and disability resultingfrom 11 CV causes, led by IHD, stroke, and hypertensive heart dis-ease, as well as disability due to heart failure. Both atheroscleroticand non-atherosclerotic CVD are included.213 The term is usefulbecause many CV disorders, particularly IHD and stroke, share
European Society of Cardiology 35D
ownloaded from
https://academic.oup.com
/eurheartj/advance-article/doi/10.1093/eurheartj/ehab892/6472699 by guest on 12 January 2022

common risk factors and treatments allowing clinicians and policy-makers to develop preventive and therapeutic strategies directedat a broad CV target. Assimilated data by the WHO provide con-textual information about the global burden of CVD which causesmore than half of all deaths across Europe and 46 times the com-bined number of deaths from acquired immune deficiency syn-drome, tuberculosis, and malaria.214
Cardiovascular disease: National statistics
Incidence In 2019, there were an estimated 12.7 million new casesof CVD across ESC member countries. National populationsize was an important determinant of incident caseload withGermany contributing more than a million new cases andRussian Federation more than 2 million new cases. The median,age-standardized annual incidence estimate for CVD was 747.6(IQR 558.2–971.9) per 100 000 inhabitants of each membercountry, ranging from ,500 in Cyprus, France and Portugalto .1000 in Azerbaijan, Belarus, Egypt, Estonia, Republic ofGeorgia, Kyrgyzstan, Morocco, Syrian Arab Republic, Ukraine,and Uzbekistan (Figure 31).
Prevalence In 2019, there were an estimated 113 million peopleliving with CVD in the 57 ESC member countries. The medianage-standardized annual prevalence estimate per 100 000 inha-bitants of each member country was 6963 (IQR 5719–7509),ranging from ,5000 in Israel, Portugal, and Switzerland to.8000 in Egypt, Republic of Georgia, Lebanon, Libya,Morocco, Syrian Arab Republic, and Uzbekistan (Figure 31).
Cardiovascular disease: stratification by sex
Incidence In 2019, females accounted for more new cases of CVDacross ESC member countries compared with males (6.5 mil-lion vs. 6.1 million), but after age standardization, median esti-mates per 100 000 people were lower in females than in males[668.3 (IQR 483.5–857.9) vs. 824.5 (IQR 663.0–1050.2)] (seeSupplementary material online, Figure S38).
Prevalence In 2019, there were more females than males livingwith CVD across ESC member countries (60 million vs. 53 mil-lion). The median age-standardized prevalence estimates per100 000 people were lower for females compared with males[6369 (IQR 5385–7139) vs. 7586 (IQR 5963–8143)], rangingfrom 4642 in Israel to 8903 in Egypt for females and from5150 in Portugal to 9614 in Egypt for males (seeSupplementary material online, Figure S38).
Cardiovascular disease: stratification by nationalincome status
Incidence The median age-standardized incidence estimate forCVD per 100 000 people was higher in middle-income coun-tries compared with high-income countries [975.0 (IQR888.6–1028 vs. 601.5 (IQR 526.2–681.9)] for both femalesand males (see Supplementary material online, Figure S38). Inmiddle-income countries, incidence estimates peaked at.1200 per 100 000 people in Azerbaijan, Egypt, and
Uzbekistan, but in high-income countries, incidence estimateswere lower and peaked at 1021 per 100 000 people in Estonia.
Prevalence The median age-standardized prevalence estimatesfor CVD per 100 000 inhabitants were higher in middle-incomecountries compared with high-income countries [7469 (IQR7094–8016) vs. 5819 (IQR 5347–6845)] (see Supplementarymaterial online, Figure S38). The age-standardized prevalenceper 100 000 people in middle-income countries ranged from6241 in Turkey to 9281 in Egypt, and in high-income countriesfrom 4871 in Portugal to 7882 in Estonia.
Cardiovascular disease: time-series data
Incidence Between 1990 and 2019, estimates for the medianage-standardized incidence of CVD per 100 000 inhabitantsshowed a small decline from 897.9 (IQR 765.5–1033.4) in1990 to 747.6 (IQR 558.2–971.9) in 2019 (seeSupplementary material online, Figure S39). Declines in inci-dence rates per 100 000 inhabitants were generally small andin seven middle-income countries (Azerbaijan, Bosnia andHerzegovina, Egypt, Libya, Tunisia, Ukraine, and Uzbekistan),small increases were recorded.
Prevalence Between 1990 and 2019, the median age-standardizedprevalence estimates for CVD per 100 000 people remainedstable at 7150 (IQR 6864–7623) in 1990 vs. 6963 (IQR5719–7510) in 2019 (see Supplementary material online,Figure S39). Modest increases in prevalence were recorded injust two high-income countries (Estonia and Latvia) and in 15middle-income countries (Azerbaijan, Belarus, Bosnia andHerzegovina, Egypt, Republic of Georgia, Lebanon, Libya,Republic of Moldova, Morocco, Russian Federation, Serbia,Syrian Arab Republic, Tunisia, Ukraine, and Uzbekistan).
Cardiovascular disease: disability-adjusted life yearsIn 2019, CVD accounted for an estimated 85 million DALYs acrossESC member countries. There was a median estimate of 4893(IQR 2295–7346) age-standardized DALYs due to CVD per 100000 inhabitants, ranging from ,2000 in Denmark, France,Iceland, Israel, Luxembourg, The Netherlands, Norway, Spain,and Switzerland to .10 000 in Azerbaijan, Uzbekistan, Ukraine,and Egypt (see Supplementary material online, Figure S40).Ischaemic heart disease and stroke were the major contributorsto DALYs due to CVD, accounting for .80% of the total burden.Disability-adjusted life years for males were nearly twice as highcompared with females [6393 (IQR 2900–9238) vs. 3628 (IQR1733–5892)] and nearly four times as high in middle-income com-pared with high-income countries [8485 (IQR 6152–8987) vs.2385 (IQR 1977–3978)] (Figure 32). In high-income countries,DALYs due to CVD have declined by more than half since 1990but in middle-income countries, the decline has been much smaller(see Supplementary material online, Figure S41).
Ischaemic heart diseaseIschaemic heart disease is defined by IHME as the disease of thecoronary arteries, usually from atherosclerosis, leading to myocar-dial infarction or ischaemia, following the Fourth Universal
36 A. Timmis et al.D
ownloaded from
https://academic.oup.com
/eurheartj/advance-article/doi/10.1093/eurheartj/ehab892/6472699 by guest on 12 January 2022
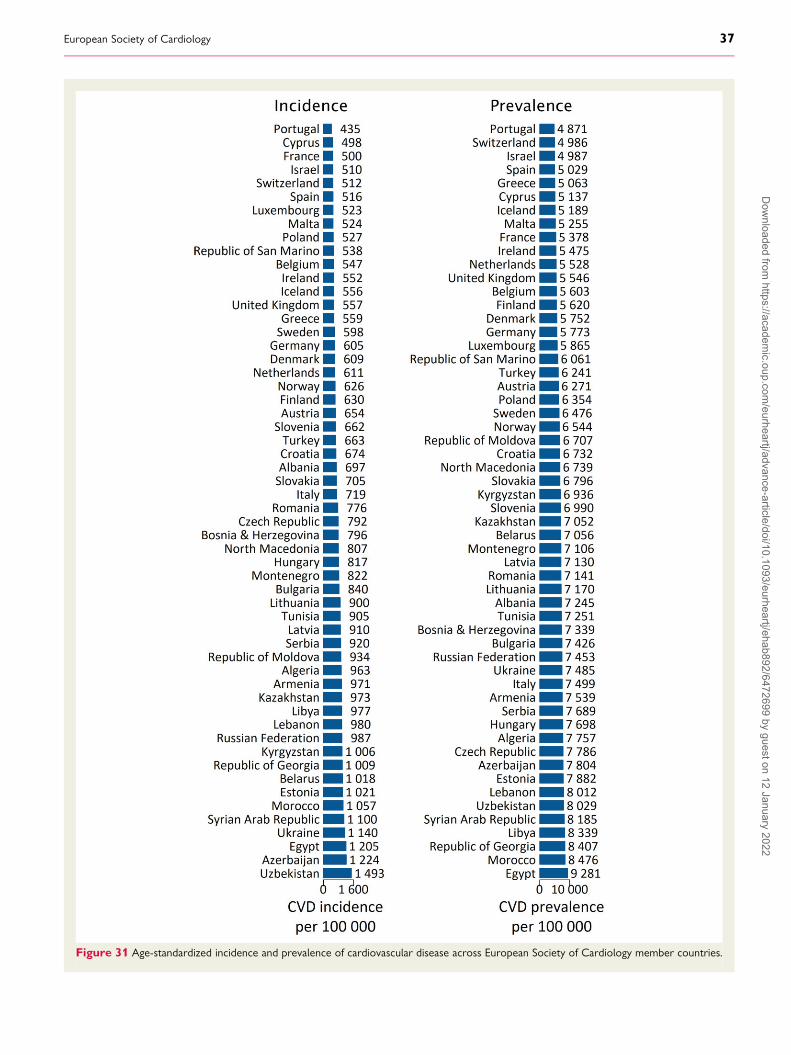
Figure 31 Age-standardized incidence and prevalence of cardiovascular disease across European Society of Cardiology member countries.
European Society of Cardiology 37D
ownloaded from
https://academic.oup.com
/eurheartj/advance-article/doi/10.1093/eurheartj/ehab892/6472699 by guest on 12 January 2022

Definition of MI and, for stable angina, physician diagnosis.215
Ischaemic heart disease is usually caused by obstructive coronaryatherosclerosis and is the most common manifestation of CVD.It is also the manifestation that has seen the most profound reduc-tions in mortality across ESC member countries in recent years.This has been achieved through a combination of preventive andtherapeutic strategies but is now threatened by the epidemic ofobesity and Type 2 diabetes affecting ESC member countries.Meanwhile, in low- and lower middle-income countries acrossthe world, the increasing adoption of western lifestyles is seeingIHD emerge as a growing health hazard159 that has led to callsfor policy and legislative interventions for health promotion andprimary prevention, similar to those that have been effective inmany high-income countries.216
Ischaemic heart disease: National statistics
Incidence In 2019, IHD was the most common manifestation ofincident CVD with an estimated 5.8 million new cases in the57 ESC member countries. The median age-standardized inci-dence estimate per 100 000 people was 293.3 (IQR 195.8–529.5) ranging from ,150 in Cyprus, Luxembourg, Portugal,and Poland to .1000 Uzbekistan (Figure 33).
Prevalence In 2019, there were an estimated 47.6 million peopleliving with IHD in the 57 ESC member countries. The medianage-standardized prevalence estimate per 100 000 inhabitantsof each member country was 2895 (IQR 1811–3737) rangingfrom ,1600 in Cyprus, Luxembourg, and Portugal to .5000in Egypt, Morocco, and Syrian Arab Republic (Figure 33).
Ischaemic heart disease: stratification by sex
Incidence In 2019, females accounted for fewer new cases of IHDcompared with males (2.6 million vs. 3.2 million), and after agestandardization, the median estimates for incident IHD per 100000 people were substantially lower in females than males[226.2 (IQR 116.3–420.6) vs. 363.0 (IQR 283.7–659.7)](Figure 34).
Prevalence There were fewer females than males living with IHDin ESC member countries (21.1 million vs. 26.5 million). Themedian age-standardized prevalence estimates per 100 000people were lower for females compared with males [2194(IQR 1133–3062) vs. 3793 (IQR 2526–4774)] with Portugal re-cording the lowest and Egypt the highest estimates for bothsexes (see Supplementary material online, Figure S42).
Ischaemic heart disease: stratification by nationalincome status
Incidence In 2019, the median age-standardized incidence esti-mates for IHD per 100 000 people were more than twice ashigh in middle-income countries compared with high-incomecountries [552.1 (IQR 387.5–626.0) vs. 203.2 (IQR 177.4–260.0)]. In middle-income countries, the incidence estimatesper 100 000 people varied between 246.3 and 1011.6 inAlbania and Uzbekistan while in high-income countries, it var-ied between 82.6 and 594.6 in Portugal and Estonia (Figure 34).
Prevalence The median age-standardized prevalence estimatesfor IHD per 100 000 people were higher in middle-incomecountries compared with high-income countries [3935 (IQR3425–4597) vs. 1856 (IQR 1645–2787)] in both females andmales (see Supplementary material online, Figure S42). Inmiddle-income countries, age-standardized prevalence esti-mates per 100 000 inhabitants ranged from 2529 in Albaniato 5624 in Egypt, and in high-income countries from 1325 inPortugal to 4320 in Estonia.
Ischaemic heart disease: time-series data
Incidence Between 1990 and 2019, the median age-standardizedincidence estimates for IHD per 100 000 people declined from404.5 (IQR 282.3–554.7) to 293.3 (IQR 195.8–529.5)(Figure 35). Incidence estimates declined consistently in all high-income countries, yet in middle-income countries, declineswere small and in seven countries (Azerbaijan, Belarus,Kyrgyzstan, Libya, Syrian Arab Republic, Ukraine, andUzbekistan), incidence estimates for IHD increased.
Prevalence Between 1990 and 2019, the median age-standardized prevalence estimates for IHD per 100 000 peopleshowed a small decline from 3357 (IQR 2140–4139) in 1990
Figure 32 Age-standardized disability-adjusted life years due tocardiovascular diseases in inhabitants of European Society ofCardiology member countries.
38 A. Timmis et al.D
ownloaded from
https://academic.oup.com
/eurheartj/advance-article/doi/10.1093/eurheartj/ehab892/6472699 by guest on 12 January 2022
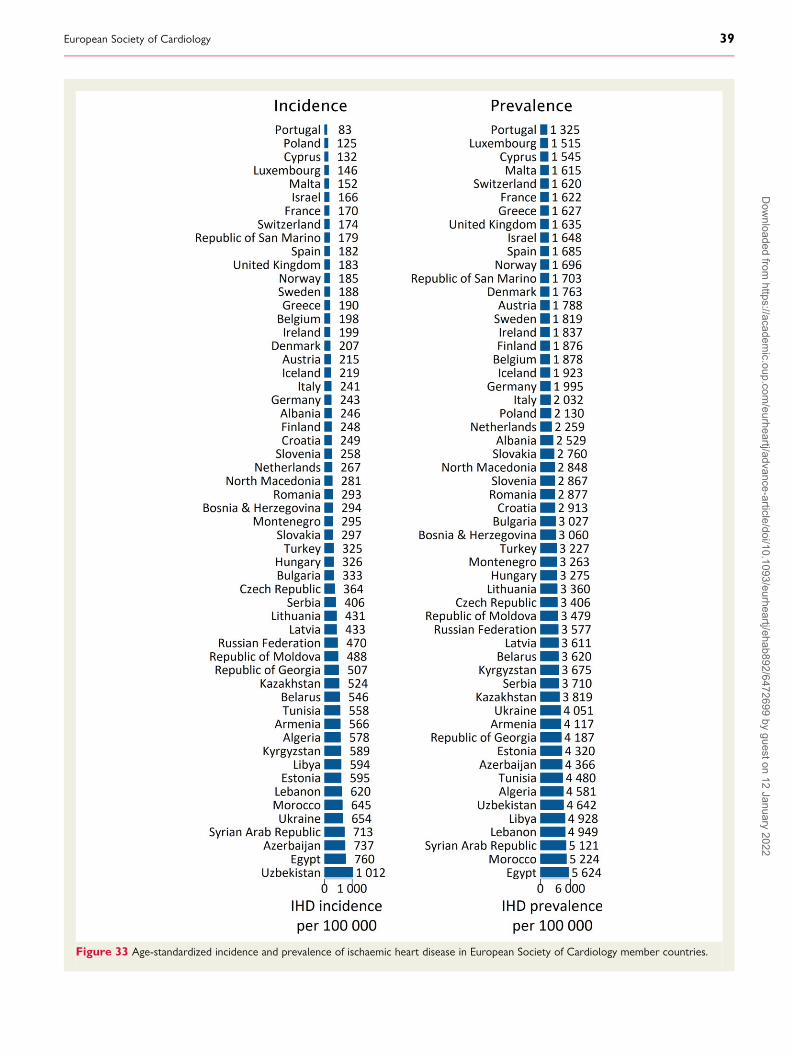
Figure 33 Age-standardized incidence and prevalence of ischaemic heart disease in European Society of Cardiology member countries.
European Society of Cardiology 39D
ownloaded from
https://academic.oup.com
/eurheartj/advance-article/doi/10.1093/eurheartj/ehab892/6472699 by guest on 12 January 2022
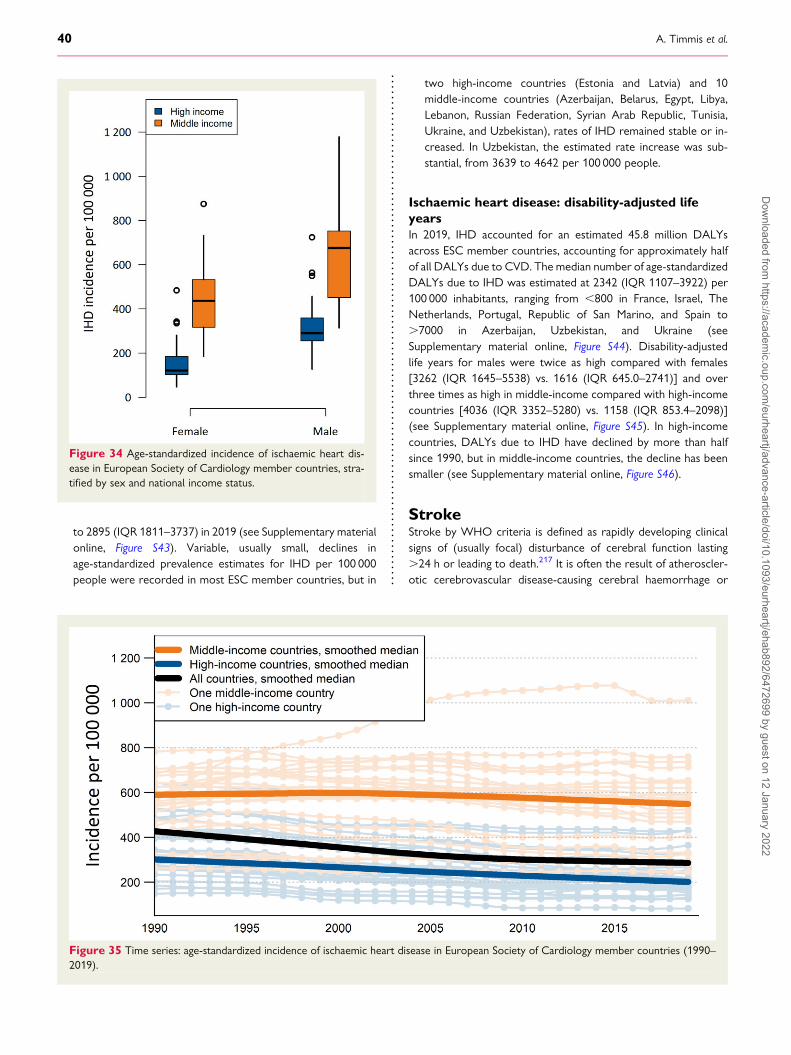
to 2895 (IQR 1811–3737) in 2019 (see Supplementary materialonline, Figure S43). Variable, usually small, declines inage-standardized prevalence estimates for IHD per 100 000people were recorded in most ESC member countries, but in
two high-income countries (Estonia and Latvia) and 10middle-income countries (Azerbaijan, Belarus, Egypt, Libya,Lebanon, Russian Federation, Syrian Arab Republic, Tunisia,Ukraine, and Uzbekistan), rates of IHD remained stable or in-creased. In Uzbekistan, the estimated rate increase was sub-stantial, from 3639 to 4642 per 100 000 people.
Ischaemic heart disease: disability-adjusted lifeyearsIn 2019, IHD accounted for an estimated 45.8 million DALYsacross ESC member countries, accounting for approximately halfof all DALYs due to CVD. The median number of age-standardizedDALYs due to IHD was estimated at 2342 (IQR 1107–3922) per100 000 inhabitants, ranging from ,800 in France, Israel, TheNetherlands, Portugal, Republic of San Marino, and Spain to.7000 in Azerbaijan, Uzbekistan, and Ukraine (seeSupplementary material online, Figure S44). Disability-adjustedlife years for males were twice as high compared with females[3262 (IQR 1645–5538) vs. 1616 (IQR 645.0–2741)] and overthree times as high in middle-income compared with high-incomecountries [4036 (IQR 3352–5280) vs. 1158 (IQR 853.4–2098)](see Supplementary material online, Figure S45). In high-incomecountries, DALYs due to IHD have declined by more than halfsince 1990, but in middle-income countries, the decline has beensmaller (see Supplementary material online, Figure S46).
StrokeStroke by WHO criteria is defined as rapidly developing clinicalsigns of (usually focal) disturbance of cerebral function lasting.24 h or leading to death.217 It is often the result of atheroscler-otic cerebrovascular disease-causing cerebral haemorrhage or
Figure 34 Age-standardized incidence of ischaemic heart dis-ease in European Society of Cardiology member countries, stra-tified by sex and national income status.
Figure 35 Time series: age-standardized incidence of ischaemic heart disease in European Society of Cardiology member countries (1990–2019).
40 A. Timmis et al.D
ownloaded from
https://academic.oup.com
/eurheartj/advance-article/doi/10.1093/eurheartj/ehab892/6472699 by guest on 12 January 2022
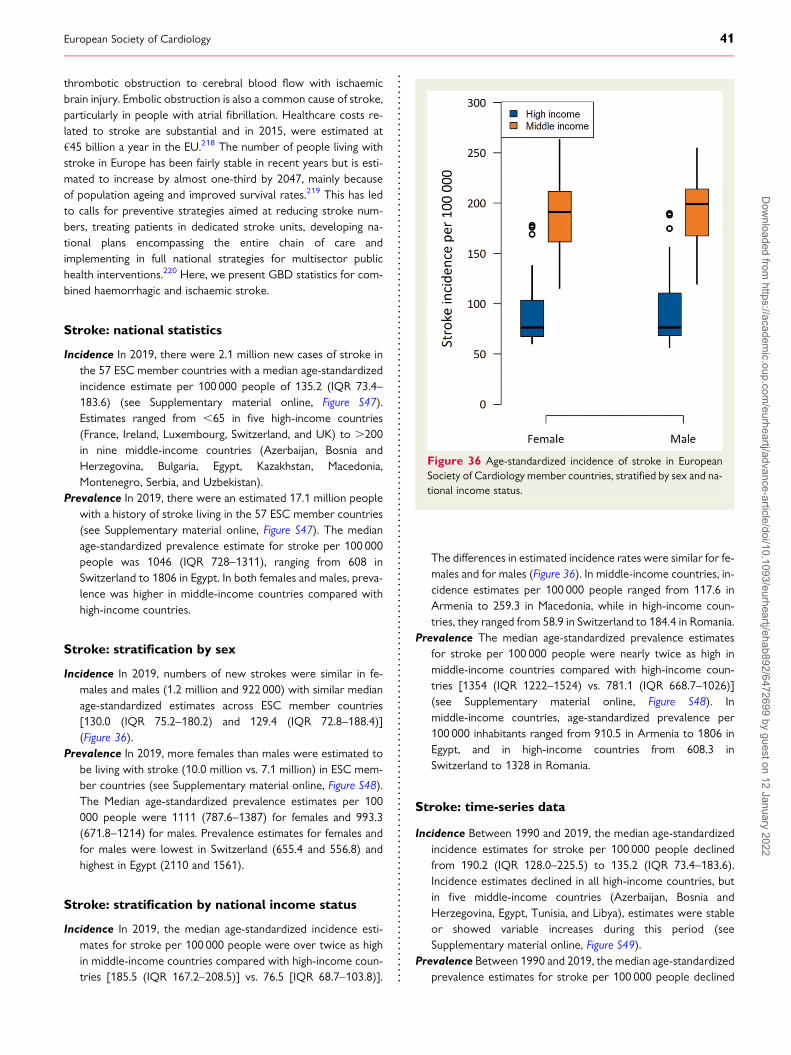
thrombotic obstruction to cerebral blood flow with ischaemicbrain injury. Embolic obstruction is also a common cause of stroke,particularly in people with atrial fibrillation. Healthcare costs re-lated to stroke are substantial and in 2015, were estimated at€45 billion a year in the EU.218 The number of people living withstroke in Europe has been fairly stable in recent years but is esti-mated to increase by almost one-third by 2047, mainly becauseof population ageing and improved survival rates.219 This has ledto calls for preventive strategies aimed at reducing stroke num-bers, treating patients in dedicated stroke units, developing na-tional plans encompassing the entire chain of care andimplementing in full national strategies for multisector publichealth interventions.220 Here, we present GBD statistics for com-bined haemorrhagic and ischaemic stroke.
Stroke: national statistics
Incidence In 2019, there were 2.1 million new cases of stroke inthe 57 ESC member countries with a median age-standardizedincidence estimate per 100 000 people of 135.2 (IQR 73.4–183.6) (see Supplementary material online, Figure S47).Estimates ranged from ,65 in five high-income countries(France, Ireland, Luxembourg, Switzerland, and UK) to .200in nine middle-income countries (Azerbaijan, Bosnia andHerzegovina, Bulgaria, Egypt, Kazakhstan, Macedonia,Montenegro, Serbia, and Uzbekistan).
Prevalence In 2019, there were an estimated 17.1 million peoplewith a history of stroke living in the 57 ESC member countries(see Supplementary material online, Figure S47). The medianage-standardized prevalence estimate for stroke per 100 000people was 1046 (IQR 728–1311), ranging from 608 inSwitzerland to 1806 in Egypt. In both females and males, preva-lence was higher in middle-income countries compared withhigh-income countries.
Stroke: stratification by sex
Incidence In 2019, numbers of new strokes were similar in fe-males and males (1.2 million and 922 000) with similar medianage-standardized estimates across ESC member countries[130.0 (IQR 75.2–180.2) and 129.4 (IQR 72.8–188.4)](Figure 36).
Prevalence In 2019, more females than males were estimated tobe living with stroke (10.0 million vs. 7.1 million) in ESC mem-ber countries (see Supplementary material online, Figure S48).The Median age-standardized prevalence estimates per 100000 people were 1111 (787.6–1387) for females and 993.3(671.8–1214) for males. Prevalence estimates for females andfor males were lowest in Switzerland (655.4 and 556.8) andhighest in Egypt (2110 and 1561).
Stroke: stratification by national income status
Incidence In 2019, the median age-standardized incidence esti-mates for stroke per 100 000 people were over twice as highin middle-income countries compared with high-income coun-tries [185.5 (IQR 167.2–208.5)] vs. 76.5 [IQR 68.7–103.8)].
The differences in estimated incidence rates were similar for fe-males and for males (Figure 36). In middle-income countries, in-cidence estimates per 100 000 people ranged from 117.6 inArmenia to 259.3 in Macedonia, while in high-income coun-tries, they ranged from 58.9 in Switzerland to 184.4 in Romania.
Prevalence The median age-standardized prevalence estimatesfor stroke per 100 000 people were nearly twice as high inmiddle-income countries compared with high-income coun-tries [1354 (IQR 1222–1524) vs. 781.1 (IQR 668.7–1026)](see Supplementary material online, Figure S48). Inmiddle-income countries, age-standardized prevalence per100 000 inhabitants ranged from 910.5 in Armenia to 1806 inEgypt, and in high-income countries from 608.3 inSwitzerland to 1328 in Romania.
Stroke: time-series data
Incidence Between 1990 and 2019, the median age-standardizedincidence estimates for stroke per 100 000 people declinedfrom 190.2 (IQR 128.0–225.5) to 135.2 (IQR 73.4–183.6).Incidence estimates declined in all high-income countries, butin five middle-income countries (Azerbaijan, Bosnia andHerzegovina, Egypt, Tunisia, and Libya), estimates were stableor showed variable increases during this period (seeSupplementary material online, Figure S49).
Prevalence Between 1990 and 2019, the median age-standardizedprevalence estimates for stroke per 100 000 people declined
Figure 36 Age-standardized incidence of stroke in EuropeanSociety of Cardiology member countries, stratified by sex and na-tional income status.
European Society of Cardiology 41D
ownloaded from
https://academic.oup.com
/eurheartj/advance-article/doi/10.1093/eurheartj/ehab892/6472699 by guest on 12 January 2022
slightly from 1283 (IQR 1055–1523) to 1046 (IQR 728–1311).Declines in prevalence estimates occurred in all high-incomecountries, but in seven middle-income countries (Azerbaijan,Bosnia and Herzegovina, Egypt, Lebanon, Libya, Morocco,and Tunisia) estimates showed a variable increase (seeSupplementary material online, Figure S49).
Stroke: disability-adjusted life yearsIn 2019, stroke accounted for an estimated 23.4 million DALYsacross ESC member countries, representing approximatelyone-quarter of all DALYs due to CVD. The median number ofage-standardized DALYs due to stroke was estimated at 1231(IQR 571.3–2218) per 100 000 inhabitants, ranging from ,500in Austria, France, Israel, Iceland, Ireland, and Switzerland to.3000 in Bulgaria, Republic of Georgia, Kazakhstan,Macedonia, Montenegro, and Uzbekistan (see Supplementarymaterial online, Figure S50). Age-standardized DALYs for maleswere higher compared with females [1402 (IQR 616.8–2463) vs.1096 (IQR 540.2–1991)] and nearly four times as high inmiddle-income compared with high-income countries [2276(IQR 1946–2992) vs. 578.9 (IQR 533.6–946.5)] (seeSupplementary material online, Figure S51). In high-incomecountries age-standardized DALYs due to stroke have declinedby more than half since 1990, but in middle-income countries,the decline has been smaller (see Supplementary material on-line, Figure S52).
Peripheral arterial diseaseInstitute for Health Metrics and Evaluation defines PAD as havingan ankle–brachial index (ABI) of ,0.90, with intermittent claudi-cation defined as leg pain on exertion among those with an ABIbelow that threshold.221 After CHD and stroke, PAD is the thirdmost prevalent form of atherosclerotic CVD. The risk of PAD in-creases sharply with age and with exposure to major CV risk fac-tors. It is estimated that PAD, whether or not it is symptomatic,increases CV morbidity and mortality risks by 80–90%.222
Reports suggest that within 5 years of diagnosis, 10–15% of pa-tients who have intermittent claudication will die fromCVD.223 This highlights the importance of the identificationand modification of risk factors associated with PAD, heart dis-ease, and stroke.
Peripheral arterial disease: national statistics
Incidence In 2019, there were an estimated 2.5 million new casesof PAD in the 57 ESC member countries. The medianage-standardized incidence estimate for new cases of PADper 100 000 people was 136.8 (IQR 118.8–166.8), rangingfrom 107.3 in Syrian Arab Republic to 224.9 in Denmark (seeSupplementary material online, Figure S53).
Prevalence In 2019, there were an estimated 29.5 million peopleliving with PAD in the 57 ESC member countries. The medianage-standardized prevalence estimate for PAD per 100 000people was 1459.5 (IQR 1254–1942), ranging from 1045 inSyrian Arab Republic to 2702 in Denmark (seeSupplementary material online, Figure S53).
Peripheral arterial disease: stratification by sex
Incidence In 2019, incident case estimates for PAD were higherfor females living in the 57 ESC member countries comparedwith males (1.6 million vs. 915 619). Age-standardized inci-dence estimates per 100 000 people were also higher in fe-males compared with males [157.1 (IQR 130.5–183.0) vs.114.1 (IQR 100.9–148.8)] (see Supplementary material online,Figure S54).
Prevalence In 2019, there were more than twice as many femalesas males estimated to be living with PAD (19.8 million vs. 9.6 mil-lion) in ESC member countries. The median age-standardizedprevalence estimates for PAD per 100 000 people were alsohigher for females than males [1675 (IQR 1387–2230) vs.1168 (IQR 1005–1602)] (see Supplementary material online,Figure S54). Estimates per 100 000 people for females rangedfrom 1192 in Syrian Arab Republic to 3036 in Denmark andfor males from 771.2 in Russian Federation to 2327 in Denmark.
Peripheral arterial disease: stratification by nationalincome status
Incidence Estimates for median age-standardized incidence ofPAD per 100 000 people were lower in middle-income com-pared with high-income countries [123.3 (IQR 111.2–135.1)vs. 165.5 (IQR 134.2–174.8)] (see Supplementary material on-line, Figure S54). In middle-income countries, incidence esti-mates per 100 000 people ranged from 107.3 in Syrian ArabRepublic to 157.5 in Ukraine while in high-income countries,they ranged from 112.0 in Slovakia to 224.9 in Denmark.
Prevalence Median age-standardized prevalence estimates forPAD per 100 000 people were lower in middle-income com-pared with high-income countries [1280 (IQR 1117–1392) vs.1915 (IQR 1447–2049)] (see Supplementary material online,Figure S54). In middle-income countries, age-standardized pre-valence estimates ranged from 1045 in Syrian Arab Republic to1726 in Russian Federation and in high-income countries from1185 in Slovakia to 2702 in Denmark.
Peripheral arterial disease: time-series data
Incidence Between 1990 and 2019, the median age-standardizedincidence estimates for PAD per 100 000 people remained re-latively stable, changing from 144.3 (IQR 128.0–239.8) in 1990to 136.8 (IQR 118.8–166.8) in 2019. In high-income countries,a decline in incidence estimates occurred from 238.0 (IQR148.9–246.7) in 1990 to 165.5 (IQR 134.2–174.8) in 2019(see Supplementary material online, Figure S55).
Prevalence Between 1990 and 2019, the median age-standardizedprevalence estimates for PVD per 100 000 people showed justminor change from 1552 (IQR 1314–2832) to 1460 (IQR1254–1942) in 2019. Small declines in prevalence estimates oc-curred in all but one (Latvia) high-income countries; however,small increases occurred in nine middle-income countries(Bosnia and Herzegovina, Egypt, Republic of Georgia, Libya,Lebanon, Republic of Moldova, Serbia, Tunisia, Uzbekistan)(see Supplementary material online, Figure S55).
42 A. Timmis et al.D
ownloaded from
https://academic.oup.com
/eurheartj/advance-article/doi/10.1093/eurheartj/ehab892/6472699 by guest on 12 January 2022
Peripheral arterial disease: disability-adjusted lifeyearsIn 2019, PAD accounted for only about 1% of DALYs due to CVD.The median age-standardized number of DALYs across ESC mem-ber countries was estimated to be 20.8 (IQR 10.6–32.4) per 100000 people. Disability-adjusted life years due to PAD were some-what lower in females compared with males [16.7 (IQR 9.6–24.1)vs. 23.1 (IQR 10.8–41.4)] and in middle-income comparedwith high-income countries [9.9 (IQR 8.3–15.4) vs. 25.3 (IQR21.0–39.2)] (see Supplementary material online, Figure S56).Time-series analysis showed almost no change in age-standardizedDALYs due to PAD between 1990 and 2019 [20.3 (IQR 10.4–32.9) vs. 20.8 (IQR 10.6–32.4)].
Atrial fibrillationAtrial fibrillation, persistent or paroxysmal, is defined byIHME as a supraventricular arrhythmia due to progressive atrio-pathy, defined by surface ECG diagnosis based on irregular RR in-tervals [in the absence of complete atrioventricular (AV) block]and no distinct P waves.224 Atrial fibrillation is prevalent acrossall high-income countries and increasingly across many middle-and low-income countries.225 It worsens quality of life,226 in-creases mortality, and is associated with significant morbidity, in-cluding an increased risk of stroke.227 The prevalence of AFacross Europe is expected to rise substantially as the populationages228 and this will increase rates of AF-related strokes and hos-pitalizations with knock on effects for healthcare costs. In 2020, AFis predicted to directly cost the UK between 0.9 and 1.6% ofNational Health Service expenditure.229
Atrial fibrillation: national statistics
Incidence In 2019, there were an estimated one million new casesof AF in the 57 ESC member countries with the medianage-standardized incidence per 100 000 people estimated at63.0 (IQR 56.4–71.2) (see Supplementary material online,Figure S57). Incidence rates exceeded 80 per 100 000 peoplein Austria and Sweden.
Prevalence In 2019, there were an estimated 15.7 million peopleliving with AF across ESC member countries. The estimatedage-standardized prevalence rate per 100 000 was 893.7 (IQR790.8–1007) ranging from ,500 in Algeria, Egypt, Syrian ArabRepublic, and Tunisia to .1000 in Austria, Czech Republic,Estonia, Hungary, Latvia, Lithuania, Luxembourg, Poland,Slovakia, Sweden, UK, Belarus, Republic of Moldova, RussianFederation, and Ukraine (see Supplementary material online,Figure S57).
Atrial fibrillation: stratification by sex
Incidence In 2019, there were estimated to be fewer cases of AFin females compared with males (498 000 vs. 539 000) acrossESC member countries. The estimated medianage-standardized incidence per 100 000 inhabitants was alsolower in females [51.0 (IQR 45.1–58.0) vs. 76.3 (IQR 69.8–83.7)] (see Supplementary material online, Figure S58).
Prevalence In 2019, fewer females than males were estimated tobe living with AF (7.5 million vs. 8.3 million) across ESC mem-ber countries. The median age-standardized prevalence esti-mates for AF per 100 000 people were lower for femalesthan males [696.6 (IQR 554.6–781.3) vs. 1146 (IQR 1051–1265)] (see Supplementary material online, Figure S58). Ratesfor females ranged from 493.8 in Switzerland to 958.5 inUkraine and for males from 469.0 in Algeria to 1725 in Sweden.
Atrial fibrillation: stratification by national incomestatus
Incidence In 2019, the median age-standardized incidence esti-mates for AF per 100 000 people were similar inmiddle-income countries compared with high-income coun-tries [64.0 (IQR 42.5–68.2) vs. 61.7 (IQR 58.7–73.8)] (seeSupplementary material online, Figure S58). In middle-incomecountries, incidence estimates per 100 000 people rangedfrom 40.5 in Algeria and Tunisia to 76.8 in Ukraine and in high-income countries from 50.9 in Switzerland to 88.44 in Sweden.
Prevalence The median age-standardized prevalence estimatesfor AF per 100 000 people were similar in middle-incomecountries compared with high-income countries [898.6 (IQR515.7–956.8) vs. 871.3 (IQR 831.4–1048)] (seeSupplementary material online, Figure S58). Estimates remainedsimilar in females compared with males.
Atrial fibrillation: time-series data
Incidence Between 1990 and 2019, the median age-standardizedincidence estimates for AF per 100 000 people remained rela-tively stable at 66.9 (IQR 62.2–71.0) in 1990 and 63.0 (IQR56.4–71.2) in 2019 (see Supplementary material online,Figure S59). Stable estimates were also recorded by sex and na-tional income status.
Prevalence Between 1990 and 2019, the median age-standardized prevalence estimates for AF per 100000 peoplewere stable at 926.3 (IQR 856.9–989.8) in 1990 and 893.7(IQR 790.8–1007) in 2019 (see Supplementary material online,Figure S59).
Atrial fibrillation: disability-adjusted life yearsIn 2019, AF accounted for 2.4 million DALYs, ,3% of all DALYsdue to CVD. The median age-standardized DALYs due to AFwere estimated at 128.9 (IQR 116.1–145.8) per 100 000 inhabi-tants of ESC member countries (see Supplementary material on-line, Figure S60), with little difference by sex or national incomestatus. Time-series analysis showed little change inage-standardized DALYs due to AF between 1990 and 2019.
Rheumatic heart diseaseRheumatic heart disease, a chronic autoimmune valvulitis due torheumatic fever, is defined by IHME as a clinical diagnosis by a phy-sician.230 It is a disease of poverty driven by poor housing andovercrowding which in 2015 affected 33.4 million people globallyand caused 319 400 deaths most of which occurred in low- and
European Society of Cardiology 43D
ownloaded from
https://academic.oup.com
/eurheartj/advance-article/doi/10.1093/eurheartj/ehab892/6472699 by guest on 12 January 2022
lower-middle-income countries.13 In a recent meta-analysis231 thatincluded 1 090 792 participants from 82 studies, the overall preva-lence estimates for RHD using WHO criteria were 11.3% (IQR7.2–16.2%), varying inversely with national income status. In re-sponse to the continuing high prevalence of RHD in developingcountries, theWHO has endorsed a strategy that includes improv-ing living conditions of at-risk populations, treating all patients withstreptococcal pharyngitis with penicillin and using antibiotic pro-phylaxis in persons with a history of RHD to preventrecurrence.232
Rheumatic heart disease: national statistics
Incidence In 2019, there were an estimated 152 700 new cases ofRHD in the 57 ESC member countries, with a medianage-standardized incidence per 100 000 inhabitants of 4.7(IQR 3.0–8.1) (see Supplementary material online,Figure S61). Incidence estimates exceeded 40 per 100 000 peo-ple in Albania, Armenia, Azerbaijan, Republic of Georgia,Kyrgyzstan, and Uzbekistan.
Prevalence In 2019, there were an estimated 2.3 million peopleliving with RHD across ESC member countries. The estimatedage-standardized prevalence rate per 100 000 was 58.2 (IQR33.0–139.9), ranging from ,25 in Denmark, Finland, Greece,Iceland, Malta, Norway, and Sweden to .700 in Albania,Armenia, Azerbaijan, Republic of Georgia, Kyrgyzstan, andUzbekistan (see Supplementary material online, Figure S61).
Rheumatic heart disease: stratification by sex
Incidence There was a small excess of new cases of RHD in fe-males living in ESC member countries compared with males(84 700 vs. 67 900) and this was reflected in the estimatedmedian age-standardized incidence rate per 100 000 inhabi-tants which was also higher in females [5.3 (IQR 3.2–9.3) vs.4.3 (IQR 2.9–6.9)] (see Supplementary material online,Figure S62.
Prevalence In 2019, more females than males were estimated tobe living with RHD (1.3 million vs. 1.0 million) across ESCmember countries. The median age-standardized prevalenceestimates for RHD per 100 000 people were higher for femalesthan males [63.4 (IQR 36.1–158.1) vs. 54.0 (IQR 30.0–112.7)].Rates for females and males were lowest in Finland (20.2 and15.4) and highest in Armenia (872.6 and 715.9) (seeSupplementary material online, Figure S62).
Rheumatic heart disease: stratification by nationalincome status
Incidence In 2019, the median age-standardized incidence estimatesfor RHD per 100000 people were twice as high in middle-incomecountries compared with high-income countries [8.0 (IQR 4.5–37.0) vs. 4.2 (IQR 2.6–5.7)] (see Supplementary material online,Figure S62). In middle-income countries, incidence estimates per100000 people ranged from 2.2 in Turkey to 45.9 inUzbekistan and in high-income countries from 1.5 in Finland to9.0 in Lithuania.
Prevalence The median age-standardized prevalence estimatesfor RHD per 100 000 people were more than three times ashigh in middle-income countries compared with high-incomecountries [134.7 (IQR 59.7–642.3) vs. 39.8 (IQR 28.4–67.6)](see Supplementary material online, Figure S62). The increasedprevalence of RHD in middle-income countries was similar forfemales and males.
Rheumatic heart disease: time-series data
Incidence Between 1990 and 2019, the median age-standardizedincidence estimates for RHD per 100 000 people living in the57 ESC member countries declined from 7.8 (IQR 4.6–14.6)to 4.7 (IQR 3.0–8.1) (Figure 37). Incidence estimates declinedin all but three high-income countries (Belgium, Netherlands,Slovakia) and in all but five middle-income countries(Republic of Georgia, Kyrgyzstan, Libya, Syrian Arab Republic,and Uzbekistan).
Prevalence Between 1990 and 2019, the median age-standardizedprevalence estimates for RHD per 100 000 people declinedfrom 82.7 (IQR 44.5–218.4) to 58.2 (IQR 33.0–139.9) (seeSupplementary material online, Figure S63). Declines of about30% were seen in both middle-income and high-incomecountries.
Rheumatic heart disease: disability-adjusted lifeyearsIn 2019, RHD accounted for an estimated 693 000 DALYs acrossESC member countries,,1% of all DALYs due to CVD. The med-ian age-standardized DALYs due to RHD were 33.3 (IQR 20.4–53.4) per 100 000 inhabitants of ESC member countries, with littledifference by sex (see Supplementary material online, Figure S64).More than twice as many DALYs due to RHD were recorded inmiddle-income countries compared with high-income countries[58.4 (IQR 34.4–84.2) vs. 24.3 (IQR 15.4–33.3)]. Time-series ana-lysis showed steep declines in age-standardized DALYs due toRHD between 1990 and 2019 from 90.5 (IQR 56.1–412.0) to33.3 (IQR 20.4–240.3) (see Supplementary material online,Figure S65).
Calcific aortic valve diseaseCalcific aortic valve disease (AVD) is defined by IHME as clinicaldiagnosis of stenosis or regurgitation due to progressive calcifica-tion of the valve, excluding congenital, rheumatic, or infectiouscauses but including stenosis of a bicuspid aortic valve.233 It is a de-generative disorder that is relatively uncommon before the age of65 years except when the valve is bicuspid when it may developearlier. Presentation is usually with aortic stenosis which is nowone of the most common types of valvular heart disease inEurope and North America, although in low and middle-incomecountries RHD remains more common. Calcific aortic stenosis af-fects about 5% of the population at age 65 years with increasingprevalence as age advances.234,235 Increasing life expectancy, par-ticularly in low and middle-income countries, is likely to result ina substantial future burden of calcific AVD.
44 A. Timmis et al.D
ownloaded from
https://academic.oup.com
/eurheartj/advance-article/doi/10.1093/eurheartj/ehab892/6472699 by guest on 12 January 2022
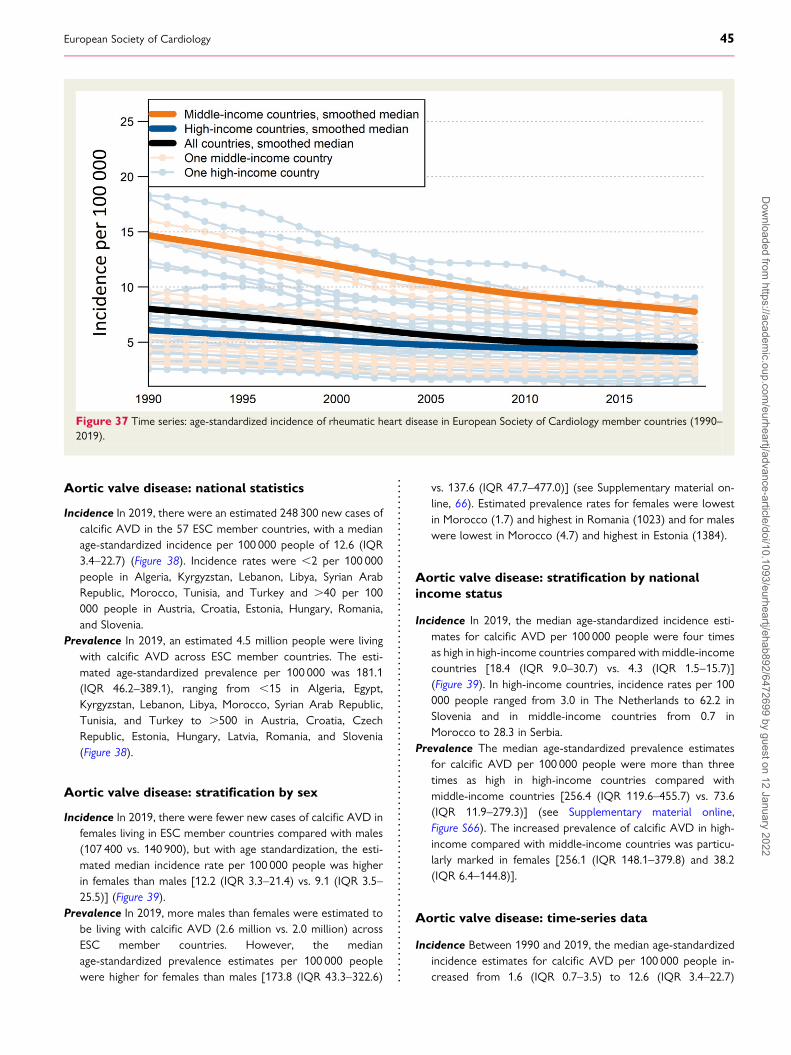
Aortic valve disease: national statistics
Incidence In 2019, there were an estimated 248 300 new cases ofcalcific AVD in the 57 ESC member countries, with a medianage-standardized incidence per 100 000 people of 12.6 (IQR3.4–22.7) (Figure 38). Incidence rates were ,2 per 100 000people in Algeria, Kyrgyzstan, Lebanon, Libya, Syrian ArabRepublic, Morocco, Tunisia, and Turkey and .40 per 100000 people in Austria, Croatia, Estonia, Hungary, Romania,and Slovenia.
Prevalence In 2019, an estimated 4.5 million people were livingwith calcific AVD across ESC member countries. The esti-mated age-standardized prevalence per 100 000 was 181.1(IQR 46.2–389.1), ranging from ,15 in Algeria, Egypt,Kyrgyzstan, Lebanon, Libya, Morocco, Syrian Arab Republic,Tunisia, and Turkey to .500 in Austria, Croatia, CzechRepublic, Estonia, Hungary, Latvia, Romania, and Slovenia(Figure 38).
Aortic valve disease: stratification by sex
Incidence In 2019, there were fewer new cases of calcific AVD infemales living in ESC member countries compared with males(107 400 vs. 140 900), but with age standardization, the esti-mated median incidence rate per 100 000 people was higherin females than males [12.2 (IQR 3.3–21.4) vs. 9.1 (IQR 3.5–25.5)] (Figure 39).
Prevalence In 2019, more males than females were estimated tobe living with calcific AVD (2.6 million vs. 2.0 million) acrossESC member countries. However, the medianage-standardized prevalence estimates per 100 000 peoplewere higher for females than males [173.8 (IQR 43.3–322.6)
vs. 137.6 (IQR 47.7–477.0)] (see Supplementary material on-line, 66). Estimated prevalence rates for females were lowestin Morocco (1.7) and highest in Romania (1023) and for maleswere lowest in Morocco (4.7) and highest in Estonia (1384).
Aortic valve disease: stratification by nationalincome status
Incidence In 2019, the median age-standardized incidence esti-mates for calcific AVD per 100 000 people were four timesas high in high-income countries compared with middle-incomecountries [18.4 (IQR 9.0–30.7) vs. 4.3 (IQR 1.5–15.7)](Figure 39). In high-income countries, incidence rates per 100000 people ranged from 3.0 in The Netherlands to 62.2 inSlovenia and in middle-income countries from 0.7 inMorocco to 28.3 in Serbia.
Prevalence The median age-standardized prevalence estimatesfor calcific AVD per 100 000 people were more than threetimes as high in high-income countries compared withmiddle-income countries [256.4 (IQR 119.6–455.7) vs. 73.6(IQR 11.9–279.3)] (see Supplementary material online,Figure S66). The increased prevalence of calcific AVD in high-income compared with middle-income countries was particu-larly marked in females [256.1 (IQR 148.1–379.8) and 38.2(IQR 6.4–144.8)].
Aortic valve disease: time-series data
Incidence Between 1990 and 2019, the median age-standardizedincidence estimates for calcific AVD per 100 000 people in-creased from 1.6 (IQR 0.7–3.5) to 12.6 (IQR 3.4–22.7)
Figure 37 Time series: age-standardized incidence of rheumatic heart disease in European Society of Cardiology member countries (1990–2019).
European Society of Cardiology 45D
ownloaded from
https://academic.oup.com
/eurheartj/advance-article/doi/10.1093/eurheartj/ehab892/6472699 by guest on 12 January 2022
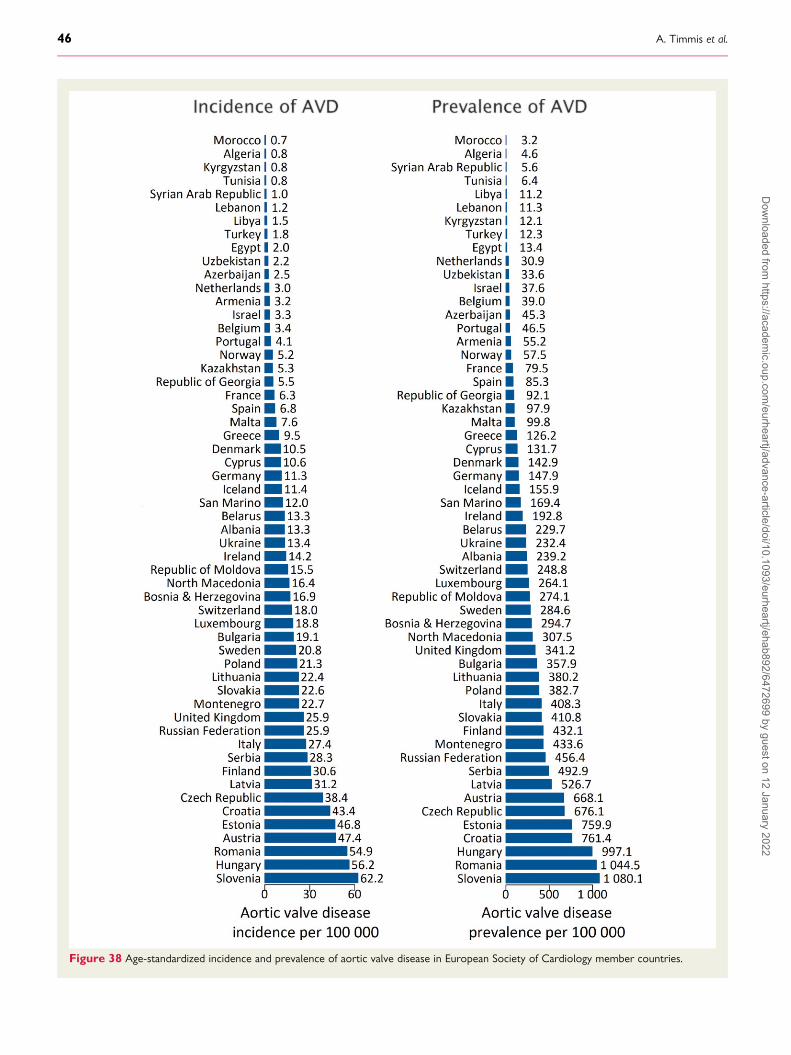
Figure 38 Age-standardized incidence and prevalence of aortic valve disease in European Society of Cardiology member countries.
46 A. Timmis et al.D
ownloaded from
https://academic.oup.com
/eurheartj/advance-article/doi/10.1093/eurheartj/ehab892/6472699 by guest on 12 January 2022
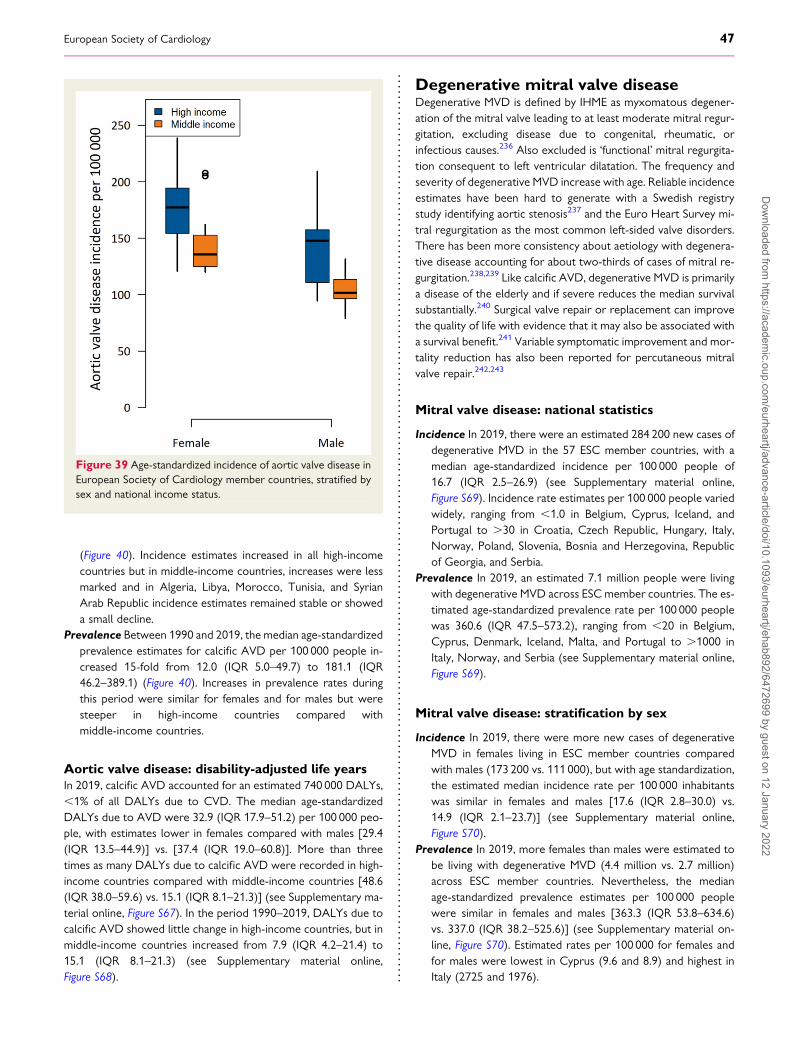
(Figure 40). Incidence estimates increased in all high-incomecountries but in middle-income countries, increases were lessmarked and in Algeria, Libya, Morocco, Tunisia, and SyrianArab Republic incidence estimates remained stable or showeda small decline.
Prevalence Between 1990 and 2019, the median age-standardizedprevalence estimates for calcific AVD per 100 000 people in-creased 15-fold from 12.0 (IQR 5.0–49.7) to 181.1 (IQR46.2–389.1) (Figure 40). Increases in prevalence rates duringthis period were similar for females and for males but weresteeper in high-income countries compared withmiddle-income countries.
Aortic valve disease: disability-adjusted life yearsIn 2019, calcific AVD accounted for an estimated 740 000 DALYs,,1% of all DALYs due to CVD. The median age-standardizedDALYs due to AVD were 32.9 (IQR 17.9–51.2) per 100 000 peo-ple, with estimates lower in females compared with males [29.4(IQR 13.5–44.9)] vs. [37.4 (IQR 19.0–60.8)]. More than threetimes as many DALYs due to calcific AVD were recorded in high-income countries compared with middle-income countries [48.6(IQR 38.0–59.6) vs. 15.1 (IQR 8.1–21.3)] (see Supplementary ma-terial online, Figure S67). In the period 1990–2019, DALYs due tocalcific AVD showed little change in high-income countries, but inmiddle-income countries increased from 7.9 (IQR 4.2–21.4) to15.1 (IQR 8.1–21.3) (see Supplementary material online,Figure S68).
Degenerative mitral valve diseaseDegenerative MVD is defined by IHME as myxomatous degener-ation of the mitral valve leading to at least moderate mitral regur-gitation, excluding disease due to congenital, rheumatic, orinfectious causes.236 Also excluded is ‘functional’ mitral regurgita-tion consequent to left ventricular dilatation. The frequency andseverity of degenerative MVD increase with age. Reliable incidenceestimates have been hard to generate with a Swedish registrystudy identifying aortic stenosis237 and the Euro Heart Survey mi-tral regurgitation as the most common left-sided valve disorders.There has been more consistency about aetiology with degenera-tive disease accounting for about two-thirds of cases of mitral re-gurgitation.238,239 Like calcific AVD, degenerative MVD is primarilya disease of the elderly and if severe reduces the median survivalsubstantially.240 Surgical valve repair or replacement can improvethe quality of life with evidence that it may also be associated witha survival benefit.241 Variable symptomatic improvement and mor-tality reduction has also been reported for percutaneous mitralvalve repair.242,243
Mitral valve disease: national statistics
Incidence In 2019, there were an estimated 284 200 new cases ofdegenerative MVD in the 57 ESC member countries, with amedian age-standardized incidence per 100 000 people of16.7 (IQR 2.5–26.9) (see Supplementary material online,Figure S69). Incidence rate estimates per 100 000 people variedwidely, ranging from ,1.0 in Belgium, Cyprus, Iceland, andPortugal to .30 in Croatia, Czech Republic, Hungary, Italy,Norway, Poland, Slovenia, Bosnia and Herzegovina, Republicof Georgia, and Serbia.
Prevalence In 2019, an estimated 7.1 million people were livingwith degenerative MVD across ESC member countries. The es-timated age-standardized prevalence rate per 100 000 peoplewas 360.6 (IQR 47.5–573.2), ranging from ,20 in Belgium,Cyprus, Denmark, Iceland, Malta, and Portugal to .1000 inItaly, Norway, and Serbia (see Supplementary material online,Figure S69).
Mitral valve disease: stratification by sex
Incidence In 2019, there were more new cases of degenerativeMVD in females living in ESC member countries comparedwith males (173 200 vs. 111 000), but with age standardization,the estimated median incidence rate per 100 000 inhabitantswas similar in females and males [17.6 (IQR 2.8–30.0) vs.14.9 (IQR 2.1–23.7)] (see Supplementary material online,Figure S70).
Prevalence In 2019, more females than males were estimated tobe living with degenerative MVD (4.4 million vs. 2.7 million)across ESC member countries. Nevertheless, the medianage-standardized prevalence estimates per 100 000 peoplewere similar in females and males [363.3 (IQR 53.8–634.6)vs. 337.0 (IQR 38.2–525.6)] (see Supplementary material on-line, Figure S70). Estimated rates per 100 000 for females andfor males were lowest in Cyprus (9.6 and 8.9) and highest inItaly (2725 and 1976).
Figure 39 Age-standardized incidence of aortic valve disease inEuropean Society of Cardiology member countries, stratified bysex and national income status.
European Society of Cardiology 47D
ownloaded from
https://academic.oup.com
/eurheartj/advance-article/doi/10.1093/eurheartj/ehab892/6472699 by guest on 12 January 2022
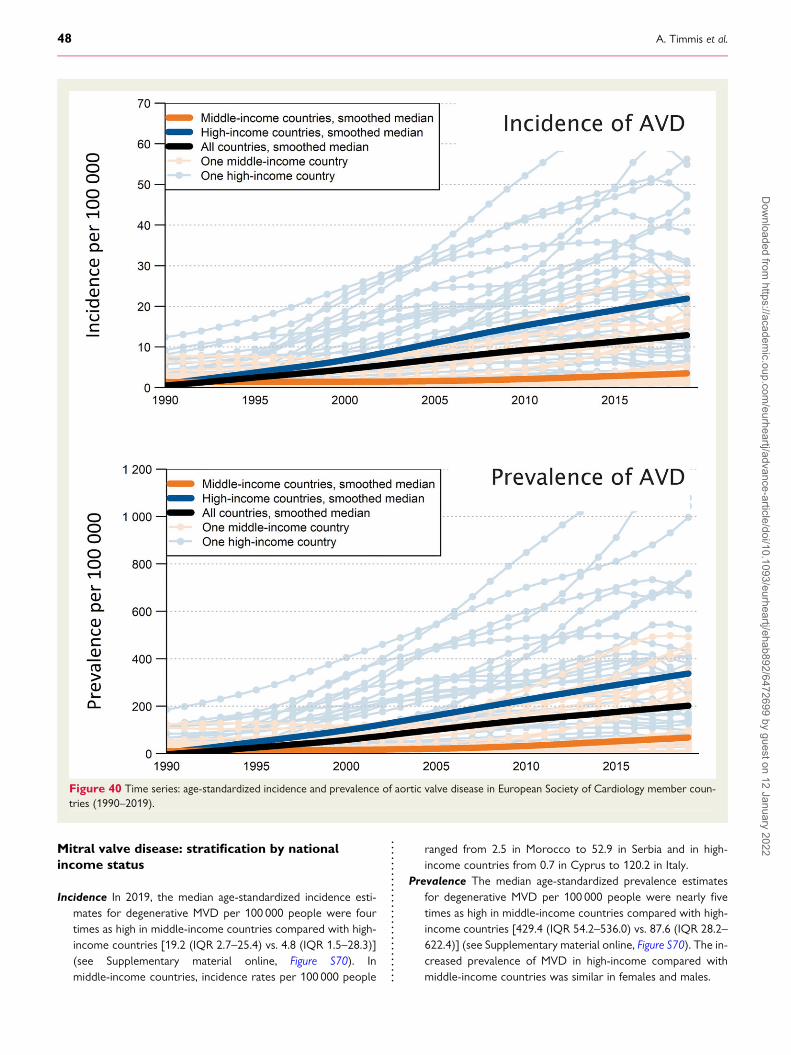
Mitral valve disease: stratification by nationalincome status
Incidence In 2019, the median age-standardized incidence esti-mates for degenerative MVD per 100 000 people were fourtimes as high in middle-income countries compared with high-income countries [19.2 (IQR 2.7–25.4) vs. 4.8 (IQR 1.5–28.3)](see Supplementary material online, Figure S70). Inmiddle-income countries, incidence rates per 100 000 people
ranged from 2.5 in Morocco to 52.9 in Serbia and in high-income countries from 0.7 in Cyprus to 120.2 in Italy.
Prevalence The median age-standardized prevalence estimatesfor degenerative MVD per 100 000 people were nearly fivetimes as high in middle-income countries compared with high-income countries [429.4 (IQR 54.2–536.0) vs. 87.6 (IQR 28.2–622.4)] (see Supplementary material online, Figure S70). The in-creased prevalence of MVD in high-income compared withmiddle-income countries was similar in females and males.
Figure 40 Time series: age-standardized incidence and prevalence of aortic valve disease in European Society of Cardiology member coun-tries (1990–2019).
48 A. Timmis et al.D
ownloaded from
https://academic.oup.com
/eurheartj/advance-article/doi/10.1093/eurheartj/ehab892/6472699 by guest on 12 January 2022
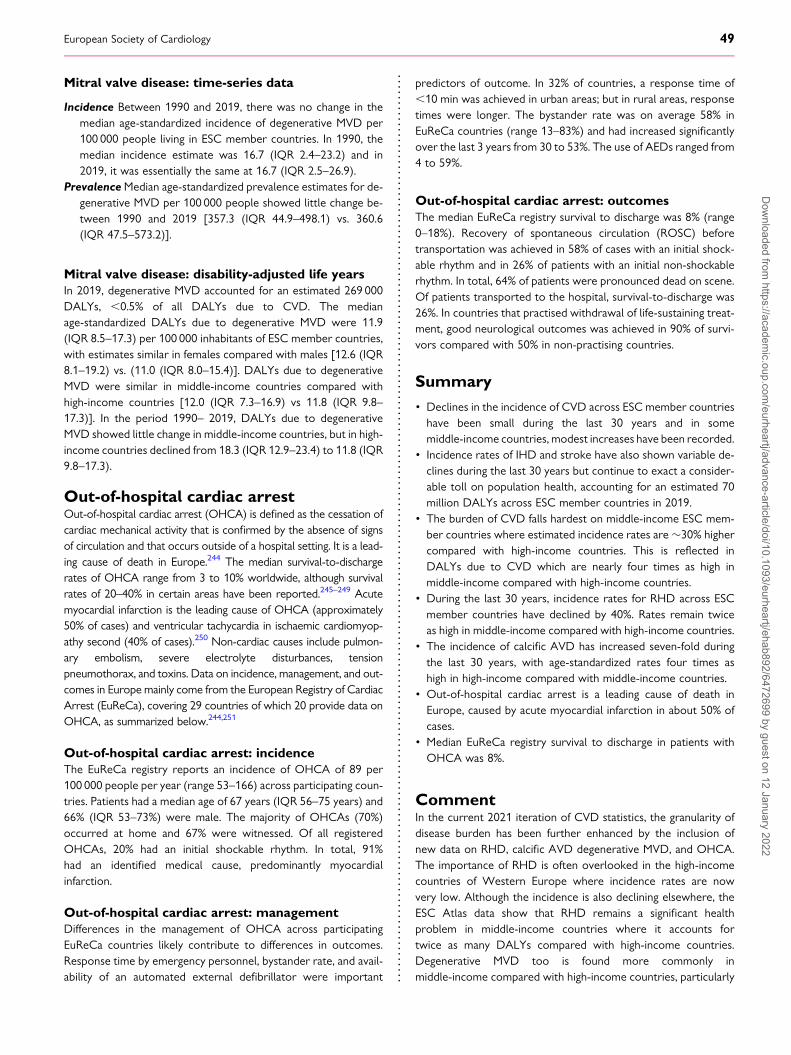
Mitral valve disease: time-series data
Incidence Between 1990 and 2019, there was no change in themedian age-standardized incidence of degenerative MVD per100 000 people living in ESC member countries. In 1990, themedian incidence estimate was 16.7 (IQR 2.4–23.2) and in2019, it was essentially the same at 16.7 (IQR 2.5–26.9).
PrevalenceMedian age-standardized prevalence estimates for de-generative MVD per 100 000 people showed little change be-tween 1990 and 2019 [357.3 (IQR 44.9–498.1) vs. 360.6(IQR 47.5–573.2)].
Mitral valve disease: disability-adjusted life yearsIn 2019, degenerative MVD accounted for an estimated 269 000DALYs, ,0.5% of all DALYs due to CVD. The medianage-standardized DALYs due to degenerative MVD were 11.9(IQR 8.5–17.3) per 100 000 inhabitants of ESC member countries,with estimates similar in females compared with males [12.6 (IQR8.1–19.2) vs. (11.0 (IQR 8.0–15.4)]. DALYs due to degenerativeMVD were similar in middle-income countries compared withhigh-income countries [12.0 (IQR 7.3–16.9) vs 11.8 (IQR 9.8–17.3)]. In the period 1990– 2019, DALYs due to degenerativeMVD showed little change in middle-income countries, but in high-income countries declined from 18.3 (IQR 12.9–23.4) to 11.8 (IQR9.8–17.3).
Out-of-hospital cardiac arrestOut-of-hospital cardiac arrest (OHCA) is defined as the cessation ofcardiac mechanical activity that is confirmed by the absence of signsof circulation and that occurs outside of a hospital setting. It is a lead-ing cause of death in Europe.244 The median survival-to-dischargerates of OHCA range from 3 to 10% worldwide, although survivalrates of 20–40% in certain areas have been reported.245–249 Acutemyocardial infarction is the leading cause of OHCA (approximately50% of cases) and ventricular tachycardia in ischaemic cardiomyop-athy second (40% of cases).250 Non-cardiac causes include pulmon-ary embolism, severe electrolyte disturbances, tensionpneumothorax, and toxins. Data on incidence, management, and out-comes in Europemainly come from the European Registry of CardiacArrest (EuReCa), covering 29 countries of which 20 provide data onOHCA, as summarized below.244,251
Out-of-hospital cardiac arrest: incidenceThe EuReCa registry reports an incidence of OHCA of 89 per100 000 people per year (range 53–166) across participating coun-tries. Patients had a median age of 67 years (IQR 56–75 years) and66% (IQR 53–73%) were male. The majority of OHCAs (70%)occurred at home and 67% were witnessed. Of all registeredOHCAs, 20% had an initial shockable rhythm. In total, 91%had an identified medical cause, predominantly myocardialinfarction.
Out-of-hospital cardiac arrest: managementDifferences in the management of OHCA across participatingEuReCa countries likely contribute to differences in outcomes.Response time by emergency personnel, bystander rate, and avail-ability of an automated external defibrillator were important
predictors of outcome. In 32% of countries, a response time of,10 min was achieved in urban areas; but in rural areas, responsetimes were longer. The bystander rate was on average 58% inEuReCa countries (range 13–83%) and had increased significantlyover the last 3 years from 30 to 53%. The use of AEDs ranged from4 to 59%.
Out-of-hospital cardiac arrest: outcomesThe median EuReCa registry survival to discharge was 8% (range0–18%). Recovery of spontaneous circulation (ROSC) beforetransportation was achieved in 58% of cases with an initial shock-able rhythm and in 26% of patients with an initial non-shockablerhythm. In total, 64% of patients were pronounced dead on scene.Of patients transported to the hospital, survival-to-discharge was26%. In countries that practised withdrawal of life-sustaining treat-ment, good neurological outcomes was achieved in 90% of survi-vors compared with 50% in non-practising countries.
Summary• Declines in the incidence of CVD across ESC member countrieshave been small during the last 30 years and in somemiddle-income countries, modest increases have been recorded.
• Incidence rates of IHD and stroke have also shown variable de-clines during the last 30 years but continue to exact a consider-able toll on population health, accounting for an estimated 70million DALYs across ESC member countries in 2019.
• The burden of CVD falls hardest on middle-income ESC mem-ber countries where estimated incidence rates are �30% highercompared with high-income countries. This is reflected inDALYs due to CVD which are nearly four times as high inmiddle-income compared with high-income countries.
• During the last 30 years, incidence rates for RHD across ESCmember countries have declined by 40%. Rates remain twiceas high in middle-income compared with high-income countries.
• The incidence of calcific AVD has increased seven-fold duringthe last 30 years, with age-standardized rates four times ashigh in high-income compared with middle-income countries.
• Out-of-hospital cardiac arrest is a leading cause of death inEurope, caused by acute myocardial infarction in about 50% ofcases.
• Median EuReCa registry survival to discharge in patients withOHCA was 8%.
CommentIn the current 2021 iteration of CVD statistics, the granularity ofdisease burden has been further enhanced by the inclusion ofnew data on RHD, calcific AVD degenerative MVD, and OHCA.The importance of RHD is often overlooked in the high-incomecountries of Western Europe where incidence rates are nowvery low. Although the incidence is also declining elsewhere, theESC Atlas data show that RHD remains a significant healthproblem in middle-income countries where it accounts fortwice as many DALYs compared with high-income countries.Degenerative MVD too is found more commonly inmiddle-income compared with high-income countries, particularly
European Society of Cardiology 49D
ownloaded from
https://academic.oup.com
/eurheartj/advance-article/doi/10.1093/eurheartj/ehab892/6472699 by guest on 12 January 2022
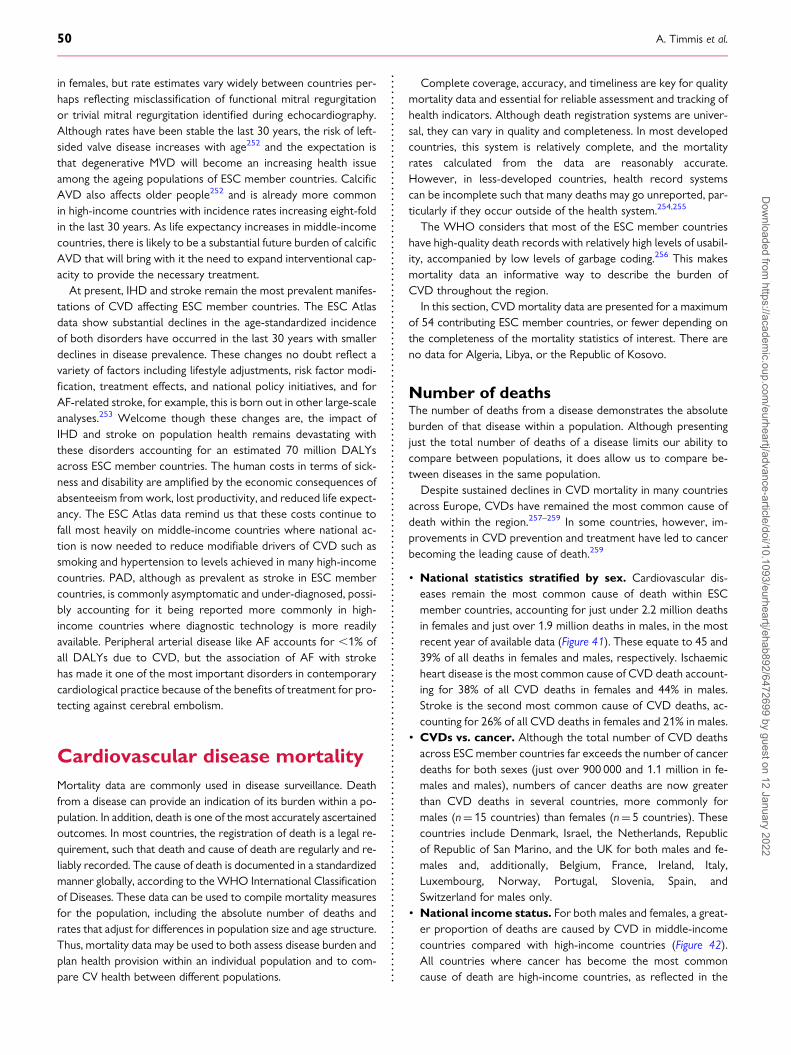
in females, but rate estimates vary widely between countries per-haps reflecting misclassification of functional mitral regurgitationor trivial mitral regurgitation identified during echocardiography.Although rates have been stable the last 30 years, the risk of left-sided valve disease increases with age252 and the expectation isthat degenerative MVD will become an increasing health issueamong the ageing populations of ESC member countries. CalcificAVD also affects older people252 and is already more commonin high-income countries with incidence rates increasing eight-foldin the last 30 years. As life expectancy increases in middle-incomecountries, there is likely to be a substantial future burden of calcificAVD that will bring with it the need to expand interventional cap-acity to provide the necessary treatment.
At present, IHD and stroke remain the most prevalent manifes-tations of CVD affecting ESC member countries. The ESC Atlasdata show substantial declines in the age-standardized incidenceof both disorders have occurred in the last 30 years with smallerdeclines in disease prevalence. These changes no doubt reflect avariety of factors including lifestyle adjustments, risk factor modi-fication, treatment effects, and national policy initiatives, and forAF-related stroke, for example, this is born out in other large-scaleanalyses.253 Welcome though these changes are, the impact ofIHD and stroke on population health remains devastating withthese disorders accounting for an estimated 70 million DALYsacross ESC member countries. The human costs in terms of sick-ness and disability are amplified by the economic consequences ofabsenteeism from work, lost productivity, and reduced life expect-ancy. The ESC Atlas data remind us that these costs continue tofall most heavily on middle-income countries where national ac-tion is now needed to reduce modifiable drivers of CVD such assmoking and hypertension to levels achieved in many high-incomecountries. PAD, although as prevalent as stroke in ESC membercountries, is commonly asymptomatic and under-diagnosed, possi-bly accounting for it being reported more commonly in high-income countries where diagnostic technology is more readilyavailable. Peripheral arterial disease like AF accounts for ,1% ofall DALYs due to CVD, but the association of AF with strokehas made it one of the most important disorders in contemporarycardiological practice because of the benefits of treatment for pro-tecting against cerebral embolism.
Cardiovascular disease mortalityMortality data are commonly used in disease surveillance. Deathfrom a disease can provide an indication of its burden within a po-pulation. In addition, death is one of the most accurately ascertainedoutcomes. In most countries, the registration of death is a legal re-quirement, such that death and cause of death are regularly and re-liably recorded. The cause of death is documented in a standardizedmanner globally, according to theWHO International Classificationof Diseases. These data can be used to compile mortality measuresfor the population, including the absolute number of deaths andrates that adjust for differences in population size and age structure.Thus, mortality data may be used to both assess disease burden andplan health provision within an individual population and to com-pare CV health between different populations.
Complete coverage, accuracy, and timeliness are key for qualitymortality data and essential for reliable assessment and tracking ofhealth indicators. Although death registration systems are univer-sal, they can vary in quality and completeness. In most developedcountries, this system is relatively complete, and the mortalityrates calculated from the data are reasonably accurate.However, in less-developed countries, health record systemscan be incomplete such that many deaths may go unreported, par-ticularly if they occur outside of the health system.254,255
The WHO considers that most of the ESC member countrieshave high-quality death records with relatively high levels of usabil-ity, accompanied by low levels of garbage coding.256 This makesmortality data an informative way to describe the burden ofCVD throughout the region.
In this section, CVD mortality data are presented for a maximumof 54 contributing ESC member countries, or fewer depending onthe completeness of the mortality statistics of interest. There areno data for Algeria, Libya, or the Republic of Kosovo.
Number of deathsThe number of deaths from a disease demonstrates the absoluteburden of that disease within a population. Although presentingjust the total number of deaths of a disease limits our ability tocompare between populations, it does allow us to compare be-tween diseases in the same population.
Despite sustained declines in CVD mortality in many countriesacross Europe, CVDs have remained the most common cause ofdeath within the region.257–259 In some countries, however, im-provements in CVD prevention and treatment have led to cancerbecoming the leading cause of death.259
• National statistics stratified by sex. Cardiovascular dis-eases remain the most common cause of death within ESCmember countries, accounting for just under 2.2 million deathsin females and just over 1.9 million deaths in males, in the mostrecent year of available data (Figure 41). These equate to 45 and39% of all deaths in females and males, respectively. Ischaemicheart disease is the most common cause of CVD death account-ing for 38% of all CVD deaths in females and 44% in males.Stroke is the second most common cause of CVD deaths, ac-counting for 26% of all CVD deaths in females and 21% in males.
• CVDs vs. cancer. Although the total number of CVD deathsacross ESC member countries far exceeds the number of cancerdeaths for both sexes (just over 900 000 and 1.1 million in fe-males and males), numbers of cancer deaths are now greaterthan CVD deaths in several countries, more commonly formales (n= 15 countries) than females (n= 5 countries). Thesecountries include Denmark, Israel, the Netherlands, Republicof Republic of San Marino, and the UK for both males and fe-males and, additionally, Belgium, France, Ireland, Italy,Luxembourg, Norway, Portugal, Slovenia, Spain, andSwitzerland for males only.
• National income status. For both males and females, a great-er proportion of deaths are caused by CVD in middle-incomecountries compared with high-income countries (Figure 42).All countries where cancer has become the most commoncause of death are high-income countries, as reflected in the
50 A. Timmis et al.D
ownloaded from
https://academic.oup.com
/eurheartj/advance-article/doi/10.1093/eurheartj/ehab892/6472699 by guest on 12 January 2022
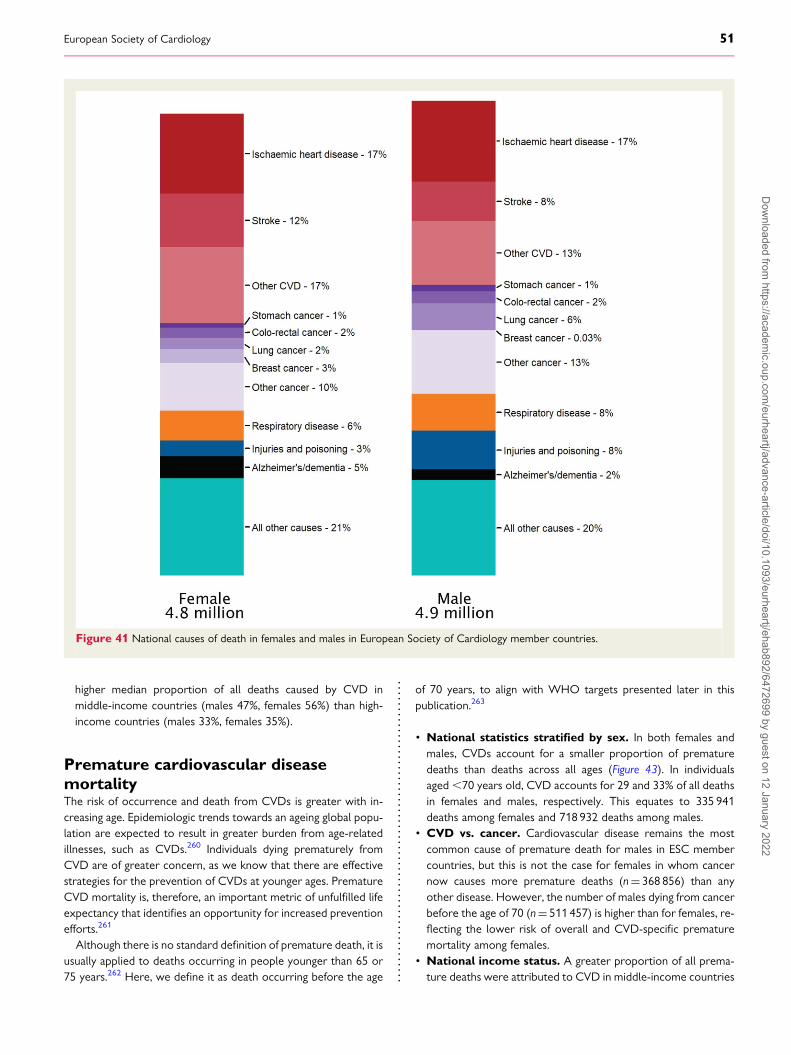
higher median proportion of all deaths caused by CVD inmiddle-income countries (males 47%, females 56%) than high-income countries (males 33%, females 35%).
Premature cardiovascular diseasemortalityThe risk of occurrence and death from CVDs is greater with in-creasing age. Epidemiologic trends towards an ageing global popu-lation are expected to result in greater burden from age-relatedillnesses, such as CVDs.260 Individuals dying prematurely fromCVD are of greater concern, as we know that there are effectivestrategies for the prevention of CVDs at younger ages. PrematureCVD mortality is, therefore, an important metric of unfulfilled lifeexpectancy that identifies an opportunity for increased preventionefforts.261
Although there is no standard definition of premature death, it isusually applied to deaths occurring in people younger than 65 or75 years.262 Here, we define it as death occurring before the age
of 70 years, to align with WHO targets presented later in thispublication.263
• National statistics stratified by sex. In both females andmales, CVDs account for a smaller proportion of prematuredeaths than deaths across all ages (Figure 43). In individualsaged,70 years old, CVD accounts for 29 and 33% of all deathsin females and males, respectively. This equates to 335 941deaths among females and 718 932 deaths among males.
• CVD vs. cancer. Cardiovascular disease remains the mostcommon cause of premature death for males in ESC membercountries, but this is not the case for females in whom cancernow causes more premature deaths (n= 368 856) than anyother disease. However, the number of males dying from cancerbefore the age of 70 (n= 511 457) is higher than for females, re-flecting the lower risk of overall and CVD-specific prematuremortality among females.
• National income status. A greater proportion of all prema-ture deaths were attributed to CVD in middle-income countries
Figure 41 National causes of death in females and males in European Society of Cardiology member countries.
European Society of Cardiology 51D
ownloaded from
https://academic.oup.com
/eurheartj/advance-article/doi/10.1093/eurheartj/ehab892/6472699 by guest on 12 January 2022
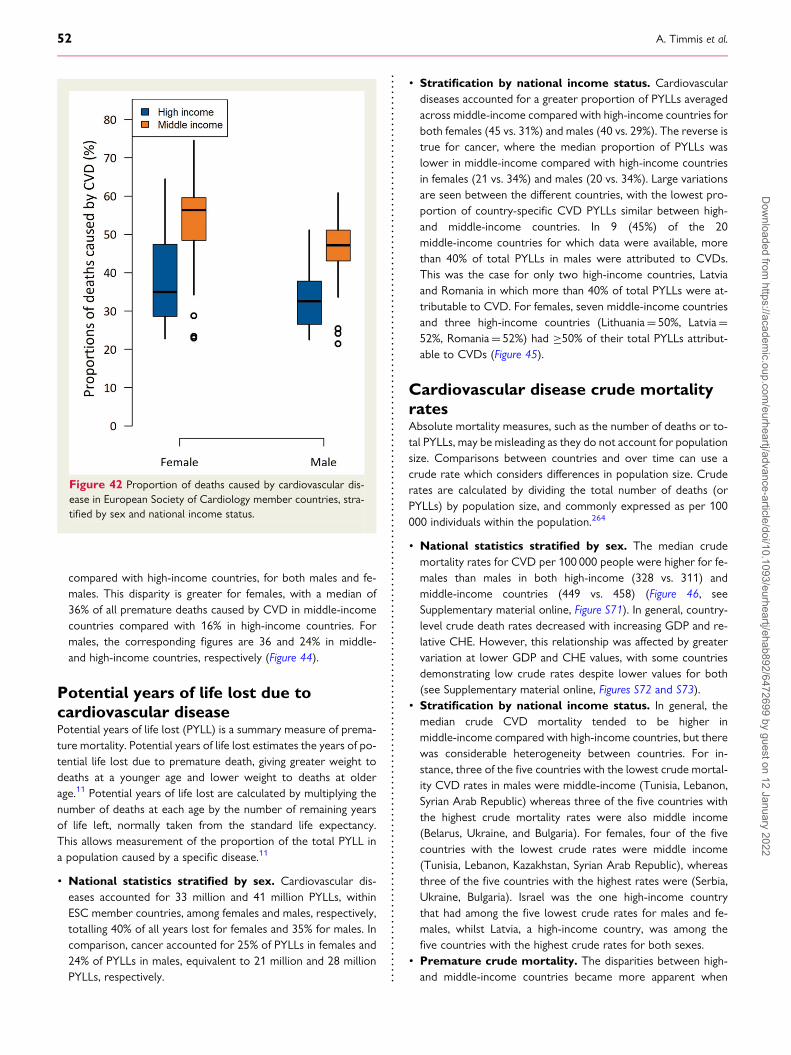
compared with high-income countries, for both males and fe-males. This disparity is greater for females, with a median of36% of all premature deaths caused by CVD in middle-incomecountries compared with 16% in high-income countries. Formales, the corresponding figures are 36 and 24% in middle-and high-income countries, respectively (Figure 44).
Potential years of life lost due tocardiovascular diseasePotential years of life lost (PYLL) is a summary measure of prema-ture mortality. Potential years of life lost estimates the years of po-tential life lost due to premature death, giving greater weight todeaths at a younger age and lower weight to deaths at olderage.11 Potential years of life lost are calculated by multiplying thenumber of deaths at each age by the number of remaining yearsof life left, normally taken from the standard life expectancy.This allows measurement of the proportion of the total PYLL ina population caused by a specific disease.11
• National statistics stratified by sex. Cardiovascular dis-eases accounted for 33 million and 41 million PYLLs, withinESC member countries, among females and males, respectively,totalling 40% of all years lost for females and 35% for males. Incomparison, cancer accounted for 25% of PYLLs in females and24% of PYLLs in males, equivalent to 21 million and 28 millionPYLLs, respectively.
• Stratification by national income status. Cardiovasculardiseases accounted for a greater proportion of PYLLs averagedacross middle-income compared with high-income countries forboth females (45 vs. 31%) and males (40 vs. 29%). The reverse istrue for cancer, where the median proportion of PYLLs waslower in middle-income compared with high-income countriesin females (21 vs. 34%) and males (20 vs. 34%). Large variationsare seen between the different countries, with the lowest pro-portion of country-specific CVD PYLLs similar between high-and middle-income countries. In 9 (45%) of the 20middle-income countries for which data were available, morethan 40% of total PYLLs in males were attributed to CVDs.This was the case for only two high-income countries, Latviaand Romania in which more than 40% of total PYLLs were at-tributable to CVD. For females, seven middle-income countriesand three high-income countries (Lithuania= 50%, Latvia=52%, Romania= 52%) had ≥50% of their total PYLLs attribut-able to CVDs (Figure 45).
Cardiovascular disease crude mortalityratesAbsolute mortality measures, such as the number of deaths or to-tal PYLLs, may be misleading as they do not account for populationsize. Comparisons between countries and over time can use acrude rate which considers differences in population size. Cruderates are calculated by dividing the total number of deaths (orPYLLs) by population size, and commonly expressed as per 100000 individuals within the population.264
• National statistics stratified by sex. The median crudemortality rates for CVD per 100 000 people were higher for fe-males than males in both high-income (328 vs. 311) andmiddle-income countries (449 vs. 458) (Figure 46, seeSupplementary material online, Figure S71). In general, country-level crude death rates decreased with increasing GDP and re-lative CHE. However, this relationship was affected by greatervariation at lower GDP and CHE values, with some countriesdemonstrating low crude rates despite lower values for both(see Supplementary material online, Figures S72 and S73).
• Stratification by national income status. In general, themedian crude CVD mortality tended to be higher inmiddle-income compared with high-income countries, but therewas considerable heterogeneity between countries. For in-stance, three of the five countries with the lowest crude mortal-ity CVD rates in males were middle-income (Tunisia, Lebanon,Syrian Arab Republic) whereas three of the five countries withthe highest crude mortality rates were also middle income(Belarus, Ukraine, and Bulgaria). For females, four of the fivecountries with the lowest crude rates were middle income(Tunisia, Lebanon, Kazakhstan, Syrian Arab Republic), whereasthree of the five countries with the highest rates were (Serbia,Ukraine, Bulgaria). Israel was the one high-income countrythat had among the five lowest crude rates for males and fe-males, whilst Latvia, a high-income country, was among thefive countries with the highest crude rates for both sexes.
• Premature crude mortality. The disparities between high-and middle-income countries became more apparent when
Figure 42 Proportion of deaths caused by cardiovascular dis-ease in European Society of Cardiology member countries, stra-tified by sex and national income status.
52 A. Timmis et al.D
ownloaded from
https://academic.oup.com
/eurheartj/advance-article/doi/10.1093/eurheartj/ehab892/6472699 by guest on 12 January 2022
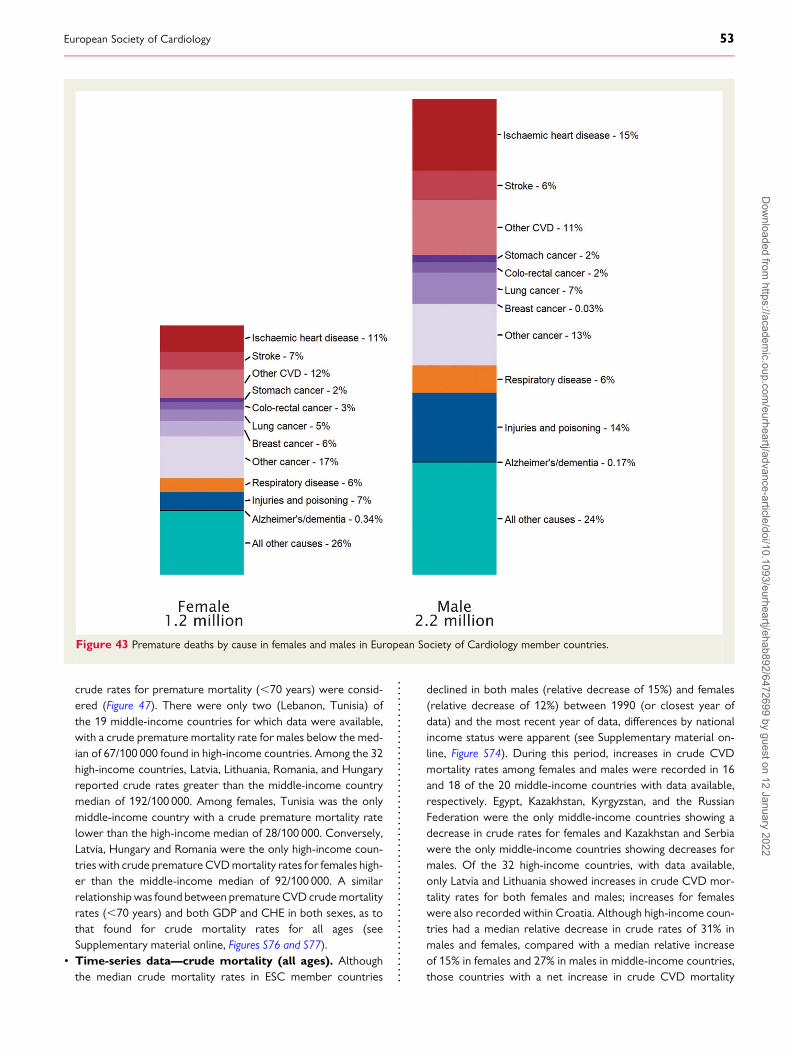
crude rates for premature mortality (,70 years) were consid-ered (Figure 47). There were only two (Lebanon, Tunisia) ofthe 19 middle-income countries for which data were available,with a crude premature mortality rate for males below the med-ian of 67/100 000 found in high-income countries. Among the 32high-income countries, Latvia, Lithuania, Romania, and Hungaryreported crude rates greater than the middle-income countrymedian of 192/100 000. Among females, Tunisia was the onlymiddle-income country with a crude premature mortality ratelower than the high-income median of 28/100 000. Conversely,Latvia, Hungary and Romania were the only high-income coun-tries with crude prematureCVDmortality rates for females high-er than the middle-income median of 92/100 000. A similarrelationshipwas found between prematureCVD crudemortalityrates (,70 years) and both GDP and CHE in both sexes, as tothat found for crude mortality rates for all ages (seeSupplementary material online, Figures S76 and S77).
• Time-series data—crude mortality (all ages). Althoughthe median crude mortality rates in ESC member countries
declined in both males (relative decrease of 15%) and females(relative decrease of 12%) between 1990 (or closest year ofdata) and the most recent year of data, differences by nationalincome status were apparent (see Supplementary material on-line, Figure S74). During this period, increases in crude CVDmortality rates among females and males were recorded in 16and 18 of the 20 middle-income countries with data available,respectively. Egypt, Kazakhstan, Kyrgyzstan, and the RussianFederation were the only middle-income countries showing adecrease in crude rates for females and Kazakhstan and Serbiawere the only middle-income countries showing decreases formales. Of the 32 high-income countries, with data available,only Latvia and Lithuania showed increases in crude CVD mor-tality rates for both females and males; increases for femaleswere also recorded within Croatia. Although high-income coun-tries had a median relative decrease in crude rates of 31% inmales and females, compared with a median relative increaseof 15% in females and 27% in males in middle-income countries,those countries with a net increase in crude CVD mortality
Figure 43 Premature deaths by cause in females and males in European Society of Cardiology member countries.
European Society of Cardiology 53D
ownloaded from
https://academic.oup.com
/eurheartj/advance-article/doi/10.1093/eurheartj/ehab892/6472699 by guest on 12 January 2022

Figure 44 Proportion of all premature deaths attributed to car-diovascular disease in European Society of Cardiology membercountries, stratified by sex and national income status.
Figure 45 Proportion of potential years of life lost to cardiovas-cular disease in European Society of Cardiology member coun-tries, stratified by sex and national income status.
Figure 46 Crude mortality rates for cardiovascular disease per100 000 people in European Society of Cardiology membercountries stratified by sex and national income status.
Figure 47 Crude premature mortality rate from cardiovasculardisease in European Society of Cardiology member countries,stratified by sex and national income status.
54 A. Timmis et al.D
ownloaded from
https://academic.oup.com
/eurheartj/advance-article/doi/10.1093/eurheartj/ehab892/6472699 by guest on 12 January 2022
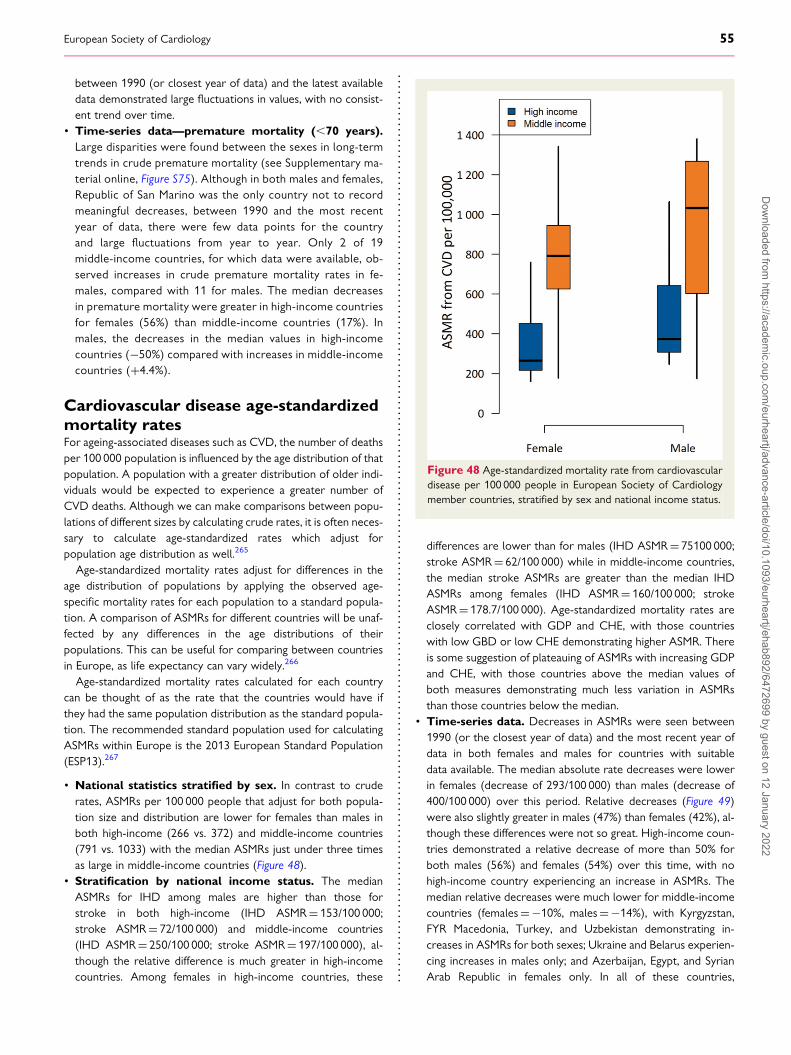
between 1990 (or closest year of data) and the latest availabledata demonstrated large fluctuations in values, with no consist-ent trend over time.
• Time-series data—premature mortality (,70 years).Large disparities were found between the sexes in long-termtrends in crude premature mortality (see Supplementary ma-terial online, Figure S75). Although in both males and females,Republic of San Marino was the only country not to recordmeaningful decreases, between 1990 and the most recentyear of data, there were few data points for the countryand large fluctuations from year to year. Only 2 of 19middle-income countries, for which data were available, ob-served increases in crude premature mortality rates in fe-males, compared with 11 for males. The median decreasesin premature mortality were greater in high-income countriesfor females (56%) than middle-income countries (17%). Inmales, the decreases in the median values in high-incomecountries (−50%) compared with increases in middle-incomecountries (+4.4%).
Cardiovascular disease age-standardizedmortality ratesFor ageing-associated diseases such as CVD, the number of deathsper 100 000 population is influenced by the age distribution of thatpopulation. A population with a greater distribution of older indi-viduals would be expected to experience a greater number ofCVD deaths. Although we can make comparisons between popu-lations of different sizes by calculating crude rates, it is often neces-sary to calculate age-standardized rates which adjust forpopulation age distribution as well.265
Age-standardized mortality rates adjust for differences in theage distribution of populations by applying the observed age-specific mortality rates for each population to a standard popula-tion. A comparison of ASMRs for different countries will be unaf-fected by any differences in the age distributions of theirpopulations. This can be useful for comparing between countriesin Europe, as life expectancy can vary widely.266
Age-standardized mortality rates calculated for each countrycan be thought of as the rate that the countries would have ifthey had the same population distribution as the standard popula-tion. The recommended standard population used for calculatingASMRs within Europe is the 2013 European Standard Population(ESP13).267
• National statistics stratified by sex. In contrast to cruderates, ASMRs per 100 000 people that adjust for both popula-tion size and distribution are lower for females than males inboth high-income (266 vs. 372) and middle-income countries(791 vs. 1033) with the median ASMRs just under three timesas large in middle-income countries (Figure 48).
• Stratification by national income status. The medianASMRs for IHD among males are higher than those forstroke in both high-income (IHD ASMR= 153/100 000;stroke ASMR= 72/100 000) and middle-income countries(IHD ASMR= 250/100 000; stroke ASMR= 197/100 000), al-though the relative difference is much greater in high-incomecountries. Among females in high-income countries, these
differences are lower than for males (IHD ASMR= 75100 000;stroke ASMR= 62/100 000) while in middle-income countries,the median stroke ASMRs are greater than the median IHDASMRs among females (IHD ASMR= 160/100 000; strokeASMR= 178.7/100 000). Age-standardized mortality rates areclosely correlated with GDP and CHE, with those countrieswith low GBD or low CHE demonstrating higher ASMR. Thereis some suggestion of plateauing of ASMRs with increasing GDPand CHE, with those countries above the median values ofboth measures demonstrating much less variation in ASMRsthan those countries below the median.
• Time-series data. Decreases in ASMRs were seen between1990 (or the closest year of data) and the most recent year ofdata in both females and males for countries with suitabledata available. The median absolute rate decreases were lowerin females (decrease of 293/100 000) than males (decrease of400/100 000) over this period. Relative decreases (Figure 49)were also slightly greater in males (47%) than females (42%), al-though these differences were not so great. High-income coun-tries demonstrated a relative decrease of more than 50% forboth males (56%) and females (54%) over this time, with nohigh-income country experiencing an increase in ASMRs. Themedian relative decreases were much lower for middle-incomecountries (females=−10%, males=−14%), with Kyrgyzstan,FYR Macedonia, Turkey, and Uzbekistan demonstrating in-creases in ASMRs for both sexes; Ukraine and Belarus experien-cing increases in males only; and Azerbaijan, Egypt, and SyrianArab Republic in females only. In all of these countries,
Figure 48 Age-standardized mortality rate from cardiovasculardisease per 100 000 people in European Society of Cardiologymember countries, stratified by sex and national income status.
European Society of Cardiology 55D
ownloaded from
https://academic.oup.com
/eurheartj/advance-article/doi/10.1093/eurheartj/ehab892/6472699 by guest on 12 January 2022
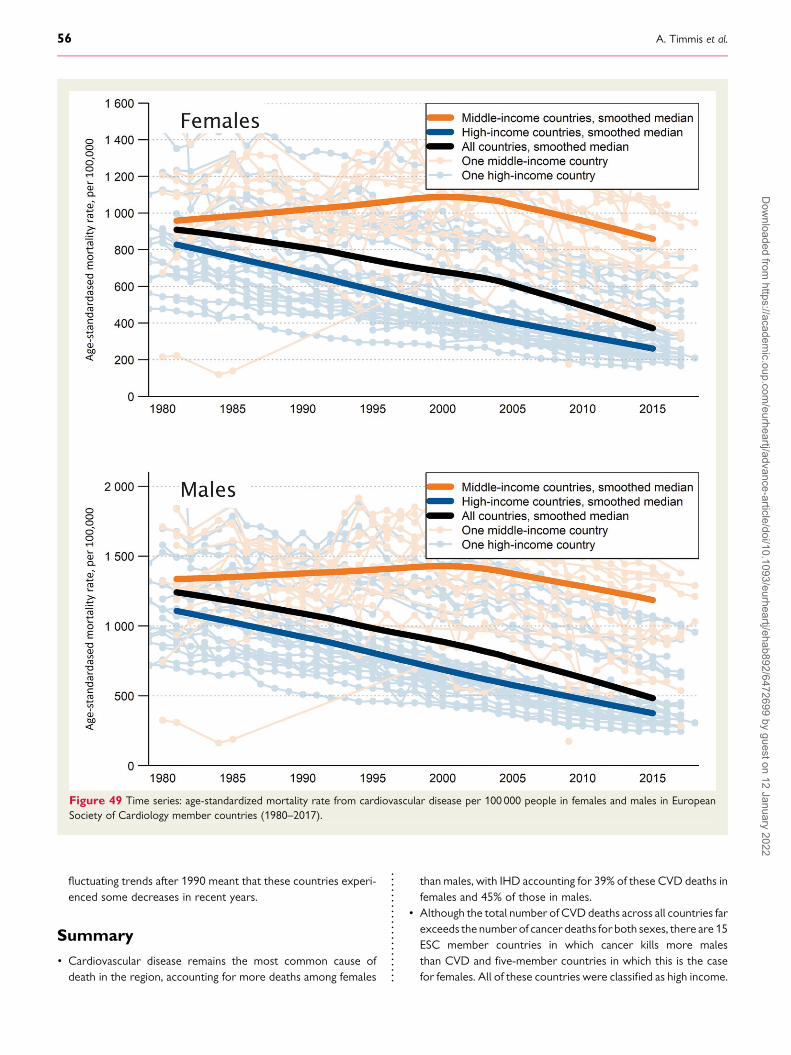
fluctuating trends after 1990 meant that these countries experi-enced some decreases in recent years.
Summary• Cardiovascular disease remains the most common cause ofdeath in the region, accounting for more deaths among females
than males, with IHD accounting for 39% of these CVD deaths infemales and 45% of those in males.
• Although the total number of CVDdeaths across all countries farexceeds the number of cancer deaths for both sexes, there are 15ESC member countries in which cancer kills more malesthan CVD and five-member countries in which this is the casefor females. All of these countries were classified as high income.
Figure 49 Time series: age-standardized mortality rate from cardiovascular disease per 100 000 people in females and males in EuropeanSociety of Cardiology member countries (1980–2017).
56 A. Timmis et al.D
ownloaded from
https://academic.oup.com
/eurheartj/advance-article/doi/10.1093/eurheartj/ehab892/6472699 by guest on 12 January 2022
• Cardiovascular diseases remain the most common cause of pre-mature death for males in ESC member countries, but this is notthe case for females among whom cancer now causes more pre-mature deaths than any other disease.
• There are large disparities between high- and middle-incomecountries in the proportion of premature deaths caused by CVD.
• Lebanon and Tunisia were the only two middle-income coun-tries with a crude premature mortality rate for males belowthe median of 67/100 000 found in high-income countries.
• Latvia Hungary and Romania were the only high-income coun-tries with crude premature CVD mortality rates for femaleshigher than the middle-income median of 92/100 000
• Cardiovascular diseases accounted for 33 million and 41 millionPYLLs, within ESC member countries, among females and males,respectively, making up 40% of all years lost for females and 35%for males. In comparison, cancer accounted for 25% of PYLLs infemales and 24% of PYLLs in males, equivalent to 21 million and28 million PYLLs, respectively.
CommentCardiovascular disease remains the most common cause of deathwithin the ESC member countries and continues to be a majorconcern for health, social, and economic services. Althoughmore females than males die from CVD, higher ASMRs and prema-ture mortality measures among males suggest that females are dy-ing from CVD at older ages. Although females may experiencesome physiological protection from CVD, particularly up until me-nopause,268 risk factor differences between the sexes may explainsome of this inequality.The transition towards cancer as the most common cause of
death in a number of high-income countries, comes as a resultof substantial decreases in CVD mortality in the preceding 30–40 years, most likely due to improved prevention and treat-ment.269 However, inequalities in mortality outcomes betweencountries give cause for concern. Further investigation into thesedisparities is required. In particular, a review as to how in certaincountries, CVD is no longer the most common cause of death,along with a contextual analysis of risk factor prevalence, treat-ment, and policy approaches in those countries in which it remainsthe greatest burden, may help to target approaches and narrowthese inequalities.The description of trends as presented in this publication is a
first step in identifying disparities between middle-income andhigh-income countries and this should be supported by further re-search incorporating more in-depth time-series analyses, that mayhelp us map recent changes in CVD outcomes within ESCmemberstates. Previous studies have identified recent plateauing of trendsin both IHD and stroke mortality in European countries, that maynot have been identified through a simple description of trendsover a longer period of time.257,258 This would be an obvious firststep in analysing these data, allowing more complex follow-upwork to investigate the reasons for these trends.Suchwork undertaken to understandwhy these inequalities exist
should include improved and standardized surveillance onmortalityand other epidemiological measures related to CVD within coun-tries. An investigation into population-level prevention and
treatment strategies adopted by member countries, along withthe country-level experience in their implementation, could helpin the scale up of evidence-based strategies throughout the region.
Finally, the mortality data presented here were collected beforeCoronavirus disease 2019 (COVID-19) was first reported and theglobal pandemic ensued. Studies have reported an association be-tween COVID-19 and CVD, with data demonstrating thatCOVID-19 can induce CVD and that pre-existing CVD is linkedwith an increased risk of death in patients with COVID-19.270
The impact of COVID-19 on CVD mortality within ESC memberstates may not be known for some time, as there is a lag betweendeath data collection, process, and release. This is a key focus forfuture years, especially due to concerns of a decrease in the abilityof health systems to diagnose and treat CVD patients, in the lightof the burden of COVID-19 on resources. An initial focus could beto work with hospitals and CV staff to determine how they havebeen impacted and to identify what steps would be beneficial inhelping them restore CVD treatment services, as the pressurefrom COVID-19 recedes.
Cardiovascular healthcaredeliveryThe development and implementation of novel pharmacologicaland technological treatments, combined with policy initiatives todeliver reductions in CV mortality during the past 50 years, havebeen a standout achievement of contemporary medicine. The evi-dence base for these treatments has been meticulously developedthrough landmark randomized trials that have confirmed the effi-cacy of nearly all the commonly used pharmacotherapeutic agentsand also many of the surgical and percutaneous interventionaltechnologies. Increasingly, it has been these interventional tech-nologies that have come to dominate cardiology practice, andthis has brought with it a financial burden that many countriescan ill afford. Already the healthcare budget exceeds 10% ofGDP in many Western countries,271 and recent predictions indi-cate that novel medical technologies will be a more significant fac-tor than population ageing in driving up healthcare costs during thenext 35 years.272
In this section, human and capital resource statistics are pre-sented, as they affect CV healthcare delivery in 57 ESC membercountries. These are 2019 statistics compiled in a 2020 survey ofthe member countries undertaken as part of the ESC Atlas pro-gramme. These data highlight areas of shortfall in CV healthcaredelivery and provide policymakers with an indication of where cor-rective action is needed.
Cardiological specialistsThere is no internationally recognized definition of what constitu-tes a cardiologist. While some countries require specialist trainingover several years, others are more permissive and allow the useof the title ‘cardiologist’ on a more arbitrary basis. This can makeinternational workforce comparisons hard to interpret. Alsounclear is what constitutes optimal specialist provision.Nevertheless, specialist involvement in CV care undoubtedly im-proves outcomes,273 and this is reflected in contemporary quality
European Society of Cardiology 57D
ownloaded from
https://academic.oup.com
/eurheartj/advance-article/doi/10.1093/eurheartj/ehab892/6472699 by guest on 12 January 2022

indicators.274–276 A more diversified cardiological workforce mightalso improve outcomes in countries where cardiology remains amale-dominated speciality.277,278
• Human resource. Across all ESC member countries in 2019,there was a median of 85.1 (IQR 60.3–111.0) cardiologists permillion people, with numbers ranging from ,30 per million inthe UK and Ireland to .250 per million in Greece andRepublic of Georgia (Figure 50).
• Females in cardiology. Females comprised fewer than a thirdof all cardiologists working in ESC member countries.Under-representation of females was greatest in the Republicof Kosovo, Greece, UK, and Ireland where they comprised,15% of cardiologists. Exceptions to this trend were Estonia,Lithuania, Republic of Moldova, and Kyrgyzstan where .70%of cardiologists were females.
• Stratification by national income status. The median num-ber of cardiologists per million inhabitants of middle-incomeESC member countries was lower compared with high-incomecountries 61.1 (IQR 51.0–86.4) vs. 99.0 (IQR 79.0–111.0)(Figure 51). Female cardiologists comprised 51.0% of the cardio-logical workforce in middle-income countries compared with30.5% in high-income countries. These averaged data, however,conceal considerable variation across ESC member countries.
Diagnostic coronary angiographyCardiac catheterization with coronary angiography is one of themost frequently performed diagnostic tests in patients with sus-pected coronary artery disease. The more recent availability ofcomputed tomography coronary angiography (CTCA) has pro-vided a non-invasive means of examining the coronary arteriesand is particularly useful for ruling out disease in low-risk popula-tions.279 Functional tests, such as myocardial perfusion imaging, arealso widely used to diagnose regional ischaemia caused by obstruc-tive coronary plaque. Although there are clear guideline recom-mendations for the use of these non-invasive diagnostic testsrates of invasive coronary angiography show no signs of diminish-ing and there is now increasing evidence that this may reflect in-appropriate use.280
• Infrastructure. A median of 2.6 (IQR 2.1–3.8) hospitals permillion inhabitants of ESC member countries reported having fa-cilities for cardiac catheterization in the 2020 survey (seeSupplementary material online, Figure S78). Provision rangedfrom ,1.5 hospitals per million in Slovakia, Kyrgyzstan,Ukraine, and Uzbekistan to .4.5 in Greece, Cyprus, andBulgaria.
• Service delivery. A median of 4084 (IQR 2563–5007) diag-nostic coronary angiograms per million people were performedacross ESC member countries in 2019, or the most recent yearthat data were available, ranging from ,1000 in Kyrgyzstan,Uzbekistan, and Egypt to nearly 7000 in Belgium andSwitzerland (Figure 50).
• Stratification by national income status. The median num-ber of hospitals per million inhabitants of ESCmember countriesthat provided facilities for diagnostic cardiac catheterization wassimilar in middle-income compared with high-income countries[2.4 (IQR 1.6–3.4) vs. 2.8 (IQR 2.2–3.9)]. Despite similar
facilities in terms of catheter laboratories, the median numbersof diagnostic catheter procedures per million people were low-er in middle-income compared with high-income countries2231 (IQR 1168–3860) vs. 4553 (IQR 3507–5962), althoughthese averaged data concealed important differences withArmenia, Serbia, and Montenegro among middle-income coun-tries performing .4000 procedures per million people, com-parable to rates in many high-income countries (Figure 51).
Interventional cardiologyPercutaneous coronary interventionPercutaneous coronary intervention (PCI) utilizes cardiac cathe-ters for revascularization of obstructed coronary arteries. In stablecoronary artery disease, the procedure provides effective relief ofangina but does not necessarily protect against myocardial infarc-tion or death.281 However, there is a clear outcome benefit fromPCI in the acute setting. In patients with acute myocardial infarc-tion, primary PCI involving timely reperfusion of the culprit coron-ary artery reduces eventual infarct size and mortality.282
• Human resource. The 2020 survey showed a median of 12.1(IQR 9.2–17.4) interventional cardiologists per million inhabi-tants of ESC member countries, with numbers ranging from,5 per million in Republic of Kosovo, Kyrgyzstan, Republic ofMoldova, Montenegro, Ukraine, and Uzbekistan to.20 per mil-lion in Austria, Belgium, Bulgaria, Greece, Italy, Latvia, Malta,North Macedonia, Poland, and Slovenia (Figure 52).
• Infrastructure. The median number of hospitals per million in-habitants of ESC member countries that offered a 24 h/7 day fa-cility for cardiac catheterization was 1.8 (IQR 1.1–2.7), rangingfrom ,1 hospital per million people in Denmark, Egypt,Slovenia, Tunisia, and UK to .4 in Belgium, Cyprus, Poland,and Bulgaria.
• Service delivery(a) Percutaneous coronary intervention. A median of
1879 (IQR 1313–2550) PCI procedures per million inhabi-tants of ESC member countries were reported in the2020 survey (Figure 52). Numbers ranged from,1000 pro-cedures per million people in Azerbaijan, Egypt, Republic ofKosovo, Kyrgyzstan, Republic of Moldova, Tunisia, Ukraine,and Uzbekistan to .3000 in France, Germany, Latvia,Lithuania, Switzerland, and Armenia.
(b) Primary PCI. A median of 522.8 (IQR 369.4–658.9) pri-mary PCI procedures per million inhabitants of ESC mem-ber countries were reported in the 2020 survey(Figure 52). Numbers ranged from,50 procedures per mil-lion people in Kyrgyzstan and Uzbekistan to .900 inLithuania.
• Stratification by national income status. The median num-ber of interventional cardiologists per million inhabitants of theESC member countries in the 2020 survey was lower inmiddle-income countries compared with high-income countries[8.6 (IQR 4.5–13.8) vs. 14.6 (IQR 10.5–20.3)] (Figure 53) andthere was further inequality in 24 h/7 day catheter laboratoryavailability [1.7 (IQR 1.1–2.1) vs. 2.1 (IQR 1.2–2.7)]. The mediannumbers of PCI procedures per million inhabitants of ESC mem-ber countries reported in the 2020 survey were also lower in
58 A. Timmis et al.D
ownloaded from
https://academic.oup.com
/eurheartj/advance-article/doi/10.1093/eurheartj/ehab892/6472699 by guest on 12 January 2022
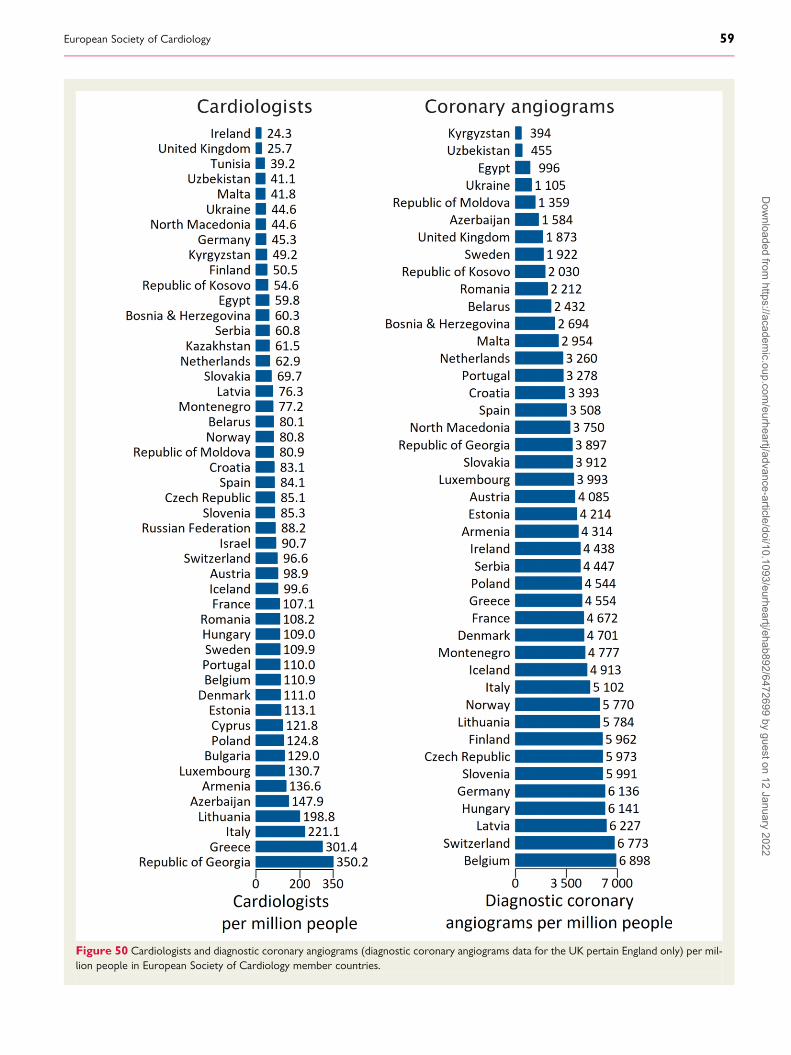
Figure 50 Cardiologists and diagnostic coronary angiograms (diagnostic coronary angiograms data for the UK pertain England only) per mil-lion people in European Society of Cardiology member countries.
European Society of Cardiology 59D
ownloaded from
https://academic.oup.com
/eurheartj/advance-article/doi/10.1093/eurheartj/ehab892/6472699 by guest on 12 January 2022
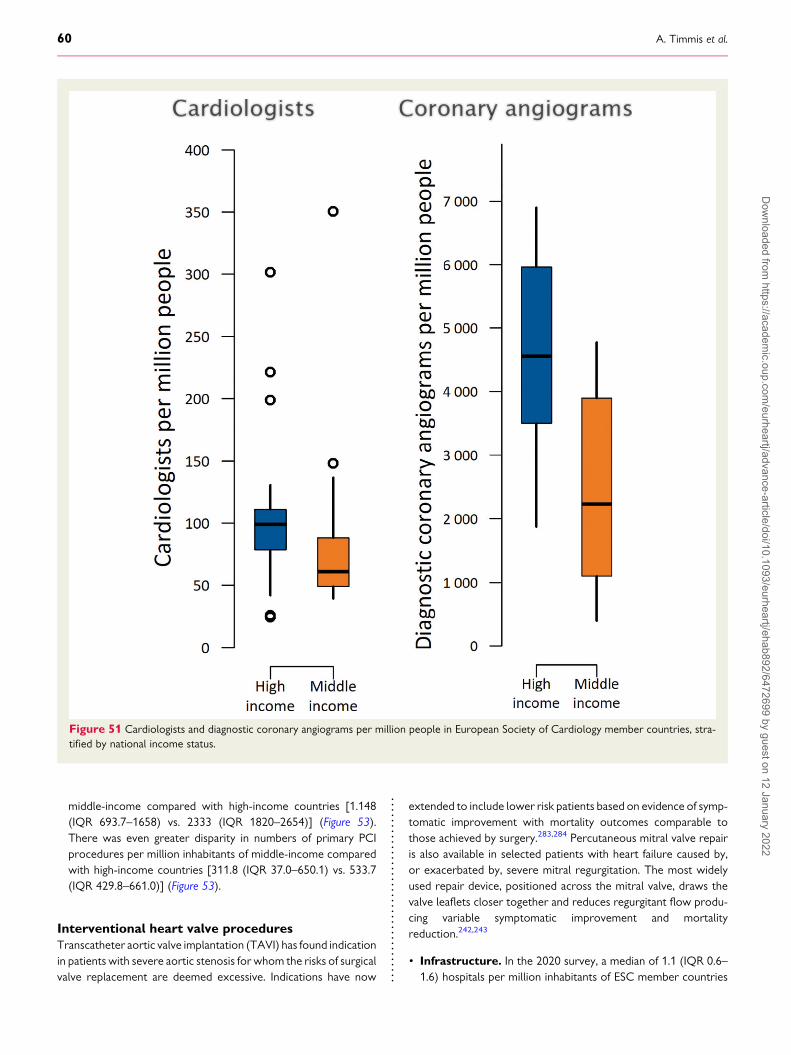
middle-income compared with high-income countries [1.148(IQR 693.7–1658) vs. 2333 (IQR 1820–2654)] (Figure 53).There was even greater disparity in numbers of primary PCIprocedures per million inhabitants of middle-income comparedwith high-income countries [311.8 (IQR 37.0–650.1) vs. 533.7(IQR 429.8–661.0)] (Figure 53).
Interventional heart valve proceduresTranscatheter aortic valve implantation (TAVI) has found indicationin patients with severe aortic stenosis for whom the risks of surgicalvalve replacement are deemed excessive. Indications have now
extended to include lower risk patients based on evidence of symp-tomatic improvement with mortality outcomes comparable tothose achieved by surgery.283,284 Percutaneous mitral valve repairis also available in selected patients with heart failure caused by,or exacerbated by, severe mitral regurgitation. The most widelyused repair device, positioned across the mitral valve, draws thevalve leaflets closer together and reduces regurgitant flow produ-cing variable symptomatic improvement and mortalityreduction.242,243
• Infrastructure. In the 2020 survey, a median of 1.1 (IQR 0.6–1.6) hospitals per million inhabitants of ESC member countries
Figure 51 Cardiologists and diagnostic coronary angiograms per million people in European Society of Cardiology member countries, stra-tified by national income status.
60 A. Timmis et al.D
ownloaded from
https://academic.oup.com
/eurheartj/advance-article/doi/10.1093/eurheartj/ehab892/6472699 by guest on 12 January 2022

reported catheter laboratories equipped for structural heart in-terventions. Numbers ranged from ,0.5 hospitals per millionpeople in Azerbaijan, Belarus, Bulgaria, Egypt Republic ofGeorgia, and Uzbekistan to .3.0 in Cyprus and Italy. InRepublic of Kosovo, there were no hospitals equipped for inter-ventional heart valve procedures.
• Service delivery(a) Transcatheter aortic valve implantation. A median of
60.0 (IQR 3.7–124.6) TAVI procedures per million inhabi-tants of ESC member countries were performed in 2019,ranging from ,1 procedure per million people in
Azerbaijan, Bosnia, and Herzegovina and Uzbekistan to.200 in France, Germany, and Switzerland (Figure 54).
(b) Percutaneous mitral valve repair. A median of 5.4(IQR 1.6–13.1) procedures per million people per yearwere performed across ESC member countries in 2019with Switzerland and Germany reporting 47.2 and 78.4 pro-cedures per million people, respectively.
(c) Percutaneous tricuspid valve repair. Procedure rates inthe 17 countries that reported in the 2020 survey were verylow and exceeded 1 per million people only in Austria,Denmark, Germany, Lithuania, Spain, and Switzerland.
Figure 52 Interventional cardiologists, percutaneous coronary interventions, and primary percutaneous coronary interventions per millionpeople in European Society of Cardiology member countries.
European Society of Cardiology 61D
ownloaded from
https://academic.oup.com
/eurheartj/advance-article/doi/10.1093/eurheartj/ehab892/6472699 by guest on 12 January 2022
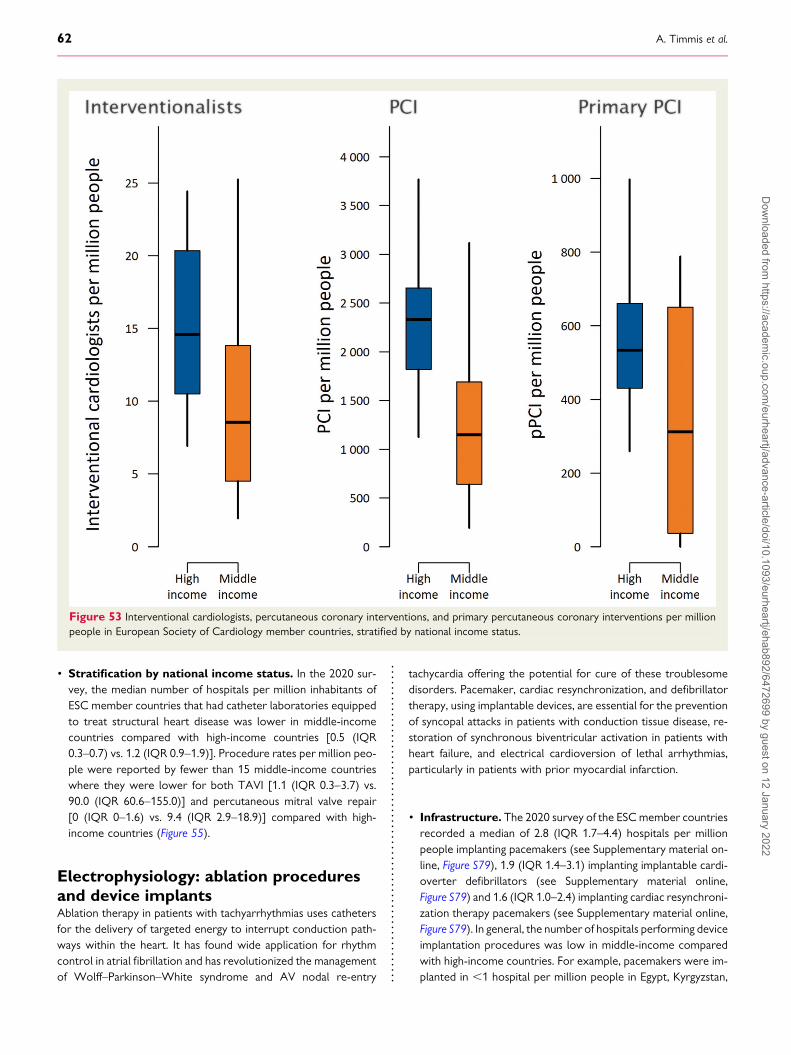
• Stratification by national income status. In the 2020 sur-vey, the median number of hospitals per million inhabitants ofESC member countries that had catheter laboratories equippedto treat structural heart disease was lower in middle-incomecountries compared with high-income countries [0.5 (IQR0.3–0.7) vs. 1.2 (IQR 0.9–1.9)]. Procedure rates per million peo-ple were reported by fewer than 15 middle-income countrieswhere they were lower for both TAVI [1.1 (IQR 0.3–3.7) vs.90.0 (IQR 60.6–155.0)] and percutaneous mitral valve repair[0 (IQR 0–1.6) vs. 9.4 (IQR 2.9–18.9)] compared with high-income countries (Figure 55).
Electrophysiology: ablation proceduresand device implantsAblation therapy in patients with tachyarrhythmias uses cathetersfor the delivery of targeted energy to interrupt conduction path-ways within the heart. It has found wide application for rhythmcontrol in atrial fibrillation and has revolutionized the managementof Wolff–Parkinson–White syndrome and AV nodal re-entry
tachycardia offering the potential for cure of these troublesomedisorders. Pacemaker, cardiac resynchronization, and defibrillatortherapy, using implantable devices, are essential for the preventionof syncopal attacks in patients with conduction tissue disease, re-storation of synchronous biventricular activation in patients withheart failure, and electrical cardioversion of lethal arrhythmias,particularly in patients with prior myocardial infarction.
• Infrastructure. The 2020 survey of the ESCmember countriesrecorded a median of 2.8 (IQR 1.7–4.4) hospitals per millionpeople implanting pacemakers (see Supplementary material on-line, Figure S79), 1.9 (IQR 1.4–3.1) implanting implantable cardi-overter defibrillators (see Supplementary material online,Figure S79) and 1.6 (IQR 1.0–2.4) implanting cardiac resynchroni-zation therapy pacemakers (see Supplementary material online,Figure S79). In general, the number of hospitals performing deviceimplantation procedures was low in middle-income comparedwith high-income countries. For example, pacemakers were im-planted in ,1 hospital per million people in Egypt, Kyrgyzstan,
Figure 53 Interventional cardiologists, percutaneous coronary interventions, and primary percutaneous coronary interventions per millionpeople in European Society of Cardiology member countries, stratified by national income status.
62 A. Timmis et al.D
ownloaded from
https://academic.oup.com
/eurheartj/advance-article/doi/10.1093/eurheartj/ehab892/6472699 by guest on 12 January 2022

and Uzbekistan compared with .7 hospitals per million peoplein Belgium, Cyprus, Germany, and Switzerland.
• Service delivery(a) Ablation procedures. A median of 372.3 (IQR 145.2–
518.8) ablation procedures per million inhabitants of theESC member countries were performed for treatment ofheart rhythm disorders (Figure 56). Rates ranged from,25 procedures per million people in Bosnia andHerzegovina, Egypt, Kyrgyzstan, and Uzbekistan to .700procedures per million people in Belgium, CzechRepublic, France, Germany, Iceland, and Switzerland.
(b) Pacemaker implants. A median of 652.2 (IQR 267.5–874.7) pacemaker implants per million inhabitants of ESCmember countries were reported in the 2020 survey
(Figure 56). Rates ranged from ,40 implants per millionpeople in Egypt, Kyrgyzstan, and Uzbekistan to .1000 permillion people in France and Sweden.
(c) Implantable cardioverter defibrillator implants. Amedian of 105.0 (IQR 37.1–153.3) ICD implants per millioninhabitants of ESC member countries were reported in the2020 survey (Figure 56). Rates ranged from,6 implants permillion people in Belarus, Egypt, Kyrgyzstan, Republic ofMoldova, Ukraine, and Uzbekistan to more than 200 permillion people in Czech Republic, Germany, Italy, TheNetherlands, and Poland.
(d) Cardiac resynchronization therapy implants. A med-ian of 63.6 (IQR 22.8–126.8) CRT implants per million inha-bitants of ESCmember countries were reported in the 2020
Figure 54 Transcatheter aortic valve implantation procedures per million people in European Society of Cardiology member countries.
European Society of Cardiology 63D
ownloaded from
https://academic.oup.com
/eurheartj/advance-article/doi/10.1093/eurheartj/ehab892/6472699 by guest on 12 January 2022
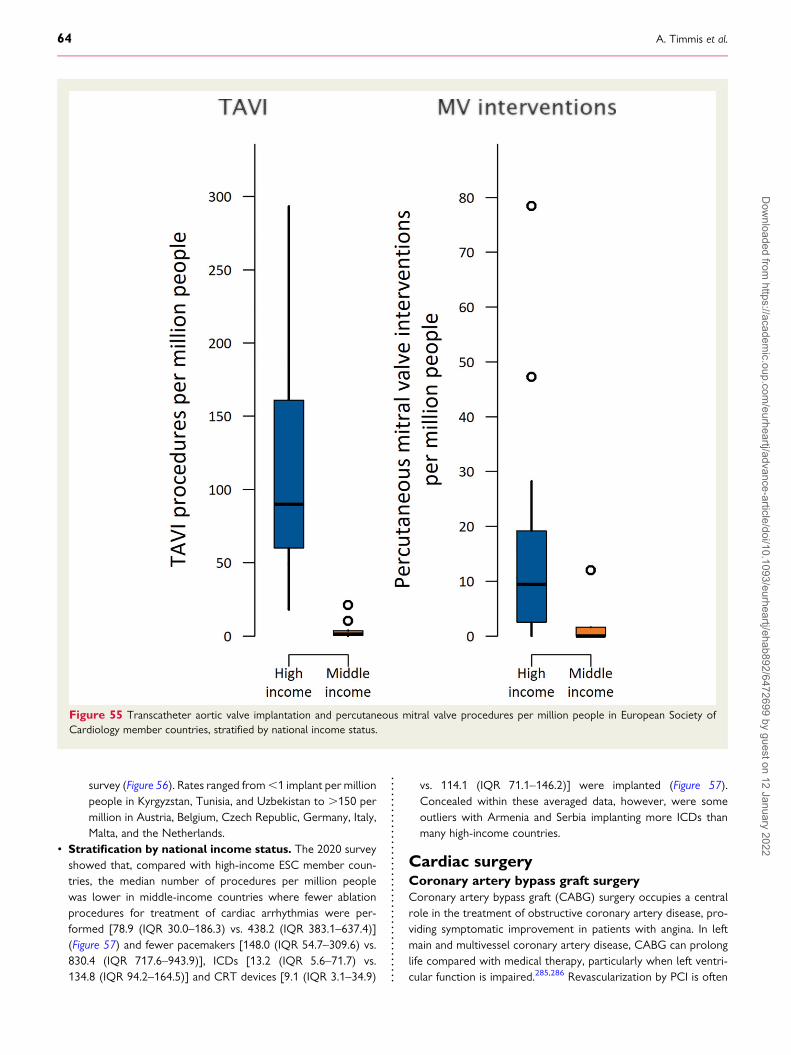
survey (Figure 56). Rates ranged from,1 implant per millionpeople in Kyrgyzstan, Tunisia, and Uzbekistan to .150 permillion in Austria, Belgium, Czech Republic, Germany, Italy,Malta, and the Netherlands.
• Stratification by national income status. The 2020 surveyshowed that, compared with high-income ESC member coun-tries, the median number of procedures per million peoplewas lower in middle-income countries where fewer ablationprocedures for treatment of cardiac arrhythmias were per-formed [78.9 (IQR 30.0–186.3) vs. 438.2 (IQR 383.1–637.4)](Figure 57) and fewer pacemakers [148.0 (IQR 54.7–309.6) vs.830.4 (IQR 717.6–943.9)], ICDs [13.2 (IQR 5.6–71.7) vs.134.8 (IQR 94.2–164.5)] and CRT devices [9.1 (IQR 3.1–34.9)
vs. 114.1 (IQR 71.1–146.2)] were implanted (Figure 57).Concealed within these averaged data, however, were someoutliers with Armenia and Serbia implanting more ICDs thanmany high-income countries.
Cardiac surgeryCoronary artery bypass graft surgeryCoronary artery bypass graft (CABG) surgery occupies a centralrole in the treatment of obstructive coronary artery disease, pro-viding symptomatic improvement in patients with angina. In leftmain and multivessel coronary artery disease, CABG can prolonglife compared with medical therapy, particularly when left ventri-cular function is impaired.285,286 Revascularization by PCI is often
Figure 55 Transcatheter aortic valve implantation and percutaneous mitral valve procedures per million people in European Society ofCardiology member countries, stratified by national income status.
64 A. Timmis et al.D
ownloaded from
https://academic.oup.com
/eurheartj/advance-article/doi/10.1093/eurheartj/ehab892/6472699 by guest on 12 January 2022
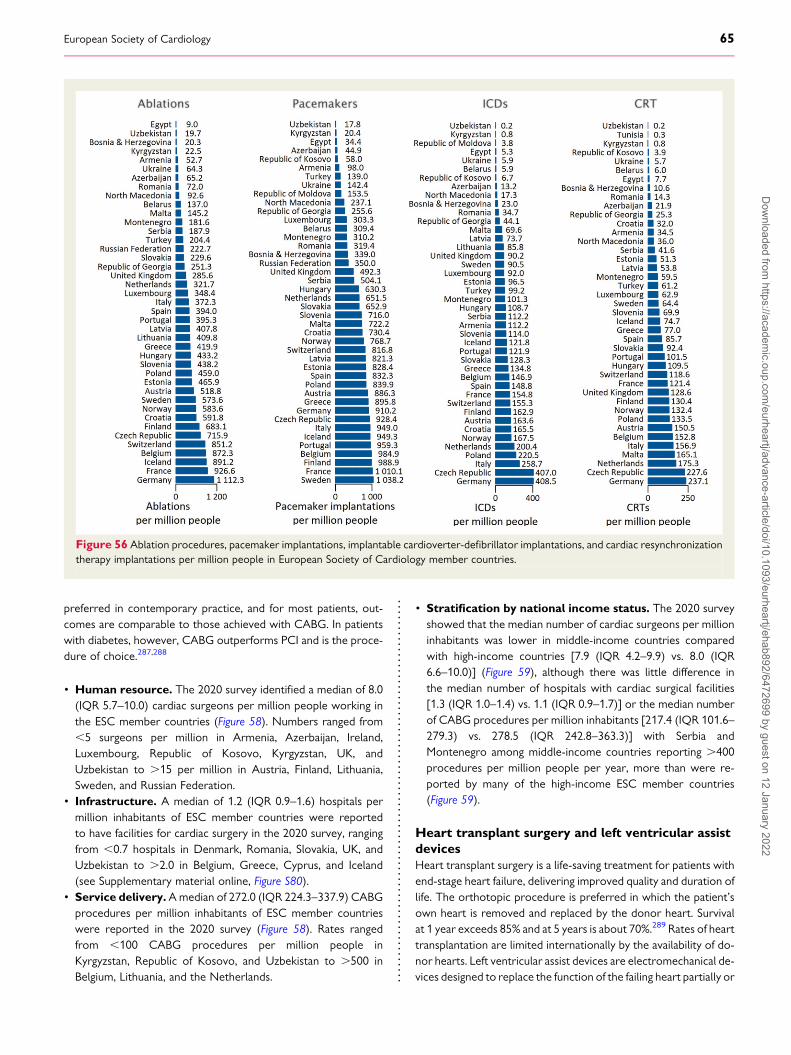
preferred in contemporary practice, and for most patients, out-comes are comparable to those achieved with CABG. In patientswith diabetes, however, CABG outperforms PCI and is the proce-dure of choice.287,288
• Human resource. The 2020 survey identified a median of 8.0(IQR 5.7–10.0) cardiac surgeons per million people working inthe ESC member countries (Figure 58). Numbers ranged from,5 surgeons per million in Armenia, Azerbaijan, Ireland,Luxembourg, Republic of Kosovo, Kyrgyzstan, UK, andUzbekistan to .15 per million in Austria, Finland, Lithuania,Sweden, and Russian Federation.
• Infrastructure. A median of 1.2 (IQR 0.9–1.6) hospitals permillion inhabitants of ESC member countries were reportedto have facilities for cardiac surgery in the 2020 survey, rangingfrom ,0.7 hospitals in Denmark, Romania, Slovakia, UK, andUzbekistan to .2.0 in Belgium, Greece, Cyprus, and Iceland(see Supplementary material online, Figure S80).
• Service delivery.Amedian of 272.0 (IQR 224.3–337.9) CABGprocedures per million inhabitants of ESC member countrieswere reported in the 2020 survey (Figure 58). Rates rangedfrom ,100 CABG procedures per million people inKyrgyzstan, Republic of Kosovo, and Uzbekistan to .500 inBelgium, Lithuania, and the Netherlands.
• Stratification by national income status. The 2020 surveyshowed that the median number of cardiac surgeons per millioninhabitants was lower in middle-income countries comparedwith high-income countries [7.9 (IQR 4.2–9.9) vs. 8.0 (IQR6.6–10.0)] (Figure 59), although there was little difference inthe median number of hospitals with cardiac surgical facilities[1.3 (IQR 1.0–1.4) vs. 1.1 (IQR 0.9–1.7)] or the median numberof CABG procedures per million inhabitants [217.4 (IQR 101.6–279.3) vs. 278.5 (IQR 242.8–363.3)] with Serbia andMontenegro among middle-income countries reporting .400procedures per million people per year, more than were re-ported by many of the high-income ESC member countries(Figure 59).
Heart transplant surgery and left ventricular assistdevicesHeart transplant surgery is a life-saving treatment for patients withend-stage heart failure, delivering improved quality and duration oflife. The orthotopic procedure is preferred in which the patient’sown heart is removed and replaced by the donor heart. Survivalat 1 year exceeds 85% and at 5 years is about 70%.289 Rates of hearttransplantation are limited internationally by the availability of do-nor hearts. Left ventricular assist devices are electromechanical de-vices designed to replace the function of the failing heart partially or
Figure 56 Ablation procedures, pacemaker implantations, implantable cardioverter-defibrillator implantations, and cardiac resynchronizationtherapy implantations per million people in European Society of Cardiology member countries.
European Society of Cardiology 65D
ownloaded from
https://academic.oup.com
/eurheartj/advance-article/doi/10.1093/eurheartj/ehab892/6472699 by guest on 12 January 2022
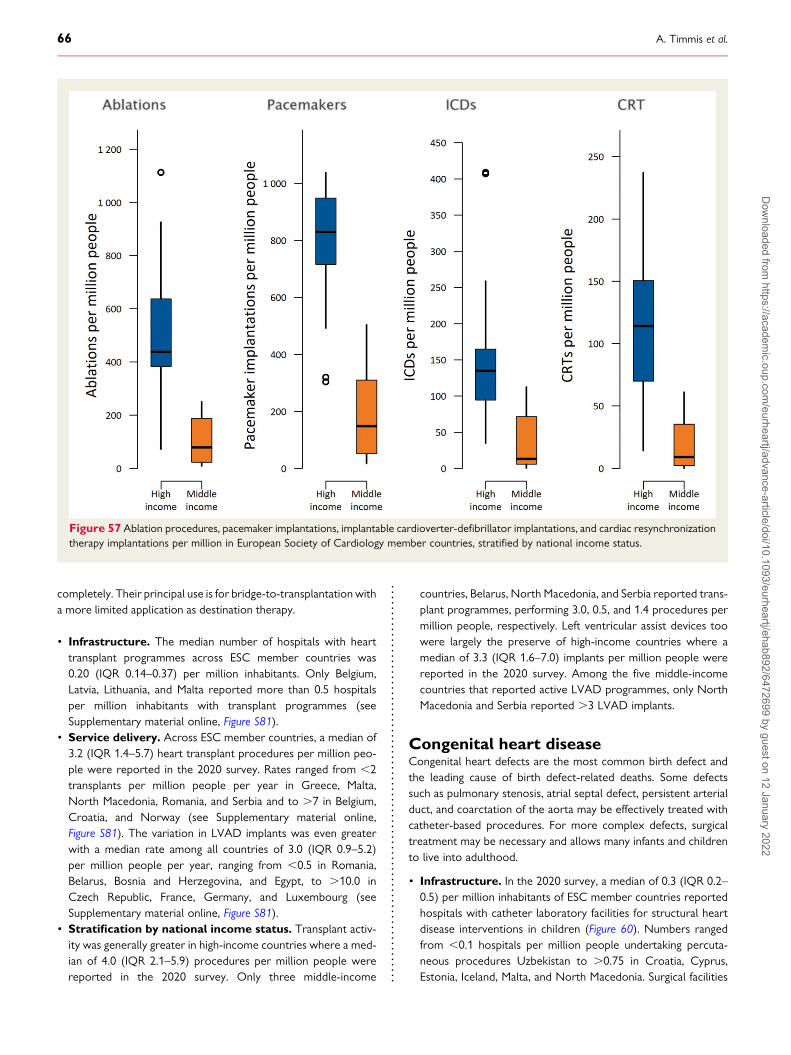
completely. Their principal use is for bridge-to-transplantation witha more limited application as destination therapy.
• Infrastructure. The median number of hospitals with hearttransplant programmes across ESC member countries was0.20 (IQR 0.14–0.37) per million inhabitants. Only Belgium,Latvia, Lithuania, and Malta reported more than 0.5 hospitalsper million inhabitants with transplant programmes (seeSupplementary material online, Figure S81).
• Service delivery. Across ESC member countries, a median of3.2 (IQR 1.4–5.7) heart transplant procedures per million peo-ple were reported in the 2020 survey. Rates ranged from ,2transplants per million people per year in Greece, Malta,North Macedonia, Romania, and Serbia and to .7 in Belgium,Croatia, and Norway (see Supplementary material online,Figure S81). The variation in LVAD implants was even greaterwith a median rate among all countries of 3.0 (IQR 0.9–5.2)per million people per year, ranging from ,0.5 in Romania,Belarus, Bosnia and Herzegovina, and Egypt, to .10.0 inCzech Republic, France, Germany, and Luxembourg (seeSupplementary material online, Figure S81).
• Stratification by national income status. Transplant activ-ity was generally greater in high-income countries where a med-ian of 4.0 (IQR 2.1–5.9) procedures per million people werereported in the 2020 survey. Only three middle-income
countries, Belarus, North Macedonia, and Serbia reported trans-plant programmes, performing 3.0, 0.5, and 1.4 procedures permillion people, respectively. Left ventricular assist devices toowere largely the preserve of high-income countries where amedian of 3.3 (IQR 1.6–7.0) implants per million people werereported in the 2020 survey. Among the five middle-incomecountries that reported active LVAD programmes, only NorthMacedonia and Serbia reported .3 LVAD implants.
Congenital heart diseaseCongenital heart defects are the most common birth defect andthe leading cause of birth defect-related deaths. Some defectssuch as pulmonary stenosis, atrial septal defect, persistent arterialduct, and coarctation of the aorta may be effectively treated withcatheter-based procedures. For more complex defects, surgicaltreatment may be necessary and allows many infants and childrento live into adulthood.
• Infrastructure. In the 2020 survey, a median of 0.3 (IQR 0.2–0.5) per million inhabitants of ESC member countries reportedhospitals with catheter laboratory facilities for structural heartdisease interventions in children (Figure 60). Numbers rangedfrom ,0.1 hospitals per million people undertaking percuta-neous procedures Uzbekistan to .0.75 in Croatia, Cyprus,Estonia, Iceland, Malta, and North Macedonia. Surgical facilities
Figure 57 Ablation procedures, pacemaker implantations, implantable cardioverter-defibrillator implantations, and cardiac resynchronizationtherapy implantations per million in European Society of Cardiology member countries, stratified by national income status.
66 A. Timmis et al.D
ownloaded from
https://academic.oup.com
/eurheartj/advance-article/doi/10.1093/eurheartj/ehab892/6472699 by guest on 12 January 2022
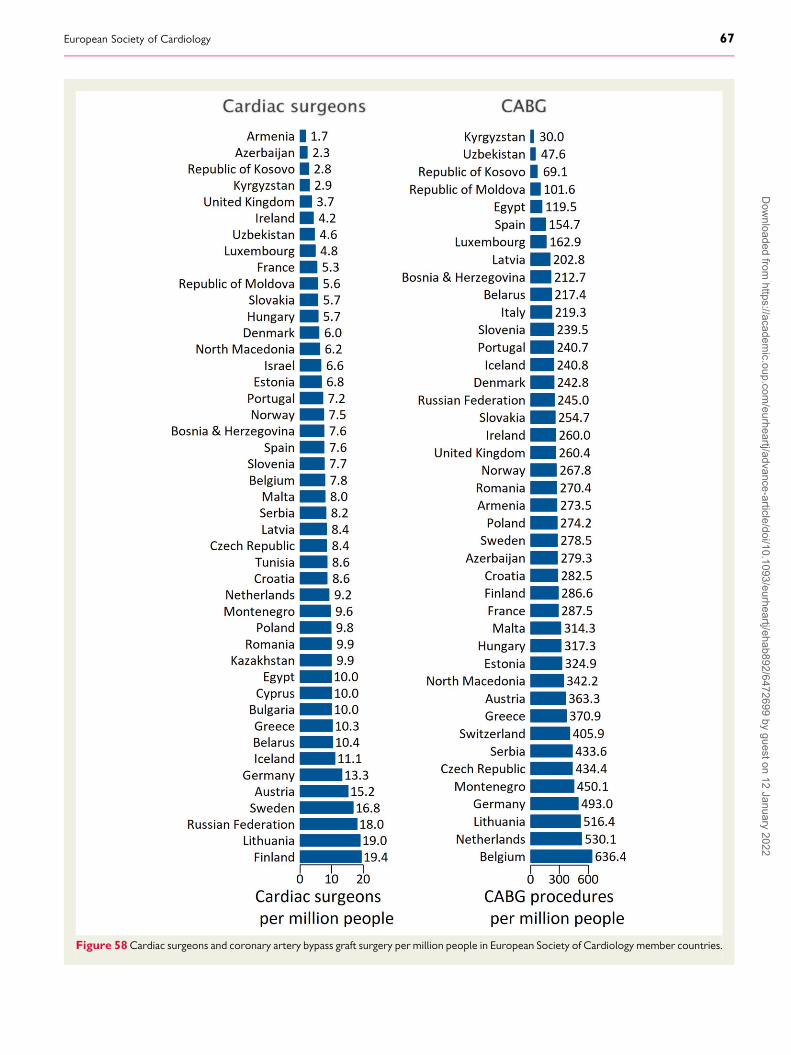
Figure 58Cardiac surgeons and coronary artery bypass graft surgery per million people in European Society of Cardiology member countries.
European Society of Cardiology 67D
ownloaded from
https://academic.oup.com
/eurheartj/advance-article/doi/10.1093/eurheartj/ehab892/6472699 by guest on 12 January 2022

for congenital heart disease were available in a median of 0.7(IQR 0.4–0.9) and 0.4 (IQR 0.2–1.0) hospitals per million inha-bitants of middle- and high-income ESC member countries.
• Service delivery. Across the ESC member countries, a medianof 33.3 (IQR 11.6–52.6) percutaneous procedures and 54.4(IQR 25.5–71.7) surgical procedures for congenital heart dis-ease were reported in the 2020 survey. Rates ranged from,10 percutaneous procedures per million people per year inBosnia and Herzegovina, Bulgaria, Egypt, Kyrgyzstan,Montenegro, Portugal, Romania, and Serbia to .90 inBelgium, Iceland, Italy, and Poland and from,10 surgical proce-dures per million people per year in Latvia, Luxembourg, Malta,and Montenegro to .90 in, Republic of Georgia, Republic ofRepublic of Moldova, and Switzerland (see Supplementary ma-terial online, Figure S82).
• Stratification by national income status. Facilities for in-terventional management of congenital heart disease were
similar in middle-income and high-income ESC member coun-tries included in the 2020 survey. A median of 0.3 (IQR 0.1–0.4) and 0.4 (IQR 0.2–0.6) hospitals per million inhabitants ofmiddle- and high-income ESC member countries, respectively,reported hospitals with catheter laboratory facilities for struc-tural heart disease interventions in children (see Supplementarymaterial online, Figure S83). Despite similar facilities for interven-tional management of congenital heart disease, procedure ratesper million people were lower in middle-income compared withhigh-income countries both for percutaneous procedures [9.8(IQR 4.8–14.0) vs. 48.6 (IQR 31.4–66.1)] and for surgical proce-dures [50.0 (IQR 25.4–68.5) vs. 56.6 (IQR 34.7–74.9)] (Figure 61).
Summary• Completeness (%) of the healthcare statistics presentedin this section was variable. Middle-income countries in
Figure 59Cardiac surgeons and coronary artery bypass graft surgery per million people in European Society of Cardiology member countries,stratified by national income status.
68 A. Timmis et al.D
ownloaded from
https://academic.oup.com
/eurheartj/advance-article/doi/10.1093/eurheartj/ehab892/6472699 by guest on 12 January 2022

particular were often unable to provide data requested in the2020 survey.
• There is considerable heterogeneity across ESC member coun-tries in cardiological person-power which likely reflects specia-list under-provision in many countries although definitions ofwhat constitutes a cardiologist may also contribute to theheterogeneity.
• There is additional heterogeneity in proportions of female car-diologists whose contributions to national workforces rangefrom ,15 to .70%. Overall, there is a substantial under-representation of females.
• Middle-income countries are severely under-resourced com-pared with high-income countries both in terms of cardiologicalperson-power and technological infrastructure.
• The under-resourced status of middle-income countries is asso-ciated with a severe procedural deficit compared with high-income countries in termsof coronary intervention, ablation pro-cedures, device implantation, and cardiac surgical procedures.
• Novel treatments such as percutaneous heart valve and LVADimplants are largely the preserve of high-income countrieswith very few middle-income countries involved in the develop-ment and utilization of these technologies.
Figure 60 Hospitals with catheter laboratories for structural heart disease in children per million people in European Society of Cardiologymember countries.
European Society of Cardiology 69D
ownloaded from
https://academic.oup.com
/eurheartj/advance-article/doi/10.1093/eurheartj/ehab892/6472699 by guest on 12 January 2022

CommentThe 2020 ESC ATLAS survey of ESC member countries has showncontinuing heterogeneity in cardiological services in terms of hu-man and capital resource and the delivery of high-quality health-care. It is important to emphasize however that optimal serviceprovision cannot be deduced from the data presented in this sec-tion. The fact that some countries have many times the number ofcardiologists or perform many times the number of PCIs com-pared with others does not necessarily mean that the quality ofCV healthcare is similarly increased. Nevertheless, wide variationbetween ESC member countries in the availability of cardiologistsdoes suggest significant under-provision in many countries andcannot be explained simply by national differences in how cardiol-ogists are defined. Specialist involvement in patient care improvesoutcomes273 and, with heart disease the leading cause of death
across ESC member countries, workforce initiatives need imple-mentation, particularly in those middle-income countries wherespecialist provision is low and CV mortality is high.Consideration should also be given to redressing the gender im-balance among cardiologists, recognizing that the absence of di-verse voices contributes to poorer collective wisdom within thespeciality.
Cardiology is increasingly a technologically driven speciality. Forall the common cardiac disorders, contemporary management hasmoved beyond diagnosis to the delivery of treatments that cancorrect symptoms and improve prognosis.272,290 To take full ad-vantage of these treatments, access is required to a range of diag-nostic, interventional, and surgical technologies that arecontributing importantly to steeply rising healthcare costs.272
The 2020 ESC ATLAS survey shows considerable heterogeneity
Figure 61 Percutaneous procedures and surgical procedures for congenital heart disease per million people in European Society ofCardiology member countries, stratified by national income status.
70 A. Timmis et al.D
ownloaded from
https://academic.oup.com
/eurheartj/advance-article/doi/10.1093/eurheartj/ehab892/6472699 by guest on 12 January 2022
in these technologies across ESCmember countries which, like theheterogeneity in numbers of cardiologists, suggests under-provision in many, mainly middle-income, countries. However,the heterogeneity does not rule-out over-provision. For example,the high rates of invasive cardiac catheterization in many high-income countries are increasingly seen as inappropriate whenless expensive and safer non-invasive tests are often availableand preferentially recommended by clinical guidelines.280,291
Programmes to enhance the more appropriate use of investiga-tional and treatment technologies have been developed interna-tionally,292–294 including the European Network for HealthTechnology Assessment which aims at creating, facilitating, andpromoting sustainable health technology assessment cooperationacross Europe.295
The under-provision of cardiological healthcare is of major im-portance in many middle-income ESC member countries. This isreflected in the 2020 ESC ATLAS survey which confirms thatmiddle-income countries have fewer hospitals equipped for con-temporary cardiac care and a corresponding deficit in procedurerates compared with high-income countries. These samemiddle-income countries are often those with continuing highCV mortality rates. Indeed, such under-provisions perpetuatethe poorer CV health of these populations, consistent withTudor-Hart’s inverse care law of less healthcare where it is mostneeded.296 Increasing healthcare provision in these countries re-quires additional spending directed towards diagnostic and thera-peutic technologies where stretched national budgets allow.However, a more amenable and cost-effective target for CV mor-tality reduction must be the high rates of hypertension and smok-ing which characterize many middle-income countries. There isconvincing evidence that modification of lifestyle and risk factorsis no less effective than treatment technologies in its contributionto CV mortality reduction.269–297
Responses to the 2020 ESC Atlas survey showed variable com-pleteness, with middle-income countries in particular often unableto provide information about key components of cardiologicalhealthcare delivery. This information shortfall is itself a likely con-tributor to under-provision of healthcare by making treatmentneeds difficult to evaluate and the development of coherenthealthcare policy almost impossible. National electronic recordsystems that are amenable to interrogation and linkage are criticalfor service planning and need to be given high priority if the health-care deficits of middle-income countries in the 2020 ESC ATLASsurvey are to be rectified. Improved data availability will act as adriver for research to better understand how CV healthcare mightbe enhanced through reductions in inequalities and improvementsin access to healthcare services.
Progress towards meeting whonon-communicable diseasetargets for 2025TheWHO reminds us that NCDs kill 41 million people each year,equivalent to 71% of all deaths globally.298 Each year, more than 15million people die from NCDs between the ages of 30 and 69years; 85% of these ‘premature’ deaths occur in low- and
middle-income countries. Cardiovascular diseases account formost NCD deaths (17.9 million annually), followed by cancers(9.3 million), respiratory diseases (4.1 million), and diabetes (1.5million).
In its campaign to control NCDs, the WHO has set nine targetsrelevant to global CV health to be met by 2025.299 Seven out ofthe nine targets call for reductions in CVD mortality and risk fac-tors with reference to 2010 as follows:
• A 25% relative reduction in the premature mortality fromCVDs, cancer, diabetes, or chronic respiratory diseases,
• At least 10% relative reduction in the harmful use of alcohol, asappropriate, within the national context,
• A 10% relative reduction in the prevalence of insufficient physi-cal activity,
• A 30% relative reduction in the prevalence of current tobaccouse in persons aged 15+ years,
• A 25% relative reduction in the prevalence of elevated bloodpressure or contain the prevalence of elevated blood pressure,according to national circumstances, and
• Halt the rise in diabetes,• Halt the rise in obesity.
In this section, progress made by ESC member countries inmeeting these seven targets is summarized for all except ‘insuffi-cient physical activity’ which lacks the availability of reliable longi-tudinal data during the period of interest.
Alcohol consumptionTheWHO has called for a relative reduction of at least 10% in theharmful use of alcohol to be achieved by 2025. During the period2010–2018, the median consumption of alcohol per capita acrossESC member countries showed a small decline from 5.1 (IQR 2.7–5.9) to 4.5 (IQR 2.5–5.5) L in females and from 17.2 (IQR 9.9–19.3)to 15.0 (IQR 10.4–18.5) L in males. Although alcohol consumptionwas higher in high-income compared with middle-income coun-tries, there was no significant change between 2010 and 2018for either females or males. For this reason, our linear forecasts(Figure 62) make it unlikely the WHO alcohol consumption targetfor 2025 will be met unless there is a change in current trends.
SmokingLongitudinal data for smoking in ESC member countries were pat-chy and incomplete for the years 2010–2018 when prevalencerates, year by year, were available for an average of 15.3 (range:12–25) high-income countries and 4.6 (range: 3–6) middle-incomecountries. The data showed a 19.7% decline in the prevalence ofsmoking from 22.8% (IQR 19.5–26.5%) to 18.3% (IQR 15.1–21.8%) among adults. Declines in the prevalence of smoking duringthe years of interest were largely confined to high-income coun-tries where rates fell by 31.0% in females and 18.5% in males. Inmiddle-income countries, smoking prevalence was higher andshowed little change between 2010 and 2018. Our linear forecasts(Figure 63) suggest theWHO smoking target will likely be achievedfor females and males in high-income countries if current trendscontinue, but there is little prospect of it being achieved in
European Society of Cardiology 71D
ownloaded from
https://academic.oup.com
/eurheartj/advance-article/doi/10.1093/eurheartj/ehab892/6472699 by guest on 12 January 2022

middle-income countries even allowing for the imprecision of ourestimates
Elevated blood pressureThe WHO has set a target of a 25% reduction (with reference to2010) in the prevalence of elevated blood pressure, to be achievedby 2025. During the period 2010–2015 (or most recent available),the median age-standardized prevalence of elevated blood pres-sure across ESC member countries has declined by 3.4% from25.9% (IQR 22.3–29.6%) in 2010 to 25.0% (IQR 19.9–28.5%).Declines were greater in high-income countries thanmiddle-income countries for both females (12.6 vs. 3.3%) andmales (11.0 vs. increase 1.0%). Our linear forecasts (Figure 64) sug-gest there is little prospect the WHO blood pressure target for
2025 will be achieved across all ESC member countries but agood prospect that it will be achieved in high-income countriesif present trends continue.
DiabetesTheWHO has called for a halt (with reference to 2010) to the risein prevalence of diabetes, to be achieved by 2025. However, ana-lysis of complete paired 2010 and 2015 data from 26 countriesshowed a 32% increase in the median prevalence of diabetesfrom 2.6 to 3.4% during that period. This was particularly markedin middle-income countries where the prevalence of diabetes in-creased by 42.1 compared with 15.7% in high-income countries.Based on these statistics, our forecasts (Figure 65) make it almost
Figure 62 Alcohol consumption in European Society of Cardiology member countries. ARIMA forecast.
72 A. Timmis et al.D
ownloaded from
https://academic.oup.com
/eurheartj/advance-article/doi/10.1093/eurheartj/ehab892/6472699 by guest on 12 January 2022
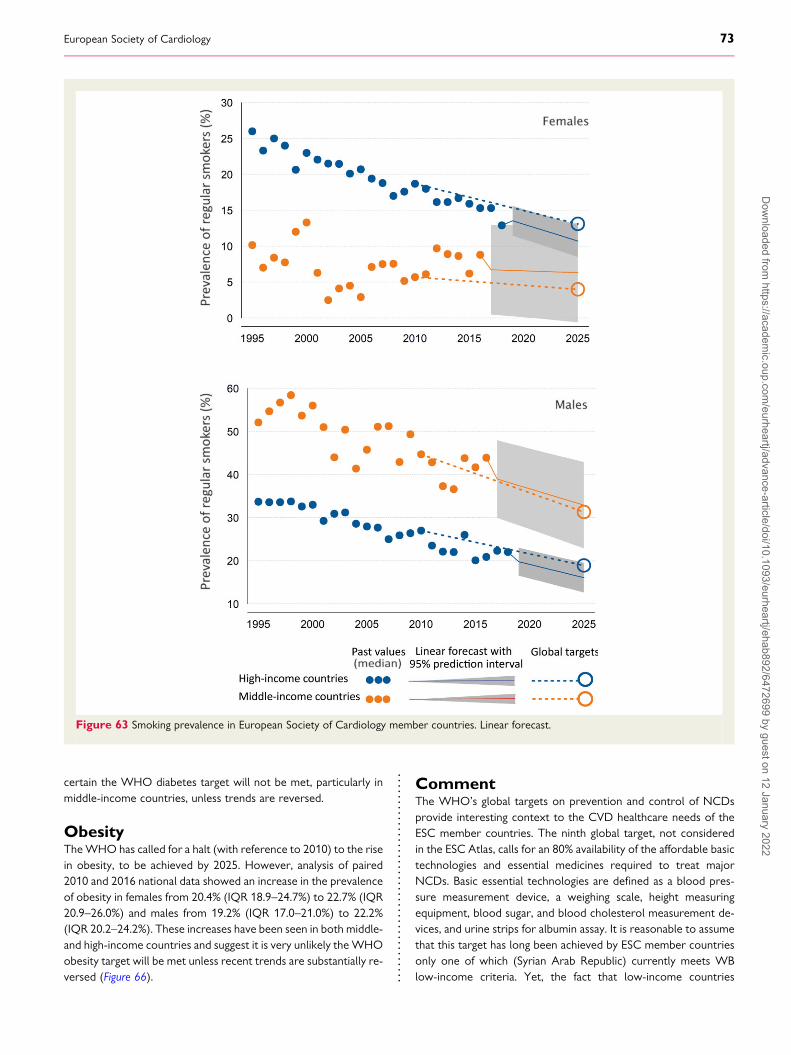
certain the WHO diabetes target will not be met, particularly inmiddle-income countries, unless trends are reversed.
ObesityTheWHO has called for a halt (with reference to 2010) to the risein obesity, to be achieved by 2025. However, analysis of paired2010 and 2016 national data showed an increase in the prevalenceof obesity in females from 20.4% (IQR 18.9–24.7%) to 22.7% (IQR20.9–26.0%) and males from 19.2% (IQR 17.0–21.0%) to 22.2%(IQR 20.2–24.2%). These increases have been seen in both middle-and high-income countries and suggest it is very unlikely theWHOobesity target will be met unless recent trends are substantially re-versed (Figure 66).
CommentThe WHO’s global targets on prevention and control of NCDsprovide interesting context to the CVD healthcare needs of theESC member countries. The ninth global target, not consideredin the ESC Atlas, calls for an 80% availability of the affordable basictechnologies and essential medicines required to treat majorNCDs. Basic essential technologies are defined as a blood pres-sure measurement device, a weighing scale, height measuringequipment, blood sugar, and blood cholesterol measurement de-vices, and urine strips for albumin assay. It is reasonable to assumethat this target has long been achieved by ESC member countriesonly one of which (Syrian Arab Republic) currently meets WBlow-income criteria. Yet, the fact that low-income countries
Figure 63 Smoking prevalence in European Society of Cardiology member countries. Linear forecast.
European Society of Cardiology 73D
ownloaded from
https://academic.oup.com
/eurheartj/advance-article/doi/10.1093/eurheartj/ehab892/6472699 by guest on 12 January 2022

elsewhere in the world fail to meet this target, despite an increas-ing prevalence of CVD, puts into context the technological short-falls of middle-income ESC member countries identified in the2020 survey. This is not to say these shortfalls are not in needof correction, but it is a reminder of how much further the low-income countries of the world have to go in combating the emer-ging CVD epidemics they now face.
Risk factors and unhealthy behaviours are potentially reversible,and this provides huge opportunity to address the health inequal-ities across ESC member countries that are highlighted in this re-port. It seems clear, however, that efforts to seize this opportunityare falling short and present evidence suggests that most of theWHO NCD targets for 2025 are unlikely to be met across ESCmember countries. Rates of obesity and diabetes in particularare increasing and the ESC’s ambitious mission ‘to reduce the bur-den of cardiovascular disease’ will not be achieved until thesetrends are substantially reversed.
Cardiovascular disease advocacyroadmapThis ESC Atlas reports encouraging reductions in CV mortality andgains in life expectancy across ESC member countries, but 113 mil-lion people continue to live with CVD, which remains the mostcommon cause of death within the region. The epidemic of obesityand type II diabetes is now contributing to a plateauing of CV mor-tality rates300–303 and the ESC Atlas draws attention to sevenmiddle-income ESC member countries that saw small increasesin the incidence of CVD in 2019. Despite these disturbing obser-vations, cancer is often perceived as the most important cause ofdeath by members of the public and when they are asked aboutthe harms of smoking, it is cancer not CVD that is seen as themain risk.304,305 This stems from a variety of ill-informed beliefsabout the mode and timing of cardiac death, which is often seen
Figure 64 Prevalence of elevated blood pressure in European Society of Cardiology member countries. ARIMA forecast.
74 A. Timmis et al.D
ownloaded from
https://academic.oup.com
/eurheartj/advance-article/doi/10.1093/eurheartj/ehab892/6472699 by guest on 12 January 2022
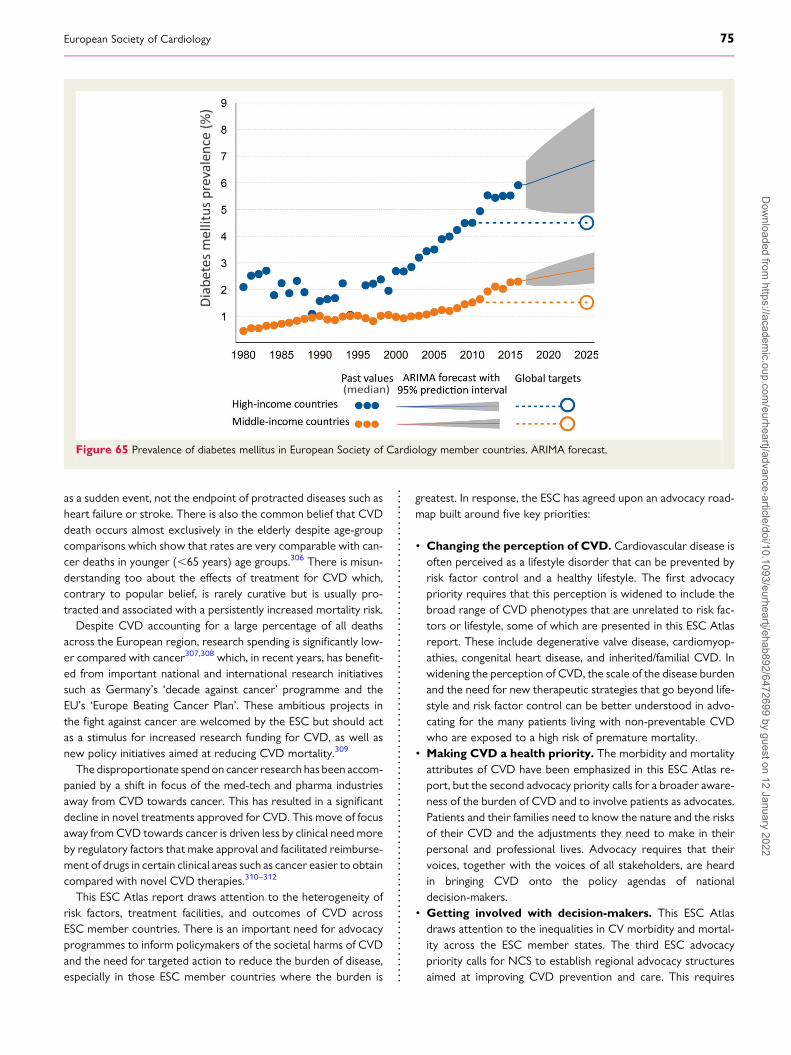
as a sudden event, not the endpoint of protracted diseases such asheart failure or stroke. There is also the common belief that CVDdeath occurs almost exclusively in the elderly despite age-groupcomparisons which show that rates are very comparable with can-cer deaths in younger (,65 years) age groups.306 There is misun-derstanding too about the effects of treatment for CVD which,contrary to popular belief, is rarely curative but is usually pro-tracted and associated with a persistently increased mortality risk.Despite CVD accounting for a large percentage of all deaths
across the European region, research spending is significantly low-er compared with cancer307,308 which, in recent years, has benefit-ed from important national and international research initiativessuch as Germany’s ‘decade against cancer’ programme and theEU’s ‘Europe Beating Cancer Plan’. These ambitious projects inthe fight against cancer are welcomed by the ESC but should actas a stimulus for increased research funding for CVD, as well asnew policy initiatives aimed at reducing CVD mortality.309
The disproportionate spendon cancer research has been accom-panied by a shift in focus of the med-tech and pharma industriesaway from CVD towards cancer. This has resulted in a significantdecline in novel treatments approved for CVD. This move of focusaway fromCVD towards cancer is driven less by clinical needmoreby regulatory factors that make approval and facilitated reimburse-ment of drugs in certain clinical areas such as cancer easier to obtaincompared with novel CVD therapies.310–312
This ESC Atlas report draws attention to the heterogeneity ofrisk factors, treatment facilities, and outcomes of CVD acrossESC member countries. There is an important need for advocacyprogrammes to inform policymakers of the societal harms of CVDand the need for targeted action to reduce the burden of disease,especially in those ESC member countries where the burden is
greatest. In response, the ESC has agreed upon an advocacy road-map built around five key priorities:
• Changing the perception of CVD. Cardiovascular disease isoften perceived as a lifestyle disorder that can be prevented byrisk factor control and a healthy lifestyle. The first advocacypriority requires that this perception is widened to include thebroad range of CVD phenotypes that are unrelated to risk fac-tors or lifestyle, some of which are presented in this ESC Atlasreport. These include degenerative valve disease, cardiomyop-athies, congenital heart disease, and inherited/familial CVD. Inwidening the perception of CVD, the scale of the disease burdenand the need for new therapeutic strategies that go beyond life-style and risk factor control can be better understood in advo-cating for the many patients living with non-preventable CVDwho are exposed to a high risk of premature mortality.
• Making CVD a health priority. The morbidity and mortalityattributes of CVD have been emphasized in this ESC Atlas re-port, but the second advocacy priority calls for a broader aware-ness of the burden of CVD and to involve patients as advocates.Patients and their families need to know the nature and the risksof their CVD and the adjustments they need to make in theirpersonal and professional lives. Advocacy requires that theirvoices, together with the voices of all stakeholders, are heardin bringing CVD onto the policy agendas of nationaldecision-makers.
• Getting involved with decision-makers. This ESC Atlasdraws attention to the inequalities in CV morbidity and mortal-ity across the ESC member states. The third ESC advocacypriority calls for NCS to establish regional advocacy structuresaimed at improving CVD prevention and care. This requires
Figure 65 Prevalence of diabetes mellitus in European Society of Cardiology member countries. ARIMA forecast.
European Society of Cardiology 75D
ownloaded from
https://academic.oup.com
/eurheartj/advance-article/doi/10.1093/eurheartj/ehab892/6472699 by guest on 12 January 2022
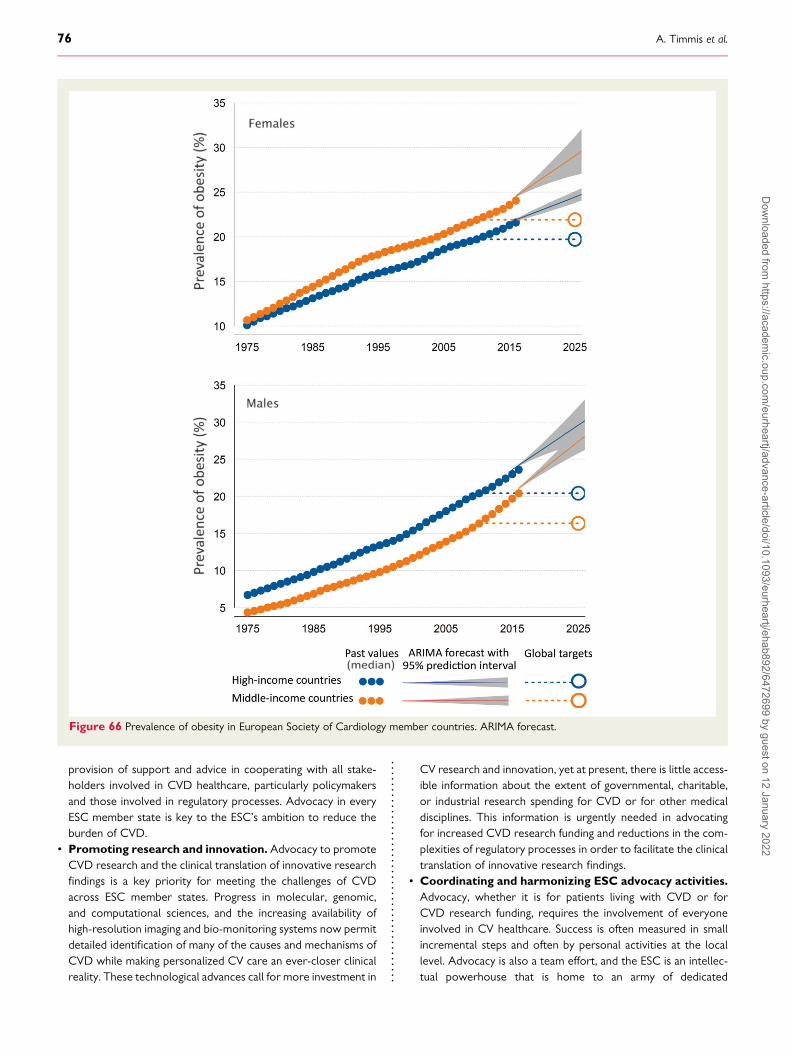
provision of support and advice in cooperating with all stake-holders involved in CVD healthcare, particularly policymakersand those involved in regulatory processes. Advocacy in everyESC member state is key to the ESC’s ambition to reduce theburden of CVD.
• Promoting research and innovation. Advocacy to promoteCVD research and the clinical translation of innovative researchfindings is a key priority for meeting the challenges of CVDacross ESC member states. Progress in molecular, genomic,and computational sciences, and the increasing availability ofhigh-resolution imaging and bio-monitoring systems now permitdetailed identification of many of the causes and mechanisms ofCVD while making personalized CV care an ever-closer clinicalreality. These technological advances call for more investment in
CV research and innovation, yet at present, there is little access-ible information about the extent of governmental, charitable,or industrial research spending for CVD or for other medicaldisciplines. This information is urgently needed in advocatingfor increased CVD research funding and reductions in the com-plexities of regulatory processes in order to facilitate the clinicaltranslation of innovative research findings.
• Coordinating and harmonizing ESC advocacy activities.Advocacy, whether it is for patients living with CVD or forCVD research funding, requires the involvement of everyoneinvolved in CV healthcare. Success is often measured in smallincremental steps and often by personal activities at the locallevel. Advocacy is also a team effort, and the ESC is an intellec-tual powerhouse that is home to an army of dedicated
Figure 66 Prevalence of obesity in European Society of Cardiology member countries. ARIMA forecast.
76 A. Timmis et al.D
ownloaded from
https://academic.oup.com
/eurheartj/advance-article/doi/10.1093/eurheartj/ehab892/6472699 by guest on 12 January 2022
scientists and clinicians with unique expertise in CV science andhealthcare. The fifth advocacy priority calls for mobilization andharmonization of this workforce in advocating on behalf of the113 million people living with CVD across the member coun-tries of the ESC.
Advocacy to increase awareness of policymakers, members ofthe public, and other stakeholders about the continuing import-ance of CVD as the leading cause of death among ESC membercountries should be seen as a duty and responsibility of all whoare involved in CV research and healthcare.
Data sharingAll the data presented in this report are available upon request tothe corresponding author (A.T.). Access will be granted followingreview with Atlas investigators and agreement with the authors ofthis manuscript
Supplementary materialSupplementary material is available at European Heart Journalonline.
AcknowledgementsNational Societies: We acknowledge the national societies of ESCmember countries for their help in developing national infrastruc-ture and healthcare data. Albania: Lezha Mimoza, Goda Artan, andDemiraj Aurel. Algeria: Mohammed Chettibi and NaimaHammoudi. Armenia: Katarine Vardanyan, Sergey Pepoyan, andHamayak Sisakian. Austria: Daniel Scherr, Peter Siostrzonek, andBernhard Metzer. Azerbaijan: Isah Mustafayev, Tofig Jahangirov,and Yasmin Rustamova. Belarus: Natalya Mitkovskaya, NatalyaShibeka, and Valeriy Stelmashok. Belgium: Michel De Pauw,Patrizio Lancellotti, and Marc Claeys. Bosnia and Herzegovina:Zumreta Kušljugic, Alen Džubur, and Elnur Smajic. Bulgaria:Mariya Tokmakova and Vassil Traykov. Croatia: Davor Milicic,Marijan Pasalic, and Sasa Pavasovic. Cyprus: TheodorosChristodoulides, Ilias Papasavvas, and Christos Eftychiou. CzechRepublic: Aleš Linhart, Miloš Táborský, and Martin Hutyra.Denmark: Jacob Thorsted Sørensen, Mads Jønsson Andersen,and Steen Dalby Kristensen. Egypt: Magdy Abdelhamid andKhaled Shokry. Estonia: Priit Kampus. Finland: Mika Laine andMatti Niemelä. France: Bernard Iung, Ariel Cohen, andChristophe Leclercq. Georgia: Dali Trapaidze, KakhaberEtsadashvili, and Alexander Aladashvili. Germany: KurtBestehorn, Stephan Baldus, and Andreas M. Zeiher. Greece:John Kanakakis, Alexandria Patrianakos, and ChristinaChrysohoou. Hungary: Zoltán Csanádi, Dávid Becker, andZoltán Járai. Iceland: Þórdís Jóna Hrafnkelsdóttir. Ireland: VincentMaher, Jim Crowley, and Barbra Dalton. Israel: Arik Wolak, EyalBen Assa, and Barak Zafrir. Italy: Adriano Murrone, CarmenSpaccarotella, and Stefano Urbinati. Kazakhstan: BerkinbayevSalim, Sakhov Orazbek, and Abdrakhmanov Ayan. Republic ofKosovo: Gani Bajraktari, and Docor Afrim Poniku. Kyrgyzstan:Mirrakhimov Erkin, Abilova Saamay, and Kalysov Kurban. Latvia:
Andrejs Erglis, Sanda Jegere, and Iveta Bajare. Lebanon: MalekMohammed, Antoine Sarkis, and Georges Saadeh. Lithuania:Rimvydas Šlapikas, Tomas Lapinskas, and Jelena Celutkiene.Libya: Khaled Ellafi and Fathi El Ghamari. Luxembourg: JeanBeissel and Cristiana Banu. Malta: Tiziana Felice and RobertXuereb. Republic of Moldova: Mihail Popovici, Dorin Lisii, andVictor Rudi. Montenegro: Aneta Boskovic and MiroslavRabrenovic. Morocco: Samir Ztot and Saadia Abir-Khalil. TheNetherlands: J.G. Meeder, A.C. van Rossum, and M. Elsendoorn.North Macedonia: Jorgo Kostov, Elizabeta Srbinovska Kostovska,and Sasko Kedev. Norway: Kristin Angel, Ole Christian Mjølstad,and Øyvind Bleie. Poland: Marek Gierlotka, Rafał Dabrowski, andPiotr Jankowski. Portugal: Sérgio Bravo Baptista, Jorge Ferreira,and Victor Gil. Romania: Elisabeta Badila, Dan Gaita, and BogdanA. Popescu. Russian Federation: Evgeny Shlyakhto, NadezhdaZvartau, and Evgenia Kotova. Republic of San Marino: MarinaFoscoli and Marco Zavatta. Serbia: Sinisa Stojkovic, MiloradTesic, and Stefan Juricic. Slovakia: Gabriela Kaliská, RobertHatala, and Peter Hlivák. Slovenia: Zlatko Fras, Matjaž Bunc, andAndrej Pernat. Spain: Ángel Cequier, Manuel Anguita, and JavierMuñiz. Sweden: Bengt Johansson and Pyotr Platonov.Switzerland: David Carballo, Marjam Rüdiger-Stürchler, and FelixC. Tanner. Syrian Arab Republic: Hussam Eddin Shebli andSamer Kabbani. Tunisia: Leila Abid, Addad Faouzi, and SalemAbdessalem. Turkey: Vedat Aytekin and Ilyas Atar. Ukraine:V. Kovalenko and E. Nesukay. UK: Andrew Archbold, UpasanaTayal, and Chris Wilkinson. Uzbekistan: Ravshanbek Kurbanov,Khurshid Fozilov, and Mirakhmadjon Mirmaksudov. For supportin developing the ESC Atlas: Dennis Boateng, Ghislain Daval,Ganna Momotyuk, and David Sebastiao.
FundingThe ESC Atlas project continuously collects data from a wide varietyof organizations, including NCS, and seeks funding from multiplesources. For the timeframe covered in the manuscript, the projectwas supported by Janssen. The funder had no role in study design,data collection and analysis, decision to publish, or preparation ofthe manuscript.
Conflict of interest: All authors declare that they have no conflict ofinterest relevant to this study.
References1. Kirchhof P. A tale of two countries: how decentralized organization and long-
term investment build resilient healthcare systems. Eur Heart J Qual Care ClinOutcomes 2020;6:201–203.
2. Kiss P, Carcel C, Hockham C, Peters SAE. The impact of the COVID-19 pan-demic on the care and management of patients with acute cardiovascular dis-ease: a systematic review. Eur Heart J Qual Care Clin Outcomes 2021;7:18–27.
3. Vardas P, Maniadakis N, Bardinet I, Pinto F. The European Society of CardiologyAtlas of Cardiology: rational, objectives, and methods. Eur Heart J Qual Care ClinOutcomes 2016;2:6–15.
4. Timmis A, Townsend N, Gale C, Grobbee R, Maniadakis N, Flather M, et al.European Society of Cardiology: cardiovascular disease statistics 2017. EurHeart J 2018;39:508–579.
5. Timmis A, Townsend N, Gale CP Torbica A, Lettino M, Petersen SE, et al.European Society of Cardiology: cardiovascular disease statistics 2019. EurHeart J 2020;41:12–85.
6. World Bank. Population estimates and projections. https://datacatalog.worldbank.org/dataset/population-estimates-and-projections (21 October2021, date last accessed).
European Society of Cardiology 77D
ownloaded from
https://academic.oup.com
/eurheartj/advance-article/doi/10.1093/eurheartj/ehab892/6472699 by guest on 12 January 2022

7. World Health Organization: WHO Mortality Database. https://www.who.int/data/data-collection-tools/who-mortality-database (21 October 2021, datelast accessed).
8. Eurostat. Revision of the European Standard Population 2013 edition. https://ec.europa.eu/eurostat/documents/3859598/5926869/KS-RA-13-028-EN.PDF/e713fa79-1add-44e8-b23d-5e8fa09b3f8f (21 October 2021, date last accessed).
9. World Health Organization. WHO methods and data sources for country-levelcauses of death 2000–2012. Geneva: Department of Health Statistics andInformation Systems WHO; 2014. https://www.who.int/healthinfo/global_burden_disease/GlobalCOD_method_2000_2012.pdf (21 October 2021, datelast accessed).
10. NCD Risk Factor Collaboration (NCD-RisC), Zhou B, Lu Y, Hajifathalian K,Bentham J, Di Cesare M, et al. Worldwide trends in diabetes since 1980: apooled analysis of 751 population-based studies with 4.4 million participants.Lancet 2016;387:1513–1530.
11. NCD Risk Factor Collaboration (NCD-RisC), Zhou B, Bentham J, Di Cesare M,Bixby H, Danaei G, et al. Worldwide trends in blood pressure from 1975 to2015: a pooled analysis of 1479 population-based measurement studies with19·1 million participants. Lancet 2017;389:37–55.
12. IHME—measuring what matters. http://www.healthdata.org (21 October 2021,date last accessed).
13. GBD 2015 Mortality and Causes of Death Collaborators, Wang H, Naghavi M,Allen C, Barber RM, Bhutta ZA, et al. Global, regional, and national life expect-ancy, all-cause mortality, and cause-specific mortality for 249 causes of death,1980–2015: a systematic analysis for the Global Burden of Disease Study2015. Lancet 2016;388:1459–1544.
14. Roth GA, Johnson C, Abajobir A, Abd-Allah F, Abera SF, Abyu G, et al. Global,regional, and national burden of cardiovascular diseases for 10 causes, 1990 to2015. J Am Coll Cardiol 2017;70:1–25.
15. Mathers CD. History of global burden of disease assessment at the WorldHealth Organization. Arch Public Health 2020;78:77. (21 October 2021, datelast accessed).
16. Mathers CD, Salomon JA, Ezzati M, Begg S, Hoorn SV, Lopez AD. Sensitivity anduncertainty analyses for burden of disease and risk factor estimates. Washington, DC:Global Burden of Disease and Risk Factors, The International Bank ofReconstruction and Development/The World Bank; 2006, Chapter 5. http://www.ncbi.nlm.nih.gov/pubmed/21250370 (21 October 2021, date lastaccessed).
17. Solberg CT, Norheim OF, Barra M. The disvalue of death in the global burden ofdisease. J Med Ethics 2018;44:192–198.
18. Tichenor M, Sridhar D. Metric partnerships: global burden of disease estimateswithin the World Bank, the World Health Organisation and the Institute forHealth Metrics and Evaluation. Wellcome Open Res 2020;4:35. (21 October2021, date last accessed).
19. WHO Expert Reference Group on the Draft GPW 13 Impact Framework2019–2023. First report. Geneva: WHO; 2018. https://web.archive.org/web/20181018033003/http://www.who.int/about/what-we-do/gpw13-expert-group/en/ (21 October 2021, date last accessed).
20. The World Bank—Data Bank. https://databank.worldbank.org/home.aspx (21October 2021, date last accessed).
21. Serajuddin U, Hamadeh N. New World Bank country classifications by income level:2020–2021: World Bank Blogs, Data Blog; 2020. https://blogs.worldbank.org/opendata/new-world-bank-country-classifications-income-level-2020-2021 (21October 2021, date last accessed).
22. Cleveland WS. Robust locally weighted regression and smoothing scatterplots. JAm Stat Assoc 1979;74:829–836.
23. Timmis A. Cardiovascular mortality in the UK: good news if you live in the South.Heart 2015;101:1180–1181.
24. Vaez M, Dalén M, Friberg Ö, Nilsson J, Frøbert O, Lagerqvist B, et al. Regionaldifferences in coronary revascularization procedures and outcomes: a nation-wide 11-year observational study. Eur Heart J Qual Care Clin Outcomes 2017;3:243–248.
25. Tadayon S, Wickramasinghe K, Townsend N. Examining trends in cardiovasculardisease mortality across Europe: how does the introduction of a new EuropeanStandard Population affect the description of the relative burden of cardiovascu-lar disease? Population Health Metrics 2019;17:6.
26. Mendis S, Puska P, Norrving B. World Health Organization. Global atlas on car-diovascular disease prevention and control. World Health Organization; 2011.
27. Ritchie H, Roser M. Age structure. Our World in Data. 2019. https://ourworldindata.org/age-structure (21 October 2021, date last accessed).
28. George J, Mathur R, Shah AD, Pujades-Rodriguez M, Denaxas S, Smeeth L, et al.Ethnicity and the first diagnosis of a wide range of cardiovascular diseases: asso-ciations in a linked electronic health record cohort of 1 million patients. PLoS One2017;12:e0178945.
29. Forouhi NG, Sattar N. CVD risk factors and ethnicity—a homogeneous rela-tionship? Atheroscler Suppl 2006;7:11–19.
30. Jivraj S, Khan O. Ethnicity and deprivation in England: how likely are ethnic minoritiesto live in deprived neighbourhoods? Centre on Dynamics of Ethnicity briefingpaper; 2013. https://hummedia.manchester.ac.uk/institutes/code/briefingsupdated/ethnicity-and-deprivation-in-england-how-likely-are-ethnic-minorities-to-live-in-deprived-neighbourhoods%20(1).pdf (21 October 2021, date last accessed).
31. Leung LA. Healthy and unhealthy assimilation: country of origin and smoking be-havior among immigrants. Health Econ 2014;23:1411–1429.
32. Saffer H, Dave D, Grossman M, Leung LA. Racial, ethnic, and gender differencesin physical activity. J Hum Cap 2013;7:378–410.
33. Cainzos-Achirica M, Fedeli U, Sattar N, Sattar N, Agyemang C, Jenum AK, et al.Epidemiology, risk factors, and opportunities for prevention of cardiovasculardisease in individuals of South Asian ethnicity living in Europe. Atherosclerosis2019;286:105–113.
34. Rowlands GP, Mehay A, Hampshire S, Phillips R, Williams P, Mann A, et al.Characteristics of people with low health literacy on coronary heart diseaseGP registers in South London: a cross-sectional study. BMJ Open 2013;3:e001503.
35. Sekhri N, Timmis A, Chen R, Junghans C, Walsh N, Zaman J, et al. Inequity ofaccess to investigation and effect on clinical outcomes: prognostic study of cor-onary angiography for suspected stable angina pectoris. BMJ 2008;336:1058–1061.
36. Biswas S, Dinh D, Lucas M, Duffy SJ, Brennan A, Liew D, et al. Impact of limitedEnglish proficiency on presentation and clinical outcomes of patients undergoingprimary percutaneous coronary intervention. Eur Heart J Qual Care Clin Outcomes2020;6:254–262.
37. Trevino FM. Quality of health care for ethnic/racial minority populations. EthnHealth 1999;4:153–164.
38. Kravitz RL. Ethnic differences in use of cardiovascular procedures: new insightsand new challenges. Ann Intern Med 1999;130:231–233.
39. Sheifer SE, Escarce JJ, Schulman KA. Race and sex differences in the managementof coronary artery disease. Am Heart J 2000;139:848–857.
40. Bailey ZD, Feldman JM, Bassett MT. How structural racism works—racist poli-cies as a root cause of U.S. racial health inequities. N Engl J Med 2021;384:768–773.
41. Worldometer – Europe Demographics. https://www.worldometers.info/demographics/demographics-of-europe/#urb (21 October 2021, date lastaccessed).
42. Marmot M, Allen J, Boyce T, Goldblatt P, Morrison J. Health equity in England: theMarmot review 10 years on: Institute of Health Equity report; 2020. https://www.health.org.uk/publications/reports/the-marmot-review-10-years-on (21October 2021, date last accessed).
43. Kumar R, Singh MC, Singh MC, Ahlawat SK, Thakur JS, Srivastava A, et al.Urbanization and coronary heart disease: a study of urban-rural differences innorthern India. Indian Heart J 2006;58:126–130.
44. Li Z, Yu S, Han X, Liu J, Yao H. Changes to cardiovascular risk factors over 7years: a prospective cohort study of in situ urbanised residents in theChaoyang District of Beijing. BMJ Open 2020;10:e033548.
45. World Heart Federation. Urbanization and 45. Cardiovascular disease: raisingheart-healthy children in today’s cities: World Heart Federation publication;2012. https://www.world-heart-federation.org/wp-content/uploads/2017/05/FINAL_Urbanization_Report_EXECUTIVE_SUMMARY_HiRes.pdf (21October 2021, date last accessed).
46. Schultz WM, Kelli HM, Lisko JC, Varghese T, Shen J, Sandesara P, et al.Socioeconomic status and cardiovascular outcomes: challenges and interven-tions. Circulation 2018;137:2166–2178.
47. Stringhini S, Carmeli C, Jokela M, Avendaño M, Muennig P, Guida F, et al.Socioeconomic status and the 25 × 25 risk factors as determinants of prema-ture mortality: a multicohort study and meta-analysis of 1·7 million men and wo-men. Lancet 2017;389:1229–1237.
48. Jayasinghe UW, Harris MF, Parker SM, Litt J, van Driel M, Mazza D, et al. The im-pact of health literacy and life style risk factors on health-related quality of life ofAustralian patients. Health Qual Life Outcomes 2016;14:68.
49. Sekhri N, Timmis AD, Hemingway H, Walsh N, Eldridge S, Junghans C, et al. Isaccess to specialist assessment of chest pain equitable by age, gender, ethnicityand socioeconomic status? An enhanced ecological cohort analysis. BMJ Open2012;2:e001025.
50. Clark AM, DesMeules M, Luo W, Duncan AS, Wielgosz A. Socioeconomic sta-tus and cardiovascular disease: risks and implications for care. Nat Rev Cardiol2009;6:712–722.
51. Ludwig J, Duncan GJ, Gennetian LA, Katz LF, Kessler RC, Kling JR, et al.Neighborhood effects on the long-term well-being of low-income adults.Science 2012;337:1505–1510.
78 A. Timmis et al.D
ownloaded from
https://academic.oup.com
/eurheartj/advance-article/doi/10.1093/eurheartj/ehab892/6472699 by guest on 12 January 2022
52. Barber S, Hickson DA, Wang X Sims M, Nelson C, Diez-Roux AV.Neighborhood disadvantage, poor social conditions, and cardiovascular diseaseincidence among African American adults in the Jackson heart study. Am J PublicHealth 2016;106:2219–2226.
53. Dewan P, Rørth R, Jhund PS, Ferreira JP, Zannad F, Shen L, et al. Income inequal-ity and outcomes in heart failure: a global between-country analysis. JACC HeartFail 2019;7:336–346.
54. Scholes S, Mindell JS. Health Survey for England 2017: cardiovascular disease: NHSDigital; 2018. http://healthsurvey.hscic.gov.uk/media/78646/HSE17-CVD-rep.pdf (21 October 2021, date last accessed).
55. Hagengaard L, Andersen MP, Polcwiartek C, Larsen JM, Larsen ML, Skals RK,et al. Socioeconomic differences in outcomes after hospital admission for atrialfibrillation or flutter. Eur Heart J Qual Care Clin Outcomes 2019;7:295–303.
56. Liu K, Cedres LB, Stamler J, Dyer A, Stamler R, Nanas S, et al. Relationship ofeducation to major risk factors and death from coronary heart disease, cardio-vascular diseases and all causes, findings of three Chicago epidemiologic studies.Circulation 1982;66:1308–1314.
57. Dégano IR, Marrugat J, Grau M, Salvador-González B, Ramos R, Zamora A, et al.The association between education and cardiovascular disease incidence ismediated by hypertension, diabetes, and body mass index. Sci Rep 2017;7:12370.
58. Hamad R, Nguyen TT, Bhattacharya J, Glymour MM, Rehkopf DH. Educationalattainment and cardiovascular disease in the United States: a quasi-experimentalinstrumental variables analysis. PLoS Med 2019;16:e1002834.
59. Kubota Y, Heiss G, MacLehose RF, Roetker NS, Folsom AR. Association of edu-cational attainment with lifetime risk of cardiovascular disease: the atheroscler-osis risk in communities study. JAMA Intern Med 2017;177:1165–1172.
60. Avendano M, Kunst AE, Huisman M, Lenthe FV, Bopp M, Regidor E, et al.Socioeconomic status and ischaemic heart disease mortality in 10 westernEuropean populations during the 1990s. Heart 2006;92:461–467.
61. Rosengren A, Smyth A, Rangarajan S, Ramasundarahettige C, Bangdiwala SI,AlHabib KF, et al. Socioeconomic status and risk of cardiovascular disease in20 low-income, middle-income, and high-income countries: the ProspectiveUrban Rural Epidemiologic (PURE) study. Lancet Glob Health 2019;7:e748–e760.
62. Nie J, Wang J, Aune D, Huang W, Xiao D, Wang Y, et al. Association betweenemployment status and risk of all-cause and cause-specific mortality: apopulation-based prospective cohort study. J Epidemiol Community Health2020;74:428–436.
63. Mejean C, Droomers M, van der Schouw YT, Sluijs I, Czernichow S, GrobbeeDE, et al. The contribution of diet and lifestyle to socioeconomic inequalitiesin cardiovascular morbidity and mortality. Int J Cardiol 2013;168:5190–5195.
64. Gaziano TA, Bitton A, Anand S, Abrahams-Gessel S, Murphy A. Growing epi-demic of coronary heart disease in low- and middle-income countries. CurrProbl Cardiol 2010;35:72–115.
65. European Commission: The Future of Cities. https://urban.jrc.ec.europa.eu/thefutureofcities/urban-health#the-chapter (21 October 2021, date lastaccessed).
66. Zaman MJS, Shipley MJ, Stafford M, Brunner EJ, Timmis AD, Marmot MG, et al.Incidence and prognosis of angina pectoris in South Asians andWhites: 18 yearsof follow-up over seven phases in the Whitehall-II prospective cohort study. JPublic Health 2011;33:430–438.
67. Howard VJ, Kleindorfer DO, Judd SE, McClure LA, Safford MM, Rhodes JD, et al.Disparities in stroke incidence contributing to disparities in stroke mortality. AnnNeurol 2011;69:619–627.
68. Wang Y, Rudd AG, Wolfe CD. Age and ethnic disparities in incidence of strokeover time: the South London Stroke Register. Stroke 2013;44:3298–3304.
69. Kovesdy CP, Norris KC, Boulware LE, Lu JL, Ma JZ, Streja E, et al. Association ofrace with mortality and cardiovascular events in a large cohort of US veterans.Circulation 2015;132:1538–1548.
70. Gheorghe A, Griffiths U, Murphy A, Legido-Quigley H, Lamptey P, Perel P. Theeconomic burden of cardiovascular disease and hypertension in low- andmiddle-income countries: a systematic review. BMC Public Health 2018;18:975.
71. Leal J, Luengo-Fernández R, Gray A, Petersen S, Rayner M. Economic burden ofcardiovascular diseases in the enlarged European Union. Eur Heart J 2006;27:1610–1619.
72. Current health expenditure (% of GDP): The World Bank; 2021. https://data.worldbank.org/indicator/SH.XPD.CHEX.GD.ZS (21 October 2021, date lastaccessed).
73. OECD. Estimating expenditure by disease, age and gender-focus on health spending.2016. https://www.oecd.org/els/health-systems/estimating-expenditure-by-disease-age-and-gender.htm (21 October 2021, date last accessed).
74. Eurostat. HEDIC: Health Expenditures by Diseases and Conditions. 2016. https://ec.europa.eu/eurostat/documents/3888793/7605571/KS-TC-16-008-EN-N.pdf/6cb33aa4-2e65-4df7-9b2b-1ff171eb1fba?t=1473156921000 (21 October 2021, datelast accessed).
75. Health matters: preventing cardiovascular disease: GOV.UK Public Health England;2019. https://www.gov.uk/government/publications/health-matters-preventing-cardiovascular-disease/health-matters-preventing-cardiovascular-disease (21October 2021, date last accessed).
76. Améliorer la qualité du système de santé et maîtriserles dépenses-Propositionsdel’Assurance Maladie pour 2019: L’Assurance Maladie; 2021. https://www.vie-publique.fr/rapport/29982-ameliorer-la-qualite-du-systeme-de-sante-et-maitriser-les-depenses (21 October, 2021, date last accessed).
77. Zorguitgaven voor hart-en vaatziekten ruim 10miljard euro. Volksgezondheidenzorg.info.https://www.volksgezondheidenzorg.info/onderwerp/hart-en-vaatziekten/kosten/zorguitgaven#node-zorguitgaven-hart-en-vaatziekten-naar-sector (21 October2021, date last accessed).
78. World Health Organization. Prevention and control of noncommunicable diseases inArmenia. The case for investment: World Health Organization, UNDP, UNInteragency Task Force on NCDs; 2019. https://www.euro.who.int/__data/assets/pdf_file/0017/401273/BizzCase-ARM-web.pdf (21 October 2021, datelast accessed).
79. Eurostat. Healthcare expenditure statistics: statistics explained; 2021. Available at:https://ec.europa.eu/eurostat/statistics-explained/index.php?title=Healthcare_expenditure_statistics (21 October 2021, date last accessed).
80. Palmer KS, Agoritsas T, Martin D, Scott T, Mulla SM, Miller AP, et al.Activity-based funding of hospitals and its impact on mortality, readmission, dis-charge destination, severity of illness, and volume of care: a systematic reviewand meta-analysis. PLoS One 2014;9:e109975.
81. Xu K, Evans DB, Kawabata K, Zeramdini R, Klavus J, Murray CJL. Householdcatastrophic health expenditure: a multicountry analysis. Lancet 2003;362:111–117.
82. Goldfield N. The evolution of diagnosis-related groups (DRGs): from its begin-nings in case-mix and resource use theory, to its implementation for paymentand now for its current utilization for quality within and outside the hospital.Qual Manag Health Care 2010;19:3–16.
83. Brugger U, Bruegger U, Gesundheitspolitik Sf. Impact of DRGs: introducing a DRGreimbursement system : a literature review. Bern: SGGP, SchweizerischeGesellschaft fur Gesundheitspolitik; 2010.
84. Farrar S, Yi D, Sutton M, Chalkley M, Sussex J, Scott A. Has payment by resultsaffected the way that English hospitals provide care? Difference-in-differencesanalysis. BMJ 2009;339:b3047. http://www.bmj.com/content/339/bmj.b3047.abstract (21 October 2021, date last accessed).
85. Busse R, Geissler A, Aaviksoo A, Cots F, Hakkinen U, Kobel C, et al. Diagnosisrelated groups in Europe: moving towards transparency, efficiency, and quality inhospitals? Br Med J 2013;346:f3197. Available at: http://www.bmj.com/content/346/bmj.f3197.abstract (21 October 2021, date last accessed).
86. Dixon A, Robertson R, Bal R. The experience of implementing choice at point ofreferral: a comparison of the Netherlands and England. Health Econ Policy Law2010;5:295–317.
87. Fässler M, Wild V, Clarinval C, Tschopp A, Faehnrich JA, Biller-Andorno N.Impact of the DRG-based reimbursement system on patient care and profes-sional practise: perspectives of Swiss hospital physicians. Swiss Med Wkly 2015;145:w14080.
88. Lai H, Tang M-C. Hospital efficiency under global budgeting: evidence fromTaiwan. Empir Econ 2018;55:937–963..
89. World Health Organization. In: Mossialos E, Dixon A, Figueras J and Kutzin J, edi-tors. Funding health care: options for Europe. Published by Open University Press;2002. https://www.euro.who.int/en/publications/abstracts/funding-health-care-options-for-europe-2002
90. World Health Organization. In: Thomson S, Foubister T and Mossialos E, edi-tors. Financing health care in the European Union. 2009. https://www.euro.who.int/en/publications/abstracts/financing-health-care-in-the-european-union-2009
91. OECD. Country health profiles 2019. https://www.oecd.org/health/country-health-profiles-eu.htm
92. Khavjou O. Projections of cardiovascular disease prevalence and costs: 2015–2035.http://www.heart.org/idc/groups/ahaecc-public/@wcm/@global/documents/downloadable/ucm_491130.pdf (30 December 2021, date last accessed).
93. Bhatnagar A. Environmental determinants of cardiovascular disease. Circ Res2017;121:162–180.
94. Münzel T, Sørensen M, Gori T, Schmidt FP, Rao X, Brook J, et al. Environmentalstressors and cardio-metabolic disease: part I-epidemiologic evidence support-ing a role for noise and air pollution and effects of mitigation strategies. Eur HeartJ 2017;38:550–556.
95. Yusuf S, Hawken S, Ôunpuu S, Dans T, Avezum A, Lanas F, et al. Effect of poten-tially modifiable risk factors associated with myocardial infarction in 52 countries(the INTERHEART study): case–control study. Lancet 2004;364:937–952.
96. Moran AE, Forouzanfar MH, Roth GA, Mensah GA, Ezzati M, Murray CJL, et al.Temporal trends in ischemic heart disease mortality in 21 world regions, 1980
European Society of Cardiology 79D
ownloaded from
https://academic.oup.com
/eurheartj/advance-article/doi/10.1093/eurheartj/ehab892/6472699 by guest on 12 January 2022
https://ec.europa.eu/eurostat/statistics-explained/index.php?title=Healthcare_expenditure_statistics

to 2010: the Global Burden of Disease 2010 study. Circulation 2014;129:1483–1492.
97. Gaye B, Tajeu GS, Offredo L, Vignac M, Johnson S, Thomas F, et al. Temporaltrends of cardiovascular health factors among 366 270 French adults. EurHeart J Qual Care Clin Outcomes 2020;6:138–146.
98. Shah R, Wilkins E, Nichols M, Kelly P, El-Sadi F, Wright FL, et al. Epidemiologyreport: trends in sex-specific cerebrovascular disease mortality in Europe basedon WHO mortality data. Eur Heart J 2019;40:755–764.
99. Pencina MJ, Navar AM,Wojdyla D, Sanchez RJ, Khan I, Elassal J, et al.Quantifyingimportance of major risk factors for coronary heart disease. Circulation 2019;139:1603–1611.
100. Unal B, Critchley JA, Capewell S. Explaining the decline in coronary heart diseasemortality in England and Wales between 1981 and 2000. Circulation 2004;109:1101–1107.
101. Bhatnagar A. Environmental cardiology: studying mechanistic links between pol-lution and heart disease. Circ Res 2006;99:692–705.
102. European Environment Agency. Environmental noise in Europe – 2020. EEA ReportNo 22/2019. https://www.eea.europa.eu/publications/environmental-noise-in-europe (21 October 2021, date last accessed).
103. Patel JV, Vyas A, Cruickshank JK, Prabhakaran D, Hughes E, Reddy K, et al. Impactof migration on coronary heart disease risk factors: comparison of Gujaratis inBritain and their contemporaries in villages of origin in India. Atherosclerosis2006;185:297–306.
104. Hedlund E, Kaprio J, Lange A, KoskenvuoM, Jartti L, Rönnemaa T, et al.Migrationand coronary heart disease: a study of Finnish twins living in Sweden and theirco-twins residing in Finland. Scand J Public Health 2007;35:468–474.
105. WHO. Ambient air pollution: a global assessment of exposure and burden of disease.Geneva, Switzerland: World Health Organization; 2016.
106. Rafaj P, Kiesewetter G, Gül T, Schöpp W, Cofala J, Klimont Z, et al. Outlook forclean air in the context of sustainable development goals. Glob Environ Change2018;53:1–11.
107. European Commission. Environment: air quality standards. https://ec.europa.eu/environment/air/quality/standards.htm (21 October 2021, date last accessed).
108. Beelen R, Stafoggia M, Raaschou-Nielsen O, Andersen ZJ, Xun WW,Katsouyanni K, et al. Long-term exposure to air pollution and cardiovascularmortality: an analysis of 22 European cohorts. Epidemiology 2014;25:368–378.
109. Beelen R, Raaschou-Nielsen O, Stafoggia M, Andersen ZJ, Weinmayr G,Hoffmann B, et al. Effects of long-term exposure to air pollution on natural-causemortality: an analysis of 22 European cohorts within the multicentre ESCAPEproject. Lancet 2014;383:785–795.
110. Johnston FH, Hanigan IC, Henderson SB, Morgan GG. Evaluation of interven-tions to reduce air pollution from biomass smoke on mortality in Launceston,Australia: retrospective analysis of daily mortality, 1994–2007. BMJ 2013;346:e8446.
111. Künzli N, Jerrett M, Garcia-Esteban R, Basagaña X, Beckermann B, Gilliland F,et al. Ambient air pollution and the progression of atherosclerosis in adults.PLoS One 2010;5:e9096.
112. Tonne C, Melly S, Mittleman M, Coull B, Goldberg R, Schwartz J. A case–controlanalysis of exposure to traffic and acute myocardial infarction. Environ HealthPerspect 2007;115:53–7.
113. Hart JE, Chiuve SE, Laden F, Albert CM. Roadway proximity and risk of suddencardiac death in women. Circulation 2014;130:1474–1482.
114. Lelieveld J, Klingmüller K, Pozzer A, Pöschl U, Fnais M, Daiber A, et al.Cardiovascular disease burden from ambient air pollution in Europe reassessedusing novel hazard ratio functions. Eur Heart J 2019;40:1590–1596.
115. United Nations. Transforming our world: the 2030 agenda for sustainable develop-ment. New York: United Nations General Assembly; 2015.
116. World Health Organization: Ambient (outdoor) air pollution. 2021. https://www.who.int/news-room/fact-sheets/detail/ambient-(outdoor)-air-quality-and-health (21 October 2021, date last accessed).
117. Fact Sheets on the European Union. European Parliament Environment policy: gen-eral principles and basic framework. https://www.europarl.europa.eu/factsheets/en/sheet/71/environment-policy-general-principles-and-basic-framework (21October 2021, date last accessed).
118. Raza A, Bellander T, Bero-Bedada G, Dahlquist M, Hollenberg J, Jonsson M, et al.Short-term effects of air pollution on out-of-hospital cardiac arrest inStockholm. Eur Heart J 2014;35:861–868.
119. Mazidi M, Speakman JR. Impact of obesity and ozone on the association betweenparticulate air pollution and cardiovascular disease and stroke mortality amongUS adults. J Am Heart Assoc 2018;7:e008006.
120. Atkinson RW, Butland BK, Dimitroulopoulou C, Heal MR, Stedman JR, CarslawN, et al. Long-term exposure to ambient ozone and mortality: a quantitative sys-tematic review and meta-analysis of evidence from cohort studies. BMJ Open2016;6:e009493.
121. European Environment Agency. Noise pollution is a major problem, both for humanhealth and the environment. 2020. https://www.eea.europa.eu/articles/noise-pollution-is-a-major (21 October 2021, date last accessed).
122. European Environment Agency. Environmental noise 2018. https://www.eea.europa.eu/airs/2018/environment-and-health/environmental-noise (21 October2021, date last accessed).
123. Münzel T, Gori T, BabischW, Basner M. Cardiovascular effects of environmentalnoise exposure. Eur Heart J 2014;35:829–836.
124. Münzel T, Schmidt FP, Steven S, Herzog J, Daiber A, Sørensen M. Environmentalnoise and the cardiovascular system. J Am Coll Cardiol 2018;71:688–697.
125. BabischW. Updated exposure–response relationship between road traffic noiseand coronary heart diseases: a meta-analysis. Noise Health 2014;16:1–9.
126. Vienneau D, Schindler C, Perez L, Probst-Hensch N, Röösli M. The relationshipbetween transportation noise exposure and ischemic heart disease: ameta-analysis. Environ Res 2015;138:372–380.
127. Kupcikova Z, Fecht D, Ramakrishnan R, Clark C, Cai YS. Road traffic noise andcardiovascular disease risk factors in UK Biobank. Eur Heart J 2021;42:2072–2084.
128. Swinburn TK, Hammer MS, Neitzel RL. Valuing quiet: an economic assessmentof US environmental noise as a cardiovascular health hazard. Am J Prev Med 2015;49:345–353.
129. Roux AVD, Merkin SS, Arnett D, Chambless L, Massing M, Nieto FJ, et al.Neighborhood of residence and incidence of coronary heart disease. N Engl JMed 2001;345:99–106.
130. Winkleby M, Sundquist K, Cubbin C. Inequities in CHD incidence and case fatal-ity by neighborhood deprivation. Am J Prev Med 2007;32:97–106.
131. Sundquist K, Winkleby M, Ahlén H, Johansson SE. Neighborhood socioeco-nomic environment and incidence of coronary heart disease: a follow-up studyof 25,319 women and men in Sweden. Am J Epidemiol 2004;159:655–662.
132. Pujades-Rodriguez M, Timmis A, Stogiannis D, Rapsomaniki E, Denaxas S, ShahA, et al. Socioeconomic deprivation and the incidence of 12 cardiovascular dis-eases in 1.9 million women and men: implications for risk prediction and preven-tion. PLoS One 2014;9:e104671.
133. Piepoli MF, Hoes AW, Agewall S, Albus C, Brotons C, Catapano AL, et al.European guidelines on cardiovascular disease prevention in clinical practice:the Sixth Joint Task Force of the European Society of Cardiology and OtherSocieties on Cardiovascular Disease Prevention in Clinical Practice (constitutedby representatives of 10 societies and by invited experts) Developed with thespecial contribution of the European Association for CardiovascularPrevention & Rehabilitation (EACPR). Eur Heart J 2016;37:2315–2381.
134. Stampfer MJ, Hu FB, Manson JE, Rimm EB, Willett WC. Primary prevention ofcoronary heart disease in women through diet and lifestyle. N Engl J Med2000;343:16–22.
135. Akesson A, Weismayer C, Newby PK, Wolk A. Combined effect of low-riskdietary and lifestyle behaviors in primary prevention of myocardial infarctionin women. Arch Intern Med 2007;167:2122–2127.
136. Hackshaw A, Morris JK, Boniface S, Tang J-L, Milenkovic D. Low cigarette con-sumption and risk of coronary heart disease and stroke: meta-analysis of 141 co-hort studies in 55 study reports. BMJ 2018;360:j5855.
137. Whincup PH, Gilg JA, Emberson JR, Jarvis MJ, Feyerabend C, Bryant A, et al.Passive smoking and risk of coronary heart disease and stroke: prospective studywith cotinine measurement. BMJ 2004;329:200–205.
138. Iversen B, Jacobsen BK, Løchen M-L. Active and passive smoking and the risk ofmyocardial infarction in 24,968 men and women during 11 year of follow-up: theTromsø Study. Eur J Epidemiol 2013;28:659–667.
139. Duncan MS, Freiberg MS, Greevy RA Jr, Kundu S, Vasan RS, Tindle HA.Association of smoking cessation with subsequent risk of cardiovascular disease.JAMA 2019;322:642–650.
140. Boggon R, Timmis A, Hemingway H, Raju S, Malvestiti FM, Van Staa TP. Smokingcessation interventions following acute coronary syndrome: a missed opportu-nity? Eur J Prev Cardiol 2012;21:767–773.
141. Bhatnagar A. E-cigarettes and cardiovascular disease risk: evaluation of evidence,policy implications, and recommendations. Curr Cardiovasc Risk Rep 2016;10:24.
142. Krist AH, Davidson KW, Mangione CM, Barry MJ, Cabana M, Caughey AB, et al.Interventions for tobacco smoking cessation in adults, including pregnant per-sons: US Preventive Services Task Force recommendation statement. JAMA2021;325:265–279.
143. Patnode CD, Henderson JT, Coppola EL, Melnikow J, Durbin S, Thomas RG.Interventions for tobacco cessation in adults, including pregnant persons: up-dated evidence report and systematic review for the US preventive servicestask force. JAMA 2021;325:280–298.
144. Soneji S, Barrington-Trimis JL, Wills TA, Leventhal AM, Unger JB, Gibson LA,et al. Association between initial use of e-cigarettes and subsequent cigarettesmoking among adolescents and young adults: a systematic review andmeta-analysis. JAMA Pediatr 2017;171:788–797.
80 A. Timmis et al.D
ownloaded from
https://academic.oup.com
/eurheartj/advance-article/doi/10.1093/eurheartj/ehab892/6472699 by guest on 12 January 2022
145. European Commission: Eurostat. https://ec.europa.eu/eurostat/statistics-explained/index.php?title=Tobacco_consumption_statistics (16 August 2019,date last accessed).
146. Hoffman SJ, Tan C. Overview of systematic reviews on the health-related effectsof government tobacco control policies. BMC Public Health 2015;15:744.
147. Kalinowski A, Humphreys K. Governmental standard drink definitions and low-risk alcohol consumption guidelines in 37 countries. Addiction 2016;111:1293–1298.
148. Bell S, Daskalopoulou M, Rapsomaniki E, George J, Britton A, Bobak M, et al.Association between clinically recorded alcohol consumption and initial presen-tation of 12 cardiovascular diseases: population based cohort study using linkedhealth records. BMJ 2017;356:j909.
149. Wood AM, Kaptoge S, Butterworth AS, Willeit P, Warnakula S, Bolton T, et al.Risk thresholds for alcohol consumption: combined analysis of individual-participant data for 599 912 current drinkers in 83 prospective studies. Lancet2018;391:1513–1523.
150. Connor J, Hall W. Thresholds for safer alcohol use might need lowering. Lancet2018;391:1460–1461.
151. Stahre M, Roeber J, Kanny D, Brewer RD, Zhang X. Contribution of excessivealcohol consumption to deaths and years of potential life lost in the UnitedStates. Prev Chronic Dis 2014;11:E109.
152. World Health Organization – Regional Office for Europe. Alcohol use. https://www.euro.who.int/en/health-topics/disease-prevention/alcohol-use (21October 2021).
153. World Health Organization. Physical activity. https://www.who.int/health-topics/physical-activity#tab=tab_1 (21 October 2021, date last accessed).
154. Lee I-M, Shiroma EJ, Lobelo F, Puska P, Blair SN, Katzmarzyk PT. Effect of phy-sical inactivity on major non-communicable diseases worldwide: an analysis ofburden of disease and life expectancy. Lancet 2012;380:219–229.
155. Hamer M, O’Donovan G, Murphy M. Physical inactivity and the economic andhealth burdens due to cardiovascular disease: exercise as medicine. Adv ExpMed Biol 2017;999:3–18.
156. Li J, Siegrist J. Physical activity and risk of cardiovascular disease—a meta-analysisof prospective cohort studies. Int J Environ Res Public Health 2012;9:391–407.
157. Coenen P, Huysmans MA, Holtermann A, Krause N, van Mechelen W, StrakerLM, et al.Do highly physically active workers die early? A systematic review withmeta-analysis of data from 193 696 participants. Br J Sports Med 2018;52:1320–1326.
158. Qiu S, Cai X, Jia L, Sun Z, Wu T, Wendt J, et al.Does objectively-measured light-intensity physical activity reduce the risk of cardiovascular mortality? Ameta-analysis. Eur Heart J Qual Care Clin Outcomes 2021;7:496–504.
159. Lear SA, Hu W, Rangarajan S, Gasevic D, Leong D, Iqbal R, et al. The effect ofphysical activity on mortality and cardiovascular disease in 130 000 peoplefrom 17 high-income, middle-income, and low-income countries: the PUREstudy. Lancet 2017;390:2643–2654.
160. World Health Organization – Regional Office for Europe. Physical activity policy.https://www.euro.who.int/en/health-topics/disease-prevention/physical-activity/policy (21 October 2021, date last accessed).
161. Dai H, Much AA, Maor E, Asher E, Younis A, Xu Y, et al. Global, regional, andnational burden of ischemic heart disease and its attributable risk factors,1990–2017: results from the global Burden of Disease Study 2017. Eur Heart JQual Care Clin Outcomes 2020:qcaa076. 10.1093/ehjqcco/qcaa076
162. Meier T, Gräfe K, Senn F, Sur P, Stangl GI, Dawczynski C, et al. Cardiovascularmortality attributable to dietary risk factors in 51 countries in the WHOEuropean Region from 1990 to 2016: a systematic analysis of the GlobalBurden of Disease Study. Eur J Epidemiol 2019;34:37–55.
163. Yu E, Malik VS, Hu FB. Cardiovascular disease prevention by diet modification:JACC health promotion series. J Am Coll Cardiol 2018;72:914–926.
164. de Souza RJ, Mente A, Maroleanu A, Cozma AI, Ha V, Kishibe T, et al. Intake ofsaturated and trans unsaturated fatty acid and risk of all cause mortality, cardio-vascular disease, and type 2 diabetes: systematic review and meta-analysis of ob-servational studies. BMJ 2015;351:h3978.
165. Al-Shaar L, Satija A, Wang DD, Rimm EB, Smith-Warner SA, Stampfer MJ, et al.Red meat intake and risk of coronary heart disease among US men: prospectivecohort study. BMJ 2020;371:m4141.
166. Jakobsen MU, O’Reilly EJ, Heitmann BL, Pereira MA, Bälter K, Fraser GE, et al.Major types of dietary fat and risk of coronary heart disease: a pooled analysisof 11 cohort studies. Am J Clin Nutr 2009;89:1425–1432.
167. Estruch R, Ros E, Salas-Salvadó J, Covas M-I, Corella D, Arós F, et al. Primaryprevention of cardiovascular disease with a Mediterranean diet supplementedwith extra-virgin olive oil or nuts. N Engl J Med 2018;378:e34.
168. Welsh JA, Sharma A, Cunningham SA, Vos MB. Consumption of added sugarsand indicators of cardiovascular disease risk among US adolescents. Circulation2011;123:249–257.
169. Yang Q, Zhang Z, Gregg EW, Flanders WD, Merritt R, Hu FB. Added sugar in-take and cardiovascular diseases mortality among US adults. JAMA Intern Med2014;174:516–524.
170. Intersalt Cooperative Research Group. Intersalt: an international study of elec-trolyte excretion and blood pressure. Results for 24 hour urinary sodium andpotassium excretion. BMJ 1988;297:319–328.
171. Walkowska A, Kuczeriszka M, Sadowski J, Olszyñski KH, Dobrowolski L,Cervenka L, et al. High salt intake increases blood pressure in normal rats:putative role of 20-HETE and no evidence on changes in renal vascular reactivity.Kidney Blood Press Res 2015;40:323–334.
172. Powles J, Fahimi S, Micha R, Khatibzadeh S, Shi P, Ezzati M, et al. Global, regionaland national sodium intakes in 1990 and 2010: a systematic analysis of 24 h ur-inary sodium excretion and dietary surveys worldwide. BMJ Open 2013;3:e003733.
173. Huang L, Trieu K, Yoshimura S, Neal B, Woodward M, Campbell NRC, et al.Effect of dose and duration of reduction in dietary sodium on blood pressurelevels: systematic review and meta-analysis of randomised trials. BMJ 2020;368:m315.
174. Trieu K, Neal B, Hawkes C, Dunford E, Campbell N, Rodriguez-Fernandez R,et al. Salt reduction initiatives around the world—a systematic review of pro-gress towards the global target. PLoS One 2015;10:e0130247.
175. World Health Organization . Global strategy on diet, physical activity and health.https://www.who.int/publications/i/item/9241592222 (30 December 2021,date last accessed).
176. Aune D, Giovannucci E, Boffetta P, Fadnes LT, Keum N, Norat T, et al. Fruit andvegetable intake and the risk of cardiovascular disease, total cancer and all-causemortality—a systematic review and dose-response meta-analysis of prospectivestudies. Int J Epidemiol 2017;46:1029–1056.
177. Miller V, Mente A, Dehghan M, Rangarajan S, Zhang X, Swaminathan S, et al.Fruit, vegetable, and legume intake, and cardiovascular disease and deaths in18 countries (PURE): a prospective cohort study. Lancet 2017;39:2037–2049.
178. Wang DD, Li Y, Bhupathiraju SN, Rosner BA, Sun Q, Giovannucci EL, et al. Fruitand vegetable intake and mortality: results from 2 prospective cohort studies ofUS men and women and a meta-analysis of 26 cohort studies. Circulation 2021;143:1642–1654.
179. Mahmood SS, Levy D, Vasan RS, Wang TJ. The Framingham Heart Study and theepidemiology of cardiovascular disease: a historical perspective. Lancet 2014;383:999–1008.
180. Pencina MJ, Navar AM, Wojdyla D, Khan I, Elassal J, D’Agostino RB, et al.Quantifying importance of major risk factors for coronary heart disease.Circulation 2019;139:1603–1611.
181. Kotseva K, De Backer G, De Bacquer D, Rydén L, Hoes A, Grobbee D, et al.Primary prevention efforts are poorly developed in people at high cardiovascu-lar risk: a report from the European Society of Cardiology EURObservationalResearch Programme EUROASPIRE V survey in 16 European countries. Eur JPrev Cardiol 2021;28:370–379.
182. Global Burden of Metabolic Risk Factors for Chronic Diseases Collaboration.Cardiovascular disease, chronic kidney disease, and diabetes mortality burdenof cardiometabolic risk factors from 1980 to 2010: a comparative risk assess-ment. Lancet Diabetes Endocrinol 2014;2:634–647.
183. Lewington S, Clarke R, Qizilbash N, Peto R, Collins R, Prospective StudiesCollaboration. Age-specific relevance of usual blood pressure to vascular mor-tality: a meta-analysis of individual data for one million adults in 61 prospectivestudies. Lancet 2002;360:1903–1913.
184. Xie X, Atkins E, Lv J, Bennett A, Neal B, Ninomiya T, et al. Effects of intensiveblood pressure lowering on cardiovascular and renal outcomes: updated sys-tematic review and meta-analysis. Lancet 2016;387:435–443.
185. NCD Risk Factor Collaboration (NCD-RisC), Zhou B, Bentham J, Di Cesare M,Bixby H, Danaei G, et al. Worldwide trends in blood pressure from 1975 to2015: a pooled analysis of 1479 population-based measurement studies with19.1 million participants. Lancet 2017;389:37–55.
186. Ference BA, YooW, Alesh I, Mahajan N, Mirowska KK, Mewada A, et al. Effect oflong-term exposure to lower low-density lipoprotein cholesterol beginningearly in life on the risk of coronary heart disease: a Mendelian randomizationanalysis. J Am Coll Cardiol 2012;60:2631–2639.
187. Domanski MJ, Tian X, Wu CO, Reis JP, Dey AK, Gu Y, et al. Time course of LDLcholesterol exposure and cardiovascular disease event risk. J Am Coll Cardiol2020;76:1507–1516.
188. Sjouke B, Kusters DM, Kindt I, Besseling J, Defesche JC, Sijbrands EJG, et al.Homozygous autosomal dominant hypercholesterolaemia in the Netherlands:prevalence, genotype–phenotype relationship, and clinical outcome. Eur HeartJ 2015;36:560–565.
189. Cholesterol Treatment Trialists’ Collaboration, Mihaylova B, Emberson J,Blackwell L, Keech A, Simes J, et al. The effects of lowering LDL cholesterol
European Society of Cardiology 81D
ownloaded from
https://academic.oup.com
/eurheartj/advance-article/doi/10.1093/eurheartj/ehab892/6472699 by guest on 12 January 2022

with statin therapy in people at low risk of vascular disease: meta-analysis of in-dividual data from 27 randomised trials. Lancet 2012;380:581–590.
190. Cholesterol Treatment Trialists’ (CCT) Collaboration, Fulcher J, O’Connell R,Voysey M, Emberson J, Blackwell L, et al. Efficacy and safety of LDL-loweringtherapy among men and women: meta-analysis of individual data from174 000 participants in 27 randomised trials. Lancet 2015;385:1397–1405.
191. Silverman MG, Ference BA, Im K, Wiviott SD, Giugliano RP, Grundy SM, et al.Association between lowering LDL-C and cardiovascular risk reduction amongdifferent therapeutic interventions. A systematic review and meta-analysis. JAMA2016;316:1289–1297.
192. World Health Organization. Global Health Observatory (GHO) data. http://www.who.int/gho/ncd/risk_factors/cholesterol_prevalence/en/ (21 October 2021,date last accessed).
193. Lopez AD, Adair T. Is the long-term decline in cardiovascular-disease mortalityin high-income countries over? Evidence from national vital statistics. Int JEpidemiol 2019;48:1815–1823.
194. NCD Risk Factor Collaboration (NCD-RisC). Trends in adult body-mass indexin 200 countries from 1975 to 2014: a pooled analysis of 1698 population-basedmeasurement studies with 19.2 million participants. Lancet 2016;387:1377–1396.
195. Malik VS, Willet WC, Hu FB. Global obesity: trends, risk factors and policy im-plications. Nat Rev Endocrinol 2013;9:13–27.
196. Global BMI Mortality Collaboration, Di Angelantonio E, Bhupathiraju S,Wormser D, Gao P, Kaptoge S, et al. Body-mass index and all-cause mortality:individual-participant-data meta-analysis of 239 prospective studies in four con-tinents. Lancet 2016;388:776–786.
197. Wilding JPH, Batterham RL, Calanna S, Davies M, Van Gaal LF., Lingvay I, et al.Once-weekly semaglutide in adults with overweight or obesity. N Engl J Med2021;384:989–1002.
198. Moussa O, Ardissino M, Heaton T, Tang A, Khan O, Ziprin P, et al. Effect of bar-iatric surgery on long-term cardiovascular outcomes: a nationwide nested co-hort study. Eur Heart J 2020;41:2660–2667.
199. World Health Organization. Data and statistics. The challenge of diabetes. http://www.euro.who.int/en/health-topics/noncommunicable-diseases/diabetes/data-and-statistics (21 October 2021, date last accessed).
200. Chan M. Obesity and diabetes: the slow-motion disaster. Milbank Q 2017;95:11–14.
201. Bertoccini L, Baroni MG. GLP-1 receptor agonists and SGLT2 inhibitors for thetreatment of type 2 diabetes: new insights and opportunities for cardiovascularprotection. Adv Exp Med Biol 2021;1307:193–212.
202. Koliaki C, Liatis S, le Roux CW, Kokkinos A. The role of bariatric surgery to treatdiabetes: current challenges and perspectives. BMC Endocr Disord 2017;17:50.
203. KnowlerWC, Barrett-Connor E, Fowler SE, Hamman RF, Lachin JM,Walker EA,et al. Reduction in the incidence of type 2 diabetes with lifestyle intervention ormetformin. N Engl J Med 2002;346:393–403.
204. Powell LM, Chriqui JF, Khan T, Wada R, Chaloupka FJ. Assessing the potentialeffectiveness of food and beverage taxes and subsidies for improving publichealth: a systematic review of prices, demand and body weight outcomes.Obes Rev 2013;14:110–128.
205. Pell D, Mytton O, Penney TL, Briggs A, Cummins S, Penn-Jones C, et al. Changesin soft drinks purchased by British households associated with the UK soft drinksindustry levy: controlled interrupted time series analysis. BMJ 2021;372:n254.
206. World Health Organization.Tackling NCDs: ‘best buys’ and other recommended inter-ventions for the prevention and control of noncommunicable diseases. 2017. https://apps.who.int/iris/handle/10665/259232 (30 December 2021, date last accessed).
207. Pinho-Gomes AC, Peters SAE, Thomson B, Woodward M. Sex differences inprevalence, treatment and control of cardiovascular risk factors in England.Heart; https://doi.org/10.1136/heartjnl-2020-317446. Published online ahead ofprint 4 September 2020.
208. Kassebaum NJ, Arora M, Barber RM, Bhutta ZA, Brown J, Carter A, et al. Global,regional, and national disability-adjusted life-years (DALYs) for 315 diseases andinjuries and healthy life expectancy (HALE), 1990–2015: a systematic analysis forthe Global Burden of Disease Study 2015. Lancet 2016;388:1603–1658.
209. GBD 2017 Mortality Collaborators, Dicker D, Nguyen G, Abate D, Abate KH,Abay SM, et al. Global, regional, and national age-sex-specific mortality and lifeexpectancy, 1950–2017: a systematic analysis for the Global Burden of DiseaseStudy 2017. Lancet 2018;392:1684–1735.
210. GBD 2015 Maternal Mortality Collaborators. Kassebaum NJ, Barber RM, BhuttaZA, Dandona L, Gething PW, et al. Global, regional, and national levels of ma-ternal mortality, 1990–2015: a systematic analysis for the Global Burden ofDisease Study 2015. Lancet 2016;388:1775–1812.
211. Dicker D, Nguyen G, Lopez AD, Murray CJL. Another blow to credibility in pub-lished data sources – author’s reply. Lancet 2019;394:27–28.
212. Rigby M, Deshpande S, Blair M. Another blow to credibility in published datasources. Lancet 2019;394:26–27.
213. Institute for Health Metrics and Evaluation. Cardiovascular diseases—Level 2cause. http://www.healthdata.org/results/gbd_summaries/2019/cardiovascular-diseases-level-2-cause (21 October 2021, date last accessed).
214. World Health Organization Europe. Cardiovascular diseases. https://www.euro.who.int/en/health-topics/noncommunicable-diseases/cardiovascular-diseases(21 October 2021, date last accessed).
215. Institute for Health Metrics and Evaluation. Ischemic heart disease—Level 3 cause.http://www.healthdata.org/results/gbd_summaries/2019/ischemic-heart-disease-level-3-cause (21 October 2021, date last accessed).
216. Mensah GA. Ischaemic heart disease in Africa. Heart 2008;94:836–843.217. Institute for Health Metrics and Evaluation. Ischemic stroke—Level 4 cause. http://
www.healthdata.org/results/gbd_summaries/2019/ischemic-stroke-level-4-cause (21 October 2021, date last accessed).
218. Wilkins E, Wilson L, Wickramasinghe K, Bhatnagar P, Leal J, Luengo-FernandezR, et al. European Heart Network (EHN): European Cardiovascular Disease Statistics;2017. https://ehnheart.org/cvd-statistics/cvd-statistics-2017.html (21 October2021, date last accessed).
219. Wafa HA, Wolfe CDA, Emmett E, Roth GA, Johnson CO, Wang Y. Burden ofstroke in Europe: thirty-year projections of incidence, prevalence, deaths, anddisability-adjusted life years. Stroke 2020;51:2418–2427.
220. Norrving B, Barrick J, Davalos A, Dichgans M, Cordonnier C, Guekht A, et al.Action plan for stroke in Europe 2018–2030. Eur Stroke J 2018;3:309–336.
221. Institute for Health Metrics and Evaluation. Peripheral artery disease—Level 3cause. http://www.healthdata.org/results/gbd_summaries/2019/peripheral-artery-disease-level-3-cause (21 October 2021, date last accessed).
222. Sartipy F, Lundin F, Wahlberg E, Sigvant B. Cardiovascular long-term outcomeand prophylactic treatment patterns in peripheral arterial disease in apopulation-based cohort. Eur Heart J Qual Care Clin Outcomes 2019;5:310–320.
223. Norgren L, Hiatt WR, Dormandy JA, Nehler MR., Harris KA, Fowkes FGR.Inter-society consensus for the management of peripheral arterial disease(TASC II). J Vasc Surg 2007;45(Suppl S):S5–S67.
224. Institute for Health Metrics and Evaluation. Atrial fibrillation and flutter—Level 3cause. http://www.healthdata.org/results/gbd_summaries/2019/atrial-fibrillation-and-flutter-level-3-cause (21 October, 2021, date last accessed).
225. Dai H, Zhang Q, Much AA, Maor E, Segev A, Beinart R, et al. Global, regional,and national prevalence, incidence, mortality, and risk factors for atrial fibrilla-tion, 1990–2017: results from the Global Burden of Disease Study 2017. EurHeart J Qual Care Clin Outcomes 2021;7:574–582. (21 October 2021, date lastaccessed).
226. Thrall G, Lane D, Carroll D, Lip GYH. Quality of life in patients with atrial fib-rillation: a systematic review. Am J Med 2006;119:448.e1–448.e19.
227. Odutayo A, Wong CX, Hsiao AJ, Hopewell S, Altman DG, Emdin CA. Atrial fib-rillation and risks of cardiovascular disease, renal disease, and death: systematicreview and meta-analysis. BMJ 2016;354:i4482.
228. Rahman F, Kwan GF, Benjamin EJ. Global epidemiology of atrial fibrillation. NatRev Cardiol 2014;11:639–654.
229. Burdett P, Lip GYH. Atrial fibrillation in the United Kingdom: predicting costs ofan emerging epidemic recognising and forecasting the cost drivers of atrialfibrillation-related costs. Eur Heart J Qual Care Clin Outcomes 2020:qcaa093.Online ahead of print.
230. Institute for Health Metrics and Evaluation. Rheumatic heart disease—Level 3cause. http://www.healthdata.org/results/gbd_summaries/2019/rheumatic-heart-disease-level-3-cause (21 October 2021, date last accessed).
231. Noubiap JJ, Agbor VN, Bigna JJ, Kaze AD, Nyaga UF, Mayosi BM. Prevalence andprogression of rheumatic heart disease: a global systematic review andmeta-analysis of population-based echocardiographic studies. Sci Rep 2019;9:17022.
232. Remenyi B, Carapetis J, Wyber R, Taubert K, Mayosi BM. Position statement ofthe World Heart Federation on the prevention and control of rheumatic heartdisease. Nat Rev Cardiol 2013;10:284–292.
233. Institute for Health Metrics and Evaluation. Non-rheumatic calcific aortic valve dis-ease—Level 4 cause. http://www.healthdata.org/results/gbd_summaries/2019/non-rheumatic-calcific-aortic-valve-disease-level-4-cause (21 October 2021,date last accessed).
234. Osnabrugge RLJ, Mylotte D, Head SJ, Van Mieghem NM, Nkomo VT, LeReunCM, et al. Aortic stenosis in the elderly: disease prevalence and number of can-didates for transcatheter aortic valve replacement: a meta-analysis and modelingstudy. J Am Coll Cardiol 2013;62:1002–1012.
235. Danielsen R, Aspelund T, Harris TB, Gudnason V. The prevalence of aortic ste-nosis in the elderly in Iceland and predictions for the coming decades: theAGES-Reykjavík study. Int J Cardiol 2014;176:916–922.
236. Institute for Health Metrics and Evaluation. Measuring what matters: degenerativemitral valve disease. http://www.healthdata.org/results/gbd_summaries/2019/non-rheumatic-degenerative-mitral-valve-disease-level-4-cause (21 October2021, date last accessed).
82 A. Timmis et al.D
ownloaded from
https://academic.oup.com
/eurheartj/advance-article/doi/10.1093/eurheartj/ehab892/6472699 by guest on 12 January 2022
237. Andell P, Li X, Martinsson A, Andersson Ce, Stagmo M, Zöller B, et al.Epidemiology of valvular heart disease in a Swedish nationwide hospital-basedregister study. Heart 2017;103:1696–1703.
238. Iung B, Baron G, Butchart EG, Delahaye F, Gohlke-Bärwolf C, Levang OW, et al.A prospective survey of patients with valvular heart disease in Europe: the EuroHeart Survey on Valvular Heart Disease. Eur Heart J 2003;24:1231–1243.
239. Monteagudo Ruiz JM, Galderisi M, Buonauro A, Badano L, Aruta P, Swaans MJ,et al. Overview of mitral regurgitation in Europe: results from the EuropeanRegistry of mitral regurgitation (EuMiClip). Eur Heart J Cardiovasc Imaging2018;19:503–507.
240. Prakash R, Horsfall M, Markwick A, Pumar M, Lee L, Sinhal A, et al. Prognosticimpact of moderate or severe mitral regurgitation (MR) irrespective of concomi-tant comorbidities: a retrospective matched cohort study. BMJ Open 2014;4:e004984.
241. Shapira OM, Kelleher RM, Zelingher J, Whalen D, Fitzgerald C, Aldea GS, et al.Prognosis and quality of life after valve surgery in patients older than 75 years.Chest 1997;112:885–894.
242. Ussia GP, Cammalleri V, Sarkar K, Scandura S, Imm S, Pistritto AM, et al. Qualityof life following percutaneous mitral valve repair with the MitraClip System. Int JCardiol 2012;155:194–200.
243. Whitlow PL, Feldman T, Pedersen WR, Lim DS, Kipperman R, Smalling R, et al.Acute and 12-month results with catheter-based mitral valve leaflet repair: theEVEREST II (Endovascular Valve Edge-to-Edge Repair) High Risk Study. J Am CollCardiol 2012;59:130–139.
244. Gräsner J-T, Herlitz J, Tjelmeland IBM, Wnent J, Masterson S, Lilja G, et al.European Resuscitation Council Guidelines 2021: epidemiology of cardiac arrestin Europe. Resuscitation 2021;161:61–79.
245. Kiguchi T, Okubo M, Nishiyama C, Maconochie Ian, Ong MEH, Kern KB, et al.Out-of-hospital cardiac arrest across the World: first report from theInternational Liaison Committee on Resuscitation (ILCOR). Resuscitation 2020;152:39–49.
246. Berdowski J, Berg RA, Tijssen JGP, Koster RW. Global incidences ofout-of-hospital cardiac arrest and survival rates: systematic review of 67 pro-spective studies. Resuscitation 2010;81:1479–1487.
247. Myat A, Song KJ, Rea T. Out-of-hospital cardiac arrest: current concepts. Lancet2018;391:970–979.
248. Becker L, Gold LS, Eisenberg M, White L, Hearne T, Rea T. Ventricular fibrilla-tion in King County, Washington: a 30-year perspective. Resuscitation 2008;79:22–27.
249. Bunch TJ, White RD, Gersh BJ, Meverden RA, Hodge DO, Ballman KV, et al.Long-term outcomes of out-of-hospital cardiac arrest after successful early de-fibrillation. N Engl J Med 2003;348:2626–2633.
250. de Vreede-Swagemakers JJM, Gorgels APM, Dubois-Arbouw WI, Dalstra J,Daemen MJ, van Ree JW, et al. Circumstances and causes of out-of-hospital car-diac arrest in sudden death survivors. Heart 1998;79:356–361.
251. Gräsner J-T, Wnent J, Herlitz J, Perkins GD, Lefering R, Tjelmeland I, et al.Survival after out-of-hospital cardiac arrest in Europe – results of the EuReCaTWO study. Resuscitation 2020;148:218–226.
252. von Kappelgaard L, Gislason G, Davidsen M, Zwisler AD, Juel K. Temporaltrends and socioeconomic differences in the incidence of left-sided valvularheart disease in Denmark. Eur Heart J Qual Care Clin Outcomes 2021;7:608–615.
253. Cowan JC, Wu J, Hall M, Orlowski A, West RM, Gale CP. A 10 year study ofhospitalized atrial fibrillation-related stroke in England and its association withuptake of oral anticoagulation. Eur Heart J 2018;39:2975–2983.
254. Abouzahr C, Mikkelsen L, Rampatige R, Lopez A. Mortality statistics: a tool toenhance understanding and improve quality. Pac Health Dialog 2012;18:247–270.
255. Bhalla K, Harrison JE, Shahraz S, Fingerhut LA, Global Burden of Disease InjuryExpert Group. Availability and quality of cause-of-death data for estimating theglobal burden of injuries. Bull World Health Organ 2010;88:831–838C.
256. Mathers C, Stevens G, Hogan D, Mahanani WR, Ho J. Chapter 4. Global and re-gional causes of death: patterns and trends, 2000–15. In: DT Jamison, H Gelband,S Horton, eds. Disease Control Priorities: Improving Health and Reducing Poverty. 3rded. Washington, DC: The International Bank for Reconstruction andDevelopment /The World Bank; 2017.
257. Nichols M, Townsend N, Scarborough P, Rayner M. Trends in age-specific cor-onary heart disease mortality in the European Union over three decades: 1980–2009. Eur Heart J 2013;34:3017–3027.
258. Shah R, Wilkins E, Nichols M, Kelly P, El-Sadi F, Wright FL, et al. Epidemiologyreport: trends in sex-specific cerebrovascular disease mortality in Europe basedon WHO mortality data. Eur Heart J 2019;40:755–764.
259. Townsend N, Wilson L, Bhatnagar P, Wickramasinghe K, Rayner M, Nichols M.Cardiovascular disease in Europe: epidemiological update 2016. Eur Heart J2016;37:3232–3245.
260. Jaul E, Barron J. Age-related diseases and clinical and public health implicationsfor the 85 years old and over population. Front Public Health 2017;5:335.
261. Cao B, Bray F, Ilbawi A, Soerjomataram I. Effect on longevity of one-third reduc-tion in premature mortality from non-communicable diseases by 2030: a globalanalysis of the Sustainable Development Goal health target. Lancet Glob Health2018;6:e1288–e1296.
262. Bhatnagar P, Wickramasinghe K,Wilkins E, Townsend N. Trends in the epidemi-ology of cardiovascular disease in the UK. Heart 2016;102:1945–1952.
263. World Health Organization. NCD Global Monitoring Framework Ensuring progresson noncommunicable diseases in countries. 2020. https://www.who.int/teams/ncds/surveillance/monitoring-capacity/gmf (21 October 2021, date last accessed).
264. Gardner JW, Sanborn JS. Years of potential life lost (YPLL) – what does it mea-sure? Epidemiology 1990;1:322–329.
265. Coggan D, Barker D, Rose G. Epidemiology for the Uninitiated. 5th edn. BritishMedical Journal Books; 2009.
266. Tadayon S,Wickramasinghe K, Townsend N. Examining trends in cardiovasculardisease mortality across Europe: how does the introduction of a new EuropeanStandard Population affect the description of the relative burden of cardiovascu-lar disease? Popul Health Metr 2019;17:6.
267. Pace M, Lanzieri G, Glickman M, Grande E, Zupanic T, Wojtyniak B, et al. Revisionof the European Standard Population Report of Eurostat’s task force, 2013 edition.2013. Eurostat Methodologies and Working papers. https://ec.europa.eu/eurostat/documents/3859598/5926869/KS-RA-13-028-EN.PDF.pdf/e713fa79-1add-44e8-b23d-5e8fa09b3f8f?t=1414782757000 (21 October 2021, date lastaccessed).
268. Garcia M, Mulvagh SL, Merz CNB, Buring JE, Manson JE. Cardiovascular diseasein women: clinical perspectives. Circ Res 2016;118:1273–1293.
269. O’Flaherty M, Buchan I, Capewell S. Contributions of treatment and lifestyle todeclining CVD mortality: why have CVD mortality rates declined so much sincethe 1960s? Heart 2013;99:159–162.
270. Nishiga M, Wang DW, Han Y, Lewis DB, Wu JC. COVID-19 and cardiovasculardisease: from basic mechanisms to clinical perspectives. Nat Rev Cardiol 2021;17:543–558. (21 October 2021, date last accessed).
271. Worldwide spending on healthcare. Emergo by UL. https://www.emergobyul.com/resources/worldwide-health-expenditures (21 October 2021, date lastaccessed).
272. Jayawardana S, Cylus J, Mossialos E. It’s not ageing, stupid: why population ageingwon’t bankrupt health systems. Eur Heart J Qual Care Clin Outcomes 2019;5:195–201.
273. Moledina SM, Shoaib A, Graham MM, Biondi-Zoccai G, Van Spall HGC,Kontopantelis E, et al. Association of admitting physician specialty and care qual-ity and outcomes in non-ST-segment elevation myocardial infarction (NSTEMI):insights from a national registry. Eur Heart J Qual Care Clin Outcomes 2021:qcab038.
274. NICE quality standard 9. Chronic heart failure in adults. Quality standard [QS9].Issued: 29 June 2011. https://www.nice.org.uk/guidance/qs9 (21 October 2021,date last accessed).
275. Schiele F, Gale CP, Bonnefoy E, Capuano F, Claeys MJ, Danchin N, et al. Qualityindicators for acute myocardial infarction: a position paper of the AcuteCardiovascular Care Association. Eur Heart J Acute Cardiovasc Care 2017;6:34–59.
276. Bebb O, Hall M, Fox KAA, Dondo TB, Timmis A, Bueno H, et al. Performance ofhospitals according to the ESC ACCA quality indicators and 30-day mortality foracute myocardial infarction: national cohort study using the United KingdomMyocardial Ischaemia National Audit Project (MINAP) register. Eur Heart J2017;38:974–982.
277. Timmis AD, Baker C, Banerjee S, Calver AL, Dornhorst A, English KM, et al.Women in UK cardiology: report of a Working Group of the British CardiacSociety. Heart 2005;91:283–289.
278. Jaijee SK, Kamau-Mitchell C, Mikhail GW, Hendry C. Sexism experienced byconsultant cardiologists in the United Kingdom. Heart 2021;107:895–901.
279. Doris MK, Newby DE. How should CT coronary angiography be integrated intothe management of patients with chest pain and how does this affect outcomes?Eur Heart J Qual Care Clin Outcomes 2016;2:72–80.
280. Patel MR, Peterson ED, Dai D, Brennan JM, Redberg RF, Anderson HV, et al. Lowdiagnostic yield of elective coronary angiography. N Engl J Med 2010;362:886–895.
281. Boden WE, O’Rourke RA, Teo KK, Hartigan PM, Maron DJ, Kostuk WJ, et al.Optimal medical therapy with or without PCI for stable coronary disease. NEngl J Med 2007;356:1503–1516.
282. Keeley EC, Boura JA, Grines CL. Primary angioplasty versus intravenous throm-bolytic therapy for acute myocardial infarction: a quantitative review of 23 ran-domised trials. Lancet 2003;361:13–20.
283. Georgiadou P, Kontodima P, Sbarouni E, Karavolias GK, Smirli A, Xanthos T,et al. Long-term quality of life improvement after transcatheter aortic valve im-plantation. Am Heart J 2011;162:232–237.
European Society of Cardiology 83D
ownloaded from
https://academic.oup.com
/eurheartj/advance-article/doi/10.1093/eurheartj/ehab892/6472699 by guest on 12 January 2022
284. Leon MB, Smith CR, Mack M, Miller DC, Moses JW, Svensson LG, et al.Transcatheter aortic-valve implantation for aortic stenosis in patients who can-not undergo surgery. N Engl J Med 2010;363:1597–1607.
285. Yusuf S, Zucker D, Peduzzi P, Fisher LD, Takaro T, Kennedy JW, et al. Effect ofcoronary artery bypass graft surgery on survival: overview of 10-year resultsfrom randomised trials by the Coronary Artery Bypass Graft Surgery TrialistsCollaboration. Lancet 1994;344:563–570.
286. Velazquez EJ, Lee KL, Jones RH, Al-Khalidi HR, Hill JA, Panza JA, et al.Coronary-artery bypass surgery in patients with ischemic cardiomyopathy. NEngl J Med 2016;374:1511–1520.
287. Farkouh ME, Domanski M, Sleeper LA, Siami FS, Dangas G, Mack M, et al.Strategies for multivessel revascularization in patients with diabetes. N Engl JMed 2012;367:2375–2384.
288. Verma S, Farkouh ME, Yanagawa B, Fitchett DH, Ahsan MR, Ruel M, et al.Comparison of coronary artery bypass surgery and percutaneous coronary in-tervention in patients with diabetes: a meta-analysis of randomised controlledtrials. Lancet Diabetes Endocrinol 2013;1:317–328.
289. Lund LH, Edwards LB, Kucheryavaya AY, Benden C, Christie JD., Dipchand AI,et al. The registry of the International Society for Heart and LungTransplantation: thirty-first official adult heart transplant report – 2014; focustheme: retransplantation. J Heart Lung Transplant 2014;33:996–1008.
290. Hemingway H, Croft P, Perel P, Hayden JA, Abrams K, Timmis A, et al. Prognosisresearch strategy (PROGRESS) 1: a framework for researching clinical out-comes. BMJ 2013;346:e5595.
291. Ko DT, Wang Y, Alter DA, Curtis JP, Rathore SS, Stukel TA, et al. Regional var-iation in cardiac catheterization appropriateness and baseline risk after acutemyocardial infarction. J Am Coll Cardiol 2008;51:716–723.
292. Doherty JU, Kort S, Mehran R, Schoenhagen P, Soman P, Dehmer GJ, et al. ACC/AATS/AHA/ASE/ASNC/HRS/SCAI/SCCT/SCMR/STS 2019 appropriate use cri-teria for multimodality imaging in the assessment of cardiac structure and func-tion in nonvalvular heart disease: a Report of the American College ofCardiology Appropriate Use Criteria Task Force, American Association forThoracic Surgery, American Heart Association, American Society ofEchocardiography, American Society of Nuclear Cardiology, Heart RhythmSociety, Society for Cardiovascular Angiography and Interventions, Society ofCardiovascular Computed Tomography, Society for Cardiovascular MagneticResonance, and the Society of Thoracic Surgeons. J Am Coll Cardiol 2019;73:488–516.
293. Patel MR, Calhoon JH, Dehmer GJ, Grantham JA, Maddox TM, Maron DJ, et al.ACC/AATS/AHA/ASE/ASNC/SCAI/SCCT/STS 2017 appropriate use criteriafor coronary revascularization in patients with stable ischemic heart disease: areport of the American College of Cardiology Appropriate Use Criteria TaskForce, American Association for Thoracic Surgery, American HeartAssociation, American Society of Echocardiography, American Society ofNuclear Cardiology, Society for Cardiovascular Angiography andInterventions, Society of Cardiovascular Computed Tomography, and Societyof Thoracic Surgeons. J Am Coll Cardiol 2017;69:2212–2241.
294. Wolk MJ, Bailey SR, Doherty JU, Douglas PS, Hendel RC, Kramer CM, et al.ACCF/AHA/ASE/ASNC/HFSA/HRS/SCAI/SCCT/SCMR/STS 2013 multimodal-ity appropriate use criteria for the detection and risk assessment of stable is-chemic heart disease: a report of the American College of CardiologyFoundation Appropriate Use Criteria Task Force, American HeartAssociation, American Society of Echocardiography, American Society ofNuclear Cardiology, Heart Failure Society of America, Heart Rhythm Society,Society for Cardiovascular Angiography and Interventions, Society ofCardiovascular Computed Tomography, Society for Cardiovascular Magnetic
Resonance, and Society of Thoracic Surgeons. Multimodality Writing Groupfor Stable Ischemic Heart Disease. J Nucl Cardiol 2014;21:192–220.
295. European Network For Health Technology Assessment. https://eunethta.eu (21October 2021, date last accessed).
296. Cookson R, Doran T, Asaria M, Gupta I, Mujica FP. The inverse care law re-examined: a global perspective. Lancet 2021;397:828–838.
297. Smolina K, Wright FL, Rayner M, Goldacre MJ. Determinants of the decline inmortality from acute myocardial infarction in England between 2002 and2010: linked national database study. BMJ 2012;344:d8059.
298. World Health Organization. Noncommunicable diseases: key facts. 2021. https://www.who.int/news-room/fact-sheets/detail/noncommunicable-diseases (21October 2021, date last accessed).
299. World Health Organization. Global action plan for the prevention and control ofNCDs 2013–2020. 2013. https://www.who.int/publications/i/item/9789241506236 (21 October 2021, date last accessed).
300. Ahmad FB, Anderson RN. The leading causes of death in the US for 2020. JAMA2021;325:1829–1830.
301. McClellan M, Brown N, Califf RM, Warner JJ. Call to action: urgent challenges incardiovascular disease: a presidential advisory from the American heart associ-ation. Circulation 2019;139:e44–e54.
302. Virani SS, Alonso A, Benjamin EJ, Bittencourt MS, Callaway CW, Carson AP,et al. Heart disease and stroke statistics-2020 update: a report from theAmerican Heart Association. Circulation 2020;141:e139–e596.
303. OECD/European Union. Health at a glance: Europe 2020: state of health in the EUcycle, trends in life expectancy: OECD Publishing Paris. (21: October 2021, datelast accessed).
304. Gooding HC, Brown CA, Liu J, Revette AC, Stamoulis C, de Ferranti SD, et al.Will teens go red? Low cardiovascular disease awareness among young women.J Am Heart Assoc 2019;8:e011195.
305. Cushman M, Shay CM, Howard VJ, Jiménez MC, Lewey J, McSweeney JC, et al.Ten-year differences in women’s awareness related to coronary heart disease:results of the 2019 American Heart Association National Survey: a SpecialReport From the American Heart Association. Circulation 2021;143:e239–e248.
306. Heron M. Deaths: leading causes for 2017. National Vitals Statistics Report, Vol. 68,No 6. Hyattsville, MD: National Center for Health Statistics 2019. https://www.cdc.gov/nchs/data/nvsr/nvsr68/nvsr68_06-508.pdf (21 October 2021, date lastaccessed).
307. Luengo-Fernandez R, Leal J, Gray A. UK research spend in 2008 and 2012: com-paring stroke, cancer, coronary heart disease and dementia. BMJ Open 2015;5:e006648.
308. Krone M, Dufner V, Wagner M, Gelbrich G, Ertl G, Heuschmann PU. Publicfunding for medical research in relation to the burden of disease caused by car-diovascular diseases and neoplasms in Germany. Clin Res Cardiol 2018;107:737–744.
309. Pearson J, Sipido KR, Musialek P, van Gilst WH. The cardiovascular researchcommunity calls for action to address the growing burden of cardiovascular dis-ease. Cardiovasc Res 2019;115:e96–e98.
310. Meyers DE, Jenei K, Chisamore TM, Gyawali B. Evaluation of the clinical benefitof cancer drugs submitted for reimbursement recommendation decisions inCanada. JAMA Intern Med 2021;181:499–508.
311. Cherla A, Naci H, Kesselheim AS, Gyawali B, Mossialos E. Assessment of cover-age in England of cancer drugs qualifying for US food and drug administrationaccelerated approval. JAMA Intern Med 2021;181:490–498.
312. Pinto F, Fraser AG, Kautzner J, Kreutzer K, Piat S, Siebert M, et al. Barriers tocardiovascular device innovation in Europe. Eur Heart J 2016;37:140–144.
84 A. Timmis et al.D
ownloaded from
https://academic.oup.com
/eurheartj/advance-article/doi/10.1093/eurheartj/ehab892/6472699 by guest on 12 January 2022