Evaluation and impact assessment for amending Regulation ...
40
Evaluation and impact assessment for amending Regulation (EU) No 517/2014 on fluorinated green- house gases Briefing paper for the stakeholder workshop: Preliminary findings 6 May 2021
-
Upload
khangminh22 -
Category
Documents
-
view
1 -
download
0
Transcript of Evaluation and impact assessment for amending Regulation ...
Evaluation and impact assessment for amending
Regulation (EU) No 517/2014 on fluorinated green-
house gases
Briefing paper for the stakeholder workshop: Preliminary findings
6 May 2021
2
Table of contents
1 Introduction ................................................................................................................................... 3
1.1 Background of the study supporting the Commission’s F-gas review .................................. 3
1.2 This Briefing Paper ................................................................................................................ 3
2 Performance of the Regulation to date ....................................................................................... 4
2.1 Approach to the evaluation and methodology....................................................................... 4
2.2 Key findings under each evaluation criteria .......................................................................... 4
3 Review of the Regulation ........................................................................................................... 15
3.1 Objectives and envisaged policy options for amending the Regulation ............................. 15
3.2 Impact assessment of envisaged policy options – preliminary results ............................... 16
Annexes ............................................................................................................................................... 27
(1) List of policy options for further assessment of impacts ..................................................... 27
(2) Share of F-gases in new equipment in the maximum substitution scenario ....................... 31
(3) Short description of the bottom-up model (AnaFgas) ......................................................... 33
(4) Administrative and compliance costs incurred by companies ............................................ 36
3
1 Introduction
1.1 Background of the study supporting the Commission’s F-gas review
The F-gas Regulation (EU) No 517/2014 (hereinafter the “Regulation”) preceded the passing of the
Paris Climate Agreement as well as the Kigali Amendment to the Montreal Protocol on substances that
deplete the ozone layer, where Parties agreed to limit progressively the production and consumption of
HFCs. More recently, the Commission adopted the European Green Deal Communication and the Eu-
ropean Parliament, and the Council reached an agreement on a European Climate Law establishing
the framework for achieving the objective of climate neutrality by 2050 and reducing greenhouse gas
emissions by at least 55 % by 2030 compared to 1990. Ambitious action to avoid emissions of F-gases,
which generally have very high global warming potentials (GWP), is important for achieving these ob-
jectives.
The Commission therefore decided to review the Regulation by the end of 2021 and started an evalu-
ation of the current Regulation and an impact assessment of the potential policy options to ensure that
the Regulation remains fit for purpose in light of the new EU climate objectives and that it can safeguard
long-term compliance with the Montreal Protocol. Furthermore, there are a number of implementation
challenges that need to be addressed with a sense of urgency as well as opportunities to improve clarity
and coherence with other policies.
1.2 This Briefing Paper
The Commission launched a study to provide input to its evaluation and impact assessment and the
purpose of this Briefing Paper is to:
• Provide the main findings from the study to support the evaluation of the Regulation;
• Present the objectives for the revision of the Regulation and envisaged policy options;
• Present the approach to assess the impacts of envisaged policy options for amending the
Regulation;
• Provide the preliminary findings of assessing the environmental, economic and social impacts
of envisaged policy options.
The Briefing Paper has been prepared to provide stakeholders with some insights ahead of the work-
shop on 6 May 2021 to enable greater feedback on the day. Further details will be presented at the
workshop together with the existence of data gaps and where additional input would be particularly
useful. The feedback received will be incorporated into the study supporting the Commission’s report
on the evaluation and impact assessment for amending the Regulation.
4
2 Performance of the Regulation to date
2.1 Approach to the evaluation and methodology
The evaluation of the Regulation appraises its functioning to help assess whether the instrument is fit
for purpose against five key evaluation criteria:
• Effectiveness: How successful has EU action been in achieving or progressing towards the
original objectives of the intervention?
• Efficiency: How proportionate have the benefits of the Regulation been to the costs?
• Relevance: Are the original objectives of the intervention still representative of the current
needs of society?
• Coherence: Are there any internal gaps, overlaps, inconsistencies or complementarities
within the F-gas policy framework but also externally with other EU/international policies?
• EU added value: Has the implementation of the Regulation at EU level exceeded the value
which could have been achieved at Member State level?
The evaluation has covered all elements of the Regulation and supporting Implementing Regulations,
and covers the period from 2015 to 2020 (or year for which latest data is available). The process of
evidence gathering involved literature research, stakeholder consultation and modelling. With respect
to stakeholder engagement: An open public consultation (OPC) was held from September to December
2020 and provided the possibility for anyone to provide input to the study; targeted interviews were
performed from January to March 2021 to gather in-depth insights from key stakeholders. And the up-
coming stakeholder workshop will complement these activities.
2.2 Key findings under each evaluation criteria
2.2.1 Effectiveness
Overall findings: The Regulation has been mostly effective in meeting its original objectives and
the individual measures were found to work together to meet the objectives. The effectiveness
of the Regulation as a whole would have been impacted if one or more of the measures had not
been included. That said, forward modelling indicates that the original climate goals set for 2030
may not be fully reached. In addition, there are a few challenges such the continued use of some
high global warming potential (GWP) F-gases in some sectors where this could be avoided, the
occurrence of illegal trade and the multiplication of bulk importers.
The overall objective of the Regulation was to provide a cost-efficient contribution to reach the EU’s
previous climate targets, i.e. to reach at least a 40% emission reduction by 2030 and an 80% reduction
by 2050. To facilitate this, the Regulation targeted four objectives. The degree to which these four ob-
jectives were met is summarised below.
Objective 1: Discourage the use of F-gases with high GWP in the EU and encourage the use of
alternative substances or technologies when they result in lower GHG emissions without com-
promising safety, functionality and energy efficiency
Use and replacement of HFCs
The supply of hydrofluorocarbons (HFCs) has declined by 37% in tonnes and 47% in terms of CO2
equivalents from 2015 until 2019. In contrast, the supply of unsaturated HFCs and HCFCs (synthetic
alternatives to HFCs with very low climate impact) has grown to about 18 000 tonnes in 2019, reflecting
the role of these substances as HFC substitutes. A significant share of the decline in HFC supply was
5
due to a lower use of a few key high GWP HFCs and HFC mixtures (R134a, R404A and R410A). While
the amounts of HFCs contained in imported products and equipment have remained rather constant
since 2016, the GWP of these HFCs dropped by 33 % until 2019. As regards the gases exempted from
the phase-down, the HFCs amounts in CO2 equivalents for the use of metered dose inhalers (MDIs)
increased by about 45% in that period.
There has been a shift to F-gas alternatives with lower GWP as well as natural alternatives, as demon-
strated by the annual decline in CO2 equivalents as of 2016. For the users, natural refrigerants such as
CO2, propane and ammonia have the advantage that they are not restricted in any way under the Reg-
ulation. However, there has also been a shift to lower GWP HFCs and mixtures containing HFCs and
unsaturated HFCs (e.g. from R410A to R32 in split air conditioning systems; from R404A partly to
R448A/R449A in commercial refrigeration). Transition is also going on in all other HFC using sectors.
The HFC phase-down has also influenced the reclamation of F-gases in the EU, resulting in a low, but
steady increase of these activities.
The most important measures for meeting this objective are the HFC phase-down as well as placing on
the market (POM) and use prohibitions that have worked together to discourage the use of F-gases
with high GWP.
By design, the HFC phase-down restricts supply which implies price increases for HFCs. Prices of high
GWP HFCs increased significantly in mid-2017 and early 2018 until reaching a peak of 6 to 13 times
higher than the original price in 2015. These observed price increases for the different HFCs roughly
reflected their GWP and were passed on from the upper to the lower levels of the refrigerant supply
chain. Prices of high GWP HFCs today (4th quarter 2020) continue to be 0.5-4 times (gas distributor
purchase prices in 2020, depending on the HFC) higher than the world market and therefore continue
to be an incentive for innovation. In contrast, prices for alternatives that are not covered by the phase-
down have remained rather stable and natural alternatives have not seen any price increases which
has made climate-friendly technologies more competitive.
The POM and use prohibitions were implemented successfully and have been observed to be effective.
According to Article 19 F-gas reporting data, supply and/or equipment imports for respective applica-
tions have declined reflecting the implementation of these measures. This is partly related to the fact
that the prohibitions have been easily understood by industry and end-users. For fire protection and
technical aerosols, prohibition dates already passed. For moveable and split air conditioning systems
as well as foam products, the implementation is found to be on track while the prohibition dates are still
in the future. On the other hand, there has been technological process in certain areas that are not
covered by prohibitions Also, some emissive types of uses were not considered during the review of
the previous Regulation, e.g. uses of HFCs for cooling skin in beauty clinics and in inhalation anaes-
thetics.
While demand and thus emissions of F-gases are declining, forward modelling indicates that the 2030
goals set for the Regulation may not be fully reached by the current Regulation (see p.17ff).
While the extensive shift to climate-friendly technologies clearly demonstrates the effectiveness of the
phase-down with accompanying prohibitions, there are also a number of challenges. First there are
unjustified barriers to the use of climate-friendly alternatives that relate to safety codes that have not be
updated in line with technological progress. Second, an insufficient number of service personnel quali-
fied to install equipment with climate-friendly alternatives may have reduced the uptake of such tech-
nologies. Third, there is evidence of imports of HFCs outside the quota system although it is not feasible
to provide an accurate estimate of the extent of these illegal activities. A number of actions to prevent
the latter activities are ongoing, including by industry itself, but there is also scope for changes to the
Regulation to better facilitate enforcement and border controls.
6
Fourth, some company owners with several affiliates (including actors setting up and registering multi-
ple companies), benefit disproportionately from the reserve1 by getting multiple quota shares. As a
consequence, the number of bulk importers increased by a factor of more than twenty between 2012
and 2019. The Commission adopted an Implementing Regulation2 in 2019 that clarified the quota allo-
cation rules in accordance with the F-gas Regulation which resulted in a decrease in the number of
applications for quota from the new entrant reserve for 2020 and 2021. Still, there appears to be a large
number of quota holders with no apparent link to the F-gas business. This results in very low quota
shares from the reserve to the real F-gas traders. Also, it makes it more challenging to prevent illegal
imports.
While substances replacing HFCs generally have a negligible GWP, and thus contribute to climate
change mitigation, for a few of the replacement substances there may be some undesirable environ-
mental effects that require further monitoring. This relates to the generation of environmentally persis-
tent and accumulative trifluoroacetic acid (TFA) as a breakdown product of unsaturated HFCs in the
atmosphere and its subsequent accumulation in the aqueous environment. These alternative sub-
stances, listed in Annex II of the Regulation, are currently not covered by measures aiming at preventing
their emissions.
Use and replacement of PFCs and SF6
Although, perfluorocarbons (PFCs) and sulphur hexafluoride (SF6), which are used in electrical equip-
ment, semiconductors, photovoltaics and other electronics manufacture, accounted for only 1 % of the
EU F-gas supply (in tonnes) in 2019, they represented 18 % in terms of CO2 equivalents. However,
despite their very high GWP (ranging from 7 000 to 23 000) their use is only restricted for specific ap-
plications. Especially in the case of SF6, alternatives have been developed and intensively researched
or even placed on the market over the past years, but the Regulation is not promoting the deployment
of those new alternatives. Consequently, for these gases the Regulation was less effective.
Other aspects
The Regulation does not prevent Member States from maintaining or introducing more stringent
measures at national level. Some Member States have already implemented additional measures such
as tax schemes (e.g. Denmark, Spain), additional requirements for F-gas related customs controls (e.g.
Estonia) or leakage checks (e.g. Portugal, Sweden), additional national reporting requirements (e.g.
Czech Republic, Estonia, Poland) or measures to support the market uptake of low GWP alternatives
(e.g. Finland, Germany, Sweden), while others intend to do so (e.g. Bulgaria, France).
Reporting and verification have been key indicators of the Regulation’s success. Data reported under
the Regulation were mostly found to provide a reliable basis for monitoring how the EU industries re-
acted to the intervention.
Independent verification is crucial for effective compliance checks. However, given the strong increase
in companies applying for new entrants’ quota, the amount of quota allocated per company from the
reserve in 2019 dropped below the threshold of 10,000 tonnes of CO2 equivalents fixed in the Regulation
for mandatory verification for HFC producers and importers. This resulted in a gap where 8 % of
amounts reported to be placed on the market are not subject to mandatory verification and thus to verify
if they had imported higher amounts than reported other less effective actions had to be taken, e.g.
inspections. Furthermore, the mandatory verification obligation is not very prescriptive, thus the quality
of reports provided by companies varies. There is evidence from the stakeholder consultation that the
1 The HFC phase-down features a mechanism to allocate a reserve of total annually allowed HFC quota to new market en-
trants without previous HFC import or production activity. 2 Commission Implementing Regulation (EU) 2019/661 of 25 April 2019 ensuring the smooth functioning of the electronic regis-
try for quotas for placing hydrofluorocarbons on the market
7
reporting and verification requirements have caused additional administrative costs for businesses. This
will be further outlined in the ‘Efficiency’ section.
All Member States have introduced penalties for infringements of the Regulation. However, penalties
vary from one Member State to the other and in some cases their level may not be proportionate to the
economic gains of illegal activities. This implies that the same violation for importing illegally into the
EU single market is penalised differently depending on in which Member State the goods enter. More-
over, the different judicial approaches and legal mechanisms related to the penalties are making it
difficult to ensure that penalties in all Member States serve the purpose of being dissuasive.
Objective 2: Prevent leakage from equipment and proper end of life treatment of F-gases in ap-
plications
Prevention of F-gas leakages from equipment is key to achieving significant emission reductions. The
Regulation has continued to address prevention of leakage from equipment and the provision of proper
end-of-life treatment. Data available from surveys in a number of Member States have shown the im-
portance of regular leakage checks and associated servicing activities, especially in the commercial
refrigeration sector, as leakage rates have declined (further) in recent years. Enforcement and compli-
ance with containment and leakage checks was raised as an area which required further attention to
ensure effectiveness.
Current emission prevention requirements only concern F-gases listed in Annex I of the Regulation,
while no such requirements apply to other fluorinated gases listed in Annex II, such as NF3, unsaturated
H(C)FCs, fluorinated ethers and alcohols and other perfluorinated compounds. Furthermore, the current
prevention provisions only apply to the use of bulk gases, but not to their manufacturing, storage and
transport, where leakages can also occur. Thus, for the prevention of emissions related to these gases
the Regulation was less effective.
Objective 3: Facilitate convergence towards a potential future agreement to phase down HFCs
under the Montreal Protocol
The Regulation has been very successful in meeting this objective. Prior to the implementation of the
Regulation there was no international agreement in place to tackle HFC emissions globally. The EU
Member States were vocal supporters and advocates of the proposed Kigali Amendment. The Regula-
tion enabled a joint EU negotiation position and the tabling of an amendment proposal that provided
crucial impetus for the negotiations. It clearly demonstrated to other Parties that ambitious action on
HFCs is possible.
Objective 4: Enhance sustainable growth, stimulate innovation and develop green technologies
by improving market opportunities for alternative technologies and gases with low GWP
The HFC phase-down has been a strong trigger for innovation aided by some prohibitions addressing
single substances or specific applications. Dozens of new blends, especially mixtures consisting of
HFCs and unsaturated HFCs, have entered the EU market since 2015. In addition, the number of com-
panies working with natural refrigerants has increased from 400 to 650 in the period 2013 to 2016 and,
for example, in the commercial refrigeration sector over 80% of companies increased their levels of
investment in R&D between 2011 and 2016.3 It is expected that innovation and development of green
technologies will continue to grow as a result of the tightening quota system and the prohibitions that
will come into effect in the coming years.
3 Shecco (2016): F-Gas Regulation Shaking up the HVAC&R Industry.
8
2.2.2 Efficiency
Overall findings: The Regulation has resulted in significant emission savings at very low abate-
ment costs linked to technological change. At the same time higher HFC prices, due to the
phase-down, implied higher gas cost to end-users that were still using HFCs. These costs were
on the other hand offset by equivalent benefits to companies in the HFC supply chain.
The Regulation has delivered significant environmental benefits since its entry into force: it achieved
savings in F-gas emissions of 44 million tonnes of CO2 equivalents cumulatively until 2019. As for the
impacts on energy consumption, stakeholders stated that higher energy efficiency was achieved with
F-gas alternatives, especially in new installations, for example in transcritical CO2 supermarket systems
(energy savings of at least 10-14% annually in LIFE C4R project). Generally, new products on the
market employing F-gas alternatives are achieving at least the same energy efficiency as comparable
products based on F-gas technology.
The cost of technological change leading to emission savings was determined as 0.2 billion € per year.
Cost of technological change describe the additional investment and operating cost of end-users for
low(er) GWP technologies in comparison to established HFC high-GWP HFC technologies under the
assumption of gas prices not altered by the HFC phase-down. Based on these costs, average emis-
sion reduction costs calculated as the ratio of the annualised technological cost relative to the lifetime-
averaged emissions savings were on average at about 1 € per tonne of CO2 equivalents. Emission
reduction cost observed for the first years of the phase-down are thus far below the average of 16 € per
tonne of CO2 equivalents calculated for the 2030 time-horizon in the 2012 impact assessment for the
Regulation (envisioning more costly technologies to be applied for that time horizon). However, the cost
of action seems to vary significantly across sectors. Many sectors in the areas of refrigeration had
negative technology change costs. The cost-effectiveness of the Regulation is underlined by the OPC
feedback, where respondents did not signal that for any of the individual measures that the costs out-
weighed the benefits.
The majority of the total compliance costs of F-gas using industries in the EU in the evaluation period
was due to increased gas prices as a result of the phase-down. Due to restrictions on their HFC supply
under the HFC phase-down, gas producers and gas importers increase the price on high GWP gases
which gives a price signal to downstream actors in the HFC supply chain, and subsequently to equip-
ment operators. Where not restricted by long-term contracts, both gas distributors and, further down-
stream, service companies apply surcharges on their respective purchasing prices when selling to their
respective customers. Thus, end-user equipment operators pay higher prices for the gas, unless they
switch to climate-friendly alternatives. The total costs linked to price increases were determined as 1.6
billion € per year. These expenses were however distributed over a large number of end-users in the
EU buying new or topping up running equipment (operating e.g. approximately 150,000 large super-
market refrigeration systems, 10 million small commercial refrigeration units, 100 million air conditioning
systems in buildings and 200 million air conditioning units in vehicles).
As technology change has just been starting for new equipment in a number of sectors and there are
still high shares of operated equipment relying on established HFC technologies, the HFC price-related
compliance cost are still very high. As users move away from high GWP HFC equipment, this share of
cost to end-users should decrease. Since the quota is allocated for free, the HFC price related compli-
ance costs to the end-users are equally offset by profits in the HFC supply chain and are thus not
considered as net cost of the Regulation but rather as a distributional effect.
The majority of F-gas users’ total costs (ca. 93%) relates to the refrigeration and air conditioning (RAC)
sectors. In relation to total expenditures for the investment in, and operation of RAC equipment, the
calculated compliance cost amounts to about 1% of the total expenditures related to the investment in,
and operation of, related equipment.
9
There are also a number of measures in the Regulation that result in some administrative burden for
a range of actors. Gathering evidence from stakeholders, it was found that:
• The total yearly costs across all Member State competent authorities and across all measures is
estimated to be 11.2 million €, or 98,785 working days to ensure compliance with the Regulation,
with a further 0.15 million € noted as a one-off cost by three Member States (based on a sample
of data provided by 12 Member States through interviews). The most significant costs have been
associated with ‘conducting national inspections or checks’ (e.g. linked to emission prevention
and leakage).
• Only very limited data could be collected through interviews regarding the administrative burden
to businesses (e.g. for quota applications and reporting) as only three business associations pro-
vided cost data. The remaining interviewees did not provide any specific detail. At this point it
is not possible to produce representative quantitative estimate of administrative burden
for all businesses from the information provided through the interviews, but several quali-
tative trends emerged: costs vary widely based upon company size and the most significant costs
were associated with complying with the HFC phase-down and quota system. It should also be
noted that for a number of the costs provided respondents have acknowledged that the figures
are estimates only, with challenges in reliably providing exact results. Verification was found to
put administrative burden on businesses.
The OPC offered some further insights to costs. Business associations and companies thought the
costs of different measures (noting this question did not specifically refer to administrative costs only)
were not excessively high, but also not marginal. By way of exception: labelling was seen as having
only marginal costs, while ‘restrictions on use and equipment’ and the ‘quota system’ were seen as
comparatively more expensive measures than the others (corroborating the interview responses). Over-
all, a majority of business associations and companies agreed that the costs of the individual measures
were justified to achieve the objectives, i.e. that the benefits of action had outweighed the costs (a result
which matched overall responses across all stakeholder groups).
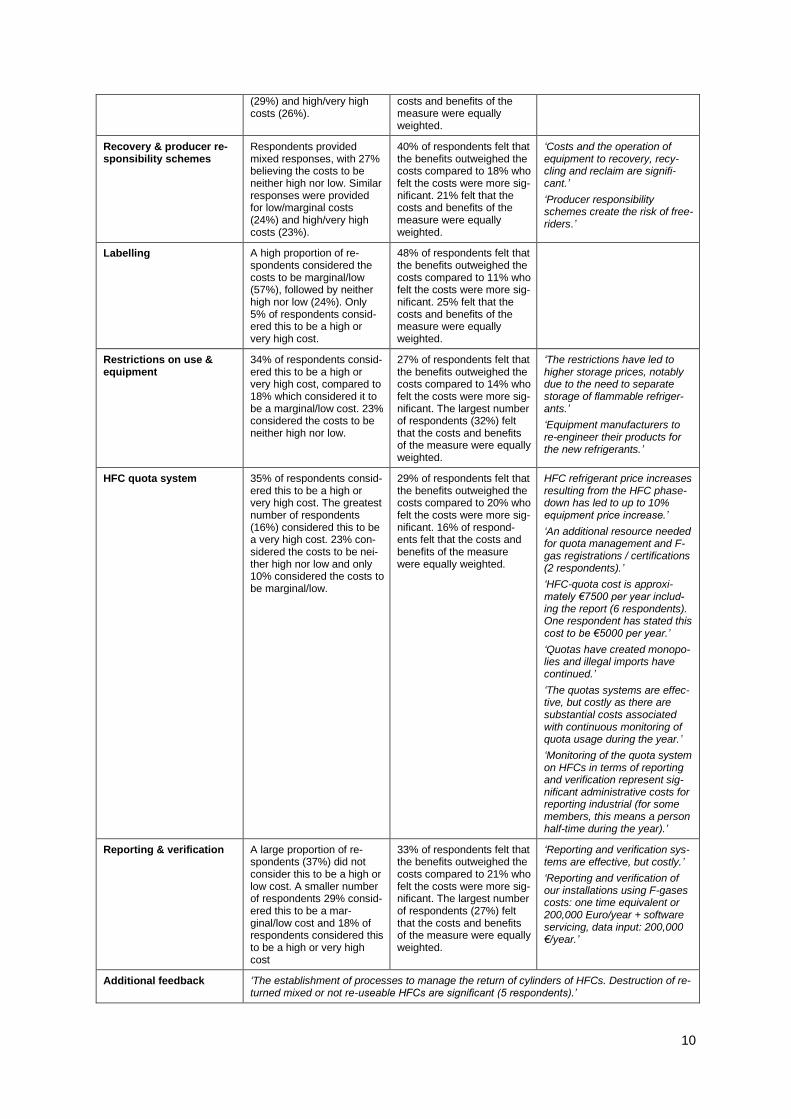
The table below has provided a detailed breakdown of responses of business associations/organisa-
tions to the OPC question assessing the cost of each measure. The additional feedback provide column
provides a sample of open text responses provided by businesses/organisations through the OPC. Each
statement is attributed to one business association/organisation unless otherwise stated.
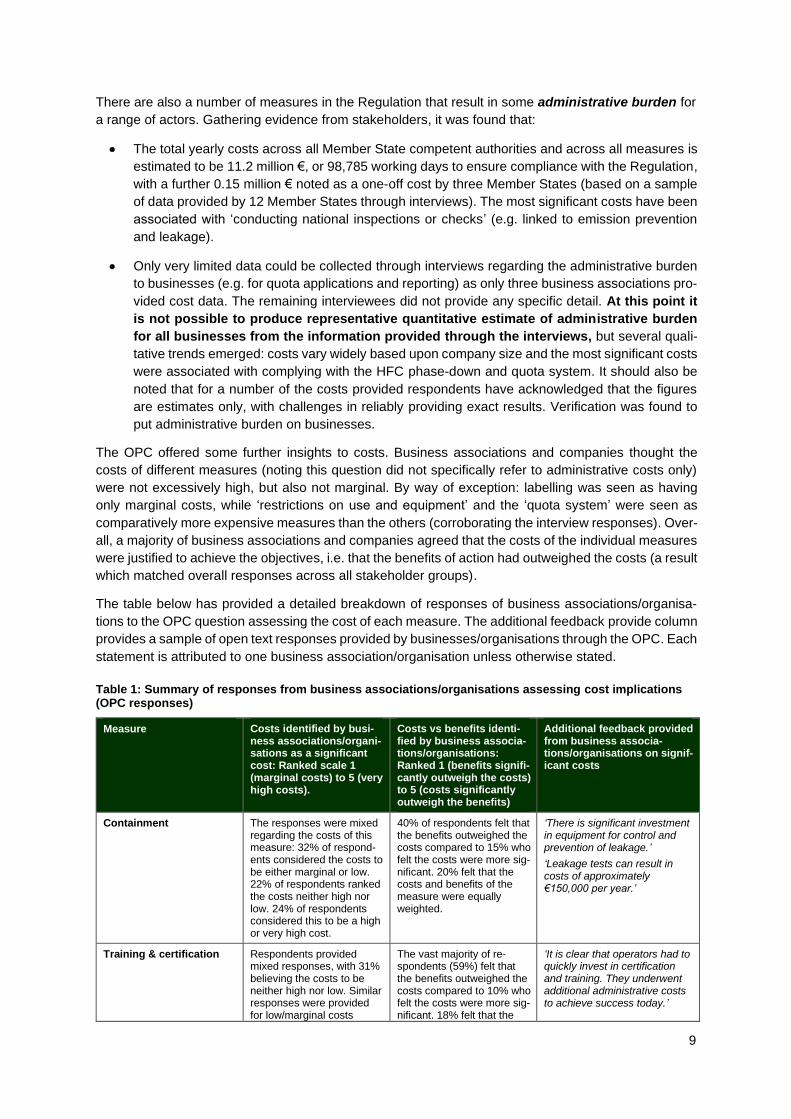
Table 1: Summary of responses from business associations/organisations assessing cost implications (OPC responses)
Measure Costs identified by busi-ness associations/organi-sations as a significant cost: Ranked scale 1 (marginal costs) to 5 (very high costs).
Costs vs benefits identi-fied by business associa-tions/organisations: Ranked 1 (benefits signifi-cantly outweigh the costs) to 5 (costs significantly outweigh the benefits)
Additional feedback provided from business associa-tions/organisations on signif-icant costs
Containment The responses were mixed regarding the costs of this measure: 32% of respond-ents considered the costs to be either marginal or low. 22% of respondents ranked the costs neither high nor low. 24% of respondents considered this to be a high or very high cost.
40% of respondents felt that the benefits outweighed the costs compared to 15% who felt the costs were more sig-nificant. 20% felt that the costs and benefits of the measure were equally weighted.
‘There is significant investment in equipment for control and prevention of leakage.’
‘Leakage tests can result in costs of approximately €150,000 per year.’
Training & certification Respondents provided mixed responses, with 31% believing the costs to be neither high nor low. Similar responses were provided for low/marginal costs
The vast majority of re-spondents (59%) felt that the benefits outweighed the costs compared to 10% who felt the costs were more sig-nificant. 18% felt that the
‘It is clear that operators had to quickly invest in certification and training. They underwent additional administrative costs to achieve success today.’
10
(29%) and high/very high costs (26%).
costs and benefits of the measure were equally weighted.
Recovery & producer re-sponsibility schemes
Respondents provided mixed responses, with 27% believing the costs to be neither high nor low. Similar responses were provided for low/marginal costs (24%) and high/very high costs (23%).
40% of respondents felt that the benefits outweighed the costs compared to 18% who felt the costs were more sig-nificant. 21% felt that the costs and benefits of the measure were equally weighted.
‘Costs and the operation of equipment to recovery, recy-cling and reclaim are signifi-cant.’
‘Producer responsibility schemes create the risk of free-riders.’
Labelling A high proportion of re-spondents considered the costs to be marginal/low (57%), followed by neither high nor low (24%). Only 5% of respondents consid-ered this to be a high or very high cost.
48% of respondents felt that the benefits outweighed the costs compared to 11% who felt the costs were more sig-nificant. 25% felt that the costs and benefits of the measure were equally weighted.
Restrictions on use & equipment
34% of respondents consid-ered this to be a high or very high cost, compared to 18% which considered it to be a marginal/low cost. 23% considered the costs to be neither high nor low.
27% of respondents felt that the benefits outweighed the costs compared to 14% who felt the costs were more sig-nificant. The largest number of respondents (32%) felt that the costs and benefits of the measure were equally weighted.
‘The restrictions have led to higher storage prices, notably due to the need to separate storage of flammable refriger-ants.’
‘Equipment manufacturers to re-engineer their products for the new refrigerants.’
HFC quota system 35% of respondents consid-ered this to be a high or very high cost. The greatest number of respondents (16%) considered this to be a very high cost. 23% con-sidered the costs to be nei-ther high nor low and only 10% considered the costs to be marginal/low.
29% of respondents felt that the benefits outweighed the costs compared to 20% who felt the costs were more sig-nificant. 16% of respond-ents felt that the costs and benefits of the measure were equally weighted.
HFC refrigerant price increases resulting from the HFC phase-down has led to up to 10% equipment price increase.’
‘An additional resource needed for quota management and F-gas registrations / certifications (2 respondents).’
‘HFC-quota cost is approxi-mately €7500 per year includ-ing the report (6 respondents). One respondent has stated this cost to be €5000 per year.’
‘Quotas have created monopo-lies and illegal imports have continued.’
‘The quotas systems are effec-tive, but costly as there are substantial costs associated with continuous monitoring of quota usage during the year.’
‘Monitoring of the quota system on HFCs in terms of reporting and verification represent sig-nificant administrative costs for reporting industrial (for some members, this means a person half-time during the year).’
Reporting & verification A large proportion of re-spondents (37%) did not consider this to be a high or low cost. A smaller number of respondents 29% consid-ered this to be a mar-ginal/low cost and 18% of respondents considered this to be a high or very high cost
33% of respondents felt that the benefits outweighed the costs compared to 21% who felt the costs were more sig-nificant. The largest number of respondents (27%) felt that the costs and benefits of the measure were equally weighted.
‘Reporting and verification sys-tems are effective, but costly.’
‘Reporting and verification of our installations using F-gases costs: one time equivalent or 200,000 Euro/year + software servicing, data input: 200,000 €/year.’
Additional feedback ‘The establishment of processes to manage the return of cylinders of HFCs. Destruction of re-turned mixed or not re-useable HFCs are significant (5 respondents).’
11
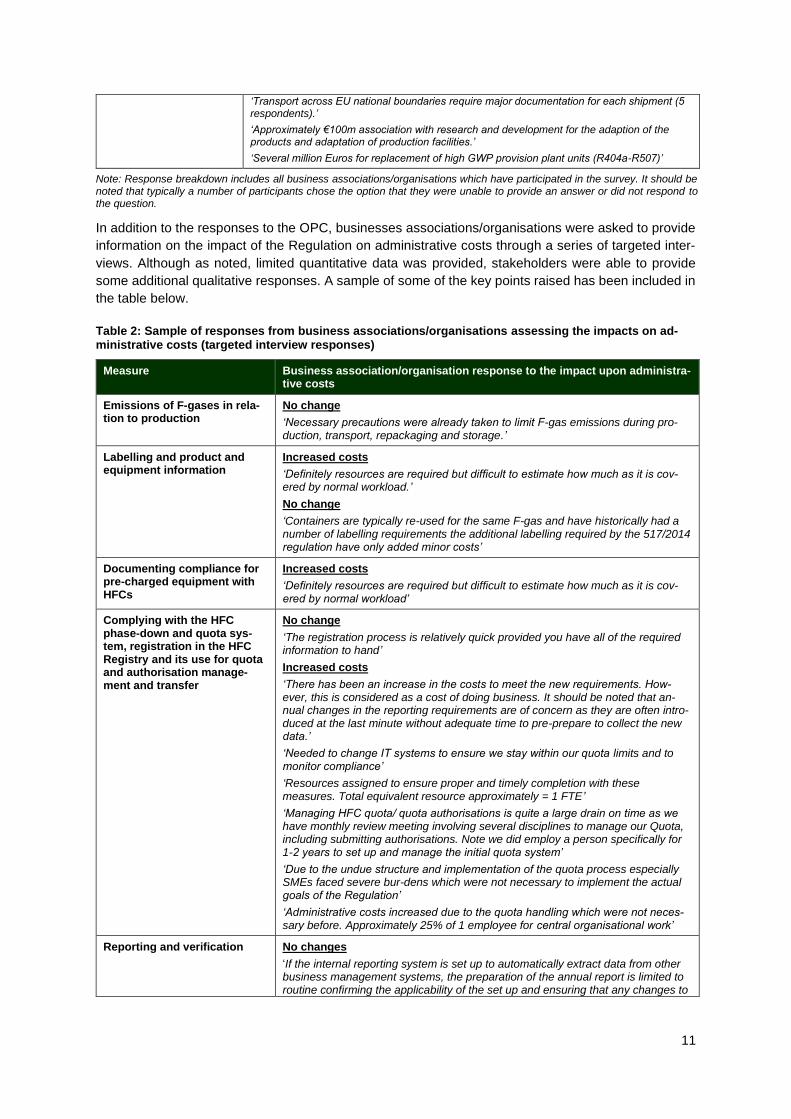
‘Transport across EU national boundaries require major documentation for each shipment (5 respondents).’
‘Approximately €100m association with research and development for the adaption of the products and adaptation of production facilities.’
‘Several million Euros for replacement of high GWP provision plant units (R404a-R507)’
Note: Response breakdown includes all business associations/organisations which have participated in the survey. It should be noted that typically a number of participants chose the option that they were unable to provide an answer or did not respond to the question.
In addition to the responses to the OPC, businesses associations/organisations were asked to provide
information on the impact of the Regulation on administrative costs through a series of targeted inter-
views. Although as noted, limited quantitative data was provided, stakeholders were able to provide
some additional qualitative responses. A sample of some of the key points raised has been included in
the table below.
Table 2: Sample of responses from business associations/organisations assessing the impacts on ad-ministrative costs (targeted interview responses)
Measure Business association/organisation response to the impact upon administra-tive costs
Emissions of F-gases in rela-tion to production
No change
‘Necessary precautions were already taken to limit F-gas emissions during pro-duction, transport, repackaging and storage.’
Labelling and product and equipment information
Increased costs
‘Definitely resources are required but difficult to estimate how much as it is cov-ered by normal workload.’
No change
‘Containers are typically re-used for the same F-gas and have historically had a number of labelling requirements the additional labelling required by the 517/2014 regulation have only added minor costs’
Documenting compliance for pre-charged equipment with HFCs
Increased costs
‘Definitely resources are required but difficult to estimate how much as it is cov-ered by normal workload’
Complying with the HFC phase-down and quota sys-tem, registration in the HFC Registry and its use for quota and authorisation manage-ment and transfer
No change
‘The registration process is relatively quick provided you have all of the required information to hand’
Increased costs
‘There has been an increase in the costs to meet the new requirements. How-ever, this is considered as a cost of doing business. It should be noted that an-nual changes in the reporting requirements are of concern as they are often intro-duced at the last minute without adequate time to pre-prepare to collect the new data.’
‘Needed to change IT systems to ensure we stay within our quota limits and to monitor compliance’
‘Resources assigned to ensure proper and timely completion with these measures. Total equivalent resource approximately = 1 FTE’
‘Managing HFC quota/ quota authorisations is quite a large drain on time as we have monthly review meeting involving several disciplines to manage our Quota, including submitting authorisations. Note we did employ a person specifically for 1-2 years to set up and manage the initial quota system’
‘Due to the undue structure and implementation of the quota process especially SMEs faced severe bur-dens which were not necessary to implement the actual goals of the Regulation’
‘Administrative costs increased due to the quota handling which were not neces-sary before. Approximately 25% of 1 employee for central organisational work’
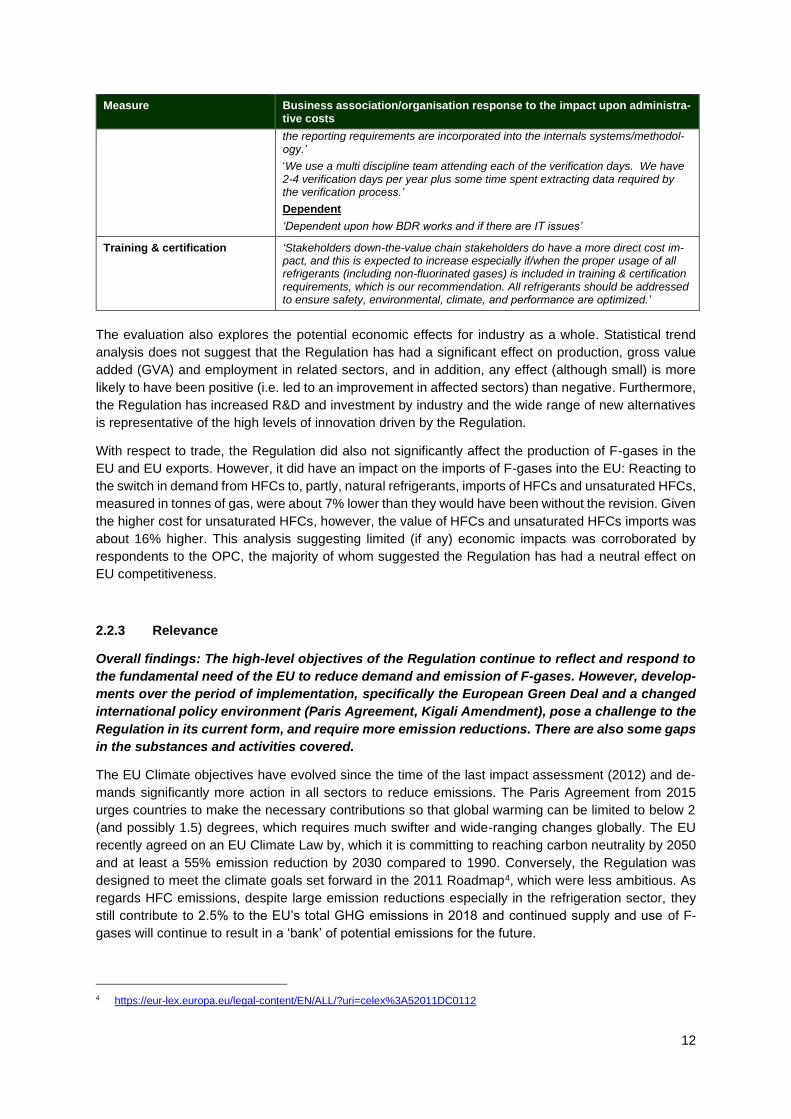
Reporting and verification No changes
‘If the internal reporting system is set up to automatically extract data from other business management systems, the preparation of the annual report is limited to routine confirming the applicability of the set up and ensuring that any changes to
12
Measure Business association/organisation response to the impact upon administra-tive costs
the reporting requirements are incorporated into the internals systems/methodol-ogy.’
‘We use a multi discipline team attending each of the verification days. We have 2-4 verification days per year plus some time spent extracting data required by the verification process.’
Dependent
‘Dependent upon how BDR works and if there are IT issues’
Training & certification ‘Stakeholders down-the-value chain stakeholders do have a more direct cost im-pact, and this is expected to increase especially if/when the proper usage of all refrigerants (including non-fluorinated gases) is included in training & certification requirements, which is our recommendation. All refrigerants should be addressed to ensure safety, environmental, climate, and performance are optimized.’
The evaluation also explores the potential economic effects for industry as a whole. Statistical trend
analysis does not suggest that the Regulation has had a significant effect on production, gross value
added (GVA) and employment in related sectors, and in addition, any effect (although small) is more
likely to have been positive (i.e. led to an improvement in affected sectors) than negative. Furthermore,
the Regulation has increased R&D and investment by industry and the wide range of new alternatives
is representative of the high levels of innovation driven by the Regulation.
With respect to trade, the Regulation did also not significantly affect the production of F-gases in the
EU and EU exports. However, it did have an impact on the imports of F-gases into the EU: Reacting to
the switch in demand from HFCs to, partly, natural refrigerants, imports of HFCs and unsaturated HFCs,
measured in tonnes of gas, were about 7% lower than they would have been without the revision. Given
the higher cost for unsaturated HFCs, however, the value of HFCs and unsaturated HFCs imports was
about 16% higher. This analysis suggesting limited (if any) economic impacts was corroborated by
respondents to the OPC, the majority of whom suggested the Regulation has had a neutral effect on
EU competitiveness.
2.2.3 Relevance
Overall findings: The high-level objectives of the Regulation continue to reflect and respond to
the fundamental need of the EU to reduce demand and emission of F-gases. However, develop-
ments over the period of implementation, specifically the European Green Deal and a changed
international policy environment (Paris Agreement, Kigali Amendment), pose a challenge to the
Regulation in its current form, and require more emission reductions. There are also some gaps
in the substances and activities covered.
The EU Climate objectives have evolved since the time of the last impact assessment (2012) and de-
mands significantly more action in all sectors to reduce emissions. The Paris Agreement from 2015
urges countries to make the necessary contributions so that global warming can be limited to below 2
(and possibly 1.5) degrees, which requires much swifter and wide-ranging changes globally. The EU
recently agreed on an EU Climate Law by, which it is committing to reaching carbon neutrality by 2050
and at least a 55% emission reduction by 2030 compared to 1990. Conversely, the Regulation was
designed to meet the climate goals set forward in the 2011 Roadmap4, which were less ambitious. As
regards HFC emissions, despite large emission reductions especially in the refrigeration sector, they
still contribute to 2.5% to the EU’s total GHG emissions in 2018 and continued supply and use of F-
gases will continue to result in a ‘bank’ of potential emissions for the future.
4 https://eur-lex.europa.eu/legal-content/EN/ALL/?uri=celex%3A52011DC0112
13
The Regulation is the main policy tool through which the EU’s compliance with international commit-
ments related to the Montreal Protocol are safeguarded. With the exception of 2014, HFC consumption
has exhibited a downward trend as a result of the Regulation. The Kigali Amendment was introduced 2
years after the adoption of the Regulation. To continue to safeguard compliance in the future, further
changes will need to be made (discussed in more detail under coherence below).
In terms of the scope of the Regulation, a review of the coverage of substances, activities and sectors
found that the Regulation continues to capture the most important F-gases, however some gaps with
regard to the substances covered have been identified. These include e.g. sevoflurane, enflurane, sul-
furyl fluoride, FK-5-1-12 (fluorinated ketone) and other fluorinated gases. Moreover, certain applications
are not covered by the reporting requirements, so little information is available, e.g. on the use of SF6
in particle accelerators, the application of certain PFCs (predominantly C10F18) in personal products and
medical applications. Also, data collected for reclamation of F-gases was found to be incomplete as
only those companies which are also importers of F-gases currently need to report. Finally, current
requirements cover only F-gas related activities; due to the increasing use of F-gas alternatives and
safety issues such as flammability, additional requirements for service technicians working with climate-
friendly alternatives is becoming increasingly important.
As regards the flexibility of the Regulation, it was found that it has been flexible to respond to some
external challenges, but not others. The emergence and a shift to the use of both natural refrigerants
and alternatives with a lower GWP in several sectors has been induced and facilitated by the Regulation
and its flexibility. In contrast, the Regulation itself does not have sufficient flexibility to allow for alignment
with the Kigali Amendment or any unforeseen issue related to the quota system, such as the lack of
gas supply or similar.
2.2.4 Coherence
Overall findings: The Regulation interacts with a number of regulatory instruments, both in the
form of other EU policy but also international agreements. In general, the Regulation was found
to be externally consistent and coherent with other interventions that have similar objectives,
although there are areas that have led to some incoherence and should be addressed, in partic-
ular with regard to the Kigali Amendment.
The implementation of the HFC phase-down is crucial for the EU to comply with its obligations under
the Kigali Amendment to the Montreal Protocol. Although principally aligned, there are areas which
need to be adjusted to ensure full compliance. These areas are: the continuation of the EU HFC phase-
down after 2030, the introduction of an HFC production phase-down, as well as exemptions and thresh-
olds for placing on the market and reporting thresholds that are not foreseen by the Montreal Protocol.
The Montreal Protocol’s requirement to have export and import licences for HFCs is fulfilled by requiring
registration in EU F-gas Portal and Licensing System before undertaking such activities. However, bor-
der controls using this licensing system can be made more effective if full advantage of the upcoming
“EU Single Window environment for Customs”5 is taken.
Custom controls and surveillance activities are relevant to the success of the Regulation and better
alignment. Uncertainty about the role of customs in enforcing the Regulation has shown that instructions
for customs and market surveillance authorities were not sufficiently clear. There are also synergies
regarding energy efficiency due to complementary measures with the Energy Labelling Regulation (EU)
No 2017/1369, the Ecodesign Directive 2009/125/EC, Energy Performance of Buildings Di-
rective 2010/31/EU, and Directive (EU) 2018/2001 on the promotion of the use of energy from renewa-
ble sources. Coherence is particularly promoted through Article 11(2) of the Regulation, which allows
5 https://ec.europa.eu/taxation_customs/sites/taxation/files/201028_single_window_impact.pdf
14
an exemption from the placing on the market bans set out in Annex III if the equipment with HFCs would
achieve lower overall GHG emissions during its life cycle than the same equipment without HFCs.
As for internal coherence, the Regulation has generally been found to be consistent and coherent in-
ternally and across its implementing acts. There are, however, some areas which require further amend-
ments, including clarification of certain existing definitions and the inclusion of additional definition for
e.g. certain categories of equipment, consistency of thresholds for the import of pre-charged equipment,
and other issues and clarifications related to individual provisions.
2.2.5 EU added value
The Regulation has a clear added value by implementing co-ordinated action at EU level to ensure
compliance with the Montreal Protocol and the EU climate goals. This is corroborated by stakeholders,
especially by the responses of the competent authorities from Member States. The Regulation has
increased ambition relative to what would have been likely achieved as the sum of individual actions at
national levels. Taking co-ordinated action at EU level has increased the effectiveness of the policy to
reduce F-gas demand and emissions. Ensuring compliance with the Kigali Amendment at Member
State level in an EU without borders would be very difficult if not impossible to ensure. Alongside addi-
tional environmental improvements, a key benefit is the creation of a more efficient and less burden-
some regulatory environment for the EU F-gas industry, helping to minimise costs and to create a level-
playing field. For example, it would be much more costly to conduct 27 implementation levels and im-
plementing the required import and export licensing systems and restrictions at Member States level
would hardly have been reconcilable with the rules of the EU Internal Market.
15
3 Review of the Regulation
3.1 Objectives and envisaged policy options for amending the Regulation
While the current measures of the Regulation can achieve significant emission reductions and contrib-
ute to more climate-friendly technologies, some challenges were identified (see previous section). To
tackle these issues, the following four review objectives have been identified and policy options groups
were developed to this end.
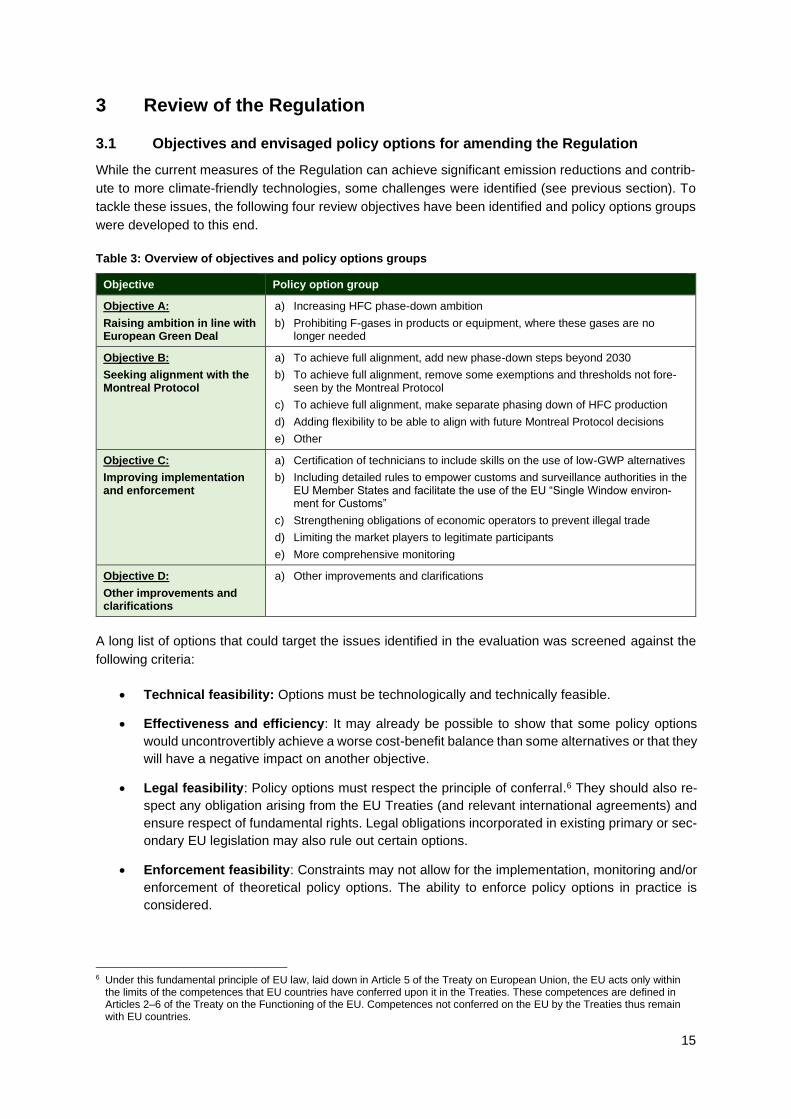
Table 3: Overview of objectives and policy options groups
Objective Policy option group
Objective A:
Raising ambition in line with European Green Deal
a) Increasing HFC phase-down ambition
b) Prohibiting F-gases in products or equipment, where these gases are no longer needed
Objective B:
Seeking alignment with the Montreal Protocol
a) To achieve full alignment, add new phase-down steps beyond 2030
b) To achieve full alignment, remove some exemptions and thresholds not fore-seen by the Montreal Protocol
c) To achieve full alignment, make separate phasing down of HFC production
d) Adding flexibility to be able to align with future Montreal Protocol decisions
e) Other
Objective C:
Improving implementation and enforcement
a) Certification of technicians to include skills on the use of low-GWP alternatives
b) Including detailed rules to empower customs and surveillance authorities in the EU Member States and facilitate the use of the EU “Single Window environ-ment for Customs”
c) Strengthening obligations of economic operators to prevent illegal trade
d) Limiting the market players to legitimate participants
e) More comprehensive monitoring
Objective D:
Other improvements and clarifications
a) Other improvements and clarifications
A long list of options that could target the issues identified in the evaluation was screened against the
following criteria:
• Technical feasibility: Options must be technologically and technically feasible.
• Effectiveness and efficiency: It may already be possible to show that some policy options
would uncontrovertibly achieve a worse cost-benefit balance than some alternatives or that they
will have a negative impact on another objective.
• Legal feasibility: Policy options must respect the principle of conferral.6 They should also re-
spect any obligation arising from the EU Treaties (and relevant international agreements) and
ensure respect of fundamental rights. Legal obligations incorporated in existing primary or sec-
ondary EU legislation may also rule out certain options.
• Enforcement feasibility: Constraints may not allow for the implementation, monitoring and/or
enforcement of theoretical policy options. The ability to enforce policy options in practice is
considered.
6 Under this fundamental principle of EU law, laid down in Article 5 of the Treaty on European Union, the EU acts only within
the limits of the competences that EU countries have conferred upon it in the Treaties. These competences are defined in Articles 2–6 of the Treaty on the Functioning of the EU. Competences not conferred on the EU by the Treaties thus remain with EU countries.
16
• General feasibility: Policy options that would clearly fail to garner the necessary stakeholder
support for legislative adoption and/or implementation could also be discarded.
The list of options that has been retained for more in-depth impact assessment is presented in the
Annex to this Briefing Paper.
3.2 Impact assessment of envisaged policy options – preliminary results
3.2.1 Modelling of fluorinated greenhouse gases in the EU
In order to assess the impact of the Regulation on the use and emissions of F-gases in the EU, a
bottom-up stock model was used to project F-gas demand and the emissions related to that demand
and the installed F-gases in the following sectors:
1. Refrigeration
2. Stationary air conditioning (including heat pumps)
3. Mobile air conditioning
4. Foams
5. Propellants, solvents and fire protection
6. Production of F-gases
7. SF6 in electrical equipment, soundproof windows and the non-ferrous metals industry.
Placing on the market of HFCs (POM)
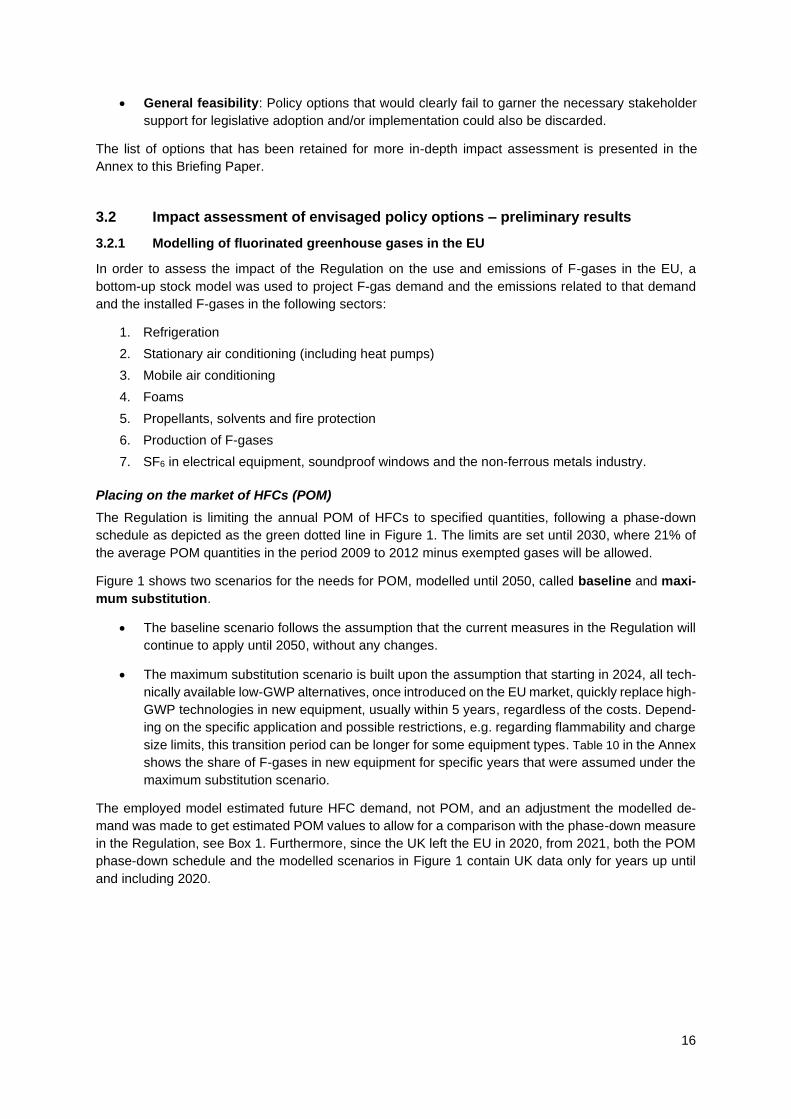
The Regulation is limiting the annual POM of HFCs to specified quantities, following a phase-down
schedule as depicted as the green dotted line in Figure 1. The limits are set until 2030, where 21% of
the average POM quantities in the period 2009 to 2012 minus exempted gases will be allowed.
Figure 1 shows two scenarios for the needs for POM, modelled until 2050, called baseline and maxi-
mum substitution.
• The baseline scenario follows the assumption that the current measures in the Regulation will
continue to apply until 2050, without any changes.
• The maximum substitution scenario is built upon the assumption that starting in 2024, all tech-
nically available low-GWP alternatives, once introduced on the EU market, quickly replace high-
GWP technologies in new equipment, usually within 5 years, regardless of the costs. Depend-
ing on the specific application and possible restrictions, e.g. regarding flammability and charge
size limits, this transition period can be longer for some equipment types. Table 10 in the Annex
shows the share of F-gases in new equipment for specific years that were assumed under the
maximum substitution scenario.
The employed model estimated future HFC demand, not POM, and an adjustment the modelled de-
mand was made to get estimated POM values to allow for a comparison with the phase-down measure
in the Regulation, see Box 1. Furthermore, since the UK left the EU in 2020, from 2021, both the POM
phase-down schedule and the modelled scenarios in Figure 1 contain UK data only for years up until
and including 2020.
17
Box 1: Adjusting HFC demand to POM values
Demand is defined as quantities of HFCs used in the filling of new equipment and servicing
of existing equipment per year. While POM quotas do not apply to reclaimed HFCs, the
demand includes these quantities and makes no differentiation between virgin and re-
claimed gas. Thus, reclaimed quantities must be deducted from the demand. This was
achieved by subtracting reported reclaimed quantities per gas until the year 2019. From
2020 until 2050, the reclamation shares from 2019 were used.7 Also, HFCs used in MDIs
are exempted from the HFC phase-down and are thus excluded from the HFC demand
shown in the modelled scenarios.
Further, HFC quota can be transferred into authorisations for use at any other time. These
quantities will be placed on the market in the future as part of the then current demand. As
such, the demand can occasionally exceed the POM quota and it is not foreseeable when
this will happen. In order to adjust for this uncertainty, the current sum of authorisations
was deducted from the calculated demand in the period of 2021 to 2034.
Figure 1: Modelled POM-adjusted HFC baseline and maximum substitution scenario in comparison to HFC
POM under the Regulation
Source: AnaFgas model
Figure 1 shows that, the estimated POM which is needed to satisfy the HFC demand in the baseline,
will not exceed the maximum allowed under the Regulation until 2030.8 When looking at the maximum
substitution scenario, it is visible that a stronger reduction in CO2 equivalents (as regards POM)
is possible when low-GWP alternatives are consistently favoured. This reduction cumulatively
7 HFC-23: 10%, HFC-32: 2%, HFC-125: 5%, HFC-134a: 2%, HFC-143a: 30%, HFC-227ea: 2% (EEA F-gas reporting 2020) 8 The Regulation does not specify any percentages for the years beyond 2030. For the purpose of the modelling, it is assumed
that the 2030 percentage remains as such.

18
amounts to 89 Mt CO2 equivalents in the years from 2024 to 2030 and 391 Mt CO2 equivalents in the
years from 2024 to 2050.
Consumption of HFCs
It should be noted that the HFC consumption metric used under the Montreal Protocol (MP) consider-
ably deviates in definition from the POM metric used under the phase-down in the Regulation. In 2019,
EU-28 quota-relevant POM under the Regulation was about 24 Mt CO2 equivalents or 32 % above HFC
consumption accounted under the MP. However, the size of these accounting differences has been
varying strongly and is subject to several independent parameters and their trends (Figure 2). For a full
comparison of the metrics, please refer to Annex 4 of the 2020 EEA F-gas Report.9
Figure 2: Accounting differences – non-exempted POM vs. MP HFC consumption (EU-28)
Source: Confidential BDR dataset 2020, own calculations
Given the methodological accounting differences, two borderline scenarios were developed in order to
assess whether the ambition level of the POM phase-down will, for all eventualities, be able safeguard
EU compliance with the MP consumption phase-down. In a ‘low-consumption’ scenario, the 2030 max-
imum POM level allowed under the Regulation (19.9 Mt CO2 equivalents for the EU-27) would correlate
to an HFC consumption of 13.5 Mt CO2 equivalents which is below the latest MP consumption phase-
down step scheduled for 2036 at 24.5 Mt CO2 equivalents for the EU-27. However, in the ‘high-con-
sumption’ scenario, the 2030 maximum POM level under the Regulation would correspond to an EU-
27 HFC consumption of 35.0 Mt CO2 equivalents, which is above the 2034-2035 limit of 32.7 Mt CO2
equivalents. Given this uncertainty on the future development of the accounting differences and the
underlying parameters between EU-27 HFC POM and consumption, EU-27 compliance with the latest
steps of the MP consumption phase-down starting 2034 and 2036 is not automatically given by the
current phase-down rules.
Demand and emissions of all modelled F-gases in the EU-27
Looking at all modelled F-gases in the EU-27, overall demand in CO2 equivalents sharply decreased
following the entry into force of the existing Regulation, as shown by comparing the baseline and a
counterfactual scenario which assumes that the Regulation never entered into force and that only the
2006 F-gas Regulation and the MAC Directive restrict the use of F-gases in the EU. The maximum
9 https://www.eea.europa.eu/publications/fluorinated-greenhouse-gases-2020
-20%
-10%
0%
10%
20%
30%
40%
-20
-10
0
10
20
30
40
201
4
201
5
201
6
201
7
201
8
201
9
Mil
lio
n t
on
ne
s o
f C
O2
eq
uiv
ale
nts
Other
POM from net stock releases(including customs warehousing)
Re-exports in equipment without priorPOM
MDI quota exemption
Destruction of used gases recoveredin the EU
Exports beyond the quota exemption
Authorisations issued
Total accounting gap (to be added toMP HFC consumption)
Gap as share of consumption [%]
Gap as share of POM [%]
19
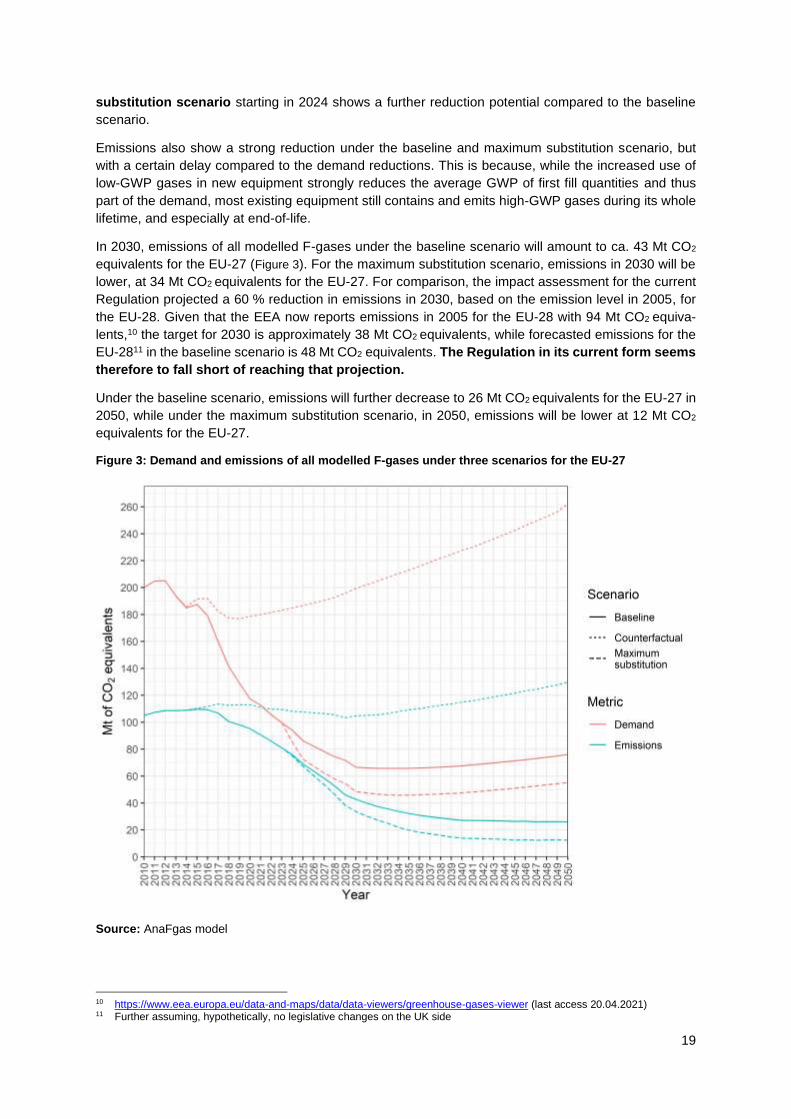
substitution scenario starting in 2024 shows a further reduction potential compared to the baseline
scenario.
Emissions also show a strong reduction under the baseline and maximum substitution scenario, but
with a certain delay compared to the demand reductions. This is because, while the increased use of
low-GWP gases in new equipment strongly reduces the average GWP of first fill quantities and thus
part of the demand, most existing equipment still contains and emits high-GWP gases during its whole
lifetime, and especially at end-of-life.
In 2030, emissions of all modelled F-gases under the baseline scenario will amount to ca. 43 Mt CO2
equivalents for the EU-27 (Figure 3). For the maximum substitution scenario, emissions in 2030 will be
lower, at 34 Mt CO2 equivalents for the EU-27. For comparison, the impact assessment for the current
Regulation projected a 60 % reduction in emissions in 2030, based on the emission level in 2005, for
the EU-28. Given that the EEA now reports emissions in 2005 for the EU-28 with 94 Mt CO2 equiva-
lents,10 the target for 2030 is approximately 38 Mt CO2 equivalents, while forecasted emissions for the
EU-2811 in the baseline scenario is 48 Mt CO2 equivalents. The Regulation in its current form seems
therefore to fall short of reaching that projection.
Under the baseline scenario, emissions will further decrease to 26 Mt CO2 equivalents for the EU-27 in
2050, while under the maximum substitution scenario, in 2050, emissions will be lower at 12 Mt CO2
equivalents for the EU-27.
Figure 3: Demand and emissions of all modelled F-gases under three scenarios for the EU-27
Source: AnaFgas model
10 https://www.eea.europa.eu/data-and-maps/data/data-viewers/greenhouse-gases-viewer (last access 20.04.2021) 11 Further assuming, hypothetically, no legislative changes on the UK side
20
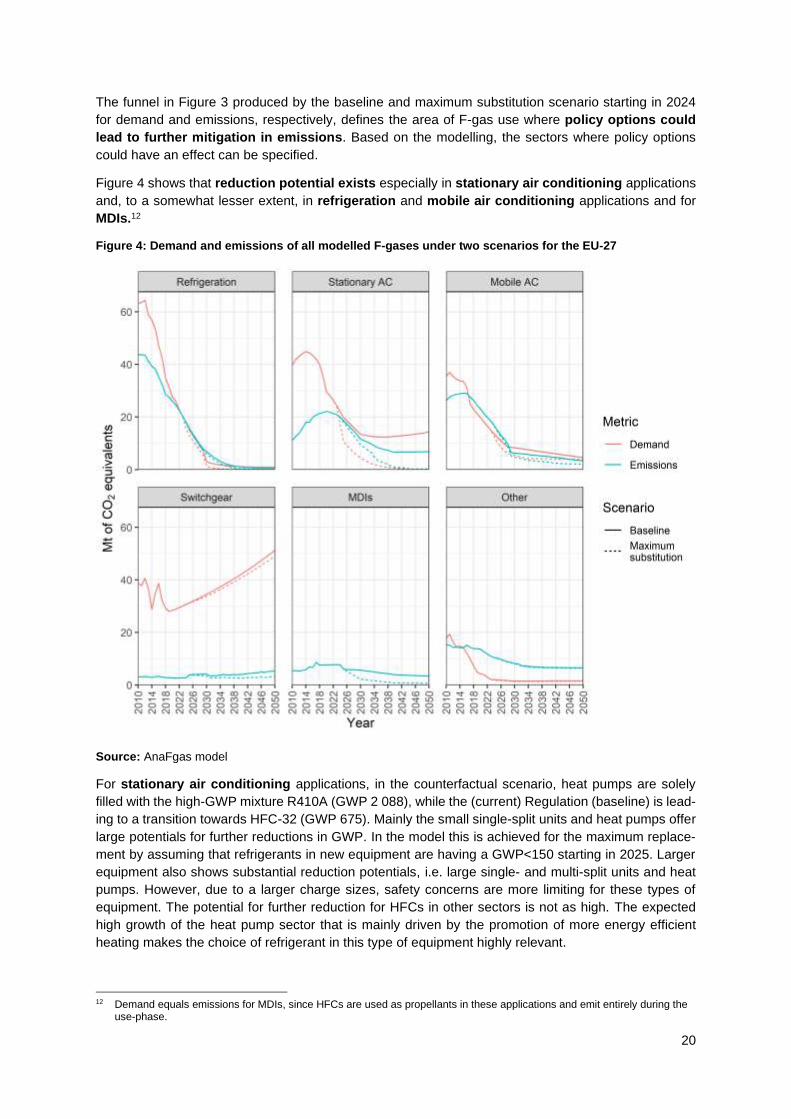
The funnel in Figure 3 produced by the baseline and maximum substitution scenario starting in 2024
for demand and emissions, respectively, defines the area of F-gas use where policy options could
lead to further mitigation in emissions. Based on the modelling, the sectors where policy options
could have an effect can be specified.
Figure 4 shows that reduction potential exists especially in stationary air conditioning applications
and, to a somewhat lesser extent, in refrigeration and mobile air conditioning applications and for
MDIs.12
Figure 4: Demand and emissions of all modelled F-gases under two scenarios for the EU-27
Source: AnaFgas model
For stationary air conditioning applications, in the counterfactual scenario, heat pumps are solely
filled with the high-GWP mixture R410A (GWP 2 088), while the (current) Regulation (baseline) is lead-
ing to a transition towards HFC-32 (GWP 675). Mainly the small single-split units and heat pumps offer
large potentials for further reductions in GWP. In the model this is achieved for the maximum replace-
ment by assuming that refrigerants in new equipment are having a GWP<150 starting in 2025. Larger
equipment also shows substantial reduction potentials, i.e. large single- and multi-split units and heat
pumps. However, due to a larger charge sizes, safety concerns are more limiting for these types of
equipment. The potential for further reduction for HFCs in other sectors is not as high. The expected
high growth of the heat pump sector that is mainly driven by the promotion of more energy efficient
heating makes the choice of refrigerant in this type of equipment highly relevant.
12 Demand equals emissions for MDIs, since HFCs are used as propellants in these applications and emit entirely during the
use-phase.
21
As regards refrigeration, the current Regulation has already led to a replacement of refrigerants with
a GWP > 2 500 in most applications and natural refrigerants have been introduced widely on the mar-
ket. The significant effect can be seen in Figure 4. Centralised systems (mostly < 40 kW) and condens-
ing units are areas where further reduction in demand and emissions are still possible. Mobile air con-
ditioning applications also offer some reduction potentials, mainly for trucks.
Further potential to reduce HFC emissions is related to MDIs, where technology has significantly pro-
gressed in recent years. Alternative propellants with a GWP < 150 are already available and are ex-
pected to be available on the market starting in 2025. Depending on the ambition of the new Regulation,
these alternatives will increasingly be able to replace the currently used high-GWP propellants, leading
to lower demand and emissions in CO2 equivalents from this sector. A reduction in emissions in the
maximum substitution scenario can be achieved by transitioning from HFC-134a (GWP 1 430), and to
a much lesser extent HFC-227ea (3 220), towards HFC-152a (GWP 124) and in later years also towards
unsaturated HFC-1234ze (GWP 7). The introduction of HFC-152a is assumed also for the baseline,
with an introduction in 2025. In contrast to the maximum substitution scenario, however, the baseline
assumes a much slower transitioning away from high-GWP propellants (in absence of a strong policy
driver).
The SF6 demand is driven by filling in new electrical switchgear and to a lesser extent by the non-
ferrous metal industry. For switchgear, the majority of the SF6 demand is intended for export in equip-
ment, but manufacturing emissions occur already within the EU. Demand and emissions related to the
manufacturing of exported equipment are considered to be the same under both scenarios. Under the
baseline, a growth in the switchgear sector of ca. 2% per year in the EU is expected until 2050 and this
leads to increasing SF6 demand and emissions. The maximum substitution scenario assumes a re-
placement of SF6 in switchgear with lower-GWP alternatives. It is worth noting that a large part of the
equipment, installed in the 1980s in the EU, are expected to be disposed in the coming years. This
explains the increase in emissions in the SF6 sector in Figure 4 in the year 2025. Emission savings in
the maximum substitution scenario result from decreasing ‘use phase’ emissions due to the reduced
amount of SF6 in new switchgear equipment in the EU. The main effects on emissions of replacing SF6
with lower-GWP alternatives will be seen only after 2050, due to the very long lifetimes of switchgear
equipment of 40 to 60 years. Under the maximum substitution scenario, SF6 would be replaced in half
of the new equipment in 2030 and 95% in 2050. Notwithstanding, it would make a big impact if action
is happening quickly as many old switchgears are due for replacement in the coming years.
However, estimated emissions based on atmospheric measurements (Billen et al. 2020)13 show that
the SF6 emissions in Figure 3 may be underestimated (UNFCCC: 10,509 tonnes in 201714; estimate:
10,800 to 24,700 tonnes), which would imply that higher emission savings are possible.
3.2.2 Environmental impacts
Based on the modelling, policy options could further reduce emissions of F-gases below the baseline
while noting that the maximum substitution scenario projects the technically possible emissions savings
until 2050 regardless of the costs. Table 4 shows the reduction in demand and emissions for all modelled
F-gases for important sectors, cumulatively until 2030 and 2050.
13 Billen, P., Maes, B., Larrain, M., & Braet, J. (2020). Replacing SF6 in electrical gas-insulated switchgear: technological alter-
natives and potential life cycle greenhouse gas savings in an EU-28 perspective. Energies, 13(7), 1807. 14 UNFCCC data from 14 April 2021 (https://unfccc.int/documents/271951)

22
Table 4: Calculated reduction in demand and emissions of all modelled F-gases between the modelled baseline and maximum substitution scenario for the EU-27
Reduction in demand (Baseline vs. maximum
substitution, in Mt CO2 eq)
Reduction in emissions (Baseline vs. maximum
substitution, in Mt CO2 eq)
Sector Subsector Until 2030 Until 2050 Until 2030 Until 2050
Refrigeration 14 36 4 18
Central systems 4 14 1 7
Condensing units 5 12 1 5
Trucks and trailers 2 6 1 5
Other 2 5 1 3
Stationary AC and heat pumps
61 302 9 117
Small single splits and heat pumps
37 167 6 73
Large splits and heat pumps
21 119 3 41
Other 3 16 0 4
Mobile AC 16 60 6 45
Trucks 11 42 4 35
Other 5 21 2 17
MDIs 10 73 10 73
Switchgear 3 32 3 32
Other 0 0 1 1
Total 105 506 34 289
3.2.3 Economic impacts
Cost of technological change
As regards the economic costs to business of raising ambition, it cannot yet be fully estimated as it will
depend on the package of measures and ambition levels yet to be defined in detail. However, at this
stage it will be important to obtain reliable costs estimates for each sub-option to be able to make that
choice and an overall cost estimate for the final package of measures.
The results of the cost assessment for the maximum substitution scenario are not yet available at the
time of drafting this briefing paper. These costs will have to be benchmarked against proportionate cost
levels for other sectors including the need to reach carbon neutrality in 2050. On this basis, a propor-
tionate scenario for the emission reduction contribution from the F-gas sector l to replace HFCs by low-
GWP alternatives.
The costs of technological change will be calculated for all scenarios for different time horizons, both in
terms of absolute annual cost and specific emission reduction cost per tonne of CO2 equivalent. As the
future development of HFC prices is highly speculative, related cost to end users and distributional
effects in the HFC supply chain make sense to be assessed in high- and low-price scenarios. Macro-
economic effects (e.g. gross value added) of technological change scenarios to be derived are foreseen
to be assessed by the European Commission’s Joint Research Centre (JRC) using the GEM-E3 model.
Administrative costs as discussed in the following section are expected to constitute only a minor part
over overall cost.
23
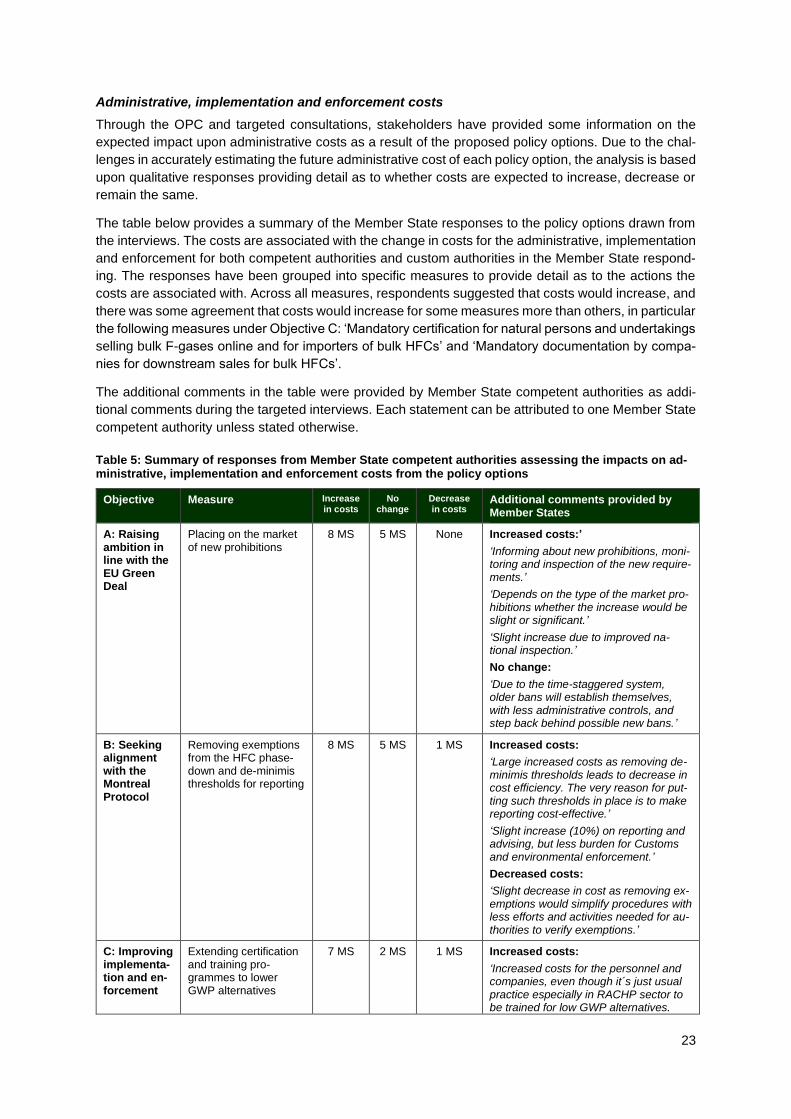
Administrative, implementation and enforcement costs
Through the OPC and targeted consultations, stakeholders have provided some information on the
expected impact upon administrative costs as a result of the proposed policy options. Due to the chal-
lenges in accurately estimating the future administrative cost of each policy option, the analysis is based
upon qualitative responses providing detail as to whether costs are expected to increase, decrease or
remain the same.
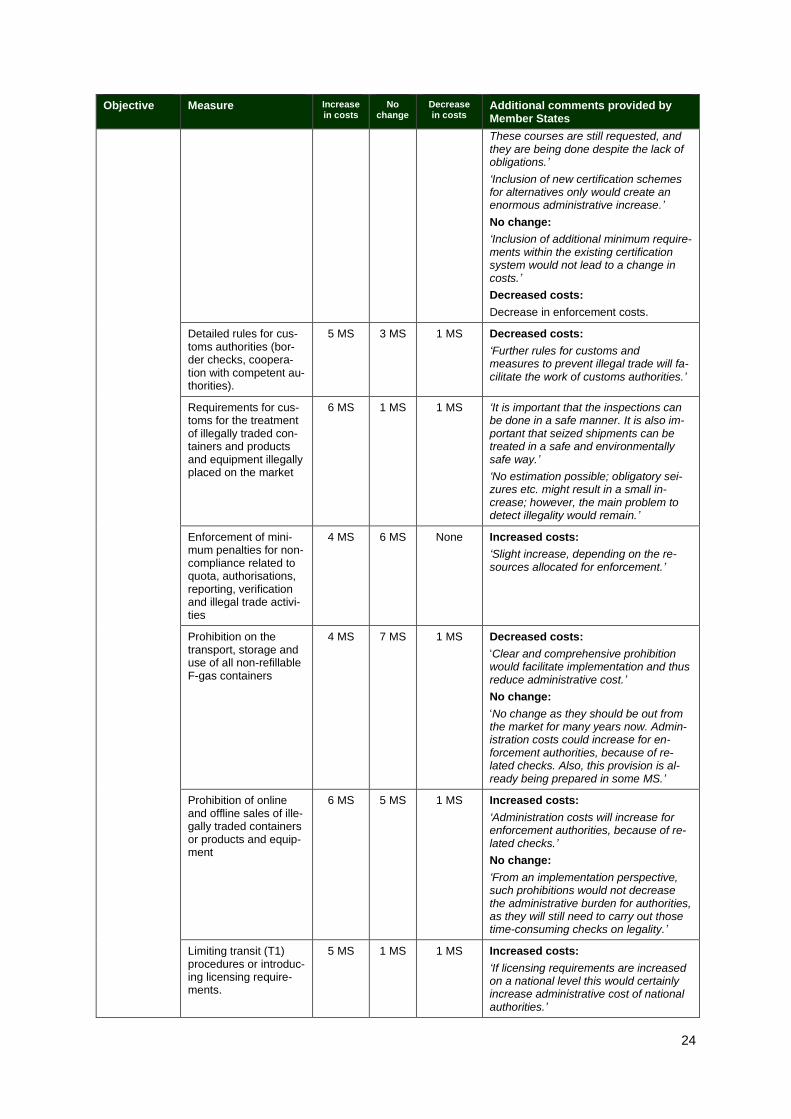
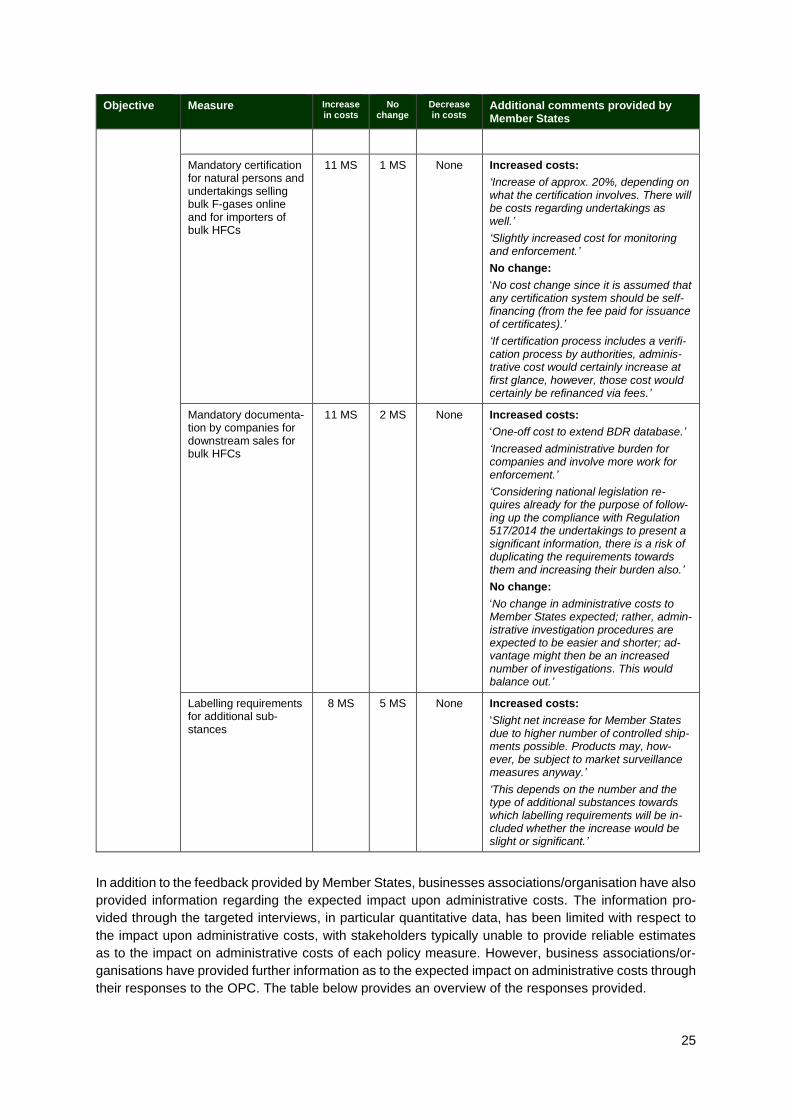
The table below provides a summary of the Member State responses to the policy options drawn from
the interviews. The costs are associated with the change in costs for the administrative, implementation
and enforcement for both competent authorities and custom authorities in the Member State respond-
ing. The responses have been grouped into specific measures to provide detail as to the actions the
costs are associated with. Across all measures, respondents suggested that costs would increase, and
there was some agreement that costs would increase for some measures more than others, in particular
the following measures under Objective C: ‘Mandatory certification for natural persons and undertakings
selling bulk F-gases online and for importers of bulk HFCs’ and ‘Mandatory documentation by compa-
nies for downstream sales for bulk HFCs’.
The additional comments in the table were provided by Member State competent authorities as addi-
tional comments during the targeted interviews. Each statement can be attributed to one Member State
competent authority unless stated otherwise.
Table 5: Summary of responses from Member State competent authorities assessing the impacts on ad-ministrative, implementation and enforcement costs from the policy options
Objective Measure Increase in costs
No change
Decrease in costs
Additional comments provided by Member States
A: Raising ambition in line with the EU Green Deal
Placing on the market of new prohibitions
8 MS
5 MS None Increased costs:’
‘Informing about new prohibitions, moni-toring and inspection of the new require-ments.’
‘Depends on the type of the market pro-hibitions whether the increase would be slight or significant.’
‘Slight increase due to improved na-tional inspection.’
No change:
‘Due to the time-staggered system, older bans will establish themselves, with less administrative controls, and step back behind possible new bans.’
B: Seeking alignment with the Montreal Protocol
Removing exemptions from the HFC phase-down and de-minimis thresholds for reporting
8 MS 5 MS 1 MS Increased costs:
‘Large increased costs as removing de-minimis thresholds leads to decrease in cost efficiency. The very reason for put-ting such thresholds in place is to make reporting cost-effective.’
‘Slight increase (10%) on reporting and advising, but less burden for Customs and environmental enforcement.’
Decreased costs:
‘Slight decrease in cost as removing ex-emptions would simplify procedures with less efforts and activities needed for au-thorities to verify exemptions.’
C: Improving implementa-tion and en-forcement
Extending certification and training pro-grammes to lower GWP alternatives
7 MS 2 MS 1 MS Increased costs:
‘Increased costs for the personnel and companies, even though it´s just usual practice especially in RACHP sector to be trained for low GWP alternatives.
24
Objective Measure Increase in costs
No change
Decrease in costs
Additional comments provided by Member States
These courses are still requested, and they are being done despite the lack of obligations.’
‘Inclusion of new certification schemes for alternatives only would create an enormous administrative increase.’
No change:
‘Inclusion of additional minimum require-ments within the existing certification system would not lead to a change in costs.’
Decreased costs:
Decrease in enforcement costs.
Detailed rules for cus-toms authorities (bor-der checks, coopera-tion with competent au-thorities).
5 MS 3 MS 1 MS Decreased costs:
‘Further rules for customs and measures to prevent illegal trade will fa-cilitate the work of customs authorities.’
Requirements for cus-toms for the treatment of illegally traded con-tainers and products and equipment illegally placed on the market
6 MS 1 MS 1 MS ‘It is important that the inspections can be done in a safe manner. It is also im-portant that seized shipments can be treated in a safe and environmentally safe way.’
‘No estimation possible; obligatory sei-zures etc. might result in a small in-crease; however, the main problem to detect illegality would remain.’
Enforcement of mini-mum penalties for non-compliance related to quota, authorisations, reporting, verification and illegal trade activi-ties
4 MS 6 MS None Increased costs:
‘Slight increase, depending on the re-sources allocated for enforcement.’
Prohibition on the transport, storage and use of all non-refillable F-gas containers
4 MS 7 MS 1 MS Decreased costs:
‘Clear and comprehensive prohibition would facilitate implementation and thus reduce administrative cost.’
No change:
‘No change as they should be out from the market for many years now. Admin-istration costs could increase for en-forcement authorities, because of re-lated checks. Also, this provision is al-ready being prepared in some MS.’
Prohibition of online and offline sales of ille-gally traded containers or products and equip-ment
6 MS 5 MS 1 MS Increased costs:
‘Administration costs will increase for enforcement authorities, because of re-lated checks.’
No change:
‘From an implementation perspective, such prohibitions would not decrease the administrative burden for authorities, as they will still need to carry out those time-consuming checks on legality.’
Limiting transit (T1) procedures or introduc-ing licensing require-ments.
5 MS 1 MS 1 MS Increased costs:
‘If licensing requirements are increased on a national level this would certainly increase administrative cost of national authorities.’
25
Objective Measure Increase in costs
No change
Decrease in costs
Additional comments provided by Member States
Mandatory certification for natural persons and undertakings selling bulk F-gases online and for importers of bulk HFCs
11 MS 1 MS None Increased costs:
‘Increase of approx. 20%, depending on what the certification involves. There will be costs regarding undertakings as well.’
‘Slightly increased cost for monitoring and enforcement.’
No change:
‘No cost change since it is assumed that any certification system should be self-financing (from the fee paid for issuance of certificates).’
‘If certification process includes a verifi-cation process by authorities, adminis-trative cost would certainly increase at first glance, however, those cost would certainly be refinanced via fees.’
Mandatory documenta-tion by companies for downstream sales for bulk HFCs
11 MS 2 MS None Increased costs:
‘One-off cost to extend BDR database.’
‘Increased administrative burden for companies and involve more work for enforcement.’
‘Considering national legislation re-quires already for the purpose of follow-ing up the compliance with Regulation 517/2014 the undertakings to present a significant information, there is a risk of duplicating the requirements towards them and increasing their burden also.’
No change:
‘No change in administrative costs to Member States expected; rather, admin-istrative investigation procedures are expected to be easier and shorter; ad-vantage might then be an increased number of investigations. This would balance out.’
Labelling requirements for additional sub-stances
8 MS 5 MS None Increased costs:
‘Slight net increase for Member States due to higher number of controlled ship-ments possible. Products may, how-ever, be subject to market surveillance measures anyway.’
‘This depends on the number and the type of additional substances towards which labelling requirements will be in-cluded whether the increase would be slight or significant.’
In addition to the feedback provided by Member States, businesses associations/organisation have also
provided information regarding the expected impact upon administrative costs. The information pro-
vided through the targeted interviews, in particular quantitative data, has been limited with respect to
the impact upon administrative costs, with stakeholders typically unable to provide reliable estimates
as to the impact on administrative costs of each policy measure. However, business associations/or-
ganisations have provided further information as to the expected impact on administrative costs through
their responses to the OPC. The table below provides an overview of the responses provided.
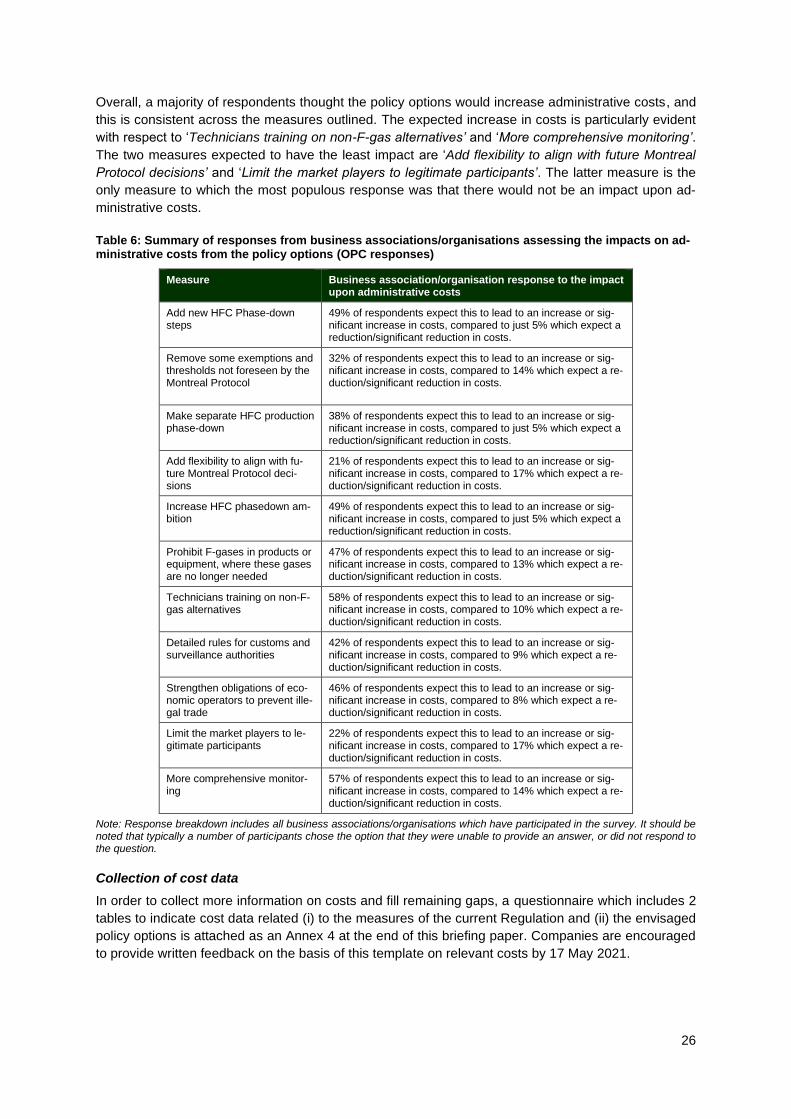
26
Overall, a majority of respondents thought the policy options would increase administrative costs, and
this is consistent across the measures outlined. The expected increase in costs is particularly evident
with respect to ‘Technicians training on non-F-gas alternatives’ and ‘More comprehensive monitoring’.
The two measures expected to have the least impact are ‘Add flexibility to align with future Montreal
Protocol decisions’ and ‘Limit the market players to legitimate participants’. The latter measure is the
only measure to which the most populous response was that there would not be an impact upon ad-
ministrative costs.
Table 6: Summary of responses from business associations/organisations assessing the impacts on ad-ministrative costs from the policy options (OPC responses)
Measure Business association/organisation response to the impact upon administrative costs
Add new HFC Phase-down steps
49% of respondents expect this to lead to an increase or sig-nificant increase in costs, compared to just 5% which expect a reduction/significant reduction in costs.
Remove some exemptions and thresholds not foreseen by the Montreal Protocol
32% of respondents expect this to lead to an increase or sig-nificant increase in costs, compared to 14% which expect a re-duction/significant reduction in costs.
Make separate HFC production phase-down
38% of respondents expect this to lead to an increase or sig-nificant increase in costs, compared to just 5% which expect a reduction/significant reduction in costs.
Add flexibility to align with fu-ture Montreal Protocol deci-sions
21% of respondents expect this to lead to an increase or sig-nificant increase in costs, compared to 17% which expect a re-duction/significant reduction in costs.
Increase HFC phasedown am-bition
49% of respondents expect this to lead to an increase or sig-nificant increase in costs, compared to just 5% which expect a reduction/significant reduction in costs.
Prohibit F-gases in products or equipment, where these gases are no longer needed
47% of respondents expect this to lead to an increase or sig-nificant increase in costs, compared to 13% which expect a re-duction/significant reduction in costs.
Technicians training on non-F-gas alternatives
58% of respondents expect this to lead to an increase or sig-nificant increase in costs, compared to 10% which expect a re-duction/significant reduction in costs.
Detailed rules for customs and surveillance authorities
42% of respondents expect this to lead to an increase or sig-nificant increase in costs, compared to 9% which expect a re-duction/significant reduction in costs.
Strengthen obligations of eco-nomic operators to prevent ille-gal trade
46% of respondents expect this to lead to an increase or sig-nificant increase in costs, compared to 8% which expect a re-duction/significant reduction in costs.
Limit the market players to le-gitimate participants
22% of respondents expect this to lead to an increase or sig-nificant increase in costs, compared to 17% which expect a re-duction/significant reduction in costs.
More comprehensive monitor-ing
57% of respondents expect this to lead to an increase or sig-nificant increase in costs, compared to 14% which expect a re-duction/significant reduction in costs.
Note: Response breakdown includes all business associations/organisations which have participated in the survey. It should be noted that typically a number of participants chose the option that they were unable to provide an answer, or did not respond to the question.
Collection of cost data
In order to collect more information on costs and fill remaining gaps, a questionnaire which includes 2
tables to indicate cost data related (i) to the measures of the current Regulation and (ii) the envisaged
policy options is attached as an Annex 4 at the end of this briefing paper. Companies are encouraged
to provide written feedback on the basis of this template on relevant costs by 17 May 2021.
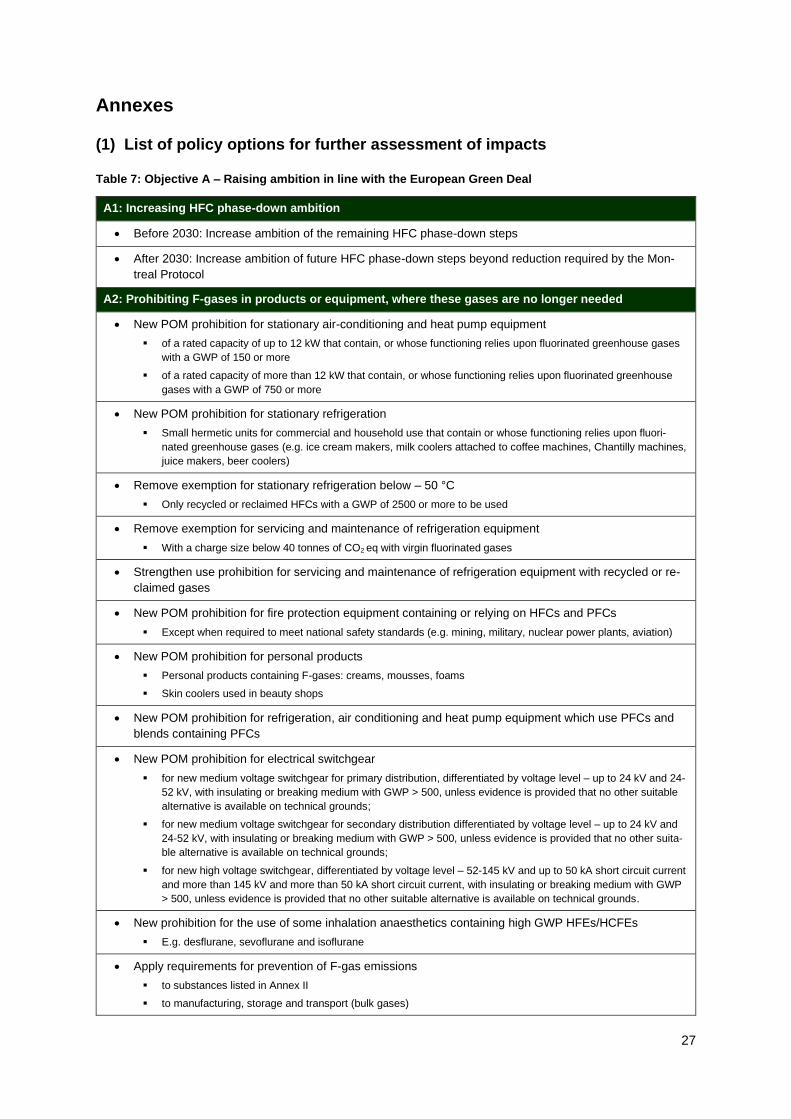
27
Annexes
(1) List of policy options for further assessment of impacts
Table 7: Objective A – Raising ambition in line with the European Green Deal
A1: Increasing HFC phase-down ambition
• Before 2030: Increase ambition of the remaining HFC phase-down steps
• After 2030: Increase ambition of future HFC phase-down steps beyond reduction required by the Mon-
treal Protocol
A2: Prohibiting F-gases in products or equipment, where these gases are no longer needed
• New POM prohibition for stationary air-conditioning and heat pump equipment
▪ of a rated capacity of up to 12 kW that contain, or whose functioning relies upon fluorinated greenhouse gases
with a GWP of 150 or more
▪ of a rated capacity of more than 12 kW that contain, or whose functioning relies upon fluorinated greenhouse
gases with a GWP of 750 or more
• New POM prohibition for stationary refrigeration
▪ Small hermetic units for commercial and household use that contain or whose functioning relies upon fluori-
nated greenhouse gases (e.g. ice cream makers, milk coolers attached to coffee machines, Chantilly machines,
juice makers, beer coolers)
• Remove exemption for stationary refrigeration below – 50 °C
▪ Only recycled or reclaimed HFCs with a GWP of 2500 or more to be used
• Remove exemption for servicing and maintenance of refrigeration equipment
▪ With a charge size below 40 tonnes of CO2 eq with virgin fluorinated gases
• Strengthen use prohibition for servicing and maintenance of refrigeration equipment with recycled or re-
claimed gases
• New POM prohibition for fire protection equipment containing or relying on HFCs and PFCs
▪ Except when required to meet national safety standards (e.g. mining, military, nuclear power plants, aviation)
• New POM prohibition for personal products
▪ Personal products containing F-gases: creams, mousses, foams
▪ Skin coolers used in beauty shops
• New POM prohibition for refrigeration, air conditioning and heat pump equipment which use PFCs and
blends containing PFCs
• New POM prohibition for electrical switchgear
▪ for new medium voltage switchgear for primary distribution, differentiated by voltage level – up to 24 kV and 24-
52 kV, with insulating or breaking medium with GWP > 500, unless evidence is provided that no other suitable
alternative is available on technical grounds;
▪ for new medium voltage switchgear for secondary distribution differentiated by voltage level – up to 24 kV and
24-52 kV, with insulating or breaking medium with GWP > 500, unless evidence is provided that no other suita-
ble alternative is available on technical grounds;
▪ for new high voltage switchgear, differentiated by voltage level – 52-145 kV and up to 50 kA short circuit current
and more than 145 kV and more than 50 kA short circuit current, with insulating or breaking medium with GWP
> 500, unless evidence is provided that no other suitable alternative is available on technical grounds.
• New prohibition for the use of some inhalation anaesthetics containing high GWP HFEs/HCFEs
▪ E.g. desflurane, sevoflurane and isoflurane
• Apply requirements for prevention of F-gas emissions
▪ to substances listed in Annex II
▪ to manufacturing, storage and transport (bulk gases)
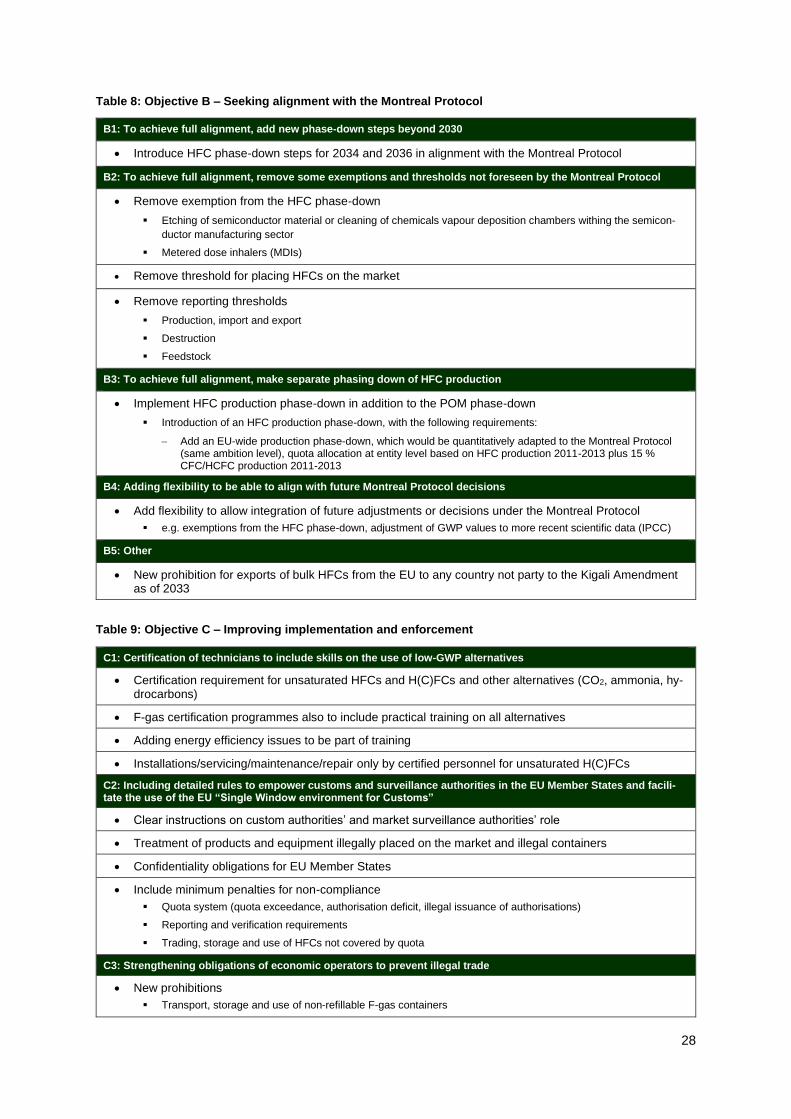
28
Table 8: Objective B – Seeking alignment with the Montreal Protocol
B1: To achieve full alignment, add new phase-down steps beyond 2030
• Introduce HFC phase-down steps for 2034 and 2036 in alignment with the Montreal Protocol
B2: To achieve full alignment, remove some exemptions and thresholds not foreseen by the Montreal Protocol
• Remove exemption from the HFC phase-down
▪ Etching of semiconductor material or cleaning of chemicals vapour deposition chambers withing the semicon-
ductor manufacturing sector
▪ Metered dose inhalers (MDIs)
• Remove threshold for placing HFCs on the market
• Remove reporting thresholds
▪ Production, import and export
▪ Destruction
▪ Feedstock
B3: To achieve full alignment, make separate phasing down of HFC production
• Implement HFC production phase-down in addition to the POM phase-down
▪ Introduction of an HFC production phase-down, with the following requirements:
− Add an EU-wide production phase-down, which would be quantitatively adapted to the Montreal Protocol (same ambition level), quota allocation at entity level based on HFC production 2011-2013 plus 15 % CFC/HCFC production 2011-2013
B4: Adding flexibility to be able to align with future Montreal Protocol decisions
• Add flexibility to allow integration of future adjustments or decisions under the Montreal Protocol
▪ e.g. exemptions from the HFC phase-down, adjustment of GWP values to more recent scientific data (IPCC)
B5: Other
• New prohibition for exports of bulk HFCs from the EU to any country not party to the Kigali Amendment as of 2033
Table 9: Objective C – Improving implementation and enforcement
C1: Certification of technicians to include skills on the use of low-GWP alternatives
• Certification requirement for unsaturated HFCs and H(C)FCs and other alternatives (CO2, ammonia, hy-drocarbons)
• F-gas certification programmes also to include practical training on all alternatives
• Adding energy efficiency issues to be part of training
• Installations/servicing/maintenance/repair only by certified personnel for unsaturated H(C)FCs
C2: Including detailed rules to empower customs and surveillance authorities in the EU Member States and facili-tate the use of the EU “Single Window environment for Customs”
• Clear instructions on custom authorities’ and market surveillance authorities’ role
• Treatment of products and equipment illegally placed on the market and illegal containers
• Confidentiality obligations for EU Member States
• Include minimum penalties for non-compliance
▪ Quota system (quota exceedance, authorisation deficit, illegal issuance of authorisations)
▪ Reporting and verification requirements
▪ Trading, storage and use of HFCs not covered by quota
C3: Strengthening obligations of economic operators to prevent illegal trade
• New prohibitions
▪ Transport, storage and use of non-refillable F-gas containers
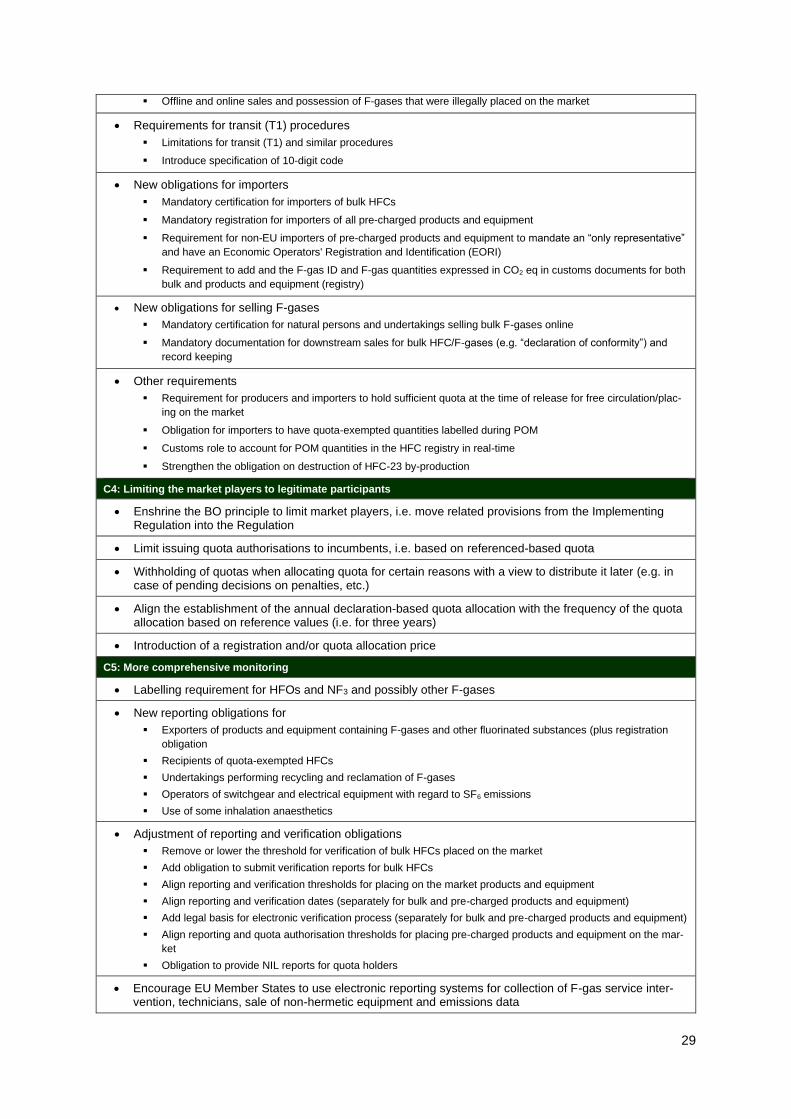
29
▪ Offline and online sales and possession of F-gases that were illegally placed on the market
• Requirements for transit (T1) procedures
▪ Limitations for transit (T1) and similar procedures
▪ Introduce specification of 10-digit code
• New obligations for importers
▪ Mandatory certification for importers of bulk HFCs
▪ Mandatory registration for importers of all pre-charged products and equipment
▪ Requirement for non-EU importers of pre-charged products and equipment to mandate an “only representative”
and have an Economic Operators' Registration and Identification (EORI)
▪ Requirement to add and the F-gas ID and F-gas quantities expressed in CO2 eq in customs documents for both
bulk and products and equipment (registry)
• New obligations for selling F-gases
▪ Mandatory certification for natural persons and undertakings selling bulk F-gases online
▪ Mandatory documentation for downstream sales for bulk HFC/F-gases (e.g. “declaration of conformity”) and
record keeping
• Other requirements
▪ Requirement for producers and importers to hold sufficient quota at the time of release for free circulation/plac-
ing on the market
▪ Obligation for importers to have quota-exempted quantities labelled during POM
▪ Customs role to account for POM quantities in the HFC registry in real-time
▪ Strengthen the obligation on destruction of HFC-23 by-production
C4: Limiting the market players to legitimate participants
• Enshrine the BO principle to limit market players, i.e. move related provisions from the Implementing Regulation into the Regulation
• Limit issuing quota authorisations to incumbents, i.e. based on referenced-based quota
• Withholding of quotas when allocating quota for certain reasons with a view to distribute it later (e.g. in case of pending decisions on penalties, etc.)
• Align the establishment of the annual declaration-based quota allocation with the frequency of the quota allocation based on reference values (i.e. for three years)
• Introduction of a registration and/or quota allocation price
C5: More comprehensive monitoring
• Labelling requirement for HFOs and NF3 and possibly other F-gases
• New reporting obligations for
▪ Exporters of products and equipment containing F-gases and other fluorinated substances (plus registration
obligation
▪ Recipients of quota-exempted HFCs
▪ Undertakings performing recycling and reclamation of F-gases
▪ Operators of switchgear and electrical equipment with regard to SF6 emissions
▪ Use of some inhalation anaesthetics
• Adjustment of reporting and verification obligations
▪ Remove or lower the threshold for verification of bulk HFCs placed on the market
▪ Add obligation to submit verification reports for bulk HFCs
▪ Align reporting and verification thresholds for placing on the market products and equipment
▪ Align reporting and verification dates (separately for bulk and pre-charged products and equipment)
▪ Add legal basis for electronic verification process (separately for bulk and pre-charged products and equipment)
▪ Align reporting and quota authorisation thresholds for placing pre-charged products and equipment on the mar-
ket
▪ Obligation to provide NIL reports for quota holders
• Encourage EU Member States to use electronic reporting systems for collection of F-gas service inter-vention, technicians, sale of non-hermetic equipment and emissions data
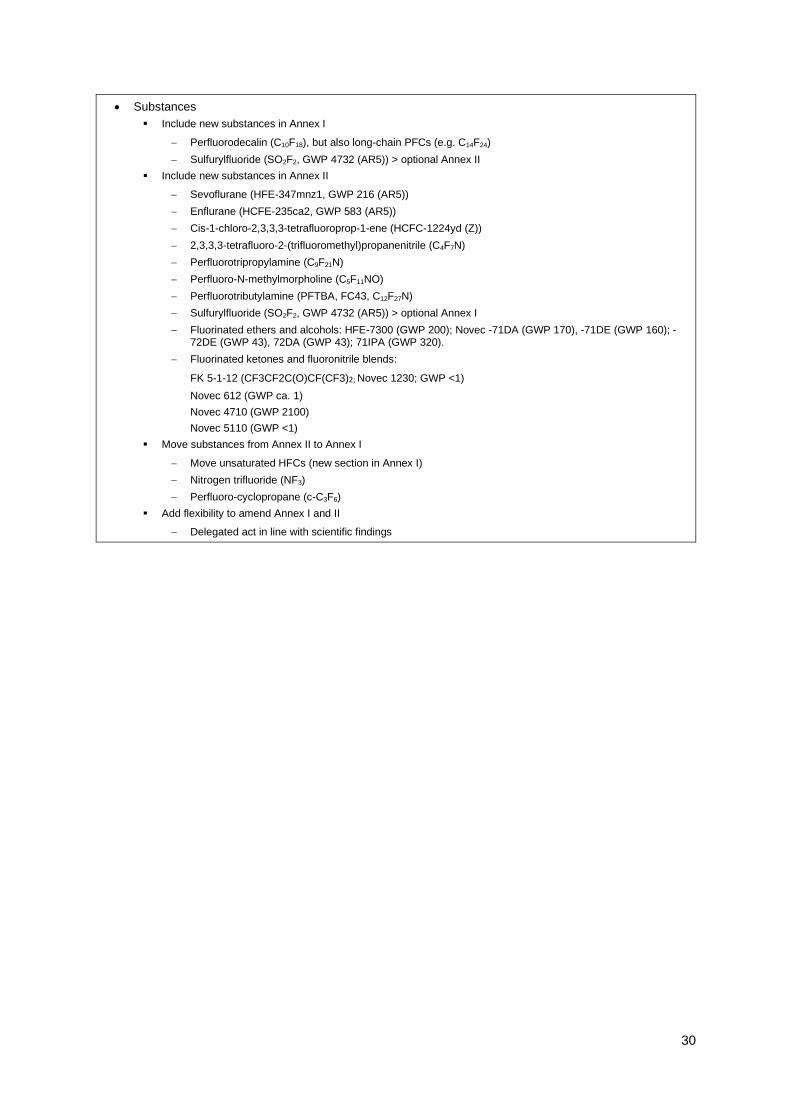
30
• Substances
▪ Include new substances in Annex I
− Perfluorodecalin (C10F18), but also long-chain PFCs (e.g. C14F24)
− Sulfurylfluoride (SO2F2, GWP 4732 (AR5)) > optional Annex II
▪ Include new substances in Annex II
− Sevoflurane (HFE-347mnz1, GWP 216 (AR5))
− Enflurane (HCFE-235ca2, GWP 583 (AR5))
− Cis-1-chloro-2,3,3,3-tetrafluoroprop-1-ene (HCFC-1224yd (Z))
− 2,3,3,3-tetrafluoro-2-(trifluoromethyl)propanenitrile (C4F7N)
− Perfluorotripropylamine (C9F21N)
− Perfluoro-N-methylmorpholine (C5F11NO)
− Perfluorotributylamine (PFTBA, FC43, C12F27N)
− Sulfurylfluoride (SO2F2, GWP 4732 (AR5)) > optional Annex I
− Fluorinated ethers and alcohols: HFE-7300 (GWP 200); Novec -71DA (GWP 170), -71DE (GWP 160); -72DE (GWP 43), 72DA (GWP 43); 71IPA (GWP 320).
− Fluorinated ketones and fluoronitrile blends:
FK 5-1-12 (CF3CF2C(O)CF(CF3)2; Novec 1230; GWP <1)
Novec 612 (GWP ca. 1)
Novec 4710 (GWP 2100)
Novec 5110 (GWP <1)
▪ Move substances from Annex II to Annex I
− Move unsaturated HFCs (new section in Annex I)
− Nitrogen trifluoride (NF3)
− Perfluoro-cyclopropane (c-C3F6)
▪ Add flexibility to amend Annex I and II
− Delegated act in line with scientific findings
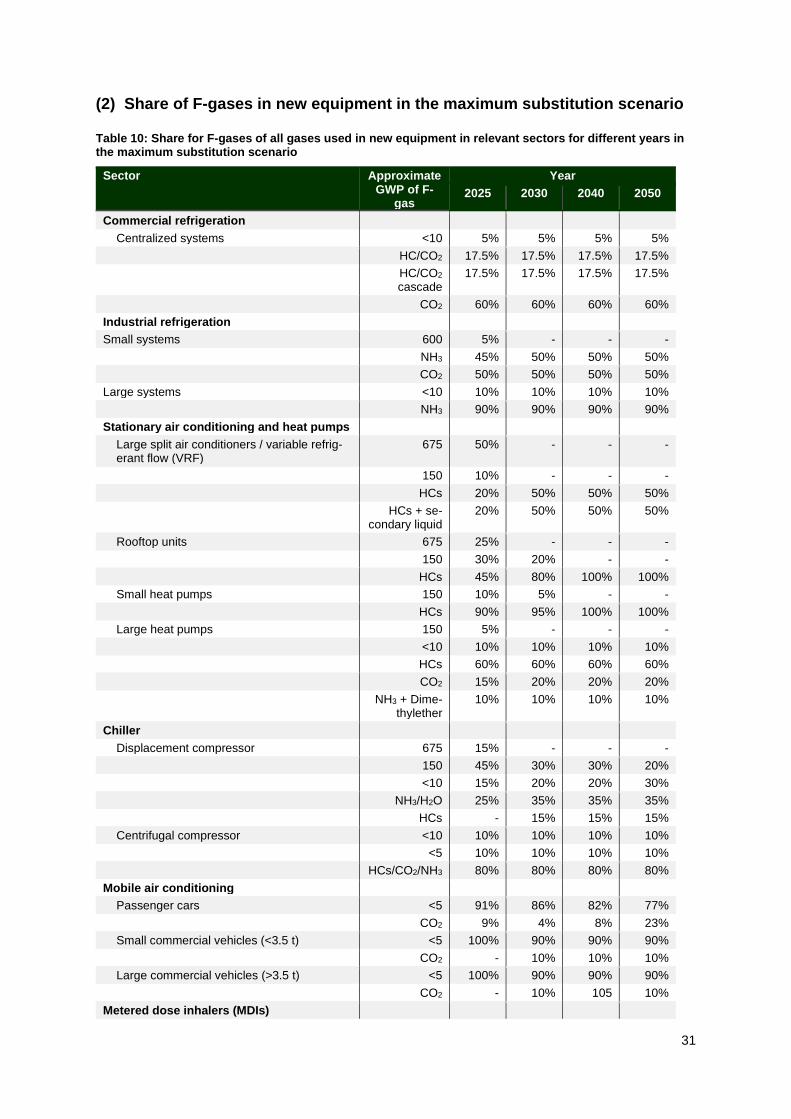
31
(2) Share of F-gases in new equipment in the maximum substitution scenario
Table 10: Share for F-gases of all gases used in new equipment in relevant sectors for different years in the maximum substitution scenario
Sector Approximate GWP of F-
gas
Year
2025 2030 2040 2050
Commercial refrigeration
Centralized systems <10 5% 5% 5% 5%
HC/CO2 17.5% 17.5% 17.5% 17.5%
HC/CO2 cascade
17.5% 17.5% 17.5% 17.5%
CO2 60% 60% 60% 60%
Industrial refrigeration
Small systems 600 5% - - -
NH3 45% 50% 50% 50%
CO2 50% 50% 50% 50%
Large systems <10 10% 10% 10% 10%
NH3 90% 90% 90% 90%
Stationary air conditioning and heat pumps
Large split air conditioners / variable refrig-erant flow (VRF)
675 50% - - -
150 10% - - -
HCs 20% 50% 50% 50%
HCs + se-condary liquid
20% 50% 50% 50%
Rooftop units 675 25% - - -
150 30% 20% - -
HCs 45% 80% 100% 100%
Small heat pumps 150 10% 5% - -
HCs 90% 95% 100% 100%
Large heat pumps 150 5% - - -
<10 10% 10% 10% 10%
HCs 60% 60% 60% 60%
CO2 15% 20% 20% 20%
NH3 + Dime-thylether
10% 10% 10% 10%
Chiller
Displacement compressor 675 15% - - -
150 45% 30% 30% 20%
<10 15% 20% 20% 30%
NH3/H2O 25% 35% 35% 35%
HCs - 15% 15% 15%
Centrifugal compressor <10 10% 10% 10% 10%
<5 10% 10% 10% 10%
HCs/CO2/NH3 80% 80% 80% 80%
Mobile air conditioning
Passenger cars <5 91% 86% 82% 77%
CO2 9% 4% 8% 23%
Small commercial vehicles (<3.5 t) <5 100% 90% 90% 90%
CO2 - 10% 10% 10%
Large commercial vehicles (>3.5 t) <5 100% 90% 90% 90%
CO2 - 10% 105 10%
Metered dose inhalers (MDIs)
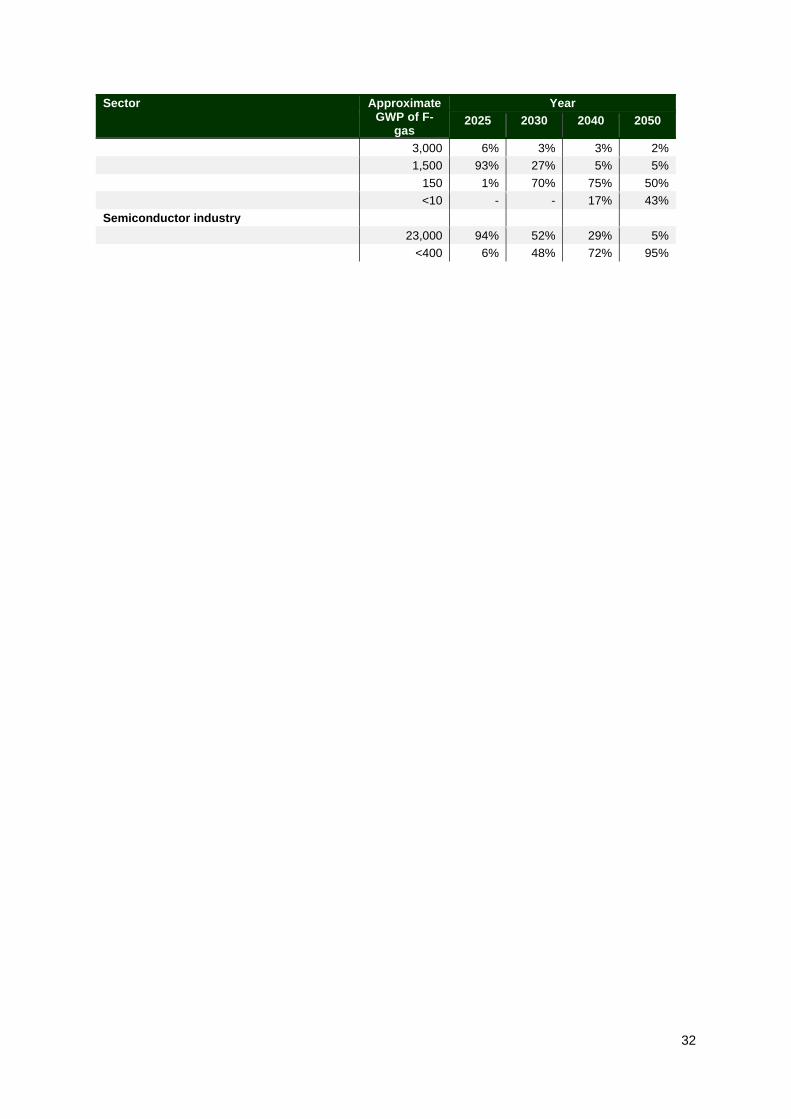
32
Sector Approximate GWP of F-
gas
Year
2025 2030 2040 2050
3,000 6% 3% 3% 2%
1,500 93% 27% 5% 5%
150 1% 70% 75% 50%
<10 - - 17% 43%
Semiconductor industry
23,000 94% 52% 29% 5%
<400 6% 48% 72% 95%
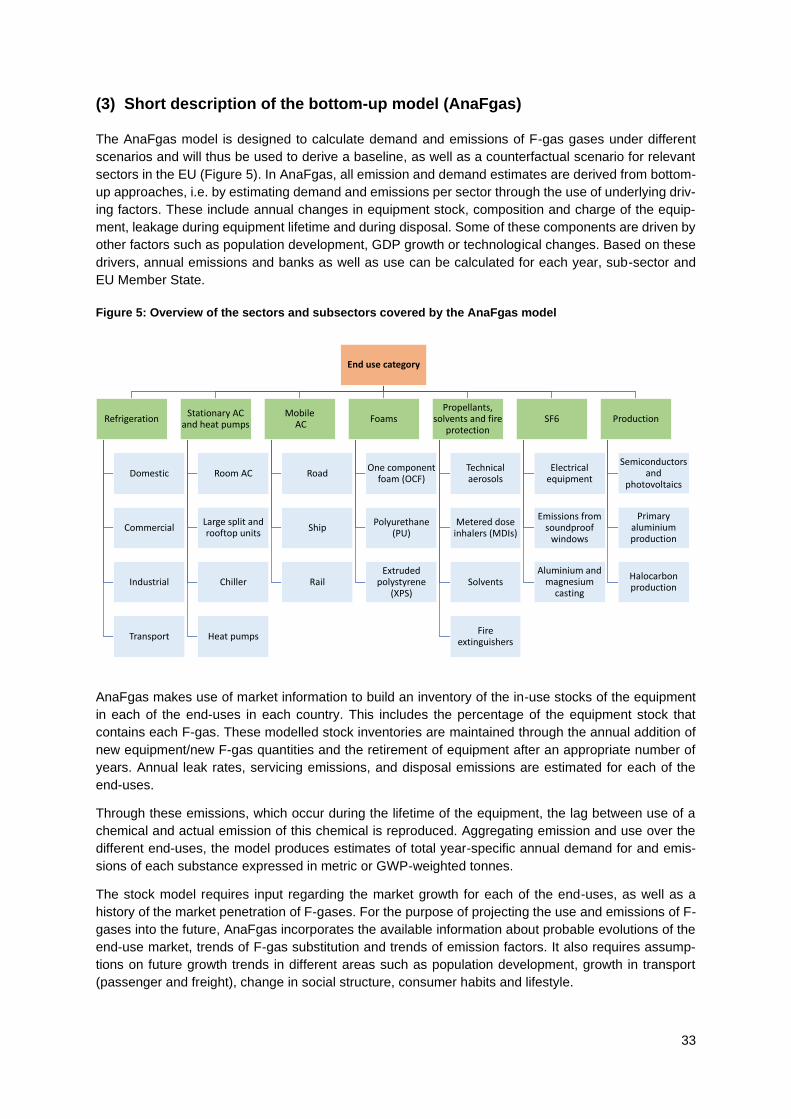
33
(3) Short description of the bottom-up model (AnaFgas)
The AnaFgas model is designed to calculate demand and emissions of F-gas gases under different
scenarios and will thus be used to derive a baseline, as well as a counterfactual scenario for relevant
sectors in the EU (Figure 5). In AnaFgas, all emission and demand estimates are derived from bottom-
up approaches, i.e. by estimating demand and emissions per sector through the use of underlying driv-
ing factors. These include annual changes in equipment stock, composition and charge of the equip-
ment, leakage during equipment lifetime and during disposal. Some of these components are driven by
other factors such as population development, GDP growth or technological changes. Based on these
drivers, annual emissions and banks as well as use can be calculated for each year, sub-sector and
EU Member State.
Figure 5: Overview of the sectors and subsectors covered by the AnaFgas model
AnaFgas makes use of market information to build an inventory of the in-use stocks of the equipment
in each of the end-uses in each country. This includes the percentage of the equipment stock that
contains each F-gas. These modelled stock inventories are maintained through the annual addition of
new equipment/new F-gas quantities and the retirement of equipment after an appropriate number of
years. Annual leak rates, servicing emissions, and disposal emissions are estimated for each of the
end-uses.
Through these emissions, which occur during the lifetime of the equipment, the lag between use of a
chemical and actual emission of this chemical is reproduced. Aggregating emission and use over the
different end-uses, the model produces estimates of total year-specific annual demand for and emis-
sions of each substance expressed in metric or GWP-weighted tonnes.
The stock model requires input regarding the market growth for each of the end-uses, as well as a
history of the market penetration of F-gases. For the purpose of projecting the use and emissions of F-
gases into the future, AnaFgas incorporates the available information about probable evolutions of the
end-use market, trends of F-gas substitution and trends of emission factors. It also requires assump-
tions on future growth trends in different areas such as population development, growth in transport
(passenger and freight), change in social structure, consumer habits and lifestyle.
End use category
Refrigeration
Domestic
Commercial
Industrial
Transport
Stationary AC and heat pumps
Room AC
Large split and rooftop units
Chiller
Heat pumps
MobileAC
Road
Ship
Rail
Foams
One component foam (OCF)
Polyurethane (PU)
Extruded polystyrene
(XPS)
Propellants, solvents and fire
protection
Technical aerosols
Metered dose inhalers (MDIs)
Solvents
Fire extinguishers
SF6
Electrical equipment
Emissions from soundproof
windows
Aluminium and magnesium
casting
Production
Semiconductors and
photovoltaics
Primary aluminium production
Halocarbon production
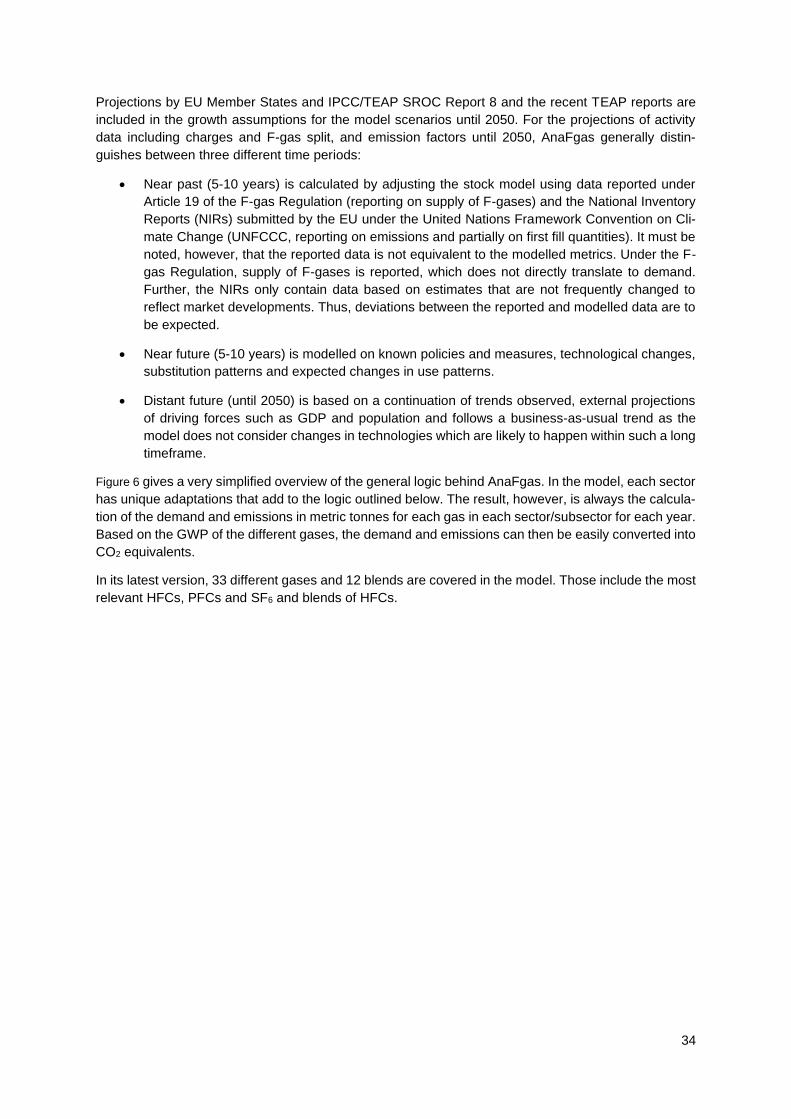
34
Projections by EU Member States and IPCC/TEAP SROC Report 8 and the recent TEAP reports are
included in the growth assumptions for the model scenarios until 2050. For the projections of activity
data including charges and F-gas split, and emission factors until 2050, AnaFgas generally distin-
guishes between three different time periods:
• Near past (5-10 years) is calculated by adjusting the stock model using data reported under
Article 19 of the F-gas Regulation (reporting on supply of F-gases) and the National Inventory
Reports (NIRs) submitted by the EU under the United Nations Framework Convention on Cli-
mate Change (UNFCCC, reporting on emissions and partially on first fill quantities). It must be
noted, however, that the reported data is not equivalent to the modelled metrics. Under the F-
gas Regulation, supply of F-gases is reported, which does not directly translate to demand.
Further, the NIRs only contain data based on estimates that are not frequently changed to
reflect market developments. Thus, deviations between the reported and modelled data are to
be expected.
• Near future (5-10 years) is modelled on known policies and measures, technological changes,
substitution patterns and expected changes in use patterns.
• Distant future (until 2050) is based on a continuation of trends observed, external projections
of driving forces such as GDP and population and follows a business-as-usual trend as the
model does not consider changes in technologies which are likely to happen within such a long
timeframe.
Figure 6 gives a very simplified overview of the general logic behind AnaFgas. In the model, each sector
has unique adaptations that add to the logic outlined below. The result, however, is always the calcula-
tion of the demand and emissions in metric tonnes for each gas in each sector/subsector for each year.
Based on the GWP of the different gases, the demand and emissions can then be easily converted into
CO2 equivalents.
In its latest version, 33 different gases and 12 blends are covered in the model. Those include the most
relevant HFCs, PFCs and SF6 and blends of HFCs.
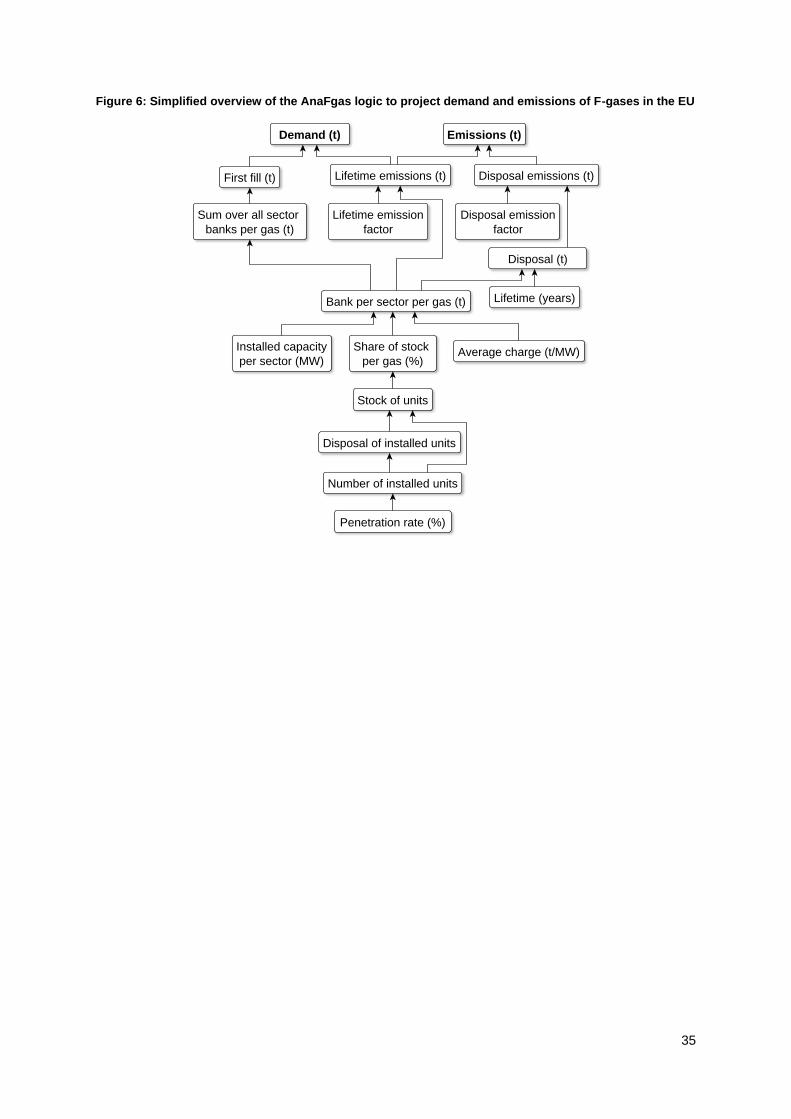
35
Figure 6: Simplified overview of the AnaFgas logic to project demand and emissions of F-gases in the EU
Lifetime emissions (t) Disposal emissions (t)
Demand (t)
First fill (t)
Disposal (t)
Disposal emission
factor
Penetration rate (%)
Bank per sector per gas (t)
Number of installed units
Lifetime emission
factor
Installed capacity
per sector (MW)Average charge (t/MW)
Sum over all sector
banks per gas (t)
Lifetime (years)
Share of stock
per gas (%)
Stock of units
Disposal of installed units
Emissions (t)
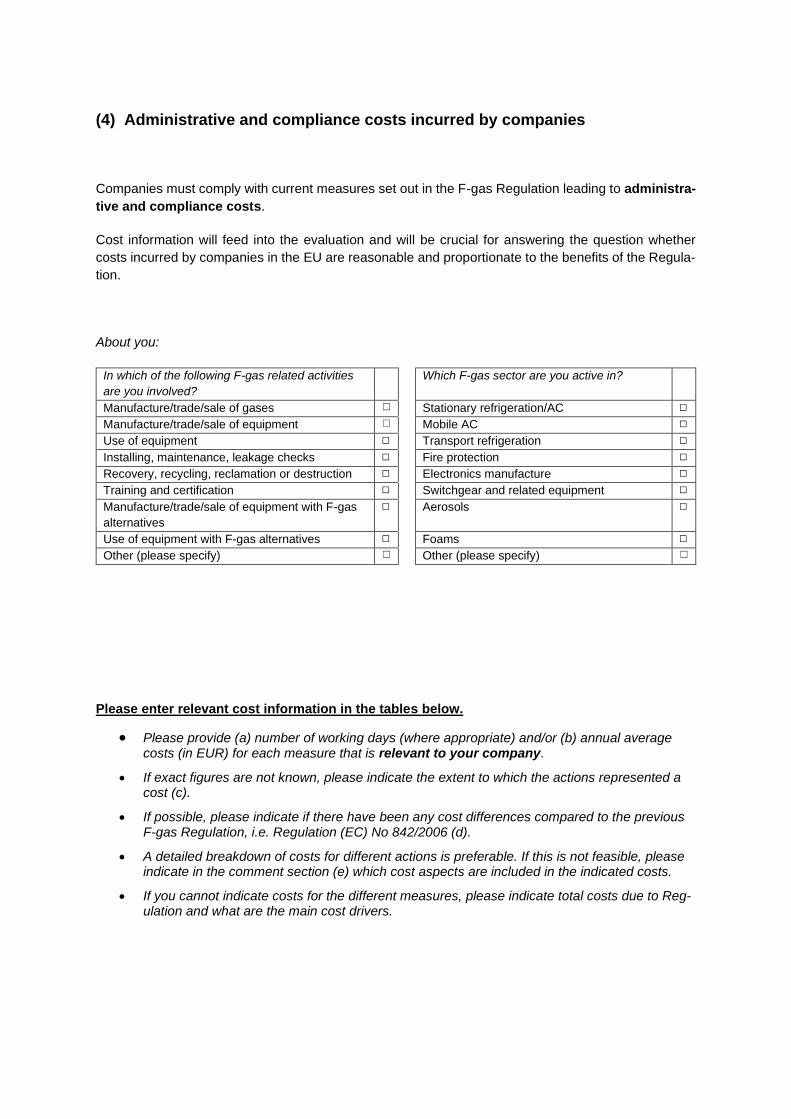
(4) Administrative and compliance costs incurred by companies
Companies must comply with current measures set out in the F-gas Regulation leading to administra-
tive and compliance costs.
Cost information will feed into the evaluation and will be crucial for answering the question whether
costs incurred by companies in the EU are reasonable and proportionate to the benefits of the Regula-
tion.
About you:
In which of the following F-gas related activities
are you involved?
Which F-gas sector are you active in?
Manufacture/trade/sale of gases ☐ Stationary refrigeration/AC ☐
Manufacture/trade/sale of equipment ☐ Mobile AC ☐
Use of equipment ☐ Transport refrigeration ☐
Installing, maintenance, leakage checks ☐ Fire protection ☐
Recovery, recycling, reclamation or destruction ☐ Electronics manufacture ☐
Training and certification ☐ Switchgear and related equipment ☐
Manufacture/trade/sale of equipment with F-gas
alternatives
☐ Aerosols ☐
Use of equipment with F-gas alternatives ☐ Foams ☐
Other (please specify) ☐ Other (please specify) ☐
Please enter relevant cost information in the tables below.
• Please provide (a) number of working days (where appropriate) and/or (b) annual average costs (in EUR) for each measure that is relevant to your company.
• If exact figures are not known, please indicate the extent to which the actions represented a cost (c).
• If possible, please indicate if there have been any cost differences compared to the previous F-gas Regulation, i.e. Regulation (EC) No 842/2006 (d).
• A detailed breakdown of costs for different actions is preferable. If this is not feasible, please indicate in the comment section (e) which cost aspects are included in the indicated costs.
• If you cannot indicate costs for the different measures, please indicate total costs due to Reg-ulation and what are the main cost drivers.

Table 11: Administrative and compliance costs related to the current measures of the Regulation
Measure Example activities
(a)
No of working days per year
AND/OR
(b)
Average cost per year (in EUR)
(c)
Extent to which the ac-tions represent a cost
Do not know / no costs / minor costs / medium
costs / high costs / very high costs
(d)
Have there been any cost differences com-pared to Regulation (EC) No 842/2006?
(e)
Any comments linked to these administrative and compliance costs and whether the fig-
ures are certain or an estimate
Prevention of F-gas emissions (Article 3 and Article 7)
− Taking precautions to prevent unin-tentional release (‘leakage’) of F-gases
− Repair of leakage without undue de-lay by a certified person
− Preventing emissions from produc-tion
Leak checks (Article 4) and leakage detection systems (Article 5)
− Carrying out regular leak checks for equipment
− Installation of leakage detection sys-tems
Record keeping (Article 6)
− Record keeping for each piece of leak-checked equipment
− Establishing records of relevant infor-mation on the purchasers of F-gases
Recovery of F-gases (Article 8)
− Carrying out recovery of F-gases from equipment by a certified person so that those gases are recycled, re-claimed or destroyed
Training and certifica-tion (Article 10)
− Attending training programmes
− Completion of theoretical and practi-cal tests (examination)
− Receiving personal certificates or company certificates
Labelling and product and equipment infor-mation (Article 12)
− Labelling of F-gas containers
− Labelling of products or equipment containing or relying on F-gases
Complying with prohibi-tions (Article 11 and 13)
− Placing on the market of products and equipment listed in Annex III
− Use prohibitions for SF6 in magne-sium die-casting
− Use prohibition for high GWP F-gases for servicing and maintenance of large refrigeration equipment
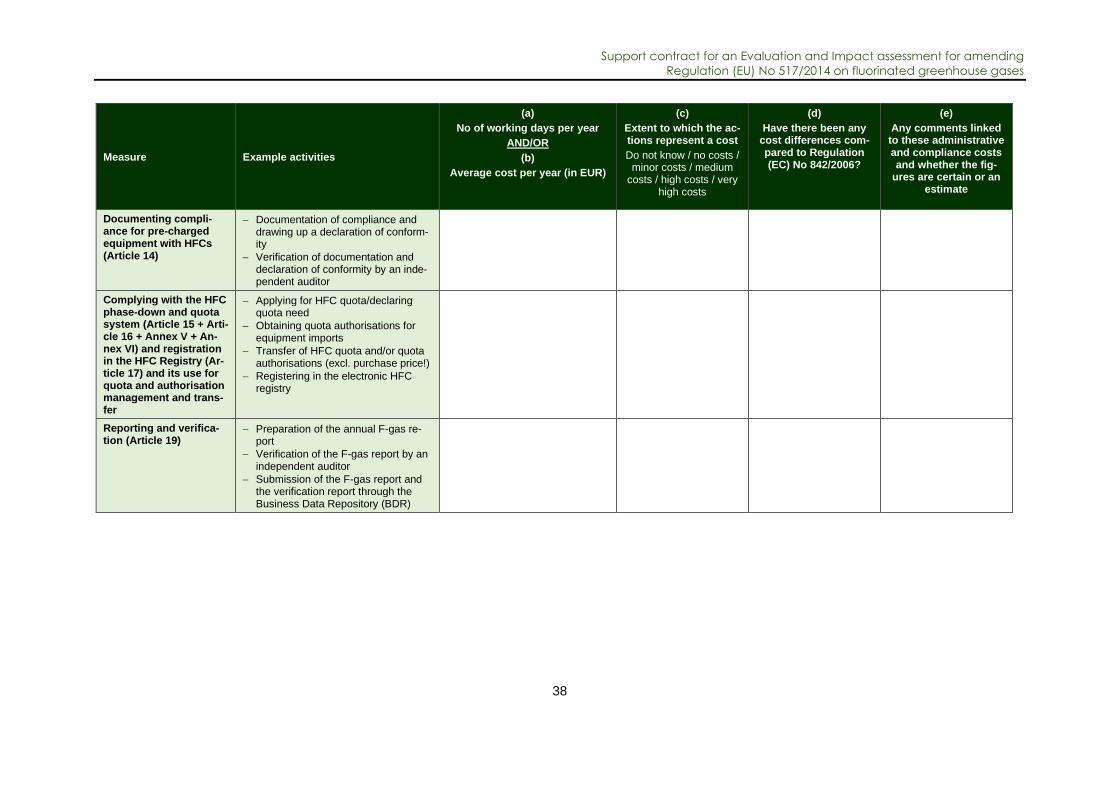
Support contract for an Evaluation and Impact assessment for amending
Regulation (EU) No 517/2014 on fluorinated greenhouse gases
38
Measure Example activities
(a)
No of working days per year
AND/OR
(b)
Average cost per year (in EUR)
(c)
Extent to which the ac-tions represent a cost
Do not know / no costs / minor costs / medium
costs / high costs / very high costs
(d)
Have there been any cost differences com-pared to Regulation (EC) No 842/2006?
(e)
Any comments linked to these administrative and compliance costs and whether the fig-
ures are certain or an estimate
Documenting compli-ance for pre-charged equipment with HFCs (Article 14)
− Documentation of compliance and drawing up a declaration of conform-ity
− Verification of documentation and declaration of conformity by an inde-pendent auditor
Complying with the HFC phase-down and quota system (Article 15 + Arti-cle 16 + Annex V + An-nex VI) and registration in the HFC Registry (Ar-ticle 17) and its use for quota and authorisation management and trans-fer
− Applying for HFC quota/declaring quota need
− Obtaining quota authorisations for equipment imports
− Transfer of HFC quota and/or quota authorisations (excl. purchase price!)
− Registering in the electronic HFC registry
Reporting and verifica-tion (Article 19)
− Preparation of the annual F-gas re-port
− Verification of the F-gas report by an independent auditor
− Submission of the F-gas report and the verification report through the Business Data Repository (BDR)
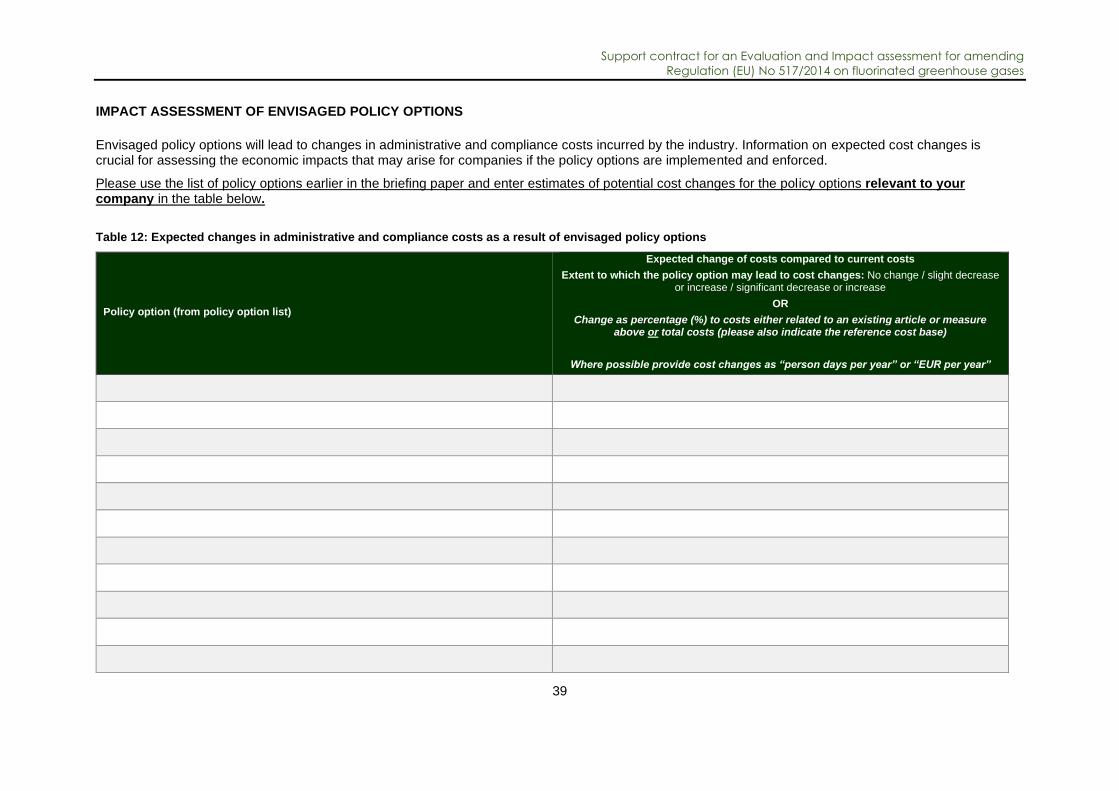
Support contract for an Evaluation and Impact assessment for amending
Regulation (EU) No 517/2014 on fluorinated greenhouse gases
39
IMPACT ASSESSMENT OF ENVISAGED POLICY OPTIONS
Envisaged policy options will lead to changes in administrative and compliance costs incurred by the industry. Information on expected cost changes is crucial for assessing the economic impacts that may arise for companies if the policy options are implemented and enforced.
Please use the list of policy options earlier in the briefing paper and enter estimates of potential cost changes for the policy options relevant to your company in the table below.
Table 12: Expected changes in administrative and compliance costs as a result of envisaged policy options
Policy option (from policy option list)
Expected change of costs compared to current costs
Extent to which the policy option may lead to cost changes: No change / slight decrease or increase / significant decrease or increase
OR
Change as percentage (%) to costs either related to an existing article or measure above or total costs (please also indicate the reference cost base)
Where possible provide cost changes as “person days per year” or “EUR per year”
Support contract for an Evaluation and Impact assessment for amending
Regulation (EU) No 517/2014 on fluorinated greenhouse gases
40