Evaluating the impact of task demands and block resolution on the effectiveness of pixel-based...
10
Evaluating the Impact of Task Demands and Block Resolution on the Effectiveness of Pixel-based Visualization Rita Borgo, Member, IEEE, Karl Proctor, Min Chen, Member, IEEE, Heike J¨ anicke, Member, IEEE, Tavi Murray, and Ian M. Thornton Abstract—Pixel-based visualization is a popular method of conveying large amounts of numerical data graphically. Application scenarios include business and finance, bioinformatics and remote sensing. In this work, we examined how the usability of such visual representations varied across different tasks and block resolutions. The main stimuli consisted of temporal pixel-based visualization with a white-red color map, simulating monthly temperature variation over a six-year period. In the first study, we included 5 separate tasks to exert different perceptual loads. We found that performance varied considerably as a function of task, ranging from 75% correct in low-load tasks to below 40% in high-load tasks. There was a small but consistent effect of resolution, with the uniform patch improving performance by around 6% relative to higher block resolution. In the second user study, we focused on a high-load task for evaluating month-to-month changes across different regions of the temperature range. We tested both CIE L*u*v* and RGB color spaces. We found that the nature of the change-evaluation errors related directly to the distance between the compared regions in the mapped color space. We were able to reduce such errors by using multiple color bands for the same data range. In a final study, we examined more fully the influence of block resolution on performance, and found block resolution had a limited impact on the effectiveness of pixel-based visualization. Index Terms—Pixel-based visualization, evaluation, user study, visual search, change detection. 1 I NTRODUCTION Pixel-based visualization is a collection of techniques that use colored position in 2D space to encode data [15]. These techniques can dis- play a large amount of encoded data, and have been found useful in a range of applications, including business and finance [38], bioinfor- matics [14] and remote sensing [18, 28]. In a typical pixel-based visualization, colored pixels are grouped into blocks (also termed as sub-windows in the literature), and blocks are normally organized in matrix form with two primary attribute di- mensions (e.g., month and year). The typical objective of the visual- ization task is to establish the correlations, causality or other relations between blocks of pixels, and to identify unusual patterns in the data. Block resolution (i.e., the number of pixels in each block) can vary substantially. A block may contain one data value (e.g., temperature), or over a million pixels (e.g., in a satellite image). Visualizing a series of high resolution pixel blocks can benefit from a large power-wall display. A challenging scientific question naturally arises from such varia- tion: what are the factors that mainly determine user performance with such displays? Will it depend only on the number of pixels in each block? Or will other variables have a greater impact? The answer to such a question will clearly depend on a number of factors, such as the nature of the task, the skill level of the user and, more fundamentally, the limits of human vision, attention and cognition. However, so far, there has been little quantitative analysis of pixel-based visualization, especially in terms of task variations and block variations. It is this gap that we try to fill in the current work. In three user studies, we examined performance in a common sce- • R. Borgo and M. Chen are with Computer Science, Swansea University, E-mail: {r.borgo,m.chen}@swansea.ac.uk. • K. Proctor and I. M. Thornton are with Department of Psychology, Swansea University, E-mail: {cskp,i.m.thornton}@swansea.ac.uk. • H. J¨ anicke is with Interdisciplinary Center for Scientific Computing, Heidelberg University, E-mail: [email protected]. • T. Murray is with Department of Geography, Swansea University, E-mail: [email protected]. Manuscript received 31 March 2010; accepted 1 August 2010; posted online 24 October 2010; mailed on 16 October 2010. For information on obtaining reprints of this article, please send email to: [email protected]. nario in which month-to-month variations in temperature were visu- alized over a six-year period. Block resolution was varied within a small range (from uniform patches up to 8 × 8 arrays), allowing the whole visual design to be easily reproducible on a ordinary computer displays. In the first study, we examined block resolution and task dif- ficulty, by presenting different comparative visual search and change detection tasks. This initial study allowed us to identify upper and lower limits of performance and to make an initial assessment of the impact of resolution. In the two subsequent studies, we selected tasks at the two extremes of performance, and examined more closely the role of block resolutions and color maps in determining patterns of behavior. Across all three studies, we found that: • block resolution had a limited impact on the effectiveness of pixel-based visualization; • task demands and related perceptual constraints accounted for most of the observed variation; • careful selection of color palettes is essential for reducing task- related errors. 2 RELATED WORK Pioneered by Keim [15], pixel-based visualizations are known for the capability of making the best possible use of screen space [17, 10]. Such display can visually present more data than many other tech- niques, such as iconic and projection-based techniques [16, 6]. The controls of its design space normally include the choice of color space, subwindow shapes, pixel arrangement, dimension ordering and query specification [27, 19]. With the advent of giga-pixel displays [37], it is desirable to learn how well pixel-based visualization will scale ac- cording to the increasing block resolution. Natural images contain detail at a wide range of spatial scales [29, 32, 31]. The human visual system has evolved mechanisms to parse information according to spatial frequency content [35, 8]. In image perception, it is thought that coarse-scale information, captured by low spatial frequency filters, conveys information about general shape and structure, while fine-scale information, captured by high spatial fre- quency filters, carries information about edges and surface texture. Human perception of images at different resolutions has been exten- sively studied (e.g., [11, 31]). Much work in this area focused on object and face recognition from degraded images. The practical ob- jective, in pixel based visualization, is to achieve cost-effectiveness 963 1077-2626/10/$26.00 © 2010 IEEE Published by the IEEE Computer Society IEEE TRANSACTIONS ON VISUALIZATION AND COMPUTER GRAPHICS, VOL. 16, NO. 6, NOVEMBER/DECEMBER 2010
-
Upload
independent -
Category
Documents
-
view
0 -
download
0
Transcript of Evaluating the impact of task demands and block resolution on the effectiveness of pixel-based...

Evaluating the Impact of Task Demands and Block Resolutionon the Effectiveness of Pixel-based Visualization
Rita Borgo, Member, IEEE, Karl Proctor, Min Chen, Member, IEEE,Heike Janicke, Member, IEEE, Tavi Murray, and Ian M. Thornton
Abstract—Pixel-based visualization is a popular method of conveying large amounts of numerical data graphically. Applicationscenarios include business and finance, bioinformatics and remote sensing. In this work, we examined how the usability of such visualrepresentations varied across different tasks and block resolutions. The main stimuli consisted of temporal pixel-based visualizationwith a white-red color map, simulating monthly temperature variation over a six-year period. In the first study, we included 5 separatetasks to exert different perceptual loads. We found that performance varied considerably as a function of task, ranging from 75%correct in low-load tasks to below 40% in high-load tasks. There was a small but consistent effect of resolution, with the uniformpatch improving performance by around 6% relative to higher block resolution. In the second user study, we focused on a high-loadtask for evaluating month-to-month changes across different regions of the temperature range. We tested both CIE L*u*v* and RGBcolor spaces. We found that the nature of the change-evaluation errors related directly to the distance between the compared regionsin the mapped color space. We were able to reduce such errors by using multiple color bands for the same data range. In a finalstudy, we examined more fully the influence of block resolution on performance, and found block resolution had a limited impact onthe effectiveness of pixel-based visualization.
Index Terms—Pixel-based visualization, evaluation, user study, visual search, change detection.
1 INTRODUCTION
Pixel-based visualization is a collection of techniques that use coloredposition in 2D space to encode data [15]. These techniques can dis-play a large amount of encoded data, and have been found useful ina range of applications, including business and finance [38], bioinfor-matics [14] and remote sensing [18, 28].
In a typical pixel-based visualization, colored pixels are groupedinto blocks (also termed as sub-windows in the literature), and blocksare normally organized in matrix form with two primary attribute di-mensions (e.g., month and year). The typical objective of the visual-ization task is to establish the correlations, causality or other relationsbetween blocks of pixels, and to identify unusual patterns in the data.Block resolution (i.e., the number of pixels in each block) can varysubstantially. A block may contain one data value (e.g., temperature),or over a million pixels (e.g., in a satellite image). Visualizing a seriesof high resolution pixel blocks can benefit from a large power-walldisplay.
A challenging scientific question naturally arises from such varia-tion: what are the factors that mainly determine user performance withsuch displays? Will it depend only on the number of pixels in eachblock? Or will other variables have a greater impact? The answer tosuch a question will clearly depend on a number of factors, such as thenature of the task, the skill level of the user and, more fundamentally,the limits of human vision, attention and cognition. However, so far,there has been little quantitative analysis of pixel-based visualization,especially in terms of task variations and block variations. It is thisgap that we try to fill in the current work.
In three user studies, we examined performance in a common sce-
• R. Borgo and M. Chen are with Computer Science, Swansea University,E-mail: {r.borgo,m.chen}@swansea.ac.uk.
• K. Proctor and I. M. Thornton are with Department of Psychology,Swansea University, E-mail: {cskp,i.m.thornton}@swansea.ac.uk.
• H. Janicke is with Interdisciplinary Center for Scientific Computing,Heidelberg University, E-mail: [email protected].
• T. Murray is with Department of Geography, Swansea University,E-mail: [email protected].
Manuscript received 31 March 2010; accepted 1 August 2010; posted online24 October 2010; mailed on 16 October 2010.For information on obtaining reprints of this article, please sendemail to: [email protected].
nario in which month-to-month variations in temperature were visu-alized over a six-year period. Block resolution was varied within asmall range (from uniform patches up to 8× 8 arrays), allowing thewhole visual design to be easily reproducible on a ordinary computerdisplays. In the first study, we examined block resolution and task dif-ficulty, by presenting different comparative visual search and changedetection tasks. This initial study allowed us to identify upper andlower limits of performance and to make an initial assessment of theimpact of resolution. In the two subsequent studies, we selected tasksat the two extremes of performance, and examined more closely therole of block resolutions and color maps in determining patterns ofbehavior. Across all three studies, we found that:
• block resolution had a limited impact on the effectiveness ofpixel-based visualization;
• task demands and related perceptual constraints accounted formost of the observed variation;
• careful selection of color palettes is essential for reducing task-related errors.
2 RELATED WORK
Pioneered by Keim [15], pixel-based visualizations are known for thecapability of making the best possible use of screen space [17, 10].Such display can visually present more data than many other tech-niques, such as iconic and projection-based techniques [16, 6]. Thecontrols of its design space normally include the choice of color space,subwindow shapes, pixel arrangement, dimension ordering and queryspecification [27, 19]. With the advent of giga-pixel displays [37], itis desirable to learn how well pixel-based visualization will scale ac-cording to the increasing block resolution.
Natural images contain detail at a wide range of spatial scales [29,32, 31]. The human visual system has evolved mechanisms to parseinformation according to spatial frequency content [35, 8]. In imageperception, it is thought that coarse-scale information, captured by lowspatial frequency filters, conveys information about general shape andstructure, while fine-scale information, captured by high spatial fre-quency filters, carries information about edges and surface texture.Human perception of images at different resolutions has been exten-sively studied (e.g., [11, 31]). Much work in this area focused onobject and face recognition from degraded images. The practical ob-jective, in pixel based visualization, is to achieve cost-effectiveness
963
1077-2626/10/$26.00 © 2010 IEEE Published by the IEEE Computer Society
IEEE TRANSACTIONS ON VISUALIZATION AND COMPUTER GRAPHICS, VOL. 16, NO. 6, NOVEMBER/DECEMBER 2010
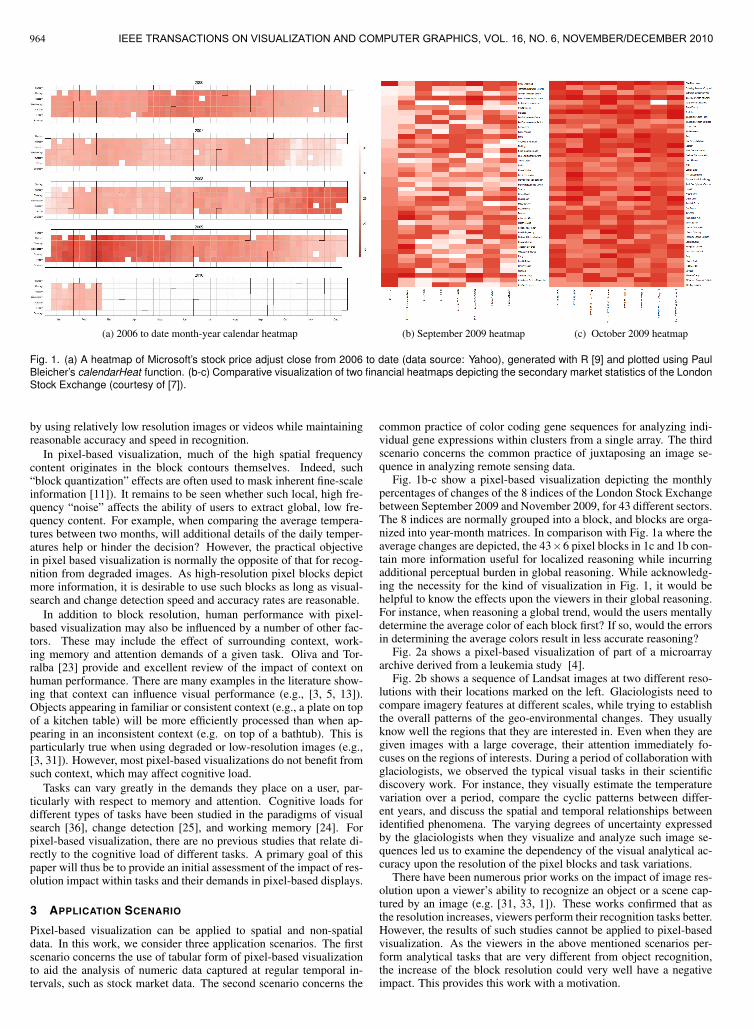
(a) 2006 to date month-year calendar heatmap (b) September 2009 heatmap (c) October 2009 heatmap
Fig. 1. (a) A heatmap of Microsoft’s stock price adjust close from 2006 to date (data source: Yahoo), generated with R [9] and plotted using PaulBleicher’s calendarHeat function. (b-c) Comparative visualization of two financial heatmaps depicting the secondary market statistics of the LondonStock Exchange (courtesy of [7]).
by using relatively low resolution images or videos while maintainingreasonable accuracy and speed in recognition.
In pixel-based visualization, much of the high spatial frequencycontent originates in the block contours themselves. Indeed, such“block quantization” effects are often used to mask inherent fine-scaleinformation [11]). It remains to be seen whether such local, high fre-quency “noise” affects the ability of users to extract global, low fre-quency content. For example, when comparing the average tempera-tures between two months, will additional details of the daily temper-atures help or hinder the decision? However, the practical objectivein pixel based visualization is normally the opposite of that for recog-nition from degraded images. As high-resolution pixel blocks depictmore information, it is desirable to use such blocks as long as visual-search and change detection speed and accuracy rates are reasonable.
In addition to block resolution, human performance with pixel-based visualization may also be influenced by a number of other fac-tors. These may include the effect of surrounding context, work-ing memory and attention demands of a given task. Oliva and Tor-ralba [23] provide and excellent review of the impact of context onhuman performance. There are many examples in the literature show-ing that context can influence visual performance (e.g., [3, 5, 13]).Objects appearing in familiar or consistent context (e.g., a plate on topof a kitchen table) will be more efficiently processed than when ap-pearing in an inconsistent context (e.g. on top of a bathtub). This isparticularly true when using degraded or low-resolution images (e.g.,[3, 31]). However, most pixel-based visualizations do not benefit fromsuch context, which may affect cognitive load.
Tasks can vary greatly in the demands they place on a user, par-ticularly with respect to memory and attention. Cognitive loads fordifferent types of tasks have been studied in the paradigms of visualsearch [36], change detection [25], and working memory [24]. Forpixel-based visualization, there are no previous studies that relate di-rectly to the cognitive load of different tasks. A primary goal of thispaper will thus be to provide an initial assessment of the impact of res-olution impact within tasks and their demands in pixel-based displays.
3 APPLICATION SCENARIO
Pixel-based visualization can be applied to spatial and non-spatialdata. In this work, we consider three application scenarios. The firstscenario concerns the use of tabular form of pixel-based visualizationto aid the analysis of numeric data captured at regular temporal in-tervals, such as stock market data. The second scenario concerns the
common practice of color coding gene sequences for analyzing indi-vidual gene expressions within clusters from a single array. The thirdscenario concerns the common practice of juxtaposing an image se-quence in analyzing remote sensing data.
Fig. 1b-c show a pixel-based visualization depicting the monthlypercentages of changes of the 8 indices of the London Stock Exchangebetween September 2009 and November 2009, for 43 different sectors.The 8 indices are normally grouped into a block, and blocks are orga-nized into year-month matrices. In comparison with Fig. 1a where theaverage changes are depicted, the 43×6 pixel blocks in 1c and 1b con-tain more information useful for localized reasoning while incurringadditional perceptual burden in global reasoning. While acknowledg-ing the necessity for the kind of visualization in Fig. 1, it would behelpful to know the effects upon the viewers in their global reasoning.For instance, when reasoning a global trend, would the users mentallydetermine the average color of each block first? If so, would the errorsin determining the average colors result in less accurate reasoning?
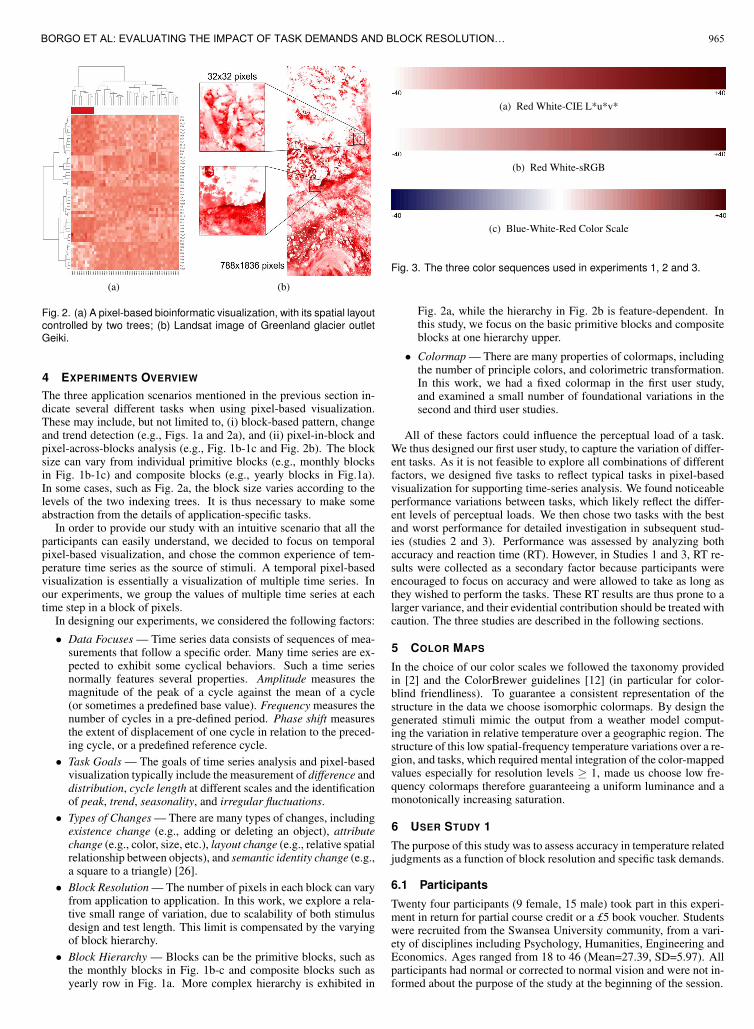
Fig. 2a shows a pixel-based visualization of part of a microarrayarchive derived from a leukemia study [4].
Fig. 2b shows a sequence of Landsat images at two different reso-lutions with their locations marked on the left. Glaciologists need tocompare imagery features at different scales, while trying to establishthe overall patterns of the geo-environmental changes. They usuallyknow well the regions that they are interested in. Even when they aregiven images with a large coverage, their attention immediately fo-cuses on the regions of interests. During a period of collaboration withglaciologists, we observed the typical visual tasks in their scientificdiscovery work. For instance, they visually estimate the temperaturevariation over a period, compare the cyclic patterns between differ-ent years, and discuss the spatial and temporal relationships betweenidentified phenomena. The varying degrees of uncertainty expressedby the glaciologists when they visualize and analyze such image se-quences led us to examine the dependency of the visual analytical ac-curacy upon the resolution of the pixel blocks and task variations.
There have been numerous prior works on the impact of image res-olution upon a viewer’s ability to recognize an object or a scene cap-tured by an image (e.g. [31, 33, 1]). These works confirmed that asthe resolution increases, viewers perform their recognition tasks better.However, the results of such studies cannot be applied to pixel-basedvisualization. As the viewers in the above mentioned scenarios per-form analytical tasks that are very different from object recognition,the increase of the block resolution could very well have a negativeimpact. This provides this work with a motivation.
964 IEEE TRANSACTIONS ON VISUALIZATION AND COMPUTER GRAPHICS, VOL. 16, NO. 6, NOVEMBER/DECEMBER 2010
(a) (b)
Fig. 2. (a) A pixel-based bioinformatic visualization, with its spatial layoutcontrolled by two trees; (b) Landsat image of Greenland glacier outletGeiki.
4 EXPERIMENTS OVERVIEW
The three application scenarios mentioned in the previous section in-dicate several different tasks when using pixel-based visualization.These may include, but not limited to, (i) block-based pattern, changeand trend detection (e.g., Figs. 1a and 2a), and (ii) pixel-in-block andpixel-across-blocks analysis (e.g., Fig. 1b-1c and Fig. 2b). The blocksize can vary from individual primitive blocks (e.g., monthly blocksin Fig. 1b-1c) and composite blocks (e.g., yearly blocks in Fig.1a).In some cases, such as Fig. 2a, the block size varies according to thelevels of the two indexing trees. It is thus necessary to make someabstraction from the details of application-specific tasks.
In order to provide our study with an intuitive scenario that all theparticipants can easily understand, we decided to focus on temporalpixel-based visualization, and chose the common experience of tem-perature time series as the source of stimuli. A temporal pixel-basedvisualization is essentially a visualization of multiple time series. Inour experiments, we group the values of multiple time series at eachtime step in a block of pixels.
In designing our experiments, we considered the following factors:
• Data Focuses — Time series data consists of sequences of mea-surements that follow a specific order. Many time series are ex-pected to exhibit some cyclical behaviors. Such a time seriesnormally features several properties. Amplitude measures themagnitude of the peak of a cycle against the mean of a cycle(or sometimes a predefined base value). Frequency measures thenumber of cycles in a pre-defined period. Phase shift measuresthe extent of displacement of one cycle in relation to the preced-ing cycle, or a predefined reference cycle.
• Task Goals — The goals of time series analysis and pixel-basedvisualization typically include the measurement of difference anddistribution, cycle length at different scales and the identificationof peak, trend, seasonality, and irregular fluctuations.
• Types of Changes — There are many types of changes, includingexistence change (e.g., adding or deleting an object), attributechange (e.g., color, size, etc.), layout change (e.g., relative spatialrelationship between objects), and semantic identity change (e.g.,a square to a triangle) [26].
• Block Resolution — The number of pixels in each block can varyfrom application to application. In this work, we explore a rela-tive small range of variation, due to scalability of both stimulusdesign and test length. This limit is compensated by the varyingof block hierarchy.
• Block Hierarchy — Blocks can be the primitive blocks, such asthe monthly blocks in Fig. 1b-c and composite blocks such asyearly row in Fig. 1a. More complex hierarchy is exhibited in
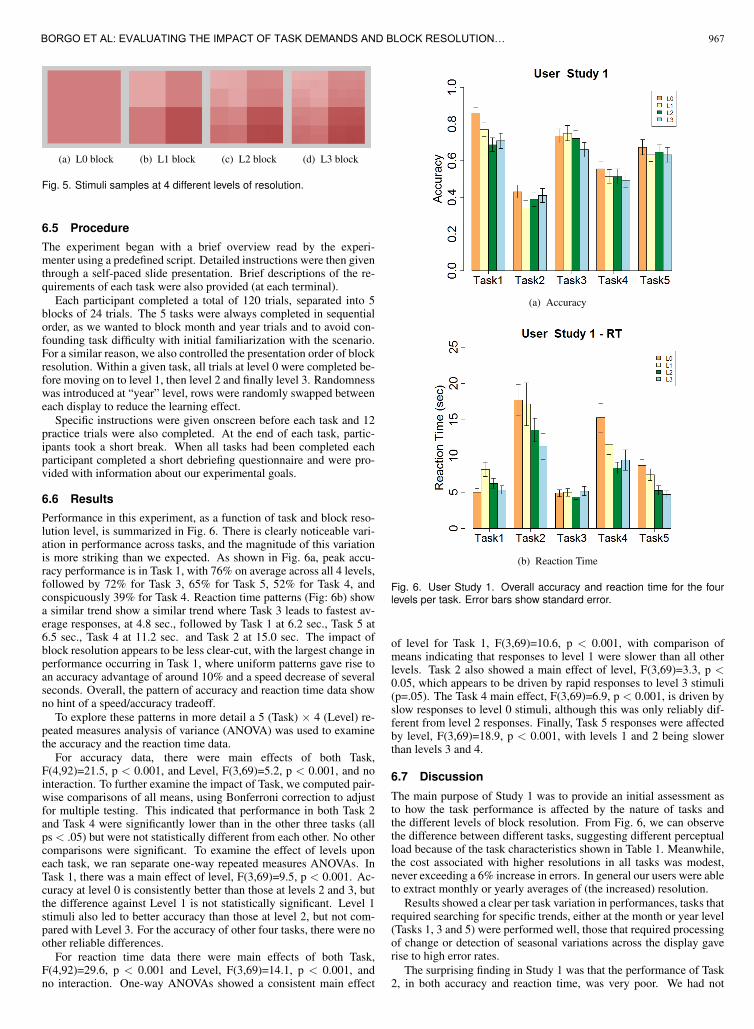
(a) Red White-CIE L*u*v*
(b) Red White-sRGB
(c) Blue-White-Red Color Scale
Fig. 3. The three color sequences used in experiments 1, 2 and 3.
Fig. 2a, while the hierarchy in Fig. 2b is feature-dependent. Inthis study, we focus on the basic primitive blocks and compositeblocks at one hierarchy upper.
• Colormap — There are many properties of colormaps, includingthe number of principle colors, and colorimetric transformation.In this work, we had a fixed colormap in the first user study,and examined a small number of foundational variations in thesecond and third user studies.
All of these factors could influence the perceptual load of a task.We thus designed our first user study, to capture the variation of differ-ent tasks. As it is not feasible to explore all combinations of differentfactors, we designed five tasks to reflect typical tasks in pixel-basedvisualization for supporting time-series analysis. We found noticeableperformance variations between tasks, which likely reflect the differ-ent levels of perceptual loads. We then chose two tasks with the bestand worst performance for detailed investigation in subsequent stud-ies (studies 2 and 3). Performance was assessed by analyzing bothaccuracy and reaction time (RT). However, in Studies 1 and 3, RT re-sults were collected as a secondary factor because participants wereencouraged to focus on accuracy and were allowed to take as long asthey wished to perform the tasks. These RT results are thus prone to alarger variance, and their evidential contribution should be treated withcaution. The three studies are described in the following sections.
5 COLOR MAPS
In the choice of our color scales we followed the taxonomy providedin [2] and the ColorBrewer guidelines [12] (in particular for color-blind friendliness). To guarantee a consistent representation of thestructure in the data we choose isomorphic colormaps. By design thegenerated stimuli mimic the output from a weather model comput-ing the variation in relative temperature over a geographic region. Thestructure of this low spatial-frequency temperature variations over a re-gion, and tasks, which required mental integration of the color-mappedvalues especially for resolution levels ≥ 1, made us choose low fre-quency colormaps therefore guaranteeing a uniform luminance and amonotonically increasing saturation.
6 USER STUDY 1
The purpose of this study was to assess accuracy in temperature relatedjudgments as a function of block resolution and specific task demands.
6.1 Participants
Twenty four participants (9 female, 15 male) took part in this experi-ment in return for partial course credit or a £5 book voucher. Studentswere recruited from the Swansea University community, from a vari-ety of disciplines including Psychology, Humanities, Engineering andEconomics. Ages ranged from 18 to 46 (Mean=27.39, SD=5.97). Allparticipants had normal or corrected to normal vision and were not in-formed about the purpose of the study at the beginning of the session.
965BORGO ET AL: EVALUATING THE IMPACT OF TASK DEMANDS AND BLOCK RESOLUTION…

Table 1. User Study 1. Tasks description and relative complexity.Task Question Unit Task Goals Data Focuses Type of Change Block Hierarchy Chance
1 Which month is the hottest? Monthdifference,peak amplitude attribute primitive 1/72
2Which month is followed by a suddenchange in temperature? Month
difference,trend amplitude implicit attribute primitive 1/66
3 Which year is the hottest on average? Yeardifference,peak amplitude attribute composite 1/6
4 Which year has an irregular pattern? Yearirregularfluctuations phase shift existence, layout composite 1/6
5Which year has most frequent changesbetween hot and cold months? Year
distribution,seasonality frequency existence, layout composite 1/6
6.2 Apparatus
Visual stimuli were created using custom software that was written inC++ in conjunction with Qt. Stimuli were saved as static images andpresented to participants using a custom made interface. Experimentswere run using Intel� dual core PCs running at 2.13 GHz, with 2 GBof RAM and Windows XP Professional. The display was 19” LCD at1280x1024 resolution with a 32bit sRGB color mode. Each monitorwas adjusted to have same brightness and same level of contrasts. Par-ticipants interacted with the software using a standard mouse at a deskin a dimmed experimental room.
6.3 Stimuli
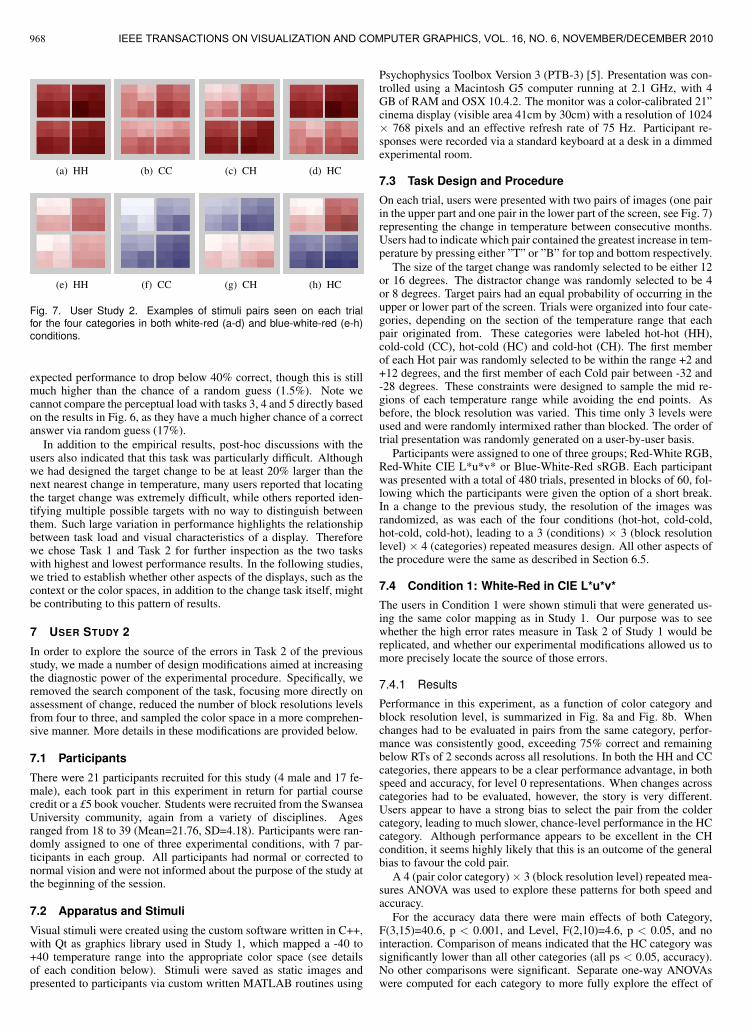
A total of 120 stimuli were used in this study, and they were organizedas 5 groups for different tasks. The 24 stimuli were further divided intofour levels, each with 6 stimuli. Each stimulus is a 6 × 12 image gridas shown in Fig. 4, and it corresponds to a unique temperature dataset.The datasets were designed to represent the temporal distribution of12 monthly temperature samples from a fictional territorial area spreadover a period of 6 years. Temperature datasets were created artificially,and mimicked, as far as possible, real temperature distributions takenfrom [22]. Our artificial temperature range varied from -40 to +40degrees.
For each temperature value, a 400 × 400 PNG uniform pixel blockwas created (L0 block, see Fig. 5a). Colors were determined basedon a white-to-red gradient mapping as shown in Fig. 3a. This map-ping has proven to be colorblind friendly in accordance to the guide-lines provided in [12]. Color mapping was performed using a two stepconversion process: first from a temperature value to a CIE L*u*v*value, and then from an L*u*v* value, via the CIE XYZ color space, togamma-corrected sRGB value for display on sRGB calibrated screen.For this white-to-red CIE L*u*v* color space transformation we usedstandard correction formula as in [20]. The value of the reference
Fig. 4. User Study 1. User Interface Description.
white chosen for the present study was the maximum monitor whiteas in [34]. From each L0 block, three higher resolution blocks at lev-els 1, 2, and 3 (L1, L2 and L3 blocks, see Fig. 5b-c-d) were createditeratively. These L1, L2 and L3 blocks were generated by using aquadtree, with the L0 block as the root. The nodes of each quadtreeat level L > 0 contained the pixel values for the block at resolutionL, and these values were computed from values at level L−1 using amidpoint displacement algorithm with roughness factor equal to 0.5.The background color was chosen to convey neutrality in relation tothe color information within the grid quadrants.
6.4 Tasks
Participants performed five main tasks each probing a specific aspectof the exploratory process typically conducted by scientists. Table 1summarizes the main design attributes of the five tasks as outlined inSection 4. For each task, it lists the question asked, the unit of response(month/year), the nature of the task demands, the nature of the timeseries phenomena, the nature of the evaluation performed, the natureof the target response and the overall probability of a correct answervia random guess.
Task 1 involved visual search for a unique target, the hottest month,within the grid. Target months were designed to have at least a 15%magnitude difference from the next nearest distractor.
Task 2 involved estimating temperature changes between consec-utive months, in order to locate the largest such increase across thewhole display. Temperature increases always occurred from left toright. Target pairs were designed to have at least a 20% magnitude dif-ference between each other, compared to 10% for the nearest distractorpair. In Tasks 1 and 2, users were asked to indicate their response byclicking with the mouse over the target month. The comparison inTask 2 is based on the evaluation of changes between two neighboringblocks. Such changes are not explicitly given, and we hence call suchan attribute an implicit attribute. The participants have to carry out twolevels of change evaluation, first between two neighbors in each pair,and then between changes taking place in different months and years.
Task 3 required participants to evaluate which year was the “hottest”on average. For this and the remaining 2 tasks, the selection of anymonth within a row resulted in the selection of the entire row/year.
Both Tasks 4 and 5 required the participants to search for the yearwith a pattern of behavior not synchronized with the others. Task 4 in-volved detecting a difference in phase between the signal characteriz-ing the target and all other years. Non-target years were created usingsine or cosine functions with a uniform phase shift as their only dif-ferentiating feature. Target stimuli were created using functions withnon-uniform or opposite phase shifts to the distractors.
Task 5 required users to detect and count temperature transitionswithin each year. Target years included at least 20% more transitionsthan the nearest distractor year. Transition periodicity was insertedinto the data in the form of functions with different frequency. Targetstimuli were designed to be high frequency sine or cosine functionswhile distractors followed a normal distribution.
966 IEEE TRANSACTIONS ON VISUALIZATION AND COMPUTER GRAPHICS, VOL. 16, NO. 6, NOVEMBER/DECEMBER 2010
(a) L0 block (b) L1 block (c) L2 block (d) L3 block
Fig. 5. Stimuli samples at 4 different levels of resolution.
6.5 Procedure
The experiment began with a brief overview read by the experi-menter using a predefined script. Detailed instructions were then giventhrough a self-paced slide presentation. Brief descriptions of the re-quirements of each task were also provided (at each terminal).
Each participant completed a total of 120 trials, separated into 5blocks of 24 trials. The 5 tasks were always completed in sequentialorder, as we wanted to block month and year trials and to avoid con-founding task difficulty with initial familiarization with the scenario.For a similar reason, we also controlled the presentation order of blockresolution. Within a given task, all trials at level 0 were completed be-fore moving on to level 1, then level 2 and finally level 3. Randomnesswas introduced at “year” level, rows were randomly swapped betweeneach display to reduce the learning effect.
Specific instructions were given onscreen before each task and 12practice trials were also completed. At the end of each task, partic-ipants took a short break. When all tasks had been completed eachparticipant completed a short debriefing questionnaire and were pro-vided with information about our experimental goals.
6.6 Results
Performance in this experiment, as a function of task and block reso-lution level, is summarized in Fig. 6. There is clearly noticeable vari-ation in performance across tasks, and the magnitude of this variationis more striking than we expected. As shown in Fig. 6a, peak accu-racy performance is in Task 1, with 76% on average across all 4 levels,followed by 72% for Task 3, 65% for Task 5, 52% for Task 4, andconspicuously 39% for Task 4. Reaction time patterns (Fig: 6b) showa similar trend show a similar trend where Task 3 leads to fastest av-erage responses, at 4.8 sec., followed by Task 1 at 6.2 sec., Task 5 at6.5 sec., Task 4 at 11.2 sec. and Task 2 at 15.0 sec. The impact ofblock resolution appears to be less clear-cut, with the largest change inperformance occurring in Task 1, where uniform patterns gave rise toan accuracy advantage of around 10% and a speed decrease of severalseconds. Overall, the pattern of accuracy and reaction time data showno hint of a speed/accuracy tradeoff.
To explore these patterns in more detail a 5 (Task) × 4 (Level) re-peated measures analysis of variance (ANOVA) was used to examinethe accuracy and the reaction time data.
For accuracy data, there were main effects of both Task,F(4,92)=21.5, p < 0.001, and Level, F(3,69)=5.2, p < 0.001, and nointeraction. To further examine the impact of Task, we computed pair-wise comparisons of all means, using Bonferroni correction to adjustfor multiple testing. This indicated that performance in both Task 2and Task 4 were significantly lower than in the other three tasks (allps < .05) but were not statistically different from each other. No othercomparisons were significant. To examine the effect of levels uponeach task, we ran separate one-way repeated measures ANOVAs. InTask 1, there was a main effect of level, F(3,69)=9.5, p < 0.001. Ac-curacy at level 0 is consistently better than those at levels 2 and 3, butthe difference against Level 1 is not statistically significant. Level 1stimuli also led to better accuracy than those at level 2, but not com-pared with Level 3. For the accuracy of other four tasks, there were noother reliable differences.
For reaction time data there were main effects of both Task,F(4,92)=29.6, p < 0.001 and Level, F(3,69)=14.1, p < 0.001, andno interaction. One-way ANOVAs showed a consistent main effect
(a) Accuracy
(b) Reaction Time
Fig. 6. User Study 1. Overall accuracy and reaction time for the fourlevels per task. Error bars show standard error.
of level for Task 1, F(3,69)=10.6, p < 0.001, with comparison ofmeans indicating that responses to level 1 were slower than all otherlevels. Task 2 also showed a main effect of level, F(3,69)=3.3, p <0.05, which appears to be driven by rapid responses to level 3 stimuli(p=.05). The Task 4 main effect, F(3,69)=6.9, p < 0.001, is driven byslow responses to level 0 stimuli, although this was only reliably dif-ferent from level 2 responses. Finally, Task 5 responses were affectedby level, F(3,69)=18.9, p < 0.001, with levels 1 and 2 being slowerthan levels 3 and 4.
6.7 Discussion
The main purpose of Study 1 was to provide an initial assessment asto how the task performance is affected by the nature of tasks andthe different levels of block resolution. From Fig. 6, we can observethe difference between different tasks, suggesting different perceptualload because of the task characteristics shown in Table 1. Meanwhile,the cost associated with higher resolutions in all tasks was modest,never exceeding a 6% increase in errors. In general our users were ableto extract monthly or yearly averages of (the increased) resolution.
Results showed a clear per task variation in performances, tasks thatrequired searching for specific trends, either at the month or year level(Tasks 1, 3 and 5) were performed well, those that required processingof change or detection of seasonal variations across the display gaverise to high error rates.
The surprising finding in Study 1 was that the performance of Task2, in both accuracy and reaction time, was very poor. We had not
967BORGO ET AL: EVALUATING THE IMPACT OF TASK DEMANDS AND BLOCK RESOLUTION…
(a) HH (b) CC (c) CH (d) HC
(e) HH (f) CC (g) CH (h) HC
Fig. 7. User Study 2. Examples of stimuli pairs seen on each trialfor the four categories in both white-red (a-d) and blue-white-red (e-h)conditions.
expected performance to drop below 40% correct, though this is stillmuch higher than the chance of a random guess (1.5%). Note wecannot compare the perceptual load with tasks 3, 4 and 5 directly basedon the results in Fig. 6, as they have a much higher chance of a correctanswer via random guess (17%).
In addition to the empirical results, post-hoc discussions with theusers also indicated that this task was particularly difficult. Althoughwe had designed the target change to be at least 20% larger than thenext nearest change in temperature, many users reported that locatingthe target change was extremely difficult, while others reported iden-tifying multiple possible targets with no way to distinguish betweenthem. Such large variation in performance highlights the relationshipbetween task load and visual characteristics of a display. Thereforewe chose Task 1 and Task 2 for further inspection as the two taskswith highest and lowest performance results. In the following studies,we tried to establish whether other aspects of the displays, such as thecontext or the color spaces, in addition to the change task itself, mightbe contributing to this pattern of results.
7 USER STUDY 2
In order to explore the source of the errors in Task 2 of the previousstudy, we made a number of design modifications aimed at increasingthe diagnostic power of the experimental procedure. Specifically, weremoved the search component of the task, focusing more directly onassessment of change, reduced the number of block resolutions levelsfrom four to three, and sampled the color space in a more comprehen-sive manner. More details in these modifications are provided below.
7.1 Participants
There were 21 participants recruited for this study (4 male and 17 fe-male), each took part in this experiment in return for partial coursecredit or a £5 book voucher. Students were recruited from the SwanseaUniversity community, again from a variety of disciplines. Agesranged from 18 to 39 (Mean=21.76, SD=4.18). Participants were ran-domly assigned to one of three experimental conditions, with 7 par-ticipants in each group. All participants had normal or corrected tonormal vision and were not informed about the purpose of the study atthe beginning of the session.
7.2 Apparatus and Stimuli
Visual stimuli were created using the custom software written in C++,with Qt as graphics library used in Study 1, which mapped a -40 to+40 temperature range into the appropriate color space (see detailsof each condition below). Stimuli were saved as static images andpresented to participants via custom written MATLAB routines using
Psychophysics Toolbox Version 3 (PTB-3) [5]. Presentation was con-trolled using a Macintosh G5 computer running at 2.1 GHz, with 4GB of RAM and OSX 10.4.2. The monitor was a color-calibrated 21”cinema display (visible area 41cm by 30cm) with a resolution of 1024× 768 pixels and an effective refresh rate of 75 Hz. Participant re-sponses were recorded via a standard keyboard at a desk in a dimmedexperimental room.
7.3 Task Design and Procedure
On each trial, users were presented with two pairs of images (one pairin the upper part and one pair in the lower part of the screen, see Fig. 7)representing the change in temperature between consecutive months.Users had to indicate which pair contained the greatest increase in tem-perature by pressing either ”T” or ”B” for top and bottom respectively.
The size of the target change was randomly selected to be either 12or 16 degrees. The distractor change was randomly selected to be 4or 8 degrees. Target pairs had an equal probability of occurring in theupper or lower part of the screen. Trials were organized into four cate-gories, depending on the section of the temperature range that eachpair originated from. These categories were labeled hot-hot (HH),cold-cold (CC), hot-cold (HC) and cold-hot (CH). The first memberof each Hot pair was randomly selected to be within the range +2 and+12 degrees, and the first member of each Cold pair between -32 and-28 degrees. These constraints were designed to sample the mid re-gions of each temperature range while avoiding the end points. Asbefore, the block resolution was varied. This time only 3 levels wereused and were randomly intermixed rather than blocked. The order oftrial presentation was randomly generated on a user-by-user basis.
Participants were assigned to one of three groups; Red-White RGB,Red-White CIE L*u*v* or Blue-White-Red sRGB. Each participantwas presented with a total of 480 trials, presented in blocks of 60, fol-lowing which the participants were given the option of a short break.In a change to the previous study, the resolution of the images wasrandomized, as was each of the four conditions (hot-hot, cold-cold,hot-cold, cold-hot), leading to a 3 (conditions) × 3 (block resolutionlevel) × 4 (categories) repeated measures design. All other aspects ofthe procedure were the same as described in Section 6.5.
7.4 Condition 1: White-Red in CIE L*u*v*
The users in Condition 1 were shown stimuli that were generated us-ing the same color mapping as in Study 1. Our purpose was to seewhether the high error rates measure in Task 2 of Study 1 would bereplicated, and whether our experimental modifications allowed us tomore precisely locate the source of those errors.
7.4.1 Results
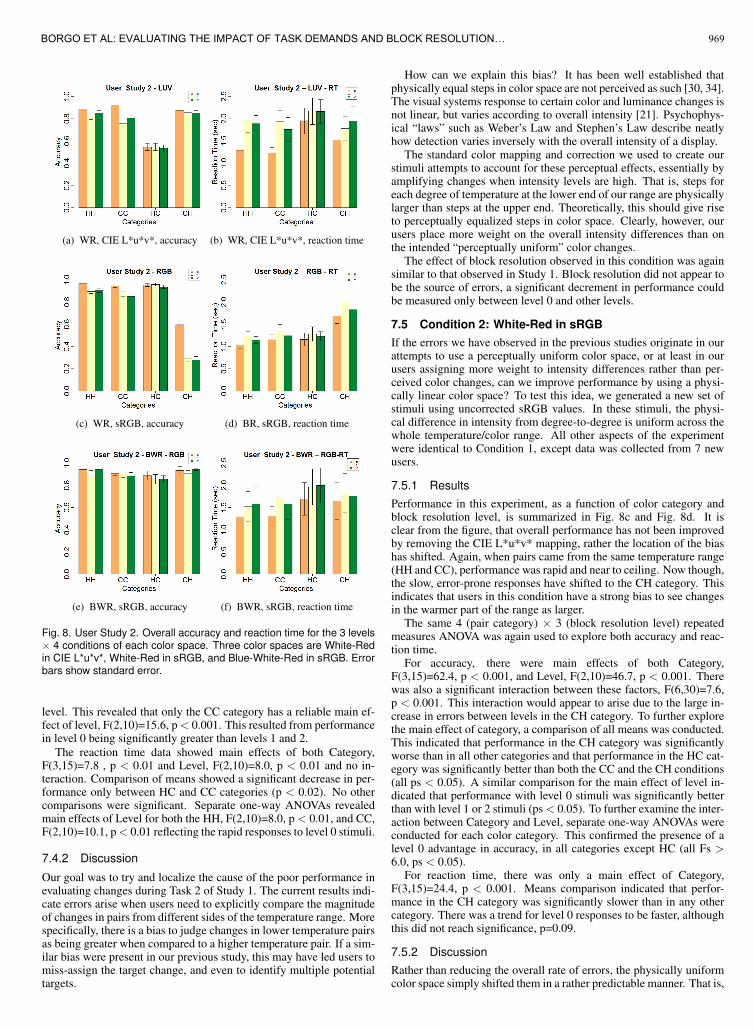
Performance in this experiment, as a function of color category andblock resolution level, is summarized in Fig. 8a and Fig. 8b. Whenchanges had to be evaluated in pairs from the same category, perfor-mance was consistently good, exceeding 75% correct and remainingbelow RTs of 2 seconds across all resolutions. In both the HH and CCcategories, there appears to be a clear performance advantage, in bothspeed and accuracy, for level 0 representations. When changes acrosscategories had to be evaluated, however, the story is very different.Users appear to have a strong bias to select the pair from the coldercategory, leading to much slower, chance-level performance in the HCcategory. Although performance appears to be excellent in the CHcondition, it seems highly likely that this is an outcome of the generalbias to favour the cold pair.
A 4 (pair color category) × 3 (block resolution level) repeated mea-sures ANOVA was used to explore these patterns for both speed andaccuracy.
For the accuracy data there were main effects of both Category,F(3,15)=40.6, p < 0.001, and Level, F(2,10)=4.6, p < 0.05, and nointeraction. Comparison of means indicated that the HC category wassignificantly lower than all other categories (all ps < 0.05, accuracy).No other comparisons were significant. Separate one-way ANOVAswere computed for each category to more fully explore the effect of
968 IEEE TRANSACTIONS ON VISUALIZATION AND COMPUTER GRAPHICS, VOL. 16, NO. 6, NOVEMBER/DECEMBER 2010
(a) WR, CIE L*u*v*, accuracy (b) WR, CIE L*u*v*, reaction time
(c) WR, sRGB, accuracy (d) BR, sRGB, reaction time
(e) BWR, sRGB, accuracy (f) BWR, sRGB, reaction time
Fig. 8. User Study 2. Overall accuracy and reaction time for the 3 levels× 4 conditions of each color space. Three color spaces are White-Redin CIE L*u*v*, White-Red in sRGB, and Blue-White-Red in sRGB. Errorbars show standard error.
level. This revealed that only the CC category has a reliable main ef-fect of level, F(2,10)=15.6, p < 0.001. This resulted from performancein level 0 being significantly greater than levels 1 and 2.
The reaction time data showed main effects of both Category,F(3,15)=7.8 , p < 0.01 and Level, F(2,10)=8.0, p < 0.01 and no in-teraction. Comparison of means showed a significant decrease in per-formance only between HC and CC categories (p < 0.02). No othercomparisons were significant. Separate one-way ANOVAs revealedmain effects of Level for both the HH, F(2,10)=8.0, p < 0.01, and CC,F(2,10)=10.1, p < 0.01 reflecting the rapid responses to level 0 stimuli.
7.4.2 Discussion
Our goal was to try and localize the cause of the poor performance inevaluating changes during Task 2 of Study 1. The current results indi-cate errors arise when users need to explicitly compare the magnitudeof changes in pairs from different sides of the temperature range. Morespecifically, there is a bias to judge changes in lower temperature pairsas being greater when compared to a higher temperature pair. If a sim-ilar bias were present in our previous study, this may have led users tomiss-assign the target change, and even to identify multiple potentialtargets.
How can we explain this bias? It has been well established thatphysically equal steps in color space are not perceived as such [30, 34].The visual systems response to certain color and luminance changes isnot linear, but varies according to overall intensity [21]. Psychophys-ical “laws” such as Weber’s Law and Stephen’s Law describe neatlyhow detection varies inversely with the overall intensity of a display.
The standard color mapping and correction we used to create ourstimuli attempts to account for these perceptual effects, essentially byamplifying changes when intensity levels are high. That is, steps foreach degree of temperature at the lower end of our range are physicallylarger than steps at the upper end. Theoretically, this should give riseto perceptually equalized steps in color space. Clearly, however, ourusers place more weight on the overall intensity differences than onthe intended “perceptually uniform” color changes.
The effect of block resolution observed in this condition was againsimilar to that observed in Study 1. Block resolution did not appear tobe the source of errors, a significant decrement in performance couldbe measured only between level 0 and other levels.
7.5 Condition 2: White-Red in sRGB
If the errors we have observed in the previous studies originate in ourattempts to use a perceptually uniform color space, or at least in ourusers assigning more weight to intensity differences rather than per-ceived color changes, can we improve performance by using a physi-cally linear color space? To test this idea, we generated a new set ofstimuli using uncorrected sRGB values. In these stimuli, the physi-cal difference in intensity from degree-to-degree is uniform across thewhole temperature/color range. All other aspects of the experimentwere identical to Condition 1, except data was collected from 7 newusers.
7.5.1 Results
Performance in this experiment, as a function of color category andblock resolution level, is summarized in Fig. 8c and Fig. 8d. It isclear from the figure, that overall performance has not been improvedby removing the CIE L*u*v* mapping, rather the location of the biashas shifted. Again, when pairs came from the same temperature range(HH and CC), performance was rapid and near to ceiling. Now though,the slow, error-prone responses have shifted to the CH category. Thisindicates that users in this condition have a strong bias to see changesin the warmer part of the range as larger.
The same 4 (pair category) × 3 (block resolution level) repeatedmeasures ANOVA was again used to explore both accuracy and reac-tion time.
For accuracy, there were main effects of both Category,F(3,15)=62.4, p < 0.001, and Level, F(2,10)=46.7, p < 0.001. Therewas also a significant interaction between these factors, F(6,30)=7.6,p < 0.001. This interaction would appear to arise due to the large in-crease in errors between levels in the CH category. To further explorethe main effect of category, a comparison of all means was conducted.This indicated that performance in the CH category was significantlyworse than in all other categories and that performance in the HC cat-egory was significantly better than both the CC and the CH conditions(all ps < 0.05). A similar comparison for the main effect of level in-dicated that performance with level 0 stimuli was significantly betterthan with level 1 or 2 stimuli (ps < 0.05). To further examine the inter-action between Category and Level, separate one-way ANOVAs wereconducted for each color category. This confirmed the presence of alevel 0 advantage in accuracy, in all categories except HC (all Fs >6.0, ps < 0.05).
For reaction time, there was only a main effect of Category,F(3,15)=24.4, p < 0.001. Means comparison indicated that perfor-mance in the CH category was significantly slower than in any othercategory. There was a trend for level 0 responses to be faster, althoughthis did not reach significance, p=0.09.
7.5.2 Discussion
Rather than reducing the overall rate of errors, the physically uniformcolor space simply shifted them in a rather predictable manner. That is,
969BORGO ET AL: EVALUATING THE IMPACT OF TASK DEMANDS AND BLOCK RESOLUTION…
the tendency of users to over-estimate the changes occurring at the hotend of our temperature range (i.e. when overall stimulus intensity islower) is precisely the pattern of results that would be predicted basedon the non-linear properties of the visual system. Simply ignoringthese limitations, would not seem to be an option, at least given thecurrent task. As in the previous condition, a small, but reliable costof increasing block resolution was again present in this task betweenlevel 0 and other levels.
7.6 Condition 3: Blue-White-Red in sRGB
In the final condition of this study, we wanted to explore one simpleoption for reducing the errors seen in conditions 1 and 2. Our ideawas to effectively compress the overall range of intensity values byusing two color hues instead of one. We re-mapped temperatures lowerthan zero using a White-Blue scale and temperature above zero usinga White-Red scale (see Fig. 3c). This re-mapping, together with thetarget selection method employed in the previous two studies, ensuredthat pairs across all four of our color categories were now much moreclosely matched in terms of overall intensity. Would this modificationimprove overall performance?
7.6.1 Results
The results from this manipulation are shown in Fig. 8e and Fig. 8f.It is immediately obvious that systematic errors have been reduced.Performance in all Categories and across the three levels remainedclose to ceiling levels. The same 4 (pair category) × 3 (block res-olution level) repeated measures ANOVA used in the previous twoexperiments was applied to both speed and accuracy data. For accu-racy there were no main effects, nor interactions. For the reaction timedata, there were main effects of both Category, F(3,15)=3.4, p < 0.05,and Level, F(2,10)=5.9, p < 0.05, but no interaction. The Categoryeffect would appear to reflect slightly faster responses for the withincategory decisions of HH and CC, although further analysis revealedno significant differences. The effect of Level was also limited to theHH, F(2,10)=4.5, p < 0.05, and CC, F(2,10)=5.4, p < 0.05 conditions.Although this pattern would seem to favor faster responses for level 0stimuli, further analysis could not confirm this pattern.
7.6.2 Discussion
Conditions 1 and 2 of this study demonstrated that user responses cansometimes be biased by properties of a color space other than thoseintended by a given task. It seems likely that performance in Task 2of Study 1, were also caused by such factors. Although our tasks wereaimed at detecting changes in color saturation, observers were highlysensitive to changes in intensity. The results of condition 3 suggestthat one possible solution, at least in this specific task, would be to tryand compress the range of intensity values, in our case, by introducinga second hue. No block resolution effect in this condition was reportedeven with near ceiling levels of performance.
8 USER STUDY 3
In our final study, we examined more fully the influence of block reso-lution on the participants’ performance. In Studies 1 and 2, there havebeen small but reliable advantages for the uniform patterns of level 0versus other levels. In Study 1, this advantage was most apparent forthe simple task of identifying the hottest month (i.e., Task 1). Here,we return to this particular task with a slightly modified procedure, toexplore whether this advantage is truly robust. The same design frame-work described in Section 6 was adopted and interface, interaction andapparatus remained unchanged.
8.1 Participants
Eleven participants (7 female, 4 male) took part in this experiment inreturn for partial course credit or a £5 book voucher. Students wererecruited from the Swansea University community as in the previousstudies. Ages ranged from 18 to 43 (Mean=27.9, SD=6.36). All partic-ipants had normal or corrected to normal vision and were not informedabout the purpose of the study at the beginning of the session.
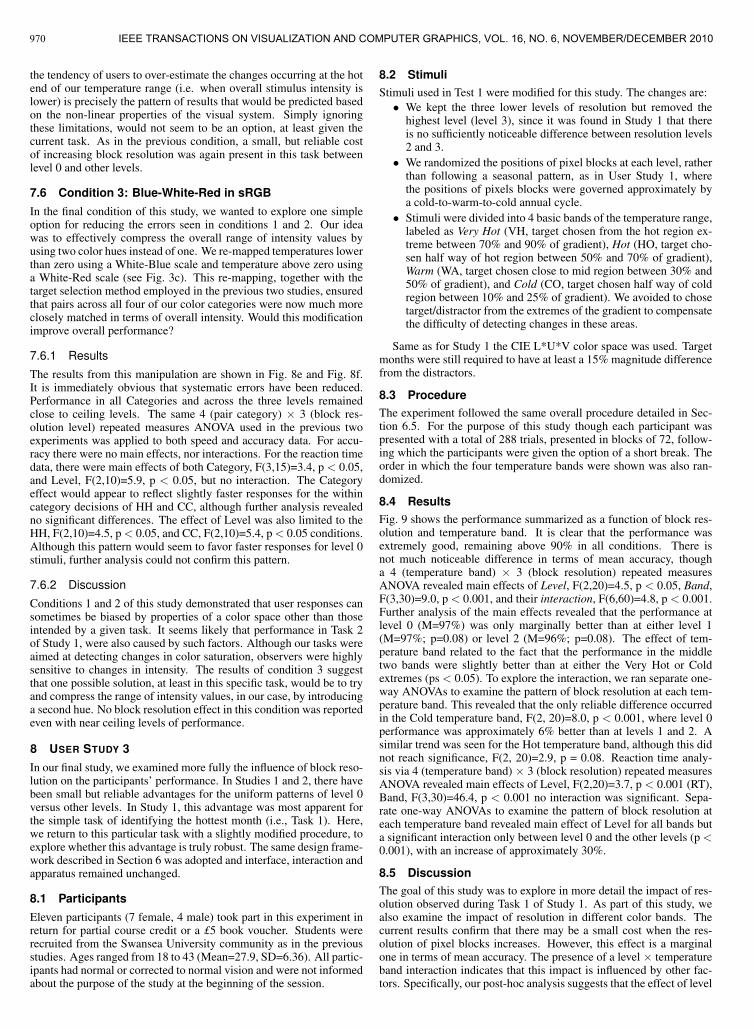
8.2 StimuliStimuli used in Test 1 were modified for this study. The changes are:
• We kept the three lower levels of resolution but removed thehighest level (level 3), since it was found in Study 1 that thereis no sufficiently noticeable difference between resolution levels2 and 3.
• We randomized the positions of pixel blocks at each level, ratherthan following a seasonal pattern, as in User Study 1, wherethe positions of pixels blocks were governed approximately bya cold-to-warm-to-cold annual cycle.
• Stimuli were divided into 4 basic bands of the temperature range,labeled as Very Hot (VH, target chosen from the hot region ex-treme between 70% and 90% of gradient), Hot (HO, target cho-sen half way of hot region between 50% and 70% of gradient),Warm (WA, target chosen close to mid region between 30% and50% of gradient), and Cold (CO, target chosen half way of coldregion between 10% and 25% of gradient). We avoided to chosetarget/distractor from the extremes of the gradient to compensatethe difficulty of detecting changes in these areas.
Same as for Study 1 the CIE L*U*V color space was used. Targetmonths were still required to have at least a 15% magnitude differencefrom the distractors.
8.3 ProcedureThe experiment followed the same overall procedure detailed in Sec-tion 6.5. For the purpose of this study though each participant waspresented with a total of 288 trials, presented in blocks of 72, follow-ing which the participants were given the option of a short break. Theorder in which the four temperature bands were shown was also ran-domized.
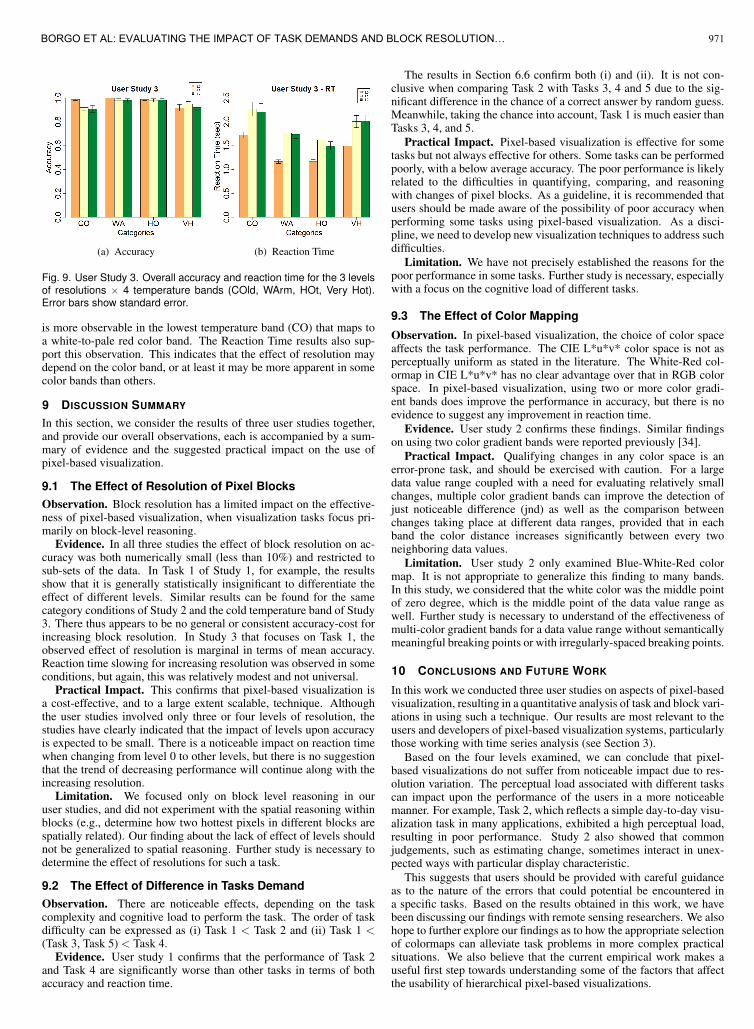
8.4 ResultsFig. 9 shows the performance summarized as a function of block res-olution and temperature band. It is clear that the performance wasextremely good, remaining above 90% in all conditions. There isnot much noticeable difference in terms of mean accuracy, thougha 4 (temperature band) × 3 (block resolution) repeated measuresANOVA revealed main effects of Level, F(2,20)=4.5, p < 0.05, Band,F(3,30)=9.0, p < 0.001, and their interaction, F(6,60)=4.8, p < 0.001.Further analysis of the main effects revealed that the performance atlevel 0 (M=97%) was only marginally better than at either level 1(M=97%; p=0.08) or level 2 (M=96%; p=0.08). The effect of tem-perature band related to the fact that the performance in the middletwo bands were slightly better than at either the Very Hot or Coldextremes (ps < 0.05). To explore the interaction, we ran separate one-way ANOVAs to examine the pattern of block resolution at each tem-perature band. This revealed that the only reliable difference occurredin the Cold temperature band, F(2, 20)=8.0, p < 0.001, where level 0performance was approximately 6% better than at levels 1 and 2. Asimilar trend was seen for the Hot temperature band, although this didnot reach significance, F(2, 20)=2.9, p = 0.08. Reaction time analy-sis via 4 (temperature band) × 3 (block resolution) repeated measuresANOVA revealed main effects of Level, F(2,20)=3.7, p < 0.001 (RT),Band, F(3,30)=46.4, p < 0.001 no interaction was significant. Sepa-rate one-way ANOVAs to examine the pattern of block resolution ateach temperature band revealed main effect of Level for all bands buta significant interaction only between level 0 and the other levels (p <0.001), with an increase of approximately 30%.
8.5 DiscussionThe goal of this study was to explore in more detail the impact of res-olution observed during Task 1 of Study 1. As part of this study, wealso examine the impact of resolution in different color bands. Thecurrent results confirm that there may be a small cost when the res-olution of pixel blocks increases. However, this effect is a marginalone in terms of mean accuracy. The presence of a level × temperatureband interaction indicates that this impact is influenced by other fac-tors. Specifically, our post-hoc analysis suggests that the effect of level
970 IEEE TRANSACTIONS ON VISUALIZATION AND COMPUTER GRAPHICS, VOL. 16, NO. 6, NOVEMBER/DECEMBER 2010
(a) Accuracy (b) Reaction Time
Fig. 9. User Study 3. Overall accuracy and reaction time for the 3 levelsof resolutions × 4 temperature bands (COld, WArm, HOt, Very Hot).Error bars show standard error.
is more observable in the lowest temperature band (CO) that maps toa white-to-pale red color band. The Reaction Time results also sup-port this observation. This indicates that the effect of resolution maydepend on the color band, or at least it may be more apparent in somecolor bands than others.
9 DISCUSSION SUMMARY
In this section, we consider the results of three user studies together,and provide our overall observations, each is accompanied by a sum-mary of evidence and the suggested practical impact on the use ofpixel-based visualization.
9.1 The Effect of Resolution of Pixel Blocks
Observation. Block resolution has a limited impact on the effective-ness of pixel-based visualization, when visualization tasks focus pri-marily on block-level reasoning.
Evidence. In all three studies the effect of block resolution on ac-curacy was both numerically small (less than 10%) and restricted tosub-sets of the data. In Task 1 of Study 1, for example, the resultsshow that it is generally statistically insignificant to differentiate theeffect of different levels. Similar results can be found for the samecategory conditions of Study 2 and the cold temperature band of Study3. There thus appears to be no general or consistent accuracy-cost forincreasing block resolution. In Study 3 that focuses on Task 1, theobserved effect of resolution is marginal in terms of mean accuracy.Reaction time slowing for increasing resolution was observed in someconditions, but again, this was relatively modest and not universal.
Practical Impact. This confirms that pixel-based visualization isa cost-effective, and to a large extent scalable, technique. Althoughthe user studies involved only three or four levels of resolution, thestudies have clearly indicated that the impact of levels upon accuracyis expected to be small. There is a noticeable impact on reaction timewhen changing from level 0 to other levels, but there is no suggestionthat the trend of decreasing performance will continue along with theincreasing resolution.
Limitation. We focused only on block level reasoning in ouruser studies, and did not experiment with the spatial reasoning withinblocks (e.g., determine how two hottest pixels in different blocks arespatially related). Our finding about the lack of effect of levels shouldnot be generalized to spatial reasoning. Further study is necessary todetermine the effect of resolutions for such a task.
9.2 The Effect of Difference in Tasks Demand
Observation. There are noticeable effects, depending on the taskcomplexity and cognitive load to perform the task. The order of taskdifficulty can be expressed as (i) Task 1 < Task 2 and (ii) Task 1 <(Task 3, Task 5) < Task 4.
Evidence. User study 1 confirms that the performance of Task 2and Task 4 are significantly worse than other tasks in terms of bothaccuracy and reaction time.
The results in Section 6.6 confirm both (i) and (ii). It is not con-clusive when comparing Task 2 with Tasks 3, 4 and 5 due to the sig-nificant difference in the chance of a correct answer by random guess.Meanwhile, taking the chance into account, Task 1 is much easier thanTasks 3, 4, and 5.
Practical Impact. Pixel-based visualization is effective for sometasks but not always effective for others. Some tasks can be performedpoorly, with a below average accuracy. The poor performance is likelyrelated to the difficulties in quantifying, comparing, and reasoningwith changes of pixel blocks. As a guideline, it is recommended thatusers should be made aware of the possibility of poor accuracy whenperforming some tasks using pixel-based visualization. As a disci-pline, we need to develop new visualization techniques to address suchdifficulties.
Limitation. We have not precisely established the reasons for thepoor performance in some tasks. Further study is necessary, especiallywith a focus on the cognitive load of different tasks.
9.3 The Effect of Color Mapping
Observation. In pixel-based visualization, the choice of color spaceaffects the task performance. The CIE L*u*v* color space is not asperceptually uniform as stated in the literature. The White-Red col-ormap in CIE L*u*v* has no clear advantage over that in RGB colorspace. In pixel-based visualization, using two or more color gradi-ent bands does improve the performance in accuracy, but there is noevidence to suggest any improvement in reaction time.
Evidence. User study 2 confirms these findings. Similar findingson using two color gradient bands were reported previously [34].
Practical Impact. Qualifying changes in any color space is anerror-prone task, and should be exercised with caution. For a largedata value range coupled with a need for evaluating relatively smallchanges, multiple color gradient bands can improve the detection ofjust noticeable difference (jnd) as well as the comparison betweenchanges taking place at different data ranges, provided that in eachband the color distance increases significantly between every twoneighboring data values.
Limitation. User study 2 only examined Blue-White-Red colormap. It is not appropriate to generalize this finding to many bands.In this study, we considered that the white color was the middle pointof zero degree, which is the middle point of the data value range aswell. Further study is necessary to understand of the effectiveness ofmulti-color gradient bands for a data value range without semanticallymeaningful breaking points or with irregularly-spaced breaking points.
10 CONCLUSIONS AND FUTURE WORK
In this work we conducted three user studies on aspects of pixel-basedvisualization, resulting in a quantitative analysis of task and block vari-ations in using such a technique. Our results are most relevant to theusers and developers of pixel-based visualization systems, particularlythose working with time series analysis (see Section 3).
Based on the four levels examined, we can conclude that pixel-based visualizations do not suffer from noticeable impact due to res-olution variation. The perceptual load associated with different taskscan impact upon the performance of the users in a more noticeablemanner. For example, Task 2, which reflects a simple day-to-day visu-alization task in many applications, exhibited a high perceptual load,resulting in poor performance. Study 2 also showed that commonjudgements, such as estimating change, sometimes interact in unex-pected ways with particular display characteristic.
This suggests that users should be provided with careful guidanceas to the nature of the errors that could potential be encountered ina specific tasks. Based on the results obtained in this work, we havebeen discussing our findings with remote sensing researchers. We alsohope to further explore our findings as to how the appropriate selectionof colormaps can alleviate task problems in more complex practicalsituations. We also believe that the current empirical work makes auseful first step towards understanding some of the factors that affectthe usability of hierarchical pixel-based visualizations.
971BORGO ET AL: EVALUATING THE IMPACT OF TASK DEMANDS AND BLOCK RESOLUTION…
REFERENCES
[1] T. Bachmann. Identification of spatially quantized tachistoscopic imagesof faces: How many pixels does it take to carry identity? EuropeanJournal of Cognitive Psychology, 3:85–103, 1991.
[2] L. D. Bergman, B. E. Rogowitz, and L. A. Treinish. A rule-based tool forassisting colormap selection. In VIS ’95: Proceedings of the 6th confer-ence on Visualization ’95, page 118, Washington, DC, USA, 1995. IEEEComputer Society.
[3] I. Biederman, A. L. Glass, and E. W. J. Stacy. Searching for objects inreal-world scenes. Journal of Experimental Psychology, 97:22–27, 1973.
[4] S. Chiaretti, X. Li, R. Gentleman, A. Vitale, M. Vignetti, F. Mandelli,J. Ritz, and F. R. Gene expression profile of adult t-cell acute lymphocyticleukemia identifies distinct subsets of patients with different response totherapy and survival. Blood, (103):2771–2778, 2004.
[5] M. Chun and Y. Jiang. Top-down attentional guidance based on implicitlearning of visual covariation. Psychologicl Science, 10:360–365, 1999.
[6] M. C. F. de Oliveira and H. Levkowitz. From visual data exploration tovisual data mining: A survey. IEEE Transactions on Visualization andComputer Graphics, 9:378–394, 2003.
[7] L. S. Exchange, 2010.[8] D. Field. Relations between the statistics of natural images and the re-
sponse profiles of cortical cells. Journal of the Optical Society of Amer-ica, 4:2379–2394, 1987.
[9] R. Gentleman and R. Ihaka. The r project for statistical computing, 2010.[10] M. C. Hao, U. Dayal, D. A. Keim, and T. Schreck. Multi-resolution
techniques for visual exploration of large time-series data. In EuroVis,pages 27–34, 2007.
[11] L. D. Harmon and B. Julesz. Masking in visual recognition: Effects oftwo-dimensional filtered noise. science 180:1194, 1973.
[12] M. Harrower and C. A. Brewer. Colorbrewer.org: An online tool forselecting colour schemes for maps. Cartographic Journal, 40(1):27–37,Jun 2003.
[13] D. e. a. Hoiem. Putting objects in perspective. Proc. IEEE Comp. Vis.Pattern Recog., 2:2137–2144, 2006.
[14] D. H. Jeong, A. Darvish, K. Najarian, J. Yang, and W. Ribarsky. In-teractive visual analysis of time-series microarray data. Vis. Comput.,24(12):1053–1066, 2008.
[15] D. A. Keim. Designing pixel-oriented visualization techniques: The-ory and applications. IEEE Transactions on Visualization and ComputerGraphics, 6(1):59–78, 2000.
[16] D. A. Keim and H.-P. Kriegel. Visualization techniques for mininglarge databases: A comparison. IEEE Trans. on Knowl. and Data Eng.,8(6):923–938, 1996.
[17] D. A. Keim, C. Panse, M. Sips, and S. C. North. Pixelmaps: A new visualdata mining approach for analyzing large spatial data sets. Data Mining,IEEE International Conference on, 0:565, 2003.
[18] D. A. Keim, C. Panse, M. Sips, and S. C. North. Pixel based visualmining of geo-spatial data. Computers and Graphics, 28(3):327 – 344,September 2004.
[19] T. Lammarsch, W. Aigner, A. Bertone, J. Gartner, E. Mayr, S. Miksch,and M. Smuc. Hierarchical temporal patterns and interactive aggregatedviews for pixel-based visualizations. In IV ’09: Proceedings of the 200913th International Conference Information Visualisation, pages 44–50.IEEE Computer Society, 2009.
[20] B. Lindbloom. Cie standard color equations, 2010.[21] C. G. Mueller. Frequency of seeing functions for intensity discrimination
at various levels of adapting intensity. Journal of General Physiology,34:463–474, 1951.
[22] U. D. of Energy (DOE), 2010.[23] A. Oliva and A. Torralba. The role of context in object recognition. Trends
in Cognitive Sciences, 11:520–527, 2007.[24] F. Paas, A. Renkl, and J. Sweller. Cognitive load theory: Instructional im-
plications of the interaction between information structures and cognitivearchitecture. Instructional Science, 32:1–8, 2004.
[25] R. A. Rensink. Visual search for change: A probe into the nature ofattentional processing. Visual Cognition, 7:345–376, 2000.
[26] R. A. Rensink. Change detection. Annual Review of Psychology, 53:245–277, 2002.
[27] J. Schneidewind, M. Sips, and D. A. Keim. An automated approach forthe optimization of pixel-based visualizations. Information Visualization,6(1):75–88, 2007.
[28] M. H. Shimabukuro, E. F. Flores, M. C. F. de Oliveira, and H. Levkowitz.
Coordinated views to assist exploration of spatio-temporal data: A casestudy. In CMV ’04: Proceedings of the Second International Conferenceon Coordinated & Multiple Views in Exploratory Visualization, pages107–117. IEEE Computer Society, 2004.
[29] P. T. Sowden and P. Schyns. Channel surfing in the visual brain. Trendsin Cognitive Sciences, 10(12):538–545, 2006.
[30] S. S. Stevens. Psychophysics of sensory function. Sensory Communica-tion, 1961.
[31] A. Torralba. How many pixels make an image? Proceedings of the IEEE,94:1948–1962, 2006.
[32] A. Torralba and A. Oliva. Statistics of natural images categories. NetworkComput. Neural Syst., 14:391–412, 2003.
[33] A. Torralba and P. Sinha. Detecting faces in impoverished images. Tech-nical report, In AI Memo 2001-028, CBCL Memo 208, 2001.
[34] C. Ware. Color sequences for univariate maps: Theory, experiments andprinciples. IEEE Computer Graphics and Applications, 8:41–49, 1988.
[35] H. R. Wilson, D. K. Mcfarlane, and G. C. Phillips. Spatial-frequencytuning of orientation selective units estimated by oblique masking. VisionResearch, 23(9):873–882, 1983.
[36] J. Wolfe and T. Horowitz. What attributes guide the deployment of visualattention and how do they do it? Nature Reviews Neuroscience, 5:1–7,2004.
[37] B. Yost, Y. Haciahmetoglu, and C. North. Beyond visual acuity: theperceptual scalability of information visualizations for large displays. InCHI ’07: Proceedings of the SIGCHI conference on Human factors incomputing systems, pages 101–110, New York, NY, USA, 2007. ACM.
[38] H. Ziegler, T. Nietzschmann, and D. A. Keim. Visual analytics on the fi-nancial market: Pixel-based analysis and comparison of long-term invest-ments. Information Visualisation, International Conference on, 0:287–295, 2008.
972 IEEE TRANSACTIONS ON VISUALIZATION AND COMPUTER GRAPHICS, VOL. 16, NO. 6, NOVEMBER/DECEMBER 2010