Gravity monitoring of CO2 movement during sequestration: Model studies

Computers & Geosciences 54 (2013) 28–37
Contents lists available at SciVerse ScienceDirect
Computers & Geosciences
0098-30
http://d
n Corr
E-m
journal homepage: www.elsevier.com/locate/cageo
Evaluating the impact of aquifer layer properties on geomechanicalresponse during CO2 geological sequestration
Jie Bao a,n, Zhijie Xu b, Guang Lin b, Yilin Fang c
a Fluid and Computational Engineering Group, Energy and Environment Directorate, Pacific Northwest National Laboratory, Richland, WA 99352, USAb Computational Mathematics Group, Fundamental and Computational Sciences Directorate, Pacific Northwest National Laboratory, Richland,
WA 99352, USAc Hydrology Technical Group, Energy and Environment Directorate, Pacific Northwest National Laboratory, Richland, WA 99352, USA
a r t i c l e i n f o
Article history:
Received 22 November 2012
Received in revised form
25 January 2013
Accepted 28 January 2013Available online 13 February 2013
Keywords:
CO2 geological sequestration
Coupled hydro-mechanical model
Finite element method (FEM)
Sensitivity analysis
Uncertainty analysis
04/$ - see front matter & 2013 Elsevier Ltd. A
x.doi.org/10.1016/j.cageo.2013.01.015
esponding author. Tel.: þ1 509 375 4459; fax
ail address: [email protected] (J. Bao).
a b s t r a c t
Numerical models play an essential role in understanding the facts of carbon dioxide (CO2) geological
sequestration in the life cycle of a storage reservoir. We present a series of test cases that reflect a broad
and realistic range of aquifer reservoir properties to systematically evaluate and compare the impacts
on the geomechanical response to CO2 injection. In this study, a coupled hydro-mechanical model was
applied to simulate the sequestration process, and a quasi-Monte Carlo sampling method was
employed to efficiently sample the value of aquifer properties and geometry parameters. Through
quantitative sensitivity analysis, the impacts of all the input parameters are ranked. Aquifer perme-
ability was found to be of significant importance to the geomechanical response to the injection.
To study the influence of uncertainty of the permeability distribution in the aquifer, an additional series
of tests is presented, based on a default permeability distribution site sample with various distribution
deviations generated by the Monte Carlo sampling method. The results of the test series show that the
uncertainty of permeability distributions significantly affect the displacement and possible failure zone.
& 2013 Elsevier Ltd. All rights reserved.
1. Introduction
Injecting fluid into confined aquifers is a widely acceptedstrategy for enhanced oil recovery, gas storage, and wastedisposal (Nordbotten and Celia, 2006). It is well known thatcarbon dioxide (CO2) sequestration in deep saline aquifers couldbe a promising mitigation method for the reduction of CO2
emitted to the atmosphere (Vilarrasa et al., 2011). The storageof CO2 in deep saline aquifer is an excellent solution for largeparts of northwest Europe and the midwestern United States,where large-scale CO2 storage will be required in order to make asignificant contribution to reduce CO2 emissions (Rutqvist et al.,2010). Geological storage of CO2 involves fairly complex physicaland chemical processes such as multiphase flow, multicomponentmiscible transport, geochemical (Spycher et al., 2003), geomecha-nical, and nonisothermal effects (Celia and Nordbotten, 2010;Rutqvist, 2012). Mathematical models and numerical simulationtools will play an important role in evaluating the feasibility ofCO2 storage in subsurface reservoirs, designing and analyzingfield tests, and designing and operating geological CO2 disposalsystems (Pruess et al., 2004). Because of the complexity of the CO2
ll rights reserved.
: þ1 509 375 3865.
geological sequestration, many factors impact the safety andsustainability of the injection. This paper presents a computa-tional model and a series of test cases for understanding theimportance of different factors that affect geomechanicalresponse upon the injection of substantial supercritical CO2 intoa deep geological formation. In addition, various aquifer perme-ability distributions are generated to represent different stoneformations in aquifers for understanding the geomechanicalresponse following the injection of CO2 into various formations.
CO2 is expected to be retained underground until well past theend of the fossil fuel era, and it could last several hundred years oreven longer than 1000 years (Wilson, 1992; Holloway, 2005).Hence, geological sequestration of supercritical CO2 intrinsicallyinvolves a number of complicated physical and chemical pro-cesses that occur within a large spatial domain and an extremelylong period of time. In addition, the sensitivity analysis of inputparameters requires hundreds of simulation cases. To make thesimulation computationally affordable, the numerical model usedfor CO2 sequestration must be stable within a large time step andgrid size. The numerical model we used in all test cases is stablefor time steps ranging from a day to a few years, and the grid sizecan be several hundred meters. The accuracy is tested throughcomparing with the analytical solution (Bao et al., 2012).
We first introduce and discuss the input parameter sensitivityanalysis in Section 2. During CO2 injection, the fluid pressure may
J. Bao et al. / Computers & Geosciences 54 (2013) 28–37 29
be too large, and the induced stress may cause irreversiblemechanical changes, create new fractures, and reactivate existingfaults (Rutqvist et al., 2007), which may cause seismic activity. Inthe same section, we describe the application of geomechanicalshear-slip failure analysis to estimate the potential damage zoneduring CO2 injection. The quasi-Monte Carlo method was appliedfor sampling model input parameters to achieve the balancebetween covering as many as possible over the entire parametricspace without introducing undesired bias and computationalburden, which are discussed in Section 2.2. We also discuss theuncertainty of structure of layering aquifer permeability distribu-tion’s impact to geological displacement during CO2 sequestrationin Section 3.
2. Input parameter sensitivity analysis
The sensitivity analysis of the input parameters for geomecha-nical response during CO2 injection was based on the simulationresults of a coupled hydro-mechanical model (Xu et al., 2012).The model can be solved analytically for a simplified typical CO2
sequestration problem in the axisymmetric coordinate system, asshown in Fig. 1. A numerical solution was developed for arbitrarygeometry (Bao et al., 2012) using a finite element method (FEM)code based on an open-source FEM program Elmer (CSC-IT, 2011),which shows great agreement with the analytical solution. Forconvenience, the model is briefly introduced in Section 2.1. Thequasi-Monte Carlo is a popular sampling method because of theirfaster convergence and effective sampling of high-dimensionalparametric space, which is briefly introduced in Section 2.2 forconvenience as well.
2.1. A hydro-mechanical model for CO2 geological sequestration
Because the hydro-mechanical model was designed for esti-mating the CO2 geological sequestration over a long time periodand in a large space domain, several assumptions were used:details in microscale and rapid transition phenomena were
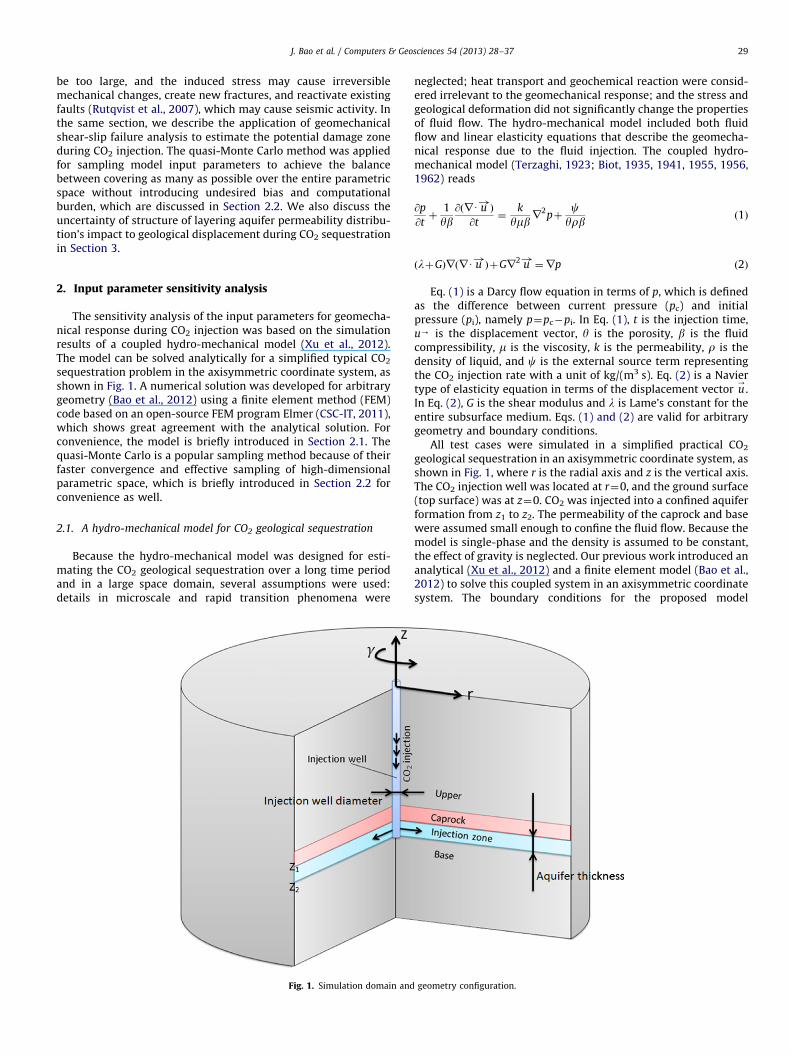
Fig. 1. Simulation domain and
neglected; heat transport and geochemical reaction were consid-ered irrelevant to the geomechanical response; and the stress andgeological deformation did not significantly change the propertiesof fluid flow. The hydro-mechanical model included both fluidflow and linear elasticity equations that describe the geomecha-nical response due to the fluid injection. The coupled hydro-mechanical model (Terzaghi, 1923; Biot, 1935, 1941, 1955, 1956,1962) reads
@p
@tþ
1
yb@ðrU u!Þ
@t¼
k
ymbr2pþ
cyrb ð1Þ
ðlþGÞrðrU u!ÞþGr2 u
!¼rp ð2Þ
Eq. (1) is a Darcy flow equation in terms of p, which is definedas the difference between current pressure (pc) and initialpressure (pi), namely p¼pc�pi. In Eq. (1), t is the injection time,u- is the displacement vector, y is the porosity, b is the fluidcompressibility, m is the viscosity, k is the permeability, r is thedensity of liquid, and c is the external source term representingthe CO2 injection rate with a unit of kg/(m3 s). Eq. (2) is a Naviertype of elasticity equation in terms of the displacement vector u
-.
In Eq. (2), G is the shear modulus and l is Lame’s constant for theentire subsurface medium. Eqs. (1) and (2) are valid for arbitrarygeometry and boundary conditions.
All test cases were simulated in a simplified practical CO2
geological sequestration in an axisymmetric coordinate system, asshown in Fig. 1, where r is the radial axis and z is the vertical axis.The CO2 injection well was located at r¼0, and the ground surface(top surface) was at z¼0. CO2 was injected into a confined aquiferformation from z1 to z2. The permeability of the caprock and basewere assumed small enough to confine the fluid flow. Because themodel is single-phase and the density is assumed to be constant,the effect of gravity is neglected. Our previous work introduced ananalytical (Xu et al., 2012) and a finite element model (Bao et al.,2012) to solve this coupled system in an axisymmetric coordinatesystem. The boundary conditions for the proposed model
geometry configuration.

Fig. 2. Pressure distribution in aquifer.
Fig. 3. Displacement at top surface after 10 years injection. Shown are (a) radial
displacement and (b) vertical displacement.
Fig. 4. Stress state represented by Mohr’s circle for failure analysis.
J. Bao et al. / Computers & Geosciences 54 (2013) 28–3730
(Eqs. (1) and (2)) are
ur ¼ 0, uz ¼ 0, p¼ 0 at r¼1 or z¼�1 ð3Þ
For finite element model, the boundary conditions are set atz¼�40 km, and r¼80 km to mimic the boundary conditions atz¼�N and r¼N. The displacements and pressure are all zero attime t¼ 0 s. The CO2 injection is a multi-phase system, while theproposed model (Eq. (1)) assumes it as single-phase. Fig. 2 showsthe comparison between the results from the proposed single-phase flow model (Eqs. (1) and (2)) and the results from a CO2-brine multi-phase subsurface flow simulator, STOMP (SubsurfaceTransport over Multiple Phases) (White and Oostrom, 2006) inthe same geometry and boundary conditions (aquifer layer isfrom z¼�2240 m to z¼�2740 m (Gollakota and McDonald,2012), and injection rate is 350 kg/s (Hitchon, 1996)). Althoughsingle-phase model slightly overestimates the pressure than themulti-phase model (STOMP) simulation near the injection well,the proposed model can catch the character of the pressureevolution in aquifer, because pressure evolution is much fasterthan flow transport. Therefore, the proposed single-phase flowmodel is an efficient tool to estimate the geomechanical responseto the CO2 injection practices, especially for the uncertaintyquantification.
The maximum pressure (pressure at the injection well, asindicated in Fig. 2), an important parameter that reflects thesafety and sustainability of the injection well, was selected forsensitivity analysis. Fig. 3(a) and (b) shows the analytical and FEMresults for radial and vertical displacements at the top surface.The maximum radial and vertical displacements at the top sur-face, indicated in Fig. 3, were another two model outputs selectedfor sensitivity analysis. Top surface/ground surface displacementsare critical parameters that can be used to monitor the potentialhazard caused by CO2 sequestration activities. Colesanti andWasowski’s work (Colesanti and Wasowski, 2004) shows thatabout 10 mm/year ground surface movement velocity can inducesevere buildings’ damage in high probability. Besides that, in thepractical site, the ground surface displacements are easily mon-itored by Global Positioning System (GPS) or satellite-borneSynthetic Aperture Radar (SAR).
Shear-slip analysis has been performed by several researchersusing the magnitude and orientation of principal stresses withrespect to pre-existing fault planes and fluid pressure within thefault plane (Morris et al., 1996; Wiprut and Zodack, 2000; Streitand Hillis, 2004; Rutqvist et al., 2007). In our work, we applied theshear-slip analysis proposed in Rutqvist’s work (Rutqvist et al.,2007) to determine the potential failure zone. In our analysis, thecohesion was set to zero and the friction angle was 301 (Rutqvistet al., 2007; Vilarrasa et al., 2011). Thus, the criterion for shear-slip was 9BC09 Z 9BC9 on a Mohr’s circle, as shown in Fig. 4. The
failure criterion in terms of the effective principal stress was
s01þs032�s03Zsin301
s01þs032
-s01Z3s03 ; ð4Þ
where s01 is the maximum effective principal stress and s03 is theminimum effective principal stress. The effective stress is calcu-lated by
s!0¼ s!�p I
!; ð5Þ
where s! is the total stress tensor and I!
is unit matrix. Remotestresses were applied at the model boundary in all simulations, asshown in Fig. 5. The vertical remote stress is the lithostatic stresssv¼rsg9z9, where rs is the density of the subsurface medium, g is

J. Bao et al. / Computers & Geosciences 54 (2013) 28–37 31
gravity, and 9z9 is depth. Horizontal remote stress (sh) varies withdifferent subsurface formations and locations. Generally, small sh
may cause tensile failure in higher possibility instead of shear-slipfailure. sh¼1.5sv (Rutqvist et al., 2007) is used in all thesimulation tests in this paper, and it is a relatively big horizontalremote stress that easier leads to shear-slip failure. Fig. 6 showsthe contour of F¼ s01�3s03 (MPa) after 10 years of CO2 injection.The indicated area is the zone in which F40, namely thepotential shear-slip failure zone. The maximum value of F alsowas selected as the output parameter. The value of F is related tothe likelihood of the failure occurrence. In our study, the potentialfailure zone locates in the aquifer layer in the most cases, and the
Fig. 5. Remote stress.
Fig. 6. Contour of F¼s01�3s03 (MPa). The marked area is the zone F40, which
indicating a high potential for shear-slip failure.
failure can enhance the injectivity because the fault increases theporosity and permeability of the aquifer formation (Flekkoy et al.,2002). However, frequent or continuous failure possibly causesconsiderable seismic activity, which may lead to ground buildingor facility damage. Although some pioneers paid attention tothe CO2 sequestration induced seismic activity (Rutqvist, 2012),the detailed and quantitative study is still very limited, and itsdamage also varies a lot because of the different location andresident population. Therefore, necessary attention should bepaid to the failure zone in aquifer to avoid considerable groundsurface damage, though it probability enhance the injectivity.
2.2. Quasi-Monte Carlo sampling approach
Various parameters and coefficients can be adjusted in thiscoupled hydro-mechanical model. Among these parameters, theaquifer permeability (k), porosity (y), and Young’s modulus((E¼G(3lþ2G)/lþG)) were selected as the input parameters forsensitivity analysis because they can be changed over a relativelywide range for different CO2 injection sites. The Poisson ratio variesfor different subsurface formation, but its impact to the geome-chanical is limited in our proposed model, so it is assumed to be afixed value 0.25. Other model parameters—for example, theviscosity (m), fluid density (r), and fluid compressibility (b)—affectthe simulation results as well, but the parameter range is verylimited for the practical injection. Values of these parameters werem¼1�10�3 Pa s, r¼600 kg/m3, and b¼1�10�9 (Xu et al., 2012).In addition to the variations in property parameters, the aquiferthickness and injection well radius may be very different forvarious aquifer formations and injection configurations. Therefore,these two geometry parameters, as indicated in Fig. 1, were chosenas the input parameters for the sensitivity analysis. The five inputparameters were selected for studying the impacts of differentfactors that affect the pressure, geomechanical response, andpotential fracture zone during CO2 geological sequestration.Table 1 lists the range for each of these input parameters. Young’smodulus of the stone formation that exists in aquifer, caprock,baserock, and upper varies in big range from a few GPa to over30 GPa (Hart and Wang, 1995; Palmstrom and Singh, 2001). Theentire computational domain is assumed to have the same Young’smodulus, so a small Young’s modulus may cause large displace-ment in the proposed model, which is not allowed in the practicalcases. Therefore, the range of Young’s modulus is set as 25–35 GPa,to make the geological deformation in the desired range, such asthe maximum ground surface vertical displacement smaller than0.4 m. Similar as Young’s modulus, the aquifer porosity andpermeability also vary in big range for different formation (Houet al., 2012), but only sub-range of these two parameters are usedfor controlling the displacement under the acceptable range during10 years injection. In all simulation cases, the top boundary of theaquifer was fixed at a depth of �2242 m, which is according to thesubsurface environment for Illinois Basin-Decatur Project(Gollakota and McDonald, 2012). The permeabilities of the caprock,upper rock, and base rock were set to zero so that injected CO2
could be completely confined within the aquifer.
Table 1Input parameters and range for sensitivity
analysis.
Well radius (m) 0.1–0.75
Aquifer thickness (m) 100–500
Aquifer porosity 0.05–0.3
Log 10 Aquifer permeability (m2) �14–12
Young’s modulus (GPa) 25–35

J. Bao et al. / Computers & Geosciences 54 (2013) 28–3732
Samples should be generated to consider as much variation aspossible within the parametric space without introducing unde-sired bias. However, as the model’s dimensionality increases, thenumber of samples required for a systematic approach to ade-quately cover the parametric space becomes unreasonable, andrandom or pseudorandom methods must be incorporated. Quasi-Monte Carlo methods have become increasingly popular over thelast two decades because of their faster convergence and effectivesampling of high-dimensional parametric space without clump-ing (Tarantola, 2005; Hou et al., 2012). The number of quasi-MontCarlo samples is normally a power of 2 and is usually chosen asa trade-off between computational time and numerical error. Fordeveloping reliable responses between output and input
Fig. 7. Paired scatterplots of the five
parameters, we found that for the five-dimensional parameterspace, 256 samples were adequate to yield a reliable analysis. Thepaired scatterplot of the five independent parameters is shown inFig. 7, in which the sampling points in the five-dimensionalparameter space are projected to a paired two-dimensionalparameter plane.
2.3. Results
As mentioned in Section 2.2, five input parameters wereselected for studying their impacts in CO2 geological sequestra-tion, and four output parameters from numerical simulationswere chosen to represent the mechanical response after 10 years
independent input parameters.

J. Bao et al. / Computers & Geosciences 54 (2013) 28–37 33
of injection. The injection rate was fixed at 350 kg/s, which isabout 11 MMT/year (Hitchon, 1996). From 256 test cases, thesignificance of each input was investigated through boxplots(Tukey, 1977; Benjamini, 1988; Rousseeuw et al., 1999) thatshow the relationship between input and output parameters(Fig. 8). Aquifer permeability clearly demonstrated the largesteffect on all four output parameters, as shown by the strong linearrelationship evident in Fig. 8 (column 4). The injection pressureincreased with decreasing permeability, indicating that a lowerinjection rate should be used for a low-permeability aquifer.A lower aquifer permeability also leads to larger displacementand a larger value of F; that is, injecting CO2 into a low-permeability aquifer leads to larger geomechanical deformationand higher risk of failure. Aquifer thickness shows a linear relation-ship with maximum pressure, which is consistent with theanalytical solution pðr,tÞ ¼ c’
4prk
R t0ððexpð�r2=4Dðt�tÞÞÞ=ðt�tÞÞdt
(Xu et al., 2012) in which pressure is linearly dependent on theline injection rate c0 (kg/m s). With increasing aquifer thickness,the line injection rate decreases linearly. Besides the predictablemost important factor, aquifer permeability, the relative signifi-cance of the other four input parameters was not so easilydetermined through boxplot or analyzing the analytical solution(Xu et al., 2012) of the proposed model.
To quantitatively evaluate the sensitivity of each input para-meter with respect to output variables, we employed generalizedcross-validation (GCV) based on the multivariate adaptive
Fig. 8. Relationships between the five input pa
regression splines (MARS) method (Friedman and Silverman,1987; Friedman et al., 1988; Friedman 1991a,1991b, 1993), andstandardized regression coefficients (SRCs) based on the quadraticpolynomial regression method (Allison, 1977; Aiken and West,1991; Bring, 1994) to analyze the importance and identify thesensitivity of each input parameter. Fig. 9 shows the score ofimportance measured by GVC and SRCs and the rank of inputparameters for different output. The most important parameter,permeability, is set to a score of 100, and the scores of otherinputs are scaled according to the permeability score. Bothanalysis methods exhibit the same rank of importance of all inputparameters, which is in agreement with the qualitative conclu-sion obtained from Fig. 8. Aquifer thickness was the second mostimportant factor affecting the maximum pressure and maximumvalue of F Aquifer porosity was found to be the second mostimportant factor affecting the top surface displacement, andYoung’s modulus is ranked third. The regression and importancemeasurements were performed using software R (Venables et al.,2012) and PSUADE (Tong, 2010).
3. Impact of structure of layering aquifer permeability
As discussed in the previous section, aquifer permeability playsa very important role in injection pressure and geomechanicalresponse during CO2 sequestration. In reality, the permeability
rameters and the four output parameters.

Fig. 9. Importance score of input parameters for different outputs. Shown are (a) maximum pressure, (b) maximum value of F¼s01�3s03, (c) maximum radial
displacement on top surface and (d) maximum vertical displacement on top surface.
Fig. 10. Aquifer permeability distribution in 200 test cases (a¼1).
Fig. 11. Displacement on top surface for 200 permeability distribution test cases
(a¼0.2).
J. Bao et al. / Computers & Geosciences 54 (2013) 28–3734
changes in an aquifer along the depth (Barnes et al., 2009; Zhouet al., 2010), as shown by the red line in Fig. 10; this was used asthe default permeability distribution, which is based on the samplein Illinois Basin-Decatur Project (Gollakota and McDonald, 2012).The aquifer was divided into 53 layers, each with a differentpermeability value. The actual permeability distribution mightdiffer from the sample distribution for different CO2 sequestrationsites, depending on the subsurface formation. Therefore, weassume that the measured permeability from the sample is themedium value in each layer, and the actual permeability in thepractical site in realistic underground environment can vary fromthe sample following lognormal distribution (Satter et al., 2007).To emulate this permeability distribution, the permeability in theaquifer was defined as
ki ¼ kd,i � eða�wiÞ ð6Þ
where kd,i is the permeability from the default distribution asindicated by the red line in Fig. 10 and i represents the i-th layerbetween 1 and 53. a is a coefficient that controls the extent ofthe deviation from the default permeability distribution. w is a53-dimensional space used for emulating the uncertainty of 53

Fig. 12. Radial displacement at top surface after 10 years of injection for 200
permeability distributions: (a) a¼0.2, (b) a¼0.6 and (c) a¼1.0.
Fig. 13. Vertical displacement at top surface after 10 years of injection for 200
permeability distributions: (a) a¼0.2, (b) a¼0.6, and (c) a¼1.0.
J. Bao et al. / Computers & Geosciences 54 (2013) 28–37 35
aquifer layers. For each value, Monte Carlo sampling was used togenerate 200 samples from w, which is sampled from a uniformdistribution from �3 to 3. The gray lines in Fig. 10 show 200different permeability distributions for a¼1.
The weight coefficients of bias a were set to 0.2, 0.6, and 1.0. Theinvestigation of impacts of structure of layering aquifer permeabilitywas based on the simulation results from the numerical modelintroduced in Section 2.1. For QUOTE , Fig. 11 plots the radial andvertical displacements on the top surface for 200 different perme-ability distributions. The red line in Fig. 11 is the mean displacementof all 200 cases. Figs. 12 and 13 show the mean, standard deviation,maximum, and minimum of vertical and horizontal displacements atthe top surface for all 200 test cases with a¼0.2, 0.6 and 1.0. It isobvious that a larger QUOTE leads to larger variation of bothdisplacements. The results show all the possible displacements, suchas the best and the worst cases, based on a measured site samplewith uncertain error or bias underground. It is helpful for evaluatingthe impact of the CO2 sequestration accurately, especially the safetyof building and facility on ground surface. Figs. 14–16 show theaccumulated shear-slip failure zone for the test cases. The value is
scaled from 0 to 200 in Figs. 14–16. The position with the value of 200means the shear-slip failure occurs at this position for all 200 testcases. Location with value 0 means no failure occurs in any of these200 test cases. It can be considered as the probability of the shear-slipfailure at each point in aquifer and caprock based on a site sample.The white line is the enclosure of the area that failure occurs at leastonce in all 200 test cases. The larger uncertainty (larger QUOTE ) inthe permeability distribution leads to larger uncertainty of shear-slipfailure area. In all three cases, the failure zone concentrated near thedepths of �2240 m to �2340 m and �2440 m to �2490 m becausethe permeability is about 2 orders of magnitude lower in these twoarea than it is in other aquifer locations (Fig. 10).
4. Conclusions
For the analysis of input parameter sensitivity, we used ourcoupled hydro-mechanical model to simulate 256 cases with

Fig. 14. Accumulated shear-slip failure zone for 200 aquifer permeability dis-
tribution test cases for a¼0.2.
Fig. 15. Accumulated shear-slip failure zone for 200 aquifer permeability dis-
tribution test cases for a¼0.6.
Fig. 16. Accumulated shear-slip failure zone for 200 aquifer permeability dis-
tribution test cases for a¼1.0.
J. Bao et al. / Computers & Geosciences 54 (2013) 28–3736
different combinations of the five input parameters. Results of thesensitivity analysis show that the aquifer permeability has thehighest score of importance and is the most important factor forinjection pressure, displacements, and the potential shear-slipfailure for CO2 sequestration. A smaller permeability value cansignificantly increase the injection pressure and deformation andleads to a much higher risk of shear-slip failure or fracturingearlier in the life of an injection well. Aquifer thickness is thesecond most important factor to affect the maximum injectionpressure and maximum value of QUOTE , while aquifer porosity is
the second most important factor to impact the displacement, andYoung’s modulus is ranked third.
To evaluate the impact of a structure of layering aquiferpermeability distribution, we studied the effects of aquiferpermeability uncertainty (quantified by parameter QUOTE ) ongeomechanical deformation and the failure zone through a totalof 600 different permeability distributions. Simulation resultsshow that a larger QUOTE leads to larger variation of both thevertical and horizontal displacements, and also leads to a largeruncertainty of shear-slip failure area.
Acknowledgments
This research was funded and conducted through the PacificNorthwest National Laboratory (PNNL) Carbon SequestrationInitiative, which is part of the Laboratory Directed Research andDevelopment Program. PNNL is operated by Battelle for the U.S.Department of Energy under Contract DE-AC05-76RL01830.
References
Aiken, L.S., West, S.G., 1991. Multiple regression: testing and interpreting inter-actions. Sage Publications, Inc.
Allison, P.D., 1977. Testing for interaction in multiple-regression. American Journalof Sociology 83 (1), 144–153.
Bao, J., Xu, Z., Fang, Y., 2012. A finite element model for coupled thermal-hydro-mechanical simulation of carbon dioxide sequestration. CCUS Conference,Pittsburgh PA, USA.
Barnes, D.A., Bacon, D.H., Kelley, S.R., 2009. Geological sequestration of carbondioxide in the cambrian mount simon sandstone: regional storage capacity,site characteriztion, and large-scale injection feasibility, michigan basin.Environmental Geosciences 16 (3), 163–183.
Benjamini, Y., 1988. Opening the box of a boxplot. The American Statistician 42,257–262.
Biot, M.A., 1935. Le problem de la consolidation des matieres argileusessous unecharge. Annales de la Societe Scientifique de Bruxelles. Serie B 55, 110–113.
Biot, M.A., 1941. General theory of three-dimensional consolidation. Journal ofApplied Physics 12, 155–164.
Biot, M.A., 1955. Theory of elasticity and consolidation for a porous anisotropicsolid. Journal of Applied Physics 26, 182–185.

J. Bao et al. / Computers & Geosciences 54 (2013) 28–37 37
Biot, M.A., 1956. Thermoelasticity and irreversible thermodynamics. Journal ofApplied Physics 27, 240–253.
Biot, M.A., 1962. Mechanics of deformation and acoustic propagation in porousmedia. Journal of Applied Physics 33, 1482–1498.
Bring, J., 1994. How to standardize regression coefficients. The American Statis-tician 48 (3), 209–214.
Celia, M.A., Nordbotten, J.M., 2010. How simple can we make models for CO2
injection, migration, and leakage? Energy Procedia 4, 3857–3864.Colesanti, C., Wasowski, J., 2004. Satellite sar interferometry for wide-area slope
hazard detection and site-specific monitoring of slow landslides. InternationalLandslide Symposium, Rio de Janeiro, Brasil, pp. 1–6.
CSC-IT, C.f.S., 2011. Elmer solver manual.Flekkoy, E.G., Sorenssen, A.M., Jamtveit, B., 2002. Modeling hydrofracture. Journal
of Geophysical Research 107 (B8), 2151–2162.Friedman, J.H., 1991a. Annals of Statistics 19, 1–141.Friedman, J.H., 1991b. Multivariate adaptive regression splines. Annals of Statistics
19, 140–141.Friedman, J.H., 1993. Fast mars. Stanford University, Technical Report LCS110.Friedman, J.H., Silverman, B.W., 1987. Flexible Parsimonious Smoothing and
Additive Modeling. Stanford University, CA, Report SLAC-PUB-4390.Friedman, J.H., Wegman, E.Gantz, D., Miller, J., 1988. Fitting functions to noisy data
in high dimensions. In: Proceedings of the 20th Symposium on the Interface.Gollakota, S., McDonald, S., 2012. Industrial CO2 storage in Mt. Simon sandstone
saline reservoir—a large-scale demonstration project in Illinois. In: Proceed-ings of the Eleventh Annual Carbon Capture, Utilization and SequestrationConference, Pittsburgh PA, USA.
Hart, D.J., Wang, H.F., 1995. Laboratory measurements of a complete set ofporoelastic moduli for berea sandstone and Indiana limestone. Journal ofGeophysical Research 100, 17741–17751.
Hitchon, B., 1996. Aquifer Disposal of Carbon Dioxide. Geoscience Publishing Ltd.,Sherwood Park, Alberta.
Holloway, S., 2005. Underground sequestration of carbon dioxide—a viablegreenhouse gas mitigation option. Energy 30 (11–12), 2318–2333.
Hou, Z., Rockhold, M.L., Murray, C.J., 2012. Evaluating the impact of caprock andreservoir properties on potential risk of CO2 leakage after injection. Environ-mental Earth Sciences 66 (8), 2403–2415.
Morris, A., Ferril, D.A., Henderson, D.B., 1996. Slip tendency analysis and faultreactivation. Geology 24, 275–278.
Nordbotten, J.M., Celia, M.A., 2006. Similarity solutions for fluid injection intoconfined aquifers. Journal of Fluid Mechanics 561, 307–327.
Palmstrom, A., Singh, R., 2001. The deformation modulus of rock masses. Tunnel-ling and Underground Space Technology 16 (3), 115–131.
Pruess, K., Garcia, J., Kovscek, T., Oldenburg, C., Rutqvist, J., Steefel, C., Xu, T., 2004.Code intercomparison builds confidence in numerical simulation models forgeologic disposal of CO2. Energy 29, 1431–1444.
Rousseeuw, P.J., Ruts, I., Tukey, J.W., 1999. The bagplot: a bivariate boxplot. TheAmerican Statistician 53, 382–387.
Rutqvist, J., 2012. The geomechanics of CO2 storage in deep sedimentry forma-tions. International Journal of Geotechnical and Geological Engineering 30,525–551.
Rutqvist, J., Birkholzer, J., Cappa, F., Tsang, C.F., 2007. Estimating maximumsustainable injection pressure during geological sequestration of CO2 usingcoupled fluid flow and geomechanical fault-slip analysis. Energy Conversionand Management 48, 1798–1807.
Rutqvist, J., Vasco, D.W., LMyer, L., 2010. Coupled reservoir-geomechanicalanalysis of CO2 injection and ground deformations at In Salah, Algeria.International Journal of Greenhouse Gas Control 4, 225–230.
Satter, A., Iqbal, G.M., Buchwalter, J.L., 2007. Practical Enhanced ReservoirEngineering: Assisted With Simulation Software. PennWell Corporation, USA.
Spycher, N., Pruess, K., Ennis-King, J., 2003. CO2–H2O mixtures in the geologicalsequestration of CO2. I. Assessment and calculation of mutual solubilities from12 to 100 1C and up to 600 bar. Geochimica et Cosmochimica Acta 67,3015–3031.
Streit, J.E., Hillis, R.R., 2004. Estimating fault stability and sustainable fluidpressures for underground storage of CO2 in porous rock. Energy 29,1445–1456.
Tarantola, A., 2005. Inverse Problem Theory and Model Parameter Estimation.Society for Industrial and Applied Mathematics, Philadelphia, PA, USA.
Terzaghi, K., 1923. Die berechnung der durchlassigkeitsziffer des tones aus demverlauf der hydrodynamischen spannungserscheinungen. Mathematish Nat-urwissenschaftliche 132, 125–138.
Tong, C., 2010. Psuade Reference Manual.Tukey, J.W., 1977. Exploratory Data Analysis. Addison-Wesley, Boston.Venables, W.N., Smith, D.M.,team, R.c. , 2012. An Introduction to R.Vilarrasa, V., Olivella, S., Carrera, J., 2011. Geomechanical stability of the caprock
during CO2 sequestration in deep saline aquifers. Energy Procedia 4,5306–5313.
White, M.D., Oostrom, M., 2006. Stomp subsurface transport over multiple phasesvertiosn 4.0. Pacific Northwest National Laboratory, Richland, WashingtonPNNL-15782.
Wilson, T.R.S., 1992. The deep ocean disposal of carbon dioxide. Energy Conversionand Management 33 (5–8), 627–633.
Wiprut, D., Zodack, M.D., 2000. Fault reactivation and fluid flow along a previouslydormant normal fault in the northern north sea. Geology 28, 595–598.
Xu, Z., Fang, Y., Scheibe, T.D., Bonneville, A., 2012. A fluid pressure and deformationanalysis for geological sequestration of carbon dioxide. Computers andGeoscience 46, 31–37.
Zhou, Q., Birkholzer, J.T., Mehnert, E., Lin, Y., Zhang, K., 2010. Modeling basin- andplume-scale processes of CO2 storage for full-scale deployment. Ground Water48 (4), 494–514.
Copyright © 2022 FDOKUMEN