II Geography (Syllabus to be implemented from June, 2019 ...
Upload
independentCategory
view
0download
0
at SciVerse ScienceDirect
LWT - Food Science and Technology 53 (2013) 113e119
Contents lists available
LWT - Food Science and Technology
journal homepage: www.elsevier .com/locate/ lwt
Evaluating the efficacy of brine acidification as implemented by the Greek tableolive industry on the fermentation profile of Conservolea green olives
Javier Villegas Vergara a, Vassiliki Blana b, Athanasios Mallouchos c, Anastasios Stamatiou b,Efstathios Z. Panagou b,*
aUniversidad Pablo Olavide, Facultad de Ciencias Experimentales, Carretera Utrera, 41013 Sevilla, Spainb Laboratory of Microbiology and Biotechnology of Foods, Department of Food Science and Technology, Agricultural University of Athens, Iera Odos 75, Athens GR 118-55, Greecec Laboratory of Food Chemistry and Analysis, Department of Food Science and Technology, Agricultural University of Athens, Iera Odos 75, Athens GR 118-55, Greece
a r t i c l e i n f o
Article history:Received 17 September 2012Received in revised form13 January 2013Accepted 5 March 2013
Keywords:AcidificationChemometricsFermentationGreen olivesMethanolOrganic acidsVolatile compounds
* Corresponding author. Tel./fax: þ30 210 5294693E-mail address: [email protected] (E.Z. Panag
0023-6438/$ e see front matter � 2013 Published byhttp://dx.doi.org/10.1016/j.lwt.2013.03.003
a b s t r a c t
The efficacy of different brine acidification treatments on the fermentation profile of Conservolea greenolives processed by the Spanish method was evaluated. The treatments included: (a) acidification withCO2 gas, and (b) acidification with a mixture of lactic acid and HCl. Both processes were compared againsta traditional fermentation with no acidification of the brine. Microbial growth, pH, acidity, organic acids,and volatile compounds were monitored for four months. Chemometric analysis was employed todifferentiate the processes based on the profile of lactic acid bacteria (LAB) and yeasts, organic acids, andvolatile compounds in the brines. Results showed that acidification of the brine with CO2 and lactic/HClacids resulted in successful lactic fermentation processes. Lactic and acetic were the main organic acidsmeasured in the brine by HPLC, whereas ethanol and methanol were the main volatile compoundsquantified by headspace GC. A high concentration of methanol was found in the acidified brinesexceeding even the concentration of ethanol in the end of the process. Sensory evaluation on the finalproduct showed no difference among the three processes. Chemometric analysis was effective indiscriminating the different fermentation profiles providing interesting perspectives in the applicabilityof this approach in olive fermentation.
� 2013 Published by Elsevier Ltd.
1. Introduction
Spanish-style green olives are by far the most important prepa-ration in the international market, with almost 800,000 tons out of2,266,500 tons estimated world production (Ruiz Barba & JiménezDíaz, 2012). In Greece, almost 120,000e130,000 tons of olives areprocessed every year from which a percentage of ca. 50e60% isprocessed by the Spanish method using the varieties of ConservoleaandHalkidiki. The traditional processing of Conservolea green olivesinvolves an initial lye treatment (1.7e2.0%, w/v, NaOH) to hydrolyzeoleuropein followed byawashing step to remove the excess of alkali.Olives are then immersed in brine (10e11%, w/v, NaCl) where theyundergo a spontaneous fermentation mainly by lactic acid bacteria(LAB) (Hurtado, Reguant, Bordons, & Rozès, 2012).
In Greece, the traditional Spanish-style processing of green olivesinvolves a washing step with three water changes every 4 h for anoverall period of 12 h. Nowadays considerable effort has been un-dertaken to reduce the amount of water used by maintaining two
.ou).
Elsevier Ltd.
water changes at 4 h and 12 h. In this case, the amount of remainingalkali in olive flesh must be neutralized otherwise the brine will becharacterized by high buffering capacity, due to the combinedacidity, diminishing the effect of organic acids production on thegradual decrease of pH values rendering the product microbiologi-cally unsafe. For this reason, acidification of the brine at thebeginning of fermentation is usually necessary. Traditionally,weak concentrations of lactic and acetic acids are recommended(0.1e0.4%, v/v) that do not affect the process as the same acids areamong themain biochemical compounds produced by fermentation(Garrido-Fernández, Fernández Díez, & Adams, 1997). However,other studies suggested the use of inorganic acids (HCl, H3PO4)(de Castro Gómez-Millán, Montaño, Sánchez Gómez, RejanoNavarro, & Garrido Fernández, 1989; González Cancho et al., 1983,González Cancho et al., 1984; Sánchez, García, Rejano, Brenes, &Garrido, 1995) or the use of brines from previous fermentations(Sánchez et al., 1995; Panagou & Katsaboxakis, 2006). Recently,another treatment has been employed by injecting compressed CO2through the brine at the beginning of the process (Marsilio, Lanza,Russi, & Iannucci, 2008; Marsilio, Russi, Iannucci, & Sabatini, 2008)which is considered as amilder acidification treatment compared to
J.V. Vergara et al. / LWT - Food Science and Technology 53 (2013) 113e119114
acids, since the pH of the brine decreases around 6.0e6.5 during thetreatment. The purpose of the present work was to monitor twoacidification treatments as implemented today by the Greek tableolive industry using (a) CO2 gas injected directly in the brine, and (b)a mixture of lactic acid and HCl and infer about their effect on thefermentation profile of cv. Conservolea green olives.
2. Materials and methods
2.1. Olive treatment and fermentation procedures
Conservolea green olives were harvested in mid-September2011 and transported to the laboratory within the same day to beprocessed according to the Spanish style method. An amountof 60 kg of olives was immersed in 1.7% (w/v) NaOH solution for10e11 h at room temperature (ca. 25 �C) until the alkali reached 2/3of the flesh as measured from the epidermis to the pit. A washingstep was followed replacing the NaOH solutionwith tap water. Twodifferent washing schemes were undertaken with (a) three waterchanges at 4, 8, and 12 h, and (b) two water changes at 4 and 12 h.Fermentation was undertaken in 14 l total capacity screw-cappedplastic vessels containing approximately 7 kg of olives and 4.5 l offreshly prepared 10% (w/v) NaCl brine. Three fermentation pro-cesses were investigated in all. In the first process, olives subjectedto a washing step with three water changes were brined withoutany initial acidification treatment (control process). Furthermore,olives subjected to two washing waters were divided into two lots.One lot of olives was immersed in brine and allowed to stand for24 h. After this period, the olives and brine in the fermentationvessel were acidified by bubbling CO2 gas from a cylinder at a flowrate of 1 l/min for 1 h to lower the initial pH to ca. 6.0 units (CO2process). The other lot of olives was also immersed in brinethat was acidified with 0.1% (v/v) lactic acid (85%, Sigma) and0.014% (v/v) HCl (lactic/HCl acid process). All treatments wereperformed in duplicate and fermentation vessels were maintainedat room temperature for an overall period of 4 months (122 days).
2.2. Microbiological analysis
Brine samples were collected at different time points duringfermentation and analyzed for LAB, yeasts and Enterobacteriaceae.Specifically, samples (1 ml) were aseptically transferred to 9 mlsterile ¼ Ringer’s solution (LabM, Bury, UK). Decimal dilutions inthe same Ringer’s solution were prepared and duplicate 1 or 0.1 mlsamples of the appropriate dilutions were mixed or spread on thefollowing agar media: de Man-Rogosa-Sharp medium (MRS; LabM,Bury, UK) for LAB, supplemented with 0.05% (w/v) cycloheximide(Sigma, St. Luis, Mo.), overlaid with the same medium and incu-bated at 25 �C for 72 h; Rose Bengal Chloramphenicol agar (RBC;LabM, Bury, UK) for yeasts and moulds, incubated at 25 �C for 48 h;Violet Red Bile Glucose agar (VRBGA; Biolife, Milano, Italy) forEnterobacteriaceae counts, overlaid with the same medium andincubated at 37 �C for 24 h.
Growth data for LAB and yeasts from plate counts versus timewere modeled with a two-term Gompertz equation (Bello &Sánchez Fuertes, 1995) as both growth and decline phases in mi-crobial counts were observed during the processes. This model isexpressed by the following equation:
logðNtÞ ¼ logðN0Þ þ k1$expð � expð � k2$ðt � k3ÞÞÞ� k4$expð � expð � k5$ðt � k6ÞÞÞ
(1)
where Nt is the number of microorganisms at time t, N0 the initialpopulation of microorganisms, k1 the increase of microorganismsfrom the initial level to the maximum level reached, k2 the relative
growth rate of the microorganism, k3 the time at which growthrate is maximum, k4 the decrease of microorganisms from themaximum level to a minimum level, k5 the relative death rate of themicroorganism and k6 the time at which death rate is maximum.For the determination of the kinetic parameters, the nonlinearregression procedure of Statistica software, version 8.0 was used(StatSoft Inc., Tulsa, Okla).
2.3. Physicochemical analysis and sensory evaluation
Fermentation of green olives was routinely analysed for pHusing a digital pH meter (Metrohm AG, Herisau, Switzerland).Titratable acidity, combined acidity, and salt content were alsodetermined (Garrido-Fernández et al., 1997). Thewater activity (aw)of the initial and final brines for each fermentation process wasmeasured with a Novasina Thermoconstander RTD 33 water ac-tivity meter (Novasina AG, Zürich, Switzerland) at 25 �C. Firmnessof olives at the end of fermentation (122 days) was determined bymeans of a texture analyser (TX0258 model, Hounsfield, Redhill,UK) equipped with a 6 mm diameter cylinder probe. Firmness ofolive samples by puncturing involved plotting force (N) versusdistance (mm) to calculate the force of the peak necessary to breakthe cuticle of olive (Romeo, De Luca, Piscopo, Perri, & Poiana, 2009).The set parameters of each measurement were: pre-test speed2 mm/s, test speed 0.5 mm/s, post-test speed 4 mm/s andmaximum force 1500 g. Results were expressed as the averagevalues of 10 olives from each fermentation process.
Organic acids (lactic, acetic, formic, succinic, citric, malic) weredetermined by an ion exclusion chromatographic method withpost-column pH-buffered electro-conductimetric detection as re-ported elsewhere (Guillén, Barroso, Zorro, Carrascal, & Pérez-Bustamante, 1998; Palma & Barroso, 2002). All samples werediluted 5-fold with HPLC grade water and then filtered through0.2 mm RC filters (Mini-UniPrep, Whatman, Clifton, USA). Eachdetermination was carried out in duplicate and the results areexpressed as mean values (mM) of organic acid � standard devia-tion. The major volatile compounds of the brine (ethanol, meth-anol, ethyl acetate, acetaldehyde, propanol, 2-butanol and dimethylsulfide) were determined using the static headspace method(Montaño, Sánchez, & Rejano, 1990). Each determination was car-ried out in duplicate and the results are expressed as mean values(mg) of volatile compound per litre of brine � standard deviation.
Olives were also evaluated organoleptically at the end offermentation by a taste panel of ten members according to themethod of sensory analysis of table olives established by the Inter-national Olive Council (IOC, 2011). The sensory attributes taken intoaccount included the following descriptors: abnormal fermenta-tion, other defects, salty, acid, bitter, hardness, fibrousness, andcrispness. Sensory data were subjected to analysis of variance todetect any differences among treatment means at P < 0.05.
2.4. Exploratory data analysis
The heterogeneous data measured in this experiment,comprising microbiological (counts of LAB and yeasts) andbiochemical data (organic acids and volatile compounds) weresubjected to multivariate statistical analysis to investigate any un-derlying relationship among the different fermentation processes.The main concept for undertaking multivariate analysis was toemploy a holistic approach and consider the fingerprints (snap-shots) of the fermentation at different time intervals, taking intoaccount both microbiological and biochemical data. DiscriminantFunction Analysis (DFA) was employed to allow for the discrimi-nation of the three fermentation processes based on the microbi-ological and biochemical profile obtained during the course of
0 10 20 30 40 50 60 70 80 90 100 110 120 130
0
1
2
3
4
5
6
7
8
9
0 10 20 30 40 50 60 70 80 90 100 110 120 130
0
1
2
3
4
5
6
7
8
9
Fermentation time (days)
Cou
nts
(log
10cf
u/m
l)
(a)
(b)
0 10 20 30 40 50 60 70 80 90 100 110 120 130
0
1
2
3
4
5
6
7
8
9
Cou
nts
(log
10cf
u/m
l)
(c)
Fermentation time (days)
Fig. 1. Changes in the population of LAB (B), yeasts (6) and Enterobacteriaceae (>)during fermentation of Conservolea green olives in brines with different initial acidi-fication treatments. (a): without brine acidification (control); (b): brine acidified withCO2; (c): brine acidified with 0.1% (v/v) lactic acid and 0.014% (v/v) HCl.
J.V. Vergara et al. / LWT - Food Science and Technology 53 (2013) 113e119 115
fermentation. DFA is a supervised classification method in whichthe decision boundary between different classes (i.e., fermentationprocesses) is calculated such that the variance between the classesis maximized and the variance within the individual classes isminimized (Hernández Gómez, Wang, Hu, & Pereira, 2007). DFAanalysis was performed with Statistica version 8.0 (StatSoft Inc.,Tulsa, OK, USA).
3. Results and discussion
3.1. Microbiological changes during fermentation
Enterobacteriaceae were present in the brines from the onset offermentation and their counts showed a rapid increase within thefirst week (8 days) with population ranging from 6.6 to 7.8 log10 cfu/ml, but afterwards they declined rapidly and did not survive formore than 30 days in all processes (Fig. 1). However, the evolutionof their population did not seem to be affected by the initial acid-ification of the brine, with the exception of the CO2 treatmentwhere maximum counts were about 1 log unit lower comparedwith the other two processes. Similar growth profiles have beenreported by other researchers (Bautista Gallego et al., 2011) forGordal Spanish style green olives.
LAB and yeasts increased steadily and became the dominantmicrobial groups in the brines presenting similar growth profilesin all processes. Specifically, LAB presented a rapid growth fromthe onset of fermentation and reached their maxima within thefirst two weeks (ca. 7.9e8.2 log10 cfu/ml) and remained almostunchanged until day 70 after which a progressive slight decline inthe counts was evident until the end of fermentation. The kineticparameters of the two-term Gompertz equation are presented inTable 1. The decline phase was similar in terms of estimated ki-netic parameters for both LAB and yeasts regardless of fermenta-tion process. However, for the growth phase, the relative growthrate of LAB in the acidified brines (k2 parameter) was highercompared to control treatment, indicating that brine acidificationhad a positive effect on the growth of LAB, at least as far as thecomparison of the kinetic parameters is concerned. It must benoted that excess amounts of HCl in the brines may affect thenormal microbial association especially that of LAB, causing stuckfermentations, and must be avoided (González Cancho et al.,1984). Moreover, other researchers (de Castro Gómez-Millánet al., 1989) proposedthe addition of HCl in the brines in concen-trations up to 0.07 eq/l in equilibrium to suppress the washingstep in Spanish-style processing without affecting the taste of thefinal fermented product.
3.2. Physicochemical changes during fermentation
The values of NaCl concentration, water activity and combinedacidity in the brines at the beginning (day 2) and end (day 122) offermentation are presented in Table 2. Although the initial salt levelin the brines was fixed at 10% (w/v), osmotic exchange betweenbrines and olives was rapid because of the previous lye treatmentand washing step. As a result, NaCl concentration in the brinesdropped within the first 2 days to 5.6e6.0% and it was maintainedalmost unchanged until the end of fermentation (ca. 6.0% NaCl). Saltconcentration is in good agreement with the measured values of awin the brines, as they remained unchanged from a practical point ofview between the beginning and end of fermentation and oscil-lated around 0.94e0.95. Concerning combined acidity, the finalvalues presented a slight increase during fermentation; howeverthese values were within the range of combined acidity values(0.09e0.11 N) reported previously for bulk-fermented green olives(Garrido-Fernández et al., 1997).
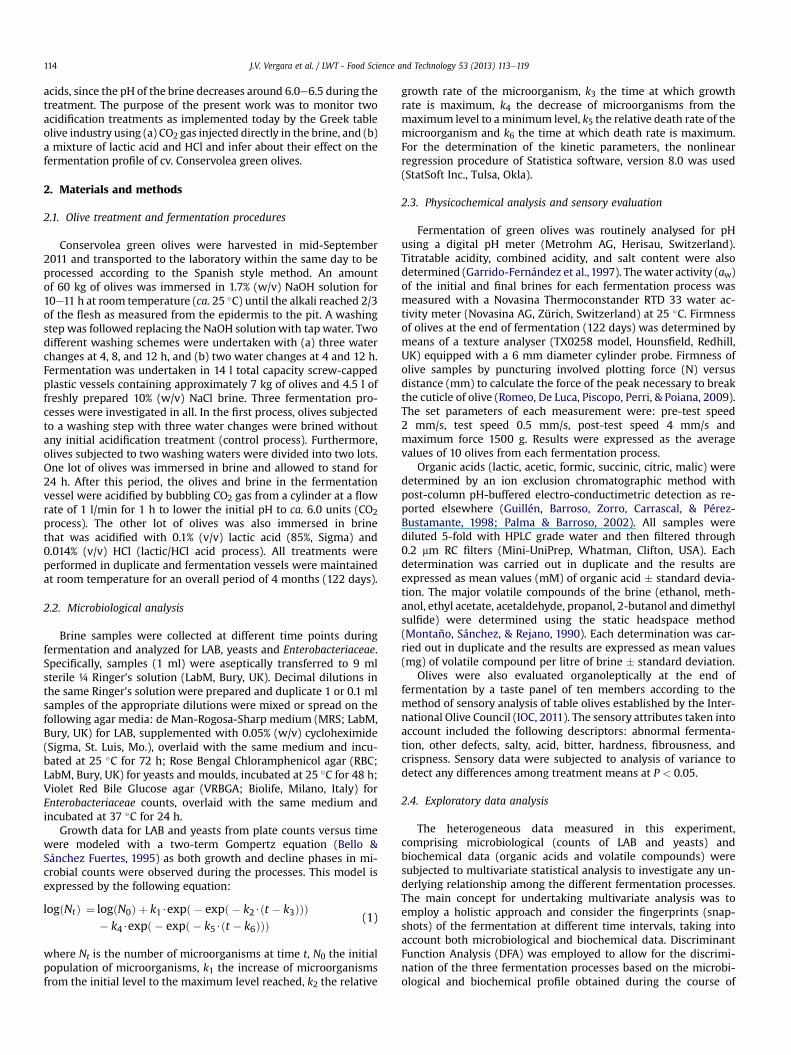
The initial pH values after the acidification treatments were 6.2and 3.1 for the CO2 and the lactic/HCl acids, respectively, whereasthe pH in the control was 8.7 (Fig. 2). Within the next 12 h, pHvalues increased to 9.4e9.8 regardless of treatment and then pre-sented a rapid decrease within the first 10 days reaching a plateauthereafter. It needs to be noted that brine acidification was greatly

Table 1Parameter estimation for the two-term Gompertz equation employed in fitting the growth/decline profile of LAB and yeasts in the fermentation processes.
Process Growth phase Decline phase
k1 (log cfu/ml) k2 (days�1) k3 (days) k4 (log cfu/ml) k5 (days�1) k6 (days)
ALAB 7.80 � 0.12a 0.26 � 0.01 8.04 � 1.17 1.59 � 0.14 0.022 � 0.001 98.82 � 3.27Yeasts 5.75 � 0.24 0.73 � 0.10 7.57 � 0.17 3.15 � 0.15 0.106 � 0.016 56.31 � 3.17BLAB 8.21 � 0.35 0.75 � 0.06 9.23 � 2.14 1.84 � 0.75 0.024 � 0.005 90.43 � 2.45Yeasts 5.87 � 0.12 0.55 � 0.10 8.23 � 1.14 3.21 � 0.25 0.104 � 0.011 45.23 � 2.81CLAB 8.34 � 0.96 0.63 � 0.04 8.62 � 1.24 1.76 � 0.35 0.019 � 0.001 95.21 � 1.18Yeasts 5.88 � 0.42 0.60 � 0.15 7.95 � 2.04 3.09 � 0.87 0.105 � 0.004 48.36 � 4.15
A: without brine acidification (control); B: brine acidified with CO2; C: brine acidified with 0.1% (v/v) lactic acid and 0.014% (v/v) HCl.a Data are values � standard error.
J.V. Vergara et al. / LWT - Food Science and Technology 53 (2013) 113e119116
affected by the buffering capacity of the brine and after 12e24 hthere was no difference among the processes as far as pH is con-cerned. It seems that the effect of acid addition on pH reductionwascounterbalanced by the buffering capacity of the brine, resulting insimilar fermentation processes as far as the evolution of themicrobiota is concerned. No differences could be observed amongthe processes and the final pH value was maintained between 4.2and 4.3. With respect to acidity changes, a steady increase wasobserved throughout fermentation, however some differenceswere noticeable among the treatments. In the case of brine acidi-fication with lactic acid and HCl acidity increased progressivelyuntil day 66 reaching a maximum value of 0.63 g of lactic acid/100 ml of brine. After this time acidity decreased to a final value of0.53 g of lactic acid/100 ml brine compared with control treatmentwhere it reached lower levels (0.47 g of lactic acid/100 ml brine). Asimilar patternwas observed for the CO2 treatment but the increasein acidity was slower and the final value was also lower (0.46 g oflactic acid/100 ml brine) and comparable to the acidity of thecontrol process (0.47 g of lactic acid/100 ml brine). The effect ofdifferent acidification treatments of the brine on olive texture wasmeasured at the end of fermentation bymeans of the force requiredto penetrate the cuticle of olives. The average values of the analysison 10 olives for each fermentation were 19.32 N (�1.02), 24.45 N(�1.14), and 18.41 N (�1.09) for the control, CO2, and lactic/HClacids. Analysis of variance showed that the mean value for textureof the CO2 treatment was significantly different compared to theother two treatments. Our results are not in agreement with aprevious work (Marsilio, Lanza, et al., 2008) reporting that alkalineutralization with CO2 caused higher softening in olive fruits dueto gas diffusion through the olive pulp compared with the use ofHCl. However, to tackle this issue properly, further research inneeded in the case of Conservolea olives to verify the effect of CO2and HCl on olive softening during alkali neutralization.
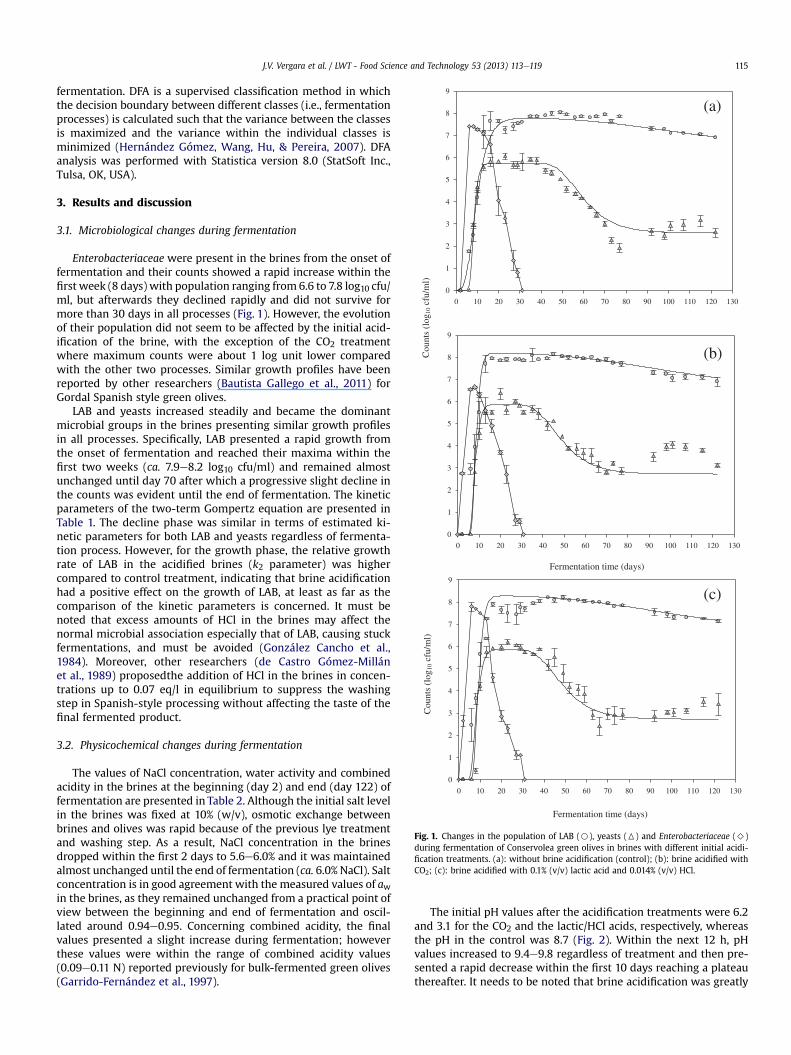
Lactic and acetic acids were the main organic acids withconsiderable presence in the brines (Fig. 3). The increase in lacticacid was more pronounced in the brine acidified with lactic andhydrochloric acids reaching a value of 79 mM at the end of
Table 2Changes in salt concentration, combined acidity and water activity in the brine between
Process NaCl (%, w/v) Combined acid
Initial Final Initial
A 6.01 � 0.50a 6.12 � 0.01 0.055 � 0.007B 5.90 � 0.25 5.97 � 0.01 0.053 � 0.011C 5.59 � 0.43 6.02 � 0.04 0.043 � 0.004
A: without brine acidification (control); B: brine acidified with CO2; C: brine acidified wa mean value � standard deviation of duplicate fermentations.
fermentation compared with the CO2 treatment and the controlwith 65 and 64 mM, respectively. A reduction in the concentrationof lactic acid was observed in the acidified brines on day 73 (Fig. 3b,c) which is consistent with the results in titratable acidity (Fig. 2).Acetic acid was also detected in the brines with amounts reaching27e31 mM at the end of fermentation with no marked differencesamong the processes. Citric andmalic acids were also present in thebrines but their concentration never exceeded 2mM,whereas noneof these acids was detected at the end of fermentation. Finally,succinic and formic acids were detected in concentrations neverexceeding 7 mM but no differences could be established among theprocesses.
Gas chromatography analysis showed that the major peaksidentified in the brines were ethanol and methanol, followed by 2-butanol, propanol, ethyl acetate, acetaldehyde, and dimethyl sulfideat lower concentrations (Table 3). The concentration of ethanolreached a peak within the first 13 days followed by a decreasethereafter ranging between 300 and 400 mg/l until the end offermentation. However, no clear differences could be establishedamong the control and acidified fermentations apparently due tothe fact that the growth pattern of LAB and yeasts in all processeswas similar from the microbiological perspective. An interestingfinding in this work was the amounts of methanol detected in thebrines during the process. Specifically, after 122 days of fermenta-tion the control process presented the lowest levels (378.6 mg/l)comparedwith acidification treatments where the same compoundwas detected at 450.0 and 588.2 mg/l for the CO2 treatment and thelactic/HCl acids treatment. The concentration of this volatile com-pound increased progressively reaching a maximum at day 73 in allfermentations followed by a decrease. At this time the highestamount of methanol was detected in the lactic/HCl acid treatmentwith 1069.2 mg/l followed by the CO2 and the control treatmentswith 933 and 533.3 mg/l, respectively. The presence of methanol inthe brine is in agreement with Montaño, Castro, Rejano, andSánchez (1992) who reported that this compound was detectedin fermented green olives in concentration ranging from 572 to954 mg/l. Other researchers (Sabatini, Perri, & Marsilio, 2009) have
the beginning (2 days) and the end of fermentation (122 days).
ity (N) Water activity of brine
Final Initial Final
0.085 � 0.003 0.955 � 0.004 0.950 � 0.0050.084 � 0.006 0.951 � 0.005 0.941 � 0.0060.087 � 0.003 0.955 � 0.002 0.950 � 0.003
ith 0.1% (v/v) lactic acid and 0.014% (v/v) HCl.

Fermentation time (days)
0 10 20 30 40 50 60 70 80 90 100 110 120 130
pH
2
3
4
5
6
7
8
9
10
11
Acidity (%
, lactic acid)
0.0
0.1
0.2
0.3
0.4
0.5
0.6
0.7
0.8
Fig. 2. Changes in pH (solid symbols) and titratable acidity (open symbols) duringfermentation of Conservolea green olives in brines with different initial acidificationtreatments. (B): without brine acidification (control); (6): brine acidified with CO2;(>): brine acidified with 0.1% (v/v) lactic acid and 0.014% (v/v) HCl.
0
10
20
30
40
50
60
70
80
90
100
0 10 20 30 40 50 60 70 80 90 100 110 120 130
0
10
20
30
40
50
60
70
80
90
100
0 10 20 30 40 50 60 70 80 90 100 110 120 130
0
10
20
30
40
50
60
70
80
90
100
0 10 20 30 40 50 60 70 80 90 100 110 120 130
Con
cent
ratio
n (m
M)
Fermentation time (days)
(a)
(b)
(c)
Fig. 3. Changes in the concentration (mM) of lactic (6) and acetic acids (B) duringfermentation of Conservolea green olives in brines with different initial acidificationtreatments. (a): without brine acidification (control); (b): brine acidified with CO2; (c):brine acidified with 0.1% (v/v) lactic acid and 0.014% (v/v) HCl.
J.V. Vergara et al. / LWT - Food Science and Technology 53 (2013) 113e119 117
also reported the presence of methanol in the volatile componentsfrom the brine of naturally fermented green olives of Nocellara delBelice variety. Higher alcohols (2-butanol, propanol) were alsodetected in the brines, the concentration of which increased pro-gressively in the course of fermentation. Higher amounts of 2-butanol were detected in the acidified brine with lactic/HCl acids,whereas for propanol higher concentrations were measured inboth acidification treatments, especially near the end of fermen-tation (day 115). The presence of these volatile compounds in fer-menting brines has been demonstrated by other researchers(Navarro, de Lorenzo, & Pérez, 2004; Sabatini & Marsilio, 2008;Sabatini, Mucciarella, & Marsilio, 2008; Sabatini et al., 2009). It isworth noting that high levels of 2-butanol have been associatedwith abnormal fermentation of Spanish-style green olives(Fleming, Etchells, & Bell, 1969) although no such perception wasclear to the taste panel employed in this work. Ethyl acetate wasalso present in the brines, due to acetic acid esterification withethanol (Sabatini et al., 2009), in concentrations less than 0.6 mg/Lof brine with no clear differences among the fermentations. Itspresence has been reported previously in olives by Spanish re-searchers (Montaño et al., 1990). Finally, dimethyl sulfite (DMS)wasdetected in the brines at very low amounts. DMS is a sulfur-containing volatile found in a variety of foods and beverages(Segurel, Razungles, Riou, Trigueiro, & Baumes, 2005) that in-fluences the aroma negatively or positively depending on its con-centration. A similar compound, methyl sulfide, has been identifiedfrom head-space vapour samples of Spanish-style green olives(Fleming et al., 1969).
3.3. Sensory analysis
The results of the sensory evaluation of table olives at the end offermentation (122 days) are presented in Table 4. The values for theperception of abnormal fermentation and other defects were notstatistically significant (P ¼ 0.506 and 0.505, respectively) indi-cating that the panelists did not detect an odour different from anormal fermentation of Conservolea green olives. The same holdsfor the salty, acid and bitter sensations that did not differ amongthe different processes (P ¼ 0.997, 0.326 and 0.276, respectively).The perception of hardness seemed to be higher in the CO2 andlactic/HCl acid treatments compared to the control. However, sta-tistical analysis showed no significant difference among thetreatments (P ¼ 0.378). Finally, the perception of fibrousness and
crunchiness was similar to the olives from different treatments(P ¼ 0.567 and 0.321, respectively). Overall, the results of thesensory analysis indicated that the processed olives in brinesacidified either by CO2 or by a mixture of lactic acid and HCl weresimilar in terms of sensory profile compared to the controlfermentation.
3.4. Exploratory data analysis of fermentation profiles
Discriminant Function Analysis (DFA) was employed as a su-pervised multivariate technique to investigate whether the
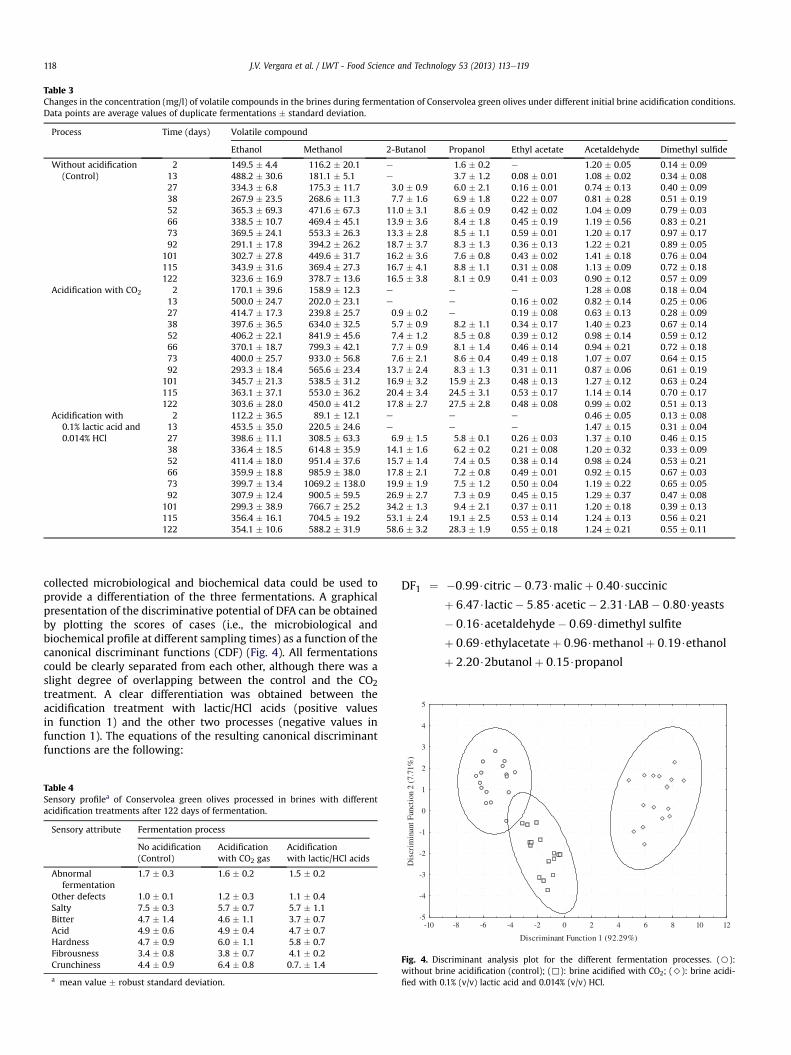
Table 3Changes in the concentration (mg/l) of volatile compounds in the brines during fermentation of Conservolea green olives under different initial brine acidification conditions.Data points are average values of duplicate fermentations � standard deviation.
Process Time (days) Volatile compound
Ethanol Methanol 2-Butanol Propanol Ethyl acetate Acetaldehyde Dimethyl sulfide
Without acidification(Control)
2 149.5 � 4.4 116.2 � 20.1 e 1.6 � 0.2 e 1.20 � 0.05 0.14 � 0.0913 488.2 � 30.6 181.1 � 5.1 e 3.7 � 1.2 0.08 � 0.01 1.08 � 0.02 0.34 � 0.0827 334.3 � 6.8 175.3 � 11.7 3.0 � 0.9 6.0 � 2.1 0.16 � 0.01 0.74 � 0.13 0.40 � 0.0938 267.9 � 23.5 268.6 � 11.3 7.7 � 1.6 6.9 � 1.8 0.22 � 0.07 0.81 � 0.28 0.51 � 0.1952 365.3 � 69.3 471.6 � 67.3 11.0 � 3.1 8.6 � 0.9 0.42 � 0.02 1.04 � 0.09 0.79 � 0.0366 338.5 � 10.7 469.4 � 45.1 13.9 � 3.6 8.4 � 1.8 0.45 � 0.19 1.19 � 0.56 0.83 � 0.2173 369.5 � 24.1 553.3 � 26.3 13.3 � 2.8 8.5 � 1.1 0.59 � 0.01 1.20 � 0.17 0.97 � 0.1792 291.1 � 17.8 394.2 � 26.2 18.7 � 3.7 8.3 � 1.3 0.36 � 0.13 1.22 � 0.21 0.89 � 0.05
101 302.7 � 27.8 449.6 � 31.7 16.2 � 3.6 7.6 � 0.8 0.43 � 0.02 1.41 � 0.18 0.76 � 0.04115 343.9 � 31.6 369.4 � 27.3 16.7 � 4.1 8.8 � 1.1 0.31 � 0.08 1.13 � 0.09 0.72 � 0.18122 323.6 � 16.9 378.7 � 13.6 16.5 � 3.8 8.1 � 0.9 0.41 � 0.03 0.90 � 0.12 0.57 � 0.09
Acidification with CO2 2 170.1 � 39.6 158.9 � 12.3 e e e 1.28 � 0.08 0.18 � 0.0413 500.0 � 24.7 202.0 � 23.1 e e 0.16 � 0.02 0.82 � 0.14 0.25 � 0.0627 414.7 � 17.3 239.8 � 25.7 0.9 � 0.2 e 0.19 � 0.08 0.63 � 0.13 0.28 � 0.0938 397.6 � 36.5 634.0 � 32.5 5.7 � 0.9 8.2 � 1.1 0.34 � 0.17 1.40 � 0.23 0.67 � 0.1452 406.2 � 22.1 841.9 � 45.6 7.4 � 1.2 8.5 � 0.8 0.39 � 0.12 0.98 � 0.14 0.59 � 0.1266 370.1 � 18.7 799.3 � 42.1 7.7 � 0.9 8.1 � 1.4 0.46 � 0.14 0.94 � 0.21 0.72 � 0.1873 400.0 � 25.7 933.0 � 56.8 7.6 � 2.1 8.6 � 0.4 0.49 � 0.18 1.07 � 0.07 0.64 � 0.1592 293.3 � 18.4 565.6 � 23.4 13.7 � 2.4 8.3 � 1.3 0.31 � 0.11 0.87 � 0.06 0.61 � 0.19
101 345.7 � 21.3 538.5 � 31.2 16.9 � 3.2 15.9 � 2.3 0.48 � 0.13 1.27 � 0.12 0.63 � 0.24115 363.1 � 37.1 553.0 � 36.2 20.4 � 3.4 24.5 � 3.1 0.53 � 0.17 1.14 � 0.14 0.70 � 0.17122 303.6 � 28.0 450.0 � 41.2 17.8 � 2.7 27.5 � 2.8 0.48 � 0.08 0.99 � 0.02 0.51 � 0.13
Acidification with0.1% lactic acid and0.014% HCl
2 112.2 � 36.5 89.1 � 12.1 e e e 0.46 � 0.05 0.13 � 0.0813 453.5 � 35.0 220.5 � 24.6 e e e 1.47 � 0.15 0.31 � 0.0427 398.6 � 11.1 308.5 � 63.3 6.9 � 1.5 5.8 � 0.1 0.26 � 0.03 1.37 � 0.10 0.46 � 0.1538 336.4 � 18.5 614.8 � 35.9 14.1 � 1.6 6.2 � 0.2 0.21 � 0.08 1.20 � 0.32 0.33 � 0.0952 411.4 � 18.0 951.4 � 37.6 15.7 � 1.4 7.4 � 0.5 0.38 � 0.14 0.98 � 0.24 0.53 � 0.2166 359.9 � 18.8 985.9 � 38.0 17.8 � 2.1 7.2 � 0.8 0.49 � 0.01 0.92 � 0.15 0.67 � 0.0373 399.7 � 13.4 1069.2 � 138.0 19.9 � 1.9 7.5 � 1.2 0.50 � 0.04 1.19 � 0.22 0.65 � 0.0592 307.9 � 12.4 900.5 � 59.5 26.9 � 2.7 7.3 � 0.9 0.45 � 0.15 1.29 � 0.37 0.47 � 0.08
101 299.3 � 38.9 766.7 � 25.2 34.2 � 1.3 9.4 � 2.1 0.37 � 0.11 1.20 � 0.18 0.39 � 0.13115 356.4 � 16.1 704.5 � 19.2 53.1 � 2.4 19.1 � 2.5 0.53 � 0.14 1.24 � 0.13 0.56 � 0.21122 354.1 � 10.6 588.2 � 31.9 58.6 � 3.2 28.3 � 1.9 0.55 � 0.18 1.24 � 0.21 0.55 � 0.11
3
4
5
)
J.V. Vergara et al. / LWT - Food Science and Technology 53 (2013) 113e119118
collected microbiological and biochemical data could be used toprovide a differentiation of the three fermentations. A graphicalpresentation of the discriminative potential of DFA can be obtainedby plotting the scores of cases (i.e., the microbiological andbiochemical profile at different sampling times) as a function of thecanonical discriminant functions (CDF) (Fig. 4). All fermentationscould be clearly separated from each other, although there was aslight degree of overlapping between the control and the CO2treatment. A clear differentiation was obtained between theacidification treatment with lactic/HCl acids (positive valuesin function 1) and the other two processes (negative values infunction 1). The equations of the resulting canonical discriminantfunctions are the following:
Table 4Sensory profilea of Conservolea green olives processed in brines with differentacidification treatments after 122 days of fermentation.
Sensory attribute Fermentation process
No acidification(Control)
Acidificationwith CO2 gas
Acidificationwith lactic/HCl acids
Abnormalfermentation
1.7 � 0.3 1.6 � 0.2 1.5 � 0.2
Other defects 1.0 � 0.1 1.2 � 0.3 1.1 � 0.4Salty 7.5 � 0.3 5.7 � 0.7 5.7 � 1.1Bitter 4.7 � 1.4 4.6 � 1.1 3.7 � 0.7Acid 4.9 � 0.6 4.9 � 0.4 4.7 � 0.7Hardness 4.7 � 0.9 6.0 � 1.1 5.8 � 0.7Fibrousness 3.4 � 0.8 3.8 � 0.7 4.1 � 0.2Crunchiness 4.4 � 0.9 6.4 � 0.8 0.7. � 1.4
a mean value � robust standard deviation.
DF1 ¼ �0:99$citric� 0:73$malicþ 0:40$succinic
þ 6:47$lactic� 5:85$acetic� 2:31$LAB� 0:80$yeasts
� 0:16$acetaldehyde� 0:69$dimethyl sulfite
þ 0:69$ethylacetateþ 0:96$methanolþ 0:19$ethanol
þ 2:20$2butanolþ 0:15$propanol
-10 -8 -6 -4 -2 0 2 4 6 8 10 12
Discriminant Function 1 (92.29%)
-5
-4
-3
-2
-1
0
1
2
Dis
crim
inan
t Fun
ctio
n 2
(7.7
1%
Fig. 4. Discriminant analysis plot for the different fermentation processes. (B):without brine acidification (control); (,): brine acidified with CO2; (>): brine acidi-fied with 0.1% (v/v) lactic acid and 0.014% (v/v) HCl.

J.V. Vergara et al. / LWT - Food Science and Technology 53 (2013) 113e119 119
DF2 ¼ �0:59$citric� 0:31$malicþ 2:00$succinic
� 0:15$lacticþ 3:33$acetic� 0:91$LABþ 1:04$yeasts
� 0:30$acetaldehydeþ 0:90$dimethyl sulfite
þ 0:94$ethylacetateþ 0:78$methanol� 2:39$ethanol
� 2:09$2butanolþ 0:14$propanol
The coefficients in the above equations are the standardizedcoefficients that may be regarded as the b coefficients in multipleregression. Thus, the highest impact to discrimination in the firstfunction (DF1) was obtained from citric, malic, lactic and aceticacids, LAB, methanol, and 2-butanol, whereas for the secondfunction (DF2) it was obtained for succinic acid, yeasts, dimethylsulfite, ethyl acetate, ethanol, and 2-butanol. Multivariate analysishas found extensive application in other food commodities andprocesses (Berrueta, Alonso-Salces, & Héberger, 2007) but its use intable olive research is still limited. However, there is a growinginterest in the last years to incorporate multivariate statistics intable olive research with promising results (Rodríguez Gómez,Bautista Gallego, Romero Gil, Arroyo López, Garrido Fernández, &García García, 2012; Rodríguez Gómez, Romero Gil, BautistaGallego, Garrido-Fernández, & Arroyo López, 2012).
4. Conclusion
Results of the present study demonstrated that the currentpractice of the Greek table olive industry to acidify the brine withCO2 and a mixture of lactic acid and HCl at the onset of fermenta-tion led to successful fermentation processes. Thus the traditionalfermentation process with three washing waters could besubstituted by two washings with the advantage of wastewaterreduction to the environment. Chemometric techniques wereapplied as a holistic approach to handle the heterogeneous datacollected from olive fermentation and the results provided inter-esting perspectives in the applicability of these techniques in olivefermentation.
Acknowledgements
Mr Villegas would like to thank the Erasmus placement pro-gramme for financial support during his visit in the AgriculturalUniversity of Athens. The authors would also like to thank Dr G.Doutsias, biofarmer and processor of table olives, for supplying theraw material used in this study as well as technical assistance.
References
Bautista Gallego, J., Arroyo-López, A., Romero Gil, V., Rodríguez Gómez, F.,García-García, P., & Garrido-Fernández, A. (2011). Chloride salt mixturesaffect Gordal cv. green Spanish-style table olive fermentation. Food Micro-biology, 28, 1316e1325.
Bello, J., & Sánchez Fuertes, M. A. (1995). Application of a mathematical model todescribe the behaviour of the Lactobacillus spp. during the ripening of a Spanishsausage (chorizo). International Journal of Food Microbiology, 27, 215e227.
Berrueta, L. A., Alonso-Salces, R. M., & Héberger, K. (2007). Supervised patternrecognition in food analysis. Journal of Chromatography A, 1158, 196e214.
de Castro Gómez-Millán, A., Montaño, A., Sánchez Gómez, A. H., Rejano Navarro, L.,& Garrido Fernández, A. (1989). Influencia de la adición de ácido clorhídrico yde la inoculación con levaduras en la fermentación y características organo-lépticas de las aceitunas verdes estilo sevillano. Grasas y Aceites, 40, 376e381.
Fleming, H. P., Etchells, J. L., & Bell, T. A. (1969). Vapor analysis of fermentedSpanish-type green olives by gas chromatography. Journal of Food Science, 34,419e422.
Garrido-Fernández, A., Fernández Díez, M. J., & Adams, M. R. (1997). Table olives:Production and processing. London: Chapman & Hall.
González Cancho, F., Rejano Navarro, L., Durán Quintana, C., Sánchez Roldán, F.,García García, P., de Castro Gómez Millán, A., et al. (1983). Influencia de laadición de HCl en la fermentación de aceitunas estilo sevillano. Grasas y Aceites,34, 375e379.
González Cancho, F., Rejano Navarro, L., Durán Quintana, C., Sánchez Roldán, F.,García García, P., de Castro Gómez Millán, A., et al. (1984). Elaboración deaceitunas verdes, estilo sevillano, sin lavados. Solución a los problemas deadición del HCl y efecto del tratamiento con lejías bajas. Grasas y Aceites, 35,155e159.
Guillén, D. A., Barroso, C. G., Zorro, L., Carrascal, V., & Pérez-Bustamante, J. A. (1998).Organic acids analysis in “Brandy de Jerez” by ion-exclusion chromatography,“post-column” buffering and conductimetric detection. Analusis, 26, 186e189.
Hernández Gómez, A., Wang, J., Hu, G., & Pereira, A. G. (2007). Discrimination ofstorage shelf-life for mandarin by electronic nose technique. LWT-Food Scienceand Technology, 40, 681e689.
Hurtado, A., Reguant, C., Bordons, A., & Rozès, N. (2012). Lactic acid bacteria fromfermented table olives. Food Microbiology, 31, 1e8.
IOC, International Olive Council. (2011). Sensory analysis of table olives. DocumentCOI/OT/MO No 1/Rev. 2, Madrid, Spain.
Marsilio, V., Lanza, B., Russi, F., & Iannucci, F. (2008). Processing-induced changes inmicrostructural and textural characteristics during green olive fermentation.Acta Horticulturae, 791, 677e683.
Marsilio, V., Russi, F., Iannucci, E., & Sabatini, N. (2008). Effects of alkali neutrali-zation with CO2 on fermentation, chemical parameters and sensory character-istics in Spanish-style green olives (Olea europea L.). LWT-Food Science andTechnology, 41, 796e802.
Montaño, A., Castro, A., Rejano, L., & Sánchez, A. H. (1992). Analysis of zapateraolives by gas and high-performance liquid chromatography A. Journal of Chro-matography, 594, 259e267.
Montaño, A., Sánchez, A. H., & Rejano, L. (1990). Rapid quantitative analysis ofheadspace components of green olive brine. Journal of Chromatography, 521,153e157.
Navarro, T., de Lorenzo, C., & Pérez, R. A. (2004). SPME analysis of volatile com-pounds from unfermented olives subjected to thermal treatment. Analytical andBioanalytical Chemistry, 379, 812e817.
Palma, M., & Barroso, C. G. (2002). Ultrasound-assisted extraction and determina-tion of tartaric and malic acids from grapes and winemaking by-products.Analytica Chimica Acta, 458, 119e130.
Panagou, E. Z., & Katsaboxakis, K. (2006). Effect of different brining treatments onthe fermentation of cv. Conservolea green olives processed by the Spanishmethod. Food Microbiology, 23, 199e204.
Rodríguez Gómez, F., Bautista Gallego, J., Romero Gil, V., Arroyo López, F. N., GarridoFernández, A., & García García, P. (2012a). Effects of salt mixtures on Spanishgreen table olive fermentation performance. LWT-Food Science and Technology,46, 56e63.
Rodríguez Gómez, F., Romero Gil, V., Bautista Gallego, J., Garrido-Fernández, A., &Arroyo López, F. N. (2012b). Multivariate analysis to discriminate yeasts strainswith technological applications in table olive processing. World Journal ofMicrobiology and Biotechnology, 28, 1761e1770.
Romeo, F. V., De Luca, S., Piscopo, A., Perri, E., & Poiana, M. (2009). Effects of post-fermentation processing on the stabilization of naturally fermented green tableolives (cv Nocellara etnea). Food Chemistry, 116, 873e878.
Ruiz Barba, J. L., & Jiménez Díaz, R. (2012). A novel Lactobacillus pentosus starterculture for Spanish-style green olive fermentation. Food Microbiology, 30,253e259.
Sabatini, N., & Marsilio, V. (2008). Volatile compounds in table olives (Olea europeaL., Nocellara del Belice cultivar). Food Chemistry, 107, 1522e1528.
Sabatini, N., Mucciarella, M. R., & Marsilio, V. (2008). Volatile compounds in unin-oculated and inoculated table olives with Lactobacillus plantarum (Olea europeaL. cv. Moresca and Kalamata). LWT-Food Science and Technology, 41, 2017e2022.
Sabatini, N., Perri, E., & Marsillio, V. (2009). An investigation on molecular partitionof aroma compounds in fruit matrix and brine medium of fermented greenolives. Innovative Food Science and Emerging Technologies, 10, 621e626.
Sánchez, A. H., García, P., Rejano, L., Brenes, M., & Garrido, A. (1995). The effects ofacidification and temperature during washing of Spanish-style green oliveson the fermentation process. Journal of the Science of Food and Agriculture, 68,197e202.
Segurel, A. M., Razungles, A. J., Riou, C., Trigueiro, M. G. L., & Baumes, R. L. (2005).Ability of possible DMS precursors to release DMS during wine aging and in theconditions of heat-alkaline treatment. Journal of Agricultural and Food Chemistry,53, 2637e2645.
Copyright © 2022 FDOKUMEN