Evaluating Full Polarimetric C- and L-Band Data for Mapping Wetland Conditions in a Semi-Arid...
12
IEEE JOURNAL OF SELECTED TOPICS IN APPLIED EARTH OBSERVATIONS AND REMOTE SENSING, VOL. 5, NO. 3, JUNE 2012 1033 Evaluating Full Polarimetric C- and L-Band Data for Mapping Wetland Conditions in a Semi-Arid Environment in Central Spain Magaly Koch, Thomas Schmid, Melissa Reyes, and Jose Gumuzzio Abstract—Semi-arid wetlands are very dynamic ecosystems as the different characteristics (areal extension, water depth and salinity, seasonal flooding, vegetation and fauna) that define them vary greatly in the short and long term. The objective of this work is to evaluate the contributions of Radarsat-2 (C-band) and ALOS PALSAR (L-band) full polarimetric data in characterizing and mapping wetland conditions in a semi-arid environment in Central Spain. The National Park of Las Tablas de Daimiel was selected as a test site because of on-going work in this wetland area which has produced ample information on the distribution of vegetation communities, soil types and wetland conditions obtained from spaceborne, airborne and ground based optical multispectral and hyperspectral sensors. The goal is to understand and evaluate the complementary information derived from multipolarized synthetic aperture radar (SAR) data not otherwise obtainable from optical sensors. Results suggest that the multipolarized SAR data enables a better separation of the vegetation structure and fragmentation than with the optical data. Optical sensors have the general advantage of improved spectral characterization of vegetation and soil types but are less effective in characterizing vegetation/soil morphology and detecting moisture conditions under dense canopies. Therefore, a combination of the radar and optical data can be very useful in assessing the wetland degradation status, so that appropriate measures can be designed for a sustainable management of the wetland. However, before such an integrated approach can be implemented, a thorough understanding of the type and nature of information derived from multi-frequency and multipolarized SAR data is needed. Index Terms—ALOS/PALSAR, RADARSAT-2, polarimetric radar, wetlands, semi-arid environments, Spain. I. INTRODUCTION W ETLAND areas in semi-arid regions are complex and fragile ecosystems that are especially important in maintaining and controlling the environmental quality and Manuscript received October 04, 2011; revised February 07, 2012; accepted April 11, 2012. Date of publication June 15, 2012; date of current version June 28, 2012. This work was supported in part with funding of the National Project (CGL22005-06458-C02-02/HID) by the Spanish Ministry of Education and Sci- ence. Image data were provided by JAXA EORC, and Canadian Space Agency under the Science and Operational Application Research (SOAR) Program. M. Koch is with the Center for Remote Sensing, Boston University, Boston, MA 02215 USA (corresponding author, e-mail: [email protected]). T. Schmid is with CIEMAT, 28040 Madrid, Spain (e-mail: thomas. [email protected]). M. Reyes is with the Canadian Space Agency, Saint-Hubert (Québec), J3Y 8Y9 Canada (e-mail: [email protected]). J. Gumuzzio is with the Department of Geology and Geochemistry, Autonomous University of Madrid, 28760 Madrid, Spain (e-mail: jose.gu- [email protected]). Color versions of one or more of the figures in this paper are available online at http://ieeexplore.ieee.org. Digital Object Identifier 10.1109/JSTARS.2012.2202091 biodiversity. These types of ecosystems often undergo extreme changes from the wet to the dry season [1]. Small wetland areas are spread throughout the central region of Spain and are mainly threatened by human-induced activities causing rapid processes of degradation with loss of wetland surface and, eventually leading to their disappearance [2]. Activities such as intensive irrigation, overexploitation of groundwater, drying and artificial drainage of wetlands as well as altering and channeling of rivers have severely affected the wetlands and their natural functions. This is the case of the semi-arid wetland “Las Tablas de Daimiel”, National Park included in the UNESCO Man and Biosphere Reserve, Special Protection Areas for Birds (SPA), listed in the Ramsar Convention and integrated in the Natura 2000 Network [3], [4]. This wetland is a refuge for endemic and threatened species of flora and fauna, but the human-induced changes lead to a loss of palustrine veg- etation (Cladium mariscus) and aquatic plants (Chara hispida) as well as affecting the nesting and feeding ground of a wide range of water birds. Nowadays, processes such as desiccation, salinization, euthrophication and contamination are seriously affecting the wetland area [5], [6]. The monitoring of the conditions of wetlands is important in order to manage and preserve these natural ecosystems. In this respect, remote sensing data from several sensors and classifi- cation techniques have been implemented in previous work to study semi-arid wetland areas [7]–[9]. The challenge is to de- tect changes in the composition of the surface land cover (soil, vegetation and water). Such changes can be well detected with satellite-borne microwave data and are particularly well im- plemented to study wetlands, as they are dynamic systems re- quiring frequent observations to capture seasonal and inter-an- nual dynamics related to hydrological processes and human im- pact [10], [11]. Data from a number of full polarimetric satel- lite-borne radar sensors exist nowadays, among them ALOS PALSAR and Radarsat-2, that can be applied to characterize and monitor wetland ecosystems [12]–[15]. Although the ALOS satellite experienced a problem in April 2011 and is currently no longer operational, it left a legacy of very useful environmental data during its five year lifespan. The main objective of this work is to evaluate fully polar- ized data obtained at different microwave frequencies (C- and L-band) and to associate the different back scattering mecha- nisms to wetland characteristics and conditions at the time of the data acquisition within the National Park of Daimiel in Central Spain. This includes producing wetland maps that can be used for 1) detecting wetland characteristics and disturbances asso- ciated to natural causes and human-induced activities, and 2) 1939-1404/$31.00 © 2012 IEEE
Transcript of Evaluating Full Polarimetric C- and L-Band Data for Mapping Wetland Conditions in a Semi-Arid...
IEEE JOURNAL OF SELECTED TOPICS IN APPLIED EARTH OBSERVATIONS AND REMOTE SENSING, VOL. 5, NO. 3, JUNE 2012 1033
Evaluating Full Polarimetric C- and L-Band Datafor Mapping Wetland Conditions in a Semi-Arid
Environment in Central SpainMagaly Koch, Thomas Schmid, Melissa Reyes, and Jose Gumuzzio
Abstract—Semi-arid wetlands are very dynamic ecosystems asthe different characteristics (areal extension, water depth andsalinity, seasonal flooding, vegetation and fauna) that define themvary greatly in the short and long term. The objective of this workis to evaluate the contributions of Radarsat-2 (C-band) and ALOSPALSAR (L-band) full polarimetric data in characterizing andmapping wetland conditions in a semi-arid environment in CentralSpain. The National Park of Las Tablas de Daimiel was selectedas a test site because of on-going work in this wetland area whichhas produced ample information on the distribution of vegetationcommunities, soil types and wetland conditions obtained fromspaceborne, airborne and ground based optical multispectral andhyperspectral sensors. The goal is to understand and evaluatethe complementary information derived from multipolarizedsynthetic aperture radar (SAR) data not otherwise obtainablefrom optical sensors. Results suggest that the multipolarized SARdata enables a better separation of the vegetation structure andfragmentation than with the optical data. Optical sensors havethe general advantage of improved spectral characterization ofvegetation and soil types but are less effective in characterizingvegetation/soil morphology and detecting moisture conditionsunder dense canopies. Therefore, a combination of the radarand optical data can be very useful in assessing the wetlanddegradation status, so that appropriate measures can be designedfor a sustainable management of the wetland. However, beforesuch an integrated approach can be implemented, a thoroughunderstanding of the type and nature of information derived frommulti-frequency and multipolarized SAR data is needed.
Index Terms—ALOS/PALSAR, RADARSAT-2, polarimetricradar, wetlands, semi-arid environments, Spain.
I. INTRODUCTION
W ETLAND areas in semi-arid regions are complex andfragile ecosystems that are especially important in
maintaining and controlling the environmental quality and
Manuscript received October 04, 2011; revised February 07, 2012; acceptedApril 11, 2012. Date of publication June 15, 2012; date of current version June28, 2012. This work was supported in part with funding of the National Project(CGL22005-06458-C02-02/HID) by the SpanishMinistry of Education and Sci-ence. Image data were provided by JAXA EORC, and Canadian Space Agencyunder the Science and Operational Application Research (SOAR) Program.M. Koch is with the Center for Remote Sensing, Boston University, Boston,
MA 02215 USA (corresponding author, e-mail: [email protected]).T. Schmid is with CIEMAT, 28040 Madrid, Spain (e-mail: thomas.
[email protected]).M. Reyes is with the Canadian Space Agency, Saint-Hubert (Québec), J3Y
8Y9 Canada (e-mail: [email protected]).J. Gumuzzio is with the Department of Geology and Geochemistry,
Autonomous University of Madrid, 28760 Madrid, Spain (e-mail: [email protected]).Color versions of one or more of the figures in this paper are available online
at http://ieeexplore.ieee.org.Digital Object Identifier 10.1109/JSTARS.2012.2202091
biodiversity. These types of ecosystems often undergo extremechanges from the wet to the dry season [1]. Small wetlandareas are spread throughout the central region of Spain andare mainly threatened by human-induced activities causingrapid processes of degradation with loss of wetland surfaceand, eventually leading to their disappearance [2]. Activitiessuch as intensive irrigation, overexploitation of groundwater,drying and artificial drainage of wetlands as well as alteringand channeling of rivers have severely affected the wetlandsand their natural functions. This is the case of the semi-aridwetland “Las Tablas de Daimiel”, National Park included inthe UNESCO Man and Biosphere Reserve, Special ProtectionAreas for Birds (SPA), listed in the Ramsar Convention andintegrated in the Natura 2000 Network [3], [4]. This wetland isa refuge for endemic and threatened species of flora and fauna,but the human-induced changes lead to a loss of palustrine veg-etation (Cladium mariscus) and aquatic plants (Chara hispida)as well as affecting the nesting and feeding ground of a widerange of water birds. Nowadays, processes such as desiccation,salinization, euthrophication and contamination are seriouslyaffecting the wetland area [5], [6].The monitoring of the conditions of wetlands is important in
order to manage and preserve these natural ecosystems. In thisrespect, remote sensing data from several sensors and classifi-cation techniques have been implemented in previous work tostudy semi-arid wetland areas [7]–[9]. The challenge is to de-tect changes in the composition of the surface land cover (soil,vegetation and water). Such changes can be well detected withsatellite-borne microwave data and are particularly well im-plemented to study wetlands, as they are dynamic systems re-quiring frequent observations to capture seasonal and inter-an-nual dynamics related to hydrological processes and human im-pact [10], [11]. Data from a number of full polarimetric satel-lite-borne radar sensors exist nowadays, among them ALOSPALSAR and Radarsat-2, that can be applied to characterizeandmonitor wetland ecosystems [12]–[15]. Although theALOSsatellite experienced a problem in April 2011 and is currently nolonger operational, it left a legacy of very useful environmentaldata during its five year lifespan.The main objective of this work is to evaluate fully polar-
ized data obtained at different microwave frequencies (C- andL-band) and to associate the different back scattering mecha-nisms to wetland characteristics and conditions at the time of thedata acquisition within the National Park of Daimiel in CentralSpain. This includes producing wetland maps that can be usedfor 1) detecting wetland characteristics and disturbances asso-ciated to natural causes and human-induced activities, and 2)
1939-1404/$31.00 © 2012 IEEE
1034 IEEE JOURNAL OF SELECTED TOPICS IN APPLIED EARTH OBSERVATIONS AND REMOTE SENSING, VOL. 5, NO. 3, JUNE 2012
Fig. 1. Study area of the Las Tablas de Daimiel wetland where the greenboundary around the wetland limits the National Park. (ALOS AVNIR2 5November 2007 false color composite using bands at wavelengths of 0.825,0.650 and 0.560 m in the red, green and blue channels).
identifying and mapping surface conditions such as land coverfragmentation, vegetation density and variations in soil moisturelevels. Inland wetlands in Mediterranean environments such asthe study site are usually small and highly fragmented, thus,more vulnerable and likely to disappear more rapidly.
II. DESCRIPTION OF THE STUDY AREA
The study area is located in a wetland zone in Central Spainin the Autonomous Community of Castilla La Mancha that isof great value with respect to biodiversity and wildlife habitats.The National Park of Las Tablas de Daimiel was declared a Na-tional Park in 1973 and included in the UNESCOMan and Bio-sphere Reserve and Ramsar Convention in 1981 and 1982.Las Tablas de Daimiel (Fig. 1) consists of a main lake sur-
rounded by several shallow pools and associated marshland atthe confluence of two rivers in the great plain of La Mancha inCentral Spain. It lies in a depressed basin filled with Tertiarysediments, mainly of limestone and calcareous clays. The wet-land is fed from two water sources: (1) floodwaters from thepermanent freshwater Guadiana River and the seasonal brackishCigüela River, and (2) upwelling groundwater from the under-lying karstic aquifer [16].The color composite image in Fig. 1 shows that the greatest
vegetation vigor (in red) coincides with areas close to thestream channels where soil moisture is high and close to thesurface. It further shows the fragmentation of the wetland withseveral patches of non-vegetated areas (dark colors). A diversemosaic of vegetation communities includes aquatic plants(Chara hispida), palustrine vegetation (Cladium mariscus,Phragmites australis, Typha domingensis), halophytic plantsin areas of temporal flooding (Salsola vermiculata, Scripus
Fig. 2. Photographs showing different vegetation communities: (a) a shallowwater lamina with aquatic plants (Chara hispida) is flanked by (b) commonreeds (Phragmites australis). Sea lavender (Limonium carpetanicum) (c) andsea club-rush (Scirpus maritimus) (d) are examples of halophytic plants foundin areas of temporal flooding.
maritimus, Lythrum salicaria, Althea officinalis), halophyticplants in areas rarely flooded (Limonium carpetanicum) andwooded areas (Tamarix gallica, Tamarix canariensis) withinthe wetland area (Fig. 2). Detailed vegetation mapping has beencarried out since the mid 1950s by several authors [17], [18]and is carried out through extensive field surveys and supportedby aerial photography corresponding to specific years whenacquisition was carried out in 1956, 1997, 2005 and 2007. Theemblematic vegetation of the national park Cladium mariscus,also known as Great Fen-Sedge, has been reduced drasticallyas a result of intensive agricultural practises that physicallyremoved an important surface area. Nowadays, the vegetationoccupies a small fraction (10%) of the area compared to 1956.Different soils can be found surrounding the lake and shallow
pools according to variations in water levels, salinity and to-pography. Organic sediments (peats) are found in the flood-plains where river overflow provides sediment deposits withhigh clay, silt and calcium contents. Marshes are preferentiallydeveloped in floodplains where organic matter supports abun-dant and rich vegetation species. With changing water levelscaused by the overexploitation of the aquifer and recurrent pe-riods of droughts, these flooded deposits are being exposed tothe surface and subjected to erosion and salinization processes.Soils surrounding the wetlands, known as upland soils, differgreatly to the soils found in the wetlands due to the change inmorphological and hydrological conditions.To date, polarimetric SAR imagery, as obtained from non-
space based platforms, has been found to be useful in a varietyof applications with respect to both land and aquatic environ-ments. A few pioneering experiments that have shown the useof polarimetric data in characterizing and differentiating landcover types (and plant phenology) are briefly mentioned here.In a study done by [19], in which radar data were used
to identify different land cover types such as trees and grassfields, full polarimetric results provided a smaller probability oferror and thus better classification performance than for singlefeature measurements. The differentiation between different
KOCH et al.: EVALUATING FULL POLARIMETRIC C- AND L-BAND DATA FOR MAPPING WETLAND CONDITIONS 1035
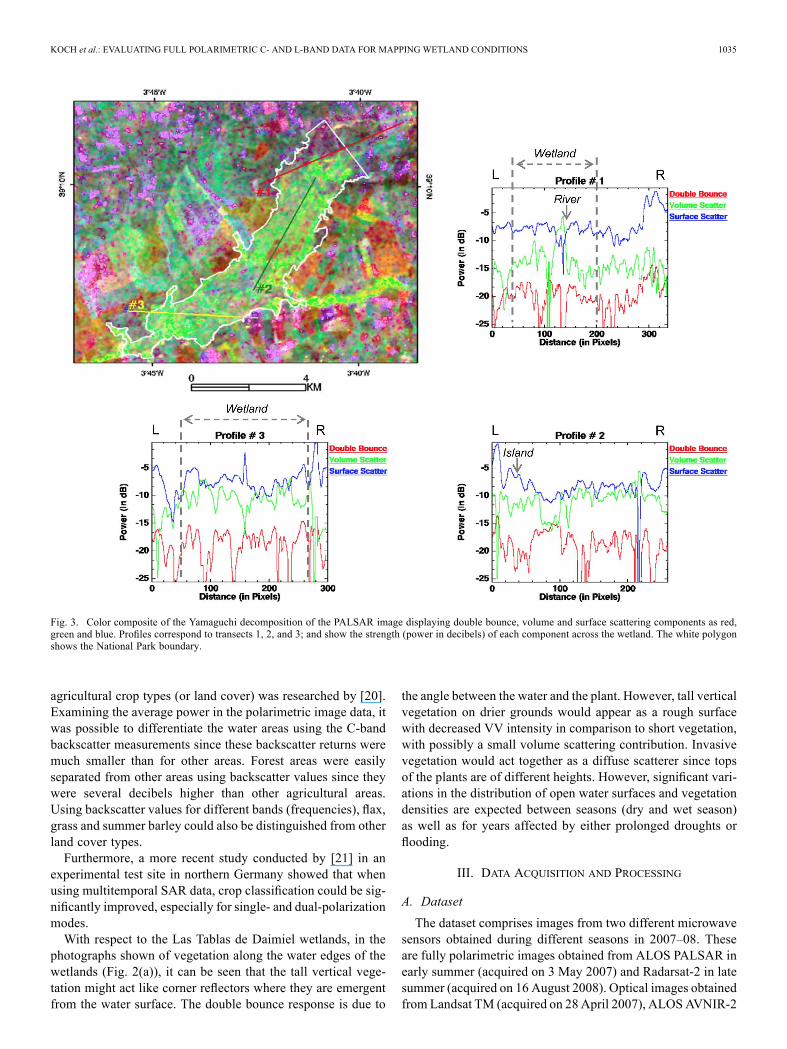
Fig. 3. Color composite of the Yamaguchi decomposition of the PALSAR image displaying double bounce, volume and surface scattering components as red,green and blue. Profiles correspond to transects 1, 2, and 3; and show the strength (power in decibels) of each component across the wetland. The white polygonshows the National Park boundary.
agricultural crop types (or land cover) was researched by [20].Examining the average power in the polarimetric image data, itwas possible to differentiate the water areas using the C-bandbackscatter measurements since these backscatter returns weremuch smaller than for other areas. Forest areas were easilyseparated from other areas using backscatter values since theywere several decibels higher than other agricultural areas.Using backscatter values for different bands (frequencies), flax,grass and summer barley could also be distinguished from otherland cover types.Furthermore, a more recent study conducted by [21] in an
experimental test site in northern Germany showed that whenusing multitemporal SAR data, crop classification could be sig-nificantly improved, especially for single- and dual-polarizationmodes.With respect to the Las Tablas de Daimiel wetlands, in the
photographs shown of vegetation along the water edges of thewetlands (Fig. 2(a)), it can be seen that the tall vertical vege-tation might act like corner reflectors where they are emergentfrom the water surface. The double bounce response is due to
the angle between the water and the plant. However, tall verticalvegetation on drier grounds would appear as a rough surfacewith decreased VV intensity in comparison to short vegetation,with possibly a small volume scattering contribution. Invasivevegetation would act together as a diffuse scatterer since topsof the plants are of different heights. However, significant vari-ations in the distribution of open water surfaces and vegetationdensities are expected between seasons (dry and wet season)as well as for years affected by either prolonged droughts orflooding.
III. DATA ACQUISITION AND PROCESSING
A. Dataset
The dataset comprises images from two different microwavesensors obtained during different seasons in 2007–08. Theseare fully polarimetric images obtained from ALOS PALSAR inearly summer (acquired on 3 May 2007) and Radarsat-2 in latesummer (acquired on 16 August 2008). Optical images obtainedfrom Landsat TM (acquired on 28 April 2007), ALOSAVNIR-2
1036 IEEE JOURNAL OF SELECTED TOPICS IN APPLIED EARTH OBSERVATIONS AND REMOTE SENSING, VOL. 5, NO. 3, JUNE 2012
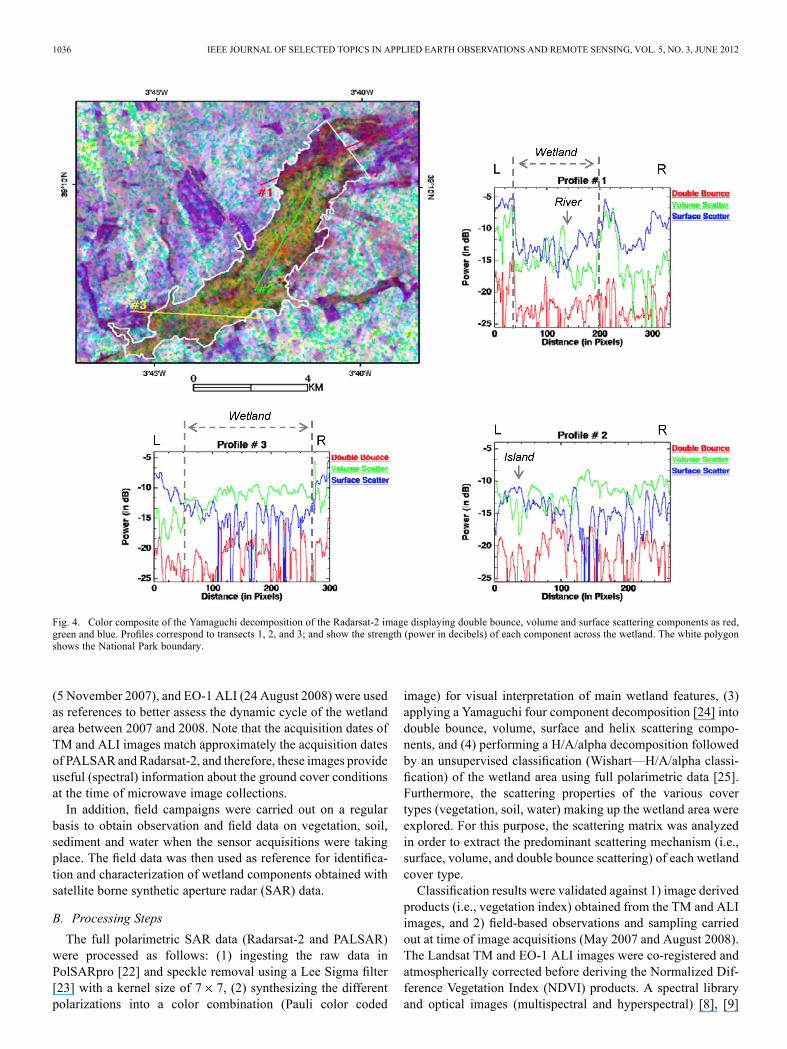
Fig. 4. Color composite of the Yamaguchi decomposition of the Radarsat-2 image displaying double bounce, volume and surface scattering components as red,green and blue. Profiles correspond to transects 1, 2, and 3; and show the strength (power in decibels) of each component across the wetland. The white polygonshows the National Park boundary.
(5 November 2007), and EO-1 ALI (24 August 2008) were usedas references to better assess the dynamic cycle of the wetlandarea between 2007 and 2008. Note that the acquisition dates ofTM and ALI images match approximately the acquisition datesof PALSAR and Radarsat-2, and therefore, these images provideuseful (spectral) information about the ground cover conditionsat the time of microwave image collections.In addition, field campaigns were carried out on a regular
basis to obtain observation and field data on vegetation, soil,sediment and water when the sensor acquisitions were takingplace. The field data was then used as reference for identifica-tion and characterization of wetland components obtained withsatellite borne synthetic aperture radar (SAR) data.
B. Processing Steps
The full polarimetric SAR data (Radarsat-2 and PALSAR)were processed as follows: (1) ingesting the raw data inPolSARpro [22] and speckle removal using a Lee Sigma filter[23] with a kernel size of 7 7, (2) synthesizing the differentpolarizations into a color combination (Pauli color coded
image) for visual interpretation of main wetland features, (3)applying a Yamaguchi four component decomposition [24] intodouble bounce, volume, surface and helix scattering compo-nents, and (4) performing a H/A/alpha decomposition followedby an unsupervised classification (Wishart—H/A/alpha classi-fication) of the wetland area using full polarimetric data [25].Furthermore, the scattering properties of the various covertypes (vegetation, soil, water) making up the wetland area wereexplored. For this purpose, the scattering matrix was analyzedin order to extract the predominant scattering mechanism (i.e.,surface, volume, and double bounce scattering) of each wetlandcover type.Classification results were validated against 1) image derived
products (i.e., vegetation index) obtained from the TM and ALIimages, and 2) field-based observations and sampling carriedout at time of image acquisitions (May 2007 and August 2008).The Landsat TM and EO-1 ALI images were co-registered andatmospherically corrected before deriving the Normalized Dif-ference Vegetation Index (NDVI) products. A spectral libraryand optical images (multispectral and hyperspectral) [8], [9]
KOCH et al.: EVALUATING FULL POLARIMETRIC C- AND L-BAND DATA FOR MAPPING WETLAND CONDITIONS 1037
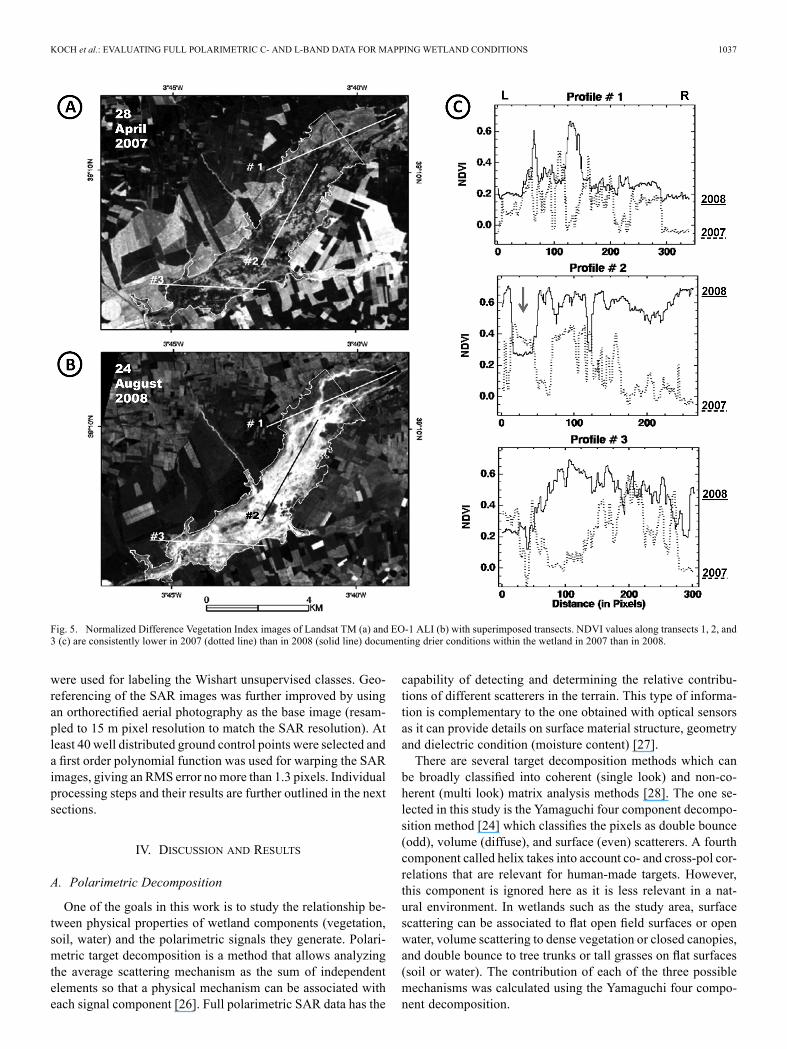
Fig. 5. Normalized Difference Vegetation Index images of Landsat TM (a) and EO-1 ALI (b) with superimposed transects. NDVI values along transects 1, 2, and3 (c) are consistently lower in 2007 (dotted line) than in 2008 (solid line) documenting drier conditions within the wetland in 2007 than in 2008.
were used for labeling the Wishart unsupervised classes. Geo-referencing of the SAR images was further improved by usingan orthorectified aerial photography as the base image (resam-pled to 15 m pixel resolution to match the SAR resolution). Atleast 40 well distributed ground control points were selected anda first order polynomial function was used for warping the SARimages, giving an RMS error nomore than 1.3 pixels. Individualprocessing steps and their results are further outlined in the nextsections.
IV. DISCUSSION AND RESULTS
A. Polarimetric Decomposition
One of the goals in this work is to study the relationship be-tween physical properties of wetland components (vegetation,soil, water) and the polarimetric signals they generate. Polari-metric target decomposition is a method that allows analyzingthe average scattering mechanism as the sum of independentelements so that a physical mechanism can be associated witheach signal component [26]. Full polarimetric SAR data has the
capability of detecting and determining the relative contribu-tions of different scatterers in the terrain. This type of informa-tion is complementary to the one obtained with optical sensorsas it can provide details on surface material structure, geometryand dielectric condition (moisture content) [27].There are several target decomposition methods which can
be broadly classified into coherent (single look) and non-co-herent (multi look) matrix analysis methods [28]. The one se-lected in this study is the Yamaguchi four component decompo-sition method [24] which classifies the pixels as double bounce(odd), volume (diffuse), and surface (even) scatterers. A fourthcomponent called helix takes into account co- and cross-pol cor-relations that are relevant for human-made targets. However,this component is ignored here as it is less relevant in a nat-ural environment. In wetlands such as the study area, surfacescattering can be associated to flat open field surfaces or openwater, volume scattering to dense vegetation or closed canopies,and double bounce to tree trunks or tall grasses on flat surfaces(soil or water). The contribution of each of the three possiblemechanisms was calculated using the Yamaguchi four compo-nent decomposition.
1038 IEEE JOURNAL OF SELECTED TOPICS IN APPLIED EARTH OBSERVATIONS AND REMOTE SENSING, VOL. 5, NO. 3, JUNE 2012
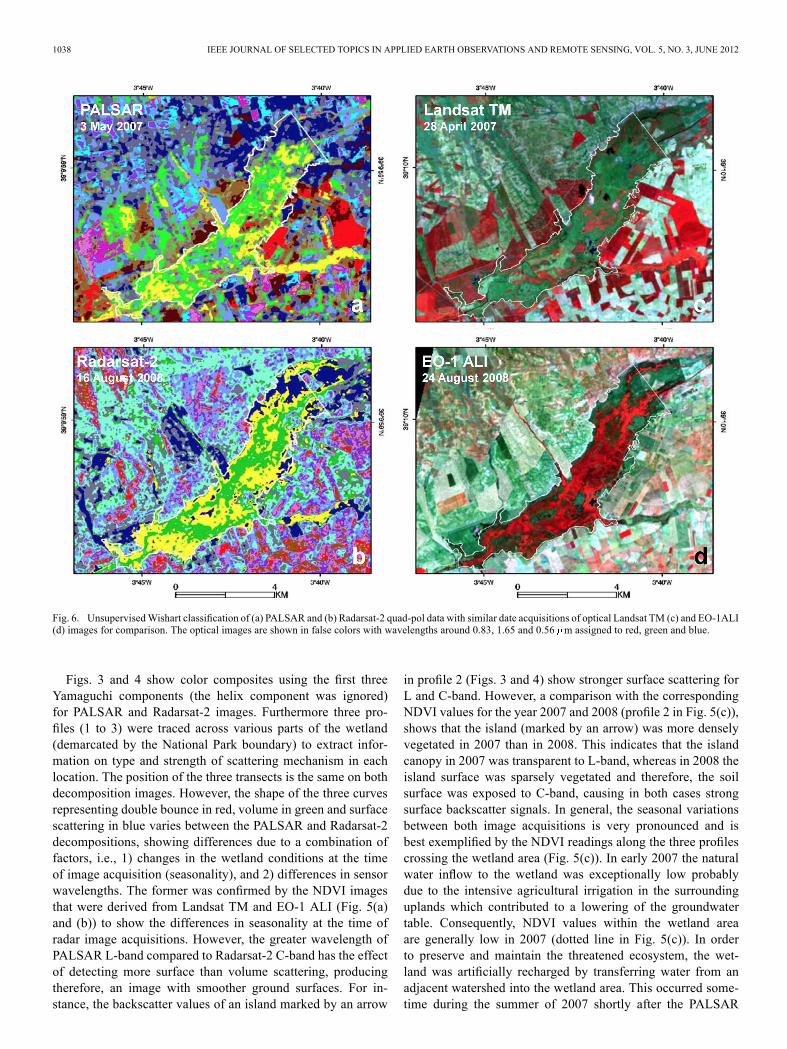
Fig. 6. UnsupervisedWishart classification of (a) PALSAR and (b) Radarsat-2 quad-pol data with similar date acquisitions of optical Landsat TM (c) and EO-1ALI(d) images for comparison. The optical images are shown in false colors with wavelengths around 0.83, 1.65 and 0.56 m assigned to red, green and blue.
Figs. 3 and 4 show color composites using the first threeYamaguchi components (the helix component was ignored)for PALSAR and Radarsat-2 images. Furthermore three pro-files (1 to 3) were traced across various parts of the wetland(demarcated by the National Park boundary) to extract infor-mation on type and strength of scattering mechanism in eachlocation. The position of the three transects is the same on bothdecomposition images. However, the shape of the three curvesrepresenting double bounce in red, volume in green and surfacescattering in blue varies between the PALSAR and Radarsat-2decompositions, showing differences due to a combination offactors, i.e., 1) changes in the wetland conditions at the timeof image acquisition (seasonality), and 2) differences in sensorwavelengths. The former was confirmed by the NDVI imagesthat were derived from Landsat TM and EO-1 ALI (Fig. 5(a)and (b)) to show the differences in seasonality at the time ofradar image acquisitions. However, the greater wavelength ofPALSAR L-band compared to Radarsat-2 C-band has the effectof detecting more surface than volume scattering, producingtherefore, an image with smoother ground surfaces. For in-stance, the backscatter values of an island marked by an arrow
in profile 2 (Figs. 3 and 4) show stronger surface scattering forL and C-band. However, a comparison with the correspondingNDVI values for the year 2007 and 2008 (profile 2 in Fig. 5(c)),shows that the island (marked by an arrow) was more denselyvegetated in 2007 than in 2008. This indicates that the islandcanopy in 2007 was transparent to L-band, whereas in 2008 theisland surface was sparsely vegetated and therefore, the soilsurface was exposed to C-band, causing in both cases strongsurface backscatter signals. In general, the seasonal variationsbetween both image acquisitions is very pronounced and isbest exemplified by the NDVI readings along the three profilescrossing the wetland area (Fig. 5(c)). In early 2007 the naturalwater inflow to the wetland was exceptionally low probablydue to the intensive agricultural irrigation in the surroundinguplands which contributed to a lowering of the groundwatertable. Consequently, NDVI values within the wetland areaare generally low in 2007 (dotted line in Fig. 5(c)). In orderto preserve and maintain the threatened ecosystem, the wet-land was artificially recharged by transferring water from anadjacent watershed into the wetland area. This occurred some-time during the summer of 2007 shortly after the PALSAR
KOCH et al.: EVALUATING FULL POLARIMETRIC C- AND L-BAND DATA FOR MAPPING WETLAND CONDITIONS 1039
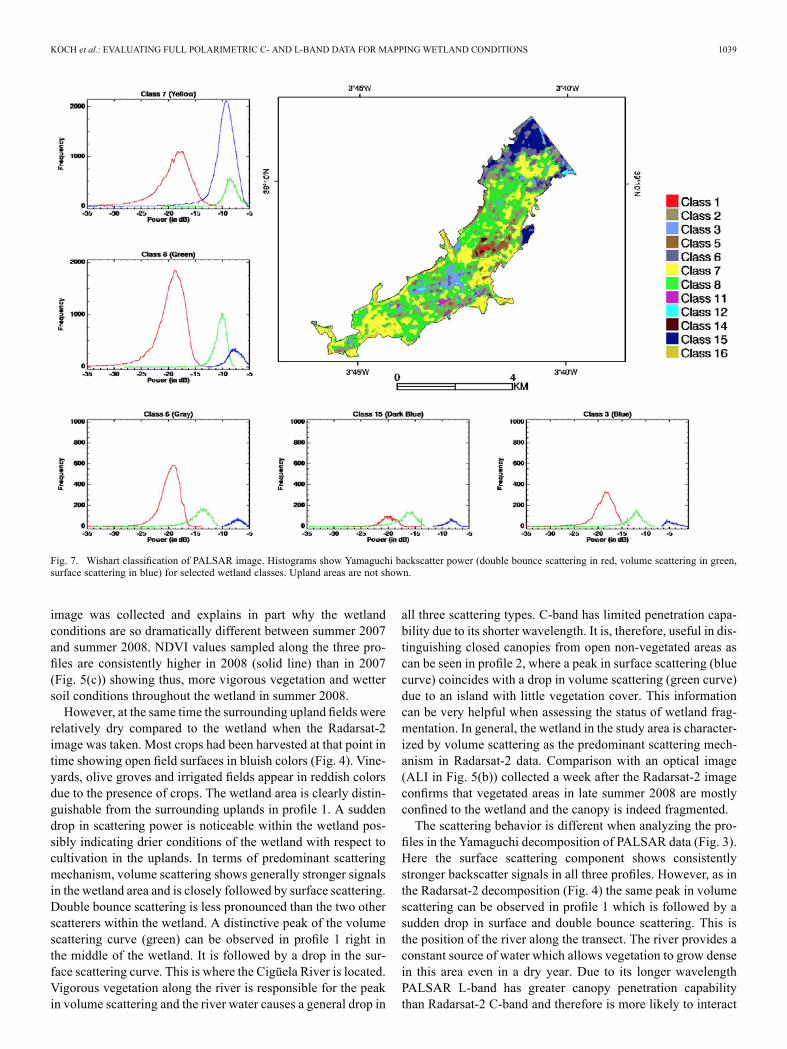
Fig. 7. Wishart classification of PALSAR image. Histograms show Yamaguchi backscatter power (double bounce scattering in red, volume scattering in green,surface scattering in blue) for selected wetland classes. Upland areas are not shown.
image was collected and explains in part why the wetlandconditions are so dramatically different between summer 2007and summer 2008. NDVI values sampled along the three pro-files are consistently higher in 2008 (solid line) than in 2007(Fig. 5(c)) showing thus, more vigorous vegetation and wettersoil conditions throughout the wetland in summer 2008.However, at the same time the surrounding upland fields were
relatively dry compared to the wetland when the Radarsat-2image was taken. Most crops had been harvested at that point intime showing open field surfaces in bluish colors (Fig. 4). Vine-yards, olive groves and irrigated fields appear in reddish colorsdue to the presence of crops. The wetland area is clearly distin-guishable from the surrounding uplands in profile 1. A suddendrop in scattering power is noticeable within the wetland pos-sibly indicating drier conditions of the wetland with respect tocultivation in the uplands. In terms of predominant scatteringmechanism, volume scattering shows generally stronger signalsin the wetland area and is closely followed by surface scattering.Double bounce scattering is less pronounced than the two otherscatterers within the wetland. A distinctive peak of the volumescattering curve (green) can be observed in profile 1 right inthe middle of the wetland. It is followed by a drop in the sur-face scattering curve. This is where the Cigüela River is located.Vigorous vegetation along the river is responsible for the peakin volume scattering and the river water causes a general drop in
all three scattering types. C-band has limited penetration capa-bility due to its shorter wavelength. It is, therefore, useful in dis-tinguishing closed canopies from open non-vegetated areas ascan be seen in profile 2, where a peak in surface scattering (bluecurve) coincides with a drop in volume scattering (green curve)due to an island with little vegetation cover. This informationcan be very helpful when assessing the status of wetland frag-mentation. In general, the wetland in the study area is character-ized by volume scattering as the predominant scattering mech-anism in Radarsat-2 data. Comparison with an optical image(ALI in Fig. 5(b)) collected a week after the Radarsat-2 imageconfirms that vegetated areas in late summer 2008 are mostlyconfined to the wetland and the canopy is indeed fragmented.The scattering behavior is different when analyzing the pro-
files in the Yamaguchi decomposition of PALSAR data (Fig. 3).Here the surface scattering component shows consistentlystronger backscatter signals in all three profiles. However, as inthe Radarsat-2 decomposition (Fig. 4) the same peak in volumescattering can be observed in profile 1 which is followed by asudden drop in surface and double bounce scattering. This isthe position of the river along the transect. The river provides aconstant source of water which allows vegetation to grow densein this area even in a dry year. Due to its longer wavelengthPALSAR L-band has greater canopy penetration capabilitythan Radarsat-2 C-band and therefore is more likely to interact

1040 IEEE JOURNAL OF SELECTED TOPICS IN APPLIED EARTH OBSERVATIONS AND REMOTE SENSING, VOL. 5, NO. 3, JUNE 2012
Fig. 8. Wishart classification of Radarsat-2 image. Histograms show Yamaguchi backscatter power (double bounce scattering in red, volume scattering in green,surface scattering in blue) for selected wetland classes. Upland areas are not shown.
with the ground. In all three profiles the surface scatteringcomponent shows consistently stronger signals and is followedby the volume scattering component. Double bounce scatteringis insignificant within the wetland (except in the middle partof profile 2 which corresponds to a flooded vegetated area).However, in the surrounding uplands this mechanism becomesmore visible as some irrigated fields are covered with a densecrop canopy.
B. Wishart Unsupervised Classification
To further explore the information contained in the SAR im-ages in relation to the wetland components, entropy, anisotropyand alpha decomposition was performed. This decomposition isalso known as the Cloude-Pottier decomposition and consists ofdecomposing a 3 3 symmetrized coherency matrix into threeorthogonal eigenvectors and their eigenvalues. Each vector rep-resents an independent scattering mechanism [29]. The entropyH indicates the degree of statistical disorder (randomness) of thescattering properties and therefore the mixing of the three scat-tering types. The anisotropy A refers to the relative importanceof the secondary scattering mechanisms, and the angle indi-cates the nature of scattering mechanism.The eigenvectors decomposition was performed on the
Radarsat-2 and PALSAR images and the results served asinputs to the unsupervised Wishart classification that followed.
The classification results are shown in Fig. 6 and displayed nextto the corresponding false color optical images. Class labels arefurther described in Tables I and II. The description is limitedto classes that appear within the wetland (Figs. 7 and 8) as thisis the area that was surveyed during image acquisitions.An unsupervised classification has the advantage that no
training areas are required, and as such clusters are formeddepending on physical properties (i.e., similar polarimetricbehavior) extracted from the data. However, it can be quite dif-ficult to interpret the natural pixel groupings (classes) resultingfrom this classification method.A total of 16 classes were produced by the Wishart classi-
fier and their distribution is shown in Fig. 6 for the PALSAR(a) and Radarsat-2 image (b). A first visual comparison revealsthat in both cases the wetland stands out from the surroundingagriculture area, and that significant changes in the wetness andvegetation density distribution occurred between summer 2007and 2008 as illustrated by the optical images in Fig. 6(c) and(d). Furthermore, the wetland area contains some unique classes(yellow and green colors) not widely found in the surroundinguplands. This is particularly the case with the Radarsat-2 classi-fication (Fig. 6(b)) and to a lesser degree with the PALSAR clas-sification (Fig. 6(a)). However, similar class colors in Fig. 6(a)and (b) do not necessarily represent the same land cover typesalthough some of the wetland class colors could be matched (to
KOCH et al.: EVALUATING FULL POLARIMETRIC C- AND L-BAND DATA FOR MAPPING WETLAND CONDITIONS 1041
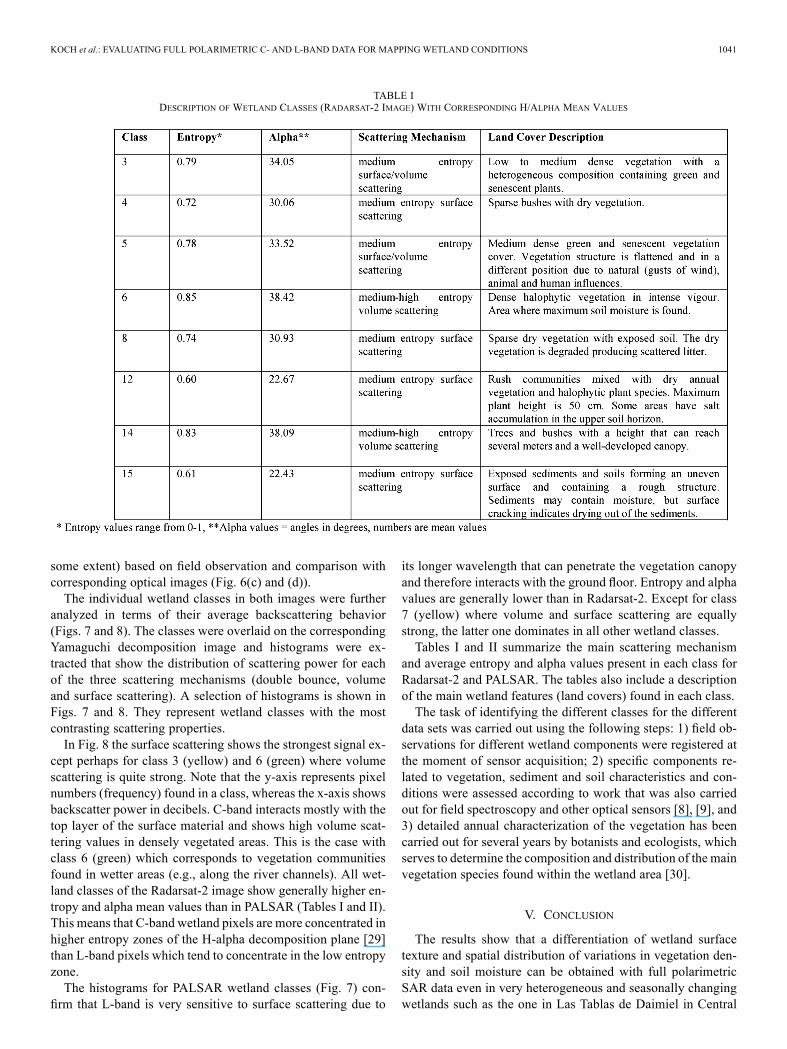
TABLE IDESCRIPTION OF WETLAND CLASSES (RADARSAT-2 IMAGE) WITH CORRESPONDING H/ALPHA MEAN VALUES
some extent) based on field observation and comparison withcorresponding optical images (Fig. 6(c) and (d)).The individual wetland classes in both images were further
analyzed in terms of their average backscattering behavior(Figs. 7 and 8). The classes were overlaid on the correspondingYamaguchi decomposition image and histograms were ex-tracted that show the distribution of scattering power for eachof the three scattering mechanisms (double bounce, volumeand surface scattering). A selection of histograms is shown inFigs. 7 and 8. They represent wetland classes with the mostcontrasting scattering properties.In Fig. 8 the surface scattering shows the strongest signal ex-
cept perhaps for class 3 (yellow) and 6 (green) where volumescattering is quite strong. Note that the y-axis represents pixelnumbers (frequency) found in a class, whereas the x-axis showsbackscatter power in decibels. C-band interacts mostly with thetop layer of the surface material and shows high volume scat-tering values in densely vegetated areas. This is the case withclass 6 (green) which corresponds to vegetation communitiesfound in wetter areas (e.g., along the river channels). All wet-land classes of the Radarsat-2 image show generally higher en-tropy and alpha mean values than in PALSAR (Tables I and II).This means that C-band wetland pixels are more concentrated inhigher entropy zones of the H-alpha decomposition plane [29]than L-band pixels which tend to concentrate in the low entropyzone.The histograms for PALSAR wetland classes (Fig. 7) con-
firm that L-band is very sensitive to surface scattering due to
its longer wavelength that can penetrate the vegetation canopyand therefore interacts with the ground floor. Entropy and alphavalues are generally lower than in Radarsat-2. Except for class7 (yellow) where volume and surface scattering are equallystrong, the latter one dominates in all other wetland classes.Tables I and II summarize the main scattering mechanism
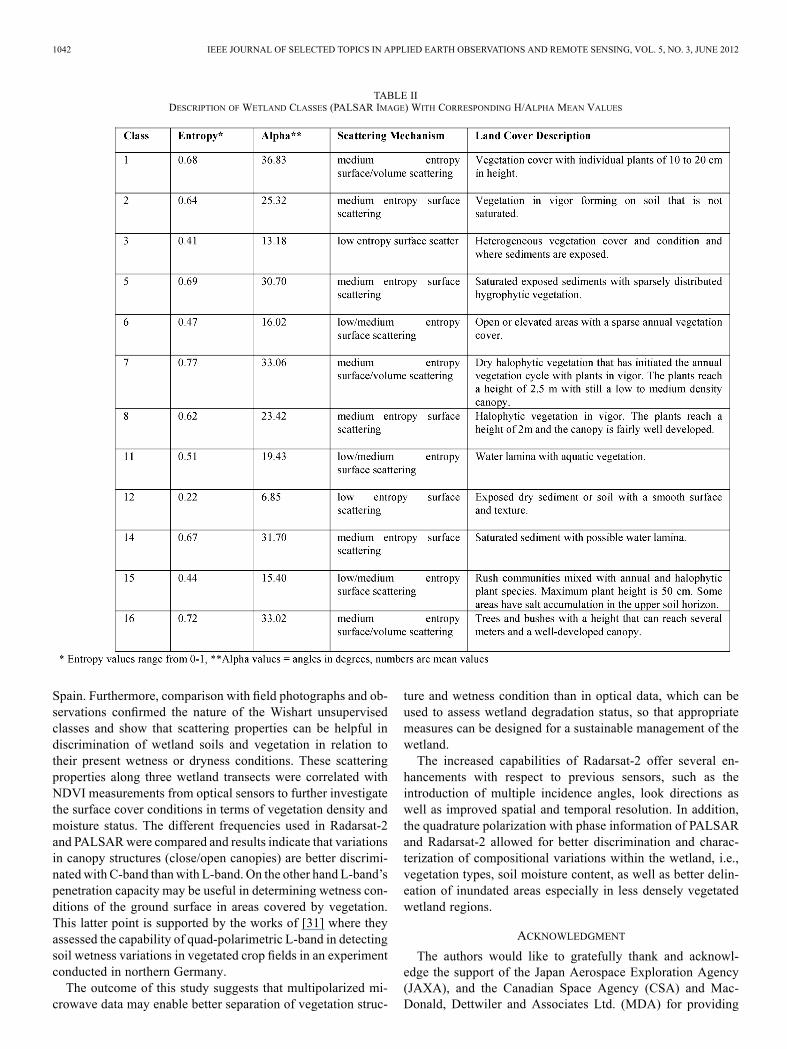
and average entropy and alpha values present in each class forRadarsat-2 and PALSAR. The tables also include a descriptionof the main wetland features (land covers) found in each class.The task of identifying the different classes for the different
data sets was carried out using the following steps: 1) field ob-servations for different wetland components were registered atthe moment of sensor acquisition; 2) specific components re-lated to vegetation, sediment and soil characteristics and con-ditions were assessed according to work that was also carriedout for field spectroscopy and other optical sensors [8], [9], and3) detailed annual characterization of the vegetation has beencarried out for several years by botanists and ecologists, whichserves to determine the composition and distribution of the mainvegetation species found within the wetland area [30].
V. CONCLUSION
The results show that a differentiation of wetland surfacetexture and spatial distribution of variations in vegetation den-sity and soil moisture can be obtained with full polarimetricSAR data even in very heterogeneous and seasonally changingwetlands such as the one in Las Tablas de Daimiel in Central
1042 IEEE JOURNAL OF SELECTED TOPICS IN APPLIED EARTH OBSERVATIONS AND REMOTE SENSING, VOL. 5, NO. 3, JUNE 2012
TABLE IIDESCRIPTION OF WETLAND CLASSES (PALSAR IMAGE) WITH CORRESPONDING H/ALPHA MEAN VALUES
Spain. Furthermore, comparison with field photographs and ob-servations confirmed the nature of the Wishart unsupervisedclasses and show that scattering properties can be helpful indiscrimination of wetland soils and vegetation in relation totheir present wetness or dryness conditions. These scatteringproperties along three wetland transects were correlated withNDVI measurements from optical sensors to further investigatethe surface cover conditions in terms of vegetation density andmoisture status. The different frequencies used in Radarsat-2and PALSARwere compared and results indicate that variationsin canopy structures (close/open canopies) are better discrimi-natedwith C-band thanwith L-band. On the other hand L-band’spenetration capacity may be useful in determining wetness con-ditions of the ground surface in areas covered by vegetation.This latter point is supported by the works of [31] where theyassessed the capability of quad-polarimetric L-band in detectingsoil wetness variations in vegetated crop fields in an experimentconducted in northern Germany.The outcome of this study suggests that multipolarized mi-
crowave data may enable better separation of vegetation struc-
ture and wetness condition than in optical data, which can beused to assess wetland degradation status, so that appropriatemeasures can be designed for a sustainable management of thewetland.The increased capabilities of Radarsat-2 offer several en-
hancements with respect to previous sensors, such as theintroduction of multiple incidence angles, look directions aswell as improved spatial and temporal resolution. In addition,the quadrature polarization with phase information of PALSARand Radarsat-2 allowed for better discrimination and charac-terization of compositional variations within the wetland, i.e.,vegetation types, soil moisture content, as well as better delin-eation of inundated areas especially in less densely vegetatedwetland regions.
ACKNOWLEDGMENT
The authors would like to gratefully thank and acknowl-edge the support of the Japan Aerospace Exploration Agency(JAXA), and the Canadian Space Agency (CSA) and Mac-Donald, Dettwiler and Associates Ltd. (MDA) for providing
KOCH et al.: EVALUATING FULL POLARIMETRIC C- AND L-BAND DATA FOR MAPPING WETLAND CONDITIONS 1043
the ALOS PALSAR and Radarsat-2 data through the ALOSuser agreement (ALOS-RA-81) and the SOAR project (IDnumber: 2615), respectively. Special thanks go to Dr. SantosCirujano for identifying the wetland vegetation and providingthe information on the distribution. Sincere thanks also go to theDirector of the National Park Mr. Carlos Ruiz de la Hermosafor supporting our work and his team for accompanying usin the field work. The authors also acknowledge the fundingof the National Project (CGL22005-06458-C02-02/HID) bythe Spanish Ministry of Education and Science. Finally, theauthors are very grateful for the very helpful suggestions madeby particularly one of the anonymous reviewers.
REFERENCES
[1] “MillenniumEcosystemAssessment,” inEcosystems andHumanWell-Being: Wetlands and Water, Synthesis. Washington, DC: World Re-sources Inst., 2005, p. 68.
[2] S. C. Bracamonte and L. M. Domingo, Plantas acuáticas de las lagunasy humedales de Castilla-La Mancha. Madrid, Spain, Real JardínBotánico y Junta de Comunidades de Castilla-La Mancha, p. 340,2002.
[3] Natura 2000 Network. [Online]. Available: http://natura2000.eea.eu-ropa.eu/Natura2000/SDFPublic.aspx?site=ES0000013. Natura 2000Site List.
[4] Ramsar Advisory Missions Spain, Report No. 2, 1988 [Online]. Avail-able: http://www.ramsar.org/cda/en/ramsar-pubs-annolist-ramsar-ad-visory-missions-15906/main/ramsar/1-30-168%5E15906_4000_0_,Tablas de Daimiel
[5] S. Sánchez-Carrillo and M. Álvarez-Cobelas, “Nutrient dynamics andeutrophication patterns in a semi-arid wetland: The effects of fluctu-ating hydrology,” Water, Air, and Soil Pollution, vol. 131, pp. 97–118,2001.
[6] M. Álvarez-Cobelas, S. Sánchez Carrillo, S. Cirujano, and D. G. An-geler, “Long-term changes in spatial patterns of emergent vegetation inaMediterranean floodplain: Natural versus anthropogenic constraints,”Plant Ecology, vol. 194, no. 2, pp. 257–271, 2007.
[7] T. Schmid, M. Koch, J. Gumuzzio, and P. M. Mather, “A spectral li-brary for a semi-arid wetland and its application to studies of wetlanddegradation using hyperspectral and multispectral data,” Int. J. RemoteSens., vol. 25, no. 13, pp. 2485–2496, 2004.
[8] T. Schmid, M. Koch, and J. Gumuzzio, “Multisensor approach to de-termine changes of wetland characteristics in semiarid environments(Central Spain),” IEEE Trans. Geosci. Remote Sens., vol. 43, no. 11,pp. 2516–2525, 2005.
[9] T. Schmid, J. A. Domı́nguez, J. Solana, J. Gumuzzio, and M. Koch,“Applying multi-angle hyperspectral data to detect human-inducedchanges causing wetland degradation in semi-arid areas (NationalPark Las Tablas de Daimiel, Spain),” in Int. Geoscience and RemoteSensing Symp. (IGARSS), Boston, MA, July 6–11, 2008.
[10] F. M. Henderson and A. J. Lewis, “Radar detection of wetland ecosys-tems: A review,” Int. J. Remote Sens., vol. 29, no. 20, pp. 5809–5835,2008.
[11] T. S. F. Silva, M. P. F. Costa, and J. M. Melack, “Spatial and temporalvariability ofmacrophyte cover and productivity in the eastern Amazonfloodplain: A remote sensing approach,” Remote Sens. Environ., vol.114, no. 9, 1998–2010, 2010.
[12] R. Touzi, A. Deschamps, and G. Rother, “Wetland characterizationusing polarimetric Radarsat-2 capability,” Can. J. Remote Sens., vol.33, no. 1, pp. S56–S67, 2007.
[13] Y. Yamaguchi, W. M. Boerner, R. J. Y. Sato, and H. Yamada, “ALOS-PALSAR quad. pol. images and their applications,” in 2nd Asian-Pa-cific Conf. Synthetic Aperture Radar, Xian, China, Oct. 26–30, 2009,pp. 26–30.
[14] B. Brisco, M. Kapfer, T. Hirose, B. Tedford, and J. Liu, “Evaluation ofC-band polarization diversity and polarimetry for wetland mapping,”Can. J. Remote Sens., vol. 37, no. 1, pp. 82–92, 2011.
[15] J. R. Buckley, “Enhanced classification of prairie landscapes using sim-ulated RADARSAT-2 imagery,” Can. J. Remote Sens., vol. 30, no. 3,pp. 510–516, 2004.
[16] M. Álvarez-Cobelas, S. Cirujano, and S. Sánchez Carrillo, “Hydrolog-ical and botanical man-made changes in the Spanish wetland of LasTablas de Daimiel,” Biological Conservation, vol. 97, pp. 89–98, 2001.
[17] S. Cirujano, “Flora y vegetación,” in Parque Nacional de Las Tablasde Daimiel, M. Álvarez-Cobelas, Ed. Madrid, Spain: EditorialEsfagnos, 1998.
[18] S. Cirujano, M. Álvarez-Cobelas, O. Soriano, J. M. A. Polvorosa, E.López, and M. J. O. Llorente, Seguimiento y monitoreo ambiental enel P. N. Las Tablas de Daimiel Organismo Autónomo Parques Na-cionales, Madrid, Spain, 2007, pp. 1–329.
[19] J. A. Kong, A. A. Swartz, H. A. Yueh, L. M. Novak, and R. T. Shin,“Identification of terrain cover using the optimal polarimetric classi-fier,” J. Electromagnetic Waves and Applications, vol. 2, no. 2, pp.171–194, 1988.
[20] A. Freeman, J. Villasenor, J. D. Klein, P. Hoogeboom, and J. Groot,“On the use of multi-frequency and polarimetric radar backscatter fea-tures for classification of agricultural crops,” Int. J. Remote Sens., vol.15, no. 9, pp. 1799–1812, 1994.
[21] H. Skriver, F. Mattia, G. Satalino, A. Balenzano, V. R. N. Pauwels,N. E. C. Verhoest, and M. Davidson, “Crop classification usingshort-revisit multitemporal SAR data,” IEEE JSTARS, vol. 4, no. 2,pp. 423–431, 2011.
[22] PolSARpro (Polarimetric SARData Processing and Educational Tool).[Online]. Available: http://earth.eo.esa.int/polsarpro/ version 4.2, 2011,distributed by ESA
[23] J. Lee, J. Wen, T. L. Ainsworth, K. Chen, and A. J. Chen, “Improvedsigma filter for speckle filtering of SAR imagery,” IEEE Trans. Geosci.Remote Sens., vol. 47, no. 1, pp. 202–213, 2009.
[24] Y. Yamaguchi, T. Moriyama, M. Ishido, and H. Yamada, “Four-com-ponent scattering model for polarimetric SAR image decomposition,”IEEE Trans. Geosci. Remote Sens., vol. 43, no. 8, pp. 1699–1706, 2005.
[25] J. S. Lee, M. R. Grunes, T. L. Ainsworth, L. Du, D. L. Schuler, and S.R. Cloude, “Unsupervised classification using polarimetric decompos-tion and the complex Wishart classifier,” IEEE Trans. Geosci. RemoteSens., vol. 37, pp. 2249–2258, 1999.
[26] S. R. Cloude and E. Pottier, “A review of target decomposition theo-rems in radar polarimetry,” IEEE Trans. Geosci. Remote Sens., vol. 34,no. 2, pp. 498–518, 1996.
[27] R. Prakash, D. Singh, and N. P. Pathak, “A fusion approach to re-trieving soil moisture with SAR and optical data,” IEEE JSTARS, vol.5, no. 1, pp. 196–206, 2012.
[28] P. Mishra, D. Singh, and Y. Yamaguchi, “Land cover classification ofPALSAR images by knowledge based decision tree classifier and su-pervised classifiers based on SAR observables,” Progress in Electro-magnetic Research B, vol. 30, pp. 47–70, 2011.
[29] S. R. Cloude and E. Pottier, “An entropy based classification schemefor land applications of polarimetric SAR,” IEEE Trans. Geosci. Re-mote Sens., vol. 35, pp. 68–78, 1997.
[30] S. Cirujano, M. Álvarez-Cobelas, O. Soriano, J. M. Alonso, M.Moreno, E. López, and M. J. Ortiz, Informe de seguimientoy monitoreo ambiental en el P. N. Las Tablas de Daimiel(2003–2007). Madrid, Spain, pp. 1–329, 2008, EINTAM, Estu-dios Europeos de Medio Ambiente S.L. y Organismo AutónomoParques Nacionales.
[31] I. Hajnsek, T. Jagdhuber, H. Schön, and K. P. Papthanassiou, “Po-tential of estimating soil moisture under vegetation cover by meansof PolSAR,” IEEE Trans. Geosci. Remote Sens., vol. 47, no. 2, pp.442–454, 2009.
Magaly Koch received the M.Sc. degree in geologyfrom the University of Cologne, Cologne, Germany,and the Ph.D. degree from Boston University,Boston, MA, USA in 1986 and 1993, respectively.Her Ph.D. research was on the use of remote sensingin ground water studies.She is currently Research Associate Professor at
the Center for Remote Sensing, Boston University.Her primary research interest is in the application ofremote sensing and GIS to the evaluation of water re-sources and environmental change in arid and semi-
arid lands. She has conducted research in Egypt, Sudan, UAE, Kuwait, Omanand Spain. In recent years she has become interested in studying the relation-ship between land cover/use changes, hydrology and infectious diseases, andis currently applying her expertise in geospatial technology in these topics inEthiopia and Brazil.
1044 IEEE JOURNAL OF SELECTED TOPICS IN APPLIED EARTH OBSERVATIONS AND REMOTE SENSING, VOL. 5, NO. 3, JUNE 2012
Thomas Schmid received the M.Sc. degree in geog-raphy from the University of Zürich, Zürich, Switzer-land, and the Ph.D. degree in science from the Au-tonomous University of Madrid, Madrid, Spain, in1993 and 2004, respectively.He is currently a Senior Researcher at the Depart-
ment of Environment, Research Centre for Energy,Environment and Technology (CIEMAT), Madrid,since 1994. His main research interests are the studyof soil and wetland degradation processes and theeffect of heavy metal contamination within arid and
semi-arid regions applying remote sensing and GIS technologies. His work isfocused on developing integrated methodologies to characterize and monitorthe exploitation of soil resources, conservation of natural ecosystems and landsurface areas affected by human induced activities.
Melissa Reyes is a full-time officer (Major) in theCanadian Forces. She is currently working as theRADARSAT Constellation Mission (RCM) Man-ager for Department of National Defence/CanadianForces Missions and Requirements as a member ofthe Canadian Forces Detachment at the CanadianSpace Agency, St-Hubert, Quebec, Canada. In thisunique position at the Canadian Space Agency,MajorReyes has made exceptional contributions in inte-grating a space-based capability for ship detectiononto Canada’s newest Earth observation satellites.
Joining the military in August 1989, Major Reyes has worked in manyplaces, the most notable being Thule Air Base (Greenland), HeadquartersNORAD (Colorado Springs, USA), and Kandahar Air Field (Afghanistan).While working at Headquarters NORAD, Major Reyes completed her Masterof Science Degree from the University of Colorado, specializing in RemoteSensing.
Jose Gumuzzio received the M.Sc. degree in chemistry (geochemistry) and thePh.D. degree in chemistry (soil science) from the Autonomous University ofMadrid, Madrid, Spain, in 1974 and 1979, respectively.He is Professor Emeritus of soil sciences at the Autonomous University of
Madrid since 1974, and a Senior Researcher specializing in soil science (UN-ESCO code: 2511). His main research interest is in the application of remotesensing and GIS to wetland and soil degradation processes and salinity in semi-arid environments.