Development and implementation of high-throughput SNP genotyping in barley

Egypt. J. Agric. Res., Vol. 90 (4): 117-130, 2012.
117
ESTIMATION OF SOME GENETIC PARAMETERS FOR
YIELD AND ITS COMPONENTS IN SOME BARLEY
GENOTYPES.
by Amer, Kh. A., A. A. Eid, M. M. A. El-sayed and A. A. El-Akhdar
Barley Dept., Field Crops Res. Institute, ARC, Egypt
ABSTRACT
This investigation was carried out at Sakha Agricultural Research Station,
ARC, Egypt during the two growing seasons (2009/2010 and 2010/011). four lines
and three testers were used to develop barley hybrids for yield and its components.
Through this study, general and specific combining ability, genetic parameters,
heritability and genetic advance from selection were studied for plant height, spike
length, no. of spikes/plant, no. of grains/spike, 100-grain weight and grain yield/plant.
Data revealed that most of the variance due to the lines, testers and line x testers
were highly significant for most studied traits. On the other hand, positive and
negative heterosis over better parent and mid-parent were detected for most traits
indicated that parental genotypes were genetically diverse. Potence ratio estimates
showed partial and over dominance in most traits. The parents L4 considered as good
combiners for plant height, no. of grains/spike, 100-grain weight and grain yield/plant.
Also, the parent L3 is considered as good combiner for spike length, no. of
spikes/plant, no. of grains/spike and grain yield/plant. Heritability in broad sense
values were found to be high in magnitude for most of the studied characters on the
other side, heritability in narrow sense were found to be low to moderate in these
traits. From the results, it could be concluded that the two crosses: (L1 x T3) and (L3 x
T3) are the best for yield and most of its components. So using these crosses in
breeding programs for high yielding production would be useful.
INTRODUCTION
Barley (Hordeum Vulgare L.) has a great adaptation potential in many
regions of the world. It has a good tolerance to biotic stresses such as salinity,
drought, frost and heat. It is considered one of the most important crops ranking the
fourth in the world cereal crops production. Its economic importance is due to its
usage it for animal feeding, brewing malts and human food in some areas. In Egypt,
barley is mainly used as animal feed (grain and straw) and sometimes for bread
making by bedouins.

Egypt. J. Agric. Res., Vol. 90 (4): 117-130, 2012.
118
In Egypt barley is a minor winter cereal crops grown mainly in rainfed areas
where limited water supply is a feature such as in the Northwest Coastal region and
North of Sinai, also it is grown over wide range of soil variability and under many
diverse climatic conditions compared with many other grain crops. So, it can be grown
in irrigated saline lands and poor soil conditions. It has also been grown in the newly
reclaimed lands as well as the old land.
Therefore, the main objective of this study included the induction of new promising barley genotypes having high yield potentially, this was approached through the following:-
1- Identification of superior parents and their crosses from a 4 line × 3 tester of barley parental genotypes. 2- Estimation of heterosis and combining ability effects for grain yield and some related agronomic traits. 3- Estimation the heritability and genetic advance from selection for yield and some related agronomic traits.
MATERIALS AND METHODS
The present investigation was carried out at the experimental farm of Sakha
Agricultural Research Station ,Kafr El-sheikh, Egypt, during the two successive
seasons 2009/2010 and 2010/2011. Four barley lines; L1, L2, L3 and L4 and three
testers T1 (Giza 117), T2 (Giza 123) and T3 (Giza 125) of barley were used, the
names and pedigrees of which are presented in Table (1).
Table (1): Names and pedigrees of parental barley genotypes. No Genotypes Pedigree
Lines
1 L1 Alanda/5/Aths/4/Pro/TolI//Cer*2/TolI/3/5106/6/Baca'S'/3/AC253// CI08887/CI05761
2 L2 Arizona5908/Aths//Avt/Attiki/3/S.T.Barley/4/Aths/Lignee686/5/Aths/ Lignee686/3/DeirAlla106/Lignee527//Asl
3 L3 ACSAD 1182/4/Alanda//Lignee527/Arar/3/Centinela/ 2*Calicuchima
4 L4 STANDER-BAR/CABUYA
Testers
5 T1 (Giza 117)
6 T2 (Giza 123) Giza117/FAO86
7 T3 (Giza 125) Giza117/Bahteem52//Giza118/FAO86.Line366.16.2
In 2009/2010 season, the three testers were crossed with the four lines to
produce F1 hybrids of 12 top cross. In 2010/2011 season, 12 F1 hybrids, three testers
and four lines were sown in randomized complete block design with three replications.
Each parent and F1 was represented by two rows per replicate. Each row was 1.5 m
long, and spaces between rows were 30 cm with 15 cm between plants. All the
recommended agronomic practices for barley production were applied at the proper
time. Ten guarded plants were randomly taken from each entry to collect data on plant

Egypt. J. Agric. Res., Vol. 90 (4): 117-130, 2012.
119
height, spike length, number of spikes/plant, number of grains /spike, 100–grain
weight and grain yield /plant.
Statistical analysis:
Line x tester analysis was performed according to Kempthorne (1957), Singh
and Chaudhary (1977). The heterosis estimates over mid and better parent was
determined according to Mather and Jinks (1971). Potence ratio was calculated
according to Wigan (1944) and Mather and Jinks (1971). Heritability in broad (H2) and
narrow (h2) senses were calculated according to Allard (1960) and Mather (1949).
The phenotypic and genotypic coefficients of variation were estimated using the
formulae developed by Burton (1952). Expected (g) and predicted g (%) genetic
advance calculated as suggested by Borthakur and Poehllman (1970)
RESULTS AND DISCUSSION
Mean performance of genotype (parents and crosses):
The mean performance of the four lines, three testers and their 12 top
crosses for all the studied traits are presented in Table (2).
Table (2): Mean performance of the barley genotypes for all
studied traits.
Genotypes Plant height
Spike length
No. of spikes/plant
No. of grains/spike
100-grain weight
Grain yield/plant
Lines L1 123.33 8.67 14.00 66.00 4.46 39.78 L2 113.33 6.33 13.67 50.00 4.17 33.14 L3 108.33 6.67 13.67 52.00 5.29 39.71 L4 111.67 7.67 14.00 58.00 4.98 44.43
Testers T1 105.00 7.33 13.67 56.00 5.11 38.17 T1 106.67 7.67 14.00 58.00 5.21 37.68 T1 105.00 6.67 12.67 52.00 5.04 30.12
Crosses L1 x T1 (1) 113.33 8.33 13.00 62.00 5.17 35.61 L1 x T2 (2) 126.67 10.67 14.33 80.00 6.14 46.76 L1 x T3 (3) 105.00 8.00 17.33 60.00 5.50 49.45
L2 x T1 (4) 110.00 8.33 16.33 64.00 4.89 46.58 L2 x T2 (5) 118.33 7.67 16.67 60.00 5.06 40.27 L2 x T3 (6) 103.33 7.33 15.33 56.00 4.25 38.04
L3 x T1 (7) 103.33 10.33 18.33 76.00 4.91 50.17 L3 x T2 (8) 120.00 8.33 15.33 62.00 5.17 48.51 L3 x T3 (9) 115.00 10.33 17.00 77.33 5.38 58.82
L4 x T1 (10) 120.00 9.67 15.33 76.00 5.46 56.92 L4 x T2 (11) 126.00 9.33 16.33 74.00 5.55 51.64 L4 x T3 (12) 113.33 8.67 17.00 68.00 5.39 47.84

Egypt. J. Agric. Res., Vol. 90 (4): 117-130, 2012.
120
Data indicated that the parental line-1 gave the highest values for
plant height, spike length and no. of grain/spike; while, line-3 gave the heaviest 100-
grain weight, for line-4 gave the highest values for no. of spikes/plant and grain
yield/plant. For testers; T2 gave the highest values for all studied traits. For crosses;
top crosses (L1 x T2) for plant height, spike length, no. of grain/spike and100-grain
weight, (L1 x T3) for no. of spikes/plant and (L3 x T3) for grain yield/plant gave the
highest values for these traits.
Analysis of variance:
The estimation of the analysis of variance as shown in Table (3),
revealed highly significant differences among genotypes for all studied traits. These
results indicated that genotypic differences between genotypes were presented.
Therefore, the genetic analysis was felt valid to be undertaken to reveal the
inheritance and gene action controlling the economic characters in barley.
Table (3): Observed mean squares from ordinary analysis of variance for the studied traits.
S.O.V df Plant height Spike length
No. of spikes/plant
No. of grains/spike
100-grain weight
Grain yield/plant
Rep. 2 13.596 2.05** 2.05 41.33* 0.01 0.44
Genotypes 18 177.1** 4.91** 8.16** 260.30** 0.65** 183.8**
Parents (P) 6 126.98** 1.94** 0.67 88.00** 0.52** 66.03**
Crosses (C) 11 200.19** 3.77** 6.27** 205.93** 0.63** 144.8**
P vs. C 1 223.73** 35.28** 73.94** 1892.25** 1.60** 1319.29**
Lines (L) 3 146.99** 5.88** 6.25** 301.44** 1.34** 281.03**
Testers (T) 2 643.75** 1.08* 3.69 62.11* 0.52** 9.59 *
L x T 6 78.94** 3.60** 7.14** 206.11** 0.32** 121.76**
Error 36 14.52 0.33 1.24 15.11 0.06 3.82
(*) and (**) significant at 0.05 and 0.01 levels probability, respectively.
Partitioning sum of squares due to genotypes (Table 3) revealed highly
significant differences among parents, crosses and parents vs. crosses for all studied
traits, except no. of spikes/plant for parents. However, the crosses was further
partitioned into lines, testers and line x testers interaction. The mean squares of lines,
testers and line x testers showed significant for all studied traits, except no. of
spikes/plant for testers These results indicated that both lines and testers had great
diversity and they performed differently in there crosses.

Egypt. J. Agric. Res., Vol. 90 (4): 117-130, 2012.
121
Estimation of heterosis and potence ratio:
It is known fact that the phenomena of heterosis (hybrid vigor) is of common
occurrence in both cross pollinated and self pollinated crops. There are three
important genetic factors affecting heterosis, (i) the genetic diversity of the parents,
where the heterotic effect increased with increasing the genetic divergence in
morphological characters, and also with respect to widest geographical origin of
parents, (ii) the genetic base of parents and (iii) the wider adaptability of the parents.
However, there are three possible genetic causes of heterosis, partial, complete
dominance and over-dominance particular with the dominance interactions.
Table (4): Heterosis percent relative to mid-parent (MP), better parent (BP) and potence ratio (PR) for plant height, spike length and no. of spikes/plant.
(*) and (**) significant at 0.05 and 0.01 levels probability, respectively.
From this point of view, heterosis would be of economical value when the F1
hybrid exceeds its better parents, therefore, if the breeder planned a program of
selection in the advanced segregating generation from such superior specific hybrids,
the expected improvement would be fruitful.
Crosses Plant height Spike length No. of spikes/plant
M.P B.P PR M.P B.P PR M.P B.P PR
L1x T1 (1) -0.73 -8.11** -0.09 4.13 -3.92 0.49 -6.04 -7.14 -5.06
L1x T2 (2) 10.15** 2.71 1.40 30.60** 23.07** 5.00 2.36 2.36 0.00
L1x T3 (3) -8.03** -14.9** -1.00 4.30 -7.73 0.33 29.96** 23.79** 6.01
L2x T1 (4) 0.76 -2.94 0.20 21.96** 13.64** 3.00 19.46** 19.46** 0.00
L2x T2 (5) 7.57** 4.41 2.50 9.57 0.00 1.00 20.49** 19.07** 17.18
L2x T3 (6) -5.35* -8.82** -1.40 12.77* 9.90 4.88 16.40** 12.14 4.32
L3x T1 (7) -3.13 -4.59 -2.00 47.57** 40.93** 10.09 34.09** 34.09** 0.00
L3x T2 (8) 11.63** 10.80** 15.06 16.18** 8.60 2.32 10.81 9.50 9.06
L3x T3 (9) 7.81** 6.19* 5.01 54.87** 54.87** 0.00 29.08** 24.36** 7.66
L4x T1 (10) 10.77** 7.46* 3.50 28.93** 26.08** 12.76 10.81 9.50 9.06
L4x T2 (11) 16.03** 13.43** 7.00 21.64** 21.64** 0.00 16.64** 16.64* 0.00
L4x T3 (12) 4.61 1.49 1.50 20.92** 13.04* 3.00 27.48** 21.43** 5.51

Egypt. J. Agric. Res., Vol. 90 (4): 117-130, 2012.
122
With regard to heterosis percentage as a deviation of F1 from either mid parent
or better parent, the results of the 6 traits are presented in Table (4). The differences
between the two estimates of heterosis varied from one cross to another according to
the performance of the parents. On the other hand, the importance of heterosis
relative to better parent for the breeder is that reflects the importance of the non-
additive gene action in the genetic constitution. This type of heterosis is very desirable
for the plant breeder from the practical point of view for production of superior elite
breeding materials. On the other side, heterosis relative to mid parent is also
important where it reflect the type of dominance which cause the heterotic effects.
Positive significant or highly significant heterosis over mid and better parent
values were obtained for; plant height in crosses 8, 9, 10 and 11; spike length and
number of grain/spikes in crosses 2, 4, 7, 9, 10, 11 and 12; number of spikes/plant in
crosses 3, 4, 5, 7, 9, 11 and 12; 100-grain weight in cross 2 and cross 3 and for grain
yield/plant in all crosses except for cross 1 and cross 5. These results are agreement
with those obtained by Budak (2000), El-Seidy and Khattab (2000), Sharma et al
(2002), El-Bawab (2003), El-Sayed (2007), El-shawy (2008), Amer (2010) and Eid
(2010).
Table (4) cont.
(*) and (**) significant at 0.05 and 0.01 levels probability, respectively.
Potence ratio refer to over dominance for; plant height in all crosses where its
values were exceeded unity except for cross 1 and cross 4 were less than unity
Crosses No. of grains/spike 100-grain weight Grain yield/plant
M.P B.P PR M.P B.P PR M.P B.P PR
L1x T1 (1) 1.64 -6.06 0.20 8.05* 1.17 1.18 -8.63* -10.48* -4.18
L1x T2 (2) 29.03** 21.21** 4.50 26.99** 17.85** 3.48 20.73** 17.55** 7.65
L1x T3 (3) 1.69 -9.09 0.14 15.79** 9.13* 2.59 41.49** 24.31** 3.00
L2x T1 (4) 20.75** 14.29* 3.67 5.39 -4.31 0.53 30.64** 22.03** 4.34
L2x T2 (5) 11.11* 3.45 1.50 7.89* -2.88 0.71 13.72** 6.87 2.14
L2x T3 (6) 9.80 7.69 5.00 -7.71* -15.67** -0.82 20.27** 14.79** 4.25
L3x T1 (7) 40.74** 35.71** 11.0 -5.58 -7.18 -3.22 28.84** 26.34** 14.58
L3x T2 (8) 12.73* 6.90 2.33 -1.52 -2.27 -2.00 25.37** 22.16** 9.67
L3x T3 (9) 48.71** 48.71** 0.00 4.16 1.70 1.72 68.47** 48.12** 4.99
L4x T1 (10) 33.33** 31.03** 19.00
8.23* 6.85 6.38 37.82** 28.11** 4.99
L4x T2 (11) 27.59** 27.59** 0.00 8.93* 6.53 3.96 25.78** 16.23** 3.14
L4x T3 (12) 23.64** 17.24** 4.33 7.58* 6.94 12.67 28.34** 7.67* 1.48

Egypt. J. Agric. Res., Vol. 90 (4): 117-130, 2012.
123
indicating partial dominance in these crosses. For spike length and number of
grain/spikes all crosses refer to over dominance except for crosses 1, 3 showed
partial dominance, 9 and 11 showed no dominance; number of spikes/plant all
crosses showed over dominance except for crosses 2, 4, 7, and 11; 100-grain weight
all crosses showed over dominance except for crosses 4, 5, and 6 showed no
dominance and for grain yield/plant all crosses showed over dominance. These
results agreed with those obtained by El-Seidy (1997b), Yadav et al (2002b) and El-
Bawab (2003), El-Sayed (2007) and El-Shawy (2008)
Combining ability analysis:
Analysis of variance for combining ability and estimates of variance due to
GCA and SCA are presented in Table (5).
General combining ability (GCA) expressed main effects and specific combining
ability (SCA) expressed interactions. GCA/SCA ratio was used as a measure to
understand the nature of gene action involved. The ratio of GCA/SCA were lesser
than unity for all studied traits which mean that non-additive gene effects played an
important role in the inheritance of these traits. In such cases, a bulk method would be
fruitful to eliminate the effect of dominance in the advanced generation. These results
agreed with those obtained by Amer (2010), Eid (2010) and Amer et al (2011).
Table (5): Mean squares from the analysis of variance for general (GCA),
specific (SCA) combining ability and GCA/SCA.
Characters 2GCA 2SCA Error term 2GCA/2SCA
Plant height (cm) 5.795 21.47 4.84 0.006
Spike length (cm) 0.185 1.09 0.11 0.009
No. of spikes/plant (spike) 0.245 1.967 0.41 -0.012
No. of grains/spike (grain) 1.1625 63.667 5.04 -0.007
100-grain weight (g) 0.07 0.086 0.02 0.084
Grain yield/plant (g) 2.0845 39.314 1.27 0.002
Estimates of general combining ability effects (GCA):
The data of general combining ability effects for all traits are presented in Table (6).
General combining ability effects varied from one parent to another giving
negative or positive values. The significant values of GCA for any genetic variance
plays a major role in the positive direction of the desired trait in all the crosses in
which the gene type is involved. The negative and significant ones indicated that the
Egypt. J. Agric. Res., Vol. 90 (4): 117-130, 2012.
124
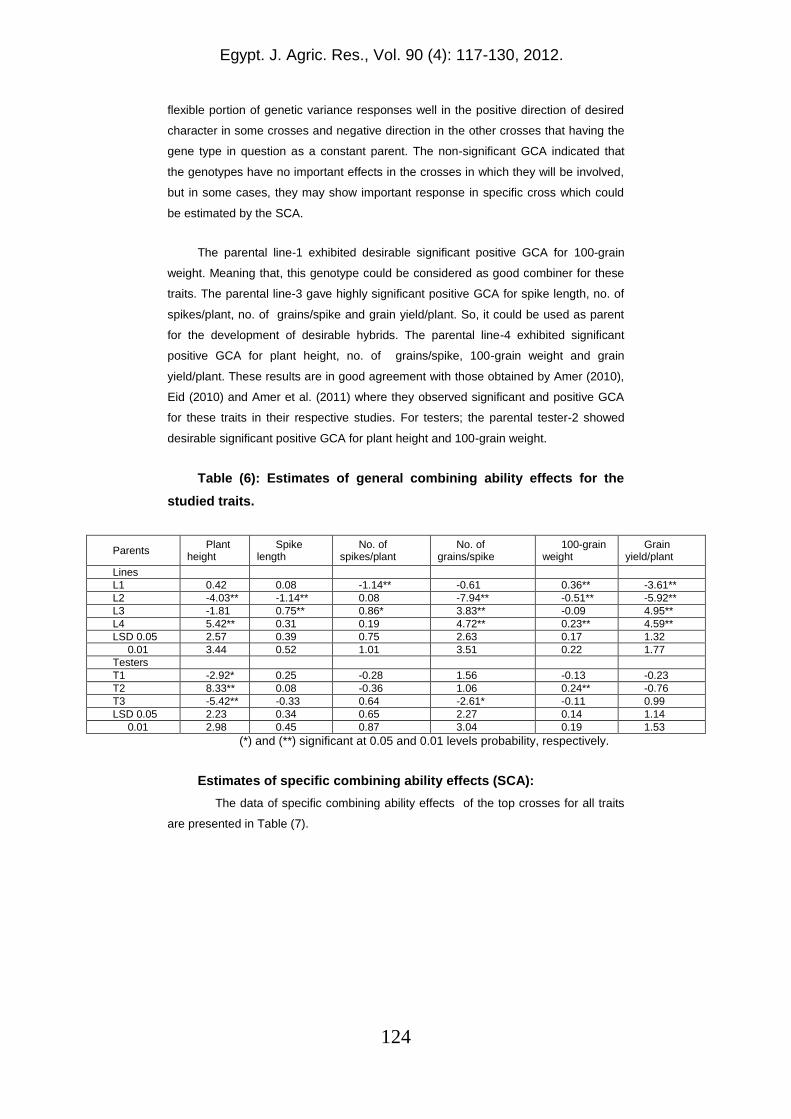
flexible portion of genetic variance responses well in the positive direction of desired
character in some crosses and negative direction in the other crosses that having the
gene type in question as a constant parent. The non-significant GCA indicated that
the genotypes have no important effects in the crosses in which they will be involved,
but in some cases, they may show important response in specific cross which could
be estimated by the SCA.
The parental line-1 exhibited desirable significant positive GCA for 100-grain
weight. Meaning that, this genotype could be considered as good combiner for these
traits. The parental line-3 gave highly significant positive GCA for spike length, no. of
spikes/plant, no. of grains/spike and grain yield/plant. So, it could be used as parent
for the development of desirable hybrids. The parental line-4 exhibited significant
positive GCA for plant height, no. of grains/spike, 100-grain weight and grain
yield/plant. These results are in good agreement with those obtained by Amer (2010),
Eid (2010) and Amer et al. (2011) where they observed significant and positive GCA
for these traits in their respective studies. For testers; the parental tester-2 showed
desirable significant positive GCA for plant height and 100-grain weight.
Table (6): Estimates of general combining ability effects for the
studied traits.
Parents Plant
height Spike
length No. of
spikes/plant No. of
grains/spike 100-grain
weight Grain
yield/plant
Lines
L1 0.42 0.08 -1.14** -0.61 0.36** -3.61**
L2 -4.03** -1.14** 0.08 -7.94** -0.51** -5.92**
L3 -1.81 0.75** 0.86* 3.83** -0.09 4.95**
L4 5.42** 0.31 0.19 4.72** 0.23** 4.59**
LSD 0.05 2.57 0.39 0.75 2.63 0.17 1.32
0.01 3.44 0.52 1.01 3.51 0.22 1.77
Testers
T1 -2.92* 0.25 -0.28 1.56 -0.13 -0.23
T2 8.33** 0.08 -0.36 1.06 0.24** -0.76
T3 -5.42** -0.33 0.64 -2.61* -0.11 0.99
LSD 0.05 2.23 0.34 0.65 2.27 0.14 1.14
0.01 2.98 0.45 0.87 3.04 0.19 1.53
(*) and (**) significant at 0.05 and 0.01 levels probability, respectively.
Estimates of specific combining ability effects (SCA):
The data of specific combining ability effects of the top crosses for all traits
are presented in Table (7).

Egypt. J. Agric. Res., Vol. 90 (4): 117-130, 2012.
125
Table (7): Estimates of specific combining ability effects for the
studied traits.
Crosses Plant
height Spike
length No. of
spikes/plant No. of
grains/spike 100-grain
weight Grain
yield/plant
L1 × T1 1.25 -0.92** -1.61* -6.89** -0.30* -8.10**
L1 × T2 3.33 1.58** -0.19 11.61** 0.30* 3.58**
L1 × T3 -4.58* -0.67* 1.81** -4.72* 0.01 4.52**
L2 × T1 2.36 0.31 0.50 2.44 0.29* 5.18**
L2 × T2 -0.56 -0.19 0.92 -1.06 0.09 -0.61
L2 × T3 -1.81 -0.11 -1.42* -1.39 -0.38** -4.58**
L3 × T1 -6.53** 0.42 1.72* 2.67 -0.11 -2.10
L3 × T2 -1.11 -1.42** -1.19 -10.83** -0.23 -3.24**
L3 × T3 7.64** 1.00** -0.53 8.17** 0.34* 5.33**
L4 × T1 2.92 0.19 -0.61 1.78 0.13 5.02**
L4 × T2 -1.67 0.03 0.47 0.28 -0.16 0.26
L4 × T3 -1.25 -0.22 0.14 -2.06 0.03 -5.28**
L.S.D. 0.05 4.46 0.67 1.30 4.55 0.29 2.29
0.01 5.96 0.90 1.74 6.08 0.38 3.06
(*) and (**) significant at 0.05 and 0.01 levels probability, respectively.
For plant height, the top cross (L3 × T3) expressed significant and positive SCA.
However, the combinations showed significant positive SCA may be useful in
exploitation of heterosis due to their desirable plant height. For spike length and no. of
grains/spike the top cross; (L1 × T2 ) and (L3 × T3) showed significant positive value
for SCA. Regarding no. of spikes/plant, significant positive SCA were demonstrated
by cross; (L1 × T3) where it gave the highest no. of spikes/plant.
For 100-grain weight, three top crosses namely (L1 × T2), (L2 × T1) and (L3 ×
T3) expressed significant positive SCA. With respect to grain yield/plant, positive and
significant SCA for grain yield/plant were revealed by five top crosses; (L1 × T2), (L1 ×
T3), (L2 × T1), (L3 × T3) and (L4 × T1). These results indicated that; non-additive
gene effects were predominant in these particular combinations of barley hybrids for
grain yield/plant due to the presence of considerable inter and intra-allelic interactions.
Therefore, these crosses could be utilized for increasing grain yield/plant following
approach of gene accumulation for the characters. These results are in general

Egypt. J. Agric. Res., Vol. 90 (4): 117-130, 2012.
126
agreement with those reported by Bhatnagar and Sharma (1997), Sharma et al
(2003), Mahmoud (2006), El-Sayed (2007), Katta et al (2009), Amer (2010), Eid
(2010) and Amer et al (2011).
Coefficients of variability:
Phenotypic (P.C.V) and genotypic (G.C.V) coefficients of variability were
estimated for the studied traits as presented in Table (8).
Table (8): Estimates of the genetic variance components,
heritability and genetic advance for all studied traits.
Parameter traits
2ph 2G 2E 2A 2D PCV % GCV % H2 h2 ∆g ∆g%
Plant height 37.90 33.06 4.84 11.59 21.47 5.44 5.09 87.23 30.58 3.88 3.43
Spike length 1.57 1.46 0.11 0.37 1.09 15.07 14.53 92.99 23.57 0.61 7.32
No. of spikes/plant 2.87 2.46 0.41 0.49 1.97 11.17 10.34 85.70 17.09 0.60 3.93
No. of grains/spike 71.03 65.99 5.04 2.33 63.67 13.26 12.78 92.90 3.27 0.57 0.89
100-grain weight 0.25 0.23 0.02 0.14 0.09 9.70 9.30 91.87 56.91 0.58 11.37
Grain yield/plant 44.75 43.48 1.27 4.17 39.31 15.25 15.03 97.16 9.32 1.28 2.93
It could be concluded that the (PCV and GCV) were low in magnitude for plant
height and 100-grain weight. While, it was observed that the phenotypic (PCV) and
genotypic (GCV) coefficients of variability were high in magnitudes for spike length,
no. of spikes/plant, no. of grains/spike and grain yield/plant. These results are in
general agreement with those reported by El-Sayed (2012).
Heritability estimates:
Heritability in both broad and narrow senses were computed and the
obtained results are presented in Table (8). The estimates of broad-sense heritability
determine as the relative proportion of genetic variance with respect to the phenotypic
variance. The heritability estimates either in broad or in narrow sense are important to
plant breeders since they judge the expected improvement that could be obtained
through selection programs. Broad sense heritability values were found to be high in
magnitudes for all traits under investigation. High H2 ranged from 85.70% for no. of
spikes/plant to 97.16% for grain yield/plant.
Narrow sense heritability was generally low to moderate and ranged from
3.27 for no. of grains/spike to 56.91 for 100-grain weight. The high difference between

Egypt. J. Agric. Res., Vol. 90 (4): 117-130, 2012.
127
broad and narrow sense heritability estimates which was found for all traits studied
was an expected due to more important of non-additive genes in the inheritance of
these traits as it mentioned before. These results are in line with those reported by El-
Sayed (2007), El-Shawy (2008) El-Sayed (2012).
Genetic advance under selection:
Genetic advance was calculated using phenotypic standard deviation and
heritability in narrow sense (Table 8). Relatively high genetic advance was found in
association with high PCV% and GCV% values for spike length and 100-grain weight.
Therefore, selection for this trait could be more effective than the other traits because
of its high expected (∆g%) genetic advance which reflected in high genetic variability.
On the other hand, relative low genetic advance was associated with low heritability
values for no. of grains/spike, indicating that selection for this trait would be less
successful than for the former cases. These results agreed with those obtained by El-
Sayed (2007), El-Shawy (2008) El-Sayed (2012).
REFERENCES
Allard, A. M. (1960). Principles of Plant Breeding. Jon Wily and Sons. Inc. NY,
U. S. A., p. 92.
Amer, Kh. A. (2010). Inheritance of drought tolerance in some barley genotypes.
Egypt. J. Agric. Res., (1) 88: 89-106.
Amer, Kh. A. (2011). Genetic Analysis of yield and its components under
normal and drought conditions in some barley crosses. Egypt. J. Plant Breed (15) 2:
65:79.
Bhatnagar, V. K. and S. N. Sharma (1997). Diallel analysis for grain yield and
harvest index in barley under diverse environments. Rachis. publ. 16: 22-27.
Borthakur, D.N. and J.M. Poehlman (1970). Heritability and genetic advance for
kernel weight in barley. Crop Sci. 10: 452-453.

Egypt. J. Agric. Res., Vol. 90 (4): 117-130, 2012.
128
Budak, N. (2000). Heterosis, general and specific combining ability estimates at
F1 and F2 generations of a 8 x 8 diallel cross population of barley. Turkish J. of Field
Crops. Society of Field Crop Sci., Izmir, Turkey. 5 (2): 61-70.
Burton, G.W. (1952). Quantitative inheritance in grasses. proc. 6th Int. Grassid
Congr. 1: 270-283.
Eid, A. A. (2010). The genetic behavior for salinity tolerance in some barley
genotypes. Egypt. J. Agric. Res., (1) 88: 67-86.
El-Bawab, A. M. O. (2003). Genetic studies on some characters in barley. Egypt.
J. Agric., 81(2).
El-Sayed, M. M. A. (2007). Estimation of quantitative genetic statistical in diallel
crosses of barley. M. Sc. Thesis Fac., Agric., Kafr El-Sheikh, Tanta Univ., Egypt.
El-Sayed, M. M. A. (2012). Genetical studies on some barley genotypes and its
tolerance to drought. Ph. D. Thesis Fac., Agric., Tanta Univ., Egypt.
El-Seidy, E. S. H. (1997b). Inheritance of earliness and yield in some barley
crosses. Annals of Agric. Sci., Moshtohor, 35 (2): 715-730.
El-Seidy, E. H. and A. B. Khattab (2000). Heterosis and combining ability in
barley under drought conditions at different growth stages. Proc.9th., Agron. Conf.
Minufiya, 1-2 Sept. 2000:167-182.
El-Shawy, E. E. A. (2008). Genetic analysis of some important traits of six-rowed
barley in normal and saline affected fields. M. Sc. Thesis, Fac. Agric., Kafr El-Sheikh,
Tanta Univ., Egypt.
Katta et al. (2009). Studies on tolerance of some hulless barley crosses to
drought. 6th International Plant Bred. Conf., Ismalia, Egypt, 3-5 May 2009. 867:885.
Kempthorne, O. (1957). An introduction to genetic statistics. Iowa State Univ.,
John Wiley and Sons Inc., New York, USA. 545 pp.

Egypt. J. Agric. Res., Vol. 90 (4): 117-130, 2012.
129
Mather, K. (1949). Biometrical Genetics. Dover Publications, Inc., London.
Mather, K. and J.L. Jinks (1971). Biometrical genetics. Cornell Univ. Proc.
Ithaca, N.Y., 231 pp.
Mather, K., and J. L. Jinks. 1982. Biometrical Genetics 3nd ed. Chapman and
Hall., London.
Mahmoud, Badeaa A. M. (2006). Genetic evaluation of some barley traits in
crosses under saline and non-saline conditions. M. Sc. thesis, Fac. Agric., Kafr El-
Sheikh, Tanta Univ., Egypt.
Sharma, Y., S. N. Sharma., P. Joshi and R. S. Sain (2002). Combining ability
analysis for yield and yield contributing characters in six-rowed barley. J. of Breed.
and Genet. 34 (2): 55-63.
Sharma, Y., S. N. Sharma., P. Joshi and R. S. Sain (2003). Combining ability in
the F1 and F2 generations of a diallel cross in six rowed barley (Hordeum vulgare L.).
Acta Agron. Hungaricae., 51: 281-288.
Singh, R.K. and B.D. Chaudhary (1977). Biometrical methods in quantitative
genetic analysis. Kalyani, Publishers, Daragnai, New Delhi.
Wigan, L.G. (1944). Balance and potence in natural populations. J. Genet. 46:
150-160.
Yadav, V. K., R. Kumar and L. Ram. (2002b). Genetic analysis of malt yield and
some of its components in barley. Plant Archives. 2 (2): 269-273. (Cited after CAB
Abs. 2002/08-2003/07).
تقدير بعض الثوابت الوراثية للمحصول ومكوناته فى بعض التراكيب الوراثية من الشعير
محمد منصور عبدالعاطى و عمار عبد العظيم االخضر, عالء على عيد, خيرى عبدالعزيز عامر
مصر- معهد بحوث المحاصيل الحقلية- قسم بحوث الشعير

Egypt. J. Agric. Res., Vol. 90 (4): 117-130, 2012.
130
الملخص العربى
تم . م2010/2011 و 2009/2010أجريت هذه الدراسة بمزرعة محطة البحوث الزراعية بسخا خالل الموسمين
تم تقدير قوة . التهجين بين أربع سالالت وثالث كشافات للحصول على البزور الهجينية التى تم تقييمها فى الموسم الثانى
وذلك والتحسين الوراثى المتوقعمعامل التوريث بمعناه الواسع والضيق, القدرة العامة والخاصة على االئتالف, الهجين
وزن المائة حبة ومحصول , عدد الحبوب فى السنبلة, عدد السنابل للنبات, طول السنبلة, طول النبات: بالنسبة لصفات
: كانت أهم النتائج المتحصل عليها كاألتي. الحبوب للنبات
الكشافات كانت عالية المعنوية فى × الكشافات والسالالت , أظهرت النتائج أن االختالفات الراجعة إلى السالالت
كما أظهرت قوة الهجين قيما سالبة وموجبة للصفات المدروسة بالنسبة لمتوسط األبوين واألب .معظم الصفات المدروسة
عدد , طول النبات: كانت أب مشارك جيد بالنسبة لصفات4-كما إتضح من نتائج القدرة على التآلف أن الساللة, األفضل
: كانت أب مشارك جيد بالنسبة لصفات3-كما أن الساللة, وزن المائة حبة ومحصول الحبوب للنبات, الحبوب فى السنبلة
كما أوضحت النتائج أن قيمة معامل . عدد الحبوب فى السنبلة ومحصول الحبوب للنبات, عدد السنابل للنبات, طول السنبلة
التوريث بمعناها الواسع تراوحت بين متوسطة إلى عالية فى معظم الصفات , فى حين تراوحت قيم معامل التوريث بمعناه
كانت أفضل الهجن (L3 x T3) و (L1 x T3)من النتائج السابقة يتضح أن الهجينان. الضيق بين منخفضة إلى متوسطة
تحت الدراسة وذلك بالنسبة للمحصول ومكوناته ولذلك نوصى بإدخالهما فى برامج التربية للمحصول العالى تحت الظروف
. الطبيعية
Copyright © 2022 FDOKUMEN