Estimation of microbial metabolism and co-occurrence patterns
39
BGD 12, 13819–13857, 2015 Estimation of microbial metabolism and co-occurrence patterns M. Bomberg et al. Title Page Abstract Introduction Conclusions References Tables Figures J I J I Back Close Full Screen / Esc Printer-friendly Version Interactive Discussion Discussion Paper | Discussion Paper | Discussion Paper | Discussion Paper | Biogeosciences Discuss., 12, 13819–13857, 2015 www.biogeosciences-discuss.net/12/13819/2015/ doi:10.5194/bgd-12-13819-2015 © Author(s) 2015. CC Attribution 3.0 License. This discussion paper is/has been under review for the journal Biogeosciences (BG). Please refer to the corresponding final paper in BG if available. Estimation of microbial metabolism and co-occurrence patterns in fracture groundwaters of deep crystalline bedrock at Olkiluoto, Finland M. Bomberg 1 , T. Lamminmäki 2 , and M. Itävaara 1 1 VTT Technical Research Centre of Finland, P.O. Box 1000, 02044 VTT, Espoo, Finland 2 Posiva Oy, Olkiluoto, 27160 Eurajoki, Finland Received: 7 July 2015 – Accepted: 22 July 2015 – Published: 26 August 2015 Correspondence to: M. Bomberg (malin.bomberg@vtt.fi) Published by Copernicus Publications on behalf of the European Geosciences Union. 13819
-
Upload
khangminh22 -
Category
Documents
-
view
2 -
download
0
Transcript of Estimation of microbial metabolism and co-occurrence patterns

BGD12, 13819–13857, 2015
Estimation ofmicrobial metabolism
and co-occurrencepatterns
M. Bomberg et al.
Title Page
Abstract Introduction
Conclusions References
Tables Figures
J I
J I
Back Close
Full Screen / Esc
Printer-friendly Version
Interactive Discussion
Discussion
Paper
|D
iscussionP
aper|
Discussion
Paper
|D
iscussionP
aper|
Biogeosciences Discuss., 12, 13819–13857, 2015www.biogeosciences-discuss.net/12/13819/2015/doi:10.5194/bgd-12-13819-2015© Author(s) 2015. CC Attribution 3.0 License.
This discussion paper is/has been under review for the journal Biogeosciences (BG).Please refer to the corresponding final paper in BG if available.
Estimation of microbial metabolism andco-occurrence patterns in fracturegroundwaters of deep crystalline bedrockat Olkiluoto, FinlandM. Bomberg1, T. Lamminmäki2, and M. Itävaara1
1VTT Technical Research Centre of Finland, P.O. Box 1000, 02044 VTT, Espoo, Finland2Posiva Oy, Olkiluoto, 27160 Eurajoki, Finland
Received: 7 July 2015 – Accepted: 22 July 2015 – Published: 26 August 2015
Correspondence to: M. Bomberg ([email protected])
Published by Copernicus Publications on behalf of the European Geosciences Union.
13819

BGD12, 13819–13857, 2015
Estimation ofmicrobial metabolism
and co-occurrencepatterns
M. Bomberg et al.
Title Page
Abstract Introduction
Conclusions References
Tables Figures
J I
J I
Back Close
Full Screen / Esc
Printer-friendly Version
Interactive Discussion
Discussion
Paper
|D
iscussionP
aper|
Discussion
Paper
|D
iscussionP
aper|
Abstract
The microbial diversity in oligotrophic isolated crystalline Fennoscandian Shieldbedrock fracture groundwaters is great but the core community has not been identi-fied. Here we characterized the bacterial and archaeal communities in 12 water con-ductive fractures situated at depths between 296 and 798 m by high throughput am-5
plicon sequencing using the Illumina HiSeq platform. The great sequencing depth re-vealed that up to 95 and 99 % of the bacterial and archaeal communities, respectively,were composed of only a few common species, i.e. the core microbiome. However,the remaining rare microbiome contained over 3 and 6 fold more bacterial and ar-chaeal taxa. Several clusters of co-occurring rare taxa were identified, which corre-10
lated significantly with physicochemical parameters, such as salinity, concentration ofinorganic or organic carbon, sulphur, pH and depth. The metabolic properties of themicrobial communities were predicted using PICRUSt. The rough prediction showedthat the metabolic pathways included commonly fermentation, fatty acid oxidation,glycolysis/gluconeogenesis, oxidative phosphorylation and methanogenesis/anaerobic15
methane oxidation, but carbon fixation through the Calvin cycle, reductive TCA cycleand the Wood-Ljungdahl pathway was also predicted. The rare microbiome is an un-limited source of genomic functionality in all ecosystems. It may consist of remnantsof microbial communities prevailing in earlier conditions on Earth, but could also beinduced again if changes in their living conditions occur. In this study only the rare taxa20
correlated with any physicochemical parameters. Thus these microorganisms can re-spond to environmental change caused by physical or biological factors that may leadto alterations in the diversity and function of the microbial communities in crystallinebedrock environments.
13820

BGD12, 13819–13857, 2015
Estimation ofmicrobial metabolism
and co-occurrencepatterns
M. Bomberg et al.
Title Page
Abstract Introduction
Conclusions References
Tables Figures
J I
J I
Back Close
Full Screen / Esc
Printer-friendly Version
Interactive Discussion
Discussion
Paper
|D
iscussionP
aper|
Discussion
Paper
|D
iscussionP
aper|
1 Introduction
Identifying and understanding the core microbiome of any given environments is ofcrucial importance for predicting and assessing environmental change both locally andglobally (Shade and Handelsman, 2012). So far, a core microbiome has not been iden-tified in deep Fennoscandian subsurface environments. For example, in a previous5
study (Bomberg et al., 2015) we showed by 454 amplicon sequencing that the activemicrobial communities in Olkiluoto deep subsurface were strictly stratified accordingto aquifer water type. Nevertheless, more rigorous sequencing efforts and more sam-plings have shown that an archaeal core community consisting of the DeepSea Hy-drothermal Vent Euryarchaeotal Group 6 (DHVEG-6), ANME-2D and Terrestrial Mis-10
cellaneous Group (TMEG) archaea may exsists in the anaerobic deep groundwater ofOlkiluoto (Miettinen et al., 2015). The bacterial core groups in Olkiluoto deep ground-water include at least members of the Pseudomonadaceae, Commamonadaceae andSphingomonadaceae (Bomberg et al., 2014, 2015; Miettinen et al., 2015). The relativeabundance of these main groups varies at different depths from close to the detection15
limit to over 90 % of the bacterial or archaeal community (Bomberg et al., 2015; Miet-tinen et al., 2015). However, both the archaeal and the bacterial communities containa wide variety of smaller bacterial and archaeal groups, which are distributed unevenlyin the different water conductive fractures.
The rare biosphere is a concept describing the hidden biodiversity of an environment20
and has been suggested to be ancient (Sogin et al., 2006). The rare biosphere consistsof microbial groups that are ubiquitously distributed in nature but rarely found. Due tomodern high throughput sequencing techniques, however, the hidden diversity of raremicrobiota has been revealed. These microorganisms are the basis for unlimited mi-crobial functions in the environment and upon environmental change specific groups25
can readily activate and become abundant. Access to otherwise inaccessible nutrientsactivate specific subpopulations in the bacterial communities within hours of exposure(Rajala et al., 2015) and enrich distinct microbial taxa at the expense of the original
13821

BGD12, 13819–13857, 2015
Estimation ofmicrobial metabolism
and co-occurrencepatterns
M. Bomberg et al.
Title Page
Abstract Introduction
Conclusions References
Tables Figures
J I
J I
Back Close
Full Screen / Esc
Printer-friendly Version
Interactive Discussion
Discussion
Paper
|D
iscussionP
aper|
Discussion
Paper
|D
iscussionP
aper|
microbial community in the groundwater (Kutvonen, 2015). Mixing of different ground-water layers due to e.g. breakage of aquifer boundaries and new connection of sepa-rated aquifers may cause the microbial community to change and activate otherwisedormant processes. This has previously been shown by Pedersen et al. (2013), whoindicated increased sulphate reduction activity when sulphate-rich and methane-rich5
groundwater mixed. The stability of deep subsurface microbial communities in isolateddeep subsurface groundwater fractures are assumed to be stable. However, there areindications that they may change over the span of several years as slow flow alongfractures is possible (Miettinen et al., 2015; Sohlberg et al., 2015).
The microbial taxa present in an environment interact with both biotic and abiotic10
factors. Co-occurrence network analyses and metabolic predictions may help to un-derstand these interactions. Barberan et al. (2012) visualised the co-occurrence net-works of microbial taxa in soils and showed novel patterns connecting generalist andspecialist species as well as associations between microbial taxa. They showed thatspecialist and generalist microbial taxa formed distinct and separate correlation net-15
works, which also reflected the environmental settings. Metagenome predicting toolsallows us to estimate microbial metabolic functions based on NGS microbiome data.Using the PICRUSt tool (Langille et al., 2013) Tsitko et al. (2014) showed that ox-idative phosphorylation was the most important energy producing metabolic pathwaythroughout the 7 m depth profile of an Acidobacteria-dominated nutrient poor boreal20
bog. Cleary et al. (2015) showed that tropical mussel-associated bacterial communitiescould be important sources of bioactive compounds for biotechnology. This approachis nevertheless hampered by the fact that only little is so far known about unculturedenvironmental microorganisms and their functions and the PICRUSt approach is bestapplied for human microbiome for which it was initially developed (Langille et al., 2013).25
However, metagenomic estimations may give important indications of novel metabolicpossibilities even in environmental microbiome studies.
Using extensive high throughput amplicon sequencing in this study we aimed toidentify the core microbiome in the deep crystalline bedrock fractures of Olkiluoto Island
13822

BGD12, 13819–13857, 2015
Estimation ofmicrobial metabolism
and co-occurrencepatterns
M. Bomberg et al.
Title Page
Abstract Introduction
Conclusions References
Tables Figures
J I
J I
Back Close
Full Screen / Esc
Printer-friendly Version
Interactive Discussion
Discussion
Paper
|D
iscussionP
aper|
Discussion
Paper
|D
iscussionP
aper|
and also to identify the rare microbiome. We aimed to show the interactions betweenthe taxa of the rare biosphere and the surrounding environmental parameters in orderto validate the factors that determine the distribution of the rare taxa. Finally we aimedto estimate the prevailing metabolic activities that may occur in the deep crystallinebedrock environment of Olkiloto, Finland.5
2 Materials and methods
2.1 Background
The Olkiluoto site has previously been extensively described (Posiva, 2013) and is onlybriefly described here. The Island of Olkiluoto situating on the west coast of Finland hasapproximately 60 drillholes drilled for research and monitoring purposes. Studies on the10
chemistry and microbiology of the groundwater have been on-going since the 1980s.The groundwater is stratified with a salinity gradient extending from fresh to brackishwater to a depth of 30 m and the highest salinity concentration of 125 gL−1 total dis-solved solids (TDS) at 1000 m depth (Posiva, 2013). The most abundant salinity caus-ing cations are Na2+ and Ca2+ and anions Cl−. Between 100 and 300 m depths, the15
groundwater originates from ancient (pre-Baltic) seawater and has high concentrationsof SO2−
4 . Below 300 m the concentration of methane in the groundwater increases and
SO2−4 is almost absent. A sulphate-methane transition zone (SMTZ), where sulphate-
rich fluid replaces methane-rich fluid, is located at 250–350 m depth. Temperature riseslinearly with depth, from ca. 5–6 ◦C at 50 m to ca. 20 ◦C at 1000 m depth (Ahokas et al.,20
2008). The pH of the groundwater is slightly alkaline throughout the depth profile. Mul-tiple drillholes intersect several groundwater-filled bedrock fractures, including largerhydrogeological zones such as HZ20 or HZ21 (Table 1). The bedrock of Olkiluoto con-sists mainly of micagneiss and pegmatitic granite type rocks (Kärki and Paulamäki,2006).25
13823

BGD12, 13819–13857, 2015
Estimation ofmicrobial metabolism
and co-occurrencepatterns
M. Bomberg et al.
Title Page
Abstract Introduction
Conclusions References
Tables Figures
J I
J I
Back Close
Full Screen / Esc
Printer-friendly Version
Interactive Discussion
Discussion
Paper
|D
iscussionP
aper|
Discussion
Paper
|D
iscussionP
aper|
This study focused on 12 groundwater samples from water conductive fractures sit-uated at between 296 and 798 m below sea level bsl and originating from 11 differentdrillholes in Olkiluoto. The samples represented brackish sulphate waters and salinewaters (as classified in Posiva, 2013). The samples were collected between Decem-ber 2009 and January 2013 (Table 1). The physicochemical parameters of the ground-5
water samples have been reported by reported by Miettinen et al. (2015), but have forclarity been collected here (Table 1).
2.2 Sample collection
The collection of samples was described previously (Bomberg et al., 2015; Miettinenet al., 2015; Sohlberg et al., 2015). The samples were obtained from both permanently10
packered drillholes and open drillholes, with which removable inflatable packers wereused. Shortly, in order to obtain indigenous fracture fluids, the packer-isolated fracturezones were purged by removing stagnant drillhole water by pumping for a minimumof four weeks before the sample water was collected. The water samples were col-lected directly from the drillhole into an anaerobic glove box (MBRAUN, Germany) via15
a sterile, gas-tight poly acetate tube (8 mm outer diameter). Microbial biomass DNAextraction was concentrated from 1000 mL samples by filtration on cellulose acetatefilters (0.2 µm pore size, Corning) by vacuum suction inside the glove box. The filterswere immediately extracted from the filtration funnels and frozen on dry ice in sterile50 mL cone tubes (Corning). The frozen samples were transported on dry ice to the20
laboratory where they were stored at −80 ◦C until use.
2.3 Nucleic acid isolation
Community DNA was isolated directly from the frozen cellulose-acetate filters with thePowerSoil DNA extraction kit (MoBio Laboratories, Inc., Solana Beach, CA), as previ-ously described (Bomberg et al., 2015). Negative DNA isolation controls were included25
13824

BGD12, 13819–13857, 2015
Estimation ofmicrobial metabolism
and co-occurrencepatterns
M. Bomberg et al.
Title Page
Abstract Introduction
Conclusions References
Tables Figures
J I
J I
Back Close
Full Screen / Esc
Printer-friendly Version
Interactive Discussion
Discussion
Paper
|D
iscussionP
aper|
Discussion
Paper
|D
iscussionP
aper|
in the isolation protocol. The DNA concentration of each sample was determined usingthe NanoDrop 1000 spectrophotometer.
2.4 Estimation of microbial community size
The size of the microbial community was determined by epifluorescence microscopy of4′,6 diamidino-2-phenylindole dihydrochloride (DAPI) (Sigma, MO, USA) stained cells5
as described in Purkamo et al. (2013). The size of the bacterial population was deter-mined by 16S rRNA gene targeted quantitative PCR (qPCR) as described by Tsitkoet al. (2014) using universal bacterial 16S rRNA gene-targeting primers fD1 (Weisburget al., 1991) and P2 (Muyzer et al., 1993), which specifically target the V1–V3 region ofthe bacterial 16S rDNA gene. The size of the archaeal population in the groundwater10
was determined by using primers ARC344f (Bano et al., 2004) and Ar744r (reversecompliment from Barns et al., 1994) flanking the V4–V6 region of the archaeal 16SrRNA gene.
The qPCR reactions were performed in 10 µL reaction volumes using the KAPA2×Syrb® FAST qPCR-kit on a LightCycler480 qPCR machine (Roche Applied Sci-15
ence, Germany) on white 96-well plates (Roche Applied Science, Germany) sealedwith transparent adhesive seals (4titude, UK). Each reaction contained 2.5 µM of rel-evant forward and reverse primer and 1 µL DNA extract. Each reaction was run intriplicate and no-template control reactions were used to determine background fluo-rescence in the reactions.20
The qPCR conditions consisted of an initial denaturation at 95 ◦C for 10 min followedby 45 amplification cycles of 15 s at 95 ◦C, 30 s at 55 ◦C and 30 s at 72 ◦C with a quantifi-cation measurement at the end of each elongation. A final extension step of three min-utes at 72 ◦C was performed prior to a melting curve analysis. This consisted of a de-naturation step for 10 s at 95 ◦C followed by an annealing step at 65 ◦C for one minute25
prior to a gradual temperature rise to 95 ◦C at a rate of 0.11 ◦C s−1 during which thefluorescence was continuously measured. The number of bacterial 16S rRNA geneswas determined by comparing the amplification result (Cp) to that of a ten-fold dilu-
13825

BGD12, 13819–13857, 2015
Estimation ofmicrobial metabolism
and co-occurrencepatterns
M. Bomberg et al.
Title Page
Abstract Introduction
Conclusions References
Tables Figures
J I
J I
Back Close
Full Screen / Esc
Printer-friendly Version
Interactive Discussion
Discussion
Paper
|D
iscussionP
aper|
Discussion
Paper
|D
iscussionP
aper|
tion series (101–107 copies µL−1) of Escherichia coli (ATCC 31608) 16S rRNA genesin plasmid for bacteria and a dilution series of genomic DNA of Halobacterium sali-narum (DSM 3754) for archaea. The lowest detectable standard concentration for theqPCRs was 102 gene copies/reaction. Inhibition of the qPCR by template tested byadding 2.17×10⁴ plasmid copies containing fragment of the morphine-specific Fab5
gene from Mus musculus gene to reactions containing template DNA as described inNyyssönen et al. (2012). Inhibition of the qPCR assay by the template DNA was foundto be low. The average Crossing point (Cp) value for the standard sample (2.17×10⁴
copies) was 28.7 (±0.4 SD), while for the DNA samples Cp was 28.65–28.91 (±0.03–0.28 SD). Nucleic acid extraction and reagent controls were run in all qPCRs in parallel10
with the samples. Amplification in these controls was never higher than the backgroundobtained from the no template controls.
2.5 Amplicon library preparation
This study is part of the Census of Deep Life initiative, which strives to obtain a censusof the microbial diversity in deep subsurface environment by collecting samples around15
the world and sequencing the 16S rRNA gene pools of both archaea and bacteria. Theextracted DNA samples were sent to the Marine Biological Laboratory in Woods Hole,MA, USA, for preparation for HiSeq sequencing using the Illumina technology. Theprotocol for amplicon library preparation for both archaeal and bacterial 16S ampli-con libaries can be found at http://vamps.mbl.edu/resources/faq.php. Shortly, amplicon20
libraries of the V6 region of both the archaeal and bacterial 16S rRNA genes wereproduced. For the archaea, primers A958F and A1048R containing Truseq adapter se-quences at their 5′ end were used, and for the bacteria primers B967F and B1064R forobtaining 100 nt long paired end reads.
13826

BGD12, 13819–13857, 2015
Estimation ofmicrobial metabolism
and co-occurrencepatterns
M. Bomberg et al.
Title Page
Abstract Introduction
Conclusions References
Tables Figures
J I
J I
Back Close
Full Screen / Esc
Printer-friendly Version
Interactive Discussion
Discussion
Paper
|D
iscussionP
aper|
Discussion
Paper
|D
iscussionP
aper|
2.6 Sequence processing and analysis
Contigs of the paired end fastq files were first assembled with mothur v 1.32.1 (Schlosset al., 2009). Analyzes were subsequently continued using QIIME v. 1.8. (Caporasoet al., 2010). Only sequences with a minimum length of 50 bp were included in theanalyses. The bacterial and archaeal 16S rRNA sequences were grouped into OTUs5
(97 % sequence similarity) using both the open reference and closed reference OTUpicking strategy and classified using the GreenGenes 13_8 16S reference database(DeSantis et al., 2006). The sequencing coverage was evaluated by rarefaction anal-ysis and the estimated species richness and diversity indices were calculated. Forcomparable α- and β-diversity analyses the data sets were normalized by random sub-10
sampling of 17 000 sequences/sample for archaea and 140 000 sequences/sample forbacteria. Microbial metabolic pathways were estimated based on the 16S rRNA genedata from the closed OTU picking method using the PICRUSt software (Langille et al.,2013) on the web based Galaxy application (Goecks et al., 2010; Blankenberg et al.,2010; Giardine et al., 2005). The sequence data has been submitted to the Sequence15
Read Archive (SRA, http://www.ncbi.nlm.nih.gov/sra) under study SRP053854, Biopro-ject PRJNA275225.
2.7 Statistical analyses
Pearson’s r correlation between biological and geochemical/-physical factors andcanonical correspondence analysis was calculated using PAST3 (Hammer and Harper,20
2001). Pearson’s r correlation between the occurrence and abundance of the archaealand bacterial genera in each sample was tested using the out.association commandin mothur. Correlation pairs of microbial genera with p < 0.01 were read into the Gephisoftware (Bastian et al., 2009) for visualization of a correlation network between thesignificant biological groups.25
13827

BGD12, 13819–13857, 2015
Estimation ofmicrobial metabolism
and co-occurrencepatterns
M. Bomberg et al.
Title Page
Abstract Introduction
Conclusions References
Tables Figures
J I
J I
Back Close
Full Screen / Esc
Printer-friendly Version
Interactive Discussion
Discussion
Paper
|D
iscussionP
aper|
Discussion
Paper
|D
iscussionP
aper|
3 Results
3.1 Microbial community size
The total number of microbial cells detected by epifluorescence microscopy of DAPIstained cells was between 2.3×10⁴ and 4.2×10⁵ cells mL−1 groundwater (Fig. 1, Ta-ble 1). The concentration of bacterial 16S rRNA gene copies mL−1 varied between5
9.5×10³ and 7.0×10⁵ and that of the archaea 2.6×101 and 6.3×10⁴ (Fig. 1, Table 1).
3.2 Sequence statistics, diversity estimates and sequencing coverage
The number of bacterial v6 sequence reads from the 12 samples varied between 1.4–7.8×10⁵ reads, with a mean sequencing depth of 2.9×10⁵ (±1.8×10⁵ standard de-viation) reads/sample (Table 2). The archaeal v6 sequence reads ranged from 0.17–10
12.1×10⁵ reads with a mean sequencing depth of 4.1×10⁵ (±3.5×10⁵ standard de-viation) reads/sample. Compared to the actual numbers of observed operational taxo-nomic units (OTUs), on average 82.6 % (±12.5 %) of the Chao1 and 78.1 % (±13.4 %)of the ACE estimated numbers of bacterial OTUs were detected (Table 2a, b). Thecoverage between samples ranged from 57.3–99.4 and 51.6–97.6 % of the Chao1 and15
ACE estimated OTU richness, respectively. The archaeal communities were slightlybetter covered, with on average 88.5 % (±11.5 %) of the Chao1 and 84.8 % (±12.6 %)of the ACE estimated number of OTUs detected. The coverage between samplesranged between 61.6–99.4 and 56.8–98.1 % of the Chao1 and ACE estimated OTUrichness, respectively. Shannon diversity index H′, calculated from 140 000 and 17 00020
random sequence reads per sample for the bacteria and archaea, respectively, washigh for both bacterial and archaeal communities. High H′ values and climbing rarefac-tion curves (Fig. 2) indicated high diversity in the microbial communities in the differentdeep groundwater fracture zones of Olkiluoto. The bacterial H′ was on average 13(±0.74), ranging from 11 to 14 between the different samples. The archaeal H′ was on25
average 11 (±1.2) ranging from 9 to 12 between the samples.
13828

BGD12, 13819–13857, 2015
Estimation ofmicrobial metabolism
and co-occurrencepatterns
M. Bomberg et al.
Title Page
Abstract Introduction
Conclusions References
Tables Figures
J I
J I
Back Close
Full Screen / Esc
Printer-friendly Version
Interactive Discussion
Discussion
Paper
|D
iscussionP
aper|
Discussion
Paper
|D
iscussionP
aper|
From the bacterial v6 sequences 49 different bacterial Phyla were detected (Supple-ment 1). These phyla included 165 bacterial classes, 230 orders, 391 families and 651genera. The greatest number of sequences, between 21.83 and 47.94 % per sample,clustered into an undetermined bacterial group (Bacteria, Other), which may be duethe fact that sequences of poorer quality may be difficult to classify, especially as the5
sequences are short.Only 31 of the identified genera represented at least 1 % of the bacterial sequence
reads in any sample (Table 3).The archaea were represented by two identified phyla, the Euryarchaeota and the
Crenarchaeota (Supplement 2). These included 21 classes, 38 orders, 61 families and10
81 genera. Between 4.7 and 35.0 % of the archaeal sequences of each sample wereclassified to unassigned Archaea, with a general increase in unassigned archaeal se-quences with increasing depth. 15 archaeal genera were present at a minimum of 1 %relative abundance in any of the samples (Table 4).
3.3 Core communities15
The bacterial core community, i.e. the taxa occurring in all the tested samples, con-stituted of 95 out of 651 identified bacterial genera (Supplement 3). These generaaccounted for 80.78–95.81 % of all the bacterial sequence reads in the samples. Thearchaeal core community consisted of 25 of the 81 identified genera and accounted for95.05–99.75 % of the total number of sequence reads in each sample (Supplement 4).20
3.4 Impact of environmental parameters on the microbial communities
The general bacterial and archaeal communities in the different samples correspondedmostly to sulphate and total sulphur concentrations at depths between 328 and 423 mas shown by the canonical correspondence analysis (Fig. 3). The community for thedeepest sampling depth at 798 m corresponded mostly to K and Fe, but also to salinity.25
In general the communities corresponded most strongly to the type of groundwater they
13829

BGD12, 13819–13857, 2015
Estimation ofmicrobial metabolism
and co-occurrencepatterns
M. Bomberg et al.
Title Page
Abstract Introduction
Conclusions References
Tables Figures
J I
J I
Back Close
Full Screen / Esc
Printer-friendly Version
Interactive Discussion
Discussion
Paper
|D
iscussionP
aper|
Discussion
Paper
|D
iscussionP
aper|
originated from. When examining the different microbial groups most of the detectedbacterial and archaeal genera did not correlate significantly with any of the measuredparameters, because most of the genera were present at very low relative abundanceand distributed evenly throughout the depth profile (Supplements 1 and 2). However,of the dominating (> 1 % relative abundance) genera Actinobacteria/Other correlated5
positively and significantly (r > 0.7, p < 0.005) withNtot, NPOC, Fe(II) (Tables 5–8). Thegenus Clostridium also correlated positively and significantly with Ntot and NPOC, whilethe unassigned Gammaproteobacteria/Other correlated positively and significantly withFe(II). Enterobacteriaceae/Other and Escherichia correlated positively and significantlywith Ntot. Microbacterium was the only major detected genus that correlated positively10
and significantly with pH and Flavobacteriaceae/Other the only major bacterial genusto correlate positively and significantly with Fetot. Caulobacteraceae/Other and Sulfuri-curvum correlated positively and significantly with sulphide.
Of the major archaeal genera Methanobacteriales/Other, MSBL1/Other andSAGMEG-1 correlated positively and significantly with sampling depth, EC, TDS, Ca,15
Cl and Na (Tables 5–8). In addition, Methanobacteriales/Other correlated positivelyand significantly with Ntot, while MSBL1/Other and SAGMEG-1 together with Crenar-chaeota/Other correlated positively and significantly with bicarbonate, DIC, and Fetot.Thermoplasmata E2/Other correlated positively and significantly with Alkalinity andFe(II).20
The concentration of sulphide correlated significantly with the greatest number ofdifferent bacterial genera, while the archaeal community did not show any correlationwith sulphide (Table 8). Instead different minor groups of ANME archaea correlatedpositively and significantly with the concentration of sulphate and Stot. Deltaproteobac-terial SRB correlated greatly with Fe(II). Ntot and NPOC affected numerous bacterial25
and archaeal clades.
13830

BGD12, 13819–13857, 2015
Estimation ofmicrobial metabolism
and co-occurrencepatterns
M. Bomberg et al.
Title Page
Abstract Introduction
Conclusions References
Tables Figures
J I
J I
Back Close
Full Screen / Esc
Printer-friendly Version
Interactive Discussion
Discussion
Paper
|D
iscussionP
aper|
Discussion
Paper
|D
iscussionP
aper|
3.5 Co-occurrence network
Of the 651 bacterial and 81 archaeal genera (or equivalent groups) identified in thisstudy 42 bacteria and 59 archaeal genera showed any significant correlation with othergenera. These groups all represented rare biosphere groups. These were divided into 7distinct communities (Fig. 4). The majority of the co-occurring rare groups showed posi-5
tive correlation to the same environmental factors clustering into communities occurringin relation to total N and organic C concentrations (community 1), sulphur, sulphate andFe(II) (communities 2, 3), salinity (communities 3–7), inorganic C (communities 3, 4, 6,7), organic C (community 5) and depth (communities 5, 6).
3.6 Predicted metabolic functions of the deep subsurface microbial10
communities
The putative metabolic functions of the microbial communities at different depth waspredicted using the PICRUSt software, which compares the identified 16S rRNA genesequences to those of known genome sequenced species thereby estimating the pos-sible gene contents of the uncultured microbial communities. The analysis is only an15
approximation, but may give an idea of the possible metabolic activities in the deep bio-sphere. In order to evaluate the soundness of the analysis a nearest sequenced taxonindex (NSTI) for each of the bacterial and archaeal communities was calculated byPICRUSt. An NSTI value of 0 indicates high similarity to the closest sequenced taxonwhile NSTI= 1 indicates no similarity. The NSTI of the bacterial communities at differ-20
ent depths varied between 0.045 in sample OL-KR44 and 0.168 in sample OL-KR13(Table 9a). The NSTI for archaea were much higher ranging from 0.141 in sample OL-KR9 at depth of 432 m and 0.288 in OL-KR44. This indicates that the metagenomicestimates are very rough. The estimated microbial metabolism did not differ notice-ably between the different depths (Table 9b). The most important predicted metabolic25
pathways included membrane transport in both bacterial and archaeal communities.The most common pathways for carbohydrate metabolism were the butanoate, propi-
13831

BGD12, 13819–13857, 2015
Estimation ofmicrobial metabolism
and co-occurrencepatterns
M. Bomberg et al.
Title Page
Abstract Introduction
Conclusions References
Tables Figures
J I
J I
Back Close
Full Screen / Esc
Printer-friendly Version
Interactive Discussion
Discussion
Paper
|D
iscussionP
aper|
Discussion
Paper
|D
iscussionP
aper|
onate, glycolysis/gluconeogenesis and pyruvate metabolism pathways for the bacteriaand glycolysis/gluconeogenesis and pyruvate metabolism pathways for the archaea.The most abundant energy metabolic pathway in the bacterial communities was theoxidative phosphorylation while for the archaea the methane metabolism was the mostimportant.5
4 Discussion
The phenotypic characteristics of the Fennoscandian Shield deep subsurface micro-bial communities are still largely unknown although specific reactions to introducedenvironmental stimulants have been shown (e.g. Pedersen et al., 2013, 2014; Ra-jala et al., 2015; Kutvonen, 2015). Nevertheless, the connection of these microbial10
responses to specific microbial groups is still only in an early phase. Metagenomic andgene specific analyses of deep subsurface microbial communities have revealed promi-nent metabolic potential of the microbial communities, which appear to be associatedwith the prevailing lithology and physicochemical parameters (Nyyssönen et al., 2014;Purkamo et al., 2015). It has also been shown with fingerprinting methods with ever15
increasing efficiency that the bacterial and archaeal communities are highly diverse inthe saline anaerobic Fennoscandian deep fracture zone groundwater (Bomberg et al.,2014, 2015; Nyyssönen et al., 2012, 2014; Pedersen et al., 2014; Miettinen et al., 2015;Sohlberg et al., 2015). Nevertheless, the concentration of microbial cells in the ground-water is quite low (Fig. 1, Table 1). Most of the microbial communities at different depth20
in Olkiluoto bedrock fractures consist of bacteria. However, at specific depths (328,423 m) the archaea may contribute with over 50 % of the estimated 16S rRNA genepool (Table 1). The major archaeal group present at these depths were the ANME-2D archaea indicating that nitrate-mediated anaerobic oxidation of methane may beespecially common (Haroon et al., 2013).25
Previously, using 454 amplicon sequencing, we have observed OTU numbers ofapproximately 800 OTUs per sample covering approximately 550 bacterial genera (or
13832

BGD12, 13819–13857, 2015
Estimation ofmicrobial metabolism
and co-occurrencepatterns
M. Bomberg et al.
Title Page
Abstract Introduction
Conclusions References
Tables Figures
J I
J I
Back Close
Full Screen / Esc
Printer-friendly Version
Interactive Discussion
Discussion
Paper
|D
iscussionP
aper|
Discussion
Paper
|D
iscussionP
aper|
equivalent groups) and approximately 350 archaeal OTUs including approximately 80different genera (or equivalent groups) (Miettinen et al., 2015). The OTUs in the studyabove were defined at 97 % sequence homology and the number of sequence readsper sample was at most in the range of 104. However, in this study the number ofsequence reads was 10- to 100-fold higher and the number of OTUs per sample in5
general 100-fold higher. This indicates that a greater sequencing depth increases thenumber of taxa detected from the subsurface environment and allows us a novel viewof the so far hidden rare biosphere. Nevertheless, in comparison to the high numberof OTUs detected the number of identified genera, 651 and 81 bacterial and archaealgenera, respectively, seems low. On the other hand this indicates that the sequencing10
depth has been sufficient to detect most of the prokaryotic groups present.In general, the microbial communities at different depth grouped loosely into clus-
ters according to the groundwater chemistry (Fig. 3). The clearest clustering was ob-served for samples derived from between 328 and 423 m depth where total sulphurand sulphate concentrations influenced the population. Individual bacterial and ar-15
chaeal groups on the other hand showed strong positive correlation to the differentgeochemical parameters (Tables 5–8). However, most of the bacterial and archaealgroups correlating with any of the measured geochemical parameters belonged to therare biosphere, i.e. low abundance and sporadic appearance in the bacterial or ar-chaeal communities. The core communities, defined as taxa present in all the studied20
samples, accounted for between 80–97 % and 95–> 99 % of the bacterial and archaealcommunities, respectively. This is a considerable frequency of common microbial taxa.Nevertheless, the number of rare taxa detected from the sample set was 3.3 to 6.8fold higher than the number of core taxa on genus level. Our results agree with Soginet al. (2006), who showed that a relatively small number of taxa dominate deep-sea25
water habitats, but a rare microbiome consisting of thousands of taxonomically dis-tinct microbial groups are detected at low abundances. What this means for the func-tioning of the deep subsurface is that the microbial communities have the capacity torespond and change due to changes in environmental conditions. For example, Peder-
13833

BGD12, 13819–13857, 2015
Estimation ofmicrobial metabolism
and co-occurrencepatterns
M. Bomberg et al.
Title Page
Abstract Introduction
Conclusions References
Tables Figures
J I
J I
Back Close
Full Screen / Esc
Printer-friendly Version
Interactive Discussion
Discussion
Paper
|D
iscussionP
aper|
Discussion
Paper
|D
iscussionP
aper|
sen et al. (2014) showed that by adding sulphate to the sulphate-poor but methane-richgroundwater in Olkiluoto the bacterial population changed over the span of 103 daysfrom a non-SRB community to a community dominated by SRB. In addition, a change inthe geochemical environment induced by H2 and methane impacted the size, compo-sition and functions of the microbial community and ultimately led to acetate formation5
(Pedersen et al., 2012, 2014; Pedersen, 2013).The metabolic pathways predicted by PICRUSt are far from certain when uncultured
and unculturable deep subsurface microbial communities are concerned. The NSTI val-ues for both the bacterial and well as the archaeal communities were great indicatingthat no closely related species have yet been sequenced. However, on higher taxo-10
nomical level common traits for specific groups of microorganisms may be revealed.
4.1 Energy metabolism
Deep subsurface environments are often declared energy deprived environments dom-inated by autotrophic microorganisms (Hoehler and Jorgensen, 2013). However, re-cent reports indicate that heterotrophic microorganisms play a greater role than the15
autotrophic microorganisms in Fennoscandian deep crystalline subsurface environ-ments (Purkamo et al., 2015). Heterotrophic communities with rich fatty acid assimi-lation strategies have been reported to fix carbon dioxide on the side of e.g. fermentingactivities in order to replenish the intracellular carbon pool, which otherwise would bedepleted. Our results agree with Purkamo et al. (2015) that a greater proportion of the20
microbial community is involved in carbohydrate and fatty and organic acid oxidationthan in fixation of inorganic carbon. Nevertheless, autotrophic carbon fixation pathwayswere predicted in the analysis with PICRUSt, indicating that both the archaeal and bac-terial communities include autotrophic members, although these microorganisms mightnot be obligate autotrophs.25
Several carbon fixation pathways were predicted in the archaeal and bacterial com-munities. The Calvin cycle and the reductive TCA (rTCA) cycle were found in boththe archaeal and the bacterial communities. The Wood-Ljungdahl pathway is consid-
13834

BGD12, 13819–13857, 2015
Estimation ofmicrobial metabolism
and co-occurrencepatterns
M. Bomberg et al.
Title Page
Abstract Introduction
Conclusions References
Tables Figures
J I
J I
Back Close
Full Screen / Esc
Printer-friendly Version
Interactive Discussion
Discussion
Paper
|D
iscussionP
aper|
Discussion
Paper
|D
iscussionP
aper|
ered the most ancient autotrophic carbon fixation pathway in bacteria and archaea(Fuchs, 1989; Martin et al., 2008; Berg et al., 2010; Hügler and Sievert, 2011). De-spite the long isolation of the ancient groundwater of Olkiluoto the Wood-Ljungdahlpathway was only predicted in the bacterial community. In the archaeal community theCalvin cycle and the rTCA were especially pronounced in the samples from 296 m,5
405–423 m and somewhat lower at 510–527 m depth. The bacterial communities arepredicted to fix CO2 at almost all depths with the exception of 405 and 559 m depth.The predicted methane metabolism (methane and methyl compound consumption)and oxidative phosphorylation were equally strong in the bacterial community. Sulphurmetabolism was not a common pathway for energy in either the archaeal or the bacte-10
rial communities, but bacteria with either assimilative or dissimilative sulphate reductionwere present. No sulphur oxidation through the sox system was predicted. Ammoniaand nitrate appear not to be taken up by the microorganisms or used for energy.
Oxidative phosphorylation was one of the most prominent energy generatingmetabolic pathways in the bacterial community. This indicates that ATP is generated by15
electron transfer to a terminal electron acceptor, such as oxygen, nitrate or sulphate. Inthe archaeal community the oxidative phosphorylation was not as strongly indicated,but this may be due to missing data on archaeal metabolism in the KEGG database.
The main energy metabolism of the archaeal communities appeared to be themethanogenesis, especially at 296 and 405 m. Methanogenesis was common also at20
all other depths except 330–347, 415 and 693–798 m. Methane is produced from CO2-H2 and methanol, and from acetate, although evidence for the acetate kinase enzymewas lacking. Methanogenesis from methylamines may also be possible, especially at296 and 405 m. Methane oxidation using methane monoxygenases and methanol de-hydrogenases does not occur in either bacterial or archaeal communities.25
4.2 Carbohydrate metabolism
Glycolysis/gluconeogenesis is one of the most common carbohydrate-metabolizingpathways predicted for both the archaeal and bacterial communities. Pyruvate from
13835

BGD12, 13819–13857, 2015
Estimation ofmicrobial metabolism
and co-occurrencepatterns
M. Bomberg et al.
Title Page
Abstract Introduction
Conclusions References
Tables Figures
J I
J I
Back Close
Full Screen / Esc
Printer-friendly Version
Interactive Discussion
Discussion
Paper
|D
iscussionP
aper|
Discussion
Paper
|D
iscussionP
aper|
glycolysis is oxidized to acetyl-CoA by both archaea and bacteria and used in the TCAcycle. The TCA cycle provides for example raw material for many amino acids, such aslysine and glutamate. The butanoate and propanoate metabolisms were also commonin the bacterial communities, indicating fermentative metabolism and capability of fattyacid oxidation.5
4.3 Amino acid metabolism
Non-essential amino acids, such as alanine, aspartate and glutamate are producedfrom ammonia and pyruvate or oxaloacetate especially in the archaeal populations. Inthe archaeal population proline appears to be produced from glutamate. Despite thelow use of sulphate as energy source in the microbial communities sulphate and other10
sulphur compounds are taken up for the production of the amino acids cysteine andmethionine by both the archaeal and the bacterial communities. A higher predictedrelative abundance of genes involved in aromatic amino acid synthesis (phenylala-nine, tyrosine, tryptophane) was seen in the archaeal than in the bacterial commu-nities. Both the archaeal and the bacterial communities synthesise branched chained15
amino acids (isoleucine, leucine and valine), but only the bacteria degrade them. Espe-cially proteobacteria have been shown to be able to use the branched chained aminoacids (isoleucine, leuscine and valine) and short chained fatty acids (acetate, butyrate,propionate) as sole energy and carbon source (Kazakov et al., 2009). The branchedchained amino acids function as raw material in the biosynthesis of branched chained20
fatty acids, which regulate the membrane fluidity of the bacterial cell. In salt stressconditions, the proportion of branch-chained fatty acids in the membranes decreases.
4.4 Nucleotide metabolism
The estimated number of genes for both the purine and pyrimidine metabolism wasmore than two times higher in the archaeal community than in the bacterial community.25
13836

BGD12, 13819–13857, 2015
Estimation ofmicrobial metabolism
and co-occurrencepatterns
M. Bomberg et al.
Title Page
Abstract Introduction
Conclusions References
Tables Figures
J I
J I
Back Close
Full Screen / Esc
Printer-friendly Version
Interactive Discussion
Discussion
Paper
|D
iscussionP
aper|
Discussion
Paper
|D
iscussionP
aper|
4.5 Membrane transport
According to the predicted metagenomes, the microbial cells transport sulphate intothe cell, but do not take up nitrate. Nitrogen is taken up as glutamate but not as urea.Iron is taken up by an Fe(III) transport system and an iron complex transport system inthe bacterial communities, but generally only by the iron complex transport system in5
archaea. However, Fe(III) transport system may also exist in the archaeal communitiesat 405 to 423 m depth, where also some manganese/iron transport systems could befound. Molybdate and phosphate is transported into the cell by molybdate and phos-phate ATPases, respectively. Nickel is taken up mainly by a nickel/peptide transportsystem but also to some extent by a cobalt/nickel transport system. Zink is taken up to10
some extent by a zink transport system, but transport systems for manganese, man-ganese/iron, manganese/zink/iron, or iron/zink/copper are negligent. Ammonia is takenup by an Amt transport system.
5 Conclusions
The wide diversity of microbial groups in the deep Fennoscandian groundwater at the15
Olkiluoto site revealed that the majority of the microbial community present belong toonly a few microbial taxa while the greatest part of the microbial diversity is repre-sented by low abundance and rare microbiome taxa. The core community was presentin all tested samples from different depths, but the relative abundance of the differenttaxa varied in the different samples. Specific rare microbial groups formed tight co-20
occurrence clusters that corresponded to different environmental conditions and thesemay become more abundant if the environmental conditions change. Fermentation oroxidation of fatty acids was a common carbon cycling and energy harvesting metabolicpathways in the bacterial communities whereas the archaea may either produce orconsume methane. Glycolysis/gluconeogenesis was predicted to be common in both25
the archaeal and bacterial communities. In addition both the bacterial and archaeal
13837

BGD12, 13819–13857, 2015
Estimation ofmicrobial metabolism
and co-occurrencepatterns
M. Bomberg et al.
Title Page
Abstract Introduction
Conclusions References
Tables Figures
J I
J I
Back Close
Full Screen / Esc
Printer-friendly Version
Interactive Discussion
Discussion
Paper
|D
iscussionP
aper|
Discussion
Paper
|D
iscussionP
aper|
communities were estimated to contain different common carbon fixation pathways,such as the Calvin cycle and the reductive TCA, while only the bacteria contained theWood-Ljungdahl pathway.
The Supplement related to this article is available online atdoi:10.5194/bgd-12-13819-2015-supplement.5
Acknowledgements. The Illumina sequencing data were made possible by the Deep CarbonObservatory’s Census of Deep Life supported by the Alfred P. Sloan Foundation. Illumina se-quencing was performed at the Marine Biological Laboratory (Woods Hole, MA, USA) andwe are grateful for the assistance of Mitch Sogin, Susan Huse, Joseph Vineis, Andrew Voorhis,Sharon Grim, and Hilary Morrison at MBL and Rick Colwell, OSU. MB was supported by the10
Academy of Finland (project 261220).
References
Bano, N., Ruffin, S., Ransom, B., and Hollibaugh, J. T.: Phylogenetic composition of Arcticocean archaeal assemblages and comparison with Antarctic assemblages, Appl. Environ.Microbiol., 70, 781–789, 2004.15
Barns, S. M., Fundyga, R. E., Jeffries, M. W., and Pace, N. R.: Remarkable archaeal diversitydetected in Yellowstone National Park hot spring environment, P. Natl. Acad. Sci. USA, 91,1609–1613, 1994.
Barberán, A., Bates, S. T., Casamayor, E. O., and Fierer, N.: Using network analysis to exploreco-occurrence patterns in soil microbial communities, ISME J., 6, 343–351, 2012.20
Bastian, M., Heymann, S., and Jacomy, M. Gephi: an open source software for exploring andmanipulating networks, ICWSM, 8, 361–362, 2009.
Berg, I. A., Kockelkorn, D., Ramos-Vera, W. H., Say, R. F., Zarzycki, J., Hügler, M., Alber, B. E.,and Fuchs, G.: Autotrophic carbon fixation in archaea, Nat. Rev. Microbiol., 8, 447–460,2010.25
13838

BGD12, 13819–13857, 2015
Estimation ofmicrobial metabolism
and co-occurrencepatterns
M. Bomberg et al.
Title Page
Abstract Introduction
Conclusions References
Tables Figures
J I
J I
Back Close
Full Screen / Esc
Printer-friendly Version
Interactive Discussion
Discussion
Paper
|D
iscussionP
aper|
Discussion
Paper
|D
iscussionP
aper|
Blankenberg, D., Von Kuster, G., Coraor, N., Ananda, G., Lazarus, R., Mangan, M.,Nekrutenko, A., and Taylor, J.: Galaxy: a web-based genome analysis tool for experimen-talists, Curr. Protoc. Mol. Biol., 19, 19.10.1-21, doi:10.1002/0471142727.mb1910s89, 2010.
Bomberg, M., Nyyssönen, M., Nousiainen, A., Hultman, J., Paulin, L., Auvinen, P., and Itä-vaara, M.: Evaluation of molecular techniques in characterization of deep terrestrial bio-5
sphere, Open J. Ecol., 4, 468–487, 2014.Bomberg, M., Nyyssönen, M., Pitkänen, P., Lehtinen, A., and Itävaara, M.: Active microbial
communities inhabit sulphate-methane interphase in deep bedrock fracture fluids in Olkilu-oto, Finland, Biomed. Res. Int., 2015, 979530, in press, 2015.
Caporaso, J. G., Kuczynski, J., Stombaugh, J., Bittinger, K., Bushman, F. D., Costello, E. K.,10
Fierer, N., Gonzalez Pena, A., Goodrich, J. K., Gordon, J. I., Huttley, G. A., Kelley, S. T.,Knights, D., Koenig, J. E., Ley, R. E., Lozupone, C. A., McDonald, D., Muegge, B. D., Pir-rung, M., Reeder, J., Sevinsky, J. R., Turnbaugh, P. J., Walters, W. A., Widmann, J., Yat-sunenko, T., Zaneveld, J., and Knight, R.: QIIME allows analysis of high-throughput commu-nity sequencing data, Nat. Methods, 7, 335–336, 2010.15
Cleary, D. F., Becking, L. E., Polónia, A. R., Freitas, R. M., and Gomes, N. C.: Compositionand predicted functional ecology of mussel-associated bacteria in Indonesian marine lakes,Anton. Leeuw. Int. J. G., 107, 821–834, 2015.
DeSantis, T. Z., Hugenholtz, P., Larsen, N., Rojas, M., Brodie, E. L., Keller, K., Huber, T.,Dalevi, D., Hu, P., and Andersen, G. L.: Greengenes, a chimera-checked 16S rRNA gene20
database and workbench compatible with ARB, Appl. Environ. Microb., 72, 5069–5072,2006.
Fuchs, G.: Alternative pathways of autotrophic CO2 fixation, in: Autotrophic Bacteria, edited by:Schlegel, H. G. and Bowien, B., Springer, Berlin, 365–382, 1989.
Giardine, B., Riemer, C., Hardison, R. C., Burhans, R., Elnitski, L., Shah, P., Zhang, Y., Blanken-25
berg, D., Albert, I., Taylor, J., Miller, W., Kent, W. J., and Nekrutenko, A.: Galaxy: a platformfor interactive large-scale genome analysis, Genome Res., 15, 1451–1455, 2005.
Goecks, J., Nekrutenko, A., Taylor, J., and the Galaxy Team: Galaxy: a comprehensive ap-proach for supporting accessible, reproducible, and transparent computational research inthe life sciences, Genome Biol., 11, R86, doi:10.1186/gb-2010-11-8-r86, 2010.30
Hallbeck, L. and Pedersen, K.: Culture-dependent comparison of microbial diversity in deepgranitic groundwater from two sites considered for a Swedish final repository of spent nuclearfuel, FEMS Microbiol. Ecol., 81, 66–77, 2012.
13839

BGD12, 13819–13857, 2015
Estimation ofmicrobial metabolism
and co-occurrencepatterns
M. Bomberg et al.
Title Page
Abstract Introduction
Conclusions References
Tables Figures
J I
J I
Back Close
Full Screen / Esc
Printer-friendly Version
Interactive Discussion
Discussion
Paper
|D
iscussionP
aper|
Discussion
Paper
|D
iscussionP
aper|
Hammer, Ø., Harper, D. A. T., and Ryan, P. D.: PAST: paleontological statistics softwarepackage for education and data analysis, Palaeontol. Electron., 4, 1–31, available at: http://palaeo-electronica.org/2001_1/past/issue1_01.htm (last access: 22 August 2015), 2001.
Haroon, M. F., Hu, S., Shi, Y., Imelfort, M., Keller, J., Hugenholtz, P., Yuan, Z., and Tyson, G. W.:Anaerobic oxidation of methane coupled to nitrate reduction in a novel archaeal lineage,5
Nature, 500, 567–570, 2013.Hoehler, T. M. and Jørgensen, B. B.: Microbial life under extreme energy limitation, Nat. Rev.
Microbiol., 11, 83–94, 2013.Hügler, M. and Sievert, S. M.: Beyond the Calvin cycle: autotrophic carbon fixation in the ocean,
Mar. Sci., 3, 261–289, doi:10.1146/annurev-marine-120709-142712, 2011.10
Kärki, A. and Paulamäki, S.: Petrology of Olkiluoto, Posiva, Olkiluoto, 2006-02, 2006.Kazakov, A. E., Rodionov, D. A., Alm, E., Arkin, A. P., Dubchak, I., and Gelfand, M. S.: Com-
parative genomics of regulation of fatty acid and branched-chain amino acid utilization inproteobacteria, J. Bacteriol., 191, 52–64, 2009.
Kutvonen, H.: Nitrogen-cycling bacteria in groundwater of the low and medium active nuclear15
waste repository in Olkiluoto, Finland, M.Sc. Thesis, Faculty of Agriculture and Forestry, Uni-versity of Helsinki, Finland, 2015 (in Finnish).
Langille, M. G. I., Zaneveld, J., Caporaso, J. G., McDonald, D., Knights, D., Reyes, J. A.,Clemente, J. C., Burkepile, D. E., Vega Thurder, R. L., Knight, R., Beiko, R. G., and Hutten-hower, C.: Predictive functional profiling of microbial communities using 16S rRNA marker20
gene sequences, Nature Biotechnol., 31, 814–821, 2013.Martin, W., Baross, J., Kelley, D., and Russell, M. J.: Hydrothermal vents and the origin of life,
Nat. Rev. Microbiol., 6, 805–814, 2008.Miettinen, H., Bomberg, M., Nyyssönen, M., Salavirta, H., Sohlberg, E., Vikman, M., and Itä-
vaara, M.: The Diversity of Microbial Communities in Olkiluoto Bedrock Groundwaters 2009–25
2013. Olkiluoto, Finland, Posiva Oy, Posiva Working Report 2015-12, Olkiluoto, 1–160, 2015.Muyzer, G., de Waal, E. C., and Uitterlinden, A. G.: Profiling of complex microbial populations
by denaturing gradient gel electrophoresis analysis of polymerase chain reaction-amplifiedgenes coding for 16S rRNA, Appl. Environ. Microb., 59, 695–700, 1993.
Nyyssönen, M., Bomberg, M., Kapanen, A., Nousiainen, A., Pitkänen, P., and Itävaara, M.:30
Methanogenic and sulphate-reducing microbial communities in deep groundwater of crys-talline rock fractures in Olkiluoto, Finland, Geomicrobiol. J., 29, 863–878, 2012.
13840

BGD12, 13819–13857, 2015
Estimation ofmicrobial metabolism
and co-occurrencepatterns
M. Bomberg et al.
Title Page
Abstract Introduction
Conclusions References
Tables Figures
J I
J I
Back Close
Full Screen / Esc
Printer-friendly Version
Interactive Discussion
Discussion
Paper
|D
iscussionP
aper|
Discussion
Paper
|D
iscussionP
aper|
Nyyssönen, M., Hultman, J., Ahonen, L., Kukkonen, I. T., Paulin, L., Laine, P., Itävaara, M., andAuvinen, P.: Taxonomically and functionally diverse microbial communities in deep crystallinerocks of the Fennoscandian shield, ISME J., 8, 126–138, 2014.
Pedersen, K.: Subterranean microbial populations metabolize hydrogen and acetate under insitu conditions in granitic groundwater at 450 m depth in the Äspö Hard Rock Laboratory,5
Sweden, FEMS Microbiol. Ecol., 81, 217–229, 2012.Pedersen, K.: Metabolic activity of subterranean microbial communities in deep granitic ground-
water supplemented with methane and H2, ISME J., 7, 839–849, 2013.Pedersen, K., Arlinger, J., Eriksson, S., Hallbeck, A., Hallbeck, L., and Johansson, J.: Num-
bers, biomass and cultivable diversity of microbial populations relate to depth and borehole-10
specific conditions in groundwater from depths of 4–450 m in Olkiluoto, Finland, ISME J., 2,760–775, 2008.
Pedersen, K., Bengsson, A., Edlund, J., and Eriksson, L.: Sulphate-controlled diversity of sub-terranean microbial communities over depth in deep groundwater with opposing gradients ofsulphate and methane, Geomicrobiol. J., 31, 617–631, 2014.15
Posiva: Olkiluoto site description 2011, Posiva 2011-02, Olkiluoto, 2013.Purkamo, L., Bomberg, M., Nyyssönen, M., Kukkonen, I., Ahonen, L., Kietäväinen, R., and
Itävaara, M.: Retrieval and analysis of authentic microbial communities from packer-isolateddeep crystalline bedrock fractures: evaluation of the method and time of sampling, FEMSMicrobiol. Ecol., 85, 324–337, 2013.20
Purkamo, L., Bomberg, M., Nyyssönen, M., Kukkonen, I., Ahonen, L., and Itävaara, M.: Het-erotrophic communities supplied by ancient organic carbon predominate in deep Fennoscan-dian bedrock fluids, Microb. Ecol., 69, 319–332, 2015.
Rajala, P., Bomberg, M., Kietäväinen, R., Kukkonen, I., Ahonen, L., Nyyssönen, M., and Itä-vaara, M.: Deep subsurface microbes rapidly reactivate in the presence of C-1 compounds,25
Microorganisms, 3, 17–33, 2015.Schloss, P. D., Westcott, S. L., Ryabin, T., Hall, J. R., Hartmann, M., Hollister, E. B.,
Lesniewski, R. A., Oakley, B. B., Parks, D. H., Robinson, C. J., Sahl, J. W., Stres, B.,Thallinger, G. G., Van Horn, D. J., and Weber, C. F.: Introducing MOTHUR: open-source,platform-independent, community-supported software for describing and comparing micro-30
bial communities, Appl. Environ. Microb., 75, 7537–7541, 2009.Shade, A. and Handelsman, J.: Beyond the Venn diagram: the hunt for a core microbiome,
Environ. Microbiol., 14, 4–12, 2012.
13841

BGD12, 13819–13857, 2015
Estimation ofmicrobial metabolism
and co-occurrencepatterns
M. Bomberg et al.
Title Page
Abstract Introduction
Conclusions References
Tables Figures
J I
J I
Back Close
Full Screen / Esc
Printer-friendly Version
Interactive Discussion
Discussion
Paper
|D
iscussionP
aper|
Discussion
Paper
|D
iscussionP
aper|
Sogin, M. L., Morrison, H. G., Huber, J. A., Welch, D. M., Huse, S. M., Neal, P. R., Arrieta, J. M.,and Herndl, G. J.: Microbial diversity in the deep sea and the underexplored “rare biosphere”,P. Natl. Acad. Sci. USA, 103, 12115–12120, 2006.
Sohlberg, E., Bomberg, M., Miettinen, H., Nyyssönen, M., Salavirta, H., Vikman, M.,and Itävaara, M.: Revealing the unexplored fungal communities in deep groundwater5
of crystalline bedrock fracture zones in Olkiluoto, Finland, Front. Microbiol., 6, 573,doi:10.3389/fmicb.2015.00573, 2015.
Tsitko, I., Lusa, M., Lehto, J., Parviainen, L., Ikonen, A. T. K., Lahdenperä, A.-M., andBomberg, M.: The variation of microbial communities in a depth profile of an acidic, nutrient-poor boreal bog in southwestern Finland, Open J. Ecol., 4, 832–859, 2014.10
Weisburg, W. G., Barns, S. M., Pelletier, D. A., and Lane, D. J.: 16S ribosomal DNA amplificationfor phylogenetic study, J. Bacteriol., 173, 697–703, 1991.
13842

BGD12, 13819–13857, 2015
Estimation ofmicrobial metabolism
and co-occurrencepatterns
M. Bomberg et al.
Title Page
Abstract Introduction
Conclusions References
Tables Figures
J I
J I
Back Close
Full Screen / Esc
Printer-friendly Version
Interactive Discussion
Discussion
Paper
|D
iscussionP
aper|
Discussion
Paper
|D
iscussionP
aper|
Table 1. Geochemical and microbiological measurements from 12 different water conductivefractures in the bedrock of Olkiluoto, Finland. The different drillholes are presented at the top ofthe table. The data is compiled from Posiva (2013).
Drillhole OL-KR13 OL-KR6 OL-KR3 OL-KR23 OL-KR5 OL-KR49 OL-KR9 OL-KR9 OL-KR2 OL-KR1 OL-KR44 OL-KR29
Sampling date 3 Nov 18 May 29 Aug 15 Dec 16 Oct 14 Dec 31 Oct 29 Aug 27 Jan 26 Jan 15 Jan 18 May2010 2010 2011 2009 2012 2009 2011 2011 2010 2010 2013 2010
Depth (m) 296 328 340 347 405 415 423 510 559 572 693 798Alkalinity mEq/L 2.19 0.37 0.47 0.05 0.27 0.16 0.18 0.13 0.29 0.23 0.49 0.13Ec mS/m 897 1832 1047 2190 2240 2670 2300 2960 4110 3770 6690 7820pH 7.9 7.9 7.9 7.5 7.9 8.1 7.7 8.1 8.6 7.8 7.5 7.3NPOC mg L−1 10 0 12 5.1 19 3 5.1 6.6 11 5 110 10DIC mg L−1 27 4.1 4.1 3.9 0 3 3 0 3.75 3.75 6.5 81HCO3 mgL−1 134 22.6 25 17.1 16 9.8 11.6 7.3 17.7 14 30 424Ntot mg L−1 0.71 0 1.1 0.42 1.2 0.16 0.38 0.66 1.1 0.41 10 3.1NH+
4 mg L−1 0.07 0.03 0.03 0 0 0 0.05 0 0.02 0.04 0.08 0.08Stot mg L−1 31 130 12 1.7 1.7 0 4.8 0 0 0 4 0SO2−
4 mg L−1 79.5 379 32 2.9 3 1.4 13.7 0.9 0.5 0.5 9.6 2S−2 mg L−1 5.1 0.38 0.62 2 0.02 0.36 0 0.02 0.13 0.02 0.02Fetot mg L−1 0.0042 0.0037 0.022 0.062 0.2 0.71 0.036 0.02 0 0.49 1.2 560Fe(II) mg L−1 0 0 0.02 0.08 0.21 0.53 0.06 0.02 0.02 0.04 1.2 0.46TDS mg L−1 4994 10 670 5656 12 710 12 880 15 900 13 430 18 580 25 500 23 260 37 410 53 210K mg L−1 8.2 9.3 7.6 8.3 18 27 12 17 19 20 24 27Mg mg L−1 35 77 17 55 68 19 32 41 18 52 33 136Ca mg L−1 460 1100 290 2100 1750 2700 2260 2930 4600 3700 7680 10 000Cl mg L−1 2920 6230 3400 7930 7950 9940 8220 11 500 15 700 14 600 22 800 33 500Na mg L−1 1320 2800 1850 2530 2990 3110 2790 3970 4980 4720 6570 9150TNC mL−1 4.2×10⁵ 1.0×10⁵ 2.4×10⁵ 2.5×10⁵ 2.1×10⁵ 1.5×10⁴ na 2.9×10⁴ 5.9×10⁴ 8.7×10⁴ 5.5×10⁴ 2.3×10⁴
16S qPCRmL−1
bacteria 7.0×10⁵ 9.5×10³ 2.0×10⁴ 3.6×10⁵ 4.9×10⁴ 1.3×10⁴ 7.2×10⁴ 1.5×10⁵ 1.4×10⁵ 1.9×10⁴ 3.2×10⁴ 1.5×10⁴
archaea 5.8×10³ 2.0×10⁴ 9.9×10³ 6.3×10⁴ 6.2×10³ 1.5×10² 4.4×10⁴ 5.2×10² 7.5×10² 3.0×10³ 2.6×101 2.8×10²
13843

BGD12, 13819–13857, 2015
Estimation ofmicrobial metabolism
and co-occurrencepatterns
M. Bomberg et al.
Title Page
Abstract Introduction
Conclusions References
Tables Figures
J I
J I
Back Close
Full Screen / Esc
Printer-friendly Version
Interactive Discussion
Discussion
Paper
|D
iscussionP
aper|
Discussion
Paper
|D
iscussionP
aper|
Table 2. The total number of sequence reads, observed and estimated (Chao1, ACE) numberof OTUs, number of singleton and doubleton OTUs, and Shannon diversity index per sampleof the bacterial 16S rRNA gene data set. The analysis results are presented for both the totalnumber of sequence reads per sample as well as for data normalized according tot he samplewith the lowest number of sequence reads, i.e. 140 000 random sequences per sample.
(a)Bacteria All sequences Normalized to 140 000 sequencesSample Number of Observed Chao1 ACE Singles Doubles Shannon Observed Chao1 ACE Singles Doubles Shannon
sequence reads OTUs species
OLKR13/296 m 786 346 79 527 87 188 91 360 18 025 21 203 13 37 045 74 288 84 530 22 445 6762 13OLKR3/318 m 345 433 52 381 53 238 54 961 5789 19 557 14 39 309 57 793 64 021 19 287 10 061 13OLKR6/328 m 188 812 29 411 35 018 37 269 9209 7561 13 26 442 34 964 37 626 10 420 6369 13OLKR23/347 m 485 154 33 257 37 175 38 895 8000 8166 11 20 494 34 268 37 305 10 641 4109 11OLKR49/415 m 184 052 38 275 49 758 53 525 14 799 9535 13 34 117 48 804 52 938 15 372 8043 13OLKR9/423 m 175 295 36 412 44 452 47 571 12 357 9494 14 33 596 44 496 48 161 13 489 8345 14OLKR5/435 m 141 886 40 445 70 520 78 340 22 166 8167 14 40 145 70 288 78 232 22 086 8090 14OLKR9/510 m 241 312 41 545 51 348 54 535 14 251 10 357 13 33 208 49 115 53 631 15 592 7640 13OLKR2/559 m 257 789 45 456 72 269 78 325 22 550 9481 13 32 600 62 318 69 573 19 071 6118 12OLKR1/572 m 210 659 29 804 35 362 37 491 9197 7607 12 25 703 34 934 37 682 10 650 6142 12OLKR44/750 m 303 058 31 410 31 589 32 188 2005 11 200 12 25 937 33 448 36 295 10 346 7124 12OLKR29/798 m 221 524 37 989 45 126 48 042 11 991 10 071 13 31 911 44 957 48 533 14 078 7594 13
13844

BGD12, 13819–13857, 2015
Estimation ofmicrobial metabolism
and co-occurrencepatterns
M. Bomberg et al.
Title Page
Abstract Introduction
Conclusions References
Tables Figures
J I
J I
Back Close
Full Screen / Esc
Printer-friendly Version
Interactive Discussion
Discussion
Paper
|D
iscussionP
aper|
Discussion
Paper
|D
iscussionP
aper|
Table 2. The total number of sequence reads, observed and estimated (Chao1, ACE) numberof OTUs, number of singleton and doubleton OTUs, and Shannon diversity index per sampleof the archaeal 16S rRNA gene data set. The analysis results are presented for both the totalnumber of sequence reads per sample as well as for data normalized according tot he samplewith the lowest number of sequence reads, i.e. 17 000 random sequences per sample.
(b)Archaea All sequences Normalized to 17 000 sequencesSample Number of Observed Chao1 ACE Singles Doubles Shannon Observed Chao1 ACE Singles Doubles Shannon
sequence reads OTUs OTUs
OLKR13/296 m 507 373 27 111 29 516 30 699 5835 7076 10 3957 13 380 15 062 2867 435 10OLKR3/318 m 271 699 25 491 32 299 34 231 9205 6221 11 4955 15 044 17 238 3546 622 10OLKR6/328 m 446 380 21 597 22 930 23 781 3861 5588 10 3776 11 705 14 020 2748 475 9OLKR23/347 m 395 339 20 800 22 403 23 214 4083 5199 10 3919 11 855 13 323 2755 477 9OLKR49/415 m 210 545 22 600 23 372 24 004 2975 5733 12 7023 17 088 19 874 4738 1114 12OLKR9/423 m 697 360 22 014 22 527 23 082 2381 5520 9 3180 9,617 10 586 2224 383 9OLKR5/435 m 769 026 21 127 22 235 23 078 3515 5574 9 2596 10 114 10 078 1852 227 9OLKR9/510 m 169 142 12 709 12 782 12 960 713 3488 11 4879 11 205 13 215 3148 782 11OLKR2/559 m 100 101 15 359 24 950 27 026 7840 3203 11 5119 14 497 16 488 3548 670 11OLKR1/572 m 1 213 360 28 884 33 207 34 832 7846 7118 9 2273 9233 9923 1631 190 9OLKR44/750 m 17 716 6436 8748 9750 2890 1805 12 6325 8743 9804 2921 1763 12OLKR29/798 m 98 770 15 641 16 720 17 483 3158 4617 12 6951 14 655 17 184 4483 1303 12
13845

BGD12, 13819–13857, 2015
Estimation ofmicrobial metabolism
and co-occurrencepatterns
M. Bomberg et al.
Title Page
Abstract Introduction
Conclusions References
Tables Figures
J I
J I
Back Close
Full Screen / Esc
Printer-friendly Version
Interactive Discussion
Discussion
Paper
|D
iscussionP
aper|
Discussion
Paper
|D
iscussionP
aper|
Table 3. The bacterial taxa representing at least 1 % of the sequence reads in any of thesamples.
Phylum Group Relative abundance Occurrence at depths
Actinobacteria Actinobacteria/Other 7.6 % 693 mActinomycetales/Other 1.1 % 415 mMicrobacteriaceae/Other 1.7–7.3 % 405–798 mMicrobacterium 1.0–24.2 % 296–572 mPropionibacerium 2.4 % 340 m
Bacteroidetes Flavobacteriales/Other 2.2 % 510 mFlavobacteriaceae/Other 1.1–15.8 % 328–510, 572, 798 m
Chlorobi SM1H02 1.0 % 423 mFirmicutes Staphylococcus 1.2 % 340 m
Clostridium 3.3 % 693 mNitrospirae Thermodesulfovibrionaceae/Other 1.2 % 340 mOP9 SB-45 1.2–8.9 % 296–798 mProteobacteria Other 1.2–9.7 % 296–798 m
Caulobacteraceae/Other 1.3–6.7 % 296, 347–405, 559 mErythrobacteriaceae/Other 1.3–5.7 % 405–510 mBetaproteobacteria/Other 5.7–12.3 % 296–328, 347–572, 798 mBurkholderiales/Other 2.1 % 347 mComamonadaceae/Other 2.0–14.5 % 296–798 mHydrogenophaga 1.2–1.3 % 340, 423 mThiobacterales/Other 1.2–2.8 % 328, 415, 510 mThiobacteraceae/Other 2.7–3.0 % 415, 510 mThiobacteraceae/Unclassified 2.4–2.8 % 415, 510 mSulfuricurvum 1.4 % 296 mGammaproteobacteria/Other 3.5–16.1 % 296–798 mPseudoalteromnas 2.9–15.3 % 296–328, 347–572, 798 mEnterobacteriaceae/Other 5.0 % 693 mEscherichia 1.1 % 693 mAcinetobacter 1.9–16.3 % 340, 693 mPseudomonadaceae/Other 1.2–3.0 % 405–415, 572–693 mPseudomonas 1.2–12.8 % 347–415, 559–798 m
Spirochaetes PL-11810 2.0 % 296 m
13846

BGD12, 13819–13857, 2015
Estimation ofmicrobial metabolism
and co-occurrencepatterns
M. Bomberg et al.
Title Page
Abstract Introduction
Conclusions References
Tables Figures
J I
J I
Back Close
Full Screen / Esc
Printer-friendly Version
Interactive Discussion
Discussion
Paper
|D
iscussionP
aper|
Discussion
Paper
|D
iscussionP
aper|
Table 4. The archaeal taxa representing at least 1 % of the sequence reads in any of thesamples.
Phylum Group Relative abundance Occurrence at depths
Crenarchaeota Other 1.2–5.5 % 328–347, 415, 510, 693–798 mThaumarchaeota/Other 1.5–11.8 % 296–559, 693 m
Euryarchaeota Other 12.9–63.3 % 296–798 mMethanobacteriales/Other 1.2–3.1 % 415, 693–798 mMSBL1/Other 1.4 % 798 mSAGMEG-1 1.4–6.7 % 415, 693–798 mMethanobacteriaceae/Other 2.4 % 510 mMethanobacteiaceae/Unclassified 7.6 % 510 mMethanobacterium 3.6 % 340 mMethanomicrobia/Other 1.4–5.1 % 296–328, 347–559, 693–798 mMethanosarcinales/Other 2.3–13.3 % 296–693 mANME-2D 4.9–56.1 % 296–798 mE2/Other 1.9–21.2 % 296–798 mMarine group II/Other 1.5–3.3 % 510–559 mMarine group II/Unclassified 1.6 % 347 m
13847

BGD12, 13819–13857, 2015
Estimation ofmicrobial metabolism
and co-occurrencepatterns
M. Bomberg et al.
Title Page
Abstract Introduction
Conclusions References
Tables Figures
J I
J I
Back Close
Full Screen / Esc
Printer-friendly Version
Interactive Discussion
Discussion
Paper
|D
iscussionP
aper|
Discussion
Paper
|D
iscussionP
aper|
Table 5. Bacterial and archaeal taxa identified to genus level, if possible, showing positive andsignificant Pearson correlation (r > 0.7, p < 0.01) to depth, alkalinity, bicarbonate concentration,pH and conductivity. Taxa presented in bold text showed highest significance (p < 0.005), taxapresented in italic text showed high correlation (r > 0.7) and p = 0.01. O indicates “Other” andUC indicates “Unclassified” according to Greengenes taxonomy.
(a)BacteriaDepth Alkalinity Bicarbonate pH Conductivity
Sphingomonadaceae, O Mycobacterium C. Rhodoluna Holophagales, O Acidobacteria_iii1-15, OAlcaligenaceae, O Zhouia CL0-1 Sva0725 Chitinophagaceae, UCVariovorax WCHB1-03 Cryomorphaceae, O Parascardovia Alcaligenaceae, O
Caldithrixales, O Fluviicola MicrobacteriumRoseiflexales Mesonia EmticiciaS085 Sejongia LentisphaeraceaeSL56 Chitinophagaceae, UC GOUTA19Sporosarcina Arcicella OM27Fusobacteria, UC NC10_wb1-A12 AcidithiobacillusGemm-2 Kordiimonadaceae LD19Lentisphaeria, O VariovoraxFW_4-29 PolynucleobacterPedomicrobium MethylobacillusRhodospirillaceae, UC IndB3-24Zymomonas HaliangiumAEGEAN_112 RickettsiellaPseudoalteromonadaceae, O Ulr1583Halothiobacillus EC214ThioalkalimicrobiumSGSH944ZA3648c, OOpitutaceaeChthoniobacterales, OSediment-1
ArchaeaDepth Alkalinity Bicarbonate pH Conductivity
Archaea, Other E2, O Archaea, Othe Halobacteriaceae, O Archaea, OtheMCG_pGrfC26 E2, UC Crenarchaeota, O Ferroplasma MCG_pGrfC26Methanobacteriales, O Crenarchaeota, UC Methanobacteriales, OMSBL1, O MBGA, O MSBL1, OSAGMEG-1 MBGB SAGMEG-1F99a103 MCG, UC F99a103Methanocellaceae, O MCG_pGrfC26 Methanocellaceae, O
MSBL1, OSAGMEG-1F99a103Micrarchaeales
13848

BGD12, 13819–13857, 2015
Estimation ofmicrobial metabolism
and co-occurrencepatterns
M. Bomberg et al.
Title Page
Abstract Introduction
Conclusions References
Tables Figures
J I
J I
Back Close
Full Screen / Esc
Printer-friendly Version
Interactive Discussion
Discussion
Paper
|D
iscussionP
aper|
Discussion
Paper
|D
iscussionP
aper|
Table 5. Bacterial and archaeal taxa identified to genus level, if possible, showing positiveand significant Pearson correlation (r > 0.7, p < 0.01) to concentrations of dissolved organiccarbon (DIC), non-purgeable organic carbon (NPOC), total nitrogen (N) and ammonium. Taxapresented in bold text showed highest significance (p < 0.005), taxa presented in italic textshowed high correlation (r > 0.7) and p = 0.01. O indicates “Other” and UC indicates “Unclas-sified” according to Greengenes taxonomy.
(b)BacteriaDIC NPOC N Ammonium
C. Rhodoluna Actinobacteria, O Actinobacteria, O MVS-40CL0-1 Arsenicicoccus Arsenicicoccus WilliamsiaCryomorphaceae, O Sanguibacter Sanguibacter SalinimicrobiumFluviicola Chitinophagaceae, O Chitinophagaceae, O Elusimicrobia, OMesonia Pedobacter Pedobacter Clostridiales, OSejongia VC38 VC38 Erysipelotrichaceae, OChitinophagaceae, UC Clostridia, O Clostridia, O AEGEAN_112Arcicella Clostridiaceae, O Clostridiaceae, O PolaromonasNC10_wb1-A12 Clostridium Clostridium GeobacterKordiimonadaceae OD1, O OD1, O Sediment-1Variovorax OD1_ZB2 OD1_ZB2Polynucleobacter Brevundimonas BrevundimonasMethylobacillus Phenylobacterium PhenylobacteriumIndB3-24 Rhodoplanes RhodoplanesHaliangium Achromobacter Sphingomonadaceae, ONB1-j Hydrogenophilales, O Alcaligenaceae, ORickettsiella Hydrogenophilaceae, O AchromobacterUlr1583 Thiobacillus Hydrogenophilaceae, OEC214 Desulfobulbaceae, UC Thiobacillus
Azorhizophilus MethylobacillusSpirochaetes, O Enterobacteriaceae, OSpirochaetes, O EscherichiaSphaerochaetales, O SalmonellaSphaerochaetaceae, O AzorhizophilusSphaerochaetaceae, UC Spirochaetes, OMollicutes, O Spirochaetes, OAcholeplasmataceae Sphaerochaetales, O
Sphaerochaetaceae, OSphaerochaetaceae, UCMollicutes, OAcholeplasmataceae
ArchaeaDIC NPOC N Ammonium
Archaea, Othe MCG_B10 MCG_B10 Crenarchaeota, UCCrenarchaeota, O DSEG_104A5 DSEG_104A5 DHVEG-1Crenarchaeota, UC pMC1A4 Methanobacteriales, OMBGA, O Methanocellaceae, O pMC1A4MBGB Methanocellaceae, UC Methanocellaceae, OMCG, UC Methanomicrobiales, O Methanocellaceae, UCMCG_pGrfC26 Methanoregulaceae, O Methanomicrobiales, OMSBL1, O Methanoregula Methanoregulaceae, OSAGMEG-1 YLA114 MethanoregulaF99a103 YLA114Micrarchaeales
13849

BGD12, 13819–13857, 2015
Estimation ofmicrobial metabolism
and co-occurrencepatterns
M. Bomberg et al.
Title Page
Abstract Introduction
Conclusions References
Tables Figures
J I
J I
Back Close
Full Screen / Esc
Printer-friendly Version
Interactive Discussion
Discussion
Paper
|D
iscussionP
aper|
Discussion
Paper
|D
iscussionP
aper|
Table 6. Bacterial and archaeal taxa identified to genus level, if possible, showing positiveand significant Pearson correlation (r > 0.7, p < 0.01) to concentration of total dissolved solids(TDS), calcium, chloride, sodium and magnesium. Taxa presented in bold text showed highestsignificance (p < 0.005), taxa presented in italic text showed high correlation (r > 0.7) and p =0.01. O indicates “Other” and UC indicates “Unclassified” according to Greengenes taxonomy.
BacteriaTDS Calcium Chloride Sodium Magnesium
C. Rhodoluna CL0-1 C. Rhodoluna CL0-1 C. RhodolunaCL0-1 Mesonia CL0-1 Mesonia CL0-1Mesonia Sejongia Mesonia Sejongia MesoniaSejongia Chitinophagaceae, UC Sejongia Chitinophagaceae, UC SejongiaChitinophagaceae, UC Alcaligenaceae, O Chitinophagaceae, UC Alcaligenaceae, O Chitinophagaceae, UCArcicella Kordiimonadaceae Arcicella Arcicella ArcicellaKordiimonadaceae Comamonadaceae, O Kordiimonadaceae Kordiimonadaceae KordiimonadaceaeAlcaligenaceae, O IndB3-24 Alcaligenaceae, O Variovorax NautellaVariovorax NB1-j Comamonadaceae, O IndB3-24 VariovoraxPolynucleobacter Rickettsiella Variovorax NB1-j PolynucleobacterIndB3-24 EC214 Polynucleobacter Rickettsiella IndB3-24NB1-j IndB3-24 EC214 NB1-jRickettsiella NB1-j RickettsiellaEC214 Rickettsiella EC214
EC214
Archaea
TDS Calcium Chloride Sodium MagnesiumArchaea, Othe Archaea, Othe Archaea, Othe Archaea, Othe MCG_pGrfC26MBGB MBGB MBGB MCG, UC F99a103MCG, UC MCG, UC MCG, UC MCG_pGrfC26 MicrarchaealesMCG_pGrfC26 MCG_pGrfC26 MCG_pGrfC26 Methanobacteriales, OMethanobacteriales, O Methanobacteriales, O Methanobacteriales, O MSBL1, OMSBL1, O MSBL1, O MSBL1, O SAGMEG-1SAGMEG-1 SAGMEG-1 SAGMEG-1 F99a103F99a103 F99a103 F99a103 Methanocellaceae, OMethanocellaceae, O Methanocellaceae, O Methanocellaceae, O MicrarchaealesMicrarchaeales Micrarchaeales Micrarchaeales
13850
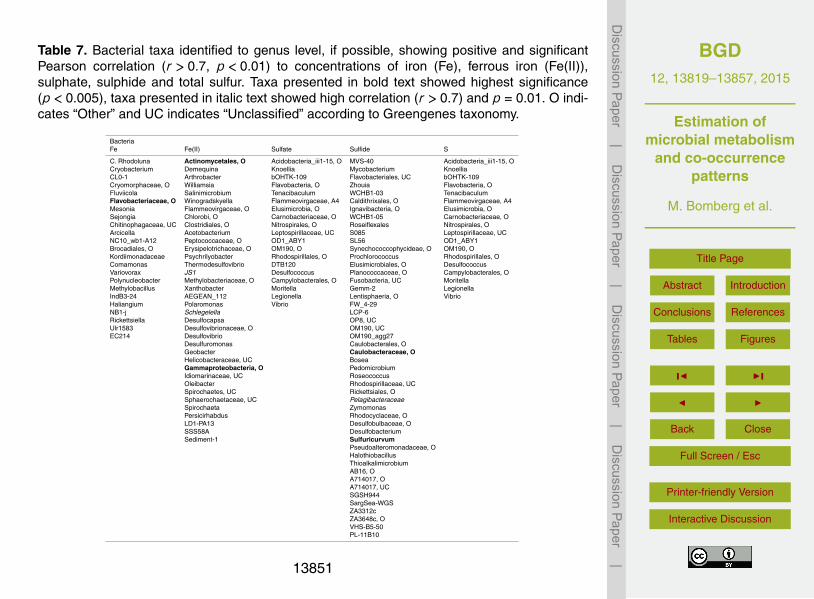
BGD12, 13819–13857, 2015
Estimation ofmicrobial metabolism
and co-occurrencepatterns
M. Bomberg et al.
Title Page
Abstract Introduction
Conclusions References
Tables Figures
J I
J I
Back Close
Full Screen / Esc
Printer-friendly Version
Interactive Discussion
Discussion
Paper
|D
iscussionP
aper|
Discussion
Paper
|D
iscussionP
aper|
Table 7. Bacterial taxa identified to genus level, if possible, showing positive and significantPearson correlation (r > 0.7, p < 0.01) to concentrations of iron (Fe), ferrous iron (Fe(II)),sulphate, sulphide and total sulfur. Taxa presented in bold text showed highest significance(p < 0.005), taxa presented in italic text showed high correlation (r > 0.7) and p = 0.01. O indi-cates “Other” and UC indicates “Unclassified” according to Greengenes taxonomy.
BacteriaFe Fe(II) Sulfate Sulfide S
C. Rhodoluna Actinomycetales, O Acidobacteria_iii1-15, O MVS-40 Acidobacteria_iii1-15, OCryobacterium Demequina Knoellia Mycobacterium KnoelliaCL0-1 Arthrobacter bOHTK-109 Flavobacteriales, UC bOHTK-109Cryomorphaceae, O Williamsia Flavobacteria, O Zhouia Flavobacteria, OFluviicola Salinimicrobium Tenacibaculum WCHB1-03 TenacibaculumFlavobacteriaceae, O Winogradskyella Flammeovirgaceae, A4 Caldithrixales, O Flammeovirgaceae, A4Mesonia Flammeovirgaceae, O Elusimicrobia, O Ignavibacteria, O Elusimicrobia, OSejongia Chlorobi, O Carnobacteriaceae, O WCHB1-05 Carnobacteriaceae, OChitinophagaceae, UC Clostridiales, O Nitrospirales, O Roseiflexales Nitrospirales, OArcicella Acetobacterium Leptospirillaceae, UC S085 Leptospirillaceae, UCNC10_wb1-A12 Peptococcaceae, O OD1_ABY1 SL56 OD1_ABY1Brocadiales, O Erysipelotrichaceae, O OM190, O Synechococcophycideae, O OM190, OKordiimonadaceae Psychrilyobacter Rhodospirillales, O Prochlorococcus Rhodospirillales, OComamonas Thermodesulfovibrio DTB120 Elusimicrobiales, O DesulfococcusVariovorax JS1 Desulfococcus Planococcaceae, O Campylobacterales, OPolynucleobacter Methylobacteriaceae, O Campylobacterales, O Fusobacteria, UC MoritellaMethylobacillus Xanthobacter Moritella Gemm-2 LegionellaIndB3-24 AEGEAN_112 Legionella Lentisphaeria, O VibrioHaliangium Polaromonas Vibrio FW_4-29NB1-j Schlegelella LCP-6Rickettsiella Desulfocapsa OP8, UCUlr1583 Desulfovibrionaceae, O OM190, UCEC214 Desulfovibrio OM190_agg27
Desulfuromonas Caulobacterales, OGeobacter Caulobacteraceae, OHelicobacteraceae, UC BoseaGammaproteobacteria, O PedomicrobiumIdiomarinaceae, UC RoseococcusOleibacter Rhodospirillaceae, UCSpirochaetes, UC Rickettsiales, OSphaerochaetaceae, UC PelagibacteraceaeSpirochaeta ZymomonasPersicirhabdus Rhodocyclaceae, OLD1-PA13 Desulfobulbaceae, OSSS58A DesulfobacteriumSediment-1 Sulfuricurvum
Pseudoalteromonadaceae, OHalothiobacillusThioalkalimicrobiumAB16, OA714017, OA714017, UCSGSH944SargSea-WGSZA3312cZA3648c, OVHS-B5-50PL-11B10
13851

BGD12, 13819–13857, 2015
Estimation ofmicrobial metabolism
and co-occurrencepatterns
M. Bomberg et al.
Title Page
Abstract Introduction
Conclusions References
Tables Figures
J I
J I
Back Close
Full Screen / Esc
Printer-friendly Version
Interactive Discussion
Discussion
Paper
|D
iscussionP
aper|
Discussion
Paper
|D
iscussionP
aper|
Table 8. Archaeal taxa identified to genus level, if possible, showing positive and significantPearson correlation (r > 0.7, p < 0.01) to concentrations of iron (Fe), ferrous iron (Fe(II)),sulphate, sulphide and total sulfur. Taxa presented in bold text showed highest significance(p < 0.005), taxa presented in italic text showed high correlation (r > 0.7) and p = 0.01. O indi-cates “Other” and UC indicates “Unclassified” according to Greengenes taxonomy.
ArchaeaFe Fe(II) Sulfate Sulfide S
Archaea, Other Crenarchaeota, UC Euryarchaeota, UC Euryarchaeota, UCCrenarchaeota, O AK31 ANME-1 ANME-1MBGA, O Cenarchaeales D-C06 D-C06MBGB Euryarchaeota, UC ANME-2a-2b ANME-2a-2bMCG, UC Halalkalicoccus ANME-2c ANME-2cMCG_pGrfC26 MSBL1, UCHalococcus RCIIMSBL1, O E2, OSAGMEG-1 CCA47F99a103 DHVEG-1Micrarchaeales WCHD3-02
Picrophiliaceae, OThermogymnomonas
13852

BGD12, 13819–13857, 2015
Estimation ofmicrobial metabolism
and co-occurrencepatterns
M. Bomberg et al.
Title Page
Abstract Introduction
Conclusions References
Tables Figures
J I
J I
Back Close
Full Screen / Esc
Printer-friendly Version
Interactive Discussion
Discussion
Paper
|D
iscussionP
aper|
Discussion
Paper
|D
iscussionP
aper|
Table 9. The relative abundance of predicted genes of the most abundant pathways identifiedin the bacterial (a) and the archaeal (b) populations in the PICRUSt analysis. The pathwaysare according to KEGG. The bar in each cell visualizes the relative abundance and the numberin each cell indicates the relative abundance of predicted genes belonging to each pathwayin each sample. The NSTI number indicates the distance to the nearest sequenced taxon towhich the obtained bacterial 16S rRNA gene sequences have been compared.
13853

BGD12, 13819–13857, 2015
Estimation ofmicrobial metabolism
and co-occurrencepatterns
M. Bomberg et al.
Title Page
Abstract Introduction
Conclusions References
Tables Figures
J I
J I
Back Close
Full Screen / Esc
Printer-friendly Version
Interactive Discussion
Discussion
Paper
|D
iscussionP
aper|
Discussion
Paper
|D
iscussionP
aper|
Figure 1. The concentration of (a) microbial cells mL−1 determined by epifluorescence mi-croscopy and the estimated concentration of (b) bacterial and (c) archaeal 16S rRNA genecopies mL−1 groundwater determined by qPCR in water conductive fractures situated at differ-ent depths in the Olkiluoto bedrock.
13854

BGD12, 13819–13857, 2015
Estimation ofmicrobial metabolism
and co-occurrencepatterns
M. Bomberg et al.
Title Page
Abstract Introduction
Conclusions References
Tables Figures
J I
J I
Back Close
Full Screen / Esc
Printer-friendly Version
Interactive Discussion
Discussion
Paper
|D
iscussionP
aper|
Discussion
Paper
|D
iscussionP
aper|
Figure 2. The rarefaction curves of observed bacterial (left pane) and archaeal (right pane)OTUs in each sample generated on sequence data normalized to 140 000 reads for bacteriaand 17 000 reads for archaea.
13855

BGD12, 13819–13857, 2015
Estimation ofmicrobial metabolism
and co-occurrencepatterns
M. Bomberg et al.
Title Page
Abstract Introduction
Conclusions References
Tables Figures
J I
J I
Back Close
Full Screen / Esc
Printer-friendly Version
Interactive Discussion
Discussion
Paper
|D
iscussionP
aper|
Discussion
Paper
|D
iscussionP
aper|
Figure 3. A canonical correspondence plot showing the distribution of the different samplesaccording to the relative abundance of bacterial and archaeal taxa in relation to geochemicalparameters. The triplot (green) indicates directionality of the environmental variables.
13856

BGD12, 13819–13857, 2015
Estimation ofmicrobial metabolism
and co-occurrencepatterns
M. Bomberg et al.
Title Page
Abstract Introduction
Conclusions References
Tables Figures
J I
J I
Back Close
Full Screen / Esc
Printer-friendly Version
Interactive Discussion
Discussion
Paper
|D
iscussionP
aper|
Discussion
Paper
|D
iscussionP
aper|
Figure 4. Network of co-occurring rare microbial taxa based on significant correlation (R > 0.7,p < 0.001) between different taxa. Each circle (node) represents a taxon and the size of thenode is proportional to the number of connections of the node. The different clusters of microbialtaxa, i.e. communities’ (1–7) are shown in different colour. Geochemical parameters to whichthe community members showed strong correlation are indicated in the figure.
13857