Thermodynamics of microbial growth and metabolism
17
Journal of Biotechnology 121 (2006) 517–533 Thermodynamics of microbial growth and metabolism: An analysis of the current situation Urs von Stockar a,∗ , Thomas Maskow b , Jingsong Liu c , Ian W. Marison a , Rodrigo Pati˜ no d a Laboratory of Chemical and Biochemical Engineering, Ecole Polytechnique F´ ed´ erale de Lausanne (EPFL), CH-1015 Lausanne, Switzerland b Department of Environmental Microbiology, UFZ Centre for Environmental Research, Leipzig-Halle GmbH, Permoserstrasse 15, D-04318 Leipzig, Germany c DSM Pharmaceuticals, R&D-Steriles, P.O. Box 1887, Greenville, NC 27835-1887, USA d Cinvestav Unidad M´ erida, Departamento de Fisica Aplicada, AP 73, Cordemex, C.P. 97310 M´ erida, Yucatan, Mexico Received 14 February 2005; received in revised form 29 July 2005; accepted 4 August 2005 Abstract This paper attempts to review in how far thermodynamic analysis can be used to understand and predict the performance of microorganisms with respect to growth and bioproduct synthesis. In the first part, a simple thermodynamic model of microbial growth is developed which explains the relationship between the driving force for growth in terms of Gibbs energy dissipation and biomass yield. From the currently available literature, it appears that the Gibbs energy dissipation per C-mol of biomass grown, which represents the driving force for chemotrophic growth, may have been adapted by evolutionary processes to strike a reasonable compromise between metabolic rate and growth efficiency. Based on empirical correlations of the C-molar Gibbs energy dissipation, the wide variety of biomass yields observed in nature can be explained and roughly predicted. This type of analysis may be highly useful in environmental applications, where such wide variations occur. It is however not able to predict biomass yields in very complex systems such as mammalian cells nor is it able to predict or to assess bioproduct or recombinant protein yields. For this purpose, a much more sophisticated treatment that accounts for individual metabolic pathways separately is required. Based on glycolysis as a test example, it is shown in the last part that simple thermodynamic analysis leads to erroneous conclusions even in well-known, simple cases. Potential sources for errors have been analyzed and can be used to identify the most important needs for future research. © 2005 Elsevier B.V. All rights reserved. Keywords: Thermodynamics; Microbial growth; Metabolism ∗ Corresponding author. Tel.: +41 21 693 31 91; fax: +41 21 693 36 80. E-mail address: [email protected] (U. von Stockar). 0168-1656/$ – see front matter © 2005 Elsevier B.V. All rights reserved. doi:10.1016/j.jbiotec.2005.08.012
Transcript of Thermodynamics of microbial growth and metabolism

Journal of Biotechnology 121 (2006) 517–533
Thermodynamics of microbial growth and metabolism:An analysis of the current situation
Urs von Stockara,∗, Thomas Maskowb, Jingsong Liuc,Ian W. Marisona, Rodrigo Patinod
a Laboratory of Chemical and Biochemical Engineering, Ecole Polytechnique Federale deLausanne (EPFL), CH-1015 Lausanne, Switzerland
b Department of Environmental Microbiology, UFZ Centre for Environmental Research, Leipzig-Halle GmbH,Permoserstrasse 15, D-04318 Leipzig, Germany
c DSM Pharmaceuticals, R&D-Steriles, P.O. Box 1887, Greenville, NC 27835-1887, USAd Cinvestav Unidad Merida, Departamento de Fisica Aplicada, AP 73, Cordemex, C.P. 97310 Merida, Yucatan, Mexico
Received 14 February 2005; received in revised form 29 July 2005; accepted 4 August 2005
Abstract
This paper attempts to review in how far thermodynamic analysis can be used to understand and predict the performance ofmicroorganisms with respect to growth and bioproduct synthesis. In the first part, a simple thermodynamic model of microbial
ipationiomassto strike
ar Gibbss type ofpredict
ombinantparatelyleads toe used to
growth is developed which explains the relationship between the driving force for growth in terms of Gibbs energy dissand biomass yield. From the currently available literature, it appears that the Gibbs energy dissipation per C-mol of bgrown, which represents the driving force for chemotrophic growth, may have been adapted by evolutionary processesa reasonable compromise between metabolic rate and growth efficiency. Based on empirical correlations of the C-molenergy dissipation, the wide variety of biomass yields observed in nature can be explained and roughly predicted. Thianalysis may be highly useful in environmental applications, where such wide variations occur. It is however not able tobiomass yields in very complex systems such as mammalian cells nor is it able to predict or to assess bioproduct or recprotein yields. For this purpose, a much more sophisticated treatment that accounts for individual metabolic pathways seis required. Based on glycolysis as a test example, it is shown in the last part that simple thermodynamic analysiserroneous conclusions even in well-known, simple cases. Potential sources for errors have been analyzed and can bidentify the most important needs for future research.© 2005 Elsevier B.V. All rights reserved.
Keywords: Thermodynamics; Microbial growth; Metabolism
∗ Corresponding author. Tel.: +41 21 693 31 91; fax: +41 21 693 36 80.E-mail address: [email protected] (U. von Stockar).
0168-1656/$ – see front matter © 2005 Elsevier B.V. All rights reserved.doi:10.1016/j.jbiotec.2005.08.012
518 U. von Stockar et al. / Journal of Biotechnology 121 (2006) 517–533
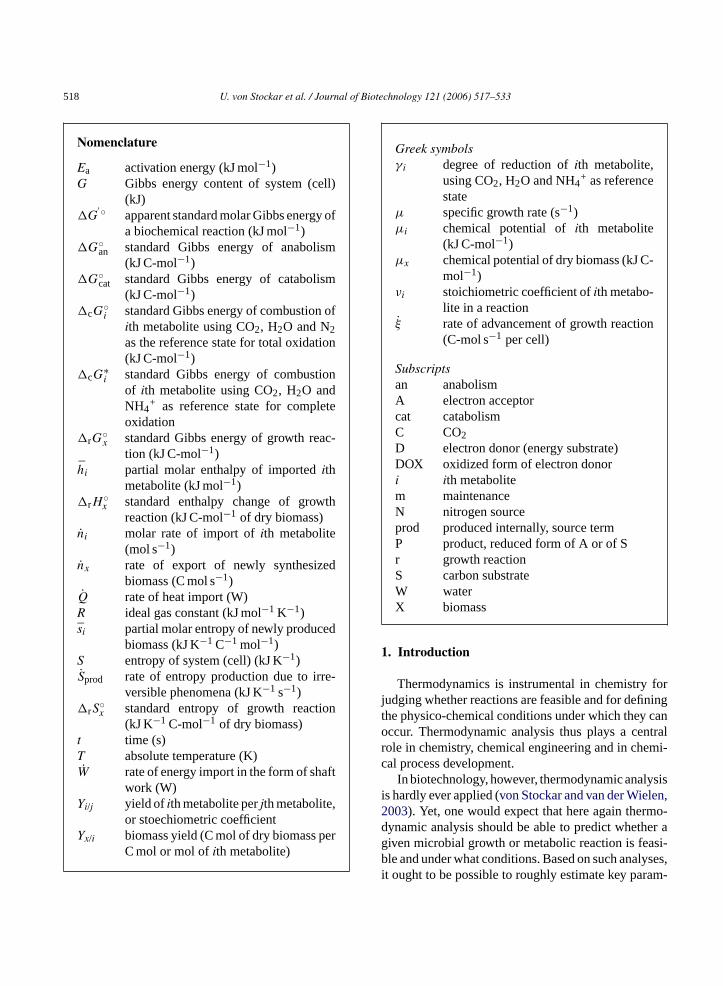
Nomenclature
Ea activation energy (kJ mol−1)G Gibbs energy content of system (cell)
(kJ)�G
′ ◦ apparent standard molar Gibbs energy ofa biochemical reaction (kJ mol−1)
�G◦an standard Gibbs energy of anabolism
(kJ C-mol−1)�G◦
cat standard Gibbs energy of catabolism(kJ C-mol−1)
�cG◦i standard Gibbs energy of combustion of
ith metabolite using CO2, H2O and N2as the reference state for total oxidation(kJ C-mol−1)
�cG∗i standard Gibbs energy of combustion
of ith metabolite using CO2, H2O andNH4
+ as reference state for completeoxidation
�rG◦x standard Gibbs energy of growth reac-
tion (kJ C-mol−1)hi partial molar enthalpy of importedith
metabolite (kJ mol−1)�rH
◦x standard enthalpy change of growth
reaction (kJ C-mol−1 of dry biomass)ni molar rate of import ofith metabolite
(mol s−1)nx rate of export of newly synthesized
biomass (C mol s−1)Q rate of heat import (W)R ideal gas constant (kJ mol−1 K−1)si partial molar entropy of newly produced
biomass (kJ K−1 C−1 mol−1)S entropy of system (cell) (kJ K−1)Sprod rate of entropy production due to irre-
versible phenomena (kJ K−1 s−1)�rS
◦x standard entropy of growth reaction
(kJ K−1 C-mol−1 of dry biomass)t time (s)T absolute temperature (K)W rate of energy import in the form of shaft
work (W)Yi/j yield of ith metabolite perjth metabolite,
or stoechiometric coefficientYx/i biomass yield (C mol of dry biomass per
C mol or mol ofith metabolite)
Greek symbolsγ i degree of reduction ofith metabolite,
using CO2, H2O and NH4+ as reference
stateµ specific growth rate (s−1)µi chemical potential ofith metabolite
(kJ C-mol−1)µx chemical potential of dry biomass (kJ C-
mol−1)νi stoichiometric coefficient ofith metabo-
lite in a reactionξ rate of advancement of growth reaction
(C-mol s−1 per cell)
Subscriptsan anabolismA electron acceptorcat catabolismC CO2D electron donor (energy substrate)DOX oxidized form of electron donori ith metabolitem maintenanceN nitrogen sourceprod produced internally, source termP product, reduced form of A or of Sr growth reactionS carbon substrateW waterX biomass
1. Introduction
Thermodynamics is instrumental in chemistry forjudging whether reactions are feasible and for definingthe physico-chemical conditions under which they canoccur. Thermodynamic analysis thus plays a centralrole in chemistry, chemical engineering and in chemi-cal process development.
In biotechnology, however, thermodynamic analysisis hardly ever applied (von Stockar and van der Wielen,2003). Yet, one would expect that here again thermo-dynamic analysis should be able to predict whether agiven microbial growth or metabolic reaction is feasi-ble and under what conditions. Based on such analyses,it ought to be possible to roughly estimate key param-

U. von Stockar et al. / Journal of Biotechnology 121 (2006) 517–533 519
eters of biotechnological cultures and thus to addressthe economic viability of the process before even per-forming experiments. Once the first measurements arecarried out, the thermodynamic predictions could beused as benchmarks, in the sense that experimentalresults staying far behind the calculations might indi-cate that there is ample room for improvement. All ofthis would be of invaluable help in bioprocess develop-ment, which usually is carried out under intense timepressure.
This contribution, which is based on a lecture givenby the first author at Bioperspectives in Wiesbaden(von Stockar et al., 2004), attempts to review the ther-modynamics of microbial growth and metabolism andto explore in how far it can be put to practical use inthe sense just described. The prediction of the biomassyield is used as the main application example. Indeed,the biomass yield constitutes one of the key parametersin any biotechnological process or experiment involv-ing microbial cultures, since it determines the finalbiomass or cell concentration, which must imperativelybe optimized in order to obtain reasonable productiv-ities. Yet, biomass yields vary by about two ordersof magnitude from one microbial growth system toanother (Heijnen and van Dijken, 1992). This reviewattempts to demonstrate that these variations may beunderstood in the light of thermodynamic analysis andthat they may roughly be predicted. Thermodynamicpredictions of other important parameters such as spe-cific growth rate will also briefly be surveyed. Thep thert ldb turnt gi-n
2
riv-i er.W rcefi
bvi-o ere-f Inr dic-t in a
Fig. 1. Entropy balance for a growing cell.Sprod represents the fluxof entropy generated inside the cell due to irreversible processes.
highly organized form from a set of very simple smallmolecules. One intuitively gets the impression thatmicrobial growth decreases the entropy rather than pro-ducing it.
This contradiction may be resolved by contemplat-ing an open-system entropy balance for the growingmicrobial cell (Fig. 1):
dS
dt= Q
T+
∑i
si · ni − sx · nx + Sprod (1)
According to this balance, the variation of entropy inthe cell with time is given by the sum of all entropyfluxes exchanged with the environment plus the rateat which entropy is produced by irreversible processes(Sprod). Entropy may be exchanged with the environ-ment due to heat transfer to or from the cell denoted byQ/T (dQrev/T represents the entropy increase in closedsystems). In open systems, entropy is also importedor exported through metabolites entering or leavingthe cell wheresi denotes the partial molar entropycarried by theith metabolite and ˙n its molar rate ofexchange, whereby positive values indicate assimila-tion rates. Newly formed biomass is treated as a productof the cell leaving it at a C-molar rate of ˙nx. Its partialmolar entropysx is clearly low due to the high degreeof organization of matter. The rate of entropy produc-tion by irreversible processesSprodcan only be positiveaccording to the Second Law of Thermodynamics andrepresents the real driving force for the process.
d pyc d byi inp malc r toa esse e
aper concludes with a short investigation of whehe feasibility of individual metabolic pathways coue thermodynamically assessed, which would
hermodynamics into a useful tool in metabolic eneering.
. Driving force for microbial growth
Biomass yields are intimately connected to the dng force for microbial growth, as will be shown lat
e therefore describe the nature of this driving forst.
Microbial growth occurs spontaneously and is ously a highly irreversible phenomenon. It must th
ore be coupled with the production of entropy.elation to growth reactions this seems contraory, because growth reactions produce matter
Due to constant entropy production at rateSprodandue to the fact that newly formed cells of low entroontent leave the cell but have been synthesizemporting high-entropy metabolites, entropy couldrinciple accumulate in the cell and lead to therell death or to structural disorganization. In ordevoid this, the cell must constantly export the excntropy, i.e. it must keep dS/dt at zero by making th
520 U. von Stockar et al. / Journal of Biotechnology 121 (2006) 517–533
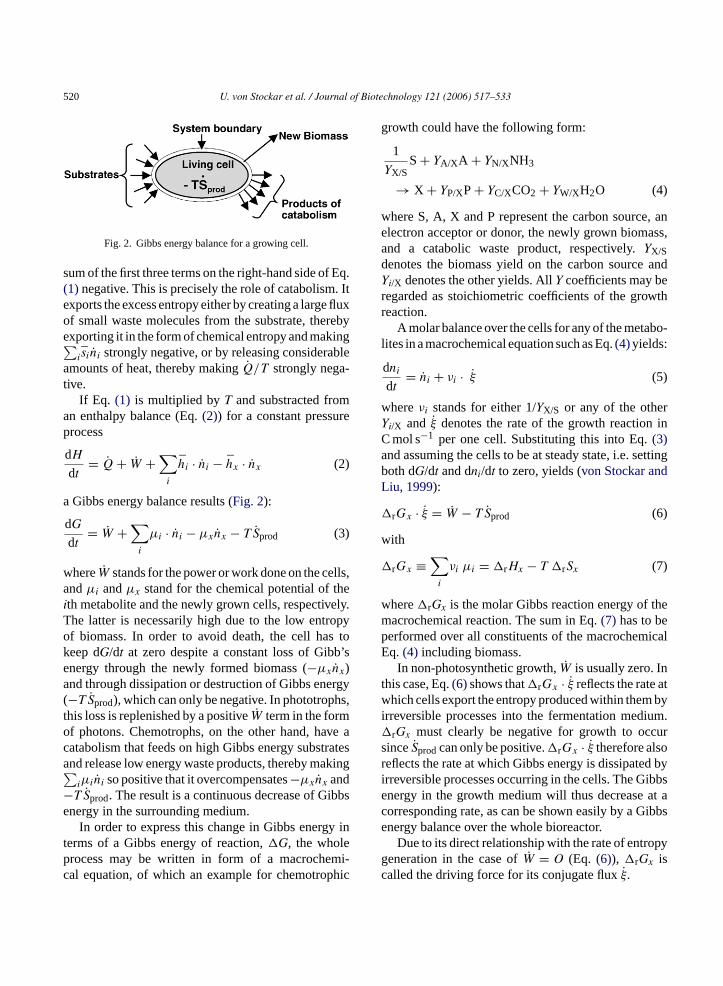
Fig. 2. Gibbs energy balance for a growing cell.
sum of the first three terms on the right-hand side of Eq.(1) negative. This is precisely the role of catabolism. Itexports the excess entropy either by creating a large fluxof small waste molecules from the substrate, therebyexporting it in the form of chemical entropy and making∑
isini strongly negative, or by releasing considerableamounts of heat, thereby makingQ/T strongly nega-tive.
If Eq. (1) is multiplied byT and substracted froman enthalpy balance (Eq.(2)) for a constant pressureprocess
dH
dt= Q + W +
∑i
hi · ni − hx · nx (2)
a Gibbs energy balance results (Fig. 2):
dG
dt= W +
∑i
µi · ni − µxnx − T Sprod (3)
whereW stands for the power or work done on the cells,andµi andµx stand for the chemical potential of theith metabolite and the newly grown cells, respectively.The latter is necessarily high due to the low entropyof biomass. In order to avoid death, the cell has tokeep dG/dt at zero despite a constant loss of Gibb’senergy through the newly formed biomass (−µxnx)and through dissipation or destruction of Gibbs energy(−T Sprod), which can only be negative. In phototrophs,this loss is replenished by a positiveW term in the formof photons. Chemotrophs, on the other hand, have ac ratesa king∑− ibbse
y intp mi-c hic
growth could have the following form:
1
YX/SS+ YA/X A + YN/XNH3
→ X + YP/XP+ YC/XCO2 + YW/XH2O (4)
where S, A, X and P represent the carbon source, anelectron acceptor or donor, the newly grown biomass,and a catabolic waste product, respectively.YX/Sdenotes the biomass yield on the carbon source andYi/X denotes the other yields. AllY coefficients may beregarded as stoichiometric coefficients of the growthreaction.
A molar balance over the cells for any of the metabo-lites in a macrochemical equation such as Eq.(4)yields:
dni
dt= ni + νi · ξ (5)
whereνi stands for either 1/YX/S or any of the otherYi/X and ξ denotes the rate of the growth reaction inC mol s−1 per one cell. Substituting this into Eq.(3)and assuming the cells to be at steady state, i.e. settingboth dG/dt and dni/dt to zero, yields (von Stockar andLiu, 1999):
�rGx · ξ = W − T Sprod (6)
with
�rGx ≡∑
i
νi µi = �rHx − T �rSx (7)
w themp icalE
t tw byi ium.� urs or d byi ibbse at ac ibbse
pygc
atabolism that feeds on high Gibbs energy substnd release low energy waste products, thereby ma
iµini so positive that it overcompensates−µxnx andT Sprod. The result is a continuous decrease of Gnergy in the surrounding medium.
In order to express this change in Gibbs energerms of a Gibbs energy of reaction,�G, the wholerocess may be written in form of a macrocheal equation, of which an example for chemotrop
here�rGx is the molar Gibbs reaction energy ofacrochemical reaction. The sum in Eq.(7) has to beerformed over all constituents of the macrochemq.(4) including biomass.In non-photosynthetic growth,W is usually zero. In
his case, Eq.(6)shows that�rGx · ξ reflects the rate ahich cells export the entropy produced within them
rreversible processes into the fermentation medrGx must clearly be negative for growth to occ
inceSprodcan only be positive.�rGx · ξ therefore alseflects the rate at which Gibbs energy is dissipaterreversible processes occurring in the cells. The Gnergy in the growth medium will thus decreaseorresponding rate, as can be shown easily by a Gnergy balance over the whole bioreactor.
Due to its direct relationship with the rate of entroeneration in the case ofW = O (Eq. (6)), �rGx isalled the driving force for its conjugate fluxξ.

U. von Stockar et al. / Journal of Biotechnology 121 (2006) 517–533 521
As shown by Eq.(7), the driving force has anenthalpic and an entropic part, which correspond to theexport of entropy in the form of heat and in the formof high entropy molecules, respectively.
3. The relationship between the driving forceand the biomass yield
3.1. Theory
The relationship between the driving force formicrobial growth�rGx and the biomass yieldYX/S isbest understood by splitting the macrochemical reac-tion into a catabolic and an anabolic part (Fig. 3).Formation of biomass clearly produces matter withhigh Gibbs energy due to its low entropy content andtherefore increases the Gibbs energy in the bioreac-tor. Anabolic reactions taken by themselves are thussubjected to a driving force in the opposite sense ofgrowth and are endergonic. In order to pull the anabolicreactions against this driving force “up-hill”, they arecoupled to catabolism, which is characterized by a largenegative�G and thus is highly exergonic. The net driv-ing force�rGx remaining for the whole process clearlydepends on the stoichiometric “load” anabolism placeson catabolism, i.e. on the biomass yield.
In inefficient growth systems, this load wouldbe very small, producing only a small amount of
F syn-t uldp theya ulledu as as enseo massyf
biomass per carbon and energy substrate consumed.The biomass yield would be small, but the overall�rGx would remain highly negative because the pos-itive �G of anabolism would hardly make its weightfelt on the downward pull of catabolism. Conversely, inefficient growth, the load would be much more impor-tant and would neutralize a large part of the negative�G of catabolism, thereby leaving only a small neg-ative �G for the overall process. On the other hand,a lot of biomass would be formed per substrate con-sumed andYX/S would be high. At the limit, the loadcould be so large that the two downward forces arein equilibrium and�rGx is zero. This situation woulddefine the highestYX/S allowed by the Second Lawof Thermodynamics. It would represent growth at thethermodynamic equilibrium and would thus proceed atan infinitely slow rate.
It is obvious that real microbial growth systemsmust strike a compromise between two unfavorableextremes: a very low “load” would provide a high over-all driving force and the metabolism would proceedvigorously, but only little biomass would be formedandYX/S would be small. If, on the other hand, growthoccurred too close to thermodynamic equilibrium, thebiomass yield would indeed be optimal, but growthwould proceed so slowly that the organism wouldalways be outgrown by competitors. Real organismsmust therefore have a�rGx and aYX/S somewherebetween these two extremes.
In order to formulate the relationship between�rGx
ab ws:
T sub-s assi ichit me-
ig. 3. Gibbs energy transduction from energy yielding to biohetic reactions. The latter are bioenergetically “up-hill” and woroceed from biomass to substrate if left alone. In living cells,re however coupled to an energy yielding reaction and thus pp against their own driving force. The energy yielding reaction htrong driving force downwards. The degree of coupling in the sf stoichiometry existing between the two determines the bioield, but also the amount of residual driving force�G remainingor both reactions together.
ndYX/S mathematically, the macrochemical Eq.(4) isest split up into catabolism and anabolism as follo
Catabolism:
S + YaAA → Ya
PP+ YaWH2O + Ya
CCO2; �Gcat
(8a)
Anabolism:
YbPP+ Yb
WH2O + YbCCO2 + Yb
NNH3
→ X + YbAA; �Gan (8b)
his description suggests that the available carbontrate S is first completely catabolized and that bioms then formed from the products of catabolism, whs of course unrealistic. Eqs.(8a) and (8b) have, onhe other hand, the advantage of simple stoichio

522 U. von Stockar et al. / Journal of Biotechnology 121 (2006) 517–533
tries with clearly defined�G values, which are easy toevaluate as long as the catabolic reaction is known. Touse correct formulations of anabolism is unpracticalbecause the real stoichiometry of anabolic processesis highly complicated (Heijnen and van Dijken, 1992)and therefore only rarely known. Despite the over-simplification in formulating anabolism, the results ofcalculations will be correct as long as Eqs.(8a) and(8b)are not used separately.
The quantitative relationship between�rG andYX/Sis obtained by observing that Eq.(4) results when Eq.(8a)is divided byYX/S and added to Eq.(8b):
�rG◦x = 1
YX/S�G◦
cat + �G◦an (9)
In this equation, only standard Gibbs energies havebeen used since life processes are so far from equilib-rium that the concentration-dependent terms will notmodify the calculations significantly.
3.2. Experimental results
The relationship between the driving force forgrowth and the biomass yield was investigated for sev-eral different growth processes in the laboratory of thefirst author (von Stockar and Liu, 1999).
The biomass yields were measured for batch andchemostat cultures under very many different growthconditions at varying specific growth rates and�rG
◦x
values were calculated according to Eq.(9). In addition,tw me-t g tot dc here(
ingf aer-o ine,o oft edb alueo untt hinl gy,w tet thata rely
Fig. 4. Standard Gibbs energies (�rGx, calculated) and standardenthalpies (�rHx, measured) of the growth reaction vs. biomassyields for aerobic growth on glucose. Thick line,�rGx calculatedfrom Eq.(9); thin line,�rHx calculated from an enthalpy analogueof Eq.(9); open symbols,�rGx, calculated for experimental biomassyields; full symbols,�rHx measured by calorimetry; dots/circles,K.marxianus; squares,C. utililis; inverted triangles,S. cerevisiae; dia-monds,C. pseudotropicalis; triangles,E. coli.
by an enthalpy change, or that the entropy producedby irreversible processes is exported practically exclu-sively in the form of heat.
Despite the enormous differences in strains, growthconditions and rates, the measured biomass yields aswell as the measured reaction enthalpies fall withinquite a narrow range. The biomass yields are quitehigh, yet still far away from the theoretical maximum.This probably reflects the compromise between twounfavorable extremes discussed earlier. The drivingforces�rG
◦x consequently do not vary widely and are
comprised between−250 and−500 kJ C-mol−1 of drybiomass grown. The measured�rH
◦x values fall into a
similar range. If the energy balances had closed, therespective points should lie on the thin line, represent-ing the predictions obtained from the enthalpy analogueof Eq. (9). (The open symbols fall on the thick line,because�rG
◦x values cannot be measured but were cal-
culated from measuredYX/S values in the same way asthe thick line (Eq.(9)).)
Fig. 5 represents a similar plot asFig. 4, but foranaerobic growth ofK. marxianus andS. cerevisiae.The catabolic reaction produces ethanol according to
C6H12O6 → 2CH3CH2OH + 2CO2 (10)
The thin line representing�rH◦x is now widely sepa-
rated from the thick Gibbs energy of reaction line andindicates much lower negative values. The measured
he enthalpic part of the driving force of growth,�rH◦x ,
as measured directly by applying reaction caloriry and compared with values computed accordinhe enthalpy analogue of Eq.(9). Experimental anomputational details have been published elsewvon Stockar and Liu, 1999).
Fig. 4summarizes the relationship between drivorces and biomass yields for a large number ofbic growth experiments on glucose. The thick lbtained by Eq.(9), shows clearly the decrease
he driving force as a function of increasing assumiomass yields (discussed earlier). The maximal vf YX/S allowed by the Second Law is seen to amo
o about 1.04 C-mol/(C-mol). The corresponding tine for�rH
◦x is very close to the one for Gibbs ener
hich indicates thatT �rS◦x , which ought to separa
he two lines, is close to zero. It may be concludederobic growth on glucose is driven almost enti

U. von Stockar et al. / Journal of Biotechnology 121 (2006) 517–533 523
Fig. 5. Standard Gibbs energies (�rGx, calculated) and standardenthalpies (�rHx, measured) of the growth reaction vs. biomassyields for ethanol fermentation on glucose. Thick line,�rGx cal-culated from Eq.(9); thin line, �rHx calculated from an enthalpyanalogue of Eq.(9); open symbols,�rGx, calculated for experimen-tal biomass yields; full symbols,�rHx measured by calorimetry;dots/circles,S. cerevisiae; squares,K. marxianus. Reprinted withpermission fromvon Stockar and Liu (1999).
reaction enthalpies were around−100 kJ C-mol−1 onlyand confirm the calculated line quite well. Despite thisdramatically lower heat generation, vigorous growthoccurred and the calculated Gibbs energy change stillreached between−240 and−340 kJ C-mol−1 of drybiomass grown. The separation of�rG
◦x and �rH
◦x
shows that a largeT �rS◦x term contributed to the total
driving force. In this case, about 2/3 of the driving forcewas entropic and the same fraction of entropy gener-ated in the cells was exported as chemical entropy in theform of the small molecules generated by the catabolicreaction (see Eq.(10)).
It is noteworthy that the Gibbs energy change of thisculture is still of the same order as the ones observedfor aerobic growth, despite the fact that the thick lineis located completely differently in the plot. Due tothe much smaller Gibbs energy change of the catabolicreaction (Eq.(10)), this line now indicates much lessnegative�rG
◦x for a given biomass yield. It could be
hypothesized that the biomass yields in anaerobiosisare reduced to an extent permitting the culture to main-tain the same overall driving force for growth.
Fig. 6. Standard Gibbs energies (�rGx, calculated) and standardenthalpies (�rHx, measured) of the growth reaction vs. biomassyields for homolactic fermentation on glucose byL. helveticus. Thickline, �rGx calculated from Eq.(9); thin line,�rHx calculated froman enthalpy analogue of Eq.(9); open symbols,�rGx, calculatedfor experimental biomass yields; full symbols,�rHx measured bycalorimetry. Reprinted with permission fromLiu et al. (1999).
Fig. 6represents the driving forces as a function ofbiomass yields for anaerobic growth ofLactobacillushelveticae, which generates its energy from the follow-ing catabolic reaction (Liu et al., 1999):
C6H12O6 → 2CH3CHOHCOOH (11)
Although this catabolic reaction might be expected toexport the excess entropy almost solely by producingsmall molecules from large ones,Fig. 6shows a major-ity of the driving force to be enthalpic. The reason isthe fact that at the growth pH lactic acid is immediatelyneutralized, thereby yielding a considerable amount ofheat. This neutralization reaction has been taken intoaccount when calculating the−�rG
◦x curve inFig. 6,
and it may be seen that the Gibbs energy driving forcesresulting from the measured biomass yields are againof the same order of magnitude.
The most extreme case of entropy-driven growthinvestigated as yet are anaerobic cultures of the bac-terium Methanosarcina barkeri, which derives itsenergy from the following reaction (Liu et al., 2001):
CH3COOH → CH4 + CO2 (12)
As may be seen inFig. 7, the−�rH◦x curve is not only
dramatically separated from the−�rG◦x curve, but it is
even below the zero line. This means that this culture

524 U. von Stockar et al. / Journal of Biotechnology 121 (2006) 517–533
Fig. 7. Standard Gibbs energies (�rGx, calculated) and standardenthalpies (�rHx, calculated or measured) of the growth reactionvs. biomass yields for acetotrophic methanogenesis byM. barkeri.Thick line, �rGx calculated from Eq.(9); thin line, �rHx calcu-lated from an enthalpy analogue of Eq.(9); open symbols,�rGx
and�rHx, calculated for experimental biomass yields; full symbols,�rHx measured by calorimetry; squares, this work; circles/dots, lit-erature values. Reprinted with permission fromLiu et al. (2001).
not only does not produce any heat, but on the contraryabsorbs heat and cools its environment down. As shownby the solid squares on the line, calorimetric measure-ments confirmed the endothermic nature of this cultureand corresponded well with the calculated predictions.This is so far the only experimental demonstration ofthe existence of an endothermic life form.M. barkeriexports the excess entropy by turning one molecule inthe aqueous state into two gaseous molecules, whichincreases the entropy in the bioreactor considerably.
The corresponding driving force for growth is suf-ficiently large to permit the culture to grow despite thefact that it must excrete waste products (CH4 and CO2)of higher chemical energy than the feedstock (acetate),thereby forcing it to absorb the difference in the form ofheat. Nevertheless, with−500 kJ C-mol−1, the overalldriving force�rG
◦x is again of the same order of mag-
nitude as in all the other cases.Driving forces of between−250 and−500 kJ C-
mol−1 of dry biomass grown are in line with a study byHeijnen and van Dijken (1992), who analyzed a largebody of literature and found that growth on carbon sub-strates of a reduction degree of 4 is always driven by adriving force of that magnitude. This range may repre-sent a good compromise between large driving forcesand low biomass yields on the one hand and growth nearthermodynamic equilibrium on the other hand, and it
appears that biomass yields may have been adapted tothis range by evolution.
In the cases of homofermentative lactic acid fer-mentation (Fig. 6) and acetotrophic methanogenesis(Fig. 7), these�rG
◦x values are only obtained if the
side reactions of lactic acid neutralization and gasifica-tion of CH4 and CO2 are included. Otherwise, Gibbsenergy changes close to zero would result. It is thusconcluded that these side reactions must be consideredto be part of the energy metabolism, even though theyoccur outside the cell. They contribute considerablyto the overall driving force by instantaneously remov-ing the waste molecules lactic acid and CH4 from theouter surface of the cells. (This is also the reason whygrowth of acetotrophic methanogenesis must be con-sidered endothermic, even though the effect is mainlydue to the vaporization of CH4 and CO2 outside of thecell. However, even without the evaporation of carbondioxide growth ofM. barkeri would still be endother-mic, albeit very mildly so (Liu et al., 2001). On theother hand, it would be virtually impossible to growM.barkeri at pressures which keep methane from evapo-rating.)
It may be concluded quite generally that the drivingforces for growth�rG
◦x appear to fall in a certain range,
which may have been determined by evolution. How-ever, the separation in an enthalpic and an entropic partdiffers widely from one case to another, as summarizedin Fig. 8. Aerobic respiration is enthalpy driven prac-tically to 100% with theT �rS
◦ term (arrows) beingi thel en ver,f parti aseo har-nst tivee riv-i sedt theo atedc no-g em-i er-c ce.T rmic
x
nsignificant. Fermentative metabolism, shown oneft of respiration, have lesser−�rH
◦x values becaus
o external electron acceptors are involved. Howeermentations invariably rip substrate molecules anto smaller entities, thereby generating an incref chemical entropy in the medium that can beessed as driving force. In the case ofM. barkeri,hown just right of the overall driving force�rG
◦x,
his entropic driving force has to overcome a posinthalpy change, which in effect acts as a partial d
ng force in the wrong sense. It was thus propoo call this enthalpy retarded growth. A case atpposite extreme of the spectrum was also investigalorimetrically: in the case of autotrophic methaenesis, the catabolism leads to a reduction of ch
cal entropy in the medium, which has to be ovome by an overly negative enthalpic driving forhese growth processes are therefore very exothe

U. von Stockar et al. / Journal of Biotechnology 121 (2006) 517–533 525
Fig. 8. Schematic representation of enthalpic and entropic contribution to the driving force of microbial growth according to�G =�H − T �S.Reprinted with permission fromvon Stockar and Liu (1999).
(Schill et al., 1999) and could be called entropyretarded.
3.3. Prediction of the biomass yield
Based on what has been presented in this review,thermodynamics allows estimating the biomass yieldof an unknown microbial strain by solving Eq.(9) forit:
YX/S = �G◦cat
�rG◦x − �G◦
an(13)
We will now describe how Eq.(13)may be used for pre-dictingYX/S. The first step would be to estimate�G◦
catand�G◦
anbased on Eqs.(8a)and(8b). This is no prob-lem as long as the compounds S, A and P have beenidentified and the stoichiometric coefficients appear-ing in Eqs.(8a)and(8b)are known from biochemistry,but in most cases it will also be possible to calculatethese yields if they are unknown. The minimum infor-mation needed for this calculation is the nature of aneventual external electron acceptor A in Eq.(4) (e.g.oxygen), and the nature of an eventual waste productof the catabolism P (e.g. ethanol). In many cases, themetabolism will involve either A or P but not both, oreither P or A will be CO2. (Occurrence of both A andP different from CO2 usually indicates the presence ofmore than one catabolic mechanisms and at least oneadditional piece of information, such as aY value in
Eq.(4), must be known to treat the case (Heijnen et al.,1992; von Stockar and Liu, 1999).)
In the many cases in which only A or P is present,or either P or A is identical with CO2, the number ofunknownY values in Eqs.(8a)and(8b)are reduced to3 and 4, respectively. They may therefore straightfor-wardly be calculated by applying degrees of reduction,carbon, oxygen and nitrogen balances.
This calculation and the evaluation of�G◦cat and
�G◦an may be generalized and simplified for all cases
treated in this review, including those in which theC-source and the energy source are not the same com-pound by rewriting Eqs.(8a)and(8b)as follows:
D + YaAA → Ya
pP+ YaDOXDOX; �G◦
cat (14a)
YbpP+ Yb
DOXDOX + YbNNH3 → X + Yb
AA; �G◦an
(14b)
where D is the electron donor or energy source in thegrowth reaction, A the electron acceptor, P the reducedform of A and DOX denotes the oxidized form of D.In heterotrophic growth, D is also the carbon source,yielding CO2 as DOX, whereas in autotrophic growththe carbon is provided by A, which then is CO2. Infermentative and reductive growth, A and D are thesame compound.
In all cases treated in this review, as well as in a largemajority of cases occurring in reality, only D, X and P

526 U. von Stockar et al. / Journal of Biotechnology 121 (2006) 517–533
have a degree of reduction different from zero. As longas CO2 (g), H2O (l) and NH4
+ (aq) are used as refer-ence state for total combustion, all the other compoundshave a degree of reduction and also a Gibbs energy ofcombustion of zero. The only relevant stoichiometriccoefficients to compute in Eqs.(14a)and(14b)are thusYa
p andYbp , respectively. These may be found using a
single degree of reduction balance for each of the twoyields. Combining the results with Gibbs energy bal-ances yields (von Stockar and Liu, 1999):
�G◦cat = �cG
◦D − γD
γp�cG
◦p (15a)
�G◦an = γx
γp�cG
◦p − �cG
∗x (15b)
where�cG∗x is the modified Gibbs energy of combus-
tion for biomass, using CO2 (g), H2O (l) and NH4+
(aq) as reference state for total combustion. In oxida-tive heterotrophic growth, the second and the first termson the right-hand side of Eqs.(15a)and(15b), respec-tively, vanish, because P is water which has a zero Gibbsenergy of combustion.
Based on Eqs.(15a)and(15b), �Gcat and�Gan arethen evaluated using tabulated molar Gibbs energiesof formation or combustion for the various metabolites(Wagmann et al., 1968; Wilhoit, 1969; Battley, 1987;Roels, 1983; Heijnen and van Dijken, 1992; Sandlerand Orbey, 1991; Heijnen, 1999a). In order to compute�G◦ , the C-molar Gibbs energy of formation or com-b herea thelt ter-m .(c s isk her,t assa
no -cd iona am-pa uise tion
of data published in the literature, that�rG◦x is virtu-
ally independent of the nature of the electron acceptorused, but does depend in a statistically significant wayon the number of carbon atoms C and the degree ofreductionγ of the carbon source on which the cultureis growing. According to this study, cultures growingon “easy” substrates that have a degree of reductionγs of 3.8, which is close to the one of dry biomass(4.2), and with six atoms of carbon (C = 6) need onlyto dissipate around−200 kJ C-mol−1 of Gibbs energy.However, any deviation from this degree of reductionand/or growth on carbon sources with less carbon atomsincreases the number of biochemical steps needed toincorporate the carbon source into the new biomass,such that a higher overall driving force is needed. Theauthors expressed this observation in terms of a quan-titative, empirical correlation as follows:
−�rG◦x = 200+ 18 · (6-C)1.8
+ exp[{(3.8 − γs)2}0.16 ·
(3.6 + 0.4C)] (kJ/C-mol) (16a)
For chemotrophic growth with reverse electron trans-port:
−�rG◦x = 3500 (kJ/C-mol) (16b)
The predictive power of correlations(16a)and(16b)together with Eqs.(13), (15a)and(15b)has been testedon an extended database consisting of almost all thed n( they nallBs sm tiono( ssy permi
or-r ialg( assy por-t on
anustion of dry microbial biomass is also needed. Tre many more or less speculative estimations in
iterature for�cG◦x (von Stockar and Liu, 1999), but
he only value with an experimental basis was deined by low temperature calorimetry byBattley et al
1997)and amounts to�cG◦x = 515 kJ C-mol−1 for E.
oli. Since the elemental composition of dry biomasnown to be fairly constant from one strain to anothis value may also be used for other types of bioms a good estimate of�cG
◦x.
Once�G◦an and �Gcat are known, an estimatio
f the overall driving force�rG◦x for the whole pro
ess is also needed, in order to use Eq.(13). While thisriving force may have been optimized by evolutnd does not seem to vary very much in the exles treated earlier, Heijnen and coworkers (Heijnennd van Dijken, 1992; Heijnen et al., 1992; Tijht al., 1993) have shown, based on an investiga
ata used and published byHeijnen and van Dijke1992), all the experimental data accumulated overears in the laboratory of the first author and additioiterature data (Patino et al., submitted for publication).y estimating�rG
◦x by use of Eqs.(16a)and(16b)and
ubstituting the result into Eq.(13), the biomass yielday be predicted with a standard error of predicf about±11% as shown inFig. 9a. (Since Eqs.(14a),14b), (15a)and(15b)were used to predict the biomaields, these were obtained in C-mol of dry biomassole of electron donor (YX/D) and plotted in this form
n Fig. 9.)Liu (1999) developed a considerably simpler c
elation for estimating the driving force for microbrowth. It was based on an old correlation byRoels1983) who proposed to estimate aerobic biomields directly by assuming them to increase proionally with the degree of reduction of the carb

U. von Stockar et al. / Journal of Biotechnology 121 (2006) 517–533 527
Fig. 9. Parity plots for biomass yields predicted on the basis ofthe correlations for�rG
◦x according to: (a)Heijnen and van Dijken
(1992)and (b)Liu (1999)based onRoels (1983). Biomass yields aregiven in C mol of dry biomass per mole of electron donor (energysubstrate, e.g. glucose for oxidative growth or H2 for autotrophicmethanogenesis).
source (YX/S = 0.13· γs) up to a degree of reduction of4.67 and then to remain constant atYX/S = 0.6. Whilethis affords a very good prediction for aerobic growth,it fails completely for anaerobic processes. However,Liu (1999) calculated how�rG
◦x must depend onγs
for this correlation to be valid in aerobic cases.
The result was:
�rG◦x = 666.2
γs+ 243.1 (kJ/C-mol) forγs ≤ 4.67
(17a)
�rG◦x = 157γs − 339 (kJ/C-mol) forγs > 4.67
(17b)
It was then assumed that�rG◦x can be estimated from
Eqs. (17a) and (17b) for both aerobic and anaerobicgrowth processes. Correlations(17a)and(17b) weretested together with Eq.(13) using the same databaseas before. The result (Fig. 9b) shows that the biomassyields may be predicted with a slightly smaller standarderror of±8%, despite a dramatically simpler estima-tion for �rG
◦x. A rough prediction to within±9% is
even possible by simply substituting an average valueof −500 kJ C-mol−1 for �rG
◦x into Eq.(13). However,
this method may result in very large relative predictionerrors for anaerobic growth.
3.4. Discussion
In summary, it may be concluded that the very widevariations occurring in biomass yields can indeed beunderstood in the framework of a thermodynamic anal-ysis. According to the nature of the catabolic mech-anism employed by given strains, the Gibbs energydriving forces for both the driving catabolic (�G◦ )a yc toa e toc rce� .a msm ld oft ucha ar ultra-f verye incec nd wths
hereh ctingb cor-
catnd the “payload” (�G◦
an) reactions may differ veronsiderably from one microbial growth systemnother. A given biomass yield would thus give risompletely different overall Gibbs energy driving forG
◦x from one system to another as shown by Eq(9)
ndFig. 10. It appears, however, that microorganisay have adapted in the course of evolution the yie
heir “payload” reaction, i.e. the biomass yield, in sway that the overall driving force�rG
◦x represents
easonable compromise between the extremes ofast, wasteful metabolism on the one hand andfficient but slow metabolism on the other hand. Sorrelations for such optimal�rG
◦x values have bee
eveloped, the actual biomass yields for given groystems may very roughly be predicted.
Other developments than the one presentedave also been published as a basis for prediiomass yield. Early work was based on attempts to

528 U. von Stockar et al. / Journal of Biotechnology 121 (2006) 517–533
Fig. 10. Relationship between biomass yield and the overall driv-ing force for the growth reaction�rG
◦x for: (a) oxidative growth on
glucose, (b) ethanol fermentation of glucose, (c) lactic acid fermen-tation on glucose and (d) acetotrophic methanogenesis. The shadedGibbs energy dissipation range is believed to represent a favorablecompromise between high growth efficiency and high growth rate.Also shown are the ranges into which biomass yields of oxidativegrowth on glucose and on acetotrophic methanogenesis have to fallin order to grow at this optimal Gibbs energy dissipation (pairs ofhorizontal broken lines).
relate the biomass yield in terms ofYATP (e.g.Bauchopand Elsden, 1960) or in terms of energetic efficiencies(Minkevich and Eroshin, 1973; Roels, 1983; Battley,1960, and many others). In developing their correla-tion for Gibbs energy dissipation,Heijnen and vanDijken (1992) reviewed these methods and showedthat they were all pleagued with by serious internalinconsistencies. An alternative method first proposedby McCarty in 1965and later refined (McCarty, 1969,1975; Lawrence and McCarty, 1970; Christensen andMcCarty, 1975; Rittmann and McCarty, 2001) is basedon a combination of a Gibbs energy and an electron bal-ance. It essentially sets a sum that is analogous to thetwo right-hand side terms of Eq.(9) equal to zero butmultiplies the term referring to the catabolic reactionwith an efficiency factorK, thereby implicitly reintro-ducing the Gibbs energy dissipation. This parameterK has no physical meaning and is usually assumedconstant when using the McCarty method. Neverthe-less, it has been shown that the yield predictions foroxidative organo-heterotrophic growth are compara-ble with the ones based on correlations of�rG
◦x (Van
Briesen, 2002). The yield predictions obtained by this
method seem not to have been tested broadly forreductive growth or for litho-autotrophic metabolism.On the other hand, its usefulness has been demon-strated for predicting the stoichiometry of biodegra-dation reactions. Also, it has been extended by VanBriesen and coworkers to cope with accumulationof slowly biodegradable intermediates (Van Briesenand Rittmann, 2000) and biodegradations involvingmonooxygenases (Van Briesen, 2001; Yuan and VanBriesen, 2002).
All of these prediction methods may be particularlyuseful to assess biomass yields where exotic formsof catabolisms occur, such as in applications in envi-ronmental sciences, e.g. for producing biohydrogen orbioelectricity (Angenent et al., 2004), but more workis needed to ascertain this. So far, the predictions arerestricted to chemotrophic growth, but work on theenergy budget and the thermodynamics of phototrophicgrowth may yield analogous results for phototrophicgrowth (Janssen et al., 2005).
4. Thermodynamic analysis of key culturegrowth parameters other than growth yield
During the 1990s, Heijnen and coworkers under-took thermodynamic analyses of a number of furtheressential parameters characterizing cellular growth.For instance, the correlations for the biomass yieldd thisp inte-n wths tingt onet sue micf ionsw ownb
�
T ands alG im-i( n
iscussed so far do not allow for the decrease ofarameter observed at low growth rates due to maance reactions. A complete prediction of the grotoichiometry thus requires a correlation for estimahe maintenance coefficient, which then enableso computeYX/S or YX/D at low specific growth ratesing the well-known Herbert–Pirt relation.Tijhuist al. (1993)placed this argument on a thermodyna
oundation by observing that maintenance reactill increase the Gibbs energy dissipation rate as shy Eq.(18):
rG◦x · µ = (�rG
◦x)min · µ − (T · SP)m (18)
he left-hand side and the first term on the right-hide of Eq.(18) represent the total and the minimibbs energy dissipation, respectively, in a form s
lar to Eq.(6), except forξ which was replaced byµ.�rG
◦x)min may be calculated as discussed in Sectio3.

U. von Stockar et al. / Journal of Biotechnology 121 (2006) 517–533 529
The last term of Eq.(18) describes the con-stant Gibbs energy dissipation due to maintenance inkJ h−1 C-mol−1.
The following correlation for the maintenanceGibbs energy dissipation was developed byTijhuiset al. (1993)based on an analysis of a large body ofpublished data:
−(T SP) = 4.5 · exp
{−Ea
R
(1
T− 1
298
)}(19)
where the activation energyEa amounts to 69 kJ mol−1.According to the authors, Eq.(19)reproduces the pub-lished data to within a standard deviation between 40and 50%.
Heijnen (1999b)also presents correlations for anumber of kinetic growth parameters. Based on theassumption that the liberation of Gibbs energy in theelectron transport chain is the growth limiting phe-nomenon, an expression forµmax is developed. Healso developed thermodynamic arguments for calculat-ing the residual substrate concentrationcmin at whichgrowth ceases due to maintenance requirements andthe threshold substrate concentrationcthresh at whichno substrate can be taken up anymore because the driv-ing catabolic reaction and the ATP generating system(e.g. the proton motive force) are in equilibrium. Whileit is clear that these arguments yield plausible values,the prediction methods have not been widely tested andtheir accuracy is not known.
5i
5
ssd ablet thp cs ofb o fari con-s ingo isma ddi-t smsa t be
opened and individual metabolic pathways and path-way options have to be thermodynamically assessedand weighed against each other. The same is true fora biomass yield prediction in cultures with a complexmetabolism such as found in CHO cells. The highlycomplex pattern of multiple substrate take-up andsecretion will never be predictable based on a simpleblack box approach with essentially only one degree offreedom.
A potentially promising method for analyzing thethermodynamic feasibility of a metabolic pathway hasbeen proposed byMavrovouniotis et al. (1992, 1993)(reviewed inStephanopoulos et al., 1998). The methodis based on the fact that a given metabolic pathway isthermodynamically only feasible if the Gibbs energydriving forces�G of each of its individual reactionsteps are negative. For an individual enzymatic reactionof the stoichiometry given by∑
i
νiAi = O (20)
the Gibbs energy change is calculated as
�G = �G◦ + RT ln∏
i
cνii (21)
In contrast to what was said in the context of Eq.(9),it is now important to allow for the influence of con-centration on the Gibbs reaction energy. While growthof whole cells occurs so far from equilibrium that theconcentration-dependent terms will modify the stan-d antf notn ions l bes rgym tratea
( luesc illm archi fort ifiedb ionsi thec ncym andt
. Thermodynamic feasibility analysis ofndividual metabolic pathways
.1. Theory of thermodynamic pathway analysis
In order to be of high value in industrial bioproceevelopment, thermodynamic analysis ought to be
o not only predict biomass yields and kinetic growarameters, but above all the yields and the kinetiioproduct synthesis. The approach discussed s
s unable to make such predictions because itiders the living cell as a black box, differentiatnly in an exceedingly formal way between catabolnd anabolism. In order to cope with the many a
ional degrees of freedom that exist in metabolible to secrete bioproducts, the black box mus
ard Gibbs reaction energy only by an insignificraction of its hugely negative value, the same isecessarily true for individual biochemical reactteps within the metabolism. The latter may welo close to equilibrium that the Gibbs reaction eneay become positive for a particular range of subsnd product concentrations.
The algorithm proposed byMavrovouniotis1993a,b)therefore searches for concentration vai for all metabolites in the pathway which wake all Gibbs energy changes negative. The se
s constrained by an upper and a lower limithe metabolite concentrations that are speceforehand to keep the intracellular concentrat
n a reasonable range. The concentrations ofofactors ATP, NADH, etc., which are called curreetabolites, are assumed to be highly controlled
herefore are assigned a fixed value.

530 U. von Stockar et al. / Journal of Biotechnology 121 (2006) 517–533
In this analysis, a pathway is rated unfeasible if nodistribution of the metabolite concentrations (ci) canbe found without making�G of at least one singlestep (“localized bottleneck”) or of a combination ofreactions (“distributed bottleneck”) positive. If suchbottlenecks occur, the analysis may be repeated assum-ing a wider spread between possible maximum andminimum concentrations or by modifying the speci-fications for the currency metabolite concentrations.Both types of modifications will tendencially alleviatebottlenecks.
5.2. Test example: glycolysis
Maskow and von Stockar (2005)tested thethermodynamic pathway analysis proposed byMavrovouniotis (1993a,b)on the well-known gly-colytic pathway.�G′◦ values for this pathway aredepicted inFig. 11and show that serious energy barri-ers exist in the break-up of fructose-1,6-bisphosphateinto dihydroxyacetone phosphate and glyceraldehyde3-phosphate (reaction(4)), in the isomerisationbetween the latter two compounds (reaction(5)), aswell as in the dehydrogynation of glyceraldehydes3-phosphate (reaction(6)). It is obvious that thesecan only be overcome by considerable concentrationdifferences from substrates to product. The study ofMaskow and von Stockar (2005)shows that the nec-essary concentration differences are only achievable,and therefore glycolysis can only occur, if maximumm ol/la are
assumed. However, this range exceeds the publishedratio of maximum to minimum values by about anorder of magnitude. The driving force of reaction(6)is essentially influenced by the currency metaboliteconcentrations, i.e. (NADH and NAD+). Calculationsshow that glycolysis would also become thermo-dynamically feasible with a more reasonable rangeof intracellular concentrations if a reductive energycharge (NADH/(NAD+ + NADH)) of below 0.018 isspecified, which is equally unrealistic.
According to this type of analysis, glycolysis wouldclearly be thermodynamically impossible under condi-tions generally considered realistic. The study thereforealso investigates a number of potential errors in thethermodynamic analysis which might explain this obvi-ously wrong conclusion. The most important sourcesof error are the uncertainty of the standard molar Gibbsenergies of reaction (�G′◦) and the neglection of theactivity coefficients. For reaction(6) alone, a litera-ture survey produced�G′◦ values between−0.83 and6.28 kJ mol−1. This difference modifies the minimumintracellular concentration one has to assume in order tomake glycolysis thermodynamically feasible by morethan an order of magnitude. By simply taking themean of the published values for�G′◦ (2.28 kJ mol−1)instead of the often applied value of 6.28 kJ mol−1,glycolysis is calculated to become thermodynamicallyfeasible under realistic conditions.
�G′◦ depends strongly on the presence of ionsand/or co-solvents. It is therefore not surprising thatn glyt asi-
F teps in ctions, seeT
etabolite concentrations of the order of 5 mmnd minimum values of less than 0.005 mmol/l
ig. 11. Standard Gibbs energies of reaction of the individual sable 1.
eglecting the activity coefficients influence stronhe conclusions concerning the thermodynamic fe
homolactic fermentation. For a detailed definition of these rea

U. von Stockar et al. / Journal of Biotechnology 121 (2006) 517–533 531
Table 1Eleven reactions of glycolysis and apparent Gibbs energies�G′◦ atpH 7 and 298.1 K
Number Reaction �G′◦(kJ mol−1)
1 GLU + ATP→ G6P + ADP −16.742 G6P→ F6P 1.673 F6P + ATP→ FBP + ADP −14.234 FBP→ DHAP + GAP 23.855 DHAP→ GAP 7.536 GAP + NAD+ + Pi → BGP + NADH + H+ 6.287 BGP + ADP→ 3PG + ATP −18.838 3PG→ 2PG 4.609 2PG→ PEP 1.67
10 PEP + ADP→ ATP + PYR −31.3811 PYR + NADH + H+ → LAC + NAD+ −25.10
The abbreviations stand for glucose (GLU), glucose 6-phosphate(G6P), fructose 6-phosphate (F6P), fructose 1,6-biphosphate (FBP),dihydroxyacetone phosphate (DHAP),d-glyceraldehyde 3-phos-phate (GAP), 1,3-bis-phosphoglycerate (BGP), 3-phosphoglycerate(3PG), 2-phosphoglycerate (2PG), phosphoenolpyruvate (PEP),pyruvate (PYR) and lactate (LAC).
bility of glycolysis. If activity coefficients are takeninto account by simply assessing them using theDebye–Huckel limiting law, glycolysis is calculated tobe thermodynamically feasible.
In addition, metabolic reactions in which protonsare included are affected by the intracellular pH andusing realistic pH values instead of pH 7 can also addor substract a few kiloJoules to�G′◦. The effect isthus less important, although such corrections shouldroutinely be applied in order to improve the reliabil-ity of the analysis. Also, these calculations showed theextreme importance of the neutralization of the lacticacid for the thermodynamic viability of the whole gly-colysis. This neutralization thus provides a part of thedriving force for growth and, as suggested in Section3.3, has to be considered as a part of catabolism eventhough it occurs outside the cells.
6. Conclusions
Thermodynamic analysis is only rarely appliedin biotechnology in order to judge the potential ofprospective microbial strains and systems with respectto their growth and bioproduct synthesis performance.Yet, the literature shows thermodynamics to hold con-
siderable promise in this respect. As shown by severalauthors, the wide variations of biomass yields reportedfor different microbial growth system can be explainedbased on thermodynamic reasoning. These variationsappear to be the result of an evolutionary adaptationof the amount of Gibbs energy dissipation towardsa reasonable compromise between growth efficiencyand growth rate. Based on this framework, biomassyields may be predicted very roughly for oxidativeand reductive chemoheteroorganotrophic growth butalso for chemoautolithotrophs. This type of analysishas yet to be extended to phototrophic growth. Simi-lar analyses have been developed for other importantgrowth parameters including maintenance coefficients,specific growth rate and threshold substrate concentra-tions.
The state of affairs of thermodynamics for assessingindividual metabolic pathways is much worse. As aresult, thermodynamic analysis might be most useful inenvironmental applications, but is essentially unable atthe time being to predict biomass yields in cultures withhighly complex nutritional patterns such as mammaliancell cultures or yields of products not related to theenergy metabolism such as overproduced primary andsecondary metabolites, or recombinant proteins.
Much more work has to be invested in the thermo-dynamics of processes in the living cells. Most impor-tant, our database concerning the Gibbs energy of thechemicals of life and the biochemical reactions, butalso our knowledge on intracellular chemicals affectingt ati-c ored con-c amicc d bea ulare
A
n-t nalS toryt ofc tingd J.J.H
he forces driving these reactions must be dramally improved. This includes more accurate and metailed data on the currency metabolites, whoseentrations have a decisive impact on thermodynalculations. In conclusion, more research shoulimed at a quantitative description of the intracellnvironment in which life processes occur.
cknowledgements
The first author is grateful for long term coinued financial support from the Swiss Natiocience Foundation (FNS) enabling his labora
hermodynamic investigations into a wide rangeellular strains. The authors acknowledge stimulaiscussions with and suggestions from Prof.eijnen and Prof. C. Wandrey.

532 U. von Stockar et al. / Journal of Biotechnology 121 (2006) 517–533
References
Angenent, L.T., Karim, K., Al-Dahhan, M.H., Wrenn, B.A.,Dominguez-Espinosa, R., 2004. Production of bioenergy andbiochemicals from industrial and agricultural wastewater. TrendsBiotechnol. 22, 477–485.
Battley, E.H., 1960. A theoretical approach to the study of the ther-modynamics of growth ofSaccharomyces cerevisiae (Hansen).Physiol. Plant. 13, 674.
Battley, E.H., 1987. Energetics of Microbial Growth.Wiley/Interscience, NY.
Battley, E.H., Putnam, R.L., Boerio-Gates, J., 1997. Heat capac-ity measurements from 10 to 300 K and derived thermody-namic functions of lyophilized cells ofSaccharomyces cere-visiae, including the absolute entropy and the entropy of for-mation at 298.15 K. Thermochim. Acta 298, 37–46.
Bauchop, T., Elsden, S.R., 1960. The growth of microorganismsin relation to their energy supply. J. Gen. Microbiol. 23, 457–469.
Christensen, D.R., McCarty, P.L., 1975. Multiprocess biologicaltreatment model. J. Water Pollut. Contr. Fed. 47 (11), 2652–2664.
Heijnen, J.J., van Loosdrecht, M.C.M., Tijhuis, L., 1992. A black boxmathematical model to calculate auto- and heterotrophic biomassyields based on Gibbs energy dissipation. Biotechnol. Bioeng.40, 1139–1154.
Heijnen, J.J., van Dijken, J.P., 1992. In search of a thermody-namic description of biomass yields for chemotrophic growthin microorganisms. Biotechnol. Bioeng. 39, 833–858.
Heijnen, J.J., 1999a. Bioenergetics of microbial growth. In: Flickiger,M.C., Drew, S.W. (Eds.), Bioprocess Technology: Fermentation,Biocatalysis and Bioseparation. J. Wiley & Sons, NY.
Heijnen, J.J., 1999b. Bioenergetics of microbial growth. In: Flickiger,M.C., Drew, S.W. (Eds.), Bioprocess Technology: Fermenta-tion, Biocatalysis and Bioseparation. J. Wiley & Sons, pp. 267–
J ofher-
L icalv. 96
L thtudy
L me--
LM esis
tionce onpp.
M 5th
McCarty, P.L., 1975. Stoichiometry of biological reactions. Prog.Water Technol. 7, 157–172.
Maskow, T., von Stockar, U., 2005. How reliable are thermodynamicfeasibility statements of biochemical pathways? Biotechnol. Bio-eng. 92, 223–230.
Mavrovouniotis, M.L., 1993a. Identification of Localized and Dis-tributed Bottlenecks in Metabolic Pathways. ISMB-93, pp.273–283.
Mavrovouniotis, M.L., 1993b. Identification of qualitatively feasiblemetabolic pathways. In: Hunter, L. (Ed.), Artificial Intelligenceand Molecular Biology. AAAI Press/MIT Press, Menlo Park,CA, pp. 325–364.
Mavrovouniotis, M.L., Stephanopoulos, G., Stephanopoulos, G.,1992. Synthesis of biochemical production routes. Comp. Chem.Eng. 16, 605–619.
Minkevich, I.G., Eroshin, V.K., 1973. Productivity and heat gener-ation of fermentation under oxygen limitation. Folia Microbiol.18, 376–385.
Patino, R., Liu, J.S., von Stockar, U. The development of correla-tions for the prediction of biomass growth yields based on Gibbsenergy dissipation. Thermochim. Acta, submitted for publica-tion.
Rittmann, B.E., McCarty, P.L., 2001. Environmental Biotechnology:Principles and Applications. McGraw-Hill Book Co., NY.
Roels, J.A., 1983. Energetics and Kinetics in Biotechnology. ElsevierBiomedical Press, Amsterdam, NY, Oxford.
Sandler, S.I., Orbey, H., 1991. On the thermodynamics ofmicrobial growth processes. Biotechnol. Bioeng. 38, 697–715.
Schill, N., Liu, J.S., von Stockar, U., 1999. Thermodynamic analysisof growth ofMethanobacterium thermoautotrophicum. Biotech-nol. Bioeng. 64, 74–81.
Stephanopoulos, G.N., Aristidou, A.A., Nielsen, J., 1998. MetabolicEngineering: Principles and Methodologies. Academic Press,San Diego.
T er-ergywth.
V bac-71–
V tionch-
V ionsions.
v d onwth.
v ics:em.
v rmo-Lec-
gung
291.anssen, M., Patino, R.T., von Stockar, U. 2005. Application
bench-scale biocalorimetry to photoautotrophic cultures. Tmochim. Acta 435, 18–27.
awrence, A.W., McCarty, P.L., 1970. Unified basis for biologtreatment design and operation. ASCE J. Sanit. Eng. Di(nSA3), 757–778.
iu, J.-S., Marison, I.W., von Stockar, U., 2001. Microbial growby a net heat up-take: a calorimetric and thermodynamic son acetotrophic methanogenesis byMethanosarcina barkeri.Biotechnol. Bioeng. 75 (2), 170–180.
iu, J.S., Marison, I.W., von Stockar, U., 1999. Anaerobic caloritryof the growth ofLactobacillus helveticus using a highly sensitive BioRC1. J. Therm. Anal. Calorim. 56, 1191–1195.
iu, J.S., 1999. Internal Report LGCB.cCarty, P.L., 1965. Thermodynamics of biological synth
and growth. In: Baers, J. (Ed.), Advances in Water PolluResearch, Proceedings of the 2nd International ConferenWater Pollution, vol. 2. Pergamon Press Inc., Oxford, UK,169–199.
cCarty, P.L., 1969. Energetics and bacterial growth. In: TheRudolf Research Conference.
ijhuis, L., van Loosdrecht, M.C.M., Heijnen, J.J., 1993. A thmodynamically based correlation for maintenance Gibbs enrequirements in aerobic and anaerobic chemotrophic groBiotechnol. Bioeng. 42, 509–519.
an Briesen, J.M., 2002. Evaluation of methods to predictterial yield using thermodynamics. Biodegradation 13, 1190.
an Briesen, J.M., Rittmann, B.E., 2000. Mathematical descripof microbiological reactions involving intermediates. Biotenol. Bioeng. 67 (1), 35–52.
an Briesen, J.M., 2001. Thermodynamic yield predictfor biodegradation through oxygenase activation reactBiodegradation 12, 265–281.
on Stockar, U., Liu, J.S., 1999. Does microbial life always feenegative entropy? Thermodynamic analysis of microbial groBiochem. Biophys. Acta 1412, 191–211.
on Stockar, U., van der Wielen, L.A.M., 2003. Back to basthermodynamics in biochemical engineering. Adv. BiochEng./Biotechnol. 80, 1–17.
on Stockar, U., Marison, I.W., Liu, J.-S., Janssen, M., 2004. Thedynamische Analyse des mikrobiellen Wachstums. Plenaryture, Bioperspectives 2004 und 22. DECHEMA-Jahresta

U. von Stockar et al. / Journal of Biotechnology 121 (2006) 517–533 533
der Biotechnologen. Tagungshandbuch, S. 34, Wiesbaden, 4–6Mai.
Wagmann, D.D., Evans, W.H., Barker, V.B., Halow, I., Bailey, S.M.,Schumm, R.H., 1968. NBS Technical Note 270-3. Selected Val-ues of Chemical Thermodynamic Properties. Tables for the First34 Elements in the Standard Order of Arrangement. NationalBureau of Standards, Washington, DC.
Wilhoit, R.C., 1969. Selected values of thermodynamic properties.In: Brown, H.D. (Ed.), Biochemical Microcalorimetry. AcademicPress, NY.
Yuan, Z., Van Briesen, J.M., 2002. Yield prediction and stoichiometryof multi-step biodegradation reactions involving oxygenation.Biotechnol. Bioeng. 80 (1), 100–113.