Estimating the Impact of the Indo-ASEAN Free Trade Agreement on India’s Balance of Trade
20
Journal of Global Analysis January 2010 www.cesran.org Journal of Global Analysis, Vol. 1, No. 1, 2010 - Special Issue: International Political Economy * Ranajoy Bhaacharyya is a Professor at the Indian Instute of Foreign Trade, Kolkata Campus, India. He has completed Ph.D in Economics from Calcua University in 2000. His main areas of research are Empirical Internaonal Trade and Environment Economics. ** Avijit Mandal is an Assistant Professor of Economics at the Maulana Azad College, Kolkata. He has got Master Degree in Economics from Calcua University. His area of interest is internaonal trade. Ranajoy Bhattacharyya Indian Institute of Foreign Trade J-1/14, EP & GP Block, Sector-V, Salt Lake City, Kolkata-700091 Ph: (033) 2357 2854 (Extn. 133) e-mail: [email protected] Keywords: Tariff Elascity, Balance of Trade, Free Trade Agreements, India, ASEAN. India signed a Free Trade Agreement with ASEAN on 13th August, 2009. In this paper we analyze one aspect of the possible impacts of the FTA: that on India’s Balance of Trade. It is found that the impact of the agreement on India’s balance of trade is expected to be negave. India’s imports will rise significantly, however there will be no commensurate rise in India’s export to these countries except to Indonesia. Estimating the Impact of the Indo-ASEAN Free Trade Agreement on India’s Balance of Trade Ranajoy Bhattacharyya* and Avijit Mandal**
Transcript of Estimating the Impact of the Indo-ASEAN Free Trade Agreement on India’s Balance of Trade

Journal of Global Analysis
January 2010
www.cesran.org
Journal of Global Analysis, Vol. 1, No. 1, 2010 -
Special Issue: International Political
Economy
* Ranajoy Bhattacharyya is a Professor at the Indian Institute of Foreign Trade, Kolkata Campus, India. He has completed Ph.D in Economics from Calcutta University in 2000. His main areas of research are Empirical International Trade and Environment Economics.
** Avijit Mandal is an Assistant Professor of Economics at the Maulana Azad College, Kolkata. He has got Master Degree in Economics from Calcutta University. His area of interest is international trade.
Ranajoy BhattacharyyaIndian Institute of Foreign TradeJ-1/14, EP & GP Block, Sector-V,Salt Lake City, Kolkata-700091
Ph: (033) 2357 2854 (Extn. 133)
e-mail: [email protected]
Keywords: Tariff Elasticity, Balance of Trade, Free Trade Agreements, India, ASEAN.
India signed a Free Trade Agreement with ASEAN on 13th August, 2009. In this paper we analyze one aspect of the possible impacts of the FTA: that on India’s Balance of Trade. It is found that the impact of the agreement on India’s balance of trade is expected to be negative. India’s imports will rise significantly, however there will be no commensurate rise in India’s export to these countries except to Indonesia.
Estimating the Impact of the Indo-ASEAN Free Trade Agreement on India’s Balance of Trade
Ranajoy Bhattacharyya* and Avijit Mandal**

www.cesran.org

Journal of
Global Analysis
9
Estimating the Impact of the Indo-ASEAN Free Trade Agreement on India’s Balance of Trade
Estim
ating
the I
mpac
t of t
he In
do-A
SEAN
Free
Trad
e Agr
eeme
nt on
India
’s Ba
lance
of Tr
ade
1. Introduction
India signed a framework agreement on comprehensive economic cooperation with the Association of South East Asian Nations (ASEAN)1 in October 2003. The agreement proposed to progressively liberalize and promote trade (in goods and services) as well as investments between them. As a means to that end the agreement proposed to enter into negotiations for the creation of a Regional Trade and Investment Area (RTIA) which includes a Free Trade Area in goods. After negotiations lasting almost six years a Free Trade Agreement (FTA) was signed between them on 13 August 2009. The objective of the proposed RTIA a part of which was implemented by the signing of the FTA appears to be economic as well as political with the political part being as important as the economic, if not more2. On the economic front, several arguments have been put forward, either for ASEAN as a whole or for particular countries within ASEAN, in favor of the RTIA in all the three areas that are expected to be covered by it: a goods agreement (see for example, Mehta (2005)), a services agreement (Joseph and Parayil (2004) and Karmakar (2005)) and an investment agreement (Mukherjee et al (2003)).
There are however skeptics who are especially critical of the FTA part of the RTIA. Interestingly some of these arguments have been put forward by politicians rather than economists. For example one of the members of the Indian parliament from Kerela, Mr. A. K. Anthony is of the opinion that an FTA with ASEAN “will hurt the interests of states like Kerala as Customs tariff of produces such as pepper, coffee and palm oil would have to be brought down substantially in the next 10 years under the agreement”3. Indeed there are clear economic reasons for being skeptical. The
1 Acknowledgements: We are indebted to Indrayan Bhattacharya, T. P. Ghosh and C. S. P. Magee for data support and comments on earlier drafts. We are especially indebted to two anonymous referees of their valuable com-ments that improved the paper immensely. All remaining errors are ours.
Association of South East Asian Nations was established on 8 August 1967 in Bangkok by the five original member countries e.g. Indonesia, Malaysia, Singapore and Thailand. Brunei Darussalam joined on 8 January 1984, Viet-nam on 28 July 1995, Laos and Myanmar on 23 July 1997, and Cambodia on 30 April 1999.
2 The Prime Minister is quoted to have said that “A free trade agreement with the ASEAN is an international politi-cal commitment and is also part of the “Look-East” policy,” Economic Times, 25 July 2009.
3 The Economic Times, 25 July 2009. It is expected that this agreement will adversely affect domestic production of traditional crops like pepper, palm oil, cardamom, rubber and coffee. Southern part of Kerala is known for cardamom, pepper, tea and rubber that grow on its misty hills. But there are huge differences in the productivity, labour cost and inputs. India can produce 380 kilograms of pepper in one hectare land where as it is 1000 kilo-grams in Vietnam and 3000 kilograms in Indonesia (As Thomas Verghese told Inter Press Service). Thus the surge of import of pepper has the potential of completely wiping out the domestic producers of this good. Also the import of cheap palm oil from Malaysia (World’s largest producer of palm oil) will seriously affect the producers of Palm Oil in India. Also affected will be the fishing industry.

Estim
ating
the I
mpac
t of t
he In
do-A
SEAN
Free
Trad
e Agr
eeme
nt on
India
’s Ba
lance
of Tr
ade
10
Journal of Global Analysis
average tariff for the ASEAN countries in 2006 was 6.53% (for all products) which was substantially lower than the average tariff of India to these countries (16.55%). Thus an FTA will clearly imply that India will have to bring tariffs down to a greater extent than the ASEAN. Also, among the ASEAN members India has preferential trade agreements with Thailand, Myanmar and Singapore4. This leads to lower impact of the Indo ASEAN FTA for these three ASEAN members. Finally due to a much stronger trade relationship between these countries and China, market access for India will lower in the ASEAN member countries (see, Pal and Dasgupta (2009)).
Pitted against these are strong economic reasons in favor of signing an FTA. Almost all of India’s major trading partners are developed countries. There is therefore a greater potential of trade expansion when a trade agreement is signed with countries that are stronger than India economically but with whom India does not yet have a strong trade relationship. The ASEAN 6 countries are classic examples in this regard. Also India has large trade surpluses with many of its developed trading partners (like, for instance, USA, UK and Italy, see table 1). Thus the deleterious effects of opening up the country’s production sector to foreign competition are not something that is empirically obvious. Also as numerous studies have shown India’s price elasticity of import is substantially smaller than price elasticity of export5. So the expectation of “the flood gate opening up” may be misnomer. Fourthly, if one presumes that a major reason for signing the FTA is that trade between India and ASEAN is well below potential6, the FTA is expected to have a substantial amount of trade creation effect7. Also, ASEAN already has FTAs with three major Asian countries: China, Japan and South Korea giving these countries a competitive edge in the ASEAN region vis-à-vis India. Signing an FTA is expected to bring India at par with these countries in the ASEAN market. Finally, Indian industry is likely to gain from Indo ASEAN FTA from the cheaper import of the intermediate goods from ASEAN8.
Given the above perspective in this paper we attempt to analyze the effect of the Indo-ASEAN FTA on India’s balance of trade (BOT). The approach that we follow is: we first estimate the tariff elasticity of India’s bilateral exports and imports to and from ASEAN 69 from 1989 to 2006. Once the elasticities have been estimated, we calibrate the
4 India has started to negotiate with many countries simultaneously for signing FTAs. In fact many of them like Malaysia are parts of ASEAN. Though to our knowledge there is no comprehensive discussion on India’s sudden infatuation for FTAs, Whalley (1998, 2008) discuss the possible reasons for the proliferation of FTAs in the inter-national context.
5 According to Little and Joshi (1994) India’s export demand and supply elasticites at the aggregate level in the short run and the long run are: 1.22, 3.0, 1.2 and 1.5 (Period: 1962- 1984). However the import demand elasticity ranges from -.5 to -1.0 (Period: 1971-1995 see Dutta and Ahmed (2001)).
6 We will turn to this issue below and, will show that the statement is generally not true.
7 That this might well be the case is bourn out by the low share of India in ASEAN’s total trade (2.18 %). The share with countries of comparable GDP like USA, Japan and China are substantially higher at 11.1%, 10.7% and 10.6% respectively.
8 Theoretically, as long as the volume of trade expands due to the FTA there will always be gains to be reaped from it. This basic result is however considerably complicated by the fact that an FTA can have serious distributional consequences and the losers are often never compensated though that can, at least theoretically, be done (see, for example, Feenstra (2004) ch 6). It should be noted here that there is a large amount of literature on the condi-tions under which regional cooperation actually occur (see Reardon et al (2002) for a cryptic summary of major theoretical underpinnings of regional cooperation).
9 ASEAN 6 is chosen because ASEAN 6 constitutes 92 % of the total GDP of ASEAN. The share of ASEAN 6 in ASEAN’s total trade with world is about 94%. Most importantly in ASEAN’s total trade with India 97% of the trade comes from ASEAN 6. Thus ASEAN 6 virtually represents the entire ASEAN.

Estim
ating
the I
mpac
t of t
he In
do-A
SEAN
Free
Trad
e Agr
eeme
nt on
India
’s Ba
lance
of Tr
ade
11
Journal of Global Analysis
post FTA situation by interpolating the tariff values to zero and reporting the resulting values of trade. We do this exercise (a) for the entire panel of the ASEAN 6 countries in a gravity model framework and (b) for individual countries over time by estimating the country specific import demand functions. Note that the approach gives us an upper bound to the trade effect in the sense that tariffs are not instantaneously adjusted to zero immediately after the signing of an FTA. Secondly, the approach gives us the ex ante summation of the trade creation and the trade diversion effects of the FTA10. However one limitation of the approach is that it fails to distinguish between the two.
Though, to our knowledge, this method of looking at the possible effects of an FTA is fairly uncommon to the literature, there is a long history of research on FTAs that have already been implemented11 and the paper falls in this tradition. The paper also contributes to the currently raging debate (both in academic circles and in media) about the pros and cons of the Indo-ASEAN FTA (Sen, Asher and Rajan (2004), Mehta (2005), Yong (2005), Joseph and Parayil (2004), Karmakar (2005), Mukherjee et al (2003)).
The rest of the paper is arranged as follows. Section 2 introduces the current status of Indo ASEAN trade. Section 3 briefly reviews the background of the FTA between India and ASEAN. The methodology of the current analysis is covered in section 4 while the data sources are given in section 5. Section 6 deals with the analysis of empirical results. Concluding remarks are discussed in section 7.
2. Current Trade between India and ASEAN
India and the South East Asian countries have traded with each other since the ancient period. In the middle ages India’s trade with this region was mainly in spices and textiles. Now the product basket has changed significantly. In recent times India’s export to ASEAN mainly consists of oil (33.3%12), chemicals (8.6%), machinery (6.6%), gems and jewellery (4%), cotton yarn and fabrics (2.3%), meat and meat preparations (1.6%) and pharmaceuticals (1.6%). ASEAN’s export to India includes mineral oil (29%), machinery (22.7%), edible vegetable and vegetable oil (10%), organic chemical (5.4%), wood and wood products (4%).
Tables 2 and 3 bring out the salient features of trade between the two economic entities. Though India and ASEAN (as a whole) are comparable, in terms of area13, in terms of imports ASEAN is much more important to India than India is to ASEAN. India is also less open than ASEAN. However India’s total trade with ASEAN has increased about three fold between 2001 and 2006 (from US $ 7.8 billion to US $ 30.7 billion).
10 The trade diversion effect is included because the tariff elasticity is calculated on the basis of historical data on actual trade which reports aggregate changes in import as tariff levels fall, some of this change can theoretically be due to the shift of import destinations towards the country in question (trade diversion).
11 See for example, Coulibaly (2004), Susanto, Rosson and Adcock (2007), Calfat and Flores (2006), Liu (2004) Hapsari and Mangunsong (2006), Magee (2008). For India, see, for example Mehta and Naraynan (2006), Asher’s (2007), Mohanty (2003), Kelegama and Mukherjee (2007).
12 Percentage of total trade for 2006
13 The average area of ASEAN 6 is about 3.01million sq. km. and population of ASEAN 6 is 206 million (2006). Where as for India total land area is 2.97 million sq. km. and population is 1122 million (2006).

Estim
ating
the I
mpac
t of t
he In
do-A
SEAN
Free
Trad
e Agr
eeme
nt on
India
’s Ba
lance
of Tr
ade
12
Journal of Global Analysis
This growth in trade is significantly higher than India’s growth rate of trade with other regions of the world14. India has also penetrated ASEAN markets to a greater extent than ASEAN has been able to do for Indian markets (15.7 % vs. 2.8 %). One reason for this might be the fact that India is more protectionist than ASEAN (see col. 4 and 5 in table 2). However, India’s degree of openness is growing more rapidly (15.4%) than that of the ASEAN (1.7%).
Considering that ASEAN and India have a combined population of 1.7 billion, a GDP of US$ 1.9 trillion in 2006 and have advantage of geographical propinquity Table 3 also brings out the fact that Indo ASEAN trade is far below potential. In fact trade between them is minuscule compared to world trade flows. However Indo ASEAN trade as a proportion of ASEAN’s trade with world is growing at a much higher rate than that of India’s total trade with world (18.2% vs. 3.8%).
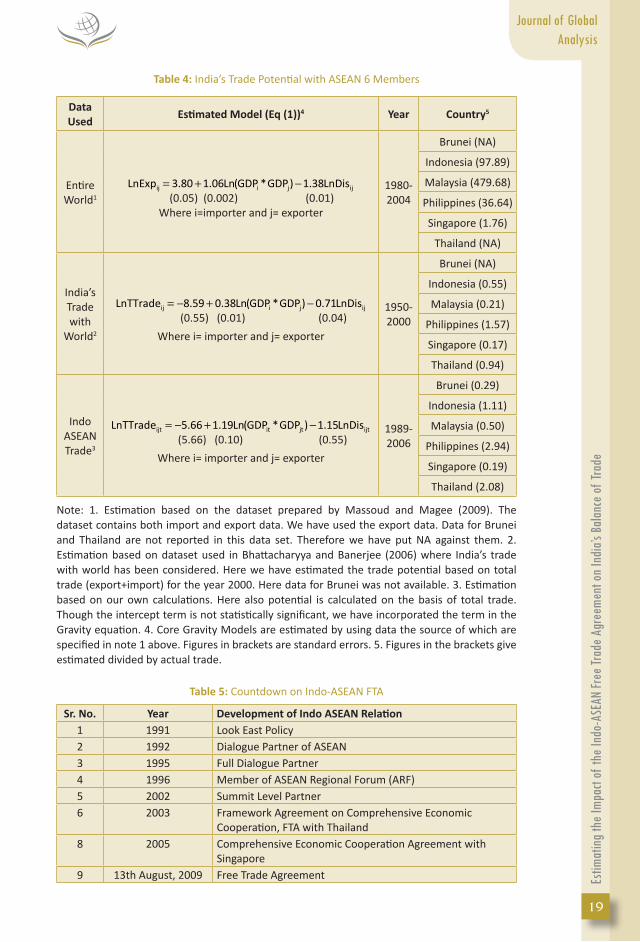
The issue of non-achievement of trade potential is fully brought out in table 415 where we have determined the Indo-ASEAN trade potential with respect to three data sets: a) the world gravity data set for 2003 b) the gravity data set for India with all its trading partners between 1950 and 2000 and c) for the Indo-ASEAN data set from 1989 to 2006 with which we are working here. We estimate three different gravity models using these three different data sets. For each, we estimate the value of India’s trade with ASEAN 6 partners and then in column 4 of table 4 present this as a ratio of the actual trade with that partner. Where this ratio exceeds 1, it indicates the potential for more trade. India’s trade is below potential with all the ASEAN countries when we consider aggregate world trade as the benchmark. However the situation drastically changes when we use India as the benchmark. Compared to what India has traded on the aggregate with its own partners India’s trade is below potential only with Philippines. Put in another way, India’s trade with most countries of the world is so small that India’s trade with the ASEAN countries (barring Philippines) can be considered as adequate given this (abnormally low) benchmark. When the potential is evaluated only with Indo-ASEAN data, as expected half of the countries operate above and half below potential with Thailand, Philippines and Indonesia being below potential. Of the countries that are above potential Singapore and Brunei are so because of the smallness of their GDP. Malaysia is the only country with whom India appears to have adequate amount of trade among the ASEAN countries.
3. Indo-ASEAN FTA: A brief Background
Indo-ASEAN trading relations received a momentum about a decade ago after the adoption of the “Look East Policy”16 (LEP) by India in 1991 (see table 5 for a full chronology of the events leading up to the signing of the FTA). The first step in this direction was taken in 1992 when India became a “dialogue partner” of the ASEAN graduating to the level of a “full dialogue partner” during the fifth ASEAN summit in Bangkok in 1995.
14 Growth rate of 58% vs 34 % for Indo-EU Trade and 32 % for Indo-North American trade.
15 See equations (1) below for a definition of the variables in the table.
16 Look East Policy was launched by India in 1991 as a response to the end of cold war following the collapse of the Soviet Union. This political consensus has emerged to promote trade liberalization to participate in the new trend of globalization. It was more than a foreign policy for India as it provides a development alternative in the age of globalization.

Estim
ating
the I
mpac
t of t
he In
do-A
SEAN
Free
Trad
e Agr
eeme
nt on
India
’s Ba
lance
of Tr
ade
13
Journal of Global Analysis
This relation was reinforced in 1996 when India was granted membership of the Asian Regional Forum17 (ARF). In this forum India’s renewed interest for closer economic and political ties with her south-east Asian neighbours was reciprocated by many of them who seemed to be pursuing an unstated “Look West” policy of increasing their interaction with India. This intensification of the economic linkages with the ASEAN led India into a second phase of its LEP. Phase-I of the policy was characterized by the establishment of trade and investment linkages. Phase-II (starting from 2004) is marked by arrangements for free trade areas and establishing institutional economic linkages between the countries of the region and India. The Indo-ASEAN FTA is the latest development in Phase II of the LEP thus far.
The gestation for the agreement has however been a long and tortuous one. The framework agreement of 2003 was followed by more than 15 meetings of the trade negotiation committee before a consensus was reached. The primary reason for the stalemate in talks was the disagreement over the sensitive list, which includes items which are to be protected against tariff cuts.
Ultimately when the agreement was signed there were four groups of products enlisted for tariff reduction: normal track, sensitive track, special products and exclusion list. In case of normal track the applied most favoured nation (MFN) rates will be reduced and subsequently eliminated. For sensitive track (see table 6) all the applied MFN tariff rates that are above 5% will be reduced to 5% in accordance with the country specific reduction schedules. In case of special products India has decided to reduce tariff rates at a much more gradual pace than either the normal track or the sensitive track. Finally the agreement also refers to the exclusion list of 489 products for which no reduction commitments have been made.
4. Methodology
As we have already mentioned our method of determining the influence of the Indo-ASEAN FTA on India’s balance of trade is to calculate tariff elasticities of India’s exports and imports with respect to the ASEAN 6 and then calculate the estimated trade value corresponding to a zero tariff situation. The data that we work with is a pooled time series cross section data from 1989 to 2006 for the six countries in the ASEAN 6. Using this data we first determine the pooled elasticity for the entire sample by using the following fixed effects gravity models for India’s import from ASEAN and ASEAN import from India:
=
= α + β ∆ +β + β +∑6
NT I I I Iijt j j 7 it jt 8 ij ijt
j 1
LnImp Ln(GDP *GDP ) Ln(D ) u (1)
=
= α + β ∆ +β + β +∑6
NT A A A Ajit j j 7 it jt 8 ij ijt
j 1
LnImp Ln(GDP *GDP ) Ln(D ) u (2)
=
= α + β ∆ +β + β + β +∑6
T I I I I Iijt j j 7 it jt 8 ij 9 ijt ijt
j 1
LnImp Ln(GDP *GDP ) Ln(D ) LnTar u (1a)
17 Asian Regional Forum aims to promote stable relationship between member countries. It can be viewed as useful complement to the bilateral alliances and dialogues between India and ASEAN member countries, which are at the heart of the region’s security architecture.

Estim
ating
the I
mpac
t of t
he In
do-A
SEAN
Free
Trad
e Agr
eeme
nt on
India
’s Ba
lance
of Tr
ade
14
Journal of Global Analysis
=
= α + β ∆ +β + β + β +∑6
T A A A A Ajit j j 7 it jt 8 ij 9 jit ijt
j 1
LnImp Ln(GDP *GDP ) Ln(D ) LnTar u (2a)
(i=India, j=ASEAN 6)
Where KijtImp
is the import of country i (in our case India) from country j (the six ASEAN
members considered here) in time period t for situation K (NT=Model without tariff, T=Model with tariff), ijD
is the bilateral distance between the trading partners, itGDP
and jtGDP are the income levels for country India (indexed by i) and country j for time period t respectively, ∆ j is the intercept dummy for country j, ijtTar is the tariff imposed by India for imports from country j in time t , jitTar is the tariff imposed by ASEAN members on India in time t and ijtu is the error term. Suffices I and A in the explanatory variables stand for India and ASEAN respectively. The effect of the FTA on, India’s imports is measured by:
λ = −∑^ ^
NT Tijt ijt ijt
j
Imp Imp
Provided I9β̂ is significant (zero otherwise).
The effect of the FTA on India’s export is:
λ = −∑^ ^
NT Tjit jit jit
j
Imp Imp
Provided βA9
ˆ is significant (zero otherwise). Of course λ ijt and λ jit are also determined
for all j.
Since the estimates βI9
ˆ and βA
9ˆ pertain to the entire sample, we have also estimated
a simplified version of the import demand function that can also be treated as the bilateral trade version of the frictionless gravity model for individual countries to determine the effect of the FTA when the effect is calculated on the basis of the data for country j only:
= α + β +NT I Iijt 10 it itLnImp LnGDP u (3)
= α + β +NT A Ajit 10 jt jtLnImp LnGDP u (4)
= α + β + β +T I I Iijt 10 it 11 ijt itLnImp LnGDP LnTar u (3a)
= α + β + β +T A A Ajit 10 jt 11 jit jtLnImp LnGDP LnTar u (4a)
Where KijtImp
is the import of country i (in our case India) from country j (the six ASEAN
members considered here) in time period t for situation K (NT=Model without tariff, T=Model with tariff).
Exactly as in above the effect of the FTA will be represented as:
η = −^ ^
NT Tijt ijt ijtImp Imp
η = −^ ^
NT Tjit jit jitImp Imp
Where ηijt represents the effect of FTA on India’s import from ASEAN 6 and ηjit shows
the effect of FTA on ASEAN six member’s import from India.

Estim
ating
the I
mpac
t of t
he In
do-A
SEAN
Free
Trad
e Agr
eeme
nt on
India
’s Ba
lance
of Tr
ade
15
Journal of Global Analysis
5. Data Sources
India’s export and import data with the ASEAN members are taken from World Integrated Trade Solution (WITS) database. Trade data is in million US $. We have divided the current value of trade with the consumer price index (CPI) of the US to arrive at the real value of trade. Data for US CPI (for all urban consumers) is taken from US Department of Labour. India’s GDP data is taken from Reserve Bank of India Handbook of Statistics and ASEAN’s GDP data come from ASEAN Statistical Yearbook, ASEAN Secretariat. Tariff data for both India and ASEAN is taken from Trade Analysis and Information System (TRAINS) database. Distances are measured by great circle air distance between capital cities. Distance data is taken from www.cepii.fr/anglaisgraph/bdd/distances.htm.
6. Results
Estimates of equations (1a) and (2a) are provided in tables 7 and 8. Since the distance variable does not have enough variation (all the countries are located close to each other), there is colinearity between the distance variable and the constant term (Correlation: 0.89). Since the distance variable proxies for the constant term in the equation, this turn out to be a fixed effect model with a constant. For making the model consistent we need to drop one dummy (for Brunei). Hence the equations actually estimated are:
=
= β ∆ +β + β + β +∑6
T I I I Iijt j j 7 it jt 8 ij 9 ijt ijt
j 2
LnImp Ln(GDP *GDP ) Ln(D ) LnTar u
=
= β ∆ +β + β + β +∑6
T A A A Ajit j j 7 it jt 8 ij 9 jit ijt
j 2
LnImp Ln(GDP *GDP ) Ln(D ) LnTar u
Let us now turn to the results. The most important point to note from the tables 7 and 8 is that the variable Lindtar (log of tariff imposed by India on ASEAN exports18) in table 7 is negative and statistically significant, while the variable Lastar (log of tariff imposed by ASEAN on Indian exports) in table 8 is still negative but not statistically significant. Thus while ASEAN exports are sensitive to tariff imposed by India, Indian exports are not. Hence the result of a reduction of tariffs will be asymmetric: while ASEAN’s access to markets in India will rise to a significant extent, there will be no significant rise in India’s access to markets in the ASEAN.
Apart from the significance of tariff elasticites, there are several other important issues highlighted in the two tables. First, the size effect (GDP product elasticites) is higher for India’s imports. Second the fixed effect dummies are all significant for ASEAN imports while they are all insignificant for Indian Imports. Third, in spite of the statistical insignificance of Lastar ASEAN imports have a higher adjusted R2 than Indian imports. What these three observations imply is that ASEAN’s import are driven more by country specific and size issues and less by price factors such as tariffs. However the opposite holds for Indian imports: price is more important than country specific issues or size issues. Interestingly the simple correlation between the India’s export to
18 Which was the same as the MFN tariff.

Estim
ating
the I
mpac
t of t
he In
do-A
SEAN
Free
Trad
e Agr
eeme
nt on
India
’s Ba
lance
of Tr
ade
16
Journal of Global Analysis
ASEAN and ASEAN tariff is -0.75 while that between ASEAN export to India and Indian tariffs is -0.91. Thus the level of association between both sets of variables is strong. For Indian exports to ASEAN however the association does not survive the control of other plausible factors such as size, distance and country specific factors. For ASEAN exports to India the association is robust to these variables.
Let us now turn to the analysis of the time series elasticites (models 3a and 3b) in column 2 of table 9. The obvious conclusion to make from the column is that, ceteris paribus, barring Indonesia the market access of Indian goods to all other countries in the ASEAN is going to remain stagnant (at the 5% level) due to any decline in tariffs19. Indian imports are however going to rise from all these countries except Philippines and Brunei20 (column 3, table 9). The major additional insight that we get from the time series analysis is that India’s exports to Indonesia are extremely price sensitive. Though quantitatively different the time series estimates of elasticities are therefore similar in spirit to the results in the pooled data analysis.
The implication of the tariff elasticity results on India’s balance of trade is reported in tables 10-13. Note that to get exact estimates of trade values in the pre and post FTA situations we have to rerun all the regressions without logs. Hence the quantitative results are different than what would appear from the elasticity coefficients. The results are obviously model and data sensitive. By its very nature the estimate of the elasticity of a particular country in the pooled data analysis internalizes an overflow of information from other countries as well. This overflow imparts a bias to the results for particular countries in the pooled case. For instance, the direction of the bias is discernable from a comparison of the results in the two cases for India’s import from ASEAN. First let us note that the average of the significant bilateral elasticities in table 9 column 3 turns out to be -0.96 which is almost equal to the pooled elasticity whose value is -0.92. By virtue of being close to the average the pooled elasticity overestimates the elasticities for Singapore, Malaysia and Thailand and underestimates the elasticity of Indonesia for India’s import from ASEAN 21. It also underestimates Indonesia’s import from India as this turns out to be statistically significant in the time series results in spite of being insignificant for the pooled data.
Turning to the results, first note that since the tariff elasticity for India’s export is statistically insignificant we have not reported any change for Indian exports to the ASEAN due to the FTA for this case. Change in BOT is thus calculated simply on the basis of a rise in India’s import.
19 However the tariff elasticity of Indian export to Indonesia is so strong that it overwhelms the insensitivity of the variable with respect to all other countries and makes the time series elasticity of total ASEAN import from India significant.
20 Note that the results for these countries are vastly different for the pooled analysis and the country-wise analy-sis. This is because the tariff elasticity of India’s import is significant for the aggregate pooled data while it is insignificant for these countries when they are taken in isolation. This suggests that the significance of the pooled elasticity was due to the effects of countries other than these two. India’s main import from Brunei is crude oil, which being a necessity is insensitive to tariffs. The case Philippines is less obvious. Note though that India’s import from this country is the lowest among the ASEAN 6 countries and this was the only country among the ASEAN 6 which was found to have a positive trade potential when the potential was determined with respect to India’s trade with all its trading partners in table 4. Thus India’s trade with Philippines is still at a nascent stage. This might have contributed to the result.
21 Note however that we have not applied the standard time series procedures that are usual for time series mod-els. Also the time period is too short to make the estimates robust.

Estim
ating
the I
mpac
t of t
he In
do-A
SEAN
Free
Trad
e Agr
eeme
nt on
India
’s Ba
lance
of Tr
ade
17
Journal of Global Analysis
India’s aggregate imports are expected to increase by about 13 % due to the implementation of the FTA. For no country is the increase expected to be less than 8 %. The abnormal increase in case of Brunei is due to the sudden increase in oil imports from this country in 2006. The highest increase is expected from Philippines (22 %). Note that India’s import from this country was lowest at around 120 mn US$ in 2006 (rank 6th among ASEAN 6). Thus the FTA will go some way in making Philippines at par with some of the other ASEAN 6 members as far as India’s import is concerned. It is important to note that Philippines was the only country among the ASEAN 6 with which India had a trade surplus in 2006. This surplus will change to deficit with the implementation of the FTA. As we will see below this observation is not replicated for the import demand function estimates.
The results for the time series data is along the same lines. There is expected to be a rise in export only to Indonesia. This rise is higher than the rise in import from that country so that India’s BOT with Indonesia is expected to improve due to the FTA22. India’s export to other ASEAN destinations is not expected to rise significantly23. The net effect on India’s balance of trade is still expected to be negative (table 13). The only significant difference is that whereas the pooled elasticity suggests that India’s BOT with ASEAN will deteriorate by about 53.5 million US$, for the time series estimate the deterioration is slightly less at about 35 million US$.
7. Concluding Comments
This paper has clearly shown that Indian imports will rise significantly and there will be no commensurate rise in India’s exports due to the Indo-ASEAN FTA. The question that arises therefore is: why is India keen on signing the agreement? Finding an answer to this question lies outside the scope of this paper. However several conjectures can be made. The first conjecture is that though the FTA may not make much of an economic sense in terms of balance of trade it makes enough political sense to outweigh the negative economic impact. As we have already mentioned the major political objective of the FTA is to counter China’s rising influence on ASEAN. This is clearly something that many other countries of the world (including Japan and USA) look forward to India for. The possibility is therefore high that the move will help India to improve relationships with countries which have powerful voices in most international forums. The second conjecture is that the goods scenario depicted here is only a part of the aggregate economic scenario. The negative effects on the goods front will be outweighed by the positive effects emanating from other fronts like trade in services and especially foreign direct investments to and from these countries24. If this is so however by signing the FTA before the services and investments agreements India has lost out on the opportunity to bargain for concessions in goods by yielding some concessions
22 Note that this is not the conclusion that one would arrive at from table 8 where the elasticities are reported as India’s elasticity of import is higher than Indonesia’s in the table. Recall that the actual magnitudes are calculated for the model without logs.
23 Since both import and export elasticities are statistically insignificant at the 5 % level for Philippines, the switch from surplus to deficit reported for the pooled data does not carry through here.
24 Several studies are available on the existence of the significant complementarity between India’s service ori-ented economy and ASEAN’s light manufacturing driven economy (Sen et al (2004), Kumar (2002), Bhattacharya and Arif (2002) and Pal and Dasgupta (2008).

Estim
ating
the I
mpac
t of t
he In
do-A
SEAN
Free
Trad
e Agr
eeme
nt on
India
’s Ba
lance
of Tr
ade
18
Journal of Global Analysis
in services and investments. Thirdly it should be emphasized that even purely from the goods angle; some of the goods imported will be intermediate goods which will boost the production of final goods at cheaper prices in India. This may increase India’s exports in the long run. Finally it should be noted that deterioration in balance of trade is in no way related to deterioration of welfare for India. There is indeed a tendency in political circles of overemphasizing the negative impact on the producers (of the goods whose import will increase). Logically this should be balanced out with the positive impact on the consumers and the efficiency gains (see Ohyama (1972), Grinols and Wong (1991) and Ju and Krishna (2000)). Calculating the net welfare impact of the trade balance deterioration and formulating an appropriate tax subsidy regime thus remains an important agenda for future research.
Table 1: India’s Balance of Trade (BOT) With Some Developed Countries for 2006
Country BOT (Mn US$)Greece 462.49
Italy 907.75Netherlands 1512.56
Spain 1249.92UK 1442.42
USA 7124.46
Source: Director General of Foreign Trade (DGFT) data
Table 2: Indo ASEAN Trade: Basic Issues
YearIndia’s share in ASEAN imports
ASEAN’s share in Indian imports
Degree of openness (India)1
Degree of openness (ASEAN average)1
2001 0.011 0.085 0.20133 1.300202002 0.014 0.084 0.23057 1.201102003 0.016 0.095 0.24774 1.236052004 0.017 0.082 0.29138 1.433792005 0.018 0.073 0.32165 1.476582006 0.019 0.097 0.35651 1.40986
Note: 1. Trade (export plus import) GDP ratio.
Source: ASEAN Secretariat, RBI Handbook of Statistics and DGFT Data, WITS- World Integrated Trade Statistics
Table 3: Indo ASEAN Trade in Global Perspective (2001-06)
YearIndo ASEAN Trade as a Percentage of
World Trade
Indo ASEAN Trade as a Percentage of
ASEAN Trade with World India’s Trade with World
2001 0.07 1.14 8.242002 0.08 1.37 8.562003 0.09 1.61 9.332004 0.10 1.64 8.992005 0.11 1.74 8.442006 0.14 2.18 9.84
Source: ASEAN Secretariat and DGFT Data, World Integrated Trade Statistics (WITS)
Estim
ating
the I
mpac
t of t
he In
do-A
SEAN
Free
Trad
e Agr
eeme
nt on
India
’s Ba
lance
of Tr
ade
19
Journal of Global Analysis
Table 4: India’s Trade Potential with ASEAN 6 Members
Data Used
Estimated Model (Eq (1))4 Year Country5
Entire World1
= + −ij i j ijLnExp 3.80 1.06Ln(GDP *GDP ) 1.38LnDis (0.05) (0.002) (0.01)
Where i=importer and j= exporter
1980-2004
Brunei (NA)
Indonesia (97.89)
Malaysia (479.68)
Philippines (36.64)
Singapore (1.76)
Thailand (NA)
India’s Trade with
World2
= − + −ij i j ijLnTTrade 8.59 0.38Ln(GDP *GDP ) 0.71LnDis
(0.55) (0.01) (0.04)
Where i= importer and j= exporter
1950-2000
Brunei (NA)
Indonesia (0.55)
Malaysia (0.21)
Philippines (1.57)
Singapore (0.17)
Thailand (0.94)
Indo ASEAN Trade3
= − + −ijt it jt ijtLnTTrade 5.66 1.19Ln(GDP *GDP ) 1.15LnDis (5.66) (0.10) (0.55)
Where i= importer and j= exporter
1989-2006
Brunei (0.29)
Indonesia (1.11)
Malaysia (0.50)
Philippines (2.94)
Singapore (0.19)
Thailand (2.08)
Note: 1. Estimation based on the dataset prepared by Massoud and Magee (2009). The dataset contains both import and export data. We have used the export data. Data for Brunei and Thailand are not reported in this data set. Therefore we have put NA against them. 2. Estimation based on dataset used in Bhattacharyya and Banerjee (2006) where India’s trade with world has been considered. Here we have estimated the trade potential based on total trade (export+import) for the year 2000. Here data for Brunei was not available. 3. Estimation based on our own calculations. Here also potential is calculated on the basis of total trade. Though the intercept term is not statistically significant, we have incorporated the term in the Gravity equation. 4. Core Gravity Models are estimated by using data the source of which are specified in note 1 above. Figures in brackets are standard errors. 5. Figures in the brackets give estimated divided by actual trade.
Table 5: Countdown on Indo-ASEAN FTA
Sr. No. Year Development of Indo ASEAN Relation1 1991 Look East Policy2 1992 Dialogue Partner of ASEAN3 1995 Full Dialogue Partner4 1996 Member of ASEAN Regional Forum (ARF)5 2002 Summit Level Partner6 2003 Framework Agreement on Comprehensive Economic
Cooperation, FTA with Thailand 8 2005 Comprehensive Economic Cooperation Agreement with
Singapore9 13th August, 2009 Free Trade Agreement

Estim
ating
the I
mpac
t of t
he In
do-A
SEAN
Free
Trad
e Agr
eeme
nt on
India
’s Ba
lance
of Tr
ade
20
Journal of Global Analysis
Table 6: Tariff Reduction Schedule for Special Products
ProductsBase Rate
2010 2011 2012 2013 2014 2015 2016 2017 2018 201931st
December 2019
CPO 80 76 72 68 64 60 56 52 48 44 40 37.5
RPO 90 86 82 78 74 70 66 62 58 54 50 45
Coffee 100 95 90 85 80 75 70 65 60 55 50 45
Balck Tea 100 95 90 85 80 75 70 65 60 55 50 45
Pepper 70 68 66 64 62 60 58 56 54 52 51 50
Source: Pal and Dasgupta (2009)
Table 7: Tariff Elasticity of India’s Import from ASEAN (Panel)
Variable Coefficient t-ratiosL(GDPi*GDPj) 1.23* 2.52
Lindtar -0.92* -2.21Dij -1.86* -2.34∆2 1.85 0.96∆3 3.25 1.88∆4 4.02* 2.47∆5 0.81 0.38∆6 0.34 0.23
*denotes significant at the 99% level. Adjusted R2 = 0.76.
Table 8: -Tariff Elasticity of ASEAN Import from India (Panel)
Variable Coefficient t-ratiosL(GDPi*GDPj) 0.96* 10.09
Lastar -0.04 -0.40Dij -1.68* -12.64∆2 0.97* 2.33∆3 1.54* 4.02∆4 2.22* 7.27∆5 0.87 1.73∆6 1.08* 3.09
*denotes significant at the 99% level. Adjusted R2 = 0.95.
Table 9: Tariff Elasticities Calculated on the Basis of Import Demand Functions1
Country ASEAN import from India India’s import from ASEAN
Brunei -0.84(-0.40)2 -2.02(-0.07)
Indonesia -1.07(-6.48) -1.81(-3.91)
Malaysia -0.31(-1.34) -0.70(-2.32)
Philippines -0.34(-1.77) 0.44(0.83)
Singapore NA3 -0.43(-2.29)4
Thailand -0.34(-1.80) -0.89(-3.02)
ASEAN -0.49(-3.53) NA
India NA -0.72(-3.01)
Note: 1. Estimates are AR(1) adjusted 2. Figures in the brackets give the t-ratios. 3. Singapore’s tariff on India’s export is zero from 1995 on all products however 4. India’s Tariff with respect to Singapore is not zero.

Estim
ating
the I
mpac
t of t
he In
do-A
SEAN
Free
Trad
e Agr
eeme
nt on
India
’s Ba
lance
of Tr
ade
21
Journal of Global Analysis
Table 10: Magnitude of Increase in India’s Import from ASEAN for 2006
(Pooled Data)1,2 (Value in Mn US$)
CountryActual Import
Predicted Import with tariff ( T
ijtImp )
Predicted Import without tariff ( NT
ijtImp )
Absolute Increase in
Import ( λ ijt )
Percentage increase in
Import
Brunei 1.87 1.80 3.43 1.63 90.19
Indonesia 16.82 23.29 25.24 1.94 8.34
Malaysia 25.22 17.85 19.75 1.90 10.66
Philippines 36.94 8.13 9.94 1.99 22.16
Singapore 8.92 21.38 23.37 2.01 9.32
Thailand 0.60 12.35 14.36 1.80 16.29
ASEAN 90.37 84.8 96.09 11.27 13.30
Note: 1. Values are in real terms. 2. Estimates are based on models without log.
Table 11: Magnitude of Increase in India’s Import from ASEAN for 2006
(Import Demand Function) 1 (Value in Mn US$)
CountryActual Import
Predicted Import with
tariff ( TijtImp )
Predicted Import without tariff ( NT
ijtImp )
Absolute Increase in
Import ( ηijt )
Percentage increase in
Import
Indonesia 16.82 16.70 17.50 0.80 4.77
Malaysia 25.22 23.80 25.12 1.32 5.54
Singapore 36.94 33.57 34.61 1.04 3.11
Thailand 8.92 8.19 8.36 0.17 2.01
ASEAN 87.9 82.26 85.59 3.33 4.04
Note: See note in table 10.
Table 12: Magnitude of Increase in India’s Export to ASEAN for 2006
(Import Demand Function) 1 (Value in Mn US$)
CountryActual Import
Predicted Import with
tariff ( TijtImp )
Predicted Import without tariff
( NTijtImp )
Absolute Increase in Import ( ηijt )
Percentage increase in
Import
Indonesia 6.98 6.66 8.42 1.76 26.39
Note: See note in table 10.

Estim
ating
the I
mpac
t of t
he In
do-A
SEAN
Free
Trad
e Agr
eeme
nt on
India
’s Ba
lance
of Tr
ade
22
Journal of Global Analysis
Table 13: - India’s Balance of Trade with ASEAN 6
(Value in Mn US$)
Estimate CountryIndia’s BOT with ASEAN 6 (2006 -
Actual)
India’s BOT with ASEAN 6
(Post FTA)1
Extent of Deterioration of India’s BOT due to
the FTA2
Pooled Data
Brunei -1.82 -3.43 1.61
Indonesia -9.84 -25.24 15.4
Malaysia -18.75 -19.75 1.0
Philippines 1.51 -9.94 11.45
Singapore -12.80 -23.37 10.57
Thailand -0.89 -14.36 13.47
ASEAN 6 -42.59 -96.09 53.5
Time Series
Brunei -1.82 03 NA3
Indonesia -9.84 -9.08 -0.76
Malaysia -18.75 -25.12 6.37
Philippines 1.51 03 NA3
Singapore -12.80 -34.61 21.814
Thailand -0.89 -8.36 7.47
ASEAN 6 -42.59 -77.17 34.58
Notes: 1. Since India’s export elasticity/ASEAN’s import elasticity with respect to India is statistically insignificant in pooled data India’s export increase will be zero. So change in BOT will incorporate only the rise in imports due to FTA. In the time series results ASEAN’s import elasticities with respect to India are insignificant except Indonesia. In all other cases (except Brunei and Philippines where both export and import are statistically insignificant) change in BOT incorporates only the rise in imports due to FTA 2. Note a positive sign implies deterioration of BOT. 3. India’s tariff elasticity with respect to ASEAN and ASEAN’s tariff elasticity with respect to India are both statistically insignificant. 4. Note since India’s tariff is still positive with Singapore.

Estim
ating
the I
mpac
t of t
he In
do-A
SEAN
Free
Trad
e Agr
eeme
nt on
India
’s Ba
lance
of Tr
ade
23
Journal of Global Analysis
Bibliography
Acosta, G. Milling, A. and Sullivan, G. (2004): “The Effects of NAFTA on Trade and Welfare in the US Fresh Tomato Industry”, Journal of International Food and Agribusiness Marketing, Vol. 16, Issue 1 (2004).
Anand, M. (2009) “India-ASEAN Relations”, IPCES special report, Institute of peace and Conflict Studies, New Delhi.
Asher, M.G. (2007): “India’s Rising Role in Asia”, Discussion Paper no. 121, Research and Information System for Non-Aligned and Other Developing Countries (RIS), New Delhi.
Asher, M.G. and Sen, R. (2005):“India: East Asia Integration: A Win-Win for Asia”, Discussion Paper no. 91, Research and Information System for Non-Aligned and Other Developing Countries (RIS), New Delhi.
Bhattacharyya, R. and Banerjee, T. (2003): Does Gravity Model Explain India’s Direction of Trade? A Panel Data Approach”, Working Paper No. 2006-09-01, Indian Institute of Management, Ahmedabad.
Bhattacharya, B. and Ariff, M. (2002): “Study of AFTA-India Linkages for the Enhancement of Trade and Investment”, A report submitted to Government of India and the ASEAN Secretariat, May.
Clafat, G. and Flores, R.G. (2006): “The EU-MERCOSOL Free Trade Agreement: Quantifying Mutual
Gains”, JCMS 2006, Vol. 44, Number 5, pp 921-945.
Cheng, D. (2008): “A Chinese Perspective on the China-Australia Free Trade Agreement and Policy Suggestions”, Economic Paper, Vol 27, Issue 1(March 2008).
Coulibaly, S. (2004): “On the Assessment of Trade Creation and Trade Diversion Effects of Developing RTAs”, Mimeo, University of Lausanne.
Dutta, D. and Ahmed, N. (2001): “An Aggregate Import Demand Function for India: A Cointegration Analysis”, Australia South Asia Research Centre, Research School of Pacific and Asian Studies, Working Paper No. 02.
Feenstra, R.C. (2004): “Advance International Trade: Theory and Evidence”, Princeton University Press, 2004.
Grinols, E.L. and Wong, K. (1991): “An Exact Measure of Welfare Change”, Canadian Journal of Economics, 24: 429-49.
Hapsari, I.M. and Mangunsong, C. (2006): “Determinants of AFTA Members’ Trade Flows and Potential for Trade Diversion”, Asia-Pacific Research and Training Network on Trade Working Paper Series No. 21.
Joseph, K.J. and Parayil, G. (2004): “India ASEAN Cooperation in Information and Communication Technologies: Issues and Prospects”, Discussion Paper no. 70, Research and Information System for Non-Aligned and Other Developing Countries (RIS), New Delhi

Estim
ating
the I
mpac
t of t
he In
do-A
SEAN
Free
Trad
e Agr
eeme
nt on
India
’s Ba
lance
of Tr
ade
24
Journal of Global Analysis
Joshi, V and Little, I.M.D. (1994): “India: Macroeconomics and Political Economy 1964-1991”, Oxford University Press.
Ju, J. and Krishna, K. (2000):“Welfare and Market Access Effects of Piecemeal Tariff Reform”, Journal of International Economics 51: 305-16.
Karmakar, S. (2005): “India ASEAN Cooperation in Services: An Overview”, Indian Council for Research on International Economic Relation, Working Paper, Number 176.
Kelegama, S. and Mukherjee, I.N. (2007): “India Srilanka Bilateral Free Trade Agreement: Six Years performance and Beyond”, Discussion Paper no. 119, Research and Information System for Non-Aligned and Other Developing Countries (RIS), New Delhi.
Koopman, B. Winston, A. and Fox, A. (2006), “Decomposing NAFTA; An Application of the USAGE model and an Approach to Model Validation”, Conference Paper presented at the 9th Annual Conference on Global Economic Analysis, Addis Ababa, Ethiopia, 2006.
Kumar, N. (2002): “Towards an Asian Economic Community: The Relevance of India”, Discussion Paper no. 34, Research and Information System for Non-Aligned and Other Developing Countries (RIS), New Delhi.
Liu, T. (2004): “Implications of Trade Creation and Trade Diversion Effect on Trade between RTAs and China and Australia”, Proceedings of the 16th Annual Conference of the Association for Chinese Economics Studies, Australia (ACESA), 2004.
Massoud, T. and Magee, C. (2009): “The Impact of Trade on the Political, Military, and Economic Cooperation between States”, Mimeo, Department of Economics, Bucknell University, Lewisburg, USA.
Magee, C.S.P. (2008): “New Measures of trade creation and Trade Diversion”, Journal of International Economics, 75(2008), pp 349-362.
Mehta, R. (2005): “India Vietnam Trade: Current Relations and Prospects”, Discussion Paper no. 105, Research and Information System for Non-Aligned and Other Developing Countries (RIS), New Delhi.
________ and Narayanan, S. (2006): “India’s Regional Trading Arrangements”, Discussion Paper no. 114, Research and Information System for Non-Aligned and Other Developing Countries (RIS), New Delhi.
Mohanty, S.K. (2003): “Possibility of Close Economic Cooperation between India and Singapore”, Discussion Paper no. 45, Research and Information System for Non-Aligned and Other Developing Countries (RIS), New Delhi.
Mukherjee, A. Mody, A. Taneja, N. and Sachdeva, R. (2003):“Indo-Singapore Trade in Services: Enhancing Cooperation, Indian Council for Research on International Economic Relation, Working Paper, Number 1998.
Ohyama, M. (1972): “Trade and Welfare in General Equilibrium”, Keio Economic Studies 9: 37-73.

Estim
ating
the I
mpac
t of t
he In
do-A
SEAN
Free
Trad
e Agr
eeme
nt on
India
’s Ba
lance
of Tr
ade
25
Journal of Global Analysis
Pal, P. and Dasgupta, M. (2008): “Does a Free Trade Agreement with ASEAN Make Sense?”, Economic and Political Weekly. November 15, 2008, 8-12.
Pal, P. and Dasgupta, M. (2009): “The ASEAN India Free Trade Agreement: An Assessment”, Economic and Political Weekly, 38, 11-15.
Reardon, J. Kiling, N.D. McCorkle, D.E. and Miller, C. (2002): “The Formation of Regional Trade Blocs”, American Business Review, Vol 20, No. 1, 91-99.
Sen, R. Asher, M.G. and Rajan, R.S. (2004):“ASEAN India Economic Relations: Current Status and Future Prospects”, Discussion Paper no. 73, Research and Information System for Non-Aligned and Other Developing Countries (RIS), New Delhi.
Susanto, D. C. Rosson, P. and Adcock, F.J. (2007): “Trade Creation and Trade Diversion in the North American Free Trade Agreement: The Case of Agricultural Sector”, Journal of Agriculture and Applied Economics, 39, 1 (April 2007: 121-134.
Whalley, J. (1998): “Why Do Countries Seek Regional Trade Agreements?”, In: Jeffrey A. Frankel, The Regionalization of the World Economy. United States of America: National Bureau Economic Research. Pp. 63-86.
Whalley, J. (2008): “Recent Regional Agreements: Why So Many, Why So Much Variance in Form, Why Coming So Fast, and Where Are They Headed?”, The World Economy, pp. 517-532.
Young, O.K. (2005): “Advancing the ASEAN-India Partnership in the New Millennium”, Discussion Paper no. 96, Research and Information System for Non-Aligned and Other Developing Countries (RIS), New Delhi.

www.cesran.org