
Estimating the effects of activists in two-party and multi-party systems: comparing the United...
36
Soc Choice Welf (2011) 36:483–518 DOI 10.1007/s00355-010-0507-0 ORIGINAL PAPER Estimating the effects of activists in two-party and multi-party systems: comparing the United States and Israel Norman Schofield · Christopher Claassen · Ugur Ozdemir · Alexei Zakharov Published online: 4 November 2010 © Springer-Verlag 2010 Abstract This article presents an electoral model where activist groups contribute resources to their favored parties. These resources are then used by the party candi- dates to enhance the electoral perception of their quality or valence. We construct an empirical model of the United States presidential election of 2008 and employ the electoral perception of the character traits of the two candidates. We use a simulation technique to determine the local Nash equilibrium, under vote share maximization, of this model. The result shows that the unique vote-maximizing equilibrium is one where the two candidates adopt convergent positions, close to the electoral center. This result conflicts with the estimated positions of the candidates in opposed quad- rants of the policy space. The difference between estimated positions and equilibrium positions allows us to estimate the influence of activist groups on the candidates. We compare this estimation with that of Israel for the election of 1996, and show that vote maximization leads low valence parties to position themselves far from the electoral origin. We argue that these low valence parties in Israel will be dependent on support of radical activist groups, resulting in a degree of political fragmentation. N. Schofield (B ) · C. Claassen · U. Ozdemir Center in Political Economy, Washington University, 1 Brookings Drive, Saint Louis, MO 63130, USA e-mail: schofi[email protected] C. Claassen e-mail: [email protected] U. Ozdemir e-mail: [email protected] A. Zakharov State University-Higher School of Economics Moscow, Moscow, Russia e-mail: [email protected] 123
-
Upload
independent -
Category
Documents
-
view
1 -
download
0
Transcript of Estimating the effects of activists in two-party and multi-party systems: comparing the United...
Soc Choice Welf (2011) 36:483–518DOI 10.1007/s00355-010-0507-0
ORIGINAL PAPER
Estimating the effects of activists in two-partyand multi-party systems: comparing the United Statesand Israel
Norman Schofield · Christopher Claassen ·Ugur Ozdemir · Alexei Zakharov
Published online: 4 November 2010© Springer-Verlag 2010
Abstract This article presents an electoral model where activist groups contributeresources to their favored parties. These resources are then used by the party candi-dates to enhance the electoral perception of their quality or valence. We construct anempirical model of the United States presidential election of 2008 and employ theelectoral perception of the character traits of the two candidates. We use a simulationtechnique to determine the local Nash equilibrium, under vote share maximization,of this model. The result shows that the unique vote-maximizing equilibrium is onewhere the two candidates adopt convergent positions, close to the electoral center.This result conflicts with the estimated positions of the candidates in opposed quad-rants of the policy space. The difference between estimated positions and equilibriumpositions allows us to estimate the influence of activist groups on the candidates. Wecompare this estimation with that of Israel for the election of 1996, and show that votemaximization leads low valence parties to position themselves far from the electoralorigin. We argue that these low valence parties in Israel will be dependent on supportof radical activist groups, resulting in a degree of political fragmentation.
N. Schofield (B) · C. Claassen · U. OzdemirCenter in Political Economy, Washington University, 1 Brookings Drive,Saint Louis, MO 63130, USAe-mail: [email protected]
C. Claassene-mail: [email protected]
U. Ozdemire-mail: [email protected]
A. ZakharovState University-Higher School of Economics Moscow, Moscow, Russiae-mail: [email protected]
123
484 N. Schofield et al.
1 Introduction
This article offers a unified model of the electoral process in order to account for anumber of general empirical observations about the effects of political institutions.As Duverger (1954) and Riker (1953) have observed, there appears to be a relation-ship between the electoral rule in place, and the number of political parties in thepolity. A highly majoritarian (or plurality) system tends to result in just two parties,while an electoral system based on proportional representation (PR) tends to give afragmented political structure.1 Many authors have also argued that there is a rela-tionship between fragmention and the durability of government (Taylor and Herman1971; Warwick 1994). Other authors have argued that these differing constitutionalrules profoundly affect the nature of the policy process (Bawn and Rosenbluth 2005;Persson and Tabellini 2000, 2003).
It is possible that the degree of political fragmentation is a direct consequence of thedetails of the electoral rule, and the opportunities these provide for strategic voting inthe electorate. However, the formal spatial electoral model has not, in our view, beenable to offer a plausible account of this relationship. Indeed, as discussed in Schofield(2007a), the extensive literature on formal “deterministic” or “stochastic” vote modelstend to suggest that all parties should adopt vote-maximizing positions at the center ofthe electoral distribution.2 Such models assume an underlying symmetry in the moti-vations and dispositions of party leaders, and as a result they are unable to account forthe extreme heterogeneity of political configurations observed by Benoit and Laver(2006), for example, in their analysis of party positions in European polities.
In this article, we offer a formal stochastic model of elections that emphasizesthe importance of the idea of valence. In the standard spatial model, only candidatepositions matter to voters. However, as Stokes (1963, 1992) has emphasized, the non-policy evaluations, or valences, of candidates by the electorate are equally important.Stokes (1963, p. 373) used the term valence issues to refer to those that “involve thelinking of the parties with some condition that is positively or negatively valued by theelectorate.” As he observes, “in American presidential elections... it is remarkable howmany valence issues have held the center of the stage.” We use the stochastic valenceelectoral model to compare party strategies in Israel, where the electoral system isbased on proportional rule, with that of the United States, where the electoral systemis highly majoritarian.
We argue that, in the United States, the differences between the valences of the twomajor presidential candidates are insufficient to force them to adopt divergent posi-tions. Instead, the logic of vote maximization should force convergence to the electoralorigin.3 Since candidates do not converge, we propose a model where activist groupsprovide the resources that are critical for political success. However, these activistsrequire the candidates to adopt divergent positions in return for political support. In
1 See Laakso and Taagepera (1979) for a formal definition of fragmentation.2 See Downs (1957), Riker and Ordeshook (1973), and McKelvey and Patty (2006).3 The electoral origin is simply that point which is at the mean on all dimensions of the distributionof voter preferred points.
123

Estimating the effects of activists 485
essence, a small number of influential activist groups induce the polarization that hasbeen noted in the U.S.polity.4
In contrast, in Israel, as in other polities based on proportional representation, thereare significant valence differences between the parties. By themselves, these valencedifferences are sufficient to force the parties to diverge. Activists may well influence theparties, but this influence appears much less significant than in the United States. Moreimportantly, since small parties may aspire to membership of coalition government,their activist coalitions have no incentive to coalesce. Thus, the relatively fragmentedparty structure is maintained. In the United States, the greater intensity of competitionfor activist support means that small activist groups, if they are to have any impact,must join one or other of the major party activist groups. This forces coalescence ofthe activist groups. We argue that the relationship between political fragmentation andthe nature of the electoral system, noted by Riker (1953) and Duverger (1954), is theresult of this logic of activist support.
There is a long tradition of argument that interest groups induce policy choices thatare non-optimal for the society (Olson 1965; Keefer 2004; Acemoglu and Robinson2006), but this article is the first, we believe, to develop a formal and empirical votemodel that indicates how to estimate the impact of activist groups on the policy stancesof political leaders in polities with different electoral systems.5
Electoral models involving this notion of valence has formed the basis for recentextensive analyses of British, Canadian and US electoral response by Clarke et al.(2009a) and Clarke et al. (2005, 2009b).6
For Britain, they argue that electoral responses
were a reflection largely of [the] changing perceptions of the decision-makingcompetence of the main political parties and their leaders. At any point in time,[the] preferences were strongly influenced by their perceptions of the capacityof the rival parties—the putative alternative governments of the day—to solvethe major policy problems facing the country.
These works have shown that valence, as measured by the perceptions of the char-acter traits of the candidates, or of party leaders, is a key element of election.
Here, we extend the usual spatial model by incorporating these electoral perceptionsof candidate character traits in a stochastic model of the 2008 US election. Our pur-pose is different from the empirical work by Clarke et al. (2009b). Instead of focusingon the electoral response to candidates, we use this extended model to determine theresponse of candidates to the electoral situation: that is we compute the equilibriumcandidate positions in the context of the chosen model.
4 It is of interest that Bernhardt et al. (2009) use a one-dimensional vote model to argue that polarizationof party positions, if not too extreme, is welfare enhancing because of the choice that it provides for theelectorate.5 An early article by Enelow and Hinich (1982) presented a formal model involving valence, though theyused the term “non-spatial characteristic” rather than valence, but their model was not related to the impactof interest groups.6 See Schofield et al. (2010c) for similar studies of Britain and Canada.
123

486 N. Schofield et al.
In the stochastic model, a voter’s perception of each candidate’s traits has a verysignificant impact on the probability that the voter chooses one candidate or the other.Since these voters are characterized by different preferred policy positions, a candi-date’s optimal policy position should be a function of the distribution of these correlatedvoter positions/perceptions.7 Our simulation of the combined model, based on bothposition and valence, allows us to estimate what we call Local Nash equilibria (LNE)to the vote-maximizing game, as calibrated by the empirical model with the greateststatistical significance.8
We found, by simulation of the stochastic model of the US presidential electionin 2008 involving perception of candidate traits, that there was a unique local Nashequilibrium very close to the electoral origin.
In contrast, simulation of the multiparty stochastic model of Israel in 1996 foundthat the local Nash equilibrium were characterized by divergence away from the elec-toral center.
In Sect. 2 of this article, we briefly sketch our argument about the fundamentaldifferences in these two polities. Section 3 introduces the notion of the convergencecoefficient which can be used to determine whether candidates or parties should con-verge to the electoral center when they attempt to maximize vote share. Sections 4and 5 present the empirical analyses of these two polities. The concluding sectionemphasizes the differences between the majoritarian electoral system of the UnitedStates and the proportional system in Israel, as well as other fragmented polities suchas Poland and Turkey, that are highlighted by the formal and empirical analyses. Thisconclusion mentions other work that has estimated the convergence coefficients forvarious polities, and suggests these coefficients are related to the degree of politicalfragmentation in these political systems. Formal definitions for the model are givenin Appendix 1. See also the Appendix to Schofield et al. (2011) in this issue, for thedefinitions of the equilibrium concepts used here.
2 Comparison of the United States and Israel
To provide a brief sketch of the results on the 2008 U.S. election, consider Fig. 1, whichpresents the distribution of voter preferred points, as obtained from factor analysis ofsurvey responses from the American National Election Study (ANES 2008). This sur-vey allows us to estimate each respondent’s ideal point, as a way of representing thatcitizen’s responses. The estimated distribution of such points is the electoral distribu-tion. We shall refer to the space in which the electoral distribution is embedded as thefactor space. In formal spatial models, this space is usually known as the policy space.We use the term factor space to remind the reader that the basis for the constructionof this space is the factor analysis of the survey. In particular, the electoral distributionis directly estimated from the factor analysis.
7 Just as in Clarke et al. (2009b), we use factor analysis of the survey responses to obtain a two-dimensionalrepresentation of the voter preferred positions.8 Erikson and Romero (1990) used this procedure in an empirical model of the 1988 US Presidential elec-tion. However, they estimated local equilibrium positions on a number of separate policy dimensions, ratherthan in a single multidimensional policy space.
123

Estimating the effects of activists 487
x
x
x
x
x
x
x
x
x
x
x
x
x
x x
x
x
x
x
x
x
x
x xx
x x
x
x
x
x
x
x
x
x
x
x
x
x
x
xxx
x
x
x
x
x
x
x
x
xx
x
x
x
x
x
x
x
x
x
x
x
x
x
x
x
x
x
x
x
x
x
x
x
x
x
x
x
x
x
x
x x
x
x
x
x
x
x
x
x
x
x
x
x
xx
x
x
x
x x
x
x
x
x
x
x
x
x x
x
x
x
x
x x
x
xx
x
xx
x
x
x
x
x
x
x
x
x
x
x
x
x
xx
x
x
x
x
x
x
xx
x
x
x
x
x
x
x
x
x
x
x
xx
x
x
xx
x
x
x
x
x
x
x
x
x
x
x
x
x
x
x
x
xx
x
x
x
x
x
x
x
x x
x
xx
xx
x
x
x
x
x
xx
x
x xx
x
x
x
x
x
x
x
x
xx
x
x
x
x
x
xxx
x
x
x
x
x
x
x
x
x
x x
x
xx
x
x
x
x
xx
x
x
x
x
x x
x
x x
x
x
x
x
x
x
x
x
x
x
x
x
x
x
x
x
x
x
x
x
x
x
x
x
x
xx
x
x
x
x
x
x
x
x
xx
x
x
x
x
xx
x
x
x
xx
x
x
x
x x
x
x
xxx
xx
x
x
x
x
x
x
x
x
xx
x
x
x
x
x
x
x
xx
x
x
x
x
x
x
x
x
x
xx
x
x x
x
xx
x
xx
x
xx
x
x
xx
x
x
x
x
x x
x
x
x
x
xxx
x
x
x
x
xx
x
x
x
x
xxx
x
x
x
x
x
xx
xxx
x
x
x
x
x
x
x
xx
x
xx
x
x
xx
x
x
x
x
xx x
x
x
x
x
x
x
x
x
x
x
x
x
x
x
xx
x
xx
x
x
x
x
x
x
x
x
x
x
x
x
x
x
xx
x
x x
x
x
x
x
x
x
xxx
x
x
x
x
xxx
xx
x
x
x
xx
x
x
xx
x
x
xx
x
xx
x
x
x
x
x
x
x
x
x
x
x
x
x
x
x
x
x
x
x
x
x
x
x
x
x
x
x
xx
x xx
x
xx
x
x x
x
xx
x
x
x
x
x
x
x
xx
x
x
x
x
x
x
x
x
x
x
x
x
x
x
x
x
xx
x
x
x
x
x
x
x
x
x
xx
xx
x
x
x
x
x
xx
x
x
x
x
x
x
x
xx
x
x
x
x
x
x
xx
x
x
x
x
xx
x
x x
xx
x
x
x
x
x
x
xx
xx
x
xx
x
xx
x
x
xx
x
x
xx
xx
x
x
xx
x
x x
x
x
x
x
x
x
xx x
x
xx
x
x
x
x
x
x
x
x
x
x
x
x
x
x
x x
x
x
x
xx
xx
x
x
x
x
x x
x
x
x
x
x
x
x
x
x
x
x
x
x
x
x
x
x
x
x
xx
x
x
x
x
x
x
xxx
x
x
x
x
x
x x
xx
x
x
x
x
xx
x
x
x
x
x
x
x
x
x
x
x
xx
x
x
x
xx
x
x
x
x
xx
x
x
x
x
x
x
x
x
x
x
x
x
x
x
x
x
x
x
x
xx
x
x
x
x
x
x
x
x
x
-2 -1 0 1 2
-2-1
01
23
Economic Policy
S
ocia
l Pol
icy
Obama
McCain
Fig. 1 Distribution of voter ideal points and candidate position in 2008
For any polity, we refer to that point in the factor space which is at the mean inall dimensions of the electoral distribution as the electoral origin. The electoral dis-tribution is characterized by variances of the distribution on each axis, as well as thecovariance between the various axes.9
Figure 1 represents the voter locations in a two-dimensional factor space, so theelectoral distribution is given by a symmetric 2 by 2 covariance matrix. The x-axisinvolves economic or redistributive issues, and on this axis the variance of the electoraldistribution is 0.80. The y-axis involves social issues, and the variance on this axis is0.83.10
In an empirical model presented below, we estimate Obama’s position in the factorspace to be zObama = (−0.22,+0.75), a distance of 0.77 units from the electoralorigin.11 McCain’s position in the same factor space was estimated to be zMcCain =(0.59,−0.37), a similar distance of 0.69 from the origin, but in a different quadrantof the policy space.12
Moreover, the average Democrat voter position was zvoteDEM = (−0.17,+0.36)13,
while the average Republican voter position was zvoteREP = (0.72,−0.56) .14 The survey
also gave information on activists of the parties (that is, individuals who contributedmoney to the parties). Figure 2 shows the distribution of activist positions, clearly very
9 The factor analysis in w dimensions thus gives a symmetric w by w electoral covariance matrix.10 The covariance between the two axes is −0.127.
11 Details of the estimation method are given below. These estimates are the average perceptions of thevoters about the candidate positions.12 The distance in the factor space between the candidates was 1.38. Since the total electoral variance was1.63, we term
√1.63 = 1.27 the electoral standard deviation (esd). The two candidates are thus located
about 1.08 esd apart.13 The variances of the distribution of Democrat partisans ideal points on the two axes were (0.72, 0.75),
giving standard errors of the means of (0.029, 0.03).
14 The variances of the Republican partisans’ ideal points were (0.38, 0.47), so the standard errors of thesetwo means were (0.027, 0.03).
123

488 N. Schofield et al.
x
xx
x x
x
x x
x
xx
x
xx
x
x
x
x
x
x
xx
x
x
x
x
x
x
xx
x
x
x
xx
x
x
x
x
x
x
x
x
x
x
x
xxx
x
x
x
x
x
x
x
x
x
x
x
x
x
x
x
x x
x
x x
x
x
x
x
x
x
x
x
-2 -1 0 1 2
-2
-10
12
3
Economic Policy
S
ocia
l Pol
icy
o
o
o
oo
o
o
o
oo
o oo
o
o
o
o
o
o
o
oo
oo
o
o
oo
o
o
o
oo
o
o
o
oo
o
Obama
McCain
x: Democrat Activistso: Republican Activists
Fig. 2 Distribution of activist ideal points and candidate positions
Fig. 3 Presidents’ positions
different from the voter distribution given in Fig. 1. The mean activist positions forthe two parties were estimated to be zact
DEM = (−0.2,+1.14) for the Democrats andzact
REP = (1.4,−0.82) for the Republicans.The point to note about these estimates is that the Obama and McCain positions
appear significantly different, and some distance from the electoral origin. Obamais located midway on the social axis between Democrat voters and activists, whileMcCain is more centrist than both Republican voters and activists on the two axes.
The positioning of Democrat presidential candidates in the upper left of the policyspace, and Republican candidates in the lower right, has been noted in other empiricalwork, as suggested by Fig. 3.15
Related work (Schofield et al. 2003) has modeled the presidential elections of 1964and 1980, and argued that such a configuration is a structural characteristic of the US
15 This figure is taken from Schofield (2002). See other related work by Poole and Rosenthal (1984).
123

Estimating the effects of activists 489
polity. Indeed, Miller and Schofield (2003, 2008) and Schofield and Milller (2007)suggest that the US polity is fundamentally two dimensional. They use this featureas the basis for a model of political realignment (Sundquist 1973), as one dimensionbecomes more important than the other. One purpose of this article is to provide a for-mal account of what seems to be opposed policy positions offered by the presidentialcandidates in elections in the United States.
We argue here that the shifts in candidate positions for the two parties over time areinsufficient to account for the quite substantial changes in electoral support that occur.Instead our analysis suggests that electoral shifts are primarily the result of changesin the perceptions by the electorate of the candidates. These electoral transformation,in turn, are the consequence of the changing resources available to the candidates.Finally, these are due to the shifting coalition structures among the potential activistgroups in the polity.
If this suggestion is correct, then it implies that formal models of elections basedon position and valence alone are quite inadequate to account for candidate policyproposals. The following remarks and inferences suggest that any formal model of USelections must expliccitly include activist groups:
(i) The equilibrium analysis of spatial models of US presidential elections indicatesthat candidates should converge to positions very close to the electoral origin inorder to maximize vote shares.16
(ii) However, estimates of candidate positions indicate that they are located inopposed quadrants of the policy space.
(iii) The incompatibility of the equilibrium locations and the estimated positions canbe explained by the influence of activists in US elections.
(iv) Activist influence has increased over time.17 The recent Supreme Court deci-sion, Citizens United v. Federal Election Commission, on Thursday, January 21,2010, has removed limits on campaign contributions and will likely increasethe importance of activist contributions. Dworkin (2010) has called this deci-sion “an unprincipled political act with terrible consequences for the nation.”Obama, shortly after, in his State of the Union address declared
the Supreme Court reversed a century of law [which] I believe will open thefloodgates for special interests... to spend without limit in our elections.
(v) Although the distribution of voter positions may not change dramatically, so thedistribution cannot be seen to be polarized, the positions of candidates for officehave become more polarized.18 The system of primaries in US elections is likelyto further enhance the influence of activists on candidates.
(vi) Because of this polarization of candidate positions, a shift in the party controllingthe presidency will have significant policy implications.
16 This result has also been found by Enelow and Hinich (1989) for earlier U.S. elections.17 Indeed, Herrera et al. (2008) observe that spending by parties in federal campaigns went from 58 milliondollars in 1976 to over 1 billion in 2004 in nominal terms.18 See for example McCarty et al. (2006), and Fiorina et al. (2005).
123

490 N. Schofield et al.
(vii) The same argument holds for members of Congress, and we would expect activistinfluence to increase the degree of polarization in Congress.19
(viii) The influence of activists in the strongly majoritarian polity of the United Statesis the fundamental cause of these policy shifts.
(ix) Because the winner of the presidential election will generally be located somedistance from the electoral center, the policies supported by the President neednot be supported by an electoral majority. This phenomenon can be seen withregard to the reform of health care, supported by Obama in 2009/2010. Thispolicy is certainly located in the upper left quadrant of the policy space. As ofJanuary 22, 2010, about 39% of the electorate supported the health plan while55% did not.20
(x) In between elections, diametrically different policy positions will be aggres-sively supported by opposed lobbying groups. For example, in 2009, healthcare, pharmaceutical and insurance lobbyists spent approximately $650 millionon lobbying itself, and about $210 million on media advertising.21 The oil andgas industry spent about $560 million.22
(xi) Actual policy choices will depend on complex bargaining between the Presidentand Congress. As the health care issue illustrates, the supramajoritarian votingrule in the Senate will tend to favor the status quo.23
(xii) Activist-induced policy preferences in Congress is extremely heterogenous.24
This, together with a non-centrist presidential policy position, can result in so-called “gridlock.” 25
(xiii) During 2010, there is an increasing perception in the electorate that Congress hasbecome dysfunctional because of “strident partisanship, unyielding ideology anda corrosive system of campaign financing.” 26. For example, the CNN/OpinionResearch Corp. poll, conducted on February 12–15,2010, with 1,023 respon-dents, found that 86% thought government was “broken.” Of these, however,81% felt it could be “fixed.” In fact, gridlock can be overcome, as illustrated bythe 62–30 vote in the Senate on February 22 to implement a multi-billion “jobs
19 Conflict between the parties over health care in 2009 and 2010 is just one illustration of this phenomenon.20 The surprise victory by Republican Scott Brown over Democrat Martha Coakley in the special electionfor the Senate seat for Massachusetts, on January 19, 2010, may be indicative of this electoral response, aswell as “Tea Party activism.”21 The pharmaceutical industry was a strong supporter of reform of health care, because of an agreementwith Obama to protect the industry’s profits.22 Tomasky (2010) gives a figure of $3.47 billion for spending by lobbyists in the non election year of2009, citing data from the Center for Responsive Politics.23 Scott Brown’s victory in Massachusetts in January, 2010, deprived the Democrats of the 60 seat majorityrequired to overcome the filibuster and push through legislation on health care and other policy issues suchas financial reform.24 Work by Jeong et al. (2010) estimated the policy positions of US senators with regard to the 2006immigration reform act and found the Republican senator positions to be very heterogenous, but all clearlyin the lower right hand quadrant of the policy space.25 This of course contradicts the argument by Bernhardt et al. (2009) that divergence is welfare enhancing.26 Indeed, when Evan Bayh, Senator from Indiana, announced in February 2010, he would retire, thesewere the reasons he gave (Bayh 2010).
123

Estimating the effects of activists 491
creation” program. Gridlock over health care was also broken on March 25,after strenuous efforts by President Barack Obama and House speaker, NancyPelosi, when the House voted 220–207 for the health care bill. Republicans hadvoted unanimously against the legislation, joined by 33 dissident Democrats.The President had signed a draft of the bill, the “Patient Protection and Afford-able Care Act” on March 23, and the Senate passed the bill by simple majorityof 56 to 43, as required for reconciliation. In July 15, the Senate voted 60–39for the bill for Reform of Financial Regulation.27 As of July 2010, there remainfour major bills to put through Congress: A Deficit Reduction Act, an EnergyIndependence and Climate Change Act, an Expanded Trade and Export Act, anda Comprehensive Immigration Act. If these prove impossible to enact becauseof Republican opposition, the electorate may blame the GOP.
The success of the health care legislation and of reform of financial regulation,together with the signing of the new START arms reduction treaty in Prague on April8 by Presidents Medvedev and Obama, has certainly increased Obama’s internationalprestige.
However, given the uncertainty surrounding policy choice in the Legislature, itis hardly surprising that voters in the United States doubt that government can beeffective. Part of the problem would appear to be the degree of political polarizationresulting from the power of interest groups located in the opposed quadrants of thepolicy space.
We contrast these observations on the difficulties facing the U.S. government withinferences about a polity based on an electoral system using proportional representa-tion, such as Israel. We argue that in such a polity, activist influence is weaker, andpolicy shifts between different governments will be significantly smaller.
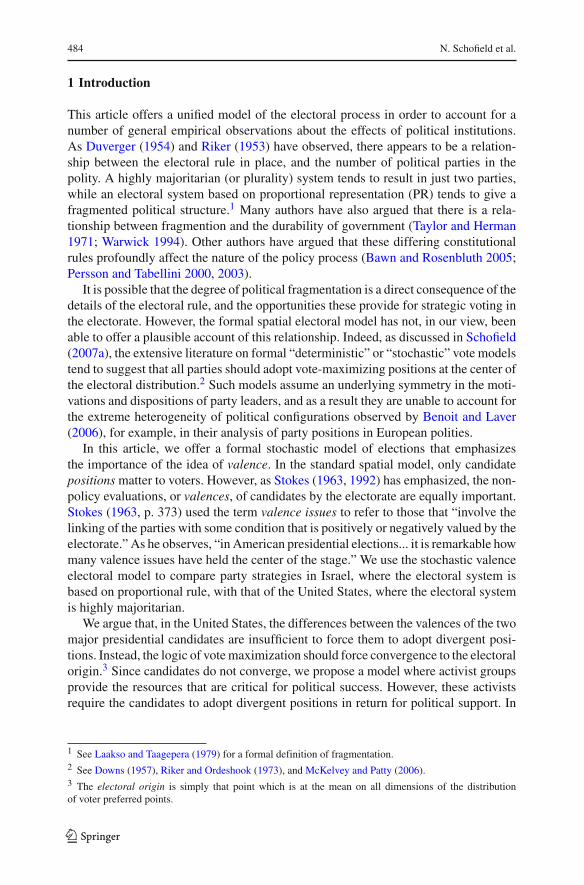
Figure 4 presents a smoothed estimate of the voter distribution, as well as theestimated party positions in Israel in 1996.28
The x-axis is designated security, and is defined in terms of attitudes to the PLO.The factor model was normalized with respect to this factor, so the electoral distribu-tion on this axis had a variance of 1.0. The y-axis involves religious attitudes and onthis axis the variance was 0.732. Note that in Fig. 4, the estimated positions of the twomajor parties, Labor and Likud, in the factor space are (−0.8,−0.3) and (0.4, 0.2).29
In the discussion of Israel elections in Sect. 3 of this article, we argue that the policypositions of coalition governments will depend on whether there is a core party, orone that is centrally located, and large enough to dominate coalition bargaining.
In the election of 2006, a centrist party, Kadima, initially under the leadership ofAriel Sharon, was able to position itself at the electoral origin, and form a coalition
27 This complex bill was 2,300 pages long. Russ Feingold, a Democrat, voted against the bill, because itwas not strong enough. Three moderate New England Republicans, Snowe and Collins of Maine, and ScottBrown of Massachusetts, voted for the bill.28 The party positions were obtained from expert estimates, and the voter distribution obtained from asurvey by Arian and Shamir (1999). See Schofield and Sened (2006).29 The distance in the factor space between these two parties was 1.3. Since the total electoral variancewas 1.732, the electoral standard deviation (esd) was
√1.732 = 1.32. The two parties were thus located
0.98 esd apart.
123
492 N. Schofield et al.
ShasNRP
Moledet
lll Way
Meretz
Labor
0
1
2
−2
−2 −1 0 1
Security
Rel
igio
n
2
−1
Gesher
Yahadut
Olim
Likud
Tzomet
Dem-ArabCommunists
Fig. 4 Party positions and voter distribution in Israel in 1996
with other smaller parties. In the recent election of February 2009, the smaller parties,estimated to be located in the upper right quadrant of the factor space gained somefurther electoral support. Netanyahu, the leader of Likud, then constructed a winningcoalition with the support of Labor and Israel Beitenu.
Our analysis suggests the following:
(i) In the US polity with a pronounced majoritarian electoral system, the twoparties, or their candidates, adopt divergent positions that are symmetricallyopposed.30
(ii) In Israel with a very proportional electoral system (but with a 2% cut-off) themajor parties typically adopt positions relatively close to the electoral origin,while the smaller parties occupy quite divergent positions. The result of bar-gaining between a major party and smaller parties will tend to result in centristoutcomes.31 The difficulty facing such a polity, especially when the politicalconfiguration is fragmented, is that agreement between the parties may be dif-ficult to attain. We comment in the conclusion on other empirical work that hasa bearing on this observation
Thus, a very rough interpretation of the significance of policy change, when nor-malized with respect to a natural characteristic of the electoral distribution, suggests
30 In particular, an estimate of policy changes from one administration to another will be of the order ofone esd.31 Policy changes from one government to another can be expected to be of the order of at most one esd.If the centrist Kadima party is included in the coalition, then policy switches will be less.
123
Estimating the effects of activists 493
that volatility, in terms of change in the political outcome, is a function of the natureof the electoral system. In this article, we present a general electoral model to providea formal account of this variation in political configuration.
3 Valence in the electoral model
The model we present is intended to cover both elections between candidates foroffice, such as president, from differing parties, as well as elections involving leadersof different parties. We shall use the term political leaders for both cases.
We assume first that leaders adopt positions to maximize their vote share in thecontext of a stochastic electoral model. Each leader, j is characterized by an intrinsic(or exogenous) valence, denoted by � j .
32 This can be estimated as the intercept termin the pure spatial model, and can be interpreted as the average electorally perceivedquality of each leader. Exogenous valence is estimated with respect to a baseline leader,so in the 2008 US election model we set �Obama = 0, and estimate �McCain. We usethe notion of a convergence coefficient, presented in Schofield (2007a) to show that thedifference between �Obama and �McCain is sufficiently small so that the equilibriumof the pure spatial model is one where the two candidates adopt identical positions atthe electoral origin.
The notion of exogenous valence is then extended to include heterogenous, so-ciodemographic valence terms. These sociodemographic valences cause each partyto seek out any group in the electorate which has a propensity to favor that leaderindependently of the leader’s declared policy position. In our simulation of the jointsociodemographic model, we found that even with these sociodemographic valencesthe equilibrium positions in the 2008 US election were not perturbed from the electoralorigin.
We then extended the model with exogenous and sociodemographic valences, byincluding the electoral perceptions of the candidate traits. These candidate traits addconsiderably to the significance of the valence model. Since these perceptions areindividually based, and, therefore, determined by voter position, we can use simu-lation techniques to compute the equilibrium positions implied by the full valencemodel. We found that the local equilibrium of the full model with traits was one wherecandidates adopted positions slightly different positions at zObama = (0.10, −0.07)
and zMcCain = (0.13, −0.12).To account for the disparity between the simulated local equilibrium positions of
the candidates and their estimated positions, we included activist valence in the for-mal model. We may regard activist valence as a kind of endogenous valence since itis the consequence of bargaining between party and activists.33 A party that has in thepast tended to adopt a policy position that favors a particular group may also benefitfrom the provision of resources, such as money and time, from activists belonging thegroup. The possibility of obtaining such resources, to enhance the electoral success of
32 See for example the formal model in Serra (2010) and an empirical model of the 2008 election in Jessee(2010).33 See the models in Grossman and Helpman (1994, 1996, 2001) and Baron (1994).
123

494 N. Schofield et al.
a candidate, will exert a centrifugal force, drawing the candidate closer to the group.The marginal calculation by each candidate can be interpreted as a balance condition,which incorporates all the valence terms. The term balance is used because it involvesequating the opposed centripetal attraction of the electoral center and the centrifugalactivist force.
The empirical work presented here for the United States suggests that the endog-enous valence terms for the candidates are very similar, so that, for the pure spatialmodel, the centripetal electoral force should dominate. Because the candidates divergefrom the center, we infer that the centrifugal activist valence terms are very signifi-cant. We argue that since the electoral system is highly majoritarian, potential activistgroups will tend to coalesce, so as to increase their influence on their chosen party.As we noted in the Sect. 1, increasing campaign expenditure by parties in the UnitedStates reflects the increase of activist influence.
Under proportional representation, as in Israel, major parties will be characterizedby high exogenous valence, in comparison to the more peripheral, low valence par-ties. The balance condition will cause the high valence parties to pay less heed tosociodemographic valence, and they will be less dependent on activist valence. As aconsequence, they will tend to be located near the electoral center. In contrast, smallparties will tend to represent the interests of very specific groups in the society. Theirexogenous valence, which is a measure of the perceived quality of the party leader inthe whole electorate, will be very low. The centripetal electoral effect on small partieswill be dominated by the centrifugal effect, and they will tend to adopt positions farfrom the electoral center.
In the application of the model to Israel in 1996, we show the intrinsic valence ofsuch small parties is indeed very low. This is a general phenomenon, which holds truefor models of elections in Poland and Turkey, as well as Israel.34 The vote share ofsuch parties will be very dependent on sociodemographic valence, as well as on thesupport of specific activist groups. Thus, the centrifugal force on such parties will befurther enhanced.
As illustrated by the case of Israel, relatively small parties will be pivotal for theformation of coalition government. Such parties may expect to gain office, and bringimportant policy rewards to their activist supporters. Thus, these specific sociodemo-graphic groups will, in expectation, gain from the support they provide to these parties.Both parties and activist groups will be motivated to maintain this mutually beneficialarrangement, and the leaders of such groups will have little motivation to coalescewith other groups. The high level of political fragmentation will be maintained unlessa dominant center party can attract some of the relatively radical activists.
To develop this argument, we first consider the United States. Section 4.1 presents astandard binomial logit model for the 2008 presidential election. This model does notinvolve candidate positions, so we then develop a spatial mixed logit model that doesinvolve candidate positions. Section 4.2 obtains the conditions that characterize thelocal Nash equilibria in the models with exogenous and sociodemographic valences
34 See Schofield et al. (2010b) for Poland. Schofield et al. (2011) for Turkey.
123

Estimating the effects of activists 495
as well as voter perceptions of the candidate traits. We then use these formal modelsto estimate the activist influences for this election on the candidates.
In Sect. 5, we perform the same analysis for the 1996 election in Israel, makinguse of the earlier analysis of Schofield and Sened (2006). Although we do have haveavailable the voter perceptions of character traits of the party leaders, we find that theestimates of exogenous valence obtained from a joint spatial model are sufficientlydifferent to account for the fact that parties do not converge to the electoral origin. Webriefly comment on the recent election of 2009, and suggest that the loss of dominanceby the centrist party Kadima was due to the decrease of sociodemographic and activistvalence by the Labor party.
4 The election of 2008 in the United States
4.1 Empirical analysis
The 2008 American National Election Study (ANES 2008) introduced many newquestions on political issues in addition to the existing set. Assignment of respondentsinto the “new” or “old” set was random, with 1,059 respondents assigned to the “new”condition and having completed the follow-up post-election interview.
The post-election interviews asked respondents whom they voted for, if at all. Sincewe use a conditional logit model, which requires data for both respondents and candi-dates (which we only have for the major party candidates) we removed observationswhere respondents claimed to have voted for a presidential candidate other than McC-ain or Obama, or not to have voted at all.
To create the two-dimensional policy space, 23 survey items were selected tobroadly represent the economic and social policy dimensions of American politi-cal ideology (see Appendix 2 for question wording). There were multiple questionsfor abortion, gay and African American issues. These three sets of questions werecombined using factor analysis to give three separate scales.
Factor analysis of the survey was then used to obtain measures of individual loca-tions in the policy space (see Table 1 for factor loadings).
The ANES also includes questions on seven qualities or traits associated withObama and McCain, asking respondents about the traits of the candidates, includingthe terms “moral, caring, knowledgable, strong, dishonest, intelligent, out of touch.”Factor analysis of these questions gave two factors, and the resulting factor scoreswere used as estimates of voter perceptions of the candidate’s personal traits.
To calculate the presidential candidate positions, we took advantage of new surveyquestions which asked respondents to locate the positions of Obama and McCain onseven distinct issues.
These seven questions (government spending, universal health care, citizenship forimmigrants, abortion when non-fatal, abortion when gender incorrect, aid to blacks,and liberal-conservative) were otherwise worded the same as the corresponding itemsfrom the 23 policy issue questions.
To find McCain’s ideal point, we simply took the average response for each of hisseven candidate location questions. We then repeated the process using Obama’s can-
123

496 N. Schofield et al.
Table 1 Factor loadings for economic and social policy
Question Economic policy Social policy
1. Government services 0.53 0.12
2. Universal health care 0.51 0.22
4. Government bigger 0.50 0.14
5. Government or market 0.56
9. Welfare spending 0.24
6. Less government 0.65
7. Equality 0.14 0.37
8. Tax companies 0.28 0.10
12. Abortion scale 0.55
11. Immigrant scale 0.12 0.25
13–16. Gay scale 0.60
17. Traditional values 0.53
18. Gun access 0.36
19–22. Afr. Amer. scale 0.14 0.45
23. Liberal v conservative 0.30 0.60
Eigenvalue 1.93 1.83
Table 2 Descriptive data
Econ Policy Social Policy n
Mean s.e. 95% C.I Mean s.e 95% C.I
Activists
Democrats −0.20 0.09 [−0.38,−0.02] 1.14 0.11 [0.92,1.37] 80
Republicans 1.41 0.13 [1.66, 1.16] −0.82 0.09 [−0.99,−0.65] 40
Non-activists
Democrats −0.17 0.03 [−0.24,−0.11] 0.36 0.04 [0.29,0.44] 449
Republicans 0.72 0.06 [0.60,0.84] −0.56 0.05 [−0.65,−0.46] 219
788
didate location questions. See Tables 2 and 3 for the descriptive data and the estimatedpositions of the two candidates.
Respondents were coded as activists if they claimed to have donated money to acandidate or party. The survey data gave information on whether the respondent wasAfrican American, Hispanic, female, working class, from the South. Additional dataon age, number of years of education, and level of income were used to construct eightdifferent sociodemographic variables.
Figure 1, above, gave the voter distribution, while Fig. 2 gave the activistdistribution.
123

Estimating the effects of activists 497
Table 3 Obama and McCainperceived positions
Question Obama McCain
Estimated position on economic policy −0.22 0.59
Estimated position on social policy 0.75 −0.37
As noted above, the positions of the major presidential candidates, McCain andObama, in 2008 were estimated using the perceptions of the sampled individuals.
These positions were:zObama = (xObama, yObama) = (−0.22, 0.75),zMcCain = (xMcCain, yMcCain) = (0.59,−0.37).
We now use the formal model to analyze this election.
4.2 Estimation of political equilibria
Obama’s victory on November 4, 2008 suggests that it was the result of an overallshift in the relative valences of the Democrat and Republican candidates from theelection of 2004. In fact, since Obama took 52.3% of the vote, a simple estimate ofthe probability, ρobama, of voting for Obama is given by
ρObama = [0.523] = exp[�Obama]1 + exp[�Obama]
It immediately follows that an estimate of �Obama relative to �McCain is given by
loge
[0.523
0.477
]= loge[1.096]� 0.09.
In fact there were differential shifts in different regions of the country. In a regionof the country from West Virginia through Tennessee, Arkansas, and Oklahoma, therewas a shift of 20% in the increase in the republican vote, suggesting a change of about0.6 in McCain’s valence advantage.
To model this election, we first constructed a pure positional binomial logit model.According to this positional model, a voter i, with preferred position (xi , yi ) is
estimated to vote Republican with probability
ρrep = exp(�r + bxi + cyi )
1 + exp(�r + bxi + cyi ). (1)
We estimated these coefficients to be (�r , b, c) = (−0.74, 1.49,−1.80), with stan-dard errors (0.11, 0.13, 0.15), respectively. All were significant at the 0.001 level.
This cleavage line derived from this the equation gives the locus of voting withequal probability for one or other of the candidates. This cleavage line is given by theequation
123

498 N. Schofield et al.
y = 0.82x − 0.4. (2)
This cleavage line misses the origin, and goes through the point (0,−0.4), indicatingthe valence advantage of Obama. The coefficient �r is a measure of the (negative)relative valance of McCain with respect to Obama for this positional model. Thiscleavage line is similar to those obtained by Schofield et al. (2003) for the presidentialelections of 1964 and 1980. (One difference between this earlier estimate and the onepresented here was that in 1980 they found that Reagan had a valence advantage overCarter.)
These positional models do not explicitly involve the candidate positions, and socannot be used to determine political equilibria. We now discuss the spatial models,presented in Table 4.
The electoral covariance matrix for the sample is given by
∇0 =[
0.80 −0.127−0.127 0.83
].
The principal component of the electoral distribution is given by the vector(1.0,−1.8) with variance 1.02, while the minor component is given by the orthogonaleigenvector (1.8, 1.0) with variance 0.61.
Model (1) in Table 4 shows the coefficients in 2008 for the pure spatial model to be
(�Obama,�McCain, β) = (0,−0.84, 0.85).
Table 4 indicates, the loglikelihood, Akaike information criterion (AIC), and Bayes-ian information criterion (BIC) are all quite acceptable, and all coefficients are signif-icant with P < 0.01.
Note that these parameters are estimated when the candidates are located at theestimated positions. Again, �McCain is the relative negative exogenous valence ofMcCain, with respect to Obama, according to the model M(�,β). We assume thatthe parameters of the model remain close to these values as we modify the candidatespositions in order to determine the equilibria of the model.
According to the model M(λ,β), the probability that a voter chooses McCain, whenthe McCain and Obama positions are at the electoral origin, z0 = ((0, 0), (0, 0)) is
ρMcCain = [1 + exp(0.84)]−1 = [1 + 2.31)]−1 = 0.3.Then β(1 − 2ρMcCain) = 0.85 × 0.4 = 0.34.The characteristic matrix (essentially the Hessian of McCain’s vote function
at z0 is:
CMcCain = [2β(1 − 2ρMcCain)∇0 = [2 × 0.34 × ∇0] − I = (0.68)∇0 − I
= (0.68)
[0.8 −0.127
−0.127 0.83
]− I =
[0.54 −0.086
−0.086 0.56
]− I
=[ −0.46 −0.086
−0.086 −0.44
]
123

Estimating the effects of activists 499
Table 4 β-Spatial conditional logit models for USA 2008
Spatial Sp. & Traits Sp. & Demog Full
McCain valence � −0.84∗∗∗ (0.11) −1.08∗∗∗ (0.13) −2.60∗∗ (0.93) −3.58∗∗∗ (1.05)
Distance β 0.85∗∗∗ (0.06) 0.78∗∗∗ (0.07) 0.86∗∗∗ (0.07) 0.83∗∗∗ (0.08)
McCain traits 1.30∗∗∗ (0.17) 1.36∗∗∗ (0.19)
Obama traits −1.02∗∗∗ (0.15) −1.16∗∗∗ (0.18)
Age −0.01 (0.01) −0.01 (0.01)
Female 0.29 (0.23) 0.44 (0.26)
African American −4.16∗∗∗ (1.10) −3.79∗∗∗ (1.23)
Hispanic −0.55 (0.41) −0.23 (0.45)
Education 0.15∗ (0.06) 0.22∗∗∗ (0.06)
Income 0.03 (0.02) 0.01 (0.02)
Working class −0.54∗ (0.24) −0.70∗∗ (0.27)
South 0.36 (0.24) −0.02 (0.27)
Observations 788
Log likelihood (LL) −298.63 −243.14 −250.25 −206.88
AIC 601.27 494.28 520.50 437.77
BIC 610.59 512.92 567.11 493.69
Standard errors in parentheses. ∗ P < 0.05; ∗∗ P < 0.01; ∗∗∗ P < 0.001Vote for Obama is the baseline outcome
The “convergence coefficient” is
c = 2β(1 − 2ρMcCain)trace∇0 = 2(0.34)(1.63) = 1.1.
Schofield (2007a) shows that the necessary condition for convergence to z0 is thatc < 1. Note that c is dimensionless, and therefore independent of the units of mea-surement.
The estimate for c exceeds this critical value for convergence. However, the deter-minant of CMcCain is positive and trace is negative so both the eigenvalues of CMcCainare negative. Standard results of calculus show that the origin is a maximum of McC-ain’s vote share function. Simulation of the pure spatial model confirmed that z0 wasan LNE. Indeed it was shown to be a Pure Strategy Nash equilibrium (PNE).
We also considered a spatial model where the x and y axes had different coeffi-cients, β1 = 0.8, β2 = 0.92. The analysis showed the the Hessian for this case hadnegative eigenvalues, so again z0 is a LNE. This model is essentially the same as themodel with a single β.
We now turn to the models with traits and sociodemographics.Table 4, above, gave the various spatial models with these additional valences.We found that the loglikelihoods of the pure sociodemographic model and pure
traits models to be to be −427 and −356, respectively. Comparison of the loglike-lihoods for the pure spatial model and the model with traits, as given in Table 4shows that the perception of character traits is important for the statistical significance
123
500 N. Schofield et al.
Table 5 Comparison of LL forUS spatial models in 2008
JST Joint spatial with traits, STspatial with traits, S pure spatial,T Pure traits
JST ST S T
JST na 36 92 150
ST −7 na 55 114
S −92 −55 na 58
T −150 −114 −58 na
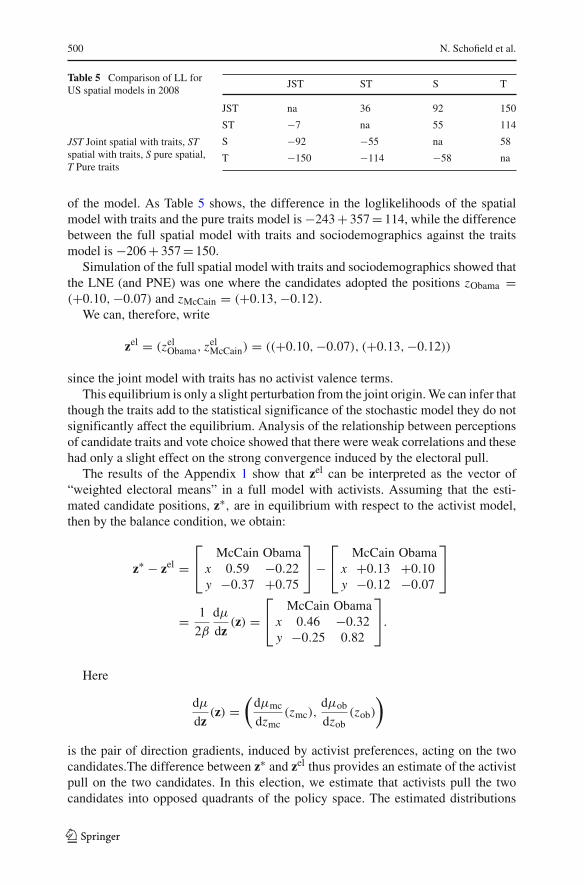
of the model. As Table 5 shows, the difference in the loglikelihoods of the spatialmodel with traits and the pure traits model is −243 + 357 = 114, while the differencebetween the full spatial model with traits and sociodemographics against the traitsmodel is −206 + 357 = 150.
Simulation of the full spatial model with traits and sociodemographics showed thatthe LNE (and PNE) was one where the candidates adopted the positions zObama =(+0.10,−0.07) and zMcCain = (+0.13,−0.12).
We can, therefore, write
zel = (zelObama, zel
McCain) = ((+0.10,−0.07), (+0.13,−0.12))
since the joint model with traits has no activist valence terms.This equilibrium is only a slight perturbation from the joint origin. We can infer that
though the traits add to the statistical significance of the stochastic model they do notsignificantly affect the equilibrium. Analysis of the relationship between perceptionsof candidate traits and vote choice showed that there were weak correlations and thesehad only a slight effect on the strong convergence induced by the electoral pull.
The results of the Appendix 1 show that zel can be interpreted as the vector of“weighted electoral means” in a full model with activists. Assuming that the esti-mated candidate positions, z∗, are in equilibrium with respect to the activist model,then by the balance condition, we obtain:
z∗ − zel =⎡⎣ McCain Obama
x 0.59 −0.22y −0.37 +0.75
⎤⎦ −
⎡⎣ McCain Obama
x +0.13 +0.10y −0.12 −0.07
⎤⎦
= 1
2β
dμ
dz(z) =
⎡⎣ McCain Obama
x 0.46 −0.32y −0.25 0.82
⎤⎦.
Here
dμ
dz(z) =
(dμmc
dzmc(zmc),
dμob
dzob(zob)
)
is the pair of direction gradients, induced by activist preferences, acting on the twocandidates.The difference between z∗ and zel thus provides an estimate of the activistpull on the two candidates. In this election, we estimate that activists pull the twocandidates into opposed quadrants of the policy space. The estimated distributions
123
Estimating the effects of activists 501
of activist positions for the two parties, in these two opposed quadrants (as given inFig. 1) are compatible with this inference. The means of these activist positions are:
⎡⎣ Rep Act Dem Act
x 1.41 −0.2y −0.82 1.14
⎤⎦.
Miller and Schofield (2003, 2008) propose a model where activists have eccen-tric or ellipsoidal utility functions. If we assume that the Democrat activists tend to bemore concerned with social policy and Republican activists tend to be more concernedwith economic policy, then we have an explanation for the candidate shifts from theestimated equilibrium. Note in particular that the distribution of activist positions forthe two parties, given in Fig. 2, looks very different from the voter positions, given inFig. 1. The latter is much more heavily concentrated near the electoral origin, whilethe former tends to be dispersed.
Miller and Schofield (2008) also emphasized the potential conflict between eco-nomically conservative and socially conservative Republican activists. In Indiana inFebruary 2010, the incumbent Democrat Senator, Evan Bayh, announced that he wouldretire. This set off a contest by local “tea party” social conservatives against the Repub-lican National Committee’s support for Dan Coats, an economic conservative con-tender for the Senate seat. This example just illustrates the degree to which contendersfor political office require support from activist groups with very different agendas.
When the candidates are at their estimated positions, the estimated vote shares,according to the traits model, are (VObama, VMcCain) = (0.68, 0.32). Since the actualvote shares are (0.52, 0.48), it appears that the trait model may give a statisticallyplausible account of voter choice, but it does not provide, by itself, a good model ofhow candidates obtain votes. We suggest that the missing characteristic of this modelof the election is the effect on the vote by the contributions of party activists.
Indeed, we suggest that the addition of activists to the model can account for thedifference between convergent, equilibrium positions and the divergent, estimated can-didate positions, as obtained by Enelow and Hinich (1989) and Poole and Rosenthal(1984), respectively, in their various analyses of U.S. elections.
As we noted above, we could also interpret dμdz (z) as the gradient obtained from
a model where candidates have policy preferences derived from utility functions(μmc, μob). Duggan and Fey (2005) have explored such a model for the case of adeterministic vote model, and obtained symmetry conditions for equilibrium similarto those obtained earlier by McKelvey and Schofield (1987). However, in such a modelof policy seeking candidates, a candidate must be willing to adopt a losing positionbecause of strong preferences for particular policies.
It is possible that our estimates of the positions, zObama = (−0.22, 0.75) andzMcCain = (0.59,−0.37), are incorrect. However, these estimated positions give us astatistically significant model of voter choice. We argue that the most plausible accountfor the difference in the estimated and equilibrium positions of the two candidates isthe nature of activist competition.35
35 See Schofield et al. (2010a) for the US election in 2000.
123

502 N. Schofield et al.
Table 6 Seats in the Knesset
Party 1988 1992 1996 1999 2003 2006 2009
Left (ADL, Arab, Hadash) 14 5 9 10 9 10 11
Meretz 12 9 10 6 5 3
Labor 39 44 34 28 21 19 13
Center (Olim, Gesher, Shinui) 2 8 11 18 15 7 –
Center (Kadima) 29 28
Likud 40 32 30 19 40 12 27
Shas, Yahadut 15 10 14 22 16 12+6 11+5
NRP, Mafdal 5 6 9 5 6 9 4+3
Moledat, Techiya, Beiteinu 5 3 2 8 7 11 15Total 120 120 120 120 120 120 120
Note also that this model can be applied to the determination of policy positionsof members of the House and Senate of the United States. In particular, we wouldexpect local activist groups to be very heterogenous across states and House constit-uencies. As a result, policy positions of members of Congress can be expected to bevery heterogenous, even within parties.
5 Elections in Israel
Schofield and Sened (2006) estimated various multinomial conditional logit modelsfor the elections of 1988, 1992, and 1996 in Israel.36 Table 6 gives the election resultsfor 1988–2009, while Fig. 4, presented above, showed the electoral distribution in1996, together with estimates of the party positions. Using the formal analysis, wecan readily show that the convergence coefficient of the pure spatial model, M(�, β)
for 1996 greatly exceeds 2 (the dimension of the policy space). Indeed, one of theeigenvalues of the Hessian of the one of the low valence parties, Shas, can be shownto be positive. The principal electoral axis (or principal component of the electoraldistribution) can be seen to be aligned at approximately 45◦ to the security axis. As wenow show, this axis is the eigenspace of the positive eigenvalue. It follows from thecomputation of eigenvalues that low valence parties should position themselves closeto this principal axis, as illustrated in the simulation of the model, given in Fig. 5.
The MNL estimation given in Table 7 presents the relative valences in the purespatial model with respect to Meretz. The table shows that in 1996 Shas had a rela-tive valence of �Shas =−2.02, while Labor had the highest relative valence of 0.99,
with Likud having a valence of 0.78. The spatial coefficient was β = 1.21, so touse the convergence theorem, we note that the valence difference between Shas and
36 Schofield and Sened (2006) compared the joint MNL spatial model involving sociodemographic termsand valences with various less extensive models. The joint model correctly predicted 63.8% of the voterchoices.
123

Estimating the effects of activists 503
Fig. 5 Estimated local equilibrium positions in the Knesset in 1996. Key: 1 Shas, 2 Likud, 3 Labor, 4 NRP,5 Moledat, 6 Third way, 7 Meretz
Labor was 0.99 − (−2.02) = 3.01, while the difference between Shas and Likud was0.78 − (−2.02) = 2.8. The electoral covariance matrix is
∇0 =[
1.0 0.5910.591 0.732
]
with trace σ 2 = 1.732. The principal component of this electoral distribution is givenby the vector (1.0, 0.80) with variance 1.47, while the minor component is given by(1.0,−1.25) with variance 0.26. We can compute the characteristic matrix of Shas atthe origin and the convergence coefficient as follows:
ρShas � 1
1 + e3 + e2.8 + e1.4 + e0.8
� 0.023.
2β(1 − 2ρShas) = 2 × 1.21 × 0.95 = 2.30
so CShas = (2.3)∇0 − I
=[
1.3 1.361.36 0.69
].
and c = 2.3 × 1.732 = 3.98.
From the estimate of CShas, it follows that the two eigenvalues are 2.39 and −0.39,
giving a saddlepoint, and a value of 3.98 for the convergence coefficient. This exceeds
123

504 N. Schofield et al.
Table 7 Spatial model of the Israel election 1996, wrt Meretz
Variable Party Coefficient Lower 95% bound Upper 95% bound
β Spatial 1.207*** 1.076 1.338
�_Valence Likud 0.777*** 0.400 1.154
Labor 0.990*** 0.663 1.316
NRP −0.626*** −1.121 −0.132
Moledat −1.259*** −1.858 −0.660
Third way −2.291*** −2.841 −1.741
Shas −2.023*** −2.655 −1.392
Convergence c 3.98 3.70 4.26
LL = − 777.0 n = 922 ∗∗∗ P < 0.001
LL Log likelihood
Table 8 Comparison of LL forIsrael models for 1996
M2 Joint Spatial Socio-Dem.
Joint na 82 249
M1 Spatial −82 na 167
Socio-Dem. −249 −167 na
the necessary upper bound of 2. The estimate for the standard error on ρShas is 0.008, sothe 95% confidence interval is [0.007, 0.02]. Note that this interval includes the actualsample vote share of 2% for Shas. The standard error on β is 0.065 so the standarderror on c is of order 0.14, and we can infer that, with high probability, the convergencecoefficient exceeds 2.0.
Using the above estimate for the major eigenvalue, we find that the major eigenvec-tor for Shas is (1.0, 0.79), and along this axis the Shas vote share function increases asthe party moves away from the origin. The minor, perpendicular axis associated withthe negative eigenvalue is given by the vector (1,−1.26). Any LNE for the modelM(�,β) will be one where all parties are located on the major eigenvector.
We also constructed a joint MNL model, M(�, θ , β),and a pure sociodemographicmodel of the election, M(�, θ), details of which can be found in Schofield and Sened(2006). Table 8 reports the differences in the log likelihoods of the various models.
Figure 5 gives one of the local Nash equilibria, obtained by simulation of the model.Since this model does not involve activist terms, we can infer that this equilibriumgives an estimate of the weighted electoral means,zel, for the parties: This vector, zel,
is given by:
⎡⎣ Party Meretz Moledat IIIWay Labor Likud NRP Shas
x −1.1 1.0 1.0 0.0 0.2 0.9 1.0y −0.8 0.8 0.8 −0.2 0.0 0.6 1.0
⎤⎦
All these equilibrium positions lie very close to an eigenvector (1.0, 0.85). It thusappears that the only effect of the inclusion of the sociodemographic variables is to
123
Estimating the effects of activists 505
slightly rotate the principal eigenvector in an anticlockwise direction. In all, five dif-ferent LNE were located. However, in every equilibrium, the two high valence parties,Labor and Likud, were located close to the simulated equilibrium positions shown inFig. 5. The only difference between the various equilibria were slight differences inthe positions of Shas, NRP, and Moledat.
It is evident that if the high valence party occupies the electoral origin, then eachparty with low valence can compute that its vote share will increase by moving upor down the principal electoral axis. In seeking local maxima of the vote shares,all parties other than the highest valence party should vacate the electoral center.Then, however, the first-order condition for the high valence party to occupy the elec-toral center would not be satisfied. Even though this party’s vote share will be littleaffected by the other parties, it too should move from the center. The simulation for1996 is compatible with the formal analysis: low valence parties, such as the NRPand Shas, in order to maximize vote shares must move far from the electoral center.As with the pure spatial model, their optimal positions will lie either in the “north-east” quadrant or the “south-west” quadrant. The vote-maximizing model, without anyadditional information, cannot determine which way the low valence parties shouldmove.
The equilibrium position of Shas, by the joint model, will give greater weight tothose voters who are observant. As Fig. 4 makes clear, Shas, Moledat, and NRP arelocated in the upper quadrant of the policy space. On the other hand, since the valencedifference between Labor and Likud was relatively low, their local equilibrium posi-tions will be close to, but not identical to, the electoral mean. Intuitively, it is clear thatonce the low valence parties vacate the origin, then high valence parties, like Likudand Labor, should position themselves almost symmetrically about the origin, andclose to the principal axis.
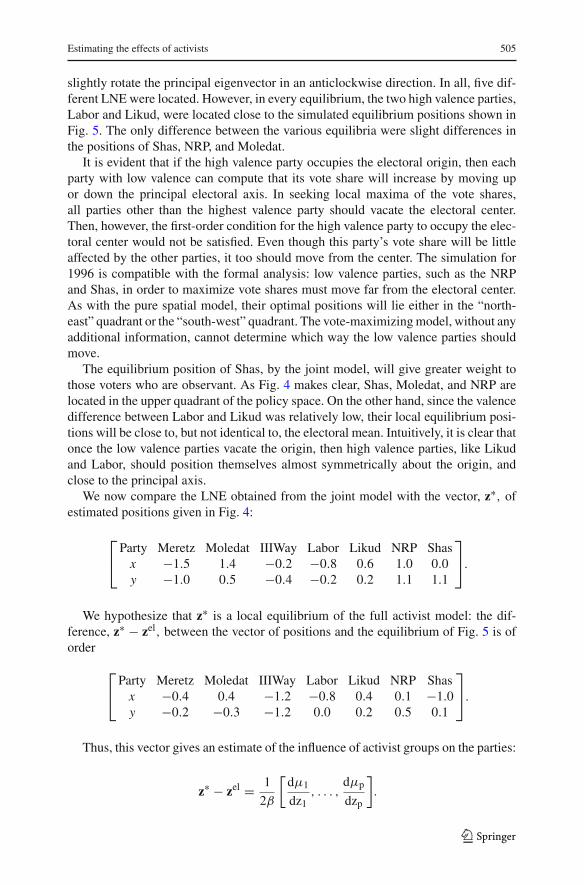
We now compare the LNE obtained from the joint model with the vector, z∗, ofestimated positions given in Fig. 4:
⎡⎣ Party Meretz Moledat IIIWay Labor Likud NRP Shas
x −1.5 1.4 −0.2 −0.8 0.6 1.0 0.0y −1.0 0.5 −0.4 −0.2 0.2 1.1 1.1
⎤⎦.
We hypothesize that z∗ is a local equilibrium of the full activist model: the dif-ference, z∗ − zel, between the vector of positions and the equilibrium of Fig. 5 is oforder
⎡⎣ Party Meretz Moledat IIIWay Labor Likud NRP Shas
x −0.4 0.4 −1.2 −0.8 0.4 0.1 −1.0y −0.2 −0.3 −1.2 0.0 0.2 0.5 0.1
⎤⎦.
Thus, this vector gives an estimate of the influence of activist groups on the parties:
z∗ − zel = 1
2β
[dμ1
dz1, . . . ,
dμp
dzp
].
123

506 N. Schofield et al.
Schofield and Sened estimate β = 1.117 for the joint model, so we obtain
[dμ1
dz1, . . . ,
dμp
dzp
]= 2β(z∗ − zel)
=⎡⎣ Party Meretz Moledat IIIWay Labor Likud NRP Shas
x −0.9 0.9 −2.7 −1.78 0.9 0.22 −2.2y −0.45 −0.67 −2.68 0.0 0.45 1.12 0.22
⎤⎦
Although we have not performed the empirical analysis for the elections of 2003 and2006, we can expect a similar result to hold. The analysis given in Schofield and Sened(2006) for the elections of 1992 and 1988 shows that in 1988 the two eigenvalues forShas were +2.0 and −0.83, while in 1992 the eigenvalues for this party were +2.12and −0.52. Just as in 1996, the theoretical model of vote maximization implies thatall parties should be located on a principal electoral axis. The positioning of Shas offthe principal electoral axis enables it to pivot between the two major parties, in thesense that it tended to be crucial for the formation of winning coalitions.
As Table 7 shows, after the elections of 1996, 1999, and 2003 any winning coalitionbased on either Labor or Likud needed additional support of Shas. In 1996, Netanyahuof Likud formed a government with Shas, but after Likud lost seats in 1999, it wasthe turn of Barak of Labor to form a government, again with Shas, followed in 2001by Likud, led by Sharon, with Shas. In consequence, even though Shas controlled fewseats in this period, it had significant bargaining power.
5.1 The elections of 2006 and 2009
This pattern of coalition government was transformed, to some degree, when AmirPeretz stood against Shimon Peres and won the election for leadership of Labor inNovember 2005.
Sharon then left the Likud Party and allied with Peres and other senior Labor Partymembers, to form the new party, Kadima (“Forward” ). We can infer that the coalitionof Sharon and Peres positioned Kadima at the center of the policy space. Because ofSharon’s stroke in January 2006, Ehud Olmert took over as leader of Kadima, andin the election of March 2006, the new party was able to take 29 seats, while Likudonly took 19 seats. One surprise of the election was the appearance of a Pensioners’party with 7 seats. A possible coalition of Likud and the religious parties, opposedto Kadima, did not have the required 61 seats for a majority (even with the Pension-ers’ Party). Schofield (2007b) discussed this election and argued that Kadima wasat the core position, since no majority coalition could agree to overturn the Kadimaposition.37 However, this “core property” was unstable, in the sense that it could bedestroyed by small changes in positions or strengths of the parties.
37 For a discussion of the core see Laver and Schofield (1990). For a spatial voting game in a legislature,the core is given by the intersection of legislative median lines between pairs of parties that pivot. If theselines do not intersect then the core is empty. In this case, the set bounded by these median lines is called the“heart”. By definition, when the core is empty, then the heart is non empty. See Schofield (1999, 2007b)
123

Estimating the effects of activists 507
As a result, Olmert needed the support of Labor to be able to deal with the com-plex issue of fixing a permanent border for Israel. The debacle in Lebanon severelyweakened Olmert’s popularity, and the 61 members of the Kadima-Labor coalitionvoted to bring Israel Beiteinu into the coalition. The report, in April 2007, on thefailure of the government during the war with Lebanon in Summer 2006 seemed tothreaten the Kadima-Labor–Israel Beiteinu coalition by bringing about a change inthe Labor party leadership. Barak then won the election for the Labor Party leadershipon June 12, 2007, and became Minister of Defense in the government on June 18,while Shimon Peres became President. In November 2007, Olmert proposed a land-for-peace proposal, possibly involving the separation of Jerusalem, and on January15, 2008, Avigdor Lieberman, chairman of Israel Beiteinu announced that the partywould quit the government because of disagreement over issues such as Jerusalemand negotiations with Hamas.
On February 3, 2008, Barak agreed to remain in the coalition, thus helping to sus-tain Kadima in power. However, in August 2008, Olmert faced charges of corruption,and formally resigned as leader of Kadima on September 21. He immediately gavean interview (Olmert 2008) in which he asserted that Israel would have to lose sover-eignty over Jerusalem, and would have to come to an agreement with Syria by givingup the Golen Heights in return for Syrian forswearing their connections with Iran,Hezbollah, and Hamas.
The new leader of Kadima, and Prime Minister designate, Tzipi Livni, then had toface a revolt by Shas, over these security issues. On October 26, 2008, she announced,that she had failed to form a viable coalition, and an election would occur in February2009. Even though the Kadima government was weakened, it responded to rocketattacks by Hamas from Gaza, and launched a 3 week attack on Gaza at the end ofDecember 2008.
In the election of 2009, as Table 6 shows, the Pensioners’ Party disappeared, andboth Likud and Israel Beiteinu gained seats. Labor lost significantly, presumablybecause of the loss of valence by its leader, Ehud Barak. The core was destroyed,and it was unclear what government would form. Both Livni and Benjamin Netan-yahu, of Likud, claimed the electoral mandate. However, on February 20, AvigdorLieberman took the role of formateur of the coalition game, and offered his supportto Netanyahu. On March 24, a majority of the Labor Party central committee votedto support Netanyahu, in return for four cabinet positions, and the retention of thedefense portfolio by Barak. Tzipi Livni refused the offer to join this unity coalitiongovernment of Likud, Labor, Shas, and Israel Beiteinu, and will be in opposition. Asprime minister designate, Netanyahu declared on March 26 that he would negotiatewith the Palestinian Authority for peace. Five days later he was sworn in as PrimeMinister, after a vote of 69 to 45, with the abstention of five Labor members (one Arabmember of the Knesset was absent). Avigdor Lieberman became foreign minister.Although Netanyahu has tended to avoid mention of a sovereign Palestinian state, hedeclared in December 2009 that in order to proceed with this policy, he was willingto consider inviting Livni to join in a grand coalition.
In March 2010, during Vice President Biden’s visit to Israel it was announcedthat Israel would add 1,600 housing units in eastern Jerusalem. Although the Obamaadministration was angered by the timing of the announcement, Netanyahu insisted
123

508 N. Schofield et al.
that Israel would go ahead with the construction. However, President Shimon Peressaid: “We cannot afford to unravel the delicate fabric of friendship with the UnitedStates. Today we are also at a decisive moment and we must decide without the deter-mination of external parties.” However, on May 31,2010, there was an attack by Israelicommandoes against a boat traveling in international waters and carrying humanitar-ian supplies for Gaza. Nine people in the convoy were killed. The convoy was partlyorganized by a Turkish organization, Insani Yardim Vakfi. It is unclear who orderedthe attack, but Netanyahu immediately cancelled a meeting that had been arrangedwith Obama.
Eventually, in September 2010, negotiations started in Washington, involving Ne-tanyahu, Mahmoud Abbas (the President of the Palestinian Authority), King AbdullahII of Jordan and President Hosni Mubarak of Egypt.
5.2 Coalitions in Israel
We can see the nature of bargaining over this coalition government by joining themedian lines between pairs of parties that pivot between majority coalitions after the2009 election, as shown in Fig. 6. When these medians do not intersect, then theybound a finite, star shaped set known as the “heart.”
Schofield (2007b) argues that the outcomes of coalition bargaining will be a con-strained within this set. 38 The complex nature of this set suggests that there are manypossible majority coalitions. In particular, small parties such as Shas, Yahadut, andIsrael Beiteinu may join in government and may thus influence the outcome of coa-lition government. We have argued that the positions adopted by the parties are theresult of activist choices to support particular parties. Thus, activist groups for thesesmall parties may reason that the party they support has a good chance of taking part ingovernment, thus bringing about policy changes that favor the activists. Consequently,there is little motivation for such activist groups to coalesce. As long as the logic ofvote maximization maintains this policy divergence between the parties, then so willactivist groups continue to provide support for these small parties. Thus, politicalfragmentation is preserved
These remarks about recent events in the Knesset are presented to illustrate thegreat difficulty of maintaining a stable government coalition, even when there is alarge, centrally located party, such as Kadima. Such a party should, in principle, beable to dominate bargaining. However, it is only when the center party’s leader hashigh valence is the party able to avoid threats to the government. Without such valencepredominance, small parties, and their activist supporters have an incentive to act tomaintain political fragmentation.
6 Concluding remarks
This article has argued, on the basis of an equilibrium analysis of elections, that theelectoral pull on parties is very different in the United States and Israel, and this is a
38 As mentioned above, when the medians intersect then the heart will collapse to the core, and we mayassume that this will be the outcome.
123

Estimating the effects of activists 509
0 0.5 1 1.5 2 2.5 30.2
0.4
0.6
0.8
1
1.2
1.4
1.6
1.8
2
Kadima
Likud
Beiteinu
Labor
Shas,Yahadut
Mafdel,MRP
Meretz
Arab
Security
Rel
igio
on
Fig. 6 The heart in Israel in 2008
consequence of the nature of the electoral system and the degree of political fragmen-tation.
We can express the difference between proportional representation and pluralityrule as follows.
Analysis of the equilibria of the spatial valence model of a polity based on propor-tional electoral methods, such as Israel, indicates that only high valence parties will bepositioned, in equilibrium, close to the electoral origin. Because of the wide variationin political valence, the low valence parties will move toward the electoral periphery.Activist groups, linked to small parties, may aspire to affect the policy choices of thechosen parties. Bargaining to create winning coalitions occurs after the election, andsmall parties may aspire to membership of government. As a consequence, there needto be no strong tendency forcing activist groups to coalesce, in order to concentratetheir influence. If activist groups remain fragmented, then the outcome will be partyfragmentation, and this will reinforce the tendency for variation in valence. Empiricalanalysis of the election in Israel for 1996 showed that the convergence coefficient hada high value of 3.98 in 1996. Other empirical work obtained a value for this conver-gence coefficient of 6.82 for 1997 in Poland (Schofield et al. 2010b) and of 5.94 forTurkey in 2002 (Schofield et al. 2011).
A standard way of estimating political fragmentation is in terms of the effectivenumber of party vote strength (env) or effective number of party seat strength (ens).39
The fragmentation in votes and seats is captured by the fact that in Israel in 1996 both
39 Fragmentation can be identified with the effective number (Laakso and Taagepera 1979). That is, let Hv
(the Herfindahl index) be the sum of the squares of the relative vote shares and env = H−1v be the effective
number of party vote strength. In the same way we can define ens as the effective number of party seatstrength using shares of seats.
123

510 N. Schofield et al.
Table 9 Convergence coefficients (c) and fragmentation
Country
Variable US Britain Canada
Convergence coeff. (c) [0.40,1.1] (2000–2008) [0.84, 0.98] (2005–2010) 2.0 (2004)
Political system Pres. PL Parl. PL Parl. PL
env 2.0 3.2 (1997) 4.0 (2004)
env 2.7 (2005) 4.1 (2008)
ens 1.0 2.2 (1997) 3.1 (2004)
ens 2.5 (2005) 3.5 (2008)
Poland Turkey Israel
Convergence coeff. (c) 6.82 (1997) 5.94 (2002) 3.98 (1996)
Political system Frag. PR Frag. PR, cut off Frag PR
env 5.5 (1997) 7.7 (1999) 6.5 (1996)
env 7.7 (2005) 4.0 (2007) 10.0 (2009)
ens 3.1 (1997) 5.0 (1999) 6.5 (1996)
ens 5.0 (2005) 2.3 (2007) 10.0 (2009)
Parl parliamentary, Pres. presidential, PL plurality, PR proportional representation, Frag. fragmented
env and ens were equal to 6.5. As Table 9 shows, these had risen to 10.0 by 2009. Thetable shows that the effective numbers for vote shares in Poland and Turkey were alsolarge, in the range [4.0, 7.7]. These three polities all have electoral systems that areapproximately proportional, although Turkey introduced an electoral cut-off, whichworked to the disadvantage of smaller parties, reducing the ens from 5.0 in 1999 to2.3 in 2007.
The parliamentary polities of Canada and Britain, based on a plurality electoralsystem, have convergence coefficients that lie in the range [0.8, 2.0], and the frag-mentation measures tend to be much lower than in the PR polities. For Canada, theenv is about 4.0, and in Britain it lies in the range [2.7, 3.2]. In the very majoritarianpolity of the United States the env is generally about 2.0. The equilibrium analysisof the spatial model presented here indicates that the convergence coefficient had alow value of 1.1 in 2008. In 2000 and 2004, Schofield et al. (2010a,b) estimate thecoefficient to be 0.4.
Schofield and Zakharov (2010) suggest that Russia has an electoral system thatis in between plurality and proportionality. It has a dominant party, United Russia,supportive of Putin, and the env was only 2.3 in the Duma election of 2007, while theconvergence coefficient was estimated to be 1.7.
These comparisons of convergence coefficients are valid because c is dimension-less. The higher coefficients in polities with many parties is a result both of higherβ-coefficients and greater electoral variance. In contrast, for US presidential elections,the convergence property still holds even when sociodemographic variables and indi-vidual perceptions of candidate traits are incorporated into the model. We argue thatpresidential candidates in the United States are pulled from these convergent equilib-rium positions by the influence of interest groups. We suggest that in the election of
123

Estimating the effects of activists 511
2008, social activists dominated in the Democrat party and economic activists in theRepublican party. Activist resources are crucial for electoral success. If these inter-est groups do not coalesce before the election, then they will have little impact onpolitical outcomes. Consequently, small parties, or activist groups, such as those ledby independent candidates in recent elections, have little expectation of influencinggovernment policy. Their valences will remain low, and they will have little impact,in general, on presidential elections. However, heterogenous local activist groups mayinfluence the policy preferences of members of Congress, and this effect may induceconflict between the President of one party and Senators of the same party, as seemsto be the case over the issue of health care in 2009 and 2010. Radical activist groupsmay also induce conflict within the support coalitions for one or other of the parties,particularly when the party is out of office. This phenomenon can be seen within theRepublican party in the aftermath of the 2008 election. We may hypothesize that suchconflict is the fundamental cause of realignment in the US polity.
Appendix 1: a formal stochastic model of elections
Details of the pure spatial stochastic electoral model are given in Schofield (2006,2007a), to which the reader is referred. Here, we extend the presentation given inSchofield et al. (2011) by including electoral perceptions of candidate traits as well asallowing for multiple activist groups.
The aim of the model is to argue that the vote-maximizing equilibrium positionof McCain will lie on what we shall call a balance locus in the lower right quad-rant of the policy space, while Obama’s position will lie in the opposite, upper left,quadrant.
The voter utility assumption for the stochastic vote model M(�, θ, α,μ,β) is:
ui j (xi , z j ) = � j + (θ j · ηi ) + (α j · τi ) + μ j (z j ) − β‖xi − z j‖2 + ε j (3)
≡ u∗i j (xi , z j ) + ε j . (4)
Here, u∗i j (xi , z j ) is the observable component of utility. The set of leaders is P =
{1, . . . j, . . . p}. The term � j is the exogenous valence of leader j, relative to thebaseline leader. This is estimated from the intercept term of the model. The symbol θ
denotes a set of k -vectors {θ j : jεP} representing the effect of the k different sociode-mographic parameters40 on voting for leader j while ηi is a k-vector denoting the i thindividual’s relevant “sociodemographic” characteristics. The compositions {(θ j ·ηi )}are scalar products. We refer to the terms {(θ j · ηi )} as the total sociodemographicvalence by i for leader j.
In similar fashion, the terms {(α j · τi )} are scalar products, where τi is voter i ′sperception of the trait of leader j, with coefficient α j . Let α = (α1, . . . , αp).
The trait score for the election of 2008 was obtained by factor analysis from a setof survey questions, as mentioned above.
40 These will depend on the survey but will include such characteristics as class, domicile, education,income, and religious orientation, etc.
123

512 N. Schofield et al.
The function μ j (z j ) is the sum of other aspects of the valence of leader j. Notethat we assume that this aspect of valence is dependent on the leader position, but noton the voter position. In the analysis below, we suggest that this term can be regardedas the effect of activist contributions to the leader. Let μ = {μ j }.
The termβ is a positive constant, called the spatial parameter, giving the importanceof policy difference defined in terms of a metric induced from the Euclidean distance,||xi − z j ||, between the voter’s ideal point,xi , and the leader position z j . The vectorε = (ε1, . . . , ε j , . . . , εp) is the stochastic error, with the multivariate Gumbel (Type I
extreme value) distribution. The variance of ε j is fixed at π2
6 , so that by definition β
has dimension L−2, where L is whatever unit of measurement is used in X.
Various submodels are pure sociodemographic (SD), denoted M(�, θ), pure spa-tial, M(�,β), joint spatial, M(�, θ , β), and joint spatial with traits, M(�, θ ,α, β).
As shown in Schofield (2006), the first-order condition for a local Nash equilibriumunder vote maximization is given by the balance equation for each z∗
j :
dE∗j
dz j(z∗
j ) + 1
2β
dμ j
dz j(z∗
j ) = 0. (5)
Here, the term
dE∗j
dz j(z j ) ≡
[zel
j − z j
].
is the marginal electoral pull of leader j at the point z j and can be regarded as agradient vector, at z j , pointing toward the weighted electoral mean of the leader. Theweighted electoral mean for leader j is given by
zelj ≡
n∑i=1
i j xi
If ρi j (z) = ρi j is the probability voter i chooses leader j, at z then the weights aregiven by the p by n matrix array of weights
[ i j ] ≡[ [ρi j − ρ2
i j ]∑k∈N [ρk j − ρ2
k j ]
](6)
When z j is equal to the weighted electoral mean then the electoral pull is zero. The
gradient vectordμ jdz j
(z j ) is called the marginal activist pull for leader j at z j .
If z∗ = (z∗1, . . . z∗
j , . . . z∗p) is such that each z∗
j satisfies the balance equation thencall z* a balance solution. We may rewrite (5) as
[z∗ − zel
]= 1
2β
dμ
dz(z) (7)
123
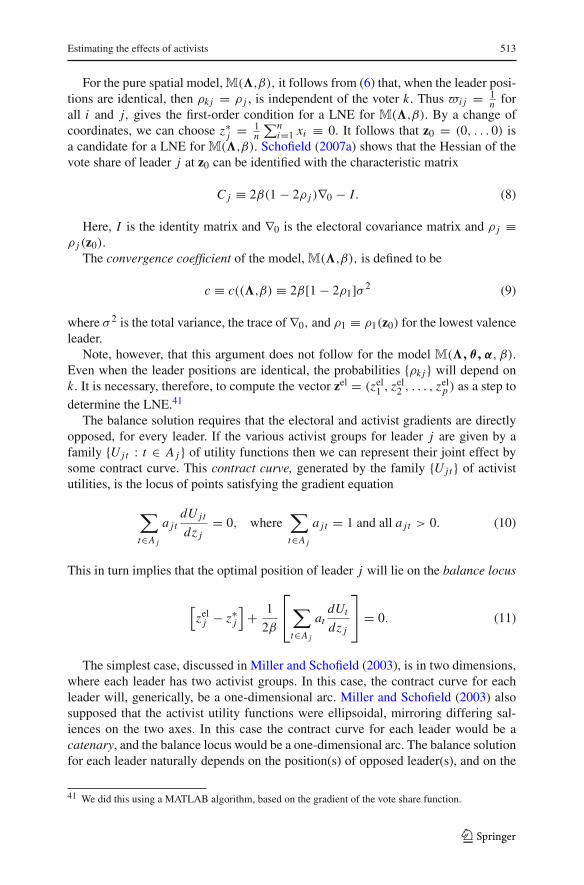
Estimating the effects of activists 513
For the pure spatial model, M(�,β), it follows from (6) that, when the leader posi-tions are identical, then ρk j = ρ j , is independent of the voter k. Thus i j = 1
n forall i and j, gives the first-order condition for a LNE for M(�,β). By a change ofcoordinates, we can choose z∗
j = 1n
∑ni=1 xi ≡ 0. It follows that z0 = (0, . . . 0) is
a candidate for a LNE for M(�,β). Schofield (2007a) shows that the Hessian of thevote share of leader j at z0 can be identified with the characteristic matrix
C j ≡ 2β(1 − 2ρ j )∇0 − I. (8)
Here, I is the identity matrix and ∇0 is the electoral covariance matrix and ρ j ≡ρ j (z0).
The convergence coefficient of the model, M(�,β), is defined to be
c ≡ c((�,β) ≡ 2β[1 − 2ρ1]σ 2 (9)
where σ 2 is the total variance, the trace of ∇0, and ρ1 ≡ ρ1(z0) for the lowest valenceleader.
Note, however, that this argument does not follow for the model M(�, θ, α, β).Even when the leader positions are identical, the probabilities {ρk j } will depend onk. It is necessary, therefore, to compute the vector zel = (zel
1 , zel2 , . . . , zel
p ) as a step todetermine the LNE.41
The balance solution requires that the electoral and activist gradients are directlyopposed, for every leader. If the various activist groups for leader j are given by afamily {U jt : t ∈ A j } of utility functions then we can represent their joint effect bysome contract curve. This contract curve, generated by the family {U jt } of activistutilities, is the locus of points satisfying the gradient equation
∑t∈A j
a jtdU jt
dz j= 0, where
∑t∈A j
a jt = 1 and all a jt > 0. (10)
This in turn implies that the optimal position of leader j will lie on the balance locus
[zel
j − z∗j
]+ 1
2β
⎡⎣∑
t∈A j
atdUt
dz j
⎤⎦ = 0. (11)
The simplest case, discussed in Miller and Schofield (2003), is in two dimensions,where each leader has two activist groups. In this case, the contract curve for eachleader will, generically, be a one-dimensional arc. Miller and Schofield (2003) alsosupposed that the activist utility functions were ellipsoidal, mirroring differing sal-iences on the two axes. In this case the contract curve for each leader would be acatenary, and the balance locus would be a one-dimensional arc. The balance solutionfor each leader naturally depends on the position(s) of opposed leader(s), and on the
41 We did this using a MATLAB algorithm, based on the gradient of the vote share function.
123

514 N. Schofield et al.
Fig. 7 Republican contract curve and balance locus
coefficients, as indicated above, of the various activists. These coefficients depend onthe willingness of each activist group to supply resources in order to influence thepolitical leader. The determination of the balance solution can be obtained by com-puting the vote share Hessian along the balance locus. Figure 7 illustrates the balancelocus and contract curve for a Republican candidate.
Note that the combination
∑t∈A j
akdUt
dz j
may be interpreted as the marginal utility of the leader of party j , induced by theactivist support.
To see this, suppose that each leader were to maximize the function
Vj (z) =δμ j (z j ) + 1
n�iρi j (z)
where μ j is no longer an activist function, but a policy determined component of theleader’s utility function, while δ is the weight given to the policy preference, Then thefirst-order condition is almost precisely as obtained above, namely
123

Estimating the effects of activists 515
dE∗j
dz j(z∗
j ) + δ′
2β
dμ j
dz j(z∗
j ) = 0.
Here,dμ jdz j
(z∗j ) is a gradient pointing toward the policy preferred position of the
leader and δ′ is a product of n and δ, divided by a summation across the voter proba-bilities. Thus, we can make the identity
δ′ dμ j
dz j(z∗
j ) =∑t∈A j
atdUt
dz j.
This equation implies that the leader’s marginal policy preference can be identifedwith a combination of the marginal preferences of the party activists. To solve thisequation in detail requires solving the game between activists and leaders, as outlinedin Grossman and Helpman (1994, 1996, 2001). For our purposes, it is sufficient to usethis reduced form, as we are interested in the difference
[zel
j − z∗j
]between the LNE
position, zelj , of party j and its estimated position, z∗
j .
Appendix 2: question wording for the 2008 American nationalelection study
1. Do you think the government should provide more services than it does now,fewer services than it does now, or about the same number of services as it doesnow?
2. Do you favor, oppose, or neither favor nor oppose the U.S. government payingfor all necessary medical care for all Americans?
3. A proposal has been made that would allow people to put a portion of their SocialSecurity payroll taxes into personal retirement accounts that would be investedin stocks and bonds. Do you favor this idea, oppose it, or neither favor nor opposeit?I am going to ask you three questions, and ask you to choose which of twostatements in these questions comes closer to your own opinion.
4. One, the main reason government has become bigger over the years is becauseit has gotten involved in things that people should do for themselves. Two, gov-ernment has become bigger because the problems we face have become bigger.
5. One we need a strong government to handle today’s complex economic prob-lems. Two, the free market can handle these problems without government beinginvolved.
6. One, the less government, the better. Two there are more things that governmentshould be doing.
7. This country would be better if we worried less about how equal people are.Do you agree strongly, agree somewhat, neither agree nor disagree, disagreesomewhat, or disagree strongly with this statement?
8. Do you think that big companies should pay a larger percent of their profits intaxes than small businesses do, that big companies should pay a smaller percent
123

516 N. Schofield et al.
of their profits in taxes than small businesses do, or that big companies and smallbusinesses should pay the same percent of their profits in taxes?
9. Should federal spending on welfare programs be increased, decreased, or keptabout the same?
10. Do you favor, oppose, or neither favor nor oppose the U.S. government makingit possible for illegal immigrants to become U.S. citizens?
11. Do you think the number of immigrants from foreign countries who are permittedto come to the United States to live should be increased a lot, increased a little,left the same as it is now, decreased a little, or decreased a lot?
12. I’d like to describe a series of circumstances in which a woman might want tohave an abortion. For each one, please tell me whether you favor, oppose, orneither favor nor oppose it being legal for the woman to have an abortion in thatcircumstance.
1. Staying pregnant would hurt the woman’s health but is very unlikely to causeher to die.
2. Staying pregnant could cause the woman to die.3. The pregnancy was caused by sex the woman chose to have with a blood
relative.4. The pregnancy was caused by the woman being raped.5. The fetus will be born with a serious birth defect.6. Having the child would be extremely difficult for the woman financially.7. The child will not be the sex the woman wants it to be.
13. Do you favor or oppose laws to protect homosexuals against job discrimination?14. Do you think homosexuals should be allowed to serve in the United States Armed
Forces or don’t you think so?15. Do you think gay or lesbian couples, in other words, homosexual couples, should
be legally permitted to adopt children?16. Should same-sex couples be allowed to marry, or do you think they should not
be allowed to marry?17. This country would have many fewer problems if there were more emphasis on
traditional family ties. Do you agree strongly, agree somewhat, neither agree nordisagree, disagree somewhat, or disagree strongly with this statement?
18. Do you think the federal government should make it more difficult for people tobuy a gun than it is now, make it easier for people, or keep the rules the same?
19. Some people feel that the government in Washington should make every effortto improve the social and economic position of blacks. Others feel that the gov-ernment should not make any special effort to help blacks because they shouldhelp themselves. Where would you place yourself on this scale, or haven’t youthought much about this?
20. Irish, Italians, Jewish and many other minorities overcame prejudice and workedtheir way up. Blacks should do the same without any special favors. Do youagree strongly, agree somewhat, neither agree nor disagree, disagree somewhat,or disagree strongly with this statement?
21. Generations of slavery and discrimination have created conditions that makeit difficult for blacks to work their way out of the lower class. Do you agree
123

Estimating the effects of activists 517
strongly, agree somewhat, neither agree nor disagree, disagree somewhat, ordisagree strongly with this statement?
22. It’s really a matter of some people not trying hard enough; if blacks would onlytry harder they could be just as well off as whites. Do you agree strongly, agreesomewhat, neither agree nor disagree, disagree somewhat, or disagree stronglywith this statement?
23. We hear a lot of talk these days about liberals and conservatives. Where wouldyou place yourself on a scale from liberal to conservative?
Acknowledgments This article is based on the work supported by NSF grant 0715929 and a WeidenbaumCenter grant to Schofield. An earlier version was completed while Zakharov was a visitor at the Center.Zakharov thanks the DECAN laboratory, State University-Higher School of Economics, Moscow, for sup-port. A version of the article was presented at the Southern Political Science Meeting, Atlanta, January2010. This version was completed while Schofield was the Glenn Campbell and Rita Ricardo-CampbellNational Fellow at the Hoover Institution, Stanford, 2010. Thanks are due to the helpful comments of twoanonymous referees.
References
Acemoglu D, Robinson J (2006) Economic origins of dictatorship and democracy. Cambridge UniversityPress, Cambridge
American National Election Study (2008)Arian A, Shamir M (1999) The election in Israel: 1996. SUNY Press, AlbanyBaron D (1994) Electoral competition with informed and uniformed voters. Am Political Sci Rev 88:33–47Bawn K, Rosenbluth F (2005) Short versus long coalitions: electoral accountability and the size of the
public sector. Am J Political Sci 50:251–265Bayh E (2010) Why I am leaving the Senate. New York Times. February 21.Benoit K, Laver M (2006) Party policy in modern democracies. Routledge, LondonBernhardt D, Duggan J, Squintani F (2009) The case for responsible parties. Am Political Sci Rev 103:570–
587Clarke HD, Sanders D, Stewart M, Whiteley P (2005) Political choice in Britain. Oxford University Press,
OxfordClarke HD, Kornberg A, Scotto T (2009a) Making political choices. Toronto University Press, TorontoClarke H, Sanders D, Stewart M, Whiteley P (2009b) Performance politics and the British voter. Cambridge
University Press, CambridgeDowns A (1957) An economic theory of democracy. Harper and Row, New YorkDuggan J, Fey M (2005) Electoral competition with policy-motivated candidates. Games Econ Behav
51:490–522Duverger M (1954) Political parties: their organization and activity in the modern state. Wiley, New YorkDworkin R (2010) The “devastating” decision. New York Rev Books 57(3):39Enelow JM, Hinich M (1982) Nonspatial candidate characteristics and electoral competition. J Politics
44:115–131Enelow JM, Hinich M (1989) The location of American Presidential candidates. Math Comput Model
12:417–435Erikson RS, Romero DW (1990) Candidate equilibrium and the behavioral model of the vote. Am Political
Sci Rev 84:1103–1126Fiorina M, Abrams SJ, Pope JC (2005) Culture war?: the myth of a polarized America. Pearson Longman,
New YorkGrossman GM, Helpman E (1994) Protection for sale. Am Econ Rev 84:833–850Grossman GM, Helpman E (1996) Electoral competition and special interest politics. Rev Econ Stud
63:265–286Grossman GM, Helpman E (2001) Special interest groups. MIT Press, Cambridge, MAHerrera H, Levine D, Martinelli C (2008) Policy platforms, campaign spending and voter participation.
J Publ Econ 92:501–513
123

518 N. Schofield et al.
Jeong G-H, Miller G, Schofield C, Sened I (2010) Cracks in the opposition: Partisan realigment in USSenate immigration negotiations. Working paper, Washington University
Jessee SA (2010) Partisan bias, political information and spatial voting in the 2008 Presidential Election.J Politics 72:327–340
Keefer P (2004) What does political economy tell us about economic development-and vice versa. AnnuRev Political Sci 7:247–272
Laakso M, Taagepera R (1979) Effective number of parties: a measure with applications to West Europe.Comp Political Sci 12:3–27
Laver M, Schofield N (1990) Multiparty Government: the politics of coalition in Europe. Oxford UniversityPress, Oxford. Reprinted 1998, University of Michigan Press, Ann Arbor
McCarty N, Poole K, Rosenthal H (2006) Polarized America. MIT Press, Cambridge, MAMcKelvey RD, Patty JW (2006) A theory of voting in large elections. Games Econ Behav 57:155–180McKelvey RD, Schofield N (1987) Generalized symmetry conditions at a core point. Econometrica 55:
923–933Miller G, Schofield N (2003) Activists and partisan realignment in the U.S. Am Political Sci Rev 97:
245–260Miller G, Schofield N (2008) The transformation of the Republican and Democratic coalitions in the U.S.
Perspect Politics 6:433–450Olmert E (2008) The time has come to say these things. New York Rev Books 55(19):6–8Olson M (1965) The logic of collective action. Yale University Press, New HavenPersson T, Tabellini G (2000) Political economics. MIT Press, Cambridge, MAPersson T, Tabellini G (2003) The economic effect of constitutions. MIT Press, Cambridge, MAPoole K, Rosenthal H (1984) U.S. Presidential elections 1968–1980: a spatial analysis. Am J Political Sci
28:283–312Riker WH (1953) Democracy in the United States. Macmillan, New YorkRiker WH, Ordeshook PC (1973) An introduction to positive political theory. Prentice-Hall, Englewood
Cliffs, NJSchofield N (1999) The heart and the uncovered set. J Econ Suppl 8:79–113Schofield N (2002) Representative democracy as social choice. In: Arrow K, Sen A, Suzumura K (eds)
The handbook of social choice and welfare. North Holland, New YorkSchofield N (2006) Equilibria in the spatial stochastic model with party activists. Rev Econ Des 10:183–203Schofield N (2007a) The mean voter theorem: necessary and sufficient conditions for convergent equilib-
rium. Rev Econ Stud 74:965–980Schofield N (2007b) Political equilibrium with electoral uncertainty. Soc Choice Welf 28:461–490Schofield N, Milller G (2007) Elections and activist coalitions in the U.S. Am J Political Sci 51:518–531Schofield N, Sened I (2006) Multiparty democracy: elections and legislative politics. Cambridge University
Press, CambridgeSchofield N, Zakharov A (2010) A stochastic model of the 2007 Russian Duma election. Pub Choice
142:177–194Schofield N, Miller G, Martin A (2003) Critical elections and political realignments in the U.S.: 1860–2000.
Political Stud 51:217–240Schofield N, Claassen C, Ozdemir U (2010a) Empirical and formal models of the United States presidential
election in 2000. Working paper, Washington UniversitySchofield N, Claassen C, Ozdemir U, Tavits M (2010b) Modeling elections in the United States and Poland:
voter perceptions, political leaders and activists. Working paper, Washington UniversitySchofield N, Gallego M, Ozdemir U, Jeon J (2010c) Modeling elections in Canada and Great Britain.
Working Paper: Washington University in Saint LouisSchofield N, Gallego M, Ozdemir U, Zakharov A (2011) Competition for popular support: a valence model
of elections in Turkey. Soc Choice Welf (this issue). doi:10.1007/s00355-010-0505-2Serra G (2010) Polarization of what? A model of elections with endogenous valence. J Politics 72:426–427Stokes D (1963) Spatial models and party competition. Am Political Sci Rev 57:368–377Stokes D (1992) Valence politics. In: Kavanagh D (ed) Electoral politics. Clarendon Press, OxfordSundquist JL (1973) Dynamics of the party system: alignment and realignment of political parties in the
United States. The Brookings Institution, Washington, DCTaylor M, Herman VM (1971) Party systems and government stability. Am Political Sci Rev 65:28–37Tomasky M (2010) The money fighting health care reform. New York Rev Books 57(6):10–14Warwick P (1994) Government survival in parliamentary democracies. Cambridge University Press,
Cambridge
123