STATE OF ISRAEL - Israelbondsintl
112
STATE OF ISRAEL This description of the State of Israel is dated as of June 30, 2021 and appears as Exhibit D to the State of Israel’s Annual Report on Form 18-K to the U.S. Securities and Exchange Commission for the fiscal year ended December 31, 2020.
-
Upload
khangminh22 -
Category
Documents
-
view
3 -
download
0
Transcript of STATE OF ISRAEL - Israelbondsintl

STATE OF ISRAEL
This description of the State of Israel is dated as of June 30, 2021 and appears as Exhibit D to the Stateof Israel’s Annual Report on Form 18-K to the U.S. Securities and Exchange Commission for the fiscal yearended December 31, 2020.

The delivery of this document at any time does not imply that the information is correct as of any timesubsequent to its date. This document (other than as part of a prospectus contained in a registration statementfiled under the U.S. Securities Act of 1933) does not constitute an offer to sell or the solicitation of an offer to buyany securities of or guaranteed by Israel.
TABLE OF CONTENTS
Currency Protocol . . . . . . . . . . . . . . . . . . . . . . . . . . . . . . . . . . . . . . . . . . . . . . . . . . . . . . . . D-5Fiscal Year . . . . . . . . . . . . . . . . . . . . . . . . . . . . . . . . . . . . . . . . . . . . . . . . . . . . . . . . . . . . . D-5FORWARD LOOKING STATEMENTS . . . . . . . . . . . . . . . . . . . . . . . . . . . . . . . . . . . . . . . . D-6COVID-19 . . . . . . . . . . . . . . . . . . . . . . . . . . . . . . . . . . . . . . . . . . . . . . . . . . . . . . . . . . . . . D-6SUMMARY INFORMATION AND RECENT DEVELOPMENTS . . . . . . . . . . . . . . . . . . . . D-11Economic Developments . . . . . . . . . . . . . . . . . . . . . . . . . . . . . . . . . . . . . . . . . . . . . . . . . . . . D-11Balance of Payments and Foreign Trade . . . . . . . . . . . . . . . . . . . . . . . . . . . . . . . . . . . . . . . . . D-11Fiscal Policy . . . . . . . . . . . . . . . . . . . . . . . . . . . . . . . . . . . . . . . . . . . . . . . . . . . . . . . . . . . . D-12Inflation and Monetary Policy . . . . . . . . . . . . . . . . . . . . . . . . . . . . . . . . . . . . . . . . . . . . . . . . D-12Labor Market . . . . . . . . . . . . . . . . . . . . . . . . . . . . . . . . . . . . . . . . . . . . . . . . . . . . . . . . . . . D-12Capital Markets . . . . . . . . . . . . . . . . . . . . . . . . . . . . . . . . . . . . . . . . . . . . . . . . . . . . . . . . . . D-13Global Issuances . . . . . . . . . . . . . . . . . . . . . . . . . . . . . . . . . . . . . . . . . . . . . . . . . . . . . . . . . D-13Political Situation . . . . . . . . . . . . . . . . . . . . . . . . . . . . . . . . . . . . . . . . . . . . . . . . . . . . . . . . . D-13Privatization . . . . . . . . . . . . . . . . . . . . . . . . . . . . . . . . . . . . . . . . . . . . . . . . . . . . . . . . . . . . D-15Loan Guarantee Program . . . . . . . . . . . . . . . . . . . . . . . . . . . . . . . . . . . . . . . . . . . . . . . . . . . D-15STATE OF ISRAEL . . . . . . . . . . . . . . . . . . . . . . . . . . . . . . . . . . . . . . . . . . . . . . . . . . . . . . D-18Introduction . . . . . . . . . . . . . . . . . . . . . . . . . . . . . . . . . . . . . . . . . . . . . . . . . . . . . . . . . . . . D-18Geography . . . . . . . . . . . . . . . . . . . . . . . . . . . . . . . . . . . . . . . . . . . . . . . . . . . . . . . . . . . . . D-19Population . . . . . . . . . . . . . . . . . . . . . . . . . . . . . . . . . . . . . . . . . . . . . . . . . . . . . . . . . . . . . D-19Immigration . . . . . . . . . . . . . . . . . . . . . . . . . . . . . . . . . . . . . . . . . . . . . . . . . . . . . . . . . . . . D-19Form of Government and Political Parties . . . . . . . . . . . . . . . . . . . . . . . . . . . . . . . . . . . . . . . D-20The Judicial System . . . . . . . . . . . . . . . . . . . . . . . . . . . . . . . . . . . . . . . . . . . . . . . . . . . . . . . D-21National Institutions . . . . . . . . . . . . . . . . . . . . . . . . . . . . . . . . . . . . . . . . . . . . . . . . . . . . . . D-22International Relations . . . . . . . . . . . . . . . . . . . . . . . . . . . . . . . . . . . . . . . . . . . . . . . . . . . . . D-22Membership in International Organizations and International Economic Agreements . . . . . . . . . D-26THE ECONOMY . . . . . . . . . . . . . . . . . . . . . . . . . . . . . . . . . . . . . . . . . . . . . . . . . . . . . . . . D-28Overview . . . . . . . . . . . . . . . . . . . . . . . . . . . . . . . . . . . . . . . . . . . . . . . . . . . . . . . . . . . . . . . D-28Gross Domestic Product . . . . . . . . . . . . . . . . . . . . . . . . . . . . . . . . . . . . . . . . . . . . . . . . . . . . D-28Savings and Investments . . . . . . . . . . . . . . . . . . . . . . . . . . . . . . . . . . . . . . . . . . . . . . . . . . . . D-31Business Sector Output . . . . . . . . . . . . . . . . . . . . . . . . . . . . . . . . . . . . . . . . . . . . . . . . . . . . . D-31Trade and Services . . . . . . . . . . . . . . . . . . . . . . . . . . . . . . . . . . . . . . . . . . . . . . . . . . . . . . . . D-31Transportation . . . . . . . . . . . . . . . . . . . . . . . . . . . . . . . . . . . . . . . . . . . . . . . . . . . . . . . . . . . D-32Communications . . . . . . . . . . . . . . . . . . . . . . . . . . . . . . . . . . . . . . . . . . . . . . . . . . . . . . . . . D-34Construction and Housing Prices . . . . . . . . . . . . . . . . . . . . . . . . . . . . . . . . . . . . . . . . . . . . . . D-35Agriculture . . . . . . . . . . . . . . . . . . . . . . . . . . . . . . . . . . . . . . . . . . . . . . . . . . . . . . . . . . . . . D-36Water . . . . . . . . . . . . . . . . . . . . . . . . . . . . . . . . . . . . . . . . . . . . . . . . . . . . . . . . . . . . . . . . . D-36Electricity . . . . . . . . . . . . . . . . . . . . . . . . . . . . . . . . . . . . . . . . . . . . . . . . . . . . . . . . . . . . . . D-37Energy . . . . . . . . . . . . . . . . . . . . . . . . . . . . . . . . . . . . . . . . . . . . . . . . . . . . . . . . . . . . . . . . D-37Tourism . . . . . . . . . . . . . . . . . . . . . . . . . . . . . . . . . . . . . . . . . . . . . . . . . . . . . . . . . . . . . . . D-38
D-1

Research and Development . . . . . . . . . . . . . . . . . . . . . . . . . . . . . . . . . . . . . . . . . . . . . . . . . . D-39Prices . . . . . . . . . . . . . . . . . . . . . . . . . . . . . . . . . . . . . . . . . . . . . . . . . . . . . . . . . . . . . . . . . D-39Employment, Labor and Wages . . . . . . . . . . . . . . . . . . . . . . . . . . . . . . . . . . . . . . . . . . . . . . . D-40Role of the State in the Economy . . . . . . . . . . . . . . . . . . . . . . . . . . . . . . . . . . . . . . . . . . . . . . D-42Israel Electric Corporation Ltd. . . . . . . . . . . . . . . . . . . . . . . . . . . . . . . . . . . . . . . . . . . . . . . . D-44Defense Oriented Companies . . . . . . . . . . . . . . . . . . . . . . . . . . . . . . . . . . . . . . . . . . . . . . . . D-45Ports Companies . . . . . . . . . . . . . . . . . . . . . . . . . . . . . . . . . . . . . . . . . . . . . . . . . . . . . . . . . D-45Israel Postal Company Ltd. . . . . . . . . . . . . . . . . . . . . . . . . . . . . . . . . . . . . . . . . . . . . . . . . . . D-46The Environment . . . . . . . . . . . . . . . . . . . . . . . . . . . . . . . . . . . . . . . . . . . . . . . . . . . . . . . . . D-46BALANCE OF PAYMENTS AND FOREIGN TRADE . . . . . . . . . . . . . . . . . . . . . . . . . . . . . D-54Balance of Payments . . . . . . . . . . . . . . . . . . . . . . . . . . . . . . . . . . . . . . . . . . . . . . . . . . . . . . D-54Foreign Trade . . . . . . . . . . . . . . . . . . . . . . . . . . . . . . . . . . . . . . . . . . . . . . . . . . . . . . . . . . . D-56AML/CFT/CPF Regime . . . . . . . . . . . . . . . . . . . . . . . . . . . . . . . . . . . . . . . . . . . . . . . . . . . . D-60Foreign Investment . . . . . . . . . . . . . . . . . . . . . . . . . . . . . . . . . . . . . . . . . . . . . . . . . . . . . . . . D-63Foreign Exchange Controls and International Reserves . . . . . . . . . . . . . . . . . . . . . . . . . . . . . . . D-64Foreign Exchange Rates . . . . . . . . . . . . . . . . . . . . . . . . . . . . . . . . . . . . . . . . . . . . . . . . . . . . D-65THE FINANCIAL SYSTEM . . . . . . . . . . . . . . . . . . . . . . . . . . . . . . . . . . . . . . . . . . . . . . . . D-66Bank of Israel . . . . . . . . . . . . . . . . . . . . . . . . . . . . . . . . . . . . . . . . . . . . . . . . . . . . . . . . . . . D-66Monetary Policy . . . . . . . . . . . . . . . . . . . . . . . . . . . . . . . . . . . . . . . . . . . . . . . . . . . . . . . . . D-67Banking System . . . . . . . . . . . . . . . . . . . . . . . . . . . . . . . . . . . . . . . . . . . . . . . . . . . . . . . . . . D-72Capital Markets . . . . . . . . . . . . . . . . . . . . . . . . . . . . . . . . . . . . . . . . . . . . . . . . . . . . . . . . . . D-79PUBLIC FINANCE . . . . . . . . . . . . . . . . . . . . . . . . . . . . . . . . . . . . . . . . . . . . . . . . . . . . . . D-85General . . . . . . . . . . . . . . . . . . . . . . . . . . . . . . . . . . . . . . . . . . . . . . . . . . . . . . . . . . . . . . . . D-85The Budget Process . . . . . . . . . . . . . . . . . . . . . . . . . . . . . . . . . . . . . . . . . . . . . . . . . . . . . . . D-85Fiscal Framework . . . . . . . . . . . . . . . . . . . . . . . . . . . . . . . . . . . . . . . . . . . . . . . . . . . . . . . . D-85Socioeconomic Policy . . . . . . . . . . . . . . . . . . . . . . . . . . . . . . . . . . . . . . . . . . . . . . . . . . . . . . D-88Taxation and Tax Revenues . . . . . . . . . . . . . . . . . . . . . . . . . . . . . . . . . . . . . . . . . . . . . . . . . . D-88Local Authorities . . . . . . . . . . . . . . . . . . . . . . . . . . . . . . . . . . . . . . . . . . . . . . . . . . . . . . . . . D-89Social Security System . . . . . . . . . . . . . . . . . . . . . . . . . . . . . . . . . . . . . . . . . . . . . . . . . . . . . D-89Healthcare . . . . . . . . . . . . . . . . . . . . . . . . . . . . . . . . . . . . . . . . . . . . . . . . . . . . . . . . . . . . . . D-90Pension Funds . . . . . . . . . . . . . . . . . . . . . . . . . . . . . . . . . . . . . . . . . . . . . . . . . . . . . . . . . . . D-90PUBLIC DEBT . . . . . . . . . . . . . . . . . . . . . . . . . . . . . . . . . . . . . . . . . . . . . . . . . . . . . . . . . . D-92General . . . . . . . . . . . . . . . . . . . . . . . . . . . . . . . . . . . . . . . . . . . . . . . . . . . . . . . . . . . . . . . . D-92Central Government Debt . . . . . . . . . . . . . . . . . . . . . . . . . . . . . . . . . . . . . . . . . . . . . . . . . . . D-92Maturity of Debt . . . . . . . . . . . . . . . . . . . . . . . . . . . . . . . . . . . . . . . . . . . . . . . . . . . . . . . . . D-93Domestic Government Debt . . . . . . . . . . . . . . . . . . . . . . . . . . . . . . . . . . . . . . . . . . . . . . . . . D-94External Government Debt . . . . . . . . . . . . . . . . . . . . . . . . . . . . . . . . . . . . . . . . . . . . . . . . . . D-94Derivatives and Hedging Transactions . . . . . . . . . . . . . . . . . . . . . . . . . . . . . . . . . . . . . . . . . . D-95Net Public Debt . . . . . . . . . . . . . . . . . . . . . . . . . . . . . . . . . . . . . . . . . . . . . . . . . . . . . . . . . . D-96Domestic Public Debt . . . . . . . . . . . . . . . . . . . . . . . . . . . . . . . . . . . . . . . . . . . . . . . . . . . . . . D-97External Public Debt . . . . . . . . . . . . . . . . . . . . . . . . . . . . . . . . . . . . . . . . . . . . . . . . . . . . . . D-97State Guarantees . . . . . . . . . . . . . . . . . . . . . . . . . . . . . . . . . . . . . . . . . . . . . . . . . . . . . . . . . D-99DEBT RECORD . . . . . . . . . . . . . . . . . . . . . . . . . . . . . . . . . . . . . . . . . . . . . . . . . . . . . . . . . D-101
D-2

LIST OF TABLES
Table No. 1 NIS/U.S. Dollar Exchange Rates . . . . . . . . . . . . . . . . . . . . . . . . . . . . . . . . . . . . . . D-5Table No. 2 Selected Economic Indicators . . . . . . . . . . . . . . . . . . . . . . . . . . . . . . . . . . . . . . . . D-17Table No. 3 Distribution of Knesset Seats by Faction . . . . . . . . . . . . . . . . . . . . . . . . . . . . . . . . D-21Table No. 4 Main Economic Indicators . . . . . . . . . . . . . . . . . . . . . . . . . . . . . . . . . . . . . . . . . . D-29Table No. 5 Resources and Use of Resources . . . . . . . . . . . . . . . . . . . . . . . . . . . . . . . . . . . . . . D-30Table No. 6 Gross Domestic Product Percentage Change by Industry . . . . . . . . . . . . . . . . . . . . . D-30Table No. 7 Manufacturing Index by Category . . . . . . . . . . . . . . . . . . . . . . . . . . . . . . . . . . . . D-32Table No. 8 Industrial Production Index . . . . . . . . . . . . . . . . . . . . . . . . . . . . . . . . . . . . . . . . . D-32Table No. 9 Arrivals of Tourists by Country of Citizenship and Exports of Tourism Services . . . . D-39Table No. 10 Selected Price Indices . . . . . . . . . . . . . . . . . . . . . . . . . . . . . . . . . . . . . . . . . . . . . D-40Table No. 11 Principal Labor Force Indicators . . . . . . . . . . . . . . . . . . . . . . . . . . . . . . . . . . . . . D-41Table No. 12 Unemployment Data by Demographic Group . . . . . . . . . . . . . . . . . . . . . . . . . . . D-41Table No. 13 Structure of Employment in Israel . . . . . . . . . . . . . . . . . . . . . . . . . . . . . . . . . . . . D-42Table No. 14 Selected State-Owned Companies . . . . . . . . . . . . . . . . . . . . . . . . . . . . . . . . . . . . D-44Table No. 15 Balance of Payments . . . . . . . . . . . . . . . . . . . . . . . . . . . . . . . . . . . . . . . . . . . . . D-55Table No. 16 Exports of Goods by Major Groups . . . . . . . . . . . . . . . . . . . . . . . . . . . . . . . . . . D-57Table No. 17 Imports of Goods by Major Groups . . . . . . . . . . . . . . . . . . . . . . . . . . . . . . . . . . D-58Table No. 18 Exports of Goods by Region . . . . . . . . . . . . . . . . . . . . . . . . . . . . . . . . . . . . . . . D-59Table No. 19 Imports of Goods by Region . . . . . . . . . . . . . . . . . . . . . . . . . . . . . . . . . . . . . . . D-59Table No. 20 Merchandise Trade Indices . . . . . . . . . . . . . . . . . . . . . . . . . . . . . . . . . . . . . . . . . D-60Table No. 21 Nonresident Investment in Israel and Resident Investment Abroad . . . . . . . . . . . . . D-63Table No. 22 External Assets and Liabilities (Debt Instruments) . . . . . . . . . . . . . . . . . . . . . . . . D-64Table No. 23 Foreign Currency Reserves at the Bank of Israel . . . . . . . . . . . . . . . . . . . . . . . . . . D-64Table No. 24 Average Exchange Rates . . . . . . . . . . . . . . . . . . . . . . . . . . . . . . . . . . . . . . . . . . . D-65Table No. 25 Selected Interest Rates . . . . . . . . . . . . . . . . . . . . . . . . . . . . . . . . . . . . . . . . . . . . D-71Table No. 26 Monetary Indicators . . . . . . . . . . . . . . . . . . . . . . . . . . . . . . . . . . . . . . . . . . . . . D-72Table No. 27 Assets, Liabilities and Equity Capital of the Five Major Banking Groups . . . . . . . . D-79Table No. 28 The Budget Deficit and Its Financing . . . . . . . . . . . . . . . . . . . . . . . . . . . . . . . . . D-87Table No. 29 General Government Taxes . . . . . . . . . . . . . . . . . . . . . . . . . . . . . . . . . . . . . . . . D-89Table No. 30 Government & Public Debt . . . . . . . . . . . . . . . . . . . . . . . . . . . . . . . . . . . . . . . . D-92Table No. 31 Central Government Debt . . . . . . . . . . . . . . . . . . . . . . . . . . . . . . . . . . . . . . . . . D-93Table No. 32 Maturity of Debt — Average Time to Maturity . . . . . . . . . . . . . . . . . . . . . . . . . D-93Table No. 33 Annual Local Currency Government Debt Issuances . . . . . . . . . . . . . . . . . . . . . . . D-94Table No. 34 Composition of External Government Debt . . . . . . . . . . . . . . . . . . . . . . . . . . . . . D-94Table No. 35 Total Funds Raised by Israel Bonds . . . . . . . . . . . . . . . . . . . . . . . . . . . . . . . . . . . D-94Table No. 36 Foreign Currency Debt of the Government of Israel . . . . . . . . . . . . . . . . . . . . . . . D-96Table No. 37 Net Public Debt . . . . . . . . . . . . . . . . . . . . . . . . . . . . . . . . . . . . . . . . . . . . . . . . D-96Table No. 38 Ratio of Net Public Debt to GDP . . . . . . . . . . . . . . . . . . . . . . . . . . . . . . . . . . . . D-97Table No. 39 Net External Debt . . . . . . . . . . . . . . . . . . . . . . . . . . . . . . . . . . . . . . . . . . . . . . . D-97Table No. 40 Outstanding Public Sector External Debt . . . . . . . . . . . . . . . . . . . . . . . . . . . . . . . D-98Table No. 41 Forward Amortization of External Debt — Principal Payments . . . . . . . . . . . . . . D-98Table No. 42 Forward Amortization of External Debt — Interest Payments . . . . . . . . . . . . . . . D-99
D-3
Table No. 43 State Guarantees . . . . . . . . . . . . . . . . . . . . . . . . . . . . . . . . . . . . . . . . . . . . . . . . D-100
SUPPLEMENTARY INFORMATION
Loans from the Government of the Federal Republic of Germany . . . . . . . . . . . . . . . . . . . . . . . D-101Loans from Non-Israeli Banks . . . . . . . . . . . . . . . . . . . . . . . . . . . . . . . . . . . . . . . . . . . . . . . . D-101International Capital Markets Issues . . . . . . . . . . . . . . . . . . . . . . . . . . . . . . . . . . . . . . . . . . . D-102State of Israel Bonds . . . . . . . . . . . . . . . . . . . . . . . . . . . . . . . . . . . . . . . . . . . . . . . . . . . . . . D-103Tradable Local Currency Direct Debt of the Government of Israel . . . . . . . . . . . . . . . . . . . . . . D-110Non-Tradable Local Currency Direct Debt of the Government of Israel . . . . . . . . . . . . . . . . . . . D-111Various Loans of the Government of Israel . . . . . . . . . . . . . . . . . . . . . . . . . . . . . . . . . . . . . . . D-111Balance of the Government’s Floating Rate Debt by Currency (As of December 31, 2020) . . . . . . D-111
D-4

Currency Protocol
Except as otherwise expressed herein, all amounts in this annual report (the “Annual Report”) areexpressed in New Israeli Shekels (“NIS”or “shekel”) or in U.S. dollars (“$,”“dollars,”or “USD”). Any amountstated in dollars in this Annual Report as of a stated date or for a stated period that was converted from NISinto dollars, was either converted at the representative foreign exchange rate for dollars on such date, or at theaverage of the representative foreign exchange rates for dollars for each day during such period, as publishedby the Bank of Israel. The Bank of Israel representative rates are indicative exchange rates of foreign currenciesversus the shekel and are based on the average buying and selling prices published by banks around the timethat the representative rate is set. The representative NIS/USD exchange rates as of the following dates and forthe following periods were:
Table No. 1
NIS/U.S. Dollar Exchange Rates
2016 2017 2018 2019 2020
December 31st . . . . . . . . . . . . . . . . . . . . . . . . . . . . . . . . . . . . . 3.845 3.467 3.748 3.456 3.215Yearly Average . . . . . . . . . . . . . . . . . . . . . . . . . . . . . . . . . . . . 3.841 3.600 3.595 3.565 3.442
Source: Bank of Israel.
On December 31, 2020, the Bank of Israel representative foreign exchange rate for USD was NIS 3.215per USD 1.00. The average exchange rate for 2020 was NIS 3.442 per USD 1.00.
Totals in certain tables in this Annual Report may differ from the sum of the individual items in suchtables due to rounding. Unless otherwise specified, amounts in NIS or USD are given in current prices withoutadjustment for inflation.
Fiscal Year
The fiscal year of the Government of Israel (the “Government”) ends on December 31. The twelve-month period which ended on December 31, 2020 is referred to in this Annual Report as “2020” andother years are referred to in a similar manner.
D-5

FORWARD-LOOKING STATEMENTS
Forward-looking statements are statements that are not historical facts, including statements about theGovernment’s beliefs and expectations. Forward-looking statements generally can be identified by the use offorward-looking terminology such as “may,” “will,” “expect,” “intend,” “estimate,” “anticipate,” “believe,”“continue,” “could,” “should,” “would” or similar terminology. These statements are based on Israel’s currentplans, estimates, assumptions and projections. Therefore, you should not place undue reliance on them.Forward-looking statements speak only as of the date they are made, and Israel undertakes no obligation toupdate any of them in light of new information or future events. Forward-looking statements involve inherentrisks. Israel cautions you that many factors could affect the future performance of the Israeli economy. Thesefactors include, but are not limited to:
• External factors, such as:
• the effects of the outbreak of coronavirus (COVID-19);
• interest rates in financial markets outside Israel;
• the impact of changes in the credit rating of Israel;
• the security situation;
• the economic growth and stability of Israel’s major trading partners, including the United Statesand the European Union (the “EU”);
• the global high-tech market; and
• regional economic and political conditions.
• Internal factors, such as:
• general economic and business conditions in Israel;
• present and future exchange rates of the Israeli currency;
• foreign currency reserves;
• the level of domestic debt;
• domestic inflation;
• the level of budget deficit;
• the level of foreign direct and portfolio investment; and
• the level of Israeli domestic interest rates.
COVID-19
Since the start of the COVID-19 pandemic in December 2019, Israel has implemented measures to reduceits spread and mitigate its negative economic impacts. Actions taken include business closures, travelrestrictions, mandatory face masks and social distancing guidelines. As of the week ending June 26, 2021,Israel recorded 840,830 total COVID-19 cases and 6,429 COVID-19-related deaths.
In February 2020, Israel imposed a mandatory quarantine for returning travelers from areas particularlyaffected by COVID-19 such as China, Italy and certain other countries in East Asia and Europe. InMarch 2020, a mandatory quarantine period was put into effect for all returning travelers from abroad.Throughout March 2020, restrictions were placed on residents and work activities. Access to public spaceswas reduced, private sector activity was restricted, and the public sector shifted to an emergency format, whichlimited the workforce to critical functions and essential employees. Additional measures were implemented,such as the requirement for individuals to remain within 100 meters of their homes unless required for essentialservices. The measures, taken to protect the health of Israelis also had an adverse effect on the economy,particularly on the business sector and unemployment. On April 19, 2020, the first lockdown ended; graduallyover the following months the state began lifting some of its restrictions. From September 18 to October 18,2020, as a result of a spike in COVID-19 cases, Israel entered its second nationwide lockdown. A third
D-6

nationwide lockdown commenced on December 27, 2020, and was in place until February 7, 2021. Followingthe end of the third lockdown, the state began to re-open and to lift the remaining restrictions such asrestrictions on businesses and social gatherings. As of the week ending June 26, 2021, the economy remainsactive and open; some COVID-19 restrictions remain in place including restrictions on travel into Israel,mandatory PCR testing for all travelers arriving to Israel, and mandatory quarantine for non-vaccinatedtravelers. Following an increase of new COVID-19 cases, the indoor facemask requirement was reintroducedafter being removed earlier in the month.
The Government began a mass vaccination program on December 19, 2020 with at-risk populations. Theprogram expanded to all citizens aged 16 and older on February 4, 2021. On June 2, 2021, the vaccinationprogram was extended to all citizens aged 12 and older. As of the week ending June 26, 2021, over 55% of theIsraeli population was fully vaccinated.
COVID-19 Stimulus Packages
The Government has deployed various initiatives in response to COVID-19. On March 23, 2020, theBank of Israel announced a NIS 50 billion government bond purchasing program and on April 6, 2020,lowered its base rate to 0.1% from 0.25%. On April 8, 2020, the Government approved a NIS 80 billionstimulus package, which included NIS 11 billion earmarked for health-related expenses. On June 2, 2020, theGovernment increased the stimulus package by NIS 20 billion. On July 29, 2020, the Government approved asecond stimulus package of approximately NIS 36 billion for FY 2020 and NIS 73 billion for FY 2021. As ofMay 2021, the total approved fiscal stimulus plan after adjustments was NIS 202.3 billion for FY 2020-2021(approximately 15% of GDP), of which NIS 151 billion has already been expended. The 2020-2021 stimulusplan includes the following measures, among others:
• Health & Civil provisions: NIS 30.9 billion,
• Social Safety Net to Israelis economically affected by COVID-19: NIS 71.8 billion,
• Business continuity: NIS 90.1 billion, and
• Economic growth & development: NIS 9.7 billion.
Impact of COVID-19 on the Healthcare System
From the beginning of the COVID-19 pandemic, a special budget of over NIS 23 billion, in addition tothe regular budget, was provided to the Israeli health system by the Government. The budget was targeted forthe procurement of: personal protective equipment (PPE) for health care workers, pharmaceutical drugs,testing equipment, respiratory machines, in addition to support for the hospital infrastructure, the geriatrichealthcare system and hotel accommodation to enable travelers to self-isolate.
Impact of COVID-19 on the Justice System
In March 2020, the Minister of Justice applied, in coordination with the Courts Administration and thePresident of the Supreme Court, regulations that allowed only certain types of hearings to take place, while allother hearings had to be postponed. These regulations also give court’s administrator the authority todetermine if any additional matters, beyond the matters already set forth in the regulations, are to beadjudicated in the courts. The special emergency period was extended several times, and it expired on May 18,2020.
Before, during, and after the emergency period, the judiciary acted in accordance with the Ministry ofHealth’s guidelines and regulations, and in accordance with the courts administrator regulations. The activityin the courts and tribunals varied in accordance with the government and Ministry of Health guidelines.
Pursuant to the government decision to end COVID-19 related restrictions, as of June 17, 2021 all courtshearings and labor courts hearings are held without COVID-19 restrictions.
Effect of COVID-19 on GDP and Trade
According to estimates by CBS, in the first quarter of 2021, Israel’s GDP contracted by 6.2%. The effectsof COVID on the economy and subsequent government-required lockdowns are reflected in the varied GDP
D-7

quarterly growth figures: contraction of 7.1% in Q1 2020, contraction of 30.7% in Q2 2020, growth of 42.4%in Q3 2020, and growth of 6.3% in Q4 2020 (all figures at annual rates, seasonally adjusted). In total, Israel’seconomy contracted by 2.6% in 2020.
Israel concluded 2020 with a current account surplus totaling 5.1% of GDP, its 18th consecutive year ofsurplus. As of the first quarter of 2021, net exports surplus amounted to $4.7 billion (non-seasonally adjustedbasis). In 2020, Public consumption grew by 2.7% while fixed capital investments contracted by 4.8%. Privateconsumption declined by 9.5% as a result of COVID-19 restrictions on retail and services sectors. Businessservice exports grew by 10.8% and goods’ exports grew 4.4%, boosted by the high-tech sector.
In 2020, exports grew 0.1% and imports fell 8%. Exports of goods and services rose to NIS 425 billionfrom NIS 424.6 billion in 2019. Israeli imports, however, fell in 2020, totaling NIS 388.1 billion from NIS421.8 billion in 2019 (all trade figures at constant 2015 prices).
In 2020, 30.9% of Israel’s goods exports (excluding aircraft, ships and diamonds, and using seasonallyadjusted data) went to the EU (a decrease from 33.7% in 2019), 23.1% went to the United States (an increasefrom 22.7% in 2019), 22.1% went to Asia (an increase from 21.2% in 2019), and 23.8% went to other markets(an increase from 22.4% in 2019).
In 2020, 39.7% of Israel’s goods imports (excluding aircraft, ships and diamonds) came from the EU (anincrease from 37.7% in 2019), 25.1% came from Asia (an increase from 22.3% in 2019), 11.4% came from theUnited States (a decrease from 13.5% in 2019), and 23.8% came from other countries (a decrease from 26.5%in 2019).
Impact of COVID-19 on the Economy and Banking System
Israeli banks showed resilience to COVID-19 crisis given the strong economic growth prior to thepandemic and the relatively low vulnerabilities of banks. The fast and effective monetary, fiscal and regulatorysupport measures implemented by the Government and the Banking Supervision Department (the “BSD”),restored confidence and sustained credit flow and economic recovery.
The BSD addressed the regulatory and supervisory concerns and established three main objectives forproviding support to Israel’s banking system:
1. Preserving the public’s deposits in banks and safeguarding the stability of the banks.
2. Providing assistance to businesses and households that are in financial distress due to the crisis.
3. Continuing to offer essential banking services to the public.
The BSD developed policies to meet the objectives above and provide economic support to Israel’spopulation in order to mitigate the economic impact of COVID-19.
To identify banks’ vulnerabilities, safeguard banks’ stability, and enhance risk-based supervision duringthe crisis, BSD took the following measures:
1. Required banks to run three different stress tests with two types of scenarios, one that forecasts arecovery in mid-2020 and one that forecasts a recovery in 2021. The BSD analyzed results relating tothe banks’ profitability, risks, liquidity and capital and found that the banks’ capital positions aresufficient to absorb the losses incurred during the COVID-19 outbreak.
2. Performed two supervisory stress tests across the banking system. The first test in mid-2020 and wasintended to identify vulnerabilities in advance and assess the ability of the banking system to providecredit and support the needs of the economy during a prolonged crisis. The results supported thespecification of the policy measures taken by the BSD. The second test in late-2020 incorporatedimpacts of changing economic and market conditions on banks and the economy and includedupdated portfolio management practices, e.g., dynamic balance sheet and variation in credit growthamongst credit lines. The results indicated that all banks’ capital positions are sufficient to absorblosses incurred during the crisis and that the banks have high liquidity buffers and strong competencyto support market and credit needs.
D-8

3. Analyzed the developments in the Israeli banks on a routine basis and, as a result of such analysis,urged banks to increase expense to credit losses and to improve cybersecurity systems.
4. Increased the supervision of liquidity reports and confirmed that all banks have adequate liquidityto weather the crisis.
5. Required banks to extend disclosure in their public financial reports to include modified debts thathave not been classified as restructured debts.
6. Published two supervisory letters to banks expecting that the financial reports should adequatelyreflect the impact of the COVID-19 pandemic on their activity, risk profile and financial conditionand the measures taken by them to address these changes.
To provide assistance to businesses and households that were significantly impacted by the COVID-19crisis, BSD took the following measures:
1. Encouraged banks to increase the supply of credit and defer loan payments from businesses andhouseholds. The BSD implemented certain measures to enable banks to do this while stillmaintaining underwriting standards and prudent credit risk management, such as:
• Urged banks to alleviate a credit crunch by using the large amount of excess capital aboveregulatory levels to increase the loan stockpile designated for businesses. The BSD allowed the useof additional capital buffers, such as countercyclical buffers, to enable the banks to inject credit toimprove the businesses’ liquidity situations.
• Issued a transitional order to reduce the tier 1 capital ratio (“CET1”) by 100 basis points to 9% forthe large banks and to 8% for all other banks.
• Issued a transitional directive to reduce the regulatory leverage ratio by 50 basis points to 5.5% forthe large banks and to 4.5% for all other banks.
• Advocated deferring the distribution of dividend payments and the buyback of banks’ sharesduring the COVID-19 outbreak period.
• Allowed the banks to defer credit payments without classifying them as a loan in arrears.
• Increased the capacity of certain home equity loans by reducing the LTV ratio from 70% to 50%;eased the restrictions on mortgages; and allowed for an increase in the payment-to-income ratio torise to 70% (from 50%) for those who were employed but, due to COVID-19, were temporarilyfurloughed without pay.
• Increased loans to the construction and real estate sector from 20% to 24% of total loans tocompensate for the difficulties that these companies encountered in raising capital in the financialmarkets.
2. Increased credit to small businesses. This was accomplished together with the Ministry of Finance,which set up a fund to issue guarantees for 15% of the funds allocated to small businesses.
3. Implemented a voluntary program of the banking system to defer credit payments of retail andsmall and medium-sized enterprises for up to six months. The program was extended inSeptember 2020 to allow for up to three more months of deferment in certain cases.
4. A new deferral program for the most strained retail and small and medium-sized enterprises wasformulated to replace the previous programs. (As a result, as of March 2021, about 2.4% of totalloans are in a deferment status, compared to more than 16% at the peak point).
5. Implemented a voluntary program for the credit-card companies to defer credit payments of retailand small and medium-sized enterprises for up to six months.
6. Preceded the publication of a directive requiring banks to report technological failures and cyberevents.
The BSD took the following measures to continue offering essential banking services to the public:
D-9

1. Encouraged banks to devise operational plans to allow for business continuity in times of crisis andto engage a smaller number of branches that will render banking services while abiding by the publichealth safety directives issued by the Ministry of Health regarding COVID-19, to continue offeringremote services digitally and via telephone, and to ensure that the ATM machines were refilled on afrequent basis to boost the trust of the general public in the banking system.
2. Allowed for the remote signing of mortgage documents for customers to open accounts withouthaving to physically visit a branch.
3. Improved access to social security payments and cash for the underprivileged and elderly by issuingdebit cards without requiring a visit to a physical bank branch. The Home Front Command workedwith banks to dispatch ATMs to allow people to access banking services without endangering theirhealth.
4. Allowed for a reduction in bank branch activity, provided that the share of open branches was noless than 80%.
5. Introduced several leniencies regarding digital operations, (securities operations, checks’ deposit viaapp etc.) that enabled the customers to access financial services remotely.
The table below shows the breakdown of accumulated loan forbearance and the amount of suchforbearance following the implementation of the measures described above from March 2020 untilMarch 2021, and the share of currently active status deferred loans of total loans in each segment as ofMarch 2021.
Accumulative number ofdeferred loans,
March 2020 – March 2021
Deferred loans outstandingMarch 2020 – March 2021
(Accumulative, NIS millions)
Share of currentlyactive status deferredloans of total loans,
March 2021(percent)
Commercial and large businesses . . . . 3,526 17,402 2.1%Small businesses . . . . . . . . . . . . . . . . 163,266 34,407 2.8%Mortgages . . . . . . . . . . . . . . . . . . . . 239,699 110,381 4.5%Consumer . . . . . . . . . . . . . . . . . . . . 300,798 14,031 0.7%Total borrowers . . . . . . . . . . . . . . . . 707,289 176,220 2.4%
D-10

SUMMARY INFORMATION AND RECENT DEVELOPMENTS
The following summary highlights information contained elsewhere in this Annual Report and is qualified inits entirety by the more detailed information appearing elsewhere in this Annual Report. This section is notcomplete and may not contain all the information that you should consider. You should read the entire AnnualReport and any supplement carefully.
Economic Developments
In recent years, the Israeli economy has performed well in terms of macroeconomic and fiscal outcomes.Growth has averaged 3.3% from 2015 to 2019 slightly higher than potential growth of the Israeli economy andhigher than in many OECD countries. Developments in the global economy are likely to influence the Israelieconomy, particularly exports and the high-tech sector.
Israel’s economic growth was expected to continue in 2020 due to the strong labor market, the growinghigh-tech sector and the expected development of new gas fields. However, the outbreak of COVID- 19, therestrictions implemented to contain it and its global economic effects have had a negative impact on Israel’seconomy. All of this led to the contraction of Israel’s growth rate by 7.1% (annual rate, seasonally adjusted) inthe first quarter of 2020, followed by a contraction of 30.7% in the second quarter of 2020. The GDP in thethird quarter of 2020 grew at a rate of 42.4% as a result of the lifting of most COVID-19 restrictions followedby growth of 6.3% in the fourth quarter of 2020. In total, the Israeli economy contracted by 2.6% in 2020. Inthe first quarter of 2021 GDP contracted by 6.2% (annual rate, seasonally adjusted).
During 2020, there was no change in Israel’s foreign currency credit rating from Fitch Ratings (“Fitch”),Moody’s Investor Services (“Moody’s”), or Standard & Poor’s Global Ratings (“S&P”). In April 2020,Moody’s updated Israel’s outlook from positive to stable.
Balance of Payments and Foreign Trade
Israel had a current account surplus of 5.1% of GDP in 2020, the 18th consecutive year in which apositive surplus in the current account was recorded. The surplus most recently peaked in 2015 at 5.2% ofGDP, and since then the surplus has amounted to 3.7% in 2016, 2.9% in 2017, 2.7% in 2018 and 3.4% in 2019.In the first quarter of 2021 the surplus amounted to 5.4% of GDP (on a non-seasonally adjusted basis).Israel’s net exports decreased from a surplus of $9.1 billion in 2015 to a surplus of $5.0 billion in 2016,$4.2 billion in 2017, $2.4 billion in 2018 and then increased to $7.4 billion in 2019, in 2020 the surplus increasedsignificantly to $17.5 billion. In the first quarter of 2021 net exports surplus amounted to $4.7 billion (on anon-seasonally adjusted basis).
In 2020, 30.9% of Israel’s goods exports (excluding aircraft, ships and diamonds, and using seasonallyadjusted data) were to the EU (a decrease from 33.7% in 2019), 23.1% were to the United States (an increasefrom 22.7% in 2019), 22.1% were to Asia (an increase from 21.2% in 2019), and 23.8% were to other markets(an increase from 22.4% in 2019). In 2020, 39.7% of Israel’s goods imports (excluding aircraft, ships anddiamonds) came from the EU (an increase from 37.7% in 2019), 25.1% came from Asia (an increase from22.3% in 2019), 11.4% came from the United States (a decrease from 13.5% in 2019), and 23.8% came fromother countries (a decrease from 26.5% in 2019).
Over the past five years (measured from June 22, 2016 to June 22, 2021), the NIS/USD exchange rate hasaveraged 3.5515, fluctuating between a high of 3.900 (recorded on June 27, 2016) and a low of 3.116 (recordedon January 14, 2021). The exchange rate as of June 22, 2021 was 3.261.
Foreign currency reserves at the Bank of Israel at the end of 2020 stood at $173.3 billion, equivalent to43.3% of GDP as the Bank of Israel purchased $21.2 billion in 2020. As of May 2021, reserves stood at$198.3 billion, equivalent to 48.3% of GDP. The reserve level has been approximately 30% of GDP since late2009. Following a concentrated effort by the Bank of Israel to raise the reserve level in 2008 and 2009, whichled to daily purchases of foreign currency, the Bank’s policy since 2009 has been to intervene in the foreigncurrency market on a discretionary basis in events of unusual movements in the exchange rate that areinconsistent with underlying economic conditions or when conditions in the foreign exchange market aredisorderly. In addition, since 2013, the Bank has been purchasing foreign currency to counteract the adverseeffect on the exchange rate caused by natural gas production in Israel. The Bank intends to reassess its policy
D-11

concerning these purchases related to counteracting the effects of natural gas production after Israel’ssovereign wealth fund becomes operational, which is expected in early 2021. In recent years, the Bank of Israelpurchased approximately $3.9 billion of foreign currency in 2019, $3.3 billion in 2018, $6.6 billion in 2017,$6.0 billion in 2016 and $8.8 billion in 2015. Of this, the amount purchased related to the natural gas programwas $1.5 billion in 2018, $1.5 billion in 2017, $1.8 billion in 2016, and $3.1 billion in 2015. In November 2018,the Bank of Israel announced that it would cease to purchase foreign currency with respect to the natural gasprogram.
Israel is a party to free trade agreements with its major trading partners and is one of the few nations thathas signed free trade agreements with both the United States and the EU.
Fiscal Policy
The Knesset approved the budget and economic plan for the 2019 fiscal year on March 15, 2018. Thedeficit target was set at 2.9% of GDP. The deficit for 2019 stood at 3.7%, exceeding 3% for the first time since2013. The budget and economic plan for the 2020 fiscal year was not approved as there was no coalitiongovernment from December 2018 to May 2020. Though a coalition government was formed, it was dissolvedafter failing to pass the 2020 Budget by the deadline of December 23, 2020. As a result on March 23, 2021Israel held elections for the fourth time in two years.
Budget proposals in Israel are constrained by two parameters. The first is a “deficit ceiling” that sets themaximal deficit-to-GDP ratio, which has been modified several times, most recently to set the deficit target forthe 2020 budget at 2.5%. The second is an “expenditure ceiling” that sets a ceiling for year-to-year growth ingovernment expenditure. Under the current formula prescribed by law, the expenditure ceiling is based on theaverage population growth rate over the three years prior to the submission of the budget, plus the ratio of themedium-term debt target (50%) to the current debt-to-GDP ratio.
In 2019, the Government continued its debt-reduction policy, reducing government debt as a percent ofGDP by 0.8% compared to 2018, to a level of 58.5% for 2019. Public debt (including local authorities’ debt) asa percent of GDP also declined to 60% at the end of 2019, a decline of 0.9% compared to 2018. As a result ofCOVID-19, the deficit for 2020 rose to 11.6%, significantly above the deficit target. Likewise, the public debt-to-GDP ratio for 2020 amounted to 72.4%, a significant increase from 60% in 2019.
Inflation and Monetary Policy
The average annual inflation rate over the last decade (2010 to 2020) was approximately 0.9%, slightlybelow the Government’s target range of 1% – 3%. The changes in the CPI reflect a rise in the prices ofcommodities, housing and agricultural products. Measured at year-end, the CPI growth rate was negative in2016 amounting to −0.2%, returning to positive values in 2017 at 0.4%, growing by 0.8% in 2018 and 0.6% in2019. In 2020 the CPI fell by 0.7%. Between December 2020 and May 2021, the CPI increased by 1.5%.
Between 2004 and 2008, the key interest rate set by the Bank of Israel mostly fluctuated between 3.5%and 5.5%. Due to the slowdown in the Israeli and global economies, toward the end of 2008, the Bank of Israelbegan to reduce the key interest rate until it reached 0.5% in mid-2009. As Israel’s economy recovered, theBank of Israel began to gradually increase the key interest rate until it peaked at 3.25% in June 2011. However,in October 2011, the Bank of Israel once again began to consistently reduce the key interest rate, until itreached 0.1% in March 2015. The rate remained until December 2018 when the Bank of Israel increased it to0.25%. In April 2020, the Bank of Israel lowered the rate to 0.1% due to COVID-19 and its impact on theeconomy and has not changed it since. The real interest rate averaged −0.5%, −0.1%, −0.2%, −0.9% and−0.8% in 2015, 2016, 2017, 2018 and 2019, respectively. As of the end of May 2021, the real interest rate, lessinflation expectations, was −1.8%.
Labor Market
Prior to the outbreak of COVID-19, the labor force participation rate, which is the labor force asa percentage of the population over the age of 15, averaged 63.0%, slightly lower than the annual average of63.5% in 2019. Unemployment averaged 3.5%, slightly lower than the annual average of 3.8% in 2019.
D-12

Since the outbreak of COVID-19, unemployment increased significantly as a result of lockdowns andother restrictions to reduce the spread of COVID-19. Total unemployment in 2020 was 4.3% with an additional9.5% absent from work due to reasons related to COVID-19, such as unpaid leave and an additional 1.4% thatleft the labor force due to reasons related to COVID-19, such as dismissal or workplace closure fromMarch 2020.
Capital Markets
The Bank of Israel, together with other governmental authorities and regulators, monitors Israeli banksand financial institutions on an ongoing basis, supervising the banking system’s conditions and operations asa whole. In addition, the Bank of Israel cooperates with the Ministry of Finance and the Israel SecuritiesAuthority to achieve comprehensive regulation and supervision of Israel’s financial markets, to ensurecoordination among the various entities in the financial sector, and to set policies and measures that will beimplemented and enforced with respect to such entities.
According to the Bank of Israel’s estimates, the value of the public’s total financial assets, which excludesassets of the Government, the Bank of Israel, nonresidents’ investments, commercial banks and mortgagebanks, reached NIS 4,404.3 billion at the end of 2020, representing growth of 7.8%, 11.2% and 1.4% in 2020,2019 and 2018, respectively.
The Tel Aviv Stock Exchange (the “TASE”) is Israel’s sole stock exchange and the Tel Aviv 125(“TA-125”) and Tel Aviv 35 (“TA-35”) are its main indices and primary indicators of the stock priceperformance of Israel’s public companies. The TA-125 and TA-35 measure the 125 and 35 companies,respectively, with the highest market capitalization listed on the TASE. In 2020, TA-35 and TA-125 decreasedby 10.9% and 3.0%, respectively, as compared to increases in the S&P 500 16.3% and the NASDAQ 43.6%over the same period.
Global Issuances
In recent years, Israel has been active in the global sovereign debt markets. In March 2016, theGovernment issued $1.5 billion in the global markets, consisting of an aggregate of $1 billion principal amountof 2.875% bonds due March 2026 and $500 million principal amount of 4.5% bonds due January 2043; the2043 bonds were a further issuance of the 4.5% bonds due 2043, which were issued on January 31, 2013. InOctober 2016, Israel issued $200 million in the global markets, consisting of 4.5% bonds due 2043; the bondswere a further issuance of the 4.5% bonds due 2043, which were issued on January 31, 2013 and reissued inMarch 2016. In January 2017, Israel completed a dual-tranche issuance in the Euro market, issuing anaggregate €1.5 billion principal amount of 1.5% bonds due 2027 and an aggregate €750 million principalamount of 2.375% bond due 2037. In January 2018, Israel completed a dual-tranche issuance in the globalmarkets, issuing an aggregate $1 billion principal amount of 3.25% bonds due 2028 and an aggregate $1 billionprincipal amount of 4.125% bonds due 2048. In January 2019, Israel completed a dual-tranche issuance in theEuro market, issuing an aggregate €1.25 billion principal amount of 1.5% bonds due 2029 and an aggregate€1.25 billion principal amount of 2.5% bond due 2049.
In January 2020, Israel completed a dual-tranche issuance in the global markets, issuing an aggregate$1 billion principal amount of 2.5% bonds due 2030 and an aggregate $2 billion principal amount of 3.375%bonds due 2050. In March 2020, Israel completed a triple-tranche issuance in the global markets, issuing anaggregate $2 billion principal amount of 2.75% bonds due 2030, an aggregate $2 billion principal amount of3.875% bonds due 2050, and an aggregate $1 billion principal amount of 4.5% bonds due 2120. In April 2020,Israel completed an aggregate $5 billion principal amount of 3.8% bonds due 2060. This issuance was dual-listed on the London Stock Exchange and, for the first time, on the Taiwanese Stock Exchange.
Political Situation
Overview of Israel’s Political Structure. The State of Israel was established in 1948. Israel is aparliamentary democracy. It functions on a set of basic laws, granted with a special status that enables judicialreview by the Israeli Supreme Court. Israel’s constitutional jurisprudence is grounded in judicial decisions,and in the State’s Declaration of Independence.
D-13

Israel’s governmental powers are divided amongst its legislative, executive and judiciary branches. TheSupreme Court is the highest court of Israel, and also sits as a High Court of Justice. Any citizen of Israel hasthe ability to appeal a case to the Supreme Court. Approximately 10,000 proceedings are initiated in theSupreme Court annually. The legislative power of the State resides in the Knesset, a unicameral parliamentthat consists of 120 members from several political factions elected by Israel’s citizens under a system ofproportional representation (see “State of Israel — Form of Government and Political Parties,” below).
The government is the executive power of the State of Israel. It is approved by the Knesset, afterpresenting a coalition supported by a majority of the Knesset members, even if not all of its supporters areactual members in it. It is usually a coalition of parties. The Prime Minister is the head of government andchief executive of state. The President is considered the ‘Head of State’, with the important role of helpinglead the process of forming a government. The functions of the President are defined in the Basic Law:President of the State. The President assigns the task of forming a new Government to a member of Knesset.In addition, the President assumes public functions and activities. Among the President’s formal functions aresigning laws, opening the first session of a new Knesset, receiving the credentials of new Ambassadors offoreign states, approving the appointment of civil and religious judges, the State Comptroller and the Governorof the Bank of Israel, pardoning prisoners or commuting their sentences.
Israel and Gaza. In 2005, Israel withdrew completely from the Gaza Strip (“Gaza”), dismantling allIsraeli communities in Gaza and all of its military bases there, as well as four Israeli settlements in the northernWest Bank (see “State of Israel — International Relations,” below). Despite this, there has been ongoingtension on the border between Israel and Gaza.
In June 2007, Hamas, a terror organization, assumed control over Gaza. In December 2008, in responseto Hamas firing an increasing number of rockets from Gaza into Israel, Israel commenced Operation CastLead in Gaza with the goal of suppressing the rocket fire. The operation concluded in January 2009,contributing to a relatively calm atmosphere from 2009 until 2011. Operation Cast Lead did not materiallyaffect the Israeli economy.
From 2011 into 2012, Hamas resumed conducting terrorist activities and substantially increased its rocketattacks from Gaza, using rockets with the capability of reaching Tel Aviv and Jerusalem. In response, inNovember 2012, Israel launched Operation Pillar of Defense, which lasted eight days, a military campaignagainst terrorist targets in Gaza. In response to Hamas firing rockets from Gaza into Israel, as well as theterrorist kidnapping and murder of three Israeli teenagers in the summer of 2014, Israel took defensive militaryaction. Israel commenced Operation Protective Edge with the goal of ending the rocket fire, some of whichreached Israeli cities and towns almost 100 kilometers away from Gaza. The operation ended in August 2014.
Beginning in October 2015, there was an increase in acts of violence against Israelis, mostly by individualPalestinians using knives or cars as weapons. This wave of violence was welcomed and encouraged by Hamasand, at first, also by the Palestinian Authority. The Palestinian Authority has, however, continued its securitycooperation with Israel and has, in general, become more cautious in expressing encouragement for violence.
In May 2018, Hamas organized violent protests along the fence separating Gaza and Israel. Manyprotesters were armed with knives and guns and threw Molotov cocktails and burning tires in an attempt tobreach the fence. Some protesters caused fires on the Israeli side of the fence through use of incendiaryballoons/kites. Hamas referred to these protests as part of a “March of Return” to claim Israeli territory.Some protesters linked the events to the relocation of the U.S. embassy, and others associated the protestswith economic hardship in Gaza. The protests continue on a regular basis. Israeli security forces preventedany breaching of the fence and border. A few dozen violent protesters lost their lives in the process, many ofwhom were identified as Hamas militants. The Israel Defense Forces have launched an investigation intoIsrael’s military response to the protests.
A wave of terror attacks, including drive-by shootings and ramming attacks, took place in the West Bankduring November and December 2018. The attacks resulted in a few Israeli casualties and Israeli DefenseForces conducted special operations to apprehend the terrorists.
In the beginning of May 2019, there was a wave of rocket attacks from Gaza and over 700 rockets werelaunched into Israeli territory. Four Israeli citizens, and two Palestinians were killed by Hamas rocket fire.Within three days this violence was suppressed and a ceasefire agreement was reached.
D-14
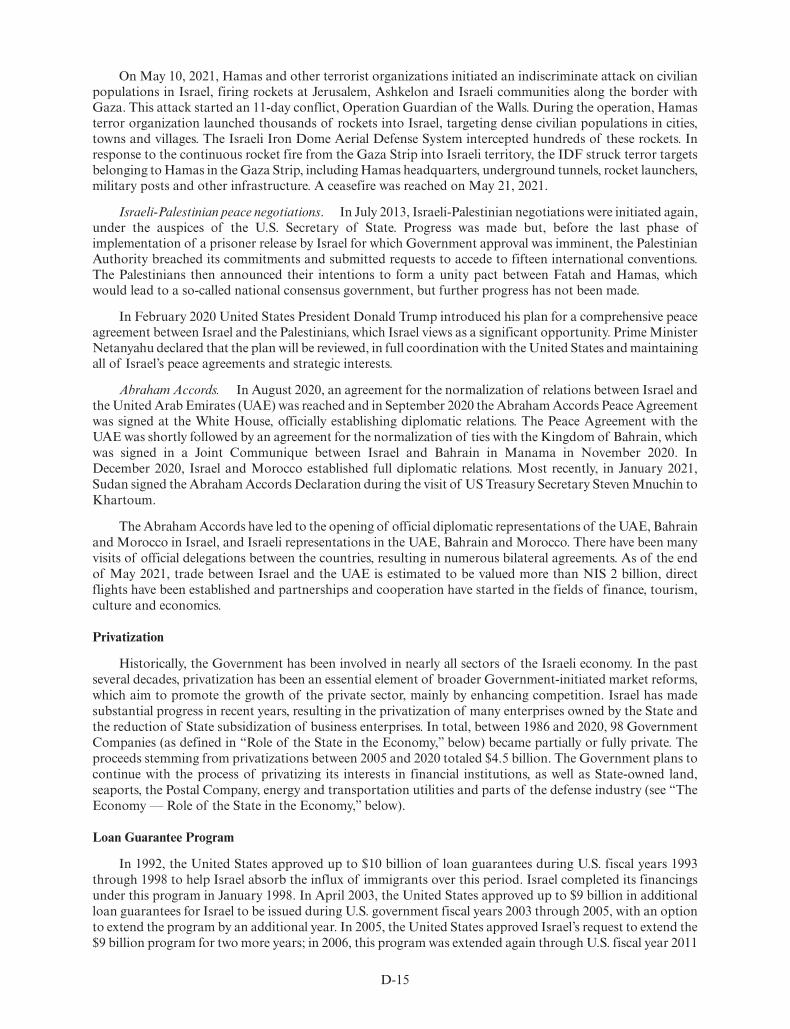
On May 10, 2021, Hamas and other terrorist organizations initiated an indiscriminate attack on civilianpopulations in Israel, firing rockets at Jerusalem, Ashkelon and Israeli communities along the border withGaza. This attack started an 11-day conflict, Operation Guardian of the Walls. During the operation, Hamasterror organization launched thousands of rockets into Israel, targeting dense civilian populations in cities,towns and villages. The Israeli Iron Dome Aerial Defense System intercepted hundreds of these rockets. Inresponse to the continuous rocket fire from the Gaza Strip into Israeli territory, the IDF struck terror targetsbelonging to Hamas in the Gaza Strip, including Hamas headquarters, underground tunnels, rocket launchers,military posts and other infrastructure. A ceasefire was reached on May 21, 2021.
Israeli-Palestinian peace negotiations. In July 2013, Israeli-Palestinian negotiations were initiated again,under the auspices of the U.S. Secretary of State. Progress was made but, before the last phase ofimplementation of a prisoner release by Israel for which Government approval was imminent, the PalestinianAuthority breached its commitments and submitted requests to accede to fifteen international conventions.The Palestinians then announced their intentions to form a unity pact between Fatah and Hamas, whichwould lead to a so-called national consensus government, but further progress has not been made.
In February 2020 United States President Donald Trump introduced his plan for a comprehensive peaceagreement between Israel and the Palestinians, which Israel views as a significant opportunity. Prime MinisterNetanyahu declared that the plan will be reviewed, in full coordination with the United States and maintainingall of Israel’s peace agreements and strategic interests.
Abraham Accords. In August 2020, an agreement for the normalization of relations between Israel andthe United Arab Emirates (UAE) was reached and in September 2020 the Abraham Accords Peace Agreementwas signed at the White House, officially establishing diplomatic relations. The Peace Agreement with theUAE was shortly followed by an agreement for the normalization of ties with the Kingdom of Bahrain, whichwas signed in a Joint Communique between Israel and Bahrain in Manama in November 2020. InDecember 2020, Israel and Morocco established full diplomatic relations. Most recently, in January 2021,Sudan signed the Abraham Accords Declaration during the visit of US Treasury Secretary Steven Mnuchin toKhartoum.
The Abraham Accords have led to the opening of official diplomatic representations of the UAE, Bahrainand Morocco in Israel, and Israeli representations in the UAE, Bahrain and Morocco. There have been manyvisits of official delegations between the countries, resulting in numerous bilateral agreements. As of the endof May 2021, trade between Israel and the UAE is estimated to be valued more than NIS 2 billion, directflights have been established and partnerships and cooperation have started in the fields of finance, tourism,culture and economics.
Privatization
Historically, the Government has been involved in nearly all sectors of the Israeli economy. In the pastseveral decades, privatization has been an essential element of broader Government-initiated market reforms,which aim to promote the growth of the private sector, mainly by enhancing competition. Israel has madesubstantial progress in recent years, resulting in the privatization of many enterprises owned by the State andthe reduction of State subsidization of business enterprises. In total, between 1986 and 2020, 98 GovernmentCompanies (as defined in “Role of the State in the Economy,” below) became partially or fully private. Theproceeds stemming from privatizations between 2005 and 2020 totaled $4.5 billion. The Government plans tocontinue with the process of privatizing its interests in financial institutions, as well as State-owned land,seaports, the Postal Company, energy and transportation utilities and parts of the defense industry (see “TheEconomy — Role of the State in the Economy,” below).
Loan Guarantee Program
In 1992, the United States approved up to $10 billion of loan guarantees during U.S. fiscal years 1993through 1998 to help Israel absorb the influx of immigrants over this period. Israel completed its financingsunder this program in January 1998. In April 2003, the United States approved up to $9 billion in additionalloan guarantees for Israel to be issued during U.S. government fiscal years 2003 through 2005, with an optionto extend the program by an additional year. In 2005, the United States approved Israel’s request to extend the$9 billion program for two more years; in 2006, this program was extended again through U.S. fiscal year 2011
D-15

(with an option to carry forward unused guarantee amounts for an additional year); and in 2012, the programwas extended again through 2016. On October 24, 2012, the United States and Israel entered into an agreementestablishing a new framework for administering the extended program. This program has been extendednumerous times, most recently in 2019 until September 30, 2023 (with an option to carry forward unusedguarantee amounts for an additional year). This allows the United States to provide access to up toapproximately $3.8 billion in future loan guarantees as part of the $9 billion commitment made in 2003.
The amount of guarantees that may be issued to Israel under the loan guarantee program may be reducedby an amount equal to the amount extended or estimated to have been extended by Israel for activities that thePresident of the United States determines are inconsistent with the objectives and understandings reachedbetween the United States and Israel regarding the implementation of the loan guarantee program. Under theprogram, the United States issues guarantees with respect to all payments of principal and interest on certainbonds issued by Israel. The proceeds of the guaranteed loans may be used to refinance existing debt. Underthe $9 billion loan guarantee program, between September 2003 and November 2004 Israel issued guaranteednotes totaling $4.1 billion face value. Israel has not issued any notes under the loan guarantee program sinceNovember 2004, and up to $3.8 billion of U.S. loan guarantees (subject to the reductions described above)remains available.
D-16

Table No. 2
Selected Economic Indicators(In Billions of NIS Unless Otherwise Noted)
2016 2017 2018 2019 2020
Main IndicatorsGDP (at constant 2015 prices) . . . . . . . . . . . . . . 1,211.2 1,254.5 1,298.2 1,342.9 1,308.0Real GDP growth . . . . . . . . . . . . . . . . . . . . . . . 3.8% 3.6% 3.5% 3.4% -2.6%GDP per capita (in NIS, at constant 2015
prices) . . . . . . . . . . . . . . . . . . . . . . . . . . . . . 141,766 144,040 146,181 148,390 141,926GDP per capita, percentage change . . . . . . . . . . . 1.8% 1.6% 1.5% 1.5% -4.4%Inflation (change in CPI – annual average) . . . . . . -0.5% 0.2% 0.8% 0.8% -0.6%Industrial production . . . . . . . . . . . . . . . . . . . . 1.7% 3.7% 3.5% 2.9% 6.3%Business sector product (at constant 2015
prices) . . . . . . . . . . . . . . . . . . . . . . . . . . . . . 900.7 934.6 969.3 1,007.7 974.3Permanent average population (thousands) . . . . . 8,546 8,713 8,883 9,054 9,217Unemployment rate . . . . . . . . . . . . . . . . . . . . . 4.8% 4.2% 4.0% 3.8% 4.3%(1)
Foreign direct investment (net inflows, in billionsof dollars) . . . . . . . . . . . . . . . . . . . . . . . . . . 12.0 16.9 21.5 17.4 24.3
Trade DataExports (F.O.B) of goods and services
(NIS, at constant 2015 prices) . . . . . . . . . . . . . 370.7 383.6 408.2 424.6 425.0Imports (F.O.B) of goods and services
(NIS, at constant 2015 prices) . . . . . . . . . . . . . 363.5 380.8 405.2 421.8 388.1External DebtExternal debt liabilities (in millions of dollars, at
year-end) . . . . . . . . . . . . . . . . . . . . . . . . . . . 87,128 90,084 94,307 103,202 130,410Net external debt (in millions of dollars, at
year-end) . . . . . . . . . . . . . . . . . . . . . . . . . . . -134,150 -164,162 -156,360 -170,256 -202,455Government Debt(1)
Total gross government debt (at end-of-yearcurrent prices) . . . . . . . . . . . . . . . . . . . . . . . . . 740.8 747.1 788.3 823.2 983.9
Total gross government debt as percentage ofGDP . . . . . . . . . . . . . . . . . . . . . . . . . . . . . . 60.5% 58.9% 59.3% 58.5% 70.9%
Revenues and Expenditures (net) . . . . . . . . . . . . .Revenues and grants . . . . . . . . . . . . . . . . . . . . . 301.7 316.5 317.2 325.4 317.9Expenditures . . . . . . . . . . . . . . . . . . . . . . . . . . 424.7 447.9 444.9 492.1 563.1Expenditures other than capital
expenditures . . . . . . . . . . . . . . . . . . . . . . . . . 312.6 321.2 336.8 354.8 426.4Development expenditures (including repayments
of debt) . . . . . . . . . . . . . . . . . . . . . . . . . . . . 112.2 126.8 108.1 137.3 136.7Repayments of debt . . . . . . . . . . . . . . . . . . . . . 88.1 100.2 79.0 104.9 97.4
(1) A broader definition of unemployment used since the outbreak of COVID-19 totaled 15.3% in 2020, andincluded those absent from work due to reasons related to COVID-19 such as unpaid leave (9.5%) andthose who left the labor force due to COVID-19 related reasons such as dismissal or closure of theworkplace (1.4%).
D-17

STATE OF ISRAEL
Introduction
Israel is a highly developed, industrialized democracy. Real GDP increased at an annual average rate of3.5% between 1996 and 2020 but contracted by 2.6% in 2020 as a result of the economic impact of COVID-19.Israel has seen marked improvements in many economic and fiscal indicators in recent decades. GDP growthhas been steady and consistent, with the exception of a contraction during the global slowdown of the early2000s and fluctuating growth rates relating to the global financial crisis, the European debt crisis and morerecently the COVID-19 pandemic.
Income inequality and poverty levels have decreased as a result of the strong labor market andemployment growth. The standard of living in Israel is steadily increasing, as demonstrated by the growth inGDP per capita. However, GDP per capita in Israel based on purchasing power parity still remains relativelylow. In order to support continuing increases in the standard of living, groups with low participation ratesneed to be integrated into labor force, and productivity needs to be improved.
In recent years natural gas production has contributed to the energy sector of the Israeli economy. From2006 to 2020 Israel experienced a major shift in fuel components used for electricity generation. In 2006,electricity production was comprised of 18% natural gas and 71% coal. In 2020, electricity production wascomprised of 67% natural gas, 26% coal and 6% renewable energy.
The high-tech sector in Israel includes the industrial sectors such as the electronics, pharmaceuticals andaircraft sectors as well as software and R&D. Employment in the high-tech industry increased rapidly and thesector’s share of GDP has grown and contributed to the economy’s development in the past few decades.These developments have also benefited total exports, half of which are high-tech goods and services.
From 2013 to 2018, GDP grew at an average annual pace of 3.6%. The increase in growth was mainly dueto an increase in private consumption averaging growth of 4.2%, while growth in exports was moderate. Inparticular, exports of goods showed weakness, mainly between 2015-2017, as services exports continued torise, leading to an increase in the share of services exports relative to total exports. The increase in privateconsumption was due, in part, to low interest rates, relatively low levels of household leverage, andimprovement in the labor market. From 2013 to 2016, growth in fixed capital formation was volatile and, afterstagnation in 2014 and 2015, it rose to 12.7% in 2016, mainly due to a sharp increase in the number ofpurchases of passenger cars, and averaged growth of 4.1% from 2017 to 2019.
Consistent with anticipated long-term growth potential of above 3%, the GDP growth rate was 3.4% in2019 reflecting growth in all GDP components. During 2020 with private consumption declining sharply by9.5% as a result of COVID-19 restrictions on retail and services sectors, exports proved to be resilient giventhe expansion of the high-tech sector as business services grew by 10.8% and exports goods grew by 4.4%. Intotal exports grew by 0.1% as tourism declined significantly. Public consumption grew by 2.7% while fixedcapital investments and imports contracted by 4.8% and 8%, respectively.
Israel has made substantial progress in opening its economy since 1990, removing major trade barriers aswell as tariffs. Israel has entered into free trade agreements with its major trading partners and is one of thefew nations to sign free trade agreements with both the United States and the EU. Israel has also signed freetrade agreements with the European Free Trade Association (“EFTA”) in addition to Canada, Turkey, Jordan,Egypt and Mexico. In 2010, Israel became a full member of the Organization of Economic Co-operation andDevelopment (“OECD”), following a unanimous vote by OECD members.
From 2013 to 2017, the budget deficit remained below the budget deficit targets. In 2018, the budgetdeficit target and the actual budget deficit were 2.9% of GDP, while in 2019 the budget deficit rose to 3.7%,above the target of 2.9%. In 2020 the budget deficit amounted to 11.6% as public expenditure expanded as aresult of the Government’s stimulus plan to support the economy during the COVID-19 crisis and the decreasein tax revenues.
The unemployment rate has fallen consistently throughout the past decade. In 2012, the unemploymentrate was 6.9%, and dropped consistently each subsequent year, down to 4% in 2018 and 3.8% in 2019. Thereduction in the unemployment rate in recent years was accompanied by an improvement in the laborparticipation rate. The participation rate in 2019 was 63.5%, continuing a trend of incremental improvement
D-18

from 59.4% in 2002. The growing employment rate in recent years has led to an increase in real wages anddisposable income. In addition, there is high demand for workers, particularly high-skilled workers. In 2020following the outbreak of COVID-19, unemployment increased significantly due to the lockdowns imposedto reduce the spread of COVID-19. The unemployment rate was 4.3% in 2020 with an additional 9.5% absentfrom work due to reasons related to COVID-19 such as unpaid leave, and a further 1.4% that left the laborforce due to COVID-19 related reasons such as dismissal or closure of the workplace from March 2020.
One of Israel’s most important resources is its highly educated work force. Based on OECD reports, in2020, 50% of adults between the ages of 25 and 64 had attained tertiary education, compared to the OECDaverage of 40%. Between 1990 and 2003, approximately 1.1 million people immigrated to Israel, increasingIsrael’s population by approximately 23%. Most of the new immigrants were highly educated and possessedstrong academic and professional backgrounds mainly in science, management, medicine and other technicaland professional fields. Although this wave of immigration initially placed a strain on the economy by raisingthe budget and trade deficits and contributing to a relatively high level of unemployment, the immigrantssuccessfully integrated into the economy.
Geography
Israel is located on the western edge of Asia bordering the Mediterranean Sea. It is bordered to the northby Lebanon and Syria, to the east by Jordan, to the west by the Mediterranean Sea and Egypt, and to thesouth by Egypt and the Gulf of Eilat. Israel has a total land area, excluding Gaza and the West Bank, ofapproximately 21,500 square kilometers or 8,305 square miles, approximately the size of the U.S. state of NewJersey. Jerusalem is the capital of Israel.
Population
Israel’s population, including Israeli citizens residing in the West Bank, but not including foreign nationalsresiding in Israel for employment purposes, is estimated at 9.3 million as of the end of 2020. This is an increaseof 1.7% from 9.1 million in 2019, following 1.9% growth in 2019 from 9 million people in 2018, 1.9% growthin 2018 from 8.8 million in 2017, 2% growth in 2017 from 8.6 in 2016 and 2.0% growth in 2016 from 8.5 millionpeople in 2015. Between 1990 and 2020, Israel’s population grew by 93%, with a significant part of the increasedue to immigration from the former Soviet Union. In 2019, 11.9% of the population was 65 years of age orolder, 31.5% was between the ages of 35 and 64, 28.5% was between the ages of 15 and 34, and 28.1% wasunder the age of 15. 91.5% of the population lives in urban areas with 18.4% of the population living inIsrael’s three largest cities: Jerusalem (population 919,400), Tel Aviv (population 460,600) and Haifa(population 285,300).
The Israeli population is comprised of a variety of ethnic and religious groups. In 2019, 74.1% of thetotal Israeli population was Jewish, 17.9% Muslim, 1.9% Christian and 1.6% Druze. The State’s Declarationof Independence and various decisions of the Supreme Court of Israel guarantee freedom of religion for allIsraeli citizens. Hebrew is the official language and Arabic has a special status in Israel, while English iscommonly used.
Immigration
Israel has experienced a continuous flow of immigrants, in part due to its Law of Return, which providesthat Jews, those of Jewish ancestry, their spouses, as well as converts to Judaism, have the right to immigrateand settle in Israel and gain citizenship. In 2016, 27,029 immigrants arrived in Israel, a decrease of 3.1%compared to 2015. In 2017, 26,357 immigrants arrived in Israel, a decrease of 2.5% compared to 2016. In2018, 28,099 immigrants arrived in Israel, an increase 6.6% compared to 2017. In 2019, 33,171 immigrantsarrived in Israel, an increase of 18.1% compared to 2018. In 2020 19,713 immigrants arrived in Israel a decreaseof 40.7% compared to 2019.
For over a decade, Israel, like many other developed countries, has experienced an influx of individualsentering its territory illegally. Since 2007, more than 60,000 migrants have entered illegally by means otherthan permitted entry into Israel at border entry points. Most of the illegal migrants entered Israel by crossingthe Israeli-Egyptian border, not through an official border crossing, prior to the Amendment to the Preventionof Infiltration Law (Offenses and Jurisdiction) 5714-1954 and the completion of a major portion of a border
D-19

fence in 2012 – 2013. Since 2013, there has been a drastic decrease in the number of migrants entering Israelillegally. Since 2010, thousands of illegal migrants have voluntarily left Israel to safe third countries or to theircountry of origin.
As of the end of 2020, there were approximately 30,511 illegal migrants in Israel (excluding births) whoentered Israel illegally, approximately 27,930 of whom originated from Eritrea and Sudan, according to datafrom the Population and Immigration Authority. Although Israel has refrained from returning citizens ofEritrea and Sudan to their home countries, this policy is reviewed from time to time.
Israel respects its international obligations and follows strict procedures consistent with the criteria andstandards of international law codified by the 1951 Convention Relating to the Status of Refugees. Applicantsfor asylum by migrants, whether legal or illegal, are interviewed by the Refugee Status Determination Unit todetermine whether the migrant fulfills the criteria set by the Convention and those who are denied refugeestatus may appeal to the court system. From 2017 to 2020, Israel received approximately 42,800 requests forpolitical asylum, some by Eritreans and Sudanese citizens.
COVID-19 has led to a significant reduction in migration. Accordingly, the number of new asylumapplications filed decreased by 81% from 2019 to 2020, with 1,909 new asylum applications filed in 2020 ascompared to 9,842 asylum applications in 2019. This decrease was primarily attributable to the restrictionsimposed on the entry of foreigners into Israel and the reduced number of international flights entering Israelin response to COVID-19.
Form of Government and Political Parties
Israel was established in 1948 as a parliamentary democracy with governmental powers divided amongthe legislative, executive and judicial branches. Israel has no formal written constitution but rather a numberof basic laws which govern the fundamental functions of the state, including the electoral system, thegovernment, the legislature and the judiciary system, and which guarantee the protection of property, life,body and dignity, and the right to privacy and freedom of occupation. These basic laws were granted a specialstatus by the Israeli Supreme Court in comparison to other laws and, in some cases, cannot be amended exceptby an absolute majority vote of the Knesset. All citizens of Israel, regardless of race, religion, gender or ethnicbackground, are guaranteed full democratic rights. Freedom of worship, speech, assembly, press and politicalaffiliation are embodied in the State’s laws, judicial decisions and Israel’s Declaration of Independence.
The President of Israel is the Head of State. The President has an apolitical, figurehead role, with theoperational executive power lying in the hands of the Prime Minister. Presidents are elected by the Knesset fora seven-year term and cannot be reelected for an additional term. The President has no veto powers and theduties of the office are mainly ceremonial. President Reuven “Rubi” Rivlin took office in July 2014 and histerm ends in July 2021. In June 2021, Isaac “Bougie” Herzog was elected by the Knesset as the next Presidentof Israel and he is due to take office in July 2021.
The legislative power of the State resides in the Knesset, a unicameral parliament that consists of 120members elected by nationwide voting under a system of proportional representation. The Knesset is electedfor a four-year term, although most parliaments have not served a full term and early elections are frequentoccurrences.
The legal voting age for Israeli citizens is eighteen. Elections are overseen by the Central ElectionsCommittee and are held in accordance with Basic-Law: The Knesset and the Knesset Elections Law of 1969.Early elections can be called by a majority vote of Knesset members on a bill to dissolve the Knesset or by anedict of the Prime Minister approved by the President, and normally occur in situations of political stalemateor when the Government is unable to obtain the Knesset’s support for its policies. Failure to form a governmentafter elections or to obtain Knesset approval of the annual budget by March 31 (three months after the start ofthe fiscal year) also triggers early elections.
Israel uses the closed list method of party-list proportional representation, whereby citizens vote for theirpreferred party-list and can only have influence over the position of individual candidates placed on the partylist, if the party decides to hold primary elections, and the citizen is a member of such party. The 120 seats inthe Knesset are assigned proportionally to each party that received votes, provided that the party meets orexceeds a 3.25% electoral threshold. Parties are permitted to form electoral alliances so as to gain enough
D-20

collective votes to meet the threshold (the alliance as a whole must meet the threshold, not the individualparties) and thus be allocated a seat. Following the elections, and after consulting with different parties’representatives, the President selects a member of the new Knesset to form the Government. While the selectedKnesset member typically is the leader of the party receiving the most seats, he or she is not required to be so,but is the member of Knesset who has the most chance of forming a government, based on the consultationwith the parties. If the selected Knesset member successfully assembles a coalition, and the Knesset votes infavor of the proposed government, then this Knesset member becomes Prime Minister and a government isformed. In the event a party wins 61 or more seats in an election, such party can form a viable governmentwithout having to form a coalition. However, no party has ever won 61 seats in an election. Thus, a coalitionhas always been required to form a government, with those remaining outside the coalition comprising theopposition.
An amendment was passed in 2020 such that when a government is formed, one of the Knesset memberscan be selected as an alternate prime minister and will replace the prime minister at a pre-determined date. Atsuch time, the sitting Prime Minister will become the alternate Prime Minister.
The previous government served for under a year and was dissolved when it failed to pass a budget for2020 by December 22, 2020. Israel’s most recent general election was held on March 23, 2021.
Following this election, the President selected Benjamin Netanyahu to form a coalition government.Netanyahu did not succeed in forming a coalition in the newly selected Knesset by the deadline. As a result,the President then selected Yair Lapid to form a coalition government. Member of the Knesset (“MK”) Lapidinformed the President that he succeeded in forming a “rotation government” in which MK Naftali Bennettwould first serve as the Prime Minister and MK Yair Lapid would then be the alternate Prime Minister. OnJune 13, 2021 the Knesset voted in favor of the new government and the government began its term. At thetime of the formation of the government, the Knesset was informed that Bennett and Lapid would switchpositions on August 27, 2023. The political parties that are members of the coalition are Yesh Atid, Blue andWhite, Yamina, Labor (Haavoda), Israel Beitenu, New Hope, Meretz, Ra’am – United Arab List.
The following table sets forth the number of Knesset seats by political party as of April 6, 2021.
Table No. 3
Distribution of Knesset Seats by Political Party(As of June 21, 2021)
Number ofSeats
Likud . . . . . . . . . . . . . . . . . . . . . . . . . . . . . . . . . . . . . . . . . . . . . . . . . . . . . . . . . . . . . . . 30Yesh Atid . . . . . . . . . . . . . . . . . . . . . . . . . . . . . . . . . . . . . . . . . . . . . . . . . . . . . . . . . . . . . 17Shas. . . . . . . . . . . . . . . . . . . . . . . . . . . . . . . . . . . . . . . . . . . . . . . . . . . . . . . . . . . . . . . . . 9Blue and White . . . . . . . . . . . . . . . . . . . . . . . . . . . . . . . . . . . . . . . . . . . . . . . . . . . . . . . . . 8Yamina . . . . . . . . . . . . . . . . . . . . . . . . . . . . . . . . . . . . . . . . . . . . . . . . . . . . . . . . . . . . . . 7Labor (Haavoda) . . . . . . . . . . . . . . . . . . . . . . . . . . . . . . . . . . . . . . . . . . . . . . . . . . . . . . . 7United Torah Judaism . . . . . . . . . . . . . . . . . . . . . . . . . . . . . . . . . . . . . . . . . . . . . . . . . . . . 7Israel Beitenu . . . . . . . . . . . . . . . . . . . . . . . . . . . . . . . . . . . . . . . . . . . . . . . . . . . . . . . . . . 7Religious Zionism. . . . . . . . . . . . . . . . . . . . . . . . . . . . . . . . . . . . . . . . . . . . . . . . . . . . . . . 6Joint list (Hadash-Taal-Balad) . . . . . . . . . . . . . . . . . . . . . . . . . . . . . . . . . . . . . . . . . . . . . . 6New Hope. . . . . . . . . . . . . . . . . . . . . . . . . . . . . . . . . . . . . . . . . . . . . . . . . . . . . . . . . . . . . 6Meretz . . . . . . . . . . . . . . . . . . . . . . . . . . . . . . . . . . . . . . . . . . . . . . . . . . . . . . . . . . . . . . . 6Ra’am – United Arab List. . . . . . . . . . . . . . . . . . . . . . . . . . . . . . . . . . . . . . . . . . . . . . . . . . 4Total . . . . . . . . . . . . . . . . . . . . . . . . . . . . . . . . . . . . . . . . . . . . . . . . . . . . . . . . . . . . . . . . 120
The Judicial System
The Israeli judicial system, which functions independently from the executive and legislative branches, iscomprised of civil courts and tribunals, as well as religious and military tribunals.
D-21

The civil courts, which have jurisdiction over civil, administrative and criminal matters, are administeredby the Directorate of Courts, a separate unit operating within the Ministry of Justice. The civil courts consistof Magistrates’ Courts, District Courts, Labor Courts, and the Supreme Court. Religious tribunals, whichoperate under the auspices of the Ministry of Religious Services, have jurisdiction over certain personal statusmatters. In addition, there are military tribunals that operate under the auspices of the Ministry of Defenseand are authorized to try soldiers for military and civil offenses.
Within the civil court system, the Magistrates’ Courts are courts of first instance. They have jurisdictionover criminal matters generally relating to offenses carrying a potential sentence of less than seven yearsimprisonment, as well as civil matters for claims of less than NIS 2.5 million or claims involving the use andpossession of real estate. The Magistrates’ Courts also sit as specialized courts based upon subject matter:Municipal Courts, Family Courts, Small Claims Courts, Traffic Courts, Rent Courts and Juvenile Courts.There are 32 Magistrates’ Courts.
Labor and social security issues are under the jurisdiction of the Labor Courts, composed of RegionalCourts and the National Labor Court, which serve as both an appellate court and a court of first instance incertain matters.
The six District Courts, located in Jerusalem, Tel Aviv, Haifa, Beer Sheba, Nazareth and Central Region(Lod), are courts of first instance in matters that do not fall within the jurisdiction of Magistrates’ Courts.District Courts also have jurisdiction in cases concerning corporations and partnerships, administrativematters (e.g., appeals on tax matters, government tenders, planning and building issues and other petitionsagainst decisions of government bodies and authorities) and intellectual property matters, as well as appealsof Magistrates’ Court decisions. The Jerusalem District Court has exclusive jurisdiction with respect to certainmatters, such as election appeals and extradition and antitrust issues. The Haifa District Court also functionsas the Maritime Tribunal and has exclusive jurisdiction over maritime matters. In addition, the Tel Aviv DistrictCourt and the Haifa District Court operate a “Financial Department,” which has exclusive jurisdiction overcertain financial matters such as derivative actions and class actions in connection with securities.
The Supreme Court, which is composed of fifteen justices, sits as an appellate court in review of trialcourt judgments and District Court appellate decisions. In addition, the Supreme Court sits as the High Courtof Justice, a court of first instance in administrative and constitutional cases whose judgments cannot beappealed. The Supreme Court also holds further hearings on its own decisions and has the unique power toorder a retrial in criminal matters. Under certain circumstances, the High Court of Justice is also authorized toreview the decisions of the National Labor Court and the religious tribunals. Supreme Court rulings areconsidered binding upon all lower courts in Israel.
Justices in Israel are selected by the Judicial Selection Committee, which is chaired by the Minister ofJustice and comprised of three Supreme Court Justices (including the President of the Supreme Court), twoCabinet ministers (including the Minister of Justice), two members of the Knesset and two members of theIsrael Bar Association. Justices are appointed by the President of the State, following a recommendation bythe Judicial Selection Committee. In accordance with tradition, the President of the Supreme Court is selectedbased on seniority.
National Institutions
Israel has four so-called “national institutions”: The Jewish Agency for Israel, the World ZionistOrganization, Keren Hayesod and the Jewish National Fund. These national institutions, which predate theformation of the State, perform a variety of non-governmental charitable functions. Each national institutionis independent of the Government and finances its activities through private and public sources, includingdonations from abroad. These national institutions were responsible for a net unilateral transfer into Israel of$0.21 billion in 2020, compared to $0.39 billion in 2019.
International Relations
Israel currently maintains diplomatic relations with 166 countries, seeking to develop relations on a fullrange of issues including trade, cultural ties and building shared values of democracy and mutual respect.During the 1990s, Israel established or reestablished commercial, trade and diplomatic relations with all of therepublics of the former Soviet Union and Eastern Europe. Israel has seen significant growth of commercial,
D-22

trade and diplomatic relations with key Asian countries, especially Japan, South Korea, China and India.Over the past three decades, Israel has encouraged efforts to increase relations with the region’s Arab countries.As first expressed in Israel’s Declaration of Independence in 1948, Israel offers, “peace and unity to allneighboring states and their peoples, and invites them to cooperate with the independent Jewish nation for thecommon good of all.” Even with new and complex challenges in the Middle East, Israel remains committed topeaceful resolutions and to economic opportunities for regional development (see “Abraham Accords,”below).
Israel and the United States. Israel maintains a close economic, diplomatic and military relationshipwith the United States.
Israel receives military assistance from the United States and has received economic assistance from theUnited States averaging approximately $3 billion per year since 1987, including by way of loan guarantees.Israel and the United States agreed to reduce U.S. foreign assistance to Israel by way of a phase-out of U.S.Economic Support Fund assistance to Israel. The United States increased annually the level of its ForeignMilitary Financing assistance to Israel. In 2016, the United States and Israel reached an agreement on apackage of at least $38 billion in U.S. military aid over the course of 10 years ($3.8 billion per year). This aidis used for foreign military financing and ballistic missile defense cooperation.
Israel and the United States share a commitment to seeking peace and economic development in theMiddle East and developing a security framework that makes such progress possible. Cooperation on keydefense projects such as the Iron Dome and Arrow missile defense programs has been a great success,highlighting the depth of cooperation between the two countries. In 2017, the President of the United Statesformally recognized Jerusalem as the capital of the State of Israel and announced plans to relocate the U.S.embassy from Tel Aviv to Jerusalem. In 2018, the U.S. officially inaugurated its new embassy in Jerusalem. In2019, the President of the United States recognized Israeli sovereignty over the Golan Heights.
For the past several years, the prospect of Iran acquiring nuclear armament capability has been a centralgeopolitical concern both domestically and internationally. The JCPOA between the P5+1 group and Iranreached in July 2015 conditioned international economic sanctions relief, mainly United States and EUsanctions, on Iranian nuclear capabilities reduction and supervision by the International Atomic EnergyAgency. Despite the economic sanctions relief, it should be noted though that the primary United Statessanctions and other types of sanctions for non-nuclear activities, such as missiles and terror, were not includedin the JCPOA and remained in place. Taking the position that the JCPOA would not prevent Iran fromdeveloping nuclear weapons, in May 2018, the United States announced its withdrawal from the JCPOA,reinstated economic sanctions, and imposed additional economic penalties. EU countries remain committedto the JCPOA, but the effect of the United States’ withdrawal from the JCPOA on Iran and the region is notyet clear.
Israel and the Middle East. Since 2011, there has been political instability and civil unrest in numerousMiddle Eastern and North African countries, including Libya, Egypt, Tunisia, Yemen and Syria. This unresthas resulted in the removal of long-standing leadership in several of the aforementioned countries and createdturbulent political situations in others. As Israel is situated in this region, it closely monitors these events,aiming to protect its economic, political and security interests. The delicate relations between Israel and itsneighbors could become even more fragile with the domestic turmoil and change in regimes. Instability in theMiddle East and North Africa region have so far not materially affected Israel’s financial or political situation,and countries that have signed peace agreements with Israel have remained committed to them, regardless ofinternal political developments.
Nevertheless, there can be no assurance that such instability in the region will not escalate in the future orwill not spread to additional countries in the region. Military efforts have significantly decreased the presenceof ISIS (Islamist State in Iraq and Syria) in Syria and Iraq, but there is growing concern regarding Shiitemilitias taking control over the relinquished territory and the creation of a land corridor from Tehran to theMediterranean under Iranian influence.
Israel monitors the situation in Syria very closely. The direct threat that the Syrian military poses to Israelhas diminished. Nevertheless, Israel remains vigilant about security of its border with Syria, possible transfersof strategic weapons (including chemical and biological weapons), and the possible spillover of radical forcesalong the border with Israel. Israel monitors terror infrastructure in Syria and increased Iranian and radicalpresence in the area. Israel views the entrenchment of Iranian forces in Syria as a growing threat to the region.
D-23

After years of hostility and wars between Egypt and Israel, intensive negotiations were held by the twocountries with the close assistance of the United States. Following these negotiations, Anwar Sadat, thePresident of Egypt, responded positively to the invitation of Prime Minister Menachem Begin, and visitedIsrael in 1977. On March 26, 1979, Egypt and Israel signed a peace treaty. This was the first peace agreementsigned between Israel and one of its neighboring countries and since then, peace with Egypt has beenimportant to Israel’s national security. Following the ousting of Egyptian President Hosni Mubarak in 2011,the relationship between Egypt and Israel has been strained, but the 2014 election of President Al-Sisi wasaccompanied by reassuring statements regarding common interests. Israel does not perceive a material changein the strategic stance of Egypt, and the peace treaty between the two states remains in force.
Israel and Jordan signed a peace treaty in 1994. After resolving issues relating to borders and water, Israeland Jordan entered into negotiations to promote economic cooperation between the two countries and tocoordinate regional economic development initiatives. The peace treaty with Jordan and subsequent progressin Israel’s negotiations with the Palestinians enabled Israel to initiate economic and political relations withother foreign countries bordering the region, as well as in North Africa and the Gulf region.
Relations between Israel and the Arabian Gulf States have been developing based on shared concernsover Iran’s threat to stability in the region and other shared interests. These countries are seeking furthercooperation with Israel in fields such as technology, infrastructure, healthcare and agriculture, as there hasbeen a growing recognition of Israel’s capabilities in these areas.
Abraham Accords. In August 2020, an agreement for the normalization of relations between Israel andthe United Arab Emirates (UAE) was reached and in September 2020 the Abraham Accords Peace Agreementwas signed at the White House, officially establishing diplomatic relations. The Peace Agreement with theUAE was shortly followed by an agreement for the normalization of ties with the Kingdom of Bahrain, whichwas signed in a Joint Communique between Israel and Bahrain in Manama in November 2020. InDecember 2020, Israel and Morocco established full diplomatic relations. Most recently, in January 2021,Sudan signed the Abraham Accords Declaration during the visit of US Treasury Secretary Steven Mnuchin toKhartoum.
The Abraham Accords have led to the opening of official diplomatic representations of the UAE, Bahrainand Morocco in Israel, and Israeli representations in the UAE, Bahrain and Morocco. There have been manyvisits of official delegations between the countries, resulting in numerous bilateral agreements. As of the endof the first quarter of 2021, trade between Israel and the UAE, Bahrain and Morocco is estimated to be valuedmore than US$1 billion, direct flights have been established and partnerships and cooperation have started inthe fields of finance, tourism, culture and economics.
Israel and Its Borders. In 2000, Israeli military forces unilaterally withdrew from south Lebanon. Thisfull withdrawal was confirmed by the United Nations. During July and August 2006, Israel became embroiledin a war with Hezbollah, a terror organization supported by Iran and based in Lebanon. The conflict, whichwas termed the ‘Second Lebanon War’, began when militants from Hezbollah fired rockets at northern Israeliborder towns and conducted a deadly ambush on Israeli soldiers — capturing two of them. Israel respondedwith airstrikes and artillery fire on Hezbollah targets in Lebanon. Hezbollah then launched more rockets intonorthern Israel and engaged Israel Defense Forces in guerrilla warfare. In accordance with UN SecurityCouncil Resolution 1701, a United Nations-brokered ceasefire went into effect on August 14, 2006, calling onthe Lebanese government to take full control of Lebanon and prohibiting the presence of paramilitary forces,including Hezbollah, south of the Litani River.
Since that conflict, Israel’s border with Lebanon has remained mostly quiet and peaceful, but Hezbollah’smilitary buildup with more sophisticated weapons that have greater accuracy and longer ranges is one ofIsrael’s main concerns. Iran, Hezbollah’s main sponsor, has increased its support to Hezbollah since signingthe JCPOA, specifically by supplying weapons and parts, know-how, money and training.
Israel closely monitors security on its northern and southern borders, due to the presence of radicalforces. Since 2015, Israel has observed a greater presence of Hezbollah forces in Syria in support of SyrianPresident Assad. Israel views the entrenchment of Iranian forces in Syria as a growing threat to the region. InFebruary 2018, Iranian Revolutionary Guard forces attempted an attack with a cross-border drone fromSyria, which was intercepted by Israeli forces. Due to the threat, Israel has stated that it will not allow thefurther entrenchment of Iranian forces in Syria.
D-24

The Israeli-Palestinian Conflict. The signing of the Oslo Accords in 1993 between Israel and thePalestine Liberation Organization (“PLO”) and the commitments undertaken for mutual recognition wasbelieved to be a turning point in the relations. This led to the introduction of a number of interim agreementsthat set the grounds for the establishment of the Palestinian Authority. As part of the 1994 Gaza Strip andJericho Agreement signed in Cairo and the 1995 Interim Agreement on the West Bank and Gaza signed inWashington, DC, several rounds of negotiations were held between Israel and the PLO in 2000. This includeda summit at Camp David in July 2000, aimed at achieving a permanent agreement and an end to the conflict.
In September 2000, relations between Israel and the Palestinian Authority deteriorated due to violenceperpetrated by Palestinian terror organizations against Israeli targets and citizens, in violation of the bilateralagreements signed in 1993. Over the past decade, Israel has called to resume unconditional peace talks withthe Palestinian Authority, while the Palestinian Authority, under the leadership of Mahmud Abbas(Abu Mazen), has raised preconditions to resume such talks.
In 2004 and 2005, despite unsuccessful dialogue and increased violence, the Government unilaterallyimplemented the Gaza disengagement plan, fully withdrawing Israeli civilian and military presence from Gaza.The disengagement plan ended Israel’s 38 years of military presence and authority over the Gaza territory.The ascent of the Hamas terrorist organization and its violent takeover of Gaza in June 2007 increasedinstability in the region.
Hamas has had control over Gaza since 2007. Palestinian terrorist organizations began launching locally-manufactured and smuggled rockets and mortar rounds from Gaza into Israel, as well as attempting toinfiltrate by sea. In 2007 and 2008, over 2,300 and 3,000 rockets, respectively, were launched on civilian targetsin southern Israel. As the range of these missiles continued to increase, by the end of 2008 over one millionIsraelis in the Gaza envelope found themselves within range of terrorist rocket fire and mortar attacks. Due tothe threat of rockets and terror tunnels, Israel has engaged in several military operations (Operation CastLead — 2008, Operation Pillar of Defense — 2012, and Operation Protective Edge — 2014) with the goal ofsuppressing the rocket-fire. The threats posed by tunnels and rocket launches have decreased in recent yearsdue to the efforts and successes in the intelligence field, the use of missile defense systems, and newtechnological capabilities in the field of location of underground tunnels.
In February 2020 United States President Trump introduced his plan for a comprehensive peaceagreement between Israel and the Palestinians, which Israel views as a significant opportunity. Prime MinisterNetanyahu declared that the plan will be reviewed, in full coordination with the United States and maintainingall of Israel’s peace agreements and strategic interests.
On May 10, 2021, Hamas and other terrorist organizations initiated an indiscriminate attack on civilianpopulations in Israel, firing rockets at Jerusalem, Ashkelon and Israeli communities along the border withGaza. This attack started an 11-day conflict, Operation Guardian of the Walls. During the operation, theHamas terror organization launched thousands of rockets into Israel, targeting dense civilian populations incities, towns and villages. The Israeli Iron Dome Aerial Defense System intercepted hundreds of these rockets.In response to the continuous rocket fire from the Gaza Strip into Israeli territory, the IDF struck terrortargets belonging to Hamas in the Gaza Strip, including Hamas headquarters, underground tunnels, rocketlaunchers, military posts and other infrastructure. A ceasefire was reached on May 21, 2021.
Other diplomatic relations. In recent years, Israel has further developed its diplomatic relations inEurope, Asia, Africa and Latin America, establishing cooperation in a wide range of fields.
Israel and the EU have a very close and deep-rooted relationship. In the 1950’s, Israel was one of the firstcountries to establish relationships with the European Union. In 1976, the EU and Israel signed their firsttrade agreement and the EU remains Israel’s largest trading partner. Since June 2013, the Open SkiesAgreement has led to an increase in passenger traffic from 7.6 million to 11.9 million, making the EU apopular destination for Israelis to visit. The EU has supported and helped Israel’s research and innovationsector over the past 20 years. As part of the Horizon 2020 program, the EU funded over 1,245 projects inIsrael totaling €713 million. Israel has also developed new regional alliances with European Countries such asthe trilateral agreement with Greece and Cyprus, the Visegrad (Hungary, Czech Republic, Slovakia andPoland), as well as relations with the Baltics and Balkans. This new form of cooperation termed “geometricdiplomacy” has led to an unprecedented amount of summit gatherings of the regional leaders with Israel.
D-25

In February 2021, Israeli Minister of Foreign Affairs Gabi Ashkenazi and Kosovo Minister of ForeignAffairs Meliza Haradinaj, signed an agreement establishing diplomatic relations between Israel and Kosovo.The two foreign ministers also signed memoranda of understanding for policy consultations and an agreementfor cooperation with MASHAV-Israel’s Agency for International Development Cooperation.
In addition, Israel increased its diplomatic activity in Latin America, with the then Prime Minister visitingArgentina, Colombia, and Mexico. These were historic visits as Netanyahu was the first Prime Minister ofIsrael to visit this region. Relations between Israel and Brazil have also developed, with recent visits by thePrime Minister of Israel to Brazil and the Brazilian President to Israel and an announcement by BrazilianPresident to open a business center in Jerusalem.
In recent years, Israel has significantly increased its activity in Africa, and new Israeli aid projects weredeveloped with several African countries. In early 2019, Israel opened an embassy in Rwanda, its 11th Africanembassy, in and renewed its diplomatic relations with Chad. These events mark the strengthening ties betweenIsrael and the continent. The President of Israel visited Ethiopia in May 2018, and the Prime Minister madeofficial visits to several African countries, including Kenya and Liberia.
Israel has also increased its diplomatic activity in Asia. In 2014, the Government convened high levelintegrated committees, led by the Prime Minister’s office, to support advancing relations with China and Indiaand since then has increased its diplomatic presence in both these countries. In 2018, relations between Israeland India deepened and agreements were signed between the two countries covering activity in variousindustries, including cybersecurity, oil and gas and medicine. In 2018, eight cooperation agreements betweenIsrael and China were signed in science and technology, life sciences, innovation, digital health, and agriculture.In December 2020, Bhutan and Israel established full diplomatic relations.
Membership in International Organizations and International Economic Agreements
Israel is a member of a number of international organizations, including the United Nations, the WorldBank Group (including the International Finance Corporation), the International Monetary Fund (“IMF”),the European Bank for Reconstruction and Development and the Inter-American Development Bank. SinceSeptember 2010, Israel has been a full member of the OECD.
Israel has been a signatory to the General Agreement on Tariffs and Trade of 1947 since 1962, and it is afounding member of the World Trade Organization. In addition, Israel is a member of initiatives conductedunder the framework of the World Trade Organization, namely the Government Procurement Agreement andthe Information Technology Agreement.
Israel has an extensive network of free trade agreements with most of its major trading partners; amongthese are the United States, EU, EFTA, Turkey, Canada, Mexico, MERCOSUR (Brazil, Argentina, Uruguayand Paraguay), Panama and Colombia. A free trade agreement with the Ukraine entered into force in thebeginning of 2021, as well as a trade and partnership agreement between Israel and the United Kingdom,which took effect upon the withdrawal of the UK from the EU. Negotiations for a free trade agreement withKorea have concluded and the agreement is in the process of ratification. Approximately 64% of Israel’sexports of Goods in 2020 was conducted under its bilateral free trade agreements which provide duty-freeaccess and other preferential treatment schemes. Israel is currently conducting free trade agreementnegotiations with China, India, Vietnam, the Euro Asian Customs Union (Russia, Armenia, Belarus,Kazakhstan and Kyrgyzstan) and Guatemala.
In 1975, Israel signed a free trade agreement with the European Economic Community that provided forthe gradual reduction and ultimate elimination of tariffs on manufactured goods and certain agriculturalproducts. In July 1995, Israel signed an Association Agreement with the EU, which came into effect inJune 2000, which addresses issues relating to competition, government procurement, and cooperation in manyareas, including research and development (“R&D”). It also expands the liberalization in agricultural products.Two additional agreements providing for further liberalization in agricultural trade were implemented, themost recent of which became effective as of January 1, 2010.
In 1985, Israel and the United States entered into a free trade agreement that resulted in the eliminationof tariffs on all industrial products, taking effect at the beginning of 1995. The free trade agreement with theUnited States also resulted in the elimination of certain non-tariff barriers to trade between the two countries.
D-26

In addition to these agreements, Israel entered into three mutual recognition agreements in the area ofstandardization. Two of them, with the United States and Canada, cover telecommunication equipment; thethird, with the EU, covers goods manufacturing processes in the area of pharmaceuticals.
Israel, with the assistance of the United States, developed regional trade agreements to facilitate economiccooperation between Israel and its neighbors in the Middle East. Israel signed a Qualified Industrial Zones(“QIZ”) agreement with Jordan in 1997 and a separate QIZ agreement with Egypt in 2004. These QIZagreements allow Egypt and Jordan to export products to the United States, free of export duties if theproducts contain inputs from Israel (8% input from Israel in the Israeli-Jordanian QIZ agreement, 10.5%input from Israel in the Israeli-Egyptian QIZ agreement). This trade initiative aims to support prosperity andstability in the Middle East by encouraging regional economic integration. However, the QIZ agreement withJordan has not been active since Jordan signed a free trade agreement with the United States in 2010, whichallows Jordanian-originated products to enter the United States duty-free.
Since 1996, Israel has been an associated member in the EU Framework Programs for Research andInnovation (the “EU Framework Program”), which allows Israeli firms, academic institutions and otherorganizations to participate in EU-based R&D projects. Israel was the first country outside of Europe toenjoy this special status, a status granted to Israel largely in recognition of its key role in technology andinnovation in the global arena. The EU Framework Program is the biggest R&D platform in the worldinvolving industrial and academic research and innovation.
In 2014 Israel signed an agreement to join Horizon 2020, the eighth European Framework Program forResearch and Innovation (2014 – 2020). Horizon 2020 provided Israel access to €77 billion in total programfunding. Horizon 2020 provides funding in a variety of areas including information and communicationtechnologies, health, biotechnology, nanotechnology, materials and production processes, energy, climate,environment, raw materials, food security and bioeconomy, space, transport, future and emerging technologies,research infrastructures, innovation in small and medium sized enterprises, secure societies, researcher’smobility, social sciences and humanities, and the European Research Council for groundbreaking academicresearch. Horizon 2020 promotes pioneering research and enables Israeli entities to cooperate on technologicaldevelopment with European industries, research institutions and universities, in addition to showcasing Israelitechnological abilities. Through Horizon 2020, small and medium-sized enterprises that are based in the EUor established in a country associated with Horizon 2020 can obtain funding and support for innovations thataid growth and expansion into countries in Europe and elsewhere.
Israel is currently in negotiations to join Horizon Europe, the ninth Framework Program for Researchand Innovation (2021 – 2027) with a total budget of €95.5 billion. Since joining the EU Framework Program,more than 22,700 Israeli researchers have participated in 4,460 projects, totaling €2.83 billion in funding.
Israel is an active participant in the EUREKA Network, Europe’s leading platform for R&Dentrepreneurs and industries. EUREKA is an inter-governmental public network that supports R&D-basedbusinesses and institutions through funding and partner-matching services. On an annual basis, EUREKAsupports more than 300 collaborative projects in a variety of industries, totaling over €1.2 billion. Projects canbe launched in a variety of industry fields and technological areas. In July 2010, Israel became the chair of theEUREKA Network for one year. The Israeli EUREKA chairmanship leveraged local technological bestpractices to focus on promoting a culture of innovation and to develop new sources of funding for start-upcompanies, small and medium sized enterprises and research institutions domestically and globally. Israel isamong EUREKA’s most active participants; of EUREKA’s member and associated countries, Israelicompanies have partnered in more than 10% of all EUREKA’s projects.
In 2019, Israeli companies submitted 70 proposals for R&D cooperation projects as part of the bilateralprograms of the European Division of the Israel Innovation Authority; the countries with the mostsubmissions were Greece, UK and Italy.
Over the years, Israel has signed many bilateral agreements for collaboration on research, developmentand innovation with foreign federal and local governments, as well as with other foreign entities. In addition,Israel has five bi-national R&D foundations with the United States, Canada, India, Singapore and SouthKorea.
D-27

THE ECONOMY
Overview
Israel has an industrialized and diversified economy. From 2016 to 2019, the average annual growth ofthe GDP was 3.6% and in 2020 the GDP per capita amounted to $43,786. Since 2016, the national accountswere characterized, in general, by overall growth in all components of the GDP, including privateconsumption, investments and trade.
The anticipated long-term growth potential of around 3% in 2020 did not materialize as the outbreak ofCOVID-19 pandemic resulted in a negative GDP growth rate of 2.6% in 2020. The overall contraction of thedomestic economy in 2020 was reflected in the labor market, as the unemployment rate grew significantly,while the participation rate remained stable and at a high level relative to historical and international rates.
Israel’s high employment rate and average wages have increased significantly in recent years prior to theCOVID-19 pandemic. The increase in real wages and the high participation rate have led to increasedhousehold income. The increase in real wages reflects both the rise in nominal wages and low inflation rates.The increase in the participation rate is attributable to overall economic growth and the successfulimplementation of the Government’s policies to cut transfer payments and lower taxation on labor.
Income inequality and poverty have fallen in recent years as a result of the strong labor market and rapidemployment growth. The standard of living in Israel is steadily increasing, as seen in the growth of GDP percapita. However, GDP per capita in Israel based on purchasing power parity remained relatively low. In orderto support continuing increases in the standard of living, those groups with low participation rates need to beintegrated into the labor force.
The high-tech sector in Israel includes the industrial sectors such as the electronics, pharmaceuticals andaircraft sectors as well as software and R&D. Employment in the high-tech industry increased rapidly, and thesector’s share of GDP has grown and contributed to the economy’s development in the past few decades.These developments have also benefited exports, half of which are high-tech goods and services.
Since 2010 there has been changes to the composition of Israel’s exports: the exports of services havegrown while exports of goods have declined. In 2020 exports of business services, notably high-tech productsgrew by 10.8% however the sharp decline in tourism brought the total growth of services to -4.6% whileexports of goods grew by 4.4%. In total, exports grew by 0.1% in 2020.
In recent years natural gas has contributed to the energy independence of the Israeli economy. From 2006to 2019 Israel experienced a major shift in fuel components used for electricity generation. In 2006, electricityproduction was comprised of 18% natural gas and 71% coal. In 2020, electricity production was comprised of67% natural gas, 26% coal and 6% renewable energy.
In the last two decades, a central goal of the Government’s economic policy has been to reduce theGovernment’s role in the economy and to promote private sector growth. In order to advance this goal, theGovernment has pursued a policy of privatizing State-owned enterprises, including banks, the electricity sectorand the ports. The Government has also pursued stability-oriented monetary and fiscal policies. Fiscaldiscipline has kept Israel’s debt-to-GDP ratio on a declining trend since 2009, increasing slightly to 60.9% in2018 before decreasing to 60% in 2019. Public debt as a percentage of GDP increased to 72.4% in 2020 asgovernment expenditure rose as a result of COVID-19 and the measures taken to mitigate its impact.
The Government is committed to price stability within an inflation target of between 1% and 3%. In thelast ten years, prices have risen by an average of 1.3% annually. Over the last five years, the average rate ofinflation has declined gradually and was −0.5% in 2016, 0.2% in 2017, 0.8% in 2018, 0.8% in 2019 and thendropped to −0.6% in 2020.
Gross Domestic Product
GDP is defined as gross national product minus income of Israeli residents from investments abroad,earnings of Israeli residents who work abroad, and other income from work and leases abroad, lesscorresponding payments made abroad (after deduction of payments to foreign companies with respect to
D-28

production facilities located in Israel). In 2016, 2017, 2018 and 2019 GDP grew by 3.8%, 3.6%, 3.5% and 3.4%,respectively, reflecting lower unemployment rates.
In 2020, GDP contracted by 2.6%, largely as a result of decreases in private consumption and investments.GDP growth was volatile during 2020. In the first quarter GDP growth rate contracted by 7.1% at an annualrate while during the second quarter, growth rate contracted by 30.7%. The low growth rates in the first half of2020 were due to the COVID-19 outbreak in the first quarter while the unprecedented negative growth of thesecond quarter reflected the negative economic impact of the first lockdown implemented in response toCOVID-19. The second half of 2020 reflected a speedy recovery with growth rates of 42.4% and 6.3% for thethird and fourth quarters, respectively. The high grow rates in the second half of 2020 reflect the rapid recoverysince the first lockdown was lifted.
In 2020, GDP amounted to NIS 1,387 billion and business sector product amounted to NIS 1,010 billion(in each case, at current prices). Business sector product is calculated as GDP minus certain general governmentservices (government operations executed through private companies are included in the business sectorproduct), services of private non-profit institutions and housing services (representing the imputed value ofthe use of owner-occupied residential property). The Central Bureau of Statistics, according to internationaland national accounts practices, applies this methodology. In 2020, government output and product of servicesof private non-profit institutions amounted to NIS 206.7 billion, and housing services amounted to NIS169.1 billion. These figures represent real growth of 2.8% for housing services in 2020, a slight decrease fromthe rates in 2018 and 2019.
Table No. 4
Main Economic Indicators(In Billions of NIS Unless Noted Otherwise)
2016 2017 2018 2019 2020
Growth (percent change)Real GDP growth . . . . . . . . . . . . . . . . . . . . . . . . . . . . . . . . . . 3.8% 3.6% 3.5% 3.4% -2.6%GDP growth per capita . . . . . . . . . . . . . . . . . . . . . . . . . . . . . . 1.8% 1.6% 1.5% 1.5% -4.4%Inflation (change in CPI – annual average) . . . . . . . . . . . . . . . . . -0.5% 0.2% 0.8% 0.8% -0.6%Industrial production . . . . . . . . . . . . . . . . . . . . . . . . . . . . . . . 1.7% 3.7% 3.5% 2.9% 6.3%Constant 2015 pricesGDP . . . . . . . . . . . . . . . . . . . . . . . . . . . . . . . . . . . . . . . . . . . 1,211 1,255 1,298 1,343 1,308Business sector output . . . . . . . . . . . . . . . . . . . . . . . . . . . . . . . 901 935 969 1,008 974Current PricesGDP . . . . . . . . . . . . . . . . . . . . . . . . . . . . . . . . . . . . . . . . . . . 1,224 1,269 1,330 1,407 1,387Business sector product . . . . . . . . . . . . . . . . . . . . . . . . . . . . . . 907 936 980 1,040 1,010Permanent average population (thousands of people) . . . . . . . . . . . 8,546 8,713 8,883 9,054 9,217
Source: Central Bureau of Statistics.
D-29

Table No. 5
Resources and Use of Resources(In Billions of NIS at Constant 2015 Prices)
2016 2017 2018 2019 2020
ResourcesGDP . . . . . . . . . . . . . . . . . . . . . . . . . . . . . . . . . . . . . . . . . . . 1,211 1,255 1,298 1,343 1,308Imports of goods and services . . . . . . . . . . . . . . . . . . . . . . . . . 363 381 405 422 388
Total . . . . . . . . . . . . . . . . . . . . . . . . . . . . . . . . . . . . . . . . . 1,575 1,635 1,703 1,765 1,696Use of resourcesPrivate consumption . . . . . . . . . . . . . . . . . . . . . . . . . . . . . . . . 675 698 723 750 679Public consumption . . . . . . . . . . . . . . . . . . . . . . . . . . . . . . . . . 272 282 293 301 309Gross domestic capital formation . . . . . . . . . . . . . . . . . . . . . . . 257 272 279 289 285Exports of goods and services . . . . . . . . . . . . . . . . . . . . . . . . . 371 384 408 425 425
Total . . . . . . . . . . . . . . . . . . . . . . . . . . . . . . . . . . . . . . . . . 1,575 1,635 1,703 1,765 1,696
Source: Central Bureau of Statistics
Table No. 6
Gross Domestic Product Percentage Change by Industry
2016 2017 2018 2019 2020
Percent ofTotal BusinessSector, 2020
Agriculture, forestry and fishing . . . . . . . . . . . . . . . . . . . 5.2% 1.9% -3.7% 1.9% -2.0% 1.7%Manufacturing; mining and quarrying . . . . . . . . . . . . . . -4.4% 5.1% 2.6% 2.5% 1.7% 17.2%Construction . . . . . . . . . . . . . . . . . . . . . . . . . . . . . . . . 7.2% 6.5% 5.8% 3.8% -4.3% 9.0%Electricity and water . . . . . . . . . . . . . . . . . . . . . . . . . . . 7.0% -1.5% 5.2% 1.8% -2.9% 2.4%Wholesale & retail trade & repair of motor vehicles;
accommodation & food service activities . . . . . . . . . . . 3.9% 5.1% 2.8% 2.8% -3.9% 16.6%Transportation, storage, postal and courier activities . . . . . 4.2% 6.3% 4.7% 1.1% -20% 4.4%Information and communications . . . . . . . . . . . . . . . . . . 7.0% 2.0% 6.2% 6.0% 6.8% 16.0%Financial & insurance; real estate; professional, scientific &
technical; professional, scientific & technical;administrative & support service . . . . . . . . . . . . . . . . . 3.9% 4.2% 3.1% 5.9% -2.1% 24.9%
Education; human health & social work activities; arts,entertainment & recreation;other services . . . . . . . . . . . 3.1% 3.1% 3.3% 2.1% -12.1% 7.9%
Total Businesses sector . . . . . . . . . . . . . . . . . . . . . . . . . 4.0% 3.8% 3.7% 4.0% -3.3% 100%Gross Domestic Product . . . . . . . . . . . . . . . . . . . . . . . . . 3.8% 3.6% 3.5% 3.4% -2.6%
Source: Central Bureau of Statistics
D-30

Savings and Investments
Gross domestic capital formation, which is the sum of investments in fixed assets and the change ininventories, decreased by 1.3% in 2020, following increases of 3.5%, 2.5%, 6% and 10.4% in 2019, 2018, 2017and 2016, respectively.
Israel’s saving rate is higher than the OECD average. According to the OECD, “Saving” is the differencebetween disposable income plus the change in net equity of households in pension funds and finalconsumption expenditure. Saving therefore reflects the residual income used to acquire financial andnon-financial assets. Net saving is equal to saving less depreciation, and the “saving rate” is measuredas percentage of GDP. The saving rate in Israel stood at 11.6% in 2019, compared to 7.7% in the EU, 6.5% inthe Euro area and 2.6% in the United States.
Business Sector Output
Business sector output in Israel equals GDP minus general government services, services of private non-profit institutions and housing services (representing the imputed value of the use of owner-occupiedresidential property). Since 2003, business sector output has expanded at consistently high rates, averaging5.7% annual growth between 2004 and 2008. The global economic crisis impacted the business sector outputstarting in the second half of 2008, with total output growing in 2009 by 0.3%. In 2010 and 2011, growthrecovered to pre-crisis levels, as business sector output grew by 6.7% and 5.6%, respectively. In 2012, thebusiness sector grew at a moderate rate of 2.0% due to the slowdown in the world economy but in 2013 thebusiness sector GDP recovered and grew by 4.9%. In 2014, the business sector product’s growth decreasedcompared to the 2013 growth rate, as business sector output grew by 3.9% in 2014. This slowdown was partlydue to the negative effects of Operation Protective Edge, which took place in July and August of 2014. In2015, the business sector output grew by 2.2%, lower than the 2014 figure.
The relatively high growth rates continued from 2016 to 2019, as the business sector GDP grew by 4.2% in2016 and 3.8% in 2017. In 2018, the business sector GDP grew by 3.7%, and in 2019 by 4.0%, both slightlyabove the total GDP growth. In 2020, the business sector contracted by 3.3% lower than total GDPcontraction.
Trade and Services
The trade and services sector consists of retail and wholesale sales, professional services, banking, hotelsand other services. From 2016 to 2019, this sector expanded at a similar rate to the overall economy, withgrowth rates of 3.7% in 2016, 4.3% in 2017, 3% in 2018 and 4.2% in 2019. In 2020, the growth rate contractedby 4.8%, below the total GDP growth. In total, in 2020 the trade and services sector accounts for 49.6% of thebusiness sector.
D-31

Table No. 7
Manufacturing Index by Category(Annual Real Percentage Change)
2016 2017 2018 2019 2020
Food, beverages and tobacco . . . . . . . . . . . . . . . . . . . . . . . . . . . . . 4.1% 1.4% 1.9% 3.1% 1.9%Mining . . . . . . . . . . . . . . . . . . . . . . . . . . . . . . . . . . . . . . . . . . . . . 21.5% 22.1% 5.5% -4.0% 34.9%Textiles and clothing . . . . . . . . . . . . . . . . . . . . . . . . . . . . . . . . . . . 4.2% -1.6% 3.1% -2.9% -15.5%Shoes, Leather and leather products . . . . . . . . . . . . . . . . . . . . . . . . 0.9% -0.1% -3.2% -8.3% -26.8%Wood and wood products . . . . . . . . . . . . . . . . . . . . . . . . . . . . . . . . 8.6% 2.7% -4.2% -0.2% -2.7%Paper and paper products . . . . . . . . . . . . . . . . . . . . . . . . . . . . . . . . 18.0% 0.8% -1.8% 0.8% -3.4%Printing and reproduction . . . . . . . . . . . . . . . . . . . . . . . . . . . . . . . -0.9% 2.2% 5.3% -1.3% -20.4%Chemical products and refined petroleum . . . . . . . . . . . . . . . . . . . . -6.9% -5.9% -7.5% -4.0% -3.3%Rubber and plastic products . . . . . . . . . . . . . . . . . . . . . . . . . . . . . . 8.4% 0.6% -1.2% -1.7% 1.3%Non-metallic mineral products . . . . . . . . . . . . . . . . . . . . . . . . . . . . 3.5% 4.5% -2.7% -3.1% 0.6%Basic metal . . . . . . . . . . . . . . . . . . . . . . . . . . . . . . . . . . . . . . . . . . -1.2% 4.0% 5.3% 1.6% 3.0%Metal products . . . . . . . . . . . . . . . . . . . . . . . . . . . . . . . . . . . . . . . 1.9% 2.8% -2.0% 1.2% -7.9%Machinery and equipment . . . . . . . . . . . . . . . . . . . . . . . . . . . . . . . -1.4% 5.7% 1.7% -0.3% -0.2%Electric motors . . . . . . . . . . . . . . . . . . . . . . . . . . . . . . . . . . . . . . . 7.8% -5.6% -14.4% -4.9% -4.2%Electronic equipment and components . . . . . . . . . . . . . . . . . . . . . . . -3.7% 5.9% 11.6% 15.5% 15.9%Communication equipment . . . . . . . . . . . . . . . . . . . . . . . . . . . . . . -4.8% 4.3% 9.2% 2.4% -9.6%Transport equipment . . . . . . . . . . . . . . . . . . . . . . . . . . . . . . . . . . . 6.5% 6.3% 3.2% 3.5% -3.1%Other . . . . . . . . . . . . . . . . . . . . . . . . . . . . . . . . . . . . . . . . . . . . . . 11.5% 2.9% 4.8% 0.3% -0.6%Total (excluding diamonds) . . . . . . . . . . . . . . . . . . . . . . . . . . . . . . . 1.6% 3.7% 3.5% 2.9% 6.1%
Source: Bank of Israel
Table No. 8
Industrial Production Index(Base Year: 2011 = 100)
2016 2017 2018 2019 2020
Index Level(1) . . . . . . . . . . . . . . . . . . . . . . . . . . . . . . . . . . . . . . . . 110 114 117.9 121.4 129Annual Real Percentage Change . . . . . . . . . . . . . . . . . . . . . . . . . . . 1.7% 3.7% 3.5% 2.9% 6.3%
(1) Excludes diamonds.Source: Central Bureau of Statistics.
Transportation
Since 1993, the Government has identified infrastructure improvement as one of its top priorities. Israelhas established a network of over 20,000 kilometers of roads, including highways that link the majorcities — Tel Aviv with Haifa, Jerusalem and Be’er-Sheva. 1,500 kilometers ofrailway runs from Nahariya onthe northern coastline to Dimona in the south (via Be’er-Sheva), linking some of Israel’s major cities with thesouthern part of the State.
As a part of a vision to increase Israel’s core infrastructure, the Government increased its investment inthe transportation sector from NIS 20 billion to NIS 30 billion over the last few years. As a result, many newroads, railways and two ports have been built.
D-32

The Government plans to continue its strategic investment in transportation projects, including newroutes for the light rails in Jerusalem, in the Tel Aviv metropolitan area and between Nazareth and Haifa.Investment will continue to expand railways across the Israeli coastal plain and the Eastern Railway in centralIsrael, and roads that provide priority access for public transportation. The total investment in these projectsis estimated to be more than NIS 75 billion.
In February 2010, the Government embarked on an ambitious program to develop the transportationinfrastructure in the northern and southern parts of the State. The program, called Netivei Israel (which is notdirectly related to the Government Company of the same name), includes the construction of a series ofrailways and highways. It is expected to play a crucial role in accelerating economic activity and decreasingtravel time between the State’s central and peripheral areas. The program is progressing as planned at anestimated total cost of NIS 27.5 billion.
The Ministry of Transportation is working to accelerate the implementation of infrastructure projectswhile taking advantage of the decline in travel and economic activity due to COVID-19 in order to completethem ahead of schedule when possible. As part of the COVID-19 economic plan, the Ministry ofTransportation is working on infrastructure projects to help improve growth in this area in the total amount ofNIS 3.3 billion by 2023.
The Government has established a series of strategic plans for public transport and road networks for thenext 20 to 30 years. The national strategic plan for public transport, announced in 2012, recommendedinvesting NIS 250 billion in the urban mass transit systems and the National Rail in accordance with specificstrategic goals.
In August 2016, the Government approved a resolution to fund public transportation projects, to becarried out by Government Companies and public-private partnerships at an estimated cost of NIS 54 billion.The expenditures include: NIS 29 billion for the green and purple lines of Tel Aviv light rail; NIS 10 billion forthe green line of Jerusalem light rail and for advance planning of the blue line; NIS 8.1 billion for Eastern railsfor the heavy rail trains; NIS 5.9 billion for the light rail to Nazareth; NIS 2.6 billion for the expansion of thepublic transit system in Haifa; and NIS 300 million for cable railway in Haifa. In addition, the resolutionincludes plans for a metro system in the Gush Dan area.
The Israel Railways 2040 strategic development plan, aims to improve public transport and in particularto improve the number of passengers using mass transit and the railways in the main corridors connecting thefour metropolitan centers, while widening the existing railways in the Ayalon corridor and other congestedareas. The implementation of the plan is estimated to cost NIS 120 billion and aims to increase speed, fleetsize and frequencies, and to improve railway accessibility.
In 2001, the Government issued a tender to establish a light rail build-operate-transfer project inJerusalem, and the first Jerusalem line began to operate in 2011. In 2010, the Government decided that theState-owned Metropolitan Mass Transit System Company would set up a light rail in metropolitan Tel Aviv,and the first Tel Aviv light rail line is expected to commence operations in 2022. Two additional rail lines areexpected to commence operations in 2026-2027.
Social distancing restrictions were imposed in response to COVID-19 to control the spread of the virus.As a result, the use of public transportation decreased significantly, which has made it possible to advance theschedule of the Israel Railways’ electrification project.
Buses are the major form of public transportation in Israel. Bus routes exist in all cities in Israel andconnect Israel’s major cities, smaller towns and rural areas. As a part of the growth in the investment in thetransportation sector, investment in public transportation has doubled in the past decade.
Israel has three major seaports: Haifa and Ashdod, on the Mediterranean coast, and Eilat, on the RedSea. During 2020, 57.5 million tons of cargo passed through Israeli ports. The Israel Ports Development andAssets Company Ltd., a Government Company, serves as the landlord of the ports’ real estate in Haifa,Ashdod and Eilat and is responsible for developing and leasing those properties. The Ashdod Port CompanyLtd., Haifa Port Company Ltd. and Eilat Port Company Ltd. are the three port-operating companies thatreceived a mandate to operate port facilities leased to them by the Government.
D-33

In 2013, the Government announced plans to build two new privately-operated terminals in Ashdod andHaifa. Following tenders valued at approximately NIS 8 billion for construction and operation of the newterminals, construction has started. In addition, the Government invested NIS 1.6 billion in adapting theroads to the Haifa port, in addition to the budget of Netivei Israel. The Southport and Bayport terminals willbe privately operated for a period of 25 years by Terminal Investment Ltd. and Shanghai International PortGroup, respectively, after which the terminals will be returned to the Israel Ports Development and AssetsCompany. Both terminals are slated to begin operation at the end of 2021.
Israel has three international airports. The Airports Authority is responsible for maintaining, developingand operating the airports and their security in accordance with the directives of the Minister ofTransportation. Israel’s main airport is Ben Gurion Airport in Lod, approximately 40 kilometers fromJerusalem and 20 kilometers from Tel Aviv. Ben Gurion Airport served approximately 24.8 million passengersin 2019, compared to approximately 22.9 million passengers in 2018, with flights to and from most majorcities throughout the world. Due to the COVID-19 virus, the number of passengers decreased significantly in2020 to 4.8 million passengers. During certain parts of 2020, international arrivals were not permitted toprevent new COVID-19 variants from entering Israel. However, as a result of the extensive vaccinationcampaigns in Israel and elsewhere, the number of flights has increased in 2021.
In January 2019, the Ilan and Assaf Ramon Airport opened in Timna. This new airport will serve as theinternational airport of southern Israel and replace the Eilat Airport and the civilian activity in the OvdaAirport. The Israeli Government endorsed developing a supplementary airport in addition to Ben GurionAirport and run by the private sector.
Communications
The telecommunications market (excluding television) comprises approximately 1.5% (NIS 20.5 billionin 2019) of Israel’s gross national income. Israel’s communications market is characterized by fundamentaltechnological and regulatory changes, large investments in advanced infrastructure, rapid development andsignificant levels of competition. The market is comprised of five infrastructure-based domestic cellularoperators, with the most recent operator entering the market in 2018, and three resale-based operators. Inaddition, there are seven international telephone service providers and four fixed domestic communicationsoperators (fixed broadband and telephone), two of which have universal service obligations. Thetelecommunications market is fully privatized and the Government does not hold a stake in anycommunications operators.
Israel has five cellular telephone network operators, which provide digital technology and modern third,fourth and, since September 2020, fifth generation services, using three shared networks in accordance withthe Ministry of Communications network sharing policy. As of December 31, 2020, there were approximately11.8 million cellular subscriptions, i.e., more than 1.26 cellular subscriptions per capita. Total revenues for thecellular market in 2019 were approximately NIS 8.4 billion. Competition in the mobile sector is strong, withcustomers enjoying low rates, while levels of usage (including the number of minutes used, mobile broadbanduse, etc.) are considered high by international standards. Smartphone use is widespread, and Israeli consumersand businesses continue to use mobile applications extensively. In 2015 there was a tender for 4G networkfrequencies and a network sharing policy, allowing for future investment along with efficiency gains. Sincethen, there has been continuing deployment of 4G cellular rollouts.
As of August 2020, the tender for 5G network frequencies ended. The frequencies were split between fiveoperators who work over three shared networks. The prices that were defined at the closing of the tender werehigher than the minimum price set by the Government, with full allocation. As part of the tender, each networkwas allocated 2*10 MHz in the 700 MHz range, 2*20 MHz in the 2600 MHz range, and 2*100 MHz in the3500 range. The state revenue expected from the tender is NIS 266 million, NIS 200 million of which has beenassigned as a grant incentivizing networks to build a new 5G network. All the winning networks fulfilled therequirements of the grant, having installed 250 new 5G cellular antennas. The collection of the tenderpayments and the distribution of the grant will take place in 2021.
The Israeli incumbent, Bezeq (Israel Telecommunications Corp. Ltd.), dominates the fixed line sector inIsrael, controlling 60% of the fixed line infrastructure, whereas Hot Telecommunication Systems Ltd. (“HOT”)controls 30% and new competitors control 10%. In 2019 the total number of internet connection based on
D-34

Bezeq decreased for the first time in at least nine years as a result of competitors’ fiber based networks rollout.Using the fixed line infrastructure, four major internet service providers and approximately five smaller internetservice providers serve more than 2.6 million users in Israel, which include more than 85% of households andbusinesses, making broadband internet available throughout the country. Fixed broadband service in Israel isused in 99% of households that have internet service, and speeds of up to 500 megabits per second are widelyavailable. The average marketed speed for household users using the Bezeq infrastructure is 74.2 Mbps, anincrease of 9.4% from the average speed last year, while 89% of the households and businesses using the HOTinfrastructure have download speeds of at least 100 Mbps, and 40% of the households and businesses usingHOTs infrastructure have downloads speeds of at least 200 Mbps. As a result, Israel is at the forefront ofhigh-speed internet access usage in the Western world. Alongside the aforementioned, “fiber to the home” ratein Israel are estimated at 10% of households (as of June 2021), significantly lower than the OECD average of29.2% (as of Q2 2020), but the accessibility to fiber based networks increased significantly from 9% at the endof 2018 to approximately 30% at the end of 2020. This increase is primarily attributable to regulatory changesconducted by the Ministry of Communications, lowering the cost of rollouts of fiber based networks. Awholesale market in fixed communications, modeled on the practices of EU member states, has increasedcompetition for the provision of fixed high-speed internet access, leading to lower retail rates and better qualityof service. At the end of 2020, competitive wholesale operators provided 36% of the internet connectionsprovided over the Bezeq network.
In 2019, Cellcom finalized the joint venture with the Israel Infrastructure Fund to obtain control in IBC,a fiber based network company, which was established by the Government in 2011 and has the exclusive rightto deploy communications network via the electricity grid. In January 2021 “HOT” purchased 23.3% of IBC’sstock. As part of the regulatory permits for the purchase agreement, IBC was assigned to deploy “fiber to thehome” to 1.7 million households, thus accelerating Israel’s fiber deployment.
In November 2019, an inter-disciplinary governmental committee, comprised of representatives of theMinistry of Communications, the Ministry of Finance and the Competition Authority, published a new planfor cross-country fiber coverage. This committee’s recommendations aim to incentivize Bezeq to launch itsfiber based services and to subsidize fiber based rollouts in the rural areas, which are not as profitable forBezeq compared to urban areas. In December 2020, following this committee’s recommendations, legislationwas amended to establish a fund for deployment of fiber network in areas where Bezeq will chose to notdeploy fibers. Following the amendment, Bezeq accelerated their deployment of the fiber network, andlaunched internet service based in fiber as of March 2021. In the coming months, Bezeq is expected toannounce the scope of their fiber retention obligation.
Fixed telephone services were opened to competition in 2004 and, since then, cable companies and otheralternative operators have gained about 38% of the market share in the telephone market. Fixed telephone useis declining as internet-based and mobile services increase. The two incumbent fixed operators, Bezeq andHOT, have universal access obligations in Israel for fixed telephone services.
On November 1, 2017, Israel’s main commercial television channel, Channel 2, was divided into twochannels, KESHET and RESHET, and in the beginning of 2019, RESHET merged with the third commerciallicense holder, Channel 10. Alongside one nationwide cable television operator, and a single direct broadcastsatellite operator, operate two television providers (but do not control the networks), holding a market shareof 25% in households. In addition, Netflix has penetrated the Israeli market, offering its customers a cheaperalternative to traditional television.
Construction and Housing Prices
In 2020 construction activity in the housing sector continued to increase due to the high demand forhousing. Housing prices have increased over the last ten years including by 3.3% in 2020. In 2020, investmentsin construction declined at a rate of 4.3%, compared to the growth rates of 3.5% in 2019, 3.1% in 2018, 6.9%in 2017 and 7.5% in 2016. In 2020, construction began on 51,605 dwellings, a decrease of 3.5% from 2019,compared to decreases of 0.2%, 2.9% and 2.5% in 2019, 2018 and 2017, respectively and an increase of 5.3%in 2016. The number of residential real estate transactions in 2020 was 17% higher than in 2019, despite asignificant increase of 47% in 2019. These increases occurred following moderate decreases since 2015.
D-35

Agriculture
In 2019, agricultural exports totaled NIS 4.9 billion, representing 1.2% of total merchandise exports. Theagricultural value of production in 2019 was NIS 30.9 billion, of which livestock accounted for 40% and cropsaccounted for 60%. In 2019, the agricultural sector’s share in employment amounted to 1.4% of the workforce. Investments in agriculture amounted to 1% of fixed investments in 2019.
The Government has implemented structural reforms to increase agricultural competition andproductivity. In 1994, the Government launched a reform to eliminate production quotas for poultry, cattleand crops. In 1998, a reform in the dairy sector was launched, aimed at enhancing competition and efficiencywhile reducing pollution levels emanating from dairy farms. The effects of this reform can be seen in thediminishing number of dairy farms and the rising number of cows per farm. The reforms in the poultry, cattle,crops and dairy sectors facilitated a sizeable shift from manufacturing, marketing and financing of agriculturalproducts through large co-operatives, which were heavily subsidized by the Government, to a system in whichdecisions regarding such matters are made by individual production units that receive fewer subsidies from theGovernment. Furthermore, in 2014 and from 2016 to 2021, to increase competition and decrease consumerprices, the Government reduced tariffs on imported cheese, meat, fish, and butter while also supporting localfarmers with direct subsidies.
Water
The scarcity of natural fresh water resources is a problem not only in Israel but also in the entire MiddleEast. Since 2000, the Government has significantly increased investments in the water and electricity sectors.Israel is committed to treaties signed with Jordan and the Palestinian Authority regarding water supply anddoes not exceed its agreed-upon quantities of allocated water. The primary natural sources of fresh water inIsrael consist of the Sea of Galilee, the Eastern mountain region aquifer (partially situated in the West Bank)and the coastline region aquifer. To increase the availability and diversity of its water sources, Israel developedlarge scale seawater desalination plants along the Mediterranean. Desalinated water produced in such plants isdistributed through the national water system to most parts of Israel, including to the arid areas in the South.
Approximately 75% of Israel’s fresh water is distributed through Mekorot Water Co. Ltd., a GovernmentCompany (see “Role of the State in the Economy,” below). The remaining 25% of Israel’s fresh water isproduced and supplied mainly by private water associations established by agricultural users and municipalentities, which are regulated by the governmental Water Authority. In 2020, Mekorot designated approximatelyNIS 1.5 billion to capital investments relating to water distribution.
Approximately 51% of Israel’s total water consumption and 28% of Israel’s fresh water consumption isused by the agricultural sector. Because most of Israel’s existing fresh water resources are already being utilized,Israel is constantly investing resources to develop additional water sources, mainly from treated wastewaterand desalinated brackish water and seawater. Desalination plants are being built by both local and foreignprivate sector companies through build-operate-transfer projects. All of the plants are operational and canprovide approximately 630 million cubic meters of desalinated seawater per year at an estimated annual cost ofNIS 1.5 billion. In accordance with Government decisions, the costs of purchasing desalinated seawater willbe covered by water tariffs. In 2019, the Government purchased approximately 600 million cubic meters ofdesalinated seawater from desalination plants in Hadera, Ashdod and Sorek and the expanded existing plantsin Ashkelon and Palmachim.
In addition, further development of agriculture involves intensifying the yield from irrigated land andreuse of treated wastewater. Israel leads the world with a water recycling rate of approximately 90%(approximately 550 million cubic meters) in recent years. To address the scarcity of water, Israeli companieshave developed a number of sophisticated irrigation systems, including micro-drip systems which maximizeirrigation efficiency. Israel has also increased its investments in technologies for the purification andimprovement of contaminated groundwater. Since 2015, the Government budgets have included provisionsfor both grants and loans to stimulate capital investment in these areas. The Government has also taken stepsto facilitate the establishment of municipal water and sewage corporations. The purpose of these steps is topromote the efficient management of municipal water and sewage systems and to direct the revenues fromthese services to investments in water and sewage infrastructure. As of end 2019, 56 regional companies werein operation, servicing approximately 7.7 million people.
D-36

Electricity
The Israeli Electricity market includes roughly 20 GW of installed capacity, of which 5 GW are coal-based, 12 GW are natural gas-based and 2.5 GW are from renewable sources, as of the end of 2020.
In 2018, the Government passed decision no. 3859 regarding the reform of the electricity market. Thedecision stipulated that IEC should sell five major units:
Alon Tavor and Ramat Hovav sites were sold to independent power producers, and Riding, Hagit East,and Eshkol are due to sold.
Currently, most of the electric power in Israel is supplied by the IEC, a Government Company thatgenerates approximately 60% of the electricity used in Israel (see “Role of the State in the Economy — IsraelElectric Corporation Ltd.,” below). In 1996, the exclusive franchise that the Government granted to IECexpired, the Electricity Sector Law was enacted and the Public Utility Authority (currently, Israeli ElectricityAuthority, or IEA) was established to supervise electric utility services and regulate the tariffs associated withsupplying electricity to consumers. The purpose of the Electricity Sector Law is to establish the tariff base,regulate the activity in the electricity sector for the public interest, ensure the reliability, availability, qualityand efficiency of services, create conditions for competition and minimize costs.
This law provided a ten-year transition period during which IEC was granted a license to generate,transmit, distribute and supply electricity. IEC currently holds licenses to produce electricity at each of its 52generation units.
Under the Electricity Sector Law, a licensed independent system operator, a transmission operator or adistributor of electricity is required to purchase electricity from private generators and to enable other licensedgenerators to use the same transmission and distribution channels to supply electricity to their customers.After the Electricity Sector Law was enacted, the Government passed several resolutions aimed atstrengthening independent power production by enabling entrepreneurs in the free market to invest in theconstruction and operation of generation units. Accordingly, independent private producers of electricitymay generate electricity and sell it directly to end-users using IEC’s transmission and distribution network. Inrecent years, the Government has expanded its policy of encouraging competition through independent privateproducers. In 2017, the Government approved five independent private producers to begin planning newprivate power plants at fifteen potential sites. The Government’s goal is a competitive market in the generationand supply segments of the electricity sector. In 2020, multiple independent private generation units andrenewables producers generated 40% of the electricity produced in Israel. 2020 also marked a turning pointwith the establishment of an independent system operator company that is currently in charge of systemplanning and is scheduled to receive the ISO responsibilities in 2021. To develop and increase competition inthe sector and improve IEC’s efficiency, the Government, IEC and the labor unions have an agreement toimplement industry reforms over eight years, including reductions in IEC employee headcount, separation ofthe system operator from the distribution network planner and allowing for competition in residentialelectricity supply segment.
As a result, it is expected that 2021 will be the first year in which more than 50% of the electricity producedin Israel will be from independent power producers.
In October 2020, the Government set new renewable energy sources targets, setting targets of 20% by2025 and 30% by 2030. These targets were set following previous targets set in 2015, in which the target for2030 was 17%. To reach this goal, approximately 13,000 additional MW of renewables (mostly photovoltaic)and 3,000 MWh of electric storage are required. Although the COVID-19 pandemic slowed the expecteddevelopment of the electricity sector, and therefore Israel fell short of its 10% renewables target for 2020, it isexpected that the targets will still be achieved. Furthermore, in 2020 the Israeli Electricity Authority led twotenders for the establishment of photovoltaic sites combined with electric storage. In those tenders, a combinedcapacity of approximately 780 MW with 4-hours storage have won feed-in tariffs, and they are expected to bebuilt and begin operations in 2023.
Energy
Demand for energy in Israel is growing significantly as a result of Israel’s high population growth,increasing GDP and high standards of living. In addition, Israel is a small country with a significant land
D-37

scarcity and the production of renewable energy in Israel is limited and based almost entirely on solar energy.Israel’s energy objectives are by 2050 to ensure reliable and clean energy and to address Israel’s constraints,such as the lack of space and reliance on solar energy as the main renewable source.
Despite these challenges, Israel has achieved its initial targets on the reduction of greenhouse gasemissions set out in the Paris Agreement and is currently revising these targets. In order to achieve a significantreduction in greenhouse gas emissions, Israel has set flexible goals that will enable the usage of the besttechnologies available. In addition, Israel is encouraging the energy sector to shift to electrification and the useof natural gas, and the transportation sector to shift to electric vehicles and cleaner fuels. Israel expects thatthese steps will lead to the reduction of greenhouse gas emissions in Israel. Israel has already reduced itspollutants by 85% and is exceeding its goals set in the Paris Agreement.
Israel is in the forefront of phasing out the use of coal. As for 2020, Israel produced 26% of its electricityby coal, as opposed to 61% in 2012. Israel has increased it renewable energy use from 2% at the end of 2015 tomore than 6% at the end of 2020, with a goal of 30% renewable energy by 2030. Israel is investing in high-endenergy technologies, and Israeli research centers, universities and startup companies are developing new andinnovative technologies that contribute to efforts to address climate change.
Israel also continues to develop its natural gas resources to facilitate the transition from coal and oil to acleaner energy. Israel’s off-shore natural gas fields provide more than 60% of Israel’s energy, and in 2020 Israelbegan to export natural gas to Egypt and Jordan. Israel has two active reservoirs: “Tamar”, which has beenproducing gas since 2013 and “Leviathan”, which has been producing gas since 2019. Two more reservoirs,“Karish” and “Tanin” were discovered in April 2012 and May 2013, respectively, and are expected to startproduction in 2022. Israel has launched three successful tender rounds and granted exploration licenses to anumber of companies. By the end of 2021 Israel intends to launch its fourth tender round.
In the transportation sector, Israel is taking a number of steps to drastically reduce dependence onpollutant fuels and encourage the transition to zero emission vehicles, such as battery electric vehicles andthose fueled by hydrogen. Israel is establishing a nationwide network of electric charging points, advancingregulations to facilitate installing charging points in residential and public buildings, promoting the use ofelectric, CNG or hydrogen powered buses and reducing taxes on imported zero emission vehicles.
Tourism
Tourism plays an important role in the Israeli economy. Israel’s tourist centers include Jerusalem, variousreligious sites throughout the country, Eilat, the Dead Sea and the Mediterranean coast. Income derived fromforeign tourism, excluding expenditures of foreign workers in Israel, has steadily increased since 2016. Foreigntourism revenues reached $4.8 billion (1.5% of GDP) in 2016, and $5.7 billion (1.6% of GDP) in 2017,$6.1 billion (1.6% of GDP) in 2018, $6.5 billion (1.6% of GDP) in 2019 and $1.5 billion in 2020 (0.4% ofGDP). The significant decline in 2020 was due to the COVID-19 pandemic.
Tourist arrivals have been on a generally upward trend, with the exception of years affected by securitysituations and the COVID-19 pandemic.
In 2016, the number of tourist arrivals was 2.90 million, an increase of 3.6% compared to the previousyear, and in 2017, the number of tourist arrivals increased by 24.6% to 3.61 million. The increases in 2016 and2017 were primarily attributable to the improvement in the security situation and a stronger global economy.In 2018, the number of tourists increased by 14.1%, amounting to 4.12 million. In 2019, the number of touristsrose by 10.5% to 4.55 million. In 2020, the number of tourists decreased by 81.7% due to travel restrictionsthat were imposed during the COVID-19 pandemic and the number of tourists is expected to continue to below after the restrictions in Israel are lifted as a result of restrictions in other countries.(2)
The total revenue generated in domestic hotels from foreign visitors amounted to $1.002 billion,$1.258 billion, $1.433 billion, $1.542 billion and $0.256 billion in 2016, 2017, 2018, 2019 and 2020, respectively.This increased revenue by 2.5%, 25.6%, 13.9% and 7.6% in 2016, 2017, 2018 and 2019, respectively, comparedto the previous year. In 2020, revenue decreased by 83.3% as a result of the COVID-19 pandemic.
(2) The tourist arrival figures in this paragraph exclude day visitors.
D-38

Table No. 9
Arrivals of Tourists by Country of Citizenship and Exports of Tourism Services(1)
(Arrivals in Thousands)
2016 2017 2018 2019 2020
Asia . . . . . . . . . . . . . . . . . . . . . . . . . . . . . . . . . . . . . . . . . 342.2 459.4 470.8 541.5 88.7Africa . . . . . . . . . . . . . . . . . . . . . . . . . . . . . . . . . . . . . . . 65.3 73.0 78.9 87.3 14.2Europe . . . . . . . . . . . . . . . . . . . . . . . . . . . . . . . . . . . . . . . 1,700.3 2,207.2 2,550.6 2,839.3 508.5America
United States . . . . . . . . . . . . . . . . . . . . . . . . . . . . . . 657.3 806.1 925.3 1,007.6 205.8Other . . . . . . . . . . . . . . . . . . . . . . . . . . . . . . . . . . . . 187.6 257.9 299.8 355.9 59.4
Oceania . . . . . . . . . . . . . . . . . . . . . . . . . . . . . . . . . . . . . . 34.7 49.9 54.2 63.0 7.5Unclassified countries . . . . . . . . . . . . . . . . . . . . . . . . . . . 9.3 9.8 9.9 10.0 3.1Total Arrivals . . . . . . . . . . . . . . . . . . . . . . . . . . . . . . . . . 2,996.7 3,863.3 4,389.5 4,904.6 887.1Total Exports of tourism services (in USD Millions) . . . . 4,795.0 5,687.0 6,086.0 6,450.0 1,471.0
(1) Tourists and day visitors, excluding cruise passengers.Source: Central Bureau of Statistics.
Research and Development
The Government encourages investment in industrial R&D through advancing support and incentiveprograms created under the Law for the Encouragement of Industrial Research and Development. TheGovernment’s main objectives in supporting industrial R&D are to foster the development of technology-related industries, create employment opportunities for Israel’s scientific and technological labor force, andimprove Israel’s balance of payments by increasing exports of high-tech products. Israel’s Innovation authorityplans to invest more than NIS 0.5 billion on R&D incentive programs in 2021,(3) mostly focused on promotingcutting-edge technologies, which include a range of companies in terms of size and sector. In addition, theGovernment supports the promotion of R&D infrastructure for technological advancements in fields such asquantum mechanics and AI. In 2018 (the most recent year for which civilian R&D data is currently available),the national expenditure on R&D reached approximately 4.8% of GDP, which is the highest level of R&Dexpenditure as a percentage of GDP in the OECD. Israel participates in more than 50 international andbi-national industrial R&D joint ventures, including with the United States (e.g., BIRD, BARD, USISTC,Florida, New York, California), the EU (e.g., EUREKA, Eurostars, Galileo, Enterprise Europe Network),Canada, India, Australia, Germany, China, France, Belgium, Italy, Ireland, Turkey, United Kingdom, Greece,Singapore, Portugal, South Korea, Sweden, Finland, Netherlands, Denmark, Czech Republic, Hungary,Brazil, Argentina and Uruguay.
Prices
Between 2009 and 2019, the annual rate of inflation was 1.3% on average, which is within the Bank ofIsrael’s target range of 1% to 3%.
In 2020, the annual inflation rate decreased by 0.6%, which was primarily attributable to the decline inworld energy and food prices, the decline of economic activity and decreased consumer demand, factorsdirectly related to the COVID-19 pandemic, and to a lesser extent the moderate decrease of rental housingand the appreciation of the shekel.
Since 1993, the Bank of Israel has adjusted its key interest rate on a monthly basis. In 2008, the slowdownin the global economy, coupled with falling inflation, led the Bank of Israel to significantly lower interest rates.
(3) The reduction in the R&D budget in comparison to 2020, is a result of the “continuation” budgetmechanism which limits new expenditure.
D-39

By April 2009, the key interest rate was lowered to 0.5% but, as the Israeli economy recovered, the interest ratewas raised slightly later that year. The gradual increase of the interest rate continued throughout 2010 intofirst half of 2011. In June 2011, the Bank of Israel raised the interest rate to 3.25% and kept it at that level untilSeptember 2011. Since late 2011, due to subsiding inflationary pressures and appreciation pressures on theNIS, coupled with a slowdown in the global economy and moderate growth in the Israeli economy, the Bankof Israel gradually lowered the nominal interest rate, reaching 0.1% in March 2015. The rate remained thesame until December 2018 when the Bank of Israel increased it to 0.25%. In April 2020,due to COVID-19, theBank of Israel lowered the rate to 0.1%. This rate has been maintained through 2020 and is the current rate asof June 2021.
The real interest rate, derived from the Bank of Israel’s key interest rate and inflation expectations(measured as the difference between the yields of indexed and non-indexed government bonds) decreasedfrom more than 6% in mid-2003 to averages of 2.5% in 2007 and 1.7% in 2008. Due to the 2008 global financialcrisis, the Bank of Israel lowered the key interest rate, and by April 2009 the real interest rate had turnednegative, averaging -0.7% in 2009. The real interest rate averaged -0.9% in 2010 and 0.4% in 2011. Throughout2012, the real interest rate averaged at 0.3% and, by the end of the year, it decreased to 0.2%. Most of 2013, thereal interest rate was negative, averaging -0.2%. In 2014, the real interest rate remained negative, averaging-0.6%. The negative real interest rates continued in 2015, 2016, 2017, 2018 and 2019, as the real interest rateaveraged -0.5%, -0.1%, -0.2%, -0.9% and -0.8%, respectively, mainly due to the Bank of Israel’s low interestrates. Although the Bank of Israel lowered the key interest rate in April 2020, the decrease in inflation hasresulted in a positive real interest rate of 0.1%, breaking a five year stretch of negative interest rates.
Table No. 10
Selected Price Indices(Percentage Change, Annual Average)
Period CPICPI Excluding Housing,
Fruits and VegetablesWholesale Price of
Manufacturing Output
2016 . . . . . . . . . . . . . . . . . . . . . . . . . . . . . . . . . . . . . -0.5% -1.6% -3.6%2017 . . . . . . . . . . . . . . . . . . . . . . . . . . . . . . . . . . . . . 0.2% -0.4% 1.4%2018 . . . . . . . . . . . . . . . . . . . . . . . . . . . . . . . . . . . . . 0.8% 0.3% 3.3%2019 . . . . . . . . . . . . . . . . . . . . . . . . . . . . . . . . . . . . . 0.8% 0.3% -1.2%2020 . . . . . . . . . . . . . . . . . . . . . . . . . . . . . . . . . . . . . -0.6% -1.3% -4.9%
Source: Central Bureau of Statistics
Employment, Labor and Wages
Israel has a high employment rate and there is strong demand for workers. Therefore, wages have increasedsignificantly in the past ten years. The increase in real wages and the high labor participation rate have led toincreased average household income. The increase in real wages reflects both the rise in nominal wages and lowinflation rates. The increase in the participation rate is attributable to overall economic growth and thesuccessful implementation of the Government’s policies to cut transfer payments and lower taxation on labor.
In 2020, there was a 7.7% increase in real wages compared to 2019, with an increase of 3.4% in the publicsector and of 10.6% in the private sector. Since 2015, real wages grew approximately 2.6% per year. Thisincrease was mostly due to the high demand for workers, primarily high-skilled workers in the technologysector. This demand is driven by strong GDP growth, technological improvements and strong macroeconomicand fiscal conditions. The increase in real wages in 2020 was due to the fact that the workers who werefurloughed during the COVID-19 pandemic tended to have lower than average wages. In 2020, unemploymenthas increased as a result of the lockdowns imposed to reduce the spread of COVID-19. In total, unemploymentin 2020 was 4.3% with an additional 9.5% absent from work due to reasons related to COVID-19 such asunpaid leave, and an additional 1.4% that left the labor force due to COVID-19 related reasons such asdismissal or closure of the workplace from March 2020.
D-40

The labor force participation rate, which is the labor force as a percentage of the population over the ageof 15, was 61.8% in 2020 compared to 63.5% in 2019. There has been steady incremental improvement in thelabor force participation rate since 2002, when the rate was 59.4%.
Table No. 11
Principal Labor Force Indicators(1)
(Annual Average — Figures In Thousands Unless Noted Otherwise)
2016 2017 2018 2019 2020
Permanent average population . . . . . . . . . . . . . . . . . . . 8,546.0 8,713.3 8,882.8 9,054.0 9,217.0Population aged 15+ . . . . . . . . . . . . . . . . . . . . . . . . . . 6,119.9 6,238.8 6,363.1 6,493.7 6,619.6Civilian labor force(2) . . . . . . . . . . . . . . . . . . . . . . . . . 3925.2 3.993.1 4,067.7 4,123.7 4,090.4Labor force participation rate(3) . . . . . . . . . . . . . . . . . . 64.1% 64.0% 63.9% 63.5% 61.8%Unemployment rate . . . . . . . . . . . . . . . . . . . . . . . . . . 4.8% 4.2% 4.0% 3.8% 4.3%
(1) All figures are comparable with the Central Bureau of Statistics’ new methodology for the monthly laborforce survey.
(2) The sum of the number of workers and the number of job seekers.
(3) Civilian labor force as a percentage of the population over the age of 15.
Source: Central Bureau of Statistics.
Table No. 12
Unemployment Data by Demographic Group(1)
2016 2017 2018 2019 2020
Men . . . . . . . . . . . . . . . . . . . . . . . . . . . . . . . . . . . . . . . . . . . . . . . . . 4.7% 4.1% 4.0% 3.7% 4.5%Women . . . . . . . . . . . . . . . . . . . . . . . . . . . . . . . . . . . . . . . . . . . . . . . 4.9% 4.3% 4.0% 3.9% 4.1%Population aged 25 – 64 . . . . . . . . . . . . . . . . . . . . . . . . . . . . . . . . . . . 4.1% 3.7% 3.5% 3.4% 3.8%
(1) All figures are comparable with the Central Bureau of Statistics’ new methodology for monthly laborforce survey.
Source: Central Bureau of Statistics.
In 2020, Israel’s population was approximately 9.2 million, an increase of 1.8% compared to 2019. Thepopulation has grown at a steady annual rate of approximately 1.8% to 2.0% from 2003 to 2020. The civilianlabor force decreased by 0.8% in 2020.
One of Israel’s most important resources is its highly educated work force. Based on OECD reports, in2019 approximately 50% of adults between the ages of 25 and 64 had attained tertiary education, compared tothe OECD average of 40%. Utilizing its highly-educated population, Israel has developed a technology-basedand export-oriented economy. The employment qualifications of recent immigrants have been in line with thehigh quality of the Israeli work force, with two-thirds of immigrants from the former Soviet Union consistingof scientists, engineers or technical staff.
D-41

Table No. 13
Structure of Employment in Israel(Employed Persons by Industry, as Percent of Total Employees)
2016 2017 2018 2019 2020
Employment by SectorPublic Sector Employment . . . . . . . . . . . . . . . . . . . . . . . . . . . . 35.4% 35.6% 36.1% 36.2% 37.4%Private Sector Employment . . . . . . . . . . . . . . .. . . . . . . . . . . . . 64.6% 64.4% 63.9% 63.8% 62.6%
Employment by IndustryAgriculture . . . . . . . . . . . . . . . . . . . . . . . . . . .. . . . . . . . . . . . . . 1.0% 1.0% 1.0% 1.0% 0.9%Manufacturing . . . . . . . . . . . . . . . . . . . . . . . . . . . . . . . . . . . . . . 11.4% 11.4% 10.9% 10.2% 9.7%Water and electricity(1) . . . . . . . . . . . . . . . . . . . . . . . . . . . . . . . . 0.9% 0.9% 0.8% 0.7% 0.8%Construction . . . . . . . . . . . . . . . . . . . . . . . .. . . . . . . . . . . . . . . . 5.0% 5.1% 5.1% 5.2% 5.1%Trade . . . . . . . . . . . . . . . . . . . . . . . . . . . . . . . . . . . . . . . . . . . . . 11.5% 11.3% 10.7% 10.7% 10.6%Catering . . . . . . . . . . . . . . . . . . . . . . . . . . . . . . . . . . . . . . . . . . . 4.4% 4.3% 4.2% 4.4% 3.6%Banking and financial services . . . . . . . . . . . . . . . . . . . . . . . . . 3.3% 3.4% 3.3% 3.2% 3.2%Business services(2). . . . . . . . . . . . . . . . . . . . . . . . . . . . . . . . . . . 17.3% 17.3% 17.4% 18.2% 18.6%Public administration . . . . . . . . . . . . . . . . . . . . . . . . . . . . . . . . . 10.1% 10.0% 10.1% 10.0% 10.4%Education . . . . . . . . . . . . . . . . . . . . . . . . . . . . . . . . . . . . . . . . . 12.2% 12.3% 12.6% 12.4% 12.5%Health, welfare and social work . . . . . . . . . . . . . . . . . . . . . . . . . 10.7% 10.7% 10.8% 11.1% 11.7%Transport . . . . . . . . . . . . . . . . . . . . . . . . . . . . . . . . . . . . . . . . . . 4.1% 4.2% 4.3% 4.3% 4.2%Personal and other services(3). . . . . . . . . . . . . . . . . . . . . . . . . . . 4.3% 4.3% 4.4% 4.8% 4.7%Services for households by domestic personnel . . . . . . . . . . . . . 1.8% 1.8% 1.7% 1.5% 1.6%Other . . . . . . . . . . . . . . . . . . . . . . . . . . . . . . . . . . . . . . . . . . . . . 1.9% 2.2% 2.6% 2.4% 2.2%
Total workers(4) (in Thousands) . . . . . . . . . . . . . . . . . . . . . . . . . . 3,737 3,825 3,905 3,967 3,913
(1) “Water and electricity” includes “Electricity, gas, steam and air conditioning supply” and “Water supply;sewage, waste management and remediation activities.”
(2) “Business services” includes “Information and communication,” “Real estate activities,” “Professional,scientific and technical activities” and “Administrative and support service activities.”
(3) “Personal and other services” includes “Arts, entertainment and recreation”and “Other service activities.”(4) Israeli workers only.Source: Central Bureau of Statistics, Bank of Israel.
Role of the State in the Economy
Historically, the Government has been involved in nearly all sectors of the Israeli economy, particularlyin defense-related and monopolistic businesses and industries. Before the privatization process started in the1980s, ownership of industry in Israel was divided among the Government, the organization of trade unions(the “Histadrut”) and the private sector, with the Government and the Histadrut owning large interests inseveral key industries. In recent decades, the Government has made progress towards the privatization ofState-owned enterprises and introduced structural competitive changes in several sectors of the economy. Aspart of the privatization process, the Government has implemented reforms intended to enhance competitionin certain sectors which the Government previously dominated, such as the communications sector, oilrefineries and ports. In addition, the Government introduced competition in additional sectors and industries,such as the electricity sector and capital markets.
The Government Companies Authority was established under the Government Companies Law of 1975.The Government Companies Authority is a professional unit of the Ministry of Digital Affairs and is charged
D-42

with exercising the ownership function in State-owned enterprises, including overseeing privatizations andmanaging structural changes. As of December 2020, there were 109 State-owned enterprises, which includebusiness-oriented enterprises, funds established as investment vehicles, academic and educational institutions,real estate companies and social services providers.
State-owned enterprises are divided by law into two main categories: Government Companies and MixedCompanies. In addition to State-owned enterprises, there are statutory corporations which are establishedpursuant to specific laws regulating their operations and governance structures.
Government Companies are companies in which the Government owns more than 50% of the votingrights or has the right to appoint more than half of the members of the board of directors. GovernmentCompanies are subject to the Israeli Government Companies Law and the regulations promulgated thereunder(collectively, the “GCL”).
Government Companies play a significant role in the Israeli economy. In 2020, they employedapproximately 54,000 employees or 1.3% of the Israeli work force, accounted for NIS 15.5 billion of exportsand owned assets amounting to NIS 222.1 billion (according to preliminary data). These companies includeseveral public utilities, monopolies and defense companies.
Mixed Companies are companies in which the State owns 50% or less of the voting rights or has the rightto appoint less than half of the members of the board of directors. Under the GCL, Mixed Companies are notsubject to the same degree of regulation as Government Companies. However, Mixed Companies are subjectto certain provisions of the GCL, including qualifications and approvals required for the appointment ofcertain directors by the Government. Mixed Companies play a relatively minor role in the economy.
The Government has initiated a number of regulatory arrangements to increase competition in certainsectors. These arrangements focus on the introduction of privately-owned companies as competitors to State-owned enterprises in sectors in which the Government wishes to increase competition. The pace ofprivatization is dependent upon further regulatory and structural reforms and the formulation of policies thatwill define the post-privatization environment in which these companies will operate. The development andimplementation of some of these policies and reforms may take a considerable amount of time.
Privatization. Privatization is an essential element of the broader market reforms initiated by theGovernment over the past several decades that aim to promote the growth of the private sector, mainly byenhancing competition. Privatization efforts have included the full or partial sale of State-owned companiesand banks and the transfer to private entities of activities that were previously performed by GovernmentCompanies or statutory corporations.
In total, between 1986 and 2020, 98 Government Companies became either Mixed Companies or fullyprivatized. The proceeds stemming from privatizations between 2005 and 2020 totaled $4.5 billion.
The implementation of privatization reforms includes a reduction of the State’s holdings in GovernmentCompanies, as well as an increase in the number of Government Companies through the consolidation andtransformation of various Government units and statutory authorities. In addition, the Government hasimplemented structural changes to the external controls system, aiming to implement high standards ofaccounting controls, improve civil services and increase competition in the infrastructure industry. As part ofthe revised external controls structure, in July 2002 the Government enacted new legislation based onprovisions of the U.S. Sarbanes-Oxley Act of 2002. This legislation provides for, among other things, accuracyand transparency in financial statements and internal controls systems of Government Companies. Underthis legislation (and similar to Section 404 of the Sarbanes-Oxley Act), Government Companies holding ormanaging assets in excess of NIS 400 million are required to submit statements regarding the scope, adequacyand effectiveness of their internal control procedures for financial reporting, attested to by their accountants.
In 2014, a Government resolution was passed to privatize 25% to 49% of the State’s holdings in certainGovernment Companies in which the State has a long-term interest to control and to completely privatizecertain other Government Companies. In 2015, the Government Companies Authority, together with theGovernment Companies in the resolution, began to take action to advance those companies’ readiness forinitial private offerings and privatization.
D-43

In 2018, the Government Companies Authority completed the full privatization of Israel MilitaryIndustries Ltd. by establishing a new Government Company to which the business-oriented activity of IsraelMilitary Industries was transferred and the new Government Company was sold in a private sale to an investor.
Table No. 14
Selected State-Owned Companies(As of December 31, 2020)(1) (In Millions of Dollars, Except Percentages)
Direct/Indirect
Company NameGovernmentOwnership
TotalAssets
Long-TermLiabilities
TotalSales
Israel Electric Corp. Ltd. . . . . . . . . . . . . . . . . . . . . . . . . . . . . . . . . 99.85% 27,027 15,899 7,396Israel Aerospace Industries Ltd. . . . . . . . . . . . . . . . . . . . . . . . . . . . 100.00% 6,257 428 4,480Rafael-Advanced Defense Systems Ltd. . . . . . . . . . . . . . . . . . . . . . 100.00% 4,566 505 2,941Israel Ports Development and Assets Company Ltd.(2) . . . . . . . . . 100.00% 4,574 1,675 334Ashdod Port Company Ltd.(2) . . . . . . . . . . . . . . . . . . . . . . . . . . . . 100.00% 1,208 151 330Haifa Port Company Ltd. . . . . . . . . . . . . . . . . . . . . . . . . . . . . . . . . 100.00% 960 251 233Israel Railways Ltd. . . . . . . . . . . . . . . . . . . . . . . . . . . . . . . . . . . . . 100.00% 9,861 9,173 746Mekorot Water Company Ltd. . . . . . . . . . . . . . . . . . . . . . . . . . . . . 99.99% 5,493 3,458 1,523Israel Postal Company Ltd. . . . . . . . . . . . . . . . . . . . . . . . . . . . . . . 100.00% 2,328 434 491Israel Natural Gas Lines Company Ltd. . . . . . . . . . . . . . . . . . . . . . 100.00% 1,980 1,416 281Netivei Israel-National Transport Infrastructure Company Ltd. . . 100.00% 538 101 1,943Petroleum & Energy Infrastructures Ltd. . . . . . . . . . . . . . . . . . . . . 99.99% 666 183 98
(1) Based on consolidated NIS-denominated financial statements prepared in accordance with either Israeligenerally accepted accounting principles or International Financial Reporting Standards. Amounts indollars were converted from NIS at the applicable exchange rates for December 31 set forth in TableNo. 1.
(2) Spun-off from the Ports Authority in 2004.Sources: Ministry of Digital Affairs, Government Companies Authority.
Below are summary descriptions of some of the State-owned companies set forth in the above table,including specific steps planned or taken by the Government to prepare such companies for privatization orreform their structures and operations.
Israel Electric Corporation Ltd.
IEC generates, transmits, distributes and supplies most of the electricity in Israel. Since 1996, IEC hasbeen regulated under the Electricity Sector Law and the regulations promulgated thereunder. The purpose ofthe Electricity Sector Law is to regulate activity in the electricity sector in the public interest; to ensure thereliability, availability, quality and efficiency of services and efficient energetic use; to create conditions forcompetition; and to minimize costs. The Electricity Sector Law’s amendments outline the separation ofactivities in the generation, transmission, distribution and supply of electricity. The Electricity Sector Lawprovides for, among other things, tariff supervision (including efficiency incentives), regulation of IEC’s returnon equity and the prices it can charge consumers, and licensing requirements pursuant to which IEC holdslicenses that permit it to conduct its business. The law provides for transition periods during which IEC hasbeen granted a general license for the transmission, distribution, supply, trade and sale of electricity. Inaddition, IEC was granted generation licenses for its generation units. IEC currently holds licenses to generateelectricity at its 52 generation units.
Under the Electricity Sector Law, the owner of a license for transmission or distribution is required topurchase electricity from other generators of electricity and to enable other licensed generators to use the
D-44

same transmission and distribution channels to supply electricity to their own customers. After the law wasenacted, the Government passed several resolutions aimed at strengthening independent electricity productionby, among other things, enabling entrepreneurs in the free market to invest in the construction and operationof generation units. Accordingly, pursuant to these Government resolutions, independent private producersof electricity may generate electricity and sell it directly to end-users using IEC’s transmission and distributionnetwork. In recent years, the Government has reaffirmed and expanded its policy of encouraging competitionby means of independent private producers. The Government’s goal is to achieve a competitive market in thegeneration segment of the electricity sector.
In May 2018, relevant government representatives and the IEC, after a consultation with IEC employees’representatives and the Histadrut, reached an agreement with respect to Government and regulatory decisionsregarding structural changes of the IEC over a period of eight years. The Government and the IEC board ofdirectors approved these structural changes and an amendment to the Electricity Sector Law was enacted.Accordingly, the IEC will reduce its share of the production and supply segments, maintain its role as a vitalservices supplier in the transmission and distribution segments, separate its system management operations toa different government company and execute a re-organization plan, with the aim of improving its financialcondition.
In 2018, the IEC raised approximately NIS 1.7 billion in tradable bonds on the TASE and USD 1 billionin bonds issued through its Global Medium Term Notes (GMTN) program to Qualified Institutional Buyersin the United States and elsewhere. In 2019, the IEC issued its first short-term commercial securities totalingNIS 220 million tradable securities and NIS 200 million non-tradable securities. In 2020, the IEC raisedapproximately NIS 1 billion through taps of existing bonds.
Defense Oriented Companies
In 2013, the Ministerial Privatization Committee decided to privatize Israel Military Industries Ltd.,which is another defense-oriented Government Company of which the State held 100% until 2018, byestablishing a new Government Company to which the business activity of Israel Military Industries would betransferred, and the new Government Company would be sold in a private sale to investors. In 2018 theGovernment sold its entire holding in Israel Military Industries for NIS 1.4 billion, the Government receivedNIS 194.7 million in 2021 and expected to receive NIS 178.8 million in 2022 in accordance with the frameworkof this privatization.
Currently, the Government holds 100% of Israel Aerospace Industries Ltd. and Rafael-Advanced DefenseSystems Ltd, which are defense-oriented Government Companies. In November 2020, the MinisterialPrivatization Committee decided to privatize up to 49% of the government’s holdings in Israel AerospaceIndustries Ltd., via public offering on the Tel Aviv Stock Exchange. The Government Companies Authority ispromoting the privatization process of Israel Aerospace Industries Ltd. Rafael-Advanced Defense SystemsLtd. owns or partially owns more than 35 subsidiaries in Israel and across the world with an investment valueof over NIS 1 billion.
Ports Companies
The Ports Authority, which historically functioned as an operating port authority (with ownership overall port property and assets and responsibility for all vessels and cargo handling operations in Israel’s ports),was one of the strongest and most significant monopolies in Israel. In 2004, the Knesset passed a lawabolishing the Ports Authority and dividing its activities among three newly-formed Government Companies,each responsible for operating the ports of Haifa, Ashdod and Eilat, respectively. An additional GovernmentCompany was created to hold and manage the ports’ assets and to lease them to these three port operatingcompanies and other companies in the ports industry. An Administration of Shipping and Ports was alsoestablished under the jurisdiction of the Ministry of Transport and Road Safety. The implementation of theport sector reform began in 2005 when the Ports Authority was abolished and the aforementioned companiescommenced operations. As part of the privatization process, it was planned that portions of the three portoperating companies would be sold to private investors. In 2007 Israel Shipyards Company received theapproval to supply seaport services and became the first private seaport in Israel.
Over the years, attempts to gradually privatize companies by selling percentages of the Government’sholdings did not succeed, and today the Government still holds 100% of the companies’ stock. The upcoming
D-45
competition led the port companies to turn to National Labor Court, leading to intense negotiations betweenthe relevant government offices, the company and the workers’ organization. This negotiation led to thedrafting of general agreements with the Ashdod port workers’ organization in 2016; however, these agreementswere not implemented.
At the same time, parallel negotiations were being held between governmental representatives, the Haifaport company and the workers organization of the Haifa port. These meetings led to a successful outcomeand resulted in an agreement to privatize the Haifa port. In January 2020, the Ministerial Committee forPrivatization decided to privatize 100% of government’s holdings in Haifa port Company to strategic investors.This privatization is intended to improve the company’s efficiency and promote the implementation of theport sector reform. The goal is that by the end of 2021, five Mediterranean port companies and Papo Maritimewill work in collaboration under the Israel Ports Company to address the increasing demands of shipping toIsrael and the Palestinian Authority.
The Government Companies Authority is promoting the privatization process of Haifa port. The GCAconducted a roadshow campaign among local and international potential investors, which resulted in 18applications to participate in the sale process on October 29, 2020. The GCA continues to lead the sale processof the Haifa Port Company which entails a data room period, a bidding procedure, final government approvalsand closing which is scheduled for the end of 2021.
Israel Postal Company Ltd.
Israel Postal Company Ltd. and its subsidiary, the Postal Bank Ltd., were established in 2006 to replacethe Postal Authority. These Government Companies were established as part of a comprehensive reform inthe postal sector which included, among other things, opening the postal sector to competition, licensing theoperations of the companies and setting fees for postal services.
In 2018 the Ministerial Committee for Privatization decided to partially privatize 40% of the Israel PostalCompany in two phases. The first phase is selling 20% of the government’s holdings in the company in aprivate sale. The second phase is privatizing an additional 20% of the company by an IPO on the TASE. Thisprivatization is intended to improve the company’s transparency, efficiency and profitability.
In November 2020, the Ministerial Committee for Privatization reaffirmed the decision to privatize 40%of the Government’s holdings in Israel Postal Company in two phases. The Government Companies Authorityis promoting the first phase of the privatization process of Israel Postal Company, the sale of 20% of IsraelPostal Company to a private strategic investor. During 2020, the GCA conducted a roadshow campaignamong local potential investors, which resulted in 10 applications from investors to participate in the saleprocess in October 2020. The GCA continues to lead the sale process of Israel Postal Company which entailsa review period, a bidding procedure, final government approvals and the selection of the strategic investorexpected at the end of 2021.
The Environment
Since the establishment of the Ministry of Environmental Protection (the “MoEP”) in 1989, Israel hasenacted many laws and regulations to protect the environment. The overall objective of the MoEP is to reduceand prevent pollution and environmental risks, while also reducing economic and social inequality andimproving citizens’ health. The current areas of focus are reduction of air pollution, strengtheningenforcement, advancing waste treatment, and creating long term programs for climate change and biodiversity.The MoEP operates on national, regional and local levels. At the national level, the MoEP is responsible forthe formulation of a nationwide integrated and inclusive policy for the protection of the environment. At theregional level, through its six district offices, the MoEP, among other ministries, oversees the implementationof national environmental policies, engages in local planning processes, assists municipalities with theirenvironmental responsibilities and supervises municipalities when formulating requirements for businesslicenses. At the local level, the MoEP lends support to environmental units and towns associations that havebeen established in municipalities throughout the country.
The State’s environmental legislation encompasses laws targeting the protection of natural resources,abatement and prevention of environmental nuisances, and safe treatment of certain contaminants and
D-46

pollutants. Other comprehensive legislation such as the Planning and Building Law and the Licensing ofBusinesses Law provides a framework for controlling the use of resources and promoting sustainabledevelopment. Planning authorities view environmental considerations as an integral part of the planning andlicensing process, and objections are frequently based on environmental issues.
Israel’s 2010 acceptance as a member of the OECD continues to have major effects on the State’senvironmental protection regime, as it continues to take steps to comply with the OECD’s decisions andrecommendations, including further implementation of chemicals management, IPPC and comprehensivewaste management.
The “2030 Agenda for Sustainable Development”was launched by the UN in 2015 and is a comprehensivepolicy program that aims to eradicate poverty. The agenda contains 17 development goals to direct policymakers to formulate a long-term strategy and provide tools for shaping and implementing said strategy. Aninterministerial team led by the Ministry of Foreign Affairs and the MoEP coordinated Israel’s first report tothe United Nations, which was presented in July 2019 and outlined the situation in Israel and the extent towhich it meets these development goals.
In July 2019, the government approved a proposal to integrate the UN’s Sustainable Development Goalsinto Israeli governmental work programs, in order to improve governance and strategic planning (GovernmentDecision 4631). The Government Decision requires that the global sustainable development targets andindicators for 2030 will be integrated with the ministries’ strategic direction of actions, which are derived fromthe Strategic Socio-economic Assessment of the National Economic Council.
Israel has ratified nearly all of the major international conventions on environmental protection andensures that its national legislation conforms to these conventions. Israel is party to international conventionson various issues, such as climate change, trans-boundary movements of hazardous waste and chemicals,protection of the ozone layer, biological diversity, wetlands protection, international trade in endangeredspecies and protection of the Mediterranean Sea from pollution.
Israel ratified the Kyoto Protocol to the United Nations Framework Convention on Climate Change (the“UNFCCC”) in February 2004 and soon thereafter created a Designated National Authority for the CleanDevelopment Mechanism. Following governmental approval, Israel submitted its Nationally DeterminedContribution (“NDC”) to the Secretariat of the UNFCCC in September 2015, in which Israel committed toan economy-wide unconditional target of reducing its per capita greenhouse gas emissions to 7.7 tCO2e (tonsof carbon dioxide equivalent) per capita by 2030, which constitutes a reduction of 26% below the level in 2005of 10.4 tCO2e per capita. An interim target of 8.8 tCO2e per capita is expected by 2025.
In order to meet Israel’s 2030 goals, a National Plan to Reduce GHG Emissions and Increase EnergyEfficiency (Government Decision 1403) was approved in 2016 that includes mitigation measures in key areasand sets timetables for review and formulation of additional measures. In November 2016, Israel ratified theParis Agreement.
The Government approved the following environmental targets for 2030:
• 17% reduction in electricity consumption;
• 13% of electricity consumption in 2025 will be from renewables, increasing to 17% in 2030; and
• 20% reduction in kilometers travelled by private vehicles.
The National Plan allocated NIS 500 million in government guarantees for a ten-year period to leverageinvestment loans related to energy efficiency and reducing GHG emissions. This is in accordance with criteriathat relate to eligibility, duration and prioritization of innovative Israeli technologies.
In 2016, the Government implemented a number of additional successful financial incentive programsfor energy efficiency and GHG emissions reduction. For example, a budget of approximately $105 million wasallocated for two grant schemes that incentivize energy efficiency investments in local authorities with lowsocio-economic rankings and small- and medium-sized businesses.
In November 2019, the MoEP, MoEI and Ministry of Energy approved an allocation of another NIS62 million in grants for energy efficiency and greenhouse gas projects. The grants will be awarded to 108 local
D-47

authorities and factories, within the framework of a national plan that aims to reach the GHG emissionsreduction target set in Govt. Decisions No. 542 and 1403, a 26% per capita reduction from the 2005 GHGemissions levels. Israel submitted its first Biennial Update Report to the UNFCCC in April 2016. The reportincludes information on GHG abatement measures carried out and a GHG inventory. In 2018 the thirdNational Communication was submitted to the UNFCCC, a comprehensive report on climate change in Israel.
A voluntary registry for the accounting and reporting of GHG emissions was launched in July 2010.Over 70 companies and organizations joined and reported on their annual GHG emissions. Recognition isgiven through certificates of recognition signed by the Minister of Environmental Protection. Level 1 awardcertificates are presented to entities to recognize the reporting of emissions; Level 2 award certificates arepresented to entities that have their reports verified by an accredited third party that received certification; andLevel 3 awards are presented to entities that implement certified emissions reductions.
The National Program for Adaptation to Climate Change includes 30 action plans, which cover all aspectsof life and economic activity. The program, approved by the government in July 2018, reflects advances inscientific knowledge and international agreements related to climate change, and it includes adjustments andunderstandings of the effects of climate change on Israel. The program has five main objectives:
• Reducing human and property damage, and building economic resilience;
• Increasing the resilience of the natural systems;
• Building and updating the scientific knowledge base for decision-making;
• Education, awareness-raising, and accessibility of information;
• Israel’s integration into the global effort, in accordance with its commitments, and the promotion ofregional and international cooperation.
By switching to renewable energy sources and reducing electricity consumption, the GHG reductionprogram is expected to decrease air pollution and to result in long-term energy security, increased energyefficiency and job opportunities, the development of a clean tech market and economic growth.
The introduction of natural gas to the electricity sector (see “The Economy — Energy,” above) is expectedto have major consequences on pollution abatement from the electricity sector. The share of coal in the fuelmix of Israel’s power sector has decreased from approximately 60% in 2010 to approximately 30% in 2019.Approximately 65% of electricity generation in 2019 came from natural gas, while 5% was from renewableenergy. Despite the slow progress in the development of renewable energy, recent developments, includingcompetitive tenders for renewable energy and the Ashalim Power Station, are expected to lead to an increase inrenewable energy capacity.
Market-based competitive tenders for renewable energy have been introduced, which have resulted insignificantly lower prices, which that renewable energy can now compete with conventional energy generationeven before the environmental costs are considered. The Ashalim Power Station, a new power generationfacility focused on renewable energy, began test operations in July 2017 and two of its solar thermal facilitiesbecame operational in April 2019.
In June 2020, the Ministry of Energy presented a plan to increase the proportion of power generatedfrom renewable sources in Israel to 30% of total power production by 2030, instead of the earlier target of17%.
The oldest and most polluting four coal powered units at the largest power plant in Israel are due to closein 2022. In 2020 the generation of electricity from coal was 26%, from natural gas was 67% and from renewableenergy sources was 6%. By 2025, coal is expected to be used as a reserve for emergency situations of naturalgas shortage and will be replaced with natural gas and renewable energy sources. The share of natural gas useis expected to increase significantly to about 83% in 2025 according to the Electricity Authority. On the otherhand, the share of coal, is expected to decrease to only about 3% in 2025. Israel joined the Powering Past CoalAlliance at the 24th UNFCCC Conference of the Parties in 2018, joining a group of governments, businesses,and organizations around the world working to transition away from coal-powered electricity generation. Thecoalition supports the reduction of the use of coal in OECD countries by 2030 and the world by 2050.
D-48

In 2013, the MoEP and the Small and Medium Enterprises Authority at the Ministry of Economylaunched a program initiative to promote sustainable business in Israel. The program offers subsidizedprofessional advice to businesses in environmental and energy efficiency areas. This program constitutes partof a wider system that provides professional consultation to existing and new businesses in areas such asestablishing a business, business management, financial management, marketing and sales, operations,industrial design and exports. Increased environmental and energy awareness is expected to result in energysavings and a reduction in GHG emissions.
Israel has enacted several environmental laws and regulations, including regulations on the prevention ofwater pollution, such as stringent standards for 36 different parameters to bring wastewater treatment to alevel creating effluents suitable for unrestricted irrigation and discharge into rivers (enacted in 2010). In 2004,regulations were legislated (amended in 2009) to implement the Montreal Protocol by limiting production,consumption, import and export of substances that deplete or are likely to deplete the ozone layer. The KigaliAmendment to the Montreal Protocol came into force in January 2019, calling for limiting production,consumption, import and export of hydrofluorocarbons and greenhouse gases. The Kigali Amendment willrequire developed countries, including Israel, to gradually reduce the use of hydrofluorocarbons (HFCs).Hazardous materials regulations that will take effect in July 2022 incorporate the Kigali Amendment intonational legislation and will gradually reduce the import of HFCs.
The Clean Air Law came into effect in 2011, providing a framework for the reduction and prevention ofair pollution by setting responsibilities and imposing obligations on the Government, local authorities and theindustrial sector. The comprehensive law relates to a wide range of provisions, including requirements thatmajor industrial polluters obtain emission permits, publication of air quality data and forecasts, granting theMoEP authority over vehicular pollution, formulation of a national plan for the reduction and prevention ofair pollution, air pollutant monitoring and sampling, and increased enforcement and stricter penalties. Airquality standards that became effective in May 2013 require new and existing factories to receive emissionspermits. Factories that do not meet air quality standards do not receive an emissions permit. Updated airquality standards that raised the threshold for air quality values for substances (pollutants) listed in the CleanAir Law came into effect in 2016. To encourage the reduction of air pollution from vehicles, the Governmentimposes a vehicle purchase tax that is linked to the pollution level emitted from the vehicle. The purchase taxon diesel and gasoline cars is 83% with a reduction of up to NIS 16,000 according to the vehicle emission level(“green grade”).
In 2020 the purchase tax of hybrid cars rose to 45% and continued to rise to 50% in 2021. According tothe tax outline published in 2019, as of 2022 the purchase tax of hybrid cars will be equal to the purchase taxof a regular vehicle. For electric vehicles, the purchase tax was 25% in 2020 and 30% in 2021, and will continueto rise until 2024 when it is planned to be equal to the purchase tax of a non-electric vehicle.
The sulfur content of transport fuels is limited to 10ppm as of 2011. New vehicles are required to complywith the most updated European emission standards. All vehicles are required to go through strict annualemission tests. Continuing from 2016, a NIS 30 million hybrid taxi program is in place to encourage licensedtaxi drivers to purchase hybrid cars with “green vehicle ratings.”
A NIS 260 million pollution reduction program for old diesel vehicles has been operating since 2018. Theprogram is largely based on subsidies for the installation of particulate filters, a scrapping program for olddiesel vehicles in exchange for government remuneration, and the creation of new Low Emission Zones(“LEZ”) in some major metropolitan areas, where polluting diesel vehicles are prohibited. The LEZ programhas currently taken effect in downtown Haifa and in Jerusalem and is expected to expand into additional cities.As of March 2019, around 1,500 particulate filters have been installed and over 600 old vehicles were scrapped.In addition, owners of old and polluting diesel vehicles are required to install particulate filters and are nolonger able to renew their licenses unless they install pollution-reducing particulate filters in those vehicles asa result of regulations enacted in November 2018.
In December 2017, the Internal Affairs and Environment Committee of the Knesset approved regulationsrequiring gas stations throughout Israel to reduce fuel vapor emissions. The regulations require all gas stationsto install vapor recovery systems and gas stations that violate the regulations will be fined.
The Reduction of Single Use Carrier Bags Law, which took effect in 2017, prohibits Israel’s largestsupermarkets from distributing single use carrier bags less than 20 microns thick to consumers and requires
D-49

supermarkets to collect a minimum fee of not less than NIS 10 agorot (approximately $0.03) for thedistribution of plastic bags between 20 and 50 microns. As a result, the number of plastic bags decreasedsubstantially. Under the law, large retailers are required to report quarterly to the MoEP on the number ofbags sold, as well as on bag composition, thickness and weight, and to pay the levy for each single-use carrierbag sold. The funds collected from the levy are deposited in the MoEP’s Maintenance of Cleanliness Fundand are managed in a separate account. The collected funds are used for encouraging the reduction of single-use carrier bags through education and conducting clean-up activities.
In July 2007, a landfill levy was imposed on municipal waste, seeking to internalize the costs associatedwith landfills. Revenues from the levy are dedicated to establishing infrastructure aimed at reducing landfilling.
In 2019, the average Israeli generated about 1.76 kg of waste per day (642 kg annually). In the last decade,the rate of waste growth in Israel has averaged about 2.6% per year as a result of population growth andincreased consumption. About 80% of waste is buried in landfills, a figure that has not changed significantlyin the last 20 years. Recycling percentages in Israel are significantly lower than in other OECD countries. TheMoEP has presented a new strategy that prioritizes waste reduction and recycling over waste incineration orlandfilling. Implementation of the new strategy will enable the achievement of the following targets by 2030:
• transfer of 54% of municipal waste to be recycled;
• 100% infrastructure for sorting and separating organic waste at source;
• 0% landfill of untreated waste and 20% landfill of treated waste;
• 47% reduction in greenhouse gas emissions, compared to 2020.
The MoEP will promote the construction of waste sorting and treatment facilities funded by theMaintenance of Cleanliness Fund and assist in the establishment of physical infrastructure for separationat-source of waste.
In October 2020, the MoEP decided to apply for the first time in Israel a deposit obligation on largebeverage bottles. In doing so, Israel joined a growing number of countries that have imposed a depositrequirement on all beverage containers, in order to address the problem of disposable plastics in public space.Beginning in December 2021, the public will be required to pay a deposit for the purchase of large beveragecontainers similar to small beverage containers. After consumption, one is be able to return the container andreceive in return the deposit fee paid at the time of purchase, similar to the deposit mechanism that existstoday on small beverage containers.
In 2015, an external consulting company prepared and submitted to the MoEP a report titled “Policy forManagement of Hazardous Waste in Israel.” The report included recommendations on how to improvepolicies and practices in the field of hazardous waste The MoEP adopted the recommendations and hasstarted implementation according to a plan for 2018 — 2019.
Limits on pollution from industrial sources are imposed by a variety of methods, including by ambientand emissions standards. The Polluter Pays Law, 2008, increased fines and introduced administrative financialsanctions in various environmental laws.
In 2020, the Clean Coast Index of the level of cleanliness of open and undeclared beaches in Israel showsthat 68.18% of the beaches were rated “clean” or “very clean” at least 70% of the time. The improvements inthe cleanliness level of Israel’s unauthorized beaches (i.e., beaches without lifeguard services) may be attributedto, among other causes, the enactment of the Plastic Bag Law, which prohibits the free distribution of plasticbags in major supermarkets, and to the tripling of the funding allocated to local authorities for beach cleanupand public awareness activities. In 2019, the Government approved a NIS 55.2 million allocation for theMediterranean monitoring program and creation of a mechanism that will allow government ministries towork together to coordinate the data collected via various monitoring programs. This data will be publishedfor the public in order to ensure transparency and to benefit the general public
In addition, the management of the Maintenance of Cleanliness Fund recently approved a multi-yearbudget for the Clean Coast Program of the Ministry of Environmental Protection in an unprecedented amountof NIS 44 million for the years 2021-2023.The Government has made lowering housing costs a central policyaim. One of the principal means to this aim is to increase the number of available housing units, especially in
D-50

areas where demand is high while availability of land is limited, as in the central part of the country. Hence theGovernment is acting to clear considerable land reserves located in central Israel, that in the past have beenutilized mainly by the military. This land is contaminated with hazardous material and some areas have beenabandoned for years. The presence of hazardous waste at these sites has lead, in many cases, to contaminationof the soil, the subsoil and the groundwater. There is therefore an urgent need to carry out a preliminaryprocess of environmental remediation in order to enable large-scale marketing of these areas for residentialbuilding. The MoEP has commissioned the Environmental Services Company, a government company, toimplement the remediation on its behalf.
Implementation of Integrated Pollution Prevention and Control (“IPPC”) is currently achieved throughlicensing under the Licensing of Businesses Law (for waste and wastewater) and the Clean Air Law (for airemissions) which requires industrial plants with the potential for significant air pollution to obtain an emissionpermit. IPPC implementation is underway in major industrial areas and will be gradually implemented atfacilities applying for air emission permits with respect to the sectors designated in the Clean Air Law. Thepermit request procedure requires a facility to submit a consolidated request for a business license and an airemission permit, and the request is examined using an integrated approach based on IPPC methodology andbest available techniques. The minerals production and processing sector is subject to the permit requestprocedure, and the procedure will be implemented in all the plant-based food production and hazardous wastemanagement factories.
The Asbestos Law, which became effective in March 2011, seeks to prevent and minimize environmentaland health hazards caused by asbestos and harmful dust. The law prohibits new uses of asbestos and requiresthe gradual phase out of friable asbestos in public buildings, industrial facilities and Israel Defense Forcesvehicles and equipment to prevent the health hazards associated with exposure to this carcinogen.Subsequently, there was an extensive asbestos cleanup operation in the western Galilee region, where anasbestos cement plant had been constructed in the 1950’s and had operated until 1997. The plant and thesurrounding area, as well as several remote sites in the region, were heavily contaminated with asbestos becauseof the cement from the plant used in the construction of roads, trails, parking lots, agricultural infrastructuresand agricultural areas. In the past six years, 342 asbestos contaminated sites have been cleaned up. InApril 2017, the Maintenance of Cleanliness Fund approved a NIS 25 million budget for the second phase ofthe cleanup project, scheduled to span five years and slated to include private and public sites owned by thelocal authorities along with completion of the beach cleanup and additional sites and roads that will be laterdetermined.
The Law for the Regulation of Sanitary Extermination, which was promoted by the MoEP and cameinto effect in June 2016, is aimed at reducing harm from pesticides to people and to the environment. The lawaddresses many issues concerning pest control safety, such as the use of toxic gases.
The Freedom of Information Regulations (Public Access to Environmental Information), 2009, requiresa wide range of environmental information held by public authorities to be made accessible to the public, freeof charge. The regulations came into effect at the end of 2010. In March 2012, the Environmental ProtectionLaw (Pollutant Release and Transfer-Registering and Reporting Obligation (“PRTR”), 2012, was approvedby the Knesset and requires the industry to report the annual quantity of emissions of pollutants (includingGHG emissions) and waste transfers from 577 facilities with the most significant environmental impact. Dataon emissions released to air, water, sea and soil and on the transfer of waste and wastewater for treatment anddisposal is published by the MoEP each year, regarding the previous year. The PRTR data is also presented byGeographical Information System and BI tools. In addition to the reports submitted by large plants operatingin Israel, the MoEP also updated its inventory of emissions to air from sources that are not reported in thePRTR. Other major emissions sources in the inventory include transportation, burning of plant waste (forwhich an action plan for emissions reduction has been launched) and household uses. The PRTR serves as acentral tool for identifying pollutant emission and waste transfer trends in Israel, as well as makingcomparisons with OECD countries. It continues to provide the MoEP with reliable data for decision andpolicy making while making vital environmental information accessible to the public.
Along with governmental and financial measures, the State has been convincing industries that pollutionprevention and waste reduction are cost-effective. Hundreds of Israeli companies are voluntarily adoptingenvironmental management systems, such as ISO 14000, as they recognize their importance in creatinginternational business opportunities. The Government has also taken steps to promote environmental quality
D-51

and sustainable development. In October 2011, the Government approved the proposal to prepare a nationalgreen growth strategy for the years 2012-2020. The national plan, which was presented to the Government inSeptember 2012 and is being implemented, assesses the economic potential of a transition to a green economyand recommends measures for implementation. The recommended measures relate to the following subjects:
• Removing obstacles to green growth: mapping and removing environmentally harmful subsidies anddealing with regulatory failures.
• Encouraging the environmental technologies industry: developing new industry and creating marketsfor green products and services, accelerating green innovation, developing the environmentaltechnologies industry including professional training, and increasing Israel’s competitiveness andpromotion of export.
• Promoting employment in sectors that promote environmental sustainability.
• Transitioning to sustainable industry: promoting clean production, implementing efficiency surveys inproduction, energy and water processes and, in environmental industrial design for small and mediumbusinesses, promoting green industrial zones, increasing use of eco-efficiency indicators andenvironmental management systems and integrating environmental legislation and licensingprocedures.
• Transitioning to a more environmentally-friendly business sector.
• Transitioning to green consumption, including a boost to green public procurement, taxation ofenvironmentally unfriendly products and anti-”greenwash” measures.
In 2014, the MoEP published a guide to the prevention of so-called “greenwashing,” the marketing ofcompanies, products, and/or services as “green” that are not actually beneficial for the environment. Amongother things, the guide outlines how and when a company can claim that its product is biodegradable, madefrom recycled material, etc. Companies that violate the rules may be sued.
In 2016, the Tel Aviv Environmental Authority in cooperation with the MoEP launched a new initiativecalled the “Urban Green Label,” is expected to result in the annual reduction of more than 1 million disposableproducts and 30 tons of organic waste. Over 80 restaurants signed on to use smart lighting, energy and waterconsumption. In December 2009, the Government decided to require its ministries to take measures to reducetheir consumption of paper, water and electricity according to set annual targets. In 2010, Israel’s AccountantGeneral issued instructions requiring the use of recycled construction and demolition waste in Government orministry contracts and in large-scale infrastructure bids issued by the State. Economic ministries, especiallythe Ministry of Finance and the Ministry of Economy, have taken the lead in recent years in promotinginitiatives such as tax incentives imposed on private vehicles based on their level of pollutants emissions,environmental fair disclosure standards and environmental risk management. Examples of such initiativesinclude: the Israeli Securities Authority requirement of environmental risk management and disclosure byissuers of securities (effective March 2011, public corporations must include environmental risks in theirreports to the ISA); the Bank of Israel’s Supervisor of Banks’ issuance of guidelines to banks recommendingthe incorporation of environmental risks among general banking risks; the Ministry of Finance’s Regulator ofInsurance and Capital’s requirement that environmental risks be assessed by investment bodies; and theGovernment Companies Authority’s requirement that an annual report on environmental risks be reviewed bya company’s management committee and that a periodic report on sustainability be prepared by allGovernment Companies.
In November 2020, the Bank of Israel joined the Network of central banks for Greening the FinancialSystem (NGFS). Also in November 2020, the Tel-Aviv Stock Exchange (TASE: TASE) announced the launchof a new index — TA-125 Fossil-Fuel-Free Climate Index. The index is comprised of shares included in theTA-125 index, excluding those of corporations involved in the production chain of fossil fuels, i.e. corporationsengaged in the exploration, production, transport, storage and refining of fossil fuels (gas, coal, petroleum, oilshale and their derivatives). The list of “fossil fuel corporations” will be determined by the “Clean MoneyForum” of the “Life and Environment” organization, the umbrella for Israel’s environmental organizations.The TASE has also created the TA-Cleantech Index, comprised of 12 shares of clean-tech companies. Someinstitutional investment firms have published Fossil Divestment Policies. The Israel Securities Authority isdeveloping Voluntary ESG Disclosure Standards for public companies. The Bank of Israel has sent a letter to
D-52

the banks announcing the start of a consultation process on environmental and climate risks, with regard tostability, liquidity and credit risks of the banks, among others. Also, instructions for ESG policies in investmentcommittees of institutional investment firms are under preparation.
In 2011, the MoEP and the Israel Standards Institution launched a new voluntary green building standardwhich complies with international standards and considers issues of energy, land use and soil, water,conservation, materials, health and wellbeing, waste, transportation and construction management. InJuly 2014, the Government reaffirmed the importance of green building by resolving to integrate greenbuilding in Israel’s construction sector. In addition, green building is a key element in achieving the nationalplan for GHG emissions reduction and energy efficiency’s goals. By 2019, more than 15,000 green buildinghousing units have been completed, and over 60% of the approved housing units in the plans will meet thestandard requirements for their construction, with a cumulative volume of approximately 200,000 units, inaddition to millions of square meters of office, commercial, educational public buildings. In 2018, the MoEPbegan to regulate the certification process of green buildings, including by establishing a legal framework forauthorizing certification organizations and publishing a register of buildings recognized as green. InAugust 2020, binding regulation were approved, requiring that starting from 2022 all new buildings are to bebuilt in accordance with the Israeli green building standard. The regulations will apply to all types of buildingsgradually. Adoption of the standard may lead to a saving of 20% to 30% in energy consumption in buildings,along with a reduction in greenhouse gas emissions.
In January 2019, the MoEP, the Ministry of Finance and the Ministry of Economy and Industry (the“MoEI”) set up a joint fund to support environmental projects in developing countries, in cooperation withthe European Bank for Reconstruction and Development (EBRD). The one-million euro fund will supportprojects that relate to water, energy and coping with climate change, mainly in Central and Eastern Europeand Central Asia.
In February 2019, the MoEP and the Ministry Economy and Industry, along with the InnovationAuthority announced funding of NIS 14 million for a new innovation lab that will focus on environmentalprotection and sustainability. The MoEP and the Innovation Authority have also published a new request forproposals for pilot facilities for testing environmental technologies. The MoEP and Innovation Authorityhave allocated NIS 10 million during this round and plan to invest a total of NIS 35 million for pilot technologyfacilities.
The MoEI and the MoEP promote the implementation of the Circular Economy approach in Israel. Thevision of the National Israeli Action Plan for Circular Economy in the Industry is to facilitate the transition ofthe Israeli industry from resource-intensive and import-dependent production into competitive production,which is based on circularity, innovation and resource efficiency. The action plan aims to facilitate thistransition by adjustment of regulation towards circularity, making relevant knowledge accessible andproviding financial support where needed. The roadmap will focus upon three industrial sectors which havethe largest potential to become circular and thus have a major effect on the environment: Construction andinfrastructure, Packaging, Chemistry and Pharma. Two cross-cutting themes embedded in the three focalsectors above are recycling and innovation.
The MoEP, MoEI and Ministry of Finance established a Resource Efficiency Center which becameoperational in March 2020. The aim of the Center is primarily to improve the environmental performance ofIsraeli industry and to increase the industry’s competitiveness. The Center carries out research, develops toolsand professional guides, organizes targeted seminars and courses and provides consulting services to theindustry on how to improve resource efficiency and implement innovative technologies and environmentalsolutions at source.
The MoEI, together with the MoEP, is promoting an Industrial Symbiosis Pilot in Israel. The aim is tofoster utilization of industrial waste, byproducts and gaseous emissions from industrial plants as raw materialat other plants. Four companies are competing in the pilot project, in different regions of the country, operatingadvanced technologies to aid the symbiosis transactions. The division of the country into four regions willgenerate significant activity throughout the country, while building expertise and providing solutions at thelocal level. The pilot project ended in March 2020, and, following its evaluation, the MoEI will work topromote a long-term national project to promote symbiosis through one or two of the companies.
D-53

BALANCE OF PAYMENTS AND FOREIGN TRADE
Balance of Payments
Israel’s balance of payments consists of: (i) the current account, which measures the trade balance(receipts and payments derived from the sale of goods and rendering of services), balance of primary incomeand balance of secondary income (current transfers) and (ii) the capital and financial accounts, which reflectborrowing by the Government and the private sector, foreign direct investment in Israel and investment byIsraeli residents abroad, as well as assets and liabilities of commercial banks.
In 2020, the shekel continued to appreciate in real terms following the trend in 2019. This continuedincrease was primarily attributable to the increase of the surplus in the current account, the increase of foreigninvestment and the depreciation of the dollar.
In recent years, services exports have been becoming a larger portion of Israel’s exports than goodsexports. In 2020, goods exports and services exports constituted 52.6% and 47.4% of all exports, respectively,compared to 69% and 31%, respectively, in 2010.
In 2020, exports increased by 0.1% while imports contracted by 8%. Exports comprised 28.3% of GDPand imports comprised 23.9% of GDP in 2020. The growth of exports despite the contraction of GDP in 2020was attributed to the increase in in business services, namely high-tech products which grew by 10.8%, and theincrease of goods by 4.4% while tourism declined sharply moderating the total growth of exports.
The decrease of imports is consistent with the negative growth of private consumption, reflecting thedecline in demand for consumer goods and the rise in the saving rate.
The increase in exports along with the sharp decline in imports led to a significant expansion of thesurplus in the current account.
Current transfers, which include assistance furnished by the United States, German reparations andpersonal and institutional remittances, increased by 1.3% in 2020 to $12.2 billion from $12.08 billion in 2019.
Israel’s net international investment position (foreign assets minus liabilities to foreigners) has been insurplus since 2006. At the end of 2020, the net international investment position stood at $189.8 billion (47%of GDP), compared to $157.5 billion in 2019 (39.9% of GDP), $136.1 billion (36.8% of GDP) in 2018,$144.4 billion (40.9% of GDP) in 2017 and, $105.5 billion (33.1% of GDP) in 2016.
Foreign currency reserves held at the Bank of Israel, in nominal USD terms, have increased significantlyover the past decade, growing from $69.8 billion at the end of 2010 to $173.2 billion at the end of 2020 and$198.3 billion as of May 2021. In 2020 the Bank of Israel purchased $21.2 billion as the Shekel appreciatedsignificantly in 2020. In terms of percent of GDP, reserves grew rapidly from approximately 29.4% of GDP in2010 (year average) to 48.3% as of May 2021.
Developments in currency reserves have been led in large part by Bank of Israel policy. Between March2008 and August 2009, the Bank of Israel conducted daily purchases of foreign currency to raise the level ofreserves. After the target level was achieved in August 2009, the Bank of Israel ended its scheduled purchasingpolicy and began a policy of intervening in the foreign exchange market on a discretionary basis in events ofunusual movements in the exchange rate that are inconsistent with underlying economic conditions, or whenconditions in the foreign exchange market are disorderly, which remains the Bank of Israel’s policy as ofJune 2021.
D-54

Table No. 15Balance of Payments(1)
(In Millions of Dollars)
2016 2017 2018 2019 2020
Current Account ReceiptsExports of goods and services . . . . . . . . . . . . . . . . . 95,664 101,792 110,219 115,502 114,139Income from abroad . . . . . . . . . . . . . . . . . . . . . . . . 11,455 13,207 15,025 14,621 12,607Current transfers. . . . . . . . . . . . . . . . . . . . . . . . . . . . 12,213 11,584 11,652 12,076 12,213
Total current account receipts . . . . . . . . . . . . . . . . . . . . 119,331 126,583 136,896 142,199 138,959Payments
Imports of goods and services . . . . . . . . . . . . . . . . . 90,248 97,600 107,817 107,347 96,512Income to foreigners . . . . . . . . . . . . . . . . . . . . . . . . 14,336 14,982 15,290 16,901 16,823Current transfers. . . . . . . . . . . . . . . . . . . . . . . . . . . . 2,973 3,722 3,844 4,195 4,982
Total current account payments . . . . . . . . . . . . . . . . . . 107,557 116,304 126,952 129,443 118,317Balances
Trade in goods and services . . . . . . . . . . . . . . . . . . . 5,416 4,192 2,402 7,156 17,627Net income. . . . . . . . . . . . . . . . . . . . . . . . . . . . . . . . -2,881 -1,774 -265 -2,280 -4,217Net current transfers . . . . . . . . . . . . . . . . . . . . . . . . 9,240 7,862 7,808 7,881 7,232
Current account balance. . . . . . . . . . . . . . . . . . . . . . . . 11,774 10,279 9,944 12,757 20,642Capital Account
Capital account balance . . . . . . . . . . . . . . . . . . . . . . 2,174 1,844 1,569 1,614 1,444Financial Account
Investments abroad by IsraelisDirect investment . . . . . . . . . . . . . . . . . . . . . . . 14,579 7,624 6,087 8,690 6,375Portfolio investment . . . . . . . . . . . . . . . . . . . . . 1,615 4,333 7,183 6,439 16,170Other investments . . . . . . . . . . . . . . . . . . . . . . 3,260 9,693 1,009 5,919 8,582Financial derivatives (net) . . . . . . . . . . . . . . . . . -553 1,354 61 -1,222 1,264Reserves assets (net) . . . . . . . . . . . . . . . . . . . . . 8,529 8,080 5,275 6,445 37,777
Total investments abroad . . . . . . . . . . . . . . . . . . . . 27,428 28,375 19,614 26,271 70,168Investments by Foreigners in Israel
Direct investment . . . . . . . . . . . . . . . . . . . . . . . 11,988 16,893 21,515 17,363 24,283Portfolio investment . . . . . . . . . . . . . . . . . . . . . 2,972 1,945 -3,091 -26 18,933Other investments . . . . . . . . . . . . . . . . . . . . . . 2,839 -3,059 604 4,019 987
Total investments in Israel . . . . . . . . . . . . . . . . . . . 17,799 15,779 19,027 21,356 44,203Net Financial Transactions
Direct investment . . . . . . . . . . . . . . . . . . . . . . . 2,590 -9,268 -15,428 -8,673 -17,909Portfolio investment . . . . . . . . . . . . . . . . . . . . . -1,357 2,387 10,274 6,465 -2,762Other investments . . . . . . . . . . . . . . . . . . . . . . 421 12,752 405 1,900 7,596Financial derivatives (net) . . . . . . . . . . . . . . . . . -553 -1,354 61 -1,222 1,264Reserves assets (net) . . . . . . . . . . . . . . . . . . . . . 8,529 8,080 5,275 6,445 37,777
Financial Transactions Balance . . . . . . . . . . . . . . . 9,630 12,596 587 4,915 25,965Statistical errors and omissions . . . . . . . . . . . . . . . . . -3,915 472 -10,926 -9,456 3,879
(1) Many of the Balance of Payments figures are based on temporary estimations and are therefore subjectto significant adjustments over time.
Source: Central Bureau of Statistics
D-55

Foreign Trade4
Exports of goods5 and services are a crucial element of Israel’s economy overall performance andcompetiveness. In 2020, Israeli exports of goods and services reached $114.0 billion and the total import ofgoods and services reached $96.6 billion, creating a trade surplus of $17.4 billion, following a trade surplus of$7.4 billion and $2.4 billion in 2019 and 2018, respectively. The annual growth rate of exports of goods andservices in 2020 stood at -1.5% after a growth rate of 5.0% and 8.2% in 2019 and 2018, respectively. Servicescontinue to represent a large share of Israel’s exports and in 2020 constituted 47.2% ($53.8 billion) of totalexports, while goods constituted 52.8% ($60.18 billion) of total exports. Exports of goods grew by 0.1% andexports of services declined by 3.0% in 2020. Imports of goods and services declined by 10.9% in 2020,following a growth of 0.5% in 2019. Imports of goods declined by 6.9% in 2020, and imports of servicesdeclined by 20.3% in 2020. The decline in Israel’s exports of goods and services is mainly a result of theeconomic effects of the COVID-19 pandemic, which negatively impacted some trade in goods, travel servicesand services derived from the sale of start-up companies’ intellectual property (“IP”).
In 2020, the United States remained Israel’s top export destination for goods, amounting to $10.3 billion.China is Israel’s second top export destination, amounting to $4.0 billion, and the United Kingdom is thethird top destination, amounting to $3.6 billion. As to trading blocs, the European Union6 remains Israel’sbiggest export market. Israeli exports of goods to the European Union declined by 13.2% in 2020. TheEuropean Union is also the primary source for imports into Israel, amounting to $21.7 billion in 2020.
The composition of Israel’s trade in goods reflects the nature of its economy. In 2020, exports of goodsconsisted primarily (88.3%) of manufactured goods sector (industrial exports), which includes the dominanthigh-tech sector, declined by 5.5% in 20207. Raw materials, investment goods, fuels and diamonds comprised75.8% of imported goods.
Trade in services continues to constitute a large part of Israel’s foreign trade. In 2020, the majority (87.0%or $47.1 billion) of Israeli exports of services was from the “Other business services” sector, which includesresearch and development, information services, telecommunication services, computer-related services andservices between related enterprises. This sector grew by 8.5% in 2020, after an increase of 11.6% and 17.7% in2019 and 2018, respectively. The decline in the growth rate of exports of “other business services” incomparison to previous years was mainly due to a decline in services derived from the sale of start-upcompanies’ IP as a result of the economic effects of the COVID-19 pandemic. The second largest sector ofIsrael’s exports of services was travel services, which declined by 65.9% in 2020 compared to 2019 and reached$2.6 billion. The decline in travel services was due to the COVID-19 pandemic, which influenced the travelindustry globally. In 2019, the United States remained Israel’s top services exports destination (41.2% of totalexports of business services), followed by the European Union (19.7% of total export of business services).“Other business services” comprised 66.7% of imported services and grew by 13.7% in 2020. Transportationservices comprised 22.3% and travel services comprised 7.2% of imported services. In 2019, the United Stateswas the largest provider of imported “Other business services” to Israel (28%), followed by the EuropeanUnion (21.7%).
4 Figures in this section are adjusted to BoP.5 Trade of goods by country statistics in this section exclude diamonds and are by country of origin. This
is due to the fact that the Israeli added value in the diamonds industry is low compared to the averageadded value in industrial goods, as well as the high volume and prices of diamonds.
6 The United Kingdom is included in Israel’s trade statistics with the European Union for the year 2020.7 Not adjusted to BoP.
D-56

Table No. 16
Exports of Goods by Major Groups(In Millions of Dollars, F.O.B.)
2016 2017 2018 2019 2020
Agriculture(1)
Seasonal crops . . . . . . . . . . . . . . . . . . . . . . . . . . . . . 501 483 472 438 355Fruits . . . . . . . . . . . . . . . . . . . . . . . . . . . . . . . . . . . 417 496 430 450 434Other . . . . . . . . . . . . . . . . . . . . . . . . . . . . . . . . . . . 232 238 243 236 242
Total . . . . . . . . . . . . . . . . . . . . . . . . . . . . . . . . . . . . . 1,151 1,217 1,145 1,125 1,031Industrial (excl. polished diamonds)
Mining and quarrying . . . . . . . . . . . . . . . . . . . . . . . 242 210 211 255 189Food, beverages and tobacco . . . . . . . . . . . . . . . . . . . 959 1,052 1,168 1,065 1,124Textiles, clothing and leather . . . . . . . . . . . . . . . . . . . 791 844 878 893 922Wood, furniture, cork, paper and printing . . . . . . . . . . 480 462 477 431 428Chemicals and refined petroleum . . . . . . . . . . . . . . . . 7,690 8,630 10,187 12,958 11,980Pharmaceutical products . . . . . . . . . . . . . . . . . . . . . . 6,906 7,515 5,840 3,135 1,858Rubber and plastics . . . . . . . . . . . . . . . . . . . . . . . . . 2,058 2,214 2,337 2,229 2,231Basic metal products . . . . . . . . . . . . . . . . . . . . . . . . . 546 627 691 589 655Metal manufacturing assembly, machinery
and equipment . . . . . . . . . . . . . . . . . . . . . . . . . . . 5,948 5,583 6,281 6,155 5,889Electronic components and computers, medical and
optical equipment . . . . . . . . . . . . . . . . . . . . . . . . . 12,878 12,038 13,458 13,083 13,585Electrical equipment . . . . . . . . . . . . . . . . . . . . . . . . . 1,095 1,157 1,157 1,126 1,170Transport equipment . . . . . . . . . . . . . . . . . . . . . . . . 2,912 3,459 2,625 2,930 2,516Jewelry . . . . . . . . . . . . . . . . . . . . . . . . . . . . . . . . . . 612 620 512 691 550Other non-metallic mineral products . . . . . . . . . . . . . . 434 456 370 366 308Miscellaneous . . . . . . . . . . . . . . . . . . . . . . . . . . . . . 128 104 155 165 128
Total . . . . . . . . . . . . . . . . . . . . . . . . . . . . . . . . . . . . . 43,758 45,231 46,347 46,070 43,535Diamonds(1) . . . . . . . . . . . . . . . . . . . . . . . . . . . . . . . . . . 15,660 14,702 14,459 11,314 5,472Diamonds (net)(2)
Polished . . . . . . . . . . . . . . . . . . . . . . . . . . . . . . . . . 4,703 4,493 4,559 3,404 3,876Rough . . . . . . . . . . . . . . . . . . . . . . . . . . . . . . . . . . 2,704 2,233 2,263 1,440 922
Total . . . . . . . . . . . . . . . . . . . . . . . . . . . . . . . . . . . . . 7,408 6,726 6,823 4,844 4,798Total(2) . . . . . . . . . . . . . . . . . . . . . . . . . . . . . . . . . . . . . 52,316 53,174 54,315 52,039 49,364Other goods(2) . . . . . . . . . . . . . . . . . . . . . . . . . . . . . . . . . 4 9 3 7 53Returned goods . . . . . . . . . . . . . . . . . . . . . . . . . . . . . . . . -132 -119 -180 -142 -111Total (net)(2)(3) . . . . . . . . . . . . . . . . . . . . . . . . . . . . . . . . 52,188 53,064 54,138 51,903 49,306
(1) Gross exports.
(2) Net exports equal total gross exports less goods returned to Israeli exporters.
(3) Excludes trade with the West Bank and Gaza.
Source: Central Bureau of Statistics.
D-57

Table No. 17
Imports of Goods by Major Groups(In Millions of Dollars, C.I.F.)(1)
2016 2017 2018 2019 2020
Consumer GoodsTransportation equipment . . . . . . . . . . . . . . . . . . . . . 2,412 1,885 2,263 2,551 2,147Furniture and electrical equipment . . . . . . . . . . . . . . . 3,158 3,235 3,333 3,871 4,327Other . . . . . . . . . . . . . . . . . . . . . . . . . . . . . . . . . . . 350 373 401 494 509
Durable goods (total) . . . . . . . . . . . . . . . . . . . . . . . . . . 5,920 5,492 5,997 6,916 6,983Food, beverages and medicines . . . . . . . . . . . . . . . . . 3,115 3,408 3,684 4,306 4,764Clothing and footwear . . . . . . . . . . . . . . . . . . . . . . . 2,088 2,220 2,390 2,465 2,140Household utensils . . . . . . . . . . . . . . . . . . . . . . . . . . 782 858 1,076 1,333 1,341Other . . . . . . . . . . . . . . . . . . . . . . . . . . . . . . . . . . . 1,429 1,687 1,569 2,161 2,720
Non-durable goods (total) . . . . . . . . . . . . . . . . . . . . . . . 7,415 8,172 8,719 10,265 10,966Total . . . . . . . . . . . . . . . . . . . . . . . . . . . . . . . . . . . . . 13,335 13,664 14,716 17,181 17,950
Agriculture . . . . . . . . . . . . . . . . . . . . . . . . . . . . . . . 790 922 978 1,227 1,285Raw food products . . . . . . . . . . . . . . . . . . . . . . . . . . 2,398 2,478 2,640 2,698 2,798Fabrics . . . . . . . . . . . . . . . . . . . . . . . . . . . . . . . . . . 587 606 628 639 659Wood and related products . . . . . . . . . . . . . . . . . . . . 553 599 642 569 601Chemical products . . . . . . . . . . . . . . . . . . . . . . . . . . 4,300 4,857 5,191 4,955 5,284Rubber and plastics . . . . . . . . . . . . . . . . . . . . . . . . . 2,299 2,544 2,755 2,535 2,474Paper-making material . . . . . . . . . . . . . . . . . . . . . . . 709 737 845 731 667Iron and steel . . . . . . . . . . . . . . . . . . . . . . . . . . . . . . 1,933 2,198 2,835 2,703 2,509Precious metals . . . . . . . . . . . . . . . . . . . . . . . . . . . . 161 178 201 147 145Non-ferrous metals . . . . . . . . . . . . . . . . . . . . . . . . . . 684 783 859 825 838Machines and electronics . . . . . . . . . . . . . . . . . . . . . 10,730 10,197 10,938 11,952 11,349Other industries . . . . . . . . . . . . . . . . . . . . . . . . . . . . 2,061 2,390 2,482 2,473 2,775Fuels . . . . . . . . . . . . . . . . . . . . . . . . . . . . . . . . . . . 5,843 7,602 9,838 9,174 5,527
Total . . . . . . . . . . . . . . . . . . . . . . . . . . . . . . . . . . . . . 33,048 36,090 40,832 40,627 36,912Diamonds (net) . . . . . . . . . . . . . . . . . . . . . . . . . . . . . . . . 6,532 5,755 5,684 3,845 3,371Investment Goods
Machinery and equipment . . . . . . . . . . . . . . . . . . . . 7,491 8,413 8,636 6,905 7,168Transport vehicles(2) . . . . . . . . . . . . . . . . . . . . . . . . . 4,188 3,674 3,985 4,339 3,615Ships and aircraft . . . . . . . . . . . . . . . . . . . . . . . . . . . 539 501 1,522 2,741 348
Total . . . . . . . . . . . . . . . . . . . . . . . . . . . . . . . . . . . . . 12,21 12,586 14,143 13,986 11,131Other goods . . . . . . . . . . . . . . . . . . . . . . . . . . . . . . . . . . 60 63 390 212 246Returned goods . . . . . . . . . . . . . . . . . . . . . . . . . . . . . . . . -129 -152 -122 -149 -124Total (net)(3)(4) . . . . . . . . . . . . . . . . . . . . . . . . . . . . . . . . 65,065 68,008 75,645 75,703 69,484
(1) Due to changes in classification, there are updates to figures reported in previous years.(2) Excluding ships and aircraft.(3) Net imports equal total gross imports less goods returned to the suppliers.(4) Excludes trade with the West Bank and Gaza.
Source: Central Bureau of Statistics.
D-58

Table No. 18
Exports of Goods by Region(In Millions of Dollars, F.O.B., Except Percentages)(1)
2016 2017 2018 2019 2020
Americas . . . . . . . . . . 19,988 33.0% 19,639 32.1% 19,658 31.7% 18,762 32.1% 15,682 31.3%USA . . . . . . . . . . . 17,589 29.0% 17,046 27.9% 16,696 27.0% 15,964 27.3% 13,078 26.1%Other America . . . . 2,399 4.0% 2,593 4.2% 2,962 4.8% 2,798 4.8% 2,604 5.2%
Europe . . . . . . . . . . . . 19,481 32.1% 22,277 36.4% 21,923 35.4% 21,282 36.4% 17,559 35.1%EU . . . . . . . . . . . . . 15,759 26.0% 18,307 29.9% 17,570 28.4% 17,329 29.6% 14,672 29.3%EFTA . . . . . . . . . . 1,524 2.5% 1,513 2.5% 1,411 2.3% 1,145 2.0% 505 1%Other Europe . . . . 2,198 3.6% 2,458 4.0% 2,942 4.7% 2,808 4.8% 2,382 4.8%
Asia . . . . . . . . . . . . . . 15,612 25.8% 13,583 22.2% 15,332 24.7% 13,470 23.0% 11,324 22.6%Africa . . . . . . . . . . . . 885 1.5% 915 1.5% 847 1.4% 731 1.2% 580 1.2%Oceania . . . . . . . . . . . 568 0.9% 642 1.0% 600 1.0% 590 1.0% 539 1.1%Other . . . . . . . . . . . . . 4,039 6.7% 4,096 6.7% 3,591 5.8% 3,673 6.3% 4,355 8.7%Total . . . . . . . . . . . . . 60,573 100.0% 61,152 100.0% 61,951 100.0% 58,508 100.0% 50,039 100%
(1) Gross exports (including diamonds returned by importers abroad and other returns to exporters in Israel).
Source: Central Bureau of Statistics.
Table No. 19
Imports of Goods by Region(In Millions of Dollars, C.I.F., Except Percentages)(1)
2016 2017 2018 2019 2020
Americas . . . . . . . 9,417 14.3% 9,437 13.6% 11,028 14.4% 13,110 17.1% 9,855 14.1%USA . . . . . . . . 8,076 12.3% 8,085 11.7% 9,755 12.7% 11,745 15.3% 8,620 12.3%Other America . 1,341 2.0% 1,352 2.0% 1,273 1.7% 1,365 1.8% 1,235 1.8%
Europe . . . . . . . . . 35,515 54.0% 38,498 55.7% 43,567 56.9% 37,492 48.9% 36,737 52.5%EU . . . . . . . . . 27,363 41.6% 28,472 41.2% 31,625 41.3% 27,678 36.1% 27,133 38.8%EFTA . . . . . . . 4,468 6.8% 5,748 8.3% 8,125 10.6% 5,848 7.6% 5,465 7.8%Other Europe . . 3,685 5.6% 4,278 6.2% 3,817 5.0% 3,967 5.2% 4,138 5.9%
Asia . . . . . . . . . . 17,322 26.3% 17,814 25.8% 18,784 24.5% 17,296 22.6% 17,661 25.1%Africa . . . . . . . . . 239 0.4% 255 0.4% 300 0.4% 350 0.5% 323 0.5%Oceania . . . . . . . . 198 0.3% 163 0.2% 191 0.2% 259 0.3% 201 0.3%Other . . . . . . . . . 3,114 4.7% 2,979 4.3% 2,742 3.6% 8,168 10.6% 5,230 7.5%Total . . . . . . . . . . 65,805 100.0% 69,145 100.0% 76,611 100.0% 76,675 100.0% 70,007 100.0%
(1) Gross imports (including un-worked diamonds returned to suppliers abroad and other returns toexporters abroad).
Source: Central Bureau of Statistics.
D-59

Table No. 20
Merchandise Trade Indices(Base Year: 2015 = 100)
2016 2017 2018 2019 2020
Indices of Physical VolumeExports . . . . . . . . . . . . . . . . . . . . . . . . . . . . . . . . . . . . . . . 97.3 94.9 94.2 89.9 82.2Imports . . . . . . . . . . . . . . . . . . . . . . . . . . . . . . . . . . . . . . . . . . . . . 110.1 108.9 112.4 115.0 112.1
Indices of PricesExports(1)(2) . . . . . . . . . . . . . . . . . . . . . . . . . . . . . . . . . . . . . 97.4 99.0 102.8 102.5 98.7Imports(1)(2) . . . . . . . . . . . . . . . . . . . . . . . . . . . . . . . . . . . . . . . . . 96.0 101.0 107.8 103.5 99.7
Terms of Trade . . . . . . . . . . . . . . . . . . . . . . . . . . . . . . . . . . . . . . . . . 101.5 98.0 95.4 99.0 99.0
(1) Gross imports (including un-worked diamonds returned to suppliers abroad and other returns toexporters abroad).
(2) Excluding ships and aircraft.
Sources: Ministry of Finance (based on data from Central Bureau of Statistics).
AML/CFT/CPF Regime
Israel is committed to maintaining its robust Anti-Money Laundering and Counter-Terrorist Financing(AML/CFT) framework and has strong AML/CFT strategies in place. In 2002 Israel established the IsraelMoney Laundering and Terror Financing Prohibition Authority (IMPA), which is responsible for combattingmoney laundering and terror financing in Israel.
The Government has set the targeting of illicit proceeds as a primary objective in combatting serious andorganized crime. Stemming from this, Government Decision no. 4618 (2006) was issued which requires allrelevant agencies to co-operate and implement their activities on the basis of work plans adopted at the highestlevel by the Executive Steering Committee (the “ESC”). The ESC, headed by the Attorney General andcomprised of the most senior representatives of law enforcement agencies (the Israel National Police, IsraelTax Authority, Israel Securities Authority, and IMPA) leads the country’s integrated AML/CFT strategy andpolicy to counter serious and organized crime, including the targeting of its proceeds. The ESC approvesannual and multi-year work plans for all relevant agencies, defines priorities for implementation, and reportson progress to the designated committee of ministers. The ESC focuses on six principles: setting goals andcoordinating policies; sharing of information and expertise between law enforcement authorities; proactivelyinitiating activities (including proactive intelligence development, and the improvement of technological meansto so do); integrating activities through operational co-operation; systematically making efforts to fight ML innew ways, combining available tools and sanctions (i.e. civil and supervisory procedures); developing bestpractices, removing barriers (e.g. initiation of legislation amendments); and improving operations through thesharing of operational experience and lessons learnt.
The Inter Agency Implementation Committee (IC) is the main operational body that implements theESC’s policies and directives. The IC is comprised of Israel’s key AML/CFT agencies, including lawenforcement authorities (the Israel Police, Tax Authority and Securities Authority), the financial intelligenceunit (IMPA), Israeli Prison Service, Bank of Israel, Ministry of Economy and Industry and Ministry of Justice.
The National Bureau for Counter Terror Financing (NBCTF), housed within the Ministry of Defense(MoD), is responsible for countering terror financing and is a combined inter-ministerial effort against terroristfinancing, and is responsible for outlining the national enforcement policy, conducting CFT risk assessment,and coordinating national CFT strategies and enforcement policies. The NBCTF also works to counterproliferation financing (“CPF”) and the Sanctions Bureau under the Ministry of Finance (MoF) co-ordinatesthe work regarding CPF strategy and CPF sanctions.
D-60

AML/CFT Legislation
Anti-Money Laundering Law
The Prohibition on Money Laundering Law (the “PMLL”) enacted in 2000 is the main act of legislationfor Israel’s anti-money laundering (“AML”) regime. The PMLL covers four key elements of the AML regime:
(1) Prevention: The PMLL is the primary legal instrument setting out the preventive measures (includingcustomer due diligence, reporting, and record-keeping) which apply to the covered financial anddesignated non-financial business and professions (“DNFBP”) sectors in Israel. It empowersindividual financial and DNFBP supervisors to enact rules for operational requirements of thesepreventive measures. The range of instruments includes regulations, orders, directives and circulars.In addition, where applicable, Israel relies on general sectoral-specific supervisory power toimplement AML/counter financing of terrorism (“CFT”) preventive measures. The regime coversall financial institutions required by the Financial Action Task Force (the “FATF”) and includesbanks, portfolio managers, insurance companies and agents, members of the TASE, provident fundsand companies managing provident funds, providers of currency services, trading platforms and thepostal bank. For DNFBPs, lawyers and accountants are subject to licensing requirements and havesome AML/CFT obligations, but are not required to report suspicious transactions. Real estateagents are subject to a market entry licensing regime. Dealers in precious stones are covered underIsrael’s AML/CFT system.
(2) Criminal Sanctions: The PMLL establishes money laundering as a criminal offence, punishable byimprisonment and large fines. It also establishes a list of money laundering associated predicateoffences.
(3) Confiscation: The PMLL establishes both criminal and civil confiscation mechanism. Confiscationmay be in addition to criminal sanctions.
(4) IMPA: The PMLL established IMPA as Israel’s financial intelligence unit. In its main capacity,IMPA is the national center for the receipt and analysis of unusual and currency transaction reportsand disseminates the results of such analysis to various authorities, as prescribed by the PMLL.
Since the enactment of the PMLL, Israel has enacted legislative amendments to meet the FATFinternational standards and any updates thereto. As of 2015, AML/CFT obligations apply to dealers inprecious stones (which includes a reporting obligation to IMPA) and to lawyers and accountants for theiractivity in providing business services to their customers. In 2016 tax offences were added to the list of moneylaundering predicate offences. Several new laws and orders were enacted regarding the regulation andsupervision of financial institutions and DNFBPs, such as 2016 Law for the Supervision of Financial ServicesBusinesses. Israel introduced a new Counter Terrorism Law which came into force in 2016. In 2017, numerousamendments were made to the PMLL including changes to the definitions of money laundering offences,establishing IMPA’s authority to disseminate information to additional law enforcement agencies (“LEAs”)and to supervisors, lowering the threshold for cross border reporting, and amending the definition of beneficialownership to align it with the FATF standards. The Reduction of Use of Cash Law came into force in 2019. Inthe first quarter of 2021, Israel adopted the Money Laundering Order for Financial Asset Service Providerswhich applies to virtual assets and virtual asset service providers, implementing the amendments to the FATF’sRecommendation 15. The Order will come into force in November 2021.
Counter Terrorism Law
Israel’s new Counter Terrorism Law was enacted in 2016 with the purpose of providing governmentagencies with adequate criminal law and administrative law tools in order to counter the terror threats thatIsrael faces. The new law ensures that Israel is on par with other countries leading the fight against terror andterror financing and that it meets the international standards set in this regard.
Reporting Suspicious Activity
The AML/CFT sector-specific Orders impose certain obligations on the financial institutions andDNFBPs. These Orders require obliged entities to report to IMPA two types of reports: (1) reports on
D-61

transactions above a certain threshold and of a certain type (referred to as currency transaction reports), and(2) reports on unusual activities (referred to as unusual activity reports). In 2020, IMPA received 1,970,029currency transaction reports and 112,241 unusual activity reports. IMPA disseminated these reports to theIsrael National Police, Tax Authority, security agencies and to other financial intelligence units, all of whichhave been instrumental to Israel’s AML/CFT efforts. These have led to the successful investigation, prosecutionand conviction of complex and significant money laundering and terrorist financing cases.
International Cooperation and Evaluation
Israel has been a member of the FATF since 2018. In addition, Israel is a member of the Egmont Groupand a member of Moneyval (Council of Europe’s Committee of Experts on the Evaluation of Anti-MoneyLaundering Measures and the Financing of Terrorism), a FATF-Style Regional Body.
In 2018, Israel underwent a rigorous and comprehensive mutual evaluation of its AML/CFT regime. Thisprocess, conducted jointly by the FATF and Moneyval, included an “on-site” visit to Israel to assess theeffectiveness of the AML/CFT regime, and a discussion at the October 2018 FATF plenary in which the jointFATF/Moneyval mutual evaluation report of Israel was adopted. In December 2018, with the publication ofthe mutual evaluation report, Israel became a full member of the FATF. Following the successful outcomes ofits evaluation, Israel was placed in the FATF’s regular follow-up process. The follow-up report will be discussedby the FATF plenary in June 2022, and Israel will be able to request re-ratings for its technical compliance.
The results of Israel’s 2018 mutual evaluation determined that Israel has successfully demonstrated itsstrong commitment to combating money laundering and terrorist financing. The report found that Israel hasachieved a high level of effectiveness for Immediate Outcome (IO) 6 (use of financial intelligence), IO.8(confiscation), and IO.9 (TF investigations and prosecutions). Israel achieved a substantial level ofeffectiveness for IO.1 (assessment of risk, coordination and policy setting), IO.2 (international cooperation),IO.5 (legal persons and arrangements), IO.7 (ML investigations and prosecutions), and IO.10 (TF preventivemeasures and financial sanctions).
The report acknowledged that Israel achieves good results in identifying and responding to the risks itfaces. It further established that Israel has a robust and effective AML/CFT regime. In particular, high resultswere achieved in the areas of ML/TF risk assessment and risk understanding; investigation and prosecutionof ML and TF, including the use of financial intelligence; targeted financial sanctions related to terroristfinancing; prevention of the misuse of legal structures; and domestic and international cooperation. Thereport notes that significant improvements are still needed to strengthen supervision and implementation ofpreventive measures. Additionally, the report found that with regards to technical compliance, Israel’s legalframework is particularly strong, with only some areas in need of significant improvement such as measuresrelated to wire transfers, internal controls and financial institutions’ foreign branches and subsidiaries, and thefull range of preventive measures and supervision for several DNFBPs.
The report further determined that Israel has strong and comprehensive national mechanisms tocoordinate the development and implementation of AML/CFT policies and activities. All relevant nationalagencies cooperate, exchange information and conduct joint investigations. Emblematic of this sharedresponsibility is the establishment of an Intelligence Fusion Center, a joint intelligence body comprised of theIsrael National Police, IMPA and the Israel Tax Authority whose purpose is to facilitate collaboration betweenagencies to produce integrated and high quality intelligence and make recommendations regarding whichcases should be prioritized.
The report also found that the respective licensing and supervising authorities of financial institutionsare responsible for AML/CFT compliance as a matter of prudential supervision. Licensing procedures in thefinancial market are broadly in line with the relevant EU legislation and FATF recommendations, as are thearrangements for AML supervision for banking corporations, portfolio managers, insurers, provident funds,currency service providers, the postal bank and stock exchange members.
The mutual evaluation report included the following key findings:
• Israel has strong, national AML/CFT co-ordination and includes all relevant competent authorities.
D-62

• Israel has demonstrated its ability to identify, investigate and disrupt terrorist financing activity at anearly stage using a wide range of effective instruments and mechanisms, as well as effectivelyprosecuting, and convicting those involved.
• Israel’s highly effective use of financial intelligence largely contributes to the prosecution andinvestigation of all types of ML case and the quality of IMPA’s financial intelligence and analysiseffectively supports the operational needs of law enforcement agencies.
• Israeli authorities, including the financial intelligence unit and law enforcement, are successfully co-operating and using financial intelligence to pursue money laundering and terrorist financinginvestigations and prosecutions.
• Authorities co-operate well with international counterparts and Israel actively makes and responds torequests for international cooperation.
• Israel sets out confiscation of criminal proceeds and instrumentalities as a high-level priority and apolicy objective and its results are in line with the country’s ML risk profile.
• Financial institutions and their supervisors have a good understanding of the money laundering andterrorist financing risks they face.
• Israel has developed an AML/CFT system that is sound and effective in many areas, and achieves goodresults in tackling money laundering and terrorist financing. The country has also achieved good resultsin understanding the risks it is exposed to, investigating and prosecuting money laundering and terroristfinancing, including through the effective use of financial intelligence, depriving criminals of theproceeds of crime, and depriving terrorists and terrorist organizations of assets and instrumentalities.
Foreign Investment
The volume of foreign direct investment in Israel totaled approximately $24.3 billion in 2020, comparedto $17.4 billion in 2019. From 2016 to 2020, the total volume of net foreign direct investment in Israel wasapproximately $48.7 billion. The volume of corresponding overseas direct investments by Israelis totaledapproximately $6.4 billion in 2020, compared to approximately $8.7 billion in 2019.
Table No. 21
Nonresident Investment in Israel and Resident Investment Abroad(Net Transactions in Millions of USD)
2016 2017 2018 2019 2020
Nonresident Investment . . . . . . . . . . . . . . . . . . . . . . . . . 17,802 15,780 19,024 21,357 44,203By investment typeDirect Investment . . . . . . . . . . . . . . . . . . . . . . . . . . . . . 11,988 16,893 21,515 17,363 24,283Portfolio Investment . . . . . . . . . . . . . . . . . . . . . . . . . . . 2,972 1,945 -3,095 -26 18,932Other Investment . . . . . . . . . . . . . . . . . . . . . . . . . . . . . 2,842 -3,059 605 4,020 987Resident Investment abroad . . . . . . . . . . . . . . . . . . . . . . 27,428 28,375 19,615 26,270 70,167By investment typeDirect Investment . . . . . . . . . . . . . . . . . . . . . . . . . . . . . 14,579 7,624 6,087 8,690 6,375Portfolio Investment . . . . . . . . . . . . . . . . . . . . . . . . . . . 1,615 4,332 7,183 6,439 16,170Other Investment . . . . . . . . . . . . . . . . . . . . . . . . . . . . . 3,259 9,693 1,009 5,919 8,582Reserve Assets . . . . . . . . . . . . . . . . . . . . . . . . . . . . . . . 8,529 8,080 5,275 6,445 37,776Financial Derivatives . . . . . . . . . . . . . . . . . . . . . . . . . . -553 -1,354 61 -1,222 1,264Net financial account . . . . . . . . . . . . . . . . . . . . . . . . . . . -9,626 -12,596 -591 -4,913 -25,965
Source: Central Bureau of Statistics and Bank of Israel.
D-63

Foreign Exchange Controls and International Reserves
In recent years, net external (debt instrument) assets (external assets minus external debt) have increaseddramatically, reaching a record level of $202.4 billion at the end of 2020. Foreign currency reserves grew from$70.9 billion at the end of 2010 to $173.3 billion at the end of 2020.
All activities and transactions in foreign currency between resident individuals, businesses andnonresidents have been permitted since January 2003.
The Bank of Israel and the Ministry of Finance took several measures in 2011, and again in 2017, toassist in facilitating the achievement of monetary and foreign exchange policy goals, which include increasingtransparency and investor confidence, improving analytical abilities with respect to transactions in the foreignexchange market, and reducing short-term investments by foreign investors.
Reporting requirements established by the Bank of Israel apply to local banking entities (regardless oftransaction volume), as well as financial intermediaries (including portfolio managers, TASE members, andcertain foreign banks) and foreign residents that carried out a daily average of at least $15 million in Shekel-denominated intraday transactions in foreign exchange swaps and forward contracts, interest rate swaps, andinflation swaps in the prior twelve months. The reporting requirements include a daily report on the details ofevery conversion transaction between Israeli currency and foreign currency and every transaction involvingIsraeli currency in foreign currency, index, and interest rate derivatives to be submitted not later than onetrading day after the trade was executed, as well as a monthly report of the inventory of such open trades,which is to be submitted no later than one trading day after the end of each month being reported.
Table No. 22
External Assets and Liabilities (Debt Instruments)(End-year Balances in Millions of USD)
2016 2017 2018 2019 2020
External DebtPublic sector . . . . . . . . . . . . . . . . . . . . . . . . . . 27,692 31,921 36,539 39,356 62,233Private sector . . . . . . . . . . . . . . . . . . . . . . . . . . 44,945 44,305 44,895 49,998 51,567Banking system . . . . . . . . . . . . . . . . . . . . . . . . 14,490 13,856 12,872 13,846 16,608
Total . . . . . . . . . . . . . . . . . . . . . . . . . . . . . . . . . . 87,127 90,082 94,306 103,200 130,408External Assets
Public sector . . . . . . . . . . . . . . . . . . . . . . . . . . 101,415 115,691 118,023 128,816 176,144Private sector . . . . . . . . . . . . . . . . . . . . . . . . . . 89,714 102,269 98,938 104,925 116,472Banking system . . . . . . . . . . . . . . . . . . . . . . . . 30,146 36,285 33,705 39,716 40,248
Total . . . . . . . . . . . . . . . . . . . . . . . . . . . . . . . . . . 221,275 254,245 250,666 273,457 332,864Net External Debt . . . . . . . . . . . . . . . . . . . . . . . . . . -134,148 -164,163 -156,360 -170,257 -202,456
Source: Bank of Israel
Table No. 23
Foreign Currency Reserves at the Bank of Israel (Annual Average, Millions of Dollars)(1)
2016 2017 2018 2019 2020
95,777 107,567 115,398 119,548 173,297
(1) Includes the Allocation of Special Drawing Rights by the IMF to member countries and the balance ofIsrael’s reserve tranche in the IMF (both of which were excluded in previous annual reports).
Source: Bank of Israel.
D-64
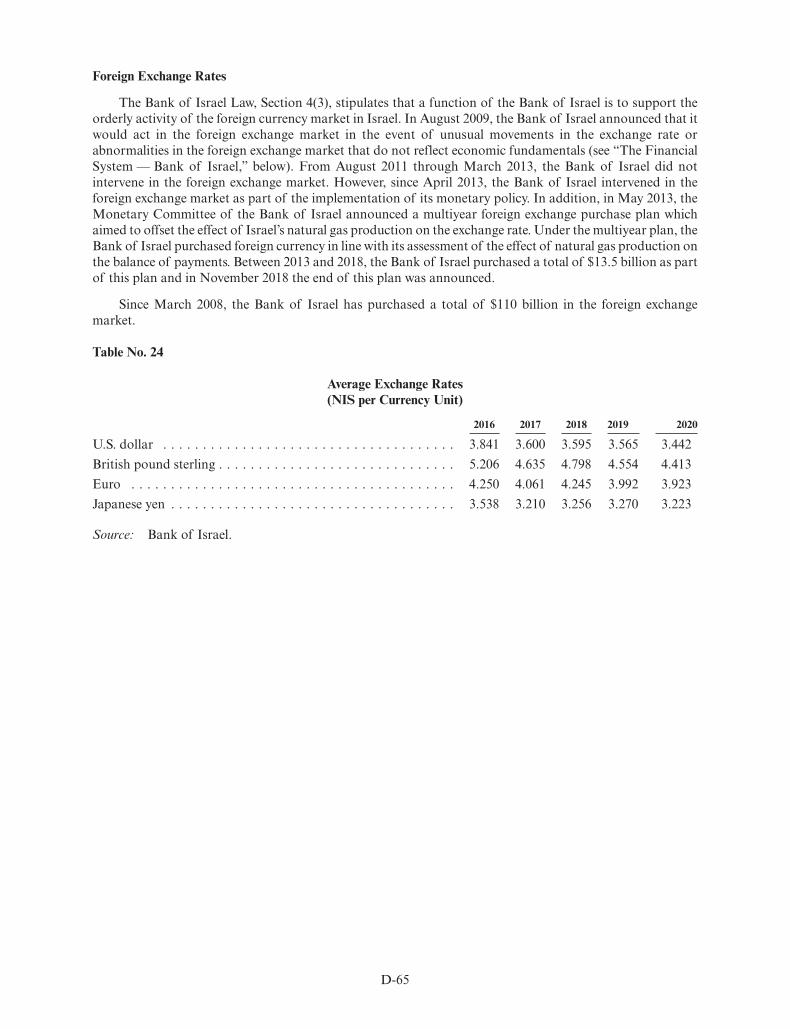
Foreign Exchange Rates
The Bank of Israel Law, Section 4(3), stipulates that a function of the Bank of Israel is to support theorderly activity of the foreign currency market in Israel. In August 2009, the Bank of Israel announced that itwould act in the foreign exchange market in the event of unusual movements in the exchange rate orabnormalities in the foreign exchange market that do not reflect economic fundamentals (see “The FinancialSystem — Bank of Israel,” below). From August 2011 through March 2013, the Bank of Israel did notintervene in the foreign exchange market. However, since April 2013, the Bank of Israel intervened in theforeign exchange market as part of the implementation of its monetary policy. In addition, in May 2013, theMonetary Committee of the Bank of Israel announced a multiyear foreign exchange purchase plan whichaimed to offset the effect of Israel’s natural gas production on the exchange rate. Under the multiyear plan, theBank of Israel purchased foreign currency in line with its assessment of the effect of natural gas production onthe balance of payments. Between 2013 and 2018, the Bank of Israel purchased a total of $13.5 billion as partof this plan and in November 2018 the end of this plan was announced.
Since March 2008, the Bank of Israel has purchased a total of $110 billion in the foreign exchangemarket.
Table No. 24
Average Exchange Rates(NIS per Currency Unit)
2016 2017 2018 2019 2020
U.S. dollar . . . . . . . . . . . . . . . . . . . . . . . . . . . . . . . . . . . . . 3.841 3.600 3.595 3.565 3.442British pound sterling . . . . . . . . . . . . . . . . . . . . . . . . . . . . . . 5.206 4.635 4.798 4.554 4.413Euro . . . . . . . . . . . . . . . . . . . . . . . . . . . . . . . . . . . . . . . . . 4.250 4.061 4.245 3.992 3.923Japanese yen . . . . . . . . . . . . . . . . . . . . . . . . . . . . . . . . . . . . 3.538 3.210 3.256 3.270 3.223
Source: Bank of Israel.
D-65

THE FINANCIAL SYSTEM
Bank of Israel
The Bank of Israel, established in 1954, is the country’s central bank and functions independently of theGovernment. It is responsible for formulating and implementing Israel’s monetary policy. The Bank of Israelalso manages foreign exchange reserves, supports the orderly activity of the foreign currency market in Israel,regulates the Israeli payment and clearing systems, supervises and regulates Israel’s banking system, and issuesbank notes and coins. The Governor of the Bank of Israel, who is appointed by the President of the State afterreceiving the recommendation of the Government, acts as an economic advisor to the Government. Thecurrent Governor of the Bank of Israel is Professor Amir Yaron, appointed in December 2018, after havingserved in the United States as a Professor of Finance at The Wharton School, University of Pennsylvania.
According to the Bank of Israel Law, which came into effect on June 1, 2010, the central objective of theBank of Israel is to maintain price stability. The range of price stability is determined by the Government, inconsultation with the Governor of the Bank of Israel. Since 2003, the Government’s target range for inflationhas been 1% – 3% per annum. Additional objectives of the Bank of Israel are to support the stability andorderly activity of the Israeli financial system and to support other objectives of the Government’s economicpolicy, especially growth, employment and reducing social gaps, provided that the support does not prejudicethe attainment of price stability over the course of time.
The Bank of Israel is autonomous in its actions, including determining its policy tools and their uses. Toattain its objectives and discharge its functions, the Bank of Israel may: issue its own securities; perform, onthe stock exchange or in another regulated market or off-market, an action or transaction of any kind that iscustomary in the capital, money and foreign exchange markets, including in the derivatives market, all ofwhich apply to securities, currency, gold or any other asset or instrument as are customary in such markets(provided the purchase or sale of Government debentures whose maturity date exceeds thirteen months fromthe purchase or sale date, as the case may be, with the exception of repurchase transactions in such debentures,shall be executed in consultation with the Minister of Finance and in such manner that does not materiallyprejudice the ability to raise local debt to finance the Government’s activity); receive deposits from bankingcorporations; grant credit to banking corporations; under exceptional circumstances, grant credit to financialentities that are not banking corporations; and take any other action the Bank of Israel deems necessary.
As stipulated in the Bank of Israel Law, the Bank of Israel is not allowed to finance budget deficits or tolend money to the Government to finance its expenditures, including via direct purchase of Governmentdebentures at issuance, except for temporary advances to bridge a gap in the Government’s cash flow inexecuting its budget (provided that the outstanding amount of such temporary advances at any time does notexceed NIS 10 billion and will not be extended for more than 150 days per year). The amount of suchpermissible temporary advances is updated on January 1 of each year, based on year-over-year changes in theCPI.
The Bank of Israel is the sole banker of the Government in its banking activity in Israeli currency. TheGovernment may, however, obtain certain services (as agreed in a memorandum of understanding datedMarch 9, 2010 between the Government and the Bank of Israel) from others, provided this is done only tomanage the Government’s debt and fiscal activity. The Bank of Israel is subject to internal limitations on theamount of investments it may make in a single country or financial institution. The majority of the Bank ofIsrael’s reserves are held in debt securities issued by foreign sovereign issuers.
As of October 2011, monetary policy and decisions on actions required to achieve the Bank of Israel’sobjectives are determined by the Bank of Israel Monetary Committee as mandated by the Bank of Israel Law.The Monetary Committee is composed of three members who represent the Bank of Israel (the Governor ofthe Bank of Israel, as chairperson, the Deputy Governor, and a member of the Bank of Israel staff who isappointed by the Governor), and three members who represent the public and are appointed by theGovernment.
The Supervisory Council, whose duties are to supervise the orderly and efficient management of theBank of Israel, was also appointed in late 2011. The Supervisory Council is composed of the Governor, the
D-66
Deputy Governor and five members appointed by the Government as representatives of the public. TheGovernment also appoints one of the public representatives as the chairperson of the council.
Monetary Policy
Monetary Framework. From the establishment of the State of Israel in 1948 until the end of 1991, themonetary framework in Israel was based on the exchange rate, with interest rate policy and other monetaryinstruments, including foreign exchange control, used to support the exchange rate regime. Following a numberof years of volatile foreign exchange flows, at the end of 1991, the Bank of Israel and the Ministry of Financebegan publicly announcing annual inflation targets, with the intention of reducing inflation gradually fromthe 15% – 20% range that had prevailed since the Economic Stabilization Program was introduced in 1985 tothe low single-digit levels typical in developed countries. At that time, Israel was one of the first emergingmarket economies to adopt the inflation-targeting approach to monetary policy as a tool in reducing inflation.Initially, strict inflation targeting was compromised by retention of an upward sloping exchange rate targetzone but, when inflation significantly exceeded its target in 1994, the Bank of Israel implemented morerestrictive monetary measures to prevent inflation from reverting to its pre-1992 levels. The Bank of Israel’stight monetary policy since 1994 and the effective abandonment of exchange rate management in 1997 werethe key factors in attaining the current stable inflation environment in Israel. Between 1998 and 2003, theinflation target range was brought down gradually and has been set at the current range of 1% – 3% since2003. From 2003 until 2008, actual inflation averaged 1.5%, toward the middle of the target range, withconsiderable year-to-year variation due primarily to short-term exchange rate pass-through effects and foreignprice shocks, especially in the food and energy sectors.
Since 2008, monetary policy has been conducted against the backdrop of the global financial crisis whichbegan in the summer of 2007 and worsened during 2008. Prior to September 2008, domestic economic activitywas robust, although concerns over the worsening financial situation abroad, mainly in the United States, ledto expectations of a recession. The Bank of Israel preemptively reduced the interest rate at the beginning of2008 but, as expectations for deterioration of the Israeli economy did not materialize and inflationary pressuresincreased, during the third quarter of 2008, the Bank of Israel raised the monetary interest rate back to itsprevious level of 4.25%. In addition, in view of sharp local currency appreciation due in large part to therepatriation of foreign investments by Israelis, in March 2008, the Bank of Israel began to implement a plan toincrease its foreign exchange reserves through direct purchases in the foreign exchange market. Starting inSeptember 2008, in view of the escalating global crisis and growing signs of a major downturn in real activity,all of the considerations employed in interest rate decisions supported sharp reductions in the rate, which wascut to 2.5% at the end of 2008, followed by further cuts to 0.5% in April of 2009. In retrospect, the acute phaseof the effects of the global financial crisis on the real economy in Israel lasted only two quarters, during thefourth quarter of 2008 and the first quarter of 2009, when real GDP growth was close to zero, but this was notknown in real time. Only toward the end of 2009 did concern of continued severe recession abate. Key trendssince 2009, including the impact of COVID-19, are as follows:
• Steady and significant improvement in key labor market indicators, including higher labor forceparticipation rates and lower unemployment, significantly stronger than in most other OECDcountries. In 2019, real wages (in CPI terms) increased by 2% and nominal wages increased by 2.8%. In2020 the COVID-19 pandemic caused massive disruptions in the labor market. The unemploymentrate rose from 3.2% in February 2020 to a high of 5.4% in August 2020, then declined slightly, andstood at 4.8% as of the end of 2020. As of May 2021 the unemployment rate was 5.1%. Anothermeasure of the unemployment rate that also includes workers furloughed due to COVID-19 andworkers who could not re-enter the labor market due to COVID-19 rose from 3.2% in February 2020 to35% in mid-April 2020. It decreased throughout the remainder of the year, and stood at 12.9% as ofthe end of 2020. As of May 2021 it was 9.8%.
• A continued increase in real output growth real output growth relative to most other OECD countries.Output dropped by 2.6% in 2020 due to COVID-19, a much smaller drop than in most OECDcountries.
• A sharp increase in housing prices, in part due to a shortage of apartments relative to the rate ofincrease of new families and to the low level of returns on financial investments during the 2008
D-67

financial crisis and thereafter. Between December 2007 and December 2020, home prices increased byapproximately 138% and by 104% in real terms (adjusted for the CPI). In 2020 housing prices increasedby 4.2%.
• Continuous declines in the Government debt-to-GDP ratio until 2017, and more expansionary fiscalpolicies in the areas of healthcare and education since 2016, reflecting the Government’s response tosocial needs. The public debt-to-GDP ratio rose slightly in 2018, but declined again and reached 60% in2019. In 2020, the Government responded to the pandemic with economic rescue plans, which increasedunemployment and other transfer payments and supported business. This expenditure, along with thereduction in tax revenues due to the reduced economic activity in 2020, caused the public debt-to-GDPratio to rise to 72.4%.
• A current account surplus in recent years. The surplus was 3.5% of national income in 2019. Thisincreased to 4.9% of national income in 2020.
• A trend of local currency appreciation (in terms of the nominal effective exchange rate), with temporaryepisodes of depreciation in 2012 and 2014 appears to stabilize during 2018. The nominal effectiveexchange rate appreciated by 8.1% in 2019, and by 4.7% in 2020, after depreciating by 2.6% in 2018.
• Since the social protests in 2011, consumer awareness has increased in Israel, and with it the desire tolower the cost of living. In parallel with the measures adopted by the Government in recent years toachieve this goal, there has been a change in consumer behavior patterns in Israel reflected by exposureto online purchasing through domestic and international Internet sites. This has served to increasecompetition in the domestic tradable goods market, to lower prices, and to reduce markups.
Developments in inflation and real output growth may be grouped into five -periods: mid-2009 to mid-2011, a period of strong real GDP growth along with relatively high inflation; mid-2011 through mid-2013, aperiod of slower GDP growth — approximately 2% — and inflation within the target range; mid-2013 to2015, a period of slower GDP growth of approximately 3%, reflecting accelerated growth in privateconsumption alongside stagnant investment and a slowdown in exports, with sharply declining inflation; 2016to 2019, a period in which GDP growth stabilized around 3.5% (near the long term rate of growth), and theinflation rate was below the lower bound of the inflation target most of the time; and 2020, in which theCOVID-19 global pandemic broke out, was characterized by a 2.6% drop in real output and an 0.7% declinein inflation.
For the mid-2009 to mid-2011 sub-period, real GDP growth averaged 5% and inflation increased to over4% in 2011, due primarily to increases in global energy and food prices. The Bank of Israel followed theconventional approach in reacting to such exogenous supply side shocks by increasing the key policy rate onlywhen there were indications that the initial shock to the price level may lead to inflationary dynamics, such asincreases in measures of expected future inflation and increased wage demands. In light of the resumption ofstrong real growth by mid-2009, the Bank of Israel increased its rate gradually from the exceptionally low levelof 0.5% to 1% by December 2009, to 2% by December 2010, and to a peak of 3.25% in mid-2011 in reactionto increased inflation. Various measures of expected inflation indicated that these rates remained firmlyanchored within the inflation target range. Despite a widening gap between short-term interest rates in Israeland those in the major financial centers, the shekel did not appreciate during 2011, perhaps due to theincreasingly uncertain geopolitical situation in neighboring countries and the related effect on Israel’s energycosts.
Starting in mid-2011, real GDP growth dropped sharply to 2%, impacted by the continued lack ofrecovery by Israel’s major trading partners and the prolonged Eurozone crisis, but Israel’s growth consistentlyexceeded the growth of major advanced economies. Unemployment in Israel continued its downward trend,implying a slowdown in productivity growth, similar to the productivity slowdown in the United States andsome other advanced countries. Inflation returned to the target range by the end of 2011 as energy andcommodity prices abroad stabilized. In light of the slowdowns in both inflation and growth, the Bank ofIsrael reduced its key interest rate several times beginning in September 2011 from a level of 3.25% to a level of1.75% by January 2013, and maintained a 1.75% level until mid-May of 2013.
Another key feature of the mid-2011 to mid-2013 period was the development of Israel’s natural gasfindings and the start of local production of natural gas from the Tamar reservoir in April 2013. Along with
D-68

renewed current account surpluses from the start of 2013, even prior to reductions in oil imports, the shekelbegan to strengthen in mid-2012. The Bank conducted intermittent foreign exchange intervention to partiallyoffset forces for local currency appreciation. From January through May of 2013, the effective exchange rateof the shekel appreciated by about 4.5%, raising some concern about the profitability of exports andemployment in the export sector. Accordingly, on May 13, 2013, the Bank of Israel announced a reduction ofits key policy rate to 1.5% and introduced its plan to commence a program of foreign exchange purchasesintended to offset the reduction in demand for foreign exchange resulting from the substitution of importedfuel made possible by the local gas production. Additionally, near the end of May 2013, the Bank of Israelannounced that it would further reduce the interest rate to 1.25%, effective June 2013. The measuresundertaken in May 2013 succeeded in slowing the rapid appreciation of the shekel.
In view of the risks embodied in the rapid rise of home prices and the expansion of housing credit, theBank of Israel’s Banking Supervision Department implemented macroprudential measures with regard tobanks’ mortgage loans in order to support financial stability. These measures included: redefining housingcredit extended to organized purchasing groups as credit extended to the construction industry instead ofhouseholds’ mortgages, requiring banks to meet stricter credit standards; increasing the capital provisionrequirement against high loan-to-value mortgages; requiring the re-examination of risk management in thehousing credit portfolio; demanding a higher capital provision against variable-interest loans; in 2011, limitingvariable-rate mortgages to one-third of the total housing loan granted to a borrower; and in 2012, limiting theloan-to-value ratio of mortgages.
The key development affecting monetary policy since the second half of 2013 has been the significantdrop in actual inflation and inflation expectations, coupled with slower growth, corresponding drops inshort-term interest rates, and decreases in longer-term interest rates. Actual CPI inflation was negative orclose to zero at -1% in 2015, -0.2% in 2016, -0.4% in 2017, 0.8% in 2018 and 0.6% in 2019. In 2020, the inflationrate was -0.7% — below the lower bound of the inflation target. The CPI minus energy, fruits and vegetablesdecreased by 0.4%. The inflation rate in the second half of 2019 was significantly more moderate than in thefirst half of the year or the previous year. This was in line with the trend of appreciation of the shekel. Themoderation was also in line with a slight slowdown in the pace of wage increases. In recent years, other than aperiod of about a year from mid-2018, the inflation rate has been below the inflation target range. However,there has been a marked increase from the negative values that were prevalent in 2015 and 2016. The lowinflation rate in recent years is mainly due to the appreciation of the shekel and increased competition againstthe background of technological improvements. In contrast, the demand side remained strong. Inflation in2020 was significantly impacted by the COVID-19 crisis: Inflation was negative throughout most of the year,and declined overall by 0.7%. The main force working to lower inflation included the declines in global energyand food prices and in activity and demand in the economy.
From 2014 to 2020, the inflation rate in Israel was lower than in most OECD member countries. Thesefindings are consistent with the assessment that a significant portion of the decline in Israel’s inflation ratehad to do with the strengthening of the shekel, and less to do with the trickle down of global price declines.Another possible cause of the gap between the inflation rates is that the transition to equilibrium with a higherlevel of competition is taking place later in Israel than in other OECD economies. In addition, it is reasonableto assume that at the point of departure, the Israeli economy had a lower level of competition than othereconomies. For instance, it is likely that in countries with open land borders, domestic importers had lesspower than in Israel. Fiscal policy was expansionary from 2015 to 2019. The central Government’s deficit in2019 was 3.7% of GDP. In 2019 the deficit of the general Government, which includes the central Government,the National Insurance Institute, the Local Authorities and a number of other small public organizations, washigher than 4% of GDP for the second consecutive year. The increase in Government expenditure reflected achange in policy that began with the establishment of the Government in 2015, after the previous Governmentengaged in fiscal consolidation, and was intended to improve the level of public services and to increasetransfer payments.
In 2020, due to the effects of the COVID-19 pandemic and the policy responses to it, the Israeli economyGDP decreased by 2.6%. Private consumption dropped by 9.5% and investment dropped by 1.6%, whilegovernment consumption rose by 2.7%. Exports also rose by 0.7%, despite the significant drop in world trade,due in large part to the strength of Israel’s high-tech services exports. In total, domestic uses dropped by 3.7%.The current account surplus rose to 5%, well above the 2016-2019 average of 3%, showing that much of funds
D-69

not spent due to the reduction in private expenditure were instead shifted to private savings. The Governmentdeficit rose to 11.6% of GDP, primarily due to spending on COVID-19 support programs, including expandedunemployment benefits and financial support for businesses.
From mid-2013 to mid-2014, the shekel continued to appreciate in effective terms. In the third quarter of2014, there was a sharp depreciation caused by temporary increased domestic and geopolitical uncertaintyand interest rate reductions at the end of July and at the end of August by the Bank of Israel. InSeptember 2014, the Bank of Israel reduced the key policy rate to a then-historic low of 0.25%. In the fourthquarter of 2014, the shekel began to appreciate once more and actual inflation was below expectations, so theBank of Israel reduced the key policy rate in March 2015 to the historically low level of 0.10%, nearing theso-called “zero lower bound” on nominal rates. In 2016, the shekel appreciated by 4.6% and continued toappreciate by 3.9% in 2017, in terms of the nominal effective exchange rate based on year-over-year Decemberaverages. In 2019, the nominal effective exchange rate appreciated by 8.1% in 2019 and by 4.7% in 2020. InJanuary 2021, the Monetary Committee announced a change in the Bank’s foreign exchange market activityand declared a plan to purchase $30 billion in 2021.
Implementation of Monetary Policy. The Bank of Israel’s principal instruments of monetary controlare auctioned time deposits for banks, sales of Central Bank bills (“Makam”), and a discount window facility.Auctions for interest-bearing deposits are currently the main tools for implementing monetary policy and aresimilar to reverse repurchase agreements. The interest rates received by the banks are determined in suchauctions. Maturities are overnight or one week. The auction of overnight funds and deposits of variousmaturities and the rates of interest determined in connection therewith are the key determinants of veryshort-term interest rates in Israel. The Bank of Israel utilizes the daily auctions primarily to offset flows, toand from the monetary base, of Governmental activities and foreign exchange market intervention. In thepast, when the banking system was in a fundamental liquidity deficit, the Bank of Israel injected liquidityusing monetary collateralized loans, which were allocated to the banking system by periodic auctions of apredetermined amount and were used in a manner similar to repurchase agreements. Since the resumption offoreign exchange intervention at the start of the global financial crisis (in 2008), the banking system has beenin a fundamental liquidity surplus so the Bank of Israel has been absorbing liquidity rather than injecting it.
The Bank of Israel may also absorb liquidity by selling Makam, formally a liability of the Governmentbut issued by the Bank of Israel for monetary purposes. Unlike Bank of Israel’s other monetary instruments,Makam securities are traded in the secondary market and are accessible by the investing public. Since themid-1990s, the Bank of Israel has expanded the use of Makam issuances as a monetary instrument to absorbexcess liquidity in the banking system. Since March 2007, the Makam market has enabled the Bank of Israelto actively increase liquidity in the banking system by reducing the issuance of Makam.
The discount window facility enables banks to obtain, at any time during the day, overnight loans to filltemporary funding needs (against suitable collateral) at a premium above the key policy rate or to depositexcess funds at a rate below the key policy rate. The key function of the discount window is to establish a rate“corridor” within which the rate on auctioned deposits is determined. This function is similar to the systemused by the European Central Bank and a number of other central banks.
In 2008, the Bank of Israel resumed foreign exchange intervention after a ten-year hiatus. Although theobjectives of interventions vary depending on the circumstances, objectives include increasing the level offoreign exchange reserves in the early stage of intervention, limiting the effect of the substitution of domesticnatural gas for imported oil on the exchange rate in the past five years, and occasionally limiting local currencyappreciation when the Bank determines that the exchange rate is not in line with macroeconomicfundamentals.
In 2016, inflation increased compared to 2015 but continued to be far below the target range. In light ofrepeated reductions of growth forecasts for the world economy, the Monetary Committee reduced the keypolicy rate to 0.1%, a near-zero level, in March 2015, and this level of interest rate remained for 2016. InNovember 2015, the Monetary Committee began using forward guidance, an unconventional monetary policytool, announcing that the monetary interest rate would remain accommodative for a considerable time. At thesame time, the Committee determined that there was no room to utilize other monetary tools (includingnegative interest rates or bond purchases); the decision was based on assessed economic health and uncertaintyregarding the effectiveness and unexpected repercussions of using such tools. In April 2017, the Committee
D-70

significantly changed the text of the forward guidance and announced that the accommodative monetarypolicy will continue as long as necessary in order to bring the inflation environment within the target range. InJune 2018 inflation reached the target range and remained slightly above the lower bound and inNovember 2018 the Bank of Israel raised the interest rate to 0.25% from 0.1%. In December 2018 the annualinflation temporarily fell below the lower bound to 0.8%. In 2019, Annual inflation of the Consumer PriceIndex totaled 0.6% in 2019 — below the lower bound of the inflation target. The monetary interest rate didnot change during the year, and with the exception of an increase of 15 basis points to 0.25% inNovember 2018, it has not changed for the past 5 years. However, starting in the second half of 2019, theexpected interest rate path changed from upward to downward, in view of the worsening global conditions,monetary accommodation in the US and Europe, and the significant decline in annual inflation to below thetarget range.
During 2020, against the backdrop of the COVID-19 crisis and the associated economic challenges, theMonetary Committee implemented several tools with the goal of dealing with the crisis, including mitigatingthe adverse economic impact of the COVID-19 crisis, ensuring the continued orderly functioning of thefinancial markets, enhancing the pass-through from the Bank of Israel interest rate to market interest rates,and encouraging demand and inflation through easing credit conditions.
In March 2020, as the spread of infection in Israel and the rest of the world caused the economic situationto deteriorate and disrupted the financial markets, the Committee held a series of emergency meetings. TheBank of Israel increased liquidity in the financial markets by means of repo transactions, and executed swaptransactions in order to provide liquidity in dollars to the financial system. The Committee decided inApril 2020 to reduce the interest rate by 0.15% to 0.1%, its lowest level in history. During the second half of2020, the interest rate remained unchanged at 0.1%. The July 2020 decision included, for the first time, aprogram to purchase NIS 15 billion of corporate bonds in the secondary market. In addition, the Committeedecided to continue to incentivize the banks to extend credit to small businesses and to extend the type ofassets that banks can accept as collateral. In October, the Committee announced the expansion of thegovernment bond purchase program by NIS 35 billion. This program, was originally launched in March 2020,at which time it was decided to purchase NIS 50 billion in government bonds with the goal of reducing thecost of credit in the economy. The October decision also provided that the Bank of Israel would provide thebanking system with loans at a negative interest rate of -0.1%, for the first time in Israel, on condition thatthey used the funds to expand loans to small businesses. The Bank of Israel continued purchasing foreignexchange throughout 2020. Alongside the monetary tools that the Committee implemented, the BankingSupervision Department at the Bank of Israel took several additional steps in the credit market.
Table No. 25
Selected Interest Rates(1)
Short Term Credit to thePublic in Local Currency Average Interest on Daily
Commercial BankDeposits at the
Bank of Israel(3) SROs(2)(4)
Yield to Maturityof 12-month
Treasury BillsLine of
Credit(2)Term
Credit(2)
2016 . . . . . . . . . . . . . . . . . . . . . 7.3% 3.3% 0.1% 0.0% 0.1%2017 . . . . . . . . . . . . . . . . . . . . . 7.3% 3.4% 0.1% 0.0% 0.1%2018 . . . . . . . . . . . . . . . . . . . . . 7.5% 3.4% 0.1% 0.0% 0.2%2019 . . . . . . . . . . . . . . . . . . . . . 7.1% 3.5% 0.2% 0.1% 0.3%2020 . . . . . . . . . . . . . . . . . . . . . 6.9% 3.3% 0.1% 0.1% 0.1%
(1) Effective interest rate (percent per year).(2) The data reflects the gross balance of all banking corporations registered in Israel.(3) The interest rate on daily deposits auctioned by the Bank of Israel.(4) Self-renewing overnight local currency interest-bearing bank deposits (“SROs”), excluding large
negotiable SROs.Source: Bank of Israel.
D-71

Table No. 26
Monetary Indicators(Percentage Change over Previous Period)(1)
2016 2017 2018 2019 2020
Monetary Aggregates(2)
M1 (in millions of NIS annual average)(3) . . . . . . . . . 305,966 348,251 392,550 421,417 508,658M2 (in millions of NIS annual average)(4) . . . . . . . . . 726,805 787,643 823,659 860,197 1,011,363M1 . . . . . . . . . . . . . . . . . . . . . . . . . . . . . . . . . . . 23.7% 13.8% 12.7% 7.4% 20.7%M2 . . . . . . . . . . . . . . . . . . . . . . . . . . . . . . . . . . . 10.3% 8.4% 4.6% 4.4% 17.6%
Public Sector Injection/GDP(5) . . . . . . . . . . . . . . . . . . 0.3% -0.3% 0.1% 0.5% 1.5%Bank Of Israel Injection/GDP(6) . . . . . . . . . . . . . . . . . -1.3% -0.6% -0.7% -1.2% -4.8%
Nominal Interest RatesSROs(7) . . . . . . . . . . . . . . . . . . . . . . . . . . . . . . . . 0.0% 0.0% 0.0% 0.1% 0.1%Unrestricted Credit in Local Currency(2)(7) . . . . . . . . 3.4% 3.5% 3.5% 3.5% 3.4%U.S.$ Interest Rate (average, three month
LIBID) . . . . . . . . . . . . . . . . . . . . . . . . . . . . . . . 0.6% 1.1% 2.2% 2.2% 0.5%NIS/U.S.$(during period) . . . . . . . . . . . . . . . . . . . . . . -1.4% -8.5% 7.1% -7.4% -6.6%Real Yield To Maturity On 5 Year Indexed Government
Bonds . . . . . . . . . . . . . . . . . . . . . . . . . . . . . . . . . . -0.1% -0.1% -0.3% -0.6% -0.7%Nominal Yield On Equities (during period)(8) . . . . . . . . . -11.1% -1.2% -3.9% 17.7% -0.4%Nominal GDP . . . . . . . . . . . . . . . . . . . . . . . . . . . . . . 4.9% 3.7% 4.8% 5.8% -1.4%
(1) Certain data herein are calculated based on annual averages and certain other data herein are calculatedbased on year-end figures.
(2) Includes mortgage banks.(3) Currency in circulation plus demand deposits.(4) M1 plus self-renewing overnight deposit plus unindexed deposits of up to one year.(5) Contributions to monetary expansion.(6) Includes swap transactions, with respect to the redemption of Government bonds held by the Bank of
Israel.(7) The data reflects the gross balance in all banking corporations registered in Israel.(8) Includes convertible securities and warrants. The data has been adjusted for dividend distributions and
stock splits.Source: Bank of Israel.
Banking System
Introduction. The banking system is well supervised and regulated, in accordance with internationalstandards and practices set by the Basel Committee for Banking Supervision. Banking and merchant acquirerlicenses are issued by the Governor of the Bank of Israel (the “BOI”). Banks and credit-card companies aresupervised by the Banking Supervision Department (the “BSD”) of the BOI. The BSD is the primary regulatorof Israeli banks and merchant acquirers and is headed by the Supervisor of Banks, an appointee of theGovernor of the BOI. Two additional committees operate alongside the Supervisor of Banks: (1) the LicensesCommittee, which advises the Governor of the BOI and the Supervisor of Banks in connection withestablishing banking corporations, licensing bank branches, reviewing changes of control in banks, andensuring the stability of banks where mismanagement has been found; and (2) the Advisory Committee,which advises on matters relating to the issuance of new banking business regulations. Another function
D-72

assigned in recent years to the BOI, carried out by the BSD, is the licensing and supervising of acquirers thatoperate in the credit and debit card markets and provide payment services to merchants and consumers.
In recent years, the BSD has enhanced its supervision of the banking system and adjusted regulation inresponse to the changing operating environment. New technologies and innovative channels, systems andproducts have been integrated into the financial systems in the global markets, and the BSD and other financialregulators have prioritized the responsible implementation of these new technologies within the financial andbanking system. This creates new risks in terms of scope and magnitude. The BSD has structured its functionto accommodate for this change and to manage these risks, which include cyberattacks, client informationleaks and IT computer outages.
Profile of the Banking System. Israel has a concentrated banking system that is dominated by the twolargest banking groups, Bank Hapoalim and Bank Leumi, which consist of 54.1% of all banking assets. At theend of 2020, there were 14 banking corporations registered in Israel, including nine commercial banks, onejoint-service company and four foreign banks.
The five largest banking groups (Bank Leumi Le-Israel B.M., Bank Hapoalim B.M., Israel DiscountBank Ltd., Mizrahi Tefahot Bank Ltd. and The First International Bank of Israel Ltd.) compriseapproximately 98.4% of the banking market in Israel. As of December 2020, there is also one small commercialbank that is unaffiliated with these banking groups. In addition, there are four branches of foreign banks thatoperate on a smaller scale: Citibank N.A., HSBC Bank PLC, Barclays Bank PLC and State Bank of India.Other major European foreign banks operate from offices in Israel, and engage in activities in the capitalmarkets and render advisory services that do not require a banking license according to Israeli banking laws.In December 2020, a banking license was issued to a new digital bank, which became effective in March 2021subject to certain limitations.
Israeli banking groups carry out wholesale and retail financial services, including investment bankingand brokerage and capital market activities, which require abiding by certain restrictions in order to avoidconflicts of interest. In addition, the Israeli banks are limited in their investments in real companies. There arealso limits on the structure and type of companies that can become controlling shareholders of banks.
Controlling Structure in Banks.
Banks can be controlled by a Core Controlling Group, or the holding of a bank can be widely dispersedamong a broad shareholder base. In 2012, an amendment to the Banking Ordinance Act, 1941, and to theBanking (Licensing) Law, 5741-1981, came into effect, which allowed for a bank ownership structure withouta Core Controlling Group. In addition, BOI issued a Principle Document to clarify the principles for a bankheld by Shareholder Structures.
In December 2013, the Knesset enacted the Law for Promotion of Competition and Reduction ofConcentration, 5774-2013, that sets restrictions on significant cross- sectorial holdings and control of a RealCorporation together with a Banking Corporation that constitutes a Significant Financial Entity (as definedby this law) and provides a transition period for pre-existing controlling shareholders.
Recent Regulatory Developments
From 2016 to 2020, certain regulations were implemented to enhance competition in the financial sector:
1. The Divestiture of Credit-Card Companies. In accordance with the increasing Competition andReducing Concentration Banking Market Law (Law Amendment) 5777 – 2017 (the “Strum Law”),the two largest banks, Bank Hapoalim and Bank Leumi, were required to divest their credit -cardholdings (Isracard Group and Leumi Card Ltd., respectively). These credit-card companies nowoperate as separate non-bank credit providers and merchant acquirers and compete with banks forproviding credit to SMEs and retail customers.
Bank Hapoalim and Bank Leumi are permitted to continue to issue credit cards, but must processthe credit cards that they issue during three years (starting two years after the law came into force)with at least two different credit-card companies. In addition, four years after the divestment, the
D-73

banks are required to decrease the amount of the cards’ credit lines that is extended by the banks by50% by January 2024.
2. Supervisory Reforms in the Merchant Acquirer Market. The merchant acquirer market consistsof three credit-card companies: Isracard, CAL and MAX. Beginning in 2015, the BSD took actionto remove barriers to entry for new entrants. These actions were intended to ease the licensing processby introducing a contingent merchant acquirer license (within six months of submitting anapplication). The BSD sought to reduce the market’s barriers of entry by:
• Making the licensing process shorter and more efficient, providing greater regulatory certaintywith regards to obtaining a license prior to an entity making a substantial investment in technologyand hiring, as well as easing both the connection to the local payment card system (Shva) and thereceipt of licenses from the International Credit-Card Schemes;
• Significantly reducing the minimum capital requirements to only NIS 1 million in starting capitalfor a new merchant acquirer; and
• Enacting more lenient regulations in the areas of corporate governance, risk management, andother areas for entities that do not have a significant impact on the stability of the financial systemand the payment system.
In April 2017, BOI issued a merchant acquirer license to TRANZILA Ltd, which is the fourthmerchant acquirer licensed in Israel’s merchant acquiring market. Though it has not yet startedoperations, TRANZILA’s entry into the merchant acquirer market represents a major step inpromoting and increasing competition in the payment sector and credit market, which is intended tobenefit small and medium businesses and households. In May 2018, BOI issued a merchant acquirerlicense to Cardcom Acquirer, Ltd., the fifth merchant acquirer to operate in Israel.
In February 2018, the BSD released a document that articulated the criteria and general conditionsfor an applicant seeking a permit to control or hold controlling means of a credit-card company ora merchant acquirer that can be made up of a group that includes a number of the aforementionedpermitted types of entities. A credit-card company or merchant acquirer can also be owned by publicstockholders or a combination of public stockholders and the aforementioned permitted types ofentities.
3. Issuance of Limited Bank Licenses. In June 2018, BOI published a policy that regulates andsimplifies the process of establishing a bank and creates regulatory certainty in the early stages ofthe licensing process for anyone interested in establishing a bank. The licensing process allows anapplicant to obtain a limited license within six months. The limited license will allow the applicant tomanage limited deposit and credit provision activities. The process also enables the applicant tocomplete more complex actions, such as raising capital, recruiting employees, investing ininfrastructure and computer systems and closing regulatory gaps after the bank is established andhas started operating.
4. Changes to bank licensing process. Since 2018, a designated team at the BSD provides closeguidance to any entrepreneurs in the process of establishing a bank. The BSD has lowered the initialcapital requirement and the regulatory capital requirements and revised its Proper Conduct ofBanking Business directives to enable the digital provision of all banking services.
5. A Centralized Computer Bureau began operations. The process of enacting the Strum Law identifiedthe significant barriers to establishing a new bank, such as the high cost of investing in computerinfrastructure. Therefore, the Strum Law allocated a budget to the Ministry of Finance to establisha centralized computer bureau to provide technological services to new banks. In March 2019, theMinistry of Finance announced that Tata Consultancy Services from the TATA Group won thetender in conjunction with two groups of entrepreneurs that are working to establish a new bankand credit union. In March 2021, the Centralized Computer Bureau began operations and is alreadyproviding computer services to the First Digital Bank, Ltd.
D-74

Recent Structural Developments
• In July 2018, Warburg Pincus, LLC, a private equity firm, bought Leumi Card and in February 2019,BOI approved this acquisition and Max, the new name of the Leumi Card company, was given amerchant acquirer license.
• In November 2018, the controlling share of Bank Hapoalim was sold. Now Bank Hapoalim does nothave a majority owner.
• In April 2019, Bank Hapoalim sold 67% of its controlling interest in Isracard to the public. InMarch 2020, Bank Hapoalim distributed the remaining 33% holdings in Isracard to its shareholders asa dividend (under the Strum Law the bank was required to sell the remaining shares by January 2021).
• In December 2019, the BOI issued a banking license to the First Digital Bank Ltd. Control Permitswere given to the controllers of the First Digital Bank. This was the first banking license that was givensince 1978. The new bank acquires IT services from the Centralized Computer Bureau mentionedabove. The license issued was activated in March 2021 and restricts the bank’s activity in terms ofscope and scale. These restrictions will be removed within three years as the bank meets the milestonesand timetable to accomplish its formation according to license granted. In May 2019, Automated BankServices’ (SHVA) “joint services company” license was cancelled due to the dilution of banks’ holdingsof the company’s ownership. This change is in accordance to the Strum law.
• In December 2019, Municipal Bank (former known as Bank Dexia) was merged into Bank Mercantilefrom the Discount Bank Group.
• In January 2020, Isracard was granted a merchant acquirer license.
• In September 2020, Union Bank merged into Bank Mizrahi-Tefahot.
Competition, New Technologies and Cyber Risks
The Supervisor of Banks undertook the following policies to advance the supervisory goals set by theBSD, in particular, implementation of the Strum Law and assisting in launching innovative technologies. Thisentailed removing barriers that hindered the implementation of technologies, such as allowing banking servicesand opening bank accounts remotely via digital access without a physical presence. This environment led tothe opening of the merchant acquirers market in 2017 and enabled the licensing of the first digital bank inDecember 2019, which received regulatory and supervisory treatment according to a risk-based approach.Other steps undertaken in recent years include:
1. Sharing credit data. In April 2019, the BoI inaugurated a system for sharing credit data that willcontribute to the overall competitive environment and will help to lower consumer credit costs.
2. Assisting clients to change banks. In December 2019, the BSD issued an amendment to theBanking (Service to Customer) Law that supports the decision of the client to change accounts fromone bank to another online and in a secure and convenient manner at no extra cost.
3. Reducing barriers for new players to enter the banking system. The BSD and the Ministry ofFinance promoted the establishment of a Centralized Computer Bureau for new banks to defray thehigh technology costs of the computerized infrastructure and IT systems.
4. Enhancing competition with non-bank credit intermediaries. The BSD is implementing “openbanking.” This technology enables third-party developers to build applications and services aroundthe financial institution. This will allow non-banking credit vendors to offer credit to all clients whooperate via the banking system by giving clients the option to grant authorization to these vendorsto access privileged information pertaining to their bank account. In February 2020, in order toincrease competition in the market, the BSD issued several leniencies related to the submission ofAML documentation to banks by non-bank credit vendors and to P2P credit platforms. Theseentities are licensed and supervised by the Capital Markets, Insurance and Savings Authority.
5. Innovation. The BSD accommodated the infrastructure for rolling-out innovational technologiesby encouraging the entry of FinTech companies to engage in joint ventures and to engage in
D-75

advancing financial service technology in the banking system. This created a need to sign MoUswith foreign regulators to foster cooperation and provide for the sharing of information in aresponsible manner.
6. Promoting technological advancement and innovation in banks’ digital services to enhancecompetition and to improve customer’s experience. In 2019 the BSD approved the use of atechnology for remote face-to-face identification and authentication and removed other regulatorybarriers to enable the expansion of digital banking activity. In addition, the BSD allowedcorporations to open a bank account online in 2020.
7. Promoting the EMV advanced payment standard in Israel. The BOI and the BSD are workingclosely to promote the use of advanced means of payment in order to enhance competition in thepayment market and to improve customers’ experience. The technology is expected to upgrade theuse of digital means of payment and the number of domestic and foreign entities entering the field.
8. Cyber risk. The sophistication of new technologies has heightened the need for regulators toengage in high-level resources and to deploy staff that possess expertise in technology andcybersecurity. The BSD has a dedicated staff to address cyber risks and formed a Technology andInnovation Division four years ago. In addition, the BSD partakes in the National Cyber Directorateunder the auspices of the Prime Minister’s Office. In 2019, the BSD prioritized combating cyber riskand constructed a uniform stress-test scenario for all the banks as a result of a significantcyber-attack. In this scenario, a malware infiltrated the bank’s core systems, which generated severedisruption of the bank’s customer data and the bank’s ability to provide service. This stress testprovided the banks with valuable experience and preparations in the event of a cyber-attack. In2020, the BSD published a new version of the Cyber Incident Reporting Directive, aiming to obtainstructured, frequent and on-going reports when a major cyber event is taking place in the bankingsystem.
Bank Investigations
On April 30, 2020, Bank Hapoalim Group concluded the US tax investigations with the signing of thefollowing agreements with their respected authorities regarding the US tax investigation and had to pay out asum total of NIS 3.1 billion ($874.3 million) to the following authorities:
1 Deferred prosecution agreement with the US Department of Justice (“US DoJ”) to settle the claimsagainst Bank Hapoalim Group regarding proactively collaborating with US clients to evade taxpayments to the Internal Revenue Service in the US. This resulted in a settlement of $214.4 million.
2 Plea agreement with the US DoJ and Bank Hapoalim Switzerland regarding claims that it wasassisting US clients to evade tax payments resulted in a settlement of $402.5 million.
3 Consent order with the New York State Department of Financial Services that imposed penaltysanctions of $220 million.
4 Cease and desist order with the Board of Governors of the Federal Reserve System that imposed acivil penalty sanction of $37.4 million.
In addition, Bank Hapoalim reached a settlement with the US DoJ pertaining to Anti-Money Laundering(“AML”) infractions. Bank Hapoalim group signed a Non-Prosecution Agreement with the US DoJ regardinga few bank employees involved in collaborating with high-ranking officials from Federation of InternationalFootball Association (“FIFA”) pertaining to breaches of AML directives. This agreement included a paymentof $30.1 million.
In March 2019, Bank Mizrahi-Tefahot signed a two years deferred prosecution agreement with the U.S.Department of Justice (“DoJ”) to conclude its investigation into Mizrahi-Tefahot Bank’s business with its USclients, and made a NIS 546 million payment to the DoJ. At the end of the term of the agreement, InMarch 2021, the US court (Los Angeles) granted an order, upon the US DoJ request, dismissing theprosecution that was filed against the Bank, according to the deferred prosecution agreement signed between
D-76

the Bank and the US DoJ in 2019. The order stated that the Bank group has complied with its obligationsunder this agreement.
The performance of the Israeli banks in 2020
As a result of the COVID-19 crisis, the net profit attributed to shareholders of the Israeli banks decreasedby 24.4% in 2020 and amounted to NIS 7.5 billion at the end of 2020, compared to an increase of 5.6% in2019, which amounted to NIS 9.9 billion. The 2020 net profit represents an after-tax return on equity of 6.1%compared to 8.3% in 2019.
Total balance sheets of the Israeli banking system grew substantially by 16.2% during 2020 compared to3.5% in 2019. Total balance-sheet credit (including activity abroad) rose by 4.9%. The credit to the businesssector increased by 6%, which can be attributed to an increase in loan demand primarily from the constructionand real estate sector. Total credit to the construction and real estate sector grew by 13.5% in 2020, and by anaverage rate of 10.7% in the last three years. Among the explanations that can be named regarding the sourcesof credit growth to business sector, is the establishment of the State Guarantee Funds in April 2020, underwhich the government serves as the loan guarantor for bank loans to facilitate credit provision to smallbusinesses despite insufficient collaterals. The size of the housing loans (mortgages) increased by 9% in 2020and amounted to NIS 424.4 billion, partially as a result of the Buyer’s Fixed Price Project instituted by theMinistry of Finance which aims to increase the affordable housing stock in the market for first-time homebuyers, and retail consumer credit decreased by 7.7%.
The high credit portfolio quality which prevailed in the years preceding the crisis assisted the bankingsystem to further extend credit to businesses and individuals during the crisis, and the local economy towithstand the crisis fairly well. The deterioration in the economic activity in 2020 due to COVID-19 and itsnegative effects on the unemployment rate and on the business sector, were not reflected in the share of overallbanks’ non-performing loans, but did reflect in an increase in the share of loan loss provisions.
The annual provision for credit loss was 0.7% in 2020, up from 0.3% in 2019 and 0.2% in 2018. Impairedloans and loans in arrears for 90 days or more was 1.39% in 2020 compared to 1.4% in 2019 and 1.23% in2018. Mortgage loans portfolio provisions for credit losses increased and their share of total mortgageportfolio was 0.21% compared to 0.03% in 2019. In the construction and real estate sector, the impaired loansratio was 1.82% in 2020 compared to 1.4% in 2019. In the commercial sector, the impaired loans ratio was1.2% in 2020 compared to 1.68% in 2019 and 1.4% in 2018. The loan-loss reserve coverage ratio went up to119% at the end of 2020, compared to 88% in 2019.
Israeli banks calculate their risk capital via the Basel II standardized approach. Accordingly, the risk-weighted assets ratio is relatively high, and for the five largest Israeli banks reached 67% at the end of 2019,which is high relative to the larger global banks implementing the advanced internal ratings-based approaches.During 2020 the density ratio decreased somewhat and stood at about 60.3%, compared to 67% in 2019. Thedecrease was primarily attributable to the growth of assets that are weighted with a low risk weights, such asdeposits at the central bank, government bonds and mortgages. The high density ratio demonstrates the strongcapital position and the substantive regulatory requirements that allow the banks to supply credit to businessesand individuals that have been adversely affected by COVID-19, as well as liquidity relief for consumers. In2020 the banks were required to re-evaluate the distribution of dividends and share buyback policies due toCOVID-19.
Equity capital of the Israeli banks amounted to NIS 127.9 billion at the end of 2020, an increase of 4.3%from 2019. The common equity capital tier 1 ratio reached 11.1% at the end of 2020, which is well above theregulatory capital requirement, 10% for the two largest banks and 9% for the smaller banks (a temporaryreduction of 100 basis points was given by the BSD to all banks during the crisis, valid until September 2021).The leverage ratio reached 6.2% at the end of 2020 and was substantially higher than the minimum requirementby the Basel Committee and also exceeds the Israeli regulatory minimum requirement set by the BSD, which isset at 6% for the two largest banks and 5% for the smaller banks (a temporary reduction of 50 basis points wasgiven by the BSD to all banks during the COVID-19 crisis and is valid until September 2021).
Issues in Anti-Money Laundering and Combating Financial Terrorism.
The Prohibition of Money Laundering Law was enacted in 2000, and the sections pertaining to theobligations imposed on financial entities took effect in 2002. In 2001, the Governor of the BOI issued the
D-77

Prohibition on Money Laundering Order, which entered into force in 2002. The Order includes requirementsregarding identification, reporting and record-keeping by banking corporations. The regulation regarding thePrevention of Money Laundering and Terrorism Financing and Customer Identification has been amendedin light of the declaration of principles of the Basel Committee on Banking Supervision of October 2001 onCustomer Due Diligence for Banks. The regulation outlines guidelines on setting AML/CFT policies, on riskmeasurement, risk mitigation practices and on management and monitoring high-risk accounts. In addition,the regulation contains specific guidance on risk management practices regarding high profile risk activities,e.g., private banking, correspondent banking accounts and politically exposed persons (PEP).
The BSD conducts regular onsite examinations to assess the compliance of banks with AML/CFT lawsand directives. The Sanctions Committee, chaired by the Supervisor of Banks, is authorized to impose financialpenalties on banks and credit-cards companies for AML/CFT related infractions.
In November 2016, the Counter-Terrorism Law, 5776−2016, went into effect and replaced the Prohibitionon Terrorist Financing Law, 2005. The object of the Counter-Terrorism Law is to establish criminal andadministrative legal provisions, including special enforcement powers, for the purpose of combating terrorism.
As amended, the 2006 Prohibition on Money Laundering Order requires financial institutions to checkthe identification of parties to a transaction against a list of declared terrorists and terrorist organizations, aswell as to report the type and size of transactions above NIS 5,000 whenever a transaction involves a high-riskcountry or territory.
Due to increased risk associated with the cross-border activities of Israeli banks in prior years, inMarch 2015, the Supervisor of Banks published enhanced cross-border risk management requirements.Enhanced measures are required of a bank’s board of directors, including revision of cross-border operationspolicies with an emphasis on the tax compliance of the bank’s clients to foreign jurisdictions’ laws, rules andregulations. A bank’s senior management is expected to comply with the bank’s controls and procedures tomanage the risks from a bank’s international activities, especially those stemming from tax compliance. Seniormanagement is expected to adopt a risk-based approach, including the classification of high-risk clients, theimplementation of tax declaration procedures, and the forgoing of bank secrecy by the bank’s clients. Bankswere vested with the authority to refuse the opening or the maintaining of a bank account whose owner doesnot cooperate with the bank on issues that derive from cross-border risks.
In June 2015, the Supervisor of Banks revised the Proper Conduct of Banking Business Directive No. 308regarding Compliance and the Compliance Function in a Banking Corporation along the lines of thestandards and practice as recommended by the Basel Committee and implemented in other prominentjurisdictions. This Directive focused on several issues, including: the accountability of a bank’s board ofdirectors and the board’s oversight over the management of compliance risk; senior management’s role andresponsibility for managing compliance risk effectively; a bank’s need to have a comprehensive compliancepolicy; main features of a compliance function that enables it to operate in an effective and robust manner;and defining and expanding the scope of the function and the role of a chief compliance officer.
In January 2020, the BSD issued an amended Reporting Directive to the Banking SupervisionDepartment No. 825, the “Semi-Annual Report on Exposure to Compliance Risk.” The Directive requiresbanking corporations to report specific information related to accounts at high risk with regard to compliance,such as hold-mail accounts, accounts of politically exposed persons and money services business accounts.
In November 2017, the Ministry of Justice published a non-restricted version of the Main Findings ofthe Money Laundering National Risk Assessment, which was conducted under the instruction of the AttorneyGeneral and was coordinated by IMPA. The report found that the Israeli banking system mitigates theexposure to the risks of money laundering and terrorist financing by implementing quality controls that ensurethe implementation of money laundering and terrorist financing instructions, and implementing effectivemeasures for tracking, monitoring and risk management. The main risks relevant to the banking system,which were assessed at moderate to high levels, were private banking (in particular, the activity ofnonresidents), activity of money service businesses and nonprofit organizations.
In December 2018, Israel became a full member of the FATF. At this time, Israel had undergone arigorous assessment of its measures to combat money laundering and terrorist financing. During this process,Israel demonstrated its commitment to protect the integrity of the financial system. Israel has established a
D-78

robust anti-money laundering and counter terrorist financing framework that is achieving good results inidentifying and responding to the risks the country is facing.
In view of the COVID-19 pandemic and its economic impact on Israel, the BSD published TemporaryProvision of the Proper Conduct of Banking Business Directives. The Provision included certain relief onAML/CFT regulatory requirements during the COVID-19 to help banks to deal with the increasing onlinebanking activities and to make things easier for customers during this period.
Israel’s regulatory regime with regard to AML/CFT is constantly subject to examination, review andrevision to respond to new difficulties and challenges due to the increasing innovation of the offenders. Forfurther discussion on anti-money laundering matters, see “Anti-Money Laundering Law,” above.
Table No. 27
Assets, Liabilities and Equity Capital of the Five Major Banking Groups(1)
(in NIS million)
2016 2017 2018 2019 2020
AssetsIn local currency(2) . . . . . . . . . . . . . . . . . . . 1,199,233 1,253,236 1,277,928 1,344,863 1,634,528In foreign currency . . . . . . . . . . . . . . . . . . . 265,414 248,614 274,727 261,783 282,996Total assets . . . . . . . . . . . . . . . . . . . . . . . . 1,464,647 1,501,850 1,552,655 1,606,646 1,917,524Liabilities and equity capitalIn local currency(3) . . . . . . . . . . . . . . . . . . . 1,091,720 1,133,387 1,211,162 1,257,634 1,516,053In foreign currency . . . . . . . . . . . . . . . . . . . 372,927 368,463 341,493 349,012 401,471Total liabilities and equity capital . . . . . . . . . 1,464,647 1,501,850 1,552,655 1,606,646 1,917,524Equity capital . . . . . . . . . . . . . . . . . . . . . . 101,803 107,998 115,289 119,017 126,925
(1) The division into local and foreign currency for 2016, 2017 and 2018 was adjusted according to thepublished financial statement for those years.
(2) Including non-financial items.(3) Including non-financial items, minority interests and equity.Source: Financial statements to the public.
Capital Markets
Israel Securities Authority. The Israel Securities Authority (“ISA”) was established under the SecuritiesLaw, 1968, and its mandate is to protect the interests of the investing public in Israel. The ISA has a wide rangeof responsibilities and powers. Within the framework of its mandate, the ISA is charged with, among otherthings:
• Issuing permits to publish prospectuses for public securities offerings of corporate issuers, as well asprospectuses for mutual fund units sold to the public;
• Examining corporate disclosure filings, including current reports, quarterly and annual periodicfinancial statements, filings concerning related-party transactions in connection with privateplacements, tender offer disclosures, etc.;
• Regulating and supervising the activities of the mutual fund industry, including on-going monitoringof mutual fund filings;
• Overseeing the fair, orderly and efficient activity of secondary markets;
• Licensing and supervising portfolio managers, investment advisers and investment marketing agents,including thorough compliance reviews and disciplinary complaints against these investmentprofessionals for adjudication by a disciplinary committee;
D-79

• Investigating violations under the Securities Law, the Joint Investment Trust Law, 1994, the Regulationof Investment Advice and Investment Portfolio Management Law, 1995 and violations of other lawsrelated to the aforesaid laws; and
• Supervision over compliance of portfolio managers and non-bank members of the TASE, inaccordance with the Prohibition of Money Laundering Law, 2000.
The ISA drafts and initiates virtually all primary and secondary legislation pertaining to securities laws inIsrael. In addition, it cooperates with government authorities in formulating policies and laws pertaining tocapital market activity. The ISA also collaborates with the Institute of Certified Public Accountants in Israelin operating and financing the Israel Accounting Standards Board, which is charged with setting accountingstandards for Israeli companies. The Minister of Finance appoints the chairman of the ISA and itscommissioners. ISA commissioners are selected from the public, the civil service and the Bank of Israel. TheISA plenum meets on a monthly basis. The ISA also performs its functions through permanent and ad hoccommittees, which facilitate the formulation and implementation of ISA policies. The ISA is not dependenton government financing; its budget is funded entirely by annual fees payable by entities regulated under theSecurities Law and the Joint Investment Trust Law. The ISA’s budget is approved by the Minister of Financeand the Knesset Finance Committee.
The ISA monitors a variety of ongoing disclosure reports, such as periodic reports that include financialstatements, director’s reports on the status of the companies’ affairs, additional information reports, quarterlyfinancial reports and immediate reports, which are filed immediately after the occurrence of certain eventsthat could have a material effect on a company or on the price of its securities. These reporting requirementsare enforceable by Israeli courts upon the petition of the ISA, which also has certain powers to direct theTASE to suspend trading of a company’s securities.
The TASE. The TASE is the only stock exchange and the only public market for trading securities inIsrael. The TASE is highly regulated, both internally and externally, by the ISA. Internal regulations includecircuit breakers and a 30-minute halting of trade in a company’s securities on a day that the company publishesprice-sensitive information, to ensure that the information can be widely disseminated. The TASE has acomputerized trading system with real-time information. The TASE’s rules govern membership, registrationof securities, conditions for suspending trading and obligations of listed companies. All shares, convertiblesecurities, treasury bills, government, corporate and structured bonds, exchange-traded notes, coveredwarrants and derivatives are traded via Tel Aviv Continuous Trading (“TACT”), the TASE’s fully automatedtrading system. The TASE has 23 members (eight of which are foreign members, including one remotemember) and, as of December 31, 2020, 455 companies had equity securities (excluding exchange-tradednotes) listed on the TASE. The TASE is highly correlated with major stock markets in developed countries.
The Dual Listing Law, which took effect in October 2000, enables companies listed in the United Statesor in England to dual-list on the TASE with no additional regulatory requirements under Israeli law. As ofDecember 31, 2020, there were 52 companies dual-listed on the TASE and foreign exchanges.
Market Performance. The Tel Aviv 125 (“TA-125”) and Tel Aviv 35 (“TA-35”) are the main indices ofthe TASE and primary indicators of the stock price performance of Israel’s public companies. The TA-125and TA-35 measure the 125 and 35 companies, respectively, with the highest market capitalization listed onthe TASE.
The TA-35 index decreased by 4.3% in 2020 in U.S. dollars terms, while the dollar depreciated 7.0%against the NIS, after an increase of 24.7% in 2019. Average daily trading volume of the TA-35 index was$261 million in 2020, which is 27% higher than the 2019. In local currency (NIS), the TA-35 index decreasedby 10.9% in 2020, following an increase of 15.0% in 2019.
As a result of COVID-19 and its economic impact, stock trading on TASE was highly volatile throughout2020. The year started on an upswing, continuing the bull rally of the previous year. TASE’s leading shareprice indices, starting with the TA-35 index, reached all-time record level in February 2020; the TA-35 reachingto 1751.79. This early surge was in keeping with trends in leading world stock markets. Following theCOVID-19 outbreak in March 2020, stock prices abruptly decreased, posting record declines in March 2020,at a time in which many countries, including Israel entered lockdown to contain the spread of the virus.
D-80

The overall reduction of economic activity and the stay-at-home restrictions imposed on residents duringthe “first wave” of the COVID-19 outbreak in March 2020 and during the “second wave” in September 2020precipitated an economic crisis in Israel as it did worldwide. Unemployment in Israel soared, the GDPdecreased and market uncertainty increased.
On the other hand, government and central bank stimulus programs in Israel and indications that effectiveCOVID-19 vaccines were under development had a positive impact on the market, contributing to price gainsamidst high volatility. In November 2020, share prices rose by an average of 12% in both foreign markets andTASE. The rally continued throughout December, albeit at a more moderate pace. The rollout of the Pfizer-Biotech vaccine initially in the U.K., US and Israel and later in Europe contributed to this rally. At the sametime, however, an additional surge in the COVID-19 pandemic and the discovery of a COVID-19 variant inthe UK, which led to tighter restrictions and reinstated lockdowns, curbed investor enthusiasm.
In total, the TA-35 index fell 11% in 2020, following a 15% increase in 2019. The index had decreased 31%from the beginning of the year to the low point of the crisis in March 23, 2020, recovering 28% by the end of2020.
The TA-90 index gained 18% this year, following sharp gains of 40% in 2019, and reached an all-timerecord high, while the S&P 500 and the Dow Jones indices, representing the “traditional” US economy, rose16% and 7% respectively, and European exchanges lost 5% on average. The rally enjoyed by technology andbiomed shares outweighed the negative impact of oil & gas and real estate shares in the index. The TA-Growthindex, which also attained all-time record highs, rose 29% this year, repeating its performance of the previousyear.
The General Index of shares and convertible securities (which is comprised of all shares and convertiblesecurities tradable on the TASE) increased in U.S. dollars terms by 7.1% in 2020, after increasing 27.7% in2019 and increasing 11.1% in 2018. As of December 31, 2020, the total market value of all listed equitysecurities (excluding exchange-traded notes) was $262.0 billion, compared to $237.2 billion in 2019.
Shares trading in 2020 had an active posting of an average daily volume of $540 million, 48% more thanthe 2019 average of $365 million. Trading was highly volatile, as in March, at the height of the crisis, the dailyvolume averaged $796 million. In contrast, average daily volume in the months May-December came to$500 million.
According to Bank of Israel, in 2020, foreign investor activity in the TASE equity market increased.Foreign investors sold a net $1.4 billion of shares, compared to $0.4 billion of net sales shares in 2019.
The total equity raised on TASE in 2020 came to $5.0 billion, as opposed to $3.8 billion in 2019. Capitalraised in public offerings amounted to $3.6 billion in 2020, 46% more than the amount raised in publicofferings in 2019. Of this $3.6 billion, $1.4 billion was raised in 27 IPOs, which was the highest number of newissuers since 2007, and compared to 7 IPOs in 2019.
Debt raised on the corporate bond market in Israel (excluding offerings abroad, placements on the TASEUP institutional platform, and structured bonds) declined in 2020, totaling $15 billion, as opposed to$19.3 billion and $14.9 billion in 2019 and 2018, respectively. This decline can be attributed almost entirely tothe lower activity of financial sector issuers.
In contrast, debt raised by real sector issuers remained stable this year at a level of $11.5 billion — slightlyhigher than the amount raised the previous year despite COVID-19, and also resulting from the need torefinance marketable debt as well as taking advantage of historically low interest rates.
The redemption of marketable corporate bonds (in both the real and financial sectors) came to$15.3 billion following redemptions of $12.1 billion and $9.5 billion in 2019 and 2018, respectively. Theproceeds of the public bond offerings this year were used primarily to refinance their marketable debt (77%),and partially to finance unmarketable debt, ongoing operations and the expansion of business activity andfacilities (23%). The increasing of redemptions this year is the result of large-scale bond offerings fromearlier years. In contrast, redemptions in 2021 are expected to decline to $14 billion, as there was significantlyless debt raised in the financial sector than in prior years.
D-81

The key characteristics of debt raised through corporate bonds in 2020 were as follows:
1. Sharp decline in debt raised by the financial sector
The financial sector raised $3.5 billion in 2020, accounting for 23% of the total raised on the corporatebond market, compared to $8.4 billion in 2019.
The large banks which raised $2.7 billion in 2020 as compared to $6.3 billion in 2019, which contributedin large part to the sharp decline in the debt raised by the financial sector. Influenced by the developingeconomic crisis, banks posted a sharp increase in credit losses and reduced lending activity. As a result, theBank of Israel lowered capital adequacy requirements by 0.5%, decided to lend money to banks at a negativeinterest of minus 0.1% against loans extended to businesses, and recently announced its intention to lift ceilingson the credit extended to the real estate and infrastructure industry from 24% of total bank credit to 26%. Inaddition, the scheduled reduction of credit extended to customers mandated under the “Strum Law” (designedto lower concentration of the banking industry) was postponed to 2021.
The most prominent issuer this year was Leumi Bank, which raised $690 million in the largest singlepublic bond offering of the year. Bank Hapoalim also raised $690 billion, but in a series of public offerings, ofwhich $300 million were raised in contingent convertible (CoCo) bonds, which include a mechanism to writedown the principal, while $205 million were raised in CoCo bonds which contain a conversion-to-equitymechanism. Mizrahi Tefahot bank raised $620 million, of which $124 million were in CoCo bonds whichinclude a principal write-down mechanism. The offerings of all three banks were of CPI-linked bonds.
2. Stability in the scope of debt raised in the real sector – the public capital market demonstratedsupport in a time of crisis, while the banks withheld credit:
The real sector raised $11.5 billion in 2020, accounting for 77% of the total raised through corporatebonds, similar to the 2018-2019 average. Approximately $9 billion in marketable bonds in the real sector wereredeemed in 2020. The redemption amount is expected to reach $10.5 billion in 2021.
Real estate continues to head the sectorial list of issuers, raising $7.4 billion in 2020, 49% of the totalraised in the corporate bond market. The companies in this industry, which were hit severely by the COVID-19crisis, reduced the scope of debt raised slightly relative to the previous two years ($7.3 billion in each of 2019and 2018). These issuers redeemed marketable bonds worth $2.5 billion in 2020 and are expected to redeemabout $3 billion in 2021.
Foreign companies, primarily real estate companies, lowered the total debt raised on the TASE bondmarket in 2020. Foreign companies raised $0.5 billion in 2020 compared to $1.1 billion and $1.8 billion in2019 and 2018, respectively.
Ten companies in the energy and oil and gas exploration sector raised $1.5 billion, more than 2.5 timesthe amount raised by such companies in 2019. These companies redeemed marketable bonds of $1 billion andare expected to redeem $1.3 billion in marketable bonds in 2021. The largest issuers were the energy companiesPaz Oil and the government-owned Israel Electric, which raised $0.3 billion each.
Bonds rated A and above accounted for 94% of the total raised in public bond offerings in 2020, comparedto 93% and 91% in 2019 and 2018, respectively.
The weight of debt raised through CPI-linked bonds relative to the total raised in public bond offeringsrose for a third consecutive year to 64% in 2020 from 52% and 45% in 2019 and 2018, respectively. A total of$9.7 billion in inflation-pegged instruments was raised in 2020.
$5.1 billion was raised in non-linked bond offerings, which accounted for 34% of public bond offeringsand private placements in 2020 compared to 47% in 2019 and 2018. Almost the entire amount was raised infixed rate bonds. Only $41 million of the total raised was through commercial paper, compared to $375 millionand $145 million in 2019 and 2018, respectively.
Dollar linked bond offerings increased this year, raising $0.2 billion, which was three times the amountraised in 2019, which accounted for 2% of total raised in public bond offerings in 2020,compared to 0.5% in2019 and 8% in 2018.
D-82

$4.1 billion was raised in 2020 through the private placement of bonds to institutional investors on theTASE UP institutional platform, of which $3.3 billion was raised abroad and $0.8 billion was raised in TelAviv. In 2019, $1.1 billion was raised through bond placements to institutional investors on the institutionalplatform, all of which were raised in Tel Aviv.
The largest placement on TASE UP in Tel Aviv was $0.4 billion raised by Ormat Technologies in non-linked bonds. The largest placements on TASE UP abroad include the $2.25 billion raised in an initialplacement by Leviathan Bond, a special purpose company of the “Delek Drilling” oil and gas partnership,through four series of dollar-denominated bonds for foreign institutional investors and Israelis abroad, andthe $0.75 billion placed by Leumi bank, part of which comprised a new series of dollar-linked CoCo bondsthat were placed with institutional investors in the United States.
Bond trading was highly volatile this year, as was the case for the equity market and other markets theworld. Across-the-board gains were posted for all categories of government bonds:
Fixed rate non-linked shekel bonds rose 1.5% over the year, echoing the volatility of the US treasuriesmarket.
The yield-to-maturity on 10-year non-linked shekel bonds fell 1.0% at the beginning of the year to 0.6%on the eve of the March market crash, rising to 1.1% at the height of the crisis and retreating to a level of 0.8%at the end of 2020.
A similar pattern was observed for US 10-year treasuries – the yield to maturity dropped at the beginningof the year from 1.9% to a historic low of 0.5% on the eve of the March crash, spiked to 1.3% at the height ofthe crisis and receded to 0.9% at the end of the year.
CPI-linked government bonds gained 1.2% in 2020. The main price spike of 0.8% in December in 2020stemmed from optimism regarding the return of economic growth following the rollout of COVID-19vaccination programs.
The corporate bond market, in contrast, was characterized by falling prices for all bonds except the bondscomprising the Tel Bond Shekel – Banking and Insurance index and the Tel Bond – Variable Interest index,which rose by 2.5% and 0.9%, respectively.
In addition to the factors mentioned in the section on the equity market, the bond market was influencedby some additional factors.
The lowering of the interest rate by the Fed twice in March by a cumulative 1.5% to a level of 0% – 0.25%had a positive impact on fixed-rate non-linked government bond prices, as well as on capital-raising activityon the bond market. In April, the Bank of Israel lowered its interest rate by 0.15% to a historic low of 0.1%.
In addition, the purchase of government bonds and corporate bonds by the Bank of Israel as part of itsstimulus program had a positive impact on bond prices.
Government bond prices were also influenced by Israel’s entry into the FTSE Russell World GovernmentBond Index (WGBI) in April 2020 and by purchases made by foreign investors.
The lowering of expected inflation rates to a level below 0% in 2020, following the contraction ofeconomic activity imposed by COVID-19 had a negative impact on CPI-linked corporate bond prices and ledto an increase in the weight of debt raised in CPI-linked bonds relative to the total debt raised on the bondmarket in 2020.
The prices of variable interest non-linked government bonds remained unchanged, given projections thatinterest rates would remain unchanged due to Fed announcements that interest rates will remain near zerountil the end of 2023.
Government Bonds. The government bond market in Israel is highly developed, and government bondsaccount for the vast majority of publicly issued debt securities. In 2006, a broad reform in the governmentbonds market was implemented, with the appointment of 19 primary dealers; as of June 2021, there are 13primary dealers. The 2006 reform helped increase the liquidity and transparency of the Israeli capital markets,encouraged the entry of international investors into the market, upgraded the trading and clearing systems
D-83

used in the market and promoted the development of diverse derivative fixed income instruments. Gross localcurrency tradable government debt raised (not including switch auctions) in 2020 was NIS 131.5 billion. In2019, gross government debt raised was NIS 70 billion compared to NIS 46.4 billion in 2018. Net local currencytradable government debt raised in 2020 was NIS 102 billion, compared to NIS 18 billion in 2019 andNIS 11 billion in 2018.
In January 2019, the Government raised €2.50 billion through an EMTN offering, consisting of€1.25 billion in 10-year bonds bearing 1.5% interest and €1.25 billion in 30-year bonds bearing 2.5% interest.In January 2020, Israel completed a dual-tranche issuance in the global markets, issuing an aggregate $1 billionprincipal amount of 2.5% bonds due 2030 and an aggregate $2 billion principal amount of 3.375% bonds due2050. In March 2020, Israel completed a triple-tranche issuance in the global markets, issuing an aggregate$2 billion principal amount of 2.75% bonds due 2030, an aggregate $2 billion principal amount of 3.875%bonds due 2050, and an aggregate $1 billion principal amount of 4.5% bonds due 2120. In April 2020, Israelcompleted an aggregate $5 billion principal amount of 3.8% bonds due 2060. This issuance was dual-listed onthe London Stock Exchange and, for the first time, on the Taiwanese Stock Exchange.
Institutional Investors. In recent years, the role of institutional investors in the Israeli capital marketsincreased significantly. The principal types of institutional investors in the Israeli market are pension funds,provident funds, severance pay funds (special funds established to hold assets set aside by employers for thepayment of severance obligations owed to their employees), advanced study funds, mutual funds and a varietyof life insurance savings plans. As of December 31, 2020, assets held by pension funds totaled $295 billion,assets held by provident funds totaled $175 billion, assets held by life insurance savings plans totaled$161 billion, and assets held by mutual funds totaled $99 billion.
D-84

PUBLIC FINANCE
General
The Government budget covers the expenditures and revenues of the central government and does notinclude the accounts of the National Insurance Institute, the National Institutions, local authorities, the Bankof Israel, or surpluses and deficits of Government authorities.
The Budget Process
The Government’s fiscal year ends on December 31. The annual budget preparation process generallybegins in April of each year when the Budget Department of the Ministry of Finance coordinates discussionsregarding the budget with the various ministries. During August and September of each year, the details ofthe budget are finalized within the Government. A proposed budget bill, together with all necessary supportinginformation, must be submitted to the Knesset for its approval no later than 60 days before the end of the year.Upon submission of its annual budget to the Knesset, the Government is required by law to include a three-year projected budget (containing less details than the annual budget). Following a review of the proposedannual budget by the Finance Committee of the Knesset, together with the relevant ministers and otherofficials, the Knesset votes on the approval of the annual budget into law.
Following the conclusion of the 2019 fiscal year and in the absence of a budget for 2020, the Basic Lawstates that the Government shall operate with a continuing budget. Successive elections over the years2019 – 2021 prolonged the duration of the continuing budget until the end of 2020. The government failed topass a budget at the end of 2020 and therefore the 2021 fiscal year also began without an approved budget andis operating based on a continuing budget.
Fiscal Framework
The Deficit Reduction and Budgetary Expenditure Limitation Law (the “Deficit Reduction Law”), setstwo limitations on the deficit level and the growth rate of government expenditures, is integral to maintainingIsrael’s fiscal stability. The Deficit Reduction Law has contributed to a decline in the debt-to-GDP ratio overthe years prior to the COVID-19 period. In 2020 due to the pandemic there was an increase in governmentdebt, which serves as a key indicator of economic stability.
In response to persistent budget deficits, the Knesset passed the Deficit Reduction Law in 1992. InJuly 2012, a six year plan for 2013 – 2019 was approved by the Government. This plan set the budget deficittarget at 3% of GDP in 2013, 2.75% in 2014, 2.5% in 2015, 2% in 2016 and 2017, 1.75% in 2018 and 1.5% from2019 and onwards. This plan was revised in May 2013 to 4.3% for 2013 and 3% for 2014 in light of the lateapproval of the 2013 – 2014 budget. In November 2015, a seven-year plan for 2015 – 2021 was approved in itsthird reading by the Knesset; this plan set the budget deficit target at 2.9% of GDP in 2015, 2.9% in 2016, 2.5%in 2017, 2.25% in 2018, 2% in 2019, 1.75% in 2020 and 1.5% from 2021 and onwards. Following the revisionsto the 2017 – 2018 biennial budget, the budget deficit target was amended to 2.9% of GDP for 2017 and 2018and 2.5% in 2019, to be followed by annual reductions of 0.25% until reaching a target of 1.5% in 2023.Following the revisions to the 2019 budget, in March 2018, the deficit target for 2019 was approved at 2.9% ofGDP and for 2020 at 2.5% GDP, to be followed by annual reductions of 0.25% until reaching 1.5% in 2024.
In the framework of certain amendments to the Deficit Reduction Law, the Knesset approved additionalrestrictions on government expenditures. Pursuant to these restrictions, aggregate government expenditureswere not allowed to increase by more than 1% compared to the previous year (indexed to the CPI) in 2005 and2006 and by 1.7% (indexed to the CPI) year-over-year from 2007 and onwards. Under the restrictions, upwardrevision of expenditures was subject to preserving the annual deficit target.
In May 2010, the Knesset, in accordance with the Government proposal, amended the Deficit ReductionLaw. Under the amendment, real growth of government expenditures will equal a ratio of 60% (the medium-term target) divided by the last known debt/GDP ratio, multiplied by the average GDP growth rates duringthe ten previous years for which GDP data from the Central Bureau of Statistics is available.
Therefore, the calculated growth rate of government expenditures will be a derivative of the differencebetween the debt target and long-term growth rate.
D-85

In 2014, another amendment to the Deficit Reduction Law was made. Under this amendment, real growthof government expenditures may not exceed the average population growth rate in the last three years plus theratio of the medium-term debt target (50%) and current debt-to-GDP ratio. The increase in expenditureresulting from the new rule allows a consistent increase in expenditure per capita.
If the increase in the expenditure rate (calculated according to the new expenditure ceiling) leads to adeviation from the deficit target, the expenditure growth rate will be reduced accordingly or governmentrevenues will need to be increased. The Expenditure Law sets a ceiling on expenditures that relies on actualfigures as opposed to forecasts, thereby increasing the simplicity, transparency and credibility of theGovernment’s fiscal policy. Starting with the 2017 – 2018 budget, the expenditure ceiling is calculated innominal terms and by indexing the ceiling to the average actual price (represented by the CPI) using data fromthe three preceding years.
In 2015 as part of its approval of the 2015 – 2016 budget and the economic plan, the Knesset approvedlegislation under the framework of the Budget Foundations Law, which specifies a medium-term budgetframework. This bill came into force January 1, 2016 and consists of the following:
• The bi-annual mandatory publication of fiscal frameworks and governmental obligations for the threefollowing years.
• Required consolidation to meet multi-year expenditure limits, starting with the budget for fiscal year2017, which limits the ability of the Government to make new financial commitments without firstpresenting a budgetary source. The Government will not be able to take on new commitments or reducetaxes if it exceeds the multiyear expenditure rule or the deficit ceilings, respectively.
In 2020, due to the rapidly changing economic situation resulting from the COVID-19, the ceiling onincrease in government expenditures was revised to allow for a temporary increase beyond the ceilings set outin the Expenditure Law of 21.34% and 12.69% for the fiscal years 2020 and 2021, respectively. By law, theadditional expenditure is to only serve needs directly related to the COVID-19 crisis and efforts to promote aswift recovery. These increases to the ceiling are not to be taken into account in calculating future expenditureceilings and are therefore temporary.
Absent approval by the Knesset, government ministries may not spend in excess of their respectivebudgets. However, budgeted amounts not spent by the Government in a given year may, upon notice to theFinance Committee of the Knesset and with the approval of the Minister of Finance, be carried over to thefollowing year. The deficit target established pursuant to the Deficit Reduction Law refers to the budget asproposed by the Government, rather than actual expenditures and revenues. Therefore, no adjustment togovernment expenditures is required by law if the actual deficit misses the deficit target due to eithergovernment revenues or actual GDP that were different than had been anticipated. The Government financesits deficits mainly through a combination of local currency and foreign currency debt, and some proceedsfrom privatization.
For each year from 2016 through 2020, the total budget deficit, excluding net allocation of credit, asa percentage of GDP was 2.1%, 1.9%, 2.9%, 3.7% and 11.6%, respectively. In 2016, the deficit was 2.1%,approximately 0.7% lower than target; the deviation is primarily attributable to higher than expected revenues(approximately NIS 9 billion). In 2017, the deficit was 1.9%, approximately 1% lower than target; the deviationis primarily attributable to non-recurring revenues (approximately NIS 12 billion) resulting from taxation ofcapital gains on large sales of high-tech companies and a tax collection campaign directed at wallet companies(service provider companies that are owned and operated by a single individual). In 2018, the deficit was 2.9%,and was on target and in 2019 the deficit was 3.7% approximately 0.8% above the 2.9% target mainly due tolower than expected revenues and a slight increase in overall expenditure above the budget forecast. In 2020the deficit was 11.6%, approximately 9.1% higher than the deficit target due to the sharp increase inexpenditures and the reductions in revenues resulting from the economic impact of COVID-19.
The following table sets forth the Government deficit and its financing. Domestic expenditures constituteall expenditures by the Government made in Israel. Domestic revenues constitute all taxes collected in Israel.The Government accounts for domestic expenditures and revenues as a method of measuring the influence ofthe Government on the domestic economy. The table presents the gross budget figures, including revenue-dependent expenditures and contributions from the budget to National Insurance Institute.
D-86

Table No. 28
The Budget Deficit and Its Financing(In Millions of NIS at Current Prices)
Actual 2016 Actual 2017 Actual 2018 Actual 2019 Actual 2020
Surplus (Deficit) to be Financed . . . . . . . . . . -22,816 -22,868 -37,348 -51,629 -159,574Surplus (Deficit) Excluding Net Credit . . . . . . -25,518 -24,617 -38,739 -52,192 -160,105Adjustments needed to cash basis . . . . . . . . . -582 -1,099 203 662 498Revenues Excluding Principle . . . . . . . . . . . . 321,919 335,959 338,818 346,511 317,814Total tax revenue excl. VAT on Security
imports . . . . . . . . . . . . . . . . . . . . . . . . . 282,704 306,493 306,362 316,363 310,564Income and Purchase tax . . . . . . . . . . . . . 143,621 168,406 162,176 168,022 166,945Customs and VAT excl. VAT on Defense
imports . . . . . . . . . . . . . . . . . . . . . . . 132,369 131,678 137,351 141,430 137,194Fees . . . . . . . . . . . . . . . . . . . . . . . . . . . 6,714 6,409 6,835 6,912 6,425
VAT on Defense imports . . . . . . . . . . . . . . . 1,378 1,128 2,014 1,040 1,373Interest and principal collections . . . . . . . . . 868 837 777 388 322Loans from the Social Security . . . . . . . . . . 23,189 21,700 23,500 22,750 1,300Grants . . . . . . . . . . . . . . . . . . . . . . . . . . . 10,607 0 0 0 0Other Revenues . . . . . . . . . . . . . . . . . . . . . 3,173 5,800 6,165 5,969 4,256Expenditures excluding credit . . . . . . . . . . . . 346,855 359,477 377,759 399,365 478,417Ministries excluding credit . . . . . . . . . . . . . . 298,026 310,087 327,942 347,988 426,701
Government administration . . . . . . . . . . . 49,258 52,137 56,281 59,991 61,215Social services . . . . . . . . . . . . . . . . . . . . . 146,969 159,384 169,064 179,903 220,948Economic services . . . . . . . . . . . . . . . . . . 25,685 29,675 32,556 35,662 46,028Defense . . . . . . . . . . . . . . . . . . . . . . . . . 72,952 64,899 67,701 69,709 71,467Other . . . . . . . . . . . . . . . . . . . . . . . . . . 3,161 3,993 2,341 2,722 27,043
Interest and principal payments, NationalInsurance Institute(1) . . . . . . . . . . . . . . . . 48,829 49,390 49,817 51,377 51,715
Net Credit . . . . . . . . . . . . . . . . . . . . . . . . . 2,702 1,749 1,391 563 531Total Income . . . . . . . . . . . . . . . . . . . . . . . 2,962 2,310 2,014 1,612 1,382Total Expenditure . . . . . . . . . . . . . . . . . . . 260 561 623 1,049 851Total financing . . . . . . . . . . . . . . . . . . . . . . 24,400 15,345 36,132 46,033 182,250Net Foreign Loans . . . . . . . . . . . . . . . . . . . 2,883 8,447 10,393 4,518 61,010Foreign Borrowings . . . . . . . . . . . . . . . . . . 11,614 13,508 13,701 17,413 74,420Foreign Loan Repayments . . . . . . . . . . . . . 8,731 5,062 3,308 12,895 13,410Net Domestic Loans . . . . . . . . . . . . . . . . . . 19,691 6,125 23,082 40,483 120,677Domestic Borrowings . . . . . . . . . . . . . . . . . 87,824 89,013 86,237 119,179 190,983Domestic Loan Repayments . . . . . . . . . . . . 68,132 82,888 63,154 78,696 70,306Net capital income . . . . . . . . . . . . . . . . . . . 1,826 773 2,658 1,032 562Cash Balance of the Government (at the end of
period)(2)(3)
Deposits in NIS . . . . . . . . . . . . . . . . . . . . . 9,700 12,836 11,056 10,207 35,337Deposits in foreign currency . . . . . . . . . . . . 12,425 12,151 16,591 12,378 11,009
Total . . . . . . . . . . . . . . . . . . . . . . . . . 22,125 24,987 27,647 22,585 46,346
(1) Interest payments and commissions are net of amounts attributable to indexation of NIS-linkedGovernment bonds and that portion of the interest payments on NIS loans attributable to inflation for
D-87

the year of payment. These amounts are included in the capital expenditures portion of the budget asdomestic loan repayments.
(2) Cash balances do not include social security reserves.(3) 2016, 2017, 2018 and 2019 data is restated.Sources: Ministry of Finance and Bank of Israel.
Socioeconomic Policy
In the budget and economic plan for 2015 – 2016, as well as in the biennial economic plan for fiscal years2017 – 2018, the Government continued to focus on two objectives of socioeconomic policy, increasingeconomic growth (by increasing labor productivity and competition in key markets) and reducing inequality.Additionally, an emphasis was placed on addressing inequalities, especially those suffered by economically-disadvantaged groups. Following the outbreak of COVID-19 induced economic crisis in 2020, the Governmentadopted a new approach, including four central components:
• Additional health expenditures and other COVID-19 associated costs to government operations.Increased outlays by government departments to ensure the smooth functioning of public services andthe adaptation of their services to changes in demand, supply chains and social behavior. Healthcareexpenditures in particular required significant increases due to the pressure on healthcare providers asa result of COVID-19.
• Comprehensive safety net including grants to businesses and enhanced unemployment benefits toprovide support to households and businesses facing unemployment, enforced closure or otherfinancial difficulties due to the economic crisis caused by COVID-19.
• Measures to support the provision of credit to businesses, primarily SMEs, in order to minimize theeconomic impact on the wider economy.
• Accelerated public investments in physical and digital infrastructure to facilitate strong recovery insupport of higher future growth.
As a result of these policies and the Israeli economy’s composition, with relatively low shares of theeconomy comprised of sectors especially vulnerable to COVID-19 effects, the reduction in GDP was relativelysmall in 2020 as compared with other developed countries. Upon formation of a new government, a newbudget and economic plan are expected to lay out a roadmap that will include substantial reforms.
Taxation and Tax Revenues
In 2020, the total tax burden (including government taxes, social security contributions, local authorities’taxes and VAT on defense imports) was 30.1% of GDP, compared to 30.4% in 2019, 31.1% in 2018 and 32.5%in 2017.
Israel maintains a progressive personal income tax system with, as of December 31, 2020, a top rate of50%, supplemented (up to a ceiling) by a 19.6% health and social security tax (including employercontribution) and a 23% corporate tax rate. Indirect taxes consist primarily of a 17% VAT rate. In addition,there are high sales taxes on cars, alcohol, fuel and tobacco.
As part of the Government’s policy to integrate Israel into the global economy, customs duties have beenlowered. While imports from the EU and the United States are duty-free, customs duties are applied on selectedimports from countries that have no trade agreements with Israel. Israel has signed free trade agreements withthe United States, EU, EFTA, Canada, Turkey, Egypt, Jordan, Mexico, Panama, the MERCOSUR countries,the Ukraine and the UK, which lowered customs duties on imports from such countries. In 1995, Israel andthe United States ratified a double taxation treaty that governs the income taxation of residents of the UnitedStates or Israel who conduct business or otherwise derive income in the other country, subject to the treaty’sjurisdiction. The treaty provides for, among other things, reduced rates of withholding tax on certain non-business income, such as dividends, interest and royalties that are sourced in Israel and derived by a resident ofthe United States. The treaty provides rules for the avoidance of double taxation through a foreign tax creditmechanism and allows for the resolution of disputes arising under the treaty through a mutual agreementprocedure involving the governing taxing authorities.
D-88

Starting in January 2003, Israel began implementing several comprehensive multi-year reforms to thedirect-tax system. The reforms provided for the gradual reduction of the corporate tax rate from 36% in 2003to 24% in 2011 while the top personal income tax rate decreased from 50% in 2003 to 45% in 2011. In 2012,this policy was temporarily reversed to increase revenues: the corporate tax rate was increased to 25% in 2012and to 26.5% in 2014. Budget improvements allowed for a decrease in the corporate tax rate to 24% in 2017and to 23% in 2018. In 2012, the top personal income tax rate was increased to 48%, and in 2013 an additional2% surtax was introduced on high income (earned and non-earned income) that exceeds NIS 800,000 per year.In 2017, the top personal income tax rate was decreased to 47%, but the additional surtax on high income wasincreased to 3% on total income above NIS 640,000 per year.
Israel does not have local taxes on the income of individuals or corporations, nor does it have alternativeminimum taxes. Real estate transactions are generally taxed on a real-profits basis and are subject to a turnovertax that varies according to the value of the transaction. Local authorities charge municipal tax on realproperty according to the size of the property, its location and use.
Due to COVID-19 and the restrictions implemented to contain its spread, total tax revenues fell by a2.8% in nominal terms, which led to a decrease in the tax burden from 30.4% of GDP in 2019 to 30.1% ofGDP in 2020. Both GDP and tax revenues are expected to recover in 2021.
Table No. 29
General Government Taxes(In Billions of NIS at Current Prices and in % of GDP)(1)
Actual 2016 Actual 2017 Actual 2018 Actual 2019 Actual 2020
Central Government . . . . . . . . . . . . . . . . . . 284.3 311.5 306.4 316.4 310.6Social Security . . . . . . . . . . . . . . . . . . . . . . 63.5 66.8 70.6 74.4 70.8Local Authorities and others . . . . . . . . . . . . 33.6 34.6 36.2 37.7 35.2Total . . . . . . . . . . . . . . . . . . . . . . . . . . . . . 381.4 413.0 413.2 428.5 416.6Total (in % of GDP) . . . . . . . . . . . . . . . . . . 31.1 32.5 31.1 30.4 30.1
(1) Including social security contributions, local authorities’ taxes and VAT on defense imports.Source: Ministry of Finance.
Local Authorities
Local authorities in Israel include 77 municipalities, 124 local councils, 54 regional councils and twoindustrial councils. The local authorities are required by law to provide certain basic social services. Localauthorities generally finance the provision of such services through local taxes (primarily property taxes) andthrough transfer payments from the Government. In addition, under certain circumstances, local authoritiesmay finance a portion of their activities through borrowing, while less financially sound local authorities mayreceive supplementary grants from the Ministry of the Interior. As of December 31, 2019, the total outstandingdebt of the local authorities was approximately NIS 15.1 billion. Transfer payments from the Government areallocated among all local authorities based on fixed criteria and for specific purposes, such as social services oreducation. The Government currently retains the power to approve changes in the levels of taxes imposed bylocal authorities. The aggregate deficit of all local authorities in 2019 was approximately NIS 3.4 billion.Government transfers to local authorities in 2019 totaled approximately NIS 29.5 billion.
Social Security System
National Insurance Law. Under Israel’s National Insurance Law, the National Insurance Institute of Israel(“NIOI”), an independent institution, provides a wide range of social security benefits, including old agepension benefits, unemployment insurance, long-term disability payments, worker’s compensation benefits,maternity support benefits and child support payments. In 2019, total expenditures by NIOI were NIS93.5 billion, as compared with NIS 87.1 billion in 2018 (these expenditures include payments made to NIOI
D-89

from non-contributory benefits). NIOI funds its expenditures using the proceeds of social security taxes paidby employers and employees, in addition to fees paid by the self-employed, unemployed, students and retirees;transfer payments from the Government pursuant to the National Insurance Law; and interest income ondeposits deriving from surpluses from previous years. NIOI also receives separate funds for non-contributoryNIOI benefit payments, including payments to new immigrants and other payments not covered by socialinsurance programs. In 2019, the Government’s transfer payments to NIOI totaled NIS 36.9 billion, and theGovernment’s share of NIOI’s provision for non-contributory payments totaled NIS 9.2 billion. In 2018, theGovernment’s transfer payments to NIOI totaled NIS 34.2 billion, and the Government’s share of NIOI’sprovision for non-contributory payments totaled NIS 9.5 billion. The aggregate amount of Governmenttransfer payments to NIOI in the 2020 budget was NIS 65.9 billion, of which NIS 19.2 billion wasCOVID-19-related funding, compared to an actual total Government transfer of NIS 46.6 billion in 2019.
Due to the COVID-19 crisis and the unemployment rate, the Government expanded the scope of socialbenefits for citizens through the NIOI system, resulting in a total of NIS 19.2 billion government transferpayments to the NIOI for COVID-19-related causes in 2020. These payments continued in 2021, with currentestimate totaling NIS 15.0 billion to be transferred to the NIOI in 2021.
Healthcare
Israel has an extremely advanced and efficient universal medical system, with four public health insuranceorganizations (also known as healthcare funds) and a ratio of one doctor for approximately every 300 people.Israel’s healthcare system receives very high ratings in health outcomes, including life expectancy and healthylife expectancy, infant mortality, public satisfaction polls, and for the scope of its preventative medicine.
Public healthcare expenditures in 2019 were NIS 68.4 billion and included government administration,hospitals and research, investments, public clinics and preventative medicine expenditures, among otherexpenditures. National expenditures on health as a percentage of GDP have remained constant at 7.6%. in2017. In 2018 and 2019, public expenditures were approximately 4.9% of GDP. A healthcare tax, which variesbased on gross salary and averages 5% of an individual’s gross salary, funds about 40% of the healthcaresystem, with the remainder funded by direct Government expenditure.
In 2015, the Government enacted legislation to better regulate the relationship between the private andpublic healthcare systems. The Government established new regulations for the private healthcare insurancemarket, with the purpose of reducing costs while improving availability. Furthermore, the regulations prohibitphysicians working in the public sector from referring patients from the public sector to their private clinics.The Government also allocated substantial additional funding to the public healthcare systems to improvequality and service.
In 2017, the Government enacted legislation to improve economic relations between insurers (healthcaremaintenance organizations or “HMOs”) and hospitals. The purchasing of hospital services, which thislegislation regulates, accounts for 37% of the public expenditure on healthcare. The legislation intends tocreate better incentives so that suitable services will be diverted from hospitals and developed and provided incommunity care, such as non-acute urgent medicine services. Furthermore, the legislation incentivizes hospitalsand insurers to shorten waiting times for surgeries.
In January 2018, the Government decided to fund and provide dental care for older people as part of thenational healthcare services, and as part of a broader plan designed to strengthen medical and social servicesto older people and increase healthy life expectancy, as well as decrease the share of private health expendituresin total expenditures on health.
In addition, the Government implemented mandatory reporting of all private health service providers’prices and profits to obtain better data for possible future regulation related to private suppliers and providers.
Pension Funds
Pension funds, together with life insurance policies and provident funds, are the principal instruments inIsrael for the investment and accumulation of retirement savings and provision for retirement income. Mostemployees who participate in a pension fund do so pursuant to an agreement between the pension fund, theemployer (or a representative organization for such employer) and the representative organization for such
D-90

employee. These agreements require that the employer and the employee each make a contribution to thepension fund. At retirement age, or at the time of another insurable event, the employee, or the employee’ssurvivors, becomes entitled to receive pension payments.
There are generally two types of pension funds in Israel: an older defined benefits pension fund and anewer defined contribution pension fund. In March 1995, in response to large and rising actuarial deficits ofIsrael’s pension funds, the Government adopted a new pension policy, including a comprehensive recoveryplan for existing pension funds. The primary elements of the recovery plan were: (i) then-existing pensionfunds would be closed to new entrants, but existing participants would continue to be covered under theexisting plans, subject to certain limitations on the future accumulation of benefits; (ii) the Minister of Financewas empowered by the Government to draft recovery plans for pension funds that were in an actuarial deficit,according to the principles established by the Government; (iii) the Minister of Finance, at his discretion, wasauthorized to continue to issue special Government bonds to pension funds in actuarial deficit for an interimperiod; and (iv) new members enrolling in pension programs would join newer, actuarially balanced funds thatwould operate separately and independently from existing funds, while benefits payable by the new pensionfunds would be subject to automatic reductions, to the extent necessary, to eliminate any actuarial fundingdeficit of such new funds.
In May 2003, as part of a general economic recovery plan, the Knesset approved a recovery plan for theolder pension funds to solve the problems of the active members and pensioners of the pension funds withactuarial deficits and to ensure continued payments to pensioners and those who will reach retirement age.
As of December 2020, Government obligations under the recovery plan stood at NIS 117.7 billion. In2020, the Government transferred NIS 5 billion from the State’s budget to the older pension funds that hadactuarial deficits. The funds will make up the remainder of the deficit by adjusting members’ benefits.Measures taken to adjust members’ benefits include Government-mandated uniform regulations for all funds,a uniform method of calculating wages for the purpose of calculating pension benefits, increased employeeand employer contribution rates, and an increase in the retirement age to limit the actuarial deficit and improvefund management. In addition, the Government ceased issuing certain types of designated government bonds,in which the older pension funds were heavily invested, and removed restrictions on both older and newerfunds that required a high percentage of assets to be invested in earmarked government bonds.
As of December 31, 2020, long-term investments totaled NIS 2,030 billion, of which NIS 507 billion wasinvested in new pension funds, NIS 442 billion was invested in old pension funds, NIS 517 billion was investedin life insurance policies and NIS 564 billion was invested in provident funds.
D-91

PUBLIC DEBT
General
After continuous consolidation of public debt over the past decade prior to the COVID-19 pandemic,public sector debt (“public debt”) as of December 31, 2020 was NIS 1,004.7 billion, of which NIS 983.9 billionwas central government debt.
The debt-to-GDP ratio is a key indicator in determining the credit rating and financial stability of thestate. In 2020, due to an increase in expenses in response to COVID-19, the public debt-to-GDP ratio increasedby 12.4%, ending the year at 72.4%.
Table No. 30
Government & Public Debt(In Billions of NIS at End of Year Prices)
2016 2017 2018 2019 2020
Central Government . . . . . . . . . . . . . . . . . . . . . . . . . . . . . . . . 740.8 747.1 788.3 823.2 983.9As percent of GDP . . . . . . . . . . . . . . . . . . . . . . . . . . . . . . . . 60.5% 58.9% 59.3% 58.5% 70.9%Other Public Agencies(1) . . . . . . . . . . . . . . . . . . . . . . . . . . . . . 20.4 21.9 21.7 21.0 20.8As percent of GDP . . . . . . . . . . . . . . . . . . . . . . . . . . . . . . . . 1.7% 1.7% 1.6% 1.5% 1.5%Total . . . . . . . . . . . . . . . . . . . . . . . . . . . . . . . . . . . . . . . . . . 761.2 769.1 810.0 844.1 1,004.7As percent of GDP . . . . . . . . . . . . . . . . . . . . . . . . . . . . . . . . 62.2% 60.6% 60.9% 60.0% 72.4%
(1) Including the debt of the local authorities, except the local authorities’ debt to the central Government.
Source: Bank of Israel; Ministry of Finance; Central Bureau of Statistics.
Central Government Debt
Central government debt increased in 2020 by 19.5% to NIS 983.9 billion, compared to NIS 823.2 billionin 2019. The majority of the nominal increase stems from a result of increased government expenses due toCOVID-19.
As indicated in the table below, total central government debt comprises the outstanding amounts oftradable local currency debt, non-tradable local currency debt and foreign currency debt.
D-92

Table No. 31
Central Government Debt(In Billions of NIS)
Segment Description 2016 2017 2018 2019 2020
Tradable Local Currency Debt Floating Rate 43.8 34.6 38.6 44.1 44.1Fixed Rate 219.4 221.7 228.1 237.9 310.7CPI-Linked 180.7 176.2 177.1 176.6 196.3Total 443.9 432.5 443.7 458.7 551.2
Non-Tradable Local CurrencyDebt(1) Pension 141.8 157.5 171.3 192.7 210.0
Insurance 50.3 51.5 52.1 54.5 54.5Other 7.9 7.5 7.5 7.6 7.5Total 199.9 216.6 230.9 254.7 271.9
Foreign Currency Debt Israel Bonds 18.1 17.3 19.1 17.8 18.0Sovereign bonds 39.9 47.2 60.1 62.0 117.0Other (including loan facilities) 2.8 2.4 2.3 1.8 1.6Bonds guaranteed by the USA 36.1 31.2 32.3 28.1 24.2Total 97.0 98.1 113.7 109.8 160.8
Total Government Debt 740.8 747.1 788.3 823.2 983.9
(1) All non-tradable local currency debt is CPI-linked.
Source: Ministry of Finance.
Maturity of Debt
The average time to maturity of central government debt was 9.2 years at the end of 2020, compared to8.2 years at the end of 2019.
Table No. 32
Maturity of Debt — Average Time to Maturity(In Years)
2016 2017 2018 2019 2020
Domestic Debt . . . . . . . . . . . . . . . . . . . . . . . . . . . . . . . . . . . . . . . . . . 7.5 7.9 8.0 8.1 8.1Foreign Debt . . . . . . . . . . . . . . . . . . . . . . . . . . . . . . . . . . . . . . . . . . . 7.2 7.2 7.2 8.9 15.6Total Debt . . . . . . . . . . . . . . . . . . . . . . . . . . . . . . . . . . . . . . . . . . . . . 7.5 7.8 7.9 8.2 9.2
Source: Ministry of Finance.
In recent years, the Ministry of Finance has taken some major steps to increase the transferability andliquidity of its bonds. Between 1995 and 2020, the CPI-linked component in the overall domestic tradabledebt decreased from 81% to 36%, and the USD-linked component decreased from 10.1% to 0%.Correspondingly, the Ministry of Finance reduced the number of bond series it issues and increased theaverage size per issue. As a result, the number of traded bond series fell sharply, from 215 in 1995 to only 33 atthe end of 2020. In 2020, three series matured and six series were issued. The average series size increased,from NIS 0.7 billion to NIS 16 billion over the same period.
D-93

Table No. 33
Annual Local Currency Government Debt Issuances(Gross Proceeds in Billions of NIS)
2016 2017 2018 2019 2020
Total IssuancesTradable . . . . . . . . . . . . . . . . . . . . . . . . . . . . . . . . . . . . . . . . . . . . . . 64 59 61 87 165Non-Tradable . . . . . . . . . . . . . . . . . . . . . . . . . . . . . . . . . . . . . . . . . . . 24 30 26 32 26Total . . . . . . . . . . . . . . . . . . . . . . . . . . . . . . . . . . . . . . . . . . . . . . . . . 88 89 87 119 191
Source: Ministry of Finance.
Domestic Government Debt
Domestic government debt comprises tradable and non-tradable debt. As of December 31, 2020,domestic government debt stood at NIS 823.2 billion, out of which NIS 551.2 billion was tradable debt,compared to NIS 271.9 billion in non-tradable debt. This reflects a 15.4% increase in total domesticgovernment debt compared to 2019.
External Government Debt
As of December 31, 2020, the Government’s external debt stood at NIS 160.7 billion.
Table No. 34
Composition of External Government Debt(In Billions of USD)
2016 2017 2018 2019 2020
U.S. Loan Guarantees . . . . . . . . . . . . . . . . . . . . . . . . . . . . . . . . . . . . 9.4 9.0 8.6 8.1 7.5Sovereign Issuances . . . . . . . . . . . . . . . . . . . . . . . . . . . . . . . . . . . . . 10.4 13.6 16.0 17.9 36.4Israel Bonds Organization . . . . . . . . . . . . . . . . . . . . . . . . . . . . . . . . . 4.7 5.0 5.2 5.2 5.7Other . . . . . . . . . . . . . . . . . . . . . . . . . . . . . . . . . . . . . . . . . . . . . . . 0.7 0.7 0.6 0.5 0.5Total External Debt . . . . . . . . . . . . . . . . . . . . . . . . . . . . . . . . . . . . . 25.2 28.3 30.4 31.8 50.1
Over the last decade, Israel has made a major shift away from its classic external borrowing vehicle, theState of Israel Bonds Organization (“Israel Bonds”), in favor of public sovereign issuances. Nonetheless,Israel Bonds remain a reliable and important source of financing for the State, particularly under adversecircumstances, due to the special characteristics of the investors, individuals and institutions, including theworldwide Jewish community that has an interest in Israel. Israel Bonds raises capital through the followingthree organizations: Development Corporation for Israel (DCI), Development Company for Israel(International) Limited and Canada-Israel Securities, Limited (CISL). Bonds and notes issued through IsraelBonds are not transferable (except pursuant to certain exceptions). The State expects to continue issuingbonds through Israel Bonds in the future. As of December 31, 2020, the outstanding balance of bonds andnotes issued through Israel Bonds was approximately $5.7 billion, representing approximately 11% of Israel’sgovernmental external debt. In 2020, the total funds raised through Israel Bonds amounted to $1.81 billion, a38% increase from the $1.31 billion raised in 2019.
Table No. 35
Total Funds Raised by Israel Bonds(In Billions of USD)
2016 2017 2018 2019 2020
Funds raised . . . . . . . . . . . . . . . . . . . . . . . . . . . . . . . . . . . . . . . . . . 1.31 1.27 1.26 1.31 1.81
Source: Ministry of Finance.
D-94

Israel maintains a close economic, diplomatic, and military relationship with the United States. Israelreceives economic and military assistance from the United States in amounts that have averaged approximately$3 billion per year since 1987.
In 1992, the United States approved up to $10 billion in loan guarantees during U.S. fiscal years 1993through 1998 to help Israel absorb the influx of immigrants over this period. Israel completed its financingsunder this program in January 1998. In April 2003, the United States approved up to $9 billion in additionalloan guarantees for Israel to be issued during U.S. government fiscal years 2003 through 2005, with an optionto extend the program an additional year. In the years 2005, 2006, 2012, 2015, and 2019 the United Statesapproved Israel’s request to extend the $9 billion program which, as of the last extension, is currently set toexpire on September 30, 2023 with all unused guarantee amounts available for use until September 30, 2024.Between September 2003 and November 2004, Israel issued guaranteed notes totaling $4.1 billion face value.Israel has not issued any notes under the $9 billion loan guarantee program since November 2004, and$3.8 billion in U.S. loan guarantees (subject to the reductions described below) remains available. The $9 billionloan guarantee program aims to support Israel’s comprehensive economic program and to create conditionsfor high and sustainable growth. The amount of guarantees that may be issued to Israel under the loanguarantee program may be reduced by an amount equal to the amount extended or estimated to have beenextended by Israel for activities that the President of the United States determines as inconsistent with theobjectives and understandings reached between the United States and Israel regarding the implementation ofthe loan guarantee program. Under the program, the United States issues guarantees with respect to allpayments of principal and interest on certain bonds issued by Israel. The proceeds of the guaranteed loansmay be used to refinance existing debt. The Government has made certain commitments with respect to itscomprehensive economic plan in connection with the loan guarantee program.
Derivatives and Hedging Transactions
Israel has never utilized and currently does not anticipate utilizing derivative instruments for speculativepurposes. As of December 31, 2020, the total debt denominated in foreign currency amounted to NIS160.7 billion, which comprised 16% of total government debt. In addition, the mix of foreign currency debt ischaracterized by the dominance of USD-denominated debt. As of December 31, 2020, 67% of foreigncurrency debt was USD-denominated, 31% was denominated in Euro and the remainder was in othercurrencies. Israel carries out hedging transactions, short-term USD-NIS forward transactions, short-termEUR-NIS forward transactions and long-term swap transactions. USD-NIS swap transactions enable thereduction of exposure to foreign currency risk, and EUR-USD transactions enable diversification of suchexposure. As of December 31, 2020, the composition of Israel’s hedged debt portfolio was as follows: 59%USD, 26% Euro, 14% NIS and 1% in other currencies.
Hedging transactions enable the reduction of market risk (currency risk) but expose Israel to credit risk,particularly counterparty risk. Credit risk is managed within the framework of shelf agreements by theInternational Swap and Derivative Association (ISDA). ISDA regulates the legal processes for the transfer ofguarantees. In accordance with ISDA’s Credit Support Annex, a margin call is carried out according to the fairvalue of the transaction (mark-to-market) and the threshold is set forth in the agreement.
As of December 31, 2020, Israel’s stock of swap transactions amounted to $9.1 billion, of which EUR-NIS transactions amounted to $3.0 billion. USD-NIS transactions amounted to $5.75 billion, JPY-EURtransactions amounted to $303 million and USD-CPI-linked NIS transactions amounted to $50 million. Asof December 31, 2020, the mark-to-market value of all transactions stood at $545 million in favor of thecounterparties.
D-95

Table No. 36
Foreign Currency Debt of the Government of Israel(Debt Outstanding as of December 31, 2020)
MM $ USD CAD EUR GBP JPY Total
State of Israel bonds . . . . . . . . . . . . . . . . . . . . . . . . . . 5,247 446 24 22 — 5,739Loans from foreign governments and other loans . . . . . . . . 247 — 256 — — 503Tradable bonds guaranteed by the U.S. Government . . . . . 7,530 — — — — 7,530Sovereign bonds – unguaranteed . . . . . . . . . . . . . . . . . . . 20,669 — 15,250 160 301 36,380Total . . . . . . . . . . . . . . . . . . . . . . . . . . . . . . . . . . . . . 33,693 446 15,530 182 301 50,152
Source: Ministry of Finance.
Net Public Debt
Net public debt as of December 31, 2020 was NIS 946.63 billion (68.3% of GDP), comprising NIS785.9 billion in local currency debt and NIS 160.8 billion in foreign currency debt. In 2019, the net public debtstood at NIS 805.4 billion (57.2% of GDP). In 2020 the ratio of net public debt-to-GDP increased by 11.0%,which was primarily attributable to the COVID-19 pandemic, its effects on the Israeli economy, and theGovernment’s response to the pandemic. The Government deficit increased from 3.7% of GDP in 2019 to11.6% of GDP in 2020, due to its expenditures on COVID-19 support programs that lowered eligibilitystandards and extended length of unemployment benefits, provided support grants to business and the self-employed, established programs to stimulate employment, and increased healthcare spending. A significantsecondary cause of the rise in Net Debt to GDP was the anomalous 1.4% drop in nominal GDP in 2020 as aresult of COVID-19. Nominal GDP rose by 5.2% on average from 2000 to 2020, and real GDP rose by 3.3%on average over the same period.
Table No. 37
Net Public Debt(1)
(In Billions of NIS at Current Prices)
2016 2017 2018 2019 2020
Local Currency(2) . . . . . . . . . . . . . . . . . . . . . . . . . . . . . . . . . . 619.0 624.7 649.8 695.9 785.9Foreign Currency(3) . . . . . . . . . . . . . . . . . . . . . . . . . . . . . . . . . 97.0 98.1 113.7 109.4 160.8Total . . . . . . . . . . . . . . . . . . . . . . . . . . . . . . . . . . . . . . . . . . . 715.9 722.8 763.5 805.4 946.6
(1) Net public debt includes the debt of the local authorities, except the local authorities’ debt to the centralGovernment.
(2) In 2020, domestic net public debt increased in real terms (at end-of-year 2019 constant prices) by 13.03%,to NIS 786.6 billion.
(3) Foreign currency debt, for this purpose, does not include nonresidents’ holdings of NIS-denominatedGovernment bonds issued in the domestic market and includes residents’ holdings of foreign currency-denominated Government bonds issued in the global market.
Source: Bank of Israel.
D-96

Table No. 38
Ratio of Net Public Debt to GDP(Percent of Annual GDP at Current Prices)
2016 2017 2018 2019 2020
Local Currency . . . . . . . . . . . . . . . . . . . . . . . . . . . . . . . . . . . . . . . . 50.6% 49.2% 48.9% 49.5% 56.7%Foreign Currency(1) . . . . . . . . . . . . . . . . . . . . . . . . . . . . . . . . . . . . . 7.9% 7.7% 8.5% 7.8% 11.6%Total . . . . . . . . . . . . . . . . . . . . . . . . . . . . . . . . . . . . . . . . . . . . . . . 58.5% 56.9% 57.4% 57.3% 68.3%
(1) Foreign currency public debt is defined as the Government’s foreign-currency denominated liabilities.Source: Bank of Israel; Central Bureau of Statistics.
Domestic Public Debt
Domestic net public debt is defined in the consolidated balance sheet of the Government and the Bank ofIsrael as gross domestic government debt plus the debt of local authorities, less the liabilities of private sectordebtors to the public sector and government deposits in the Bank of Israel. The net public debt includes debtof local authorities, but excludes their debt to the Government. As of December 31, 2020, the domestic netpublic debt was NIS 785.9 billion, as compared with NIS 695.9 billion as of December 31, 2019. The domesticpublic debt is comprised of transferable and non-transferable debt, which is raised through the issuance ofshekel-denominated bonds. Non-transferable debt is issued to institutional investors in Israel under set termsbased on long-standing arrangements. In recent years, the size and share of non-transferable debt as a portionof the total domestic debt has increased to approximately 33%, mainly due to the increase of pension fund-designated bond issuances (see “Public Finance — Pension Funds” above).
External Public Debt
Unless otherwise specified, and only for the purpose of the statistical data presented herein, Israel’s grossexternal debt is defined, in line with the IMF’s definition, as all external liabilities to nonresidents required tobe paid in both local and foreign currency by the public sector, the private sector and the banking system (notincluding mortgage banks, investment finance banks and financial institutions). For the purpose of thisdefinition, the public sector includes the Government, the Bank of Israel and the national institutions. Thedata presented does not include currency swap transactions.
The net external debt is defined as the public and private sectors’ external debt, less foreign (debtinstrument) assets of both sectors.
Table No. 39
Net External Debt(in Billions of USD)
2016 2017 2018 2019 2020
Net External Debt . . . . . . . . . . . . . . . . . . . . . . . . . . . . . . . -134.1 -164.2 -156.4 -170.3 -202.5As percent of GDP . . . . . . . . . . . . . . . . . . . . . . . . . . . . . . . -42.1% -46.5% -42.3% -43.1% -50.3%
Source: Bank of Israel; Central Bureau of Statistics.
The Government is the principal borrower of external public debt. In 2020, the public sector’s share ofgross external debt amounted to 47.7%, compared to 38.1% in 2019, 38.8% in 2018, 35.4% in 2017 and 31.8%in 2016. The share of the public sector gross external debt as a percentage of the total government debt was20.3% in 2020, compared to 16.5% in 2019, 17.4% in 2018, 14.8% in 2017 and 14.4% in 2016 (in each case, atyear-end).
Total public sector external debt in 2020 amounted to $62.2 billion, compared to $39.4 billion in 2019,$36.5 billion in 2018, $31.9 billion in 2017, and $27.7 billion in 2016. The total public sector external assets in
D-97

2020 amounted to $176.1 billion, compared to $128.8 billion in 2019, $118.0 billion in 2018, $115.7 billion in2017, and $101.4 billion in 2016.
The net external debt of the public sector is defined as the public sector’s external debt less foreign assetsof the public sector.
Table No. 40
Outstanding Public Sector External Debt(End-year Balances in Millions of USD)
2016 2017 2018 2019 2020
Public sector external debt(1)
Foreign governments and international institutions . . 1,656 1,679 1,580 1,462 1,527Negotiable bonds guaranteed by the U.S.
government . . . . . . . . . . . . . . . . . . . . . . . . . . . . 9,686 9,324 8,856 8,422 7,998Negotiable bonds – unguaranteed . . . . . . . . . . . . . . 11,643 15,882 20,815 24,123 46,926State of Israel bonds . . . . . . . . . . . . . . . . . . . . . . . 4,587 4,909 5,104 5,163 5,596Other . . . . . . . . . . . . . . . . . . . . . . . . . . . . . . . . . . 121 127 184 186 185Total . . . . . . . . . . . . . . . . . . . . . . . . . . . . . . . . . . 27,692 31,921 36,539 39,356 62,233Total public sector external assets . . . . . . . . . . . . . . . 101,415 115,691 118,023 128,816 176,144
Net public sector external debt . . . . . . . . . . . . . . . . . -73,723 -83,770 -81,484 -89,460 -113,911
(as percent of GDP) . . . . . . . . . . . . . . . . . . . . . . . . -23.1% -23.7% -22.0% -22.7% -28.3%
(1) Includes accrued interest.Source: Ministry of Finance and Bank of Israel.
Table No. 41
Forward Amortization of External Debt — Principal Payments(in Millions of USD)(1)
2021 2022 2023 2024 2025 2026 onwards
Public sector . . . . . . . . . . . . . . . . . . . . . . . . . . . . 8,033 5,574 4,861 6,723 1,704 32,011Foreign governments and international
institutions . . . . . . . . . . . . . . . . . . . . . . . . . . . 28 28 19 13 8 1,429Negotiable bonds guaranteed by the
U.S. government . . . . . . . . . . . . . . . . . . . . . . . 158 129 2,017 1,840 68 507Negotiable bonds – unguaranteed . . . . . . . . . . . 6,249 4,033 1,842 4,294 957 29,552State of Israel bonds . . . . . . . . . . . . . . . . . . . . . . 1,583 1,369 968 561 656 414Other . . . . . . . . . . . . . . . . . . . . . . . . . . . . . . . . . . 15 15 15 15 15 109Private sector . . . . . . . . . . . . . . . . . . . . . . . . . . . . 2,891 3,818 6,224 6,073 4,749 5,071Financial loans . . . . . . . . . . . . . . . . . . . . . . . . . . 1,243 1,658 2,072 2,072 1,243 0Bonds . . . . . . . . . . . . . . . . . . . . . . . . . . . . . . . . . 109 109 1,587 1,437 1,967 5,071Equity-holders’ loans . . . . . . . . . . . . . . . . . . . . . 1,539 2,051 2,564 2,564 1,539 0Total direct credit external liabilities (Debt
Instruments) . . . . . . . . . . . . . . . . . . . . . . . . . . 10,923 9,392 11,084 12,796 6,453 37,082
(1) Based on the debt balance as of the end of the period preceding the forecasted payments.Excludes trade credit and banking system data. The data do not include accrued interest.
Source: Ministry of Finance and Bank of Israel.
D-98

Table No. 42
Forward Amortization of External Debt — Interest Payments(In Millions of USD)(1)
2021 2022 2023 2024 2025 2026 onwards
Public sector . . . . . . . . . . . . . . . . . . . . . . . . . . . . 1,887 1,842 1,745 1,424 1,083 16,018Foreign governments and international
institutions . . . . . . . . . . . . . . . . . . . . . . . . . . . . 7 7 6 5 5 112Negotiable bonds guaranteed by the U.S.
government . . . . . . . . . . . . . . . . . . . . . . . . . . . 938 946 911 634 408 528Negotiable bonds – unguaranteed . . . . . . . . . . . . . 795 772 737 724 629 15,158State of Israel bonds . . . . . . . . . . . . . . . . . . . . . . . 134 104 79 49 30 55Other . . . . . . . . . . . . . . . . . . . . . . . . . . . . . . . . . 13 13 12 12 11 165Private sector . . . . . . . . . . . . . . . . . . . . . . . . . . . . 482 465 470 345 251 1,760Financial loans . . . . . . . . . . . . . . . . . . . . . . . . . . 84 71 54 33 13 0Bonds . . . . . . . . . . . . . . . . . . . . . . . . . . . . . . . . . 372 372 399 301 234 1,760Equity-holders’ loans . . . . . . . . . . . . . . . . . . . . . . 26 22 17 11 4 0Total direct credit external liabilities (Debt
Instruments) . . . . . . . . . . . . . . . . . . . . . . . . . . . 2,369 2,307 2,215 1,769 1,334 17,778
(1) Based on the debt balance as of the end of the period preceding the forecasted payments.Excludes trade credit and banking system data.
Source: Ministry of Finance and Bank of Israel calculations.
State Guarantees
In certain cases, the Government may issue financial guarantees to secure third-party obligations if itdetermines that the issuance of such guarantees is in the best interest of the State. These guarantees generallyrequire the payment of a fee. Each guarantee or guarantee program must be specifically approved in advanceby the Finance Committee of the Knesset, and the aggregate amount of all obligations issued under suchguarantees may not exceed 10% of the Government’s annual budget for the same year excluding developmentbudget. In exceptional circumstances, the Government may increase the rate to 25% for a period that may notexceed 18 months.
Government guarantees fall into four categories:
(i) Guarantees to support economic activities, including encouragement of capital investment andlending to SME;
(ii) Guarantees to support foreign trade, including export guarantees against foreign, political, andcommercial risks made through ASHR’A, the Israel Foreign Trade Risks Insurance CorporationLtd., a Government-controlled company, or through two private export insurance companies.
(iii) Special guarantees to support Government-controlled entities, including entities in the infrastructuresectors such as IEC, or to support other enterprises or activities on a case-by-case basis; and
(iv) Special Guarantees to support SME and large enterprises that were affected by the COVID-19pandemic. The Government has initiated two main programs in this category:
a) Establishing a dedicated guarantee loan fund designed for small, medium and large businesses.The purpose of the fund is to assist businesses that have encountered cash flow difficulties, dueto restrictions imposed by the Government to contain the spread of COVID-19, to obtain loansfrom the banking system. To further assist businesses in the recovery process and accelerate
D-99

business activity, the Government extended the initial loan repayment period from five toten years, and allowed a second grace period of up to an additional 12 months.
b) Assisting Israeli exporters and local businesses in the field of short-term credit insurance, duringthe COVID-19 period, with the aim of encouraging economic growth and employment byproviding a guarantee to top up cover beyond the basic coverage of the private insurancecompanies to their customers.
The guarantees, the associated fees and other receipts are included in the national accounts. As ofDecember 31, 2020, approximately $5 billion in State guarantees remained outstanding. The following tablesets forth the State guarantees granted to secure third parties’ indebtedness by category.
Table No. 43
State Guarantees(In Millions of NIS)
As of December 31, 2019 As of December 31, 2020
Grouping(1) Exposure
EffectiveLimits of the
Program Exposure
Small- and Medium-Sized Business Funds . . . . . . . . . . . . . . (i) 778 1,045 684Energy Efficiency Fund . . . . . . . . . . . . . . . . . . . . . . . . . . . (i) — 190 —International Trade . . . . . . . . . . . . . . . . . . . . . . . . . . . . . . (ii) 8,276 11,255 8,147Housing . . . . . . . . . . . . . . . . . . . . . . . . . . . . . . . . . . . . . (iii) 812 871 600Israel Electric Corporation Ltd . . . . . . . . . . . . . . . . . . . . . (iii) 282 215 215Small/Medium and Large-Sized Business Funds – COVID-19
Fiscal Plan . . . . . . . . . . . . . . . . . . . . . . . . . . . . . . . . . . (iv)(a) — 5,771 4,479Top Up Cover 2020 . . . . . . . . . . . . . . . . . . . . . . . . . . . . . (iv)(b) — 2,660 2,163Total . . . . . . . . . . . . . . . . . . . . . . . . . . . . . . . . . . . . . . . . 10,148 22,007 16,288
(1) Refers to groupings (i), (ii), (iii) and (iv) described in the first paragraph under “State Guarantees,” above.Source: Ministry of Finance.
D-100

DEBT RECORD
Israel has never defaulted on the payment of principal or interest on any of its internal or external debtobligations.
Loans from the Government of the Federal Republic of Germany
Interest Rate(%) Issue Date Maturity Currency
OutstandingAmount as of
December 31, 2020(In Millions)(1)
2.0 Dec.1991 Dec.2021 EUR 3.62.0 Dec.1992 Dec.2022 EUR 7.12.0 Dec.1993 Dec.2023 EUR 13.82.0 Dec.1994 Dec.2024 EUR 10.22.0 Jun.1995 Jun.2025 EUR 16.12.0 Dec.1996 Dec.2026 EUR 13.82.0 Jan.1998 Dec.2027 EUR 8.92.0 Sep.2000 Dec.2030 EUR 2.22.0 Dec.2001 Dec.2030 EUR 5.12.0 Dec.2003 Dec.2030 EUR 0.52.0 Dec.2004 Dec.2030 EUR 0.92.0 Aug.2005 Dec.2030 EUR 0.92.0 Dec.2006 Dec.2030 EUR 1.72.0 Dec.2007 Dec.2030 EUR 0.9
(1) Data excludes accrued interest on debt outstanding.
Source: Ministry of Finance.
Loans from Non-Israeli Banks
Interest Rate(%) Issue Date Maturity Currency
OutstandingAmount as of
December 31, 2020(In Millions)(1)
4.157 Dec.2009 Dec.2029 EUR 79.43.571 Jan.2012 Jan.2032 EUR 42.3
(1) Data excludes accrued interest on debt outstanding.
Source: Ministry of Finance.
D-101

International Capital Markets Issues
Interest Rate(%) Issue Date Maturity Currency
OutstandingAmount as of
December 31, 2020(In Millions)(1)(2)
7.25 Dec.1998 Dec.2028 USD 2506.875 Oct. 1999 Oct.2034 GBP 1004.00 Jan. 2012 Jun.2022 USD 1,5003.15 Jan. 2013 Jun.2023 USD 1,0004.5 Jan. 2013 Jan.2043 USD 1,000
2.875 Jan. 2014 Jan.2024 EUR 1,5004.5 Mar. 2016 Jan.2043 USD 500
2.875 Mar. 2016 Mar.2026 USD 1,0004.5 Oct. 2016 Jan.2043 USD 2001.5 Jan. 2017 Jan.2027 EUR 1,500
2.375 Jan. 2017 Jan.2037 EUR 7503.25 Jan. 2018 Jan.2028 USD 1,0004.125 Jan. 2018 Jan.2048 USD 1,0000.05 Jul. 2018 Jul.2021 EUR 2501.5 Jan. 2019 Jan.2029 EUR 1,2502.5 Jan. 2019 Jan.2049 EUR 1,2502.0 Jul. 2019 Jul.2069 EUR 5000.15 Aug. 2019 Aug.2026 JPY 15,0002.5 Jan. 2020 Jan.2030 USD 1,000
3.375 Jan. 2020 Jan.2050 USD 2,0002.875 Apr. 2020 Jan.2024 EUR 5001.5 Apr. 2020 Jan.2029 EUR 2002.75 Apr. 2020 Jul.2030 USD 2,0003.875 Apr. 2020 Jul.2050 USD 2,0004.5 Apr. 2020 Apr.2120 USD 1,0002.0 Apr. 2020 Jul.2069 EUR 1501.5 Apr. 2020 Jan.2029 EUR 200
2.875 Apr. 2020 Jan.2024 EUR 2502.875 May. 2020 Jan.2024 EUR 3503.8 May. 2020 May.2060 USD 5,0002.0 Jul. 2020 Jul.2069 EUR 3500 Jul. 2020 Jul.2022 EUR 5000 Jul. 2020 Jul.2022 EUR 950
0.315 Jul. 2020 Jul.2023 JPY 16,0001.5 Aug. 2020 Jan.2027 EUR 250
2.875 Oct. 2020 Jan.2024 EUR 5500 Oct. 2020 Jul.2022 EUR 600
2.875 Oct. 2020 Jan.2024 EUR 400
(1) Data excludes accrued interest on debt outstanding.(2) In January 2020, the Government raised $3 billion through a US registered bond offering, consisting of
an aggregate of $1 billion of 2.5% bonds due January 2030 and $2 billion of 3.375% bonds dueJanuary 2050.In April 2020, the Government raised $5 billion through a US registered bond offering, consisting of anaggregate of $2 billion of 2.75% bonds due July 2030, $2 billion of 3.875% bonds due July 2050, and$1 billion of 4.5% bonds due April 2120.
D-102

In May 2020, the Government raised and $5 billion through an EMTN offering of 3.8% bonds dueMay 2060.Between April and October 2020, the Government raised €5.25 billion in 13 tap offerings of its EMTNprogram, and in July 2020 the Government raised ¥16 billion in an EMTN offering.Source: Ministry of Finance
STATE OF ISRAEL BONDS
ISSUED THROUGH THE DEVELOPMENT CORPORATION FOR ISRAEL18K REPORT FOR BONDS AS OF DECEMBER 31, 2020
ISSUE INTEREST RATE % ISSUE DATE MATURITY DATE CCY
TOTALOUTSTANDING
(in millions)
DEVELOPMENT ISSUES
DEV-7TH AMENDED . . . . . . . . . . . . . 4.00 JAN 2006 – FEB 2006 JAN 2021 – FEB 2021 USD 1.16
DEV-7TH AMENDED . . . . . . . . . . . . . 4.00 JAN 2006 – FEB 2006 JAN 2021 – FEB 2021 USD 1.48
DEV INT’L-7TH AMENDED . . . . . . . . . . 4.00 JAN 2006 – FEB 2006 JAN 2021 – FEB 2021 USD 0.81
INSTITUTIONAL ISSUES
LFRI INSTITUTIONAL PP 7TH ISSUE 5YEARS . . . . . . . . . . . . . . . . . . . . . LIBORUSD06 – 1.10 APR 2016 – MAY 2016 APR 2021 – MAY 2021 USD 8.60
LFRI INSTITUTIONAL PP 8TH ISSUE 3YEARS . . . . . . . . . . . . . . . . . . . . . LIBORUSD06 – 0.60 FEB 2018 – MAR 2018 JUN 2021 – NOV 2021 USD 22.50
LFRI INSTITUTIONAL PP 8TH ISSUE 5YEARS . . . . . . . . . . . . . . . . . . . . . LIBORUSD06 – 1.00 – 1.10 JAN 2017 – MAR 2018 JAN 2022 – MAR 2023 USD 31.00
LFRI INSTITUTIONAL PP 9TH ISSUE 2YEARS . . . . . . . . . . . . . . . . . . . . . LIBORUSD06 – 0.25 – 0.45 FEB 2019 – NOV 2019 FEB 2021 – NOV 2021 USD 1.55
LFRI INSTITUTIONAL PP 9TH ISSUE 3YEARS . . . . . . . . . . . . . . . . . . . . . LIBORUSD06 – 0.55 JUN 2018 – JUN 2018 JUN 2021 – JUN 2021 USD 2.00
USD LFRI INSTITUTIONAL PP 9TH ISSUE5 YEARS . . . . . . . . . . . . . . . . . . . . LIBORUSD06 – 0.85 – 0.95 MAY 2018 – SEP 2018 MAY 2023 – SEP 2023 USD 6.00
INSTITUTIONAL JUBILEE PP 7TH ISSUE 3YEARS . . . . . . . . . . . . . . . . . . . . . 3.15 – 3.28 FEB 2018 – APR 2018 FEB 2021 – APR 2021 USD 65.30
INSTITUTIONAL JUBILEE PP 7TH ISSUE 5YEARS . . . . . . . . . . . . . . . . . . . . . 2.57 – 3.71 JAN 2016 – MAR 2018 JAN 2021 – MAR 2023 USD 155.50
INSTITUTIONAL JUBILEE PP 8TH ISSUE 2YEARS . . . . . . . . . . . . . . . . . . . . . 1.15 – 1.46 JUN 2020 – NOV 2020 JUN 2022 – NOV 2022 USD 15.00
INSTITUTIONAL JUBILEE PP 8TH ISSUE 3YEARS . . . . . . . . . . . . . . . . . . . . . 1.25 – 3.71 JUN 2018 – NOV 2020 JUN 2021 – NOV 2023 USD 99.80
INSTITUTIONAL JUBILEE PP 8TH ISSUE 5YEARS . . . . . . . . . . . . . . . . . . . . . 1.56 – 3.72 JAN 2019 – OCT 2020 JAN 2024 – OCT 2025 USD 190.40
INSTITUTIONAL REINVESTMENTBONDS
REINVESTMENT SAVINGS BOND 5TH
INTERN’L . . . . . . . . . . . . . . . . . . . 2.70 – 3.57 JAN 2018 – AUG 2018 JAN 2021 – AUG 2021 USD 0.24
REINVESTMENT SAVINGS BOND 6TH
INTERN’L . . . . . . . . . . . . . . . . . . . 2.41 – 3.54 OCT 2018 – AUG 2019 OCT 2021 – AUG 2022 USD 0.36
REINVESTMENT SAVINGS BOND 7TH
INTERN’L . . . . . . . . . . . . . . . . . . . 1.26 – 2.47 AUG 2019 – AUG 2020 AUG 2022 – AUG 2023 USD 1.52
REINVESTMENT SAVINGS BOND 8TH
INTERN’L . . . . . . . . . . . . . . . . . . . 0.28 – 1.24 SEP 2020 – DEC 2020 SEP 2023 – DEC 2023 USD 0.01
JUBILEE
JUBILEE 7TH ISSUE 10 Y CASH . . . . . . . 3.14 – 4.50 JAN 2011 – JUN 2013 JAN 2021 – JUN 2023 USD 338.07
JUBILEE 8TH ISSUE 10 Y CASH . . . . . . . 3.80 – 4.51 JUN 2013 – JUL 2014 JUN 2023 – JUL 2024 USD 255.43
JUBILEE 9TH ISSUE 10 Y CASH . . . . . . . 3.12 – 3.93 JUL 2014 – SEP 2015 JUL 2024 – SEP 2025 USD 144.25
D-103

ISSUE INTEREST RATE % ISSUE DATE MATURITY DATE CCY
TOTALOUTSTANDING
(in millions)
JUBILEE 10TH ISSUE 3 Y CASH . . . . . . . 2.45 – 3.13 JAN 2018 – APR 2018 JAN 2021 – APR 2021 USD 49.74
JUBILEE 10TH ISSUE 5 Y CASH . . . . . . . 2.25 – 3.60 JAN 2016 – APR 2018 JAN 2021 – APR 2023 USD 332.31
JUBILEE 10TH ISSUE 10 Y CASH . . . . . . 3.10 – 4.26 SEP 2015 – APR 2018 SEP 2025 – APR 2028 USD 216.25
JUBILEE 11TH ISSUE 2 Y CASH . . . . . . . 0.16 – 3.13 JAN 2019 – DEC 2020 JAN 2021 – DEC 2022 USD 879.75
JUBILEE 11TH ISSUE 3 Y CASH . . . . . . . 0.21 – 3.56 MAY 2018 – DEC 2020 MAY 2021 – DEC 2023 USD 511.77
JUBILEE 11TH ISSUE 5 Y CASH . . . . . . . 0.45 – 3.95 MAY 2018 – DEC 2020 MAY 2023 – DEC 2025 USD 519.67
JUBILEE 11TH ISSUE 10 Y CASH . . . . . . . 1.33 – 4.46 MAY 2018 – DEC 2020 MAY 2028 – DEC 2030 USD 163.03
JUBILEE 11TH ISSUE 15 Y CASH . . . . . . . 1.58 – 4.71 MAY 2018 – DEC 2020 MAY 2033 – DEC 2035 USD 51.18
JUBILEE 11TH ISSUE 2 Y FINANCING . . . 1.00 – 1.10 AUG 2020 – NOV 2020 AUG 2022 – NOV 2022 USD 26.10
JUBILEE 1ST INTERNATIONAL ISSUE 10YEARS . . . . . . . . . . . . . . . . . . . . . 3.75 – 4.51 JUN 2013 – NOV 2013 JUN 2023 – NOV 2023 USD 0.70
JUBILEE 2ND INTERNATIONAL ISSUE 10YEARS . . . . . . . . . . . . . . . . . . . . . 3.81 – 4.50 JAN 2014 – OCT 2014 JAN 2024 – OCT 2024 USD 1.60
JUBILEE 3RD INTERNATIONAL ISSUE 10YEARS . . . . . . . . . . . . . . . . . . . . . 3.31 – 3.93 NOV 2014 – OCT 2015 NOV 2024 – OCT 2025 USD 18.40
JUBILEE 4TH INTERNATIONAL ISSUE 5YEARS . . . . . . . . . . . . . . . . . . . . . 2.25 – 2.86 JAN 2016 – OCT 2016 JAN 2021 – OCT 2021 USD 2.52
JUBILEE 4TH INTERNATIONAL ISSUE 10YEARS . . . . . . . . . . . . . . . . . . . . . 3.10 – 3.91 OCT 2015 – OCT 2016 OCT 2025 – OCT 2026 USD 12.76
JUBILEE 5TH INTERNATIONAL ISSUE 5YEARS . . . . . . . . . . . . . . . . . . . . . 2.45 – 3.20 NOV 2016 – AUG 2017 NOV 2021 – AUG 2022 USD 4.41
JUBILEE 5TH INTERNATIONAL ISSUE 10YEARS . . . . . . . . . . . . . . . . . . . . . 3.12 – 4.08 OCT 2016 – AUG 2017 OCT 2026 – AUG 2027 USD 7.34
JUBILEE 6TH INTERNATIONAL ISSUE 3YEARS . . . . . . . . . . . . . . . . . . . . . 3.08 – 3.56 APR 2018 – SEP 2018 APR 2021 – SEP 2021 USD 0.84
JUBILEE 6TH INTERNATIONAL ISSUE 5YEARS . . . . . . . . . . . . . . . . . . . . . 2.96 – 3.94 NOV 2017 – AUG 2018 NOV 2022 – AUG 2023 USD 0.48
JUBILEE 6TH INTERNATIONAL ISSUE 10YEARS . . . . . . . . . . . . . . . . . . . . . 3.60 – 4.46 NOV 2017 – AUG 2018 NOV 2027 – AUG 2028 USD 9.58
JUBILEE 7TH INTERNATIONAL ISSUE 2YEARS . . . . . . . . . . . . . . . . . . . . . 2.27 – 3.13 JAN 2019 – AUG 2019 JAN 2021 – AUG 2021 USD 1.52
JUBILEE 7TH INTERNATIONAL ISSUE 3YEARS . . . . . . . . . . . . . . . . . . . . . 2.47 – 3.44 NOV 2018 – JUL 2019 NOV 2021 – JUL 2022 USD 0.72
JUBILEE 7TH INTERNATIONAL ISSUE 5YEARS . . . . . . . . . . . . . . . . . . . . . 2.65 – 3.95 OCT 2018 – JUL 2019 OCT 2023 – JUL 2024 USD 1.02
JUBILEE 7TH INTERNATIONAL ISSUE 10YEARS . . . . . . . . . . . . . . . . . . . . . 3.36 – 4.40 OCT 2018 – AUG 2019 OCT 2028 – AUG 2029 USD 5.27
JUBILEE 7TH INTERNATIONAL ISSUE 15YEARS . . . . . . . . . . . . . . . . . . . . . 3.60 – 4.56 OCT 2018 – JUL 2019 OCT 2033 – JUL 2034 USD 4.18
JUBILEE 8TH INTERNATIONAL ISSUE 2YEARS . . . . . . . . . . . . . . . . . . . . . 1.06 – 2.08 OCT 2019 – AUG 2020 OCT 2021 – AUG 2022 USD 35.27
JUBILEE 8TH INTERNATIONAL ISSUE 3YEARS . . . . . . . . . . . . . . . . . . . . . 1.24 – 2.15 NOV 2019 – AUG 2020 NOV 2022 – AUG 2023 USD 2.89
JUBILEE 8TH INTERNATIONAL ISSUE 5YEARS . . . . . . . . . . . . . . . . . . . . . 1.51 – 2.50 SEP 2019 – AUG 2020 SEP 2024 – AUG 2025 USD 1.27
JUBILEE 8TH INTERNATIONAL ISSUE 10YEARS . . . . . . . . . . . . . . . . . . . . . 2.33 – 3.20 SEP 2019 – JUL 2020 SEP 2029 – JUL 2030 USD 5.41
JUBILEE 8TH INTERNATIONAL ISSUE 15YEARS . . . . . . . . . . . . . . . . . . . . . 2.74 – 3.44 SEP 2019 – MAY 2020 SEP 2034 – MAY 2035 USD 0.31
JUBILEE 9TH INTERNATIONAL ISSUE 2YEARS . . . . . . . . . . . . . . . . . . . . . 1.00 – 1.10 SEP 2020 – NOV 2020 SEP 2022 – NOV 2022 USD 4.50
D-104

ISSUE INTEREST RATE % ISSUE DATE MATURITY DATE CCY
TOTALOUTSTANDING
(in millions)
JUBILEE 9TH INTERNATIONAL ISSUE 5YEARS . . . . . . . . . . . . . . . . . . . . . 0.51 DEC 2020 – DEC 2020 DEC 2025 – DEC 2025 USD 0.03
JUBILEE 9TH INTERNATIONAL ISSUE 10YEARS . . . . . . . . . . . . . . . . . . . . . 1.72 – 2.23 SEP 2020 – NOV 2020 SEP 2030 – NOV 2030 USD 1.14
JUBILEE 9TH INTERNATIONAL ISSUE 15YEARS . . . . . . . . . . . . . . . . . . . . . 2.48 NOV 2020 – NOV 2020 NOV 2035 – NOV 2035 USD 0.03
MACCABEE BONDS 7TH ISSUE 10 YEARS 3.20 – 3.51 AUG 2012 – JUN 2013 AUG 2022 – JUN 2023 USD 10.45
MACCABEE BONDS 8TH ISSUE 10 YEARS 3.67 – 4.30 JUN 2013 – JUL 2014 JUN 2023 – JUL 2024 USD 23.33
MACCABEE BONDS 9TH ISSUE 10 YEARS 2.97 – 3.80 JUL 2014 – SEP 2015 JUL 2024 – SEP 2025 USD 16.69
MACCABEE BONDS 10TH ISSUE 3 YEARS 2.30 – 2.98 JAN 2018 – APR 2018 JAN 2021 – APR 2021 USD 1.65
MACCABEE BONDS 10TH ISSUE 5 YEARS 2.10 – 3.44 JAN 2016 – APR 2018 JAN 2021 – APR 2023 USD 32.84
MACCABEE BONDS 10TH ISSUE 10YEARS . . . . . . . . . . . . . . . . . . . . . 2.95 – 4.11 SEP 2015 – APR 2018 SEP 2025 – APR 2028 USD 25.94
MACCABEE BONDS 11TH ISSUE 2 YEARS 0.16 – 2.98 JAN 2019 – DEC 2020 JAN 2021 – DEC 2022 USD 19.01
MACCABEE BONDS 11TH ISSUE 3 YEARS 0.21 – 3.41 MAY 2018 – DEC 2020 MAY 2021 – DEC 2023 USD 11.28
MACCABEE BONDS 11TH ISSUE 5 YEARS 0.45 – 3.80 MAY 2018 – DEC 2020 MAY 2023 – DEC 2025 USD 38.66
MACCABEE BONDS 11TH ISSUE 10YEARS . . . . . . . . . . . . . . . . . . . . . 1.28 – 4.31 MAY 2018 – DEC 2020 MAY 2028 – DEC 2030 USD 7.95
MACCABEE BONDS 11TH ISSUE 15YEARS . . . . . . . . . . . . . . . . . . . . . 1.43 – 4.56 MAY 2018 – DEC 2020 MAY 2033 – DEC 2035 USD 2.38
MACCABEE BONDS 2ND
INTERNATIONAL ISSUE 10Y . . . . . . . 3.61 – 4.16 FEB 2014 – OCT 2014 FEB 2024 – OCT 2024 USD 0.13
MACCABEE BONDS 3RD
INTERNATIONAL ISSUE 10Y . . . . . . . 3.30 – 3.78 NOV 2014 – OCT 2015 NOV 2024 – OCT 2025 USD 0.12
MACCABEE BONDS 4TH
INTERNATIONAL ISSUE 5Y . . . . . . . 2.11 – 2.71 JAN 2016 – JUL 2016 JAN 2021 – JUL 2021 USD 0.08
MACCABEE BONDS 4TH
INTERNATIONAL ISSUE 10Y . . . . . . . 3.01 – 3.76 NOV 2015 – AUG 2016 NOV 2025 – AUG 2026 USD 0.15
MACCABEE BONDS 5TH
INTERNATIONAL ISSUE 5Y . . . . . . . 2.77 – 2.90 FEB 2017 – JUL 2017 FEB 2022 – JUL 2022 USD 0.06
MACCABEE BONDS 5TH
INTERNATIONAL ISSUE 10Y . . . . . . . 3.58 – 3.84 FEB 2017 – JUL 2017 FEB 2027 – JUL 2027 USD 0.03
MACCABEE BONDS 6TH
INTERNATIONAL ISSUE 10Y . . . . . . . 4.03 – 4.31 APR 2018 – AUG 2018 APR 2028 – AUG 2028 USD 0.11
MACCABEE BONDS 6TH
INTERNATIONAL ISSUE 3Y . . . . . . . 2.98 – 3.41 APR 2018 – AUG 2018 APR 2021 – AUG 2021 USD 0.04
MACCABEE BONDS 6TH
INTERNATIONAL ISSUE 5Y . . . . . . . 2.88 – 3.70 OCT 2017 – AUG 2018 OCT 2022 – AUG 2023 USD 0.05
MACCABEE BONDS 7TH
INTERNATIONAL ISSUE 2Y . . . . . . . 2.18 – 2.98 JAN 2019 – AUG 2019 JAN 2021 – AUG 2021 USD 0.10
MACCABEE BONDS 7TH
INTERNATIONAL ISSUE 3Y . . . . . . . 2.76 – 3.00 DEC 2018 – APR 2019 DEC 2021 – APR 2022 USD 0.05
MACCABEE BONDS 7TH
INTERNATIONAL ISSUE 5Y . . . . . . . 2.53 – 3.70 NOV 2018 – AUG 2019 NOV 2023 – AUG 2024 USD 0.05
MACCABEE BONDS 7TH
INTERNATIONAL ISSUE 10Y . . . . . . . 3.27 – 4.25 OCT 2018 – JUL 2019 OCT 2028 – JUL 2029 USD 0.21
MACCABEE BONDS 7TH
INTERNATIONAL ISSUE 15Y . . . . . . . 4.46 NOV 2018 – NOV 2018 NOV 2033 – NOV 2033 USD 0.02
MACCABEE BONDS 8TH
INTERNATIONAL ISSUE 2Y . . . . . . . 0.91 – 1.78 DEC 2019 – AUG 2020 DEC 2021 – AUG 2022 USD 0.07
MACCABEE BONDS 8TH
INTERNATIONAL ISSUE 3Y . . . . . . . 1.10 – 2.00 DEC 2019 – AUG 2020 DEC 2022 – AUG 2023 USD 0.10
D-105

ISSUE INTEREST RATE % ISSUE DATE MATURITY DATE CCY
TOTALOUTSTANDING
(in millions)
MACCABEE BONDS 8TH
INTERNATIONAL ISSUE 5Y . . . . . . . 1.40 – 2.26 OCT 2019 – JUL 2020 OCT 2024 – JUL 2025 USD 0.07
MACCABEE BONDS 8TH
INTERNATIONAL ISSUE 10Y . . . . . . . 2.34 – 3.22 AUG 2019 – MAR 2020 AUG 2029 – MAR 2030 USD 0.06
MACCABEE BONDS 9TH
INTERNATIONAL ISSUE 2Y . . . . . . . 0.86 NOV 2020 – NOV 2020 NOV 2022 – NOV 2022 USD 0.01
MACCABEE BONDS 9TH
INTERNATIONAL ISSUE 3Y . . . . . . . 0.95 NOV 2020 – NOV 2020 NOV 2023 – NOV 2023 USD 0.01
MACCABEE BONDS 9TH
INTERNATIONAL ISSUE 5Y . . . . . . . 0.51 – 1.30 SEP 2020 – DEC 2020 SEP 2025 – DEC 2025 USD 0.01
MACCABEE BONDS 9THINTERNATIONAL ISSUE 15Y . . . . . . . 2.3 SEP 2020 – SEP 2020 SEP 2035 – SEP 2035 USD 0.01
LIBOR FLOATING RATE ISSUE BONDS
LFRI 16TH ISSUE 2Y FINANCING . . . . . . LIBORUSD06 – 0.50 – 0.90 JAN 2019 – SEP 2020 JAN 2021 – SEP 2022 USD 110.33
LFRI 4TH INTERNATIONAL ISSUE 5YEARS CASH . . . . . . . . . . . . . . . . . LIBORUSD06 – 0.95 – 1.10 FEB 2016 – OCT 2016 FEB 2021 – OCT 2021 USD 40.02
LFRI 5TH INTERNATIONAL ISSUE 5YEARS CASH . . . . . . . . . . . . . . . . . LIBORUSD06 – 0.90 – 1.00 OCT 2016 – JUL 2017 OCT 2021 – JUL 2022 USD 30.73
LFRI 6TH INTERNATIONAL ISSUE 3YEARS CASH . . . . . . . . . . . . . . . . . LIBORUSD06 – 0.30 – 0.45 FEB 2018 – SEP 2018 FEB 2021 – SEP 2021 USD 0.51
LFRI 6TH INTERNATIONAL ISSUE 5YEARS CASH . . . . . . . . . . . . . . . . . LIBORUSD06 – 0.80 APR 2018 – JUL 2018 APR 2023 – JUL 2023 USD 1.01
LFRI 7TH INTERNATIONAL ISSUE 2YEARS CASH . . . . . . . . . . . . . . . . . LIBORUSD06 – 0.10 – 0.30 FEB 2019 – JUL 2019 FEB 2021 – JUL 2021 USD 0.71
LFRI 7TH INTERNATIONAL ISSUE 5YEARS CASH . . . . . . . . . . . . . . . . . LIBORUSD06 – 0.40 NOV 2018 – JAN 2019 NOV 2023 – JAN 2024 USD 35.07
LFRI 8TH INTERNATIONAL ISSUE 2YEARS CASH . . . . . . . . . . . . . . . . . LIBORUSD06 – 0.25 – 0.30 AUG 2019 – DEC 2019 AUG 2021 – DEC 2021 USD 25.40
LFRI 14TH ISSUE 5Y CASH . . . . . . . . . . LIBORUSD06 – 0.95 – 1.10 JAN 2016 – OCT 2016 JAN 2021 – OCT 2021 USD 17.18
LFRI-15TH ISSUE 3Y CASH . . . . . . . . . . LIBORUSD06 – 0.20 – 0.45 JAN 2018 – APR 2018 JAN 2021 – APR 2021 USD 7.05
LFRI-15TH ISSUE 5Y CASH . . . . . . . . . . LIBORUSD06 – 0.60 – 1.00 OCT 2016 – APR 2018 OCT 2021 – APR 2023 USD 41.92
LFRI-16TH ISSUE 2Y CASH . . . . . . . . . . LIBORUSD06 – 0.00 – 0.30 JAN 2019 – JAN 2020 JAN 2021 – JAN 2022 USD 94.94
LFRI-16TH ISSUE 3Y CASH . . . . . . . . . . LIBORUSD06 – 0.00 – 0.45 MAY 2018 – JAN 2019 MAY 2021 – JAN 2022 USD 5.40
LFRI-16TH ISSUE 5Y CASH . . . . . . . . . . LIBORUSD06 – 0.40 – 0.80 MAY 2018 – JAN 2019 MAY 2023 – JAN 2024 USD 10.49
FLOATING LIBOR FINANCING 6TH
INTERN’L DOLL’ . . . . . . . . . . . . . . LIBORUSD06 – 0.70 JAN 2019 – JAN 2019 JAN 2021 – JAN 2021 USD 0.01
FLOATING RATE BONDS 13TH EUROSERIES 3Y . . . . . . . . . . . . . . . . . . . LIBORUSD06 – 1.22 – 1.32 JAN 2018 – SEP 2018 JAN 2021 – SEP 2021 EUR 1.69
FLOATING RATE BONDS 14TH EUROSERIES 2Y . . . . . . . . . . . . . . . . . . . LIBORUSD06 – 1.02 FEB 2019 – AUG 2019 FEB 2021 – AUG 2021 EUR 0.97
FLOATING RATE BONDS 14TH EUROSERIES 3Y . . . . . . . . . . . . . . . . . . . LIBORUSD06 – 1.12-1.22 OCT 2018 – DEC 2018 OCT 2021 – DEC 2021 EUR 1.75
FLOATING RATE BONDS 15TH EUROSERIES 2Y . . . . . . . . . . . . . . . . . . . . LIBORUSD06 – 1.02 AUG 2019 – DEC 2019 AUG 2021 – DEC 2021 EUR 3.89
SAVINGS BOND
MAZEL TOV 7TH ISSUE 5 YEARS . . . . . . 2.45 – 4.04 JAN 2016 – MAY 2018 JAN 2021 – MAY 2023 USD 74.68
MAZEL TOV 8TH ISSUE 5 YEARS . . . . . . 1.68 – 4.38 JUN 2018 – DEC 2020 JUN 2023 – DEC 2025 USD 61.52
MAZAL TOV SAVINGS BOND 4TH
INTERNATIONAL 5Y . . . . . . . . . . . . 2.45 – 3.21 JAN 2016 – OCT 2016 JAN 2021 – OCT 2021 USD 0.25
MAZAL TOV SAVINGS BOND 5TH
INTERNATIONAL 5Y . . . . . . . . . . . . 2.80 – 3.47 NOV 2016 – OCT 2017 NOV 2021 – OCT 2022 USD 0.42
D-106

ISSUE INTEREST RATE % ISSUE DATE MATURITY DATE CCY
TOTALOUTSTANDING
(in millions)
MAZAL TOV SAVINGS BOND 6TH
INTERNATIONAL 5Y . . . . . . . . . . . . 3.33 – 4.23 NOV 2017 – OCT 2018 NOV 2022 – OCT 2023 USD 0.34
MAZAL TOV SAVINGS BOND 7TH
INTERNATIONAL 5Y . . . . . . . . . . . . 3.22 – 4.38 NOV 2018 – AUG 2019 NOV 2023 – AUG 2024 USD 0.36
MAZAL TOV SAVINGS BOND 8TH
INTERNATIONAL 5Y . . . . . . . . . . . . 2.57 APR 2020 – APR 2020 APR 2025 – APR 2025 USD 0.04
SABRA SAVING 7TH ISSUE 3 YEARS . . . . 2.46 – 3.12 JAN 2018 – APR 2018 JAN 2021 – APR 2021 USD 10.06
SABRA SAVING 8TH ISSUE 1 YEAR . . . . . 0.10 – 1.72 JAN 2020 – DEC 2020 JAN 2021 – DEC 2021 USD 75.63
SABRA SAVING 8TH ISSUE 3 YEARS . . . . 0.23 – 3.57 MAY 2018 – DEC 2020 MAY 2021 – DEC 2023 USD 114.90
SABRA SAVINGS BOND 5TH
INTERNATIONAL ISSUE 5Y . . . . . . . 2.90 – 3.02 AUG 2017 – OCT 2017 AUG 2022 – OCT 2022 USD 0.60
SABRA SAVINGS BOND 6TH
INTERNATIONAL ISSUE 3Y . . . . . . . 2.46 – 3.57 JAN 2018 – SEP 2018 JAN 2021 – SEP 2021 USD 1.59
SABRA SAVINGS BOND 6TH
INTERNATIONAL ISSUE 5Y . . . . . . . 2.98 – 3.98 OCT 2017 – SEP 2018 OCT 2022 – SEP 2023 USD 10.79
SABRA SAVINGS BOND 7TH
INTERNATIONAL ISSUE 2Y . . . . . . . 2.35 – 3.20 JAN 2019 – AUG 2019 JAN 2021 – AUG 2021 USD 2.46
SABRA SAVINGS BOND 7TH
INTERNATIONAL ISSUE 3Y . . . . . . . 2.41 – 3.54 OCT 2018 – JUL 2019 OCT 2021 – JUL 2022 USD 4.37
SABRA SAVINGS BOND 7TH
INTERNATIONAL ISSUE 5Y . . . . . . . 2.73 – 3.98 OCT 2018 – AUG 2019 OCT 2023 – AUG 2024 USD 4.96
SABRA SAVINGS BOND 8TH
INTERNATIONAL ISSUE 1Y . . . . . . . 1.74 JAN 2020 – JAN 2020 JAN 2021 – JAN 2021 USD 0.01
SABRA SAVINGS BOND 8TH
INTERNATIONAL ISSUE 2Y . . . . . . . 1.06 – 2.41 AUG 2019 – AUG 2020 AUG 2021 – AU G 2020 USD 11.34
SABRA SAVINGS BOND 8TH
INTERNATIONAL ISSUE 3Y . . . . . . . 1.51 JUN 2020 – JUN 2020 JUN 2023 – JUN 2023 USD 0.01
SABRA SAVINGS BOND 8TH
INTERNATIONAL ISSUE 5Y . . . . . . . 1.60 – 2.74 AUG 2019 – AUG 2020 AUG 2024 – AUG 2025 USD 5.60
SABRA SAVINGS BOND 9TH
INTERNATIONAL ISSUE 2Y . . . . . . . 0.20 – 1.10 AUG 2020 – DEC 2020 AUG 2022 – DEC 2022 USD 10.62
SABRA SAVINGS BOND 9TH
INTERNATIONAL ISSUE 5Y . . . . . . . 1.52 – 1.55 SEP 2020 – OCT 2020 SEP 2025 – OCT 2025 USD 0.20
EMITZVAH SAVING 7TH ISSUE 5YEARS . . . . . . . . . . . . . . . . . . . . . 2.45 – 4.04 JAN 2016 – MAY 2018 JAN 2021 – MAY 2023 USD 0.63
EMITZVAH SAVING 8TH ISSUE 5YEARS . . . . . . . . . . . . . . . . . . . . . 1.68 – 4.43 JUN 2018 – DEC 2020 JUN 2023 – DEC 2025 USD 0.69
STERLING BONDS
MAZAL TOV SAVINGS BONDS 6TH
STERLING SERIES . . . . . . . . . . . . . 1.74 – 2.94 JAN 2016 – OCT 2016 JAN 2021 – OCT 2021 GBP 0.11
MAZAL TOV SAVINGS BONDS 7TH
STERLING SERIES . . . . . . . . . . . . . 1.72 – 2.25 NOV 2016 – OCT 2017 NOV 2021 – OCT 2022 GBP 0.11
MAZAL TOV SAVINGS BONDS 8TH
STERLING SERIES . . . . . . . . . . . . . 2.33 – 2.75 NOV 2017 – OCT 2018 NOV 2022 – OCT 2023 GBP 0.12
MAZAL TOV SAVINGS BONDS 9TH
STERLING SERIES . . . . . . . . . . . . . 2.26 – 2.80 NOV 2018 – AUG 2019 NOV 2023 – AUG 2024 GBP 0.07
MAZAL TOV SAVINGS BONDS 10TH
STERLING SERIES . . . . . . . . . . . . . 1.55 – 2.16 SEP 2019 – AUG 2020 SEP 2024 – AUG 2025 GBP 0.13
MAZAL TOV SAVINGS BONDS 11TH
STERLING SERIES . . . . . . . . . . . . . 1.48 – 1.62 SEP 2020 – DEC 2020 SEP 2025 – DEC 2025 GBP 0.02
SAVINGS BONDS 8TH STERLING SERIES3 YEARS . . . . . . . . . . . . . . . . . . . . 2.27 APR 2018 – APR 2018 APR 2021 – APR 2021 GBP 0.01
D-107

ISSUE INTEREST RATE % ISSUE DATE MATURITY DATE CCY
TOTALOUTSTANDING
(in millions)
SAVINGS BONDS 8TH STERLING SERIES5 YEARS . . . . . . . . . . . . . . . . . . . . 2.18 – 2.46 FEB 2018 – SEP 2018 FEB 2023 – SEP 2023 GBP 0.08
SAVINGS BONDS 9TH STERLING SERIES3 YEARS . . . . . . . . . . . . . . . . . . . . 1.91 JUN 2019 – JUN 2019 JUN 2022 – JUN 2022 GBP 0.01
SAVINGS BONDS 9TH STERLING SERIES5 YEARS . . . . . . . . . . . . . . . . . . . . 2.07 – 2.41 NOV 2018 – JAN 2019 NOV 2023 – JAN 2024 GBP 0.13
SAVINGS BONDS 10TH STERLING SERIES1 YEAR . . . . . . . . . . . . . . . . . . . . . 1.02 – 1.67 JAN 2020 – AUG 2020 JAN 2021 – AUG 2021 GBP 1.78
SAVINGS BONDS 10TH STERLING SERIES2 YEARS . . . . . . . . . . . . . . . . . . . . 1.00 – 1.63 OCT 2019 – AUG 2020 OCT 2021 – AUG 2022 GBP 0.05
SAVINGS BONDS 10TH STERLING SERIES3 YEARS . . . . . . . . . . . . . . . . . . . . 1.51 – 1.70 OCT 2019 – FEB 2020 OCT 2022 – FEB 2023 GBP 0.03
SAVINGS BONDS 10TH STERLING SERIES5 YEARS . . . . . . . . . . . . . . . . . . . . 1.28 MAY 2020 – MAY 2020 MAY 2025 – MAY 2025 GBP 0.01
SAVINGS BONDS 11TH STERLING SERIES1 YEARS . . . . . . . . . . . . . . . . . . . . 0.98 – 1.07 SEP 2020 – DEC 2020 SEP 2021 – DEC 2021 GBP 1.44
SAVINGS BONDS 11TH STERLING SERIES2 YEARS . . . . . . . . . . . . . . . . . . . . 1.01 – 1.05 OCT 2020 – NOV 2020 OCT 2022 – NOV 2022 GBP 0.05
SAVINGS BONDS 11TH STERLING SERIES3 YEARS . . . . . . . . . . . . . . . . . . . . 1.07 NOV 2020 – NOV 2020 NOV 2023 – NOV 2023 GBP 0.02
JUBILEE BONDS 9TH STERLING SERIES2 YEARS . . . . . . . . . . . . . . . . . . . . 1.96 – 2.18 JAN 2019 – AUG 2019 JAN 2021 – AUG 2021 GBP 2.45
JUBILEE BONDS 10TH STERLING SERIES2 YEARS . . . . . . . . . . . . . . . . . . . . 1.30 – 1.97 AUG 2019 – AUG 2020 AUG 2021 – AUG 2022 GBP 4.66
JUBILEE BONDS 11TH STERLING SERIES2 YEARS . . . . . . . . . . . . . . . . . . . . 1.30 – 1.41 AUG 2020 – DEC 2020 AUG 2022 – DEC 2022 GBP 4.53
EURO BONDS
SAVINGS BONDS 11TH EURO SERIES 5YEARS . . . . . . . . . . . . . . . . . . . . . 1.15 SEP 2017 – SEP 2017 SEP 2022 – SEP 2022 EUR 0.01
SAVINGS BONDS 12TH EURO SERIES 3YEARS . . . . . . . . . . . . . . . . . . . . . 0.77 – 1.01 MAR 2018 – JUL 2018 MAR 2021 – JUL 2021 EUR 0.12
SAVINGS BONDS 12TH EURO SERIES 5YEARS . . . . . . . . . . . . . . . . . . . . . 1.08 – 1.48 NOV 2017 – JUL 2018 NOV 2022 – JUL 2023 EUR 1.18
SAVINGS BONDS 13TH EURO SERIES 2YEARS . . . . . . . . . . . . . . . . . . . . . 0.60 – 0.70 JAN 2019 – JUL 2019 JAN 2021 – JUL 2021 EUR 0.08
SAVINGS BONDS 13TH EURO SERIES 3YEARS . . . . . . . . . . . . . . . . . . . . . 0.51 – 0.80 NOV 2018 – AUG 2019 NOV 2021 – AUG 2022 EUR 0.15
SAVINGS BONDS 13TH EURO SERIES 5YEARS . . . . . . . . . . . . . . . . . . . . . 0.61 – 1.05 DEC 2018 – JUL 2019 DEC 2023 – JUL 2024 EUR 0.13
SAVINGS BONDS 14TH EURO SERIES 1YEARS . . . . . . . . . . . . . . . . . . . . . 0.35 – 0.63 FEB 2020 – AUG 2020 FEB 2021 – AUG 2021 EUR 5.80
SAVINGS BONDS 14TH EURO SERIES 2YEARS . . . . . . . . . . . . . . . . . . . . . 0.31 – 0.62 NOV 2019 – AUG 2020 NOV 2021 – AUG 2022 EUR 1.28
SAVINGS BONDS 14TH EURO SERIES 3YEARS . . . . . . . . . . . . . . . . . . . . . 0.33 – 0.63 SEP 2019 – JUL 2020 SEP 2022 – JUL 2023 EUR 0.24
SAVINGS BONDS 14TH EURO SERIES 5YEARS . . . . . . . . . . . . . . . . . . . . . 0.36 – 0.74 AUG 2019 – AUG 2020 AUG 2024 – AUG 2025 EUR 0.16
SAVINGS BONDS 15TH EURO SERIES 1YEARS . . . . . . . . . . . . . . . . . . . . . 0.51 – 0.53 SEP 2020 – DEC 2020 SEP 2021 – DEC 2021 EUR 1.63
SAVINGS BONDS 15TH EURO SERIES 2YEARS . . . . . . . . . . . . . . . . . . . . . 0.45 – 0.53 SEP 2020 – DEC 2020 SEP 2022 – DEC 2022 EUR 0.17
SAVINGS BONDS 15TH EURO SERIES 3YEARS . . . . . . . . . . . . . . . . . . . . . 0.53 – 0.54 SEP 2020 – SEP 2020 SEP 2023 – SEP 2023 EUR 0.13
D-108

ISSUE INTEREST RATE % ISSUE DATE MATURITY DATE CCY
TOTALOUTSTANDING
(in millions)
SAVINGS BONDS 15TH EURO SERIES 5YEARS . . . . . . . . . . . . . . . . . . . . . 0.57 – 0.58 SEP 2020 – OCT 2020 SEP 2025 – OCT 2025 EUR 0.13
MAZAL TOV SAVINGS BONDS 6TH EUROSERIES . . . . . . . . . . . . . . . . . . . . . 1.15 – 1.76 JAN 2016 – OCT 2016 JAN 2021 – OCT 2021 EUR 0.02
MAZAL TOV SAVINGS BONDS 7TH EUROSERIES . . . . . . . . . . . . . . . . . . . . . 1.11 – 1.55 NOV 2016 – OCT 2017 NOV 2021 – OCT 2022 EUR 0.04
MAZAL TOV SAVINGS BONDS 8TH EUROSERIES . . . . . . . . . . . . . . . . . . . . . 1.38 – 1.78 NOV 2017 – OCT 2018 NOV 2022 – OCT 2023 EUR 0.06
MAZAL TOV SAVINGS BONDS 9TH EUROSERIES . . . . . . . . . . . . . . . . . . . . . 1.16 – 1.70 NOV 2018 – AUG 2019 NOV 2023 – AUG 2024 EUR 0.06
MAZAL TOV SAVINGS BONDS 10TH
EURO SERIES . . . . . . . . . . . . . . . . . 0.87 – 1.20 SEP 2019 – AUG 2020 SEP 2024 – 2025 AUG EUR 0.09
MAZAL TOV SAVINGS BONDS 11TH
EURO SERIES . . . . . . . . . . . . . . . . . 0.90 – 1.08 SEP 2020 – DEC 2020 SEP 2025 – DEC 2025 EUR 0.03
CANADIAN ISSUES
CAN MAZAL TOV-6TH ISSUE 5 YEARS . . 2.21 – 3.70 JAN 2016 – MAY 2018 JAN 2021 – MAY 2023 CAD 13.90
CAN MAZAL TOV-7TH ISSUE 5 YEARS . . 1.82 – 3.96 JUN 2018 – DEC 2020 JUN 2023 – DEC 2025 CAD 11.44
EMITZVAH SAVING CANADIANDOLLAR 7TH 5Y . . . . . . . . . . . . . . . 1.87 – 3.26 JUL 2019 – DEC 2020 JUL 2024 – DEC 2025 CAD 0.03
CAN SABRA BOND-6TH ISSUE 3 YEARS . 2.33 – 2.91 JAN 2018 – APR 2018 JAN 2021 – APR 2021 CAD 3.78
CAN SABRA BOND-7TH ISSUE 1 YEAR . . 0.47 – 1.94 JAN 2020 – DEC 2020 JAN 2021 – DEC 2021 CAD 10.31
CAN SABRA BOND-7TH ISSUE 3 YEARS . 1.34 – 3.07 MAY 2018 – DEC 2020 MAY 2021 – DEC 2023 CAD 29.64
CAN JUBILEE-4TH ISSUE 10 YEARS . . . . 3.46 – 4.61 JAN 2011 – JUL 2014 JAN 2021 – JUL 2024 CAD 187.08
CAN JUBILEE-5TH ISSUE 10 YEARS . . . . 3.10 – 3.84 JUL 2014 – SEP 2015 JUL 2024 – SEP 2025 CAD 32.35
CAN JUBILEE-6TH ISSUE 3 YEARS . . . . . 2.60 – 2.74 FEB 2018 – APR 2018 FEB 2021 – APR 2021 CAD 1.48
CAN JUBILEE-6TH ISSUE 5 YEARS . . . . . 2.03 – 3.37 JAN 2016 – APR 2018 JAN 2021 – APR 2023 CAD 40.63
CAN JUBILEE-6TH ISSUE 10 YEARS . . . . 3.10 – 4.24 SEP 2015 – APR 2018 SEP 2025 – APR 2028 CAD 60.09
CAN JUBILEE-7TH ISSUE 2 YEARS . . . . . 1.14 – 2.46 JAN 2019 – DEC 2020 JAN 2021 – DEC 2022 CAD 30.11
CAN JUBILEE-7TH ISSUE 3 YEARS. . . . . . 1.30 – 3.00 MAY 2018 – DEC 2020 MAY 2021 – DEC 2023 CAD 16.08
CAN JUBILEE-7TH ISSUE 5 YEARS . . . . . 1.78 – 3.47 MAY 2018 – DEC 2020 MAY 2023 – DEC 2025 CAD 53.08
CAN JUBILEE-7TH ISSUE 10 YEARS . . . . 2.48 – 4.25 MAY 2018 – DEC 2020 MAY 2028 – DEC 2030 CAD 18.63
CAN JUBILEE-7TH ISSUE 15 YEARS . . . . 2.80 – 4.45 MAY 2018 – DEC 2020 MAY 2033 – DEC 2035 CAD 6.17
CAN MACCABEE 4TH ISSUE 10 YEARS . . 3.40 – 4.28 SEP 2012 – JUL 2014 SEP 2022 – JUL 2024 CAD 2.52
CAN MACCABEE 5TH ISSUE 10 YEARS . . 2.90 – 3.65 JUL 2014 – SEP 2015 JUL 2024 – SEP 2025 CAD 1.30
CAN MACCABEE 6TH ISSUE 3 YEARS . . . 2.01 – 2.60 JAN 2018 – APR 2018 JAN 2021 – APR 2021 CAD 0.23
CAN MACCABEE 6TH ISSUE 5 YEARS . . 1.88 – 3.22 JAN 2016 – APR 2018 JAN 2021 – APR 2023 CAD 4.57
CAN MACCABEE 6TH ISSUE 10 YEARS . . 2.95 – 4.10 SEP 2015 – APR 2018 SEP 2025 – APR 2028 CAD 3.62
CAN MACCABEE 7TH ISSUE 2 YEARS . . . 1.00 – 2.31 JAN 2019 – DEC 2020 JAN 2021 – DEC 2022 CAD 2.87
CAN MACCABEE 7TH ISSUE 3 YEARS . . . 1.15 – 2.84 MAY 2018 – DEC 2020 MAY 2021 – DEC 2023 CAD 1.27
CAN MACCABEE 7TH ISSUE 5 YEARS . . . 1.63 – 3.32 MAY 2018 – DEC 2020 MAY 2023 – DEC 2025 CAD 3.78
CAN MACCABEE 7TH ISSUE 10 YEARS . . 2.33 – 4.10 MAY 2018 – DEC 2020 MAY 2028 – DEC 2030 CAD 1.57
CAN MACCABEE 7TH ISSUE 15 YEARS . . 2.67 – 4.30 JUN 2018 – DEC 2020 JUN 2033 – DEC 2035 CAD 0.64
CAN INSTITUTIONAL JUBILEE 6TH
ISSUE 5 YEARS . . . . . . . . . . . . . . . . 2.74 – 3.22 FEB 2019 – AUG 2019 FEB 2024 – AUG 2024 CAD 10.00
CAN INSTITUTIONAL JUBILEE 7TH
ISSUE 5 YEARS . . . . . . . . . . . . . . . . 1.96 – 2.95 JUL 2019 – JUL 2020 JUL 2024 – JUL 2025 CAD 18.10
(A) The LIBOR Rate is for six-month period rounded upwards to the next 1/16%
D-109

(B) The EURIBOR Rate is six months period rounded upwards to the next 2ND decimal.
Tradable Local Currency Direct Debt of the Government of Israel
Serial No. Serial Name Interest Rate(1)Issue Date
DD/MM/YYYYMaturity
DD/MM/YYYY
OutstandingAmount on
December 31, 2020(In Millions of NIS)(2)
Floating Rate LoansIsrael Government FRN
1166552 0 08/06/2020 29/11/2030 9,954.31127646 0 04/02/2013 30/11/2021 14,018.61141795 0 11/09/2017 31/05/2026 20,122.3
Fixed Rate LoansIsrael Government Fixed
1138130 1 04/04/2016 30/04/2021 10,987.61099456 6.25 11/06/2006 30/10/2026 16,544.71123272 5.5 04/04/2011 31/01/2022 17,721.51126747 4.25 06/08/2012 31/03/2023 18,395.01139344 2 07/11/2016 31/03/2027 18,723.41150879 2.25 02/07/2018 28/09/2028 17,720.61125400 5.5 09/01/2012 31/01/2042 19,453.61130848 3.75 06/01/2014 31/03/2024 20,957.21135557 1.75 05/05/2015 31/08/2025 19,506.41155068 1.5 08/10/2018 30/11/2023 16,817.11142223 0.5 06/11/2017 31/01/2021 4,098.71140193 3.75 06/03/2017 31/03/2047 20,961.21141225 1.25 10/07/2017 30/11/2022 15,254.61158104 0.75 03/06/2019 31/07/2022 15,470.21160985 1.00 04/11/2019 31/03/2030 16,473.11162668 0.5 03/02/2020 30/04/2025 14,968.21166180 1.5 11/05/2020 31/05/2037 11,859.71167105 0.15 06/07/2020 31/07/2023 10,584.1
Israel Government T-Bills1165877 0 20/04/2020 28/02/2021 5,486.81167113 0 13/07/2020 31/05/2021 7,208.11168939 0 19/10/2020 31/08/2021 6,764.4
CPI-linked Loans9590332 Galil CPI+4.00 19/08/2001 30/07/2021 20,297.29590431 CPI+4.00 23/08/2004 31/07/2024 15,668.41097708 Israel Government CPI CPI+4.00 26/06/2006 30/05/2036 19,694.41120583 CPI+2.75 06/09/2010 30/08/2041 19,208.21124056 CPI+2.75 04/07/2011 30/09/2022 18,139.21128081 CPI+1.75 02/04/2013 29/09/2023 17,943.31134865 CPI+1.00 02/03/2015 31/05/2045 17,864.91135912 CPI+0.75 06/07/2025 31/10/2025 21,990.61140847 CPI+0.75 08/05/2017 31/05/2027 19,612.31157023 CPI+0.5 04/03/2019 31/05/2029 18,519.21168301 CPI+0.5 07/09/2020 30/11/2051 3,247.31169564 CPI+0.1 09/11/2020 31/07/2026 2,428.6
D-110

(1) The Annual interest rate for the Israel Government FRN debt equals yield to maturity of Central BankBills (Makam) with 12 months maturity.
(2) Data excludes accrued interest on debt outstanding but includes CPI adjustments, if any.Source: Ministry of Finance.
Non-Tradable Local Currency Direct Debt of the Government of Israel
Series Name Interest Rate Issue DateDate of
Maturity
OutstandingAmount on
December 31, 2020(In Millions of NIS)(1)
CPI-Linked LoansHetz . . . . . . . . . . . . . . . . . . . . . . . CPI+4% − 6.2% 1967 − 2020 2021 − 2045 54,439.8Meron . . . . . . . . . . . . . . . . . . . . . . CPI+5.5% 1987 − 2003 2021 − 2023 5,189.2Arad . . . . . . . . . . . . . . . . . . . . . . . CPI+4.8% 1995 − 2020 2021 − 2035 201,927.1
(1) Data excludes accrued interest on debt outstanding but includes CPI adjustments, if any.Source: Ministry of Finance.
Various Loans of the Government of Israel
Name Interest Rate Issue Date Date of Maturity
OutstandingAmount on
December 31, 2020(In Millions of NIS)(3)
Emissions and Funds(1). . . . . . . . . . . . . . 2% − 6% 1984 − 2004 (2) 6,996.2Compulsory Bonds . . . . . . . . . . . . . . . . N/A N/A N/A N/A
(1) Emissions and Funds primarily includes deposits at the Accountant General’s Office made by financialinstitutions and other entities.
(2) Most of these amounts were deposited for 17 years and are re-financed. Some of the depositing entitiesare able to withdraw their funds at any time and some of the deposits have an established maturity date(“Emissions”).
(3) Data excludes accrued interest on debt outstanding.Source: Ministry of Finance.
Balance of the Government’s Floating Rate Debt by Currency(As of December 31, 2020)
Total(In Millions)(1)
United States Dollars (USD) . . . . . . . . . . . . . . . . . . . . . . . . . . . . . . . . . . . . . . . . . . . . . 489.04Euro (EUR) . . . . . . . . . . . . . . . . . . . . . . . . . . . . . . . . . . . . . . . . . . . . . . . . . . . . . . . . . 8.28New Israeli Shekel (NIS) . . . . . . . . . . . . . . . . . . . . . . . . . . . . . . . . . . . . . . . . . . . . . . . . 44,095.3
(1) Data excludes accrued interest on debt outstanding.Source: Ministry of Finance.
D-111