Estimating the capital component of mental health care costs in the public sector
17
Administration and Policy in Mental Health Vol. 21, No. 6, July 1994 ESTIMATING THE CAPITALCOMPONENTOF MENTAL HEALTH CARE COSTS IN THE PUBLIC SECTOR Robert Rosenheck, M.D., Linda Frisman, Ph.D., and Michael Neale, Ph.D. ABSTRACT: This study describes methods for determining the cost of buildings and grounds in public sector facilities. Two methods for estimating the cost of capital (one using local office rents; the other based on estimates of the replacement cost of hospital buildings) are applied to six types of health care service at nine VA medical centers. Results indicate that capital costs for psychiatric inpatient care were about one-third those for surgical services and one-half those for medical services. Overall, capital costs add 6% to average inpatient costs and 4% to outpatient costs. The economic impact of innovative treatments on health care costs has become an increasingly important focus of mental health program evaluation, particularly in the evaluation of high cost treatments such as intensive case management or clozapine pharmacotherapy. In times of limited or shrinking mental health budgets, promising treatments must be judged as much by their cost efficiency as by their clinical effectiveness. The principal mechanism through which expensive mental health interventions have achieved cost offsets is by reducing inpatient utilization and associated costs (Bond, 1984; Dickey, Cannon, McGuire, & Gudeman, 1986; Weisbrod, 1983). Accurate estimation Robert Rosenheck, Linda Frisman, and Michael Neale are all with the VA Medical Center in Westhaven CT. Address for correspondence: Robert Rosenheck, Northeast Program Evaluation Center, VAMC, 950 Campbell Ave., West Haven, CT 06516. The authors thank Thomas McGuire, Ph.D., for his conceptual guidance for this article. Richard Frank, Ph.D., Paul Errera, M.D., and Boris Astrachan, Ph.D., provided valuable consultation. John Bonsall, Carl Lister, Stephanie Monroy, Stephen Hogel, and Robert Whiting helped with the interpretation of the VA data bases and accounting procedures. We are also grateful to the staffs at the nine Mental Health Initiative Sites. 493 1994 Human Sciences Press, Inc.
-
Upload
independent -
Category
Documents
-
view
0 -
download
0
Transcript of Estimating the capital component of mental health care costs in the public sector

Administration and Policy in Mental Health Vol. 21, No. 6, July 1994
ESTIMATING THE CAPITAL COMPONENT OF MENTAL HEALTH CARE COSTS IN THE PUBLIC SECTOR
Robert Rosenheck, M.D., Linda Frisman, Ph.D., and Michael Neale, Ph.D.
A B S T R A C T : This study describes methods for de te rmining the cost of buildings and grounds in public sector facilities. Two methods for est imating the cost of capital (one using local office rents; the other based on estimates of the replacement cost of hospital buildings) are applied to six types of heal th care service at nine V A medical centers. Results indicate that capital costs for psychiatric inpat ient care were about one-third those for surgical services and one-half those for medical services. Overall , capital costs add 6% to average inpat ient costs and 4% to outpat ient costs.
The economic impact of innovative treatments on health care costs has become an increasingly important focus of mental health program evaluation, particularly in the evaluation of high cost treatments such as intensive case management or clozapine pharmacotherapy. In times of limited or shrinking mental health budgets, promising treatments must be judged as much by their cost efficiency as by their clinical effectiveness. The principal mechanism through which expensive mental health interventions have achieved cost offsets is by reducing inpatient utilization and associated costs (Bond, 1984; Dickey, Cannon, McGuire, & Gudeman, 1986; Weisbrod, 1983). Accurate estimation
Robert Rosenheck, Linda Frisman, and Michael Neale are all with the VA Medical Center in Westhaven CT. Address for correspondence: Robert Rosenheck, Northeast Program Evaluation Center, VAMC, 950 Campbell Ave., West Haven, CT 06516.
The authors thank Thomas McGuire, Ph.D., for his conceptual guidance for this article. Richard Frank, Ph.D., Paul Errera, M.D., and Boris Astrachan, Ph.D., provided valuable consultation. John Bonsall, Carl Lister, Stephanie Monroy, Stephen Hogel, and Robert Whiting helped with the interpretation of the VA data bases and accounting procedures. We are also grateful to the staffs at the nine Mental Health Initiative Sites.
493 �9 1994 Human Sciences Press, Inc.

494 Administration and Policy in Mental Health
of inpatient treatment costs has thus become important in mental health evaluation studies.
The growing emphasis on economic assessment in mental health program evaluation has fostered increasing sophistication in the methods used to esti- mate costs. A decade ago, Weisbrod and colleagues brought social costs to the attention of the mental health research community in a comprehensive cost- benefit study of the Madison model of community treatment (Weisbrod, Test, & Stein, 1980). Social cost analysis explicitly attends to costs that may be shifted
between parties (e.g., from state to federal governments or to patients' families) and indirect costs such as lost wages. While full social cost analyses were a rarity before Weisbrod's work was published, standard principles of cost- benefit research are now being applied to mental health cost studies with increasing frequency. Three of the most important of these principles are: 1) health care cost estimates must be based on analysis of the actual resources used to provide services, not on charges; 2) variation in the cost of specific services should be taken into account as much as possible, rather than relying on averages; and 3) "hidden" costs such as the opportunity cost of capital in publicly owned facilities should not be ignored, even though they may not be included in standard accounting procedures. This paper focuses on the estima- tion of capital costs.
The opportunity cost of land and buildings has been identified as a crucial variable that runs the risk of being neglected, particularly in studies of public facilities (McGuire, 1991). For the accountant, the cost of health care may be fully described through a summary of monthly expenditures and capital depre- ciation. A complete economic analysis requires that all resources that could be put to an alternative use be valued and considered as a cost. Government buildings and land are especially likely to be absent from the accountant's ledger because they are purchased through a one time expenditure of public revenues, with no further debt service payments by the agency using the building. Special efforts must be made to estimate their value. McGuire has recently underscored the importance of this issue, stating that " . . . mental health care is usually thought to be labor intensive, but for the seriously mentally ill treated in institutions just the opposite is true: much of the cost is in the form of land and buildings in which the ill are housed" (p. 383). He supports this contention by pointing out that in Weisbrod's pioneering study (1983), 30% of the cost of inpatient treatment was attributed to capital costs, and that even a small adjustment in the estimated annual cost of capital (from 8% to 4%) would have resulted in a change in the study's principal finding. In health care cost studies, and in public program planning, more generally, " . . . when the cost involves public facilities . . . the capital portion of the ledger potentially dominates the total" (Cannon, McGuire & Dickey, 1985).
The central methodological challenge in estimating capital costs in the public sector is the identification of the best (i.e., most valuable) alternative use to

Robert Rosenheck, Linda Frisman, and Michael Neale 495
which a facility could be put and determining its market value. Public facilities are rarely placed on the market and, as a result, indirect methods for approx- imating their value must be used. In the most detailed consideration of this problem published thus far, Cannon, McGuire and Dickey (1985) found that, depending on the method and assumptions employed to assess alternative use, there was wide a variation in the estimated capital cost of a state mental hospital in Boston, the Massachusetts Mental Health Center ( M M H C ) . In the absence of a clear best choice they indicated a preference for using a midpoint value among their results. In a subsequent report, the cost of capital an the M M H C was estimated to be a modest, but important, fraction of the total cost: 7.9% of inpatient costs ($9.80 per bed day of care) and 15.4% of quarterway house costs ($13.16 per bed day of care) (Dickey, et al., 1986). It can be further deduced from the data presented that use of alternative estimates for capital costs would not have affected the final results of their study. There is clearly a need for further examination of the methods used to estimate capital costs in public health care facilities, and of the impact of choosing one method over another on the results of mental health cost studies.
This paper presents cost data gathered for the evaluation of a multi-site Department of Veterans Affairs (VA) initiative in intensive case management, and addresses both methodological principles and specific procedures for esti- mating the capital component of health care costs in VA and, we expect, in other public mental health systems. This study goes beyond previous studies in five ways. First, unlike the studies of Weisbrod (1983) and Cannon et al. (1985), which concerned single institutions, this study addressed health care costs at multiple facilities, all located in the northeastern United States. Sec- ond, in addition to psychiatric inpatient services, we analyzed capital costs associated with five other types of health care service. Third, while previous studies incorporated the opportunity cost of the land on which medical facilities rest, they did not specifically consider the contribution of land to overall capital costs. In this study the value of land is independently considered for each facility. Fourth, special attention is paid to the allocation of capital resources to specific patient care services. While Cannon et al. (1985) meticulously detailed their approach to estimating the annualized capital value of the M M H C , they did not specify methods for distributing those costs to specific types of health care service (perhaps because use of capital was similar for various services). In VA medical centers or other general hospitals psychiatric, medical, and surgi- cal care are provided under a single roof, and differences in capital costs across services become more important. Finally, we pay explicit attention to the relative importance of capital costs as a portion of total inpatient and outpa- tient costs, and to variations in capital cost across different types of service, at different medical centers. Capital costs, at least in VA medical centers, may represent a relatively constant proportion of total inpatient and outpatient costs across facilities. If so, in circumstances in which detailed data are not readily

496 Administration and Policy in Mental Health
available, percentage estimates based on data presented here might be used with some justification.
METHODS
Study Sites
Nine Department of Veterans Affairs medical centers participated in the evaluation of a demonstration project in which high hospital users were treated with intensive case management, referred to in VA as Intensive Psychiatric Communi ty Care (IPCC). This initiative was based on treatment approaches described by Stein and Test (1980) and on rehabilitation principles proposed by other experts (Anthony, Cohen, & Farkas, 1991) in the community based care of the seriously mentally ill. The nine medical centers sponsoring the initiatives were located in major urban areas (the Bronx, Boston, Albany, and Buffalo), in smaller cities (Syracuse; West Haven, CT) and in suburban or rural areas (Brockton, MA; Canandaigua, NY; and Montrose, NY). Clinical data for this study were gathered from 1987-1991; cost information from 1989 is used throughout.
Opportunity Costs Associated with Medical Center Buildings and Land
As noted by Cannon et al. (1985), conventional accounting procedures do not provide an accurate assessment of the opportunity costs associated with public facilities such as VA medical centers. Since most of the hospitals involved in this study were constructed before 1949, and VA accounting procedures depreciate the cost of hospitals over 40 years, most of these hospi- tals were fully depreciated (i.e., their "book" value is zero). We agree with Cannon and her colleagues that the preferred method for evaluating the current opportunity cost associated with medical center buildings and grounds is to determine the fair market rental value of the extant facilities.
Estimating Opportunity Cost of Capital Using Rental Rates. Although rental rates for public facilities are not usually available, a proxy rental rate was obtained by questioning key informants (real estate agents, brokers or appraisers in each community) about rental rates for similar property. Using the real estate section of the local phone book, we contacted three or four key informants in each community and asked for information on current market rents for medi- cal office space similar to that at the local VA medical center. Estimates were obtained for unimproved office space, excluding the cost of furnishings or utilities. Where the estimates were divergent, a central value was employed. These rental estimates were subsequently used to estimate the opportunity cost of all medical center space used by each service, including both direct patient care space and indirect support service space.

Robert Rosenheck, Linda Frisman, and Michael Neale 497
The decision to use a single rental-based estimate to represent the value of space used by all services in the medical facility was carefully weighed. It could be argued that the value of the surgical service space, for example, is higher than the value of the psychiatric service space. Indeed, as discussed in the following section, surgery space is more costly to construct. To correctly assess opportunity costs, however, one must determine the best (highest priced) possible alternative use. If it would not be possible to rent or sell the building for the specialized use for which it was built (i.e., for providing surgical services), it is appropriate to use the next best alternative use, and to regard the extra cost of construction as sunk costs. For this study, it was not possible to state with certainty whether any of the additional costs associated with construction of specialized space could be recovered. However, given the paucity of new construction for medical facilities in the northeast, we decided that the best alternative use was as general medical office space.
Estimating Capital Costs Using Replacement Costs. An alternative approach, used here to validate the rental estimation method, uses the replacement cost of these VA medical centers. Capital cost as estimated by this method is equal to the annualized cost of replacing each facility, plus the annual depreciation of the involved buildings. The E.C. Boeckh Index, a proprietary compendium of cost estimates for various building types, was used to estimate the 1989 general hospital construction costs in each city involved in the study. Further adjust- ment to this basic hospital construction cost was made in consideration of the differential cost of replacing medical, surgical, psychiatric, nursing home, outpatient and non-patient care building space. A construction cost estimation index supplied by the Office of Cost Estimation in VA Central Office was used to make this adjustment. Annual depreciation was obtained from VA account- ing records.
While estimates based on rental values are presumed to incorporate the value of associated land, estimates of the replacement cost of VA medical centers required a specific additional assessment of land value. The number of acres of land owned by each medical center, the year of purchase, and the purchase price were obtained from federally mandated quarterly property assets reports. The shelter price component of the Consumer Price Index was then used to adjust the original purchase cost to 1989 levels (U.S. Bureau of Census, 1976, 1991).
The value of the land was then distributed back to medical center buildings on a square footage basis. The total space of each hospital in gross square feet (GSF) was obtained from the property assets report, and the ratio of total land area to hospital space was calculated. Multiplying the annual value of the land (in dollars per square foot) by this ratio, we obtained the value of the land per GSF of hospital space, which was then included in the replacement cost estimate.

498 Administration and Policy in Mental Health
Once the replacement cost per GSF was estimated (including adjustments for geographic locality, type of hospital space and the value of land), an estimate of return on capital was used to annualize replacement costs. A conventional way of determining the return on investment at a given point in time is to identify a standard measure of interest (e.g., the prime lending rate) and subtract a measure of inflation from it (e. g., the annual percent change in the consumer price index) (Samuelson & Nordhaus, 1985). Using this ap- proach the average return on investment in the United States, in 1989, was determined to be 6.07% (Samuelson & Nordhaus, 1985, pp. 478, 512). This estimate for return on capital is close to the 4 % figure recently advocated by McGuire (1991).
Allocating Costs to Specific Units of Service
Annualized capital costs, as determined by each of the above methods, were disaggregated and allocated to specific departments and to specific units of service. Three different types of information were used to calculate capital costs at the level of the unit of service: 1) the number of square feet of hospital space directly used in the delivery of patient care services by each clinical depart- ment; 2) an estimate of indirect (i.e., non-patient care) space used to support the delivery of those services; and 3) the number of units of service delivered annually by each service.
Allocation of the Rental Cost Estimate to Specific Units of Service. The formula used to determine the rental-based estimate of opportunity cost per unit of service is:
Capital Cost/Unit of Service = (DPCSA + ICSA) x (OC) UA
where,
DPCS A
ICS A OC
UA
= direct patient care space allocated to service A in (Net Square feet [NSF];
= indirect clinical space apportioned to service A (in NSF); = opportunity cost of hospital space ($/NSF); and = the number of units of service provided by service A.
Information on direct patient care space utilization by each service was obtained from the engineering service at each medical center. Since a service- by-service breakdown of outpatient space was not available at most hospitals, outpatient space had to be retained as an aggregate. The opportunity cost of medical center building space not used directly for patient care (i.e., indirect care space) was also allocated to specific patient care activities, through a two- step procedure: First, the total amount of indirect care space at each hospital was determined by subtracting the space used in direct clinical care from the total space of the hospital. Second, the indirect care space was allocated to

Roberl Rosenheck, Linda Frisman, and Michael Neale 499
specific departments in proportion to their share of other indirect costs, as determined by the VA Cost Distribution Report (CDR). The CDR is a facility-by-facility accounting record that identifies total expenditures and unit costs associated with all VA inpatient and outpatient health care services. Using standardized accounting procedures both direct health care costs (per- sonnel services, medications and supplies) and indirect costs (e. g., administra- tion, building maintenance, engineering service, building and equipment depreciation) are identified and distributed to specific health care programs. The indirect costs on the CDR provide a straightforward basis for apportion- ing indirect capital costs.
Allocation of the Replacement Cost Estimate to Specific Units of Service. Estimation of service-specific replacement costs is somewhat more complicated than estimat- ing rental-based opportunity costs because: 1) a specific replacement cost rate is used for each type of service, and 2) annual depreciation and the value of land are included.
Replacement costs per unit of service are thus calculated by the following formula, applying the service-specific replacement cost for each type of space:
(DPCS A X COSTA) + (ICSA) X COStls ) + LandCost X (DPCS A + ICSA) ) + D A
where,
DPCS A Cost A
ICS A = Costis =
Land Cost =
UA
D A
U A =
direct patient care space allocated to service A in (GSF); annualized replacement cost of space ($/GSF) for service A estimated using: a) the local Boeckh cost index for general hospital space, b) the VA Central Office index for specific types of hospital space and c) a 5.2% estimated return on capital; indirect clinical space apportioned to service A in (GSF); replacement cost of indirect care hospital space estimated using information similar to that used to estimate Cost A the estimated value of surrounding land per GSF of building space ($/GSF); annual depreciation of buildings used by service A; and the number of units of service provided by service A.
Using this formula capital cost per unit of service was estimated separately for each service, at each medical center.
(The unit of measurement conventionally used in estimates of replacement cost is Gross Square feet (GSF) as contrasted with Net Square Feet (NSF), the measure by which rental rates were determined. The net square footage of a

500 Administration and Policy in Mental Health
space refers only to the immediately useable space and excludes walls, hall- ways, stairs, etc. GSF, in contrast, is a measure of the entire covered space, i.e., the floors, walls, mechanical systems, and stairwells of each floor. A standard conversion factor, specific to hospital space, of 1.7 GSF per NSF (Hardy & Lammers, 1986) was used to convert NSF to GSF for these calcula- tions.)
Impact of Capital Costs of Total Cost Estimates
To evaluate the percentage increase in total health care cost resulting from capital cost, the value of all non-capital direct and indirect costs per unit of service was obtained from the C D R for each major service at the nine medical centers, and divided into the capital cost.
RESULTS
Opportunity Costs of Buildings and Land
Opportunity costs determined by both rental and replacement estimates are presented in Table 1. Rental estimates ranged from $8/NSF to $12.50/NSF with limited variation across sites (coefficient of variation = 0.15). Basic hospital replacement estimates (before adjusting for the cost of specific ser- vices), ranged from $I 26/GSF to $179/GSF and also showed limited variation (coefficient of variation = 0.12). The greatest degree of variation in cost was in the value of land, due to the wide range in the amount of land owned (from 7.4 to 200 acres; see Table 2) and the low cost of land in two rural settings, Canandaigua and Montrose, NY. On average the value of land represented less than 2 % of estimated replacement costs.
Estimated capital costs based on the rental method were lower than those based on the replacement cost method. The ratio of estimated rental costs/NSF to replacement costs/NSF ranged from 0.53 to 0.82 across sites (Table 1) with an overall ratio of 0.61.
Capital Costs Allocated to Specific Units of Service
Sections A and B on Table 3 show both direct patient care space and indirect space allocated to clinical services at the nine medical centers. The third section (C in Table 3) records the number of units of service provided by each service in each medical center (days of care for inpatient programs and clinic visits for outpatient services).
Using the formulae presented previously and the data presented in Tables 1 and 3, the capital costs per unit of service were calculated and are presented in Parts A and B of Table 4. Within service categories, variation across sites is modest for both the rental-based method (average coefficient of variation = 0.54) and the replacement cost method (average coefficient of variation =

TA
BL
E 1
E
stim
ated
Opp
ortu
nity
Cos
t of
Hos
pita
l B
uild
ings
, as
Det
erm
ined
by
Com
mun
ity
Ren
tal
Rat
es
and
Hos
pita
l R
epla
cem
ent
Cos
ts i
n 19
89,
by G
eogr
aphi
c L
ocat
ion
Alb
any
Bos
ton
Bro
ckto
n B
ronx
B
uffa
lo
Can
'dgu
a M
ontr
ose
Syra
cuse
W
. H
aven
Si
te M
ean
S.D
. of
Var
.
~A
nnua
l Ren
tal
Rat
e ($
/NS
F/Y
ear)
$1
0.00
$1
2.50
$8
.00
$10.
00
$8.0
0 $8
.00
$10.
00
$9.0
0 $8
.00
$9.2
8 $1
.44
bBui
ldin
g R
epla
cem
ent
Cos
t ($
/GS
F/Y
ear)
.$
126
$147
$1
47
$179
$1
32
$135
$1
70
$126
$1
42
$145
$1
7
cBui
ldin
g R
epla
cem
ent
Cos
t C
onve
rted
to
$/N
SF
/Yea
r $2
15
$250
$2
50
$304
$2
24
$229
$2
88
$214
$2
41
$246
$3
0
dVal
ue o
f L
and
per
N
SF
of
Hos
pita
l $4
.74
N/A
$1
2.68
N
/A
$2.6
2 $0
.38
$1.9
8 $4
.63
$6.9
5 $4
.85
$3.7
6
~A
nnua
lize
d R
epla
cem
ent
Cos
t ($
/NS
F/Y
ear)
(I
nclu
ding
Lan
d
Val
ue)
@ 6
.1%
C
ost
of C
apit
al
$13.
33
$15.
17
$15.
94
$18.
45
$13.
75
$13.
94
$17.
63
$13.
28
$15.
04
$15.
17
$1.7
6
Rat
io o
f R
enta
l C
ost/
A
nn
ual
ized
R
epl'
mn
t C
ost
0.75
0.
82
0.50
0.
54
0.58
0.
57
0.57
0.
68
0.53
0.
61
0.10
aBas
ed o
n in
terv
iew
s wit
h ke
y in
form
ants
. bH
ospi
tal c
onst
ruct
ion
cost
est
imat
es f
rom
Boe
chk'
s Ind
ex,
for
1989
. ~C
onve
rsio
n Fac
tor
from
Har
dy a
nd L
amm
ers
(198
6).
aOpp
ortu
nity
cos
t of l
and
from
Tab
le 2
. ~R
etur
n on
inv
estm
ent b
ased
on
1989
pri
me
lend
ing
rate
les
s the
per
cent
inc
reas
e of
CP
I (U
.S.
Bur
eau
of th
e C
ensu
s, 1
991)
0.15
0.12
0.12
N
"
0.77
~ g~
0.
12
0.17

TA
BL
E 2
A
nn
ual
ized
Val
ue
(Est
imat
ed O
pp
ortu
nit
y C
ost)
of
Lan
d A
ssoc
iate
d w
ith
VA
Med
ical
Cen
ters
a
Alb
an
y B
rock
ton
Buf
falo
C
anan
daig
ua
Mo
ntr
ose
Sy
racu
se
IV.
Hav
en
A.
Est
imat
e of
198
9 L
and
Val
ue/S
q.
Ft.
1.
T
otal
Acr
es
28.3
14
5.7
16.9
15
9.0
200.
0 7.
4 43
.7
2.
Lan
d P
urch
ase
Pri
ce
$376
,000
$1
,295
,000
$2
56,0
00
$32,
000
$306
,000
$2
67,0
00
$403
,000
3.
P
urch
ase
Dat
e 19
47
1949
19
47
1931
19
55
1952
19
48
4.
She
lter
Pri
ce I
nd
ex
5.55
5.
37
5.55
5.
32
5.06
5.
20
5.44
(P
urch
ase
to 1
989)
5.
19
89 L
and
Val
ue
$2,0
86,8
00
$6,9
54,1
50
$1,4
20,8
00
$170
,240
$1
,547
,442
$1
,387
,332
$2
,193
,126
6.
L
and
Val
ue/A
cre
$73,
739
$47,
729
$84,
071
$1,0
71
$7,7
37
$187
,477
$5
0,18
6
B.
Dis
trib
utio
n of
Lan
d V
alue
to
Pat
ient
Car
e S
pace
1.
H
ospi
tal
Spa
ce (
NS
F)
440,
179
548,
329
542,
730
442,
560
782,
168
299,
437
315,
636
2.
bLan
d S
q. F
t./P
atie
nt
2.8
11.6
1.
4 15
.6
11.1
4 1.
1 6.
0 C
are
Spa
ce (
NS
F)
3.
Lan
d V
alue
/Pat
ient
$4
.74
$12.
68
$2.6
2 $0
.38
$1.9
8 $4
.63
$6.9
5 C
are
Spa
ce (
NS
F)
aSee
text
for
sour
ces o
f dat
a. D
ata
are
inco
mpl
ete f
or B
osto
n an
d B
ronx
. bl
acr
e =
43,5
60 sq
. fe
et.

TA
BL
E 3
D
irec
t an
d I
nd
irec
t P
atie
nt
Car
e S
pac
e an
d U
nit
s of
Ser
vice
Alb
any
Bost
on
Bro
ckto
n B
ronx
Bu
ffalo
C
an'd
gua
Mon
tros
e Sy
racu
se
W.
Hav
en
A.
Dir
ect
Pat
ient
Car
e Sp
ace
(NSF
)/C
linic
al S
ervi
ce
Psyc
hiat
ry
25
,00
6
21
,74
8
80
,45
7
21
,33
1
18
,81
2
92
,49
2
14
1,3
18
1
0,5
35
4
4,0
82
M
edic
ine
68,5
01
85
,01
2
98
,06
3
33
,31
0
41
,80
6
10
,68
6
13
,98
1
45
,83
5
46
,20
2
Sur
gery
7
0,1
89
5
1,6
16
2
8,0
42
3
0,8
12
25
,293
0
0 2
8,1
35
31
,591
In
term
edia
te M
edic
ine
38
,01
8
0 19
,623
9
,18
8
19
,60
6
10
0,7
71
8
9,3
60
3
,91
5
31
,48
7
Nur
sing
Hom
e C
are
30,1
75
0 3
3,7
25
3
1,8
39
5
,64
3
31
,43
6
47
,13
1
14
,63
2
16,7
73
Out
pati
ent
Clin
ics
26
,59
9
23
,88
3
22
,26
4
18
,29
3
12,8
20
4,4
96
7
3,1
00
2
8,8
58
2
8,6
85
B.
Allo
catio
n of
Ind
irec
t P
atie
nt C
are
Spac
e (N
SF)/
Clin
ical
Ser
vice
C.
Psy
chia
try
9,32
6 3
,77
7
40
,95
8
11
,98
2
23
,08
1
25
,68
8
11
5,0
92
1
0,2
94
13
,432
M
edic
ine
48
,79
8
67
,82
7
94
,75
4
72
,12
7
138,
554
7,1
95
6
2,8
88
4
9,7
67
5
5,6
87
S
urge
ry
46
,97
8
43
,28
6
50
,49
4
52
,83
9
109,
139
0 0
40
,69
4
24
,09
9
Inte
rmed
iate
Med
icin
e 4
6,9
67
0
47
,26
1
39
,87
4
10
6,0
09
1
57
,38
1
15
3,4
41
36
,861
9,
533
Nur
sing
Hom
e C
are
8,21
6 0
9,59
1 3,
856
6,48
6 8
,43
0
21,8
53
2,16
2 2,
418
Out
pati
ent
Clin
ics
21
,40
6
15
,60
1
23
,09
7
19
,46
5
35,4
81
3,9
85
3
4,7
17
1
3,1
92
11
,647
~Uni
ts o
f Se
rvic
e/Y
ear
Psyc
hiat
ry
26
,25
2
19
,49
2
10
8,3
37
2
0,2
04
3
1,2
90
8
4,1
89
12
3,19
3 8
,96
3
46
,24
2
Med
icin
e 3
5,3
23
7
4,1
69
6
9,3
92
6
6,1
76
8
3,5
19
1
1,5
63
1
2,2
98
2
7,5
05
53
,281
S
urge
ry
22
,41
6
30
,48
0
14
,93
1
29
,59
7
31,3
57
0 0
15
,95
2
15,1
53
Inte
rmed
iate
Med
icin
e 3
0,0
48
0
33
,52
8
19
,54
7
39
,81
6
12
4,7
72
8
5,6
30
1
4,2
90
13
,483
N
ursi
ng H
ome
Car
e 33
,623
0
57
,74
2
39
,61
6
12
,52
1
35
,29
3
41
,53
9
3,4
50
3
2,0
97
O
utpa
tien
t C
linic
s 24
2,01
7 3
18
,36
7
38
0,7
05
4
00
,48
1
34
4,7
22
1
00
,19
4
15
6,3
62
1
87
,53
1
172,
356
aUni
ts of
serv
ice a
re b
ed d
ays o
f car
e for
inpa
tient
units
and
nurs
ing h
ome,
patie
nt vi
sits
for o
utpa
tient
clin
ics.
g.
2"
g~
kal

504 Administration and Policy in Mental Health
0.57). Higher degrees of variation for nursing home (0.84) and outpatient care (1.03) were attributable to extremely high values observed for nursing home care at the Syracuse VAMC (where a low workload was recorded) and for outpatient care at the Montrose VAMC (where there was an exceptionally high, and possibly erroneous, allocation of space to outpatient care). Capital costs varied considerably across services with capital costs for inpatient psychi- atry estimated to be 42% of the costs for surgery, about half the cost for medicine or intermediate medicine and 16 times the cost for outpatient care.
Capital Costs in Relation to Other Health Care Costs
Section A of Table 5 presents the non-capital cost for each type of health care service, including both direct and indirect costs, but excluding building depre- ciation. Capital costs, as determined by the rental estimation method, are a relatively small proportion of the value of VA health care, averaging 5-6% of inpatient costs and 4% of outpatient costs (Part B of Table 5).
Table 6 summarizes the average capital costs for each type of service, across all the hospitals involved in the study, using five different estimates: 1) the rent based estimate, 2) the replacement cost estimate using our empirical estimate of return on capital investment for 1989 (6.07 %), and 3) the replacement cost estimate using three other rates of return on capital (4 %, 7 %, and 9 %), those used by Cannon, McGuire and Dickey (1985) in their analysis. The rental- based cost estimate is almost identical to the replacement cost estimate when a 4 % rate of return on capital is used, but these estimates diverge as higher rates of return on capital are applied. It is notable, however, that, even at a 9 % rate of return on investment (a rate not achieved during the past two decades), capital costs in VA have only a modest effect on inpatient costs, increasing them by only 16%.
DISCUSSION
In this study we have presented a multi-step procedure for valuing and allocating the opportunity costs associated with public medical center buildings and grounds. The data have both methodological and substantive importance for cost studies in the mental health field.
Following Cannon, McGuire, and Dickey (1985), both community rental rates and replacement costs were used to estimate capital costs. In our study, however, estimates of the square foot value of buildings and land derived from these two methods were similar even though estimates were made indepen- dently for nine different hospitals. Real estate values in the study of Cannon et al. (1985) may have been particularly difficult to estimate in the Harvard Medical Complex in central Boston. Our findings were less clouded by un- usual market conditions. In addition, our use of a nationwide construction cost index and a specific estimate of return on investment also increased the

TA
BL
E 4
C
apit
al C
ost
Est
imat
es/U
nit
of S
ervi
ce (
Com
pari
son
of E
stim
ates
)
Std
. C
oeff
Alb
any
Bos
ton
Bro
ckto
n B
ronx
B
uffa
lo
Can
'dga
M
ontr
ose
Syra
cuse
W
. H
aven
Si
te M
ean
Dev
. V
at.
A.
Cap
ital
Co
st/U
nit
of
Ser
vice
(re
nt-b
ased
est
imat
e)
Psy
chia
try
$13.
08
$16.
37
$8.9
7 $1
6,49
$1
0.71
$1
1.23
$2
0.81
$2
0.91
$9
.95
$14.
28
$4.3
0 0.
30
Med
icin
e $3
3.21
$2
5.76
$2
2.23
$1
5.93
$1
7.28
$1
2.37
$6
2.50
$3
1.28
$1
5.30
$2
6.21
$1
4.55
0.
56
Sur
gery
$5
2.27
$3
8,92
$4
2.08
$2
8.26
$3
4.30
N
/A
N/A
$3
8.83
$2
9.40
$3
3.01
$1
4.36
0.
43
Inte
rmed
iate
Med
icin
e $2
8.28
N
/A
$15.
96
$25.
10
$25.
24
$16.
55
$28.
35
$25,
68
$24.
34
$23.
69
$4.5
0 0.
19
Nu
rsin
g H
om
e C
are
$11.
42
N/A
$6
.00
$9.0
1 $7
,75
$9.0
4 $1
6.61
$4
3.81
$4
.78
$13.
55
$11.
93
0.88
O
utp
atie
nt
Cli
nics
$1
.98
$1.5
5 $0
.95
$0.9
4 $1
.12
$0.6
8 $6
.90
$2.0
2 $1
.87
$2.0
0 $1
.79
0.90
B.
Cap
ital
Co
st/U
nit
of
Serv
ice
(rep
lace
men
t co
st-b
ased
est
imat
e: a
t 6.
07%
re
turn
on
inve
stm
ent)
P
sych
iatr
y 21
,75
22.5
6 18
.31
33.8
5 18
.09
21.9
2 47
.92
37.1
8 22
.43
$27.
11
$9.6
4 0.
36
Med
icin
e 51
.05
35.3
8 49
.11
34.6
8 29
.59
30,5
5 10
9.76
57
.32
41.2
1 $4
8.74
$2
3.41
0.
48
Sur
gery
95
.16
63.0
4 94
.77
66.6
4 60
.20
N/A
N
/A
77.9
9 85
.64
$67.
93
$28,
67
0.42
In
term
edia
te M
edic
ine
41.4
4 N
/A
29.2
7 48
.53
39.8
0 32
.69
59.6
6 35
.10
60.4
6 $4
3.37
$1
1.08
0.
26
Nu
rsin
g H
om
e C
are
18.5
8 N
/A
23.9
5 26
.29
13.5
5 17
.78
32.9
8 94
.39
11.5
0 $2
9.88
$2
5.24
0.
84
Ou
tpat
ien
t C
lini
cs
3.11
1,
95
1,88
2.
16
1.81
1.
32
15.1
8 3.
84
4.51
$3
,97
$4.0
9 1.
03
C.
Rat
io o
f re
ntal
-bas
ed e
stim
ate
to r
epla
cem
ent
cost
-bas
ed e
stim
ate
of c
apit
al c
ost
Psy
chia
try
0.60
0.
73
0.49
0.
49
0.59
0.
51
0.43
0.
56
0.44
0.
54
0.09
0.
16
Med
icin
e 0.
65
0.73
0.
45
0.46
0.
58
0.40
0.
57
0.55
0.
37
0.53
0.
11
0.21
S
urge
ry
0.55
0.
62
0.44
0.
42
0.57
N
/A
N/A
0.
50
0.34
0.
43
0.18
0.
42
Inte
rmed
iate
Med
icin
e 0.
68
N/A
0.
55
0.52
0.
63
0.51
0.
48
0.73
0.
40
0.56
0.
10
0.19
N
urs
ing
Ho
me
Car
e 0.
61
N/A
0.
25
0.34
0.
57
0.51
0.
50
0.46
0.
42
0.46
0.
11
0.24
O
utp
atie
nt
Cli
nics
0.
64
0.79
0.
51
0.44
0.
62
0.51
0.
45
0.53
0.
42
0.54
0.
11
0.21
N/A
= D
ata
not
avai
labl
e or
ser
vice
doe
s no
t ex
ist a
t th
at V
AM
C,
~z
g~
~m

TA
BL
E
5 N
on C
apit
al C
ost
s/U
nit
of
Ser
vice
an
d t
he P
erce
nt
Incr
ease
D
ue
to C
apit
al C
ost
s
W.
Site
St
d.
Coe
ff A
lban
y B
osto
n B
rock
ton
Bro
nx
Buf
falo
Can
'dgu
a M
ontr
ose
Syra
cuse
H
aven
M
ean
Dev
. of
Vat
.
A.
Non
Cap
ital
Cos
t (O
pera
ting
Exp
endi
ture
s E
xclu
ding
Dep
reci
atio
n fr
om t
he C
DR
) P
sych
iatr
y W
ards
$
21
9
$3
13
$
16
8
$3
32
$
20
0
$153
$2
02
$337
$
20
3
$2
36
$6
7 0.
28
Med
icin
e $
49
7
$5
93
$
58
3
$4
55
$
35
1
$344
$7
01
$522
$
62
0
$5
19
$1
14
0.22
S
urge
ry
$6
22
$
78
5
$9
01
$
62
6
$5
22
N
/A
N/A
$
66
7
$8
68
$
62
4
$265
0.
43
Inte
rmed
iate
Med
icin
e $
40
7
$6
22
$
32
6
$4
34
$
37
1
$305
$2
90
$5
67
$
39
6
$3
87
$8
3 0.
21
Nur
sing
Hom
e C
are
$147
N
/A
$97
$1
99
$
13
9
$106
$1
43
$261
$
10
2
$1
49
$5
2 0.
35
Out
pati
ent
Cli
nics
$6
7 $5
4 $4
1 $5
5 $5
8 $3
2 $4
3 $5
6 $7
9 $5
4 $1
3 0.
25
B.
Per
cent
Inc
reas
e in
Tot
al C
ost/
Uni
t of
Ser
vice
Due
to
Cap
ital
Cos
t/U
nit
of S
ervi
ce
Psy
chia
try
War
ds
6.0%
5.
2%
5.3%
5.
0%
5.4%
7.
3%
10.3
%
6.2%
4.
9%
5.8%
1.
4%
0.24
M
edic
ine
6.7%
4.
3%
3.8%
3.
5%
4.9%
3.
6%
8.9%
6.
0%
2.5
%
4.7%
1.
7%
0.36
S
urge
ry
8.4%
5.
0%
4.7%
4.
5%
6.6%
N
/A
N/A
5.
8%
3.4%
4.
5%
2.1%
0.
47
Inte
rmed
iate
Med
icin
e 7.
0%
N/A
4.
9%
5.8%
6.
8%
5.4%
9.
8%
4.5%
6.
1%
5.9%
1.
3%
0.23
N
ursi
ng H
ome
Car
e 7.
8%
N/A
6.
2%
4.5%
5.
6%
8.5%
11
.6%
16
.8%
4.
7%
7.5%
3.
2%
0.43
O
utpa
tien
t C
lini
cs
3.0%
2.
9%
2.3%
1.
7%
1.9%
2
~1
%
16.2
%
3.6%
2.
4%
3.7%
3.
7%
0.99
N/A
Dat
a not
ava
ilabl
e or
serv
ice d
oes n
ot e
xist
at th
is V
AM
C.
Robert Rosenheck, Linda Frisman, and Michael Neate 507
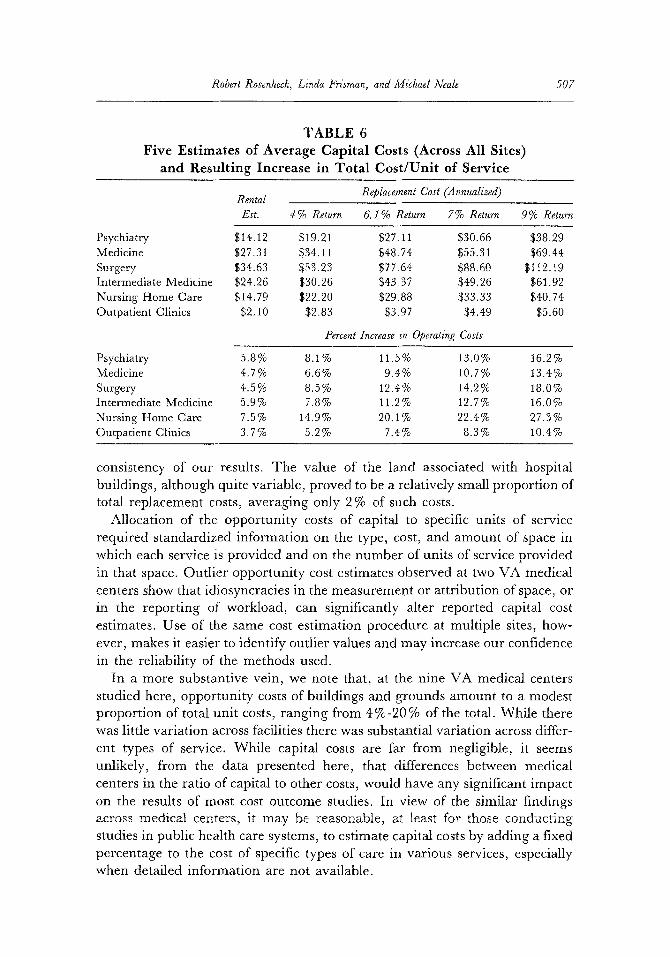
TABLE 6 Five Estimates of Average Capital Costs (Across All Sites)
and Resulting Increase in Total Cost/Unit of Service
Rental Replacement Cost (Annualized)
Est. 4% Return 6.1% Return 7% Return 9% Return
Psychiatry $14.12 $19.21 $27.11 $30.66 $38.29 Medicine $27.31 $34.11 $48.74 $55.31 $69.44 Surgery $34.63 $53.23 $77.64 $88.60 $112.19 Intermediate Medicine $24 .26 $30.26 $43.37 $49.26 $61.92 Nursing Home Care $14.79 $22.20 $29.88 $33.33 $40.74 Outpatient Clinics $2.10 $2.83 $3.97 $4.49 $5.60
Percent Increase in Operating Costs
Psychiatry 5.8% 8.1% 11.5 % 13.0% 16.2 % Medicine 4.7% 6.6% 9.4% 10.7% 13.4% Surgery 4.5% 8.5% 12.4% 14.2% 18.0% Intermediate Medicine 5.9% 7.8% 11.2% 12.7% 16.0% Nursing Home Care 7.5% 14.9% 20.l% 22.4% 27.3% Outpatient Clinics 3.7 % 5.2 % 7.4 % 8.3 % 10.4 %
consistency of our results. The value of the land associated with hospital buildings, although quite variable, proved to be a relatively small proportion of total replacement costs, averaging only 2% of such costs.
Allocation of the opportunity costs of capital to specific units of service required standardized information on the type, cost, and amount of space in which each service is provided and on the number of units of service provided in that space. Outlier opportunity cost estimates observed at two VA medical centers show that idiosyncracies in the measurement or attribution of space, or in the reporting of workload, can significantly alter reported capital cost estimates. Use of the same cost estimation procedure at multiple sites, how- ever, makes it easier to identify outlier values and may increase our confidence in the reliability of the methods used.
In a more substantive vein, we note that, at the nine VA medical centers studied here, opportunity costs of buildings and grounds amount to a modest proportion of total unit costs, ranging from 4%-20 % of the total. While there was little variation across facilities there was substantial variation across differ- ent types of service. While capital costs are far from negligible, it seems unlikely, from the data presented here, that differences between medical centers in the ratio of capital to other costs, would have any significant impact on the results of most cost outcome studies. In view of the similar findings across medical centers, it may be reasonable, at least for those conducting studies in public health care systems, to estimate capital costs by adding a fixed percentage to the cost of specific types of care in various services, especially when detailed information are not available.

508 Administration and Policy in Mental Health
It is of interest to compare our estimates of VA capital costs with estimates of capital costs among non-government health care providers for whom such costs are far less "hidden." It has been estimated that, in 1989, 8 % of total spending by U.S. hospitals was for capital expenses (including equipment), with 4.5 % for "fixed capital expenses," the category most comparable to the subject of this study (Herr, 1991). This estimate also fits with reports suggesting that between 1982 and 1985 total capital costs reimbursed by Medicare ranged from 7 % to 10% of all payments (Anderson & Ginsburg, 1983; Hemesath & Pope, 1989). Although the general similarity of these proportions might suggest a similar ratio of capital to operating costs, data have also been published to suggest a very wide range in the percentage of capital costs across facilities (Paschal, Klein, Bookman & Blanchard, 1987).
The VA data we have presented, while comparable to available data from other health care systems, have uncertain relevance beyond the VA system. In a comparative study of VA and non-VA hospitals, costs per case-mix adjusted inpatient day in VA were estimated to be about two-thirds of those in non-VA hospitals (Management Sciences Group, 1991). It would thus appear that while the ratio of capital costs to total costs is similar in VA and non-VA settings, the absolute value of annual capital costs may be somewhat less in VA.
A final comment is warranted about the potential for change in the oppor- tunity cost of public capital. In the highly volatile real estate market of recent years, the opportunity cost of publicly owned buildings, as estimated by the methods used here, has changed considerably, and in a direction opposite to the general rising trend of health care costs. Both rents for office space, and the estimated return on capital investments have been declining in the United States since their peak in 1982 (Passel, 1991). By 1989, office rents had lost 32 % of their 1982 value, after adjustment for inflation, and return on capital investments had declined 29%, from 8.6%, in 1982, to 6.1% 1989 (US Bureau of the Census, 1991). To the extent that capital costs do affect the result of cost benefit studies, the changing value of capital may alter the cost- effectiveness of an intervention over the years. In Weisbrod's 1980 study, for example, the experimental and control conditions differed in their total cost by only 6.5%. As demonstrated by McGuire (1991), a modest change in the estimated rate of return on capital would have changed the results of that study. Theoretically, a community-based program could therefore be cost effective at one point in time, but might lose its net cost effectiveness as the opportunity cost of capital changed. The question of whether findings from experimental studies can be generalized from the study sample to larger populations is a well recognized problem in experimental research (Cook & Campbell, 1979). In cost studies, especially where capital is concerned, the issue of generalizability over time may also be relevant, especially during periods of time, or in regions of the country, in which rapid economic change is occurring.

Robert Rosenheck, Linda Frisman, and Michael Neale 509
CONCLUSION
The annual cost of buildings and land in public sector hospitals emerges, in this study, as a notable but modest component of inpatient cost, and as a component that does not vary markedly from one VA facility to another. Such costs should be calculated and included in cost analyses whenever appropriate data are available, using methods comparable to those we have described here. However, our findings also suggest that, in the absence of site-specific data, a non-empirical estimate of opportunity costs based on a percentage of other operating costs (6% of inpatient costs and 4% of outpatient costs) may be acceptable for use with VA medical centers, if not with other public sector hospitals.
REFERENCES
Anderson, G., & Ginsburg, P.B. (1983). Prospective capital payments to hospitals. Health Affairs, 2, 52. Anthony, W., Cohen, M., & Farkas, M. (1991). Psychiatric rehabilitation. Boston: Center for Psychiatric
Rehabilitation. Bond, G.R. (1984). An economic analysis of psychosocial rehabilitation. Hospital and Community Psychiatry,
35, 356. Cannon, N.L., McGuire, T., & Dickey, B. (1985). Capital costs in economic program evaluation: The case
of mental health services. In J.S. Catterall (Ed.), Economic evaluation of public programs. New Direction in Program Evaluation, No. 26. San Francisco: Jossey-Bass.
Cook, T.D., & Campbell, D.T. (1979). Quasi-experimentation: Design and analysis issues for field settings. Skokie, IL: Rand McNally.
Dickey, B., Cannon, N.L., McGuire, T., & Gudeman, J. (1986). The quarterway house: A two-year cost study of an experimental residential program. Hospital and Community Psychiatry, 37, 1136.
Hardy, O.B., & Lammers, L.P. (1986). Hospitals: The planning and design process (2nd ed.). Rockville, MD: Aspen Publishers.
Hemesath, M., & Pope, G.C. (1989). Linking Medicare capital payments to hospital occupancy rate. Health Affairs, 8, 104.
Herr, W. (1991, April). Taking a deep breath over capital payments. Healthcare Financial Management. Management Sciences Group. (1991). A comparison of the operating costs and performance of VA and non-
federal hospitals: 1984-1988. Bedford, MA: Dept. of Veterans Affairs Management Sciences Group. McGuire, T.G. (1991). Measuring the economic costs of schizophrenia. Schizophrenia Bulletin, 17, 375. Paschal, W.E., Klein, R.A., Bookrnan, L.A., & Blanchard, T.P. (1987). Capital costs under Medicare
PPS: Exploring the myths and the reality. Federation of American Hospital Systems Review, May-June, p. 41. Passel, P. (1991, September 8). Surviving the real estate glut: Light at the end of the elevator shaft. New York
Times, Section 10, p. 1. Samuelson, P.A., & Nordhaus, W.D. (1985). Economics (12th ed.). New York: McGraw-Hill. Stein, L.I., & Test, M.A. (1980). Alternative to mental hospital treatment I: Conceptual model, treatment
program and clinical evaluation. Archives of General Psychiatry, 37, 392. U.S. Bureau of the Census. (1976). Historical statistics of the United States, colonial times to 1970. Washington,
DC: Author. U.S. Bureau of the Census. (1991). Statistical abstracts of the United States: 1991 (11 lth ed.). Washington, DC:
Author. Weisbrod, B.A. (1983). A guide to benefit-cost analysis, as seen through a controlled experiment in treating
the mentally ill. Journal of Health Politics & Law, 7, 808. Weisbrod, B.A., Test, M.A., & Stein, L.I. (1980). Alternative to mental hospital treatment II: Economic
benefit-cost analysis. Archives of General Psychiatry, 37, 400.