Estimating preconstruction services costs for highway projects
117
Graduate eses and Dissertations Iowa State University Capstones, eses and Dissertations 2014 Estimating preconstruction services costs for highway projects Kate Hunter Iowa State University Follow this and additional works at: hps://lib.dr.iastate.edu/etd Part of the Engineering Commons is esis is brought to you for free and open access by the Iowa State University Capstones, eses and Dissertations at Iowa State University Digital Repository. It has been accepted for inclusion in Graduate eses and Dissertations by an authorized administrator of Iowa State University Digital Repository. For more information, please contact [email protected]. Recommended Citation Hunter, Kate, "Estimating preconstruction services costs for highway projects" (2014). Graduate eses and Dissertations. 13774. hps://lib.dr.iastate.edu/etd/13774
-
Upload
khangminh22 -
Category
Documents
-
view
1 -
download
0
Transcript of Estimating preconstruction services costs for highway projects

Graduate Theses and Dissertations Iowa State University Capstones, Theses andDissertations
2014
Estimating preconstruction services costs forhighway projectsKate HunterIowa State University
Follow this and additional works at: https://lib.dr.iastate.edu/etd
Part of the Engineering Commons
This Thesis is brought to you for free and open access by the Iowa State University Capstones, Theses and Dissertations at Iowa State University DigitalRepository. It has been accepted for inclusion in Graduate Theses and Dissertations by an authorized administrator of Iowa State University DigitalRepository. For more information, please contact [email protected].
Recommended CitationHunter, Kate, "Estimating preconstruction services costs for highway projects" (2014). Graduate Theses and Dissertations. 13774.https://lib.dr.iastate.edu/etd/13774

Estimating preconstruction services costs for highway projects
by
Kate D. Hunter
A thesis submitted to the graduate faculty
In partial fulfillment of the requirements for the degree of
MASTER OF SCIENCE
Major: Civil Engineering (Construction Engineering and Management)
Program of Study Committee:
Douglas D. Gransberg, Major Professor
Hyung Seok “David” Jeong
Brent M. Phares
Iowa State University
Ames, Iowa
2014
Copyright © Kate D. Hunter, 2014. All rights reserved.

i
TABLE OF CONTENTS
LIST OF TABLES ............................................................................................................................ iv
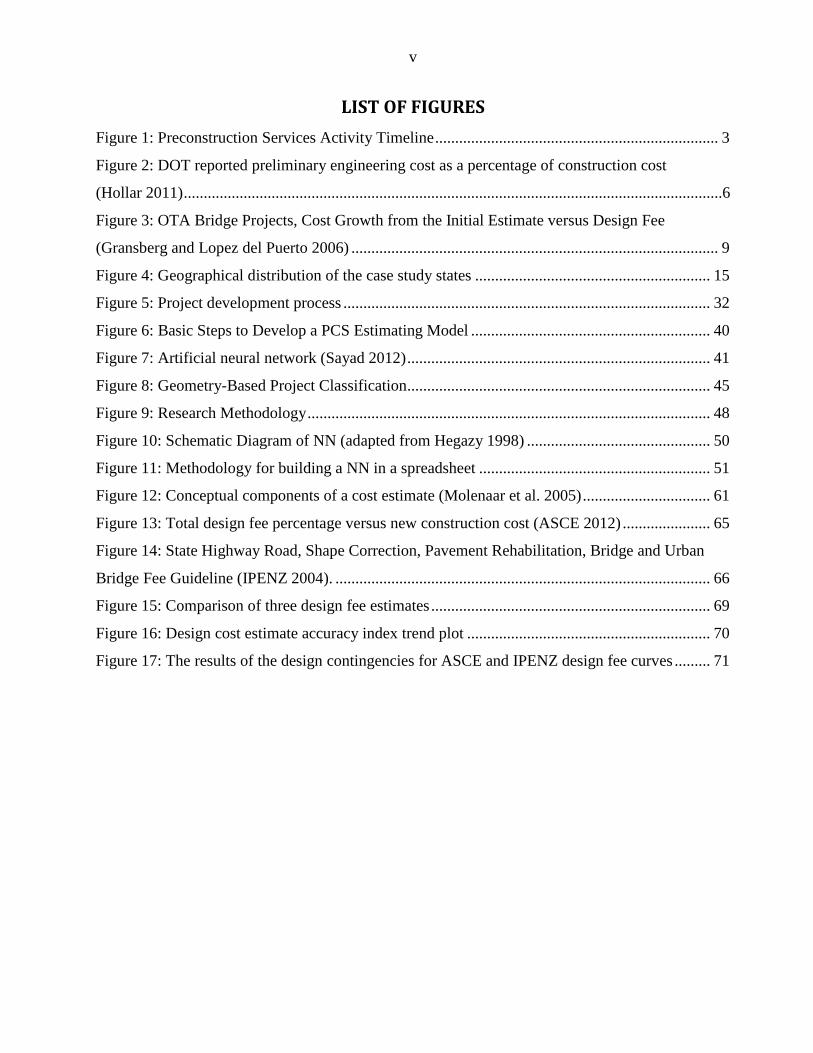
LIST OF FIGURES ............................................................................................................................v
ACKNOWLEDGEMENTS .............................................................................................................. vi
ABSTRACT ..................................................................................................................................... vii
CHAPTER 1—INTRODUCTION .....................................................................................................1
Background .....................................................................................................................................1
Motivation .......................................................................................................................................6
Problem Statement ..........................................................................................................................9
Content Organization ....................................................................................................................10
CHAPTER 2—APPROACH TO RESEARCH METHODOLOGY AND VALIDATION ............12
Case Study Protocol ......................................................................................................................12
Case Study Process .......................................................................................................................14
Case Study Selection.....................................................................................................................14
Case Study Agency Synopsis........................................................................................................16
CHAPTER 3—FRAMEWORK FOR DEVELOPING A PRECONSTRUCTION
SERVICES COST ESTIMATING MODEL FOR HIGHWAY PROJECTS ..................................25
Abstract .........................................................................................................................................25
Introduction ...................................................................................................................................25
Background ...................................................................................................................................26
Methodology .................................................................................................................................29
Results ...........................................................................................................................................30
Conclusions ...................................................................................................................................36
CHAPTER 4— A NEURAL NETWORK APPROACH TO ESTIMATING
PRECONSTRUCTION SERVICES COST .....................................................................................38

ii
Abstract .........................................................................................................................................38
Introduction ...................................................................................................................................38
Background ...................................................................................................................................40
Methodology .................................................................................................................................48
Results ...........................................................................................................................................53
Conclusions ...................................................................................................................................55
CHAPTER 5 – RATIONAL METHOD TO DETERMINE A DESIGN COST
CONTINGENCY FOR CONSULTANT DESIGNED HIGHWAY CONSTRUCTION
PROJECTS .......................................................................................................................................56
Abstract .........................................................................................................................................56
Introduction ...................................................................................................................................56
Background ...................................................................................................................................57
Methodology .................................................................................................................................67
Conclusions ...................................................................................................................................72
CHAPTER 6—CONSOLIDATED CONCLUSIONS AND LIMITATIONS .................................73
Conclusions ...................................................................................................................................73
Limitations ....................................................................................................................................74
CHAPTER 7—CONTRIBUTIONS AND RECOMMENDATIONS FOR FUTURE
RESEARCH ......................................................................................................................................76
Contributions.................................................................................................................................76
Recommendations For Future Research .......................................................................................76
BIBLIOGRAPHY .............................................................................................................................77
APPENDIX A—PROJECT DEVELOPMENT PROCESSES ........................................................83
APPENDIX B—CASE STUDY WRITE UPS.................................................................................86
Agency: Caltrans ..........................................................................................................................86
Agency: Colorado Department of Transportation (CDOT) .........................................................88

iii
Agency: Iowa Department of Transportation (Iowa DOT) ..........................................................90
Agency: Maryland (MSHA) ........................................................................................................92
Agency: Montana Department of Transportation (MDT) ............................................................94
Agency: New York State Department of Transportation (NYSDOT) .........................................96
Agency: Oklahoma State Department of Transportation (ODOT) ..............................................98
Agency: Rhode Island Department of Transportation (RIDOT) ...............................................100
Agency: Utah Department of Transportation (UDOT) ...............................................................102
APPENDIX C—AGENCY AND PROJECT INTERVIEW TEMPLATE ....................................104

iv
LIST OF TABLES
Table 1: Preconstruction Services Activity Timeline (Anderson et al. 2007) ................................... 4
Table 2: Population and Land area information (US Census Bureau 2014) .................................... 15
Table 3: CDOT project data ............................................................................................................. 17
Table 4: MSHA project data ............................................................................................................ 19
Table 5: MDT project data ............................................................................................................... 20
Table 6: NYSDOT project data ....................................................................................................... 21
Table 7: ODOT project data ............................................................................................................ 22
Table 8: UDOT project data ............................................................................................................ 24
Table 9: Conditions for preferring Top-Down or Bottom-Up Estimates (Larson and Gray, 2011) 29
Table 10: Agency PCS estimating methods..................................................................................... 30
Table 11: Influence Factors ranked based on mean response values from nine DOTs ................... 33
Table 12: Project Influence Factors ranked based on mean response values from 16 Projects....... 34
Table 13: Project Classification Based on Complexity (Iowa DOT, 2012) .................................... 47
Table 14: Project Influence Factors ranked based on mean response values from 16 Projects....... 49
Table 15: Results of NN analysis..................................................................................................... 54
Table 16: TCEC Table of Technical Factors (TCEC 2005) ............................................................ 64
Table 17: Database of projects used estimate .................................................................................. 68
v
LIST OF FIGURES
Figure 1: Preconstruction Services Activity Timeline ....................................................................... 3
Figure 2: DOT reported preliminary engineering cost as a percentage of construction cost
(Hollar 2011) .......................................................................................................................................6
Figure 3: OTA Bridge Projects, Cost Growth from the Initial Estimate versus Design Fee
(Gransberg and Lopez del Puerto 2006) ............................................................................................ 9
Figure 4: Geographical distribution of the case study states ........................................................... 15
Figure 5: Project development process ............................................................................................ 32
Figure 6: Basic Steps to Develop a PCS Estimating Model ............................................................ 40
Figure 7: Artificial neural network (Sayad 2012) ............................................................................ 41
Figure 8: Geometry-Based Project Classification ............................................................................ 45
Figure 9: Research Methodology ..................................................................................................... 48
Figure 10: Schematic Diagram of NN (adapted from Hegazy 1998) .............................................. 50
Figure 11: Methodology for building a NN in a spreadsheet .......................................................... 51
Figure 12: Conceptual components of a cost estimate (Molenaar et al. 2005) ................................ 61
Figure 13: Total design fee percentage versus new construction cost (ASCE 2012) ...................... 65
Figure 14: State Highway Road, Shape Correction, Pavement Rehabilitation, Bridge and Urban
Bridge Fee Guideline (IPENZ 2004). .............................................................................................. 66
Figure 15: Comparison of three design fee estimates ...................................................................... 69
Figure 16: Design cost estimate accuracy index trend plot ............................................................. 70
Figure 17: The results of the design contingencies for ASCE and IPENZ design fee curves ......... 71

vi
ACKNOWLEDGEMENTS
First, I would like to thank Dr. Doug Gransberg for all the guidance and support he has
given me throughout the research process. He is a great mentor, and I have learned so much from
working with him.
Secondly, I would like to thank the members of the NCHRP 15-51 research team. I have
learned so much from working with them and they have been a great support network.
Thirdly, I would like to thank the members of my thesis committee. I would like to thank
Dr. David Jeong and Dr. Brent Phares for the time and support they have offered to me.
Finally, I would like to thank my classmates, family and friends in particular Jorge, Silvia
Catalina, Ed, Asre, Elika, Francis, Leon, Kayla, Meagan and my parents.

vii
ABSTRACT
Preconstruction Services (PCS) is defined as all work completed on a project once it has
been authorized for funding and cost related to the project can be charged accordingly, up until
construction contract is awarded. Due to the changing nature of State DOT work with increased
funding uncertainties and shrinking budgets it is more important than ever to ensure proper
allocation of funds for highway projects. Uneducated estimates for preconstruction services or
using a fixed percentage across multiple projects can lead to a misallocation of available capital
funding in the PCS phase, which may force the need to redistribute funding late in an agency’s
fiscal year to cover overages and to expend underruns before the authorization expires.
Underestimation can lead to inadequate PCS budgets and poor construction documents. In short an
educated thought out PCS cost estimate can lead to cost certainty within all aspects of a project.
Firstly the research focuses on developing a framework for a PCS cost estimate focusing on
the type of estimate and the factors that affect it. Second, an artificial neural network model is
proposed to estimate PCS costs, the research also investigates a method for defining projects to
further refine the historic data that is used in the NN model. Finally the research focuses on a
method to estimate a design cost contingency.
Two types of estimates were found top-down and bottom-up estimates the difference in the
estimate was dependent on the end user and the amount of data available. Three factors
complexity, project type and construction cost were found to be the three factors that had a major
influence on PCS cost estimate. The NN model produce provided a top-down PCS estimate, the
final model provided estimates with a weighted error of 1.4% over 13 projects. Iowa DOT’s
method of classifying projects based on project complexity was investigated and determined to be
an appropriate method for project classification considering project complexity was considered a
major influence factor. Finally a method was determined to estimate an appropriate design
contingency using design cost estimate accuracy index. All methods and models developed in this
thesis are expected to be applied to individual agency’s historic data and estimating systems. It is
also stressed that models have limitations and should not be used outside the range which it was
developed.

1
CHAPTER 1—INTRODUCTION
The objective of this research is to review the state-of-art in preconstruction services
(PCS) cost estimating techniques used within the transportation industry and propose a
framework for developing a PCS cost estimate. In doing so, it is important to first focus on how
design costs are estimated since those constitute a large proportion of total PCS costs and the
preliminary design often dictates what PCSs, like geotechnical investigations and environmental
studies, are required to be accomplished to be able to complete the design itself. This thesis has
three primary areas of focus:
Developing a rational method for estimating a contingency for design cost estimate
Framework for developing a preconstruction services cost estimating model
Neural network model to determine preconstruction services cost estimate.
The definition of preconstruction services covers a very broad spectrum of project
services and includes all work completed on the project from the project conception up until
contract award. This process includes effort that may not be assigned to a particular project and
also effort for projects that never eventuate.
BACKGROUND
The definition of PCS covers a very broad spectrum of project services and includes all
work completed on the project from the project conception up until construction contract award.
This process includes effort that may not be assigned to a particular project and also effort for
projects that never eventuate.
Standard Definitions
Preconstruction Services (PCS): All work completed on a project once it has been
authorized for funding and costs related to the project can be charged accordingly, up
until the construction contract is awarded. A generic project development timeline and a
list of included activities for each phase were standardized for this study and are shown in
Figure 1.
Overhead costs: The mark-up/amount that accounts for the costs of department of
transportation (DOT) staff above the operational level of planners, designers, etc. (i.e.
executive and support staff that do not directly work on specific projects).

2
Corridor Projects: Also referred to as “parent projects’. The term corridor is defined by
the US DOT as “a combination of discrete, adjacent surface transportation networks (e.g.,
freeway, arterial, rail networks) that link the same major origins and destinations. It is
defined operationally rather than geographically or organizationally.” Corridor projects
are usually multi-phased projects which require various preliminary engineering studies
such as environmental assessment (acquiring wetland permits, NEPA documents, etc.),
and right of way during the early planning stages. These types of projects are represented
by project identification number (PIN) and usually fall under Type I category. Thus, a
Corridor Project is defined as a group of Single Projects divided either into multiple
sections or work types aimed at repairing, preserving and/or improving transportation
network associated to a given roadway.
Single Projects: Also referred to as “child projects.” Projects that are created from
portions Corridor Projects and whose early preconstruction expenses are at some level
jointly estimated and recorded within the Corridor Project that spawned it. Single projects
are identified by the assign of DOT project numbers for funding purposes. In this type of
project, it should be noted that preliminary engineering works might be performed for a
particular type of project conducted at the planning stage of multi-phase project and care
must be taken to account all works and costs associated with the project.
Independent Projects: Typical projects that are awarded by a DOT on an annual basis. In
this type of project, the total preconstruction costs are individually estimated, assigned,
and recorded. Thus, Single Projects that do not share any recorded preconstruction
service expenses with Corridor Projects will be considered as Independent Projects.
Independent Projects are also identified by project numbers.
3
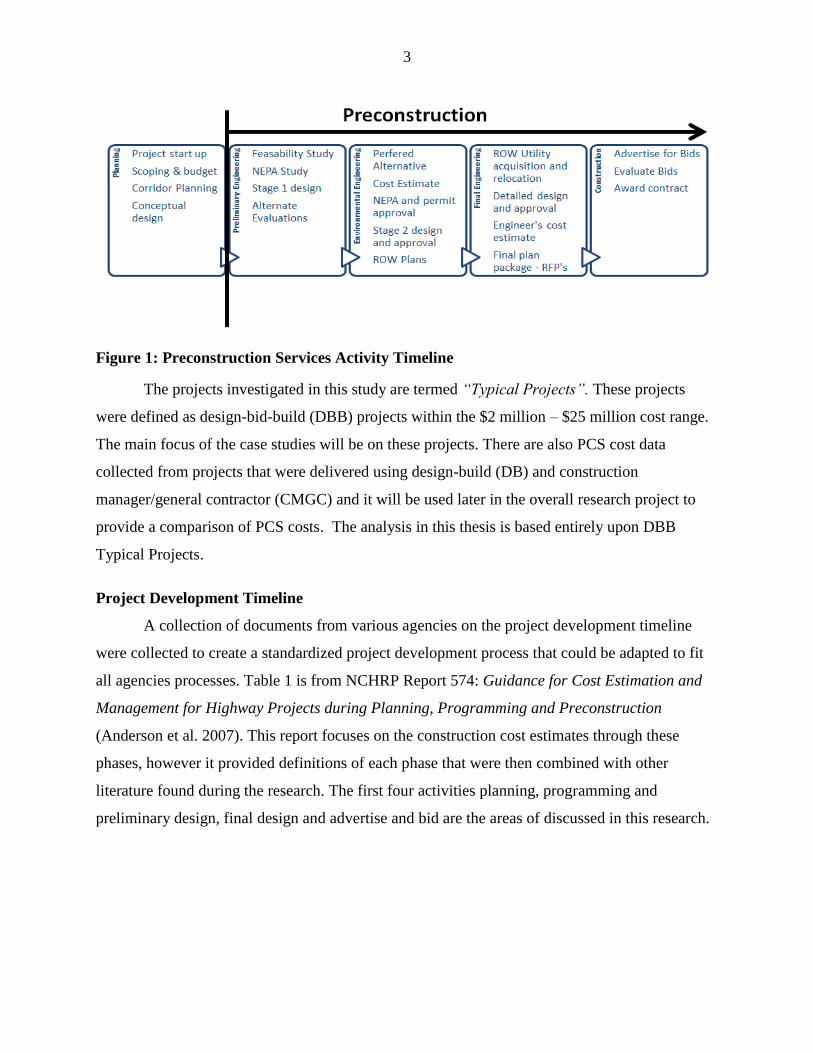
Figure 1: Preconstruction Services Activity Timeline
The projects investigated in this study are termed “Typical Projects”. These projects
were defined as design-bid-build (DBB) projects within the $2 million – $25 million cost range.
The main focus of the case studies will be on these projects. There are also PCS cost data
collected from projects that were delivered using design-build (DB) and construction
manager/general contractor (CMGC) and it will be used later in the overall research project to
provide a comparison of PCS costs. The analysis in this thesis is based entirely upon DBB
Typical Projects.
Project Development Timeline
A collection of documents from various agencies on the project development timeline
were collected to create a standardized project development process that could be adapted to fit
all agencies processes. Table 1 is from NCHRP Report 574: Guidance for Cost Estimation and
Management for Highway Projects during Planning, Programming and Preconstruction
(Anderson et al. 2007). This report focuses on the construction cost estimates through these
phases, however it provided definitions of each phase that were then combined with other
literature found during the research. The first four activities planning, programming and
preliminary design, final design and advertise and bid are the areas of discussed in this research.

4
Table 1: Preconstruction Services Activity Timeline (Anderson et al. 2007)
Development phase Typical Activities
Planning
Determine purpose and need, determine whether it's an improvement or
requirement study, consider environmental factors, facilitate public
involvement/participation, and consider interagency conditions
Programming and Preliminary
Design
Conduct environmental analysis, conduct schematic development, hold public
hearings, determine right-of-way impact, determine project economic
feasibility, obtain funding authorization, develop right-of-way, obtain
environmental clearance, determine design criteria and parameters, survey
utility locations and drainage, make preliminary plans such as alternative
selections, assign geometry, and create bridge layouts
Final Design
Acquire right-of-way, develop plans, specifications, and estimates (PS&E),
and finalize pavement and bridge design, traffic control plans, utility
drawings, hydraulics studies/drainage design, and cost estimates
Advertise and Bid
Prepare contract documents, advertise for bid,
hold a pre-bid conference, and receive and
analyze bids
Construction
Determine the lowest responsive bidder, initiate contract, mobilize, conduct
inspection and materials testing, administer contract, control traffic, and
construct bridge, pavement, and drainage
Project development processes from the Arizona, Iowa, Ohio, and New York State DOT
as well as the Western Federal Lands Highway Division, were synthesized to develop a
generalized project development process that can be adapted to individual agencies. These
documents can be found in Appendix A of this report. Figure 1 shows the preconstruction
timeline starting at the preliminary engineering stage this is designed to coincide with the
Statewide Transportation Improvement Plan (STIP) for most agencies. All activities that occur
prior to this including initial startup, scoping and budget, corridor planning and conceptual
design are considered sunk cost and are included in the project overhead.
Statewide Transportation Improvement Plan
Federal Regulations require that State Departments of Transportation develop a Statewide
Transportation Improvement Program (STIP) (CDOT 2013). The STIP contains capital and
noncapital transportation projects proposed for funding under Title 23 (highways) and Title 49
5
(transit) of the U.S. Code as well as all regionally significant transportation projects that require
an action by the Federal Highway Administration (FHWA) or the Federal Transit Administration
(FTA).
In July 2012, the President signed Moving Ahead for Progress in the 21st Century (MAP-
21). The STIP is developed under current federal regulations (Title 23 US Code). Currently, the
development of a new STIP is required at least every four years and must contain a minimum
four-year listing of Federal-Aid Projects. The STIP must be approved by the FHWA and the
FTA.
Federal regulations require each STIP to be fiscally constrained. All federally funded
transportation projects must be included in the STIP. In some states it is transportation
commission policy to include state funded projects and local projects overseen by the DOT’s in
the STIP. The STIP was identified as a good baseline for the start of preconstruction services
once a project gains funding authorization.
Research by Hollar (2011) looked at the percentage of construction costs that went in to
“preliminary engineering.” The definition used for preliminary engineering it this study was:
“[P]lanning and design of a highway project for construction. PE begins when a specific
highway project first receives funding authorization for planning and/or design activities.
The delivery of the construction documents used for solicitation of construction contract
bids (known as project letting) marks the end of PE.” (Hollar 2011)
This definition is similar to the definition of preconstruction services except it does not
include construction contract letting phase. Figure 2 shows the responses from 28 DOTs the
percentage ranges from 4% in South Dakota up to 20% in California, Montana, Pennsylvania and
Virginia.

6
Figure 2: DOT reported preliminary engineering cost as a percentage of construction cost
(Hollar 2011)
MOTIVATION
The first expenses incurred in all projects are the costs to perform planning,
programming, and preliminary engineering. Construction uncertainty is at its absolute highest
level, making the practice of setting a budget for PCS costs using a percentage of construction
costs merely the act of multiplying an arbitrary number by an estimated figure that will change as
project development progresses (Hollar 2011). Hence, in many cases, the budget for developing
a given project is effectively more uncertain than the budget for the project itself. To exacerbate
the problem, research has proved that 86% of the time the initial construction estimate and
subsequent estimates are too low (Flyvbjerg et al. 2002), which means that the budget for PCS
costs will also be too low. The cliché “you get what you pay for” becomes active in this
situation. The amount of effort that can be applied to quantifying the cost of the project’s scope
of work is limited by the available budget, and an inaccurate PCS cost estimate becomes a design
quality issue, with in-house engineers and DOT preliminary engineering consultants forced to
make the time spent on refining the design fit the available budget (Carr and Beyor 2005). The

7
final product is often a set of poorly prepared construction documents detailing a product that is
functionally over-designed because the designers did not have the budget to produce a fully
optimized design (Gransberg et al. 2007; CMAA 2003).
The state-of-the-practice in PCS cost estimating ranges widely among DOTs. At times
the variation is present within a single agency for different types of services and different stages
of project development. Issues including the range of design alternatives to be analyzed; the
impact of environmental permitting, construction safety, and options for traffic control; as well
as construction phasing to meet construction financing and budget constraints all make PCS cost
estimating challenging at best and nearly arbitrary at worst. Therefore, the need for standardized
guidance for estimating PCS costs is critical for DOTs to meet transparency, accountability, and
fiscal responsibility that come with the tighter budget experienced in the past 5 years. Hence, the
objective of this research will be to propose a framework for estimating PCS costs.
The issue of accurate estimating of preconstruction service (PCS) costs is essentially tied
to the efficient use of available public capital (Janacek 2006). Early estimates conducted during
the planning phase often become legislative authorizations and turn into project budgets before
the final scope of project work is adequately quantified (Anderson et al. 2007). Additionally,
since preconstruction costs are by definition a small portion of the total project delivery cost,
they are typically estimated as a standard percentage of estimated construction costs. Hence, if
the capital project is underestimated, PCS costs will be similarly underestimated. A 2002 study
involving 258 transportation projects collectively valued at $90.0 billion (Flyvbjerg et al. 2002)
found that 86% experienced actual costs that were on average 28% higher than estimated. That
study concludes that “underestimation of costs at the time of decision to build is the rule rather
than the exception for transportation infrastructure projects” (Flyvbjerg et al. 2002, italics
added). If one applies the USACE (1997) supervision and administration (S&A) rate of 5.6% to
Flyvbjerg’s sample, the PCS cost would be roughly $5.0 billion, a significant amount of money
in any context. Using Flyvbjerg’s cost growth would mean that the agencies delivering these
projects would be short $1.4 billion in the preconstruction phases of project development. The
fact that project scope and quality is defined during the planning and design process leads one to
infer that poor estimating accuracy is actually robbing the project of proper resources to
complete a thorough preconstruction process and perhaps ultimately results in imperfect

8
construction documents that actually become the basis for construction cost growth after contract
award (Molenaar 2005).
A study by Carr and Beyor (2005) reported that consultant design fees have not kept pace
with inflation for the past three decades. This creates a situation where “the high-quality
professional services rightfully expected by the public will become increasingly difficult [to
attain] if the erosion in fees continues unabated into the future” (Carr and Beyor 2005). In
essence, this pricing pressure forces engineers to literally furnish the requisite level of design
services with a steadily decreasing amount of resources. This could unintentionally induce a bias
toward minimizing planning and design activities to maintain necessary project profitability,
which in turn would manifest itself in the form of declining quality of construction documents.
This environment is further exacerbated by the recent demand by owners to compress
project delivery periods via programs like the FHWA’s Everyday Counts (EDC). A survey by
the Construction Management Association of America (CMAA 2003) found that the “demand
for increasing speed of project delivery is the top reason for decline in construction document
quality.” The survey also reported that “In their responses to questions about the quality of
construction documents, more than half of the owners surveyed responded that these documents
often have significant amounts of missing information. Specifically, 45 percent of respondents
indicated that construction documents, while sufficient, still had ‘significant information
needed,’ while an additional 12 percent found that documents were typically inadequate because
of major information gaps” (CMAA 2003).
A number of studies have looked at the relationship between design quality and
subsequent construction contract modifications. Studies by Morgen (1986) and Kirby et al
(1988) found that design deficiencies are the major cause of construction contract modifications
and that 56% of all modifications are aimed at correcting design deficiencies. Additionally, a
study by Burati et al. (1992) found that deviations due to design errors discovered during
construction account for 79% of all modification costs and average 9.5% of the total project cost.
Thus, past research is showing that improving planning and design quality has the potential to
accrue benefits through reducing construction cost growth. A study completed for the Oklahoma
Turnpike Authority (OTA) (Gransberg et al. 2006) confirmed this inference and demonstrated

9
for one agency that, to a point, increases in actual construction costs compared to the early
estimate were inversely proportional to the amount of money allocated for PCS. Figure 3 comes
from that work and illustrates the relationship for OTA DBB bridge projects, specifically for the
design fee expressed as a percentage of construction costs. The figure graphically illustrates that,
within the limitations of the research, providing adequate funding to properly complete PCS
gives the agency more control over the final cost of the project. Said another way, an accurate
PCS cost estimate increases cost certainty for DBB projects. This conclusion is confirmed by a
recent study that found “DB and CMGC display lower cost growths than DBB and therefore
provide greater cost certainty” (West and Gransberg 2012, italics added).
Figure 3: OTA Bridge Projects, Cost Growth from the Initial Estimate versus Design Fee
(Gransberg and Lopez del Puerto 2006)
Given the above discussion, developing a pragmatic system with which to estimate PCS
costs will promote final design quality by reducing construction document errors and omissions
(Carr and Beyor 2005; CMAA 2003) and accrue an immediate benefit by enhancing cost
certainty for projects delivered using both traditional and alternative delivery methods
(Gransberg and Lopez del Puerto 2006; West and Gransberg 2012).
PROBLEM STATEMENT
In the past there has been a substantial amount of research into estimating construction
costs for highway projects and there are also a handful of articles about estimating design cost
and preliminary engineering for highway project but somehow preconstruction services costs
have not been seriously researched. Due to the changing nature of state DOT work with
Bridge Projects
R2 = 0.9254
-100.00%
-50.00%
0.00%
50.00%
100.00%
0 0.05 0.1 0.15 0.2
Design Fee
Co
st
Gro
wth

10
increased funding uncertainties and shrinking budgets, it is more important than ever to ensure
proper allocation of funds for highway projects. Uneducated estimates for preconstruction
services or using a fixed percentage across multiple projects can lead to a misallocation of
available capital funding in the PCS phase, which may force the need to redistribute funding late
in an agency’s fiscal year to cover overages and to expend underruns before the authorization
expires (Hollar 2011).
The main objective of this research is to identify, analyze, and understand the current
models for PCS cost estimating. This research is focused on US Department of Transportation
(DOT) highway projects, but considers work from other industries.
These objectives are being further explored by focusing on the following questions:
1. What project characteristics are important to developing an accurate PCS cost estimate?
2. What steps must be followed to implement a standardized PCS cost estimating
methodology?
CONTENT ORGANIZATION
This thesis contains three journal articles that comprise chapters 3, 4, and 5. Although
each of these chapters contains a stand-alone document, they all focus on aspects of
preconstruction services cost estimating for highway projects. The three chapters begin a
framework for estimating PCS costs along with the key factors that influence the PCS cost
estimates (Chapter 3), then the focus is narrowed to a PCS cost estimating using a neural
network (Chapter 4), and finally the focus is narrowed even further to discuss a method for
estimating design cost contingency (Chapter 5).
The objective of chapter 3 is to review and analyze current PCS cost estimating methods
and propose a framework for developing a PCS cost estimate. The framework is derived from a
larger project where detailed case studies were undertaken in nine US state Departments of
Transportation (DOT). The paper documents and discusses the project characteristics previously
identified for a given project through exploration of the literature and DOT estimating
guidance/policy documents. Specifically, the paper seeks to answer the following research
question:
What project characteristics are important to developing an accurate PCS cost estimate?

11
Chapter 4 discusses the use of a neural network to estimate PCS costs. The paper
demonstrates the data mining approach used to develop the model and a classification system
that can divide projects into like groups to improve the accuracy of the model. This chapter will
provide an agency with a framework for implementing a neural network model by building on
the influence factors determined in chapter 3.
Chapter 5 was submitted to the Transportation Research Board and was accepted for
presentation at the 2014 annual meeting. The purpose of this chapter is to propose a rational
method for determining a design cost contingency. This paper focuses on a single aspect of PCS
cost estimating, the design cost estimate. The chapter proposes a method for creating a design
cost estimate accuracy index from historical budgeted and actual design fee data. The paper
demonstrates how the index can be used on future projects to determine an appropriate design
contingency.
Chapter 6 details the conclusions reached in the research as well as the limitations that
are inherent to those conclusions, and Chapter 7 discusses the important contributions made to
the PCS cost estimating body of knowledge and points out future research needs to fill the gaps
in that body of knowledge discovered during this project.

12
CHAPTER 2—APPROACH TO RESEARCH METHODOLOGY AND
VALIDATION
There has been a substantial amount of research into estimating construction costs for
highway projects. There are also a handful of studies about estimating design cost and
preliminary engineering, but no research about estimating preconstruction services costs was
found in the literature review conducted for this project. The thesis focuses on sixteen project
and nine agency case studies that were collected at the time of this writing, as well as, the
relevant analyses and observations made of those case studies. Case studies formed the bulk of
the original research conducted in this project and offered examples of PCS cost estimating
practices as well as examples of how agencies breakdown available PCS information.
The section begins by discussing the case study data collection protocol and methodology
that allowed information to be collected from each agency in a verifiable manner. This section
includes a description of case study demographics and the rationale for choosing each case study
agency and the accompanying projects. Following the methodology section are condensed
synopses of the case study summaries. Detailed case study summaries are contained in the
Appendix B.
CASE STUDY PROTOCOL
Case studies were the primary source of data on the PCS cost estimating techniques in
this research and are the basis for the practices recommended in this thesis. Since the collection
of information via agency interviews and project case studies is the predominant research
instrument in the research project, a large amount of time was invested to determine to how best
to conduct the case studies, reduce the subsequent data and to capture valuable information.
Construction is a highly social process and is affected by human traits and behavior
therefore it is important to utilize social science research methods to ensure social factors do not
jeopardize the results (Abowitz 2010). Case study research has been shown to be a powerful
research tool to evaluate and analyze emerging business practices such as PCS estimating
techniques (Eisenhardt 1991). Case studies are particularly useful in answering questions about
how things are done in detail, especially when examining a number of different cases (Yin
2003). The use of the case study method was essential in this research for capturing the unique

13
nature and methods of the differing PCS cost estimating procedures employed by each agency
and understanding the rationale behind their chosen methods.
The major objection to the use of case studies has been the perceived lack of statistical
rigor. Recognizing this criticism, the research sought to generate a defensible, repeatable method
to guide the case study process. This method was formalized and recorded in the case study
protocol for the project. Creation of the case study protocol was guided by the influential book
on the technique written by Yin (2003).
The case study protocol serves to establish the purpose of the case studies and the
research questions to be answered by them. Clearly stating the specific information sought by
the researchers at the start of this crucial task ensured that all researchers who were conducting
case study interviews understood the ultimate goals of the research. The background information
for the protocol included key sections, like the two below, to further explore the objective of this
research:
1. What project characteristics are important to developing an accurate PCS cost estimate?
2. What steps must be followed to implement a standardized PCS cost estimating
methodology?
The most important aspect of the protocol was the field data collection procedures. These
procedures standardize the method to conduct all of the case studies and facilitate consistent and
comparable results among the case studies. The key research instrument is the structured
interview (GAO 1991) based on a standard case study questionnaire. The questionnaire was sent
to the participants a week in advance of the interview. Each agency’s PCS estimating procedures
are unique and the interview process was designed to capture that uniqueness, while generating a
standard comparable output. To that end, the questionnaire maximized the use of yes/no
questions and matrices of checklists to be complete for every case study. Additionally open-
ended questions were crafted to generate in-depth discussion to fill in the details surveys and
questionnaires cannot easily capture.
14
CASE STUDY PROCESS
The case study protocol included a pilot case study to evaluate the efficacy of the process
before modifying the case study protocol and completing the remaining cases. The pilot study
also served to allow an opportunity to become familiar with the case study protocol for this
project and provide comments on it or recommendations for changes. After the pilot study took
place with the Montana DOT a few minor adjustments were made to the agency structured
interview questionnaire. There were additional explanation boxes added to gain a more in-depth
understanding of each agency’s PCS processes, also both loss of design effort and geographic
factors were added to the matrix concerning the list of factors that influence the PCS estimate.
Finally there was the addition of a question about the impact the DOT thought a better PCS
estimate would make on the planning process.
The case study protocol for this project mandated a specific sequential order for
communications and interactions with project participants that was followed on each case study.
First, all interviews with the participating agencies were conducted on site in person at the
agency’s headquarters to ensure appropriate people were available to answer the questions
provided. Other initial inquiries were made via email, but the personal contact was vital to the
quality of the information collected in each case study. The personal contact with the key PCS
estimating personnel participants provided a champion for the research effort and a specific point
of contact for queries during data reduction and interpretation. The participants were not
compensated for their time by the research team, making it essential to secure at least one agency
staff member who was enthusiastic about assisting with the research effort and was in a position
to coordinate with the rest of the agency.
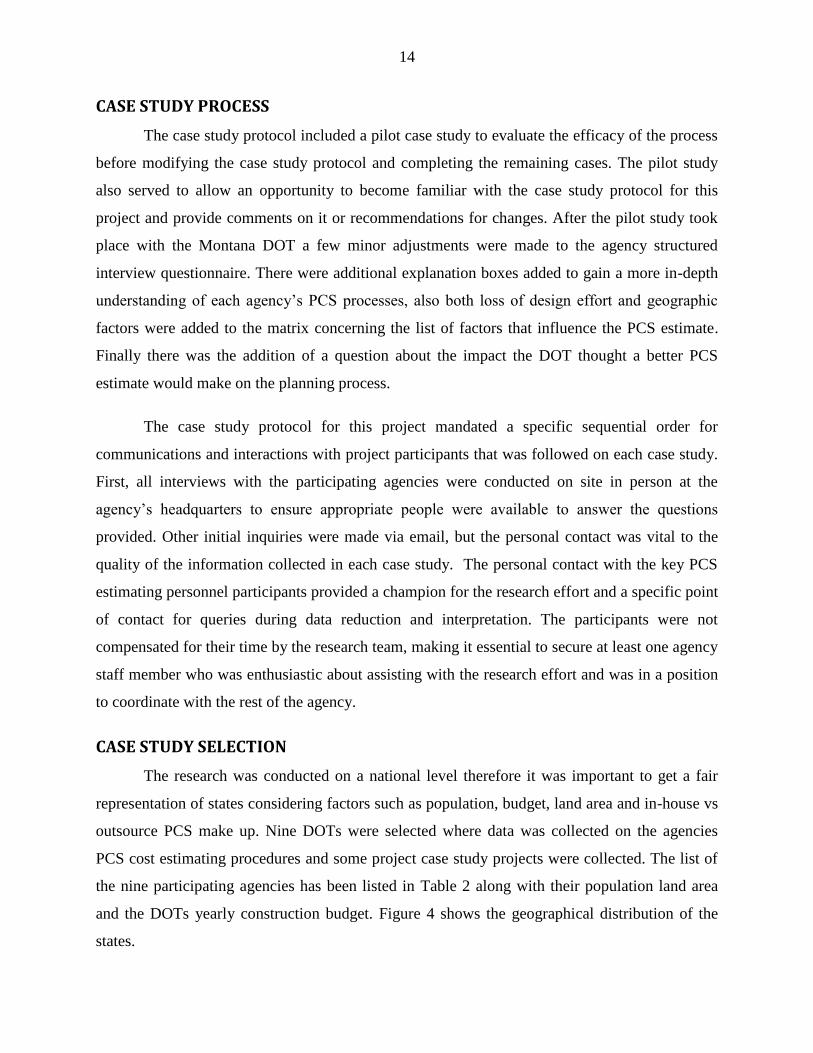
CASE STUDY SELECTION
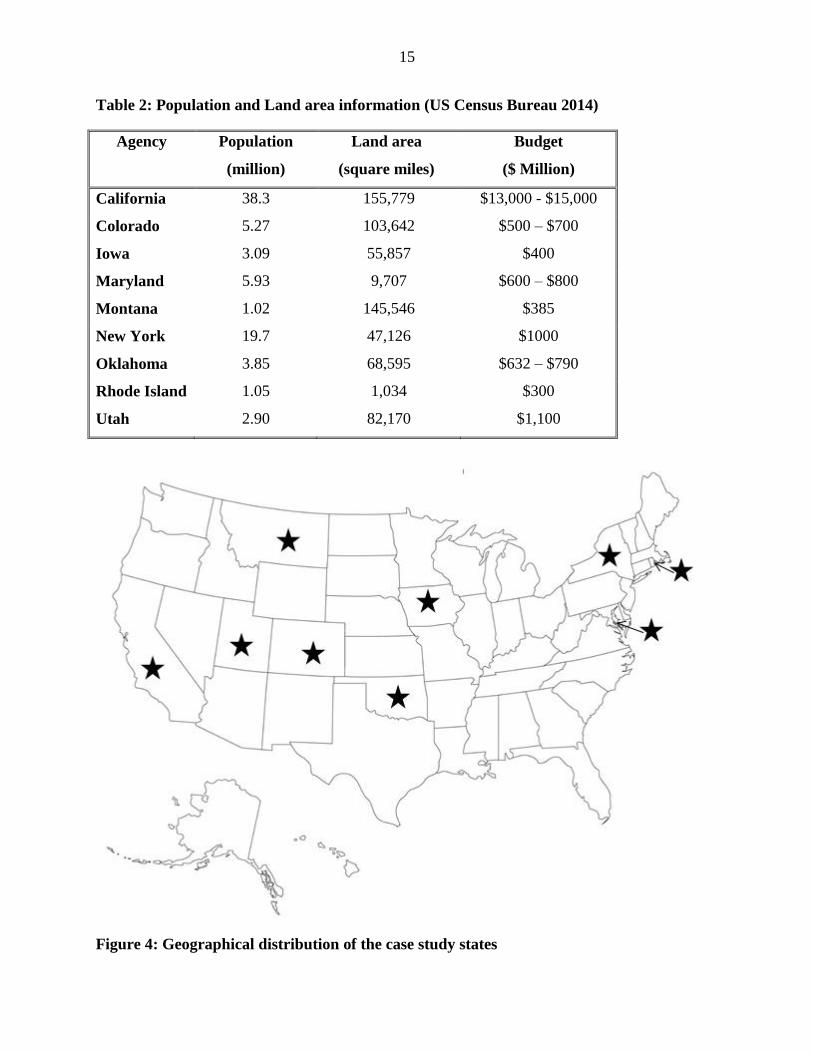
The research was conducted on a national level therefore it was important to get a fair
representation of states considering factors such as population, budget, land area and in-house vs
outsource PCS make up. Nine DOTs were selected where data was collected on the agencies
PCS cost estimating procedures and some project case study projects were collected. The list of
the nine participating agencies has been listed in Table 2 along with their population land area
and the DOTs yearly construction budget. Figure 4 shows the geographical distribution of the
states.
15
Table 2: Population and Land area information (US Census Bureau 2014)
Agency Population
(million)
Land area
(square miles)
Budget
($ Million)
California 38.3 155,779 $13,000 - $15,000
Colorado 5.27 103,642 $500 – $700
Iowa 3.09 55,857 $400
Maryland 5.93 9,707 $600 – $800
Montana 1.02 145,546 $385
New York 19.7 47,126 $1000
Oklahoma 3.85 68,595 $632 – $790
Rhode Island 1.05 1,034 $300
Utah 2.90 82,170 $1,100
Figure 4: Geographical distribution of the case study states

16
Nine agencies were interviewed in a structured interview process to determine each
agency’s overall PCS cost estimating procedure. The interview template is shown in Appendix
C. Each agency was also asked to provide 2 – 5 projects for project case studies for the research.
The researchers ended with 16 projects from 6 of the 9 agencies.
CASE STUDY AGENCY SYNOPSIS
For full case study reports refer to Appendix B.
Agency: California Department of Transportation – Caltrans
Caltrans collects past project cost data for PCS through engineer’s timesheets. Caltrans
uses data collected from past projects to estimate the PCS cost for future projects. They also have
a system called pipe scan and it is used as a starting point for PCS estimates. Current methods
used to estimate PCS costs for a project include a direct estimate of hours as well as the use of an
average percent support to cap ratio.
Caltrans performs 90% of PCS in-house and contracts out 10% of PCS. Each district has
their own on call contracts with pre-selected qualified architect and engineering consultants.
Caltrans can outsource all PCS activities except advertisement for bids, evaluation of bids and
award of contract. It is rare for Caltrans to outsource PCS concerning cost estimate, ROW plans,
and ROW utility acquisition and relocation.
At Caltrans if there is a loss of funding for a project when it is in PCS phase the project
will be terminated, once funding for the project is resumes a new project number is assigned
therefore they do not consider loss of design effort these costs will be included in the overhead
rate. To improve PCS estimate Caltrans believe they need a better model for historical data
analysis, need to do bottom-up estimates. At this stage the project manager does not control the
people working on project in the PCS phase, and good scoping documents. Caltrans believes that
having more accurate PCS cost estimates would have some impact on the project budget
establishment process.
Agency: Colorado Department of Transportation – CDOT
17
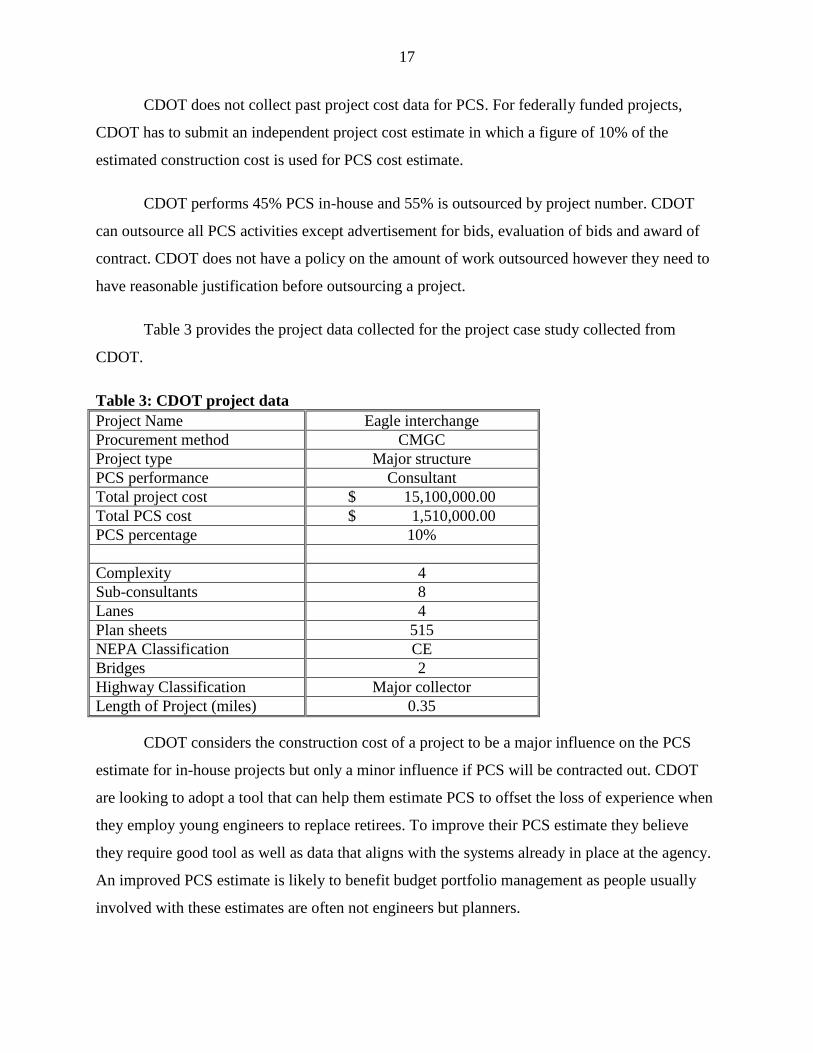
CDOT does not collect past project cost data for PCS. For federally funded projects,
CDOT has to submit an independent project cost estimate in which a figure of 10% of the
estimated construction cost is used for PCS cost estimate.
CDOT performs 45% PCS in-house and 55% is outsourced by project number. CDOT
can outsource all PCS activities except advertisement for bids, evaluation of bids and award of
contract. CDOT does not have a policy on the amount of work outsourced however they need to
have reasonable justification before outsourcing a project.
Table 3 provides the project data collected for the project case study collected from
CDOT.
Table 3: CDOT project data
Project Name Eagle interchange
Procurement method CMGC
Project type Major structure
PCS performance Consultant
Total project cost $ 15,100,000.00
Total PCS cost $ 1,510,000.00
PCS percentage 10%
Complexity 4
Sub-consultants 8
Lanes 4
Plan sheets 515
NEPA Classification CE
Bridges 2
Highway Classification Major collector
Length of Project (miles) 0.35
CDOT considers the construction cost of a project to be a major influence on the PCS
estimate for in-house projects but only a minor influence if PCS will be contracted out. CDOT
are looking to adopt a tool that can help them estimate PCS to offset the loss of experience when
they employ young engineers to replace retirees. To improve their PCS estimate they believe
they require good tool as well as data that aligns with the systems already in place at the agency.
An improved PCS estimate is likely to benefit budget portfolio management as people usually
involved with these estimates are often not engineers but planners.

18
Agency: Iowa Department of Transportation – Iowa DOT
Iowa DOT collects past project cost data for PCS through engineer’s timesheets this data
is collected and stored mainly for accounting purposes. Iowa DOT does not use data collected
from past projects to estimate the PCS costs for future projects. They do not estimate PCS costs
for any projects. The Iowa DOT can use both in-house and on call consultants; they do also use
other consultants but only for larger less common projects.
Currently Iowa DOT is not estimating PCS cost for projects but may adopt this in the
future. To improve these estimates they believe they need to learn how to use the data they
already have. Iowa DOT has been capturing PCS hours, and they need a way to organize this
data to make it useful in PCS cost estimating. Iowa DOT thinks that having a more accurate
estimate of PCS would have a large impact on the planning process for the agency and would
allow the agency to better budget staff time. It also would be valuable to know the number of
hours per task and to be able to compare these to consultant design hours.
Agency: Maryland State Highway Administration – MSHA
MSHA does record in-house preconstruction services (PCS) hours on a per project basis.
They record these hours using time tracking software. MSHA uses data collected from past
projects along with standard percentages to estimate the PCS cost for future projects. The old
system used 15% of the construction cost as preliminary engineering; they now use a curve
system on preliminary engineering.
MSHA has a standing contract for a general engineering consultant (GEC). MSHA can
perform the entire preconstruction process in-house and it can also outsources all PCS except
ROW utility acquisition and relocation, advertisement for bids, evaluation of bids, and award of
contract.
MSHA is currently estimating PCS cost for all projects. To improve these estimates they
believe they need to develop a historical database of previous estimates. MSHA believes that
having more accurate PCS cost estimates would have a large impact on the planning process as
they believe that it would provide more efficiency to managing funds.
19
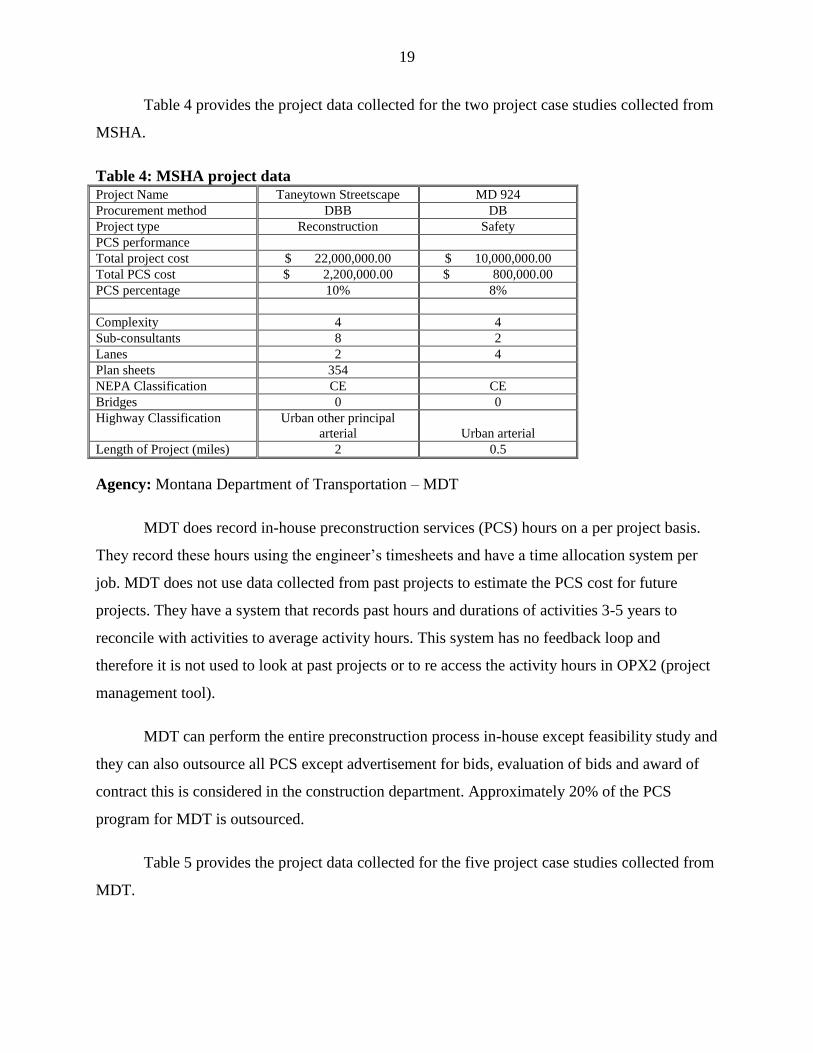
Table 4 provides the project data collected for the two project case studies collected from
MSHA.
Table 4: MSHA project data Project Name Taneytown Streetscape MD 924
Procurement method DBB DB
Project type Reconstruction Safety
PCS performance
Total project cost $ 22,000,000.00 $ 10,000,000.00
Total PCS cost $ 2,200,000.00 $ 800,000.00
PCS percentage 10% 8%
Complexity 4 4
Sub-consultants 8 2
Lanes 2 4
Plan sheets 354
NEPA Classification CE CE
Bridges 0 0
Highway Classification Urban other principal
arterial Urban arterial
Length of Project (miles) 2 0.5
Agency: Montana Department of Transportation – MDT
MDT does record in-house preconstruction services (PCS) hours on a per project basis.
They record these hours using the engineer’s timesheets and have a time allocation system per
job. MDT does not use data collected from past projects to estimate the PCS cost for future
projects. They have a system that records past hours and durations of activities 3-5 years to
reconcile with activities to average activity hours. This system has no feedback loop and
therefore it is not used to look at past projects or to re access the activity hours in OPX2 (project
management tool).
MDT can perform the entire preconstruction process in-house except feasibility study and
they can also outsource all PCS except advertisement for bids, evaluation of bids and award of
contract this is considered in the construction department. Approximately 20% of the PCS
program for MDT is outsourced.
Table 5 provides the project data collected for the five project case studies collected from
MDT.

20
Table 5: MDT project data Project Name Alberton - MT Yellowstone -
MT
Richey - MT Libby - MT Manchester -
MT
Procurement
method
DBB DBB DBB DBB DBB
Project type Rehabilitation Bridge
replacement
Reconstruction Rehabilitation Rehabilitation
PCS
performance
In-house 61% in-house
39% consultant
81% In-house
19% Consultant
69% In-house
31% Consultant
In-house
Total project
cost
$15,160,216.69 $11,117,526.18 $11,671,335.94 $5,154,041.00 $13,654,704.61
Total PCS cost $ 326,984.74 $ 1,350,022.32 $ 747,932.55 $ 523,441.08 $ 221,626.30
PCS percentage 2% 12% 6% 10% 2%
Complexity 1 4 3 4 2
Sub-consultants 0 3 1 3 0
Lanes 4 2 2 2 4
Plan sheets 41 113 351 284 258
NEPA
Classification CE EA CE CE CE
Bridges 6 1 1 0 3
Highway
Classification principal arterial Urban arterial
Major collector
rural
Major collector
rural
Principle arterial
(freeway)
Length of
Project (miles) 9.8 0.7 10.7 5.1 5.4
Currently MDT is estimating PCS cost for all projects using a standard percentage of
construction costs. To improve PCS estimates MDT believes they need to introduce function-
based estimating, and they also need to determine how to allocate the funds in split corridor
projects. MDT also believes that they need to improve how they capture the hours on the time
sheets.
Agency: New York State Department of Transportation – NYSDOT
NYSDOT collects past project cost data for PCS through engineer’s timesheets. This data
is used by project manager to predict an estimate for future projects with similar qualities.
NYSDOT uses an in-house system called DPR which contains a selection of tools to estimate
PCS hours. NYSDOT are looking at moving to use Primavera P6 in the future.
NYSDOT performs 50% PCS in-house and 50% is outsourced by dollar value and 90%
in-house and 10% outsourced by number of projects. NYSDOT does not perform environmental
sampling and testing or surveying services, they use on call contracts for these services even if

21
all PCS services are performed in-house. NYSDOT can outsource all PCS activities except
advertisement for bids, evaluation of bids and award of contract.
Table 6 provides the project data collected for the two project case studies collected from
NYSDOT.
Table 6: NYSDOT project data Project Name Western Ave - NYS I787 NYS
Procurement method DBB DBB
Project type Reconstruction Bridge rehabilitation
PCS performance Consultant In-house
Total project cost $ 9,700,000.00 $ 28,000,000.00
Total PCS cost $ 1,280,000.00 $ 1,333,346.08
PCS percentage 13% 5%
Complexity 2 4
Sub-consultants 2 0
Lanes 6 6
Plan sheets 198 648
NEPA Classification CE CE
Bridges 0 6
Highway Classification Interstate Interstate
Length of Project (miles) 12.1 4.3
NYSDOT does not consider number of plan sheets as an influential characteristic in the
PCS estimating due to recent advances in technology and the general move into electronic plans.
NYSDOT believes that a major setback to estimating PCS costs is how to estimate inflation as it
is difficult if project development occurs over multiple years. NYSDOT believes that to improve
their PCS cost estimate they need to move to task based estimating but they are skeptical about
whether the time and effort would result in any real value for the agency.
Agency: Oklahoma Department of Transportation – ODOT
ODOT does not record in-house preconstruction services (PCS) hours on a per project
basis. Approximately 50% of engineers’ time spent on PCS is billed to departmental overhead.
ODOT can perform the entire preconstruction process in-house except right of way
acquisition. They can also outsource all PCS except preferred alternative, NEPA and permit
approval, final plan package (RFP and RFQ), advertisement for bids, evaluation of bids, and
award of contract.

22
Currently ODOT believes estimating PCS cost would add value to the agency but they
have yet to implement a process to do so. To improve PCS cost estimates they believe they need
to make direct changes to their projects and agency culture. ODOT believes that it would be
difficult to convince all people within the agency to adopt a PCS estimating system.
Table provides the project data collected for the three project case studies collected from
ODOT.
Table 7: ODOT project data Project Name Garvin - Ok Beckham -OK Payne -OK
Procurement method DBB DBB DBB
Project type Resurfacing Resurfacing / Bridge
rehab
Pavement overlay
PCS performance In-house Outsourced Outsourced
Total project cost
Total PCS cost
PCS percentage
Complexity 4 4 3
Sub-consultants 0 2 2
Lanes 4 4 4
Plan sheets 131 60 50
NEPA Classification CE CE CE
Bridges 6 5 0
Highway Classification Interstate Interstate I 35
Length of Project (miles) 6.5 7.93 5.4
Agency: Rhode Island Department of Transportation – RIDOT
RIDOT does record in-house preconstruction services (PCS) hours on a per project basis.
They record these hours using the engineer’s timesheets. RIDOT does not use data collected
from past projects to estimate the PCS cost for future projects. Design costs are estimated by
using 15% of total construction cost. However, this is not uniform; smaller projects tend to be of
a higher percentage and larger projects tend to be of a lower percentage. This process is not an
estimate, but only an educated guess.
RIDOT does contract out PCS. They have several on-call consultants as almost all their
design work is outsourced. They use two consultants for highway work, two for bridges, and four
for traffic engineering. No single firm is the dominant GEC. RIDOT can advertise for bids,
evaluate bids, award contracts, and perform some ROW utilities acquisition and relocation; all
other PCS processes are outsourced. RIDOT did not provide data for project case studies.
23
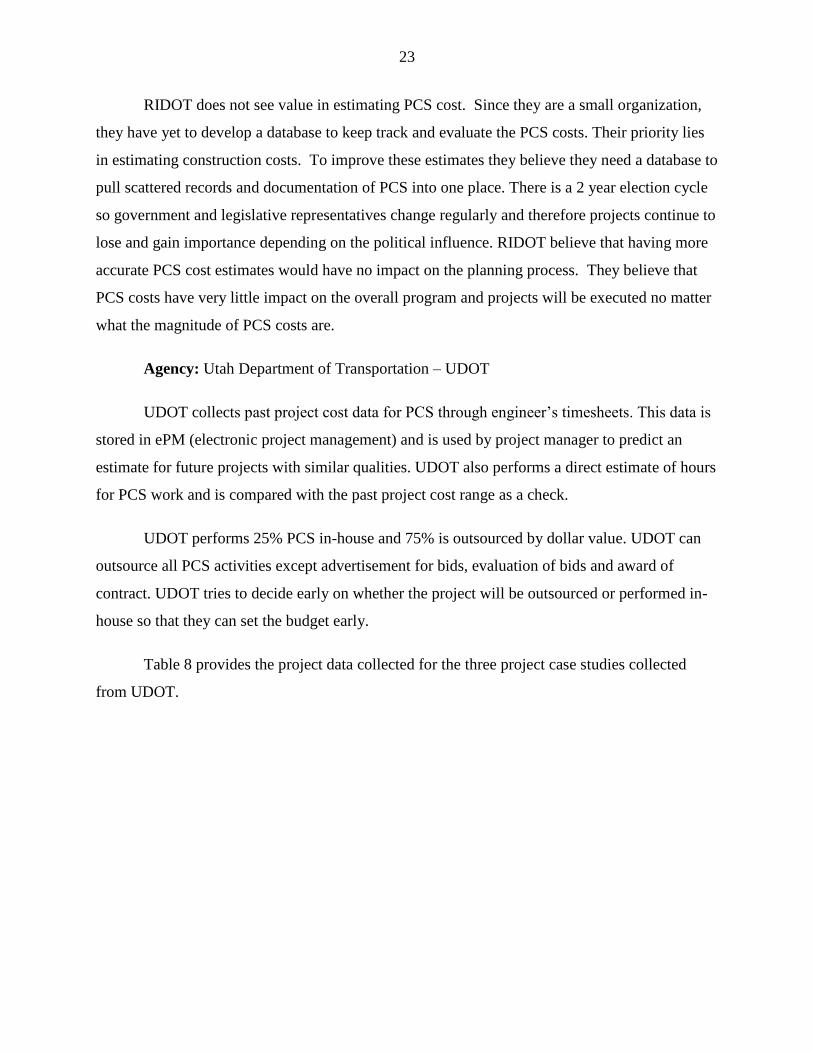
RIDOT does not see value in estimating PCS cost. Since they are a small organization,
they have yet to develop a database to keep track and evaluate the PCS costs. Their priority lies
in estimating construction costs. To improve these estimates they believe they need a database to
pull scattered records and documentation of PCS into one place. There is a 2 year election cycle
so government and legislative representatives change regularly and therefore projects continue to
lose and gain importance depending on the political influence. RIDOT believe that having more
accurate PCS cost estimates would have no impact on the planning process. They believe that
PCS costs have very little impact on the overall program and projects will be executed no matter
what the magnitude of PCS costs are.
Agency: Utah Department of Transportation – UDOT
UDOT collects past project cost data for PCS through engineer’s timesheets. This data is
stored in ePM (electronic project management) and is used by project manager to predict an
estimate for future projects with similar qualities. UDOT also performs a direct estimate of hours
for PCS work and is compared with the past project cost range as a check.
UDOT performs 25% PCS in-house and 75% is outsourced by dollar value. UDOT can
outsource all PCS activities except advertisement for bids, evaluation of bids and award of
contract. UDOT tries to decide early on whether the project will be outsourced or performed in-
house so that they can set the budget early.
Table 8 provides the project data collected for the three project case studies collected
from UDOT.
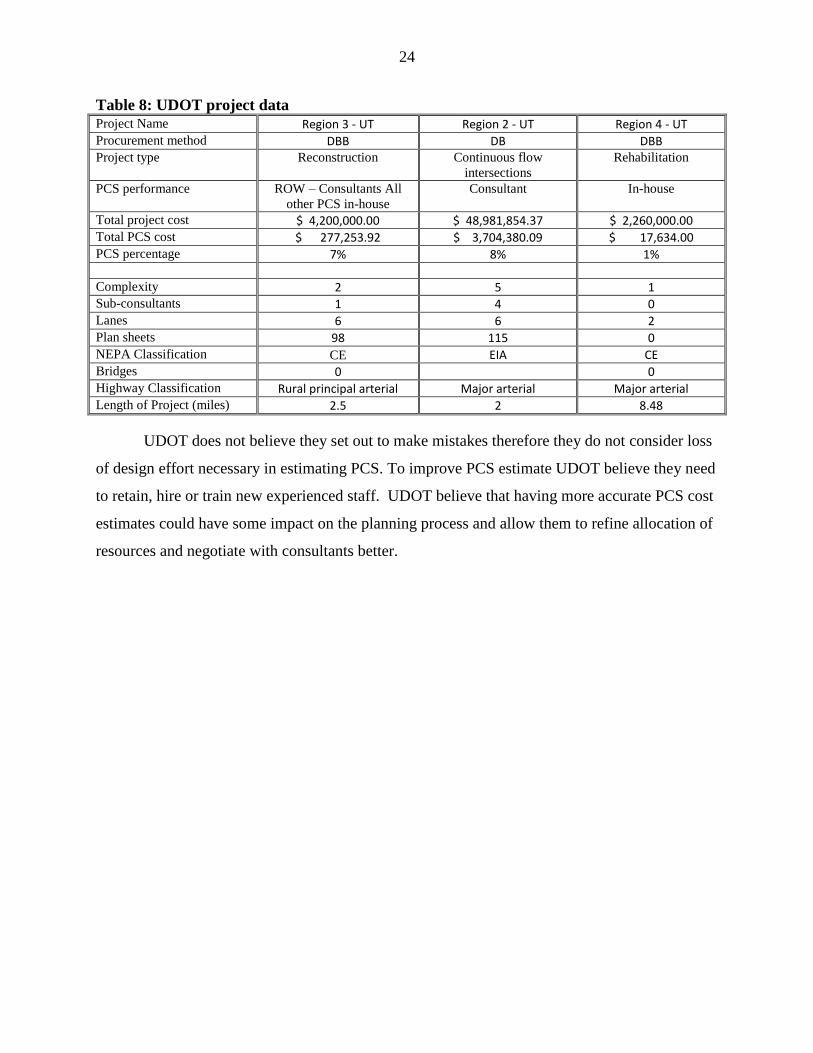
24
Table 8: UDOT project data Project Name Region 3 - UT Region 2 - UT Region 4 - UT Procurement method DBB DB DBB Project type Reconstruction Continuous flow
intersections
Rehabilitation
PCS performance ROW – Consultants All
other PCS in-house
Consultant In-house
Total project cost $ 4,200,000.00 $ 48,981,854.37 $ 2,260,000.00 Total PCS cost $ 277,253.92 $ 3,704,380.09 $ 17,634.00 PCS percentage 7% 8% 1%
Complexity 2 5 1 Sub-consultants 1 4 0 Lanes 6 6 2 Plan sheets 98 115 0 NEPA Classification CE EIA CE Bridges 0 0 Highway Classification Rural principal arterial Major arterial Major arterial Length of Project (miles) 2.5 2 8.48
UDOT does not believe they set out to make mistakes therefore they do not consider loss
of design effort necessary in estimating PCS. To improve PCS estimate UDOT believe they need
to retain, hire or train new experienced staff. UDOT believe that having more accurate PCS cost
estimates could have some impact on the planning process and allow them to refine allocation of
resources and negotiate with consultants better.
25
CHAPTER 3—FRAMEWORK FOR DEVELOPING A PRECONSTRUCTION
SERVICES COST ESTIMATING MODEL FOR HIGHWAY PROJECTS
Hunter, K.D., D.D. Gransberg and H.D. Jeong, “Framework for Developing a Preconstruction
Services Cost Estimating Model for Highway Projects,” Journal of Management in Engineering,
ASCE (Submitted April 2014) [Peer-reviewed archival journal]
ABSTRACT
Due to recent funding uncertainties in the public sector state departments of
transportation (DOT) are experiencing increased pressure to improve efficiency of their cost
estimating systems. Preconstruction services (PCS) cost estimating is and area in which there is a
need for improvement as guidance and support for agencies in managing PCS costs is lacking.
This paper proposes a framework for developing a PCS cost estimate for highway projects, it
provides a project development timeline and the types of estimates that will be appropriate at
each stage. The paper also establishes the key project characteristics that affect PCS cost of a
project identifying project type, complexity and estimated construction cost as most influential
factors when estimating PCS costs.
INTRODUCTION
The issue of accurate estimating is essentially tied to the efficient use of available public
capital (Janacek 2006). Early estimates conducted during the planning phase often become
legislative authorizations and turn into project budgets before the final scope of project work is
adequately quantified (Anderson et al. 2007). Additionally, since preconstruction costs are by
definition a small portion of the total project delivery cost, they are typically estimated as a
standard percentage of estimated construction costs. Hence, if the capital project is
underestimated, preconstruction services (PCS) costs will be similarly underestimated. A 2002
study involving 258 transportation projects collectively valued at $90.0 billion (Flyvbjerg et al.
2002) found that 86% experienced actual costs that were on average 28% higher than estimated.
That study concludes that “underestimation of costs at the time of decision to build is the rule
rather than the exception for transportation infrastructure projects” (Flyvbjerg et al. 2002, italics
added).
If one applies the US Army Corps of Engineers supervision and administration rate of
5.6% to Flyvbjerg’s sample, the PCS cost would be roughly $5.0 billion, a significant amount of

26
money and does not include the design costs. Using Flyvbjerg’s cost growth would mean that the
agencies delivering these projects would be short $1.4 billion in the preconstruction phases of
project development. The fact that a completed construction project’s scope and quality was
defined during the planning and design process leads one to infer that poor estimating accuracy
and the resultant resource shortfall may actually be preventing the project from completing a
thorough preconstruction process. It may also ultimately result in imperfect construction
documents that actually become the source for construction cost growth after contract award.
As such, this paper’s objective is to review and analyze current PCS cost estimating
methods and propose a framework for developing a PCS cost estimate. The framework is derived
from a larger project where detailed case studies were undertaken in nine US state Departments
of Transportation (DOT). Specifically, the paper seeks to answer the following research
question:
What project characteristics are important to developing an accurate PCS cost estimate?
The paper will document and discuss the project characteristics previously identified for a
given project through exploration of the literature and DOT estimating guidance/policy
documents. It will also discuss the underlying motivation for selecting these characteristics via
detailed case study interviews. Finally, it will identify and document the possible set of
preconstruction services.
BACKGROUND
By definition PCSs are complete when the construction contract has been awarded in
design bid build (DBB) and construction manager general contractor (CMGC) contracts and
once the design-build (DB) contract is awarded. Unfortunately, defining the point in time where
PCS begin is not nearly as simple. Many projects within a state DOT may be started and never
move past the initial planning phase due to funding restrictions, political influence,
environmental issues or programming priorities. For the purpose of this research, PCS costs start
once a project reaches the Statewide Transportation Improvement Program (STIP) or once it has
passed the initial planning phase shown in Table 1. All costs incurred for a project before this
point are considered sunk costs and are ascribed to the agency overall overhead.

27
When studying PCS cost estimating it is important to consider what factors influence the
PCS cost of a project. Past research on estimating PCS costs is scarce. Much of the cost
estimating research in transportation is specifically about construction cost estimating, with some
related to design cost estimating (Anderson et al. 2007). Part of the problem is due to the fact that
most DOTs complete a great part of the preconstruction project development process using
internal personnel. Thus, the budgeting process for DOT staff is different from the process used
to establish budgets for construction projects, and the funds typically are appropriated from a
different pot of money. Additionally, the management interviews conducted in this study also
revealed that there is a concern that systematically collecting the cost data needed for a PCS
estimate could result in a publicly accessible document that would expose the agency to criticism
for not cost effectively utilizing their personnel budget and political pressure to increase the
amount of work that is outsourced (Gransberg and Molenaar 2008).
However as state and federal budgets become tighter and the condition of the nation’s
highway infrastructure deteriorates, it becomes more critical for public agencies to be able to
budget for future projects with greater accuracy. Thus, the business case for investing in systems
to estimate PCS costs, a true gap in the body of civil engineering cost estimate knowledge, is
becoming more compelling.
New York State DOT developed a model using a commercial spreadsheet / database
program to estimate the design hours for each project (Williams 2013). The model allows the
DOT to either search similar projects or generate an estimate of total design hours to be expected
for a project. The model was developed using a 12 “key” project characteristic chosen by the
NYSDOT engineers as defining factors of a project. These were (Williams 2013):
1. Complexity
2. Project type
3. Number of sub-consultants
4. Construction cost
5. Number of lanes
6. Number of plan sheets
7. State Environmental Quality Review (SEQR) classification

28
8. National Environmental Policy Act (NEPA) classification
9. Predominant bridge type
10. Number of bridges
11. Highway classification
12. Length of project
These characteristics became the input factors in the model the number of plan sheets
were used as the independent variable to calculate the total design hours. However cost per plan
sheet methodology is becoming obsolete. This is due to the development of technology that
permits plans to be produced electronically, making the correlation between number of plan
sheets and design fee difficult to measure. Hours are calculated from a simple regression model
that is expected to become more accurate as more project data is made available (Williams
2013).
Another consideration when estimating the PCS cost is the type of estimating method.
Two approaches to PCS cost estimating were explored:
Top-down (macro) estimates produced by an experienced estimator, useful for managers
who have limited knowledge of the process to complete the project (Larson and Gray,
2011)
Bottom-up (micro) estimates usually correlate to a work breakdown structure (WBS).
Each activity is estimated by the person who is involved with monitoring the project
(Larson and Gray, 2011)
Table 9 has been adapted from Larson and Gray (2011), and shows the project
characteristics associated with choosing to do top-down or bottom-up estimates. A top-down
estimate is defined as the use of a parametric estimating factor, such as percentage of estimated
construction costs, to determine the PCS budget. On the other hand, a bottom-up estimate
calculates the number of labor hours estimated for each PCS task, the average labor-hour rate,
and rolls the cost up from these detailed estimates of effort.

29
Table 9: Conditions for preferring Top-Down or Bottom-Up Estimates (Larson and Gray,
2011)
Condition Top-down Bottom-up
Strategic decision making X
Cost and time important X
High uncertainty X
Internal, small project X
Fixed price contract X
Details needed X
Unstable scope X
METHODOLOGY
A full explanation of the research methodology used to collect case studies is explained
in Chapter 2.
Williams et al. (2012) identified 12 project characteristics that are inherent for each
project for NYSDOT and can be used to estimate design effort. These characteristics were
evaluated by a team of NYSDOT and FHWA personnel so are applicable to the target audience
of this research. Most non-design preconstruction activities are similar in composition to design
tasks, in that they involve the provision of specialized professional services and are often
performed by engineers. Therefore, these characteristics were used as a starting point for
identifying the project characteristics important in developing an accurate PCS cost estimate.
Each agency was asked to fill in a matrix identifying which project characteristics had the
most influence on the PCS cost estimate. The average ranking for these characteristics were
analyzed using a t-test to determine the equality of the means of the responses and categorize the
factors in to the three levels of influence.
Question V.1 of the interview was as follows:
How influential do you think the following characteristics are in estimating the overall
PCS cost for a “typical Design Bid Build” project? (Interviewer circle the check box)
1- No Influence
2-Some Influence
3-Major Influence
The list of characteristics or influence factors provided was as follows:
30
1. Complexity
2. Project type
3. Number of sub-consultants
4. Construction cost
2. Number of lanes
3. Number of plan sheets
4. National Environmental Policy Act (NEPA) classification
5. Number of bridges
6. Highway classification
7. Length of project
8. Geographical
9. Loss of design effort
10. Other
The same question was also asked in relation to a specific project for the project case
study interview - however the influence factors “Loss of Design Effort” and “Geographical”
were not considered in the project case study questionnaire.
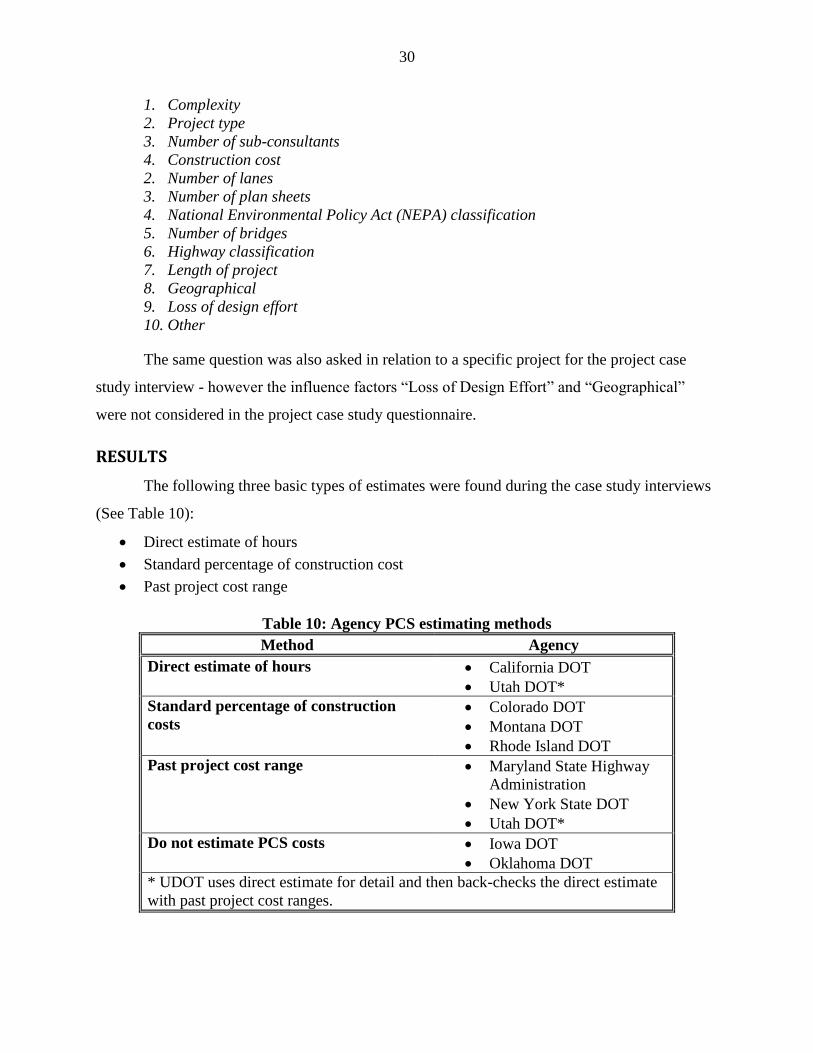
RESULTS
The following three basic types of estimates were found during the case study interviews
(See Table 10):
Direct estimate of hours
Standard percentage of construction cost
Past project cost range
Table 10: Agency PCS estimating methods
Method Agency
Direct estimate of hours California DOT
Utah DOT*
Standard percentage of construction
costs Colorado DOT
Montana DOT
Rhode Island DOT
Past project cost range Maryland State Highway
Administration
New York State DOT
Utah DOT*
Do not estimate PCS costs Iowa DOT
Oklahoma DOT
* UDOT uses direct estimate for detail and then back-checks the direct estimate
with past project cost ranges.

31
The level of sophistication used within each department varies, but it can be seen that
Utah is the only state currently using two methods and comparing the results. Two states were
found to have no formal method to estimate PCS cost.
When the researchers met with the California DOT (Caltrans), two types of projects were
used; corridor-level projects (termed parent projects in Caltrans jargon) were used when the costs
for planning and scoping are incurred. The parent projects spawn a series of child projects or
single projects. This project structure was also found in the Iowa DOT case study data.
When determining the best practice for estimating PCS costs one must consider the
estimate’s end user, the timing of the estimate and the data available on a specific project type at
the time of the estimate. The initial estimate of PCS costs for the corridor project is typically
done at the programmatic level. Therefore Table 9 shows that a top-down estimate is more
appropriate as it is used essentially for strategic decision making, when there is limited data
available on the project and usually an unstable scope. This estimate is useful for allocating
program funds, making it valuable to higher level management. When the project moves into the
single project phase and it has been assigned funds and enters the STIP, the scope is likely to be
better defined and requires a more detailed estimate to set the budget for the project. In this
situation, both a bottom-up and a top-down estimate can be used. Once a project reaches this
phase it is usually considered the start of the PCS for a project, and it is now much more likely to
be funded but is still in the early stages of development. Applying both top-down and bottom-up
estimating methods, and comparing the two, helps provide a strong basis for strategic decision
making, but also sets a budget for the project manager or PCS staff to adhere to through the PCS
phases. As a project is further developed a bottom-up estimate can be used before the project
moves into the final engineering phases. This estimate is used as milestone to review the estimate
thus far, and also provides a basis for negotiations with consultants if the project is to be
outsourced. Independent projects usually arise from a need in a certain area and start at the
preliminary engineering phase, but can start later in the PCS process depending on the project
characteristics.
Figure 5 shows a flow chart of a standard project development process that shows the
three PCS cost estimate milestones described in the previous paragraph. The initial estimate is to
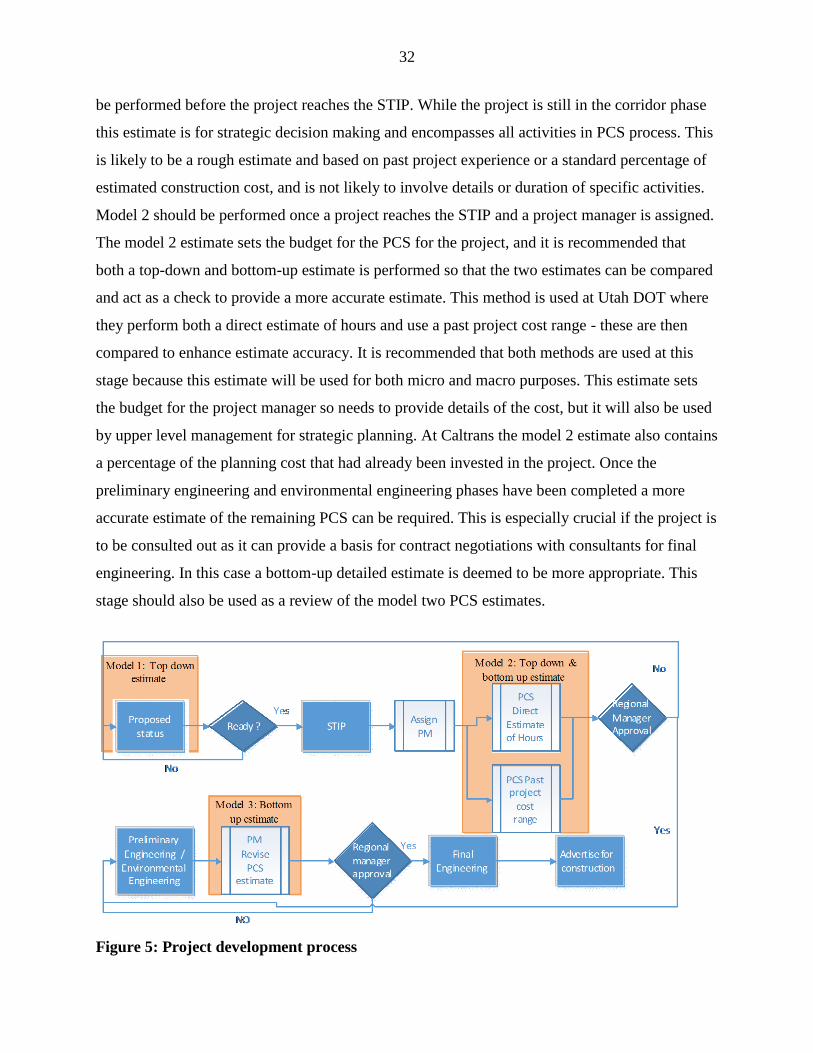
32
be performed before the project reaches the STIP. While the project is still in the corridor phase
this estimate is for strategic decision making and encompasses all activities in PCS process. This
is likely to be a rough estimate and based on past project experience or a standard percentage of
estimated construction cost, and is not likely to involve details or duration of specific activities.
Model 2 should be performed once a project reaches the STIP and a project manager is assigned.
The model 2 estimate sets the budget for the PCS for the project, and it is recommended that
both a top-down and bottom-up estimate is performed so that the two estimates can be compared
and act as a check to provide a more accurate estimate. This method is used at Utah DOT where
they perform both a direct estimate of hours and use a past project cost range - these are then
compared to enhance estimate accuracy. It is recommended that both methods are used at this
stage because this estimate will be used for both micro and macro purposes. This estimate sets
the budget for the project manager so needs to provide details of the cost, but it will also be used
by upper level management for strategic planning. At Caltrans the model 2 estimate also contains
a percentage of the planning cost that had already been invested in the project. Once the
preliminary engineering and environmental engineering phases have been completed a more
accurate estimate of the remaining PCS can be required. This is especially crucial if the project is
to be consulted out as it can provide a basis for contract negotiations with consultants for final
engineering. In this case a bottom-up detailed estimate is deemed to be more appropriate. This
stage should also be used as a review of the model two PCS estimates.
Figure 5: Project development process

33
The framework provided in Figure 5 can be used as a base timeline for performing PCS
cost estimates, and reviewing these estimates to monitor budgets. When developing a PCS cost
estimating framework it is also important to determine the project characteristics that affect the
estimate. This information allows the user to link a project to past projects with similar
characteristics, providing information for an estimate based on past project cost range.
To determine the most influential factors in a PCS cost estimate each agency was asked
to fill in a matrix identifying which project characteristics had the most influence on the PCS
cost estimate. This question was answered by the DOT representative during the interview and
later the same question was answered in the context of a specific project. The mean value of
response to each influence factor is given in Table 11 for agency response and Table 12 for the
project responses. In these tables the 12 influencing factors are ranked based on the mean
response value. It is worth noting that additional factors that were suggested in the other
category, such as inflation, expedited project delivery, political issues innovation and new
technology, were not included in this analysis.
Table 11: Influence Factors ranked based on mean response values from nine DOTs
INFLUENCE FACTOR MEAN RESPONSE
Tier 1 [2.56-3.00]
1. Complexity 3.0
2. Project type 2.89
3. NEPA classification 2.67
4. Construction cost 2.56
Tier 2 [2.00-2.56]
5. Length of project 2.56
6. Number of bridges 2.44
7. Number of plan sheets 2.33
8. Number of lanes 2.0
9. Geographical 2.0
Tier 3 [1.44-1.56]
10. Highway classification 1.56
11. Number of sub-consultants 1.44
12. Loss of design effort 1.44

34
Table 12: Project Influence Factors ranked based on mean response values from 16
Projects
INFLUENCE FACTOR MEAN RESPONSE
Tier 1 [2.42-2.75]
1. Complexity 2.75
2. Project type 2.56
3. Construction cost 2.42
Tier 2 [1.92-2.07]
4. Number of bridges 2.07
5. Length of project 2.06
6. Highway classification 1.94
7. Number of subconsultants 1.93
8. Number of plan sheets 1.92
Tier 3 [1.62-1.81]
9. NEPA 1.81
10. Number of lanes 1.63
Therefore, the responses summarized in Table 11 represent the importance of influence
factors from the point of view of the state DOT. We have categorized the factors into three
groups. Tier 1 consists of the factors that DOTs felt had the most influence on the PCS costs.
Tier 3 consists of factors that scored on average well below 2.0 and hence were considered to
have little to no influence on PCS costs. A statistical analysis was conducted to see the effect of
variability of responses to each factor and to see if there are significant differences between
factors.
In order to investigate this question we conducted a two-tailed t-test for comparison of
mean responses. The null hypothesis was that the means for any of the two selected factors were
equal. The alternative hypothesis was that the means were not equal. In general, for the factors in
each tier of Table 11, one could not reject the hypothesis that the means were equal. This means
that the factors within each tier will have more or less the same importance. There are some
concerns with using this test for this application. First, the number of data points is only 9.
Secondly, the assumption of normality is not realistic. However, the test provides an insight into
the effect of variance on the possible values of each factor. The main purpose for conducting
these tests was to have a systematic and consistent method to group these factors into the three
tiers so that we can concentrate on the most influential factors.
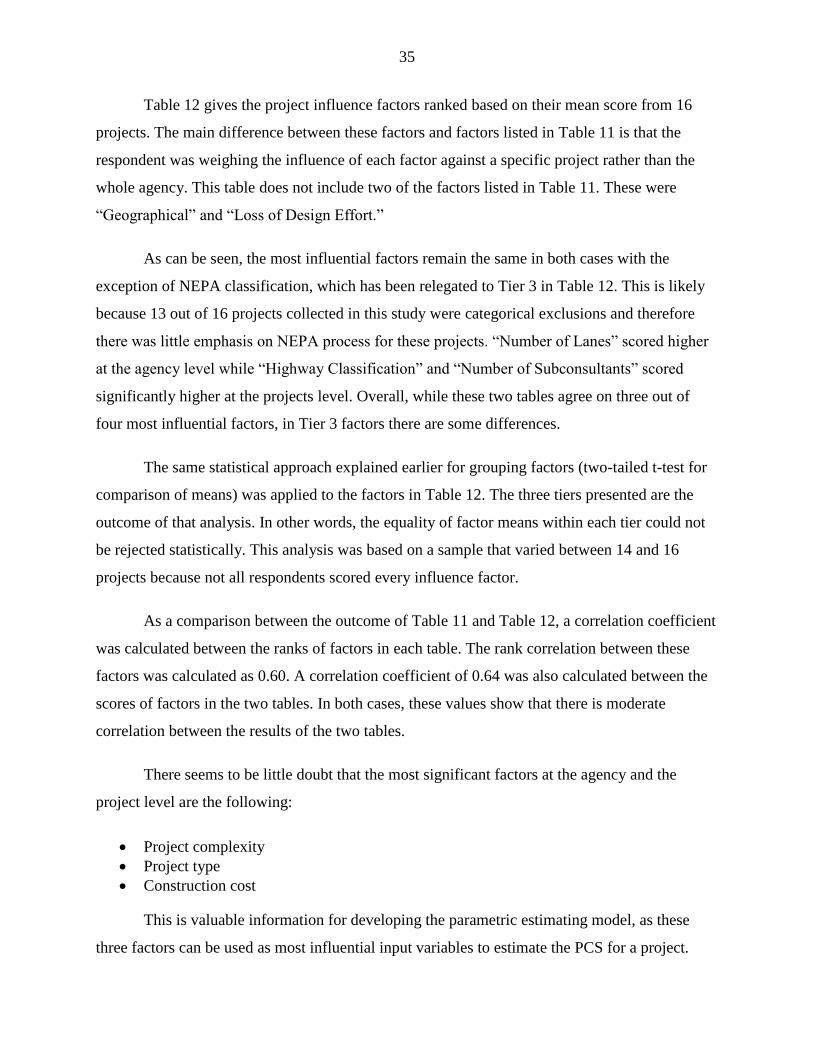
35
Table 12 gives the project influence factors ranked based on their mean score from 16
projects. The main difference between these factors and factors listed in Table 11 is that the
respondent was weighing the influence of each factor against a specific project rather than the
whole agency. This table does not include two of the factors listed in Table 11. These were
“Geographical” and “Loss of Design Effort.”
As can be seen, the most influential factors remain the same in both cases with the
exception of NEPA classification, which has been relegated to Tier 3 in Table 12. This is likely
because 13 out of 16 projects collected in this study were categorical exclusions and therefore
there was little emphasis on NEPA process for these projects. “Number of Lanes” scored higher
at the agency level while “Highway Classification” and “Number of Subconsultants” scored
significantly higher at the projects level. Overall, while these two tables agree on three out of
four most influential factors, in Tier 3 factors there are some differences.
The same statistical approach explained earlier for grouping factors (two-tailed t-test for
comparison of means) was applied to the factors in Table 12. The three tiers presented are the
outcome of that analysis. In other words, the equality of factor means within each tier could not
be rejected statistically. This analysis was based on a sample that varied between 14 and 16
projects because not all respondents scored every influence factor.
As a comparison between the outcome of Table 11 and Table 12, a correlation coefficient
was calculated between the ranks of factors in each table. The rank correlation between these
factors was calculated as 0.60. A correlation coefficient of 0.64 was also calculated between the
scores of factors in the two tables. In both cases, these values show that there is moderate
correlation between the results of the two tables.
There seems to be little doubt that the most significant factors at the agency and the
project level are the following:
Project complexity
Project type
Construction cost
This is valuable information for developing the parametric estimating model, as these
three factors can be used as most influential input variables to estimate the PCS for a project.

36
Project complexity is a subjective variable making it difficult to incorporate this as in input
variable.
One of the controversial characteristics that came from this analysis was the number of
plan sheets. While some DOTs still do a lot of their work on paper (i.e. plan sheets), some DOTs
like NYSDOT are moving more towards using only digital plans, making the plan sheet metric
obsolete. This is also highlighted in the report by Tippett and LaHoud (1991) and Sturts et al.
(2005) who stated that “technology is revolutionizing the way engineers work and there is a need
to revise the pricing strategies for engineering design services.”
Loss of design effort was a characteristic added by the researchers after the pilot study,
this was defined as ‘Design work completed but not used in the final project due to changes in
scope during the design process.’ During the PCS phase, this is likely to occur often, especially if
the project scope is not well-defined in early phases of the development process. It occurs when
there is a change in the scope rendering hours already billed to the project redundant; the work is
still a PCS cost to the project and therefore should be accounted for in the estimate. When
questioned about this influencing factor, it was clear that this concept was either not fully
understood or not considered by state DOTs. It was suggested by several interviewees that
incorporating lost design effort into the PCS estimate was inappropriate because it indicates that
the agency plans to waste valuable design time. The intent of this factor is to account for typical
scope changes/refinements and human error that require reworking of the design. In the final
analysis, the issue is moot since none of the case study agencies had a means of tracking lost
design effort.
CONCLUSIONS
There are two types of estimates that need to be considered for PCS cost estimating: top-
down and bottom-up estimates. The decision to use either of these estimates depends on the end
user of the data and the scope definition at the time of the estimate. Figure 2 provides a
framework for when to use the estimating methods and at what point in the project development
timeline. The type of PCS cost estimating model is also dependent on the available information
and project characteristics. The study showed the three factors that had the largest influence on
PCS costs were:

37
Complexity
Construction cost
Project type
If these factors can be identified early on in the project development process, they can be
used to determine suitable past projects with similar qualities. These factors can also act as input
variables for PCS cost estimating models.

38
CHAPTER 4— A NEURAL NETWORK APPROACH TO ESTIMATING
PRECONSTRUCTION SERVICES COST
Hunter, K.D., D.D. Gransberg and H.D. Jeong, “A Neural Network Approach to Estimating
Preconstruction Services Costs,” Journal of Construction Engineering and Management, ASCE
(Submitted April 2014) [Peer-reviewed archival journal]
ABSTRACT
The purpose of this paper is to propose and demonstrate the use of an artificial neural
network (NN) in preconstruction services (PCS) cost estimating. PCS cost estimating is
becoming more relevant due to the uncertainty in funding for state DOTs as well as the impact of
the loss of staff DOTs reducing the experience of the cost estimating staff. A NN model is a
computer model that can be trained and change its behavior bases on previous experience. A
simple model was developed using a commercial spreadsheet and its internal solver function.
The NN model produces a top-down PCS estimate with a weighted error below 2% over the 13
projects. The paper also looks at Iowa DOT’s project classification system to determine a
suitable way of grouping like projects.
INTRODUCTION
This paper discusses the benefits of using an artificial neural network model to estimate
preconstruction services (PCS) costs. Due to recent funding limitations within DOTs, there has
been increased pressure to improve cost estimates as a means to more accurately allocate project
funding. A study by Government Accountability Office (GAO) reported that “of the 50
departments that completed GAO's survey, 38 indicated that they have experienced constant or
declining staffing levels over the past 5 years” (GAO 2008). This has caused an increase in work
that is contracted out by an agency having a direct impact on their budget and the ability to
estimate these affects is vital.
A poor PCS cost estimate can result in two impacts. Firstly, over estimating PCS costs
for a project can lead to inefficient use of program funds and in the case of Federal-aid project,
unused funds may be lost to the given DOT as they are redistributed to other states (Hollar
2012). Next, if a project’s PSC costs are underestimated, there is insufficient funding to properly
complete all PCS activities potentially leading to lower quality construction documents and
subsequent construction cost growth (Gransberg et al. 2007).

39
The purpose of a larger study in which the work described in this paper will be included
is to evaluate using multiple PCS cost estimating models in order to select the most appropriate
model(s), which will reliably estimate the preconstruction service costs. The three models
covered in that research project are briefly explained in this section:
Multiple Regression: A statistical technique that permits the determination of a
relationship between a dependent variable, also known as response or outcome variable,
and multiple independent variables, which are also usually referred as predictor,
explanatory, or regressor variables (Allison 1999). Multiple regression or least squares
multiple linear regression, is commonly used by researchers to generate optimal
predictions by the combination of multiple variables obtained from historical data or
recorded observations (Allison 1999; Ott and Longnecker 2010). By using this method
the analyst is able to obtain a quantitative equation that allows DOTs to estimate project
PCS cost (dependent variable) based on the characteristics of the projects and others
known factors (independent variables).
Decision Trees: This approach is commonly used in industry and research to make
decisions that involve a high level of uncertainty (Chelst and Canbolat 2012). These are
flowcharts or tree-like graphs that represent algorithms that lead to different outcomes.
Decision trees are drawn with a root node at the top by taking all the data and splitting it
into branches or decision nodes. This process continues until it reaches a bottom node, or
leaf node, based on the values of the independent variables. Thus, in this study, each node
in the graph will represent a test on the variable and each branch will represent a possible
outcome to this test. The path that determines PCS will depend on the value of the
variables for each project and the uncertainty incorporated in the branches of the
flowchart, which will be measured from the collected data.
Neural Networks: A neural network is a learning system which has the ability to
generalize and learn from data by modeling the neural connections in human brains.
Typically a neural network consists of input layer, hidden layer and output layer where
different inputs are incorporated by these inputs which are combined to result in single
output value through nodes or neurons. Each of these units are then assigned a weight to
make its connection through its nodes based on a training process. This method is capable

40
of modeling non-linear relationships among variables with high accuracy, however it is
difficult to determine the internal weights distributed within the network. Berry and
Linoff (1997) define neural network as a powerful, general purpose tool readily applied
to prediction, classification, and clustering which are sometimes best approached as
‘black boxes’ with mysterious internal workings.
This content of this paper is confined to reporting the results of the evaluation of artificial
neural networks (NN) when applied to PCS cost estimating. It also seeks to identify a project
classification system that can separate projects to improve the estimate accuracy when using
historic data.
The paper will use a data mining approach that consists of six major functions:
1. identifying the problem to solve,
2. determining the data source,
3. preparing the data,
4. building and training a model,
5. validating the model and
6. implementing the model.
The process to develop a model is the same regardless of the research instrument and the
project classification. Figure 6 illustrates the process. Note that identifying potential variables
and preparing the data must be separately conducted for each model as each type of project can
have different correlation / weight with different types of variables.
Figure 6: Basic Steps to Develop a PCS Estimating Model
BACKGROUND
Artificial Neural Network
Artificial neural networks (NN) are a mode of computing that “seeks to include the style
of computing of the brain” (Aleksander and Morton 1990). In 1992 Moselhi et al. investigated
Clean and
format data(Identify potential
variables )
Develop initial model
Validate (Conduct sensitivity
analysis & Error Rate)
Implement PCS estimating modelIdentify problem
Determine data source

41
the potential applications of neural networks in construction due to the benefits that they do not
just describe behaviors like other artificial intelligence (AI) systems but they mimic them. They
are modeled on the adaptable nodes in the human brain and can be trained as through changes in
the function of the node by being exposed to examples (Aleksander and Morton 1990). Figure 7
shows a map of a simple artificial NN. There are three types of nodes input nodes, hidden nodes
and output nodes the number of each vary depending on the model. The nodes are connected
together by weights and along with the transfer function they are used to pass the activation
value from node to node (Sayad 2012). The model can be trained by continuously updating the
weights until the output is within tolerable limits (Hegazy 1998). Each line in Figure 7 performs
a simple sum of the inputs by weight value. A bias node with a value of 1.0 is also added to the
input and hidden nodes to facilitate network processing (Hegazy 1998).
Figure 7: Artificial neural network (Sayad 2012)
One of the trends found in a screening survey completed by 18 state DOTs was that there
is an abundance of PCS cost data that currently exists within a typical agency, but DOTs lack
reliable tools to organize and convert the data into actionable information. This trend was later
confirmed by the agency and case study interviews. In all cases, agency engineers were required
to bill their time to specific projects, making the information available within the agency
financial accounting system. On some occasions, staff did not think that the hours billed were
completely accurate. The Oklahoma DOT responded that approximately 50% of their time was
billed to departmental overhead instead of to a specific job. This ‘noise’ in the data is to be

42
expected when working in this environment. When using historical estimating data, it is
important to recognize that the noise is there and to try to understand the limitations created by
the noise as well as how it may affect the outcome of the estimate. In agencies with a high level
of noise, a top-down approach would work better than a bottom-up estimate because of the lack
of precise historic labor hour information (Larson and Gray 2011). Employing a NN system that
can be trained means DOTs will no longer be as reliant on professional judgment for PCS cost
estimating because the trends in PCS costs will be institutionalized in the NN. This capability
will become more critical if the recent trend showing DOTs are downsizing continues (GAO
2008). A NN-based PCS cost estimating system is a knowledge management tool that transfers
the process to new personnel increasing estimate consistency as DOTs lose experienced mid-
career staff to the private sector.
A NN model is a top-down estimating model and provides an overall estimate for PCS
cost but no details as to how the output was generated. That’s why these NNs are often referred
to as “black box” systems. As shown in Figure 5 this system would work best at the very early
stages of the project development process as the Model 1 estimating system. It could also be
used alongside a bottom-up estimate shown in Model 2. The NN can be used as the back check
of the Model 3 direct estimate based on the project work break down structure (WBS).
Highway Project Classification
One of the challenges encountered in developing a PCS cost estimating model is
classifying highway projects into categories and identifying what is a typical DOT project. Each
DOT has their own set of technical jargon that accompanies their various data collection, cost
estimating systems and project development processes. In some of the case studies, use of
different terminology was found between elements within an agency. Project classification is key
to improving the accuracy of the NN model. Although the model can be trained, it utilizes past
project data to train it. This means that the estimate is based on previous projects in the database,
and therefore, the estimate is only valid for projects within the same range. In other words,
estimating the PCS cost for a new interstate interchange project with a model that is built from
resurfacing project data would not provide a valid estimate.
43
As shown in Figure 6, steps 1 and 2 identify the problem and determine the data source
has been completed. The problem is estimating PCS costs, and the data being used for this paper
is the project data provided collected from the case study projects. The four remaining steps to
developing a PCS cost estimating model are as follows:
1. Identify potential independent variables based on the availability of data in DOT records,
clean and prepare the data by applying appropriate methods for reliable model
development
2. Develop an initial model by using the potential variables and employing the research
tools
3. Validate the developed models using internal validation (by partitioning data into training
and validation data set and conducting sensitivity analysis)
4. Implement the validated models into new projects based on variables with significant
impact on preconstruction service costs.
Prior to implementation, of any model it must be validated by comparing the outcomes
with actual collected data and evaluated by comparing its performance with other existing PCS
estimating methods.
Cleaning Data
This paper explores the project classification system used by the Iowa DOT as a guide for
differentiating between project types. Before a cost estimating system can be set up, the data
needs to be sorted and cleaned to ensure that the results are as accurate as possible. In this
situation, the old adage “garbage in equals garbage out” applies. The data needs to be sorted into
categories to avoid misuse of the model.
The data categories provide a basis for the number of models that need to be developed to
satisfy the estimating requirements for each category. Iowa DOT utilizes the following two types
of classification systems;
1. geometry based classification
2. project complexity classification.
Geometry based classification categorizes projects into four classes;
1. point-based,
2. line-based,
3. polygon-based or multi-line projects and

44
4. special projects
For the purpose of data collection, special projects are be integrated with geographical
information system interfaces. Figure 8 shows the project classification for the geometry based
system.
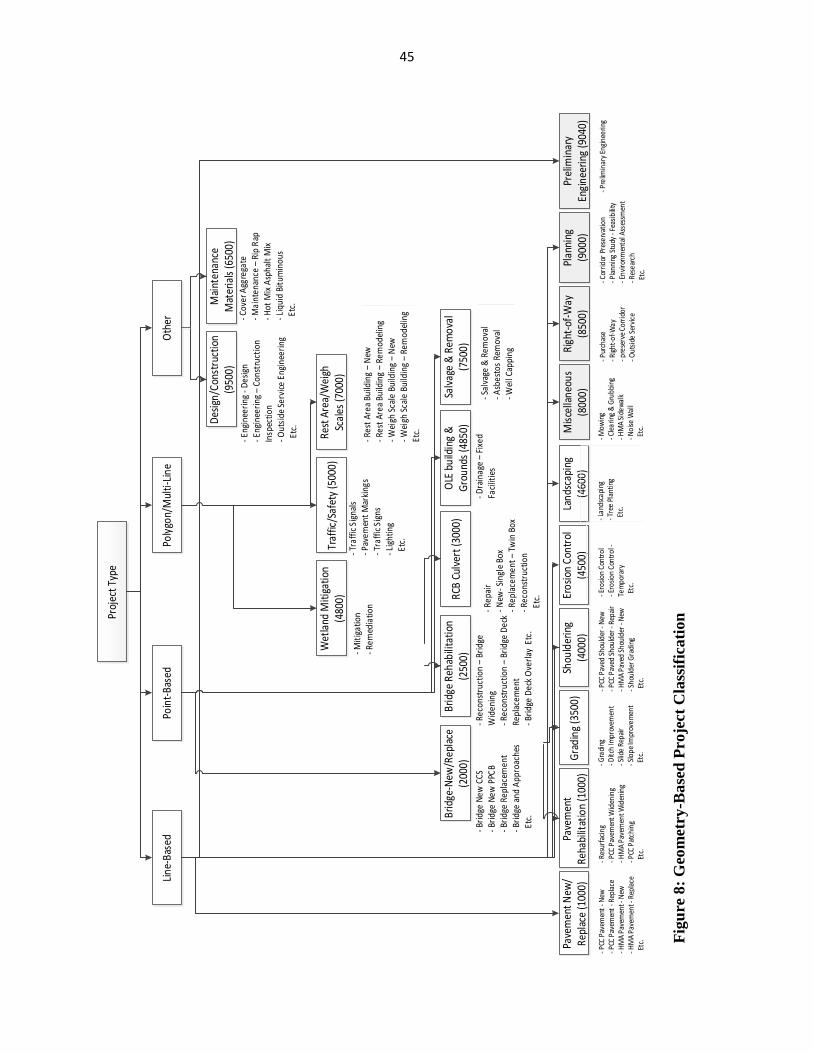
45
Proj
ect T
ype
Line
-Bas
edPo
int-
Base
dPo
lygo
n/M
ulti-
Line
Oth
er
Pave
men
t New
/Re
plac
e (1
000)
Pave
men
t Re
habi
litat
ion
(100
0)G
radi
ng (3
500)
Shou
lder
ing
(400
0)
Des
ign/
Cons
truc
tion
(950
0)M
aint
enan
ce
Mat
eria
ls (6
500)
Wet
land
Miti
gatio
n (4
800)
Traf
fic/S
afet
y (5
000)
Rest
Are
a/W
eigh
Sc
ales
(700
0)
Brid
ge-N
ew/R
epla
ce
(200
0)Br
idge
Reh
abili
tatio
n (2
500)
RCB
Culv
ert (
3000
)O
LE b
uild
ing
&
Gro
unds
(485
0)Sa
lvag
e &
Rem
oval
(7
500)
Eros
ion
Cont
rol
(450
0)La
ndsc
apin
g (4
600)
Mis
cella
neou
s (8
000)
Righ
t-of
-Way
(8
500)
Plan
ning
(9
000)
Prel
imin
ary
Engi
neer
ing
(904
0)
- PCC
Pav
emen
t - N
ew- P
CC P
avem
ent
- Rep
lace
- HM
A Pa
vem
ent -
New
- HM
A Pa
vem
ent -
Rep
lace
Etc
.
- Res
urfa
cing
- PCC
Pav
emen
t Wid
enin
g- H
MA
Pave
men
t Wid
enin
g- P
CC P
atch
ing
Etc
.
- Gra
ding
- Ditc
h Im
prov
emen
t- S
lide
Repa
ir- S
lope
Impr
ovem
ent
Etc
.
- PCC
Pav
ed S
houl
der
- New
- PCC
Pav
ed S
houl
der
- Rep
air
- HM
A Pa
ved
Shou
lder
- N
ew- S
houl
der G
radi
ng E
tc.
- Ero
sion
Cont
rol
- Ero
sion
Cont
rol -
Te
mpo
rary
E
tc.
- Lan
dsca
ping
- Tre
e Pl
antin
g E
tc.
- Mow
ing
- Cle
arin
g &
Gru
bbin
g- H
MA
Side
wal
k- N
oise
Wal
l E
tc.
- Pur
chas
e- R
ight
-of-W
ay- p
rese
rve
Corr
idor
- Out
side
Ser
vice
- Cor
ridor
Pre
serv
atio
n- P
lann
ing
Stud
y - F
easi
bilit
y- E
nviro
nmen
tal A
sses
smen
t- R
esea
rch
Etc
.
- Pre
limin
ary
Engi
neer
ing
- Bri
dge
New
CCS
- Bri
dge
New
PPC
B- B
ridg
e Re
plac
emen
t- B
ridg
e an
d A
ppro
ache
s E
tc.
- Rec
onst
ruct
ion –
Brid
ge
Wid
enin
g- R
econ
stru
ctio
n –
Brid
ge D
eck
Repl
acem
ent
- Bri
dge
Dec
k O
verl
ay E
tc.
- Rep
air
- New
- Sin
gle
Box
- Rep
lace
men
t –
Twin
Box
- Rec
onst
ruct
ion
Etc
.
- Dra
inag
e –
Fixe
d Fa
cilit
ies
- Sal
vage
& R
emov
al- A
sbes
tos
Rem
oval
- Wel
l Cap
ping
- Mit
igat
ion
- Rem
edia
tion
- Tra
ffic
Sig
nals
- Pav
emen
t M
arki
ngs
- Tra
ffic
Sig
ns- L
ight
ing
Etc
.
- Res
t Ar
ea B
uild
ing –
New
- Res
t Ar
ea B
uild
ing –
Rem
odel
ing
- Wei
gh S
cale
Bui
ldin
g –
New
- Wei
gh S
cale
Bui
ldin
g –
Rem
odel
ing
Et
c.
- Eng
inee
ring
- D
esig
n- E
ngin
eeri
ng –
Con
stru
ctio
n In
spec
tion
- Out
side
Ser
vice
Eng
inee
ring
Etc
.
- Cov
er A
ggre
gate
- Mai
nten
ance
– R
ip R
ap- H
ot M
ix A
spha
lt M
ix- L
iqui
d Bi
tum
inou
s E
tc.
Fig
ure
8:
Geo
metr
y-B
ase
d P
roje
ct
Cla
ssif
icati
on

46
The second classification categorizes projects into Type I, II and III projects in a
decreasing order of complexity where Type I projects require major changes such as new
construction, bridge replacement, relocation etc., Type III projects are repair, replacement or
operational improvement type projects. The complexity classification is determined from five
criteria:
1. location,
2. grade,
3. lanes,
4. ROW,
5. Public access and private access.
For instance, Type I projects are complex projects such as interstate projects that consist
of interchanges and roads that features new alignment with complete new grade lines and may
incorporate addition of new lanes and acquisition of substantial right of way. Table 13 shows
these classifications along with applicable project groups and corresponding work types.
The complexity based project classification system is more adaptable to the data available
from other DOTs. Project complexity was also found to be one of three most influential
characteristic on the PCS cost estimate. Determining projects into groups by their complexity
rating can minimize the error this factor could introduce. Another defining factor that could be
used is National Environmental Policy Act (NEPA) classification systems. Each project must be
assessed to determine whether it is a categorical exclusion (CE), environmental assessment (EA)
or an environmental impact statement (EIS). These ratings are usually related to project
complexity and there are specific guidelines on how to determine the classification of each
project whereas project complexity classification is more subjective.
From the project influence analysis discussed in Chapter 3, NEPA classification was in
the top tier when considering the overall agency program. However, when rated on an individual
project basis, it was relegated to Tier 3 (little to no influence). This is likely because 13 out of 16
projects collected in this study were categorical exclusions (lowest level of documentation
required); therefore the NEPA classification had little effect on the PCS cost estimate for these
projects.

47
Table 13: Project Classification Based on Complexity (Iowa DOT, 2012)
Project Type Criteria Description Applicable
Project Groups
Corresponding
Work Types
Type I
Major Change
Location New alignment or relocation along major portion of
highway section
- New
Construction
- Relocation
- Bridge
Replacement
(Major Crossing)
- Grading
- Pavement:
New/Replace
- Right of Way
- Bridge:
New/Replace
Grade Complete new grade lines, or very small segments
of existing grade line
Lanes
2-lanes, change from 2-lanes to multi-lane
(divided/undivided) or ROW acquitted for multi-
lane construction
ROW Substantial right of way (ROW) acquisition
Public Access
Restricted to interchange locations or limited at-
grade connections for freeway or expressway
system or minor or no adjustment
Private Access
Restricted to use of frontage roads or points of
public access for freeway or expressway system or
changes with limitations on number & location in
areas of ROW acquisition
Type II
Minor Change
Location Use existing grade location
- Reconstruction
- Rehabilitation
- Restoration
- Bridge
Replacement
- Intersection
Improvement
- Grading
- Pavement
Rehabilitation
- Right of Way
- Bridge:
New/Replace
- Pavement:
New/Replace
- Traffic/Safety
Grade Use existing grade lines
Lanes Remains the same in number but will normally be
widened
ROW Usually requires some additional right of way
Public Access Remains the same or involves minor adjust
Private Access
Could involve changes with limitations on number
& location in areas of ROW acquisition, but not
frontage roads
Type III Repair,
replacement or
Operational
Improvement
Location No change - Rehabilitation
- Restoration
- Maintenance
- Bridge
Replacement
- Bridge Repair
- Bridge
Rehabilitation
- Safety
Improvement
- Pavement
Rehabilitation
- Bridge
Rehabilitation
- Right of Way
- Bridge:
New/Replace
- RCB Culvert
- Traffic/Safety
- Shouldering
Grade No change requiring ROW, excepted in isolated
circumstances
Lanes No change, width may change and turning lanes
may be added
ROW No additional ROW required except at isolated
locations
Public Access Remains the same
Private Access Remains the same

48
METHODOLOGY
Figure 9 show the methodology adopted to develop the PCS cost estimate.
Interviews case
studies DATA
PCS estimate
Validation
Actual PCS cost Predicted PCS cost
Neural Network
Input variablesInfluence variables
OK?
Yes
No
Figure 9: Research Methodology
The methodology for the interviews and case studies has been described in chapter 2 of
this thesis. Chapter 3 describes in detail how the researchers developed the NN model input
variables. Tables 3-8 in chapter 2 show the data collected for individual projects that are used in
this study.
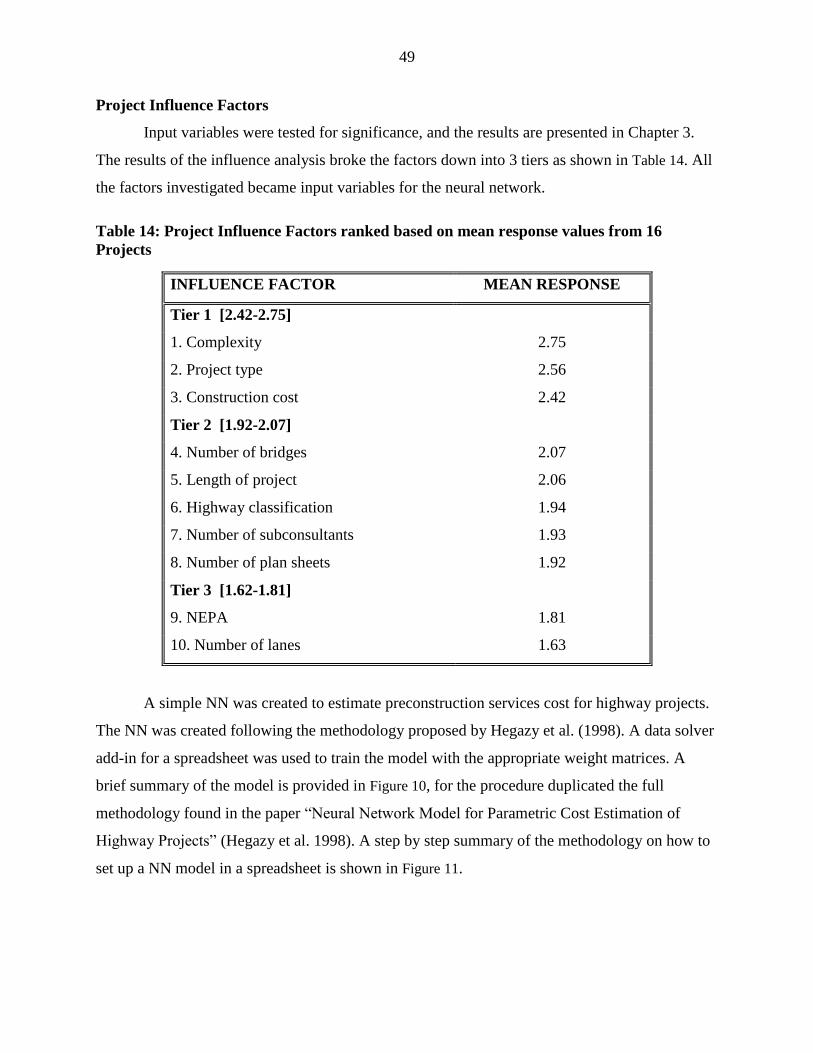
49
Project Influence Factors
Input variables were tested for significance, and the results are presented in Chapter 3.
The results of the influence analysis broke the factors down into 3 tiers as shown in Table 14. All
the factors investigated became input variables for the neural network.
Table 14: Project Influence Factors ranked based on mean response values from 16
Projects
INFLUENCE FACTOR MEAN RESPONSE
Tier 1 [2.42-2.75]
1. Complexity 2.75
2. Project type 2.56
3. Construction cost 2.42
Tier 2 [1.92-2.07]
4. Number of bridges 2.07
5. Length of project 2.06
6. Highway classification 1.94
7. Number of subconsultants 1.93
8. Number of plan sheets 1.92
Tier 3 [1.62-1.81]
9. NEPA 1.81
10. Number of lanes 1.63
A simple NN was created to estimate preconstruction services cost for highway projects.
The NN was created following the methodology proposed by Hegazy et al. (1998). A data solver
add-in for a spreadsheet was used to train the model with the appropriate weight matrices. A
brief summary of the model is provided in Figure 10, for the procedure duplicated the full
methodology found in the paper “Neural Network Model for Parametric Cost Estimation of
Highway Projects” (Hegazy et al. 1998). A step by step summary of the methodology on how to
set up a NN model in a spreadsheet is shown in Figure 11.
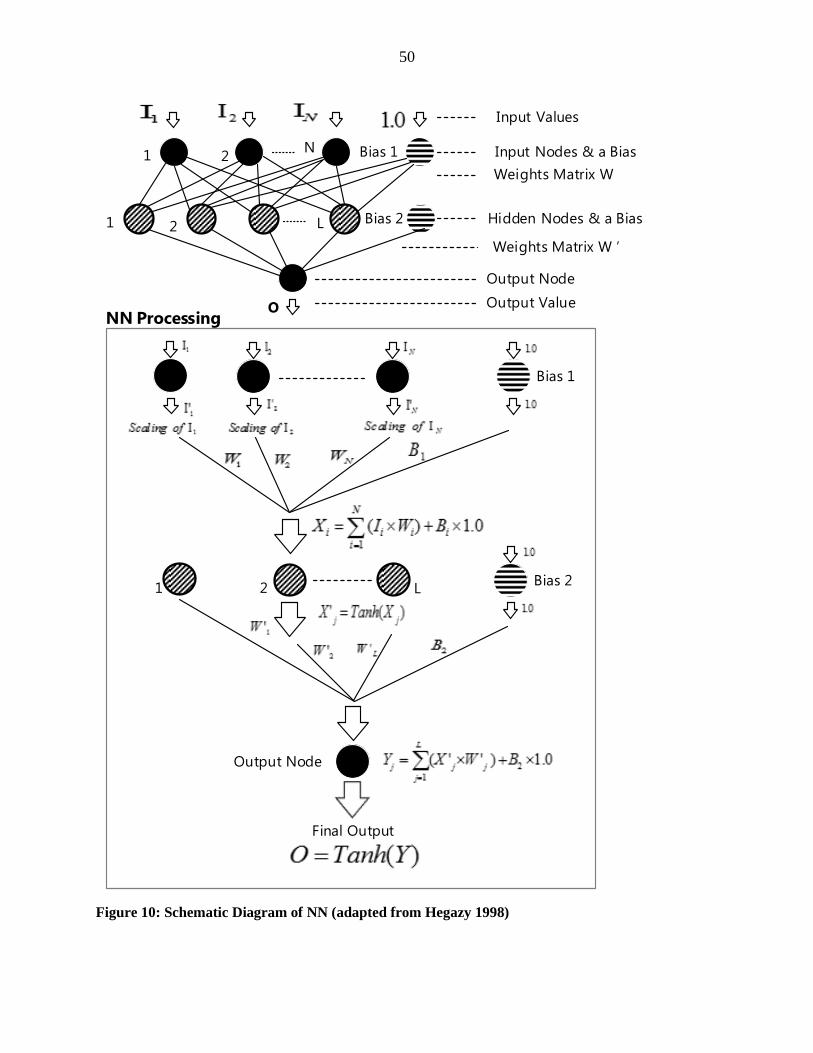
50
1 2N
L
Bias 1
Bias 21 2
Input Values
Input Nodes & a Bias
Weights Matrix W
Hidden Nodes & a Bias
Weights Matrix W ’
Output Node
Output ValueO
Bias 1
Bias 21 2 L
Output Node
Final Output
NN Processing
Figure 10: Schematic Diagram of NN (adapted from Hegazy 1998)
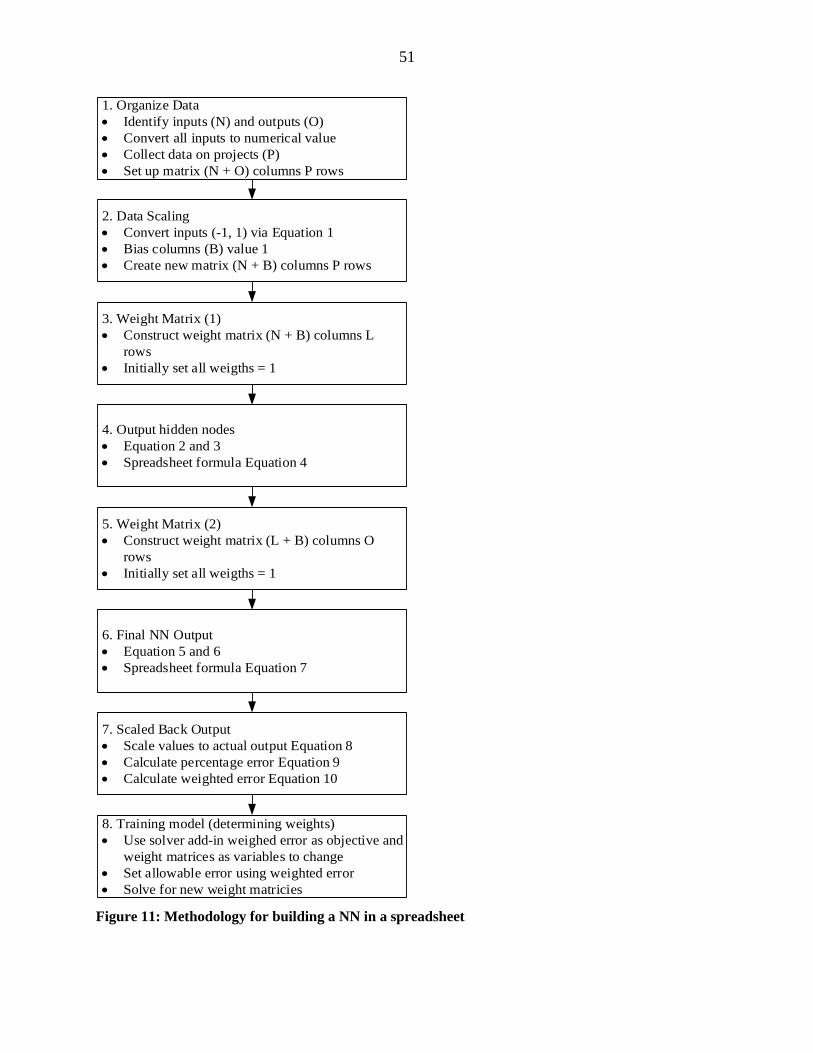
51
1. Organize Data
Identify inputs (N) and outputs (O)
Convert all inputs to numerical value
Collect data on projects (P)
Set up matrix (N + O) columns P rows
2. Data Scaling
Convert inputs (-1, 1) via Equation 1
Bias columns (B) value 1
Create new matrix (N + B) columns P rows
3. Weight Matrix (1)
Construct weight matrix (N + B) columns L
rows
Initially set all weigths = 1
4. Output hidden nodes
Equation 2 and 3
Spreadsheet formula Equation 4
5. Weight Matrix (2)
Construct weight matrix (L + B) columns O
rows
Initially set all weigths = 1
6. Final NN Output
Equation 5 and 6
Spreadsheet formula Equation 7
8. Training model (determining weights)
Use solver add-in weighed error as objective and
weight matrices as variables to change
Set allowable error using weighted error
Solve for new weight matricies
7. Scaled Back Output
Scale values to actual output Equation 8
Calculate percentage error Equation 9
Calculate weighted error Equation 10
Figure 11: Methodology for building a NN in a spreadsheet

52
Equation 1
∑( )
Equation 2
Equation 3
Equation 4
∑(
)
Equation 5
Equation 6
Equation 7
Equation 8
Equation 9
Equation 10
In the model developed to estimate PCS cost there were ten input values (N=10) for each
project, these values came from the influence factors shown in Table 14. The diagram show in
Figure 7 shows a multiple output NN the model developed for here used a single output the PCS
cost estimate (O=1). The number of hidden nodes is set to equal one half of the total input and
output nodes (Hegazy et al. 1994). In the PCS cost estimating model there was five hidden nodes
(L=5) All values must be in a numerical format the input values and their numerical assignments
are listed below:
I1 = Project Cost
I2 = Project type (1= Major Structure, 2=Reconstruction, 3=Bridge rehabilitation, 4=
Continuous flow intersection, 5=Rehabilitation, 6=Safety)
I3 = NEPA Classification (1 = Categorical exclusion, 2= Environmental Assessment, 3=
Environmental Impact statement)
I4 = Project Complexity (scale 1(basic project) 3(standard project) 5(complex project))
I5 = Number of sub-consultants
I6 = Number of lanes
53
I7 = Number of plan sheets
I8 = Number of Bridges
I9 = Highway Classification (1=principal arterial, 2= urban arterial, 3= rural major
collector, 4=rural principal arterial, 5=interstate)
I10 = project length (miles)
Due to the limited number of project case studies available in this study, the model was
trained with 10 projects then tested with the remaining 3. There was not actual PCS cost data for
Oklahoma DOT projects, therefore these were not used in the model. It is important to
continually add data to the system and update the weights as more data becomes available. This
will continually improve the model and train it to provide better estimates as more data is added
to the database.
RESULTS
The key to a NN is training the model, which adjusts the weight matrices to produce
estimates within the allowable error. The effectiveness of the model is measured by the weighted
error shown in Equation 10.
Initially the values of the 5 by 11 and 1 by 6 weight matrices were set to 1. Table 15
shows the output results of this analysis. The weighted error is 99.57 %, which exceeds the
acceptable limit. After the solver simulation was completed, the model is trained as described in
step 8 Figure 11 using the weighted error as the objective cell to minimize its value. Constraints
were set on the error values. The maximum error for the 10 training projects was set at 2% and
the maximum error for the testing cells was set at 3%. The simulation was run and new weight
values were created. The final PCS cost estimates shown in Table 15 were all within the
previously mentioned constraints and the weighted error was reduced to 1.4%.

54
Table 15: Results of NN analysis
Before Training After Training
Actual PCS Cost Estimate Error Estimate Error
$ 2,200,000.00 $ 18,950.23 99.14% $ 2,156,000.00 2.00%
$ 800,000.00 $ 18,917.15 97.64% $ 784,000.00 2.00%
$ 326,984.74 $ 19,283.07 94.10% $ 320,445.05 2.00%
$ 1,350,022.32 $ 18,902.44 98.60% $ 1,323,021.88 2.00%
$ 747,932.55 $ 18,971.17 97.46% $ 732,973.90 2.00%
$ 523,441.08 $ 18,917.35 96.39% $ 512,972.26 2.00%
$ 221,626.30 $ 18,890.64 91.48% $ 226,058.83 2.00%
$ 277,253.92 $ 18,888.98 93.19% $ 282,799.00 2.00%
$ 3,704,380.09 $ 3,704,355.83 0.00% $ 3,703,639.06 0.02%
$ 17,634.00 $ 18,871.44 7.02% $ 17,986.68 2.00%
$ 1,510,000.00 $ 83,511.06 94.47% $ 1,509,993.91 0.00%
$ 1,280,000.00 $ 94,265.66 92.64% $ 1,318,400.00 3.00%
$ 1,333,346.08 $ 3,704,356.45 177.82% $ 1,333,352.90 0.00%
Before Training After Training
Average Training error 77.50% 1.80%
Average Testing error 121.64% 1.00%
Weighted Error
99.57% 1.40%
Table 15 shows the analysis output in both dollar values and as a percentage of error from
actual PCS costs for each project. As future projects are completed within an agency, they should
be added to the database and used as further training projects to maintain current PCS cost
estimates. There needs to be a constant feedback loop and continual adjustment of weight values
to avoid inflation or cost differences affecting the final estimate.
The input variables that were used in the model are not fixed and. they should be altered
to fit the individual agency data and processes. To implement this method an agency should
determine its input variables by completing an influence analysis of project PCS costs as
described in Chapter 3 (Table 14). Input parameters should also be regularly assessed to ensure
they are still relevant to PCS cost estimate. For example, NYSDOT suggested they are moving
away from using plan sheets to fully electronic construction documents. Thus, plan sheets will no
longer be a suitable parameter for use in the future. Another example is found in the Rhode
Island DOT where PCS costs vary whether a project is bordering the sea, bordering a fresh water
55
body, or not near water at all, making an input factor related to its geographical location logical
for that agency’s PCS cost model.
CONCLUSIONS
Hegazy (1998) provides a detailed methodology to create a simple NN model that can be
built in a spreadsheet and this paper has demonstrated the application Hegazy’s methodology to
produce a PCS cost estimate. After training the NN model, the between predicted and actual
project PCS cost was reduced from 99.6% to 1.4%. This leads to the conclusion that NNs are
well suited for use in PCS cost estimating as they can be trained and easily adjusted as new data
becomes available.
Iowa DOTs project classification process was also investigated and found to provide a
comprehensive three level classification system to define a project based on its complexity.
Project complexity was shown in Chapter 3 to have a major influence on the PCS cost estimate.
Therefore it is concluded that projects can be classified using the Iowa DOT classification
system.
Finally it is recommended that each project complexity type should have its own NN-
based PCS cost estimating model compiled of like projects to improve estimate accuracy. As
with all models that require historic data the model is only valid within the parameters in which
it was created and must be continually revised and updated to ensure the output remains current.
56
CHAPTER 5 – RATIONAL METHOD TO DETERMINE A DESIGN COST
CONTINGENCY FOR CONSULTANT DESIGNED HIGHWAY CONSTRUCTION
PROJECTS
Hunter, K.D. and D.D. Gransberg, “Comparative Analysis of Two Models for Estimating
Highway Project Design Costs,” 2014 Transportation Research Board, Paper 14-3967,
National Academies, January 2014, pp. 1-18.
[Peer-reviewed full-paper proceedings article]
ABSTRACT
The purpose of this paper is to propose a rational method for determining a design cost
contingency. The contingency in design is to account for risks such as scope creep and lost
design effort throughout the process. In design of transportation projects, the required function of
a project is usually well-defined but the amount of time required needed to complete the design
are difficult to quantify. The proposed method to calculate design contingency can be used by an
agency to augment its current method to estimate consultant design fees. This paper details a
method for creating a design cost estimate accuracy index from historical budgeted and actual
design fee data. The index can be used on future projects to determine an appropriate design
contingency. The paper demonstrates the validity of the proposed method by example comparing
the data from 26 actual projects from 9 different agencies with published design fee curves from
the American Society of Civil Engineers and the Institute of Professional Engineering New
Zealand, using linear regression. Since coefficients of determination (R2 values) exceeded 0.95,
the paper concludes that the use of the design contingency will enhance the accuracy of design
fee estimates.
INTRODUCTION
Design is defined by the Oxford English Dictionary as “a plan or drawing produced to
show the look and function or workings of a building, garment, or other object before it is made”
(Oxford 2013). It is difficult to set a dollar value to the creativity, foresight and technical skill
that are required to solve a given engineering problem because design is the creation of
intellectual rather than physical property (Sturts et al 2005). This is issue has long plagued
engineers and their clients. The traditional remedy in construction estimating is to include a
contingency, which by definition is “a provision for an unforeseen event or circumstance”
(Oxford 2013). The objective of the research is to develop a method to determine an appropriate

57
contingency for highway construction project design fee estimate being designed by external
design consultants. The proposed approach assumes that an agency will already have its own
unique method for estimating consultant design fees as well as data for budgeted and actual
design fees from past projects. It then relies on the historic data to develop an index that
measures the accuracy of past estimates and establish a logical means to calculate a contingency
for a given project based on a fee that is a function of the ratio of the design cost to the budgeted
construction cost.
Design costs occur in the preconstruction services phase of a project and are not always
accurately recorded in the public sector making it more difficult to form an estimate without past
data and experience available. As design costs are usually a small portion of the total project
cost, conventional wisdom holds that it is unnecessary to conduct a detailed design cost estimate
that accounts for all the uncertainty (Brown 2002). An inaccurate design cost estimate in the
Preconstruction Services (PCS) phase typically does not directly affect the total project cost as
much as an inaccurate estimate of the construction cost of the project. The design fee
contingency tends to be a small percentage of the total project costs, making its value seem
inconsequential. However if the design estimate requires 40,000 hours 5% of this is 2,000 hours,
this extra time available for design could drastically change the project outcomes. Recent
research has shown that failing to adequately fund the design phase can result in increased
construction cost growth (Gransberg et al 2007). The cost growth can be attributed to designers
cutting corners to get the design finished in the time allocated and supplying incomplete
construction documents. If designers know there is extra time available for design this will be
used to complete work to an appropriate standard without the risk of not getting paid.
Accounting for uncertainty when a consultant design fee is established is every bit as important
has accounting for uncertainty in estimating the construction cost. Additionally, having a direct
estimate of the expected fee and a reliable contingency gives the agency a starting point for
negotiations with consultants, and it will also allow them to more efficiently allocate funds
throughout the program.
BACKGROUND
From the literature it can be seen that there are a wide variety of methods for estimating
design costs for transportation projects. This variation stems from diversity in the states, their

58
funding, policy, regulations and local preferences. As a result, any method for determining an
appropriate design contingency based on past project experience must be able to be applied to a
variety of estimating models to be of practical value. At the outset of design fee negotiations, a
number of satisfactory design solutions to a given design problem exist, making it difficult to
estimate the financial value of these services when the details of the end product are unknown.
Struts et al. (Struts et al 2005) commented that “expertise, creativity, and quality are difficult to
quantify,” and therefore there is a large component of uncertainty in the design process. There
must be provisions to address uncertainty to ensure the client gets the best product and can make
alterations to the final scope of work as necessary.
Design Fee Impact on Construction Project Cost Performance
In highway projects, the design cost ranges from approximately 1.5% to 5% of the
estimated construction cost (Struts et al 2005). The low overall value of design costs has in the
past deterred Departments of Transportation’s (DOT) from investing any more time than
necessary to estimate the design cost and little if any, time to established necessary contingencies
(Williams et al 2013). The upshot is that inaccurately estimated consultant design fees create an
unintentional cap on the amount of design effort that can be expended on a given project (Carr et
al 2005) and actually impact the quality of the construction documents (McSkimming et al
2005).
In traditional design-bid-build project delivery, poor design quality leads to increased
construction cost because the project’s owner warrants the quality of the construction documents.
Any errors, omissions, and quantity inaccuracies discovered after award of the construction
contract must be paid for by contract modifications, which usually increase the final cost of the
project (Beemer 2005). More importantly, the design documents “literally define the level of
required construction quality and as such, are extremely important to a transportation project’s
ultimate success” (Gransberg et al 2007). Research completed by Morgen (Morgen 1986) and
Kirby et al (Kirby et al 1988) found that design deficiencies were the primary driver for
construction contract changes and that “56% of all modifications are aimed at correcting design
deficiencies.” Another study by Burati et al (Burati et al 1992) found that changes resulting from
design errors identified after construction contract award accounted for 79% of all change order
costs and average 9.5% of the total project cost.
59
Carr and Beyor (Carr et al 2005) reported that design fees have lagged construction
inflation for the past three decades. Underfunding project design contracts results in a
conundrum where “the high-quality professional services rightfully expected by the public will
become increasingly difficult [to attain] if the erosion in fees continues unabated into the future”
(Carr et al 2005). Pricing pressure leads engineers to a point where they must provide the
necessary level of design with diminishing resources, and may induce a bias toward minimizing
design analyses and cross-checks to maintain project profitability, which would be seen in
declining quality of construction documents. This issue is further exacerbated by the recent
focus on accelerating project delivery in official programs like the Federal Highway
Administration’s Every Day Counts initiative (Mendez 2010). Janacek (Janacek 2006) sums up
this issue succinctly when he states: “Don’t try to squeeze that extra quarter point from their
[design] fee. For every dollar you spend up front on design and planning you will save 10 to 20
fold down the line”
Estimating Design Fees
The 2012 update of ASCE Manual No. 45 states that there are five methods for charging
for design services (ASCE 2012):
1. Multiplier: Salary cost times multiplier, plus direct nonsalary expense;
2. Hourly: Hourly billing rate, plus reimbursable expenses and a “not to exceed: amount for
specific services;
3. Per diem: Fixed charge per day;
4. Cost plus, fixed fee ; and
5. Lump sum or fixed price.
The first four methods are variable cost methods as the price the client will pay varies
depending on the actual amount of work (ASCE 2012). The fifth method, lump sum or fixed fee,
is a single factor and is useful if there is a well-defined project scope. When an agency
outsources design, there is commonly a defined, but general, scope of work. However, as the
project is yet to be designed, that scope is conceptual and both the owner and the consultant must
estimate the design effort to achieve the necessary functional requirements. By adding a
contingency the need to request authorization for additional funds to complete the design process
60
is avoided. Without a contingency, there exists a strong bias against requesting additional
funding (Flyvbjerg et al 2002). If a contingency is not used during the design those funds can
then be released.
Contingencies
When estimating project design cost, the scope is articulated in functional terms, but the
design details are unknown. Nevertheless, current practice tends toward negotiating a lump sum
design fee, which unintentionally implies a level of certainty that may not be dependable
(Gransberg et al 2007, Williams et al 2013). Some agencies will only use variable cost methods
to allow for the uncertainty; however it is important to have a known range for funding
authorization. A design estimate is the expected value of design and a contingency can be
included in the estimate to account for the higher end of the possible cost range for the project
(Mak et al 2000). In public works, the project’s contingency is effectively to account for the risks
associated with both the design process and the construction project. However, in many cases, it
is calculated as an arbitrary percentage. For example, the US Army Corps of Engineers requires
a 5% contingency (US Army Corps of Engineers 197) and the Riverside County California DOT
uses 10% (Riverside County 1999) to be added to project cost estimates before design
commences.
Figure 12 shows the project development process, how the risk is allocated, and how the
contingency can be retired as the project progresses and risks are realized. Most of the research
conducted about contingencies pertains to construction cost contingencies; however an argument
can be made that Figure 12 shows that the construction contingency is greater in the design stage
where the unknowns are much greater and as such, a design contingency is warranted for the
very same reason.

61
Figure 12: Conceptual components of a cost estimate (Molenaar et al. 2005)
Design Fee Estimating Approaches
Two approaches for estimating design cost have been identified in this study, an estimate
of hours and an estimate producing a fee percentage of construction cost. Another method to
estimate design fee is cost per plan sheet. This was not included in the analysis because this
method is becoming obsolete. This is due to the development of technology that permits plans to
be produced electronically making the correlation between number of plan sheets and design fee
difficult to measure. New York State DOT developed a model using a commercial
spreadsheet/database program to estimate the design hours for each project (Williams et al 2013).
The model allows the DOT to either search similar projects or generate an estimate of total
design hours to be expected for a project. The model was developed using a 12 “key” project
characteristic chosen by the NYSDOT engineers as defining factors of a project, these were
(Williams et al 2013):
1. Complexity
2. Project type
3. Number of sub-consultants

62
4. Construction cost
5. Number of lanes
6. Number of plan sheets
7. State Environmental Quality Review (SEQR) classification
8. National Environmental Policy Act (NEPA) classification
9. Predominant bridge type
10. Number of bridges
11. Highway classification
12. Length of project
These characteristics became the input factors in the model the number of plan sheets is
used as the independent variable to calculate the total design hours. Hours are calculated from a
simple regression model that is expected to become more accurate as more project data is made
available (Williams et al 2013).
It has been suggested that using labor-hours as an estimating tool could cause a
misrepresentation of the total work performed (Sturts et al 2005). Due to the advancement in
available technology and computer aided design the labor-hours can be significantly reduced but
the value of the design could be increased (Sturts et al 2005). This was also suggested by Carr
and Beyor (2005) where they found that the design fees are not keeping up with the inflation of
construction prices. Another study (Gransberg et al 2007) found that if the design fee of a project
is too low, it can lead to major cost growth in the construction process due to incomplete
construction documents. The issue of under-estimating the reasonable cost of the necessary
design effort must be considered when using past project data to estimate direct hours and make
adjustments if necessary.
Three regression models were considered by the researchers in this study one at a state
level, American Council of Engineering Companies of Texas (TCEC); a national model
American Society of Civil Engineers (ASCE) fee curve model; and an international model
Institute of Professional Engineers New Zealand (IPENZ) design fee curve. The three
alternatives furnish three different perspectives on the topic.
The American Council of Engineering Companies of Texas (TCEC) released a formula to
estimate a fee for consultant design of a transport project. The formula uses a number of

63
technical factors related to the project to determine the percentage of design fee estimate. Table
16 shows all the factors that are considered. The estimator must determine the appropriate value
for each factor for each individual project. The formula is as shown in Equation 11 (TCEC
2005):
( )
Equation 11
Where: F = Engineering fee as a percent of construction cost
C = Sum of fee factors (See Table 16)
A = Cost index factor = CCI current/CC11993
CCI = Engineering News Record construction cost index
CC11993 = 3484.85 (Dallas, Texas - March 1993)
P = Construction cost in millions of dollars

64
Table 16: TCEC Table of Technical Factors (TCEC 2005)
Technical Factors Factor Values
1. Level of information required on plans/drawings -0.20 to 0. 1 0
2. Project requirement
a. scope of services
b. rehab vs. grass roots project
c. interface with other contracts/consultants
d. numerous disciplines required
e. alteration/modification of existing facility
f. complexity of project
-0.20 to 0.33
3. Existing data, e.g.
preliminary engineering report
as-constructed drawings/specifications
-0.35 to 0.20
Owner Controlled Factors Factor Values
1. Risk/liability (base standard of risk limited to fee) -0.10 to 0.10
2. Time required for owner review/approvals
(2 weeks standard)
0.0 to 0.20
3. Number of submittals/owner reviews Add 0.05 for each submittal in
addition to preliminary and final
4.Schedule for completing work - fast-track vs. reasonable schedule 0.0 to 0.20
5. Payment schedule - 30 days after receipt of invoice 0.01 for each late 30-day period
6. Owner requested subconsultant's 0.05 to 0.15 of the value of the
subcontract
7. Owner participation in project/partnering 0.0 to 0.20
8. Construction inspection limiting participation of engineer 0.05 to 0.20
External Factors Factor Values
1. Coordination with other entities 0.0 to 0.12
2. Environmental regulations 0.0 to 0.12
3. "Not-in-my-back-yard"/citizen's involvement 0.0 to 0.20
4. Governmental constraints 0.0 to 0.20
This estimate considers a variety of technical factors to either increase of decrease the
estimated fee depending on project conditions. The table incorporates all 12 of the factors
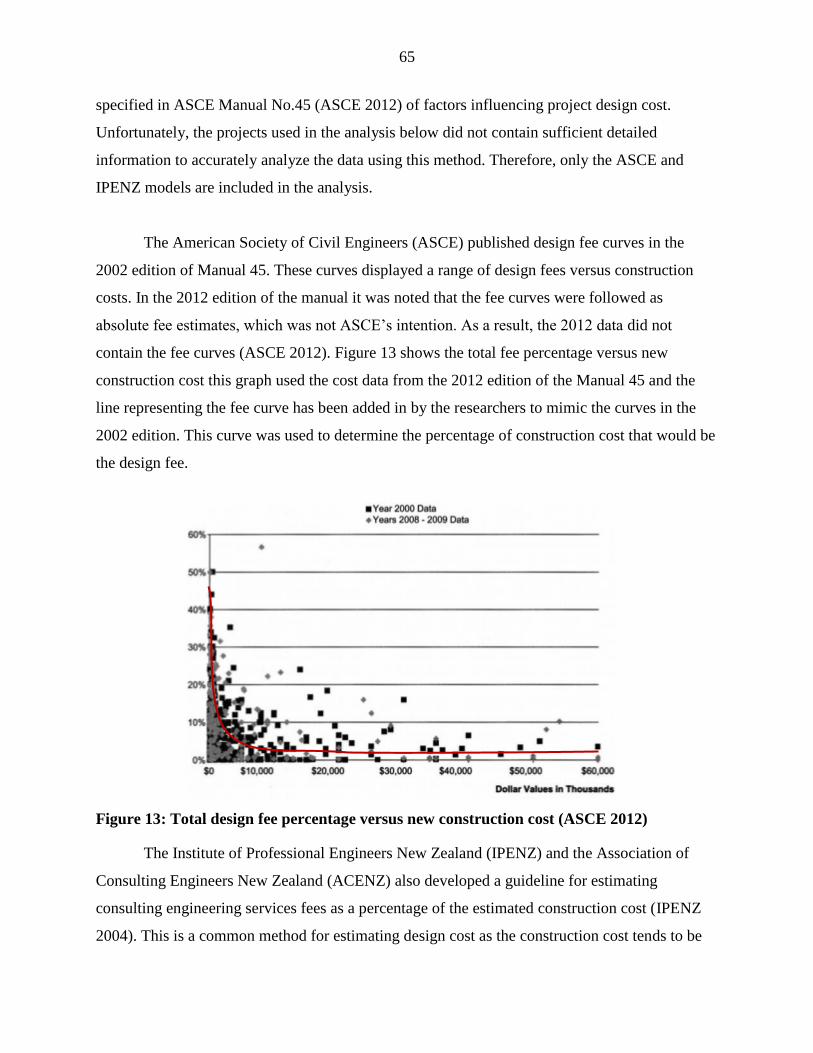
65
specified in ASCE Manual No.45 (ASCE 2012) of factors influencing project design cost.
Unfortunately, the projects used in the analysis below did not contain sufficient detailed
information to accurately analyze the data using this method. Therefore, only the ASCE and
IPENZ models are included in the analysis.
The American Society of Civil Engineers (ASCE) published design fee curves in the
2002 edition of Manual 45. These curves displayed a range of design fees versus construction
costs. In the 2012 edition of the manual it was noted that the fee curves were followed as
absolute fee estimates, which was not ASCE’s intention. As a result, the 2012 data did not
contain the fee curves (ASCE 2012). Figure 13 shows the total fee percentage versus new
construction cost this graph used the cost data from the 2012 edition of the Manual 45 and the
line representing the fee curve has been added in by the researchers to mimic the curves in the
2002 edition. This curve was used to determine the percentage of construction cost that would be
the design fee.
Figure 13: Total design fee percentage versus new construction cost (ASCE 2012)
The Institute of Professional Engineers New Zealand (IPENZ) and the Association of
Consulting Engineers New Zealand (ACENZ) also developed a guideline for estimating
consulting engineering services fees as a percentage of the estimated construction cost (IPENZ
2004). This is a common method for estimating design cost as the construction cost tends to be

66
easier to quantify than design (Sturts et al 2005). The curves were developed using data from
past projects and provide a “best practice” for estimating consultant fees however individual
project interpretation is encouraged. It is noted in the guideline that the fee estimate includes
project estimates, economic studies, alternative evaluations and schedule of quantities if the
required services for a particular project is different an adaptation of the fee is required.
The method divides projects up into nine different types each type has a sub types to
define the project. Figure 14 shows the fee guideline for the class of project in the analysis, the
graph used by the researcher in this study. The graph relates the project complexity and degree of
urbanization to the design effort required. From Figure 14 it can be seen that the there is a
logarithmic relationship between the construction cost and design fee (IPENZ 2004). The costs
are all recorded in New Zealand dollars however as the design cost is measured as a percentage
the graphs were directly translated to US dollars. Due to the accuracy of the project data it was
assumed all projects were state highway projects and all fees were calculated using Figure 14.
Figure 14: State Highway Road, Shape Correction, Pavement Rehabilitation, Bridge and
Urban Bridge Fee Guideline (IPENZ 2004).

67
METHODOLOGY
The purpose of this research is to develop a method to determine an appropriate
contingency when producing a design cost estimate using an individual agency’s traditional
estimating model. Initially, a database of past projects performed by consultant design was
collected with cost data including budgeted design cost (cost at award) in both dollar value and
percentage of budgeted construction cost. Table 17 is the database of projects used in the
research it consists of 26 projects from 9 different DOTs and encompassed a variety of projects
including roads, bridges, sound walls and intelligent transportation systems. For each project a
complementary database was created using a cost estimating model that expresses design cost as
a percentage of construction cost. Both the ASCE and IPENZ models were used. Figure 15 is a
projection of the three datasets. The difference in the budgeted and estimated cost represents
contingency required as it consists of the known unknowns shown in Figure 12.

68
Table 17: Database of projects used estimate
Agency Budgeted Design
Cost (in thousands)
Budgeted
Construction Cost (in
thousands)
Roads
Colorado Department of Transportation $ 1,800.00 $ 16,200.00
Colorado Department of Transportation $ 2,320.00 $ 26,680.00
Florida Department of Transportation $ 93.36 $ 1,073.64
Florida Department of Transportation $ 375.00 $ 2,500.00
Florida Department of Transportation $ 568.37 $ 4,598.66
Georgia Department of Transportation $ 909.00 $ 27,400.00
Maryland Department of Transportation $ 1,000.00 $ 17,635.00
Maryland Department of Transportation $ 880.00 $ 8,059.00
Pennsylvania Department of Transportation $ 350.00 $ 17,252.00
Pennsylvania Department of Transportation $ 647.00 $ 9,825.70
Washington State Department of Transportation $ 2,000.00 $ 15,000.00
New Jersey Department of Transportation $ 1,300.00 $ 7,116.00
Pennsylvania Department of Transportation $ 117.21 $ 7,117.00
Bridges
Florida Department of Transportation $ 129.53 $ 1,489.55
Delaware Department of Transportation $ 147.00 $ 588.00
New Jersey Department of Transportation $ 400.00 $ 2,400.00
New Jersey Department of Transportation $ 360.00 $ 1,700.00
New Jersey Department of Transportation $ 200.00 $ 2,900.00
Pennsylvania Department of Transportation $ 150.00 $ 3,346.00
Pennsylvania Department of Transportation $ 50.00 $ 3,429.00
Pennsylvania Department of Transportation $ 27.00 $ 531.00
Florida Department of Transportation $ 130.00 $ 1,142.47
Pennsylvania Department of Transportation $ 350.00 $ 8,450.00
Other
Florida Department of Transportation $ 750.00 $ 6,500.00
Maryland Department of Transportation $ 1,000.00 $ 17,586.00
North Carolina Department of Transportation $ 3,200.00 $ 12,630.00

69
Figure 15: Comparison of three design fee estimates
Proposed Contingency Estimating Method
This method is intended to be used with a variety of design cost estimating models. The
database is used to find the absolute difference of each of the estimated design cost for each
project and the budgeted design cost (both as a percentage of budgeted construction cost) and
divide by the budgeted design cost. This will become the design cost estimate accuracy index
(DCEAI) shown in Equation 12.
| |
Equation 12
DCEAI – Design cost estimate accuracy index
BDC% - Budgeted design cost as a percent of construction cost
EDC% - Estimated design cost as a percent of construction cost
BDC – Budgeted Design Cost ($Millions)
Contingency

70
The DCEAI represents the percent per million dollars variation of the budgeted and the
estimate. This is plotted on a scatter graph against the budgeted design cost and the best fit
trendline with the highest coefficient of determination (R2) for the data set is found. Figure 16
shows that for both the ASCE and IPENZ model a power equation was the best fit curve for
both.
Figure 16: Design cost estimate accuracy index trend plot
For a given estimated construction cost both ASCE and IPENZ methods were used to
determine a budgeted design cost percentage, which was converted to a budgeted construction
cost. The equation of the trendline is used to determine the DCEAI for a project of any size with
in the available data range. In the above example the data on included projects with a maximum
budgeted design cost of $3.25 million and a budgeted construction cost of $27.5 million. The
model is only validated within this cost range if more data was available the model could include
a greater cost range.

71
For any given budgeted construction cost the estimated design cost is extrapolated from
the design cost model. The equation from the graph in Figure 16 is used to determine the DCEAI
for a given the estimated design cost.
The DCEAI is multiplied by the budgeted design cost to generate the design contingency
for the project. Figure 17 shows the design contingency for both the ASCE and IPENZ models it
is noted that the models contingency are progressing in opposite directions, this represents the
difference in accuracy of the two models are the project cost increases. Both models display a
very strong logarithmic relationship as the R2 values in each case is above 0.99 shows that the
contingency amounts when added to the design fee from the ASCE and IPENZ curves almost
exactly match the actual design costs. To insure that this result is not viewed to be more
definitive that it is, the reader must keep in mind that the model is retroactive and would be
expected to have a high correlation.
Figure 17: The results of the design contingencies for ASCE and IPENZ design fee curves

72
CONCLUSIONS
All good estimates have a contingency built in to account for the uncertainty of the tasks
to be performed. The method provided in this study is meant to furnish a means to calculate the
required construction contingency for design cost estimate as an alternative to choosing a
random number or using an arbitrary percentage. An index that relates the variation in design
estimate to budgeted design cost for projects to calculate a contingency design of future projects.
The model can only be used within ranges of the budgeted cost data used to develop it.
As budgeted cost database increases the accuracy of curves and design cost estimate accuracy
index is expected to increase improving the contingency estimate. The implementation of this
method will also encourage DOTs to accurately record design cost data for projects into the
future. In the example there was a strong correlation between the design cost estimate accuracy
index and the budgeted design cost confirming that the method is acceptable and proving the
relationship exists. In the future this method should be tested with a larger dataset over a wider
range of project sizes. The model concluded that the contingency for the two estimating methods
tested progressed inversely exposing the difference in the estimating methods. It is expected that
agencies will apply the method using individual estimating techniques to determine the
applicable contingency for each project. Agencies must remember that estimates need to be
tailored to individual project and the demands of each contract and that the contingency is for
unknown unknowns not for known activities.

73
CHAPTER 6—CONSOLIDATED CONCLUSIONS AND LIMITATIONS
CONCLUSIONS
There are two types of estimates that need to be considered for PCS cost estimating: top-
down and bottom-up estimates. The decision to use either of these estimates depends on the end
user of the data and the scope definition at the time of the estimate. Figure 2 provides a
framework for when to use the estimating methods and at what point in the project development
timeline. The type of PCS cost estimating model is also dependent on the available information
and project characteristics. The study showed the three factors that had the largest influence on
PCS costs were:
Complexity
Construction cost
Project type
If these factors can be identified early on in the project development process, they can be
used to determine suitable past projects with similar qualities. These factors can also act as input
variables for PCS cost estimating models.
Hegazy (1998) provides a detailed methodology to create a simple NN model that can be
built in a spreadsheet and this paper has demonstrated the application Hegazy’s methodology to
produce a PCS cost estimate. After training the NN model, the between predicted and actual
project PCS cost was reduced from 99.6% to 1.4%. This leads to the conclusion that NNs are
well suited for use in PCS cost estimating as they can be trained and easily adjusted as new data
becomes available.
Iowa DOTs project classification process was also investigated and found to provide a
comprehensive three level classification system to define a project based on its complexity.
Project complexity was shown in Chapter 3 to have a major influence on the PCS cost estimate.
Therefore it is concluded that projects can be classified using the Iowa DOT classification
system.

74
Finally it is recommended that each project complexity type should have its own NN-
based PCS cost estimating model compiled of like projects to improve estimate accuracy. As
with all models that require historic data the model is only valid within the parameters in which
it was created and must be continually revised and updated to ensure the output remains current.
All good estimates have a contingency built in to account for the uncertainty of the tasks
to be performed. The method provided in this study is meant to furnish a means to calculate the
required construction contingency for design cost estimate as an alternative to choosing an
arbitrary number or percentage. An index that relates the variation in design estimate to budgeted
design cost for projects to calculate a contingency design of future projects.
As budgeted cost database increases the accuracy of curves and design cost estimate
accuracy index is expected to increase improving the contingency estimate. The implementation
of this method will also encourage DOTs to accurately record design cost data for projects into
the future. In the example there was a strong correlation between the design cost estimate
accuracy index and the budgeted design cost confirming that the method is acceptable and
proving the relationship exists. In the future this method should be tested with a larger dataset
over a wider range of project sizes. The model concluded that the contingency for the two
estimating methods tested progressed inversely exposing the difference in the estimating
methods. It is expected that agencies will apply the method using individual estimating
techniques to determine the applicable contingency for each project. Agencies must remember
that estimates need to be tailored to individual project and the demands of each contract and that
the contingency is for unknown unknowns not for known activities.
LIMITATIONS
For every research study, there are limitations. In Chapter 3, the limitations of the
research were that the results of interviews with nine DOTs. As explained in the methodology
the states were chosen to provide a variety it was observed that cost estimating practices vary
greatly among DOTs and within each agency.
The limitations in Chapter 4 deal with the case studies themselves. In Chapter 4 there
were 16 case study projects collected and used in the NN model. It must be stressed that the

75
model is only valid within the data that it was built. This is why it has been suggested that
projects are classified by their complexity and separate models are built for each type. It is also
important that each DOT choses input factors that affect the PCS cost in their state.
Chapter 5 provided a methodology to estimate the design cost contingency for a project
not a direct estimate. This methodology need to be applied to historic data and estimating
systems of a specific agency to render it valid for use. The method can only be used to estimate
the contingency within the range of historic data used to construct the model. The data used in
this study was from nine agencies and provides only a demonstration of the method not actual
results. The model can only be used within ranges of the budgeted cost data used to develop it.

76
CHAPTER 7—CONTRIBUTIONS AND RECOMMENDATIONS FOR FUTURE
RESEARCH
CONTRIBUTIONS
Chapter 3 provided the base for this research because it synthesized the current practices
in the industry and set up a framework for estimating PCS costs. Chapter 3 also determined the
factors that are considered to have a major influence on PCS costs. These were complexity
project type and construction cost. Previous research in highway cost estimating related
predominantly to construction cost estimating with some about design cost estimating. This
research presents the case for estimating PCS cost and Chapter 4 presents a method to do this
using and artificial NN model, the first time NNs have been applied to PCS cost estimating.
Chapter 5 proposed a method to estimate design cost contingency which to the author’s best
knowledge has never been addressed by any past research. The interviews in this project
indicated that a design contingency was a very small part of the total project costs and therefore,
it was considered trivial, which supplies the answer to why no previous research has been
conducted on the topic. As described in Chapter 5, the concept that underfunding design merely
creates a bias to poor quality construction documents which in turn have been proven by past
research to be the root cause of construction cost growth.
RECOMMENDATIONS FOR FUTURE RESEARCH
Chapter 3 came up with 3 models for PCS cost estimates at different stages of the project
development process. Further investigation into the models one and three shown in Figure 5 and
how they all relate to each other is required.
This research provides a NN model that can be easily produced to estimate PCS costs.
Future research could be conducted to access the validity of estimating methods such as multiple
regression and decision tree analysis compared to NN. Further analysis could be done using a
database of projects divided into complexity groups within one DOT to further validate the
conclusions in chapter 4. It would also be useful for future research to investigate the effect of
different association functions on the NN model.

77
BIBLIOGRAPHY
Aleksander Igor., Morton, Helen., (1990) “An Introduction to Neural Computing” Chapman and
Hall New York.
Allison, P. D. Multiple regression: A primer. Pine Forge Press, Inc., Thousand Oaks, 1999.
Alshanbari, H. (2010). “Impact of Pre-Construction Project Planning on Cost Savings,” Master
of Science Thesis, University of Florida, 52pp.
Anderson, S., Molenaar, K., and Schexnayder, C. (2007). Guidance for Cost Estimation and
Management for Highway Projects during Planning, Programming, and Preconstruction,
NCHRP Report 574, Transportation Research Board, Washington, D. C.
Arizona Department of Transportation (ADOT) (2014) “Transportation Enhancement Project
Development Process” URL: http://www.azdot.gov/docs/business/project-development-
process.pdf?sfvrsn=0. (March 2013).
ASCE Task Committee for the Update of Manual 45. How to Select and Work Effectively with
Consulting Engineers - Getting the Best Project. American Society of Civil Engineers.
2012. pp: 35-56.
http://www.knovel.com/web/portal/browse/display?_EXT_KNOVEL_DISPLAY_bookid
=5555&VerticalID=0
Association for the Advancement of Cost Engineering, International (AACEI) (2010). Basis of
Estimate Recommended Practice 34R–05, AACEI, Morgantown West Virginia p.2.
Association of Consulting Engineers New Zealand and Institute of professional Engineers New
Zealand.(IPENZ) Fee Guidelines for Consulting Engineering Services. January 2004
URL:http://www.ipenz.org.nz/ipenz/practicesupport/endorsedinfo/BE_feeguide.pdf.
Bajaj, A., D.D. Gransberg, and M.D. Grenz, “Parametric Estimating for Design Costs” 2002
Transactions, AACE, Int’l, Portland, Oregon, June 2002, pp. EST.08,01 – EST.08.06.
Beemer, J. (2005). “The cost of perfection in public works projects: a design professional’s
perspective,” American Council of Engineering Companies, Government Advocacy,
http://www.acec.org/advocacy/pdf/ tcop_2006-04-20.pdf (July 10, 2006).
Brown, J.T. (2002). “Controlling costs using design quality workshops,” 2002 Transactions,
AACEI, Washington, DC, CSC.10.1 – CSC 10.9.

78
Brunsman, A., K.F. Robson, and D.D. Gransberg, ““Parametric Estimating for Environmental
Remediation Projects,” 2008 Transactions, AACE, International, Toronto, Ontario,
Canada, July 2008, pp EST.06.1-EST.06.8.
Bubshait, A.A., Al-Said, F.A. and M.M. Abolnour (1998). “Design fee versus design
deficiency,” J. of Arch Engrg, ASCE, 4(2), 44–46.
Burati, J.L., J.J. Farrington, and W.B. Ledbetter (1992). “Causes of quality deviations in design
and construction,” J. of Constr. Engrg. And Mgmt, ASCE, 118(1), 34-36.
Carr, P. G., and Beyor, P. S. Design Fees, the State of the Profession, and a Time for Corrective
Action. Journal of Management in Engineering. Vol, 21 Issue 3 2005. Pp.110-117.
Chelst, K., and Y. B. Canbolat. Value Added Decision Makings for Managers. CRC Press, Boca
Raton, 2012.
Colorado Department of Transportation (CDOT), Project Development manual Jan 31 2013
Section 1: Scoping budgeting and programming
http://www.coloradodot.info/business/designsupport/bulletins_manuals/project-
development-manual/2013-project-development-manual/05-pdm-sect-1-scoping.pdf/view
Accessed on 02/2014.
Construction Management Association of America (CMAA) (2003). “Speed, communication,
and commissioning issues are top owner concerns, FMI/CMAA survey finds.”
http://cmaanet.org/owners_survey.php, (June 24, 2006).
Deis, D., Schneider, H., Wilmot, C., and Coates C. (2004). “A Simulation Approach To In-
House Versus Contracted Out Cost Comparisons,” J. of Public Procurement, 4(1), 43–66.
Eisenhardt, K. M. "Better Stories and Better Constructs: The Case for Rigor and Comparative
Logic." Academy of Management Review, 16(3), 1991, pp.620-627.
Flyvbjerg, B., Holm, M., and Buhl, S. (2002). “Underestimating costs in public works projects:
Error or lie?” J. Am. Plan. Assn., 68(3), 279–295.
Government Accountability Office (GAO) (2008) “Increased Reliance on Contractors Can Pose
Oversight Challenges for Federal and State Officials” Publicly Released: Jan 8, 2008.
Government Accounting Office (GAO) (1991) Using Structured Interviewing Techniques,
GAO/PEMD-10.1.5, Government Accounting Office, Washington, D.C., June 1991,
191pp.

79
Gransberg, D.D. and K.R. Molenaar, “Does Design-Build Project Delivery Affect the Future of
the Public Engineer?” Transportation Research Record 2081, Journal of the
Transportation Research Board, National Academies, December 2008, pp. 3-8
Gransberg, D.D., and M.E. Villarreal (2002). “Construction Project Performance Metrics” 2002
Transactions, AACE, International, Portland, Oregon, pp. CSC.02.01-CSC.02.05.
Gransberg, D.D., C. Lopez del Puerto, and D. Humphrey. “Relating Cost Growth from the Initial
Estimate Versus Design Fee for Transportation Projects,” Journal of Construction
Engineering and Management, ASCE, Vol. 133 (6), June 2007, pp. 404–408.
Hegazy, T., Ayed, A., Neural Network Model for Parametric Cost Estimation of Highway
Projects. American Society of Civil Engineers, Journal of Construction Engineering and
Management., Vol. 124 (3), 1998, pp.210–218
Hegazy, T., Moselhi, O., and Fazio, P. Developing Practical Neural Network Application Using
Backpropergation. American Society of Civil Engineers, Computer-Aided Civil and
Infrastructure., Vol. 9 (2), 1994, pp.145–159
Hollar, D.A. “Predicting Preliminary Engineering Costs for Highway Projects” North Carolina
State University, Raleigh North Carolina 2011.
Janacek, J. (2006). “Construction costs going through the roof?” Presentation, 2006 Public
Works Officer Institute, Los Angeles, California.
Kirby, J.G., D.A.Furry, and D.K.Hiks (1988). “Improvements in design review management.” J.
of Constr. Engrg. and Mgmt, ASCE, 114(1), 69-82.
Konchar, M. And Sanvido, V. (1998). “Comparison of U.S. Project Delivery Systems,” J of
Constrn Engrg and Mgmt, ASCE,124(6), 435–444.
Larson E.W Gray C.F, (2011) Project management the managerial process fifth edition chapter
5 Estimating Project Times and Costs McGraw Hill.
Liu, M., Hummer, J., Rasdorf, W., Hollar, D., Parikh, S., Lee, J., Gopinath, S. (2010).
Preliminary Engineering Cost Trends for Highway Projects Research Report
FHWA/NC/2010-10, North Carolina Department of Transportation Raleigh, North
Carolina, 133pp.
Mak, S. and D. Picken, Using Risk Analysis to Determine Construction Project Contingencies.
American Society of Civil Engineers, Journal of Construction Engineering and
Management., Vol. 126 Issue 2, 2000, pp.130–136

80
McGeorge, J.F. (1988). “Design productivity: a quality problem.” J. of Mgmt in Engrg, ASCE,
21(3), 110–117.
McSkimming, J., B. Peck, B. Hoy, and S. Carr (2005). “The quality of design documents: what
can the cm do?” CMAA forum on quality of design documents, May, 2005.
http://cmaanet.org/user_images/forum.quality_of_design_documents_-_mcskimming.pdf,
(January 5, 2013).
Mendez, V., “Every Day Counts: Innovation Initiative,” Federal Highway Administration,
Washington, DC, 2010, p.1-2.
Molenaar, K. “Programmatic Cost Risk Analysis for Highway Megaprojects.”: American
Society of Civil Engineers, Journal of Construction Engineering and Management.,
Vol.131, Issue 3, 2005, pp. 343–353.
Moore, W.B. and J.A. Hawkins (1990). Cost-Competitive Construction Management: A Review
of Corps of Engineers Construction Management Costs, Logistics Management Institute
Report AR603R3, Bethesda, Maryland, 86pp.
Morgen, E.T. (1986). Claims by the federal government against its A/E – Guidelines for
improving practice. Office for Professional Liability Research, Victor O. Schinner and
Co., Washington, D.C.
Moselhi, O., Hegazy, T. and Fazio, P., Potential Applications of Neural Networks in
Construction Canadian Journal of Civil Engineering, 1992, Vol.19(3), pp.521-529
National Society of Professional Engineers (NSPE) (1999). “Qualifications Based Selection
Issue Paper,” NSPE Issue Briefs, http://www.nspe.org/govrel/gr2%2D4022.asp (July 9,
1999).
New York State Department of Transportation (NYSDOT) “Project Development Manual.”
Chapter 2 – Project Development Overview. January 2004.
Ohio Department of Transportation (Ohio DOT) (2014) “ODOT’s Project Development Process
~ A Phased Approach”. URL: http://www.dot.state.oh.us/projects/pdp/Pages/Path-
Views.aspx. (March 2013)
Ott, L., and M. Longnecker. An introduction to statistical methods and data analysis. 6th
Ed.,
Pacific Grove, Duxbury, 2010.
Oxford University Press, Oxford English Dictionary,
http://oxforddictionaries.com/definition/english/design?q=design, Accessed July 27 2013.

81
Reiss, R., R. Gordon, L. Neudorff, and J. Harding. Integrated Corridor Management Phase I
Concept Development and Foundational Research: Task 3.1 Develop Alternative
Definitions. Publication FHWA-JPO-06-034. FHWA, U.S. Department of
Transportation, 2006.
Riverside County, Estimating guidelines for roadway construction projects, Transportation
Department, County of Riverside, Riverside, California, 1999, p.8.
Sayad, Saed., (2012), “Artificial Neural Network”,
(http://www.saedsayad.com/artificial_neural_network.htm) Accessed on (04/01/2014)
Sturts, C.S. and F.H Griffis, Pricing Engineering Services, American Society of Civil Engineers,
Journal of Management in Engineering. Vol. 21 Issue 2, 2005, pp. 56–62.
Task Committee for the Update of Manual 45 (Manual 45). How to Select and Work Effectively
with Consulting Engineers - Getting the Best Project. American Society of Civil
Engineers. 2012. pp: 35-56.
Texas Council of Engineering Companies, (TCEC), (2005) “Selection of a Consulting
Engineer,” [WWW document] URL http://www.cectexas.org/selprof.htm, (August 5,
2005)
Touran, A., D.D. Gransberg, K.R. Molenaar, K. Ghavamifar, D.J. Mason, and L.A. Fithian. A
Guidebook for the Evaluation of Project Delivery Methods, TCRP Report 131,
Transportation Research Board, National Academies, Washington, D.C., ISBN: 978-0-
30911779-1, 2009, 112pp.
Touran, A., D.D. Gransberg, K.R. Molenaar, P. Bakshi, and K. Ghavamifar. A Guidebook for the
Selecting Airport Capital Project Delivery Methods, ACRP Report 21, Transportation
Research Board, National Academies, Washington, D.C., ISBN: 978-0-309-11804-0,
2009, 101pp.
United States Census Bureau (2014). “State and County Quick Facts” URL:
http://quickfacts.census.gov/qfd/index.html (January 2014).
US Army Corps of Engineers (USACE). Engineering instructions construction cost estimates,
CEMP-E/CECW-E EI 01D010, US ACE, Washington, D.C., 1997, p.121
West, N.J.N., and D.D. Gransberg (2012). “Quantifying the Value of Construction Contractor
Preconstruction Involvement,” First Australasia and South East Asia Structural
Engineering and Construction Conference (ASEA-SEC-1) Perth, Australia.
82
Western Federal Lands Highway Division (WFLHD) (2007) Project Development Process Flow
Chart. U.S. Department of Transportation, Federal Highway Administration. September
2007.
Williams, T. P., N. Parker, and J. Klotz. Development of an Estimating Tool for Transportation
Project Design Effort. Transportation Research Board, 2013 Annual Meeting. 2013.
Worth, R., Miller, K., Handley, S., C. Lopez del Puerto, and D.D. Gransberg. Design-Build
Services: A Marketing and Business Development Handbook, BNi Building News, ISBN
0978155-70-1, 2009, 230pp.
Yin, R. Case Study Research: Design and Methods. Sage, New York. 2008, 176pp.

83
APPENDIX A—PROJECT DEVELOPMENT PROCESSES
The following 4 figures are project development processes from 4 different transportation
agencies. The project development processors were synthesized to create a generalized project
development process for the preconstruction services phase of a project.
Figure A-1. Arizona DOT project development process (ADOT 2014)
Figure A-2. Ohio DOT project development process (Ohio DOT 2014)

84
Figure A-3. Western Federal Lands Highway Division project development process
(WFLHD 2007)

85
Figure A-4. New York State DOT project development process (NYSDOT 2004)

86
APPENDIX B—CASE STUDY WRITE UPS
The following is a full write up of the nine agency case study interviews on
preconstruction service (PCS) cost estimating practices. All write ups are completed with the
same template so they can be easily compared. Chapter 2 of the report contains a synthesized
version of these case studies.
Agency: Caltrans
Location: Sacramento, California
General information: Caltrans yearly construction budget is approximately $13-$15
Billion and they are awarded approximately 364 construction projects per year. Approximately
60% of all annual projects are federally funded with the remaining 40% non-federally funded.
Project monetary size ranges from $50 thousand to $3.5 Billion. The average monetary size of a
new construction project is $2 - $5 Million.
In-House data collection: Caltrans does record in-house preconstruction services (PCS)
hours on a per project basis. They record these hours using the engineer’s timesheets. The data
recorded on these times sheets is rated a 3 out of 5 on the scale of accuracy. Caltrans does
allocate in-house overhead cost to a specific project. These costs are allocated as a % annual rate
with a functional rate at 35% - 40% and an administrative rate at 20%-30%. Caltrans uses data
collected from past projects to estimate the PCS cost for future projects. However, the PIPE scan
system is used as a starting point. Current methods used to estimate PCS costs for a project
include a direct estimate of hours as well as the use of an average % support to cap ratio.
Outsourcing data collection: Caltrans contracts out 10% of PCS work. They have a
standing contract for a GEC. Each district has their own separate on call staff. Caltrans can
perform the entire preconstruction process in-house and they also outsource all PCS except
advertisement for bids, evaluation of bids, and award of contract. It is rare for Caltrans to
outsource PCS concerning cost estimate, ROW plans, and ROW utility acquisition and
relocation.
Caltrans performs 90% PCS in-house and 10% is outsourced. The main reason why they
outsource PCS is due to policies, staff availability, as well as special expertise. Caltrans does not
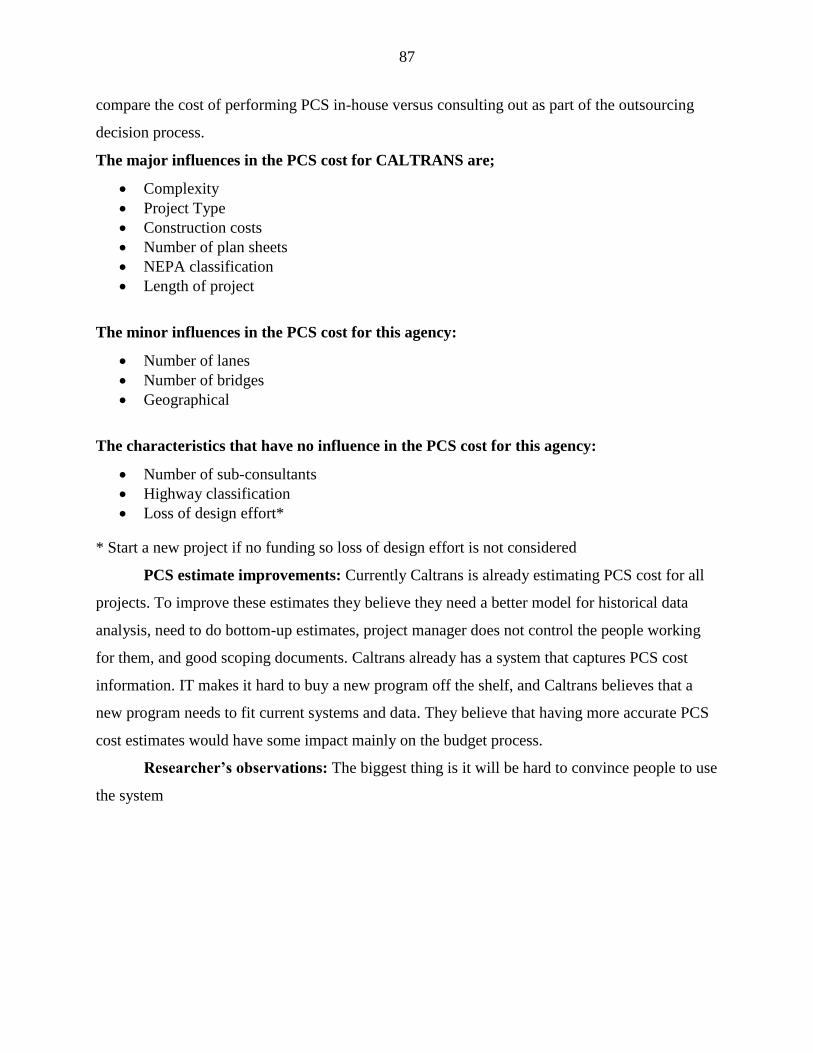
87
compare the cost of performing PCS in-house versus consulting out as part of the outsourcing
decision process.
The major influences in the PCS cost for CALTRANS are;
Complexity
Project Type
Construction costs
Number of plan sheets
NEPA classification
Length of project
The minor influences in the PCS cost for this agency:
Number of lanes
Number of bridges
Geographical
The characteristics that have no influence in the PCS cost for this agency:
Number of sub-consultants
Highway classification
Loss of design effort*
* Start a new project if no funding so loss of design effort is not considered
PCS estimate improvements: Currently Caltrans is already estimating PCS cost for all
projects. To improve these estimates they believe they need a better model for historical data
analysis, need to do bottom-up estimates, project manager does not control the people working
for them, and good scoping documents. Caltrans already has a system that captures PCS cost
information. IT makes it hard to buy a new program off the shelf, and Caltrans believes that a
new program needs to fit current systems and data. They believe that having more accurate PCS
cost estimates would have some impact mainly on the budget process.
Researcher’s observations: The biggest thing is it will be hard to convince people to use
the system

88
Agency: Colorado Department of Transportation (CDOT)
Location: Denver, Colorado
General information: CDOT yearly construction budget is approximately $500 - $700
million and they award approximately 180 construction projects per year. 85% -90% of all
annual projects are federally funded. Project monetary size ranges from $150 thousand to $100
million. The average monetary sized of a new construction project is $1.5 - $1.6 million.
In-House data collection: CDOT does not record in-house preconstruction services
(PCS) hours on a per project basis. Whether the cost is recorded depends on the type of the
project. For federally funded projects they need to submit and independent project cost estimate
in this case 10% is assumed. For bridge enterprise and larger projects the will collect all costs.
They record these hours using the engineer’s timesheets. The data recorded on these times sheets
is expected to be 60% accurate. CDOT does allocate in-house overhead cost to a specific project.
Their current organizational indirect rate of 20% is evaluated every year and distributed across
the multiple phases of the project. CDOT does not use data collected from past projects to
estimate the PCS cost for future projects. They use standard percentages of estimated
construction cost to estimate PCS hours.
Outsourcing data collection: CDOT does contract out PCS. They have a standing
contract for geotechnical and environmental consultants (GEC). CDOT can perform the entire
preconstruction process in-house. Or they can outsource all PCS except advertisement for bids,
evaluation of bids, and award of contract.
CDOT performs 45% PCS in-house and 55% is outsourced (by number of projects). The
main reason why they outsource PCS is due to staff availability and special expertise. They do
not have and regulations on how much they can or shall outsource. They have to have
justification to outsource projects. CDOT does not compare the cost of performing PCS in-
house versus consulting out as part of the outsourcing decision process. The decision to whether
outsource or not is mainly based on the availability of staff and in-house capabilities.
The major influences in the PCS cost for CDOT are;
Complexity
Construction costs*
NEPA classification
Political elements (i.e. high visibility project)
Schedule drivers
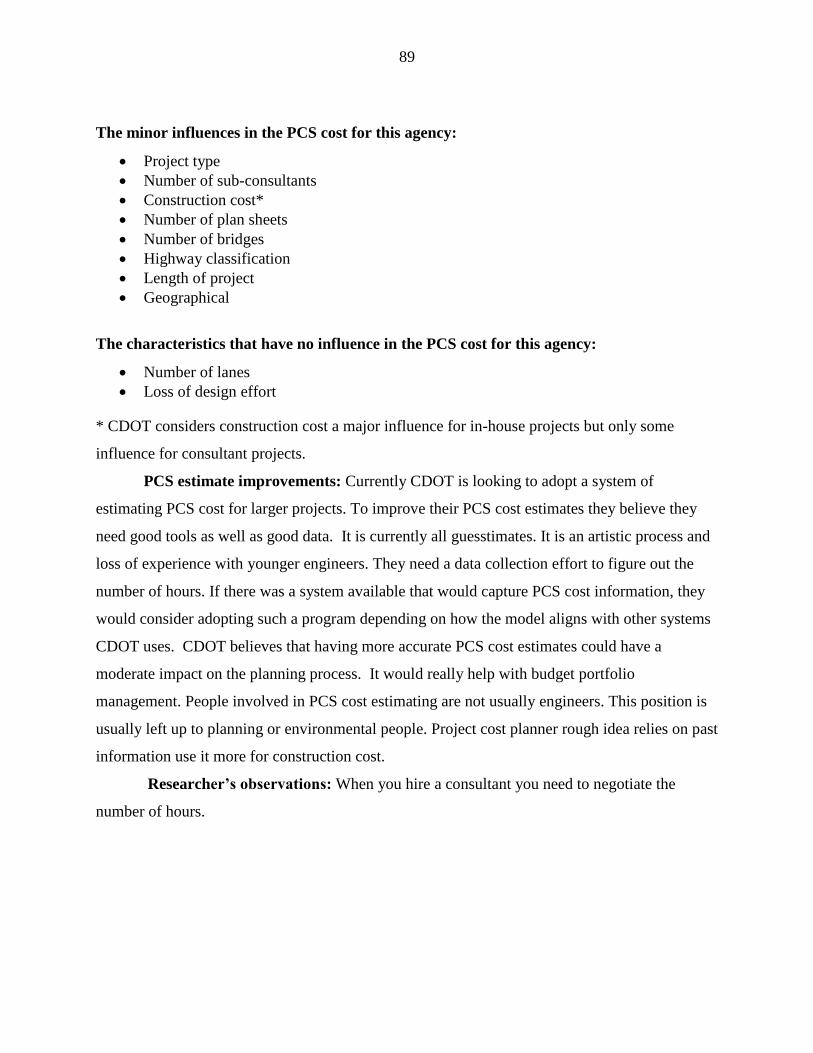
89
The minor influences in the PCS cost for this agency:
Project type
Number of sub-consultants
Construction cost*
Number of plan sheets
Number of bridges
Highway classification
Length of project
Geographical
The characteristics that have no influence in the PCS cost for this agency:
Number of lanes
Loss of design effort
* CDOT considers construction cost a major influence for in-house projects but only some
influence for consultant projects.
PCS estimate improvements: Currently CDOT is looking to adopt a system of
estimating PCS cost for larger projects. To improve their PCS cost estimates they believe they
need good tools as well as good data. It is currently all guesstimates. It is an artistic process and
loss of experience with younger engineers. They need a data collection effort to figure out the
number of hours. If there was a system available that would capture PCS cost information, they
would consider adopting such a program depending on how the model aligns with other systems
CDOT uses. CDOT believes that having more accurate PCS cost estimates could have a
moderate impact on the planning process. It would really help with budget portfolio
management. People involved in PCS cost estimating are not usually engineers. This position is
usually left up to planning or environmental people. Project cost planner rough idea relies on past
information use it more for construction cost.
Researcher’s observations: When you hire a consultant you need to negotiate the
number of hours.

90
Agency: Iowa Department of Transportation (Iowa DOT)
Location: Ames, Iowa
General information: Iowa DOT yearly construction budget is approximately $400
Million and they award approximately 500 – 600 construction projects per year.
In-House data collection: Iowa DOT does record in-house preconstruction services
(PCS) hours on a per project basis. They record these hours using the engineer’s timesheets. The
data recorded on these times sheets is rated a 4 out of 5 on the scale of accuracy. Iowa DOT does
not allocate in-house overhead cost to a specific project. The Iowa DOT does not use data
collected from past projects to estimate the PCS cost for future projects. They do not estimate
PCS cost for a project.
Outsourcing data collection: Iowa DOT does contract out PCS. The Iowa DOT can use
both in-house and on call consultants they do also use other consultants but only for larger less
common projects, they do not have overall GEC contracts. Iowa DOT can perform the entire
preconstruction process in-house and it also outsources all PCS except advertisement for bids,
evaluation of bids and award of contract.
The main reason why they outsource PCS is due to staff availability, special expertise
and timeline for design. They do not have and regulations about how much it can or shall
outsource however they cannot exceed the annual budget for outside services. The Iowa DOT
does not compare the cost of performing PCS in-house versus consulting out as part of the
outsourcing decision process.
The major influences in the PCS cost for Iowa DOT are;
Complexity
Project Type
Construction costs
Number of plan sheets
NEPA classification
Length of project
The minor influences in the PCS cost for this agency:
Number of lanes
Number of sub-consultants
Number of bridges
Geographical – (Soils on west side of state)

91
The characteristics that have no influence in the PCS cost for this agency:
Highway classification
PCS estimate improvements: Currently Iowa DOT is not estimating PCS cost for
projects but it is looking to adopt this in the future. To improve these estimates they believe they
need to learn how to use the data they already have. Iowa DOT has been capturing PCS hours for
a few years now and they need a way to organize this data so that is useful in PCS estimating. If
there was a system available to help capture agencies PCS cost Iowa DOT would consider
adopting it.
Iowa DOT think that having a more accurate estimate of PCS would have a large impact
on the planning process for the agency. Would allow the agency to budget staff time would be
good to know the number of hours per task and to compare these to consultant design hours.
Researcher’s observations:
Iowa DOT wants to capture costs that are useful to each area, can’t be useful to both
planning and design. Would like a model that is split up by function or by office.

92
Agency: Maryland (MSHA)
Location: Annapolis, Maryland
General information: MSHA yearly construction budget is approximately $600-800
Million and they award approximately 300 – 350 construction projects per year. Project
monetary size ranges from $1Million to $150 Million. Average monetary size of a new
construction project is approximately $25 Million.
In-House data collection: MSHA does record in-house preconstruction services (PCS)
hours on a per project basis. They record these hours using time tracking software. The data
recorded on these times sheets is rated a 4.5 out of 5 on the scale of accuracy. MSHA does
allocate in-house overhead cost to a specific project. The MSHA uses data collected from past
projects along with standard percentages to estimate the PCS cost for future projects. The old
system used 15% of the construction cost as preliminary engineering, they now use a cure based
system on preliminary engineering.
Outsourcing data collection: MSHA does contract out PCS. They have a standing
contract for a GEC. MSHA can perform the entire preconstruction process in-house and it also
outsources all PCS except ROW utility acquisition and relocation, advertisement for bids,
evaluation of bids, and award of contract.
The main reason why they outsource PCS is due to staff availability and special
expertise. They do not have regulations on how much they can or shall outsource. The MSHA
does not compare the cost of performing PCS in-house versus consulting out as part of the
outsourcing decision process.
The major influences in the PCS cost for MSHA are;
Complexity
Project Type
Construction costs
The minor influences in the PCS cost for this agency:
Number of sub-consultants
Number of lanes
Number of plan sheets
National Environmental Policy Act (NEPA) classification
Number of bridges
Length of project

93
Geographical
Loss of design effort
Innovation
New Technology
PDM
The characteristics that have no influence in the PCS cost for this agency:
Highway classification
PCS estimate improvements: Currently MSHA is already estimating PCS cost for all
projects. To improve these estimates they believe they need to develop a historical database of
previous estimates. MSHA believe that having more accurate PCS cost estimates would have a
large impact on the planning process as they believe that it would provide more efficiency to
managing funds.
Researcher’s observations: Historical projection is incorporated into project factors
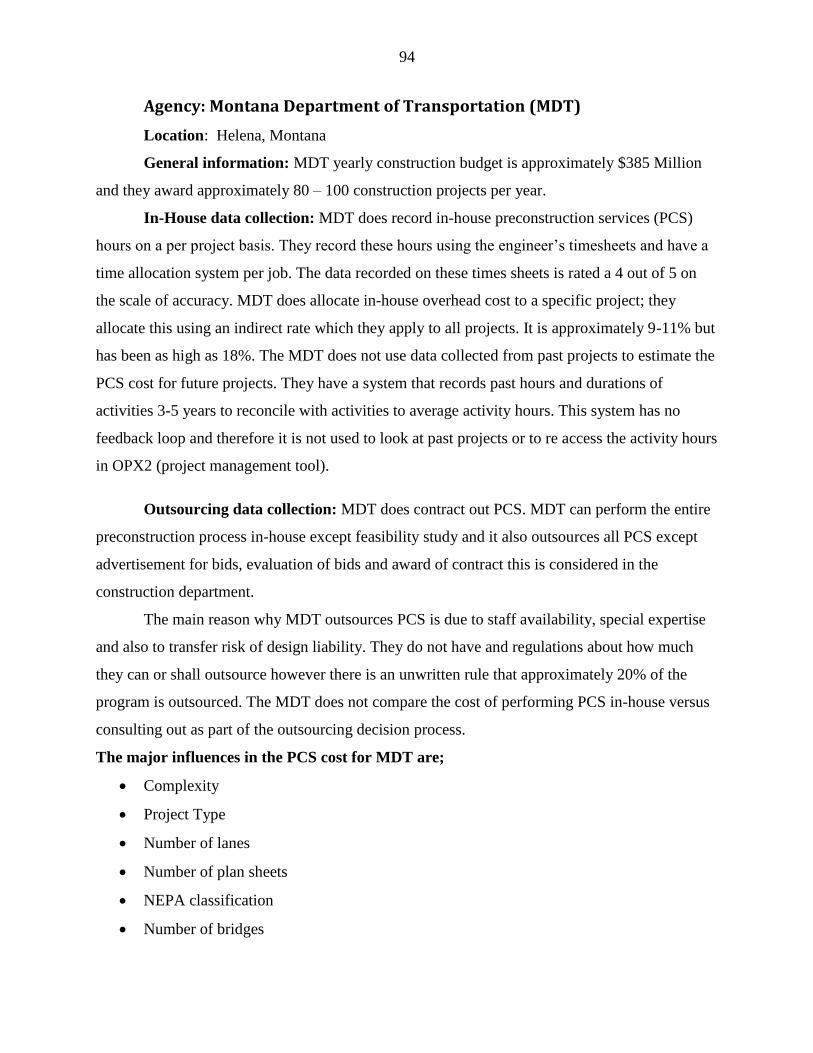
94
Agency: Montana Department of Transportation (MDT)
Location: Helena, Montana
General information: MDT yearly construction budget is approximately $385 Million
and they award approximately 80 – 100 construction projects per year.
In-House data collection: MDT does record in-house preconstruction services (PCS)
hours on a per project basis. They record these hours using the engineer’s timesheets and have a
time allocation system per job. The data recorded on these times sheets is rated a 4 out of 5 on
the scale of accuracy. MDT does allocate in-house overhead cost to a specific project; they
allocate this using an indirect rate which they apply to all projects. It is approximately 9-11% but
has been as high as 18%. The MDT does not use data collected from past projects to estimate the
PCS cost for future projects. They have a system that records past hours and durations of
activities 3-5 years to reconcile with activities to average activity hours. This system has no
feedback loop and therefore it is not used to look at past projects or to re access the activity hours
in OPX2 (project management tool).
Outsourcing data collection: MDT does contract out PCS. MDT can perform the entire
preconstruction process in-house except feasibility study and it also outsources all PCS except
advertisement for bids, evaluation of bids and award of contract this is considered in the
construction department.
The main reason why MDT outsources PCS is due to staff availability, special expertise
and also to transfer risk of design liability. They do not have and regulations about how much
they can or shall outsource however there is an unwritten rule that approximately 20% of the
program is outsourced. The MDT does not compare the cost of performing PCS in-house versus
consulting out as part of the outsourcing decision process.
The major influences in the PCS cost for MDT are;
Complexity
Project Type
Number of lanes
Number of plan sheets
NEPA classification
Number of bridges
95
Length of project
Geographical
Loss of design effort
ROW and utilities
The characteristics that have no influence in the PCS cost for this agency:
Number of sub-consultants
Construction costs
Highway classification
PCS estimate improvements: Currently MDT is already estimating PCS cost for all
projects. To improve these estimates they believe they need to get to function based estimating
and also need to determine how to allocate the funds in split corridor projects. MDT also believe
that they need to improve how they capture the hours on the time sheets.

96
Agency: New York State Department of Transportation (NYSDOT)
Location: Albany, New York
General information: NYSDOT yearly construction budget is approximately $1 billion
and they award approximately 300 – 350 construction projects per year.
In-House data collection: NYSDOT does record in-house preconstruction services
(PCS) hours on a per project basis. They record these hours using the engineer’s timesheets. The
data recorded on these times sheets is rated a 4.5 out of 5 on the scale of accuracy. NYSDOT
does allocate in-house overhead cost to a specific project. The NYSDOT uses data collected
from past projects to estimate the PCS cost for future projects. They use an in-house system
called DPR which contains a selection of tools to estimate PCS hours. NYSDOT are looking to
move to primavera P6 software resource allocation model to help estimate hours PCS.
Outsourcing data collection: NYSDOT does contract out PCS. When design for a
project is performed in-house they use on call contracts for the environmental sampling and
testing and survey services but they do not have overall GEC contracts. NYSDOT can perform
the entire preconstruction process in-house except services stipulated above and it also
outsources all PCS except advertisement for bids, evaluation of bids and award of contract.
NYSDOT performs 50% PCS in-house and 50% is outsourced by dollar value and 90%
to 10% by project number. The main reason why they outsource PCS is due to staff availability
and special expertise. They do not have and regulations about how much they can or shall
outsource however they have quarterly meetings with consultants to ensure there is enough work
in the industry. Design staff for NYSDOT are unionized. Most consultant work for NYSDOT
happens in the southern region in and around New York City and Long Island. The NYSDOT
does not compare the cost of performing PCS in-house versus consulting out as part of the
outsourcing decision process.
The major influences in the PCS cost for NYSDOT are;
Complexity
Project Type
Construction costs
Number of lanes
NEPA classification
Number of bridges
Length of project
Geographical

97
Inflation
The minor influences in the PCS cost for this agency:
Highway classification
The characteristics that have no influence in the PCS cost for this agency:
Number of sub-consultants
Number of plan sheets*
The NYSDOT also noted that loss of design effort is considered rare they had problems
when they shifted to preservation mode 3 years ago. A lot of reconstruction was shifted later in
program (~10 years) and preservation was adopted.
* Electronic plan sheets mean that you can produce more but it no longer directly reflects
the level of work put into the design like it did in the past when cad and other modeling software
wasn’t used.
PCS estimate improvements: Currently NYSDOT is already estimating PCS cost for all
projects. To improve these estimates they believe they need to get to task estimating however
they are skeptical about whether the time, effort and cost of this would be add any real value to
the agency. NYSDOT believe that having more accurate PCS cost estimates could have some
impact on the planning process the believe that they may possible be able to have more projects
but the current number already within ~10% and having a more accurate estimate will not make
the process cheaper so is not likely to affect the agency.

98
Agency: Oklahoma State Department of Transportation (ODOT)
Location: Oklahoma City, Oklahoma
General information: ODOT yearly construction budget is approximately $632-$790
million and they are awarded approximately 364 construction projects per year. Approximately
60% of all annual projects are federally funded with the remaining 40% non-federally funded.
Project monetary size ranges from $50 thousand to $25 million. The average monetary sized of
a new construction project is $1.7 million.
In-House data collection: ODOT does not record in-house preconstruction services
(PCS) hours on a per project basis. Approximately 50% of the time it is billed to overhead.
Outsourcing data collection: ODOT does contract out PCS. ODOT can perform the
entire preconstruction process in-house except right of way and they also outsource all PCS
except Preferred alternative, NEPA and permit approval, final plan package (RFP and RFQ),
advertisement for bids, evaluation of bids, and award of contract.
The main reason why they outsource PCS is due to staff availability and special
expertise. They do not have any regulations on how much they can or shall outsource. The
ODOT does not compare the cost of performing PCS in-house versus consulting out as part of
the outsourcing decision process.
The major influences in the PCS cost for ODOT are:
Complexity
Project type
Construction cost
Number of bridges
Length of project
The minor influences in the PCS cost for this agency:
Number of sub-consultants
Number of plan sheets
National Environmental Policy Act (NEPA) classification
Highway classification
The characteristics that have no influence in the PCS cost for this agency:
Number of lanes
PCS estimate improvements: Currently ODOT believes estimating PCS cost would be
valuable but have yet to do so. To improve PCS cost estimates they believe they need to made
direct changes to their projects. If a system that would capture PCS cost information was

99
available, ODOT might choose to adopt it. ODOT believes that having more accurate PCS cost
estimates would have minimal impact on the planning process within their program.
Researcher’s observations:Will be hard to convince people to use the system.

100
Agency: Rhode Island Department of Transportation (RIDOT)
Location: Providence, Rhode Island
General information: RIDOT yearly construction budget is approximately $300 million.
In-House data collection: RIDOT does record in-house preconstruction services (PCS)
hours on a per project basis. They record these hours using the engineer’s timesheets. The data
recorded on these times sheets is rated a 4 out of 5 on the scale of accuracy. RIDOT does not
allocate in-house overhead cost to a specific project. The RIDOT does not use data collected
from past projects to estimate the PCS cost for future projects. Design costs are estimated by
using 15% of total construction cost. However, this is not uniform; smaller projects tend to be a
higher percentage and larger projects tend to be a lower percentage. This process is just an
educated guess.
Outsourcing data collection: RIDOT does contract out PCS. They have several on-call
consultants as almost all their design work is outsourced. They use two consultants for highway
work, two for bridges, and four for traffic engineering. No single firm is the dominant GEC.
They have only two persons in the area of historical and heritage issues and four in
environmental groups. This workforce is inadequate in performing the required studies in an
appropriate time. RIDOT can advertise for bids, evaluate bids, award contracts, and perform
some ROW utilities acquisition and relocation. All PCS processes are outsourced except those
stipulated above.
The main reasons why they outsource PCS are due to staff availability and having better
control over consulting engineers easier to terminate / not extend consultant contract contracts
than employees. RI DOT engineers are unionized. RIDOT rely heavily on federal funds (roughly
two thirds of the transportation budget comes from federal) which are subject to approval; can’t
guarantee jobs. They do not have and regulations on how much they can or shall outsource.
Engineering staff for RIDOT are unionized. The RIDOT does not compare the cost of
performing PCS in-house versus consulting out as part of the outsourcing decision process.
The major influences in the PCS cost for RIDOT are:
Complexity
Project type
Number of plan sheets
The minor influences in the PCS cost for this agency:
101
Construction cost
Number of lanes
National Environmental Policy Act (NEPA) classification
Number of bridges
Highway classification
Length of project
Geographical
Loss of design effort
The characteristics that have no influence in the PCS cost for this agency:
Number of sub-consultants
During Mr. Farhoumand’s 26 years with RIDOT, there has been just one new road
project and one major relocation of a major road (I95). New roads are a rarity!
One clarification regarding the characterization of “Geographical” above. Coastal
projects need extra permits compared to non-coastal projects, hence more “difficult.”
PCS estimate improvements: RIDOT does not see value in estimating PCS cost. Since
they are a small organization, they have yet to develop a database to keep track and evaluate the
design costs. Their priority lies in estimating construction costs. To improve these estimates they
believe they need a database to pull scattered records and documentation of PCS into one place.
If there was a system RIDOT would probably not consider adopting it because drivers of these
costs tend to be out of the control of the agency. There is a 2 year election cycle so government
and legislative representatives change regularly and therefore projects continue to lose and gain
importance depending on the political influence. Also they will get built regardless of
preconstruction; it is the construction cost that causes the most difficulties. RIDOT believe that
having more accurate PCS cost estimates would have no impact on the planning process. They
believe that PCS costs have very little impact on the overall program and projects will be
executed no matter the PCS costs.

102
Agency: Utah Department of Transportation (UDOT)
Location: Salt Lake City, Utah
General information: UDOT yearly construction budget is approximately $1,100
million.
In-House data collection: UDOT does record in-house preconstruction services (PCS)
hours on a per project basis they charge hours to a PIN (project identification number). They
record these hours using project management software called ePM. The data recorded on these
times sheets is rated a 4 out of 5 on the scale of accuracy, sometimes staff will bill to overhead
instead of a project. UDOT does not allocate in-house overhead cost to a specific project
however they do charge to a management line item and all staff costs included benefits etc. The
UDOT uses data collected from past projects to estimate the PCS cost for future projects. They
use a past project cost range as well as a direct estimate of hours to determine the PCS hours.
These estimates are project dependent.
Outsourcing data collection: UDOT does contract out PCS. UDOT uses on call
contracts for most outsourced work but they can only use up to $40,000/consultant/project if
more work need to be outsourced they will advertise for contracts. UDOT can perform the entire
preconstruction process in-house except region 4 (Southern reigion) cannot do ROW, hydraulics
and signal design services. UDOT outsources all PCS except advertisement for bids, evaluation
of bids and award of contract.
UDOT performs 25% PCS in-house and 75% is outsourced by dollar value. The main
reason why they outsource PCS is due to staff availability and special expertise they also choose
to outsource to strengthen the economy and expedite project delivery. They do not have policy or
regulations about how much they can or shall outsource however they must always keep the in-
house staff busy first. The UDOT does not compare the cost of performing PCS in-house versus
consulting out as part of the outsourcing decision process they are aware that this will cost more
but are limited by staff. UDOT try to decide early on whether the project will be outsourced or
performed in-house so that they can set the budget early. PCS for simple projects will usually be
performed in-house this decision is made at the program level. Occasionally UDOT will put
design staff to work with the consultant on an outsourced project to get experience. The staff at
UDOT has reduced from 3500 in 2000 to 1530 now.

103
The major influences in the PCS cost for UDOT are;
Complexity
Project Type
NEPA classification
Number of bridges
The minor influences in the PCS cost for this agency:
Highway classification
Construction costs
Number of plan sheets
Number of lanes
Length of project
The characteristics that have no influence in the PCS cost for this agency:
Number of sub-consultants
Geographical
Loss of design effort
The UDOT does not believe it sets out to make mistakes therefore they do not consider
loss of design effort necessary in estimating PCS.
PCS estimate improvements: Currently UDOT is already estimating PCS cost for all
projects. To improve these estimates they believe they need to have more experience. New
project managers do not have a good feel for the number of hours, required training and time on
job needed to produce an accurate estimate. UDOT is happy with their current cost estimating
system and they would prefer to refine their own system than adopt another system. UDOT
believe that having more accurate PCS cost estimates could have some impact on the planning
process allow them to refine allocation of resources and negotiate with consultants better.
Researcher’s observations:
UDOT has a positive work environment that keeps them moving forward and allows
UDOT to try new and innovative things, constantly pushing to get better results.
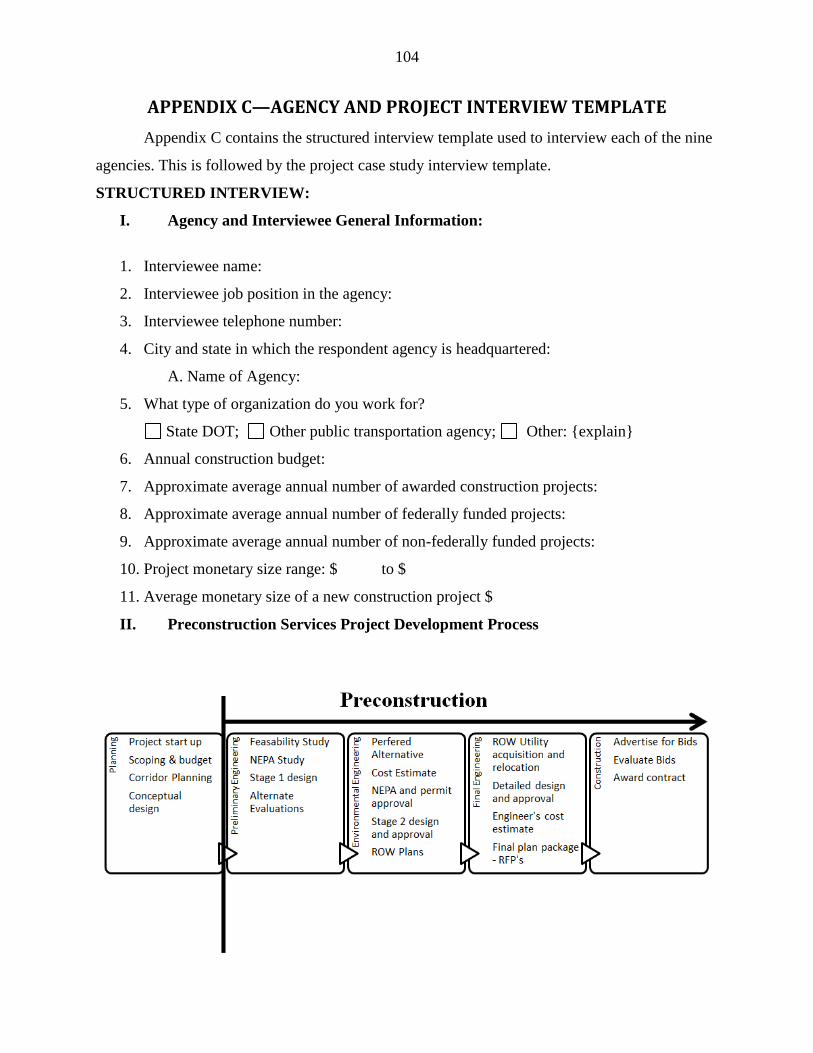
104
APPENDIX C—AGENCY AND PROJECT INTERVIEW TEMPLATE
Appendix C contains the structured interview template used to interview each of the nine
agencies. This is followed by the project case study interview template.
STRUCTURED INTERVIEW:
I. Agency and Interviewee General Information:
1. Interviewee name:
2. Interviewee job position in the agency:
3. Interviewee telephone number:
4. City and state in which the respondent agency is headquartered:
A. Name of Agency:
5. What type of organization do you work for?
State DOT; Other public transportation agency; Other: {explain}
6. Annual construction budget:
7. Approximate average annual number of awarded construction projects:
8. Approximate average annual number of federally funded projects:
9. Approximate average annual number of non-federally funded projects:
10. Project monetary size range: $ to $
11. Average monetary size of a new construction project $
II. Preconstruction Services Project Development Process

105
III. Agency In-House data collecting:
1. Do you record in-house PCS hours on a per project basis.
Yes No
If yes continue. If No go to next section
2. How do you record these hours?
Engineer’s timesheets Time allocation system per job
Time tracking software Other {explain}
3. How accurate do you think the hours are?
4. Do you allocate in-house overhead costs to an individual project?
Yes No
If yes how do you allocate these costs?
5. Do you use the data to determine PCS cost estimate for future projects?
Yes No
If yes continue. If No go to next section
6. What method do you use to estimate PCS costs for a project
Trns.port Software; Standard percentage of estimated preconstruction cost ;
Direct estimate of hours; Past project cost range; Don’t know; Other {please
specify}
IV. Agency Outsourcing Preconstruction Services Make Up:
1. Does your agency contract out PCS work?
Yes No
If yes continue. If No go to next section:
2. Do you have a standing contract for a general engineering consultant (GEC)?
Yes No
1- Not Accurate 3 4 2 5- Very Accurate

106
3. What services do you contract out? In-house GEC Other Consultant
Feasibility Study
NEPA Study
Stage 1 Design
Alternate Evaluations
Preferred alternative
Cost Estimate
NEPA and Permit Approval
Stage 2 Design and Approval
ROW Plans
ROW Utility Acquisition and Relocation
Detailed Design and Approval
Engineer’s Cost Estimate
Final Plan Package (RFP and RFQ)
Advertise for Bids
Evaluate Bids
Award Contract
Approximate percentage
4. If your agency contracts out PCS why do you do it?
Regulations Staff availability Special expertise
Policy Transfer risk of design liability Other: {explain}
5. Do you have limitations or guidelines on how much you can or shall outsource?
Yes No
If yes please explain:
6. Do you compare the cost of in-house resources to the cost of consulting out as part of the
outsourcing decision process?
Yes No
If yes please explain:
V. Preconstruction Cost Components:
2. How influential do you think the following characteristics are in estimating the overall
PCS cost for a “typical Design Bid Build” project? (Interviewer circle the check box)
1- No Influence
2-Some Influence
3-Major Influence 1 2 3
Complexity
Project type
Number of sub-consultants
Construction cost
Number of lanes
Number of plan sheets
National Environmental Policy Act (NEPA) classification
Number of bridges
Highway classification
Length of project
Geographical
Loss of design effort
Other

107
VI. How to improve PCS cost estimates:
1. What is your agency current stance on estimating PCS cost?
Already estimating PCS cost
Looking to adopt it in the future
Believe it would be valuable
Do not see value for my agency
Other: {explain}
2. What do you think your agency needs to do to improve their PCS cost estimate?
3. If there was a system available that would capture PCS cost information would your
agency consider adopting it?
Yes No Maybe
4. If you were able to more accurately estimate the PCS cost what would be the impact on
planning process?
5. Is there anything you would like to add that you think would be valuable to the
researchers in this study?
PROJECT CASE STUDY INTERVIEW:
VII. Project General Information:
1. Project name:
2. Project type: DBB DB CMGC Other
3. Project description:
4. Total monetary size of project:
5. Total Cost of PCS for project:
6. Breakdown of the PCS cost for the project (if available)
1- No Impact 2-Some Impact 3 – Large Impact

108
In-house GEC Other Consultant
Feasibility Study $ $ $
NEPA Study $ $ $
Stage 1 Design $ $ $
Alternate Evaluations $ $ $
Preferred alternative $ $ $
Cost Estimate $ $ $
NEPA and Permit Approval $ $ $
Stage 2 Design and Approval $ $ $
ROW Plans $ $ $
ROW Utility Acquisition and Relocation $ $ $
Detailed Design and Approval $ $ $
Engineer’s Cost Estimate $ $ $
Final Plan Package (RFP and RFQ) $ $ $
Advertise for Bids $ $ $
Evaluate Bids $ $ $
Award Contract $ $ $
Total percentage
7. Complexity of project:
8. Number of sub-consultants:
9. Number of lanes:
10. Number of plan sheets:
11. NEPA Classification
12. Number of bridges:
13. Highway Classification:
14. Length of project:
15. How much influence did the following factor have on the PCS cost for this project? No influence Minor influence Major influence
Complexity
Project type
Number of sub-consultants
Construction cost
Number of lanes
Number of plan sheets
National Environmental Policy Act
(NEPA) classification
Number of bridges
Highway classification
Length of project
Other
1- Basic project 3 Typical project 4 2 5- Very complex