High Wolbachia Strain Diversity in a Clade of Dung Beetles ...
Upload
museonoelkempffCategory
view
0download
0
Fax to: (+49)(0)622148768500Gabriele SchmitzSpringer Heidelberg, 69121 Heidelberg
From:Re: European Journal of Wildlife Research DOI 10.1007/s10344-004-0064-x
Estimating brocket deer (Mazama gouazoubira and M. americana) abundance by dung pelletcounts and other indices in seasonal Chiquitano forest habitats of Santa Cruz, Bolivia
Authors: Rivero · Rumiz · Taber
I. Permission to publishDear Gabriele Schmitz,
I have checked the proofs of my article and
❑ I have no corrections. The article is ready to be published without changes.
❑ I have a few corrections. I am enclosing the following pages:
❑ I have made many corrections. Enclosed is the complete article.
II. Offprint order❑ I do not wish to order offprints❑ Offprint order enclosed
Remarks:
Date / signature
III. Copyright Transfer Statement (sign only if not submitted previously)The copyright to this article is transferred to Springer-Verlag (for U.S. government employees: to the extenttransferable) effective if and when the article is accepted for publication. The copyright transfer covers theexclusive right to reproduce and distribute the article, including reprints, translations, photographic reproductions,microform, electronic form (offline, online) or any other reproductions of similar nature.An author may self-archive an author-created version of his/her article on his/her own website and his/her
institution’s repository, including the final version; however he/she may not use the publisher’s PDF versionwhich is posted on www.springerlink.com. Furthermore, the author may only post his/her version providedacknowledgement is given to the original source of publication and a link is inserted to the published articleon Springer’s website. The link must be accompanied by the following text: “The original publication is availableat www.springerlink.com.” Please use the appropriate DOI for the article (go to the Linking Options in thearticle, then to OpenURL and use the link with the DOI). Articles disseminated via SpringerLink are indexed,abstracted and referenced by many abstracting and information services, bibliographic networks, subscriptionagencies, library networks, and consortia.The author warrants that this contribution is original and that he/she has full power to make this grant. The
author signs for and accepts responsibility for releasing this material on behalf of any and all co-authors.After submission of this agreement signed by the corresponding author, changes of authorship or in the order
of the authors listed will not be accepted by Springer.
Date / Author’s signature

Journal: European Journal of Wildlife ResearchDOI: 10.1007/s10344-004-0064-x
Offprint Order Form• If you do not return this order form, we assume thatyou do not wish to order offprints.
• To determine if your journal provides free offprints,please check the journal’s instructions to authors.
• You are entitled to a PDF file if you order offprints. • If you order offprints after the issue has gone to press,costs are much higher. Therefore, we can supply• Please specify where to send the PDF file:offprints only in quantities of 300 or more after thistime.
• For orders involving more than 500 copies, please askthe production editor for a quotation.
❑
Please note that orders will be processed only if a credit card number has beenprovided. For German authors, payment by direct debit is also possible.
I wish to be charged in ❑ Euro ❑ USD
Prices include surface mail postage and handling.Customers in EU countries who are not registered for VATshould add VAT at the rate applicable in their country.
VAT registration number (EU countries only):
For authors resident in Germany: payment by directdebit:I authorize Springer to debit the amount owed frommy bank account at the due time.
Account no.:
Bank code:
Bank:
Date / Signature:
Please enter my order for:
Price USDPrice EURCopies330.00300.0050❑405.00365.00100❑575.00525.00200❑750.00680.00300❑940.00855.00400❑1,130.001,025.00500❑
Please charge my credit card❑ Eurocard/Access/Mastercard❑ American Express❑ Visa/Barclaycard/Americard
Number (incl. check digits):_ _ _ _ _ _ _ _ _ _ _ _ _ _ _ _ _ _ _Valid until: _ _ / _ _
Date / Signature:
Ship offprints to:Send receipt to:
❑ Kathia RiveroMuseo de Historia NaturalNoel Kempff MercadoSanta CruzBolivia
❑ Kathia RiveroMuseo de Historia NaturalNoel Kempff MercadoSanta CruzBolivia
❑ ❑

European Journal of Wildlife ResearchDOI 10.1007/s10344-004-0064-x
Original Paper
Estimating brocket deer (Mazama gouazoubira andM. americana) abundance by dung pellet countsand other indices in seasonal Chiquitano foresthabitats of Santa Cruz, BoliviaG. Kathia Rivero (✉) · Damiàn I. Rumiz · Andrew B. Taber
G. K. Rivero · D. I. RumizMuseo de Historia Natural Noel Kempff Mercado, Av. Irala 565, C.C. 2469 Santa Cruz, Bolivia
D. I. Rumiz · A. B. TaberWildlife Conservation Society, 2300 Southern Blvd., Bronx, NY 10460, USA
✉ G. K. RiveroE-mail: [email protected]
Received: 25 March 2004 / Accepted: 14 October 2004
Abstract We assessed dung and track counts for indexing brocket deer abundance in seasonal
habitats on a ranch where hunting is not practiced in the Bolivian lowlands. Surveys were replicated
along four 10-km trails (totaling 180 km in the wet season and 90 km in the dry season) through
four semideciduous forest habitats. Dung pellets and tracks were identified as belonging to Mazama
gouazoubira or M. americana by size and shape. Pellet groups lasted more than 1 month during
the dry season, but decayed within 1–2 weeks in the wet season. Mean density estimates based on
dung counts varied widely between seasons for gray brockets (from 6.77±4.0 to 30.57±23.5
ind/km2; mean±SD) but not for reds (from 3.52±4.6 to 6.98±7.2 ind/km2). These values were
probably too high due to underestimation of daily deposition rate, and were reduced during the
wet season because of dung decay. We found consistently more dung in the dry season and more
tracks in the wet season. Sightings of red brockets were too few for line-transect analysis (n=6),
but those of gray brockets (n=42) produced an overall estimate of 5.6 ind/km2 (95%
CI=3.5–9.0 ind/km2). Different estimates indicated that gray brockets were more abundant than
reds in all situations, except perhaps in the riverine forest. Environmental factors affected these
1
indices of abundance differently, and while we recommend the use of dung counts in dry-season
scenarios, we think that index reliability should be assessed locally before conducting population
comparisons.
Keywords Mazama · Brocket deer · Dung pellets · Abundance indices · Density
IntroductionThe gray brocket (Mazama gouazoubira) and the red brocket (M. americana) are the most widely
distributed South American deer (Emmons and Feer 1997). They are also important game species,
harvested all over their range (Ojasti 1993) and particularly in the lowlands of Bolivia (Townsend
1996; Rumiz et al. 2001; Noss et al. 2003). Assessments of the sustainability of hunting are often
limited by the difficulty in estimating population density. Line-transect methods have been used
to produce reliable estimates of neotropical ungulates exposed to hunting (e.g. Bodmer 1997; Hill
and Padwe 2000; Peres 2000; Hurtado and Bodmer 2004), but these require considerable sampling
effort. Direct indices of abundance (based on animal encounter rates) and indirect indices (such
as dung and tracks) usually demand less effort, but often are related to the actual abundance through
an unknown or changing coefficient (Conroy 1996). Consequently, both the index’s coefficient
and its variation under different field conditions need to be assessed to produce robust estimations
of abundance (Walker et al. 2000).
We assessed the use of pellet group counts for estimating brocket deer abundance in different
habitats and seasons of a Chiquitano forest site were hunting does not take place. We examined
the association of abundance estimates based on pellet-group counts, line-transect sightings, and
tracks discovered simultaneously at the site, and compared our density values to others from the
literature.
Materials and methods
Study area and survey trails
The study took place at the Estancia San Miguelito (Ñuflo de Chavez Province), a 40,000 ha cattle
ranch enclosing natural habitats of the Precambrian Shield and the Chaco-Beni Plain landscapes
in Santa Cruz. Annual mean temperature is 24°C, but during the austral winter, temperatures may
drop to 5°C. Annual rainfall averages 1,000 mm occurring mainly from November to April, while
2

the dry season usually lasts from May to September. Bioclime is classified as “dry xeric
thermotropical”, bordering with the “sub-humid seasonal thermotropical” to the north (Fuentes
and Navarro 2000), which roughly correspond to “subhumid megathermal” in Thornthwaite’s
system. More details of the study area can be found elsewhere (Rumiz et al. 2001; Rivero et al.
2005) .
We used “La Pascana” (17°05′S, 61°47′W, 300 m a.s.l.) located on the north bank of the San
Julián river and at the foothills of Serranía San Pablo (Cerro Puntudo is the highest point around
at 620 m) as base camp. Within 3 km of La Pascana and across a 200-m altitudinal gradient, we
identified four forest types, an open palm savanna, and wetlands, according to the ecological
descriptions given by Fuentes and Navarro (2000). Vegetation measurements and records of deer
feeding signs showed differences in forest structure and food resources among the four forested
habitats (Rivero 1997; Rivero et al. 2005). Main habitat characteristics are summarized below.
Transitional Chaco–Chiquitano forest ("chaco")
Transitional Chaco–Chiquitano forest ("chaco") occupies the alluvial plains south of the San Julián
river. On well-drained soils, it shares the tall (18 m) structure of the Chiquitano forest from the
Precambrian Shield with species such as Phyllostylon rhamnoides and Anadenanthera macrocarpa,
but incorporates Chacoan species such as Aspidosperma quebracho-blanco, Diplokeleba floribunda,
Cereus tacuaralensis, Caesalpinia paraguayensis and Zizyphus oblongifolius. On poorly drained
depressions, this forest type is low in stature (10 m) and characterized by the palm Trithrinax
campestris. The understory is dense, has the lowest horizontal visibility of all four habitats, and
is dominated by shrubs, ground bromeliads (Bromelia, Aechmea), and cacti (Opuntia, Monvillea).
Semi-deciduous Chiquitano forest ("riverine")
Semi-deciduous Chiquitano forest ("riverine") occurrs on the high banks the San Julian River and
regionally covers slopes, foot hills, and well-drained valley bottoms of the Shield. It is a tall
(15–25 m) and species-rich forest, with trees such as Schinopsis brasiliensis, Anadenanthera
macrocarpa, Caesalpinia pluviosa, and Astronium urundeuva. It has abundant vines (Arrabidaea,
Macfadyena) and mid-story trees (Achatocarpus, Allophylus, Trichilia, Capparis), which create
high cover and low visibility. The understory presents herbaceous ferns, Commelinaceae and
ground bromeliads (Pseudananas, Bromelia, Ananas).
3
Moist Chiquitano forest ("piedmont")
The moist Chiquitano forest ("piedmont") is an edaphic variant of the Chiquitano forest, the most
humid habitat in the area. It occurs on the south-facing slope of the Serranía San Pablo and is
favored by reduced insolation and the presence of small streams. Canopy height is about 20 m,
formed by trees (such as Gallesia integrifolia, Ficus spp., Cariniana estrellensis, Inga marginata,
and Vitex cymosa) and palms (Attalea phalerata and Syagrus sancona). Relatively abundant smaller
trees (Pouteria spp., Genipa americana, Sapindus saponaria, and Salacia elliptica) are an important
food source for frugivores. Understory cover was intermediate but variable, dominated by
Acanthaceae and ferns.
Cerrado woodland and savanna ("cerrado")
Cerrado woodland and savanna ("cerrado") is a low stature (5–10 m) open forest grading up to
grasslands, and growing on poor soils on top of lateritic hills exposed to regular fires. Trees and
shrubs feature corky barks, leathery leaves, and thick leaf cuticles as adaptations to dessication
and fire. It was the shortest and most open (highest visibility) habitat surveyed. Common tree
species are Callisthene fasciculata, Linociera hassleriana, Qualea spp., Curatella americana and
the palm Acrocomia aculeata. Elionurus muticus dominates among the grasses, but many other
herbaceous plants, including orchids, are present. Several plants are important fruit sources.
In each forest habitat, a 10-km trail system was cleared for surveying animal sign. Trails
approximately 1 m wide were cut through the understory in straight, 0.3–1 km sections. They were
laid out as a single continuous line (piedmont), as parallel sections at least 100 m apart (chaco and
cerrado), or in an intermediate pattern (riverine) to include representative samples of vegetation
and to reduce total walking distances. All trails and the base camp were encompassed within an
area of 6×5 km, and ranged between 280 and 480 m above sea level.
Estimation of deer abundance by pellet-group counts
Population densities of forest ungulates may be estimated by counting pellet groups or dung piles
found per unit of area in a given time interval (during which depositions do not disappear by
decay), and dividing that by the number of depositions produced by one individual during that
time. If dung piles decay during count intervals, the formula should incorporate an estimated dung
decay rate (e.g. Barnes and Barnes 1992), and because decay rates may change among seasons
4
and habitats, temporal or spatial comparisons of abundance should be done with caution (Rabinowitz
1993).
Pellet groups were counted within a 3-m fixed width along the trails. Repeated surveys totaled
180 km during 5 months in the wet season (December 1994 through April 1995) and 90 km during
2 months in the dry season (July through August 1995). Each pile was marked or removed to avoid
double counts. Dung of each of the two species of Mazama was identified by shape and size of
pellets. Gray brocket pellets were slender (10.3±1.3 mm×5.4±0.5 mm, n=100) and ended in a fine
point, while red brocket pellets were thicker (9.2±1.2 mm×7.9±0.8 mm, n=100) and had rounded
ends (Rivero 1997; Rivero et al. 2005). Defecation rates were estimated by counting pellet groups
of two red and three gray brocket deer at the Santa Cruz Zoo over an 8-day period. We estimated
4.9–5.0 pellet groups produced per individual per day.
To assess pellet-group decay rate by habitat and season, 39 recently deposited pellet groups
were monitored in the four habitats during the wet season, and 15 during the dry season. This
sample mostly included dung of gray brockets and a few of reds, but we did not expect that dung
decay would vary between these similar species. All pellets remaining at each pile were counted
weekly for more than 1 month or until they disappeared. The formula used to estimate deer density
(D) based on pellet-group counts was
The area covered in each dung survey by habitat type was 3 m wide and 10 km long (0.03 km2).
We also calculated dung encounter rates per km as another index of abundance.
Estimation of deer abundance by line-transect sightings and
track counts
Transect censuses were conducted by one observer between 06:00–11:00 and 13:00–18:00, totaling
180 km in the wet season and 114.8 km in the dry season. At each encounter with deer, the
perpendicular distance from the individual to the transect (or the radial distance to the observer
and its angle) was measured. The species was identified by size and color, or by its tracks.
Line-transect data analysis for gray brockets was performed according to Buckland et al. (1993)
with distance 4 for overall sightings (n=42), and separated by season (18+24). Red brocket sightings
5
(n= 6) were too few for line-transect density estimation. A sighting rate of individuals per km was
also calculated.
Brocket deer tracks were identified to species by their different size and shape. A sample of
tracks measured at our site indicated that gray brocket tracks were smaller
(32.5±2.5 mm×24.5±3.1 mm) and more acutely pointed than red brocket tracks
(45.8±6.5 mm×32.8±5.3 mm) (Rivero 1997; Rivero et al. 2005). Tracks were surveyed on 3-m-wide
strips totaling 180 and 90 km in the wet and the dry seasons, respectively. At each encounter the
tracks were assigned to species, measured if possible, mapped (location and track course), and
marked to avoid recounting. Successive tracks of similar size and age, presumed to belong to a
single individual, were counted as one. Track series of different sizes (e.g. mother and fawn) or
mixed ages (e.g. fresh and old) were counted as separate encounters. Track encounter rates per
kilometer by species were also calculated for each habitat and season.
Comparison of indices of abundance
Density estimates by dung counts, and encounter rates of tracks, dung and individual animals (for
the four habitats and two seasons), were examined for consistency by calculating correlation
coefficients (Pearson's r, Bonferroni adjusted; Systat 1997) within species. We compared indices
of abundance (track and dung encounter rates per km) between deer species or seasons as paired
values for each of the four habitats in the two (species or season) situations (Wilcoxon signed rank
test, n=8 pairs, in Systat). Other estimates of abundance from the same site (deer track occurrence
in 2×1 m plots laid out along the same four trails (Cuéllar 1997) and from neighboring sites where
hunting takes place (Guinart 1997; Rumiz et al. 2001) were compared with our values.
ResultsDung decayed at different rates by season. Some pellet groups disappeared due to dung beetles
between the first and second counts in the wet season, but most remained for 40 days or more
during the dry season (Fig. 1). Fresh depositions had 50–150 pellets each, and progressively lost
pellets until disappearing. Wet-season decay curves varied among habitats, with pellet groups
surviving for at least 21 days in the cerrado, while others became difficult to detect (<20 pellets)
after the first week in denser forest habitats.
6

Fig. 1 Decay curves (decrease in number of pellets) of brocket deer pellet groups monitored in two seasons
and four habitats in the Chiquitano forest
We produced between two and six density estimates based on pellet-group counts for each
brocket deer species in each habitat/season combination. Considering a daily defecation rate of 5
pellet groups per individual, estimates for each 10-km survey varied between 0 and 29 ind/km2
for red brockets and between 0 and 92 ind/km2 for gray brockets. Averages for each habitat/season
combination were also highly variable, at 1.27–62.78 ind/km2 for grays and 0.57–17.69 ind/km2
for reds (Table 1). Deposition periods (time interval in days between dung counts, or DI) varied
between 6 and 45 days, and we used shorter periods in the wet season to compensate for the more
rapid decay. For both species, the highest density estimates corresponded to the riverine forest in
the dry season, while the lowest values occurred during the wet season in piedmont for gray
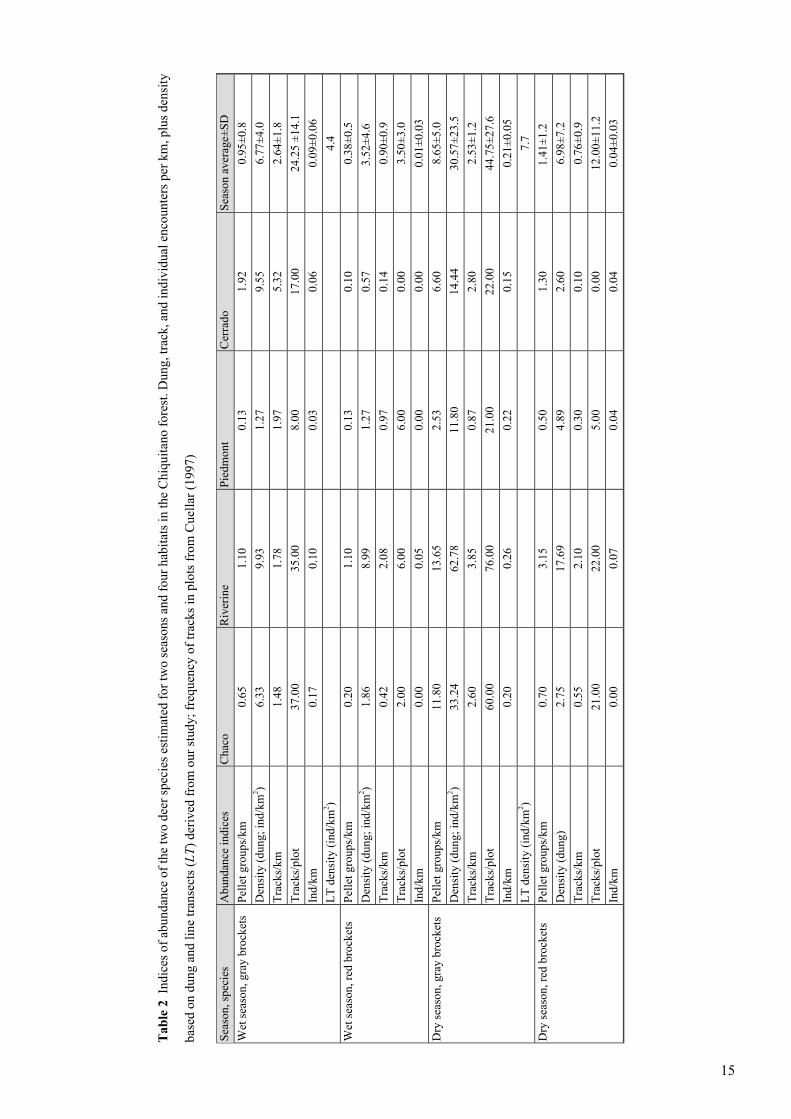
brockets, and in cerrado for red brockets. Density averages by season across all habitats (Table 2)
7
indicated that gray brockets (wet season: 6.77 ind/km2, dry season: 30.57 ind/km2) were several
times more abundant than red brockets (wet season: 3.52 ind/km2, dry season: 6.98 ind/km2).
[Table 1 will appear here. See end of document.]
[Table 2 will appear here. See end of document.]
Based on 42 gray brocket deer sightings recorded along 295 km of line transects, overall
population density was estimated at 5.6 ind/km2 (95% CI=3.5–9.0 ind/km2), with a 12.7-m effective
sighting width (ESW). The wet-season estimate was 4.4 ind/km2 (180 km, n=18,
CI=1.6–11.5 ind/km2; ESW=11.4 m) and dry season was 7.7 ind/km2 (115 km, n=24, CI=
5.2–11.5 ind/km2, ESW=13.6 m). Gray brocket sighting rates (0.14 ind/km overall) varied between
0.02 and 0.17 ind/km in the wet season and between 0.17 and 0.23 ind/km in the dry season
(Table 2). Red brocket sightings (n=6) were not sufficient to estimate population density, and
produced a much lower overall sighting rate (0.02 ind/km).
Track and dung encounters were more numerous than animal sightings and allowed an estimate
of indices for each season and habitat combination (Table 2). Dung index values, as illustrated by
a dung-to-track ratio, were consistently higher than track values for all habitats in the dry season
(Wilcoxon, eight pairs, P=0.012), while the opposite occurred in the wet season (Fig. 2). Encounter
rates for gray brocket tracks (Table 2) varied between 1.48 and 5.32 tracks/km in the wet season
and 0.87 and 3.85 tracks/km in the dry season, while red brocket track encounter rates were lower
(Wilcoxon test, 8 pairs, P=0.017) at 0.14–2.08 tracks/km in the wet season, and 0.10–2.10 tracks/km
in the dry season. Only in one case (riverine forest, wet season) were there more red brocket tracks
than gray. We did not identify any seasonal differences in the overall track encounter rate (Wilcoxon,
eight pairs, P=0.889). Dung encounter rates (Table 2), were also greater for gray brockets (wet
season: 1.02 pellet groups/km, dry season: 8.00 pellet groups/km) than those of red brockets (0.36
and 1.31 pellet groups/km, for wet and dry seasons, respectively) (Wilcoxon, eight pairs, P=0.028).
8
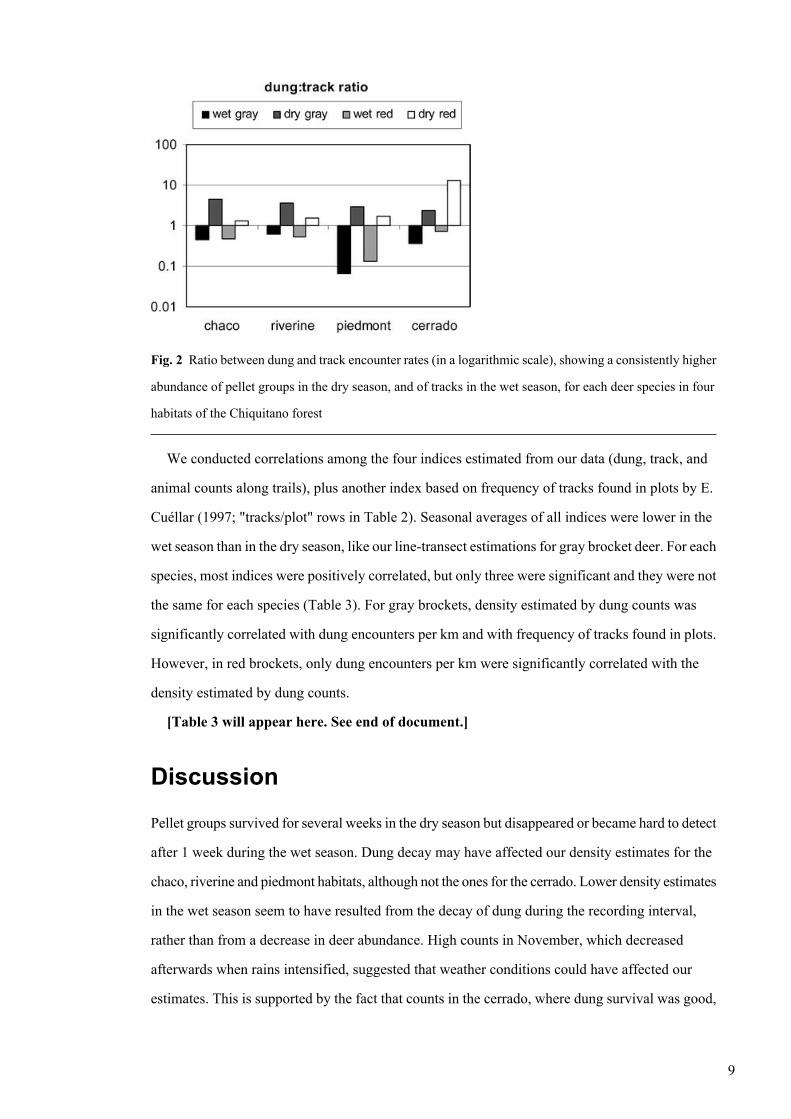
Fig. 2 Ratio between dung and track encounter rates (in a logarithmic scale), showing a consistently higher
abundance of pellet groups in the dry season, and of tracks in the wet season, for each deer species in four
habitats of the Chiquitano forest
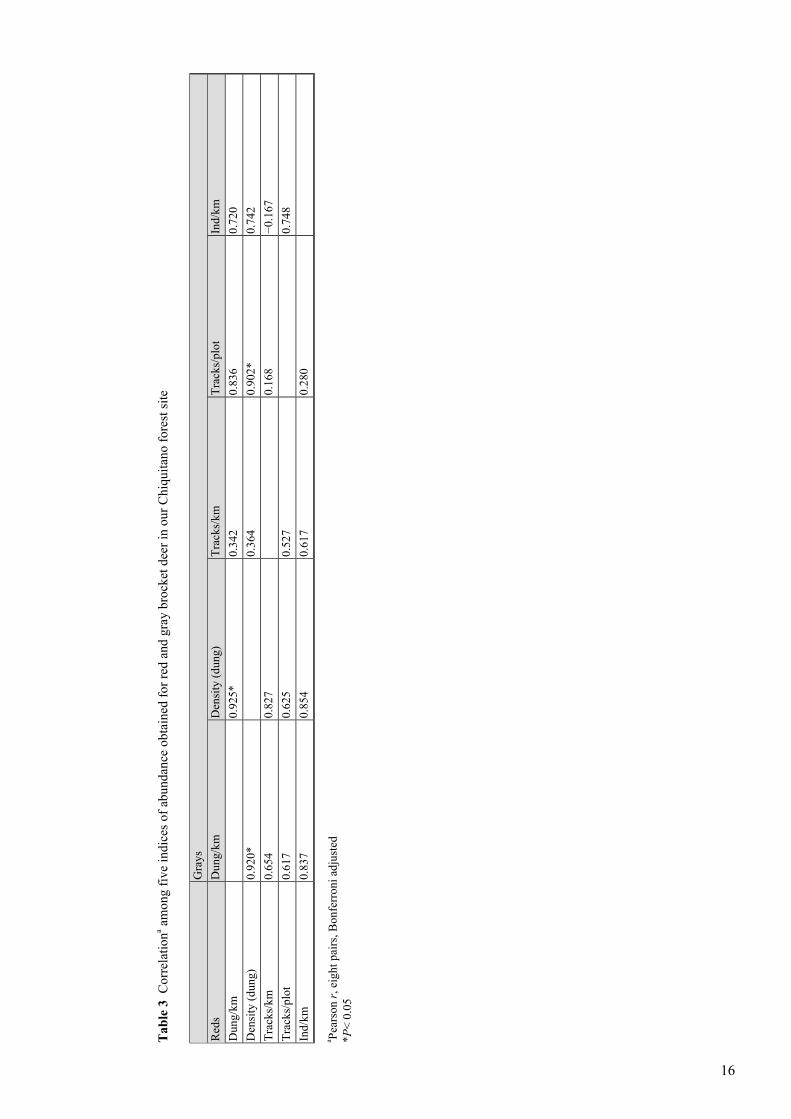
We conducted correlations among the four indices estimated from our data (dung, track, and
animal counts along trails), plus another index based on frequency of tracks found in plots by E.
Cuéllar (1997; "tracks/plot" rows in Table 2). Seasonal averages of all indices were lower in the
wet season than in the dry season, like our line-transect estimations for gray brocket deer. For each
species, most indices were positively correlated, but only three were significant and they were not
the same for each species (Table 3). For gray brockets, density estimated by dung counts was
significantly correlated with dung encounters per km and with frequency of tracks found in plots.
However, in red brockets, only dung encounters per km were significantly correlated with the
density estimated by dung counts.
[Table 3 will appear here. See end of document.]
DiscussionPellet groups survived for several weeks in the dry season but disappeared or became hard to detect
after 1 week during the wet season. Dung decay may have affected our density estimates for the
chaco, riverine and piedmont habitats, although not the ones for the cerrado. Lower density estimates
in the wet season seem to have resulted from the decay of dung during the recording interval,
rather than from a decrease in deer abundance. High counts in November, which decreased
afterwards when rains intensified, suggested that weather conditions could have affected our
estimates. This is supported by the fact that counts in the cerrado, where dung survival was good,
9
had the least difference between seasons, while piedmont and chaco had dry-season counts several
times higher than those from the wet season.
The several-fold seasonal variation in density as estimated by dung counts does not appear to
reflect an actual population change. Dry-season dung estimates for grays (30.57 ind/km2) were
improbably high, four times our line-transect estimate (7.7 ind/km2), while wet-season dung
estimates (6.77 ind/km2) were closer to transect estimates (4.4 ind/km2) but probably due to the
reducing effect of dung decay. Red brocket density estimates (from 3.52±4.6 to 6.98±7.2 ind/km2)
did not vary between seasons as much as gray’s, but they may also be overestimates. We attributed
this density overestimation to the use of a low defecation rate calculated from captive animals
(five pellet groups per individual per day); the rate may actually be higher in the wild.
Reported densities of gray brocket deer vary from 3.7 ind/km2 in the Brazilian Pantanal (Schaller
1983), 2.4–1.2 ind/km2 in the Bolivian Chaco (under no/some hunting pressure; Ayala and Noss
1999), to 0.7 ind/km2 in the Brazilian Cerrado (Pinder and Leeuwenberg 1997). In the Peruvian
Amazon lowland forest (Hurtado and Bodmer 2004), gray brockets are less abundant
(0.4–0.2 ind/km2) than red brockets (1.1 ind/km2), as reported in the moist forests from eastern
Paraguay (Hill and Padwe 2000). In a "lightly hunted" moist forest in northern Santa Cruz, Bolivia,
gray brockets were only known from hunting records while red brockets were encountered at rates
of 0.07 ind/km. Further south, however, in the drier forest habitats of the Lomerio indigenous
territory, grays (0.02 ind/km) were more common than reds (0.004 ind/km) and both species were
relatively scarce and heavily hunted (Rumiz et al. 2001). Near Lomerio, at our better-protected
study site, we had a relatively high encounter rate for both brocket deer species (0.14 gray ind/km,
0.02 red ind/km), and a high density estimated by line transects for gray brockets (5.6 ind/km2).
A short study of a radio-collared male red brockets at the same site estimated a home range of
52 ha and a density of 1.92 ind/km2 across the riverine—piedmont—cerrado gradient (Maffei and
Taber 2003). We think that gray brockets become more abundant and red brockets tend to disappear
towards the drier and more open habitats of the chaco and the cerrado like the ones in our study
site. At our site, gray brockets dominate but both species are relatively abundant.
We believe that our line-transect estimation of 5.6 gray brocket individuals per km2, although
the highest in the literature, is plausible and can be supported by the diverse and high quality
habitats of the ranch, under no hunting pressure. Although we do not have line-transect estimates
for red brockets, we think their density was between 1/3 and 1/4 that of grays for all habitats
combined (about 1.4–1.9 ind/km2), despite the fact that total sightings were only 1/7 that of grays
(6:42). The low sighting rate of red brockets may have been caused by their mostly nocturnal
10
pattern of activity which would not be captured by daytime censuses. Activity patterns recorded
by camera traps at our site and additional analyses of dung and track data showed that the two
deer species shared habitats but used them at different times and intensities (Rivero et al. 2005).
Our data confirm that indices of abundance based on dung or track encounter rates vary seasonally
and among habitats, but we think it is possible to "calibrate" some of them to make reliable
comparisons and to calculate absolute density. For assessing brocket deer populations in scenarios
similar to our site we suggest that:
1. Pellet-group counts work better in the dry season when dung decay is minimal and sampling
intervals may be longer, while track indices may be more appropriate in the wet season. This
selection will allow more events per unit of effort to be recorded and stronger statistical analyses
to be applied.
2. It is necessary to obtain better estimates of daily defecation rates and the factors affecting them.
Intensive radio-tracking and interpretation of sign may provide data on the distribution of one
individual’s dung (pellet-group numbers, use of latrines, etc.), habitat selection and main foods
used.
3. Stronger relationships among indices and better predictions of density may be obtained after
controlling for factors that affect sign or animal detectability. In the case of comparing different
indices or their repeated measures over time, we stress the need to assure inter-observer reliability,
assess habitat differences for dung/track survival and detectability, and conduct line transects
at times when individuals of each species are more likely to be sighted. We expect that further
assessments of these indices and the development of new estimates of abundance based on
systematic camera trapping will improve our ability to monitor brocket deer populations.
Acknowledgements We thank Ronald Larsen, the owner of the ranch, and Negro Mejía, don
Adolfo and doña Dirma Pizarro for their invaluable support in the field. Fellow biologists Alfredo
Fuentes, Jose Luis Santivañez, Erika Cuéllar, and Leo Maffei also made this study possible with
their help and companionship at La Pascana. We are grateful to E. Cuéllar for allowing us to use
her track-plot data and to Humberto Gomez for helping with the distance analysis. Louise Emmons,
Rob Wallace, Andy Noss, Luis Pacheco, and two anonymous reviewers provided useful comments
on the manuscript. The study was funded by the Wildlife Conservation Society through an agreement
with the Museo Noel Kempff Mercado, UAGRM. The Santa Cruz Zoo kindly gave us access to
their captive deer. This research complies with the current laws of Bolivia.
11
ReferencesAyala J, Noss A (1999) Censos por transectas en el chaco boliviano: limitaciones biológicas y sociales dela metodología. In: Estudios de investigación y manejo de fauna enel Izozog y Parque Nacional Kaa Iya.CABI-WCS, Santa Cruz, pp 72–85
Barnes RFW, Barnes KL (1992) Estimating decay rates of elephant dung piles in forest. Afr J Ecol 30:316–321
Bodmer RE (1997) Ecologia e conservacao dos veados mateiro e catingueiro na Amazonia. In: Duarte JM(ed) Biologia e conservaçao de Cervideos Sul Americanos: Blastoceros, Ozotoceros e Mazama. FUNEP,Jaboticabal, pp 70–77
Buckland ST, Anderson DR, Burnham KP, Laake JL (1993) Distance sampling: estimating abundance ofbiological populations. Chapman Hall, London
Conroy MJ (1996) Abundance indices. In: Wilson DE, Cole FR, Nichols JD, Rudran R, Foster M (eds)Measuring and monitoring biological diversity: standard methods for mammals. Smithsonian InstitutionPress, Washington, pp 179–192
Cuellar E (1997) Evaluación de una comunidad de mamíferos medianos y grandes en una zona de bosquesemideciduo Chiquitano empleado como método principal el estudio y clasificación de huellas. LicenciaturaThesis, UAGRM, Santa Cruz
Emmons LH, Feer F (1997) Neotropical rainforest mammals: a field guide, 2nd edn. University of ChicagoPress, Chicago
Fuentes A, Navarro G (2000) Estudio fitosociológico de la vegetación de una zona de contacto Chaco-Cerradoen Santa Cruz (Bolivia). Lazaroa 21:73–109
Guinart D (1997) Los mamíferos del bosque semideciduo neotropical de Lomerío (Bolivia): interacciónindígena. PhD Thesis, Universidad de Barcelona, Barcelona
Hill K, Padwe J (2000) Sustainability of Aché hunting in the Mbaracayu Reserve, Paraguay. In: RobinsonJR, Bennett EL (eds) Hunting for sustainability in tropical forests. Columbia University Press, New York,pp 79–105
Hurtado-Gonzales JL, Bodmer RE (2004) Assessing the sustainability of brocket deer hunting in theTamshiyacu-Tahuayo Communal Reserve, northeastern Peru. Biol Conserv 116:1–7
Maffei L, Taber AB (2003) Area de accion de Mazama americana (Cervidae) en un bosque seco de Bolivia.Ecol Bolivia 38:179–180
Noss AJ, Cuéllar E, Cuéllar RS (2003) Hunter self-monitoring as a basis for biological research: data fromthe Bolivian Chaco. J Neotrop Mamm 10:49–67
Ojasti J (1993) Utilización de la fauna silvestre en América Latina: situación y perspectivas para un manejosostenible. Guía FAO Conserv 25:1–248
Peres CA (2000) Evaluating the impact and sustainability of subsistence hunting at multiple Amazonianforest sites. In: Robinson JG, Bennett EL (eds) Hunting for sustainability in tropical forests. ColumbiaUniversity Press, New York, pp 31–56
Pinder L, Leeuwenberg F (1997) Veado catingueiro (Mazama gouazoubira, Fisher 1814). In: Duarte JM(ed) Biologia e conservaçao de Cervideos Sul Americanos: Blastoceros, Ozotoceros e Mazama. FUNEP,Jaboticabal, pp 60–68
Rabinowitz A (1993) Wildlife field research and conservation training manual. Wildlife ConservationSociety, New York
Rivero K (1997) Densidad poblacional y uso de hábitat de Mazama gouazoubira y Mazama americana enla estancia San Miguelito, provincia Ñuflo de Chavez, Santa Cruz, Bolivia. Licenciatura Thesis, UAGRM,Santa Cruz
Rivero K, Rumiz DI, Taber AB (2005) Differential habitat use by two sympatric brocket deer species(Mazama americana and M. gouazoubira) in a seasonal Chiquitano forest of Bolivia. Mammalia (in press)
Rumiz DI, Guinart S, Solar L, Herrera JC (2001) Logging and hunting in community forests and loggingconcessions: two contrasting case studies in Bolivia. In: Fimbel RA, Grajal A, Robinson JG (eds) The cuttingedge, conserving wildlife in logged tropical forests. Columbia Unversity Press, New York, pp 333–358
Schaller G (1983) Mammals and their biomass on a Brazilian ranch. Arqui Zool 31:1–36
12
SYSTAT (1997) Systat 7.0 for Windows: statistics. SPSS, Chicago
Townsend W (1996) Nyao ito: caza y pesca de los siriono. Instituto de Ecologia, UMSA Fund-Eco, La Paz
Walker RS, Novaro AJ, Nichols JD (2000) Consideraciones para la estimación de abundancia de poblacionesde mamíferos. J Neotrop Mamm 7:73–80
13

Tab
le 1 Gray and red brocket deer density estimations based on dung counts between various day intervals (
DI) in four habitats of the Chiquitano forest
Cerrado
Piedmont
Riverine
Chaco
Wet season
5030
4060
Total sampling (km)
6–27
7–11
6–11
6–11
DI range (days)
Gray brocket
964
4439
No. pellet groups
9.55
1.27
9.93
6.33
Density (ind/km2 )
6.9
2.2
12.3
8.9
SD
Red brocket
54
4412
No. pellet groups
0.57
1.27
8.99
1.86
Density (ind/km2 )
0.53
2.2
11.9
2.7
SD
Dry season
2030
2020
Total sampling (km)
27–34
3–32
6–38
8–45
DI range (days)
Gray brocket
132
76273
236
No. pellet groups
14.44
11.80
62.78
33.24
Density (ind/km2 )
0.18
9.0
41.6
7.2
SD
Red brocket
2615
6314
No. pellet groups
2.60
4.89
17.69
2.75
Density (ind/km2 )
2.9
4.1
15.8
2.0
SD
14
Tab
le 2 Indices of abundance of the two deer species estimated for two seasons and four habitats in the Chiquitano forest. Dung, track, and individual encounters per km, plus density
based on dung and line transects (L
T) derived from our study; frequency of tracks in plots from Cuellar (1997)
Season average±SD
Cerrado
Piedmont
Riverine
Chaco
Abundance indices
Season, species
0.95±0.8
1.92
0.13
1.10
0.65
Pellet groups/km
Wet season, gray brockets
6.77±4.0
9.55
1.27
9.93
6.33
Density (dung; ind/km
2 )2.64±1.8
5.32
1.97
1.78
1.48
Tracks/km
24.25 ±14.1
17.00
8.00
35.00
37.00
Tracks/plot
0.09±0.06
0.06
0.03
0.10
0.17
Ind/km
4.4
LT density (ind/km2 )
0.38±0.5
0.10
0.13
1.10
0.20
Pellet groups/km
Wet season, red brockets
3.52±4.6
0.57
1.27
8.99
1.86
Density (dung; ind/km
2 )0.90±0.9
0.14
0.97
2.08
0.42
Tracks/km
3.50±3.0
0.00
6.00
6.00
2.00
Tracks/plot
0.01±0.03
0.00
0.00
0.05
0.00
Ind/km
8.65±5.0
6.60
2.53
13.65
11.80
Pellet groups/km
Dry season, gray brockets
30.57±23.5
14.44
11.80
62.78
33.24
Density (dung; ind/km
2 )2.53±1.2
2.80
0.87
3.85
2.60
Tracks/km
44.75±27.6
22.00
21.00
76.00
60.00
Tracks/plot
0.21±0.05
0.15
0.22
0.26
0.20
Ind/km
7.7
LT density (ind/km2 )
1.41±1.2
1.30
0.50
3.15
0.70
Pellet groups/km
Dry season, red brockets
6.98±7.2
2.60
4.89
17.69
2.75
Density (dung)
0.76±0.9
0.10
0.30
2.10
0.55
Tracks/km
12.00±11.2
0.00
5.00
22.00
21.00
Tracks/plot
0.04±0.03
0.04
0.04
0.07
0.00
Ind/km
15
Tab
le 3 Correlationa among five indices of abundance obtained for red and gray brocket deer in our Chiquitano forest site
Grays
Ind/km
Tracks/plot
Tracks/km
Density (dung)
Dung/km
Reds
0.720
0.836
0.342
0.925*
Dung/km
0.742
0.902*
0.364
0.920*
Density (dung)
−0.167
0.168
0.827
0.654
Tracks/km
0.748
0.527
0.625
0.617
Tracks/plot
0.280
0.617
0.854
0.837
Ind/km
a Pearson r, eight pairs, Bonferroni adjusted
*P< 0.05
16
Copyright © 2022 FDOKUMEN