Estimates of forest elephant abundance: projecting the relationship between precision and effort
12
Journal of Applied Ecology 2001 38 , 217– 228 © 2001 British Ecological Society Blackwell Science, Ltd Oxford, UK JAPPL Journal of Applied Ecology 0021-8901 British Ecological Society, 2001 38 1 2001 578 Forest elephant survey precision P.D. Walsh et al. Forum 000 000 Graphicraft Limited, Hong Kong FORUM Estimates of forest elephant abundance: projecting the relationship between precision and effort PETER D. WALSH*§, LEE J.T. WHITE*, CHRISTIAN MBINA†, DANIEL IDIATA†‡, YVES MIHINDOU†, FIONA MAISELS* and MARC THIBAULT† * Africa Program, Wildlife Conservation Society, Bronx, NY 10024, USA; † World Wildlife Fund, Central Africa Regional Program Office, B.P. 9144, Libreville, Gabon; ‡ Direction de la Faune et de la Chasse, Ministère des Eaux et Forêts, de la Pêche, du Reboisement, chargé de l’Environnement et de la Protection de la Nature, B.P. 1128, Libreville, Gabon; and § Department of Ecology and Evolutionary Biology, Princeton University, Princeton, NJ 08544, USA Summary 1. A key element of African elephant conservation is monitoring how different forms of human activity influence elephant distribution and abundance. Information on human–elephant interaction is critical for guiding conservation action at all levels, from very local management interventions, through national protected area planning, to international policy initiatives such as the ban on ivory trade. However, methods for monitoring elephant numbers often produce rather poor estimate precision. Therefore, a major challenge for elephant monitoring programmes at all levels is to allocate survey effort efficiently: the greatest possible statistical power to detect the effects of particular forms of human activity must be obtained from limited survey effort. 2. This study examined an approach to survey design based on the assumption that the precision of an abundance estimate is directly proportional to sampling effort. Field data from three sites in Central Africa were used to evaluate the potential of this approach for projecting how much effort will be necessary to survey and monitor forest elephants. 3. Variance in elephant dung pile encounter rate was proportional to sampling effort, but variance was also influenced by mean encounter rate. The relationship between variance and mean encounter rate followed a power law more closely than the linear model suggested by many previous authors. The linear model tended to substantially underestimate the effort level required for areas with high encounter rates. A bootstrapping exercise suggested that modelling the precision–effort relationship across strata should produce more accurate projections than estimating a distinct precision–effort relationship for each stratum. 4. Our results suggest that the survey design framework examined could substantially improve the statistical power of forest elephant monitoring programmes, although the use of a power law (rather than linear) model seems preferable. A similar approach should be appropriate for designing savanna elephant monitoring programmes and for addressing other issues, including rates of hunting and human elephant conflict. Furthermore, the parameter estimates reported in this study should be useful in designing elephant survey and monitoring programmes at other forested sites in Central Africa. Key-words : Central Africa, optimal allocation, survey design, Taylor’s power law, transects, variance inflation. Journal of Applied Ecology (2001) 38 , 217– 228 Correspondence: Peter Walsh, PO Box 478, Ringoes, NJ 08551, USA (e-mail [email protected]).
Transcript of Estimates of forest elephant abundance: projecting the relationship between precision and effort
Journal of Applied Ecology
2001
38
, 217–228
© 2001 British Ecological Society
Blackwell Science, LtdOxford, UKJAPPLJournal of Applied Ecology0021-8901British Ecological Society, 20013812001578Forest elephant survey precisionP.D. Walsh et al.Forum000000Graphicraft Limited, Hong Kong
FORUM
Estimates of forest elephant abundance: projecting the relationship between precision and effort
PETER D. WALSH*§, LEE J.T. WHITE*, CHRISTIAN MBINA†, DANIEL IDIATA†‡, YVES MIHINDOU†, FIONA MAISELS* and MARC THIBAULT†
*
Africa Program, Wildlife Conservation Society, Bronx, NY 10024, USA;
†
World Wildlife Fund, Central Africa Regional Program Office, B.P. 9144, Libreville, Gabon;
‡
Direction de la Faune et de la Chasse, Ministère des Eaux et Forêts, de la Pêche, du Reboisement, chargé de l’Environnement et de la Protection de la Nature, B.P. 1128, Libreville, Gabon; and
§
Department of Ecology and Evolutionary Biology, Princeton University, Princeton, NJ 08544, USA
Summary
1.
A key element of African elephant conservation is monitoring how different formsof human activity influence elephant distribution and abundance. Information onhuman–elephant interaction is critical for guiding conservation action at all levels, fromvery local management interventions, through national protected area planning, tointernational policy initiatives such as the ban on ivory trade. However, methods formonitoring elephant numbers often produce rather poor estimate precision. Therefore,a major challenge for elephant monitoring programmes at all levels is to allocate surveyeffort efficiently: the greatest possible statistical power to detect the effects of particularforms of human activity must be obtained from limited survey effort.
2.
This study examined an approach to survey design based on the assumption that theprecision of an abundance estimate is directly proportional to sampling effort. Fielddata from three sites in Central Africa were used to evaluate the potential of thisapproach for projecting how much effort will be necessary to survey and monitor forestelephants.
3.
Variance in elephant dung pile encounter rate was proportional to sampling effort,but variance was also influenced by mean encounter rate. The relationship betweenvariance and mean encounter rate followed a power law more closely than the linearmodel suggested by many previous authors. The linear model tended to substantiallyunderestimate the effort level required for areas with high encounter rates. A bootstrappingexercise suggested that modelling the precision–effort relationship across strata shouldproduce more accurate projections than estimating a distinct precision–effort relationshipfor each stratum.
4.
Our results suggest that the survey design framework examined could substantiallyimprove the statistical power of forest elephant monitoring programmes, although theuse of a power law (rather than linear) model seems preferable. A similar approach shouldbe appropriate for designing savanna elephant monitoring programmes and for addressingother issues, including rates of hunting and human elephant conflict. Furthermore, theparameter estimates reported in this study should be useful in designing elephant surveyand monitoring programmes at other forested sites in Central Africa.
Key-words
: Central Africa, optimal allocation, survey design, Taylor’s power law,transects, variance inflation.
Journal of Applied Ecology
(2001)
38
, 217–228
Correspondence: Peter Walsh, PO Box 478, Ringoes, NJ 08551, USA (e-mail [email protected]).
JPE578.fm Page 217 Monday, March 5, 2001 1:32 PM
218
P.D. Walsh
et al
.
© 2001 British Ecological Society,
Journal of Applied Ecology
,
38
,217–228
Introduction
In a recent study Hoare (1999) examined the causes ofhuman–elephant conflict. Although elephant densitywas found to have a significant effect on rates of con-flict, the effect was weak. Hoare concluded that rates ofconflict in a given region are determined less by the meandensity of elephants or human settlement than by thespatial grain of mixing between human settlements andelephant habitat. A coarse-grained pattern of settlement,with villages and agricultural activity concentrated inone block and elephants in another, limits the amountof conflict because it minimizes the amount of elephanthabitat that lies in close proximity to human settlements.The more human settlements are scattered throughelephant habitat and the more perimeter each settlementpresents, the greater the rate of conflict will be.
The spatial grain issues raised by Hoare are alsopertinent to other major elephant conservation issues.The impact that habitat degradation has on elephantsis undoubtedly strongly determined by the grain ofdegradation. Degrading one contiguous block ofhabitat has a different impact on elephants thandegrading many scattered pockets with the same totalarea. In addition, spatial grain plays an importantrole in the dynamics of commercial hunting, probablythe most important elephant conservation problemin the forests of Central Africa (Barnes
et al
. 1991;Fay & Agnagna 1991; Barnes, Agnangna & Alers1993; Barnes, Blom & Alers 1995). Access to remoteareas to hunt represents a serious logistical challenge,as does getting the product (ivory or meat) out to mar-ket. Consequently, large roadless blocks of habitat tendto experience much lower hunting rates than moreaccessible areas (Fay & Agnagna 1991; Barnes
et al
.1991; Barnes, Blom & Alers 1995; Michelmore
et al
.1995). Unfortunately, commercial forestry, mining andpetroleum operations are currently building roads intoonce inaccessible areas at a rapid rate, thereby reducingthe habitat grain and increasing rates of poaching.
In all of these cases, remediating the effects ofinevitable human expansion requires a more detailedunderstanding of how the spatial grain of human activ-ity affects elephants. A critical issue in gaining thisunderstanding is statistical power. The ability to detectthe causal role of a given form of human activity onelephants is constrained by the precision with whichthe pertinent variables are estimated. For instance, theprecision with which human or elephant density isestimated limits the power to detect a significant effectof these factors on the rate of human–elephant conflict.Likewise, the precision with which carcass or elephantdensity is estimated limits the power to detect theeffects of forestry or protective activities on illegalhunting rate. Monitoring programmes, such as thecontinent-wide Monitoring of Illegal Killing of Elephants(MIKE) programme now being developed by theConvention on International Trade in EndangeredSpecies (CITES), will be of little practical utility if their
statistical power is so weak that they cannot detectwhat are actually substantive causal effects on rates ofconflict, competition or hunting.
Unfortunately, several factors tend to promote lowestimate precision in African elephant survey andmonitoring. Problems are particularly severe in theforests of Central Africa. Central African protectedareas are typically large (on the scale of 3000–4000 km
2
;Walsh
et al
. 2000) and inaccessible. This limits sam-pling intensity and means that a substantial proportionof effort must be invested in arduous foot travelbetween sampling locations. In addition, infrastruc-ture is generally poor, staff training levels are typicallylow, and the amount of effort available for survey andmonitoring activities is usually modest. Furthermore,the difficulty of travel and observation in the forestmeans that the amount of data that can be collected perunit researcher effort is low. For example, a team of fivepersons cutting line transects in heavy forest can expectto complete only about 1–1·5 km of transect a day(Walsh & White 1999). Furthermore, forest elephant
Loxodonta africana cyclotis
Matschie surveys aretypically based on dung piles because of the difficultyof detecting live elephants before they flee (Barnes &Jensen 1987). In order to convert dung counts intoelephant counts it is necessary to estimate dung piledegradation rate (Barnes & Jensen 1987; Barnes &Barnes 1992; Barnes, Agnangna & Alers 1993; White1994) and elephant defecation rate (Tchamba 1991),which both siphon away effort and add sources ofsampling variance (Walsh & White 1999). All of thesefactors have a negative impact on estimate precision(Plumptre 2000), thus placing a high premium onefficient allocation of sampling effort.
One promising avenue for improving the statisticalpower of elephant monitoring programmes lies inexploiting the fact that elephant density (Barnes
et al
.1991; Fay & Agnagna 1991; Barnes
et al
. 1995; Barnes,Blom & Alers 1995; Michelmore
et al
. 1995; Walsh
et al
. 2000), human–elephant conflict and elephanthunting (Fay & Agnagna 1991; Barnes
et al
. 1991;Barnes, Agnangna & Alers 1993; Fay & Agnagna 1993;Barnes
et al
. 1995; Barnes, Blom & Alers 1995) all tendto vary predictably in space. If distinct strata that arerelatively homogeneous for the pertinent factor can bedefined (Michelmore
et al
. 1995; Barnes
et al
. 1995)then well known methods can be used to allocate effortto different strata (Thomson 1992; Buckland
et al
.1993). For example, in the case in which elephant abund-ance (E) is being estimated using strip transects, thevariance of an estimate of abundance for a study areacomprised of
s
strata can be assumed to be the sum ofthe individual stratum variances:
eqn 1
The key to optimizing sampling effort is to express theestimate variance for each stratum in terms of samplingeffort. To do so, first recognize that abundance is just
var E( ) var E1( ) var E2( ) … var Es( ).+ + +=
JPE578.fm Page 218 Monday, March 5, 2001 1:32 PM
219
Forest elephant survey precision
© 2001 British Ecological Society,
Journal of Applied Ecology
,
38
,217–228
the product of stratum density and stratum area. Next,note that, with strip transects, elephant density is equalto the encounter rate [the number of elephants (
n
)encountered in length
L
] divided by the strip width (
w
),which we take to be a constant. Finally, as a con-sequence of the law of large numbers (Ross 1997), the vari-ance in an estimate of encounter rate should be inverselyproportional to the number of replicates (sample size)used to make that estimate. When all transects are thesame length, sample size is directly proportional tototal transect length (
L
), so that one can write:
eqn 2
The constant
β
can be estimated by performing apilot study of length
6
. If dung piles are observedduring the pilot study, then:
We can now use all of this information in rewritingthe equation for the overall estimate of the variance ofan estimate of abundance in terms of sampling effort:
eqn 3
where
A
1
is the area of stratum 1 and lower case
l
rep-resents total sampling effort that will be allocated ineach stratum. Any allocation of sampling effort tostrata (any combination of values for
l
) can be pluggedinto this equation to predict what var(
E
) that allocationof effort will produce. In practice, either analyticalor numerical search methods can be used to find theoptimal allocation of sampling effort to strata, givensome constrained quantity of total sampling effort,
L
. Alternatively, one can search for the (unconstrained)allocation of effort that will achieve a target estimatevariance (for discussions of how to choose a targetvariance see Eberhardt 1978 or Buckland
et al
. 1993).Although, for the sake of simplicity, the develop-
ment above is given in terms of strip transects thatcount elephants, the same principles apply equally toother sampling methods (e.g. line transects or quad-rats) and other types of data (e.g. carcasses, dung pilesor incidents of conflict). In fact, this general frameworkcould be used to optimize sampling effort for just aboutany kind of elephant monitoring programme. How-ever, there is one potential complication in the applica-tion of this framework to elephant survey andmonitoring. A great deal of research has shown quiteconvincingly that the sampling variance for the meanof a random variable often varies as a function of themean (Wedderburn 1974; Cox 1983). This tendencyhas been found to be particularly strong for animalcount data (Taylor 1961). The implication for elephantsurvey design is that a value of
β
estimated from a pilotstudy will only accurately project the relationshipbetween effort and sampling variance for strata withthe same mean density as the pilot stratum.
Of course, one could just conduct pilot surveys atevery stratum for which a sampling effort projectionwas required, then estimate a distinct value of
β
foreach stratum. But this may be a poor solution if relat-ively little sampling effort is used to estimate
β
for eachstratum. In this case each separate estimate of
β
wouldhave low precision and therefore would tend do a verypoor job of projecting how much effort actually wouldbe required at that site to achieve the desired precision.As a consequence, some strata would be allocatedfar too much sampling effort and others not nearlyenough. A better solution would be to conduct pilotstudies at sites with a range of densities, then model therelationship between variance and mean. For example,some authors (Eberhardt 1978; Burnham, Anderson &Laake 1980; Buckland
et al
. 1993) suggest assumingthat sampling variance inflates linearly. On the otherhand, in a long series of papers, Taylor (Taylor 1961;Taylor, Woiwood & Perry 1978; Taylor & Woiwod 1982;Taylor
et al
. 1988) has argued that variance in animalcounts generally inflates as a power function of the mean.
In this study we used counts of elephant dung pilesthat we made in and around three Central Africanprotected areas to examine the applicability of thisvariance projection framework to elephant survey andmonitoring. We compared several functional formsfor modelling the relationship between the varianceand mean of dung pile counts, and investigated howmuch the variance projections of the different modelsdiffered over the range of encounter rates that aretypical of elephant dung pile studies. We also usednon-parametric bootstrapping (Efron & Tibshirani 1993)to investigate the effect that estimating the variance–mean relationship across strata has on the variance ofsampling effort projections relative to the case in whicha distinct value of
β
is estimated for each stratum.
Methods
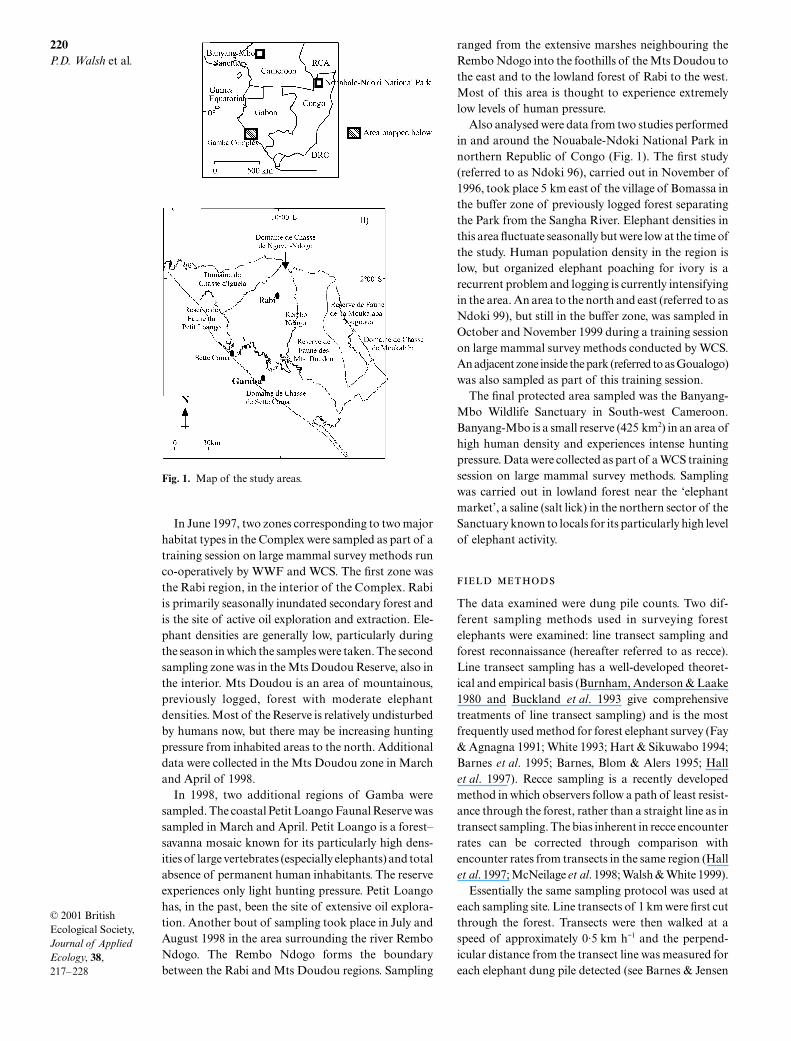
The majority of the data presented here were collectedat the Gamba Complex, a system of protected areas(four wildlife reserves and four hunting domains)covering an area of about 12 000 km
2
in south-westernGabon (Fig. 1). The Complex is a stronghold for largevertebrates, including substantial populations of forestelephant, hippopotamus
Hippopotamus
amphibus
Linne,buffalo
Syncerus
caffer
nanus Boddaert, crocodile
Crocodilus
niloticus
Laurenti, gorilla
Gorilla
gorillagorilla
Savage & Wyman, chimpanzee
Pan
troglodytes
Blumenbach and manatee
Trichechus
senegalensis
Link. Gamba is the site of a recently completedlarge mammal survey, a collaboration between theGabonese Direction de la Faune et de la Chasse, theWorld Wildlife Fund (WWF), and the Wildlife Con-servation Society (WCS). The survey was conducted toprovide hard data with which a management plan forthe region might be prepared.
var n/L( )βL----.=
n̂
βvar ni /6( )
6-----------------------.=
var E( )βA1
w1l1----------
βA2
w2l2---------- …
βAm
wmlm------------,+ + +=
JPE578.fm Page 219 Monday, March 5, 2001 1:32 PM
220
P.D. Walsh
et al
.
© 2001 British Ecological Society,
Journal of Applied Ecology
,
38
,217–228
In June 1997, two zones corresponding to two majorhabitat types in the Complex were sampled as part of atraining session on large mammal survey methods runco-operatively by WWF and WCS. The first zone wasthe Rabi region, in the interior of the Complex. Rabiis primarily seasonally inundated secondary forest andis the site of active oil exploration and extraction. Ele-phant densities are generally low, particularly duringthe season in which the samples were taken. The secondsampling zone was in the Mts Doudou Reserve, also inthe interior. Mts Doudou is an area of mountainous,previously logged, forest with moderate elephantdensities. Most of the Reserve is relatively undisturbedby humans now, but there may be increasing huntingpressure from inhabited areas to the north. Additionaldata were collected in the Mts Doudou zone in Marchand April of 1998.
In 1998, two additional regions of Gamba weresampled. The coastal Petit Loango Faunal Reserve wassampled in March and April. Petit Loango is a forest–savanna mosaic known for its particularly high dens-ities of large vertebrates (especially elephants) and totalabsence of permanent human inhabitants. The reserveexperiences only light hunting pressure. Petit Loangohas, in the past, been the site of extensive oil explora-tion. Another bout of sampling took place in July andAugust 1998 in the area surrounding the river RemboNdogo. The Rembo Ndogo forms the boundarybetween the Rabi and Mts Doudou regions. Sampling
ranged from the extensive marshes neighbouring theRembo Ndogo into the foothills of the Mts Doudou tothe east and to the lowland forest of Rabi to the west.Most of this area is thought to experience extremelylow levels of human pressure.
Also analysed were data from two studies performedin and around the Nouabale-Ndoki National Park innorthern Republic of Congo (Fig. 1). The first study(referred to as Ndoki 96), carried out in November of1996, took place 5 km east of the village of Bomassa inthe buffer zone of previously logged forest separatingthe Park from the Sangha River. Elephant densities inthis area fluctuate seasonally but were low at the time ofthe study. Human population density in the region islow, but organized elephant poaching for ivory is arecurrent problem and logging is currently intensifyingin the area. An area to the north and east (referred to asNdoki 99), but still in the buffer zone, was sampled inOctober and November 1999 during a training sessionon large mammal survey methods conducted by WCS.An adjacent zone inside the park (referred to as Goualogo)was also sampled as part of this training session.
The final protected area sampled was the Banyang-Mbo Wildlife Sanctuary in South-west Cameroon.Banyang-Mbo is a small reserve (425 km
2
) in an area ofhigh human density and experiences intense huntingpressure. Data were collected as part of a WCS trainingsession on large mammal survey methods. Samplingwas carried out in lowland forest near the ‘elephantmarket’, a saline (salt lick) in the northern sector of theSanctuary known to locals for its particularly high levelof elephant activity.
The data examined were dung pile counts. Two dif-ferent sampling methods used in surveying forestelephants were examined: line transect sampling andforest reconnaissance (hereafter referred to as recce).Line transect sampling has a well-developed theoret-ical and empirical basis (Burnham, Anderson & Laake1980 and Buckland
et al
. 1993 give comprehensivetreatments of line transect sampling) and is the mostfrequently used method for forest elephant survey (Fay& Agnagna 1991; White 1993; Hart & Sikuwabo 1994;Barnes
et al
. 1995; Barnes, Blom & Alers 1995; Hall
et al
. 1997). Recce sampling is a recently developedmethod in which observers follow a path of least resist-ance through the forest, rather than a straight line as intransect sampling. The bias inherent in recce encounterrates can be corrected through comparison withencounter rates from transects in the same region (Hall
et al
. 1997; McNeilage
et al
. 1998; Walsh & White 1999).Essentially the same sampling protocol was used at
each sampling site. Line transects of 1 km were first cutthrough the forest. Transects were then walked at aspeed of approximately 0·5 km h
−
1
and the perpend-icular distance from the transect line was measured foreach elephant dung pile detected (see Barnes & Jensen
Fig. 1. Map of the study areas.
JPE578.fm Page 220 Monday, March 5, 2001 1:32 PM

221
Forest elephant survey precision
© 2001 British Ecological Society,
Journal of Applied Ecology
,
38
,217–228
1987 for a methodological discussion of transect sam-pling of dung piles). At the end of each transect theresearch team walked 50 m in a direction perpendicu-lar to the direction of the transect. A recce was thenperformed roughly parallel to the transect, but in theopposite direction. Researchers on recce followed thepath of least resistance through the forest, while main-taining a compass bearing opposite to that used on thetransect. Dung piles observed on recce were noted butperpendicular distances were not measured.
Sampling at Ndoki differed from other sites in a fewminor respects. First, in 1996 only a single observer wasused, while two observers were always used thereafter.Secondly, 57 of 59 recces at Gamba and Banyang-Mbowere exactly 1 km (as measured using a hip chain). Thelength of the 1996 Ndoki recces varied around 1 km. In1999, transects at Ndoki were only 200 m while reccesvaried around 200 m.
For each stratum observed variance in the dung pileencounter rate was calculated as:
i
= 1,2
...k
where
l
i
is the length of transect
i
and
k
is the numberof transects in the stratum (Buckland
et al
. 1993).Three models of the relationship between
n
/
L
andthe expected variance var(
E
[
n
]/
L
) were considered.The first was simply that var(
E
[
n
]/
L
) was directlyproportional to mean encounter rate:
which would be apply if dung piles were randomly(Poisson) distributed through the environment. Inthe second model (suggested by Eberhardt 1978;Burnham, Anderson & Laake 1980; Buckland
et al
. 1993),var(
E
[
n
]/
L
) is assumed to increase linearly with
n
/
L
:
where
a
is a positive constant. The final model is basedon ‘Taylor’s power law’ (Taylor 1961; Perry & Woiwod1992; Routledge & Swartz 1992):
with both
a
and
b
assumed to be positive constants.One problem we faced in analysing our data was the
fact that two different transects lengths were used(1000 m and 200 m). This created a problem becausesample length (
L
) did not have the same relationship tosample size (
k
) for all strata. But simply using
k
insteadof
L
in the denominators of the above equations provedto be unsatisfactory because longer transects tend toaverage out small-scale variation in encounter rate.
Therefore, for a given sample size
k
, a sample with longtransects will tend to produce a lower estimate variancethan a sample with short transects. In an attempt toaccount for the effect of both
k
and
L
on estimateprecision we substituted the term for
L
in thedenominator of each model. This term fit the data sub-stantially better for each data set than
k
or
L
alone andit was used in all the analyses presented in the Results.
The parameters of the linear model were fitted to theempirical variances by minimizing the deviance:
i = 1,2...s.
The power law model was fitted by minimizing thedeviance:
. i = 1,2...s.
The three models form a nested set. The third (powerlaw) model is equivalent to the second model (linear)when b is set to 1. The linear model is equivalent to thefirst (direct) model when a is set equal to 1, as is thepower law model when a = 1 and b = 1. Paired t-tests(Press et al. 1989) based on the model deviances wereperformed in a nested set (Press et al. 1989): the linearmodel vs. the direct model and the power law model vs.the linear model. Natural logarithm (ln) transforma-tion was used in calculating the deviances in an attemptto conform to the t-test’s assumption of homosced-asticity of variances. In order to compare visuallythe predictions of the three models, we plotted theuntransformed observed values and thevalues predicted by each model against mean dung pileencounter rate.
To investigate the variance stabilizing effect ofestimating model parameters across multiple strata,we considered two scenarios. The first (optimistic)scenario was that each stratum had an underlyingvariance–effort relationship equal to the one predictedby the power law model and that the deviation ofthe observed values of from thevalues predicted by the model was entirely due tosampling error. The second (pessimistic) scenariowas that each stratum had a unique variance–effortrelationship that was estimated by the observed value of
. For each scenario we constructed10 000 pseudo-data sets for each stratum by boot-strapping (sampling with replacement) from thetransects or recces within a given stratum. For thepessimistic scenario we then stored the bootstrappedvariance–effort relationship, , foreach replicate and fitted the power law model acrossstrata. The fitted power law model was then used topredict a value of the variance–effort relationship,given the mean encounter rate of the bootstrappeddata for each stratum. The procedure for the optimisticscenario differed only in that after bootstrappingwe shifted the variance–effort relationship for eachstratum as follows:
var(nL----)
Σli (ni
li----
nL----)
2–
L k 1–( )------------------------------=
var E n[ ] /L( ) n/LL
---------= ,
var E n[ ] /L( )a n/L( )
L----------------= ,
var E n[ ] /L( ) a n/L( )b
L-------------------= ,
kL
∑{ln( kL varo(nli---)) ln(an
li---)}2– .
∑{ln( kLvaro(nli---)) ln(a(n
li---)b)}2–
kL varo n/L( )
ln kL var n/L( )( )
ln kL var n /L( )( )
ln kL varb n /L( )( )
JPE578.fm Page 221 Monday, March 5, 2001 1:32 PM
222P.D. Walsh et al.
© 2001 British Ecological Society, Journal of Applied Ecology, 38,217–228
This shift produced variance–effort estimates thatexhibited a sampling error reflecting the sample sizeand intertransect variability typical of the originalsample for each stratum, but were centred around thepower law model prediction derived from fitting to theoriginal sample.
For each scenario, for both the raw and fitted valuesof the variance–effort relationship the lower 95%bootstrap confidence limit was just the value of
or that wassmaller than all but 2·5% of bootstrapped values forthat stratum. The upper limit was the value for whichonly 2·5% of bootstrap iterations produced highervalues. For the raw and fitted values for each scenariowe also calculated a mean squared error (MSE) of thebootstrapped variance–effort ratios. For the optimisticscenario, MSE was calculated as:
MSE =
and for the pessimistic scenario:
where i = 1,...,s and j = 1,...,10 000.Note that because transect and recce samples were
carried out in matched pairs, dung pile encounterrates in members of a pair are highly correlated. Thus,the transect and recce data presented here cannot betreated as if they provide independent estimates of theprecision–effort relationship. Recce data were includedprimarily to show that the same variance–effort pat-terns observed for transect data are also applicable torecce data.
Results
A total of 161 recce–transect pairs was performed
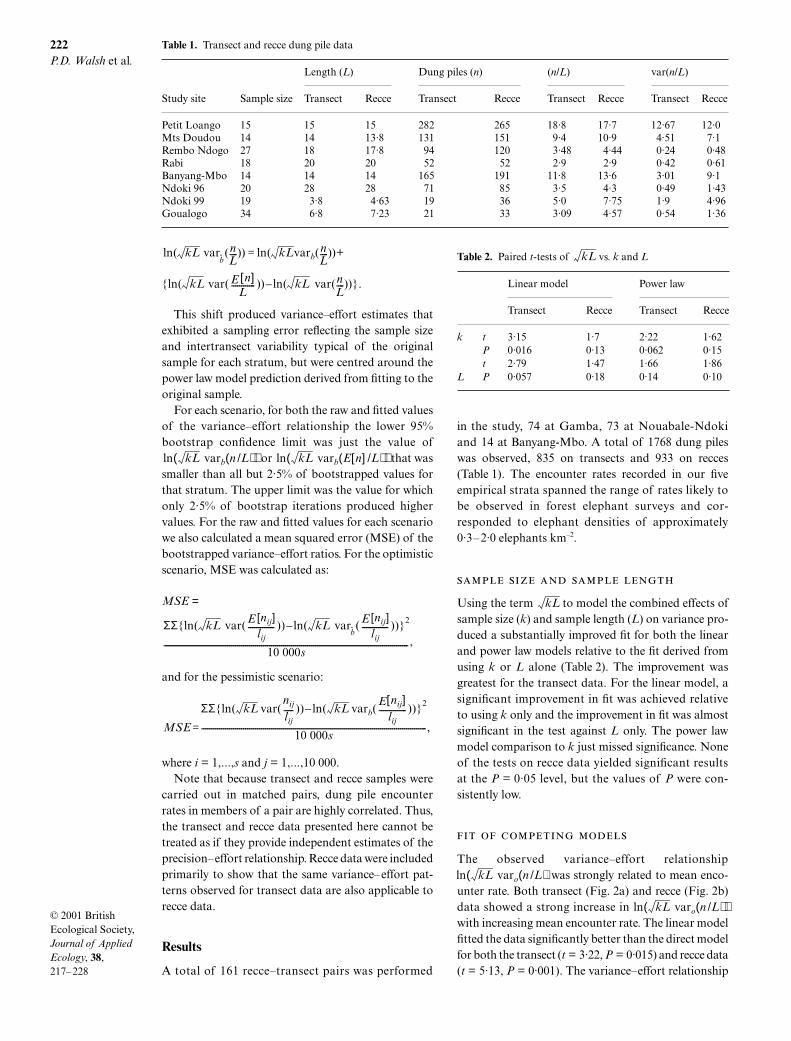
in the study, 74 at Gamba, 73 at Nouabale-Ndokiand 14 at Banyang-Mbo. A total of 1768 dung pileswas observed, 835 on transects and 933 on recces(Table 1). The encounter rates recorded in our fiveempirical strata spanned the range of rates likely tobe observed in forest elephant surveys and cor-responded to elephant densities of approximately0·3–2·0 elephants km–2.
Using the term to model the combined effects ofsample size (k) and sample length (L) on variance pro-duced a substantially improved fit for both the linearand power law models relative to the fit derived fromusing k or L alone (Table 2). The improvement wasgreatest for the transect data. For the linear model, asignificant improvement in fit was achieved relativeto using k only and the improvement in fit was almostsignificant in the test against L only. The power lawmodel comparison to k just missed significance. Noneof the tests on recce data yielded significant resultsat the P = 0·05 level, but the values of P were con-sistently low.
The observed variance–effort relationship was strongly related to mean enco-
unter rate. Both transect (Fig. 2a) and recce (Fig. 2b)data showed a strong increase in with increasing mean encounter rate. The linear modelfitted the data significantly better than the direct modelfor both the transect (t = 3·22, P = 0·015) and recce data(t = 5·13, P = 0·001). The variance–effort relationship
ln( kL varb̂(nL----)) ln( kLvarb(n
L----))+=
{ln( kL var( E n[ ]L
------------ )) ln( kL var(nL----))}.–
ln kL varb n /L( )( ) ln kL varb E n[ ] /L( )( )
ΣΣ{ln( kL var( E [nij]lij
------------- )) ln( kL varb̂( E [nij]
lij------------- ))}2–
10 000 s ---------------------------------------------------------------------------------------------------------------------------
,
MSE
ΣΣ{ln( kL var(nij
lij----- )) ln( kL varb(
E nij[ ]lij
-------------- ))}2–
10 000 s -----------------------------------------------------------------------------------------------------------------
=
,
Table 1. Transect and recce dung pile data
Length (L) Dung piles (n) (n/L) var(n/L)
Study site Sample size Transect Recce Transect Recce Transect Recce Transect Recce
Petit Loango 15 15 15 282 265 18·8 17·7 12·67 12·0Mts Doudou 14 14 13·8 131 151 9·4 10·9 4·51 7·1Rembo Ndogo 27 18 17·8 94 120 3·48 4·44 0·24 0·48Rabi 18 20 20 52 52 2·9 2·9 0·42 0·61Banyang-Mbo 14 14 14 165 191 11·8 13·6 3·01 9·1Ndoki 96 20 28 28 71 85 3·5 4·3 0·49 1·43Ndoki 99 19 3·8 4·63 19 36 5·0 7·75 1·9 4·96Goualogo 34 6·8 7·23 21 33 3·09 4·57 0·54 1·36
kL
Table 2. Paired t-tests of vs. k and L
Linear model Power law
Transect Recce Transect Recce
k t 3·15 1·7 2·22 1·62P 0·016 0·13 0·062 0·15t 2·79 1·47 1·66 1·86
L P 0·057 0·18 0·14 0·10
kL
ln kL varo n /L( )( )
ln kL varo n /L( )( )
JPE578.fm Page 222 Monday, March 5, 2001 1:32 PM

223
Forest elephant survey precision
© 2001 British Ecological Society,
Journal of Applied Ecology
,
38
,217–228
predicted by the power law model fitted the empiricalvariances better than the linear model. This differencewas significant for the recce data but not for thetrmansect data (Table 3). Fitted parameter estimatesfor the linear and power law models are presented inTable 3. The ‘error’ column presents the sum of squareddeviations of each model’s predictions from the observedvariance–effort relationship. Note that recce andtransect data yielded very similar estimates of the slopeparameter ‘
b
’.
The three models produced substantially differentprojections of the precision that should be achieved,given a particular level of effort. At low encounterrates the linear model projected that much more effortwould be needed to achieve a given variance thanwas projected by the power law models (Fig. 3a,b). Forinstance, our transect data suggested that at a very
low encounter rate (1 dung pile km
–1
) the linear modelprojected an estimate variance that was 3·6 times higherthan the variance projected by the power law model. Ata high encounter rate (20 dung piles km
–1
) the linearmodel underestimated the power law model by 58%.The direct model did well at a low encounter rate, but ata high encounter rate underestimated the power lawmodel by a factor of about 9.
The magnitude of differences in the projections ofthe alternate models may be made clearer through anexample. Imagine you are planning surveys at two siteswith respective surface areas of
A
1
= 100 km
2
and
A
2
= 200 km
2
and can perform a total of 100 km ofstrip transect. To simplify calculations consider variancein dung density, var(
D
), rather than elephant density
and treat our data as if it came from strip (rather thanline) transects with a strip width of 10 m = 0·01 km.Also, assume that each transect is 1 km so that samplesize equals sample length and . A pilot studyshows that mean dung pile encounter rates at sites 1and 2 are, respectively,
n
1
/
l
1
= 20 dung piles km
–1
and
n
2
/
l
2
= 2 dung piles km
–1
. We can now replace
β
inequation 3 with the linear model term , theninsert values for
A
1
,
A
2
,
w
, and
a
(from Table 3) to get:
.
Fig. 2. Relationship between and mean dung pile encounter rate as predicted by the direct, linear and powerlaw models: (a) transect data; (b) recce data. Open squares are the observed values for each stratum.
kL var E n[ ] /L( )
Table 3. Model parameter estimates
Model a b Error Paired t P
Transect Linear 3·59 – 2·2Power law 1·083 1·69 0·5 1·55 0·164
Recce Linear 6·03 – 1·5Power law 1·87 1·61 0·4 2·40 0·047
k∗ l l=
a ni /li( )
var(D)a n1/l1( )A1
wl1-------------------------+
a n2/l2( )A2
wl2-------------------------=
3.59*20*1000.01l1
-------------------------------- 3.59*2*2000.01l2
-----------------------------+=
JPE578.fm Page 223 Monday, March 5, 2001 1:32 PM
224
P.D. Walsh
et al
.
© 2001 British Ecological Society,
Journal of Applied Ecology
,
38
,217–228
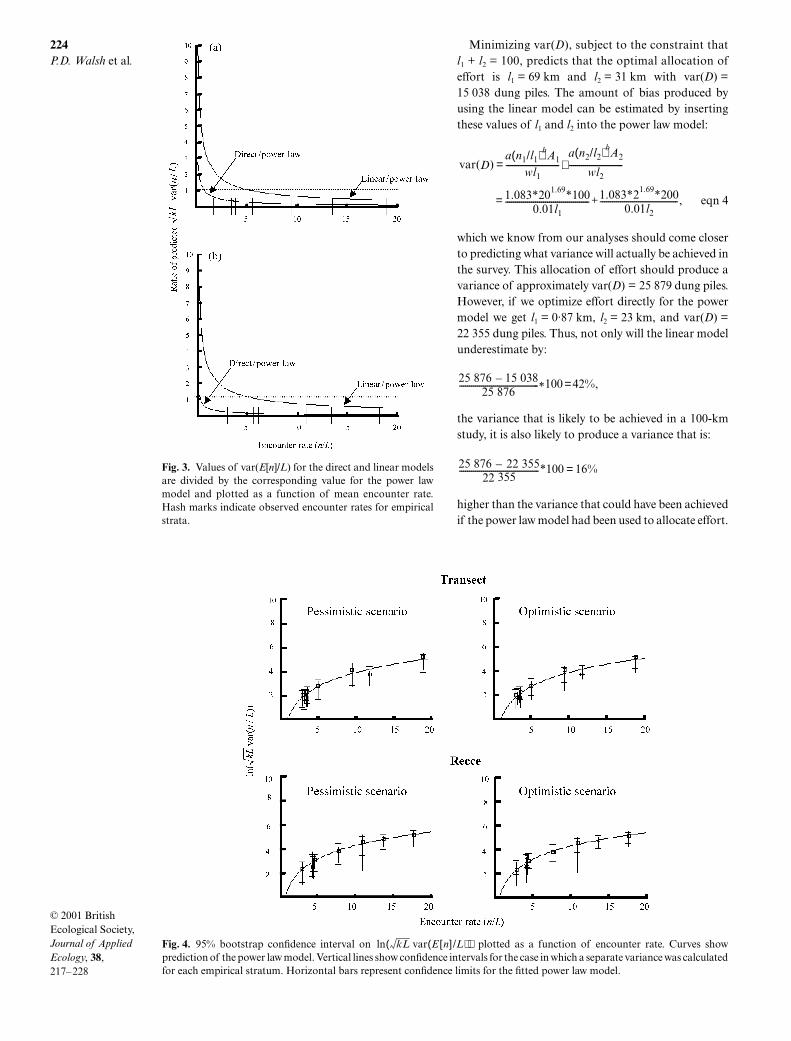
Minimizing var(
D
), subject to the constraint that
l
1
+
l
2
= 100, predicts that the optimal allocation ofeffort is
l
1
= 69 km and
l
2
= 31 km with var(
D
) =15 038 dung piles. The amount of bias produced byusing the linear model can be estimated by insertingthese values of
l
1
and
l
2
into the power law model:
eqn 4
which we know from our analyses should come closerto predicting what variance will actually be achieved inthe survey. This allocation of effort should produce avariance of approximately var(
D
) = 25 879 dung piles.However, if we optimize effort directly for the powermodel we get
l
1
= 0·87 km, l2 = 23 km, and var(D) =22 355 dung piles. Thus, not only will the linear modelunderestimate by:
the variance that is likely to be achieved in a 100-kmstudy, it is also likely to produce a variance that is:
higher than the variance that could have been achievedif the power law model had been used to allocate effort.
var(D)a n1/l1( )bA1
wl1---------------------------+
a n2/l2( )bA2
wl2---------------------------=
1.083*201.69*1000.01l1
------------------------------------------ 1.083*21.69*2000.01l2
---------------------------------------,+=
25 876 15 038 – 25 876
---------------------------------------- *100 42%
=
,
25 876 22 355 – 22 355
----------------------------------------
*100 16%
=
Fig. 4. 95% bootstrap confidence interval on plotted as a function of encounter rate. Curves showprediction of the power law model. Vertical lines show confidence intervals for the case in which a separate variance was calculatedfor each empirical stratum. Horizontal bars represent confidence limits for the fitted power law model.
ln kL var E n[ ] /L( )( )
Fig. 3. Values of var(E[n]/L) for the direct and linear modelsare divided by the corresponding value for the power lawmodel and plotted as a function of mean encounter rate.Hash marks indicate observed encounter rates for empiricalstrata.
JPE578.fm Page 224 Monday, March 5, 2001 1:32 PM
225
Forest elephant survey precision
© 2001 British Ecological Society,
Journal of Applied Ecology
,
38
,217–228
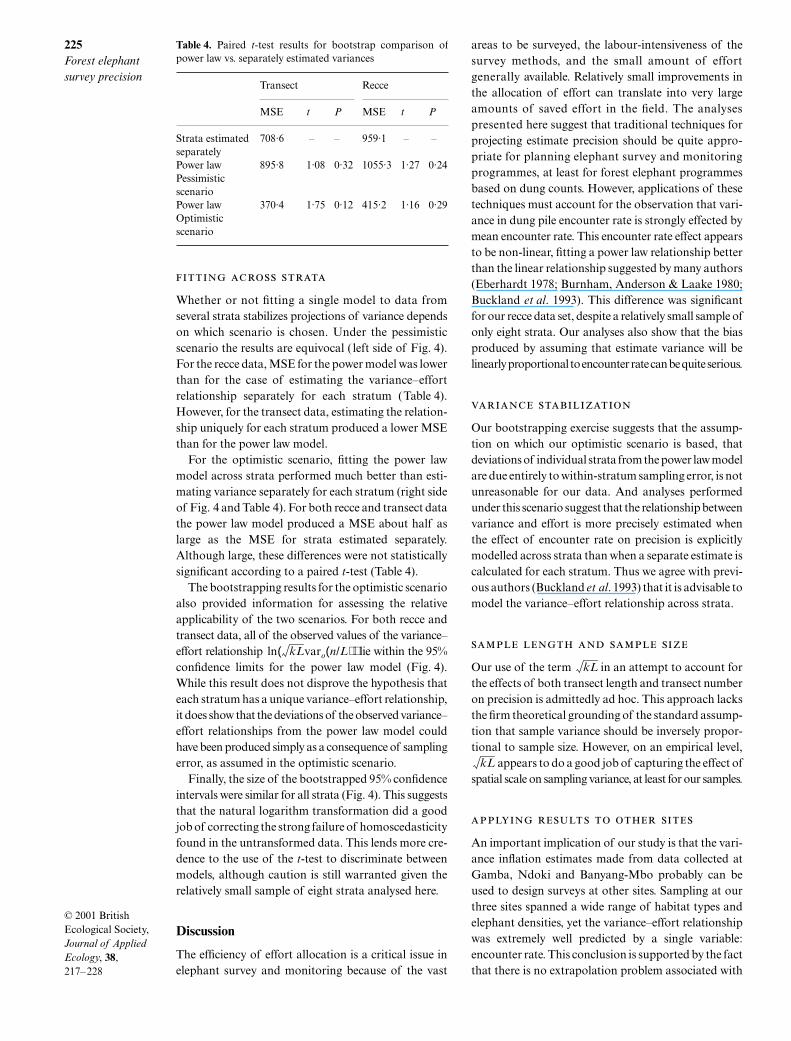
Whether or not fitting a single model to data fromseveral strata stabilizes projections of variance dependson which scenario is chosen. Under the pessimisticscenario the results are equivocal ( left side of Fig. 4).For the recce data, MSE for the power model was lowerthan for the case of estimating the variance–effortrelationship separately for each stratum (Table 4).However, for the transect data, estimating the relation-ship uniquely for each stratum produced a lower MSEthan for the power law model.
For the optimistic scenario, fitting the power lawmodel across strata performed much better than esti-mating variance separately for each stratum (right sideof Fig. 4 and Table 4). For both recce and transect datathe power law model produced a MSE about half aslarge as the MSE for strata estimated separately.Although large, these differences were not statisticallysignificant according to a paired
t
-test (Table 4).The bootstrapping results for the optimistic scenario
also provided information for assessing the relativeapplicability of the two scenarios. For both recce andtransect data, all of the observed values of the variance–effort relationship lie within the 95%confidence limits for the power law model (Fig. 4).While this result does not disprove the hypothesis thateach stratum has a unique variance–effort relationship,it does show that the deviations of the observed variance–effort relationships from the power law model couldhave been produced simply as a consequence of samplingerror, as assumed in the optimistic scenario.
Finally, the size of the bootstrapped 95% confidenceintervals were similar for all strata (Fig. 4). This suggeststhat the natural logarithm transformation did a goodjob of correcting the strong failure of homoscedasticityfound in the untransformed data. This lends more cre-dence to the use of the
t
-test to discriminate betweenmodels, although caution is still warranted given therelatively small sample of eight strata analysed here.
Discussion
The efficiency of effort allocation is a critical issue inelephant survey and monitoring because of the vast
areas to be surveyed, the labour-intensiveness of thesurvey methods, and the small amount of effortgenerally available. Relatively small improvements inthe allocation of effort can translate into very largeamounts of saved effort in the field. The analysespresented here suggest that traditional techniques forprojecting estimate precision should be quite appro-priate for planning elephant survey and monitoringprogrammes, at least for forest elephant programmesbased on dung counts. However, applications of thesetechniques must account for the observation that vari-ance in dung pile encounter rate is strongly effected bymean encounter rate. This encounter rate effect appearsto be non-linear, fitting a power law relationship betterthan the linear relationship suggested by many authors(Eberhardt 1978; Burnham, Anderson & Laake 1980;Buckland
et al
. 1993). This difference was significantfor our recce data set, despite a relatively small sample ofonly eight strata. Our analyses also show that the biasproduced by assuming that estimate variance will belinearly proportional to encounter rate can be quite serious.
Our bootstrapping exercise suggests that the assump-tion on which our optimistic scenario is based, thatdeviations of individual strata from the power law modelare due entirely to within-stratum sampling error, is notunreasonable for our data. And analyses performedunder this scenario suggest that the relationship betweenvariance and effort is more precisely estimated whenthe effect of encounter rate on precision is explicitlymodelled across strata than when a separate estimate iscalculated for each stratum. Thus we agree with previ-ous authors (Buckland
et al
. 1993) that it is advisable tomodel the variance–effort relationship across strata.
Our use of the term in an attempt to account forthe effects of both transect length and transect numberon precision is admittedly ad hoc. This approach lacksthe firm theoretical grounding of the standard assump-tion that sample variance should be inversely propor-tional to sample size. However, on an empirical level,
appears to do a good job of capturing the effect ofspatial scale on sampling variance, at least for our samples.
An important implication of our study is that the vari-ance inflation estimates made from data collected atGamba, Ndoki and Banyang-Mbo probably can beused to design surveys at other sites. Sampling at ourthree sites spanned a wide range of habitat types andelephant densities, yet the variance–effort relationshipwas extremely well predicted by a single variable:encounter rate. This conclusion is supported by the factthat there is no extrapolation problem associated with
Table 4. Paired t-test results for bootstrap comparison ofpower law vs. separately estimated variances
Transect Recce
MSE t P MSE t P
Strata estimated separately
708·6 – – 959·1 – –
Power law 895·8 1·08 0·32 1055·3 1·27 0·24Pessimistic scenarioPower law 370·4 1·75 0·12 415·2 1·16 0·29Optimistic scenario
ln kLvaro n/L( )( )kL
kL
JPE578.fm Page 225 Monday, March 5, 2001 1:32 PM
226
P.D. Walsh
et al
.
© 2001 British Ecological Society,
Journal of Applied Ecology
,
38
,217–228
our projections. The range of encounter rates observedin our strata should span the range of encounter rates thatare likely to be observed in forest elephant surveys. Thus,the relative shape of the power law model and other non-linear models (Routledge & Swartz 1991, 1992) outsidethe range of encounter rates examined is not a major issue.
The variance–effort relationships presented heremay prove particularly useful in the preliminary planningphases of surveys for which no local data are availableto make effort projections. They may even prove usefulwhen some local data is available. As our bootstrappingexercise shows, estimates of the rate of variance infla-tion that are made with small sample sizes can be veryimprecise. Thus, the benefit of using our relatively stablevariance inflation estimates may often outweigh thebenefit of making an inflation estimate based on localdata, if the latter estimate is based on a small sample.
In many cases a good strategy may be to carry outenough pilot work to estimate roughly encounter ratein local sampling zones. Our variance inflation esti-mates then could be used to project how much totalsampling effort would be necessary in each stratum toachieve the desired estimate precision, given the pre-liminary encounter rate estimates. In order to do this,just follow the steps given in the example above. Then,instead of searching for the values of
l
1
and
l
2
thatminimize var(
D
), search (without constraint on
L
) for thevalues of l 1 and l 2 that make the right side of equation 4exactly equal to your desired estimate variance. Theadvantage of this approach is that mean encounterrate can be estimated with much less effort than isrequired for robust estimation of inflation parameters(Buckland
et al
. 1993). For instance, duplicating thevariance inflation estimates made in our study wouldrequire in the order of 6–8 months of fieldwork by a surveyteam, but suitable estimates of encounter rate might beobtained with several days of work in each stratum.
Given that our recce and transect data producedvery similar estimates of the parameter
b
, it would seemquite reasonable to expedite the planning process fur-ther by using recces to estimate encounter rates for eachstratum. This approach would increase sample size forthe estimation of encounter rate and, thereby, increasethe precision of effort projections. The full study couldthen use either transects alone or a combination ofrecces and transect.
The observed relationship between mean encounterrate and encounter rate variance has a rather satisfyinginterpretation in terms of elephant biology. It indicatesthat elephants become more and more clumped inspace as mean density increases. This statistical observa-tion is satisfying because it corresponds with existingknowledge on forest elephant feeding ecology andmigratory behaviour. Forest elephants tend to eat twoclasses of food (Short 1983; White, Tutin & Fernandez
1993). Foods in one class are abundant and of lownutritional value. Examples are savanna grasses, treebark and pulp, and the pith of herbaceous plants.Foods in the second class (e.g. fruit and succulentmarsh grasses) are of relatively high nutritional value.It may well be the difference in the spatial distributionsof these two types of foods that drives the observedrelationship between precision and encounter rate.Foods in the first class tend to be spread relatively uni-formly through the environment. On the other hand,high-quality food items tend to be very patchily distrib-uted, both spatially and temporally. And the number ofhigh quality patches in a region probably determinesboth the mean resource quality of the region and thevariance in resource quality.
All that is necessary for this habitat quality patternto explain the observed relationship of variance to meanencounter rate is for elephants to condition their dis-persal behaviour on habitat quality. On a large scale forestelephants must migrate into zones that currently havehigh mean resource quality. This kind of migratorybehaviour is well documented for savanna elephants.On the within-zone scale it means that elephants mustspend more time per unit area in high-quality patchesthan in low-quality habitat. Both of these conditionsseem quite consistent with past observations on elephanthabitat usage. Elephants appear to move into Bia NationalPark in Ghana during the dry season in response to thefruiting of
Parinari excelsa
, and out of the park to feed
on
Tieghemella hecklii
when it fruits in the wet season(Short 1983). Transect studies showed that as meanelephant density within the Park decreases during thewet season, so does variance in the estimate of meanelephant density. Transect studies at the Lope Reservein Gabon (White 1993) showed that elephant densities inone zone with a particularly high density of
Saccoglottisgabonensis
, a colonizing tree species commonly found indistinct monodominant patches, increased substantiallyduring the
Saccoglottis
fruiting season. Interestinglyenough, the stratum with the highest mean and variancein dung pile encounter rate in our analyses (Petit Loango)also supports a high density of
Saccoglottis
that happenedto have fruited in the month before our survey.
A second, more speculative, hypothesis shifts thefocus slightly from habitat quality to travel time. Sup-pose that elephants perform (figuratively) a calculationin which the nutritional value of a resource item is dis-counted against the searching time necessary to cap-ture that item. Also, imagine that the availability ofindividual resource items is transient but highly pre-dictable on a large spatial scale. Under this scenario,habitats with highly clumped resources should offer ahigher net yield than habitats with less clumpedresources because elephants are long-lived and havegood memories. They know exactly where high-qualityfood patches are and have a good idea of when they arelikely to be available. For high-quality patches, ‘search-ing’ time often reduces to ‘transit’ time. Thus, given thesame mean density of resource items in two regions of
JPE578.fm Page 226 Monday, March 5, 2001 1:32 PM
227
Forest elephant survey precision
© 2001 British Ecological Society,
Journal of Applied Ecology
,
38
,217–228
equal surface area, the region in which resources areclumped into a smaller number of patches shouldrequire lower transit time and, consequently, produce ahigher net yield. This effect should be intensified by thefact that even elephant memories are not infinite. Themore patches resources are divided into, the harder it isto remember the location of each patch, and the moretime is wasted on searching rather than transitingdirectly between patches (a searching elephant movesat a radically slower rate than an elephant in transit).Under this scenario it is only natural that elephant dens-ity should be correlated with the degree of resourceclumping. It is the degree of resource clumping itselfthat determines mean resource value.
Acknowledgements
We thank USFWS and DGIS for support of survey workat Gamba, and USAID’s Central African RegionalProject for the Environment and the MacArthurFoundation for support of work at all three field sites.We thank the Government of Cameroon for allowingus to work at Banyang-Mbo and the Government of theRepublic of Congo for permission to work at Nouabale-Ndoki. M. Fay of the Nouabale-Ndoki National ParkProject and B. Curran, first at the Banyang-MboWildlife Sanctuary Project and later at Noubale-Ndoki,provided much appreciated logistical support. S. Blakeand R. Beyers collaborated on fieldwork at Nouabale-Ndoki. P. Rothery, R. Hoare and an anonymousreferee made comments that substantially improvedthe manuscript.
References
Barnes, R.F.W. & Barnes, K.L. (1992) Estimating decay rateof elephant dung piles in the forest.
African Journal ofEcology
,
30
, 316 –321.Barnes, R.F.W. & Jensen, K.L. (1987) How to count elephants
in forests.
IUCN African Elephant and Rhino SpecialistGroup Technical Bulletin
,
1
, 1– 6.Barnes, R.F.W., Agnangna, M. & Alers, M.P.T. (1993) Elephants
and ivory poaching in the forests of equatorial Africa:report of a field reconnaissance.
Oryx
,
27
, 27–34.Barnes, R.F.W., Barnes, K.L., Alers, M.P.T. & Blom, A. (1991)
Man determines the distribution of elephants in the rain forestsof northeastern Gabon.
African Journal of Ecology
,
29, 54–63.Barnes, R.F.W., Blom, A. & Alers, M.P.T. (1995) A review of
the status of forest elephants Loxodonta africana in CentralAfrica. Biological Conservation, 71, 125 –132.
Barnes, R.F.W., Blom, A., Alers, M.P.T. & Barnes, K.L.(1995) An estimate of the numbers of forest elephants inGabon. Journal of Tropical Ecology, 11, 27 – 37.
Buckland, S.T., Anderson, D.R., Burnham, K.P. & Laake, J.L.(1993) Distance sampling. Estimating the Abundance ofBiological Populations. Chapman & Hall, London, UK.
Burnham, K.P., Anderson, D.P. & Laake, J.L. (1980) Estima-tion of Density from Line Transect Sampling of BiologicalPopulations. Wildlife Monographs 72. The Wildlife Society,Bethesda, Maryland, USA.
Cox, D.R. (1983) Some remarks on overdispersion. Biometrika,70, 269 –274.
Eberhardt, L.L. (1978) Appraising variability in populationstudies. Journal of Wildlife Management, 42, 207–238.
Efron, B. & Tibshirani, R.J. (1993) An Introduction to theBootstrap. Chapman & Hall, New York, NY.
Fay, J.M. & Agnagna, M. (1991) A population survey of forestelephants (Loxodonta africana cylcotis) in northern Congo.African Journal of Ecology, 29, 177 –187.
Fay, J.M. & Agnagna, M. (1993) Elephants and ivory in theCongo since the ban: lull before the storm? Pachyderm,16, 51–58.
Hall, J., Inogwabini, B.-I., Williamson, E.A., Omari, I.,Sikubwabo, C. & White, L.J.T. (1997) A survey of elephants(Loxodonta africana cylcotis) in the Kahuzi-Biega NationalPark lowland sector and adjacent forest in eastern Zaire.African Journal of Ecology, 35, 213 – 223.
Hart, J.A. & Sikuwabo, C. (1994) Exploration of the MaikoNational Park of Zaire 1989–1992: History, Environmentand the Distribution and Status of Large Mammals. WildlifeConservation Society, New York, NY.
Hoare, R.E. (1999) Determinants of human–elephant conflictin a land-use mosaic. Journal of Applied Ecology, 36, 689–700.
McNeilage, A., Plumptre, A., Brock-Doyle, A. & Vedder, A.(1998) Bwindi Impenetrable National Park, Uganda. Gorillaand Large Mammal Census 1997. WCS Working Paper No.14. Wildlife Conservation Society, New York, NY.
Michelmore, F., Beardsley, K., Barnes, R.F.W. & Douglas-Hamilton, I. (1995) A model illustrating the changes inelephant numbers caused by poaching. African Journal ofEcology, 32, 89 – 99.
Perry, J.N. & Woiwood, I.P. (1991) Fitting Taylor’s PowerLaw. Oikos, 60, 107–112.
Plumptre, A. (2000) Monitoring mammal populations withline transect techniques in African forests. Journal ofApplied Ecology, 37, 356 –368.
Press, W.H., Flannery, B.P., Teukolsky, S.A. & Vetterling, W.T.(1989) Numerical Recipes: The Art of Scientific Computing.Cambridge University Press, New York, NY.
Routledge, R.D. & Swartz, T.B. (1991) Taylor’s Power Lawreexamined. Oikos, 60, 107–112.
Routledge, R.D. & Swartz, T.B. (1992) Rejoinder to ‘FittingTaylor’s Power Law’ by Perry and Woiwood. Oikos, 65,543–544.
Ross, S. (1997) A First Course in Probability, 5th edn. PrenticeHall, Princeton, NJ.
Short, J.C. (1983) Density and seasonal movements of theforest elephant (Loxodonta africana cyclotis Matschie) inBia National Park, Ghana. African Journal of Ecology, 21,175–184.
Taylor, L.R. (1961) Aggregation, variance, and the mean.Nature, 189, 732 – 735.
Taylor, L.R. & Woiwod, I.P. (1982) Comparative synopticdynamics. I. Relationships between inter- and intra-specificspatial and temporal variance/mean population parameters.Journal of Animal Ecology, 51, 879 – 906.
Taylor, L.R., Woiwod, I.P. & Perry, J.N. (1978) The density-dependence of spatial behaviour and the rarity of randomness.Journal of Animal Ecology, 47, 383– 406.
Taylor, L.R., Taylor, R.A.J., Woiwod, I.P. & Perry, J.N. (1988)Specificity of the spatial power-law exponent in ecology andagriculture. Nature, 3332, 721.
Tchamba, M.N. (1991) Defaecation by the African forestelephant (Loxodonta africana cylcotis) in the SantchouReserve, Cameroon. Nature et Faune, 7, 27 –31.
Thomson, S.K. (1992) Sampling. Wiley, New York, NY.Walsh, P.D. & White, L.J.T. (1999) What it will take to
monitor forest elephant populations. Conservation Biology,13, 1194 –1202.
Walsh, P.D., Thibault, M., Mihindou, Y., Idiata, D., Mbina, C. &White, L.J.T. (2000) A statistical framework for monitoringforest elephants. Natural Resource Modeling, 13, 89 –134.
Wedderburn, R.W.M. (1974) Quasi-likelihood functions,generalized linear models, and the Gauss–Newton method.Biometrika, 61, 439 – 447.
JPE578.fm Page 227 Monday, March 5, 2001 1:32 PM
228P.D. Walsh et al.
© 2001 British Ecological Society, Journal of Applied Ecology, 38,217–228
White, L.J.T. (1993) Saccoglottis gabonensis fruiting and theseasonal movements of elephants in the Lope Reserve,Gabon. Journal of Tropical Ecology, 10, 121–125.
White, L.J.T. (1994) Biomass of rainforest mammals in the LopeReserve, Gabon. Journal of Animal Ecology, 63, 499–512.
White, L.J.T., Tutin, C.E.G. & Fernandez, M. (1993) Group
composition and diet of forest elephants, Loxodonta africanacyclotis Matshie 1900, in the Lope Reserve, Gabon. AfricanJournal of Ecology, 31, 181–199.
Received 2 January 1999; revision received 24 July 2000
JPE578.fm Page 228 Monday, March 5, 2001 1:32 PM