Ecological relevance of Sentinels' biomarker responses: A multi-level approach
Upload
independentCategory
view
0download
0
PROJECTING CLIMATE PROJECTING CLIMATE CHANGES AND ECOLOGICAL CHANGES AND ECOLOGICAL
RESPONSESRESPONSESGARY D. SHARP (1), LEONID KLYASHTORIN (2),
And DOUGLAS McLAIN (1, 3)(1) Center for Climate/Ocean Resources Study,
Salinas, CA.(2) VNIRO, Moscow
(3) CoML/TOPP, Hopkins Marine Station,Pacific Grove, CA.

Operational Fisheries Oceanography 1A thru
Today
TidesWinds Swell
Moon PhaseSeason
Location, Location, LocationLocation, Location, Location

Godthab Nuuk, Greenland annual mean temperatures (NASA GISS) top and the AMO bottom (annual dark blue and 5 year running mean purple)
source CDC Climate Indices

Arctic basin wide temperatures from Polyakov(2004) versus PDO+AMO (STD).
Dark blue is annual and purple 5 year running means.


Major Atmospheric Greenhouse Warming Components.

Proportion of Atmospheric CO2 of Total that is man-made

Total Human contribution to Green House effect = ~ 0.278%~ 0.278% - not very great portion

Coral reefs first formed back in the Devonian period when Coral reefs first formed back in the Devonian period when atmospheric carbon dioxide levels were ten times todayatmospheric carbon dioxide levels were ten times today’’s.s.

Forecasting the Future from History
2100
2100
From Joseph Fletcher’s Lecture on 21st Century Climate

Sunspot Cycles 1700 - 2030
Solar Cycles 24 and 25 and Predicted Climate Response by David C. Archibald
Energy and Environment, 2006, 17:1

SOLAR CYCLES 24 AND 25 AND PREDICTED CLIMATE RESPONSE -
David C. Archibald 2006, 2007 in press Climate Outlook
to 2030 Energy and Environment,)
Based on solar maxima of approximately 50 for solar cycles 24 and 25 - a global temperature decline of 1.5C is predicted to 2020, equating to the experience of the
Dalton Minimum Vs The 2C increase predicted from the Dikpati scenario.
There is more to EcosystemThere is more to EcosystemPatterns than only decadal scalePatterns than only decadal scale
Climate Climate VariabilitiesVariabilities..

The Oldeand
The NEW


QuickTime™ and aGIF decompressor
are needed to see this picture.

Leonid Leonid KlyashorinKlyashorin and I have worked hard together and I have worked hard together starting with our Convergence in early 2000 starting with our Convergence in early 2000 -- then I had then I had
him invited to Rome him invited to Rome -- FAO folks were impressedFAO folks were impressed……
And given my And given my longlong--term term
interests interests -- and and many colleagues many colleagues from PACLIM and from PACLIM and around the Globe around the Globe -- in 2001 Leonid in 2001 Leonid
arrived @ PACLIM arrived @ PACLIM -- and we both and we both continued our continued our efforts to get efforts to get
attention on the attention on the real issues real issues --

1200 1300 1400 1500 1600 1700 1800 1900
Right-hand end of the moving time window of the length = 600 years
0.02
0.04
0.06
0.08
-1.10
-0.90
-0.70
-0.50
-0.30
-0.10
Freq
uenc
y, 1
/yea
r
Evolution of the decimal logarithm of the power spectra of Greenland ice core temperature,estimated within moving time window of the length = 600 years,shift = 5 years, AR-order = 60.
(12.5 )
(16.7)
(25)
(50)
(Corresponding periods, years)
Temporal dynamics of power spectra of reconstructed temperatureby Greenland ice cores analysis (Ice Cores dT)
for the time period 553-1973 years AD.
Years
8.5 years
12.5 years
18.5 years33 years
160 years55 years
8.5years
Periodicity
3-D diagram of temporal dynamics of power spectra of reconstructed temperatureby Greenland Ice Cores analysis ( 18O) for the time period 553-1973 years AD

M. Ben-Yami - WORLD FISHING, Dec. 2006/Jan. 2007
ENLIGHTMENT FROM RUSSIA
A wise man said once: a people without history is a people without future. I'd paraphrase: science that ignores former studies and historical data cannot produce reliable predictions. This is also true for all those who attribute to fishing being the single or predominant cause for all trends and variations in fish populations.
I often wonder how references quoted in so many learned articles on fisheries related subjects reach only 5 or 10 year back. Fisheries science started developing towards the ascent of the last century and has flourished throughout since. Long term data series and historical information on fish yields fluctuations and on climatic variations, as well as biological/ecological knowledge on life history and behaviour of the main commercial species have been long available….

• And Finishes with - One can only conclude that ignoring regime shifts and other climatic fluctuations can lead to misunderstanding of the role of fishing on marine fish populations and their ecosystems, and consequently to their mismanagement. While overfishing is a fact in many cases, it alone doesn’t explain the boom-and-bust fishing reality. Neither can management steps “recover” fish stocks to their former state, if those are on a downward section of their natural cycle.
The 2005 Russian book represents the most authoritative and-up-to-date analysis of the effect of climatic and planetary factors on fishery resources, in particular, and fishery ecosystems, in general. To make it accessible to, it should soonest be translated to English, for It would open the eyes of fishery scientists and managers to the bitter truth that they cannot “recover” a stock, which is on the downward slope of its multi-annual variation. Neither should they depress fishing of a stock that’s half way up on the upwards slope of its cycle. Hopefully, it will Hopefully, it will help in so much needed overhauling of the prevailing fisheries help in so much needed overhauling of the prevailing fisheries sciencescience--cumcum--management system. management system. English Version Soon off the English Version Soon off the Press in MoscowPress in Moscow

The projected trend of total commercial catch (100,000 tons; bold line) of Norwegian spring-spawning herring for the next 50 years. Thin line shows commercial catch; bold red
line shows probable trend marked with
standard deviation vertical bars
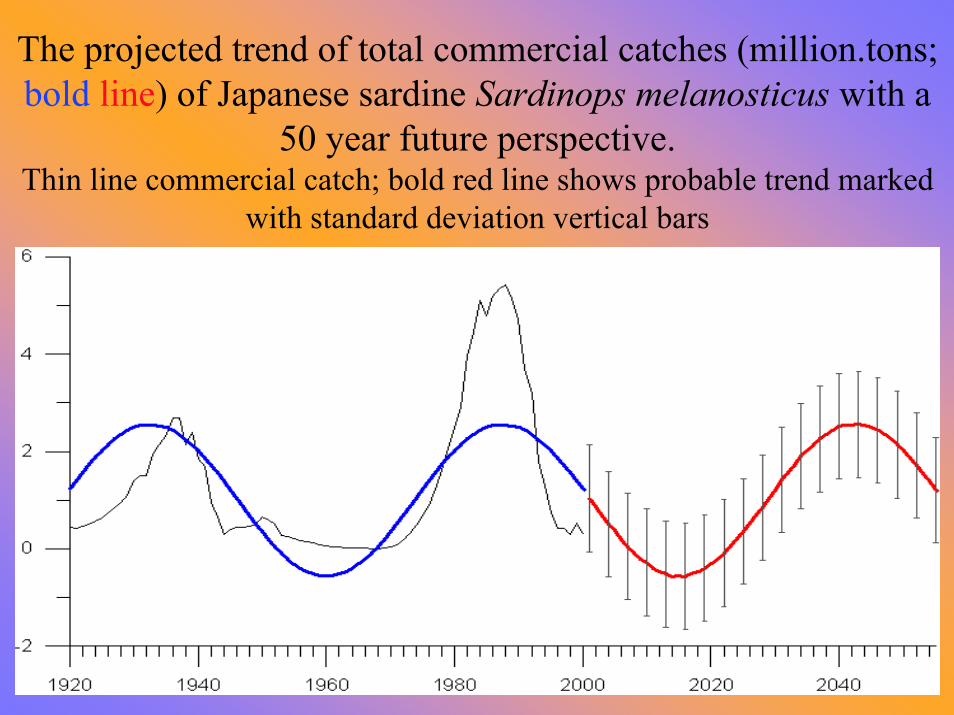
The projected trend of total commercial catches (million.tons; bold line) of Japanese sardine Sardinops melanosticus with a
50 year future perspective. Thin line commercial catch; bold red line shows probable trend marked
with standard deviation vertical bars

The projected trend of total commercial catch (million tons; bold line) of Norwegian Arctic cod Gadus morhua for the next
50 years. Thin line shows commercial catch; bold red line
shows probable trend - with standard deviation vertical bars

Green & Orange arrows Signal Beginnings of Blooms, Green & Orange arrows Signal Beginnings of Blooms, Red arrows = periods of No Fishing for key speciesRed arrows = periods of No Fishing for key species

ENSO WarmEvents AffectOcean ProductionCenters, CausingChanges in BothFish & Fisheries
Cold EventsAffect BothOceans andEcosystems byReversing theLocations ofPredators &
Fisheries.

Length of Day (LOD) -Earth’s rotation rate -
responds to energy (mass) content and Circulation
Changes in Earth’s atmosphere as climate varies.
This provides a six year indicative forecast of
interactive physical forcing processes that affect all
marine ecosystems.
Zonal (ACI EZonal (ACI E--W) winds cause W) winds cause Warm ocean conditions Warm ocean conditions --
Meridional (N-S) ACI-C winds force coastal upwelling, hence Cold ocean conditions along eastern boundaries, where
fisheries are most productive -Two separate faunas have
evolved in response. A third species mix underlies all these
dynamics that just plods along -low response to all changes.

Solar Irradiance Energizes the Earth!Solar Irradiance Energizes the Earth!
But, We have only since 1979 begun to makeBut, We have only since 1979 begun to makeDirect and accurate via satellite measurementsDirect and accurate via satellite measurements

El NiEl Niñño Years Marked Redo Years Marked Red

Given what we saw in previous slide:i.e., More Solar Energy Modulates Event FrequencyWhat would you expect over next decade?

???

Can CLIOTOP and TOPPCan CLIOTOP and TOPPFill In These Voids ???Fill In These Voids ???
Vancouver
Panama
Valparaiso


Andreas Walli - 2007

Necessary Actions to Take Necessary Actions to Take -- NOW!NOW!
11 --WhatWhat’’s Coming up? s Coming up? Monitor Climate Indices and Monitor Climate Indices and --LODLOD
22 -- Which Species will do what Which Species will do what -- given historical response informationgiven historical response information;;
33 -- Define Indicators of Transitions Define Indicators of Transitions -- both Physical and Ecologicalboth Physical and Ecological;;
44 -- Continuous catch Monitoring Continuous catch Monitoring -- via Collaborations with Fishermenvia Collaborations with Fishermen;;
55 -- Rapid Control/Management of Fishing Effort Rapid Control/Management of Fishing Effort Location and IntensityLocation and Intensity;;
66 -- Continuous Environmental Monitoring for Continuous Environmental Monitoring for LongLong--Term SignalsTerm Signals;;
77 -- Rapid Response to EventRapid Response to Event--Scale Scale ‘‘NoiseNoise’’ -- i.e., ENSO Warm/Coldi.e., ENSO Warm/Cold;;
88 -- MarketMarket--Floor FlowFloor Flow--Through Measures Through Measures to Inhibit Goldto Inhibit Gold--RushesRushes;;
99 -- ReRe--education of Fisheries Managers, and Industry about Transitionseducation of Fisheries Managers, and Industry about Transitions..

THE INTEGRATED SCIENCES OF CLIMATE CHANGE & APPLIED FISHERIES
OCEANOGRAPHY
Gary D. Sharp, Center for Climate/Ocean Resources Study,
SALINAS, California USA,
Website: It’s All About Time & Placehttp://sharpgary.org
Copyright © 2022 FDOKUMEN