Establishing the Kojina Gold Deposit as a Viable Mining ...
77
i UNIVERSITY OF GHANA ESTABLISHING THE KOJINA GOLD DEPOSIT AS A VIABLE MINING VENTURE FOR SAMEVA LTD, GHANA BY EDEM KWAMI MENSAH ABBA (10440162) THIS DISSERTATION IS SUBMITTED TO THE UNIVERSITY OF GHANA, LEGON IN PARTIAL FULFILMENT OF THE REQUIREMENTS FOR THE AWARD OF MSc MINERAL EXPLORATION DEGREE. OCTOBER, 2014 University of Ghana http://ugspace.ug.edu.gh
-
Upload
khangminh22 -
Category
Documents
-
view
0 -
download
0
Transcript of Establishing the Kojina Gold Deposit as a Viable Mining ...

i
UNIVERSITY OF GHANA
ESTABLISHING THE KOJINA GOLD DEPOSIT AS A
VIABLE MINING VENTURE FOR SAMEVA LTD, GHANA
BY
EDEM KWAMI MENSAH ABBA
(10440162)
THIS DISSERTATION IS SUBMITTED TO THE UNIVERSITY OF
GHANA, LEGON IN PARTIAL FULFILMENT OF THE
REQUIREMENTS FOR THE AWARD OF MSc MINERAL
EXPLORATION DEGREE.
OCTOBER, 2014
University of Ghana http://ugspace.ug.edu.gh

ii
DECLARATION This dissertation is an outcome of a research undertaken by Edem Kwami Mensah Abba
towards the award of MASTER OF SCIENCE IN MINERAL EXPLORATION in the
Department of Earth Science, University of Ghana.
Prof. Johnson Manu (Principal supervisor)
...................................... Date.........................
Mr. Richard Afenu (Co-supervisor)
....................................... Date............................. This dissertation has not been submitted in whole or in part to this university or elsewhere
for a degree.
Edem Kwami Mensah Abba (10440162)
....................................... Date.............................
University of Ghana http://ugspace.ug.edu.gh

iii
ABSTRACT
Assessment of viability of an ore deposit depends on the accurate estimation of the quantity
and quality of the commodity, which is a function of the sample data quality. SAMEVA Limited,
a fully owned Ghanaian company, wants to acquire Kojina Gold deposit as an investment
opportunity in the gold industry of Ghana. The decision to invest in the mining industry
comes with huge capital requirement and the associated risks are very high. The major
objectives with regards to evaluating the viability of the deposit are; to define appropriate
mineralized zone based on available drill core data, use an appropriate estimation method to
create a model that accurately predicts grade and tonnes and finally use a suitable financial
model to establish the viability or otherwise of the Kojina project. An Ordinary krigged
geostatistical model was used to estimate the quantity and quality of gold within the deposit
based primarily on diamond drill holes. The Net Present Value (discounted cash flow) method
of financial analysis was used to arrive at the investment decision on the Kojina deposit.
Capital and Operating Costs estimates used were based on benchmarking of adjacent mine
operations within the catchment area of Kojina. Using appropriately planned drilling and
representative sampling as well as predominant use of diamond core gives more accurate
information with no contamination and has structural orientation which allows for better
geologic and structural mapping therefore helping define the mineralization zones more
accurately. The mineralization zone defined based on reverse circulation holes gave
37,413,998 tonnes at 1.47g/t whereas that based on the diamond holes gave 26,674,888
tonnes at 1.57g/t. Again, based on the more accurate deductions from diamond holes, the Net-
Present value of the project was estimated at USD 187,796,325 with a payback period of three
years.
University of Ghana http://ugspace.ug.edu.gh

iv
DEDICATION This project work is dedicated to all grand-children and great grand-children of the late
Togbe Abba of Have-Etoe.
Education has no end!
University of Ghana http://ugspace.ug.edu.gh

v
ACKNOWLEDGEMENT My utmost thanks to God almighty for giving me the strength and energy to go through this
master’s programme successfully. My appreciation goes to the Technical services manager,
Mr. Trevor Silverton, as well as Management of Chirano Gold Mines Ltd for providing funding
for all aspects of the programme.
To my supervisors; Prof. Johnson Manu, Mr. Richard Afenu and all other lecturers of
the Department of Earth Sciences, University of Ghana, Legon for their tutorship and
guidance throughout our studies at the University, I am very grateful. To my course mates;
Fred, Dela, Augustine, Paul and Mike; I say “boys abre”.
Finally, to my beautiful women; Esime and Enya for not fussing over daddy’s constant absence and Selorm for the encouragement, ‘dze ko’ moments, and appreciation of the times. Love you gals!
University of Ghana http://ugspace.ug.edu.gh

vi
TABLE OF CONTENT
Page (s) DECLARATION ......................................................................................................................... ii ABSTRACT ............................................................................................................................... iii DEDICATION ........................................................................................................................... iv ACKNOWLEDGEMENT .......................................................................................................... v TABLE OF CONTENT ............................................................................................................ vi LIST OF FIGURES .................................................................................................................. viii LIST OF TABLES.......................................................................................................................ix CHAPTER ONE ................................................................................................................... - 1 - INTRODUCTION ................................................................................................................ - 1 -
1.1 Background ............................................................................................................ - 1 - 1.2 Problem Statement ................................................................................................. - 3 - 1.3 Objectives............................................................................................................... - 3 - 1.4 Justification ............................................................................................................ - 4 - 1.5 Location.................................................................................................................. - 4 - 1.6 Physiography and Occupation................................................................................ - 6 -
CHAPTER TWO .................................................................................................................. - 7 - LITERATURE REVIEW ..................................................................................................... - 7 -
2.1 Regional Geology ................................................................................................... - 7 - 2.2 Local Geology......................................................................................................... - 9 – 2.3 Some Viability studies in Ghana............................................................................ - 12 -
CHAPTER THREE ............................................................................................................ - 14 - METHODOLOGY ............................................................................................................. - 14 -
3.1 Drilling and Survey................................................................................................... - 14 - 3.2 Sampling, Sample preparation and analysis ............................................................. - 15 - 3.3 Approaches to Project Valuation .............................................................................. - 17 -
The Discounted Cash flow method of Analysis........................................................... - 19 - 3.4 Resource Estimation ................................................................................................. - 19-
3.4.1 Phase 1- Data preparation .................................................................................. - 19 - 3.4.2 Phase 2- Investigation of statistical and spatial patterns.................................... - 26 - 3.4.3 Phase 3- Building the model .............................................................................. - 28 - 3.4.4 Phase 4- Block Model Validation ...................................................................... - 29 - 3.4.5 Phase 5- Resource classification and Reporting ................................................ - 31 -
3.5 Financial Analysis..................................................................................................... - 32 - 3.5.1 Cost estimates .................................................................................................... - 33 - 3.5.2 Sensitivity Analysis ........................................................................................... - 33 -
University of Ghana http://ugspace.ug.edu.gh

vii
CHAPTER FOUR............................................................................................................... - 35 - RESULTS AND DISCUSSION ......................................................................................... - 35 -
4.1 Deduction on Data validation and Integrity.............................................................. - 35 - 4.2 The Resource Model and Estimation........................................................................ - 39 - 4.3 Financial analysis...................................................................................................... - 44 -
CHAPTER FIVE ................................................................................................................ - 48 - CONCLUSION AND RECOMMENDATION.................................................................. - 48 -
5.1 Conclusion ................................................................................................................ - 48 - 5.2 Recommendations..................................................................................................... - 48 -
REFERENCES ................................................................................................................... - 49 - APPENDICES .................................................................................................................... - 51 -
University of Ghana http://ugspace.ug.edu.gh
viii
LIST OF FIGURES Figures Page
Figure 1: Location of Kojina................................................................................................. - 5 -
Figure 2: General geology of the Sefwi gold region............................................................. - 8 -
Figure 3: Geology of the Kojina Gold Deposit, showing mineralization trend.................. - 10 -
Figure 4: Mechanized core cutting process by DrillCorp ................................................... - 17 -
Figure 5: Verifying accuracy of Collar location ................................................................. - 20 -
Figure 6: Determining composite length by histogram ...................................................... - 21 -
Figure 7: Determining cell declustering size ...................................................................... - 22 -
Figure 8: Log transformation of positively skewed data .................................................... - 23 -
Figure 9: Log probability plot for gold (Au) –Selecting the top-cut value......................... - 24 –
Figure 10: Mineralization zones as interpreted from Diamond holes verses RC holes …...- 25 -
Figure 11: Back transform Model....................................................................................... - 26 -
Figure 12: KNA –Determining block size, number of samples, search radius................... - 27 -
Figure 13: Digitized polygons for classification of mineral Resources .............................. - 31 -
Figure 14: Cash flow model for mineral project evaluation in Ghana (modified after
Stermole, 1993) .................................................................................................................. - 32 -
Figure 15: Determining the effect of price/cost changes on NPV ...................................... - 34 -
Figure 16: The components of a variogram model.................................................... - 36 -
Figure 17: Downhole variogram for Au – Determining nugget effect ............................. - 37 -
Figure 18: Variogram modelling for direction 1.................................................................. - 37 -
Figure 19: Variogram modelling for direction 2 ................................................................ - 38 -
Figure 20: Variogram modelling for direction 3 .................................................................. - 38 -
Figure 21: Comparing Ordinary kriged estimates to Nearest neighbour estimates ............ - 40 -
Figure 22: Section showing good comparison between drillholes and estimated grades... - 41 -
Figure 23: Plan view of model at 0.5g/t cut-of ................................................................... - 41 -
Figure 24: Variogram ellipsoid showing anisotropy in the data ……................................. -43-
Figure 25: Plan view of drill hole showing good sampling coverage ................................ -43-
Figure 26: Discounted cash flow model ............................................................................. - 45 -
Figure 27: Sensitivity Analysis Graph ................................................................................ - 46 -
University of Ghana http://ugspace.ug.edu.gh

ix
LIST OF TABLES
Table 1: Validating database against field logs ……………………………………………-20-
Table 2: Descriptive statistics of raw data ………………………………………………...-22-
Table 3: Block model extents ………………………………………………………………-28-
Table 4: List of attributes used in the block model ………………………………………..-28-
Table 5: Project sensitivities ……………………………………………………………….-33-
Table 6: Resource summary indicating Metal content at increasing cut-off ............................ -42-
Table 7: Resource summary by category ................................................................................ -42-
Table 8: Reserve summary ………………………………………………………………….-42-
Table 9: Financial analysis results – RC versus DD data ……………………………………-41-
Table 10: Financial analysis results and sensitivities ………………………………………..-43-
LIST OF APPENDICES
Appendix A – Database Tables Summary……………………………...…………………….-54-
Appendix B – Drillhole Listing Used For Resource Estimation………….......….…………..-55-
Appendix C – Visual Validation Of Model…………………………………..…...………….-58-
Appendix D – Summary Of QAQC Samples Performance……………………………..…...-61-
Appendix E – Charts Of QAQC Samples Performance…………………..……..…………….-62-
Appendix F – Data Verification Report.....................................................................................-63-
Appendix G – Capital Costs Summary………………………………..…….………………..-66-
Appendix H – Operating Costs Summary……………………………..…….….…………….-67-
Appendix I – Kojina Financial Analysis – Cash Flow ……………………………………….-68-
University of Ghana http://ugspace.ug.edu.gh

- 1 -
CHAPTER ONE
INTRODUCTION
1.1 Background A number of studies have revealed that unreliable reserve estimates has led to several mine
failures. In the 1980s, a study on 35 Australian gold mines found that 68% failed because they
could not deliver the planned head grade (Tatman, 2001). Another study in 2003 of 41
underground mines showed that 60% of ore reserve estimates fell outside the expected
range, with some very seriously in error (Tatman, 2001). It was revealed in those studies
that the errors resulted from unreliable sampling data, insufficient samples, poor choice of
estimation technique, unrealistic cost estimates, or a combination of these.
Notable examples of projects, which have had reserve problems, are Hayden Hill, California,
USA. In 1993, Amax Gold reported a US$64 million write-down of the carrying value of
Hayden hill. Schwabb et al (1994) assert that the grade/tonnage shortfall resulted from an
absence of adequate drilling, obscured by variogram analysis that on close inspection could not
be supported by geology.
Also, Grouse Creek mine in Idaho, USA was permitted in 1992 with an expected annual
production of 3.1 t/a of gold, later changing to 2.2 t/a (Darling, 2013). Three (3) years later, the
owners announced a write-down of the entire US95 million investment because it encountered
significant shortfalls in both grade and tonnage of the ore being mined.
The accuracy of resource estimates is key to the economic evaluation of natural resources.
Accurate resource estimation establishes a basis for successful mining operations. The
overestimation or underestimation of mineral reserves can have severe consequences for future
mine planning. Underestimation could result in an otherwise profitable operation being written
off while overestimation on the other hand may lead to the construction of a mine where no
University of Ghana http://ugspace.ug.edu.gh

- 2 -
profitable orebody exists. More commonly, it results in the life-of-mine (LOM) being shorter
than anticipated. Incorrect mineral resource calculation and unrealistic cost and revenue
estimates are major risks for project start-ups in the mining industry worldwide
(Burmeister, 1988).
Guarnera (1997) sums up this geological risk in mining projects as “No single feature has
caused so many mining projects to fail as have reserves not being what were originally
estimated”.
SAMEVA Limited is a fully owned Ghanaian company looking for investment opportunities
in the mining industry of Ghana. SAMEVA’s previous venture into the industry had led to
huge losses. This time around they are taking into account some detailed pragmatic steps
both geological and economical for an accurate assessment.
The Kojina deposit is SAMEVA’s new interest. The deposit is adjacent to the producing
mine of Kinross’ Chirano gold project and several other exploration properties.
Reliability of information provided by professionals for use in decision-making will boost
confidences for further investment by the Ghanaian private sector.
University of Ghana http://ugspace.ug.edu.gh

- 3 -
1.2 Problem Statement SAMEVA Ghana Limited made huge investments into the now defunct Sewum gold mines.
During production, it was discovered that the actual grades being mined fell way below the
predicted tonnes and grades. The resource work done at Sewum had been based on sparse and
unreliable data coming from different regimes of sampling techniques and company standards.
SAMEVA wants to enter into mining once more, the new venture is the Kojina gold deposit
owned by DrillCorp Exploration Limited, on the Sefwi- Bibiani gold belt. Based on
available detailed data on the property, SAMEVA has therefore contracted FlyGroup
Consult (a mineral resource evaluation group) to create a reliable model of the deposit to be
used for assessment of viability before a decision on the acquisition is made.
1.3 Objectives The objectives are to:
• verify drilling and sampling data to ensure sample integrity and representativity.
• use an appropriate estimation method to create a model that accurately predicts grade
and tonnes.
• use a suitable financial model to establish the viability or otherwise of the Kojina
project.
University of Ghana http://ugspace.ug.edu.gh

- 4 -
1.4 Justification The use of diamond holes, primarily, in resource estimation ensures the absence of downhole
contamination and gives in-situ information on geological, mineralization and structural
orientation especially for a hydrothermal deposit, which is structurally controlled.
Structurally controlled ore bodies tend to have sharp ore waste boundaries, which must be
properly modeled to avoid smearing of grades in unmineralized rock. Ordinary kriging has
the inherent ability to handle the clustering, which occurs in mineral exploration drilling.
The issue of unrealistic cost estimates and revenue forecasts are addressed by
benchmarking existing operations. The approach used in this research hopes to address the
problems identified by Bullock (2011) as the reasons for failed mine start-ups; recovered grade
and tonnes being lower than predicted, capital and operating costs being higher than expected
and finally, the sales revenue being lower than projected.
This evaluation will therefore not only project the economic viability of the Kojina deposit but
will also serve as guideline in considering future projects that may be signed.
1.5 Location The Kojina deposit, which is approximately 29 km2 in size, is located in south-western
Ghana with many historical and current open pit and underground gold mines located along
strike to the northeast of the Project (Kesse, 1985). It is about 180 km southwest of
Kumasi. The nearest operating mine is Chirano Gold Mines limited, which is some 35km
away from Kojina deposit. From the township of Sefwi-Bekwai, the site is accessible by 1st
class road onwards to Sefwi-Akontonbra and a 20-kilometer dust road beyond Ashiem.
The Project is centered on 5°59’ north latitude and 2°27’ west longitude (Figure 1).
University of Ghana http://ugspace.ug.edu.gh

- 5 -
Figure 1: Location map showing the Kojina deposit (red box)
University of Ghana http://ugspace.ug.edu.gh
- 6 -
1.6 Physiography and Occupation The physiographic region of the place is of the forest-dissected plateau (Dickson and Benneh,
1988). The heavy rainfall in the region and the consequent forest vegetation which prevents
sheet erosion explains the strongly dissected nature of the plateau. The Ankobra River with its
several tributaries drain through the broad flat valley of the concession. Covered with steep
hills, which rise to an average of 240 meters ASL, rugged and gently undulating
topographies, the concession is characterized by rocks of the Upper Birimian as well as
Tarkwaian rocks. (Dickson and Benneh, 1988).
The major occupational activities within the area are commercial farming and small scale
mining operations. Besides cocoa and oil palm farming done on a commercial scale,
subsistence farming to produce cassava, plantain, yam, pepper and citrus is also done in the
area. In addition to the above produce some non-traditional cash crops which have gained
popularity in the municipality include rice and pineapple.
University of Ghana http://ugspace.ug.edu.gh
- 7 -
CHAPTER TWO
LITERATURE REVIEW This section entails all available geological information with respect to previous data that
have been compiled considering the regional geology, local geology and also on the Kojina
deposit as well. This spans from lithological characteristics, regional extents, structures,
mineralization, alteration, geochronology and proposed geodynamic or geological settings.
The latter part of the literature considers a detailed example of similar viability in Ghana,
specifically in the Northern part of the country but of the same regional geological scope.
2.1 Regional Geology
Early Proterozoic Birimian greenstone assemblages (2100 Ma) constitute the major geologic
units in Ghana. This occupies about twenty percent of the total area of Ghana, and form part of
the West African craton that outcrops extensively in other parts of the subcontinent, including
Ivory Coast, Burkina Faso and Mali (Hammond and Tabata, 1997). The greenstone units in
Ghana are characterized by five evenly spaced volcanic belts trending NE-SW interspersed
with sedimentary basin (Figure 2).
In Ghana, the volcanic belt consists of metamorphosed volcanic rocks of tholeitic to cal-
alkaline composition, where the metasedimentary basins contain metamorphosed
volcaniclastics, wackes and argillitic sedimentary rocks (Kesse, 1985). Available field
evidence suggests that the volcanic and sedimentary rocks are lateral equivalents (Leube et al.,
1990). Within the Birimian Supergroup, northwest striking mafic metavolcanics belts are
separated from the intervening metasedimentary basins by major faults, these faults probably
early syn-Birimian sedimentary basin down-faulting (Hirdes and Leube, 1989). The Tarkwaian
system is dominated by coarse clastic sedimentary rocks. Age dating suggests that the Birimian
University of Ghana http://ugspace.ug.edu.gh

- 8 -
and the Tarkwaian sediments broadly overlap in the period 2140 to 2100 Ma (Pigois et al,
2003).
Figure 2: General geology of the Sefwi gold region
University of Ghana http://ugspace.ug.edu.gh

- 9 -
2.2 Local Geology The Kojina gold deposit is within the Proterozoic gold district of southwest Ghana. The
concession is along the central western margin of the Sefwi volcanic belt and it covers
about 20 km of strike-length along the very prospective, fault bounded contact between the
Sefwi volcanic belt and the adjacent Kumasi basin metasediments and intermediate granitoid
batholiths to the east. The western part of the concession is dominated by thick sequences of
Birimian mafic metavolcanics that form much of the Bibiani range whereas the lower lying
areas to the east are dominated by Birimian sediments.
The Sefwi volcanic belt is one of several similar belts in the region, separated by the
sedimentary basin. The belt and the basin architect comprise rocks of Birimian age, with the
belts being dominated by mafic volcanics and the basin typified by deep fine-grained marine
sediments (Stuart, 2007).
The Birimian meta-volcanic rocks in the Chirano district consist of fine-grained basalts, fine
to medium-grained dolerites and medium to coarse-grained gabbro with some minor tuffacous
sedimentary rocks. The meta-volcanic rocks show minor metamorphism and deformation. The
unaltered basalt has about 60% and 40% of pyroxene and plagioclase as its mineral
composition respectively. Altered basalts comprise pervasive chlorite-carbonate alteration.
Dolerite rocks closer to the mineralised lode horizon however have been altered by greenschist
facies assemblage of chlorite, carbonate and albite. There are significant felsic units which
are inter-fingering in the mafic. The felsic material is mainly tonalites. Towards the lode
horizon the units become more foliated and mylonised (Stuart, 2007).
The felsic units at Chirano are mainly granodiorite to tonalite in composition. They are
medium to coarse- grained and equiangular to porphyritic in texture. It has variable colour partly
due to the alteration assemblages. The colour however ranges from light pink to grey. The
coarser and more equigranular granodiorite-tonalite appear to be more prevalent as large,
University of Ghana http://ugspace.ug.edu.gh
- 10 -
massive bodies in the hanging-wall nearer the shear zone, whereas the sub-porphyritic
variety outcrops in the foot- wall portion of the deposits. The Chirano Shear zone has been
intruded by smaller felsic units. Granitoids occur within both the Birimian volcanic rocks and
the sedimentary units (Figure 3).
Structures, Mineralization and Alteration
The DrillCorp shear is the major structure which controls the mineralization of the DrillCorp
deposit and it is a splay of the Bibiani shear zone. The Bibiani shear is the fault between the
Tarkwaian and the Birimian sedimentary rocks and the DrillCorp shear also forms the contact
between the Birimian metavolcanics and the Tarkwaian sediments.
Gold mineralization is characteristic of classic Pre-Cambrian Greenstone-hosted quartz vein
style gold deposits. This style of gold mineralization is the most important type of gold
occurrence in West Africa and is commonly referred to as the" Ashanti-type" in this region of
West Africa. It is associated with intense hydrothermal alteration, predominantly manifest as
an ankerite-albite-pyrite-muscovite assemblage. Generally, the tenor of mineralization
correlates with intensity of alteration, veining and brecciation.
Primary sulphide minerals are present in concentrations of 1% to 2% but can attain
concentrations up to 5% (Stuart, 2007). There is a close correlation between gold and the
presence of disseminated pyrite and albite-ankerite alteration. The mineralized horizon is
characterized by a high degree of alteration, foliation, veining and brecciation.
University of Ghana http://ugspace.ug.edu.gh

- 11 -
Figure 3: Geology of the Kojina Gold Deposit, showing mineralization trend
University of Ghana http://ugspace.ug.edu.gh

- 12 -
The mineralization normally occurs within 50 meter west of the DrillCorp Shear Zone. The
common alteration types are sericite, pyrite, carbonate and chlorite alteration.
Exploration at Kojina has been very extensive, employing methods of geophysics,
geological mapping, prospecting, remote sensing, geochemistry, etc. to identify areas of
interest that warrant further investigation. Kojina has lots of geophysical information
especially induced polarization, and aerial photography which were used to delineate areas
for soil sampling, trenching and augur drilling. The GIS and remote sensing were done
by Terra Resources Limited led by principal consultant Barry Bourne. (DrillCorp
technical report no. 13_003)
2.3 Similar viability Study in Ghana.
Awotwe (2003) conducted a pre- feasibility study of the Dokrupe Gold Project (DGP) near
Bole in Northern Region of Ghana. The project which is owned by the Northern Goldfield
Limited (NGL) was looking for funds to exploit near surface auriferous deposits at
Dokrupe and Baju near Bole. To date, NGL’s exploration programme has established
indicated and inferred reserves totaling 3 million tonnes at an average grade of 3.1 g/t. The
nature of the deposits and metallurgical characteristics of the ore bodies indicate that the
deposits could be exploited using open-pit mining method at a yearly production rate of
635,280 t over the next 5 years. The run-of-mine ore would be processed by the Carbon-
in- leach (CIL) method to achieve a recovery of 90%. Semafo Ghana Limited (SGL) has
expressed interest to enter into a joint venture agreement with NGL and by this
agreement, NGL would source funds to complete the exploration programme and develop
the Dokrupe Gold Project provided the project would be economically viable once the
indicated and inferred reserves became proven. Based on funding agreement, there was the
need for Dokrupe Gold Project to establish its economic viability or otherwise on the
University of Ghana http://ugspace.ug.edu.gh

- 13 -
assumption that the indicated and inferred reserves are proven.
With details on the location of the deposits, the exploration data, the proposed mining system
and the processing method, the total capital cost and yearly operating cost were estimated
using detailed cost estimation method as well as base cost data from mines operating in similar
conditions in Ghana. Using an estimated yearly revenues of a base gold price of $9.65/g
($300/oz) and with the use of Ghana Investment Law pertaining to mining, computerized cash
flow model — ECASHFLOW was used. This programme has been used to analyse the
economic viability of the project using 100% equity and 100% loan (at an assumed Minimum
Rate of Return of 12%) as a base case scenario. The Net Present Value (NPV), Internal Rate
of Return (IRR) and Discounted Pay Back Period (DPBP) were used as economic indicators to
assess the viability of the project. Detailed financial analyses were conducted into the costs of
capital, cost of equity and cost of loan, from which optimum capital structure was determined.
Based on this, the weighted average cost of capital was determined and used as the Minimum
Rate of Return (MRR) to assess the economic viability of the project.
In addition, sensitivity analyses were conducted to verify the effect that changes in any of the
economic parameters like capital cost, operating cost and revenue would have on the project’s
viability. Furthermore, risk analysis was carried out using the Monte Carlo simulation
technique, which takes into account the simultaneous random variation of economic parameters
on the project’s viability. As a result, risk was quantified and the probability of achieving
specific returns on the investment also measured. The project was found to be economically
viable and financially sound since the NPV was $2 157 862.95 and the Internal Rate of Return
(IRR) of (36.46%) was greater than the weighted average cost of capital (19.04%) which is
considered as the minimum rate of return. The risk analysis conducted revealed a risk of 35%
associated with the project.
University of Ghana http://ugspace.ug.edu.gh

- 14 -
CHAPTER THREE
METHODOLOGY
All the methods adopted are systematically outlined below, and these include validation
of all available data on drilling and sampling, statistical treatment of the data, appropriate data
transformation and the incorporation of reliable modeling tools for the resource evaluation,
ore modeling and financial analysis. Details of each approach in relation to the method is
dully considered and explained.
3.1 Drilling and Survey
Advanced exploration systems reverse circulation (RC) and diamond drilling (DD) were used
to define the resource of the Kojina gold deposit. Boart longyear and Geodril Ghana Ltd
were the contractors used for all the drilling at Kojina. Drillhole information was captured
electronically at DrillCorp using mini handheld devices called motion PDA’s. Previously,
Dell’s iPAQ using Fusion’s Century Technology was used for the data logging (DrillCorp
database report, (2013) to ensure the following;
• Standardized procedures and data integrity
• Secured and centralized data
• Increased confidence in interpretations Diameter of core used for this project was HQ, a 63.5 mm diameter core, extracted using a
triple-tube wire-line system capable of extracting core under the worst of ground conditions.
The Kojina area is drilled on a fairly regular grid of 50 along strike by 25 across. Most of the
holes were drilled at an angle between 60 and 70 degrees towards grid east, typically
intersecting the mineralisation zones at 25 meter to 50 meter intervals on section.
University of Ghana http://ugspace.ug.edu.gh

- 15 -
Numerous permanent and semi-permanent survey control stations have been established by the
company’s licensed surveyors. Surface surveying affecting the current resource estimate was
carried out using Sokkia total station electronic distance measuring (EDM) instruments.
Downhole surveys were done historically by FlexIT tool, a single-shot surveying instrument
but more recently by the contractor called Wellforce, UK Ltd, which did it using the gyroscope
surveying tool, a multi-shot able to measure all parameters at any number of depths in a single
run into a hole. An azimuth and dip reading is taken every 30m, and at the end of hole.
Grid System
The project area has a local grid system; Kojina grid system. This grid was chosen so that each
localised mineralization would have its strike aligned orthogonally to a local north-south trend.
The rotation between these two grids is approximately 45o, the seed points for transforming
these to UTM coordinates are;
Point 1 568,247.65E 69,9529.75N WGS/84 15,086.59E 38,559.73N Kojina Grid Point 2 567,065.39E 69,4749.19N WGS/84 16,338.48E 33,797.21N Kojina Grid
3.2 Sampling, Sample preparation and analysis
For RC drilling, sample mixing is prevented by blowing the hole clear at the end of each
sampled interval. RC samples are split with the Jones’ riffle splitter (Figure 4) to get 2-3kg for
laboratory analysis. Diamond core is cut into two halves. One halve is stored for future study
and logging, and the other halve was generally sampled at 1m intervals, unless geological
conditions dictated otherwise, in which case sample intervals could be shorter. Generally, only
University of Ghana http://ugspace.ug.edu.gh

- 16 -
mineralized zones were sent to the lab but a few non-mineralised samples were sent as
sterilization samples.
Quality Assurance and Quality Control (QAQC )
At Kojina, the types of QAQC checks used are:
• Standards (STD)
These are samples of known (usually certified) grade that are submitted to monitor the
accuracy of a laboratory, i.e. the ability of the laboratory to get the correct or known
result. The standards were bought from Rocklabs in Australia. The permitted standard
deviation is +_10%. (Rocklabs Limited, 2013)
• Blanks (BLK)
Blank (barren samples) inserted routinely into known ore zones to check on possible
contamination from the laboratory.
• Field Duplicate (DUP)
Field Duplicates are collected at the drill rig (for RC chips). Diamond cores
however are split at the core shed (Figure 4) for duplicate samples. Duplicates
were used to estimate sampling and laboratory precision.
ALS Chemex, Kumasi, a subsidiary of ALS Global Ltd, did all the assaying for DrillCorp.
Results are sent to DrillCorp in electronic format as an encrypted certificate with accompanying
CSV file for easy loading into DrillCorp’s Fusion database. Assay files received from the lab
are never altered. Any inconsistencies are rather referred back to the lab for rectification. All
assaying has been by 50 gram Fire Assay with AAS finish. Umpire checks are sent to Genalysis
Lab in Australia from a random selection of pulps and rejects.
University of Ghana http://ugspace.ug.edu.gh

- 17 -
Figure 4: Mechanized core cutting process by DrillCorp 3.3 Approaches to Project Valuation
There are three generally accepted approaches to mine project valuation (Manu, 2014). These
are the cost approach, market approach and earnings approach.
The cost approach
The fundamental concept is that a purchaser would not be justified in paying more for a
property than it would cost him to acquire land and construct improvements having comparable
utility, assuming no undue delay. The cost approach is merely applicable in valuing mining
properties and is the least reliable method of valuation (Manu, 2014). The correlation between
construction costs and value of the property is very imperfect since the very nature of mineral
exploration and mining dictates that the discovery value of an ore deposit is generally greater
than the cost incurred in that discovery.
University of Ghana http://ugspace.ug.edu.gh

- 18 -
The market or comparable sales approach The market approach is viewed by most appraisers and courts as the best since it reflects the
balance of supply and demand. The market approach is rarely used for mining property
transactions because assumptions are hardly present and making it very difficult to ascertain
the actual true value of the sale. The Analyst studies the market for similar assets in attempting
to determine the market value of the item in question. Practical problems of this approach
when applied to mining transactions is that there is little comparative data available due to
limited sales of mining properties. Each mineral deposit is unique in quality, size, geological
location, degree of development, and many other parameters, and market data are of modest
value at best.
The income or earnings approach
The Income Approach is used widely in valuing mineral properties (Manu, 2014). The value
of the asset or investment- type property is estimated by calculating future annual net earnings
from the producing mine or asset and then discounting this earning’s stream to the present time
using an appropriate interest rate. The assumption is that the purchaser would not be justified
in paying more to acquire income producing than the present value of the income stream from
the property.
If comparable sales data are unavailable or one is estimating the value of a commodity in-situ,
it is possible to arrive at a value estimate by combining the selling price of the commodity
produced with the associated costs of producing the commodity from the property in question.
By properly incorporating this data into a discounted cash flow analysis, it is possible to arrive
at an estimate of property value even in the absence of actual production (Manu, 2014).
University of Ghana http://ugspace.ug.edu.gh
- 19 -
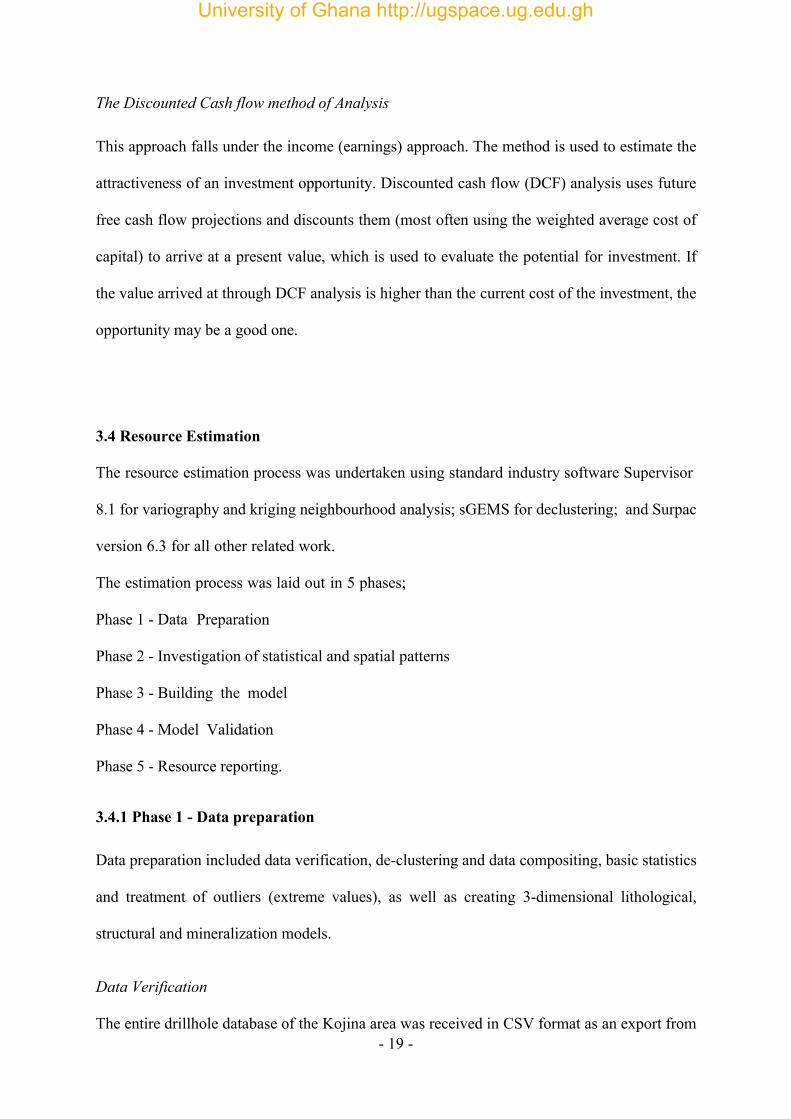
The Discounted Cash flow method of Analysis This approach falls under the income (earnings) approach. The method is used to estimate the
attractiveness of an investment opportunity. Discounted cash flow (DCF) analysis uses future
free cash flow projections and discounts them (most often using the weighted average cost of
capital) to arrive at a present value, which is used to evaluate the potential for investment. If
the value arrived at through DCF analysis is higher than the current cost of the investment, the
opportunity may be a good one.
3.4 Resource Estimation
The resource estimation process was undertaken using standard industry software Supervisor
8.1 for variography and kriging neighbourhood analysis; sGEMS for declustering; and Surpac
version 6.3 for all other related work.
The estimation process was laid out in 5 phases;
Phase 1 - Data Preparation
Phase 2 - Investigation of statistical and spatial patterns
Phase 3 - Building the model
Phase 4 - Model Validation
Phase 5 - Resource reporting.
3.4.1 Phase 1 - Data preparation Data preparation included data verification, de-clustering and data compositing, basic statistics
and treatment of outliers (extreme values), as well as creating 3-dimensional lithological,
structural and mineralization models.
Data Verification
The entire drillhole database of the Kojina area was received in CSV format as an export from
University of Ghana http://ugspace.ug.edu.gh

- 20 -
the Fusion database. The information received was validated against original field sheets,
survey contractor’s Gyro reports and assay lab certificates by comparing side by side in an
excel spreadsheet (Table 1).
Table 1: Validating database against field logs
The holes chosen for verification represented 10% of the entire database randomly selected.
The process consisted of checks on: Collar Coordinates (easting, northing, elevation, hole
length); Survey (azimuth, dip, depth); Lithology (rock code, interval); and Assay (Au values,
sample number, sample interval). Appendix G contains results of the checks. In addition,
actual field verification of collars (Figure 5) was also done on some random holes.
Figure 5: Verifying accuracy of Collar location
University of Ghana http://ugspace.ug.edu.gh

- 21 -
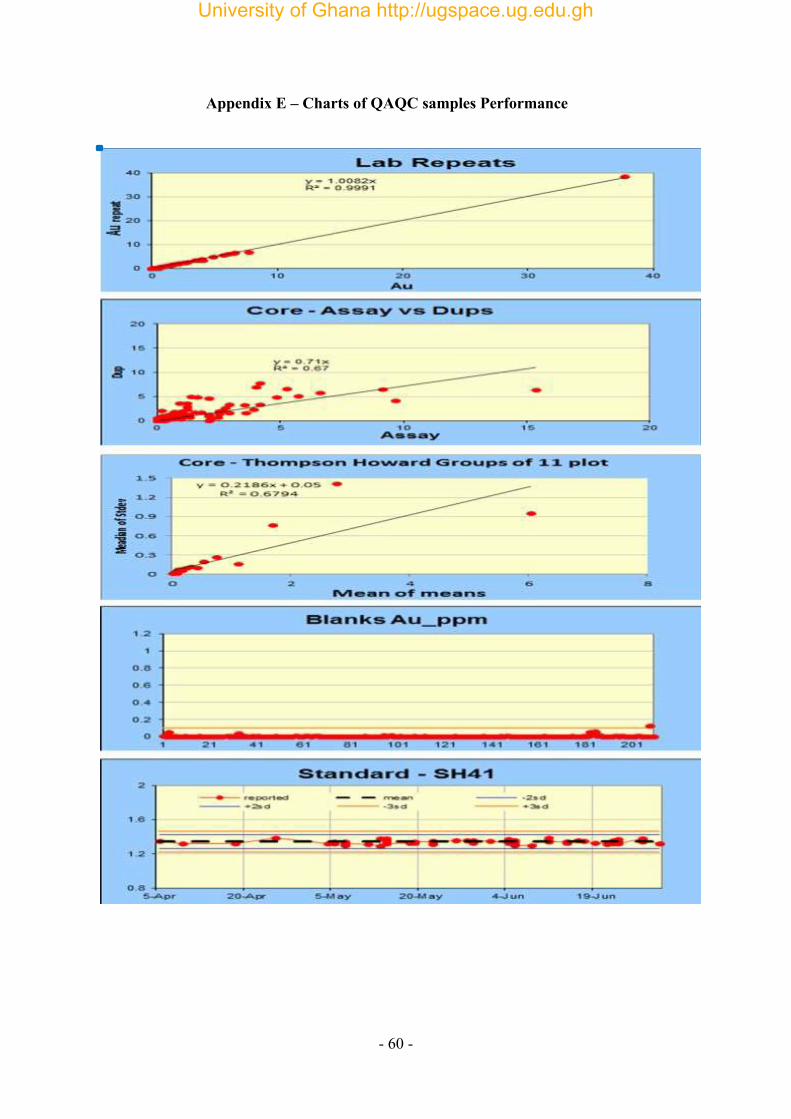
Accuracy and precision of Lab results Plots of original samples versus duplicates, original samples versus repeats etc were generated
using excel charts. The failure criteria used for certified reference materials (CRMs) was per
manufacturer’s guideline summarized as follows;
• Any standard value falling outside of ±3SD is a failure (inaccurate),
• Any two or more consecutive values falling between ±2SD and ±3SD on the
same side of the mean are failures (Rocklabs Limited, 2013).
Data compositing and De-clustering
To ensure that the samples for estimation represent equal volume (support), compositing
was done. The composite length was determined from statistical analysis as the sample interval
with the highest rank (Figure 6). A 3m length composite was also done to be used later for
validation.
Figure 6: Determining composite length by histogram
In order to reduce the influence of the crowded samples on the estimation process,
declustering was done using GSLIB (geostatistical software library, developed by Stanford
university, USA) cell de-clustering which assigns weights to samples.
University of Ghana http://ugspace.ug.edu.gh

- 22 -
For a given cell, the weight of each sample is calculated as follows,
The cell size used was determined from a graph of grade versus sample cell sizes (Figure 7) at
the point on the graph where the data first flattens out.
Figure 7: Determining cell de-clustering size
Basic statistical analysis was performed on the composite string to determine the statistical
properties of the data being used for the geostatistical estimation. The statistics include the
mean, median, variance, standard deviation, coefficient of variation, skewness and kurtosis
as shown in Table 2.
Table 2: Descriptive statistics of raw data No. of Points 23,087 Mean 0.84 Standard Deviation 1.07 Variance 1.14 Cofficient of Variation (CoV) 1.28 Skewness 5.49 Kurtosis 61.78 Maximum 21.40 75% 1.15 50% 0.54 25% 0.22 Minimum 0
University of Ghana http://ugspace.ug.edu.gh
- 23 -
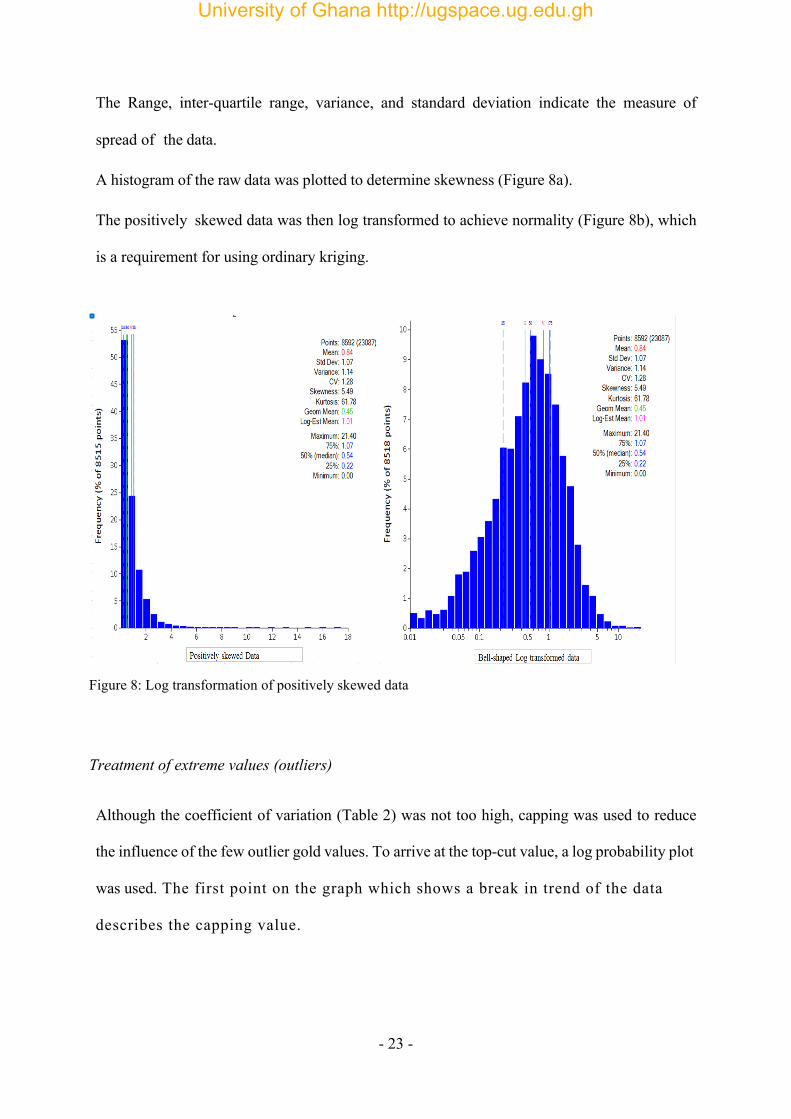
The Range, inter-quartile range, variance, and standard deviation indicate the measure of
spread of the data.
A histogram of the raw data was plotted to determine skewness (Figure 8a).
The positively skewed data was then log transformed to achieve normality (Figure 8b), which
is a requirement for using ordinary kriging.
Figure 8: Log transformation of positively skewed data
Treatment of extreme values (outliers)
Although the coefficient of variation (Table 2) was not too high, capping was used to reduce
the influence of the few outlier gold values. To arrive at the top-cut value, a log probability plot
was used. The first point on the graph which shows a break in trend of the data
describes the capping value.
University of Ghana http://ugspace.ug.edu.gh

- 24 -
The inflexion point (Figure 9) on the graph was used as top-cut value. A topcut of 10g/t was
applied to the data.
Figure 9: Log probability plot for gold (Au) –Selecting the top-cut value Wireframes, surfaces and ore solids All the 3-dimensional (3D) models of lithology, shear zones, alteration and mineralization were
created by digitizing sectional interpretations of lithology, alteration, or mineralization in
cross-section mode across the deposit. The strings were then triangulated to build 3D solids.
The topographic surface was created by extracting all collar values into a string to form the
surface. The oxidation surface points were extracted from geotechnical core log data. Points
on each drillhole logged as oxide /fresh were extracted as strings. These strings were then
formed into DTM’s (digital terrain models) using Surpac’s “create DMT from string”
function.
University of Ghana http://ugspace.ug.edu.gh
- 25 -
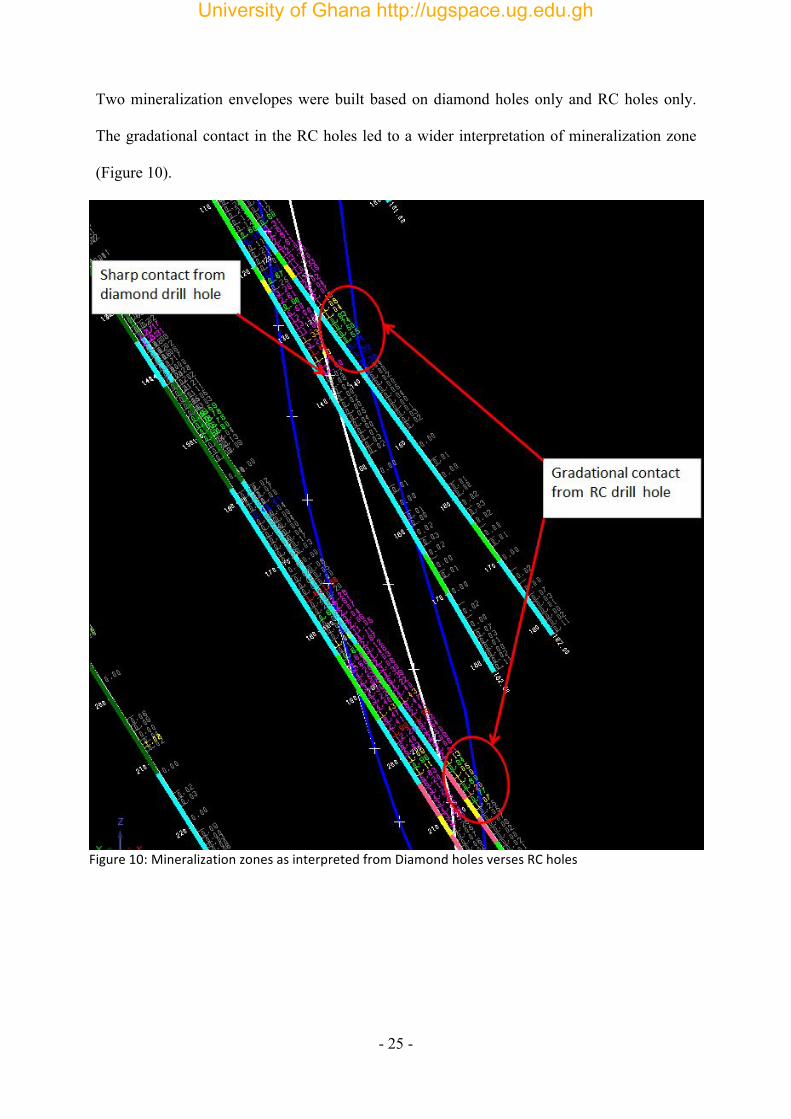
Two mineralization envelopes were built based on diamond holes only and RC holes only.
The gradational contact in the RC holes led to a wider interpretation of mineralization zone
(Figure 10).
Figure 10: Mineralization zones as interpreted from Diamond holes verses RC holes
University of Ghana http://ugspace.ug.edu.gh

- 26 -
3.4.2 Phase 2- Investigation of statistical and spatial patterns The semi-variogram was used in identifying and modeling the trends in the data. The prepared
data was imported into Supervisor software and processed. Two sets of variogram were
generated; the downhole variogram and the planar variogram. The downhole variogram was
generated first to know the nugget effect to be used in the planar variogram. A line of best fit
was put through the sample pairs which equation is used by Surpac as the trend predictor for
the kriging process. The major and semi-major anisotropic ratios describe the relationship
between the principal directions. The two variogram maps were extracted along the
minor axis to generate the anisotropic ratio and the kriging parameters for the estimation
process. This minor axis is the down dip or plunge of the orebody. An ellipsoid was created
from these ratios and superimposed on the dataset to confirm the trends in the data. All
results were back transformed, per industry standard, using the back-transform model below
(Figure 11).
Figure 11: Back transform Model
University of Ghana http://ugspace.ug.edu.gh

- 27 -
Kriging neighbourhood analysis The Supervisor kriging neighbourhood analysis (KNA) utility was used. KNA helps determine
the best block size, discretization, minimum and maximum number of composites to use for
estimation, and search ellipse size by domain. (Figure 12)
Figure 12: KNA –Determining block size, number of samples, search radius
University of Ghana http://ugspace.ug.edu.gh

- 28 -
3.4.3 Phase 3- Building the model The entire dataset was displayed in 2D grid, both plan view and longitudinal view. The limits
of the data guided the choice of the block model extents (Table 3). The selection of block
size was driven by the borehole spacing (easting and northing), which is 25m as well as the
assumed mining bench height (elevation) of 3m.
Table 3: Block model extents
Block model parameters
X Y Z Minimum 48885 88270 1350 Maximum 49470 89220 2500 Parent Block Size 10 20 3 Sub Block Size 5 10 3
The model was created using Surpac version 6.5. Attributes (Table 4) were created to store the block model properties as summarized below. Table 4: List of attributes used in the block model
Block Model Attributes
Attribute Name Type Background value Description
au_nn Real -99 nearest neighbour gold estimate expressed in g/t au_ok Real -99 ordinary krigged gold value expressed in g/t specific gravity (SG) Real 2.75 in-situ dry bulk density expressed in g/cm3
redox Float Fresh oxidation state of rock expressed as “fresh” or “oxide”
krig_var Float - kriging variance of the estimate class Integer 4 mineral resource classification
nsamp Float - the number of data points used to estimate grade;
nhole Integer - the number of drillholes used to source data for estimation;
Pass Integer
- the estimation pass that successfully informed the cell
University of Ghana http://ugspace.ug.edu.gh

- 29 -
Grade Estimation Grade estimation was done twice; based on the mineralization as interpreted from the Diamond holes
and then as interpreted from the RC holes. The estimation was done using ordinary kriging and
nearest neighbour methods. The nearest neighbour method was later used as one of the
validation checks. Estimation for gold grade was done with a 3-pass approach in each case,
using search ellipses defined by variogram ranges. The first estimation pass used a search
radius equal to the full variogram range. The range was doubled for pass two, and tripled for
the third estimation pass. Based on the KNA, a minimum of three holes were used for the
first and second pass estimations; two drill holes for the third pass. No more than eight
samples per single drill hole were used for the estimation. Thus the highest confidence
blocks were estimated in pass 1 and the lowest confidence blocks in pass 3.
3.4.4 Phase 4- Block Model Validation
Three methods of validation were used.
1. Visual validation Visual inspections on cross sections of composite values compared to the estimated blocks
were made for reasonableness. Comparisons were made using the 1 m composites that were
used for the block estimates. Also, 3 m composites were compared to the blocks as they would
have a variance closer to that of the blocks. Some of the sections are displayed in Appendix D
2. Swath plots
A comparison of the estimated block grades with the composite data along the three principal
directions i.e. evaluation of conformance of the block estimates with the composite grades by
comparing au_ok (ordinary krigged estimates), au_uncap (uncapped composite data) and the
au_cap (capped composite data).
University of Ghana http://ugspace.ug.edu.gh

- 30 -
3. Alternative Estimation technique A Nearest neighbour estimation was done as a check on the ordinary krigged estimate. The two
were compared using an excel scatter plot; estimated grade on y-axis, estimated point location
in y, x, z directions on the x-axis.
University of Ghana http://ugspace.ug.edu.gh
- 31 -
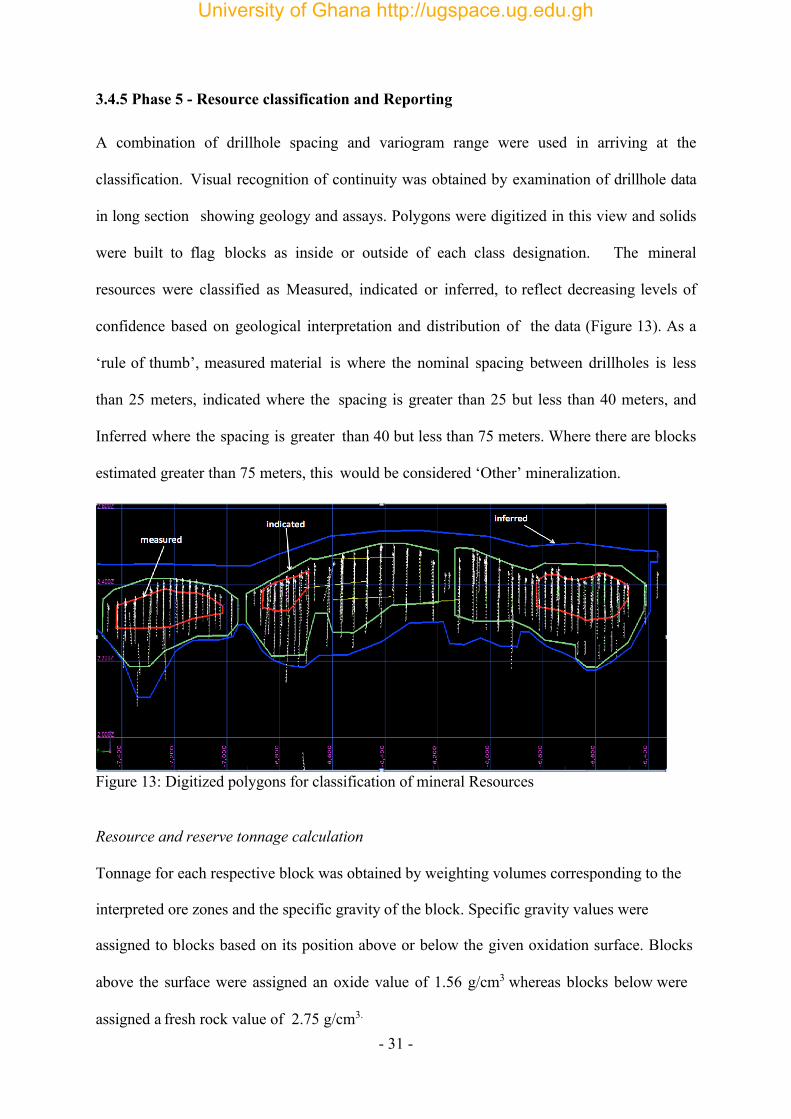
3.4.5 Phase 5 - Resource classification and Reporting A combination of drillhole spacing and variogram range were used in arriving at the
classification. Visual recognition of continuity was obtained by examination of drillhole data
in long section showing geology and assays. Polygons were digitized in this view and solids
were built to flag blocks as inside or outside of each class designation. The mineral
resources were classified as Measured, indicated or inferred, to reflect decreasing levels of
confidence based on geological interpretation and distribution of the data (Figure 13). As a
‘rule of thumb’, measured material is where the nominal spacing between drillholes is less
than 25 meters, indicated where the spacing is greater than 25 but less than 40 meters, and
Inferred where the spacing is greater than 40 but less than 75 meters. Where there are blocks
estimated greater than 75 meters, this would be considered ‘Other’ mineralization.
Figure 13: Digitized polygons for classification of mineral Resources
Resource and reserve tonnage calculation
Tonnage for each respective block was obtained by weighting volumes corresponding to the
interpreted ore zones and the specific gravity of the block. Specific gravity values were
assigned to blocks based on its position above or below the given oxidation surface. Blocks
above the surface were assigned an oxide value of 1.56 g/cm3 whereas blocks below were
assigned a fresh rock value of 2.75 g/cm3.
University of Ghana http://ugspace.ug.edu.gh

- 32 -
3.5 Financial Analysis The economics of the SAMEVA Project were evaluated using a real, after-tax discounted cash
flow (DCF) model on a 90% project equity basis, calculated as:
CFn = cash flow in year n; r = discount rate; n = nth year of investment
Projected production, revenues, operating costs, capital costs and taxes were considered in the
financial model (Figure 14) below. The main economic assumptions were a US$1,200/oz
gold price and a 10% discount rate.
Figure 14: Cash flow model for mineral project evaluation in Ghana (modified after Stermole, 1993)
University of Ghana http://ugspace.ug.edu.gh
- 33 -
3.5.1 Cost estimates Capital cost estimates
Capital costs estimates include pre-production costs, ongoing construction and replacements
costs, infrastructure, vehicles, closure and rehabilitation costs.
Operating and processing costs
Estimates on operating and processing costs were based on figures from the adjacent producing
mines of Chirano Gold mines and Noble Gold Mines, as well as the national mining costs
index. Details of capital expenditure and operating cost estimates are attached as Appendix H
and I
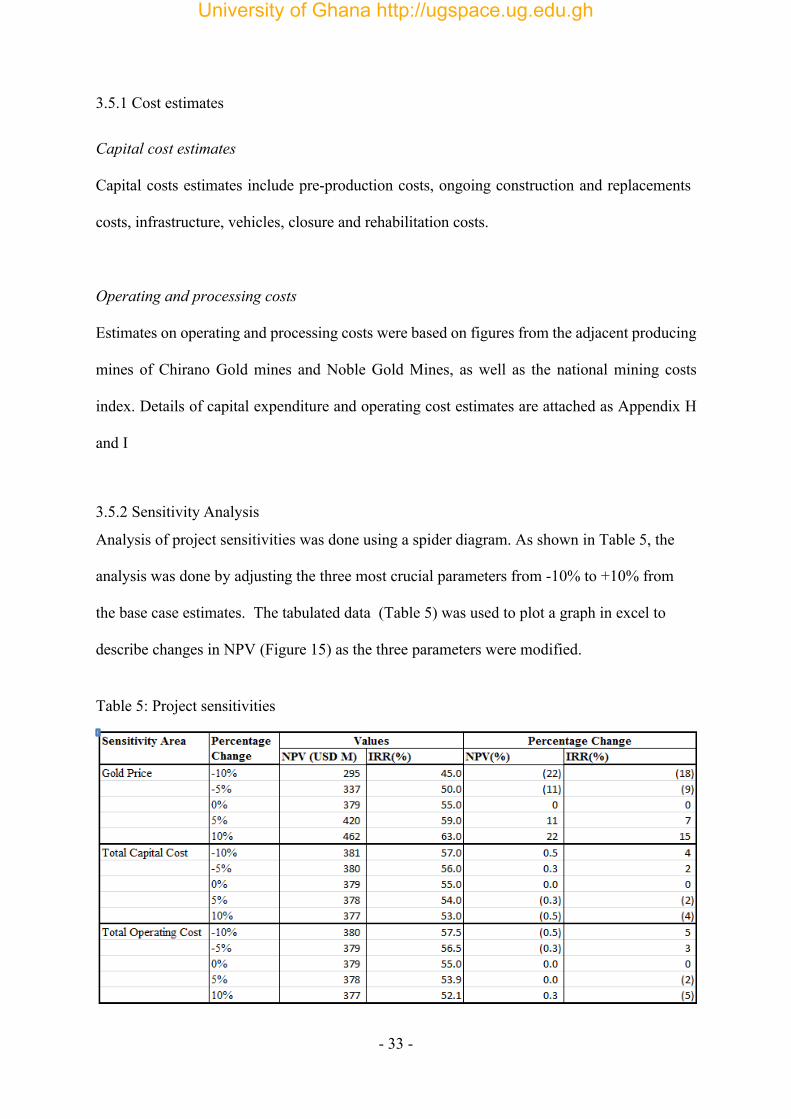
3.5.2 Sensitivity Analysis
Analysis of project sensitivities was done using a spider diagram. As shown in Table 5, the
analysis was done by adjusting the three most crucial parameters from -10% to +10% from
the base case estimates. The tabulated data (Table 5) was used to plot a graph in excel to
describe changes in NPV (Figure 15) as the three parameters were modified.
Table 5: Project sensitivities
University of Ghana http://ugspace.ug.edu.gh

- 34 -
Figure 15: Determining the effect of price/cost changes on NPV
University of Ghana http://ugspace.ug.edu.gh

- 35 -
CHAPTER FOUR
RESULTS AND DISCUSSION
4.1 Deduction on Data validation and Integrity Spatial (geostatistical) analysis of the data – that is, the calculation and modelling of semi-
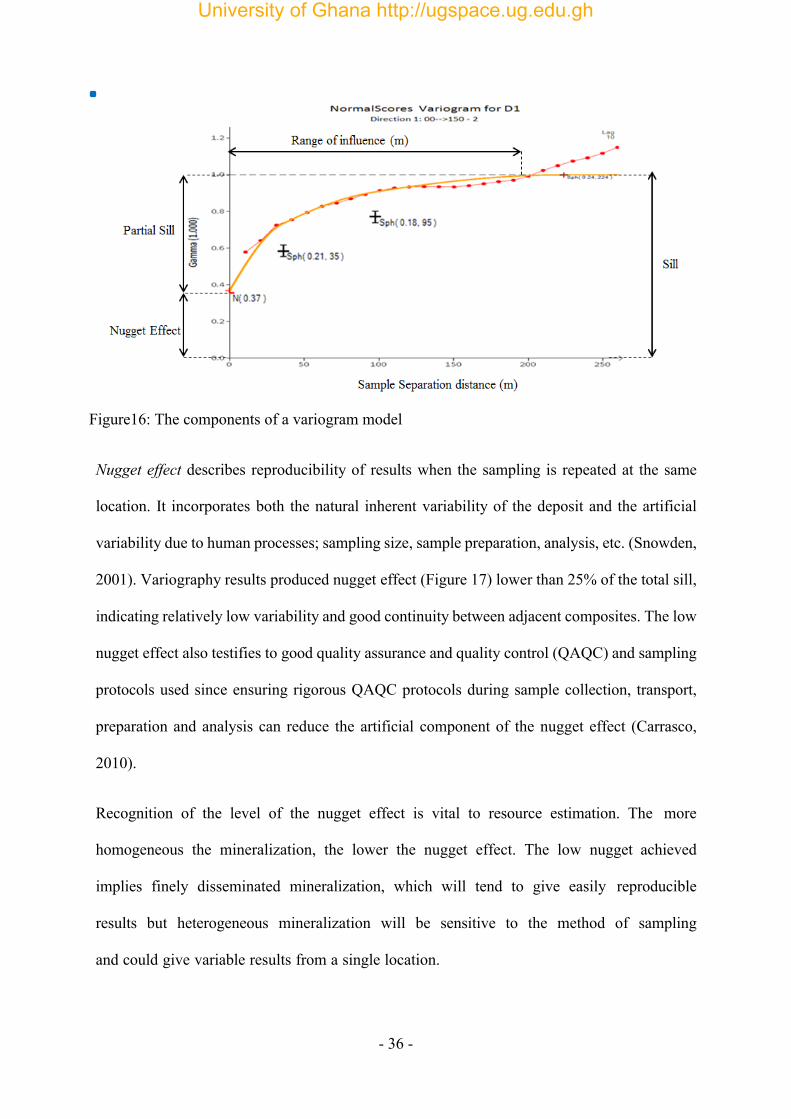
variograms is a precursor to any of the kriging methods. The semi-variogram (Figure 16) is a
graph relating the degree of similarity between sample grades to the distance between them
along a given orientation.
Structural analysis through the semi-variogram was used to describe the spatial variability of
the gold attribute. The calculation of variograms in different directions (Figures 18 to 20) along
strike, across strike and down dip gave an important insight into the (an)isotropy of the
orebody. The primary and secondary planar variograms were used to determine the direction
of maximum continuity along strike and across strike of the orebody respectively.
Fitted to these experimental variograms are a series of mathematical models, which when used
in the kriging algorithm created the spatial continuity observed in the dataset (Hadlow,
Khosrowshah and Vearucombe, 1993). The grades of samples separated by distances greater
than the range of influence are uncorrelated, implying that such samples cannot be used to
estimate locations outside this range. The variogram model of data follows the classical
definition of a spherical model; a linear behaviour at small separation distance near the origin
but flattens at large distances (Figure 16) with the tangent of the origin reaching the sill at
about two-thirds of the range (Vann, 2007).
University of Ghana http://ugspace.ug.edu.gh
- 36 -
Figure16: The components of a variogram model
Nugget effect describes reproducibility of results when the sampling is repeated at the same
location. It incorporates both the natural inherent variability of the deposit and the artificial
variability due to human processes; sampling size, sample preparation, analysis, etc. (Snowden,
2001). Variography results produced nugget effect (Figure 17) lower than 25% of the total sill,
indicating relatively low variability and good continuity between adjacent composites. The low
nugget effect also testifies to good quality assurance and quality control (QAQC) and sampling
protocols used since ensuring rigorous QAQC protocols during sample collection, transport,
preparation and analysis can reduce the artificial component of the nugget effect (Carrasco,
2010).
Recognition of the level of the nugget effect is vital to resource estimation. The more
homogeneous the mineralization, the lower the nugget effect. The low nugget achieved
implies finely disseminated mineralization, which will tend to give easily reproducible
results but heterogeneous mineralization will be sensitive to the method of sampling
and could give variable results from a single location.
University of Ghana http://ugspace.ug.edu.gh

- 37 -
The higher the nugget effect, the lower the likelihood of being able to achieve a high degree
of selectivity during mining.
This affects classification in that a high nugget effect resource quoted at a low cut-off may have
a higher degree of resource confidence than if it were reported at a higher cut-off.
Figure17: Downhole variogram for Au - determining the nugget effect
Figure 18: Variogram modelling for direction 1
University of Ghana http://ugspace.ug.edu.gh

- 38 -
Figure 19: Variogram modelling for direction 2
Figure20: Variogram for modelling direction 3
University of Ghana http://ugspace.ug.edu.gh
- 39 -
4.2 The Resource Model and Estimation
The main factors that were considered in arriving at the Mineral Resource/ Reserve
Estimates (Tables 6 to 8) were the amount of data, distribution and quality of the data,
reliability of geological interpretation, assumptions regarding costs and commodity prices.
In determining block size to be used, it should ideally bear some relation to the mining
equipment planned for use, often referred to as the selectivity. The concept of the selective
mining unit is the smallest parcel of ground on which mining decisions, such as the allocation
to ore or waste, may be made.
The block dimensions should also be considered in relation to the sampling grid; blocks that
are too small will result in over smoothing of the sample data and subsequent very low
precision results. Over smoothing results in conditional bias, whereby high-grade blocks
are underestimated and low-grade blocks are overestimated (Krige, 1996). Supervisor’s
KNA tool was used as a guide in arriving at the block size.
Drillholes are spaced at 25 m sections and 25 to 75 m on long sections. A block size of 10 m
x 10 m x 6 m was selected in order to accommodate the nature of the mineralization and
be amenable for the open pit potential. The block model was sub-celled on a 5 mx 5 m x3m
pattern in the YZ plane which allows the parent block to be split in each direction to
more accurately fill the volume of the wireframes, thus more accurately estimate the
tonnes in the resource.
The resource estimate was done using the ordinary kriging method on a capped and
composited borehole dataset. Whatever the estimation approach adopted, all techniques
which seek to interpolate grades into blocks (except the nearest neighbour method)
depend on the sample search procedure. The methods by which samples are selected for
subsequent weighting are critical to the process, and in some cases (Carras, 1998) are of
more consequence than the estimation algorithm itself. A good sample search plan should
University of Ghana http://ugspace.ug.edu.gh

- 40 -
have some or all of the following features; de-clustering of data via octant or quadrant
selection, restrictions on the number of samples from one drill hole, minimum and
maximum numbers of samples specified for search, preferred search directions (i.e.
anisotropic search); and restriction of the influence of high- grade samples.
Validation of the results was conducted through the use of swath plots (Figure 21), visual
inspection (Figure 22), and global statistical comparison of the model against a nearest
neighbour (NN) model. As is typical for exploration data, the composites were slightly
more variable than the block grades (Figure 21). This may imply some smoothing in the
resource model estimates. The potential for smearing high-grade samples elsewhere within
the deposits was controlled by the kriging process.
As depicted by Figure 23, the ore zone is quite well-defined.
Figure 21: Comparing Ordinary krigged estimates to Nearest neighbour estimates
University of Ghana http://ugspace.ug.edu.gh

- 41 -
Figure 22: Section showing good comparison between drillholes and estimated grades
Figure 23: Plan view of model at 0.5g/t cut-of
University of Ghana http://ugspace.ug.edu.gh

- 42 -
Table 6: Resource summary indicating Metal content at increasing cut-off
Table 7: Resource summary by category Resource Classification Tonnage Grade Ounces Measured 28,237,758 1.60 1,452,583 Indicated 16,425,907 1.28 675,974 Inferred 10,455,010 1.44 484,036 Total 55,118,674 1.47 2,612,593
Table 8: Reserve summary Reserve Classification Tonnage Grade Ounces Proven 26,714,874 1.45 1,241,349 Probable 10,699,124 1.29 443,740 Total 37,413,998 1.40 1,685,089
University of Ghana http://ugspace.ug.edu.gh

- 43 -
Criteria for Classifying Mineral Resources as Measured, Indicated or Inferred
• Confidence in geological and grade continuity as depicted in variograms (Figure 24)
• Quantity and distribution of drillhole data (Figure 25)
Figure 24: Variogram ellipsoid showing Grade anisotropy in the data
Figure 25: Plan view of drill holes showing good sampling coverage
University of Ghana http://ugspace.ug.edu.gh
- 44 -
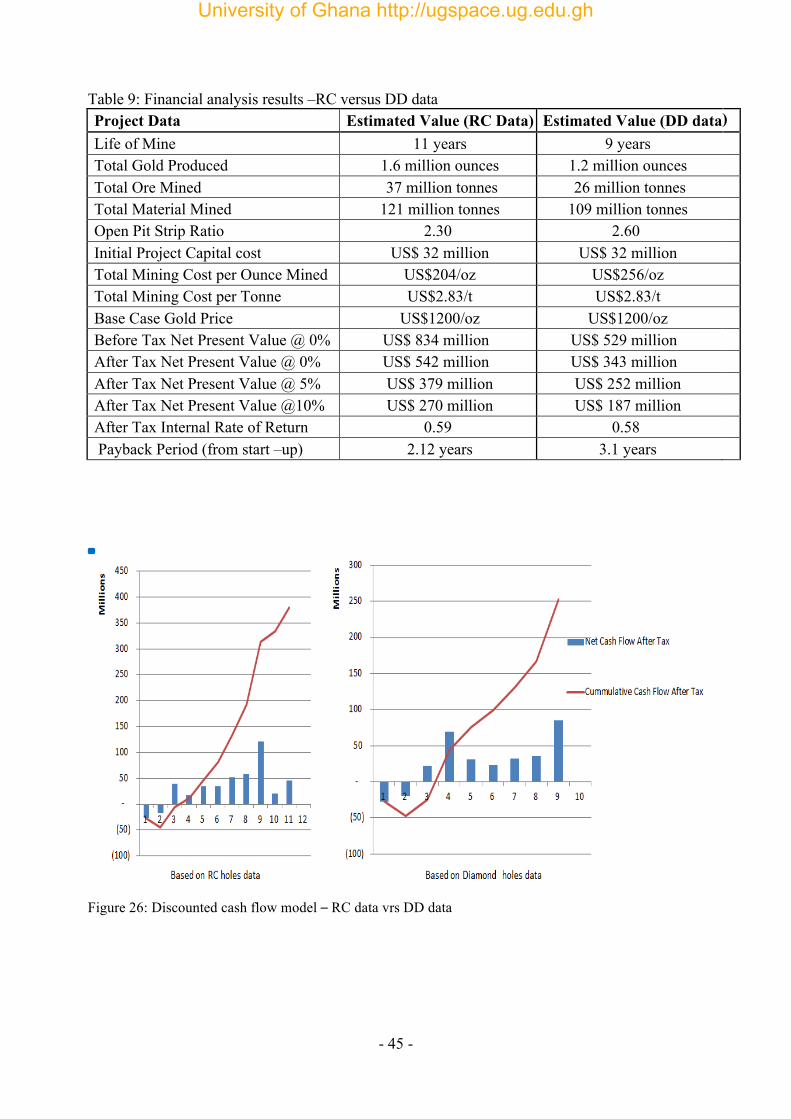
4.3 Financial analysis To overcome the causes of unreliable financial estimates, cost parameters and
assumptions were based on benchmarking of the adjacent mining operation of Chirano
Gold Mines Ltd and Noble Gold ltd. This was done to ensure estimates were close to
reality.
Some assumptions upon which the financial analysis was done are that mining will be by
conventional open pit bench mining using truck and shovel method, a gold price of
US$1,200/oz, a 10% discount rate, metallurgical recovery tests yielding 96% for oxide
and 92% for sulphides. The project was evaluated using a real, after-tax discounted cash
flow model (Figure 26) on a 90% project equity basis. The annual rates of production were
then estimated based on the projected excavator capacity. Based on the recoveries and gold
price of USD 1,200, corporate tax of 35%, royalties of 5.6% and the other costs, revenues
could then be calculated as shown in Appendix I.
University of Ghana http://ugspace.ug.edu.gh
- 45 -
Table 9: Financial analysis results –RC versus DD data Project Data Estimated Value (RC Data) Estimated Value (DD data) ) Life of Mine 11 years 9 years Total Gold Produced 1.6 million ounces 1.2 million ounces Total Ore Mined 37 million tonnes 26 million tonnes Total Material Mined 121 million tonnes 109 million tonnes Open Pit Strip Ratio 2.30 2.60 Initial Project Capital cost US$ 32 million US$ 32 million Total Mining Cost per Ounce Mined US$204/oz US$256/oz Total Mining Cost per Tonne US$2.83/t US$2.83/t Base Case Gold Price US$1200/oz US$1200/oz Before Tax Net Present Value @ 0% US$ 834 million US$ 529 million After Tax Net Present Value @ 0% US$ 542 million US$ 343 million After Tax Net Present Value @ 5% US$ 379 million US$ 252 million After Tax Net Present Value @10% US$ 270 million US$ 187 million After Tax Internal Rate of Return 0.59 0.58 Payback Period (from start –up) 2.12 years 3.1 years
Figure 26: Discounted cash flow model – RC data vrs DD data
University of Ghana http://ugspace.ug.edu.gh

- 46 -
Project Sensitivities Sensitivity analysis is a tool for project failure prediction and a potential risk mitigation tool.
A sample spider plot (Figure 27) showing the effects of metal price changes, changes
in Capital cost, and operating costs on NPV. The sensitivity analysis indicates that changes
in operating and capital costs do not have any appreciable impact on the project because these
parameters lie virtually flat on the curve and are not steep as the gold price parameter.
Stability of gold price on the market, which unfortunately cannot be controlled by the
investor, can impact very negatively on the project.
Figure 27: Sensitivity Analysis Graph
The factors that cause poor resource estimation: unreliable data and/or insufficient data; poor
geological interpretation; inappropriate estimation methodology; inadequate checks and
alternative estimates, inappropriate financial analysis; reliance on unsustainable market and
pricing forecast; excessive optimism on production forecasts (English, 1984) have been
tackled in this research work. Ground truthing, which refers to actual site visits and checks on
data, was a key component of this work.
University of Ghana http://ugspace.ug.edu.gh

- 47 -
Table 10: Financial analysis results and sensitivities Financial metric Unit Gold Price (US$/oz)
1,100 1,200 1,300 1,350 1,400
NPV at 0% discount rate US$
(million) 447.22 542.34 637.47 685.03 732.59
NPV at 5% discount rate US$ (million) 310.18 379.71 449.24 484 518.77
NPV at 10% discount rate
US$ (million) 218.65 270.92 323.19 349.33 375.47
Internal rate of return % 50% 59% 67% 71% 75% Payback year Year 2017 2017 2017 2017 2017
University of Ghana http://ugspace.ug.edu.gh

- 48 -
CHAPTER FIVE
CONCLUSION AND RECOMMENDATION
5.1 Conclusion This work provides insight concerning the mineral resource evaluation of the Kojina gold deposit
on the Sefwi-Bibiani gold belt. The major findings regarding the project objectives are stated as
following;
i. Using appropriately planned drilling and representative sampling as well as
predominant use of diamond core gives more accurate information since the sample
is in-situ with no contamination and has structural orientation which allows for
better geologic and structural mapping therefore helping define the mineralization
zones more accurately.
ii. The mineralization interpretation based on reverse circulation holes gave
37,413,998 tonnes at 1.47g/t whereas that based on the diamond holes gave
26,674,888 tonnes at 1.57g/t.
iii. Based on the more accurate interpretation from diamond holes, the Net-Present
value of the project was estimated at USD 187,796,325 with a payback period of
three years.
1.2 Recommendations
1. SAMEVA Ltd should go ahead with the acquisition of the Kojina deposit and
immediately commence feasibility studies.
2. That diamond drill holes be included when evaluating structurally controlled
mineral deposits.
University of Ghana http://ugspace.ug.edu.gh

- 49 -
REFERENCES Awotwe, T. (2003), “Pre-feasibility study of the Dokrupe Gold Project”, unpublished Master of
Science Thesis in Mining Engineering, University of Science & Technology, Kumasi. 81 pp. Burmeister, B.B. (1988), “From Resource to Reality: A Critical Review of the Achievements of
New Australian Gold Mining Projects During the Period January 1983 to September 1987”, Macquarie University, Sydney, Unpublished
Bullock, R.L. (2011), “Accuracy of feasibility study evaluations would improve accountability”
Mining Engineering Journal, Volume 63 issue 4, pp 78 Carras, S. N. (1998), “Let the ore body speak for itself”, Gold and Nickel Ore Reserve Estimation
Practice Seminar, The Australasian Institute of Mining and Metallurgy, Kalgoorlie Branch. pp 3-18
Carrasco, P. C. (2010), “Nugget effect, artificial or natural”, The Journal of the Southern African
Institute of Mining and Metallurgy, vol. 110, June 2010, pp. 299-305. Darling, P. (2013), SME Mining Engineering Handbook, Third Edition. Society for mining,
Metallurgy and exploration. 1837 pp Dickson, K.B., and Benneh, G. (1988) A New Geography of Ghana. Longman Group Limited. pp
1-177. DrillCorp, (2013), “DrillCorp Geological database report 2013” DrillCorp Exploration ltd,
Ghana, Unpublished Report, pp 2-5 DrillCorp, (2013), “DrillCorp technical report no. 13_003” DrillCorp Exploration ltd, Ghana,
Technical Report, pp 15 English, J.M. (1984), “Project Evaluation - A Unified Approach for the Analysis of Capital
Investments”, Macmillan, New York, 401pp Guarnera, B.J., (1997), “Technical Flaws in bankable documents”, paper presented to Assaying
and Reporting Standards Conference, Singapore Hadlow, H.R., Khosrowshahi, S. and Vearncombe, J.R. (1993), “The use of directional
variography and structural geology to determine the controls on gold mineralisation in the Kundana Mine”, Koolgardie Goldfield, Perth, Australia. pp 31-38
Hammond, N.Q., & Tabata, H. (1997), “Characteristics of ore minerals associated with gold at
the Prestea mine, Ghana”. Mineralogical Magazine 61, pp 879–894
University of Ghana http://ugspace.ug.edu.gh

- 50 -
Kesse, G.O., (1985), “The Mineral and Rock Resources of Ghana”, A.A. Balkema, Rotterdam/Boston, 610 pp.
Krige, (1996), “A practical analysis of the effects of spatial structure and data available and used,
on conditional biases in ordinary kriging”, 5th International Geostatistics Congress, Wollongong, Australia
Hirdes, A. and Leube, A. (1989), “On Gold Mineralization of the Proterozoic Birimian supergroup
in Ghana/ West Africa”. Ghana German Mineral Prospecting Project, Technical Cooperation Project No 80, pp 176
Leube, A., Hirdes, W., Mauer, R. and Kesse, G.O. (1990), “The Early Proterozoic Birimian supergroup of Ghana and Some Aspects of its Associated Gold Mineralization”, Precambrian Research, vol 46, pp 139-165.
Manu, J. (2014), “Mine feasibility studies”. Unpublished Lecture notes, 2014. Earth
Science Dept., University of Ghana, Legon, Ghana. pp 7-15 Pigois, J.P., Groves, D.I., Flecher, I.R., McNaughton, N.J., Snee, L.W. (2003), “Age constraints
on Tarkwaian paleoplacer and lode-gold formation in the Tarkwa-Damang district, SW Ghana”, Mineralium Deposita volume 38, issue 6, pp 695-714
Rocklabs Limited (2013), “Certified Reference Materials brochure” Materials handbook.
Unpublished, 20pp. Schwabb, A.P., Banks, M.K., Tedford, E.T. and Perkins, R.E. (1994), “Gold mining due
diligence” Mining Magazine, Gale Group, Farmington Hills, Michigan Snowden, V. (2001), “Practical Interpretation of Mineral Resource and Ore Reserve Classification
Guidelines” The AUSIMM Guide to Good Practice (Monography 23), pp10 Stermole, F. J. (1993), “Economic evaluation and investment decision methods”, Investment
Evaluations Corporation, pp 497 Stuart, H. (2007), “Technical Report on the Chirano Gold Deposits” Chirano Gold mines ltd, Ghana. Unpublished, pp 31-33 Tatman, C.R. (2001), “ Production rate selection for steeply dipping tabular deposits”, Mining Engineering Journal, pp 62-64 Vann, J. (2007), “Applied Geostatistics for Geologists and Mining Engineers” Quantitative
Group Publishers,Western Australia, pp182-200
University of Ghana http://ugspace.ug.edu.gh

- 51 -
APPENDICES
University of Ghana http://ugspace.ug.edu.gh

- 52 -
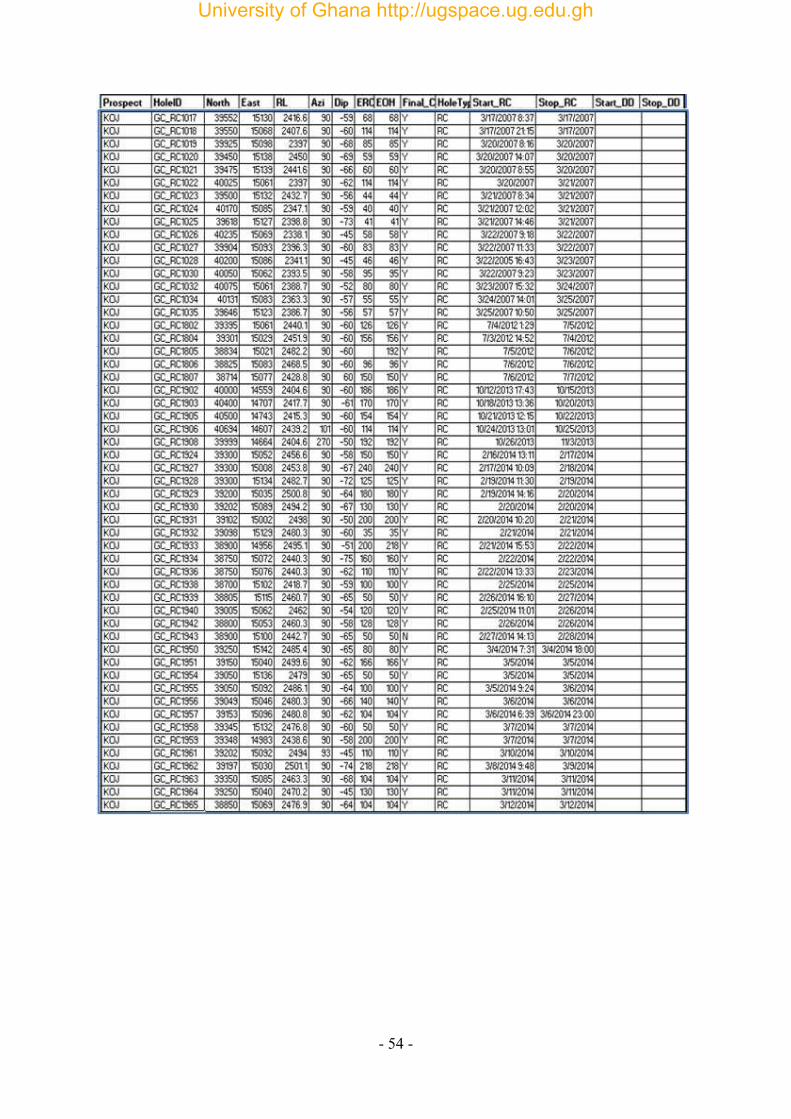
Appendix A – Database Tables Summary
University of Ghana http://ugspace.ug.edu.gh

- 53 -
Appendix B – Drillhole listing used for Resource Estimation
University of Ghana http://ugspace.ug.edu.gh
- 54 -
University of Ghana http://ugspace.ug.edu.gh

- 55 -
University of Ghana http://ugspace.ug.edu.gh

- 56 -
Appendix C – Visual Validation of Model
Visual validation - 88125 Section (looking north)
University of Ghana http://ugspace.ug.edu.gh

- 57 -
Visual validation - 88925 Section (looking north)
University of Ghana http://ugspace.ug.edu.gh

- 58 -
Visual validation - 88275 Section (looking north)
University of Ghana http://ugspace.ug.edu.gh

- 59 -
Appendix D – Summary of QAQC samples Performance
University of Ghana http://ugspace.ug.edu.gh
- 60 -
Appendix E – Charts of QAQC samples Performance
University of Ghana http://ugspace.ug.edu.gh
- 61 -
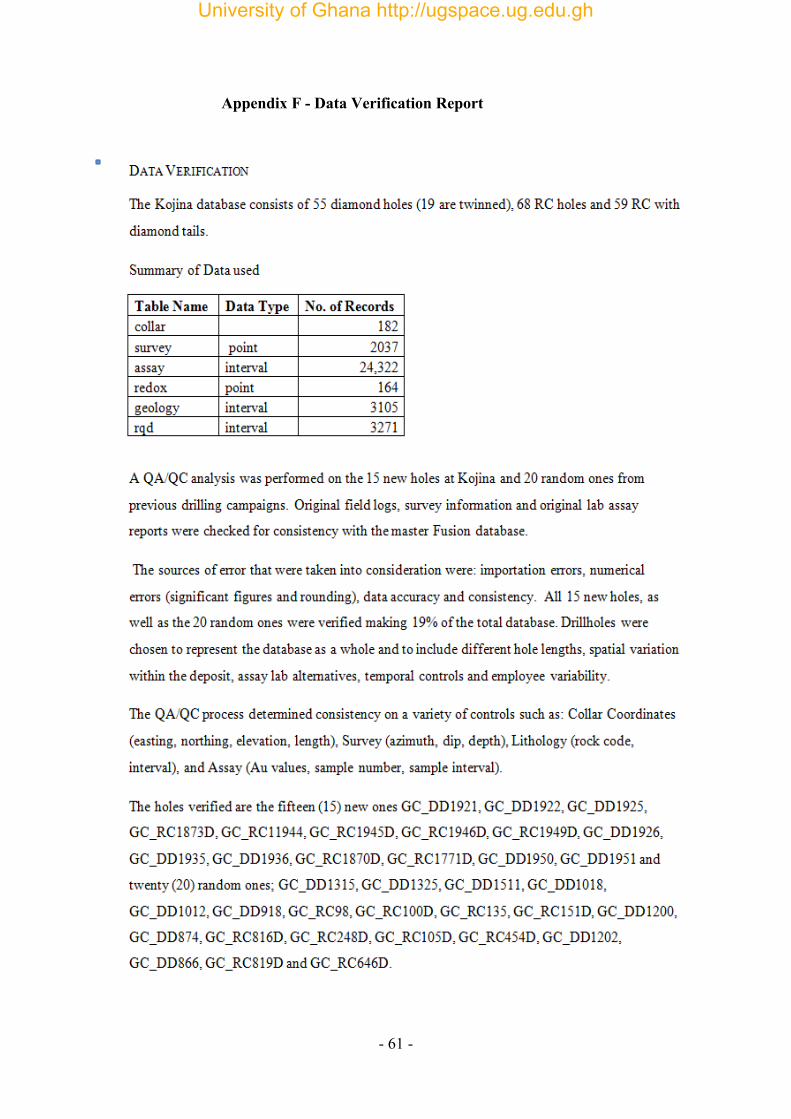
Appendix F - Data Verification Report
University of Ghana http://ugspace.ug.edu.gh

- 62 -
University of Ghana http://ugspace.ug.edu.gh

- 63 -
University of Ghana http://ugspace.ug.edu.gh

- 64 -
Appendix G – Capital Costs Summary
University of Ghana http://ugspace.ug.edu.gh

- 65 -
Appendix H – Operating Costs Summary
University of Ghana http://ugspace.ug.edu.gh

- 66 -
Appendix I : Kojina Financial Analysis – Cash Flow
University of Ghana http://ugspace.ug.edu.gh

- 67 -
University of Ghana http://ugspace.ug.edu.gh

- 68 -
University of Ghana http://ugspace.ug.edu.gh