ESPR-Bioprospecting, 2014
14
1 23 Environmental Science and Pollution Research ISSN 0944-1344 Volume 21 Number 11 Environ Sci Pollut Res (2014) 21:6824-6835 DOI 10.1007/s11356-013-1907-3 Bioprospecting at former mining sites across Europe: microbial and functional diversity in soils Anna Rosa Sprocati, Chiara Alisi, Flavia Tasso, Alessia Fiore, Paola Marconi, Francesca Langella, Götz Haferburg, Andrei Nicoara, et al.
-
Upload
independent -
Category
Documents
-
view
0 -
download
0
Transcript of ESPR-Bioprospecting, 2014
1 23
Environmental Science and PollutionResearch ISSN 0944-1344Volume 21Number 11 Environ Sci Pollut Res (2014)21:6824-6835DOI 10.1007/s11356-013-1907-3
Bioprospecting at former mining sitesacross Europe: microbial and functionaldiversity in soils
Anna Rosa Sprocati, Chiara Alisi, FlaviaTasso, Alessia Fiore, Paola Marconi,Francesca Langella, Götz Haferburg,Andrei Nicoara, et al.
1 23
Your article is protected by copyright and
all rights are held exclusively by Springer-
Verlag Berlin Heidelberg. This e-offprint is
for personal use only and shall not be self-
archived in electronic repositories. If you wish
to self-archive your article, please use the
accepted manuscript version for posting on
your own website. You may further deposit
the accepted manuscript version in any
repository, provided it is only made publicly
available 12 months after official publication
or later and provided acknowledgement is
given to the original source of publication
and a link is inserted to the published article
on Springer's website. The link must be
accompanied by the following text: "The final
publication is available at link.springer.com”.
USING MICROBES FOR THE REGULATION OF HEAVY METAL MOBILITYAT ECOSYSTEM AND LANDSCAPE SCALE
Bioprospecting at former mining sites across Europe:microbial and functional diversity in soils
Anna Rosa Sprocati & Chiara Alisi & Flavia Tasso & Alessia Fiore &
Paola Marconi & Francesca Langella & Götz Haferburg &
Andrei Nicoara & Aurora Neagoe & Erika Kothe
Received: 3 April 2013 /Accepted: 3 June 2013 /Published online: 18 June 2013# Springer-Verlag Berlin Heidelberg 2013
Abstract The planetary importance of microbial function re-quires urgently that our knowledge and our exploitation abilityis extended, therefore every occasion of bioprospecting iswelcome. In this work, bioprospecting is presented from theperspective of the UMBRELLA project, whose main goal wasto develop an integral approach for remediation of soilinfluenced by mining activity, by using microorganisms inassociation with plants. Accordingly, this work relies on thecultivable fraction of microbial biodiversity, native to six min-ing sites across Europe, different for geographical, climatic andgeochemical characteristics but similar for suffering fromchronic stress. The comparative analysis of the soil functionaldiversity, resulting from the metabolic profiling at communitylevel (BIOLOG ECOPlates) and confirmed by the multivariateanalysis, separates the six soils in two clusters, identifying soilscharacterised by low functional diversity and low metabolicactivity. The microbial biodiversity falls into four major bac-terial phyla: Actinobacteria, Proteobacteria, Firmicutes andBacteroidetes, including a total of 47 genera and 99 species.
In each soil, despite harsh conditions, metabolic capacity ofnitrogen fixation and plant growth promotion were quite wide-spread, and most of the strains showed multiple resistances toheavy metals. At species-level, Shannon’s index (alpha diver-sity) and Sørensen's Similarity (beta diversity) indicates thesites are indeed diverse. Multivariate analysis of soil chemicalfactors and biodiversity identifies for each soil well-discriminating chemical factors and species, supporting theassumption that cultured biodiversity from the six mining sitespresents, at phylum level, a convergence correlated to soilfactors rather than to geographical factors while, at specieslevel, reflects a remarkable local characterisation.
Keywords Cultivablemicrobialbiodiversity .Heavy–metal-contaminated soil . PGP-bacteria . 16S rRNA sequence
Introduction
Bioprospecting is generally described as the search for natu-rally occurring biological material, especially in extreme orbiodiversity-rich environments. A comprehensive picture of abioprospecting activity would involve a range of observation-al lenses. In this work, bioprospecting is presented from theperspective of the UMBRELLA project, whose main goal wasto develop an integral approach for remediation of soil affect-ed by mining activities through geo-biological processes,more precisely through phytoremediation assisted by plantgrowth-promoting bacteria (PGPB). To this end, abioprospection has been carried out at six mining sites acrossEurope, located in different geographical areas and underdifferent climatic conditions, in search of native plants andmicroorganisms to be employed in field trials for microbiallyaided phytoremediation. For these reasons, all isolates havebeen characterised for resistance to heavy metals and capacityto fix nitrogen, mobilise phosphates, produce siderophores
Responsible editor: Robert Duran
Electronic supplementary material The online version of this article(doi:10.1007/s11356-013-1907-3) contains supplementary material,which is available to authorized users.
A. R. Sprocati : C. Alisi (*) : F. Tasso :A. Fiore : P. MarconiItalian National Agency for New technologies,Energy and Sustainable Economic Development,via Anguillarese, 301-00123 Rome, Italye-mail: [email protected]
F. Langella :G. Haferburg : E. KotheFriedrich Schiller University of Jena, Neugasse 25,07743 Jena, Germany
A. Nicoara :A. NeagoeCenter for Ecological Services Faculty of Biology,University of Bucharest, 36-46 Mihail Kogalniceanu Blvd,050107 Bucharest, Romania
Environ Sci Pollut Res (2014) 21:6824–6835DOI 10.1007/s11356-013-1907-3
Author's personal copy

and phytohormones (PGP features). The final goal of themicrobial survey was to establish six bacterial consortia, onefor each test site, obtained by pooling the best PGP-bacteriaisolated from the native soil. Due to the very partial descrip-tion of the existing biodiversity measurable from culture-dependent techniques, it is worth conducting a more compre-hensive analysis through metagenomic techniques (in prog-ress). Although the analysis of environmental genomes canprovide a great deal of information, the importance of provid-ing cultivable isolates is, however, well acknowledged forphysiological, ecological and evolutionary studies (Zinderand Salyers 2001) and for the far-reaching benefits in theapplication field (Forney et al. 2004). Much of the basicknowledge of soil bacteria, as well as the discovery of manyimportant antibiotics, came from investigations of pure cul-tures (Janssen 2006). In the end, sequencing is one importantstep towards understanding the microbial environment, butthere is the need for new technologies that focus on the directanalysis and measurement of microbial cells within a commu-nity or in cultivation conditions that are as close as possible tothe native environment (Forney et al. 2004).
In addition, we can make a special consideration about therelevance of cultivable biodiversity of the sites under inves-tigation. The biodiversity originated in historically pollutedenvironments represents in fact a unique experience in theevolutionary history, since peculiar biotopes have evolvedadapting in a short time, when compared with evolutionarytime, to elements and compounds that did not co-evolve withthe microbial communities (xenobiotics) or which, however,were present at concentrations and fluxes immeasurablylower than those occurring as a result of intensive miningactivities (heavy metals).
In these biotopes, microorganisms implemented adaptivestrategies as an answer to harsh life conditions (chronicstress), which make them strong candidates for potentialbiotechnological exploitation and may represent potentialsolutions for damaged areas. For this reason, such biodiver-sity deserves to be preserved. As it is clearly declared in thetexts of international convention on Biological Diversity,the ex situ collections of microorganisms deriving frompolluted sites, as well as deep sea vents, high alkalineenvironments, hot and cold deserts, form an essentialresource for the future, as the uncertainties and complex-ities of unicellular micro-organisms (very fast replicationand fast adaptation), make it difficult to perform an “insitu conservation”.
To have access to these microorganisms allows forharnessing the intrinsic bioremediation potential of suchpolluted soils for translating it into enhanced bioremedia-tion techniques. This represents a challenge research iscurrently addressing in order to find solutions for restor-ing soil while preserving its quality and thus its function(Sprocati et al. 2012).
This work examines the six mine soils under investigationby comparing the functional diversity obtained through anal-ysis of community-level physiological profiling (CLPP) inBIOLOG ECOPlates™ and the bacterial diversity of strainsisolated through cultural techniques and identified through16S rRNA gene sequences. Cultivable biodiversity is analysedat phylum, class and genus levels through ecological indicesand multivariate analysis.
Materials and methods
Soil characterisation
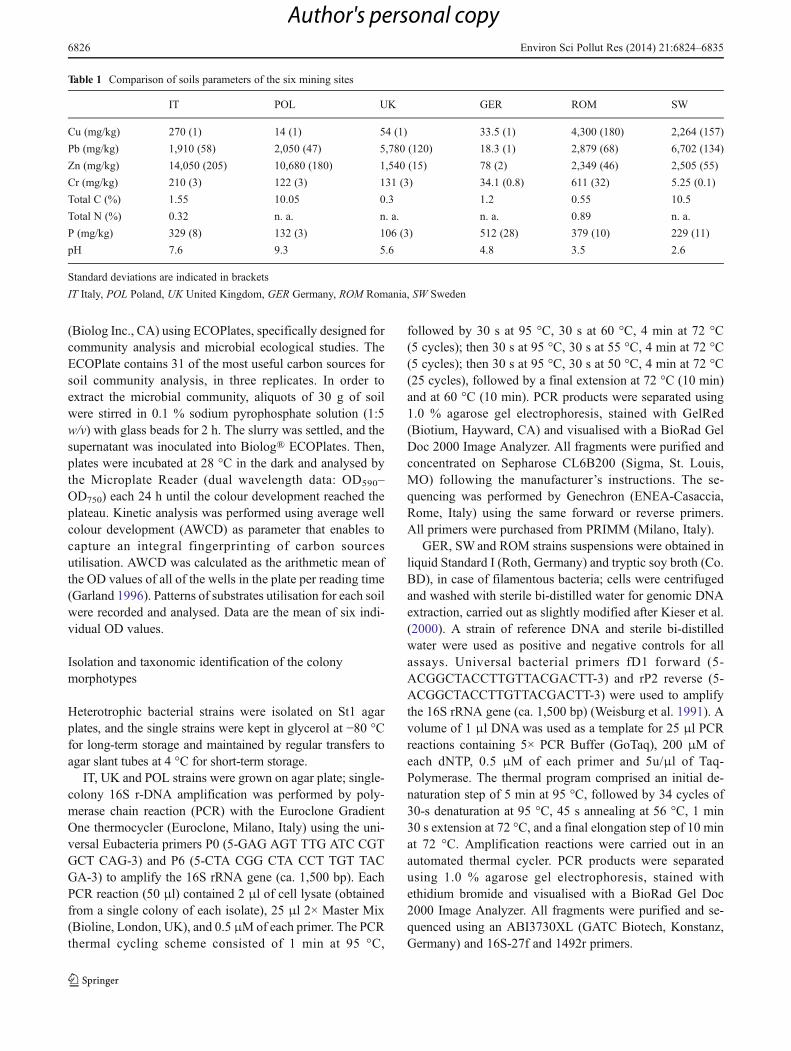
The soils used in the present study were collected in miningsites across Europe: Ingurtosu (Italy (IT)), Trezbionka(Poland (POL)), Ystwyth (UK), Bergslagen (Sweden(SW)), Zlatna/Rosia Montana (Romania (ROM)) andRonneburg (Germany (GER)). Ten soil samples from eachsite, collected from the surface layer (0–15 cm depth) of therhizosphere of endemic botanical species, were dried at roomtemperature. The ten samples were then mixed to create acomposite sample from each site, passed through a 2-mmsieve and immediately processed for microbiological analy-ses or stored at 4 °C. The physical and chemical properties ofthe soils are shown in Table 1.
Extraction of the microbial communities
The microbial communities were extracted from aliquots of30 g of fresh soil mixture, sieved at 2 mm, in a 0.1 % sodiumpyrophosphate solution (1:5 w/v); each slurry was stirred withglass beads for 2 h in orbiting shaker (180 rpm) at 28 °C. Thetotal heterotrophic microbial communities were enumeratedusing serial dilutions (up to 10−5), plating and counting thecolony-forming units (CFUs) developed on different solidmedia: non-selective standard nutrient medium n°1 (St1, con-taining peptone 15 g/l, yeast extract 3 g/l, NaCl 6 g/l, glucose1 g/l, agar 15 g/l, pH adjusted to 7.5±0.2), mineral medium(Schmidt and Schlegel 1989), starch-casein agar (starch 10 g/l,casein, 1 g/l, K2HPO4, 0.5 g/l, agar, 15 g/l, pH 7) and potatodextrose agar (PDA Liofilchem, Teramo, Italy). The plateswere incubated for several weeks until the microbial growthwas observed. Chemicals for media preparation were pur-chased at Liofilchem, Teramo, Italy; chemicals for analyticalessays were purchased at Carlo Erba, Milano, Italy, unlessotherwise specified.
Community-level physiological profilingthrough BIOLOG-ECOPlates
The metabolic profiles of the microbial communities weregenerated by means of the Biolog® Microstation System 4.2
Environ Sci Pollut Res (2014) 21:6824–6835 6825
Author's personal copy
(Biolog Inc., CA) using ECOPlates, specifically designed forcommunity analysis and microbial ecological studies. TheECOPlate contains 31 of the most useful carbon sources forsoil community analysis, in three replicates. In order toextract the microbial community, aliquots of 30 g of soilwere stirred in 0.1 % sodium pyrophosphate solution (1:5w/v) with glass beads for 2 h. The slurry was settled, and thesupernatant was inoculated into Biolog® ECOPlates. Then,plates were incubated at 28 °C in the dark and analysed bythe Microplate Reader (dual wavelength data: OD590–OD750) each 24 h until the colour development reached theplateau. Kinetic analysis was performed using average wellcolour development (AWCD) as parameter that enables tocapture an integral fingerprinting of carbon sourcesutilisation. AWCD was calculated as the arithmetic mean ofthe OD values of all of the wells in the plate per reading time(Garland 1996). Patterns of substrates utilisation for each soilwere recorded and analysed. Data are the mean of six indi-vidual OD values.
Isolation and taxonomic identification of the colonymorphotypes
Heterotrophic bacterial strains were isolated on St1 agarplates, and the single strains were kept in glycerol at −80 °Cfor long-term storage and maintained by regular transfers toagar slant tubes at 4 °C for short-term storage.
IT, UK and POL strains were grown on agar plate; single-colony 16S r-DNA amplification was performed by poly-merase chain reaction (PCR) with the Euroclone GradientOne thermocycler (Euroclone, Milano, Italy) using the uni-versal Eubacteria primers P0 (5-GAG AGT TTG ATC CGTGCT CAG-3) and P6 (5-CTA CGG CTA CCT TGT TACGA-3) to amplify the 16S rRNA gene (ca. 1,500 bp). EachPCR reaction (50 μl) contained 2 μl of cell lysate (obtainedfrom a single colony of each isolate), 25 μl 2× Master Mix(Bioline, London, UK), and 0.5 μMof each primer. The PCRthermal cycling scheme consisted of 1 min at 95 °C,
followed by 30 s at 95 °C, 30 s at 60 °C, 4 min at 72 °C(5 cycles); then 30 s at 95 °C, 30 s at 55 °C, 4 min at 72 °C(5 cycles); then 30 s at 95 °C, 30 s at 50 °C, 4 min at 72 °C(25 cycles), followed by a final extension at 72 °C (10 min)and at 60 °C (10 min). PCR products were separated using1.0 % agarose gel electrophoresis, stained with GelRed(Biotium, Hayward, CA) and visualised with a BioRad GelDoc 2000 Image Analyzer. All fragments were purified andconcentrated on Sepharose CL6B200 (Sigma, St. Louis,MO) following the manufacturer’s instructions. The se-quencing was performed by Genechron (ENEA-Casaccia,Rome, Italy) using the same forward or reverse primers.All primers were purchased from PRIMM (Milano, Italy).
GER, SWand ROM strains suspensions were obtained inliquid Standard I (Roth, Germany) and tryptic soy broth (Co.BD), in case of filamentous bacteria; cells were centrifugedand washed with sterile bi-distilled water for genomic DNAextraction, carried out as slightly modified after Kieser et al.(2000). A strain of reference DNA and sterile bi-distilledwater were used as positive and negative controls for allassays. Universal bacterial primers fD1 forward (5-ACGGCTACCTTGTTACGACTT-3) and rP2 reverse (5-ACGGCTACCTTGTTACGACTT-3) were used to amplifythe 16S rRNA gene (ca. 1,500 bp) (Weisburg et al. 1991). Avolume of 1 μl DNAwas used as a template for 25 μl PCRreactions containing 5× PCR Buffer (GoTaq), 200 μM ofeach dNTP, 0.5 μM of each primer and 5u/μl of Taq-Polymerase. The thermal program comprised an initial de-naturation step of 5 min at 95 °C, followed by 34 cycles of30-s denaturation at 95 °C, 45 s annealing at 56 °C, 1 min30 s extension at 72 °C, and a final elongation step of 10 minat 72 °C. Amplification reactions were carried out in anautomated thermal cycler. PCR products were separatedusing 1.0 % agarose gel electrophoresis, stained withethidium bromide and visualised with a BioRad Gel Doc2000 Image Analyzer. All fragments were purified and se-quenced using an ABI3730XL (GATC Biotech, Konstanz,Germany) and 16S-27f and 1492r primers.
Table 1 Comparison of soils parameters of the six mining sites
IT POL UK GER ROM SW
Cu (mg/kg) 270 (1) 14 (1) 54 (1) 33.5 (1) 4,300 (180) 2,264 (157)
Pb (mg/kg) 1,910 (58) 2,050 (47) 5,780 (120) 18.3 (1) 2,879 (68) 6,702 (134)
Zn (mg/kg) 14,050 (205) 10,680 (180) 1,540 (15) 78 (2) 2,349 (46) 2,505 (55)
Cr (mg/kg) 210 (3) 122 (3) 131 (3) 34.1 (0.8) 611 (32) 5.25 (0.1)
Total C (%) 1.55 10.05 0.3 1.2 0.55 10.5
Total N (%) 0.32 n. a. n. a. n. a. 0.89 n. a.
P (mg/kg) 329 (8) 132 (3) 106 (3) 512 (28) 379 (10) 229 (11)
pH 7.6 9.3 5.6 4.8 3.5 2.6
Standard deviations are indicated in brackets
IT Italy, POL Poland, UK United Kingdom, GER Germany, ROM Romania, SW Sweden
6826 Environ Sci Pollut Res (2014) 21:6824–6835
Author's personal copy
All sequence similarity searches were conducted using theBLAST network service (http://www.ncbi.nlm.nih.gov/BLAST/) and EzTaxon to identify the nearest relatives ofthe partially sequenced 16S rRNA genes. Sequences werescreened for chimeras by the Bellerophon program (Huberet al. 2004) of the Green Genes workbench (http://greengenes.lbl.gov/cgi-bin/nph-bel3 interface.cgi) and byBLAST alignment. Nucleotide sequences were sent to theGenBank genetic sequence database (Nucleic AcidsResearch, 2008; 36 (database issue): D25-30). The se-quences were deposited with the accession numbers: fromJX133179 to JX133227, from JX171074 to JX171076, fromKC618476 to KC618505 and KC625484.
The phylogenetic analysis was performed using MEGA5.1 (Tamura et al. 2011).The evolutionary history was in-ferred using the neighbour-joining method (Saitou and Nei1987). Bootstrap analysis was based on 1,000 replicates. Theoptimal tree with the sum of branch length=3.88753318 isshown. The tree is drawn to scale, with branch lengths in thesame units as those of the evolutionary distances used toinfer the phylogenetic tree. The evolutionary distances werecomputed using the p-distance method (Nei and Kumar2000) and are in the units of the number of base differencesper site. The analysis involved 213 nucleotide sequences,including the reference strains.
Selection of strains tolerant to heavy metals
Two different approaches were applied to test the metalresistance: two qualitative tests (agar diffusion assay, growthon soil extract) and one quantitative test (determination ofthe minimal inhibitory concentration (MIC)) that defines thelowest concentration that causes the total growth inhibition.
Agar diffusion assay Square plates (12 cm) were filled withsterilised agar medium (asparagine 0.5 g/l, K2HPO4 0.5 g/l,MgSO4 0.2 g/l, glucose 10 g/l, agar 15 g/l). The solidmedium was cut to create a trench that was filled with 3 mlof metal solution, each heavy metal tested separately: Ni40 mM, Cu 10 mM, Zn 100 mM, Cr 10 mM, Cd 10 mMand Pb 10 mM, all provided as sulfates. The bacterial strainswere streaked vertically from the trench until the edge of theplate. As control, strains were streaked on the same minimalmedium heavy–metal-free plates. The plates were incubatedfor at least 7 days at 28 °C. Heavy metal resistance wasestimated in terms of growth distance from the trench.
Test for growth on “soil extract” The water extract of thenative soils, simulating the bioavailability of the metalsunder field conditions, was used for testing heavy metalresistance of isolated strains. Fifty grams of soil was mixedwith 450 ml of distilled water and stirred for 24 h at 25 °C.Afterwards, the suspension was centrifuged 15 min at
800 rpm. The supernatant was filtered with paper filter andused to prepare the minimal medium soil extract agar(MMSE, Amoroso et al. 2000), with the composition de-scribed above. The strains were streaked on the surface of theMMSE plates, and the plates were incubated at 28 °C for atleast 7 days. As control, the strains were streaked on minimalmedium (metal-free) plates.
Determination of the minimal inhibitory concentration(MIC) In order to determine the MIC of each isolated strain,minimal medium agar (Amoroso et al. 2000) was amendedwith heavy metals (all provided as sulfates) at increasingconcentrations, in the following range: Ni 2.5–30 mM, Cu1–5 mM, Zn 10–20 mM, Cr 2.5–5 mM, Cd 2.5–10 mM andPb 5–10 mM. Control strains were streaked on minimalmedium (metal-free) plates. Plates were incubated at 28 °Cfor at least 7 days.
Selection of plant growth-promoting bacteria
Bacterial strains isolated from the six soils were screened formetabolic PGP features: nitrogen-fixing activity, auxin- andsiderophore-production and phosphates mobilisationaccording to the UMBRELLA protocols, as follows.
Nitrogen fixation The capacity of the isolated strains to fixnitrogen was evaluated by their growth in a nitrogen-freemedium (Azotobacter medium: CaCl2·2H2O 0.10 g/l,MgSO4·7H2O 0.10 g/l, Na2MoO4·2H2O 5 mg/l, K2HPO4
0.90 g/l, KH2PO4 0.10 g/l, FeSO4·7H2O 0.01 g/l, CaCO3
5 g/l, agar 15 g/l, pH 7.3) supplemented with glucose(10 g/l) and mannitol (5 g/l). Strains were incubated at28 °C for 7–14 days.
Phosphate solubilisation Phosphate-mobilising bacteriawere detected using Pikovskaia’s medium containingtricalcium phosphate (Pikovskaya 1948), as modified afterGupta et al. 1994, with and without addition of bromophenolblue, incubated at 28 °C for 7–10 days. The production oforganic acid-solubilising inorganic phosphates was evaluat-ed by formation of a halo around the bacterial colonies.
Siderophore production Siderophores were qualitativelyassayed in solid medium using the modified chrome-azurolS (CAS) agar plate method as described by Milagres et al.(1999). CAS agar plates were spot-inoculated with test or-ganism, incubated at 28 °C for 7 days and evaluated forcolour change of the CAS indicator into a yellow–orangehalo surrounding the colony.
Auxin production The capacity of the isolated strains toproduce auxin was evaluated by Salkowski assay (Pattenand Glick 2002). Strains were grown overnight in 5 ml of
Environ Sci Pollut Res (2014) 21:6824–6835 6827
Author's personal copy

DF salts minimal medium (Dworkin and Foster 1958).Production of auxin was determined by mixing 1 ml ofsupernatant with 4 ml of Salkowski’s reagent (150 ml ofconcentrated H2SO4, 250 ml of distilled H2O, 7.5 ml of0.5 M FeCl3·6H2O) (Gordon and Weber 1951). The mixturewas incubated in the dark at 30 °C for 15 min. Auxincompounds expressed as IAA equivalents (micrograms permillilitre culture medium) were directly related to the absor-bance measured at 530 nm. Indole-3-acetic acid (Sigma, St.Louis, MO) was used as standard.
Data analyses
Ecological indices According to the classification ofWhittaker (1972), ecological indices were calculated to de-scribe alpha, beta and gamma diversity on the basis of thespecies identified in the six soil samples. The alpha diversityis based on the Shannon indexH’=−Σ(Pi ln(Pi) and explainsthe diversity in species within a site. The beta diversity refersto the differences in species composition between the com-munities of the different test sites and was calculated bymeans of Sørensen's Similarity Index (β) with the formulaβ=2C/(S1+S2), where S1 is the total number of speciesrecorded in the first community, S2 is the total number ofspecies recorded in the second community and C is thenumber of species common to both communities. The gam-ma diversity refers to the total species richness at geograph-ical scale (spatial distribution of the test sites across Europe).
Statistical analysis Data sets of soil chemical characteristics,microbial metabolism and biodiversity were separatelyanalysed by principal component analysis (PCA). Data werevisualised in the form of the principal component score plotsand loading plots. On the same data sets, partial least-square(PLS) regression was performed to correlate pairs of datablocks: soil versus biodiversity; soil versus microbial metab-olism; biodiversity versus microbial metabolism. In-houseroutines, provided by the group of Federico Marini (Dept. ofChemistry, University of Rome “La Sapienza”) written inMatlab© (the MathWorks, Natick, MA; version R2010a)and PLS-toolbox (Eigenvector Research Inc., version6.5.2) were used for preprocessing, calculation and graphicalrepresentation of the data.
Results
Chemical and microbiological characteristics of soils
Soils from the test sites under investigation showed a widedifference for bio-geochemical characteristics (Tables 1 and2). The pH values range from 2.6 to 9.3: Two sites showedneutral and basic pH (IT and POL) and four sites showed
acidic pH, very low in ROM and SW soils. Total P contentrange from 132 to 512 mg/kg; total C content was 0.3 to1.55 mg/kg in most sites, except for POL and SWwith valueshigher than 10 mg/kg. According to the geologic characteris-tics of sites, IT, UK and POL sites that were former blend andgalena mines revealed a very high content of Zn and Pb; inparticular, the Pb content was very high in UK soil; SW sitewas a copper mine and, together with a high content of Cu,showed the highest Pb content; GER soil came from a formeruranium mine and showed a low heavy metals content andROM soil came from a tailing hip of Cu-Zn-Pb mine with ahigh content of these metals and the highest content of Cr.
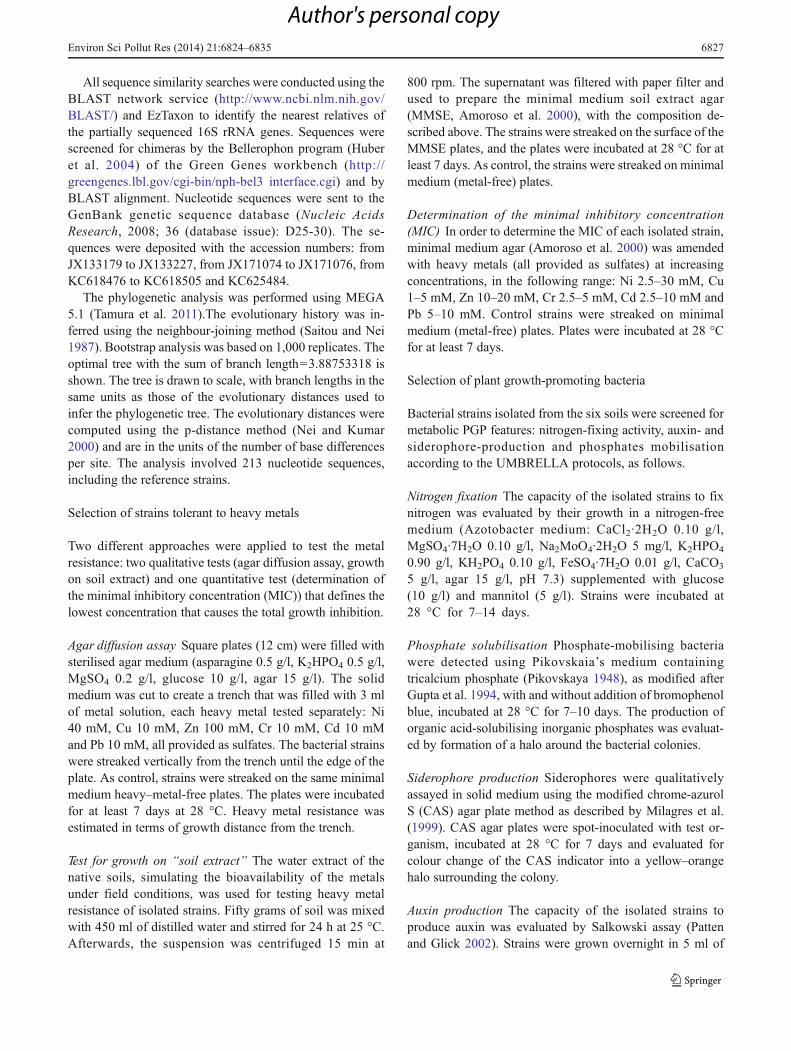
The microbial load of soil rhizosphere was very similarfor the different sites, ranging from 106 and 107 CFU ml(Table 2); a total of 177 colony morphotypes ranging from18 (GER) to 42 (UK) were isolated on agar media. Thescreening for PGP features of the isolates showed a highpercentage of nitrogen fixers and metal-resistant strains in allthe soils; siderophores producers were numerous in all thecommunities, especially in the GER and ROM communities;phytohormone producers were less frequent among the com-munities, except in the ROM soil, where more than 50 % ofthe strains were able to produce IAA. The function of phos-phate mobilisation was also quite well represented in all thecommunities, ranging from 36 % (SW) to 64 % (POL).
Community-level physiological profile (CLPP)
The comparison of the metabolic profile at community level(Table 3) highlighted some differences among the six micro-bial communities: IT showed the lowest metabolic diversity interms of substrates utilisation capacity (13 out of 31) whileUK, SWand POL communities were able to use almost all thesubstrates, showing a higher functional diversity. In particular,IT microbial community was able to metabolise all the poly-meric substrates and some carbohydrates, and presents thepeculiarity, compared with the others, not to be able tometabolise most of the carboxylic acids and all the amino acidsand amines. POL microbial community did metabolise all thesubstrates included in the ECOPlate. The substrates common-ly oxidised by all the communities were L-cellobiose, D-man-nitol, N-acetyl-D-glucosamine among the carbohydrates, and4-hydroxybenzoic acid among the carboxylic acids; all thecommunities, except IT, were able to oxidise the amino acids.The amino acids L-arginine, L-phenylalanine, L-serine, L-thre-onine, together with D-xylose, 2-hydroxybenzoic acid, 4-hydroxybenzoic acid, hydroxybutyric acid and D-malic acidare among the nine root exudates contained in the ECOPlates.IT community used only two of these root exudates, while thecommunities of the other soils used almost all these com-pounds. These data could be in agreement with the lack ofvegetation in the site of Ingurtosu, where only few pioneerbotanical species were identified.
6828 Environ Sci Pollut Res (2014) 21:6824–6835
Author's personal copy
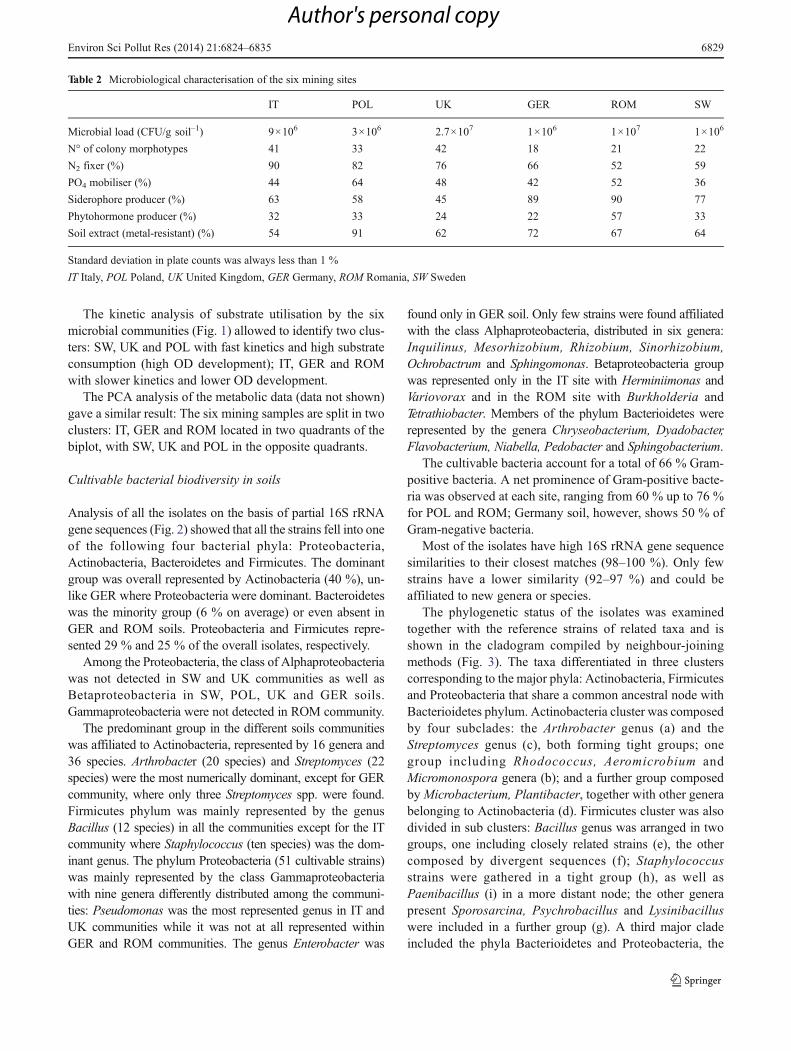
The kinetic analysis of substrate utilisation by the sixmicrobial communities (Fig. 1) allowed to identify two clus-ters: SW, UK and POL with fast kinetics and high substrateconsumption (high OD development); IT, GER and ROMwith slower kinetics and lower OD development.
The PCA analysis of the metabolic data (data not shown)gave a similar result: The six mining samples are split in twoclusters: IT, GER and ROM located in two quadrants of thebiplot, with SW, UK and POL in the opposite quadrants.
Cultivable bacterial biodiversity in soils
Analysis of all the isolates on the basis of partial 16S rRNAgene sequences (Fig. 2) showed that all the strains fell into oneof the following four bacterial phyla: Proteobacteria,Actinobacteria, Bacteroidetes and Firmicutes. The dominantgroup was overall represented by Actinobacteria (40 %), un-like GER where Proteobacteria were dominant. Bacteroideteswas the minority group (6 % on average) or even absent inGER and ROM soils. Proteobacteria and Firmicutes repre-sented 29 % and 25 % of the overall isolates, respectively.
Among the Proteobacteria, the class of Alphaproteobacteriawas not detected in SW and UK communities as well asBetaproteobacteria in SW, POL, UK and GER soils.Gammaproteobacteria were not detected in ROM community.
The predominant group in the different soils communitieswas affiliated to Actinobacteria, represented by 16 genera and36 species. Arthrobacter (20 species) and Streptomyces (22species) were the most numerically dominant, except for GERcommunity, where only three Streptomyces spp. were found.Firmicutes phylum was mainly represented by the genusBacillus (12 species) in all the communities except for the ITcommunity where Staphylococcus (ten species) was the dom-inant genus. The phylum Proteobacteria (51 cultivable strains)was mainly represented by the class Gammaproteobacteriawith nine genera differently distributed among the communi-ties: Pseudomonas was the most represented genus in IT andUK communities while it was not at all represented withinGER and ROM communities. The genus Enterobacter was
found only in GER soil. Only few strains were found affiliatedwith the class Alphaproteobacteria, distributed in six genera:Inquilinus, Mesorhizobium, Rhizobium, Sinorhizobium,Ochrobactrum and Sphingomonas. Betaproteobacteria groupwas represented only in the IT site with Herminiimonas andVariovorax and in the ROM site with Burkholderia andTetrathiobacter. Members of the phylum Bacterioidetes wererepresented by the genera Chryseobacterium, Dyadobacter,Flavobacterium, Niabella, Pedobacter and Sphingobacterium.
The cultivable bacteria account for a total of 66 % Gram-positive bacteria. A net prominence of Gram-positive bacte-ria was observed at each site, ranging from 60 % up to 76 %for POL and ROM; Germany soil, however, shows 50 % ofGram-negative bacteria.
Most of the isolates have high 16S rRNA gene sequencesimilarities to their closest matches (98–100 %). Only fewstrains have a lower similarity (92–97 %) and could beaffiliated to new genera or species.
The phylogenetic status of the isolates was examinedtogether with the reference strains of related taxa and isshown in the cladogram compiled by neighbour-joiningmethods (Fig. 3). The taxa differentiated in three clusterscorresponding to the major phyla: Actinobacteria, Firmicutesand Proteobacteria that share a common ancestral node withBacterioidetes phylum. Actinobacteria cluster was composedby four subclades: the Arthrobacter genus (a) and theStreptomyces genus (c), both forming tight groups; onegroup including Rhodococcus, Aeromicrobium andMicromonospora genera (b); and a further group composedbyMicrobacterium, Plantibacter, together with other generabelonging to Actinobacteria (d). Firmicutes cluster was alsodivided in sub clusters: Bacillus genus was arranged in twogroups, one including closely related strains (e), the othercomposed by divergent sequences (f); Staphylococcusstrains were gathered in a tight group (h), as well asPaenibacillus (i) in a more distant node; the other generapresent Sporosarcina, Psychrobacillus and Lysinibacilluswere included in a further group (g). A third major cladeincluded the phyla Bacterioidetes and Proteobacteria, the
Table 2 Microbiological characterisation of the six mining sites
IT POL UK GER ROM SW
Microbial load (CFU/g soil–1) 9×10⁶ 3×10⁶ 2.7×10⁷ 1×10⁶ 1×10⁷ 1×10⁶
N° of colony morphotypes 41 33 42 18 21 22
N2 fixer (%) 90 82 76 66 52 59
PO4 mobiliser (%) 44 64 48 42 52 36
Siderophore producer (%) 63 58 45 89 90 77
Phytohormone producer (%) 32 33 24 22 57 33
Soil extract (metal-resistant) (%) 54 91 62 72 67 64
Standard deviation in plate counts was always less than 1 %
IT Italy, POL Poland, UK United Kingdom, GER Germany, ROM Romania, SW Sweden
Environ Sci Pollut Res (2014) 21:6824–6835 6829
Author's personal copy
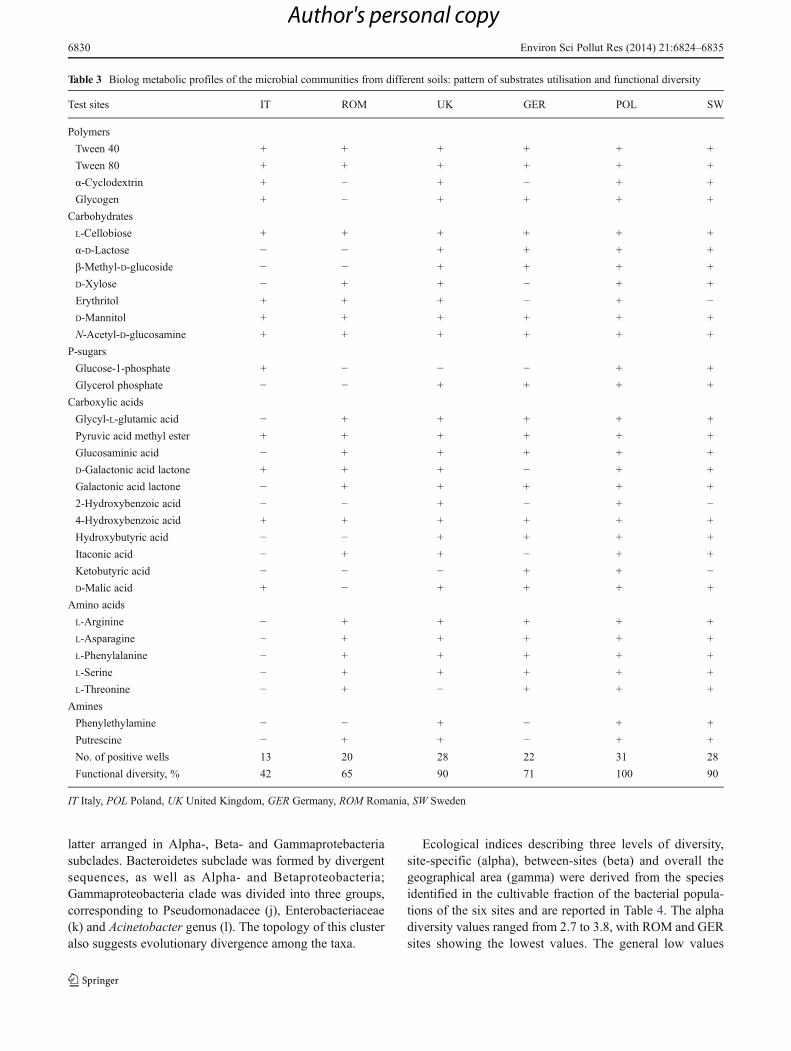
latter arranged in Alpha-, Beta- and Gammaprotebacteriasubclades. Bacteroidetes subclade was formed by divergentsequences, as well as Alpha- and Betaproteobacteria;Gammaproteobacteria clade was divided into three groups,corresponding to Pseudomonadacee (j), Enterobacteriaceae(k) and Acinetobacter genus (l). The topology of this clusteralso suggests evolutionary divergence among the taxa.
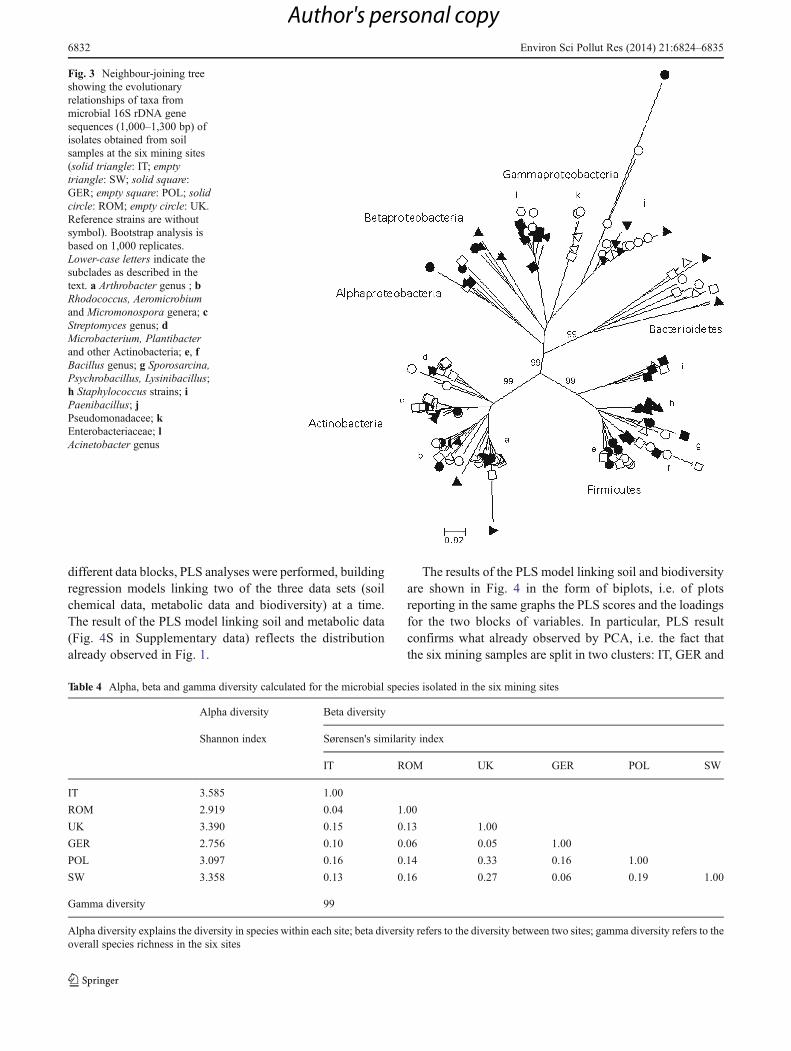
Ecological indices describing three levels of diversity,site-specific (alpha), between-sites (beta) and overall thegeographical area (gamma) were derived from the speciesidentified in the cultivable fraction of the bacterial popula-tions of the six sites and are reported in Table 4. The alphadiversity values ranged from 2.7 to 3.8, with ROM and GERsites showing the lowest values. The general low values
Table 3 Biolog metabolic profiles of the microbial communities from different soils: pattern of substrates utilisation and functional diversity
Test sites IT ROM UK GER POL SW
Polymers
Tween 40 + + + + + +
Tween 80 + + + + + +
α-Cyclodextrin + − + − + +
Glycogen + − + + + +
Carbohydrates
L-Cellobiose + + + + + +
α-D-Lactose − − + + + +
β-Methyl-D-glucoside − − + + + +
D-Xylose − + + − + +
Erythritol + + + − + −
D-Mannitol + + + + + +
N-Acetyl-D-glucosamine + + + + + +
P-sugars
Glucose-1-phosphate + − − − + +
Glycerol phosphate − − + + + +
Carboxylic acids
Glycyl-L-glutamic acid − + + + + +
Pyruvic acid methyl ester + + + + + +
Glucosaminic acid − + + + + +
D-Galactonic acid lactone + + + − + +
Galactonic acid lactone − + + + + +
2-Hydroxybenzoic acid − − + − + −
4-Hydroxybenzoic acid + + + + + +
Hydroxybutyric acid − − + + + +
Itaconic acid − + + − + +
Ketobutyric acid − − − + + −
D-Malic acid + − + + + +
Amino acids
L-Arginine − + + + + +
L-Asparagine − + + + + +
L-Phenylalanine − + + + + +
L-Serine − + + + + +
L-Threonine − + − + + +
Amines
Phenylethylamine − − + − + +
Putrescine − + + − + +
No. of positive wells 13 20 28 22 31 28
Functional diversity, % 42 65 90 71 100 90
IT Italy, POL Poland, UK United Kingdom, GER Germany, ROM Romania, SW Sweden
6830 Environ Sci Pollut Res (2014) 21:6824–6835
Author's personal copy

resulting for beta diversity indicated a substantial diversitybetween the sites under investigation, at level of species. Thesix soils, in fact, host many unique species; the most diversesites appear to be GER compared with UK, ROM and SWand IT compared with ROM.
Multivariate Analysis
PCA and PLS were performed to visualise the correlationbetween the groups of data that could explain the differences
between the soils of the test sites soil. In particular, PCAprovided an exploratory data analysis of the individual ma-trices corresponding to the three different data blocks: soilchemical parameters (soil), microbial metabolism in soil(metabolism) and biodiversity. For all the three matrices, aclear separation was observed between the soil samples fromIT, GER, ROM and SW, UK, POL. Inspection of the load-ings (data not shown) provided a first hint about the variablesthat were mostly responsible of the observed separation. Tofurther investigate the correlation among the variables in the
Fig. 1 Kinetic analysis of themetabolic profile at communitylevel. Solid triangle: IT; emptytriangle: SW; solid square:GER; empty square: POL; solidcircle: ROM; empty circle: UK
Fig. 2 Comparison of thecultivable bacterialcommunities in the soil samplesat the six mining sites. Phyla areshown as percentage of the totalnumber of isolates in each site
Environ Sci Pollut Res (2014) 21:6824–6835 6831
Author's personal copy
different data blocks, PLS analyses were performed, buildingregression models linking two of the three data sets (soilchemical data, metabolic data and biodiversity) at a time.The result of the PLS model linking soil and metabolic data(Fig. 4S in Supplementary data) reflects the distributionalready observed in Fig. 1.
The results of the PLS model linking soil and biodiversityare shown in Fig. 4 in the form of biplots, i.e. of plotsreporting in the same graphs the PLS scores and the loadingsfor the two blocks of variables. In particular, PLS resultconfirms what already observed by PCA, i.e. the fact thatthe six mining samples are split in two clusters: IT, GER and
Fig. 3 Neighbour-joining treeshowing the evolutionaryrelationships of taxa frommicrobial 16S rDNA genesequences (1,000–1,300 bp) ofisolates obtained from soilsamples at the six mining sites(solid triangle: IT; emptytriangle: SW; solid square:GER; empty square: POL; solidcircle: ROM; empty circle: UK.Reference strains are withoutsymbol). Bootstrap analysis isbased on 1,000 replicates.Lower-case letters indicate thesubclades as described in thetext. a Arthrobacter genus ; bRhodococcus, Aeromicrobiumand Micromonospora genera; cStreptomyces genus; dMicrobacterium, Plantibacterand other Actinobacteria; e, fBacillus genus; g Sporosarcina,Psychrobacillus, Lysinibacillus;h Staphylococcus strains; iPaenibacillus; jPseudomonadacee; kEnterobacteriaceae; lAcinetobacter genus
Table 4 Alpha, beta and gamma diversity calculated for the microbial species isolated in the six mining sites
Alpha diversity Beta diversity
Shannon index Sørensen's similarity index
IT ROM UK GER POL SW
IT 3.585 1.00
ROM 2.919 0.04 1.00
UK 3.390 0.15 0.13 1.00
GER 2.756 0.10 0.06 0.05 1.00
POL 3.097 0.16 0.14 0.33 0.16 1.00
SW 3.358 0.13 0.16 0.27 0.06 0.19 1.00
Gamma diversity 99
Alpha diversity explains the diversity in species within each site; beta diversity refers to the diversity between two sites; gamma diversity refers to theoverall species richness in the six sites
6832 Environ Sci Pollut Res (2014) 21:6824–6835
Author's personal copy
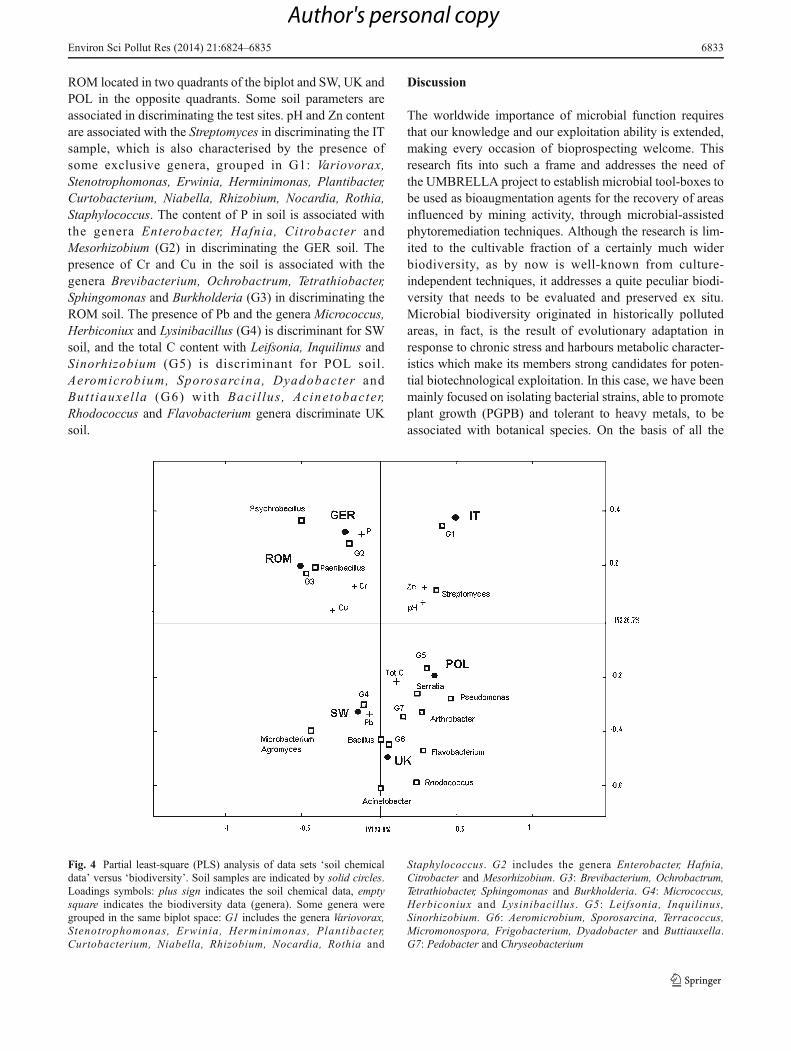
ROM located in two quadrants of the biplot and SW, UK andPOL in the opposite quadrants. Some soil parameters areassociated in discriminating the test sites. pH and Zn contentare associated with the Streptomyces in discriminating the ITsample, which is also characterised by the presence ofsome exclusive genera, grouped in G1: Variovorax,Stenotrophomonas, Erwinia, Herminimonas, Plantibacter,Curtobacterium, Niabella, Rhizobium, Nocardia, Rothia,Staphylococcus. The content of P in soil is associated withthe genera Enterobacter, Hafnia, Citrobacter andMesorhizobium (G2) in discriminating the GER soil. Thepresence of Cr and Cu in the soil is associated with thegenera Brevibacterium, Ochrobactrum, Tetrathiobacter,Sphingomonas and Burkholderia (G3) in discriminating theROM soil. The presence of Pb and the genera Micrococcus,Herbiconiux and Lysinibacillus (G4) is discriminant for SWsoil, and the total C content with Leifsonia, Inquilinus andSinorhizobium (G5) is discriminant for POL soil.Aeromicrobium, Sporosarcina, Dyadobacter andButt iauxel la (G6) with Baci l lus , Acinetobacter,Rhodococcus and Flavobacterium genera discriminate UKsoil.
Discussion
The worldwide importance of microbial function requiresthat our knowledge and our exploitation ability is extended,making every occasion of bioprospecting welcome. Thisresearch fits into such a frame and addresses the need ofthe UMBRELLA project to establish microbial tool-boxes tobe used as bioaugmentation agents for the recovery of areasinfluenced by mining activity, through microbial-assistedphytoremediation techniques. Although the research is lim-ited to the cultivable fraction of a certainly much widerbiodiversity, as by now is well-known from culture-independent techniques, it addresses a quite peculiar biodi-versity that needs to be evaluated and preserved ex situ.Microbial biodiversity originated in historically pollutedareas, in fact, is the result of evolutionary adaptation inresponse to chronic stress and harbours metabolic character-istics which make its members strong candidates for poten-tial biotechnological exploitation. In this case, we have beenmainly focused on isolating bacterial strains, able to promoteplant growth (PGPB) and tolerant to heavy metals, to beassociated with botanical species. On the basis of all the
Fig. 4 Partial least-square (PLS) analysis of data sets ‘soil chemicaldata’ versus ‘biodiversity’. Soil samples are indicated by solid circles.Loadings symbols: plus sign indicates the soil chemical data, emptysquare indicates the biodiversity data (genera). Some genera weregrouped in the same biplot space: G1 includes the genera Variovorax,Stenotrophomonas, Erwinia, Herminimonas, Plantibacter,Curtobacterium, Niabella, Rhizobium, Nocardia, Rothia and
Staphylococcus. G2 includes the genera Enterobacter, Hafnia,Citrobacter and Mesorhizobium. G3: Brevibacterium, Ochrobactrum,Tetrathiobacter, Sphingomonas and Burkholderia. G4: Micrococcus,Herbiconiux and Lysinibacillus. G5: Leifsonia, Inquilinus,Sinorhizobium. G6: Aeromicrobium, Sporosarcina, Terracoccus,Micromonospora, Frigobacterium, Dyadobacter and Buttiauxella.G7: Pedobacter and Chryseobacterium
Environ Sci Pollut Res (2014) 21:6824–6835 6833
Author's personal copy
scientific data obtained from the six test sites under investi-gation, the present work intends to implement a comparativestudy of the mining soils, based both on microbial biodiver-sity and functional diversity, correlated with chemical–phys-ical parameters of soil.
The metabolic fingerprint (CLPP) of the six soil commu-nities under investigation that separates soils in two clusters(Fig. 1) not necessarily reflects the abundance of isolates(Table 1), as in the ECOPlates the entire communityextracted from a soil is inoculated, clearly including non-cultivable strains, which still contribute to the overall meta-bolic profile of the community. In fact UK and POL soilsshowed a high number of isolates together with a highmetabolic performance both for range of substrates usedand metabolic yield in the use of individual substrates, whileSW showing the same high metabolic profiling provided alower number of isolates. The IT community, showing thelowest metabolic activity, yielded a rich species diversity.This may be also due to the different selective pressure ofartificial media used for bacterial growth and the carbonsources of ECOPlates. These plates contain 31 carbonsources to assess the potential functional diversity of thebacterial population through sole source carbon utilisationpatterns. Some limitations of metabolic profiling arerecognised as the method favours fast-growing microorgan-isms (Yao et al. 2000), is sensitive to inoculum density(Garland 1996) and reflects the potential and not the in situmetabolic diversity (Garland and Mills 1991). On the basisof the r/K concept (MacArthur and Wilson 1967; Fierer et al.2007), we can speculate that in the ECOPlates the K-strategists were at a disadvantage, while favoured in thenative poor soils. On the other hand, in order to capture asmuch as possible of cultivable biodiversity, the heterotrophicpopulations were isolated on a variety of growth media withdifferent substrate compositions (from rich medium to min-eral medium) and for longer incubation time (several weeks)so that both r-strategists and K-strategists were able to grow.
It is known from literature that there is considerablevariability in the abundance of members of different phylaand classes in different soils. It is not yet clear to what extentthe variations are systemic, e.g. in response to soil environ-mental conditions, and to what degree method-induced arte-facts impact the data (Janssen 2006). It is hard to say whetherthe abundance of members of some taxa is controlled bysingle, readily identifiable factors, as it can be inferred forsome others. The assumption ‘everything is everywhere; theenvironment selects’ suggests that environmental conditionswill determine distribution rather than any specific factorlinked to the geographical location. However, a number ofrecent studies of genetic diversity in microbial communitiesshow evidence that microbial diversity is spatially structuredby geography as well as by the environment (O’Malley2008). In our work, the whole community isolated across
Europe falls in four phyla, 46 genera and 99 species, phylo-genetically correlated as shown in Fig. 3. The comparison ofthe heterotrophic microorganisms highlighted that most ofthe isolated strains are Gram-positive affiliated withActinobacteria and Firmicutes: These are members of theterrestrial clade Terrabacteria proposed by Battistuzzi andHedges (2009), which includes two thirds of known pro-karyote species and possess important adaptations such asresistance to environmental stresses, as those sought forUMBRELLA strains. On the other hand, Gram-negativeProteobacteria that on the basis of cultivation-dependentand cultivation-independent approaches are generallyrecognised as one of the most successful microbial groupson the planet (Rappè and Giovannoni 2003) are generallyless represented within these communities, while prevail inGER, where a very low content of heavy metals in soil wasdetected.
The analysis at phylum-level of the detected biodiversityshows that the number of phyla represented is fairly smallcompared with the diversity found in soil ecosystems(Janssen 2006; Battistuzzi and Hedges 2009). These resultsimply a convergence of the six communities, located indifferent geographical and climatic areas, but similarly af-fected by mining pollution. The convergence at phylum levelcould be related to the same environmental pressure exertedby heavy metals and the harsh soil conditions rather than togeographical factors.
At species-level biodiversity was analysed through eco-logical indices describing alpha (Shannon’s index), beta(Sørensen's similarity index) and gamma diversity(Table 4). Shannon index values range between 2.756 and3.585 and are comparable to those observed in forest soil(Fierer and Jackson 2006) and in disturbed environment(Laplante and Derome 2011). Beta diversity values clearlyindicate that the six sites are undeniably diverse, sharing avery low number of common species.
The results bring to the assumption that microbial commu-nities from the six mining sites present a convergence corre-lated to soil factors rather than to geographical factors atphylum level while, at species level, reflect a remarkable localcharacterisation. Multivariate analysis of soil chemical factorsand biodiversity supports this interpretation, identifying foreach soil well-discriminating chemical factors and species.
Conclusion
The bioprospecting activities performed at the six miningsoils located across Europe provided information on thecultivable fraction of native microbial biodiversity, its adap-tive responses to chronic stress (resistance to metals, pH veryacidic or very basic, lack of nutrients) and its metabolicpotential associated with plant growth promotion and soil
6834 Environ Sci Pollut Res (2014) 21:6824–6835
Author's personal copy
quality. Several PGP-bacteria have been isolated, allowing toestablish a native consortium at each site to be used as abioaugmenta t ion agent for microbia l ly ass is tedphytoremediation of mining areas, which was the main goalof the UMBRELLA project. Multivariate analysis supportsthe assumption that the cultivable biodiversity, originatedfrom the six mining sites that are different for geo-climaticposition across Europe while similar for chronic stress con-ditions, presents a convergence at phylum level, correlated tosoil factors rather than to geographical factors. On the otherhand, at species level, biodiversity reflects a remarkable localcharacterisation.
Of course, the above is applicable only to the cultivablefraction of microbial communities; however, the meta-genomic study in progress may lead to different conclusions.
Acknowledgements This study was supported by the EU 7FP-UMBRELLA (EU 226870).
The authors warmly thank Federico Marini from the UniversitySapienza (Rome, Italy) for the help in statistical analysis
References
Amoroso MJ, Schubert D, Mitscherlich P, Schumann P, Kothe E(2000) Evidence for high affinity nickel transporter genes inheavy metal resistant Streptomyces species. J Basic Microbiol40:295–301
Battistuzzi FU, Hedges SB (2009) A major clade of prokaryotes withancient adaptations to life on land. Mol Biol Evol 26(2):335–343
Dworkin M, Foster J (1958) Experiments with some microorganismswhich utilize ethane and hydrogen. J Bacteriol 75:592–601
Fierer N, Jackson RB (2006) The diversity and biogeography of soilbacterial communities. PNAS 103(3):626–631
Fierer N, Bradford MA, Jackson RB (2007) Toward an ecologicalclassification of soil bacteria. Ecology 88(6):1354–1364
Forney LJ, Zhou X, Brown CJ (2004) Molecular microbial ecology:land of the one-eyed king. Curr Opin Microbiol 7:210–220
Garland JL (1996) Analytical approaches to the characterizationof samples of microbial communities using patterns of po-tential C source utilization. Soil Biol Biochem 28(2):213–221
Garland JL, Mills AL (1991) Classification and characterization ofheterotrophic microbial communities on the basis of patterns ofcommunity-level sole-carbon-source utilization. Appl EnvironMicrobiol 57(8):2351–2359
Gordon SA, Weber RP (1951) Colorimetric estimation of indoleaceticacid. Plant Physiol 26(1):192–195
Gupta R, Singal R, Shankar A, Kuhad RC, Saxena RK (1994) Amodified plate assay for screening phosphate solubilizing micro-organisms. J Gen Appl Microbiol 40:255–260
Huber T, Faulkner G, Hugenholtz P (2004) Bellerophon; a program todetect chimeric sequences in multiple sequence alignments. Bio-informatics 20:2317–2319
Janssen PH (2006) Identifying the dominant soil bacterial taxa inlibraries of 16S rRNA and 16S rRNA genes Appl. EnvironMicrobiol 72(3):1719–1728
Kieser T, Bibb MJ, Buttner MJ, Chater KF, Hopwood DA (2000)Practical Streptomyces genetics: John Innes Foundation, NorwichResearch Park, Colney, Norwich NR4 7UH, UK
Laplante K, Derome N (2011) Parallel changes in the taxonomicalstructure of bacterial communities exposed to a similar environ-mental disturbance. Ecol Evol 1(4):489–501
MacArthur R, Wilson E (1967) The theory of island biogeography.Princeton University Press, Princeton, New Jersey, USA
Milagres AM, Machuca A, Napoleão D (1999) Detection ofsiderophore production from several fungi and bacteria by a mod-ification of chrome azurol S (CAS) agar plate assay. J MicrobiolMethods 37(1):1–6
Nei M, Kumar S (2000) Molecular evolution and phylogenetics. OxfordUniversity Press, New York
O’Malley MA (2008) ‘Everything is everywhere: but the environmentselects’: ubiquitous distribution and ecological determinism inmicrobial biogeography. Stud Hist Philos Biol Biomed Sci39(3):314–325
Patten CL, Glick BR (2002) Role of Pseudomonas putida indole aceticacid in development of host plant root system. Appl EnvironMicrobiol 48:3795–3801
Pikovskaya RI (1948) Mobilization of phosphorus in soil in connectionwith the vital activity of some microbial species. Mikrobiologia17:362–370
Rappè MS, Giovannoni SJ (2003) The uncultured microbial majority.Annu Rev Microbiol 57:369–394
Saitou N, Nei M (1987) The neighbor-joining method: a newmethod for reconstructing phylogenetic trees. Mol Biol Evol4:406–425
Schmidt T, Schlegel HG (1989) Nickel and cobalt resistance of variousbacteria isolated from soil and highly polluted domestic and in-dustrial wastes. FEMS Microb Ecol 62:315–328
Sprocati AR, Alisi C, Tasso F, Marconi P, Sciullo A, Pinto V, ChiavariniS, Ubaldi C, Cremisini C (2012) Feasibility study for bioremedi-ation of a soil co-contaminated by diesel oil and heavy metalsusing a tailor-made microbial formula as bioaugmentation agent.Process Biochem 47:1649–1655
Tamura K, Peterson D, Peterson N, Stecher G, Nei M, Kumar S (2011)MEGA5: molecular evolutionary genetics analysis using maxi-mum likelihood, evolutionary distance, and maximum parsimonymethods. Mol Biol Evol 28:2731–2739
Weisburg WG, Barns SM, Pelletier DA, Lane DJ (1991) 16S ribo-somal DNA amplification for phylogenetic study. J Bacteriol173:697–703
Yao H, He Z, Wilson MJ, Campbell CD (2000) Microbial biomass andcommunity structure in a sequence of soils with increasing fertilityand changing land use. Microb Ecol 40:223–237
Whittaker RH (1972) Evolution and measurement of species diversity.Taxonomy 21:213–251
Zinder SH, Salyers AA (2001) Microbial ecology—new directions,new importance. In: Boone DR, Castenholz RW (eds) Bergey'smanual of systematic bacteriology vol. 1: the Archaea and thedeeply branching and phototrophic bacteria. Springer-Verlag,New York, pp 101–109
Environ Sci Pollut Res (2014) 21:6824–6835 6835
Author's personal copy