esia-full-alto-aguan-irrigation-project-honduras.pdf - EKF
620
The business of sustainability Environmental and Social Impact Assessment (ESIA) for the Alto Aguan River Valley Irrigation Project in Honduras PAA Project Finance A/S Rev. 03 January 2019 www.erm.com
-
Upload
khangminh22 -
Category
Documents
-
view
2 -
download
0
Transcript of esia-full-alto-aguan-irrigation-project-honduras.pdf - EKF

The business of sustainability
Environmental and Social Impact Assessment (ESIA) for the Alto Aguan River Valley Irrigation Project in Honduras PAA Project Finance A/S Rev. 03 January 2019 www.erm.com

Environmental and Social Impact Assessment (ESIA) for the Alto Aguan River Valley Irrigation PAA Project Finance A/S
REV.03
For ERM Approved by: Maria Quintana Title: Partner Date: 15 January 2019
This Report has been prepared by ERM, the trading name of Environmental Resources Management Iberia S.A., with all reasonable skill, care and diligence within the terms of the Contract with the client, incorporating our General Terms and Conditions of Business and taking account of the resources devoted to it by agreement with the client. We disclaim any responsibility to the client and others in respect of any matters outside the scope of the above. This report is confidential to the client and we accept no responsibility of whatsoever nature to third parties to whom this report, or any part thereof, is made known. Any such party relies upon the report at their own risk.

ENVIRONMENTAL RESOURCES MANAGEMENT PAA PROJECT FINANCE A/S
I
CONTENTS
EXECUTIVE SUMMARY
LIST OF ACRONYMS
CHAPTER 1 INTRODUCTION
CHAPTER 2 LEGISLATION AND POLICY FRAMEWORK
CHAPTER 3 PROJECT DESCRIPTION AND ALTERNATIVES
CHAPTER 4 STAKEHOLDER ENGAGEMENT
CHAPTER 5 BASELINE DESCRIPTION
CHAPTER 6 IMPACT ASSESSMENT METHODOLOGY
CHAPTER 7 ASSESSMENT OF ENVIRONMENTAL AND SOCIAL IMPACTS
CHAPTER 8 ENVIRONMENTAL AND SOCIAL MANAGEMENT PLAN
CHAPTER 9 REFERENCES
LIST OF ANNEXES
ANNEX 1: STAKEHOLDER ENGAGEMENT PLAN (SEP)
ANNEX 2: ASSESSMENT OF POTENTIAL BENEFICIARIES (2017)
ANNEX 3: MAY 2018 FIELD SURVEY PHOTO LOG
ANNEX 4: MAY 2018 FIELD SURVEY MAPS
ANNEX 5: SOIL AND WATER WELL PROFILES
ANNEX 6: SIGNIFICANT FLORA AND FAUNA
ANNEX 7: LIST OF SETTLEMENTS (ALDEAS AND CASERÍOS)
ANNEX 8: SUMMARY OF WATER BALANCE
ANNEX 9: CRITICAL HABITAT ASSESSMENT

ENVIRONMENTAL RESOURCES MANAGEMENT PAA PROJECT FINANCE A/S
i
I. EXECUTIVE SUMMARY
I.1. INTRODUCTION
PAA Project Finance A/S (hereafter referred to as PAA Project Finance), has appointed Environmental Resources Management (ERM) to act as an independent environmental and social consultant to undertake the Environmental and Social Impact Assessment (ESIA) for the Alto Aguan River Valley Irrigation Project in the Olanchito and Arenal municipalities in northern Honduras (hereafter known as “the Project”). The Project is an initiative of the Secretary of Agriculture and Livestock (Secretaría de Agricultura y Ganadería or SAG), ascribed to the Government of Honduras, to improve the socioeconomic status of the population in the Alto Aguan River Valley. This objective is sought through the efficient and sustainable use of soil and water resources for the existing livestock and milk production, as well as improving agricultural activities in the valley, by supplying irrigation equipment to selected beneficiaries in the area. The Government of Honduras is receiving financing from ING Bank, and EKF, Denmark’s Export Credit Agency, to transform the Alto Aguan river valley and is expected to conduct the activities in line with the World Bank Group Standards: IFC Performance Standards and IFC/World Bank Environmental, Health and Safety (EHS) General Guidelines. The Government of Honduras, through the SAG, has awarded PAA Project Finance the contract for delivering311 irrigation sets and accessories, , in addition to training SAG technicians/trainers in their use and maintenance. PAA Project Finance assumes no responsibility for the subsequent operation, use, and decommissioning of the irrigation system. According to local regulations, the Project does not require the development of an Environmental and Social Impact Assessment (ESIA), because the activities are limited to the delivery and operation of irrigation equipment designed to irrigate up to 10 ha as well as the delivery of trainings and because of the fact that among the conditions that need to be met by potential beneficiaries the land plot to be irrigated cannot be located within the limits of any protected area. Nevertheless, in 2017, PAA Project started developing an ESIA to comply with lender requirements. Currently, PAA Project Finance has commissioned ERM to update and finalize the draft 2017 ESIA, according to the gaps identified by lenders in the draft 2017 ESIA. The Project is located in the Alto Aguan Valley in Honduras, in the Olanchito and Arenal municipalities. The Project Area covers approximately 60,000 ha, which encompass the 3,110 ha of agricultural land to be irrigated. There are a total of 54 hamlets (aldeas) and 133 settlements (caseríos) within this larger area. Each irrigation system planned to be delivered is designed to irrigate up

ENVIRONMENTAL RESOURCES MANAGEMENT PAA PROJECT FINANCE A/S
ii
to 10 ha of land. It will be provided to approximately 300 milk producers and farmers present in the Project Area, selected based on certain eligibility conditions established by the SAG-PIU and PAA Project Finance.
Figure I.1 Project Location
Source: ERM, 2018
I.2. LEGISLATION AND POLICY FRAMEWORK
The legal basis for environmental protection in Honduras is established in General Environmental Law - Decree nº104-93 (Ley General del Medio Ambiente), dated 25th July, 1993. The General Environmental Law sets out the framework for the protection, conservation, restoration, and sustainable management of the environmental and natural resources in Honduras. It also establishes the principles for environmental protection, which includes the EIA requirements for the development of certain potentially contaminating and degrading projects. Other important environmental regulations applicable to this Project are summarised in Table I.1.
Table I.1 Environmental regulations applicable to the Project
Area of relevance Decree name Environmental Impact Assessment
Ministerial agreement nº08-2015 – Regulation of the Environmental Impact National System Law (SINEIA) modified by Ministerial agreement nº7-2016 and nº11-2016 Ministerial agreement nº16-2015 – Environmental Categorisation Decree nº800-2015 - Public Participation in the Environmental Assessment
Water resources Decree 181-2009 - General Water Act

ENVIRONMENTAL RESOURCES MANAGEMENT PAA PROJECT FINANCE A/S
iii
Area of relevance Decree name Ministerial agreement nº084-1995 - National Technical Standards for Drinking-Water Quality Ministerial agreement nº043-2016
Climate change Decree nº297-2013 – Climate Change Act Flora, fauna and protected areas
Decree nº98-2007 – Forestry, Protected areas and Wildlife Law
Decree nº159-2005 – Protected area of Honduran Emerald Hummingbird
Decree nº204-2011 - Honduran Emerald Hummingbird Wildlife Refuge
Decree nº32-2014 - Honduran Emerald Hummingbird Wildlife Refuge Pesticides and related substances
Regulation on the Registration, Use and Control of Pesticides and Related Substances, Agreement nº 642-98 Central American Technical Regulation RTCA 65.03.44: 07 - Pesticides for domestic and professional use, of June 13th 2011 Phytozoosanitary Act, Decree nº 157-94
Solid Waste Management
Regulation of the integral management of solid waste (Executive Agreement nº 1567-2010, dated October 1st, 2010)
Air emissions Regulation of Emissions of Pollutant Gases and Smoke of Motor Vehicles (January 13th, 2000)
Land property Property Law, Decree nº82/04 Resolution of the Property Law nº3/10
Cultural Heritage Protection
Protection of Cultural Heritage Law, Decree nº220-97 (1997)
Risk Management National Risk Management System Law Regulation of the National Risk Management System (SINAGER) Law, Agreement nº032-2010
Labour Labour Code, Decree nº189-1959
Agreement nºSTSS-053-04 modifying the General Regulation for the Prevention of Work-related Accidents and Occupational Diseases
Code of Childhood and Adolescence, Decree nº73-96
Source: ERM 2018
The main government departments, national authorities, or organisations engaged in environmental and social governance in Honduras and that have a specific role or interest in the Project are:
Ministry of Agriculture and Livestock (Secretaría de Agricultura y Ganadería or SAG) and its various directorates (such as SAG – National Service for Agro-food Health and Safety or SENASA, SAG – Directorate of Agricultural Science and Technology or DICTA, SAG – Planning and Evaluation Management Unit or UPEG, etc.);
Secretary of State in the Office of Energy, Natural Resources, the Environment and Mining (MIAMBIENTE); and
National Institute of Conservation and Development of Forestry, Protected Areas and Wildlife (ICF) and Research Association for Ecological and Socioeconomic Development (ASIDE).
To conclude, as the development of this Project involves funding from lender entities, WB/IFC Performance Standards have also been considered in order to ensure the Project complies with international good practice. In addition, the Project has to meet the Corporate Social Responsibility (CSR) standards of PAA Project Finance A/S.

ENVIRONMENTAL RESOURCES MANAGEMENT PAA PROJECT FINANCE A/S
iv
I.3. PROJECT DESCRIPTION AND ALTERNATIVES
Project Overview, Location, Organization and Management
The Project consists of establishing an irrigation system for a maximum of 3,110 hectares of agricultural land located in the Alto Aguan River Valley in the Olanchito and El Arenal municipalities, in the Yoro department in Honduras. The 3,110 ha to be irrigated are distributed over an area of 60,000 ha which coincides with the Alto Aguan River Valley area, and represents approximately 5% of the total area of the Alto Aguan River Valley. The specific locations of the plots to be irrigated will be defined only once the beneficiaries have been selected; the overall perimeter of the 60,000 ha that encompasses the maximum total area where the irrigation system may be implementation has been assumed as the Project Area. Figure I.2 illustrates the parties involved in the implementation and management of the Project.
Figure I.2 Project organization and management
Source: ERM, 2018 Project Beneficiaries
The potential Project beneficiaries are milk producers and farmers who are either independent farmers or members of a locally organized collective, such as a milk collection centre (Centro de Recolección y Enfriamiento de Leche or CREL), the Olanchito society of farmers and stockbreeders (Sociedad de Agricultores y Ganaderos de Olanchito or SAGO), or the Honduran federation of farmers and stockbreeders (Federación Nacional de Agricultores y Ganaderos de Honduras or FENAGH). The selection criteria that was shared with potential beneficiaries was established by the SAG and PAA Project Finance. The Project eligibility conditions that must be met are:
the beneficiary must be the owner of the land plot to be irrigated;
ENVIRONMENTAL RESOURCES MANAGEMENT PAA PROJECT FINANCE A/S
v
the land plot to be irrigated must not be located within the limits of any protected area;
the land plot must not be situated within natural habitats such as shrubland or forest;
there must be available water, either surface water or groundwater; the land must be flat; and the land plot must not be located on indigenous land.
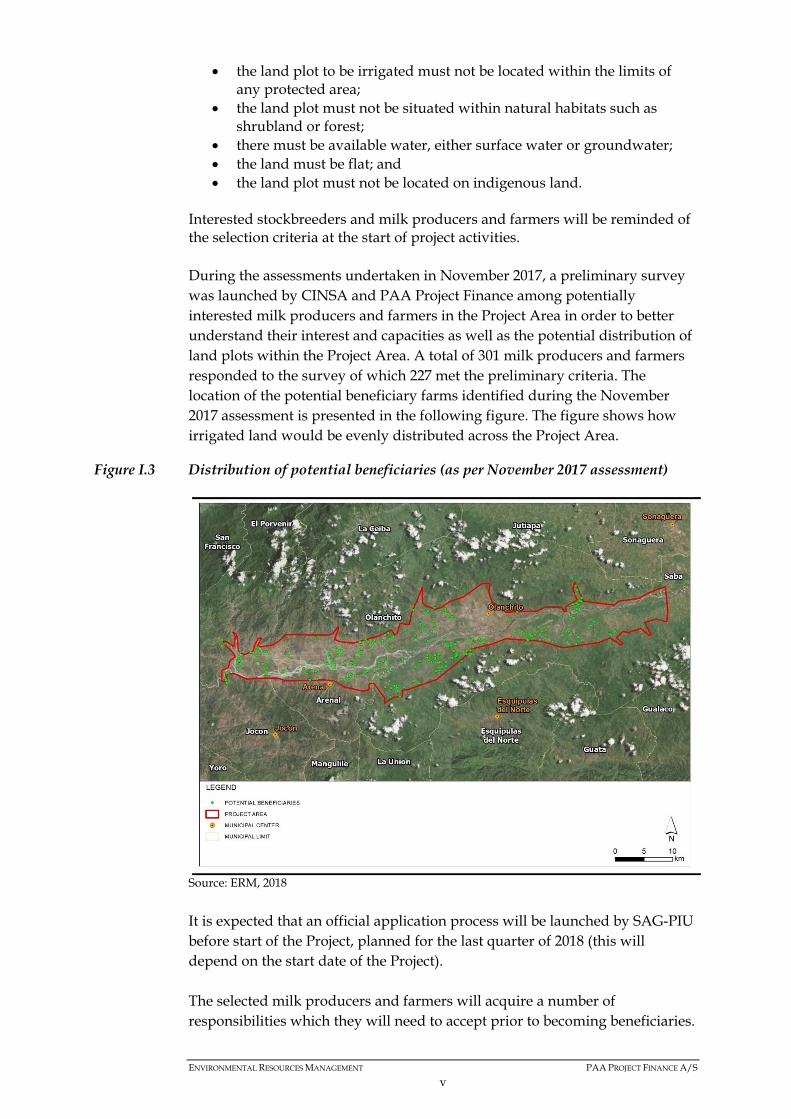
Interested stockbreeders and milk producers and farmers will be reminded of the selection criteria at the start of project activities. During the assessments undertaken in November 2017, a preliminary survey was launched by CINSA and PAA Project Finance among potentially interested milk producers and farmers in the Project Area in order to better understand their interest and capacities as well as the potential distribution of land plots within the Project Area. A total of 301 milk producers and farmers responded to the survey of which 227 met the preliminary criteria. The location of the potential beneficiary farms identified during the November 2017 assessment is presented in the following figure. The figure shows how irrigated land would be evenly distributed across the Project Area.
Figure I.3 Distribution of potential beneficiaries (as per November 2017 assessment)
Source: ERM, 2018 It is expected that an official application process will be launched by SAG-PIU before start of the Project, planned for the last quarter of 2018 (this will depend on the start date of the Project). The selected milk producers and farmers will acquire a number of responsibilities which they will need to accept prior to becoming beneficiaries.

ENVIRONMENTAL RESOURCES MANAGEMENT PAA PROJECT FINANCE A/S
vi
These responsibilities include the following aspects: application process, fee, permits and other costs, use and maintenance, sustainability, technical inspections and monitoring, plot transfer or sale, and support to the SAG. The final list of potential beneficiaries will depend on the ultimate conditions that the beneficiaries will need to meet, their interest in the Project, and whether or not they accept the responsibilities they will acquire with regard to the Project. The selection process will be managed by the SAG-PIU through a transparent process including direct information to all potential interested parties. Irrigation System and Responsibilities
The irrigation system and responsibilities are summarized in the following figures. The irrigation system has been assessed as being the most suitable for the current needs of the Project, the objectives of the SAG, best practice applicable to the agricultural activities, and the environmental and social aspects that have been considered throughout the Project design.

ENVIRONMENTAL RESOURCES MANAGEMENT PAA PROJECT FINANCE A/S
vii
Figure I.4 Project irrigation equipment
Source: ERM, 2018

ENVIRONMENTAL RESOURCES MANAGEMENT PAA PROJECT FINANCE A/S
viii
Figure I.5 Irrigation process
Hose reel irrigation unit

ENVIRONMENTAL RESOURCES MANAGEMENT PAA PROJECT FINANCE A/S
ix
Microsprinkler irrigation unit
Source: ERM, 2018

ENVIRONMENTAL RESOURCES MANAGEMENT PAA PROJECT FINANCE A/S
x
Figure I.6 Components of the irrigation system and responsibilities
Source: ERM, 2018 Project Phases
Project activities will take place in three different phases: pre-operation, operation, and abandonment, in which the responsible parties differ from one phase to another. The Project activities under the direct responsibility of PAA Project Finance, include the delivery of irrigation equipment and its accessories, as well as providing training on in its use, maintenance and other relevant aspects to SAG representatives/trainers. These activities will be implemented exclusively during the pre-operation phase of the Project. It is important to note that PAA Project Finance assumes no responsibility for assigning irrigation systems to beneficiaries nor the subsequent use and maintenance of these systems (activities that will take place during the operation and abandonment phases). The SAG, through the Project Implementation Unit – PIU (Unidad Ejecutora de Proyecto or UEP), will assume responsibility for establishing the Project (pre-operation phase), while the SAG will directly manage and supervise the subsequent phases.
Figure I.7 summarises the main activities of each phase, the responsible parties, and estimated duration.

ENVIRONMENTAL RESOURCES MANAGEMENT PAA PROJECT FINANCE A/S
xi
Figure I.7 Project activities for each Project phase
Source: ERM, 2018

ENVIRONMENTAL RESOURCES MANAGEMENT PAA PROJECT FINANCE A/S
xii
Waste management, use of resources and emissions in each phase is summarized in Table I.2.
Table I.2 Waste management, use of resources and emissions due to Project Activities
Phase Waste management Use of resources Emissions P
re-o
pera
tion
Irrigation equipment packaging materials (wood, plastic, polymers) Domestic waste and wastewater in the offices where the training activities will take place. Management by the municipality of Olanchito: Olanchito sanitary landfill, sewer network, or corresponding septic tanks.
Fuel consumption required for: (1) transporting the irrigation equipment to the SAGO warehouse; and (2) mobilization of technicians to the Project Area.
Vehicle exhaust emissions related to the described fuel consumption.
Ope
rati
on
Lubricants. Management by the beneficiary: reuse or recycle. Bentonite-based muds will be used for drilling the wells. Management by the beneficiary
Estimated water consumption for irrigation: 14,93 Hm3 per year. Estimated diesel consumption by motor pumps: less than 2,500 m3/year. The drilling of underground water wells will also require fuel.
Exhaust emissions will be generated due to the consumption of fossil fuels by the motor pumps. Noise emissions due to the operation of the pumps. Drilling associated exhaust and noise emissions.
Aba
ndon
men
t
The beneficiaries will be responsible for correctly abandoning the irrigation equipment and water wells. Abandoned Project irrigation equipment can be either managed and recycled by a specialist company or reused by the milk producer or farmer on other machinery, or for other purposes. The SAG will be responsible for monitoring the correct implementation and management of the environmental and social measures relating to abandonment activities.
Source: ERM 2018
I.4. STAKEHOLDER ENGAGEMENT
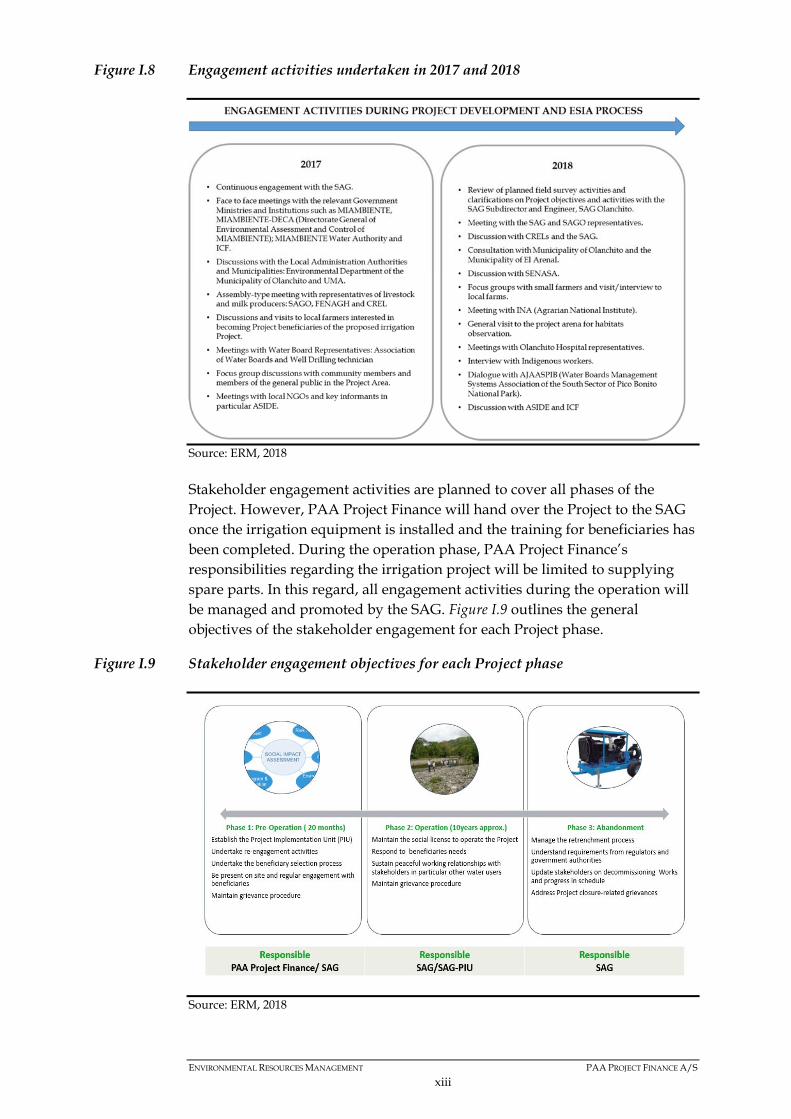
Stakeholder consultations for the Project began during Project planning phase and has been continuous through the feasibility studies, Environmental and Social Impact Assessment (ESIA) update which included new engagement activities with key stakeholders (field survey conducted in June 2018). Figure I.8 shows a summary of the stakeholder engagement activities during ESIA preparation in 2017 and during the ESIA update preparation in 2018.
ENVIRONMENTAL RESOURCES MANAGEMENT PAA PROJECT FINANCE A/S
xiii
Figure I.8 Engagement activities undertaken in 2017 and 2018
Source: ERM, 2018 Stakeholder engagement activities are planned to cover all phases of the Project. However, PAA Project Finance will hand over the Project to the SAG once the irrigation equipment is installed and the training for beneficiaries has been completed. During the operation phase, PAA Project Finance’s responsibilities regarding the irrigation project will be limited to supplying spare parts. In this regard, all engagement activities during the operation will be managed and promoted by the SAG. Figure I.9 outlines the general objectives of the stakeholder engagement for each Project phase.
Figure I.9 Stakeholder engagement objectives for each Project phase
Source: ERM, 2018

ENVIRONMENTAL RESOURCES MANAGEMENT PAA PROJECT FINANCE A/S
xiv
To conclude, as part of the stakeholder engagement activities, there will be a grievance mechanism. The Community Grievance Mechanism enables any stakeholder to make a complaint or a suggestion about the way the Project is being implemented. Grievances may take the form of specific complaints for damages/injury, concerns about routine Project activities, or perceived incidents or impacts. The purpose of the Community Grievance Mechanism Procedure is to implement a formalised process (identification, tracking and redress) to manage complaints/grievances from communities and other local stakeholders in a systematic and transparent manner that could potentially arise from the Irrigation Project.
I.5. BASELINE DESCRIPTION
Table I.3 and Table I.4 provide a summary of the environmental and social baseline in the Project Area, highlighting those key baseline features considered in the environmental and social impact assessment.

ENVIRONMENTAL RESOURCES MANAGEMENT PAA PROJECT FINANCE A/S
xv
Table I.3 Summary of Environmental Baseline
Physical environmental baseline Climate The climate in Honduras is tropical and temperate, according to the Köppen climate classification. In the case of the climate conditions in the Project Area, located between
the lowlands along the Caribbean and the highlands within the country, the presence of the mountain range Sierra Nombre de Dios is particularly significant. This mountain range acts as a barrier that prevents the humidity of the Atlantic Ocean reaching the area, making the climate warm and dry. The average temperatures range between 26-27ºC in the Project Area. The climate in Honduras is characterized by two differentiated seasons: rainy and dry, with a very variable rainfall distribution throughout the year. The dry season in the Project Area occurs from January to April and during the rest of the year, the monthly rainfall ranges from 80 mm/month to 160 mm/month where June and September are the months with the highest rainfall. Hurricanes and tropical storms occur most often between June and October. However, this varies substantially from year to year.
Air Quality Information on air quality in Honduras and specifically in the Project Area is very scarce. Honduras is reported to have only one air quality station, located in Tegucigalpa. Poor air quality conditions are reported in urban areas in Honduras due to emissions from urban transport, re-suspension of dust in the streets, unpaved street emissions and eroded areas, and lime and brick kiln plants operating in urban surroundings. Rural areas also face problems of air quality because of forest fires and agricultural burning, which produce emissions of suspended particles. The Project Area does not present any particular sources of air emissions such as industries, mining activities and power plant apart from traffic-related emissions. Livestock production activities are the dominant economic activity in the Project Area, however industrial milk-processing centres, which are potentially air emission sources, are located outside the Project Area.
Acoustic environment
Information on the acoustic environment in Honduras, and specifically the Project Area, is very scarce. It is expected that noise levels in urban areas (e.g., Tegucigalpa) are high, taking into account the typically dense traffic. In very remote areas, far from any human activities, the sound level is determined by natural sources such as water (rain, rivers and waterfalls), and the wind making waves and blowing through the vegetation. The Project Area is located in a rural area, characterized by relatively low ambient noise levels, particularly at night. However, some noise sources (e.g., traffic) are present, but these are more limited than in the urban areas.
Topography The Project Area is surrounded by hills and mountains on both sides of the valley: those in the north correspond to the mountain range Sierra Nombre de Dios and those in the south correspond to the mountain range Sierra La Esperanza. Most of the Project Area is relatively flat, corresponding to the bottom of the Aguan River Valley.
Geology The Project Area presents the following geological units: Palaeozoic materials of the Chortis Block (Palaeozoic basement), in the western section of the Project Area, in the hills around the valley, Angels Valley Group deposited during the Cretaceous, in the eastern section of the Project Area, Undifferentiated plutonic rocks, in the central section of the Project Area, in the hills around the valley, and finally alluvial deposits associated to the Aguan River and its tributaries. The alluvial deposits represent the predominant geological unit in the Project Area.
Soils The main types of soils found in the Project Area are alluvial soils and two types of lithosols (Jacaleapa and Yaruca). Soil quality conditions in the Project Area are expected to be good. Based on the information gathered during the field survey in 2018 through interviews with the local population, no erroneous uses of chemical products were observed. Chemical products (herbicides, pesticides, and fertilizers) are commonly employed on the farms in the Project Area, however only small quantities are used.

ENVIRONMENTAL RESOURCES MANAGEMENT PAA PROJECT FINANCE A/S
xvi
Hydrology The Project Area is located in the macro-basin of the Aguan River which is characterized to be very dynamic with changes along its course and bars being formed from the sedimentary materials transported downstream. The water flow of the Aguan River fluctuates between the dry season (January – April) and the rainy season (rest of the year). The Aguan River has many tributaries in the Project Area (34 in total). The water flow in the Aguan River comes from two main sources: tributaries flowing towards this river; and groundwater flow towards the river from the alluvial aquifer located in the bottom of the valley. Surface water features in the Project Area are used for irrigating agricultural fields and providing water for the cattle. Tributaries of the Aguan River also used as a water supply for the communities (human consumption). There is a lack of data on surface water quality analyses. The observations during the field survey in 2018 suggest a generally good condition based on biological indicators of good quality fresh water, such as fish. However, there is a potential risk of loss of quality by organic contamination as a result of the wastewater management procedures in the communities.
Hydrogeology The Project Area presents four categories of aquifers: a highly productive and extensive aquifer which corresponds to the alluvial deposits of the Aguan River, moderately to highly productive local aquifers which correspond to a fissured aquifer associated to the Angels Valley Group materials, poor to moderately productive local and extensive aquifers which correspond to undifferentiated volcanic rocks located in two areas around the municipality of Olanchito, rocks with limited and local groundwater resources which correspond to the Cacaguapa Schist formation. Most of the Project Area is located on the Alluvial Aquifer of the Aguan River. It presents a confined/semiconfined condition where water flow ranges between 4 and 30 L/s as well as an unconfined condition where water flow of 67 L/s have been reported. The Project Area is characterized by groundwater levels at depths of < 10 m to 40 m. There are two main categories of groundwater wells in the Project Area based on their construction characteristics: dug wells, shallow and built using hand tools; and drilled wells, deeper and built using drilling equipment. There is no official register of groundwater wells as so accurate information on the exact number of groundwater wells in the Project Area is not available. The use of groundwater is minor in comparison with the use of surface water. Groundwater wells are mostly utilized for farming activities (cleaning and water for cattle), but in a few cases they are also used as a water supply for the communities (human consumption). The available chemical analyses of groundwater resources show that these are adequate for irrigation purposes.
Habitats The main habitats in the Project Area are agricultural fields and pastures, grassland, aquatic systems, inhabited urban and rural areas, and shrubland and forest. In the eastern section of the Project Area, the agricultural areas are mostly irrigated banana and African palm plantations, while the agricultural areas in the central and western sections of the Project Area are mostly pasture and non-irrigated crops used for livestock feeding. Agricultural fields and pastures habitats represents about 50.5% of the total surface area of the Project Area. Grassland in the Project Area is generally found in abandoned areas that were previously used for livestock. The aquatic systems in the Project Area are the Aguan River and its tributaries, together with small lakes, ponds, and artificial lagoons. The shrubland and forest habitat is composed of different vegetation units which can be grouped as two different types of forest: very dry tropical forest and dry tropical forest, representing about 23% of the total Project Area. The very dry tropical forest is a habitat of high biodiversity value, since it only occurs in two locations in Central America and has a high level of endemism in flora and fauna and it is also considered Critical Habitat with respect to IFC PS6. The project will not result in any loss of this habitat, neither directly through land use change or other kind of direct or indirect alteration, nor to any flora or fauna species. On the contrary it is expected that an indirect effect of the project will result in a lowered grazing pressure in this habitat by cattle during the dry months, and as a consequence on a net improvement of the habitat quality.
Flora There are 306 flora species identified in the Project Area: 10 endemic species; six species classified as VU by IUCN; two species classified as EN by IUCN; three species classified as CR by IUCN; 26 species included in the Appendices of CITES; and one species classified as a Species of Special Concern in Honduras: Nyctocereus guatemalensis.

ENVIRONMENTAL RESOURCES MANAGEMENT PAA PROJECT FINANCE A/S
xvii
The local population in the Project Area use certain species of plants for grazing livestock (both forage plants and natural shrub vegetation), medicinal purposes such as guayacan plant (Guaiacum sanctum), provision of wood (for firewood, and as a construction material).
Fauna The fauna species potentially present in the Project Area include (per group): 33 species of fishes (none endemic; one species classified as VU by IUCN; and two species classified as Species of Special Concern in Honduras Agonostomus monticola and Joturus pichardi), 15 species of amphibians (no endemic species), 40 species of reptiles (two endemic species; one species classified as CR by IUCN; and two species included in the Appendices of CITES), 189 species of birds (one endemic species; one species classified as EN by IUCN; 34 species included in the Appendices of CITES and seven species included in the Appendix II of the CMS) and 40 species of mammals (no endemic species; one species classified as VU by IUCN; and five species included in the Appendices of CITES). The black-chested spiny-tailed iguana (Ctenosaura melanosterna) and the Honduran Emerald Hummingbird (Amazilia luciae) have been described both within the protected area Honduran Emerald Hummingbird Wildlife Refuge (RVSCEH) and beyond. The Ctenosaura melanosterna is endemic and classified as CR by IUCN. The Amazilia luciae is endemic as well and classified as EN by the IUCN. Although Amazilia luciae can be observed in various habitats, especially when searching for food, Ctenosaura melanosterna is a more specialized species which is mostly found within the very dry tropical forest.
Protected areas There is one protected area within the Project Area: Honduran Emerald Hummingbird Wildlife Refuge (RVSCEH – Refugio de Vida Silvestre Colibrí Esmeralda Hondureño). The RVSCEH was declared a protected area in 2005 (Legislative Decree 159-2005) and in 2011, new areas were also declared protected making the total surface area of the RVSCEH of 1,992.7 ha. The main ecological features of the RVSCEH are: (1) fauna – Honduran emerald hummingbird and black-chested spiny-tailed iguana, (2) up to 10 species of endemic flora: Bakeridesia molinae, Caesalpinia yucatanensis (subsp. hondurensis), Capparicordis yunckeri, Dioon mejiae, Eugenia lempana, Eugenia coyolensis, Leucaena lempirana, Lonchocarpus trifolius, Opuntia hondurensis and Zamia standleyi; (3) very dry tropical forest habitat.
Source: ERM, 2018

ENVIRONMENTAL RESOURCES MANAGEMENT PAA PROJECT FINANCE A/S
xviii
Table I.4 Summary of Social Baseline
Socioeconomic, infrastructure, archaeological and cultural heritage Environment Overview of potential Project beneficiaries
The beneficiaries of the Aguan Irrigation Project will be chosen among all the livestock breeders, farmers and milk producers present in the area. Currently, there are approximately 350 and 400 milk producers members of the SAGO; most of whom are also members of the 16 CRELES present in the Project Area. Based on CINSA & PAA’s preliminary assessment, 75% of potential beneficiaries are expected to meet the selection criteria. The Project is therefore expected to benefit between 260 and 300 producers. These Producers occupy approximately 16,000 ha of land which correspond to 70% of the total cultivated and pasture land in the Area. The majority (48%) of potential beneficiaries are small producers with less than 40 ha of land while 14% have less than 10 ha. In addition, Preliminary findings show that 70% of potential beneficiaries do not have access to a source of surface water for irrigation and would therefore require underground wells as part of the irrigation equipment installation.
Socioeconomic environment
The Project Area is located in the Department of Yoro with most of the area included in the municipality of Olanchito and a smaller portion in El Arenal. The population in the Project Area is mostly rural with 89,166 inhabitants as of 2013 which corresponds to 86% of the population in Olanchito and Arenal municipalities. In the Project Area the population is quite young with approximately 53% of working age. The presence of indigenous groups in the Project Area is limited, with indigenous communities mainly located in the mountainous areas north of Olanchito and outside the Project Area. Field survey findings show that a small population of Tolupan individuals reside and work in the Valley and in the Project Area, as part of non-indigenous communities and are reportedly well integrated into the labour market in the Study Area. In the Study Area, livestock and milk production is the main livelihood activity, followed by employment in large scale production companies, and agriculture. In the Study Area, between a quarter and one third of the population is employed in the agriculture and livestock sector as low-skilled farm workers. The Area, as the rest of Honduras, is also characterized by a high underemployment rate which translates into one third of the occupied population in Honduras being underemployed with higher numbers in rural areas. Agricultural land is the predominant land use (50.5%) of land coverage in the Project Area, followed by shrubland and forested areas (43%while residential areas represent less than 5% of the total area. In the Project Area, most agricultural producers are livestock breeders whose agricultural output focuses on forage crops for livestock feed. Some producers sometimes diversity their production with the cultivation of basic grains, vegetables, African palm, sugar cane, citrus fruits, for both self-consumption and additional income generation. The average income of small producers is currently estimated between 20,000 and 40,000 lempiras (834 – 1,665 USD) in the rainy season compared to 10,000 and 20,000 (416 – 834 USD) in the dry season with an overall average of 30,000 lempiras (1,249 USD) per month. Potential beneficiary farms employ on average 6 permanent employees and 12 in the rainy season.
Labour rights Formal employment in Honduras is overseen by the Secretariat of Labour and Social Security (Secretaría de Trabajo y Seguridad Social) and is primarily regulated by the National Labour Code and National Program of Employment per Hour along with the dispositions of social security and minimum wage. Although National Labour Laws exist in Honduras, practice in terms of hiring and employment practices may fall short of international standards. The National Labour Code does not require written contracts for labour employed in agricultural and livestock farms that are not industrial or commercial, nor for temporary labour of up to 60 days and punctual tasks. In line with the national law, field survey findings show that that farm workers do not have formal contracts. Their average salary is below the minimum wage of 6,000 lempiras (ie. 249 USD) per month established for enterprises employing up to 10 workers in the agricultural and livestock sector. National minimum working age is 14 for children who continue to attend school and otherwise 16, whereas ILO standards set the general minimum working age at 15 and 18 for hazardous work (16 under strict conditions). In practice, child labour in Honduras is prevalent with 14.7% of children between 5 and 14 who work, of which

ENVIRONMENTAL RESOURCES MANAGEMENT PAA PROJECT FINANCE A/S
xix
57.5% are employed in the agriculture sector (sugarcane, coffee, etc.). It has been reported during the field survey that children under 14 help out at the farm on their freetime outside of school, including children of the farm owner.
Health and access to healthcare
The most common types of diseases reported in Olanchito and in Arenal municipalities are: intestinal, respiratory, and hypertension. Water-borne infections are the mostcommon causes of intestinal infections and diarrheas. In addition, vector-borne diseases such as malaria and dengue are present in the Project Area, however reportedly malaria and dengue breakouts have been successfully controlled in the Alto Aguan Valley and there is very limited occurrence of malaria and dengue fever in the Municipality of Olanchito. Children under 14 are most vulnerable to vector-borne and water-borne diseases. In fact, water-borne infections are the most common causes ointestinal infections and diarrheas, for which 18% of all reported cases in Olanchito occurred among children under 5 years of age and 20% among children between 5 and14. The most important health centre is the area’s public hospital located in Olanchito’s urban centre, which provides health services to other municipalities in the departmenof Yoro, including Arenal. Olanchito and Arenal municipalities also count with additional health centres of the following categories: Dental Medical Centre, Rural HealthCentre, Health centres with a permanent doctor, Health centres only staffed with medical assistants. Private clinics are also present in Olanchito and provide general healthcare services. The doctor per capita ratio is very low with 0.083 doctors out of 1,000 inhabitants. In rural areas, access to healthcare is limited considering that there are about 12 rural health centres in Olanchito municipality, which are only present in hamlets of 2,000 inhabitants or more, and there are 2 in Arenal municipality.
Infrastructure and public services
The water supply coverage in Olanchito and Arenal municipalities is reportedly of 88% and 65% respectively. This percentage of the population has access through the municipal distribution network. The remaining population rely on small springs, private wells, rivers, streams, etc. for water consumption. There is also a limited sanitation coverage and poor waste wastewater management in rural settlements. Access to electricity at the national level is predominant in urban areas (99% in 2013) although electricity cuts are frequent. In rural areas electricity coverage is of 75% combined with 16% of alternative energy sources including candles, gas lamps, and fuel wood. Waste collection and disposal services are present in both municipalities of Olanchito and Arenal and cover domestic users and non-domestic users including commerciaand industrial. However, this service mostly covers the urban area of Olanchito with limited coverage in rural areas Waste collected is taken to the municipal landfill where it is burned. In the absence of a dedicated landfill or waste disposal location, residents either berry or burn their waste themselves. The industries that generate hazardous wastes are responsible for establishing their own system of hazardous waste disposal with approval from the municipality (hospitals, chemical plants, or similar). The road infrastructure in the Project Area and leading to the Project Area from the port of San Pedro Sula (where the kits will be delivered) includes both paved and unpaved roads, some of them well maintained while others tend to lack proper maintenance and appropriate paving and present deficiencies in terms of signage, landslides, and potholes.
Archaeological and cultural heritage
Some of the earliest evidence of human occupation in Honduras comes from the Aguan Valley, such as the Cuyamel Caves, located outside the Project Area towards the eastern end of the Aguan Valley. The Project Area contains a number of known archaeological sites, such as Puerto Escondido, located south of Olanchito town. It was occupied from 900BC to 1000AD. Many early sites are under or beside existing settlements, such as at Olanchito.
Source: ERM, 2018

ENVIRONMENTAL RESOURCES MANAGEMENT PAA PROJECT FINANCE A/S
i
I.6. IMPACT ASSESSMENT METHODOLOGY
The methodology employed in the environmental, social and health impact assessment was prepared in accordance with the ERM Impact Assessment Standard v1.1 (2012). Box I.1 presents the ERM Impact Assessment Approach which is aligned with international best practices.
Box I.1 ERM Impact Assessment Approach
Recommended mitigation measures have been identified and follow a mitigation hierarchy as shown in Figure I.10. Mitigation is clearly described for all significant environmental and social impacts to a level appropriate for the stage of project development.
A project can have potential significant impacts on a wide range of environmental, social and health receptors. The importance or significance of these impacts depends upon a number of factors, principally the level of magnitude of the impact and secondly the sensitivity of a receptor to be affected by the impact. It is therefore important to:
Identify those processes or actions which will lead to an impact (i.e., a change in the environment) and evaluate the magnitude of this change; and,
Identify any environmental receptors upon which the impacts may act and evaluate their sensitivity.
The significance of the impact is determined by comparing, wherever possible, against accepted company, national or international standards. If no standards are available then it is necessary to develop project-specific limits, based on guidance or experience, as necessary. Such standards or limits are referred to as the significance threshold. Wherever possible the significance thresholds are based on a measurable value and compared with a legal, policy or guideline value.
If the size and type of the impact is greater than the significance threshold, this is then termed a significant impact, which is further defined as high, moderate or low. A significant impact may be broadly defined as one which should be brought to the attention of those involved in the decision-making process and therefore any significant impacts identified must be reported in the ESIA Report and, wherever possible, avoided or mitigated to reduce them to an acceptable level.

ENVIRONMENTAL RESOURCES MANAGEMENT PAA PROJECT FINANCE A/S
ii
Figure I.10 Mitigation Hierarchy
Source: ERM, 2012
I.7. ASSESSMENT OF ENVIRONMENTAL AND SOCIAL IMPACTS
Table I.5 to Table I.8 provide a summary of the residual impacts, taking into account the mitigation measures planned to be adopted during the implementation of the Project.
Table I.5 Summary of Impact Assessment: Pre-operation phase
Impact Code Impact Name Residual Impact
EE1 Long-term benefits of capacity enhancement for SAG
technicians and Project beneficiaries Positive - moderate
OHS1 Health and safety and labour rights related to road transport of irrigation kits to the SAGO warehouse
Negligible
Source: ERM, 2018
Table I.6 Summary of Impact Assessment: Operation phase
Impact Code Impact Name Residual Impact
CA1 Emissions of air pollutants and GHGs potentially
affecting air quality and climate change Negligible
N1 Potential disturbance to workers and/or fauna due to
noise levels Negligible
S1 Potential loss of soil properties due to excessive
irrigation and soil disturbance Minor
W1 Loss of surface water quality Minor
W1 Loss of groundwater quality Negligible
W2 Eutrophication of surface water Minor

ENVIRONMENTAL RESOURCES MANAGEMENT PAA PROJECT FINANCE A/S
iii
Impact Code Impact Name Residual Impact
W3 Effect on river flow Minor
W4 Increase of organic matter in the groundwater Negligible
W5 Effect on groundwater level Negligible
B1 Disturbance to fauna Negligible
B2 Disturbance to flora Negligible
B3 Loss of natural habitats and subsequent loss of flora
and fauna due to change of habitat Negligible
B3 Loss of natural habitats and subsequent loss of flora
and fauna due to the transformation of natural land to increase agriculture and livestock activity
Positive - medium
PA1 Effect on habitats, flora, and fauna in the protected area Negligible
PA1 Effect on habitats, flora, and fauna in the Protected Area due to the transformation of natural land to
increase agriculture and livestock activity Positive - medium
EE2 Temporary economic impacts from beneficiary fee
payment to the SAG and procurement Positive - moderate
EE3 Temporary direct employment of labour for
installation of irrigation equipment Positive
Negligible to Minor EE4 Long-term economic growth from production increase
nd improvements in the milk production and agriculture sectors and related sectors
Positive Moderate to Major
EE5 Long-term direct and indirect employment in the
livestock breeding and milk production and agriculture sectors and related sectors
Positive Moderate to Major
LL1 Improved livelihoods and food security for Project
beneficiaries and farm labour Positive – major
LL2 Risk of livelihood losses for beneficiaries due to increased financial pressure on beneficiaries
Minor
LL3 Risk of livelihood losses for beneficiaries and other
land users due to loss of soil fertility Minor
LL4 Risk of livelihood and losses for non-project
beneficiaries due to decreased availability of water Minor
OHS2 Occupational health and safety and labour rights
related to installation and well drilling Negligible to Minor
OHS3 Occupational health and safety of farm labour Minor
OHS4 Labour rights for farm labour including the risk of
child labour and forced overtime Negligible to Minor
CHS1 Increased risk of water-borne disease due to poor
drinking water quality Minor
CHS2 Increased transmission of vector-borne diseases Minor
CHS3 Increased pressure on health infrastructure care and
access to health care Minor
CC1 Increased tensions between communities, producers, and beneficiaries over land ownership and water
availability in the dry season Minor
CH1 Potential damage to archaeological or cultural heritage
elements in the Project Area Minor
Source: ERM, 2018
Table I.7 Summary of Impact Assessment: Non-routine events
Impact Code Impact Name Residual Impact
Acc1 Affection to the soil quality and water resource quality
due to accidental spills of fuel (diesel) and/or wastes (lubricants, bentonite-based muds)
Low
Source: ERM, 2018

ENVIRONMENTAL RESOURCES MANAGEMENT PAA PROJECT FINANCE A/S
iv
Table I.8 Summary of Impact Assessment: Cumulative impacts
Other projects considered Residual Impact
Impacts which are the result of the combination of activities associated with the Alto Aguan Project (i.e. irrigation activities and water use)
together with other similar ongoing or foreseen activities
Not Significant
Source: ERM, 2018
I.8. EMBEDDED AND MITIGATION MEASURES
For those significant impacts identified, a series of mitigation measures additional to the already considered in the design of the project (e.g. embedded measures) have been proposed. The implementation of mitigation measures aims to prevent and reduce the possible negative effects of the project activities to a tolerable level. In addition to the positive impacts identified in the socio-economic environment, a series of enhancement measures have been identified.
I.9. ENVIRONMENTAL AND SOCIAL MANAGEMENT PLAN
The main objective of the Environmental and Social Management Plan (ESMP) is to provide a framework for the implementation of the measures identified in the impact assessment to avoid, mitigate or offset adverse impacts and to minimise and manage risks on the physical, biological and social environments from Project activities. The broad purpose of the ESMP is to:
Ensure that good industry practice with regards to environmental and socioeconomic management is adopted during all phases of the Project (pre-operation, operation and abandonment);
Define strategies and methods and control approaches to ensure implementation of measures to effectively mitigate potentially adverse environmental or socioeconomic impacts;
Provide a framework for compliance monitoring (auditing and inspection) by which the identified responsible parties will assure that the environmental and socioeconomic performance commitments of the Project are being met.
The proposed mitigation measures as well as the embedded measures of the Project design make reference to a number of specific management plans that will need to be developed to address in detail key areas of potential environmental and socioeconomic impacts and risks. The following plans and programs are foreseen for the Project in the context of the mitigation and embedded measures proposed based on the outcomes of the impact assessment as well as the Project design.

ENVIRONMENTAL RESOURCES MANAGEMENT PAA PROJECT FINANCE A/S
v
Permitting Action Plan. Water Management Plan. Biodiversity Management Plan. Good Practice Irrigation Guideline. Pesticides, Herbicides and Fertilizer Management Plan. Waste Management Plan Cultural Heritage Management and Monitoring Plan Occupational Health and Safety Guidance. Community Health Management Plan. Training Management Plan. Monitoring Plan.
Additional management plans may be introduced as the Project progresses to aid in the management of any newly identified impacts or sensitive receptors or changes that may occur in the course of Project implementation. These plans are regarded as ‘live’ documents and will need to be updated periodically as the implementation of the Project evolves.

The business of sustainability
Environmental and Social Impact Assessment (ESIA) for the Alto Aguan River Valley Irrigation Project in Honduras PAA Project Finance A/S Rev.03 January 2019
Environmental and Social Impact Assessment (ESIA) for the Alto Aguan River Valley Irrigation PAA Project Finance A/S Rev.03
For ERM Approved by: Maria Quintana Title: Partner Date: 25 January 2019
This Report has been prepared by ERM, the trading name of Environmental Resources Management Iberia S.A., with all reasonable skill, care and diligence within the terms of the Contract with the client, incorporating our General Terms and Conditions of Business and taking account of the resources devoted to it by agreement with the client. We disclaim any responsibility to the client and others in respect of any matters outside the scope of the above. This report is confidential to the client and we accept no responsibility of whatsoever nature to third parties to whom this report, or any part thereof, is made known. Any such party relies upon the report at their own risk.

ENVIRONMENTAL RESOURCES MANAGEMENT PAA PROJECT FINANCE A/S
I
CONTENTS
EXECUTIVE SUMMARY
LIST OF ACRONYMS
CHAPTER 1 INTRODUCTION
CHAPTER 2 LEGISLATION AND POLICY FRAMEWORK
CHAPTER 3 PROJECT DESCRIPTION AND ALTERNATIVES
CHAPTER 4 STAKEHOLDER ENGAGEMENT
CHAPTER 5 BASELINE DESCRIPTION
CHAPTER 6 IMPACT ASSESSMENT METHODOLOGY
CHAPTER 7 ASSESSMENT OF ENVIRONMENTAL AND SOCIAL IMPACTS
CHAPTER 8 ENVIRONMENTAL AND SOCIAL MANAGEMENT PLAN
CHAPTER 9 REFERENCES
LIST OF ANNEXES
ANNEX 1: STAKEHOLDER ENGAGEMENT PLAN (SEP)
ANNEX 2: ASSESSMENT OF POTENTIAL BENEFICIARIES (2017)
ANNEX 3: MAY 2018 FIELD SURVEY PHOTO LOG
ANNEX 4: MAY 2018 FIELD SURVEY MAPS
ANNEX 5: SOIL AND WATER WELL PROFILES
ANNEX 6: SIGNIFICANT FLORA AND FAUNA
ANNEX 7: LIST OF SETTLEMENTS (ALDEAS AND CASERÍOS)
ANNEX 8: SUMMARY OF WATER BALANCE
ANNEX 9: CRITICAL HABITAT ASSESSMENT

ENVIRONMENTAL RESOURCES MANAGEMENT PAA PROJECT FINANCE A/S
i
LIST OF ACRONYMS
ABC American Bird Conservation AHJASA Honduran Society of Administrative Boards of Water Systems (Asociación
Hondureña de Juntas Administradoras de Sistemas de Agua). AJAASPIB Asociación de Juntas Administradoras de Agua del Sector Sur del Parque
Nacional Pico Bonito). ALARP As low as reasonable practical AMHE Habitat Comanagement Agreement By Species of the Honduran Emerald
Hummingbird (Convenio de comanejo del Hábitat Por Especie del Colibrí Esmeralda Hondureño)
ASCDE Association of Research for the Ecological and Socioeconomic Honduran Development (Asociación de Investigación para el desarrollo hondureño ecológico y socioeconómico)
ASIDE Research Association for Ecological and Socioeconomic Development (Asociación de Investigación para el Desarrollo Ecológico y Socioeconómico)
ASL Above sea level BAP Biodiversity Action Plan CBO Community-Based Organisations CCAFS Climate Change, Agriculture and Food Security CCAFS CGIAR Research Program on Climate Change, Agriculture and Food
Security. CEDEX Center of Studies and Experimentation of Public Works (Centro de
Estudios y Experimentación de Obras Públicas). CESCCO Pollutant Control and Study Center (Centro de Estudios y Control de
Contaminantes). CGIAR Consultative Group on International Agricultural Research CGIAR Consultative Group for International Agricultural Research CH4 Methane CICC Inter-institutional Climate Change Committee (Comité Interinstitucional
de Cambio Climático) CINSA Consultores en Ingenieria CITES The Convention on International Trade in Endangered Species of Wild
Fauna and Flora CITES The Convention on International Trade in Endangered Species of Wild
Fauna and Flora. CMS Content Management System CO Carbon oxide CO2 Carbon dioxide COMAS Municipal Water and Sanitation Commission (Comisión Municipal de Agua
Potable y Saneamiento). CONASA National Council on Drinking Water and Sanitation (Consejo Nacional de
Agua Potable y Saneamiento) CONASA National Council on Drinking Water and Sanitation (Consejo Nacional de
Agua Potable y Saneamiento). COPECO Permanent Commission of Contingencies (Comisión Permanente de
Contingencias). CR Critically endangered CREA (Environmental Training Regional Center - Centro Regional de Educación
Ambiental) CRELES Milk Collection Centers CRES (Centro de Recolección y Enfriamiento de Leche). CURLA Regional University Center of Aguan Valley (Centro Universitario Regional
del Valle Aguan dBA Decibel DD Data Deficient

ENVIRONMENTAL RESOURCES MANAGEMENT PAA PROJECT FINANCE A/S
ii
DECA Direction of environmental assessment and control (Dirección de Evaluación y Control Ambiental).
DICTA Dictatorate of Agriculture Science and Technology DNCC National Directorate for Climate Change (Dirección Nacional de Cambio
Climático) DOLE American agricultural multinational corporation EBRD The European Bank for Reconstruction and Development ECA Environmental Compliance Aproval EE Economy and employment EER Coefficient of energy efficiency EHS Environmental Health and Safety EKF Denmark’s Export Credit Agency EN Endangered ENCC National Climate Change Strategy (Estrategia Nacional de Cambio
Climático) ENCC National climate change strategy (Estrategia Nacional de Cambio Climático). ENEE (Empresa Natural de Energia Electrica). EPA Environmental Portection Agency ERM Environmental Resource Management ESIA Environmental social impact assessment ESMP Environmental and Social Management Plan EU European Union FAO Food and Agriculture Organization FENAGH National Farmers Stockbreeders Federation of Honduras FETRIXY Federation of Xicaque Tribes of Yoro GDP Gross Domestic Product GEO Global Environmental Outlook GHG Greenhouse gases GHG Greenhouse Gases GM Grievance mechanism GPS Global Positioning System GW Ground Water GWh Gigawatts hour H2O Water HC Hydrocarbon ICEP Institute for Cooperation in Development Projects (Instituto para la
Cooperación en Proyectos de Desarrollo). ICF National Institute of Forest Conservation and Development, Protected
Areas and Wildlife (Instituto Nacional de Conservación y Desarrollo Forestal, Áreas Protegidas y Vida Silvestre)
ICF Institute of Conservation and Development (Instituto de Conservación y Desarrollo).
IFC International Finance Corporation IHT Honduran Tourism Institute INA National Agrarian Institute (Instituto Nacional Agrario). INAH Honduran Institute of Anthropology and History (Instituto Hondureño de
Antropología e Historia). INFOP National Institute for Professional Training (Instituto Nacional de
Formación Profesional). IPC Integrated Pest Control ITCZ Intertropical Convergence Zone (Zona Intertropical de convergencia) ITCZ Intertropical Convergence Zone IUCN International Union for Conservation of Nature and Natural Resources Kti Cretacic plutonic intrusions Kva Angels Valley Group LC Least Concern LEYDE Leche y Derivados S.A. LULUCF Land use, land-use change, and forestry

ENVIRONMENTAL RESOURCES MANAGEMENT PAA PROJECT FINANCE A/S
iii
MP Management Plan MW Megawatts N2O Nitrous oxide NGO Non-governmental organization NOx Nitrogen oxides NT Near threatened OOPEC Office for Official Publications of the European Communities PAT Lands Management Program (Programa de Administración de Tierras) PIUY Project Implementation Unit PM Particulate Matter PM10 Particulate matter PNUD United Nations Development Program (Programa de las Naciones
Unidas para el Desarrollo) PNUD UNDP United Nations Environment Programme PS Performance Statement PVC Polyvinylchloride RTN National Tax Registry RVSCEH Wildlife Refuge for Hummingbird Emerald (Refugio de vida Silvestre
Para Colibrí Esmeralda) SAG Secretariat of Agriculture and Livestock (Secretaría de Agricultura y
Ganadería) SAGO Farmers and stockbreeders society of Olanchito SEDINAFROH Secretary of State for Indigenous and Afro-Honduran Peoples (Secretaria
de Estado de Pueblos Indígenas y Afrohondureños). SEFIN Ministry of Finance of Honduras (Secretaría de Finanzas de Honduras) SEIP Social Environmental Investment Plan SENASA National Agricultural Health Service (Servicio Nacional de Sanidad
Agropecuaria) SEP Stakeholder Engagement Plan SERNA Secretariat of Natural Resources and Environment (Secretaría de
Recursos Naturales y Ambiente) SINIT National System of Territorial Information ( Sistema Nacional de
Información Territorial) SINIT Sistema Nacional de Información Territorial SINIT National System of Territorial Information (Sistema Nacional de
Infromación Territorial). SPR Source Pathaway Receptor SW Surface water TNC The Natural Conservatory TSP Total suspended particles UAP Project Management Unit (Unidad Administradora de Proyectos) UEP Unidad Ejecutora de Proyecto UICN Unión Internacional paca la Conservación de la Naturaleza UMA Municipal Unit of the Environment (Unidad Municipal del Ambiente) UN United Nations UNAH National Autonomous University of Honduras (Universidad National
Autonoma de Honduras) UNDP United Nations Development Programme UNEP United Nations Environment Programme UNESCO United Nations Educational, Scientific, and Cultural Organization UNESCO United Nations Educational, Scientific and Cultural Organization USAID United States Agency for International Development VOCs Volatile Ogranic Compunds VU Vulnerable WHO World Health Organization WHS Worker Health Safety WMP Waste Management Plan

ENVIRONMENTAL RESOURCES MANAGEMENT PAA PROJECT FINANCE A/S
1-I
CONTENTS
1 INTRODUCTION 1-1
1.1 OVERVIEW 1-1 1.2 PURPOSE OF THE REPORT 1-2 1.3 PROJECT OBJECTIVES 1-3 1.4 PROJECT PROPONENT 1-4 1.5 PROJECT CONSULTANTS 1-5 1.6 REPORT STRUCTURE 1-6
LIST OF FIGURES
Figure 1.1 Project Location 1-2

ENVIRONMENTAL RESOURCES MANAGEMENT PAA PROJECT FINANCE A/S
1-1
1 INTRODUCTION
1.1 OVERVIEW
PAA Project Finance A/S (hereafter referred to as PAA Project Finance), has appointed Environmental Resources Management (ERM) to act as an independent environmental and social consultant to undertake the Environmental and Social Impact Assessment (ESIA) for the Alto Aguan River Valley Irrigation Project in the Olanchito and Arenal municipalities in northern Honduras (hereafter known as “the Project”). The Project is an initiative of the Secretary of Agriculture and Livestock (Secretaría de Agricultura y Ganadería or SAG), ascribed to the Government of Honduras, to improve the socioeconomic status of the population in the Alto Aguan River Valley. This objective is sought through the efficient and sustainable use of soil and water resources for the existing livestock and milk production, as well as improving agricultural activities in the valley, by supplying irrigation equipment to selected beneficiaries in the area. The Government of Honduras is receiving financing from ING Bank, and EKF, Denmark’s Export Credit Agency, to transform the Alto Aguan river valley and is expected to conduct the activities in line with the World Bank Group Standards: IFC Performance Standards and IFC/World Bank Environmental, Health and Safety (EHS) General Guidelines. The Government of Honduras, through the SAG, has awarded PAA Project Finance the contract for delivering irrigation sets and accessories, and two drilling vehicles, in addition to training SAG technicians/trainers in their use and maintenance. PAA Project Finance assumes no responsibility for the subsequent operation, use, and decommissioning of the irrigation system. According to local regulations, the Project does not require the development of an Environmental and Social Impact Assessment (ESIA), as the activities that will be carried out, namely the supply of equipment such as portable pumps and irrigation units, and water-well drilling, are not subject to a specific environmental licence. However, in 2017, PAA Project started developing an Environmental and Social Impact Assessment (ESIA) to comply with lender requirements. Currently, PAA Project Finance has commissioned ERM to update and finalize the draft 2017 ESIA, according to the gaps in this ESIA identified by lenders. Additionally, ERM, on behalf of PAA Project Finance and the SAG, will develop all the required management plans over a four and a half months period, once the ESIA is approved. The Project is located in the Alto Aguan Valley in Honduras, in the Olanchito and Arenal municipalities, in the Yoro department. A small portion of the Project Area also touches the municipalities of Jocón and Sabá. The Project Area covers approximately 60,000 ha, which encompass the 3,110 ha of

ENVIRONMENTAL RESOURCES MANAGEMENT PAA PROJECT FINANCE A/S
1-2
agricultural land to be irrigated. There are a total of 54 hamlets (aldeas) and 133 settlements (caseríos) within this larger area.
Figure 1.1 Project Location
Source: ERM, 2018
1.2 PURPOSE OF THE REPORT
This report presents the results of the Environmental and Social Impact Assessment (ESIA) undertaken for the Alto Aguan River Valley Irrigation Project in the Olanchito and Arenal municipalities in northern Honduras, hereafter known as “the Project”. The information contained in this report, along with the comments and inputs received from stakeholders and commenting authorities, will assist the SAG, owner of the Project, to manage environmental and social activities and impacts throughout the lifespan of the Project. It is noted that the involvement of PAA Project Finance will be limited to the initial phase of the Project when the equipment will be delivered and the training provided. The environmental and social impact assessment process involves the identification, prediction, and evaluation of actual and potential environmental and social impacts of a Project, and outlines proposed mitigation measures for negative impacts, as well as enhancement measures for positive impacts resulting from the Project.
The objectives of this document are to:
communicate the results of the ESIA process for the proposed Project and alternatives considered;
ENVIRONMENTAL RESOURCES MANAGEMENT PAA PROJECT FINANCE A/S
1-3
ensure that the impacts identified during the ESIA process are assessed;
present the mitigation and enhancement measures which will be implemented by the Project to manage any impacts identified;
provide a record of comments and responses received from Interested and Affected Parties (I&APs) during the ESIA process; and
facilitate an informed decision-making process by the SAG-PIU and other relevant institutions.
1.3 PROJECT OBJECTIVES
The Alto Aguan River Valley is a geographical area with rainy and very dry seasons, where livestock production activities (the dominant economic activity in the region) are affected during the dry season due to a lack of grass (pasto) for pasturing the cattle. Over an average of four months, from January to April, the lack of rain limits the availability of water for agricultural activities. There is a risk that climate change effects could prolong the dry seasons, affecting the agricultural productivity of the valley to an even greater extent. The activity in the valley is based around small and medium-sized livestock producers. Although the water resources in the Alto Aguan River Valley are abundant, the climatic limitations have restricted any agricultural intensification and diversification, which in turn make producers very vulnerable to market variations. For this reason, the purpose of the Project is to take advantage of the water resources available in the area around the year in order to effectively use them for crop irrigation. By implementing individual irrigation systems across the Olanchito and Arenal municipalities, producers will be able to maintain their agricultural production throughout the year, even increasing the quality of yields, and potentially increasing the profitability of the farms, the number of jobs, and ultimately contributing to the settlement of the population. Yearlong use of water resources will help solve current problems related to the agriculture as well as feeding livestock during the dry season, which worsen livestock conditions and reduce milk production. The commitment of the Project is to ultimately improve the economy of the area, through job creation, higher productivity of its fields, and greater competitiveness of the current local livestock and milk production, as well as improving the agricultural sector. The Project aims to contribute to the rural development of the valley and pursue, through the sustainable management and exploitation of the irrigation system, the following results:
increased and improved livestock conditions and milk production during the dry season thanks to irrigation systems installed in cattle pastures, by optimising irrigation according to the needs of the plant.
ENVIRONMENTAL RESOURCES MANAGEMENT PAA PROJECT FINANCE A/S
1-4
This increase could reportedly be as much as 40%, depending on the crops, as the farmers will be able to irrigate in the most optimised way possible according to the needs of the plants in each vegetative cycle;
high reliability and flexibility of supply, and increased value of agricultural production;
collective management of irrigation; increased technical efficiency of irrigation and efficient use of water
resources through training on efficient irrigation, water-use optimisation, and good agricultural practices. This increase aims to:
o reduce water use by up to 40%, contributing to sustainable environmental development;
o avoid soil and aquifer pollution as a result of an adequate irrigation; and
o mitigate drainage problems, erosion, water pollution, and overexploitation of aquifers.
improved environmental quality; economic diversification through the possibility of growing a higher
number of crops, allowing farmers to adjust more easily to any market variations;
increased labour demand, increased employment, and improved working and living conditions for farmers, having a consequently positive effect on potential population settlement in rural environments;
poverty alleviation, through the creation of wealth and employment, potentially boosting the economic and social development of the municipalities;
potential gender equality through increased job opportunities and improved economic conditions for the population; and
positive influence on the creation or establishment of agro-food industries related to the crops grown thanks to the irrigation system, consequently also increasing job opportunities.
The alternative to not implementing this Project (alternative no-project) is presented in Section 3.7.
1.4 PROJECT PROPONENT
PAA Project Finance is a project management and project finance firm that is part of the Aarsleff Group. PAA Project Finance provides project trade finance services for infrastructure projects in developing countries. The firm holds a proven track record of successfully completed projects within secondary healthcare, the rehabilitation and construction of potable water and wastewater treatment plants, irrigation projects, as well as light rail and airport projects.

ENVIRONMENTAL RESOURCES MANAGEMENT PAA PROJECT FINANCE A/S
1-5
Their core values, policies and corporate social responsibility comply with those of the Aarsleff Group, and use the standards OHSAS 18001 – Occupational health and safety management, DS/ISO 9001 – Quality management and DS/ISO 14001 – Environmental management as a reference whenever this is relevant to their services and customers. Further information on PAA Project Finance standards are presented in Chapter 2- Legislation and Policy Framework. PAA Project Finance handles the entire process from project identification, financing, sourcing and purchasing, to logistics and progress reporting. Focus is set on providing continuous, professional and efficient project management services to its clients. Through strong international relationships with key stakeholders, contractors and reputable financial institutions, PAA Project Finance assists their clients in ensuring a reliable and efficient management of their projects.
1.5 PROJECT CONSULTANTS
1.5.1 ERM
ERM Iberia S.A. (which is part of the ERM group; hereinafter ERM) was appointed by PAA Project Finance to undertake the ESIA for the proposed Project. ERM have no financial ties to, nor are they a subsidiary, legally or financially, of PAA Project Finance. ERM is the world's leading provider of sustainability services covering the full spectrum of environmental, health and safety, risk, and social consulting issues. ERM has more than 160 offices in over 40 countries and employs over 5,000 specialists representing more than 30 disciplines, including engineering, natural and earth sciences, social sciences, economics, planning, and business management. ERM combines local focus with a global scale, providing a unique platform from which to understand local context and regulatory needs, as well as the unparalleled ability to leverage the best technical expertise around the world. ERM is committed to operating in a socially, ethically, and environmentally responsible way. ERM’s business is underpinned by a number of principles concerning the environment, business, and people. These include conducting business with integrity, and applying ethical principles to ERM’s relationships with clients, employees, suppliers and other stakeholders.
1.5.2 CINSA
Consultores en Ingeniería, S.A. (CINSA) is a Honduran consulting company that began operation on January 22nd, 1968.

ENVIRONMENTAL RESOURCES MANAGEMENT PAA PROJECT FINANCE A/S
1-6
CINSA is a certified company by the Honduran Secretary of State in the Office of Energy, Natural Resources, the Environment and Mining (Secretaría de Energía, Recursos Naturales, Ambiente y Minas or MIAMBIENTE), under Environmental Service Lender certification number. RE-00009-2002. CINSA holds ISO 9001:2008, among other certifications. The company was involved in the development of the environmental impact assessment for the draft 2017 ESIA that was performed as a result of the 2016 and 2017 field surveys undertaken on site, in addition to a preliminary assessment of potentially interested beneficiaries. CINSA was also present during the field survey undertaken in June 2018.
1.5.3 Integra Ingeniería
Integra Ingeniería, S.L. is a Spanish consulting engineering company founded in 1997. The company developed the 2017 technical engineering aspects of the Project. The company has been involved in on-site field work in 2017 and 2018 and has undertaken an identification of Project needs, geological and hydrological analysis, and the design and selection of the irrigation technology solution.
1.6 REPORT STRUCTURE
The report is organised with the following structure:
Executive Summary: presents a non-technical summary of the main findings of the environmental and social impact assessment as well as the environmental and social management plan.
Acronyms: presents the list of acronyms used in this study. Chapter 1 Introduction: presents the objectives of the report, the Project
background information and objectives, its location, and finally the report organisation.
Chapter 2 Legislation and policy: presents the key applicable national legislation and policy framework, the applicable international standards, and the relevant internal policies and standards of the Company.
Chapter 3 Project description and alternatives: presents the Project features and planned activities as well as their associated waste generation and resource use and emissions. It also presents the different parties responsible for each of the Project phases, and their roles. Finally, the different alternatives considered for the Project have been summarised.
Chapter 4 Stakeholder engagement: presents a description of the different stakeholders involved in the Project activities and the consultation activities undertaken.
Chapter 5 Baseline: provides a summary of the environmental and social baseline conditions in the Project Area. This section is based on publicly available data as well as information collected during the 2016, 2017, and 2018 field surveys.

ENVIRONMENTAL RESOURCES MANAGEMENT PAA PROJECT FINANCE A/S
1-7
Chapter 6 Impact assessment method: describes the method and criteria applied for identifying and evaluating impacts, as well as a definition of mitigation and recommended measures. It also presents the impact matrix identifying the potential impacts assessed in Chapters 7 and 8.
Chapter 7 Assessment of environmental and social impacts¡Error! No se encuentra el origen de la referencia.: presents the results of the assessment of the environmental and social potential impacts associated to the Project activities, including the mitigation measures proposed to reduce or enhance any potential negative or positive effects, respectively.
Chapter 8 Environmental and social management plan: presents a summary of the mitigation measures proposed in the previous Chapter and the project commitments made throughout the ESIA, as well as the roles and responsibilities for implementing such commitments.
Chapter 9 References: presents the list of references used in the development of this report.
The following annexes containing supporting information relevant to the ESIA are included: Annex 1: Stakeholder Engagement Plan (SEP) Annex 2: Assessment of potential beneficiaries (2017) Annex 3: May 2018 field survey photo log Annex 4: May 2018 field survey maps Annex 5: Soil and water well profiles Annex 6: Significant flora and fauna Annex 7: List of settlements (aldeas and caseríos) Annex 8: Summary of water balance Annex 9: Critical habitat assessment

ENVIRONMENTAL RESOURCES MANAGEMENT PAA PROJECT FINANCE A/S
2-I
CONTENTS
2 LEGISLATION AND POLICY FRAMEWORK 2-1
2.1 HONDURAN ENVIRONMENTAL AND SOCIAL LEGAL FRAMEWORK 2-12.1.1 Overview 2-12.1.2 Environmental and social regulatory framework 2-12.1.3 Environmental Impact Assessment (EIA) 2-32.1.4 Water resources 2-52.1.5 Climate change 2-72.1.6 Protected areas 2-72.1.7 Flora and fauna 2-82.1.8 Other legal instruments 2-82.1.9 Institutional Framework 2-102.2 INTERNATIONAL AND REFERENCE STANDARDS FOR THE PROJECT 2-122.2.1 International conventions and multilateral agreements 2-122.2.2 WB/IFC Performance standards 2-152.3 PAA PROJECT FINANCE CSR STANDARDS 2-162.3.1 Environment and climate 2-172.3.2 Employees 2-172.3.3 Society 2-182.3.4 External business partners 2-182.3.5 Equality 2-19
LIST OF TABLES
Table 2.1 Environmental regulations applicable to the Project 2-2Table 2.2 References to WB/IFC standards in following section of the study 2-16
LIST OF FIGURES
Figure 2.1 Confirmation received from MIAMBIENTE on environmental licensing requirements 2-4 LIST OF BOXES
Box 2.1 WB/IFC Performance standards 2-15

ENVIRONMENTAL RESOURCES MANAGEMENT PAA PROJECT FINANCE A/S
2-1
2 LEGISLATION AND POLICY FRAMEWORK
This chapter provides a summary of the national environmental and social regulatory framework applicable to planned Project activities, mainly focused on the use of water resources and irrigation activities. As the development of this Project involves funding from lender entities, WB/IFC Performance Standards have also been considered in order to ensure the Project complies with international good practice. In addition, the Project has to meet the Corporate Social Responsibility (CSR) standards of PAA Project Finance A/S. All these standards have been summarised in this chapter. This chapter is therefore structured as follows:
Section 2.1 Honduran environmental and social legal framework: presents the key Honduran environmental and social legislation relevant for the Project activities as well as the institutional framework with an interest or role in the Project.
Section 2.2 International and reference standards for the Project: summarises the international conventions of interest for the Project ratified or signed by Honduras as well the WB/IFC Performance standards.
Section2.3 PAA Project Finance CSR standards: provides an overview of PAA Project Finance A/S internal CSR standards of relevance for the Project.
2.1 HONDURAN ENVIRONMENTAL AND SOCIAL LEGAL FRAMEWORK
2.1.1 Overview
This section presents the legal basis in Honduras of the key environmental and social aspects relevant to the Project activities: environmental licensing requirements, water resources, climate change, flora and fauna, protected areas, as well as other legal instruments relating to the topics addressed throughout the study. It also presents the government departments or national governing bodies and authorities with a role or interest in the Project.
2.1.2 Environmental and social regulatory framework
The legal basis for environmental protection in Honduras is established in General Environmental Law - Decree nº104-93 (Ley General del Medio Ambiente), dated 25th July, 1993. The General Environmental Law sets out the framework for the protection, conservation, restoration, and sustainable management of the environmental and natural resources in Honduras. It

ENVIRONMENTAL RESOURCES MANAGEMENT PAA PROJECT FINANCE A/S
2-2
also establishes the principles for environmental protection, which includes the EIA requirements for the development of certain potentially contaminating and degrading projects. The most important environmental regulations applicable to this Project are summarised in Table 2.1 along with references to the sub-sections of this Chapter where each decree is further explained.
Table 2.1 Environmental regulations applicable to the Project
Decree name Area of relevance Reference section
Environmental Impact Assessment Ministerial agreement nº08-2015 – Regulation of the Environmental Impact National System Law (SINEIA) modified by Ministerial agreement nº7-2016 and nº11-2016
Establishes the procedures and mechanisms of the Regulation of the Environmental Impact National System Law (Sistema Nacional de Evaluación de Impacto Ambiental; SINEIA).
Section 2.1.3
Ministerial agreement nº16-2015 – Environmental Categorisation Table
Establishes the sectors and activities that need to apply for environmental licences as well as the procedures to follow.
Water resources Decree 181-2009 - General Water Act
Establishes the principles and regulations applicable to the proper handling of water resources for its protection, conservation, enhancement, and use.
Section 2.1.4
Water resources
Ministerial agreement nº084-1995 - National Technical Standards for Drinking-Water Quality
Establishes the adequate or maximum standard quality level for drinking water.
Ministerial agreement nº043-2016 Authorises the Secretary of State in the Office of Energy, Natural Resources, the Environment and Mining, through the General Directorate of Water Resources, to be responsible for implementing the policies of the water sector.
Climate change Decree nº297-2013 – Climate Change Act
Establishes the principles and regulations necessary to plan, prevent, and respond appropriately, in a coordinated and sustainable way, to impacts generated by climate change in Honduras.
Section 2.1.5
Flora, fauna and protected areas Decree nº98-2007 – Forestry, Protected areas and Wildlife Law
Establishes the principles for the management of forest resources, protected areas and wildlife, including protection, restoration, use, conservation, and development.
Section ¡Error! No se encuentra el origen de la

ENVIRONMENTAL RESOURCES MANAGEMENT PAA PROJECT FINANCE A/S
2-3
Decree nº159-2005 – Protected area of Honduran Emerald Hummingbird
Declares the Honduran Emerald Hummingbird Protected area, under the category of Habitat Management Area.
referencia. and 2.1.7
Decree nº204-2011 - Honduran Emerald Hummingbird Wildlife Refuge
Declares the Honduran Emerald Hummingbird Wildlife Refuge.
Decree nº32-2014 - Honduran Emerald Hummingbird Wildlife Refuge
Redefines the limits of the Honduran Emerald Hummingbird Wildlife Refuge.
Source: ERM 2018
2.1.3 Environmental Impact Assessment (EIA)
Ministerial Agreement 016-2015, published on 6th October, 2015, contains an Environmental Categorisation used by the governing body establishing the sectors and activities that need to apply for an environmental licence. The procedures to follow are specified in Ministerial Agreement 08-2015, published on 14th September, 2015, which details the Regulation of the Environmental Impact National System (Sistema Nacional de Evaluación de Impacto Ambiental or SINEIA) coordinated by the Secretariat of State in the Office of Energy, Natural Resources, the Environment and Mining (Secretaría de Energía, Recursos Naturales, Ambiente y Minas or MIAMBIENTE). The Project falls under the following environmental categorisations: Sector 01 – Farming; and Sector 10 - Infrastructure, Construction, and Housing. However, Sector 01 refers to specific types of crops that, in the case of the Project, depend on each individual producer. Moreover, in Sector 10 there are no activities listed similar to those that concern the Project with regard to water intake, transport, supply, provision, and utilisation through sprinkler irrigation. As the Project is limited to the delivery and operation of irrigation equipment designed to irrigate up to 10 ha, as well as the delivery of trainings and because of the fact that among the conditions that need to be met by potential beneficiaries, the land plot to be irrigated cannot be located within the limits of any protected area, it does not require environmental licensing. With the aim of assuring the regulation compliance of the Project, an official letter request was sent to MIAMBIENTE, which confirmed the absence of environmental licensing requirements for the Project (see response from MIAMBIENTE presented in Figure 2.1).
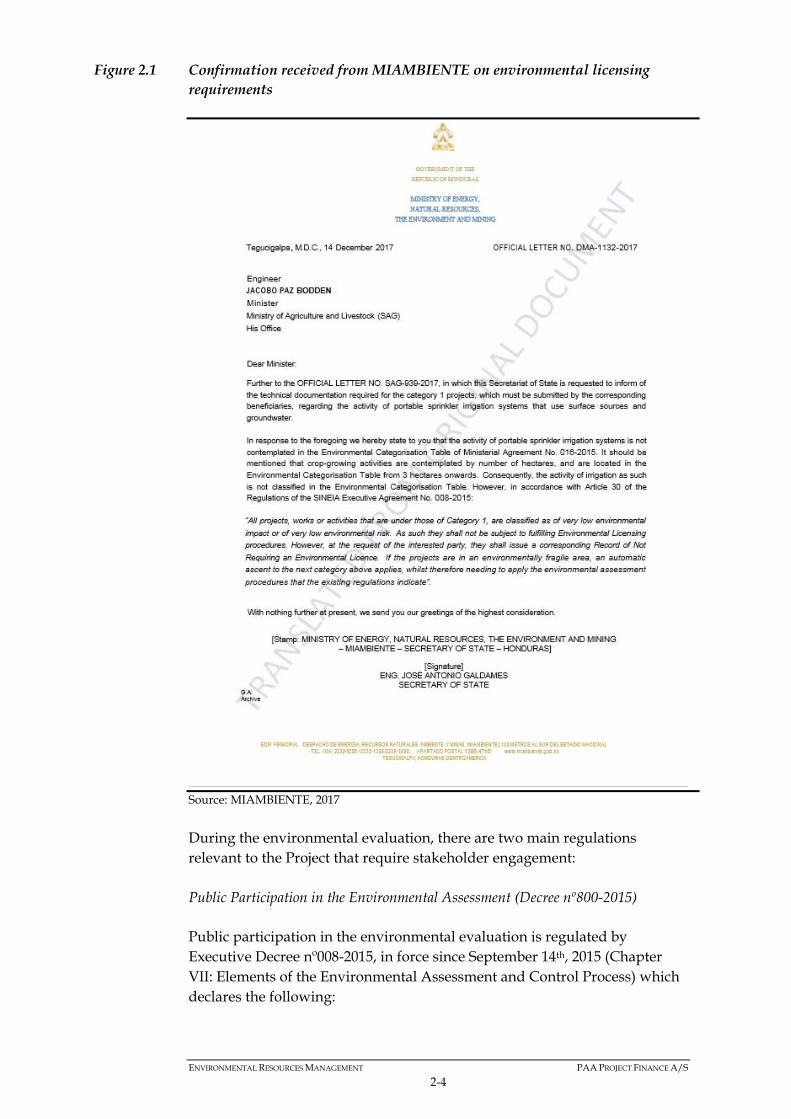
ENVIRONMENTAL RESOURCES MANAGEMENT PAA PROJECT FINANCE A/S
2-4
Figure 2.1 Confirmation received from MIAMBIENTE on environmental licensing requirements
Source: MIAMBIENTE, 2017
During the environmental evaluation, there are two main regulations relevant to the Project that require stakeholder engagement: Public Participation in the Environmental Assessment (Decree nº800-2015) Public participation in the environmental evaluation is regulated by Executive Decree nº008-2015, in force since September 14th, 2015 (Chapter VII: Elements of the Environmental Assessment and Control Process) which declares the following:

ENVIRONMENTAL RESOURCES MANAGEMENT PAA PROJECT FINANCE A/S
2-5
Art. 58: MIAMBIENTE will promote the participation of the general public during the environmental evaluation process, in all its phases, for any projects, work, or activities considered significant from the environmental point of view, according to the Principles of Proportionality and Gradualness.
Art. 59: The proponent of the project, work, or activity subject to environmental assessment, in accordance with the terms of reference established by MIAMBIENTE, must involve the neighbouring population of the project area at the earliest possible stage of the ESIA preparation process.
However, as the Project requires no environmental licensing, no public participation is required. General Water Act (Decree nº181-2009) The General Water Act states that:
Art.3: Citizen participation will be effective in the planning of water management, use, protection, and conservation.
This Act is described in detail in the following subsection.
2.1.4 Water resources
Article 3 of the General Water Act, Decree nº181-2009, in force since December 14th, 2009, declares the principles and foundations of water management. These include the following:
Water is an essential resource for life, as well as social and economic development. Its protection and conservation constitute a priority action of the State.
Human consumption has a preferential and privileged relationship over other uses.
Water is a social resource, and its access will be equitable. Citizen participation will be effective in the planning of its
management, use, protection, and conservation. The comprehensive management of the resource, linked to the water
cycle and the natural environment, will take place with the involvement and responsibility of all Government bodies, their organizations.
Remuneration for services will be linked to the use, protection, and conservation of water.
Art. 10 of the General Environmental Health Regulations classify water according to its use:
for human consumption; for domestic use; for the preservation of flora and fauna; for agricultural and livestock use;

ENVIRONMENTAL RESOURCES MANAGEMENT PAA PROJECT FINANCE A/S
2-6
for industrial use. Article 7 of the General Water Act designates MIAMBIENTE as being responsible for the sectoral handling and management of the water resources. According to the same article, the framework for the management of water resources is organised as follows in hierarchal order:
1. The National Council of Water Resources 2. The Water Authority
a. The National Institute of Water Resources b. Regional Agencies
3. Basin bodies, user bodies, and advisory councils. However, this management structure is not yet in place due to the lack of regulation. The issue of new regulations is planned for the near future. In the meantime, according to Decree nºPCM-043-2016, of 5th September, 2016, MIAMBIENTE is authorised, through its General Directorate of Water Resources, to implement the Water Sector Policies, including responsibility for registering water wells, as well as managing and authorising water contracts. Articles 66, 69 and 70 of the General Water Act specify the permits, licences, and concessions necessary for water use and the procedure for requesting these, under the conditions that the water balance is not affected and drinking water availability is not limited. The use of water resources is regulated by the principles of (Art. 61):
optimal human, social, and economic benefit durability and protection of the resource generation of minimum environmental impacts
Depending on the case, either the municipalities or the Water Authority will deliver this water use authorisation:
Municipalities will grant water use rights through permits and licences in the case (among others) of irrigation systems not exceeding a total of ten (10) hectares, and in the case of agricultural use in farms whose consumption in isolation does not exceed 0.06 litres per second.
The Water Authority (currently MIAMBIENTE through its General Directorate of Water Resources as mentioned previously) will grant rights of use through concession agreements for (among other things) irrigation systems which use infrastructure and irrigation systems of more than ten (10) hectares.
Associated to the use of water, Art. 49 states the existence of “environmental services costs, which are part of the costs that water users must assume and whose sole destination will be for conservation and protection of the water resource in the basin that generates them.”

ENVIRONMENTAL RESOURCES MANAGEMENT PAA PROJECT FINANCE A/S
2-7
According to Art. 52, “any State institution, natural or legal person providing a public water supply service for human or industrial consumption, hydroelectricity, irrigation, tourism or aquaculture, recreational or scenic use, among others, with the aim of compensating for the environmental service of protecting the water resource in the producer basin, sub-basin, or micro-basin, shall incorporate a compensation cost into the established fee structure, so that it is charged to the end user of the environmental service; it is to be provided through the Water Authority, and it shall relate to the estimated value of the water resource according to the quality, quantity, and use variables.”
2.1.5 Climate change
The Climate Change Act, Decree nº297-2013, has been in effect since 2013. It establishes the Inter-institutional Climate Change Committee (Comité Interinstitucional de Cambio Climático or CICC) as a permanent, consultative, deliberative, and advisory body responsible for formulating policies, monitoring, and social control to manage the reduction and prevention of the negative impacts of climate change and mitigate its adverse effects. In the presidency of the Republic, the Presidential Delegation for Climate Change was set up with the aim of formulating and concluding the Water, Forest, and Soil Master Plan at the national level. Within MIAMBIENTE, the National Directorate for Climate Change (Dirección Nacional de Cambio Climático or DNCC), established in Art. 14 of the aforementioned Climate Change Act, acts as the technical entity specialised in adapting and mitigating climate change, through which municipalities and different stakeholders have been trained in recent years.
2.1.6 Protected areas
The legislative framework for protected areas is set out in Decree nº98-2007 – Forestry, Protected areas and Wildlife Law, of 28th February, 2008. This establishes the requirement for preparing and updating management and operating plans for protected areas, as well as undertaking monitoring activities to verify their correct implementation. There are a total of 16 different categories of protected areas management in Honduras that correspond to the IUCN (International Union for Conservation of Nature and Natural Resources) standards. The Institute of Conservation of Forestry, Protected Areas, and Wildlife (Instituto de Conservación Forestal, Áreas Protegidas y Vida Silvestre or ICF) is the entity in charge of managing protected areas. Through the National System of Protected Areas (Sistema Nacional de Areas Protegidas or SPINAPH), created in 1992 under the General Environmental Law - Decree 104-93, and regulated by the Forestry, Protected areas and

ENVIRONMENTAL RESOURCES MANAGEMENT PAA PROJECT FINANCE A/S
2-8
Wildlife Law and Agreement nº921-97, protected areas must be declared and registered. There are a total of 91 protected areas registered in Honduras. There is one protected area within the Project Area: the Honduran Emerald Hummingbird Wildlife Refuge (Refugio de Vida Silvestre Colibrí Esmeralda Hondureño or RVSCEH ) (declared as such in Decree nº204-2011 of May 2011, and amended by Decree nº32-2014, which defines the revised limits of the area). This refuge consists of a series of isolated plots of different sizes, on which a dry tropical forest grows. This habitat in Honduras first received the designation of protected area through Decree nº159-2005.
2.1.7 Flora and fauna
The legislative framework for wild flora and fauna in protected areas is set out in Decree nº98-2007 – Forestry, Protected areas, and Wildlife Law. The ICF is the entity in charge of the protection, management, and administration of wildlife in the country. Decree nº98-2007 establishes that any endangered flora species will be managed as per ICF policies and strategies aligned with the international conventions the country has ratified (i.e., IUCN and CITES (Convention on International Trade in Endangered Species of Wild Fauna and Flora). According to the lists of species of flora and fauna of special concern in Honduras, developed by Honduran national institutions (SERNA, now MIAMBIENTE, and the General Directorate of Biodiversity), there are a total of 253 plant and 387 animal species of special concern. These include endemic fauna and flora, of national concern due to the ecological/economical value the species represent, as well as those included in IUCN and in CITES.
2.1.8 Other legal instruments
Below is a summary of other regulations in Honduras that are relevant to the project and which complement the aforementioned regulations. Pesticides and related substances
The legal framework for pesticides and related substances in Honduras is essentially expressed in the following instruments:
Regulation on the Registration, Use and Control of Pesticides and Related Substances, Agreement nº 642-98: this standard is the basis for regulating pesticides in the country. It establishes the general principles and procedures regulating the registration, use, and control of formulated synthetic pesticides, technical-grade active ingredients, processing aids, and related substances for agricultural use. After sufficient scientific data has been evaluated to demonstrate that a product is effective for the purpose intended and does not represent an unacceptable risk to health and the environment, when

ENVIRONMENTAL RESOURCES MANAGEMENT PAA PROJECT FINANCE A/S
2-9
used in accordance with recommendations for use, the sale and use of the evaluated substance can be approved.
Central American Technical Regulation RTCA 65.03.44: 07 - Pesticides for domestic and professional use, of June 13th 2011: establishes the requirements for registering pesticides for domestic and professional use.
Phytozoosanitary Act, Decree nº 157-94: revokes the Plant Health Law, Decree nº23 (17612), of February 24th, 1962. It aims to ensure the protection and health of plants and animals, and the conservation of their products and by-products, against the harmful action of pests and diseases of economic, quarantine, and human importance.
The National Service for Agro-food Health and Safety (Servicio Nacional de Sanidad e Inocuidad Agroalimentaria o SENASA) is, through the Pesticide Control and Use Department (DCUP), in charge of regulating and controlling the registration, manufacture, formulation, import, export, reshipment, distribution, sale, application, storage, management, and proper use of pesticides, fertilizers, and related substances. Solid Waste Management
Regulation of the integral management of solid waste (Executive Agreement nº 1567-2010, dated October 1st, 2010): regulates the integral management of solid wastes, including the prevention, reduction, storage and conditioning, transportation, treatment, and final disposal of waste, encouraging the use of these operations in order to avoid risks to health and the environment.
Air emissions
Regulation of Emissions of Pollutant Gases and Smoke of Motor Vehicles (January 13th, 2000): states the maximum permissible levels for emissions of polluting gases and smoke and preventive measures, infractions, and sanctions.
Land property
Property Law, Decree nº82/04: strengthens and grants legal security to owners of property, developing and executing a national policy that allows foreign national investment and access to property by all sectors of society.
Resolution of the Property Law nº3/10: develops the principles, objectives, and provisions of the aforementioned Property Law in order to facilitate its application and achieve compliance.
Cultural Heritage Protection
Protection of Cultural Heritage Law, Decree nº220-97 (1997): aimed at defending, conserving, protecting, rescuing, and transmitting to

ENVIRONMENTAL RESOURCES MANAGEMENT PAA PROJECT FINANCE A/S
2-10
future generations the goods that constitute the Cultural Heritage of the Nation throughout the national territory and in jurisdictional waters.
Risk Management
National Risk Management System Law: creates the National Risk Management System (SINAGER), establishing the Honduran legal framework that will help the country develop the capacity to prevent and reduce the risks of potential disasters, as well as prepare, respond, and recover from real damage caused by natural phenomena or by those generated by human activities.
Regulation of the National Risk Management System (SINAGER) Law, Agreement nº032-2010: establishes the framework needed to assure the effectiveness and application of the above-mentioned National Risk Management System Law.
Labour
The labour legal framework in Honduras is essentially expressed in through following instruments:
Labour Code, Decree nº189-1959: regulates the relationship between capital and labour, according to a base of social justice that guarantees workers the conditions necessary to carry out a normal life, in addition to equitable compensation for the investment.
Agreement nºSTSS-053-04 modifying the General Regulation for the Prevention of Work-related Accidents and Occupational Diseases: reforms numerous articles of the aforementioned regulation regarding employer and worker obligations, training, composition, operation and functions of the Joint Health and Safety Commissions, the functions of the Occupational Safety Delegate, occupational health and safety programmes for preventing occupational hazards that should be provided by public and private employers, contractors and subcontractors, among other subjects.
Code of Childhood and Adolescence, Decree nº73-96: enshrines the fundamental rights and freedoms of children; establishes and regulates the prevention and protection regime that the State guarantees to ensure their integral development, as well as creating the necessary bodies and procedures for offering them the necessary protection; facilitates and guarantees their access to justice; and defines the principles that should guide national policies relating to children.
2.1.9 Institutional Framework
The main government departments, national authorities, or organisations engaged in environmental and social governance in Honduras and that have a specific role or interest in the Project are described below:
ENVIRONMENTAL RESOURCES MANAGEMENT PAA PROJECT FINANCE A/S
2-11
Ministry of Agriculture and Livestock (SAG)
The Ministry of Agriculture and Livestock (Secretaría de Agricultura y Ganadería or SAG) was created by Decree n° 218-96, in accordance with the sectoral framework established by the Law for the Modernization and Development of the Agricultural Sector and the 2002-2006 Government Plan. It is responsible for coordinating the planning and execution of public sector agriculture policies. The ministry integrates various directorates, including:
SAG – SENASA: National Service for Agro-food Health and Safety (Servicio Nacional de Sanidad e Inocuidad Agroalimentaria)
SAG – DICTA: Directorate of Agricultural Science and Technology (Dirección de Ciencia y Tecnología Agropecuaria)
SAG – DIGEPESCA: Directorate of Fisheries and Aquaculture (Dirección General de Pesca y Acuicultura)
SAG- DGRD: Directorate of Irrigation and Drainage (Dirección General de Riego y Drenaje)
SAG – PRONADER: National Programme of Sustainable Rural Development (Programa Nacional de Desarrollo Rural Sostenible)
SAG – UPEG: Planning and Evaluation Management Unit (Unidad de Planeamiento y Evaluación de la Gestión)
The Aguan Irrigation Project is a SAG initiative. The SAG-PIU will be in charge of implementing the Project through a Project Implementation Unit – PIU (Unidad Ejecutora del Proyecto or UEP). The SAG-PIU will comprise members of the SAG. Secretary of State in the Office of Energy, Natural Resources, the Environment and Mining (MIAMBIENTE)
In 1993, with the promulgation of the General Environmental Law - Decree nº104-93, the Secretary of State in the Environment Office (Secretaría de Estado en el Despacho del Ambiente - SEDA) was created. In 1996, through Legislative Decree nº218-96, SEDA was replaced by the Secretary of Natural Resources and Environment (SERNA). In 2014, through Executive Decree PCM 042-2014, the National Institute of Forest Conservation and Development, Protected Areas and Wildlife (IFC) and the Honduran Institute of Geology and Mines (INHGEOMIN) were attached to the Secretary of State for Energy, Natural Resources, Environment and Mines (Secretaría de Estado de Energía, Recursos Naturales, Ambiente y Minas), renamed MIAMBIENTE. MIAMBIENTE is in charge of the public and private coordination of environmental matters including water resources, renewable energy, climate change, hydrocarbons, environmental management, fauna and flora, and protected areas. It is also responsible for the Environmental Impact Assessment process in Honduras through the Regulation of the Environmental Impact National
ENVIRONMENTAL RESOURCES MANAGEMENT PAA PROJECT FINANCE A/S
2-12
System (SINEIA). It issues the Environmental Licenses required for certain Project categories. In addition, since 2016, MI AMBIENTE, through its General Directorate of Water Resources, has been the competent entity, according to Decree nº PCM-043-2016, for executing water sector policies, including registering water wells, receiving requests for water usage rights, and authorising these rights. As such, for this Project MIAMBIENTE was first consulted regarding the overall Project compliance requirements, and will subsequently be consulted on water use permitting and environmental licensing issues, as part of the beneficiaries’ responsibilities will be to obtain the necessary permits:
the environmental licence for the type of crop they wish to farm; a request for water usage rights; and a permit for exploring and exploiting groundwater.
National Institute of Conservation and Development of Forestry, Protected Areas and Wildlife (ICF)
The National Institute of Conservation and Development of Forestry, Protected Areas and Wildlife (Instituto Nacional de Conservaci6n y Desarrollo Forestal, de Áreas Protegidas y Vida Silvestre or ICF) is integrated within MIAMBIENTE according to Decree nº PCM 042-2014. The ICF is in charge of managing the protected areas in Honduras under the National System of Protected Areas of Honduras (Sistema Nacional de Áreas Protegidas de Honduras or SINAPH).
In this Project, IFC as well as the Research Association for Ecological and Socioeconomic Development (Asociación de Investigación para el Desarrollo Ecológico y Socioeconómico or ASIDE) have been consulted regarding the management of protected areas, and specifically the Honduran Emerald Hummingbird Wildlife Refuge.
2.2 INTERNATIONAL AND REFERENCE STANDARDS FOR THE PROJECT
2.2.1 International conventions and multilateral agreements
With respect to environmental and social protection relevant to the Project, Honduras has ratified a number of international agreements. Those relevant to climate change, local content, and indigenous peoples are listed below. With respect to climate change and biodiversity, which constitutes a relevant part of the Project rational, Honduras has ratified the following agreements:
ENVIRONMENTAL RESOURCES MANAGEMENT PAA PROJECT FINANCE A/S
2-13
The RAMSAR wetlands Convention of 1971, ratified on 23rd October, 1993;
The Convention on biological diversity, ratified by Honduras on 21st February, 1995;
The Convention to combat desertification, ratified on 23rd June, 1997 The Central American Convention for the protection of the
environment, ratified on April 3rd, 1990. The Paris agreement on Climate Change, ratified on 21st September,
2016. The Kyoto Protocol (Kyoto, 1998); ratified on 19th July, 2000. In 2014,
Honduras accepted the Doha amendment to the Kyoto Protocol. United Nations Framework Convention on Climate Change (New
York, 1992); ratified on 19th October, 1995. Vienna Convention on the Protection of the Ozone Layer (Vienna,
1985); ratified on 20th September, 1979. Montreal Protocol on Substances that Deplete the Ozone Layer
(Montréal, 1989); ratified on 14th October, 1993; and, in 2002, the Copenhagen Amendments.
The United Nations Conference on Environment and Development (UNCED), ratified in June 1992.
CITES (the Convention on International Trade in Endangered Species of Wild Fauna and Flora), ratified in September 1979.
Convention on the Conservation of Migratory Species of wild animals (CMS), of which Honduras has been a member since 2007.
In addition, with respect to local content regulations, in 2005 Honduras joined the International Convention of the United Nations on the Protection of the Rights of All Migrant Workers and their Families, in addition to being a member of the International Labour Organisation (ILO), and ratified 26 conventions of the ILO including:
ILO Convention No. 87 on Freedom of Association and Protection of the Right to Organize,
ILO Convention No. 98 on the Right to Organize and Collective Bargaining,
ILO Convention No. 29 on Forced Labour, ILO Convention No. 105 on the Abolition of Forced Labour, ILO Convention No. 138 on the Minimum Age (of Employment), ILO Convention No. 182 on the Worst Forms of Child Labour, ILO Convention No. 100 on Equal Pay, ILO Convention No. 111 on Discrimination (Employment and
Occupation) With respect to the protection of indigenous peoples, Honduras has ratified the ILO Convention No. 169 on Indigenous and Tribal Peoples in Independent Countries (1989) and voted in favour of the 2007 Declaration of the United Nations on the Rights of Indigenous Peoples.

ENVIRONMENTAL RESOURCES MANAGEMENT PAA PROJECT FINANCE A/S
2-14
It is worth mentioning that the IUCN Red List of Threatened Species™ provides taxonomic, conservation status and distribution information on plants, fungi, and animals that have been globally evaluated using the IUCN Red List Categories and Criteria. This system is designed to determine the relative risk of extinction, and the main purpose of the IUCN Red List is to catalogue and highlight those plants and animals that are facing a higher risk of global extinction, i.e., listed as Critically Endangered (CR), Endangered (EN), or Vulnerable (VU). Species in these three categories are regarded as ‘threatened’ and are therefore subject to special conservation attention. In addition, CITES has created an international legal framework for the prevention of trade, which includes the following annexes:
Annex I: lists species threatened with extinction and for which the trade in wild-caught specimens is illegal.
Annex II: lists species for which trade must be controlled to avoid endangering the species.
Annex III: list species for which one country has asked other CITES parties for assistance in controlling the trade. Species locally at risk. Trade only permitted with export permit and certificate of origin.
As an environmental treaty under the aegis of the United Nations Environment Programme, the CMS provides a global platform for the conservation and sustainable use of migratory animals and their habitats. The CMS brings together the States through which migratory animals pass, the Range States, and lays the legal foundation for internationally coordinated conservation measures throughout a migratory range. These appendices list migratory species to which the Convention applies. The text of the Convention defines the basic obligations of the Contracting Parties towards species listed in Appendix I and Appendix II. These obligations are quite distinct for the two Appendices, and a migratory species can be listed in both Appendices at the same time, if the circumstances so warrant.
Appendix I – Endangered migratory species Appendix I comprises migratory species that have been assessed
as being in danger of extinction throughout all or a significant portion of their range.
Appendix II - Migratory species conserved through Agreements Appendix II covers migratory species that have an unfavourable
conservation status and that require international agreements for their conservation and management, as well as those that have a conservation status which would significantly benefit from the international cooperation that could be achieved by an international agreement.

ENVIRONMENTAL RESOURCES MANAGEMENT PAA PROJECT FINANCE A/S
2-15
2.2.2 WB/IFC Performance standards
The IFC, a division of the World Bank Group that lends to private investors, has released a Sustainability Policy and set of Performance Standards on Social and Environmental Sustainability (January 2012). These standards can be used either to evaluate a project seeking funding through the IFC, or as a benchmark of international good practice for projects that do not expect to seek financing from the IFC. For this Project, financing is sought from international financial institutions (IFI), in this case Denmark’s Export Credit Agency, EKF. Many IFIs require the project to meet international standards of management and environmental and social performance. The international standards most widely used by the IFIs are the WB/IFC environmental and social performance standards. Performance Standards provide guidance on how to identify risks and impacts, and are designed to help avoid, mitigate, and manage risks and impacts as a way of doing business in a sustainable way, including stakeholder engagement and disclosure obligations of the client in relation to project-level activities. The WB/IFC Performance Standards are outlined in Performance Standards:
Box 2.1.
Box 2.1 WB/IFC Performance standards
In the case of direct IFC investments (including project and corporate finance provided through financial intermediaries), the IFC requires its clients to apply the Performance Standards to manage environmental and social risks and impacts in order to enhance development opportunities (IFC, 2012). The IFC Performance Standards are outlined in Table 2.2. Of the eight Performance standards, neither PS5 nor PS7 are applicable in this case as no land acquisition activities will be undertaken as a result of Project activities, and there are no indigenous communities or lands affected by the Project.
PS 1: Assessment and Management of Environmental and Social Risks and Impacts. PS 2. Labour and Working Conditions PS 3. Resources Efficiency and Pollution Prevention PS 4. Community, Health, Safety, and Security PS 5. Land Acquisition and Involuntary Resettlement PS 6. Biodiversity Conservation and Sustainable Management of Living Natural
Resources PS 7. Indigenous Peoples PS 8. Cultural Heritage
Performance Standards: PS 1: Assessment and Management of Environmental and Social Risks and Impacts. PS 2. Labour and Working Conditions PS 3. Resources Efficiency and Pollution Prevention PS 4. Community, Health, Safety, and Security PS 5. Land Acquisition and Involuntary Resettlement PS 6. Biodiversity Conservation and Sustainable Management of Living Natural
Resources PS 7. Indigenous Peoples PS 8. Cultural Heritage

ENVIRONMENTAL RESOURCES MANAGEMENT PAA PROJECT FINANCE A/S
2-16
Table 2.2 References to WB/IFC standards in following section of the study
PS Performance Standard
1
Assessment and Management of Environmental and Social Risks and Impacts.
Underscores the importance of managing environmental and social performance throughout the life of a project (any business activity that is subject to assessment and management).
2 Labour and Working Conditions
Recognises that the pursuit of economic growth through employment creation and income generation should be accompanied by the protection of the fundamental rights of workers.
3 Resources Efficiency and Pollution Prevention
Recognises that increased economic activity and urbanisation often generate increased levels of pollution to air, water, and land, and consume finite resources in a manner that may threaten people and the environment at the local, regional, and global levels.
4 Community, Health, Safety and Security
Recognises that project activities, equipment, and infrastructure can increase community exposure to risks and impacts.
5 Land acquisition and involuntary resettlement
Recognises that project-related land acquisition and restrictions on land use can have adverse impacts on communities and persons that use this land.
Not applicable to the Project as no land acquisition activities will be undertaken as a result of Project activities.
6
Biodiversity Conservation and Sustainable Management of Living Natural Resources
Recognises that protecting and conserving biodiversity, maintaining ecosystems services, and sustainably managing living and natural resources are fundamental to sustainable development
7 Indigenous peoples
Recognises that indigenous peoples (IPs) may be particularly vulnerable to the adverse impacts associated with project development, including risk of impoverishment and loss of identity, culture, and natural resource-based livelihoods.
Not applicable as there are no indigenous people or lands affected by the Project.
8 Cultural Heritage Recognises the importance of cultural heritage for current and future generations
2.3 PAA PROJECT FINANCE CSR STANDARDS
In 2007, The Aarsleff Group acquired PAA Project Finance (formerly called EAC Trading) as a fully owned subsidiary. PAA Project Finance services are rendered internally within the Aarsleff Group as well as to customers and partners in a global environment.
ENVIRONMENTAL RESOURCES MANAGEMENT PAA PROJECT FINANCE A/S
2-17
For this reason, PAA Project Finance policies and corporate social responsibility standards comply with those of the Aarsleff Group. In addition, PAA Project Finance applies OHSAS 18001 – Occupational health and safety management standards, DS/ISO 9001 – Quality management standards, and DS/ISO 14001 – Environmental management standards whenever these are relevant to their services and customers. The Aarsleff Group currently works on identifying the CSR matters that are most important to the Group and its stakeholders. The Group takes responsibility for its business activities and wants to ensure positive and clear coherence between the activities of the Group and a sustainable society. The four main strategic areas of the Group are:
2.3.1 Environment and climate
The Aarsleff Group has incorporated a number of policies, principles and working methods to protect the environment on a short- and long-term basis. One of the relevant policies is the environmental policy, which describes the Group’s awareness of their influence on the environment and how it works to protect it and prevent pollution. The Aarsleff Group is committed to minimising their environmental impact through planning, design, and choice of method. The Group measures significant environmental parameters and seeks to minimise waste and excessive consumption of materials. The environmental policy covers issues such as fuel efficiency, energy-saving measures, and purchasing products from environmentally friendly companies. Furthermore, the Aarsleff Group’s quality, environment and occupational health and safety management system (QE&OHS) provides guidelines for environmentally responsible actions and operating procedures.
2.3.2 Employees
The Aarsleff Group has been certified in occupational health and safety since 2009. To achieve its goals, it has developed a number of policies, principles and working methods all incorporated into everyday work routines. The Group’s occupational health and safety policy shows that it wants to offer attractive workplaces with a focus on occupational health and safety, job satisfaction, and lifelong development. The Aarsleff Group has already incorporated OHS aspects in the design phase and method selection; prioritising order, tidiness, and a systematic

ENVIRONMENTAL RESOURCES MANAGEMENT PAA PROJECT FINANCE A/S
2-18
fitting out of the workplaces; and the Group continuously improves its occupational health and safety measures. Aarsleff’s One Company approach and Code of Conduct are the cornerstones for its code of good management. The OHS policy states that the Group wants a sound and stimulating working environment that enhances job satisfaction.
2.3.3 Society
The Aarsleff Group wishes to contribute to a sound, democratic, and competitive development of society. The Group aspires to comply with applicable competition legislation and oppose all types of corruption, including blackmail and bribery. It has developed a guideline for compliance with competition legislation providing information on the prohibition of agreements or the exchange of information that coordinates tenders or splits up markets or customers. As stated in its policy on respect for human rights, the Aarsleff Group wishes to avoid negative impacts on human rights, and it actively manages any negative impacts it may have caused or contributed to. The Group’s approach is based on the UN Guiding Principles for Business and Human Rights. Actively entering into applicable collective agreements is a fundamental principle of the Aarsleff Group, and it does everything possible to counteract social dumping.
2.3.4 External business partners
As stated in the Aarsleff Group quality policy, it complies with legislation, rules and agreements entered into, and customer satisfaction is an important quality parameter. It is committed to engaging in professional collaboration, making customer satisfaction a high priority. Planning and preparation are essential to the Group, and it continuously seeks to improve through systematic control. In addition it deliberately seeks to cultivate a culture of improvement that allows experience and creativity to be communicated and applied. The Aarsleff Group has defined a set of principles applying to “Activities with customers and business partners” that provides specific rules concerning gifts, lunches, dinners, study trips, and training courses. Actively creating collaborations and good stakeholder relations on projects is a fundamental principle of the Aarsleff Group, as this benefits project implementation and increases stakeholder satisfaction.

ENVIRONMENTAL RESOURCES MANAGEMENT PAA PROJECT FINANCE A/S
2-19
2.3.5 Equality
Aarsleff Group believes that equality helps generate better results, wiser decisions, increased innovation ability, an improved internal working environment, and make the Group an attractive employer.

ENVIRONMENTAL RESOURCES MANAGEMENT PAA PROJECT FINANCE A/S
3-i
CONTENTS
3 PROJECT DESCRIPTION AND ALTERNATIVES 3-1
3.1 INTRODUCTION 3-1 3.2 PROJECT LOCATION 3-1 3.3 PROJECT ORGANISATION AND MANAGEMENT 3-4 3.4 PROJECT BENEFICIARIES 3-7 3.4.1 Selection criteria of beneficiaries 3-7 3.4.2 Responsibilities of selected beneficiaries 3-11 3.5 IRRIGATION SYSTEM IMPLEMENTATION 3-15 3.5.1 Project irrigation equipment 3-15 3.5.2 Irrigation process 3-17 3.5.3 Roles and responsibilities of the irrigation system 3-21 3.6 PROJECT PHASES AND ACTIVITIES 3-24 3.6.1 Pre-operation 3-26 3.6.2 Operation Phase 3-27 3.6.3 Abandonment 3-29 3.7 PROJECT ALTERNATIVES 3-29 3.7.1 Alternative no-project 3-30 3.7.2 Irrigation method 3-31 3.7.3 Sprinkler irrigation system 3-31
LIST OF TABLES
Table 3.1 Responsibilities of the selected beneficiaries 3-12 Table 3.2 Factors conditioning the irrigation method 3-31
LIST OF FIGURES
Figure 3.1 Location of the Project Area 3-3 Figure 3.2 Project organization and management 3-6 Figure 3.3 Distribution of potential beneficiaries (as per November 2017 assessment) 3-10 Figure 3.4 Project irrigation equipment 3-16 Figure 3.5 Water Well Design 3-18 Figure 3.6 Irrigation process 3-20 Figure 3.7 Components of the irrigation system and responsibilities 3-23 Figure 3.8 Project activities for each Project phase 3-25 Figure 3.9 Alternatives considered for the Project design 3-30 Figure 3.10 Effects of the two alternatives 3-30 Figure 3.11 Classification of sprinkler irrigation systems 3-32 Figure 3.12 Hose irrigator system 3-32

ENVIRONMENTAL RESOURCES MANAGEMENT PAA PROJECT FINANCE A/S
3-1
3 PROJECT DESCRIPTION AND ALTERNATIVES
3.1 INTRODUCTION
The Project consists of establishing an irrigation system for 3,110 hectares of agricultural land located in the Alto Aguan River Valley in the Olanchito and El Arenal municipalities, in the Yoro department in Honduras. By establishing individual irrigation systems, the Project, designed by the engineering company Integra Ingeniería and managed by PAA Project Finance, aims to support the Secretary of Agriculture and Livestock of Honduras (Secretaría de Agricultura y Ganadería or SAG), owner of the Project, to improve the socioeconomic status of the population in the Alto Aguan River Valley.
The Project activities under the direct responsibility of PAA Project Finance, include the delivery of irrigation equipment and its accessories, as well as providing training on in its use, maintenance and other relevant aspects to SAG representatives/trainers. These activities will be implemented exclusively during the pre-operation phase of the Project. It is important to note that PAA Project Finance assumes no responsibility for assigning irrigation systems to beneficiaries nor the subsequent use and maintenance of these systems (activities that will take place during the Operation and Abandonment phases). The SAG, through the Project Implementation Unit – PIU (Unidad Ejecutora de Proyecto or UEP), will assume responsibility for establishing the Project (Pre-operation phase), while the SAG will directly manage and supervise the subsequent phases. A detailed account of the roles and responsibilities in the Project is presented in Section 3.3 below. This chapter presents the Project organisation and features, and outlines the various Project phases (pre-operation, operation, and abandonment) to be undertaken, including the roles and responsibilities involved in Project implementation and management. A summary of the different Project alternatives assessed is also presented.
3.2 PROJECT LOCATION
The Project is located within the Yoro department, within the Olanchito and El Arenal municipalities. A small portion of the potential areas to be irrigated touch the Jocón and Sabá municipalities. The 3,110 ha to be irrigated are distributed over an area of 60,000 ha which coincides with the Alto Aguan River Valley area, and represents approximately 5.2 % of the total area of the Alto Aguan River Valley. The

ENVIRONMENTAL RESOURCES MANAGEMENT PAA PROJECT FINANCE A/S
3-2
specific locations of the plots to be irrigated will be defined only once the beneficiaries have been selected; the overall perimeter of the 60,000 ha that encompasses the maximum total area where the irrigation system may be implementation has been assumed as the Project Area (see Section 3.4 for details on the beneficiary selection process). Figure 3.1 shows the location of the Project Area.

ENVIRONMENTAL RESOURCES MANAGEMENT PAA PROJECT FINANCE A/S
3-3
Figure 3.1 Location of the Project Area
Source: ERM, 2018

ENVIRONMENTAL RESOURCES MANAGEMENT PAA PROJECT FINANCE A/S
3-4
3.3 PROJECT ORGANISATION AND MANAGEMENT
The Project is an initiative of the Secretary of Agriculture and Livestock of Honduras (Secretaría de Agricultura y Ganadería or SAG) ascribed to the Honduran Government. As such, the SAG is the owner of the Project. In order to deploy the Alto Agua Irrigation Project (the Project), the SAG plans to designate a Project Implementation Unit – PIU (Unidad Ejecutora del Proyecto or UEP), which will be in charge of implementing the Project during the pre-operation phase. After the establishing the Project, the SAG will supervise the irrigation operations throughout the Project lifetime. The PIU will be formed exclusively by members of the SAG. The Government of Honduras, through the SAG, has awarded PAA Project Finance the contract for providing individual irrigation equipment for irrigating independent plots in the Alto Aguan River Valley. The engineering company Integra Ingeniería, managed by PAA Project Finance, has designed the irrigation system in close collaboration with SAG technicians and representatives of the local milk producers and farmers. The irrigation sets to be delivered to individual farmers consist of a combination of equipment pieces, diesel motor pump or a diesel fuelled generator together with a submersible pump, and each with two easy-to-handle travelling hose irrigators or micro-sprinkles, a set of pipelines, and associated accessories. Each irrigation system is designed to irrigate up to 10 ha of land. It is planned that a total of 311 irrigation sets will be supplied for the Project. which will be divided per set combination as follows: • 95 units of surface diesel motor pump and two hose reel irrigators and metal pipelines • 155 units with diesel fuelled generator + submersible pump and two
travelling hose irrigators and metal pipelines • 26 units of surface diesel motor pump, micro-sprinklers and PVC pipelines • 35 units with diesel fuelled generator + submersible pump, micro-
sprinklers and PVC pipelines The irrigation systems will go to selected livestock and milk producers as well as farmers in the Alto Aguan River Valley. These will be chosen from among the approximately 400 milk producers and farmers present in the Project Area. They will be able to apply to become beneficiaries of the Project provided they meet the criteria set by the SAG and PAA Project Finance (details on the potential beneficiaries and the preliminary selection criteria they must meet are provided in Section 3.4). This selection process will be undertaken by the PIU of the SAG. It is envisaged that the Project could benefit between 250 and 300 beneficiaries in the area. Farmers will be able to apply for more than one irrigation set depending on land availability and resources. In addition to complying with the strict selection criteria set, beneficiaries will have to pay a fee (canon) to receive the irrigation equipment and accept the responsibilities acquired when

ENVIRONMENTAL RESOURCES MANAGEMENT PAA PROJECT FINANCE A/S
3-5
becoming a beneficiary of the Agua Irrigation Project (more details on beneficiary responsibilities are presented in detail in Section 3.4). The fee or canon will be established by the SAG based on socioeconomic criteria and a series of to-be-defined Project variables. To date (September 2018), these have not yet been established by the SAG. Their purpose is to ensure the long-term viability of the Project and the correct use of the equipment received. The fees collected will be used for the Project (e.g., for training purposes and supervision activities). Figure 3.2, below, illustrates the parties involved in the implementation and management of the Project. The complete list of identified stakeholders involved in the Project and their role in the Project organisation is provided in Chapter ¡Error! No se encuentra el origen de la referencia. ¡Error! No se encuentra el origen de la referencia. and Annex A Stakeholder Engagement Plan (SEP).

ENVIRONMENTAL RESOURCES MANAGEMENT PAA PROJECT FINANCE A/S
3-6
Figure 3.2 Project organization and management
Source: ERM, 2018

ENVIRONMENTAL RESOURCES MANAGEMENT PAA PROJECT FINANCE A/S
3-7
3.4 PROJECT BENEFICIARIES
The potential Project beneficiaries are milk producers and farmers who are either independent farmers or members of a locally organized collective, such as a milk collection centre (Centro de Recolección y Enfriamiento de Leche or CREL), the Olanchito society of farmers and stockbreeders (Sociedad de Agricultores y Ganaderos de Olanchito or SAGO), or the Honduran federation of farmers and stockbreeders (Federación Nacional de Agricultores y Ganaderos de Honduras or FENAGH). The majority1 of the producers in the Project Area are members of a CREL, a common interest association. There are currently 16 CRELs in the Project Area. It was, however, reported during the June 2018 field survey that two new CRELs are being established. Each CREL has on average 30-50 members (see Section 5.5.9 in Chapter 5). It is estimated that the number of milk producers and farmers in the Project Area, and thus potential beneficiaries, is between 350 and 400. Of these approximately 48% are considered small producers (less than 40 ha of land) while 33% are categorized as medium size (40-80 ha of land). Only a small portion of the total potential beneficiaries have a landholding of more than 80 ha (see Section 5.5.9 in Chapter 5 for more details on potential beneficiaries).
3.4.1 Selection criteria of beneficiaries
During the project promotion stage where the first stakeholder engagement activities were undertaken in 2017, a conference was held at the SAGO offices to explain to members of the CRELs and SAGO the Project benefits and the beneficiary selection criteria (see Chapter 4 for detailed account of engagement to date). The selection criteria that was shared with potential beneficiaries was established by the SAG and PAA Project. The Project eligibility conditions that must be met are:
the beneficiary must be the owner of the land plot to be irrigated; the land plot to be irrigated must not be located within the limits of
any protected area; the land plot must not be situated within natural habitats such as
shrubland or forest; there must be available water, either surface water or groundwater; the land must be flat; and the land plot must not be located on indigenous land.2
1 Based on the field survey activities undertaken in 2017 and in 2018, it has been estimated that between 85% and 90% of the milk producers and farmers in the Project Area are members of a CREL.
2 It has been confirmed by the Project that there is no indigenous land within the Project Area. However it was felt necessary to reinforce to potential beneficiaries the message that respecting indigenous rights was important to the Project.
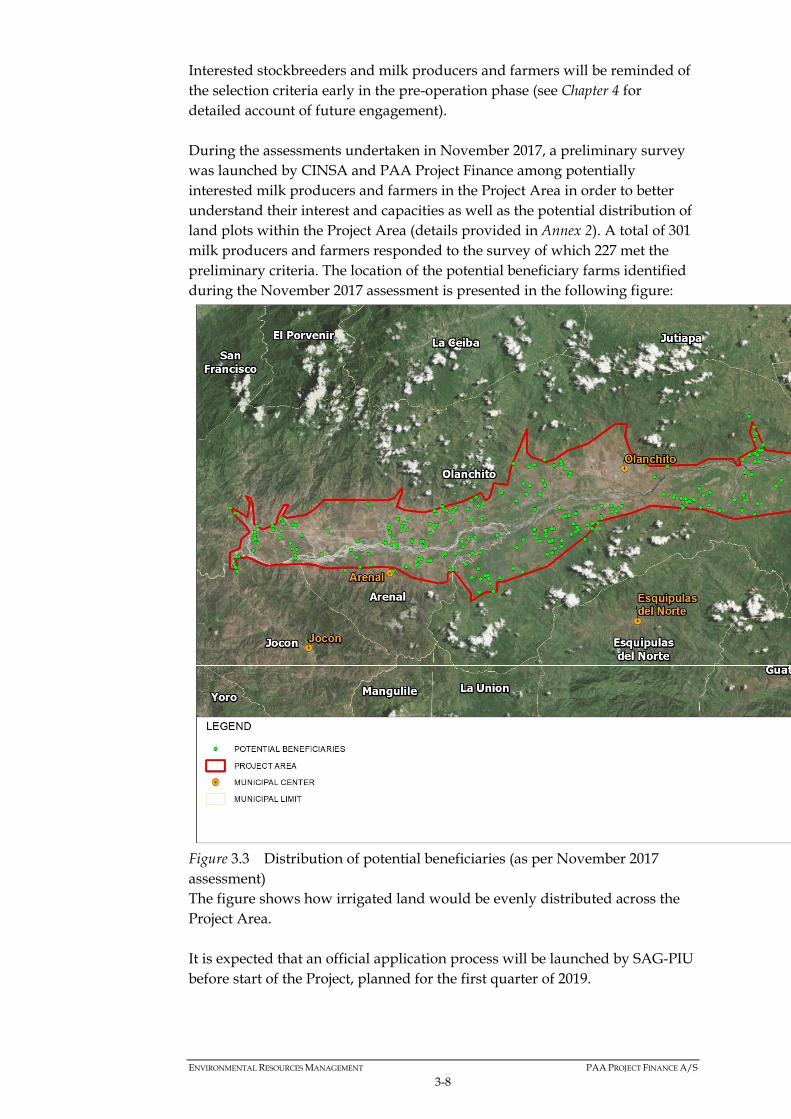
ENVIRONMENTAL RESOURCES MANAGEMENT PAA PROJECT FINANCE A/S
3-8
Interested stockbreeders and milk producers and farmers will be reminded of the selection criteria early in the pre-operation phase (see Chapter 4 for detailed account of future engagement). During the assessments undertaken in November 2017, a preliminary survey was launched by CINSA and PAA Project Finance among potentially interested milk producers and farmers in the Project Area in order to better understand their interest and capacities as well as the potential distribution of land plots within the Project Area (details provided in Annex 2). A total of 301 milk producers and farmers responded to the survey of which 227 met the preliminary criteria. The location of the potential beneficiary farms identified during the November 2017 assessment is presented in the following figure:
Figure 3.3 Distribution of potential beneficiaries (as per November 2017 assessment) The figure shows how irrigated land would be evenly distributed across the Project Area. It is expected that an official application process will be launched by SAG-PIU before start of the Project, planned for the first quarter of 2019.

ENVIRONMENTAL RESOURCES MANAGEMENT PAA PROJECT FINANCE A/S
3-9
The final list of potential beneficiaries will depend on the ultimate conditions that the beneficiaries will need to meet, their interest in the Project, and whether or not they accept the responsibilities they will acquire with regard to the Project, as presented below. The selection process will be managed by the SAG-PIU through a transparent process including direct information to all potential interested parties (see Annex 1 SEP).

ENVIRONMENTAL RESOURCES MANAGEMENT PAA PROJECT FINANCE A/S
3-10
Figure 3.3 Distribution of potential beneficiaries (as per November 2017 assessment)
Source: ERM, 2018 based on the November 2017 assessment undertaken by CINSA and PAA Project Finance

ENVIRONMENTAL RESOURCES MANAGEMENT PAA PROJECT FINANCE A/S
3-11
3.4.2 Responsibilities of selected beneficiaries
The responsibilities that the selected milk producers and farmers will acquire and therefore that they will need to accept prior to becoming beneficiaries, are presented below.

ENVIRONMENTAL RESOURCES MANAGEMENT PAA PROJECT FINANCE A/S
3-12
Table 3.1 Responsibilities of the selected beneficiaries
Aspect Responsibility Application Attesting to the veracity of all documents to be included in the file for the irrigation equipment application.
Attesting that the title deed submitted for the land where the irrigation system will be installed is free of all encumbrances, mortgages, and that they are the absolute owner of the property, as well as any other aspects of a legal nature that may affect their possession for a period of at least 10 years.
Complying with and attesting to all the requirements demanded in the operating regulations of the agreement between the SAG and the beneficiary, which are mainly indicated below: o Application signed by the applicant producer. o Photocopy of public deed or any other title that is registered in the Property Institute of the Department to which the property to be cultivated
and the irrigation equipment to be installed are ascribed. o Photocopy of the applicant’s identity document. o Photocopy of the applicant’s National Tax Registry (numerical RTN). o Proof of neighbourhood of the applicant issued by the Municipal Mayor, or their representative, for the place where the property in the
application is located. o Investment plan or crop feasibility study that is being, or will be, carried out.
Fee Once the application has been approved by the Ministry of Agriculture and Livestock, the benefit fee amount must be settled.
Permits The beneficiary takes the responsibility for processing all permits related to their productive and commercial activity, if any.
The beneficiary of the equipment must acquire all the usage rights for natural resources and any respective environmental permits necessary for their activity, which could include: o The environmental licence for the type of crop they wish to farm. o The water contract. o The permit for connecting any additional necessary equipment to the national electric power grid. o The permit for exploring and exploiting groundwater.
Other costs The beneficiary shall be liable for the costs of the environmental services regarding the use of water or the corresponding environmental
compensation. Covering all expenses for the loading, transport, and operability of the irrigation equipment from the city of delivery to its final destination
(farm).

ENVIRONMENTAL RESOURCES MANAGEMENT PAA PROJECT FINANCE A/S
3-13
If necessary, covering expenses for the conditioning of their water source, such as the drilling of underground water wells or the construction of a dug well near a surface water supply, in addition to all the associated accessories, materials, and other work required for the proper installation and functioning of the equipment.
Acquiring, on their own, all the accessories or materials that are needed to install the irrigation equipment from the site of the water supply to their property, as well as that necessary for the proper functioning of the equipment.
Providing, on their own, all fluids such as lubricants, fuel, battery acids, and anything else necessary for the installation and start-up of the irrigation equipment received, as well as electric power if necessary.
Paying the compensation, where applicable, corresponding to third parties for the use of the irrigation equipment. If the beneficiary producer sells or loses the equipment, they must reimburse its value to the General Treasury of the Republic, and should they
fail to do so, a case must be submitted to the corresponding judicial authorities.
Use and maintenance
Complying with the objectives and commitments established in the Conditional Donation Agreement, as well as with the technical assistance and manuals recommended for the irrigation equipment.
Correctly using and maintaining the irrigation equipment acquired through this Conditional Donation Agreement. Carrying out, on their own, all the equipment and hydrant pipe installation work on the plot where the received irrigation equipment is going
to operate. Maintaining the equipment and its components, accessories, as recommended by the manufacturer or supplier. Taking responsibility for any damage to the equipment due to mishandling, theft, or loss, and repairing or replacing the parts within a period
of no more than 30 days after the event has been detected. Additionally, they authorise the Ministry of Security or another related institution to designate the SAG to take the equipment away from them
if they are not using it or are misusing it. The beneficiary will be responsible for transporting the equipment to SAGO’s warehouse. The irrigation equipment acquired through the agreement between the SAG and the beneficiary cannot be unused as this would imply the
immediate termination of the equipment agreement, nor can it be sold or used as collateral for a loan with a natural person or financial entity, nor removed from the property to which it is assigned or belongs, unless this is with the approval of the SAG.
The irrigation equipment received by the beneficiary can only be handled or operated by the beneficiary and cannot be loaned, rented or temporarily used by any persons other than the beneficiary themselves.
Sustainability The responsibility for the management of water and soil resources lies with the beneficiary. The project only intervenes in raising awareness
and contributes to the improvement of the educational offering for the beneficiary to acquire the knowledge and the will to implement preventive measures aimed at preserving the sustainability of the water and soil resources.
Technical inspections and monitoring
Allowing the monitoring of the irrigation equipment for a period of no less than 10 years, by the SAG, SAGO, FENAGH, or the Environment Unit (Unidad de Medioambiente or UMA) of Olanchito, in order to verify its condition and correct operation. At the same time, providing information about the crops they are managing through its operation.
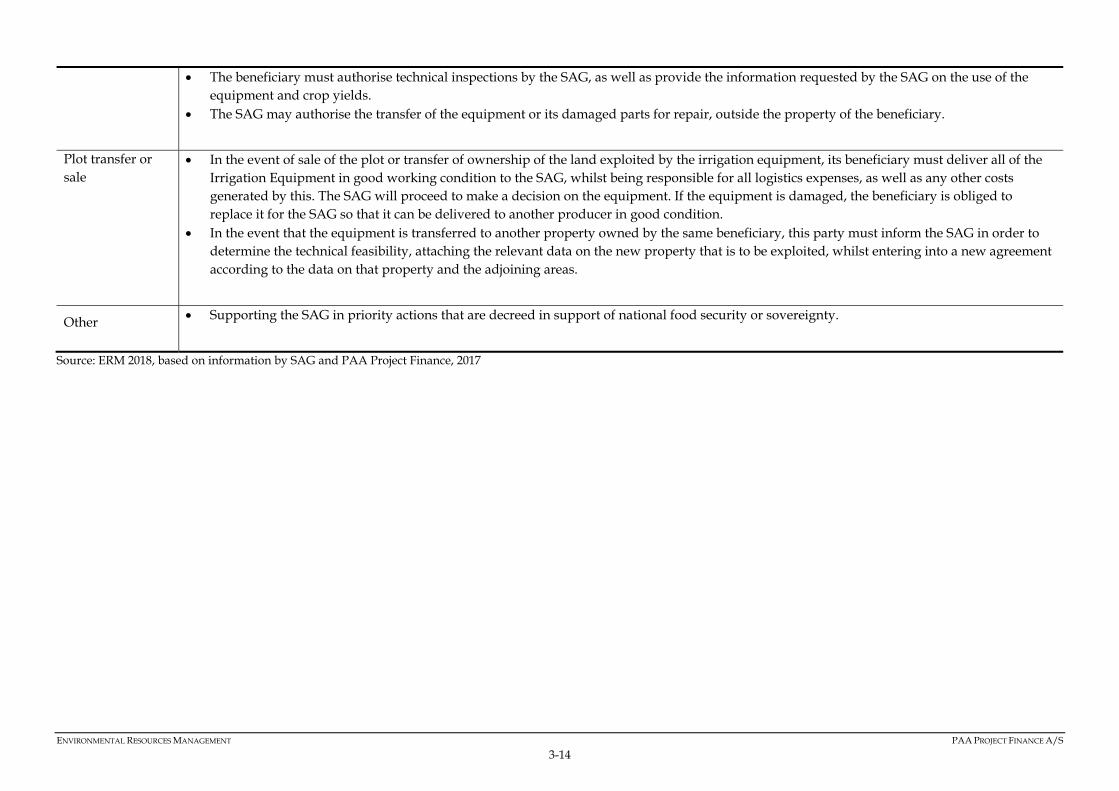
ENVIRONMENTAL RESOURCES MANAGEMENT PAA PROJECT FINANCE A/S
3-14
The beneficiary must authorise technical inspections by the SAG, as well as provide the information requested by the SAG on the use of the equipment and crop yields.
The SAG may authorise the transfer of the equipment or its damaged parts for repair, outside the property of the beneficiary.
Plot transfer or sale
In the event of sale of the plot or transfer of ownership of the land exploited by the irrigation equipment, its beneficiary must deliver all of the Irrigation Equipment in good working condition to the SAG, whilst being responsible for all logistics expenses, as well as any other costs generated by this. The SAG will proceed to make a decision on the equipment. If the equipment is damaged, the beneficiary is obliged to replace it for the SAG so that it can be delivered to another producer in good condition.
In the event that the equipment is transferred to another property owned by the same beneficiary, this party must inform the SAG in order to determine the technical feasibility, attaching the relevant data on the new property that is to be exploited, whilst entering into a new agreement according to the data on that property and the adjoining areas.
Other Supporting the SAG in priority actions that are decreed in support of national food security or sovereignty.
Source: ERM 2018, based on information by SAG and PAA Project Finance, 2017
ENVIRONMENTAL RESOURCES MANAGEMENT PAA PROJECT FINANCE A/S
3-15
3.5 IRRIGATION SYSTEM IMPLEMENTATION
The Project consists of establishing and implementing an irrigation system. This irrigation system is made up of a set of Project irrigation equipment that is to be delivered by PAA Project Finance to the SAG as part of its main responsibilities in the Project. Each of the elements of the irrigation system for which PAA Project Finance is responsible are presented in Section 3.5.1. Section 3.5.2 provides a description of the irrigation system design and overall process: from each beneficiary’s water input which can be either a groundwater or surface source, depending on each beneficiary and the location of their plot, to the area of land to be irrigated. In addition to the procurement of additional equipment, beneficiaries will also be responsible for installing all the equipment, as well as any work necessary for conditioning their water source. The responsibilities regarding the implementation of the irrigation system are illustrated in Section 0.
3.5.1 Project irrigation equipment
PAA Project Finance is responsible for delivering a total of 311 sets of up to 10 ha irrigation equipment to the SAG for onward distribution to selected milk producers and farmers. An irrigation set comprises a combination of equipment pieces, diesel motor pump or a diesel fuelled generator with a submersible pump, and each with two easy-to-handle travelling hose irrigators or micro-sprinkles, and the irrigation pipeline with valves. The distribution of equipment combination within the 311 irrigation sets will be divided per set combination as follows: • 95 units of surface diesel motor pump and two hose reel irrigators and metal pipelines • 155 units with diesel fuelled generator + submersible pump and two
travelling hose irrigators and metal pipelines • 26 units of surface diesel motor pump, micro-sprinklers and PVC pipelines • 35 units with diesel fueled generator + submersible pump, micro-
sprinklers and PVC pipelines The Project irrigation technology to be supplied by PAA Project Finance has been designed to irrigate up to 10 ha of land per set of equipment. It has been assessed as being the most suitable for the current needs of the Project as it allows the highest number of beneficiaries to receive equipment, irrigation across a wide area, and it is more environmentally friendly than other potential alternatives (see assessment of Project alternatives in Section 3.7). The irrigation equipment set to be provided by PAA Project Finance is presented in Figure 3.4, below.

ENVIRONMENTAL RESOURCES MANAGEMENT PAA PROJECT FINANCE A/S
3-16
Figure 3.4 Project irrigation equipment
Source: ERM, 2018 based on Integra Ingeniería’s Technical Project

ENVIRONMENTAL RESOURCES MANAGEMENT PAA PROJECT FINANCE A/S
3-17
3.5.2 Irrigation process
Depending on the location of each beneficiary’s plot, the source of irrigation water will vary. In the majority of the cases, beneficiaries will require the drilling of a groundwater well and subsequent pumping of groundwater to irrigate during the dry season. The groundwater source option has the advantage of maintaining stable water quality and quantity and is less vulnerable to surface contamination. However, in the event the beneficiary’s plot is located near a surface water source, no drilled well will be required and when the water level is shallow and accessible a dug well or pit may be used as water source, to maintain a reliable source of water that does not dry up in the dry season. Both water sources options are presented in Figure 3.6, below. The location of the water source for the irrigation system on each beneficiary’s plot will be selected by the beneficiary themselves, always ensuring it is situated away from other water sources (e.g., other existing groundwater wells) and away from potential contamination sources. During the allocation of the Project irrigation equipment, to be undertaken by SAG-PIU, it is possible that more than one set could be assigned to a single beneficiary depending on that particular beneficiary’s land availability and resources, while also taking into account the objective of assigning irrigation sets to the highest number of beneficiaries possible. It is expected that the majority of beneficiaries will receive one Project irrigation equipment set and will need one water source (groundwater well or dug well/pit). For the beneficiaries that receive more than one set and require more than one water source, the criteria regarding the location of the water source in the beneficiary’s plot will stand. The irrigation system has been designed so that a groundwater well will hold the submergible pump that will provide water directly to the pipeline system, avoiding the need for most beneficiaries of any water buffer or tank. The well has been designed to prevent groundwater pollution due to inflow of surface water through the wells. The design adopted assumes that water will be channelled directly through the distribution network and any fertilisers will be supplied through a control valve that will avoid any accidental contamination. Additionally, the mouth of the well cannot be opened easily. Figure 3.5 presents a sample image of similar design.

ENVIRONMENTAL RESOURCES MANAGEMENT PAA PROJECT FINANCE A/S
3-18
Figure 3.5 Water well design
Source: Integra Ingeniería 2018
From the water source, the pumped water will go to irrigate the beneficiary’s plot using the irrigation equipment supplied by PAA Project Finance:
A mobile component, made up of the diesel motor pump orgenerator and two hose reel irrigators with integrated sprinkler, or micro-sprinklers. This mobile component can be adequately moved and stored away by the beneficiary during the rainy season when irrigation will not be necessary.
The fixed component composed of a set of pipelines and valves, either easy connection aluminium tube segments of 5.8m length for the travelling hose irrigators, or PVC tubes to connect to the micro-sprinklers
The two hose irrigators will be able to operate simultaneously, each irrigating strips of land 150x50 m2. The travelling hose will be able to move automatically, without any human intervention, within this 150x50 m2 strip of land. The hose will only need physically moving by the beneficiary from one irrigation hydrant to another. The travelling reels hold a hose of 125 m maximum length, which have a maximum irrigation distance of 25 m, from each hose, from irrigation hydrant locations. There is a total of 7 different positions where the hose irrigators can be connected, considering that every 50 m of the main pipeline there is an irrigation hydrant. For each irrigation hydrant position a land strip of 150x50 m2 can be irrigated, meaning each hose irrigator will be able to irrigate 52,500 m2. As two travelling hoses will be operating, these will irrigate a total of 105,000 m2, corresponding to the total irrigation unit per plot of approximately 10 ha as designed by the Project. This is illustrated in Figure 3.6, below.

ENVIRONMENTAL RESOURCES MANAGEMENT PAA PROJECT FINANCE A/S
3-19
The combination of equipment which include the micro-sprinklers connected by PVC pipes (51 units) are meant to be used for irrigation of trees (citric mainly), micro-sprinklers will have a mesh configuration of 5m x 4m (every 5 m in one direction and each 4 m in the other)
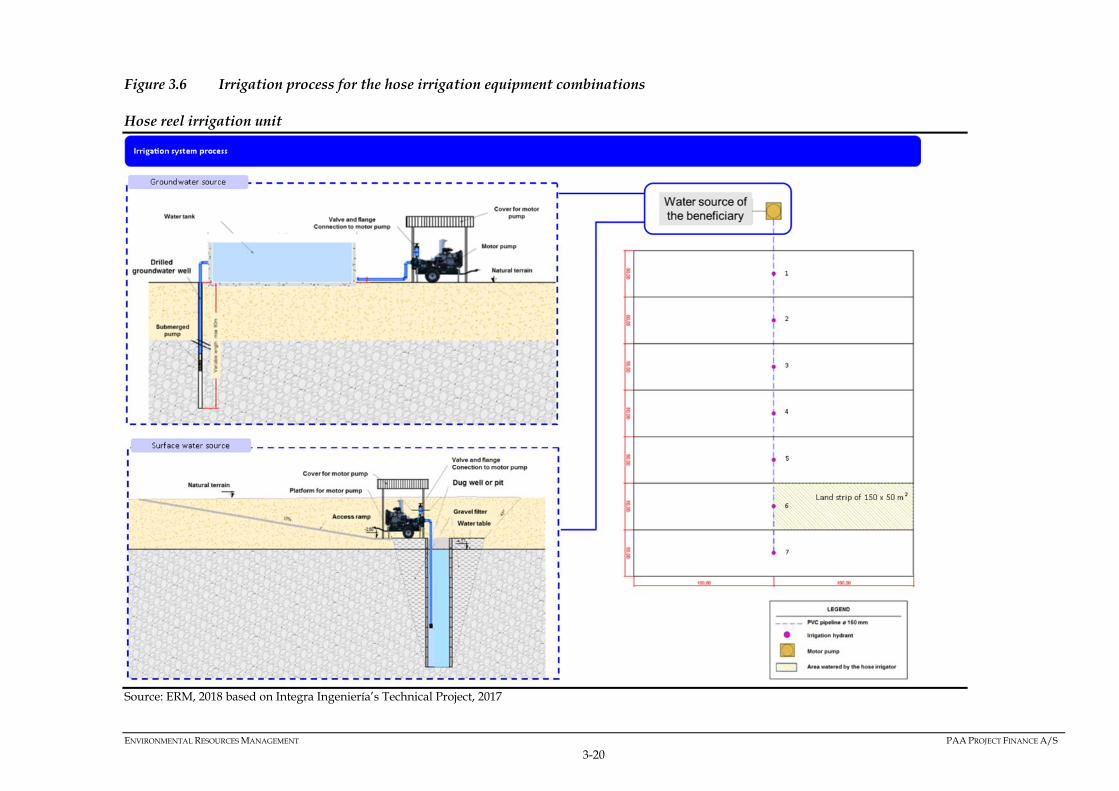
ENVIRONMENTAL RESOURCES MANAGEMENT PAA PROJECT FINANCE A/S
3-20
Figure 3.6 Irrigation process for the hose irrigation equipment combinations
Hose reel irrigation unit
Source: ERM, 2018 based on Integra Ingeniería’s Technical Project, 2017
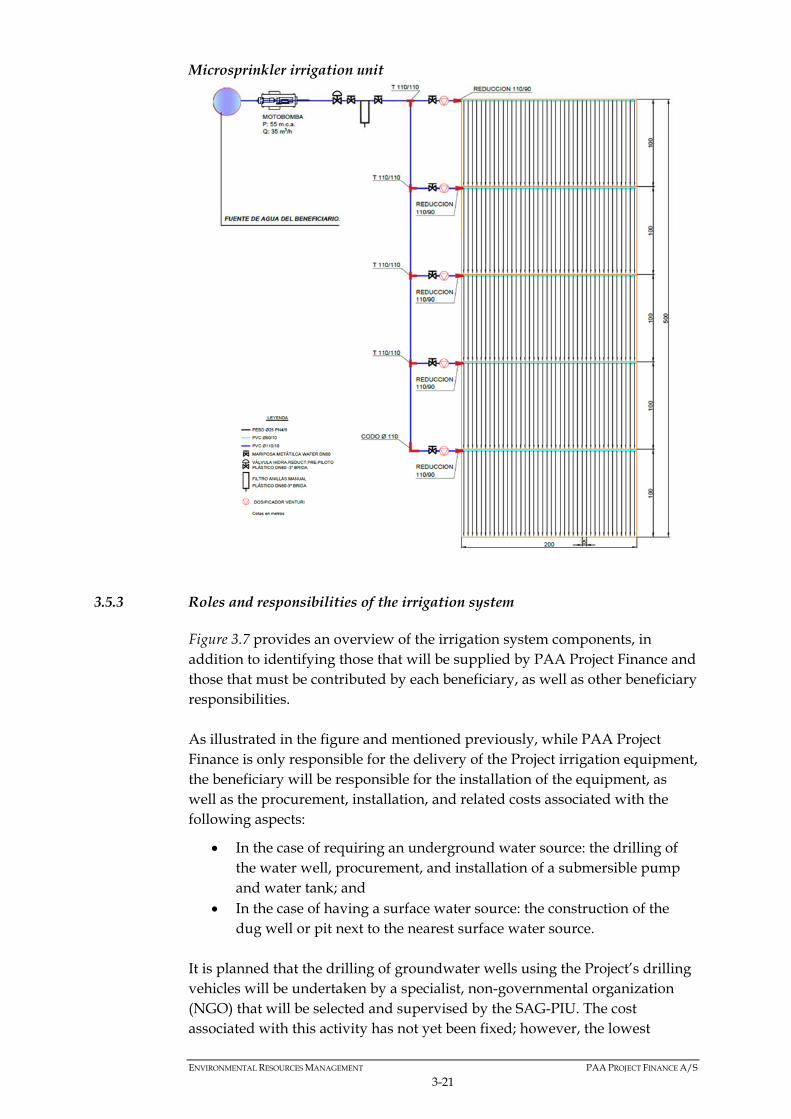
ENVIRONMENTAL RESOURCES MANAGEMENT PAA PROJECT FINANCE A/S
3-21
Microsprinkler irrigation unit
3.5.3 Roles and responsibilities of the irrigation system
Figure 3.7 provides an overview of the irrigation system components, in addition to identifying those that will be supplied by PAA Project Finance and those that must be contributed by each beneficiary, as well as other beneficiary responsibilities. As illustrated in the figure and mentioned previously, while PAA Project Finance is only responsible for the delivery of the Project irrigation equipment, the beneficiary will be responsible for the installation of the equipment, as well as the procurement, installation, and related costs associated with the following aspects:
In the case of requiring an underground water source: the drilling of the water well, procurement, and installation of a submersible pump and water tank; and
In the case of having a surface water source: the construction of the dug well or pit next to the nearest surface water source.
It is planned that the drilling of groundwater wells using the Project’s drilling vehicles will be undertaken by a specialist, non-governmental organization (NGO) that will be selected and supervised by the SAG-PIU. The cost associated with this activity has not yet been fixed; however, the lowest

ENVIRONMENTAL RESOURCES MANAGEMENT PAA PROJECT FINANCE A/S
3-22
possible cost to the beneficiary will be assured (as reported during field survey activities undertaken in June 2018). The timing of the drilling activities will depend on the required depth of each well and the geology of the site. It is estimated that for a 6 m-deep water well, drilling activities are expected to last 1 day while an 80 m-deep water well could take up to 10 days. Wells will be drilled subsequently, over a period of two years.

ENVIRONMENTAL RESOURCES MANAGEMENT PAA PROJECT FINANCE A/S
3-23
Figure 3.7 Components of the irrigation system and responsibilities
Source: ERM, 2018
Option 2: Dug well / pit constructed next to nearest
surface water feature
Option 1: Groundwater well drilled
Mobile motor pump
Irrigation network
Project equipment delivered by PAA Project Finance
Equipment to be procured by beneficiary
Conditioning and installation works to be undertaken by beneficiary
Water source of the beneficiary Water distribution
Legend:
Mobile Generator + submersible
pump
Hose reel irrigators and sprinkler
Micro‐sprinkers

ENVIRONMENTAL RESOURCES MANAGEMENT PAA PROJECT FINANCE A/S
3-24
3.6 PROJECT PHASES AND ACTIVITIES
Project activities will take place in three different phases: pre-operation, operation, and abandonment, in which the responsible parties differ from one phase to another. Figure 3.8 summarises the main activities of each phase, the responsible parties, and estimated duration. Additional details are provided in the following sections.

ENVIRONMENTAL RESOURCES MANAGEMENT PAA PROJECT FINANCE A/S
3-25
Figure 3.8 Project activities for each Project phase
Source: ERM, 2018

ENVIRONMENTAL RESOURCES MANAGEMENT PAA PROJECT FINANCE A/S
3-26
3.6.1 Pre-operation
During the pre-operation phase, PAA Project Finance will be responsible for delivering the Project irrigation equipment to the SAG. The equipment will be stored in the SAGO warehouse in Olanchito or other place defined by SAG. The warehouse is safeguarded by a security agent who is part of the regular staff. The Project equipment will remain in this warehouse until the selection of beneficiaries to be undertaken by the SAG-PIU has been finalised, as per the established requirements detailed in Section 3.4, after which the Project irrigation sets will be assigned to the beneficiaries. In addition, PAA Project Finance, with the support of the SAG-PIU, will be responsible for preparing and delivering the necessary training to SAG technicians (in other words training the trainers) to ensure the correct use of the irrigation equipment. The technical training will address the following aspects:
installation of the irrigation equipment, its accessories, and use of the equipment,
maintenance and upkeep of the irrigation equipment, .
This training will be delivered by PAA Project Finance to SAG technicians and/or personnel designated by the SAG. These will then be responsible for delivering training to the Project beneficiaries. In addition, other relevant training sessions will be prepared to ensure that good practices and the environmental and social measures defined in the present corresponding Environmental and Social Impact Assessment are efficiently implemented by the beneficiaries. These refer to training on irrigation good practices, recommendations for the sustainable use of water, pesticides, and fertilizers, and waste management. These will be defined in the Training Management Plan. They will be designed and delivered to the selected beneficiaries by technicians from the SAG-DICTA (Directorate of Agricultural Science and Technology), as well as other local organizations such as ASIDE, SENASA, the Health Secretary / Coordination of Environmental Health Programme of the Municipality of Olanchito. Waste management, use of resources, and emissions
The pre-operation activities to be implemented by PAA Project Finance are limited to the delivery of the Project irrigation equipment and training activities. For this reason, waste generation will be associated with irrigation equipment packaging materials (wood, plastic, polymers), as well as domestic waste and wastewater in the offices where the training activities will take place. The generated waste will be managed by the municipality of Olanchito and appropriately disposed of in the Olanchito sanitary landfill, sewer network, or corresponding septic tanks.

ENVIRONMENTAL RESOURCES MANAGEMENT PAA PROJECT FINANCE A/S
3-27
The use of resources will be limited to the fuel consumption required for transporting the Project irrigation equipment to the warehouse, in addition to the mobilization of technicians to the Project Area and related vehicle exhaust emissions. Transport activities are expected to be undertaken by sea from either Denmark or Spain (depending on logistics) to San Pedro de Sula port in Honduras, where the containers will be transported by truck to the warehouse. The transport of the Project irrigation equipment will be undertaken progressively, over an overall and non-continuous period of approximately 15 months during the operation phase. It is estimated that the pre-operation phase will last approximately 20 months.
3.6.2 Operation Phase
This phase consists of the operation of the Project irrigation system as well as associated monitoring activities. Indeed, once the beneficiary’s application has been accepted, they have received training, agreed to the conditions of use of the equipment, and paid the fee for the reception of the irrigation equipment, the beneficiary will be assigned an irrigation equipment set. The equipment stored at the SAGO warehouse in Olanchito or other warehouse specified by SAG, must be collected by the selected beneficiaries and transported to their land plot. Each beneficiary will be responsible for conditioning their water supply (groundwater or surface water source), installing the Project irrigation set and other necessary equipment (such as the water tank, if needed), and commencing irrigation. Each beneficiary will be responsible for managing the drilling of their water wells. As mentioned previously, along with the equipment, the beneficiary will also acquire a series of responsibilities linked to the irrigation equipment, as well as natural resource usage rights (see Section 3.4.2). In addition, the beneficiary will be liable for certain environmental services costs, such as those related to the use of water and electricity. The beneficiaries will be responsible for safeguarding the irrigation equipment1 as well as properly storing the equipment when not in use during the rainy season. Irrigation equipment monitoring activities will be managed by the SAG directly, with the support of other organisations such as the CRELS and SAGO. During these monitoring activities, the condition and correct operation of the irrigation equipment will be verified, as will the correct implementation and management of environmental and social measures resulting from the
1 No additional security measures will be implemented during the operation phase. Once the Project irrigation equipment is appointed to the beneficiary, they are the responsible for the security of the equipment.

ENVIRONMENTAL RESOURCES MANAGEMENT PAA PROJECT FINANCE A/S
3-28
environmental and social impact assessment (see Chapter ¡Error! No se encuentra el origen de la referencia. and Chapter ¡Error! No se encuentra el origen de la referencia.). The operation phase is estimated to extend over the expected operational life of the irrigation equipment, corresponding to a period of 10 years1. Waste management, use of resources and emissions
In order to estimate the water volume necessary for the irrigation activities, it has been assumed that the irrigation water requirements per plot will be 32 L/m2 per week and that irrigation activities will take place over 3.5 months per year (105 days), corresponding to the driest months. Taking into account the fact that a maximum of 3,110 ha are planned for irrigation (considering 311 potential beneficiaries and an irrigation unit per beneficiary plot of approximately 10 ha), the total maximum water requirement for irrigation will be 14,93 Hm3 per year (Integra Ingeniería, 2017, updated on 2018) considering the same water demand of 32 l/m2 per week and a maximum irrigable area of 3,110 ha and a system rate use of 100%. Water meters will be installed on the irrigation systems to monitor the water consumption of each piece of irrigation equipment throughout the Project lifetime. As for fuel consumption, each motor pump/diesel generator with submergible pump will consume approximately 3.8 L/h (Integra Ingeniería, 2017). Taking into account the fact that the total of 311 motor pumps/diesel generators are expected to be distributed among the selected beneficiaries and considering a maximum irrigation rate of 20h/day (total 2,481 m3/year), over 3.5 months of the dry season each year, this leads to a maximum estimated diesel consumption of less than 2,500 m3/year. The final diesel consumption will depend on the actual equipment usage according to the real irrigation needs of each beneficiary each year. Associated with the operation of the irrigation equipment, exhaust emissions will be generated due to the consumption of fossil fuels by the motor pumps/diesel generators as well as noise emissions, again due to the operation of the same units. In addition, lubricants are expected to be used for the start-up of the equipment. The beneficiary will be responsible for managing any lubricants used, either reusing them or selling them to a recycler. No additional waste is planned to be generated during the operation of the irrigation equipment. The drilling of underground water wells, , will also require fuel and will have associated exhaust and noise emissions. Bentonite-based muds which do not
1 After 10 years of operation, once the life expectancy of the irrigation equipment is achieved, the beneficiary can either continue with the operation through a change of equipment or abandon the irrigation equipment. This will depend entirely on each individual beneficiary.

ENVIRONMENTAL RESOURCES MANAGEMENT PAA PROJECT FINANCE A/S
3-29
contain any additives will be used for drilling the wells. Once recovered from the water well, these will be managed accordingly.
3.6.3 Abandonment
The following abandonment activities have been considered:
The abandonment of the irrigation equipment, i.e., assuming that the equipment is no longer used for the purpose initially planned by the Project.
The abandonment of the water wells, i.e., assuming that the water wells are no longer used for extracting water for irrigation purposes, as initially planned by the Project, or assuming that no water can be extracted.
The abandonment of the irrigated areas, i.e., assuming that the land is no longer irrigated and no longer used for agricultural or livestock purposes, as initially planned by the Project.
These abandonment activities are considered one-off final events that depend entirely on each individual beneficiary. The beneficiaries will be responsible for correctly abandoning the irrigation equipment and water wells. Abandoned Project irrigation equipment can be either managed and recycled by a specialist company or reused by the milk producer or farmer on other machinery, or for other purposes. In the event that the producer decides to no longer use it, the abandoned water wells will need to be decommissioned as appropriate, following good practice. The SAG will be responsible for monitoring the correct implementation and management of the environmental and social measures relating to abandonment activities.
3.7 PROJECT ALTERNATIVES
During the design of the Project, different alternatives have been evaluated to determine the most adequate in line with the needs of the Project Area, the objectives of the SAG, best practice applicable to the agricultural activities, and the environmental and social aspects that have been considered throughout the Project design. The Figure 3.9, below, presents the different alternatives evaluated. The analysis of alternatives justifies the solution adopted for the Project as described in the previous section of Chapter ¡Error! No se encuentra el origen de la referencia..

ENVIRONMENTAL RESOURCES MANAGEMENT PAA PROJECT FINANCE A/S
3-30
Figure 3.9 Alternatives considered for the Project design
Source: ERM, 2018
3.7.1 Alternative no-project
As explained in Section ¡Error! No se encuentra el origen de la referencia., the Project’s commitment is to ultimately improve the economy of the area, through job creation, greater productivity of its fields, and the competitiveness of the local agricultural sector. The alternative of there being no Project would limit the economic and social growth of the Project area, meaning milk producers or farmers in the area remain vulnerable to climate conditions and market variations, among other negative effects. The Figure 3.10 summarizes the effects associated with the two alternatives.
Figure 3.10 Effects of the two alternatives
Source: PAA Project, 2017
No‐ProjectWith‐Project
Sprinkler SurfaceIRRIGATION METHODS
IRRIGATION SYSTEMS
Stationary
Giantsprinkle
Displaceablebranches
Travelling hose
Rollers
Selected alternatives for the Project Not selected alternatives for the Project
Continousdisplacement
WITH PROJECT, NO‐PROJECT
Dripper
Micro‐sprinklers
Giant Sprinklers

ENVIRONMENTAL RESOURCES MANAGEMENT PAA PROJECT FINANCE A/S
3-31
3.7.2 Irrigation method
There are various factors that condition the three potential irrigation methods, including: sprinkler irrigation, drip irrigation, and surface irrigation. These factors are summarised in Table 3.2, below.
Table 3.2 Factors conditioning the irrigation method
Factors Surface irrigation by gravity
Sprinkler irrigation
Localized or drip irrigation
Water price Low Medium High Water supply Irregular Regular Continuous Water availability Abundant Medium Limited Water purity Not limiting No solids Elevated Soil infiltration capacity
Low to medium Medium to high Either
Soil storage capacity High Medium to low Not limiting
Topography Flat and uniform Smooth profile Irregular
Sensitivity to water deficit
Low Moderate High
Production value Low Medium High Workforce cost Low Medium High Energy cost High Medium Moderate Capital availability Low Medium to high High
Technology demand Limited Medium to high Elevated
Source: Integra Ingeniería, 2017 Taking into account the fact the Project area is not located in an area where there is an exceedance of water, nor where the water source is located near the land plot, the surface irrigation method is not applicable to the Project. The dripper irrigation method is also not appropriate, as this method should be used in areas that are very sensitive to a water deficit and where there is a high level of knowledge on dripper irrigation systems. Considering these arguments, together with the moderate and high energy costs of the dripper and surface irrigation systems, the most appropriate irrigation system for the Project is the sprinkler method.
3.7.3 Sprinkler irrigation system
The sprinkler method is appropriate for the majority of crops and adapts to almost all land types as sprinklers have a wide range of characteristics and capacities. Sprinkler irrigation systems can be classified as follows:

ENVIRONMENTAL RESOURCES MANAGEMENT PAA PROJECT FINANCE A/S
3-32
Figure 3.11 Classification of sprinkler irrigation systems
Source: Integra Ingeniería, 2017
Among the different types of sprinkler irrigation systems, the travelling hose system, and the micro-sprinklers system for trees, have been selected as most appropriate for the Project needs due to the following advantages:
It requires a lower investment. It adapts perfectly to crops such as cereals (wheat, barley, and alfalfa),
beetroot, leafy vegetables, pulses, and tubers. It can be automatized and thus requires little manpower. It is easily transportable and does not require a specialised workforce
to transport and connect the hose reel equipment to the next irrigation position.
The following Figure 3.12 presents the selected Project hose reel irrigator system.
Figure 3.12 Hose irrigator system
Source: Integra Ingeniería, 2017
ENVIRONMENTAL RESOURCES MANAGEMENT PAA PROJECT FINANCE A/S
4-I
CONTENTS
STAKEHOLDER ENGAGEMENT 2
4.1 INTRODUCTION 24.2 STAKEHOLDER ENGAGEMENT PRINCIPLES 24.3 STAKEHOLDER IDENTIFICATION 34.4 ESIA CONSULTATION ACTIVITIES 74.5 CONSIDERATIONS FOR FUTURE STAKEHOLDER ENGAGEMENT 74.6 GRIEVANCE MECHANISM 84.6.1 Grievance Procedure 94.7 MONITORING AND REPORTING STAKEHOLDER ENGAGEMENT ACTIVITIES 104.7.1 Monitoring 104.7.2 Reporting 11
LIST OF TABLES
Table 4.1 Overview of stakeholder groups 4 LIST OF FIGURES
Figure 4.1 Engagement activities undertaken in 2017 and 2018 7Figure 4.2 Stakeholder engagement objectives for each Project phase 8Figure 4.3 Grievance mechanism 10
LIST OF BOXES
Box 4.1 Definition of a Stakeholder () 3

ENVIRONMENTAL RESOURCES MANAGEMENT PAA PROJECT FINANCE A/S
4-2
STAKEHOLDER ENGAGEMENT
4.1 INTRODUCTION
This Section provides a description of the main stakeholders of relevance to the Project, a summary of the stakeholder engagement activities during ESIA preparation in 2017 and during the ESIA update preparation in 2018. Additionally the section provides an overview of the stakeholder engagement programme that will be implemented by the Project. This programme is designed to cover all phases of the Project and the series of actions proposed to enhance the current community grievance mechanism. This section is complemented by the Stakeholder Engagement Plan as presented in Annex 1 to this report which presents a more detailed account of proposed engagement activities and well as detailed procedure for management of community grievances.
4.2 STAKEHOLDER ENGAGEMENT PRINCIPLES
Stakeholder engagement is a requirement of international lenders within the IFC Performance Standards (namely Performance Standard 1) as it is recognised that failure to engage stakeholders can create significant risks to development of a project. PAA Project Finance understands that effective stakeholder engagement and public consultation is a cornerstone of successful Project development, and is committed to free, prior, and informed engagement with stakeholders throughout the Project lifecycle. The key principles guiding PAA Project Finance’s approach to stakeholder engagement on this Project are:
To be open and transparent with stakeholders.
To be accountable and willing to accept responsibility as a corporate citizen and to account for impacts associated with the Project activities.
To have a relationship with stakeholders that is based on trust and a mutual commitment to acting in good faith.
To respect stakeholders’ interests, opinions and aspirations.
To work collaboratively and cooperatively with stakeholders to find solutions that meet common interests.
To be responsive and to coherently respond in good time to stakeholders.
To be pro-active and to act in anticipation of the need for information or potential issues.
To engage with stakeholders such that they feel they are treated fairly and their issues and concerns are afforded fair consideration.

ENVIRONMENTAL RESOURCES MANAGEMENT PAA PROJECT FINANCE A/S
4-3
To be accessible and within reach of stakeholders so that they feel heard and to provide comprehensive information.
To be inclusive and proactively anticipate, identify and include all stakeholders.
4.3 STAKEHOLDER IDENTIFICATION
Stakeholders include individuals or groups that may influence or be impacted by the Project, as described in Box 4.1.
Box 4.1 Definition of a Stakeholder (1)
“Stakeholders are persons or groups who are directly or indirectly affected by a project, as well as those who may have interests in a project and/or the ability to influence its outcome, either positively or negatively. Stakeholders may include locally affected communities or individuals and their formal and informal representatives, national or local government authorities, politicians, religious leaders, civil society organizations and groups with special interests, the academic community, or other businesses.”
The level of interest and impact of any given group of stakeholders is dependent on a number of factors including level of authority, socio-economic context, influence, education and cultural factors. Stakeholder identification began at Project inception and planning and has continued through the various stages of the Project development. Stakeholders identified to date represent the organisations and individuals who may be directly or indirectly (positively or negatively) affected by the Project or who may have an effect on how the Project is implemented. Stakeholders identified for inclusion in engagement activities meet one of the following criteria:
have an interest in the Project;
would potentially be impacted by or have an influence on the Project (negatively or positively); and/or,
could provide commentary on issues and concerns related to the Project. Next Table resents an overview of the main stakeholder groups of relevance to the Project. A more complete list of stakeholders in included in Annex 1- Stakeholder Engagement Plan.
(1) IFC (2007) Stakeholder Engagement: A Good Practice Handbook for Companies Doing Business in Emerging Markets
Available at: http://www.ifc.org/wps/wcm/connect/938f1a0048855805beacfe6a6515bb18/IFC_StakeholderEngagement.pdf?MOD=AJ
PERES (Accessed 05.06.16)

ENVIRONMENTAL RESOURCES MANAGEMENT PAA PROJECT FINANCE A/S
4-4
Table 4.1 Overview of stakeholder groups
Stakeholder Categories & Groups
Stakeholders Connection to the Project
Internal Stakeholders Project Owner and Project Partner
Farming and Livestock Secretariat (SAG), Irrigation Department PAA Project Finance Project technical support consultancies (Engineers and advisors)
Approves the design, provides resources, approves applications, delivers equipment, trains, and monitors; Commercial Agreement
Implementing Partners National Government agencies
SAG-Irrigation Department, Project Implementation Unit SAG Olanchito (SEFIN
Collaboration agreements with other government bodies; Budget management; Surveillance and communication and engagement with local population; Reforestation Plan
Financial Institution Lender
ING Bank, Bank Nederlandse Gemeenten (BNG) and EKF’s Denmak Export Credit Agency
Loan agreement and funding
Project Partners (External) National & Regional associations and federations University and research centres
FENAGH SAGO National Agrarian Institute (Instituto Nacional Agrario – INA) Fund for Agricultural Development (Fondo Internacional de Desarrollo Agrícola - FIDA) Honduras Land Administration Program (Programa de Administración de Tierras de Honduras – PATH) Regional University Centre of Aguan Valley (CURLA) of Honduras National Autonomous University Universidad (UNAH) CREL
Formal, legal and functional organizations with credibility in the area and experience in other project implementations.
National Government National Regulatory bodies
MiAmbiente (DECA / Water Authority) ICF Ministry of Health
- Property Institute (Instituto de la Propiedad – IP) Honduran Institute of Anthropology and History ((Instituto Hondureño de Antropología e Historia - INAH) National Council of Potable Water and Sanitation (CONASA) State Secretariat for Indigenous and Afrohonduran Peoples (SEDINAFROH) Secretariat of Labour / Social Security Institution
National Government are of primary national political importance throughout all stages of the Project life cycle, in charge of licensing, granting permits/authorizations for the Project; monitoring and enforcing compliance with Honduran Law.

ENVIRONMENTAL RESOURCES MANAGEMENT PAA PROJECT FINANCE A/S
4-5
Stakeholder Categories & Groups
Stakeholders Connection to the Project
Municipal Government Municipal Authorities and Government bodies
Olanchito and El Arenal Municipal corporation Municipal Environmental Unit (Unidades Municipales de Ambiente – UMA) Department of Human Resources (Employment) Municipal Administration (Administración municipal) of urban areas, rural areas, the Municipal Administration’s Governance and Transparency Department Municipal Water and Sanitation Commission (Comisión Municipal de Agua Potable y Saneameinto - COMAS) Municipal representative of the Honduran Society of Administrative Boards of Water Systems (Asociación Hondureña de Juntas Administradoras de Sistemas de Agua - AHJASA) Health Centers
Regional and local government are responsible for implementation of legislation, and development plans and policies at the Regional and Local levels. Municipal corporations also responsible for granting permits to the farms as well as water extraction permits. Municipal environmental units involved in the monitoring of the fulfilment of the environmental control measures.
Project Potential Beneficiaries Selected livestock and milk producers and farm workers
Potential beneficiaries of the Project Livestock and milk producer with no or up to extensive experience in irrigation. Interests and expectations lie in improving economic income, reducing vulnerability to drought and improving income stability.
Potentially affected stakeholders Landowners and farm workers in the area Residents / other water users Water boards (resident associations) Downstream communities
Hamlets (aldeas) and settlements (caseríos) in the Project Area Hamlets located downstream of Project Area Landowners and farm workers not selected as beneficiaries Residents or other water users Water Administration Boards (Juntas Administradoras de Agua - JAAS) in each hamlet (aldea)
Users of water for human consumption and livestock and agriculture.
Vulnerable and Indigenous Persons/Groups Vulnerable groups within the Project Area
Vulnerable people within the hamlets in the Project Area Representatives of Indigenous and Afro-descendant groups residing /working in the Project Area: Federation of Xicaque Tribes of Yoro (Federación del Tribu Xicaque de Yoro - FETRIXY) and Association of Indigenous Tolupan Communities of La Montaña de la Flor (Asociación de Comunidades Indígenas Tolúpanes de la Montaña de la Flor - Acitmfm)
Vulnerable groups may be affected by the Project by virtue of their physical disability, social or economic standing, limited education, lack of employment or access to land. No indigenous communities are found within the Project Area, nonetheless indigenous individuals live among non-indigenous communities. Furthermore, the Project Area is located downstream from indigenous settlements.

ENVIRONMENTAL RESOURCES MANAGEMENT PAA PROJECT FINANCE A/S
4-6
Stakeholder Categories & Groups
Stakeholders Connection to the Project
Civil Society Community-Based Organisations (CBOs) Local Associations Research and Academic Institutions (national and local)
ASIDE Alfalit in Honduras CARE-PASOS FUPNAPIB - Protection, Conservation and Responsible Use of Natural Resources Present in Pico Bonito National Park CURVA University National Institute for Professional Training (Instituto Nacional de Formación Profesional - INFOP) SAGO CRELs Olanchito Red Cross
Organisations with direct interest in the Project, and its social and environmental aspects and that are able to influence the Project directly or through public opinion. Such organisations may also have useful data and insight and may potentially become partners to the Project in areas of common interest such as the implementation of training programs, etc.
Non-Governmental Organizations (NGOs)
International National Local
National and international NGOs present in the area: ASIDE, Alfalit in Honduras, FUPNAPIB and other potential international NGOs and Pressure Groups.
NGOs with direct interest in the Project (social and environmental aspects) with the ability to directly influence the project or through public opinion.
Other interest groups Media Private sector / multinational companies Law enforcement
Local and municipal media Banana plantations (DOLE) Palm trees plantations Dairy product producers Police and law enforcement National Processing Companies Local artisanal cheese producers
Multinational companies are economic actors with strong economic and political influence.
Potential partners Contractors. Suppliers and service providers. Other businesses operating within the community Local and international banks Other
Indirect beneficiaries of the project: micro and small entrepreneurs, workshop supplies.
Organisations, businesses and individuals with direct interest in the Project e.g. running businesses or providing services and supplies to the Project.

ENVIRONMENTAL RESOURCES MANAGEMENT PAA PROJECT FINANCE A/S
4-7
4.4 ESIA CONSULTATION ACTIVITIES
Stakeholder consultations for the Project began during Project planning phase and has been continuous through the feasibility studies, Environmental and Social Impact Assessment (ESIA) update including field visit for new engagement with key stakeholders conducted in June 2018. Engagement as part of the project development and ESIA process for lenders was conducted between 2016 and 2018. Initial consultations took place with the Government ministries and departments, the interested farmers, the Local Administration Authorities as well as social institutions in the area. Both public and private stakeholders were included in the engagement process, which was undertaken in 2017. In the field visit performed in June 2018 as part of the ESIA update process, additional engagement meetings have been conducted to fill data gaps and reconfirm assessment of impacts. A summary of the stakeholder engagement activities during ESIA preparation in 2017 and during the ESIA update preparation in 2018 is showed in Figure 4.1. Details on the engagement activities are provided in Annex 1.
Figure 4.1 Engagement activities undertaken in 2017 and 2018
4.5 CONSIDERATIONS FOR FUTURE STAKEHOLDER ENGAGEMENT
Stakeholder engagement activities are planned to cover all phases of the Project. However, PAA Project Finance will hand over the Project to the SAG once the irrigation equipment is installed and the training for beneficiaries has been completed. During the operation phase, PAA Project Finance’s

ENVIRONMENTAL RESOURCES MANAGEMENT PAA PROJECT FINANCE A/S
4-8
responsibilities regarding the irrigation project will be limited to supplying spare parts. In this regard, all engagement activities during the operation will be managed and promoted by the SAG. The general objectives of stakeholder engagement are outlined in Figure 4.2 as well as the Project activities.
Figure 4.2 Stakeholder engagement objectives for each Project phase
Source: ERM, 2018
Specific planning and engagement activities will be necessary at each Project phase. These are presented in Annex 1.
The activities that will be ongoing throughout the entire Project cycle and therefore common to the different phases include the following:
Regular update and revision of the stakeholder register including stakeholder analysis and re-evaluation as necessary throughout the different Project phases.
Addressing comments, questions, and grievances regularly and through appropriate channels, and issuing information to stakeholders. This includes regular refreshers to stakeholders about the Grievance Mechanism and related processes.
Regular reporting to the different stakeholders as appropriate.
Regular Project Monitoring reports.
4.6 GRIEVANCE MECHANISM
The Community Grievance Mechanism enables any stakeholder, including farm workers, to make a complaint or a suggestion about the way the Project is being implemented. Grievances may take the form of specific complaints for

ENVIRONMENTAL RESOURCES MANAGEMENT PAA PROJECT FINANCE A/S
4-9
damages/injury, concerns about routine Project activities, or perceived incidents or impacts.
The purpose of the Community Grievance Mechanism Procedure is to implement a formalised process (identification, tracking and redress) to manage complaints/grievances from communities and other local stakeholders in a systematic and transparent manner that could potentially arise from the Irrigation Project.
4.6.1 Grievance Procedure
The SAG has currently in place a grievance mechanism that allows identifying negative attitudes with the aim to systematically transform concerns into positive experiences through an adequate response protocol. It includes:
A grievance mechanism form on the following webpage: http://premperhn.com/sag-new/formulario-de-denuncias.
Contact details to report any concern, as indicated below: SAG - Secretaría de Agricultura y Ganadería Honduras Colonia Loma Linda, Avenida La FAO, Bulevar Centroamérica. Tegucigalpa Honduras Teléfono PBX: (504) 2232-5029 Correo electrónico: [email protected] Horario de atención: 9:00am a 5:00pm Although grievance management during pre-construction and operation is a responsibility of the SAG, PAA Project Finance will propose a series of actions (as a minimum) to the SAG in order to enhance the current grievance mechanism to have clear procedures that make filing grievances easy for communities with various levels of literacy and access to infrastructure. PAA Project Finance will also ensure that consultation on design of the mechanism provides for inclusion and participation of women in the grievance process, facilitating women’s access. These include: various access points and mechanisms to receive complaints and the definition of the procedure to follow once a grievance is received. These detailed grievance management procedure is presented in detail in Section 6- Community Grievance Mechanism in Annex 1. The grievance procedure in Figure 4.3 is proposed to ensure an effective and timely response to community complaints and maintain good community and stakeholder relations, and incorporates relevant provisions in the SAG’s general grievance procedure.

ENVIRONMENTAL RESOURCES MANAGEMENT PAA PROJECT FINANCE A/S
4-10
Figure 4.3 Grievance mechanism
Source: ERM, 2018
4.7 MONITORING AND REPORTING STAKEHOLDER ENGAGEMENT ACTIVITIES
It will be important to monitor and report on the on-going stakeholder engagement activities to ensure that the desired outcomes are being achieved, and to maintain a comprehensive record of engagement activities and the issues raised.
4.7.1 Monitoring
Monitoring of the irrigation equipment will be conducted by the PIU in collaboration with the SAGO, FENAH and UMA of Olanchito. Involvement of beneficiaries and project-affected stakeholders in monitoring Project implementation can assist in addressing their concerns and promote transparency. This can also empower communities as it enables them to have a role in addressing Project-related issues that affect their lives. This, in turn, strengthens relationships between the Project and its stakeholders. Stakeholder involvement in monitoring of this Project will include the following:
CRELs and stockbreeder’s representatives will be involved in the technical inspections and monitoring of the irrigation equipment
Involvement of affected stakeholders when selecting methods for any social surveys and in the analysis of results. Training will be conducted where needed to build capacities.
Observations of audit activities by affected parties.

ENVIRONMENTAL RESOURCES MANAGEMENT PAA PROJECT FINANCE A/S
4-11
Grievance follow-up meetings and calls with affected stakeholders in relation to installation of pumps, beneficiary selection and capacity building program.
4.7.2 Reporting
The SAG will prepare regular reports, which mainly describe as a minimum:
Progress with implementation of the project
Action Plans on issues that involve on-going risk to or impacts or concerns on affected stakeholders.
A summary of engagement activities and all resolved grievances
Other reporting modes that shall be prepared are presented in Annex 1. The internal schedule of preparation and dissemination of all formal disclosures shall be determined by the SAG and shall be communicated to PAA Project Finance.

ENVIRONMENTAL RESOURCES MANAGEMENT PAA PROJECT FINANCE A/S
5-I
CONTENTS
5 BASELINE DESCRIPTION 5-1
5.1 OVERVIEW 5-15.2 DATA COLLECTION AND LIMITATIONS 5-15.3 PHYSICAL ENVIRONMENT 5-35.3.1 Climate 5-35.3.2 Air quality, GHG emissions and climate change 5-95.3.3 Acoustic environment 5-155.3.4 Topography 5-165.3.5 Geology 5-195.3.6 Soils 5-235.3.7 Hydrology 5-285.3.8 Hydrogeology 5-365.4 BIOLOGICAL ENVIRONMENT 5-485.4.1 Habitats 5-485.4.2 Flora 5-575.4.3 Fauna 5-705.4.4 Protected areas 5-995.4.5 Critical Habitats 5-1065.5 SOCIOECONOMIC ENVIRONMENT 5-1075.5.1 Social Study Area 5-1075.5.2 Administrative structure 5-1075.5.3 Overview of potential project beneficiaries 5-1105.5.4 Demographics 5-1125.5.5 Indigenous groups 5-1215.5.6 Vulnerable groups 5-1245.5.7 Land use and ownership 5-1265.5.8 Economy and employment 5-1345.5.9 Livelihoods and income 5-1415.5.10 Health 5-1535.5.11 Education 5-1555.5.12 Infrastructure and public services 5-1565.5.13 Gender, security and human rights 5-1665.5.14 Archaeological and cultural heritage 5-168
LIST OF TABLES
Table 5.1 Rainfall in the Project Area 5-6Table 5.2 Overview of the Air Quality in Honduras 5-11Table 5.3 GHG emissions in Honduras 5-13Table 5.4 Use of chemical products (fertilizers, pesticides, and herbicides) in the Project
Area 5-25Table 5.5 Main Aguan River tributaries in the Project Area 5-30Table 5.6 Water flow measured (May 2016) in some Aguan River tributaries in the
Project Area 5-31Table 5.7 Water flow in the Aguan River (Sabana Larga) 5-32
ENVIRONMENTAL RESOURCES MANAGEMENT PAA PROJECT FINANCE A/S
5-II
Table 5.8 Water flow in the Aguan River (Olanchito) 5-32Table 5.9 Observations pertinent to surface water quality in the Project Area 5-34Table 5.10 Observations of surface water use in the Project Area 5-35Table 5.11 Observations of the gauging stations in the Project Area 5-36Table 5.12 Groundwater wells in the Project Area in 2017 5-39Table 5.13 Results of the groundwater sampling campaign 5-43Table 5.14 Observations of groundwater quality in the Project Area 5-44Table 5.15 Observations of groundwater use in the Project Area 5-45Table 5.16 List of flora in the Project Area 5-60Table 5.17 Significant flora species in the Project Area 5-64Table 5.18 Medicinal and lumber plants in the Project Area 5-67Table 5.19 Use of medicinal plants in the Project Area 5-68Table 5.20 Use of lumber in the Project Area 5-68Table 5.21 List of fish in the Aguan River drainage basin 5-73Table 5.22 List of amphibians in the Project Area 5-77Table 5.23 List of reptiles in the Project Area 5-81Table 5.24 List of birds in the Project Area 5-86Table 5.25 Significant birds in the Project Area 5-89Table 5.26 List of mammals in the Project Area 5-94Table 5.27 Hunting and bushmeat in the Project Area 5-97Table 5.28 Presence of fauna in the Project Area 5-98Table 5.29 Distribution of farmers and milk producers per CREL and municipality in the
Project Area 5-111Table 5.30 Age and gender distribution in Olanchito and Arenal municipalities 5-114Table 5.31 Population distribution in the Project Area per municipality (2013 official
census) 5-116Table 5.32 Households per number of Basic Needs Unmet (NBI 0 to 4+) in 2013 5-121Table 5.33 Indigenous and afro honduran peoples in Honduras 5-122Table 5.34 Distribution of indigenous groups in the municipalities of Olanchito and
Arenal (2013) 5-124Table 5.35 Agricultural land use types in the Project Area 5-129Table 5.36 Land tenure in Olanchito and Arenal (2018) 5-130Table 5.37 Livestock and milk producers by size in the Project Area 5-144Table 5.38 Producer characteristics by size 5-146Table 5.39 Job creation per irrigated hectare per crop 5-149Table 5.40 Basins and micro basins in Olanchito municipality 5-158Table 5.41 Water supply system coverage in Olanchito 5-159Table 5.42 Health centres in Olanchito by category 5-165Table 5.43 Education facilities per Municipality (2017) 5-166Table 5.44 Homicide rates per 100,000 in Olanchito and Arenal as of December 2016 5-167
LIST OF BOXES
Box 5.1 Specific climate conditions in the Olanchito municipality 5-8Box 5.2 Management of the RVSCEH 5-102Box 5.3 Conservation concerns in the RVSCEH 5-103Box 5.4 Expectations of the irrigation project 5-104Box 5.5 Additional inventories of flora and fauna in the RVSCEH (post-2012) 5-105

ENVIRONMENTAL RESOURCES MANAGEMENT PAA PROJECT FINANCE A/S
5-III
LIST OF FIGURES
Figure 5.1 Project Area 5-1Figure 5.2 Climate types in Honduras 5-4Figure 5.3 Annual average temperature in the Project Area 5-2Figure 5.4 Annual average minimum and maximum temperatures in Coyoles
(municipality of Olanchito) (2000 – 2008) 5-2Figure 5.5 Months with least rainfall 5-4Figure 5.6 Average rainfall in the Project Area (shown by isoclines) 5-5Figure 5.7 Yearly rainfall in Coyoles (Olanchito municipality) (2000 – 2008) 5-5Figure 5.8 Location of Coyoles 5-6Figure 5.9 Potential evapotranspiration in the Project Area 5-7Figure 5.10 View of the vandalized meteorological station in the Aguan River 5-9Figure 5.11 Overview of GHGs and climate change in Honduras 5-14Figure 5.12 Actions planned for reducing GHG emissions in Honduras 5-15Figure 5.13 Topography in the Project Area (western section) 5-17Figure 5.14 Topography in the Project Area (eastern section) 5-17Figure 5.15 Topography in the Project Area – Google Earth Pro 5-18Figure 5.16 Panoramic photographs taken in the Project Area 5-18Figure 5.17 Stratigraphic column of Honduras 5-20Figure 5.18 Geology of the Project Area (general view) 5-21Figure 5.19 Geology – zoom in view (western section) 5-21Figure 5.20 Geology – zoom in view (eastern section) 5-22Figure 5.21 Soils in Honduras 5-24Figure 5.22 Soils – zoom in view (western section) 5-24Figure 5.23 Soils – zoom in view (eastern section) 5-25Figure 5.24 Herbicide observed on a farm in the Project Area 5-27Figure 5.25 Soil profiles in the Project Area 5-27Figure 5.26 Aerial view of the Aguan River at the confluence with the San Lorenzo River
in 1969 (top) and in 2011 (bottom) 5-29Figure 5.27 Aerial view of fluvial bars 5-30Figure 5.28 Ground view of fluvial bars 5-30Figure 5.29 Aguan River and its tributaries in the Project Area 5-33Figure 5.30 Surface water extraction 5-33Figure 5.31 Hydrological elements observed in the Project Area 5-36Figure 5.32 Hydrogeological map of Honduras 5-37Figure 5.33 Hydrogeological units in the Project Area 5-38Figure 5.34 Groundwater wells in the Project Area identified in 2017 5-40Figure 5.35 Location of identified groundwater wells 5-41Figure 5.36 Groundwater levels in the Project Area 5-42Figure 5.37 Groundwater levels in the Project Area (zoom in view – western section) 5-42Figure 5.38 Groundwater levels in the Project Area (zoom in view – eastern section) 5-43Figure 5.39 Hydrogeological elements observed in the Project Area 5-47Figure 5.40 Habitats in the Project Area 5-48Figure 5.41 View of rural areas in the Project Area 5-49Figure 5.42 Satellite image of the confluence of the San Marcos and Chiquito rivers over
the years 1970 – 2002 - 2011 (Google Earth) 5-50Figure 5.43 View of agricultural fields and pastures in the Project Area 5-50Figure 5.44 View of grassland in the Project Area 5-51

ENVIRONMENTAL RESOURCES MANAGEMENT PAA PROJECT FINANCE A/S
5-IV
Figure 5.45 View of aquatic systems in the Project Area 5-52Figure 5.46 View of very dry tropical forest in the Project Area 5-55Figure 5.47 View of natural habitat degradation into pasture in the dry season 5-56Figure 5.48 Location of natural habitat identified during the field survey degraded into
pasture 5-57Figure 5.49 Lumber and medicinal plants in the Project Area 5-69Figure 5.50 Flora observed in the Project Area 5-69Figure 5.51 Fish observed in the Project Area 5-72Figure 5.52 Amphibians observed in the Project Area 5-76Figure 5.53 Reptiles observed in the Project Area 5-79Figure 5.54 Birds observed in the Project Area 5-85Figure 5.55 Hummingbirds observed in the Project Area 5-85Figure 5.56 Mammals observed in the Project Area 5-93Figure 5.57 Map of the Protected Area in the Project Area: Honduran Emerald
Hummingbird Wildlife Refuge (RVSCEH – Refugio de Vida Silvestre Colibrí Esmeralda Hondureño) 5-99
Figure 5.58 Visit to the RVSCEH 5-105Figure 5.59 Administrative divisions in the Project Area 5-108Figure 5.60 Population distribution per hamlet in the Project Area (2013) 5-113Figure 5.61 Gender distribution in Olanchito (2013) 5-114Figure 5.62 Gender distribution in El Arenal (2013) 5-115Figure 5.63 Trends in Honduras' HDI component indices 1990-2015 5-119Figure 5.64 Location of indigenous communities in relation to the Project Area 5-123Figure 5.65 Land use distribution in the Project Area 5-126Figure 5.66 Land uses in the Project Area 5-128Figure 5.67 View of agriculture fields and pastures in the Project Area 5-130Figure 5.68 Location of African Palm plantations in the middle and lower Aguan River
Valley with respect to the Project Area 5-134Figure 5.69 Honduras GDP composition by Sector (2017) 5-135Figure 5.70 Occupation distribution in Yoro Department 5-137Figure 5.71 Sectors of occupation the Olanchito and Arenal (2013) 5-138Figure 5.72 CREL facilities in the Project Area 5-143Figure 5.73 Employment creation per hectare of irrigated land in the Bauer Project Area
Honduras 5-149Figure 5.74 Shop in the hamlet of Coyoles (Olanchito municipality) 5-152Figure 5.75 Lumbering and medicinal plants in the Project Area 5-153Figure 5.76 Occurance of water-related health cases diagnosed in the municipality of
Olanchito in the first half of 2016 5-154Figure 5.77 Occurrence of malaria cases with respect to the Project Area in 2016 5-155Figure 5.78 Map of vector-borne diseases in the municipality of Olanchito (2018) ¡Error!
Marcador no definido.Figure 5.79 Education levels in Olanchito and Arenal (2013) 5-156Figure 5.80 Extraction of water from surface water feature 5-157Figure 5.81 Location of declared microbasins in Honduras (1987 - 2010) vs. Project Area 5-
158Figure 5.82 National road network from San Pedro Sula to El Progreso 5-163Figure 5.83 Municipal roads from Yoro to Olanchito 5-163Figure 5.84 Road and transport infrastructure in the Project Area 5-164

ENVIRONMENTAL RESOURCES MANAGEMENT PAA PROJECT FINANCE A/S
5-1
5 BASELINE DESCRIPTION
5.1 OVERVIEW
This baseline section provides a description of the environmental and social characteristics of the Project Area, which covers a surface area of about 60,000 ha in the Alto Aguan Valley in the Olanchito and Arenal municipalities in the Honduran department of Yoro. The approximately 3,110 ha of agricultural land that will be irrigated is located within this area.1 The Project Area is shown in Figure 5.1.
Figure 5.1 Project Area
Source: ERM, 2018
The baseline section provides specific data on the Project Area combined with the national context, whenever needed, to facilitate a thorough understanding of the issues involved.
5.2 DATA COLLECTION AND LIMITATIONS
The main sources of information consulted in the preparation of this baseline report are the previous assessments prepared by CINSA and PAA Project Finance in 2017 and the Project Technical Design prepared by Integra Ingeniería in 2017.
1 The agricultural land to be irrigated would be limited to a maximum of 3.110 ha, to be located within the project area. The location of these ha will be defined after selecting potential beneficiaries.

ENVIRONMENTAL RESOURCES MANAGEMENT PAA PROJECT FINANCE A/S
5-2
This desktop assessment was completed with a search of publicly available information, when the information cited above was not sufficient to describe the baseline in detail, including reliable and internationally recognized internet sources, e.g. such as those of the United Nations Development Programme (UNEP) and International Union for Conservation of Nature (IUCN). In addition to the existing desktop information, a more recent field survey was undertaken in June 2018 to complement the preparation of this ESIA report and to collect the specific information required to complete a number of information gaps identified in a preliminary assessment of the existing information conducted by the lenders and ERM in early 2018. Data collection activities included meetings and interviews with the SAG, SAGO, CRELs, and personnel from the municipalities of Olanchito and Arenal. One Focus Group Discussion (FGD) was also conducted with six small producers, including three women; however, FGDs with medium and large producers could not be conducted due to time constraints. The field survey also involved visits to five farms of different sizes in the Project Area belonging to potential beneficiaries (three small, one medium, and one large), which included habitat observation as well as brief interviews with the farm owners to collect information on water extraction, farm management, production, and so on. A full list of data collection and stakeholder engagement activities undertaken during this field survey (June 2018) is presented in Annex 1 Stakeholder Engagement Plan. Note that as the sample pool for the June 2018 survey was relatively small (approx. 15, mostly small producers and CREL members) the information collected was not representative of the different producer categories (small, medium, and large), and was not always consistent across the different sources. The SAGO and CRELs, for instance, reported slightly different figures in terms of average production and incomes for the different groups. This limitation was addressed by triangulating the information with the larger sample of 301 producers from which preliminary data was collected in 2017 (CINSA & PAA Project Finance, 2017). However, data on some important indicators such as milk production and number of cattle head per farm was not collected in 2017. For such indicators the information comes primarily from the June 2018 field survey results. Limitations were also identified in the preparation of the physical and biological baseline, including:
• Historical climatological information in Honduras is scarce and the network of climatological stations is limited.
• Lack of air quality information in Honduras and the Project Area due to the absence of air quality monitoring stations – only referred to in Tegucigalpa and San Pedro Sula.

ENVIRONMENTAL RESOURCES MANAGEMENT PAA PROJECT FINANCE A/S
5-3
• No noise background data in the Project Area.
• Soil quality information is limited to the information gathered from soil type maps at national level. No information is available from soil samples taken in the Project Area.
• Gauging stations in Honduras and the Project Area are limited. In most cases, only emergency stations are present.
• No information is available on surface water quality based on analytical results.
• No registration of groundwater wells. Consequently, there is no accurate list of groundwater wells in the Project Area.
• Biodiversity inventories in the Project Area are limited to the Refugio de Vida Silvestre Colibrí Esmeralda Hondureño or RVSCEH.
• Additional biodiversity inventories conducted in the RVSCEH are still pending publication and therefore not yet available for consultation. These include monitoring of insects conducted in 2014 and Addendum to Flora Management Plan.
5.3 PHYSICAL ENVIRONMENT
5.3.1 Climate
Overview
Unfortunately, Honduras has no institution with a long history of climatological data records and universal accessibility2. Overall, the climate in Honduras is tropical and temperate, according to the Köppen climate classification. Areas with a tropical climate are characterized by average temperatures of above 20ºC, while areas with a temperate climate are characterized by average temperatures in the coldest month of between -3ºC and 18ºC, and by average temperatures in the hottest month of more than 10ºC. Figure 5.2 shows the climate types in Honduras, based in the Köppen climate classification.
2 Although there is currently a reliable data collection network, the coverage of this information has been lost across most of the country. In addition, the information that several institutions are presently collecting is not freely available to general users. Despite a significant number of existing telemetric stations, these do not measure all the climatological parameters. There is also no technology for updating the information or interpreting it adequately.
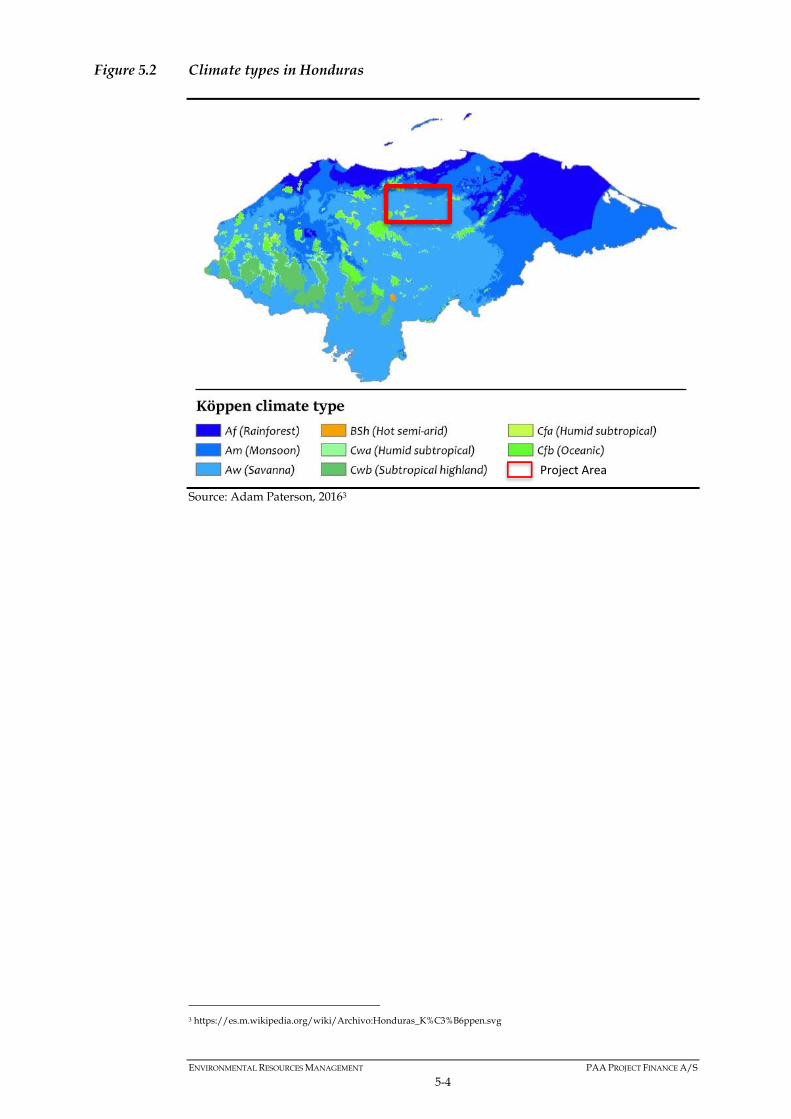
ENVIRONMENTAL RESOURCES MANAGEMENT PAA PROJECT FINANCE A/S
5-4
Figure 5.2 Climate types in Honduras
Source: Adam Paterson, 20163
3 https://es.m.wikipedia.org/wiki/Archivo:Honduras_K%C3%B6ppen.svg
Project Area

ENVIRONMENTAL RESOURCES MANAGEMENT PAA PROJECT FINANCE A/S
5-1
The climate in Honduras is characterized by three differentiated factors: (1) the Intertropical Convergence Zone of the Trade Winds (ITCZ) during the rainy season, when large amounts of rain falls due to tropical storms and hurricanes; (2) cold fronts and polar air masses accompanying the dry season; and (3) the national orography. Three main climate areas in Honduras (Asesora, 2009) are:
Lowlands along the Caribbean; Highlands in the interior of the country; and Lowlands along the Pacific Ocean characterized by a warm tropical
climate (average temperatures around 26ºC) that change gradually towards the interior of the country, where it is milder (temperatures ranging from 16ºC to 24ºC, although it can be colder than 16ºC at altitudes above 2,100 m ASL).
In the case of the climate conditions in the Project Area, located between the lowlands along the Caribbean and the highlands within the country, the presence of the Sierra Nombre de Dios is particularly significant. This mountain range acts as a barrier that prevents the humidity of the Atlantic Ocean reaching the area, making the climate warm and dry (Asesora, 2009). The following subsections provide specific information on the main parameters defining the climate conditions: temperature, rainfall, evapotranspiration, and a brief reference to extreme weather events. These are complemented with a subsection providing some key data on the climate parameters in the Olanchito municipality. Temperature
Figure 5.3 shows the average temperature in the Project Area, from 26 - 27°C.

ENVIRONMENTAL RESOURCES MANAGEMENT PAA PROJECT FINANCE A/S
5-2
Figure 5.3 Annual average temperature in the Project Area
Source: SINIT – National System of Territory Information (Sistema Nacional de Información Territorial) – modified by ERM, 2018
In addition to this, based on information provided by Dole Fruit Company, the minimum average temperature in the Coyoles is about 20°C, whilst the maximum average temperature is about 32.7°C. These temperatures are consistent with those described previously for lowlands (average temperatures around 26ºC). Figure 5.4 shows the temperature chart provided by Dole Fruit Company for the period 2000 – 2008 (Asesora, 2009).
Figure 5.4 Annual average minimum and maximum temperatures in Coyoles (municipality of Olanchito) (2000 – 2008)
Source: Asesora, 2009 – modified by ERM, 2018
ENVIRONMENTAL RESOURCES MANAGEMENT PAA PROJECT FINANCE A/S
5-3
Rainfall
The climate in Honduras is characterized by two differentiated seasons: rainy and dry, with a very variable rainfall distribution throughout the year. In summary:
Dry season in the Project Area occurs from January to April. In the rest of the year, the monthly rainfall ranges from 80 mm/month
to 160 mm/month (Asesora, 2009). June and September are the months with the highest rainfall. This rainy season is the result of the Inter-Tropical Convergence Zone of the Trade Winds (ITCZ) and the East Tropical Waves. These two phenomena simultaneously influence Central America, with the following rainfall pattern:
o They generate and maintain the rainy season across almost the entire country (Honduras), but with a lower intensity along the Atlantic coast.
o These two phenomena are most influential in June and September. Under their influence, the rains come in the form of storms with electrical activity and cumuliform clouds, increasing the average of rainy days.
o The east to west movement of the East Tropical Waves brings continuous rain to Honduras. Sometimes these waves intensify the effect of the ITCZ, generating “rainstorm” conditions. This effect is felt less in the Project Area than other parts of the country. When rain events last longer than 48 h, the risk of floods increases.
During July and August, there is a combination of the rainy season and a “heat wave” thanks to the Bermuda Anticyclone, a circulation of winds characteristic of a cold air mass that remain stationary over Bermuda. This anticyclone causes a decrease in rainfall in Honduras during July and August. However, this effect is not particularly evident in the Project Area, taking into account the local wind circulation and the presence of Sierra Nombre de Dios that acts as a barrier.
Figure 5.5 shows the months with the lowest level of rainfall, March (western section of the Project Area) and April (eastern section of the Project Area).

ENVIRONMENTAL RESOURCES MANAGEMENT PAA PROJECT FINANCE A/S
5-4
Figure 5.5 Months with least rainfall
Source: SINIT – National System of Territory Information (Sistema Nacional de Información Territorial) – modified by ERM, 2018
Rainfall in the Project Area is affected by the Sierra Nombre de Dios mountain range, which prevents the humidity from the Atlantic Ocean reaching the Project Area. Because of this, the annual rainfall in the Project Area is only about a third of that recorded north of the Sierra Nombre de Dios, next to the Caribbean Sea (Atlantic Ocean), as described below. Figure 5.6 shows the average rainfall in the Project Area, which ranges from 900 mm/year in the western section to 1,700 mm in the eastern section of the Project Area. This range is much lower than the rainfall observed in the basin north of the Sierra Nombre de Dios, where it rains more than 2,500 mm/year (maximum isocline: 3,500 mm). This basin to the north of the Sierra Nombre de Dios is located about 20 km from the western border of the Project Area, showing how clearly the mountain range affects the precipitation in the Project Area.

ENVIRONMENTAL RESOURCES MANAGEMENT PAA PROJECT FINANCE A/S
5-5
Figure 5.6 Average rainfall in the Project Area (shown by isoclines)
Source: SINIT – National System of Territory Information (Sistema Nacional de Información Territorial) – modified by ERM, 2018
In addition to this, information provided by Dole Fruit Company (Asesora, 2009) shows the average rainfall ranged from less than 400 mm/year in 2000 to less than 1,400 mm/year in 2005 in Coyoles (see Figure 5.7).
Figure 5.7 Yearly rainfall in Coyoles (Olanchito municipality) (2000 – 2008)
Source: Asesora, 2009 – modified by ERM, 2018

ENVIRONMENTAL RESOURCES MANAGEMENT PAA PROJECT FINANCE A/S
5-6
Additional rainfall data from Coyoles is included in Table 5.1. The annual rainfall can be seen to range from 800 mm to 1,400 mm in the period 1985 -2012.
Table 5.1 Rainfall in the Project Area
Pd. Prom 10 years Total Rainfall (mm) 85-94 95-04 2005 2006 2007 2008 2009 2010 2011 2012
1 45.36 59.60 56.71 37.50 51.93 62.38 39.00 34.83 117.21 63.29 2 22.00 53.57 8.92 49.31 31.31 22.63 84.50 33.95 19.63 34.92 3 33.97 37.22 33.90 3.89 66.65 53.68 16.63 49.88 15.02 54.33 4 14.84 24.57 9.46 19.63 20.65 56.75 21.88 115.32 0.75 30.38 5 22.73 51.83 33.05 66.16 4.75 4.75 113.38 51.46 57.79 95.779 6 86.84 107.53 207.80 201.02 195.75 153.00 37.88 168.92 155.24 265.42 7 81.83 92.05 123.58 108.27 93.00 91.50 89.00 129.21 83.67 61.33 8 108.71 105.54 112.56 101.29 69.43 106.38 51.38 118.49 74.58 56.00 9 88.87 94.82 67.21 115.68 128.88 53.75 146.88 121.78 74.58 102.50 10 120.99 108.15 184.23 74.05 117.50 188.38 71.63 254.92 135.08 80.83 11 128.52 152.15 151.55 97.14 79.50 375.95 101.88 63.97 237.58 87.29 12 94.35 100.74 299.78 42.79 144.43 62.38 50.92 56.11 36.83 89.79 13 71.16 53.33 53.01 139.37 27.13 38.00 50.33 32.46 51.75 39.75
Tot. 920.17 1041.10 1341.73 1056.08 1030.89 1269.50 881.25 1231.28 1059.72 1061.63
Source: CINSA and PAA Project Finance, 2017
Coyoles is a community located in the central section of the Project Area, as shown in Figure 5.8.
Figure 5.8 Location of Coyoles
Source: ERM, 2018

ENVIRONMENTAL RESOURCES MANAGEMENT PAA PROJECT FINANCE A/S
5-7
Evapotranspiration and relative humidity
According to Asesora (2009), the evapotranspiration in the Project Area ranges between 1,400 mm/year and 1,600 mm/year. The high levels of evapotranspiration compared to low rainfall values (about 900 mm/year) result in a situation of water deficit for the vegetation, especially during the dry season. In addition, the annual relative humidity is 72.3%. Figure 5.9 shows the potential evapotranspiration in the Project Area.
Figure 5.9 Potential evapotranspiration in the Project Area
Source: SINIT – National System of Territory Information (Sistema Nacional de Información Territorial) – modified by ERM, 2018
Extreme weather events
Hurricanes and tropical storms occur most often between June and October. However, this varies substantially from year to year. Regular events do not alter the country’s general climate and their influence is limited to short periods (displacement though the Honduras Gulf). However, in some cases, these extreme weather events can be catastrophic, as in the case of Hurricane Fifi (1974) and Hurricane Mitch (1998), which had dramatic consequences including thousands of deaths, massive damage to the country’s economy and infrastructures, failure of the water supply, and disease. As in the rest of Central America, the El Niño climate phenomenon results in changes to the meteorological conditions: if El Niño is very intense, the likelihood of hurricanes and tropical storms in the Atlantic is lower and therefore, the average rainfall is lower, especially along the Pacific Coast.
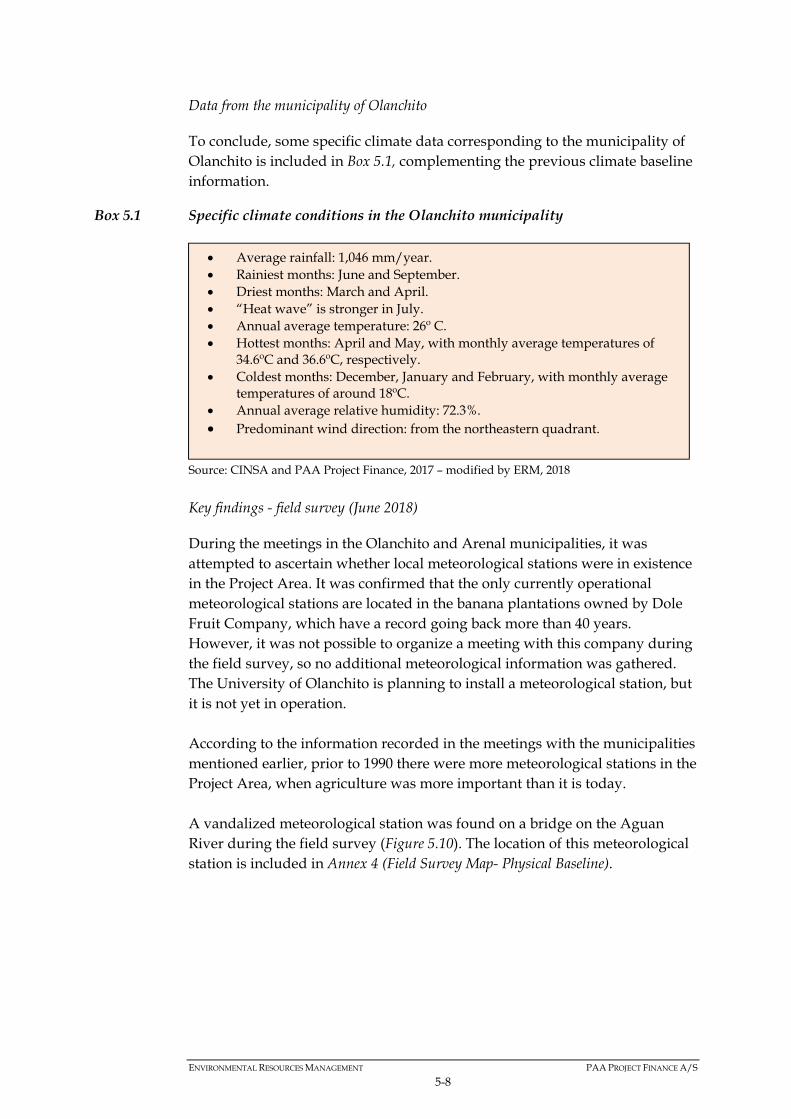
ENVIRONMENTAL RESOURCES MANAGEMENT PAA PROJECT FINANCE A/S
5-8
Data from the municipality of Olanchito
To conclude, some specific climate data corresponding to the municipality of Olanchito is included in Box 5.1, complementing the previous climate baseline information.
Box 5.1 Specific climate conditions in the Olanchito municipality
Source: CINSA and PAA Project Finance, 2017 – modified by ERM, 2018
Key findings - field survey (June 2018)
During the meetings in the Olanchito and Arenal municipalities, it was attempted to ascertain whether local meteorological stations were in existence in the Project Area. It was confirmed that the only currently operational meteorological stations are located in the banana plantations owned by Dole Fruit Company, which have a record going back more than 40 years. However, it was not possible to organize a meeting with this company during the field survey, so no additional meteorological information was gathered. The University of Olanchito is planning to install a meteorological station, but it is not yet in operation. According to the information recorded in the meetings with the municipalities mentioned earlier, prior to 1990 there were more meteorological stations in the Project Area, when agriculture was more important than it is today. A vandalized meteorological station was found on a bridge on the Aguan River during the field survey (Figure 5.10). The location of this meteorological station is included in Annex 4 (Field Survey Map- Physical Baseline).
Average rainfall: 1,046 mm/year. Rainiest months: June and September. Driest months: March and April. “Heat wave” is stronger in July. Annual average temperature: 26º C. Hottest months: April and May, with monthly average temperatures of
34.6ºC and 36.6ºC, respectively. Coldest months: December, January and February, with monthly average
temperatures of around 18ºC. Annual average relative humidity: 72.3%. Predominant wind direction: from the northeastern quadrant.

ENVIRONMENTAL RESOURCES MANAGEMENT PAA PROJECT FINANCE A/S
5-9
Figure 5.10 View of the vandalized meteorological station in the Aguan River
Source: ERM, 2018
5.3.2 Air quality, GHG emissions and climate change
Overview
Information on air quality in Honduras and specifically in the Project Area is very scarce. Honduras is reported to have only one air quality station, located in Tegucigalpa (UNEP, 2015). An article published by the Mario Molina Centre in 2008 (National Plan for Air Quality Management in Honduras) provides an overview of the air quality in Honduras. According to this article, in Honduras the air quality has been monitored by CESCCO (Pollutant Control and Study Centre) since 2001, after the installation of four automatic monitoring stations: three in Tegucigalpa and one in San Pedro Sula. However, these were not in operation due to a lack of maintenance and trained personnel. The same article explains that there are no air quality standards to enable limits to be set to protect the population from the harmful impacts of air pollutants (total suspended particles, TSP; and particulate matter of less than 10 micrometres, PM10). The article reports that these two parameters are more than 9 and 4 times, respectively, above the average annual limits set by the World Health Organization (WHO). However, these values should onlybe considered representative of the air quality conditions in large cities, such as San Pedro Sula and Tegucigalpa, where the monitoring stations were located. The Department of Statistics from the Ministry of Health provided the following data about air quality in Honduras:
In 2004, it reported that there were more than one million cases of respiratory diseases in Honduras.
27% of these diseases occurred in Tegucigalpa, the majority in children aged less than 5 years old.

ENVIRONMENTAL RESOURCES MANAGEMENT PAA PROJECT FINANCE A/S
5-10
In 2007, the World Bank estimated that more than 500 premature deaths per year could be attributed to urban air pollution in Honduras.
The costs associated with indoor air pollution are as much as 59.3 million dollars a year.
In addition to this, the number of deaths attributable to air pollution in Honduras has risen from 3,978 in 2000 to 4,507 in 2016
Air emission sources in Honduras
According to the 2008 publication by the Mario Molina Centre (National Plan for Air Quality Management in Honduras), the main air emissions sources in Honduras are the transport and electricity sectors. These two activities, together with mining, are the largest fossil fuel consumers in the country. Of these air emissions sources, only transport and electricity were identified in the Project Area. In the case of transport, it was estimated that the number of vehicles could double in the next five years, since distances travelled are increasing due to urban sprawl. Furthermore, there is a high proportion of vehicles around 10-years old with no emissions control equipment. This, along with the use of high-sulphur fuels and poor maintenance practices, results in the transport sector being an important source of atmospheric smoke and gaseous pollutants. As for the electricity sector, energy consumption is growing rapidly in the country. Historically, Honduras generated electricity through hydroelectric power stations. However, over the last 15 years, these have been displaced by thermal power stations, which are now the main source of electricity in the country. This resulted in the quantity of fuel consumed between 2001 and 2006 doubling. Air quality conditions in Honduras
As described in the 2008 publication by the Mario Molina Centre (National Plan for Air Quality Management in Honduras), particulate matter (measured as TSP and PM10) concentrations measured (e.g., in Tegucigalpa) exceed the air quality standards established in other countries and the WHO standards. The main reasons for this exceedance are likely to be emissions generated by urban transport, re-suspension of dust in the streets, unpaved street emissions and eroded areas, and lime and brick kiln plants operating in urban surroundings. In addition to the poor air quality conditions reported in urban areas in Honduras, rural areas also face problems of air quality because of forest fires and agricultural burning, which produce emissions of suspended particles.

ENVIRONMENTAL RESOURCES MANAGEMENT PAA PROJECT FINANCE A/S
5-11
Table 5.2 includes an additional overview of the air quality in Honduras.
Table 5.2 Overview of the Air Quality in Honduras
Current Status Policies and Programmes General overview Ranked 23rd worst country for air
pollution by the WHO, mainly due to transport and electricity generation.
Indoor air pollution is an issue in rural areas.
Insufficient resources for monitoring and enforcement.
Air quality monitoring system only in Tegucigalpa.
Lack of National Ambient air quality standards.
Lack of National Air Quality Policy. Environmental Policy provides
general objectives but does not provide specific goals.
No legislation for managing air quality.
National Plan for Air Quality Management provides suggestions with regard to urban transport, land use planning, cleaner production, and energy efficiency improvements.
Emissions from industries Industries with the potential to impact
air quality: mining (gold, silver, lead, zinc, cadmium); brick kilns.
Industry share of GDP ($19 billion): 27%.
Electricity sources: petrol power plants (53%), hydro (42%), coal, gas, co-generation.
Since 2011, the regulation "For the Control of Emissions from Stationary Sources" has set parameters per industry and type of fuel used, as well as sensitive areas.
No regulation for emissions from small installations.
National renewable energy target of 60% electricity from renewable sources by 2022; renewable energy law provides income tax and customs tax exemptions, but does not address off-grid power plants and so favours larger, grid-connected plants; the sustainable energy action plan also does not promote off-grid projects; recently inaugurated the largest photovoltaic park in Latin America.
No tax incentives for energy efficiency measures, such as: subsidies, labelling, rebates, etc.
Small tax incentives for clean production and installation of pollution prevention technologies.
Emissions from transport Key transport-related air quality challenges: No emission standards. Growing fleet. Possibly high-sulphur fuel.
No vehicle emission limit: since 1999, regulation "To adjust Gas Emissions Pollutants and Smoke from motor vehicles". This regulation should be reviewed, since it has never been achieved in the absence of technical and technological capacities.
Fuel sulphur content: 5,000 ppm (fuel is imported, so could lower standard).
Restriction on used car importation: vehicles more than 7 years old (10
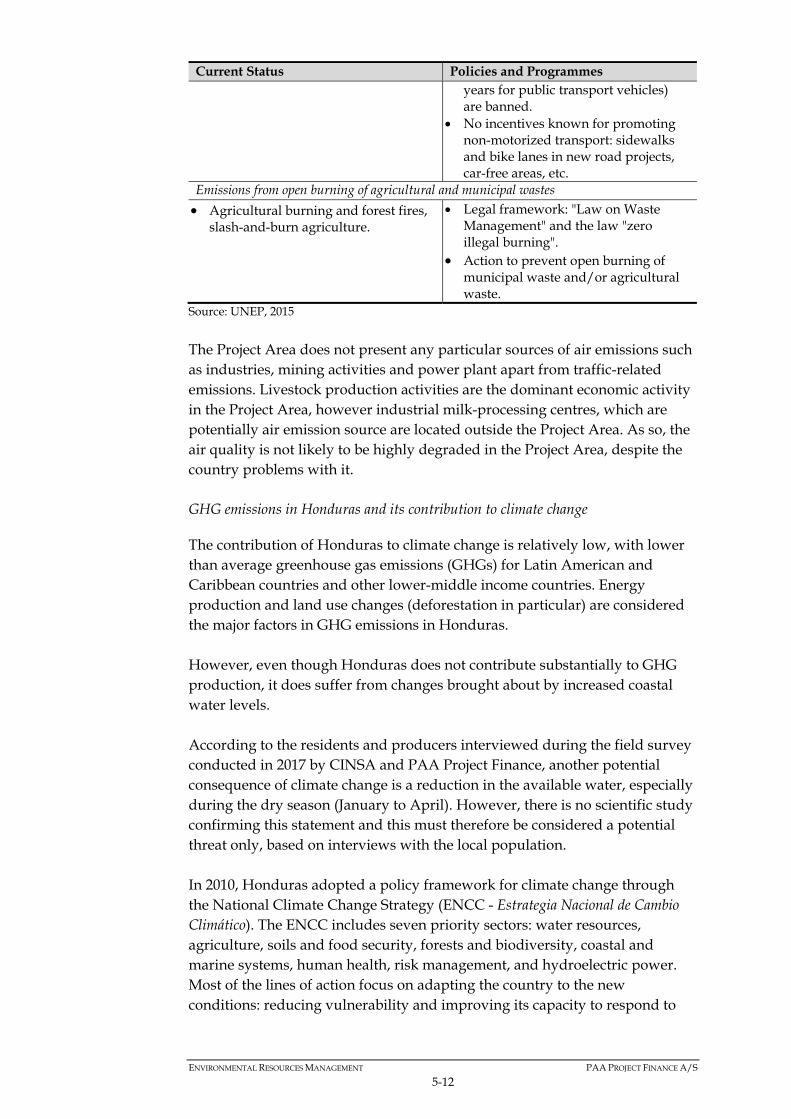
ENVIRONMENTAL RESOURCES MANAGEMENT PAA PROJECT FINANCE A/S
5-12
Current Status Policies and Programmes years for public transport vehicles) are banned.
No incentives known for promoting non-motorized transport: sidewalks and bike lanes in new road projects, car-free areas, etc.
Emissions from open burning of agricultural and municipal wastes Agricultural burning and forest fires,
slash-and-burn agriculture. Legal framework: "Law on Waste
Management" and the law "zero illegal burning".
Action to prevent open burning of municipal waste and/or agricultural waste.
Source: UNEP, 2015
The Project Area does not present any particular sources of air emissions such as industries, mining activities and power plant apart from traffic-related emissions. Livestock production activities are the dominant economic activity in the Project Area, however industrial milk-processing centres, which are potentially air emission source are located outside the Project Area. As so, the air quality is not likely to be highly degraded in the Project Area, despite the country problems with it. GHG emissions in Honduras and its contribution to climate change
The contribution of Honduras to climate change is relatively low, with lower than average greenhouse gas emissions (GHGs) for Latin American and Caribbean countries and other lower-middle income countries. Energy production and land use changes (deforestation in particular) are considered the major factors in GHG emissions in Honduras. However, even though Honduras does not contribute substantially to GHG production, it does suffer from changes brought about by increased coastal water levels. According to the residents and producers interviewed during the field survey conducted in 2017 by CINSA and PAA Project Finance, another potential consequence of climate change is a reduction in the available water, especially during the dry season (January to April). However, there is no scientific study confirming this statement and this must therefore be considered a potential threat only, based on interviews with the local population. In 2010, Honduras adopted a policy framework for climate change through the National Climate Change Strategy (ENCC - Estrategia Nacional de Cambio Climático). The ENCC includes seven priority sectors: water resources, agriculture, soils and food security, forests and biodiversity, coastal and marine systems, human health, risk management, and hydroelectric power. Most of the lines of action focus on adapting the country to the new conditions: reducing vulnerability and improving its capacity to respond to

ENVIRONMENTAL RESOURCES MANAGEMENT PAA PROJECT FINANCE A/S
5-13
weather phenomena. In addition, a GHG emissions inventory was prepared in Honduras, as described at the end of this section. The report “Honduran agriculture and climate change. Where are the priorities for adaptation?” (CGIAR, CCAFS, 2015) assessed the vulnerability of Honduran municipalities to climate change. The main conclusions of this report with regard to climate change were the following:
Honduras is considered to have the highest vulnerability to climate change in Central America.
Climate change effects (increasing temperatures and decreasing rainfall) will have a significant impact on the agriculture sector in the country.
The agriculture sector in the Olanchito and Arenal municipalities is considered to have low vulnerability within Honduras.
The rural population in the Olanchito and Arenal municipalities is considered highly adaptable, based on access to basic services, innovative resources, and organizational and working capacities.
Climatological data analysis for assessing the climate change occurring in the country is not feasible taking into account the lack of long-term historical climatological data records and universal accessibility (see Section 5.3.1). For example, it apparently rains more now, but the data sets are too short to be able to confirm this statistically (e.g., according to Table 5.1, the rainfall in 2012 was similar to the rainfall in the period 1995-2004). In general, to be able to reach definitive conclusions, high-quality information spanning a longer period is needed, and this is not possible in Honduras. The National Autonomous University of Honduras has conducted some research in this area, but their studies are not conclusive and have not been able to establish representative climate scenarios due to the lack of meteorological data, hyetographs, and so on. Some additional data (Table 5.3) on climate change is available from the UNDP website (United Nations Development Programme).
Table 5.3 GHG emissions in Honduras
Parameter Value Baseline GHG emissions (LULUCF sector - Land Use, Land-Use Change and Forestry)
3,749.83 Gg CO2 equivalent (2010)
GHG emissions objective for 2021
3,562.34 Gg CO2 equivalent
Difference 187.49 Gg CO2 equivalent Reduction needed 5%
Source: UN website (http://hn.one.un.org/content/unct/honduras/es/home/manud/tasa-de-asistencia-escolar18.html)
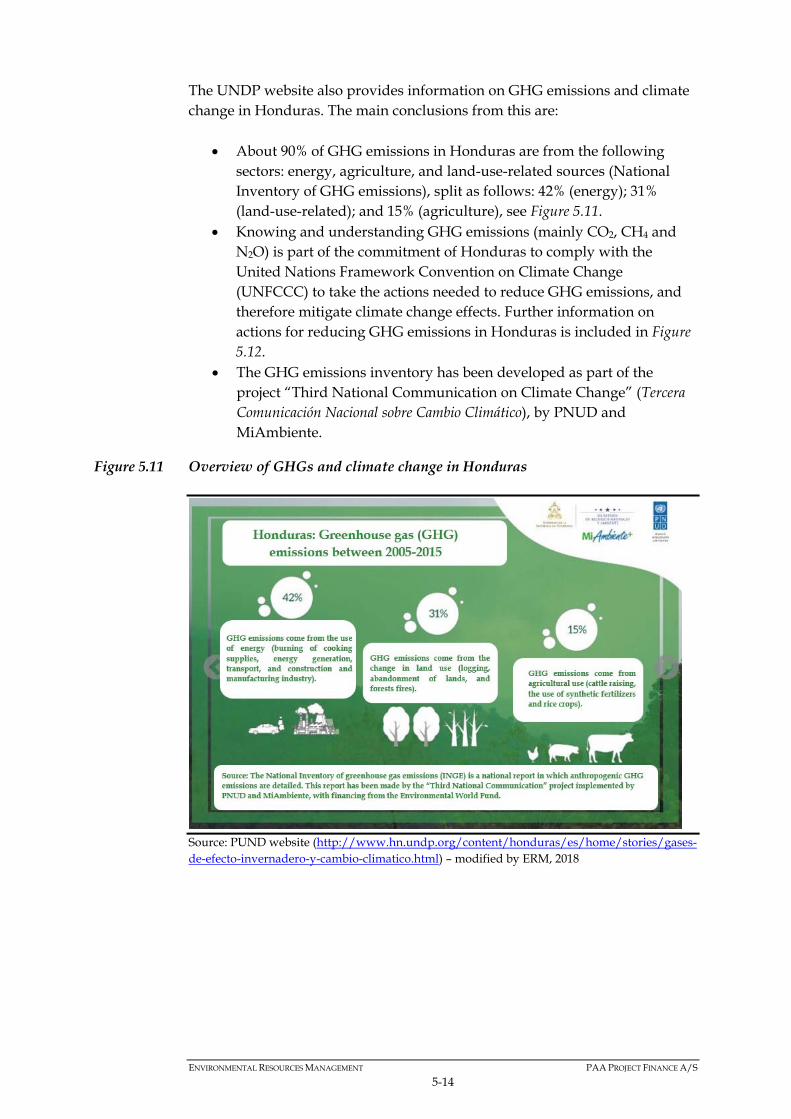
ENVIRONMENTAL RESOURCES MANAGEMENT PAA PROJECT FINANCE A/S
5-14
The UNDP website also provides information on GHG emissions and climate change in Honduras. The main conclusions from this are:
About 90% of GHG emissions in Honduras are from the following sectors: energy, agriculture, and land-use-related sources (National Inventory of GHG emissions), split as follows: 42% (energy); 31% (land-use-related); and 15% (agriculture), see Figure 5.11.
Knowing and understanding GHG emissions (mainly CO2, CH4 and N2O) is part of the commitment of Honduras to comply with the United Nations Framework Convention on Climate Change (UNFCCC) to take the actions needed to reduce GHG emissions, and therefore mitigate climate change effects. Further information on actions for reducing GHG emissions in Honduras is included in Figure 5.12.
The GHG emissions inventory has been developed as part of the project “Third National Communication on Climate Change” (Tercera Comunicación Nacional sobre Cambio Climático), by PNUD and MiAmbiente.
Figure 5.11 Overview of GHGs and climate change in Honduras
Source: PUND website (http://www.hn.undp.org/content/honduras/es/home/stories/gases-de-efecto-invernadero-y-cambio-climatico.html) – modified by ERM, 2018

ENVIRONMENTAL RESOURCES MANAGEMENT PAA PROJECT FINANCE A/S
5-15
Figure 5.12 Actions planned for reducing GHG emissions in Honduras
Source: PUND website (http://www.hn.undp.org/content/honduras/es/home/stories/gases-de-efecto-invernadero-y-cambio-climatico.html) – modified by ERM, 2018
Key findings - field survey (June 2018)
Three main observations potentially related to climate change were reported during the field survey conducted in June 2018:
Lack of availability of water, especially in the dry season (January to April), when the need for water is higher to keep the forage in good conditions (this was also reported during the field survey conducted in 2017).
Dry and rainy seasons are less stable now (more unpredictable) which affects the annual planning of the farmers. Because of this, some crops can only have one cycle per year (from seeding to harvesting), although in the past two cycles were possible.
The main sources of GHGs observed during the field survey were road traffic and cattle raising.
As described previously, in the absence of scientific studies confirming these statements, they are to be considered potential issues based on interviews with the local population.
5.3.3 Acoustic environment
Information on the acoustic environment in Honduras, and specifically the Project Area, is very scarce. Therefore, this section includes a general noise baseline description limited to expected noise conditions in different types of environments (urban areas, rural areas and remote areas). No noise recording was performed during the field surveys. However, Project activities are

ENVIRONMENTAL RESOURCES MANAGEMENT PAA PROJECT FINANCE A/S
5-16
unlikely to significantly affect the acoustic baseline conditions, so a general description is considered sufficient. It is expected that noise levels in urban areas (e.g., Tegucigalpa) are high, taking into account the typically dense traffic: levels around 75 dBA are common in busy urban areas, and levels up to 85 dBA occur near major freeways and airports. In very remote areas, far from any human activities, the sound level is determined by natural sources such as water (rain, rivers and waterfalls), and the wind making waves and blowing through the vegetation. The Project Area is located in a rural area, characterized by relatively low ambient noise levels, particularly at night. However, some noise sources (e.g., traffic) are present, but these are more limited than in the urban areas. In small towns (e.g., Olanchito), the noise levels are likely to be around 50 or 60 dBA, being higher at day than at night. In wilderness areas (e.g., protected areas) or remote rural areas (sparsely populated areas, such as small communities and farms in the Project Area), the noise levels may be below 27 dBA (night) and 30 dBA (day)1.
5.3.4 Topography
Overview
Figure 5.13 and Figure 5.14 show the topography in the Project Area. It can be seen that most of the Project Area is relatively flat, corresponding to the bottom of the Aguan River Valley. The upper section of the Aguan River Valley (west section of the Project Area), has an altitude of about 500 m ASL, whilst the lower section (east section of the Project Area), has an altitude of about 100 m ASL. The Project Area is surrounded by hills and mountains on both sides of the valley: those in the north correspond to the Sierra Nombre de Dios and those in the south correspond to the Sierra La Esperanza.
1 Waugh, D. Durucan, S. Korre, A. Hetherington, O. O’Reilly, B. Environmental Quality Objectives – Noise in Quiet Areas, Report 2000-MS-14-M1, EPA-Ireland

ENVIRONMENTAL RESOURCES MANAGEMENT PAA PROJECT FINANCE A/S
5-17
Figure 5.13 Topography in the Project Area (western section)
Source: Integra Ingeniería, 2017 – modified by ERM, 2018
Figure 5.14 Topography in the Project Area (eastern section)
Source: Integra Ingeniería, 2017 – modified by ERM, 2018 Figure 5.15 shows a Google Earth Pro view of the overall topography of the Project Area, showing that the Aguan River Valley, where the Project Area is located, is very flat.

ENVIRONMENTAL RESOURCES MANAGEMENT PAA PROJECT FINANCE A/S
5-18
Figure 5.15 Topography in the Project Area – Google Earth Pro
Source: Google Earth Pro – modified by ERM, 2018 Key findings - field survey (June 2018)
No specific observations on topography were recorded during the field survey conducted, taking into account the fact that no significant impact on the topography of the Project Area is expected as a result of the Project activities. The following photographs (Figure 5.16) confirm the flat topography of the Project Area. They show the main road crossing the Aguan River Valley, surrounded by mountain chains on either side of the valley.
Figure 5.16 Panoramic photographs taken in the Project Area
Source: ERM, 2018

ENVIRONMENTAL RESOURCES MANAGEMENT PAA PROJECT FINANCE A/S
5-19
5.3.5 Geology
National geological context
Honduras is located on the Palaeozoic basement Chortis Block (Bloque Chortis). This block comprises variably metamorphosed sedimentary rocks. There are two main types of rocks: phyllites (filitas) and granitic schists (esquistos graníticos). Other rocks with different levels of metamorphism may occur, such as gneiss, migmatite, quartzite, and marble. This group of facies is known as the Cacaguapa Group or Cacaguapa Schists, and is present throughout the country (see blue polygon in Figure 5.17). Mesozoic and Cenozoic sedimentary materials lie discordantly above this Palaeozoic basement. The Mesozoic sediments are from the Jurassic and Lower Cretaceous periods and were deposited under continental or shallow marine conditions. They are known as the Honduras Group (see red polygon in Figure 5.17). During the Upper Cretaceous some carbonate rocks (limestone) formed, followed by detritic deposition. The limestones are shallow water reefal limestone, known as the Yojoa Group (see green polygon in Figure 5.17). The detritic rocks comprise conglomerates, sandstones, marls, and limestones, and are known as the Angels Valley Group (see orange polygon in Figure 5.17). Volcanic processes occurred during the Tertiary. These resulted first in the Matagalpa Group, a volcanic pre-ignimbrite unit found discordantly overlying the Cretaceous rocks. It is a basic unit with predominant andesites, basalts, and pyroclastic flows (see purple polygon in Figure 5.17). Overlying the Matagalpa Group is the Padre Miguel Group consisting of ignimbrites, rhyolitic tuffs, and andesitic tuffs (see pink polygon in Figure 5.17). At the end of the Tertiary, there was uplift of the Chortis Block and the previously described facies were eroded. Products resulting from this erosion were transported and sedimented in low basins, mostly along the coast. Finally, during the Quaternary, basalts were extruded in several areas of Honduras. The most recent materials include detritic sediments formed in alluvial, deltaic and colluvial environments (see yellow polygon in Figure 5.17). Figure 5.17 depicts the stratigraphic column for Honduras, showing all the geological groups described above.

ENVIRONMENTAL RESOURCES MANAGEMENT PAA PROJECT FINANCE A/S
5-20
Figure 5.17 Stratigraphic column of Honduras
Note: Text is in Spanish, see description provided in the main text in English. Source: Honduras stratigraphic column. Modified by Rogers, R.D. (1992) and Serna, Geominh-BRGM (1987-1992) – Modified by ERM, 2018
Local geological context
The geology of the Project Area is shown in Figure 5.18, Figure 5.19 and Figure 5.20.

ENVIRONMENTAL RESOURCES MANAGEMENT PAA PROJECT FINANCE A/S
5-21
Figure 5.18 Geology of the Project Area (general view)
Source: Integra Ingeniería, 2017 - modified by ERM, 2018
Figure 5.19 Geology – zoom in view (western section)
Source: Integra Ingeniería, 2017 - modified by ERM, 2018

ENVIRONMENTAL RESOURCES MANAGEMENT PAA PROJECT FINANCE A/S
5-22
Figure 5.20 Geology – zoom in view (eastern section)
Source: Integra Ingeniería, 2017 - modified by ERM, 2018
The following geological units are found in the Project Area:
Palaeozoic materials of the Chortis Block (Palaeozoic basement) (see “Pzm” in the geology map legends). Outcrops of this unit are found in the western section of the Project Area, in the hills around the valley: the Cacaguapa Group or Cacaguapa Schists formed by metamorphic materials, mostly schists, slates, quartzite and gneiss. This unit acts as a basement, overlain by the other units in the Project Area (valley and hills). Outcrops of this unit within the Project Area only represent 3.5% of the total surface area of the Project Area.
Angels Valley Group (see “Kva” in the geology map legends): reddish clastic layers (continental origin) deposited during the Cretaceous. They mostly comprise quartz conglomerates in a cemented matrix, together with reddish sands and clays; these have some surficial porosity but are quite compacted too. Outcrops of this unit are found in the eastern section of the Project Area, mostly in the hills in the south of the valley, and they represent 0.4% of the total surface area of the Project Area.
Cretaceous plutonic intrusions (see “KTi” and “Ki” in the geology map legends): monzogranitic composition. Found in fractures and between metasediment strata. Outcrops of this unit follow the undifferentiated plutonic rocks found in the hills in the south of the valley; they are not found in the Project Area, but about 5 km to the south.
Undifferentiated plutonic rocks (see “Tv” in the geology map legends): rhyolitic ignimbrites with quartz phenocrysts. This unit replaces the Palaeozoic basement in the eastern section of the Project Area.

ENVIRONMENTAL RESOURCES MANAGEMENT PAA PROJECT FINANCE A/S
5-23
Outcrops of this unit are found in the central section of the Project Area, in the hills around the valley; and in the eastern section of the Project Area, in the hills to the north of the valley. They represent 4.7% of the total surface area of the Project Area
Alluvial deposits (see “QA” in the geology map legends): materials in the alluvial plain of the Aguan River and its tributaries. They are composed mainly of gravels and gravels with silts. This is the predominant geological unit in the Project Area. There is no available information on the thickness of this unit. However, according to some records from abstraction wells in the Project Area (see Annex 4), the thickness of this unit is at least 20-40 m (the gravel levels of the lithological profile correspond to the alluvial deposits, while the clays define the beginning of a different unit). These alluvial deposits represent 91.4% of the total surface area of the Project Area.
In conclusion, the Aguan River and its valley are likely to be associated to a tectonic line oriented approximately east-west. This directional pattern (east to west) can also be seen in the distribution of some of the geological materials, such as the Angels Valley Group (Kva) and the Cretaceous plutonic intrusions (KTi).
5.3.6 Soils
Overview
The types of soils in Honduras are shown in Figure 5.21, whilst Figure 5.22 and Figure 5.23 show the types of soils in the Project Area. Three main types of soils occur in the Project Area:
Alluvial soils: found in the vicinity of the Aguan River. These have a well-drained fine texture referred to as AF soils in the Simmons soil classification and described as sandy and silty soils, with gravels and cobbles, with a yellow to grey colour. These soils are usually good for agriculture and although they are well drained, during the rainy season puddles may be produced on the surface. Alluvial soils occupy 50.3% of the Project Area.
Surrounding the alluvial soils and associated with the slopes is a strip formed by the so-called Jacaleapa and Yaruca soils. Both are lithosols (i.e., soils with a high stone content or thin soils on rock). According to the potential soil use scale, they are classified as type VII (potential use for pasture and selective forest use). They are described as being not very deep, formed above a substrate of metamorphic igneous rocks. Jacaleapa soils occupy 23.9% of the Project Area, and Yaruca soils occupy 24.5%.
There are two additional categories of soils: valley soils and Tomala soils. However, these are found very residually, and occupy less than 1% of the total surface area of the Project Area.
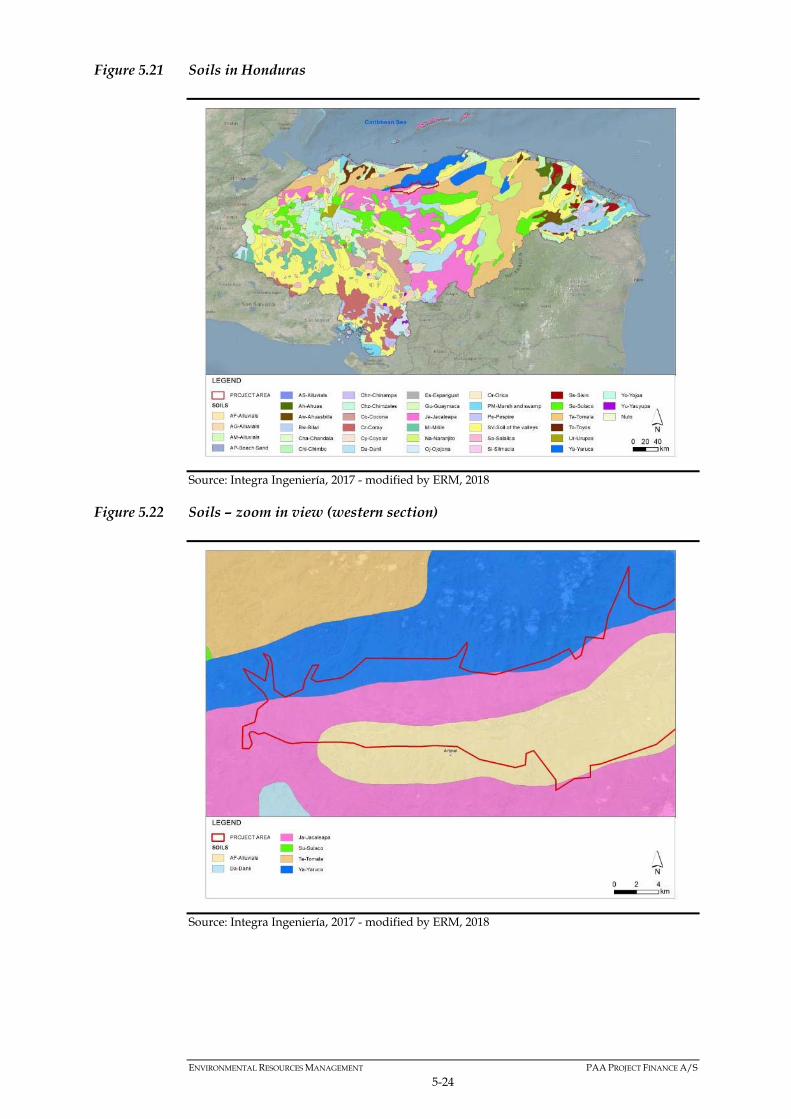
ENVIRONMENTAL RESOURCES MANAGEMENT PAA PROJECT FINANCE A/S
5-24
Figure 5.21 Soils in Honduras
Source: Integra Ingeniería, 2017 - modified by ERM, 2018
Figure 5.22 Soils – zoom in view (western section)
Source: Integra Ingeniería, 2017 - modified by ERM, 2018

ENVIRONMENTAL RESOURCES MANAGEMENT PAA PROJECT FINANCE A/S
5-25
Figure 5.23 Soils – zoom in view (eastern section)
Source: Integra Ingeniería, 2017 - modified by ERM, 2018
Key findings - field survey (June 2018)
The field survey conducted in 2018 was aimed at gathering information on: (1) the soil quality conditions in the Project Area, in particular with regard to the potential effect on soil quality resulting from erroneous use of chemical products typically employed in the agricultural sector: fertilizers, pesticides, and herbicides; and (2) soil profiles. Table 5.4 summarizes the feedback received during the field survey regarding the use of chemical products (herbicides, pesticides, and fertilizers): although chemical products are commonly utilized on the farms in the Project Area, only small quantities are used.
Table 5.4 Use of chemical products (fertilizers, pesticides, and herbicides) in the Project Area
Source Feedback
Herbicides Pesticides Fertilizers
SAG Common use. Small quantities.
SENASA Low use: once every 6 months – 1.4 l/ha. In the dry season they are not needed, due the absence of herbaceous plants. In the rainy season, mechanical hand
Low use: once every 6 months - 1.4 l/ha. Use is not recommended. In the case of the pest Duplachinonaspis divergens a regular detergent only is
Urea is the most common product. Also, formula: 12/24/12 (N/P/K). Low use: once / year (rainy

ENVIRONMENTAL RESOURCES MANAGEMENT PAA PROJECT FINANCE A/S
5-26
Source Feedback
Herbicides Pesticides Fertilizers
tools are recommended for removing weeds.
recommended (non-hazardous for the environment). IPC management: integrated pest control by selection of resistant crop varieties also results in low levels of pesticides.
season) – 64 kg/ha.
Meeting with group of farmers (small property profile)
Low use, but more than pesticides.
Very low use, except in the banana plantations.
Low use. Organic fertilizers preferred (e.g. manure), as cheaper.
Visit to farm 30 (small property profile)
Combatran. - Urea and formula: 12/24/12 (N/P/K).
Visit to farm 71 (medium property profile)
Combatran. Low use: once/year – limited to 14 ha (total property is 56 ha) – 1.4 l/ha
- Urea and formula: 12/24/12 (N/P/K). Low use: once/year - 71 kg/ha
Visit to farm 108 (small property profile)
Roundup: to burn existing forage and plant new. Tordon: for weeds.
- Urea and formula: 12/24/12 (N/P/K). Medium use: urea (once / 40 days) and formula 12/24/12 (once / 25 days).
Visit to farm 128 (small property profile)
Plenum. Low use: twice / year – 1.2 l/ha. Hand tools to remove wild weeds.
- Urea. Low use: once to twice/year – 6 kg/ha.
Visit to farm 165 (large property profile)
Bullgrass. Low use: once / year.
- Urea and formula: 12/24/12 (N/P/K). Low use: limited to 2 plots with forage (camerun and suasi).
Source: Field survey, 2018
Based on the information gathered during the field survey through interviews with the local population, soil quality conditions can be expected to be good,

ENVIRONMENTAL RESOURCES MANAGEMENT PAA PROJECT FINANCE A/S
5-27
as no erroneous uses of chemical products were observed. Figure 5.24 includes a photograph of a herbicide container found on one of the farms visited.
Figure 5.24 Herbicide observed on a farm in the Project Area
Source: ERM, 2018
Two soil profiles were identified during the field survey where the horizons were exposed. In both cases the pedology comprised of gravels and pebbles with more sandy levels. Figure 5.25 includes a view of the two soil profiles. The location of these profiles is included in Annex 4 (Field Survey Map- Physical Baseline).
Figure 5.25 Soil profiles in the Project Area
Source: ERM, 2018

ENVIRONMENTAL RESOURCES MANAGEMENT PAA PROJECT FINANCE A/S
5-28
5.3.7 Hydrology
Overview
The Project Area is located in the macro-basin of the Aguan River, with a total surface area of about 10,266 km2. The Aguan River Valley itself has a total surface area of about 718 km2. The Aguan River Basin reaches its highest altitudes in Montaña Santa Bárbara (2,480 m ASL) and Pico Bonito (2,435 m ASL). The total length of the Aguan River is about 275 km. The Project Area is located at an average altitude of 100 – 300 m ASL in the lower part of the Aguan River Basin, close to the Caribbean Sea, into which the Aguan River flows, leading in Santa Rosa de Aguán municipality (located at about 90 km in NE direction from the Project Area). During the rainy season, the Aguan River occupies a wider section of the river bed and the water turns brown due to the sediments carried down by the tributaries in the hillsides. In the dry season (January to April), the flow decreases significantly and the riverbed narrows creating beaches more than 800 m wide. During the dry season the river runs clear. The Aguan River seems to be very dynamic with changes along its course and bars being formed from the sedimentary materials transported downstream. This type of river, in addition to the main watercourse, involves secondary courses that are followed occasionally based on water flow. These secondary courses can form isolated water bodies fed by the river. This can be seen from a review of the various historical aerial photographs. A good example is shown in Figure 5.26, where satellite photographs of one location (the Aguan River at the confluence with the San Lorenzo River) show two different years (1969 and 2011). These reveal several changes in the course followed by the river (some are highlighted with white arrows). Satellite photographs also show the wide fluvial bars in the dry season.

ENVIRONMENTAL RESOURCES MANAGEMENT PAA PROJECT FINANCE A/S
5-29
Figure 5.26 Aerial view of the Aguan River at the confluence with the San Lorenzo River in 1969 (top) and in 2011 (bottom)
Source: CINSA and PAA Project Finance, 2017 - modified by ERM, 2018
Figure 5.27 and Figure 5.28 show examples of fluvial bars and secondary watercourses.

ENVIRONMENTAL RESOURCES MANAGEMENT PAA PROJECT FINANCE A/S
5-30
Figure 5.27 Aerial view of fluvial bars
Source: Google Earth Pro - accessed and modified by ERM, 2018
Figure 5.28 Ground view of fluvial bars
Source: CINSA and PAA Project Finance, 2017
The Aguan River has many tributaries in the Project Area. Both the Aguan River and the main tributaries are highlighted in Figure 5.29. Table 5.5 shows the main tributaries both on the right and left side.
Table 5.5 Main Aguan River tributaries in the Project Area
Tributaries on the right side Tributaries on the left side Las Gemelas Stream
La Pita Stream Chiquito River San Marcos River
Zapamatepe Stream
El Higuero Stream San Lorenzo Stream and River
El Ojo Stream
El Terrero Stream El Saladillito Stream
San Felipe Stream San Juan River
30 m
150 m
Secondary water course Main water course
Fluvial bars

ENVIRONMENTAL RESOURCES MANAGEMENT PAA PROJECT FINANCE A/S
5-31
Tributaries on the right side Tributaries on the left side Seca Stream El Chile Stream El Barro Stream El Guayacan
Stream
Yaguala River Uluapa River La Chorrera Stream
Coyoles River
Cerritos Stream Potrerillos Stream Medina Stream Agalteca River
Puerto Escondido Stream
San Carlos Stream La Pimienta River Uchapa River
Mame River San Francisco River
Charatí Stream Uyuca River
Jaguaca River Santa Barbara River
Source: CINSA and PAA Project Finance, 2017 – Edited by ERM, 2018
The flow in the tributaries is very variable, as described previously, with a seasonal pattern. Table 5.6 provides the water flow of certain tributaries after the dry season.
Table 5.6 Water flow measured (May 2016) in some Aguan River tributaries in the Project Area
Tributary name Water flow (l/s)
San Marcos River 226
Uyuca River 600
Agalteca River 150
Coyoles River 27
San Marcos River 226
Jaguaca River 1,110
Source: CINSA and PAA Project Finance, 2017 – Edited by ERM, 2018
Table 5.7 and Table 5.8 provide information on the water flow in the Aguan River in two locations: Sabana Larga and Olanchito. The water flow in the Aguan River is significantly higher during the rainy season than during the dry season in the two locations, according to the average water flows presented in both Table 5.7 and Table 5.8. Figure 5.29 shows the location of Sabana Larga and Olanchito. Sabana Larga is situated on the western border of the Project Area, upstream of Olanchito, which is in the centre of the Project Area, about 45 km from Sabana Larga. Because of this, water flows measured in Olanchito are higher than those measured in Sabana Larga, since between Sabana Larga and Olanchito, the Aguan River receives additional water input from tributaries in the area.

ENVIRONMENTAL RESOURCES MANAGEMENT PAA PROJECT FINANCE A/S
5-32
Table 5.7 Water flow in the Aguan River (Sabana Larga)
Date Flow (m3/s)
Season Date Flow (m3/s)
Season
04/08/2000 6.92 Rainy 05/07/2005 12.12 Rainy 17/10/2000 22.15 Rainy 06/05/2006 6.03 Dry 08/05/2000 3.58 Dry 08/03/2007 23.19 Dry 12/06/2001 5.28 Rainy 08/08/2007 5.11 Rainy 21/06/2000 6.27 Rainy 15/12/2007 17.70 Rainy 23/09/2001 5.79 Rainy 07/03/2008 9.55 Dry 25/09/2001 4.74 Rainy 20/06/2008 6.93 Rainy 26/09/2001 6.46 Rainy 16/11/2008 42.15 Rainy 08/11/2001 116.19 Rainy 22/02/2009 16.36 Dry 23/08/2002 5.60 Rainy 24/05/2009 8.10 Dry 11/12/2002 8.73 Rainy 07/08/2009 11.20 Rainy 17/03/2003 6.91 Dry 11/11/2009 24.28 Rainy 01/07/2003 7.67 Rainy 21/04/2010 8.36 Dry 24/08/2003 7.60 Rainy 19/05/2010 7.33 Dry 27/08/2003 6.83 Rainy 21/10/2010 23.21 Rainy 08/10/2003 8.08 Rainy 06/03/2011 4.62 Dry 10/12/2003 33.84 Rainy 17/06/2011 4.97 Rainy 11/02/2004 10.37 Dry 23/08/2011 36.48 Rainy 24/03/2004 10.64 Dry 17/02/2010 8.19 Dry 12/05/2004 12.00 Dry 24/03/2004 15.76 Dry 26/04/2005 2.88 Dry
Average water flow during the dry season: 9.62 m3/s Average water flow during the rainy season: 23.22 m3/s
Notes: February to May (inclusive) are considered rainy season months, with regard to river flow. Although the dry season ends in April, values measured in May are more representative of the dry season than the rainy season. For the same reason, although the dry season starts in January, the values measured in January are more representative of the rainy season than the dry season. Source: CINSA and PAA Project Finance, 2017 – modified by ERM, 2018
Table 5.8 Water flow in the Aguan River (Olanchito)
Date Flow (m3/s) Season Date Flow (m3/s) Season 07/05/2001 10.09 Dry 10/02/2004 25.44 Dry 12/06/2001 16.61 Rainy 23/03/2004 26.17 Dry 21/06/2001 13.41 Rainy 12/05/2004 25.51 Dry 23/09/2001 31.89 Rainy 24/11/2004 30.87 Rainy 25/09/2001 23.51 Rainy 26/04/2005 7.78 Dry 26/09/2001 19.44 Rainy 05/07/2005 37.49 Rainy 22/08/2002 18.58 Rainy 05/05/2006 13.32 Dry 13/12/2002 20.37 Rainy 08/08/2007 32.34 Rainy 18/03/2003 16.81 Dry 22/05/2009 40.88 Dry 09/07/2003 24.13 Rainy 07/08/2009 25.92 Rainy 23/08/2003 36.62 Rainy 21/04/2010 32.19 Dry 24/08/2003 31.52 Rainy 07/04/2011 11.26 Dry 9/10/2003 30.24 Rainy 18/06/2011 24.64 Rainy
10/12/2003 85.86 Rainy 24/08/2011 72.67 Rainy Average water flow during the dry season: 20.95 m3/s Average water flow during the rainy season: 32.00 m3/s
Notes: February to May (inclusive) are considered rainy season months, with regard to river flow. Although the dry season ends in April, values measured in May are more representative of the dry season than the

ENVIRONMENTAL RESOURCES MANAGEMENT PAA PROJECT FINANCE A/S
5-33
rainy season. For the same reason, although the dry season starts in January, the values measured in January are more representative of the rainy season than the dry season. Source: CINSA and PAA Project Finance, 2017 – modified by ERM, 2018
Figure 5.29 Aguan River and its tributaries in the Project Area
Source: ERM, 2018
The water flow in the Aguan River comes from two main sources: tributaries flowing towards this river; and groundwater flow towards the river from the alluvial aquifer located in the bottom of the valley (see Section 5.3.8). Water from the Aguan River is mainly used by the agricultural sector, but it is also a drinking water source in the upper areas of its tributaries. In the Aguan River itself, no supplies of water for human consumption were reported during the field survey conducted in June 2018. Figure 5.30 shows a surface water extraction system. Further information about the water consumption in the Project Area is included in Section 5.4.
Figure 5.30 Surface water extraction
Source: CINSA and PAA Project Finance, 2017

ENVIRONMENTAL RESOURCES MANAGEMENT PAA PROJECT FINANCE A/S
5-34
Key findings - field survey (June 2018)
The 2018 field survey was aimed at gathering information on the following hydrological parameters: surface water quality; use of the surface water by the local population; and the existence of gauging stations in the Project Area to measure the river water levels and flows. Some photographs taken during the field survey relating to key hydrological findings are included in Figure 5.31. The location of all the hydrological features visited during the field survey is included in Annex 4 (Field Survey Map- Physical Baseline). No quality analyses of the surface water were available. Therefore, the water quality can only be indirectly assessed: the field observations, summarized in Table 5.9, suggest a generally good condition based on biological indicators of good quality fresh water, such as fish. However, there is a potential risk of loss of quality by organic contamination as a result of the wastewater management procedures in the communities. As described in Section 5.3.6 - Table 5.4, chemical products were reported to be in common use on the farms in the Project Area, although only small quantities are utilized. Erroneous or excessive use of chemical products could affect the quality of the surface waters due to organic contamination from fertilizers, and by chemical pollution from herbicides and pesticides.
Table 5.9 Observations pertinent to surface water quality in the Project Area
Source Observations Visit to farm 165 (large property profile)
Surface water body resulting from a secondary deviation of the Aguan River during Hurricane Mitch in 1998. Fish were observed. Reportedly, one caiman (Caiman cocodrilus) had been found in this water body in the past. Both biodiversity findings show good surface water quality.
Meeting with the Olanchito municipality
Wastewater treatment in the urban area of Olanchito: oxidation lake. Outside the urban areas the settlements have septic tanks where the wastewater is filtered into the subsoil. Wastewater treatment systems result in a risk of organic contamination of the surface water.
Meeting with the municipality of Arenal
Septic tanks connected to a treatment pond, ultimately connecting to the river. This wastewater treatment system results in a risk of organic contamination of the surface water.
Meeting with AJAASPIB
Reportedly, analyses of bacteria and metals are conducted on potable water. No analytical reports are available. Lack of potabilization systems (or the absence of proper maintenance of the systems) result in non-compliance with human drinking water standards. Wastewater management by septic tanks with filtration to the subsoil. These wastewater treatment systems are a risk of organic contamination of the surface water.
Note: see also Table 5.4 for information on use of chemical products which may be related to water quality. Source: Field survey, 2018

ENVIRONMENTAL RESOURCES MANAGEMENT PAA PROJECT FINANCE A/S
5-35
The main findings of the field survey with regard to the use of surface water by the local population are summarized in Table 5.10. River water is frequently used as a water source for the communities and on the farms. Although not reported during the field survey, low-intensity fishing (for self-consumption only) cannot be disregarded as an additional activity.
Table 5.10 Observations of surface water use in the Project Area
Source Observations Visit to farm 108 (small property profile)
There are three ponds formed by the Aguan River, which maintain a high level and do not dry up. Water from the ponds is given to the cattle to drink.
Visit to farm 128 (small property profile)
There are two ponds used for cleaning activities and supplying the cattle (drinking). When the water level of the Aguan River is very high, the farm gets partially flooded.
Visit to farm 71 (medium property profile)
The San Marcos River is located 500 m from the farm. It reportedly dries up during the dry season. Water from the river is given to the cattle to drink.
Meeting with the Olanchito municipality
The water sources for the urban area of Olanchito are the Pimienta and Uchapa rivers. In the rest of the municipality, surficial water is used in about 95% of the communities. Water treatment for drinking consumption is very limited: in most cases it only includes filtration and chlorination.
Meeting with the Arenal municipality
Two surface water microcatchments provide water to the municipality. During the dry season a groundwater well is also used to supplement the water supply (reportedly, during the last dry season, the emergency groundwater well was used for three days, when the two microcatchments could not provide enough water). During the rainy season, due to increased solids in suspension in the river water, the emergency groundwater well may also be needed. Water treatment for drinking consumption is very limited: in most cases it only includes filtration and chlorination.
Meeting with SAGO / CRELES
Surface water is commonly used for irrigation purposes, while the use of groundwater is marginal.
Meeting with AJAASPIB
Water for domestic use and potable water are 100% surface water resources. Water source for irrigation is also mostly surface water.
Note: Additional information on the water sources for the communities is provided in Section 5.4. Source: Field survey, 2018
Table 5.11 summarizes the available information on the existence of gauging stations in the Project Area. Gauging stations are limited to the Yaguala River due to a planned hydropower project in that area1. In the other rivers, there are only emergency water level stations.
1 Arenal I – II Project _ https://www.bnamericas.com/project-profile/es/planta-hidroelectrica-arenal-etapa-i-ii-planta-hidroelectrica-arenal-etapa-i-ii

ENVIRONMENTAL RESOURCES MANAGEMENT PAA PROJECT FINANCE A/S
5-36
Table 5.11 Observations of the gauging stations in the Project Area
Source Observations Meeting with the Olanchito municipality
COPECO has emergency water level stations on the bridges. They detect significant increases in the water level, activating an emergency procedure. The water volume is not calculated, since this requires a more sophisticated station.
Meeting with the Arenal municipality
Gauging stations are only located on the Yaguala River (tributary of Aguan River), where there is planned hydropower project.
Source: Field survey, 2018
Figure 5.31 Hydrological elements observed in the Project Area
Notes: Top left: Aguan River – high level of suspended sediments, characteristic of the rainy season. Top right: water pond used to provide water for the cattle. Bottom left: abandoned / vandalized emergency water level station in the Aguan River. Bottom right: observation of good water quality in a tributary of the Aguan River (lack of turbidity, plant communities, and the presence of fish). Source: Field survey, 2018
The locations of all the hydrological bodies visited during the June 2018 field survey are included in Annex 4 (Field Survey Map- Physical Baseline).
5.3.8 Hydrogeology
National hydrogeological context
Figure 5.32 shows the hydrogeological map of Honduras where the following types of aquifers can be identified based on the “productivity·” of the unit.
Highly productive extensive aquifers. Two locations in the north of Honduras, one location in the central section of Honduras and one location in the south of Honduras.

ENVIRONMENTAL RESOURCES MANAGEMENT PAA PROJECT FINANCE A/S
5-37
Moderately productive local and extensive aquifers. Typically in the northeast of Honduras, with some secondary locations in the centre, south, and north of the country.
Poor to moderately productive local and extensive aquifers. Mainly in the western and central sections of the country.
Moderately to highly productive local aquifers. Several locations distributed across the central section of the country.
Yojoa Lake in the northwest of the country. Rocks with limited and local groundwater resources predominant in
the northern and central sections of the country.
Figure 5.32 Hydrogeological map of Honduras
Source: National System of Territory Information (SINIT – Sistema Nacional de Información Territorial) – modified by ERM, 2018
Local hydrogeological context
Figure 5.33 shows a zoom view of the hydrogeological map of Honduras, focusing on the Project Area, where four categories of aquifers are found.

ENVIRONMENTAL RESOURCES MANAGEMENT PAA PROJECT FINANCE A/S
5-38
Figure 5.33 Hydrogeological units in the Project Area
Source: National System of Territory Information (SINIT – Sistema Nacional de Información Territorial) – modified by ERM, 2018
Highly productive and extensive aquifer. This corresponds to the alluvial deposits of the Aguan River (QA level - see Section 5.3.5) that cover practically the entire Project Area. It is characterized by an intergranular flow that, depending the location, has a variable behaviour, from confined to unconfined. Based on the data gathered by CINSA and PAA Project Finance in 2017, the following can be indicated:
o Confined/semiconfined condition. Wells have flows between 4 and 30 l/s, depending on the thickness of the layers of sand and gravel and well characteristics (e.g., depth and size of screen). The permeable sand and gravel layers appear interbedded with lower permeability layers, such as clays with limestones or clays with conglomerates, resulting in a confined/semiconfined aquifer.
o Unconfined condition. Higher flows, up to 67 l/s have been reported (e.g., groundwater wells in Puerto Escondido and Méndez). The depth of these wells is around 23 and 30 m, respectively. Their transmissivity is moderate (81 – 173 m2
/day) and their permeability is excellent.
Overall, according to a National Water Balance carried out by CEDEX in 2003, the Aguan River aquifer transmissivity is reported to be 470 m2/day.
Moderately to highly productive local aquifers. These correspond to a fissured aquifer associated to the Angels Valley Group materials (Kva level –see Section 5.3.5) between the mountainous area of Saba and the Mame River. Groundwater wells in this aquifer provide a water flow

ENVIRONMENTAL RESOURCES MANAGEMENT PAA PROJECT FINANCE A/S
5-39
ranging between 1 and 20 l/s, depending on the fissures and faults present in the formation. The productive area of these aquifers is normally limited to a depth of 60 or 70 m.
Poor to moderately productive local and extensive aquifers. These correspond to undifferentiated volcanic rocks (Tv level –see Section 5.3.5) comprising tuff, andesite, and pyroclastic rocks located in two areas around the municipality of Olanchito: a mountainous area to the north, from the Saba fault until approximately the community of Tacualtuste; and to the south, in the mountainous area between the Mame and Yaguala rivers.
Rocks with limited and local groundwater resources. These correspond to the Cacaguapa Schist formation (Pzm level –see Section 5.3.5). They are found in the mountainous area to the northeast of the Olanchito municipality, from the Santa Barbara community to the Yoro municipality. These units are considered to have a limited groundwater potential, due to their generally low permeability and their location in mountainous areas.
Groundwater wells in the Project Area
During the field survey conducted in 2017, a total of 26 groundwater wells were identified. Table 5.12 summarizes the key information.
Table 5.12 Groundwater wells in the Project Area in 2017
Name of groundwater well
Diameter (inches) Depth (m)
Water level (m)
Water pump level (m)
Water flow (l/s)
Mabuhay 10 30.48 4.57 7.62 34.70
Mendez 10 36.58 4.57 7.62 41.64
Coyoles / Naranjo B 8 79.25 24.38 36.58 23.09
Los Mangos 12 125.27 38.10 54.86 69.40
Limonera 14 45.72 6.10 9.14 34.70
Coyoles Yardo 12 60.96 6.10 15.24 26.02
Coyoles Campo 10 60.96 6.10 15.24 52.05
Rosario A 8 60.96 12.19 18.29 29.72
Trojas A 10 79.25 18.29 24.38 41.01
Trojas B 10 109.73 18.29 24.38 34.70
Limones A 8 60.96 33.53 42.67 10.41
Palo Verde A 36 18.29 3.05 4.57 69.40
Palo Verde B 8 50.29 6.10 9.14 29.72
Acarsa 10 22.86 6.10 7.62 26.02
Bomba A 14 22.86 6.10 7.62 208.20
Bomba B 14 22.86 6.10 7,62 208.20
Bomba C 14 22.86 6.10 7.62 208.20
Bomba D 14 22.86 6.10 7.62 208.20
Bomba E 14 22.86 6.10 7.62 208.20
Lemon Packer A 8 42.67 33.53 42.67 10.41
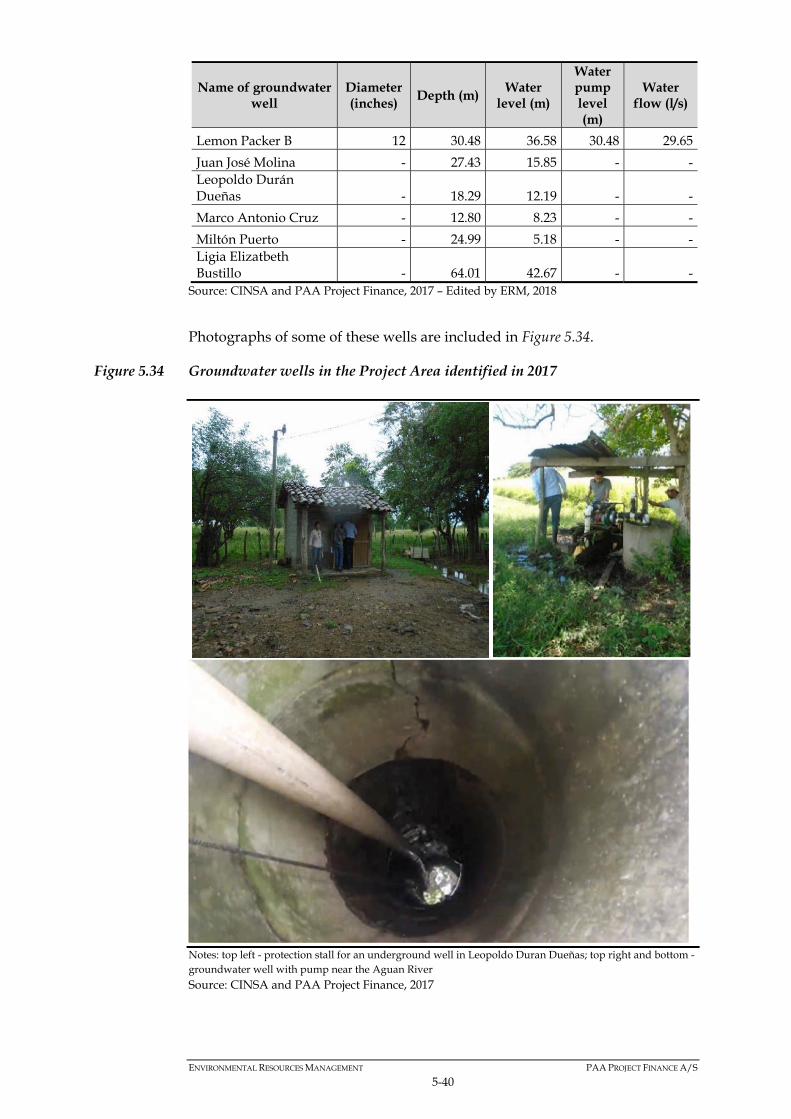
ENVIRONMENTAL RESOURCES MANAGEMENT PAA PROJECT FINANCE A/S
5-40
Name of groundwater well
Diameter (inches) Depth (m)
Water level (m)
Water pump level (m)
Water flow (l/s)
Lemon Packer B 12 30.48 36.58 30.48 29.65
Juan José Molina - 27.43 15.85 - - Leopoldo Durán Dueñas - 18.29 12.19 - -
Marco Antonio Cruz - 12.80 8.23 - -
Miltón Puerto - 24.99 5.18 - - Ligia Elizatbeth Bustillo - 64.01 42.67 - -
Source: CINSA and PAA Project Finance, 2017 – Edited by ERM, 2018
Photographs of some of these wells are included in Figure 5.34.
Figure 5.34 Groundwater wells in the Project Area identified in 2017
Notes: top left - protection stall for an underground well in Leopoldo Duran Dueñas; top right and bottom - groundwater well with pump near the Aguan River Source: CINSA and PAA Project Finance, 2017

ENVIRONMENTAL RESOURCES MANAGEMENT PAA PROJECT FINANCE A/S
5-41
Annex 5 includes the lithological profile of 5 of these wells (Bomba A, Bomba B, Bomba C, Bomba D and Bomba E), together with their specific locations in the Project Area. Their stratigraphy is as follows:
From 0 to 4.5 – 6.0 m depth: sandy silts. From 4.5 – 6.0 m to 18-21 m depth: fine and coarse gravels. From 18-21 m to 21-25 m depth: intermediate level of clays and gravels. In deep wells, after depths of 21-25 m, there are additional layers of
coarse gravels. The deep gravel levels, as described previously, can act as a confined/semiconfined aquifer, when there is a thick intermediate layer of low permeability clays. Figure 5.35 shows the location of the all the groundwater wells identified in the Project Area (both in 2017 and in 2018).
Figure 5.35 Location of identified groundwater wells
Note: the locations of the groundwater wells identified in 2017 is approximately only. The locations of the groundwater wells identified in 2018 is accurate, based on GPS coordinates taken during the field survey. Source: ERM, 2018
Expected groundwater level in the Project Area
Figure 5.36 shows the expected groundwater levels in the Project Area. A view with additional zoom is provided in Figure 5.37 and Figure 5.38. Four different categories of water levels are included: < 10 m depth, 10-25 m depth, 25-40 m depth, and > 40 m depth.

ENVIRONMENTAL RESOURCES MANAGEMENT PAA PROJECT FINANCE A/S
5-42
Figure 5.36 Groundwater levels in the Project Area
Source: Integra Ingeniería, 2017 – modified by ERM, 2018
Figure 5.37 Groundwater levels in the Project Area (zoom in view – western section)
Source: Integra Ingeniería, 2017 – modified by ERM, 2018

ENVIRONMENTAL RESOURCES MANAGEMENT PAA PROJECT FINANCE A/S
5-43
Figure 5.38 Groundwater levels in the Project Area (zoom in view – eastern section)
Source: Integra Ingeniería, 2017 – modified by ERM, 2018
The distribution of the water levels is symmetrical around the axis of the Aguan River, where the groundwater level is the shallowest. This distribution follows the pattern produced by the topographic and geological conditions in the Project Area: deep water levels are found in the mountainous areas, where the materials are less permeable and therefore the aquifers are less productive than in the bottom of the valley, where the alluvial aquifer is located. Although the deepest groundwater levels are found in the mountainous areas, the piezometric isoclines show the same distribution pattern as the water level, so that the general groundwater flow has a main discharge component flowing towards the alluvial axis of the Aguan River. Groundwater quality
A selection of two samples from the sampling campaign undertaken at six different groundwater locations in the Olanchito municipality (sampling undertaken in 1997) gave the following results (Table 5.13):
Table 5.13 Results of the groundwater sampling campaign
Parameters Groundwater well 1. Well with highest salinity (Land Limones B2 empacadora)
Groundwater well 2 Well with lowest salinity (Land Mabujay)
Conductivity (µS/cm) 820 339 Sodium (Na); mg/l 37 15 Calcium (Ca); mg/l 124 59 Magnesium (Mg); mg/l 24 22

ENVIRONMENTAL RESOURCES MANAGEMENT PAA PROJECT FINANCE A/S
5-44
Chlorine (Cl); mg/l 43 12 Boron (B); mg/l 0.072 0.04 SAR 0.81 0.42
Note: Results of two groundwater samples showing minimum and maximum sodium levels. Source: Olanchito Municipality, 2010 The above results demonstrate that the groundwater resources of the Olanchito municipality are adequate for irrigation purposes as they have a low level of mineralization, low content of ions such as boron and sodium, and a very low (< 1) Sodium Absorption Ratio (SAR)1 Key findings - field survey (June 2018)
The 2018 field survey aimed to gather information on the following hydrogeological parameters: identification of groundwater wells; quality of groundwater; the local population’s use of the groundwater; and the existence of monitoring wells in the Project Area. The groundwater wells identified in the field survey are referred to above and shown in Figure 5.35. Some of these are also shown in Figure 5.39, where there are also photographs taken during the field survey. The locations of all the hydrogeological bodies visited during the June 2018 field are included in Annex 4 (Field Survey Map- Physical Baseline). The observations conducted during the field survey, summarized in Table 5.14, support the groundwater chemical analyses undertaken (see previous subsection Groundwater quality). Based on field observations, it is expected that the main risk related to current practices is the potential impact by organic contamination due to the wastewater management procedures in the communities. As described in Section 5.3.6 - Table 5.4, chemical products were reported to be in common use on the farms in the Project Area, although only small quantities seem to be utilised. Erroneous or excessive use of chemical products could affect the quality groundwater due to organic contamination from fertilizers, and chemical pollution from herbicides and pesticides.
Table 5.14 Observations of groundwater quality in the Project Area
Source Observation Visit to farm 108 (small property profile)
Farmer reports that groundwater from 5 water wells (used for human consumption) located in the Juncal community were analysed after their installation confirming acceptable quality for human consumption. No periodic controls are conducted on these wells.
1 The Sodium Adsorption Ratio, SAR, is an index for evaluating the risk of irrigation water sodification. It is calculated using sodium (Na), calcium (Ca), and magnesium (Mg) levels.

ENVIRONMENTAL RESOURCES MANAGEMENT PAA PROJECT FINANCE A/S
5-45
Source Observation Visit to farm 71 (medium property profile)
The water was analysed after the construction of the well and confirmed to be fit for human consumption. It is unknown if further analysis have been conducted subsequently.
Note: see Table 5.4 for information on the groundwater quality in the Project Area. Source: Field survey, 2018
Observations on the use of groundwater by the local population, recorded during the field survey, is summarized in Table 5.15. It can be concluded that the use of groundwater resources is minor in comparison with the use of surface water and mostly associated with farming activities (cleaning and water for the cattle), but in a few cases, it is also used as a water source by the local communities. There are two main categories of groundwater wells based on their construction characteristics: dug wells, shallow and built using hand tools; and drilled wells, deeper and built using drilling equipment. It should also be noted that there is no official register of groundwater wells. Therefore, accurate information on the exact number of groundwater wells in the Project Area is not available.
Table 5.15 Observations of groundwater use in the Project Area
Source Observations Meeting with SAG
There are few groundwater wells in the Project Area. There is no registration system for groundwater wells. Water for human consumption is most likely to be extracted from surface water bodies. There are few irrigation systems in the area.
Visit to farm 30 (small property profile)
One groundwater well observed on the farm. Used for irrigation. Well characteristics: Built in 2012 –drilled mechanically. Diameter: 8’’. Depth: 35 m. Water flow: 24.6 l/s. Farmer reports that he knows about other 2 wells in the proximity of his farm: one at 500 m and other at 1 km distance. Farmer reports that he has never observed changes in the groundwater levels in the well.
Visit to farm 108 (small property profile)
One groundwater well observed on the farm. Used for cleaning activities and to provide water for the cattle. Well characteristics: Dug well built with hand tools. Diameter: 1 m. Depth: 6 m. Water level: 3.6 m. In the dry season the water level
decreases to 4.9 m. Water flow: 3.5 l/s. Farmer reports that water for human consumption is taken from 5 water wells located in Juncal (a nearby community).

ENVIRONMENTAL RESOURCES MANAGEMENT PAA PROJECT FINANCE A/S
5-46
Source Observations Visit to farm 108 (small property profile)
No groundwater wells on the farm. However, there is one water well in the banana plantation located next to the farm. Groundwater level in the water well in the banana plantation thought to be about 3 m depth. Farmer reports no conflict between the ponds in his farm and water well in the banana plantation.
Visit to farm 71 (medium property profile)
Two groundwater wells observed on the farm. One to provide water for the cattle. Well characteristics: Dug well built with hand tools. Diameter: 32’’. Depth: 11 m. Water level: 6 m. The other well supplies water to people living on the farm. Well characteristics: Dug well built with hand tools. Diameter: 25’’. Depth: 7.6 m.
Water level: 5.8 m. Meeting with the Arenal municipality
Emergency groundwater well, used only when the surface water resource is bad quality (increased turbidity) and the stream flows decrease. In the last dry season they used it for 3 days. Well characteristics: Depth: 97 m –drilled mechanically. Water level: 43 m. Only two small communities within the municipality have groundwater wells as a water source. In both cases, these are dug wells, built with hand tools, with a shallow water level (1.5 m depth).
Meeting with SAGO / CRELES
Groundwater wells are used as a water resource for irrigation purposes, mainly during the dry season. Near the river: shallow dug wells, approximately 4-6 m
deep. Far from the river: drilled wells, since the water level is
deeper. In some drought periods, groundwater levels can drop below the pump intake.
Meeting with AJAASPIB
Water well profiles are as follows: Most are dug wells: 9 m depth. When they are deeper than 60 m, they are drilled
mechanically. Few groundwater wells. For example, only two farmers in
the CREL have wells. Note: Additional information on the water sources for the communities is provided in Section 5.4. Source: Field survey, 2018
Personnel of the Olanchito and Arenal municipalities report that there are no monitoring wells in the Project Area for measuring the groundwater and/or taking groundwater samples.

ENVIRONMENTAL RESOURCES MANAGEMENT PAA PROJECT FINANCE A/S
5-47
Figure 5.39 Hydrogeological elements observed in the Project Area
Notes: Top left: pump providing water from the groundwater well in the community of El Juncal. Top right: dug well connected to pump. Bottom left: groundwater well constructed using a drilling machine. Bottom right: WC connected to a septic tank with the wastewater outlet infiltrating into the subsoil. Source: Field survey, 2018

ENVIRONMENTAL RESOURCES MANAGEMENT PAA PROJECT FINANCE A/S
5-48
5.4 BIOLOGICAL ENVIRONMENT
5.4.1 Habitats
Overview
As shown in Figure 5.40, the following habitats occur in the Project Area:
Agricultural fields and pastures.
Grassland.
Aquatic systems.
Urban and rural areas.
Shrubland and forest.
Figure 5.40 Habitats in the Project Area
Source: ERM, 2018
Each is of these habitats is described separately in the following subsections. Urban and rural areas
The main urban area in the Project Area is Olanchito, but there are also small rural communities spread along the Aguan River Valley.

ENVIRONMENTAL RESOURCES MANAGEMENT PAA PROJECT FINANCE A/S
5-49
According to the information available in the Atlas of the Municipality of Olanchito (2015)1, the surface corresponding to urban and rural areas is 2,880 ha, which represents 4.8% of the total surface area of the Project Area (60,000 ha). This area corresponds to the following land cover categories considered in the Atlas: continuous urban area; discontinuous urban area; and roads. Figure 5.41 shows two communities within the Project Area, visited during the June 2018 field survey: Juncal and Coyoles.
Figure 5.41 View of rural areas in the Project Area
Notes: communities of Juncal (left) and Coyoles (right) Source: ERM, 2018
Agricultural fields and pastures
These include areas dedicated to agriculture and livestock. In the eastern section of the Project Area, the agricultural areas are mostly irrigated banana and African palm plantations. However, the agricultural areas in the central and western sections of the Project Area are mostly pasture and non-irrigated crops for feeding the livestock. According to the information available in the Atlas of the Municipality of Olanchito (2015), the surface corresponding to agricultural and fields and pastures is about 30,510 ha, which represents about 50.5% of the total surface area of the Project Area (60,000 ha). This area corresponds to the following land cover categories considered in the Atlas: technified agricultural land; African palm; and pastures and crops. Overall, agriculture field and pasture area has increased over recent decades. Figure 5.42 includes a historical sequence available in Google Earth, showing how the areas dedicated to agricultural fields and pastures have increased. Although no significant changes occurred between 1970 and 2002, these can be appreciated between 2002 and 2011. The yellow circle highlights an area where the mentioned habitat change is very evident, particularly between 2002 and 2011, with a very typical agricultural pattern in the satellite image from 2011, which was previously present.
1 http://www.atlasmunicipal.org/?q=node/310

ENVIRONMENTAL RESOURCES MANAGEMENT PAA PROJECT FINANCE A/S
5-50
Figure 5.42 Satellite image of the confluence of the San Marcos and Chiquito rivers over the years 1970 – 2002 - 2011 (Google Earth)
Source: Google Earth Pro – modified by ERM, 2018
Figure 5.43 shows agricultural fields and pastures within the Project Area, visited during the June 2018 field survey.
Figure 5.43 View of agricultural fields and pastures in the Project Area
Notes: top left (ploughed field next to camerun crop – Pennisetum purpureum – with irrigation system); top right (pastures and livestock), bottom left (African palm plantation, young palms); and bottom right (banana plantation)

ENVIRONMENTAL RESOURCES MANAGEMENT PAA PROJECT FINANCE A/S
5-51
Source: ERM, 2018
Grassland
Grassland is seasonal and is not present during the dry season, due to the absence of water. Dominant grassland families include the Gramineae, Cyperaceae, and certain ferns, as well as other species. Grassland in the Project Area is generally found in abandoned areas that were previously used for livestock. Because of this, when reviewing the Atlas of the Municipality of Olanchito (2015), it was not feasible to calculate the surface of grassland in the Project Area. The grassland areas are therefore included within the general surface area and percentage provided for agricultural fields and pastures. Figure 5.44 shows a grassland area observed in the Project Area during the June 2018 field survey.
Figure 5.44 View of grassland in the Project Area
Source: ERM, 2018
Aquatic systems
The aquatic systems in the Project Area are the Aguan River and its tributaries, together with small lakes, ponds, and artificial lagoons. In the past, these aquatic systems were associated with dense gallery forests. However, most of these gallery forests have been converted into agricultural fields and pastures. According to the information available in the Atlas of the Municipality of Olanchito (2015), the surface area corresponding to aquatic systems is about

ENVIRONMENTAL RESOURCES MANAGEMENT PAA PROJECT FINANCE A/S
5-52
1,100 ha, which represents about 1.8% of the total surface area of the Project Area (60,000 ha). This area corresponds to the following land cover categories considered in the Atlas: anthropic water features, and other surface water bodies. Figure 5.45 shows four different aquatic systems observed in the Project Area during the June 2018 field survey.
Figure 5.45 View of aquatic systems in the Project Area
Notes: top left (pond), top right (Aguan River with gallery forest on the left side), bottom left (creek, tributary of the Aguan River, with gallery forest on both sides) and bottom right (creek, tributary of the Aguan River, with gallery forest limited to the background, while foreground presents more degraded vegetation as a result of livestock activities) Source: ERM, 2018
Shrubland and forest
There are a number of different vegetation units within this general habitat category, including deciduous forests, conifer forests, deciduous shrubland, and mixed areas, where the previous units occur together with other habitats such as pastures. Due to their biodiversity values, two specific types of forest are described in detail:
Very dry tropical forest. Dry tropical forest.
According to the information available in the Atlas of the Municipality of Olanchito (2015), the surface area corresponding to very dry and dry tropical forest is about 13,900 ha, which represents about 23% of the total surface area of the Project Area (60,000 ha). This area corresponds to the following land cover category considered in the Atlas: deciduous broad-leaved forest. Since other deciduous broad-leaved forests may occur in the Project Area (e.g.,
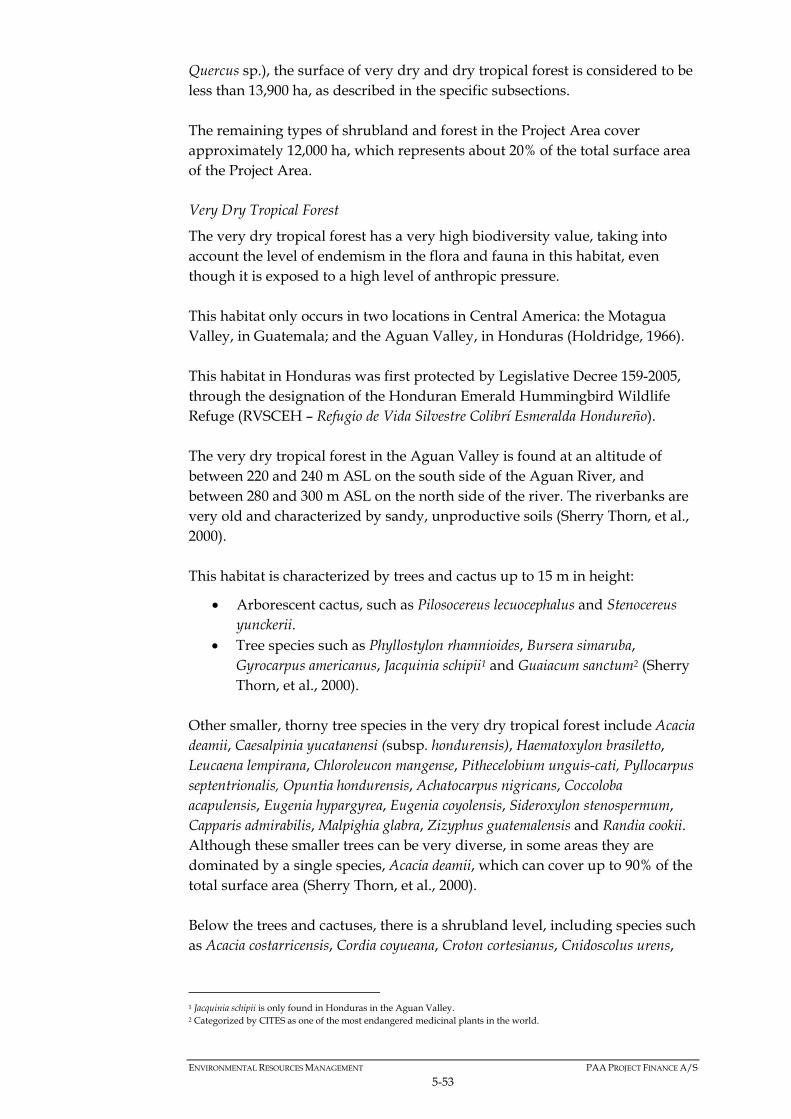
ENVIRONMENTAL RESOURCES MANAGEMENT PAA PROJECT FINANCE A/S
5-53
Quercus sp.), the surface of very dry and dry tropical forest is considered to be less than 13,900 ha, as described in the specific subsections. The remaining types of shrubland and forest in the Project Area cover approximately 12,000 ha, which represents about 20% of the total surface area of the Project Area. Very Dry Tropical Forest
The very dry tropical forest has a very high biodiversity value, taking into account the level of endemism in the flora and fauna in this habitat, even though it is exposed to a high level of anthropic pressure. This habitat only occurs in two locations in Central America: the Motagua Valley, in Guatemala; and the Aguan Valley, in Honduras (Holdridge, 1966). This habitat in Honduras was first protected by Legislative Decree 159-2005, through the designation of the Honduran Emerald Hummingbird Wildlife Refuge (RVSCEH – Refugio de Vida Silvestre Colibrí Esmeralda Hondureño). The very dry tropical forest in the Aguan Valley is found at an altitude of between 220 and 240 m ASL on the south side of the Aguan River, and between 280 and 300 m ASL on the north side of the river. The riverbanks are very old and characterized by sandy, unproductive soils (Sherry Thorn, et al., 2000). This habitat is characterized by trees and cactus up to 15 m in height:
Arborescent cactus, such as Pilosocereus lecuocephalus and Stenocereus yunckerii.
Tree species such as Phyllostylon rhamnioides, Bursera simaruba, Gyrocarpus americanus, Jacquinia schipii1 and Guaiacum sanctum2 (Sherry Thorn, et al., 2000).
Other smaller, thorny tree species in the very dry tropical forest include Acacia deamii, Caesalpinia yucatanensi (subsp. hondurensis), Haematoxylon brasiletto, Leucaena lempirana, Chloroleucon mangense, Pithecelobium unguis-cati, Pyllocarpus septentrionalis, Opuntia hondurensis, Achatocarpus nigricans, Coccoloba acapulensis, Eugenia hypargyrea, Eugenia coyolensis, Sideroxylon stenospermum, Capparis admirabilis, Malpighia glabra, Zizyphus guatemalensis and Randia cookii. Although these smaller trees can be very diverse, in some areas they are dominated by a single species, Acacia deamii, which can cover up to 90% of the total surface area (Sherry Thorn, et al., 2000). Below the trees and cactuses, there is a shrubland level, including species such as Acacia costarricensis, Cordia coyueana, Croton cortesianus, Cnidoscolus urens,
1 Jacquinia schipii is only found in Honduras in the Aguan Valley. 2 Categorized by CITES as one of the most endangered medicinal plants in the world.

ENVIRONMENTAL RESOURCES MANAGEMENT PAA PROJECT FINANCE A/S
5-54
Casearia corymbosa, Bakeridesia molinae, Solanum hirtum, Solanum diaboli, Senna palida and Acanthocereus pentagonus. During the rainy season, there is an additional level of plants, including Portulaca pilosa, Evolvulus alsinoides, Pectris prostrata, Oxalis neaei, Croton lobatus, Ocimum campechianum, Cleome viscosa, Dichondra sericea, Chamaesyce dioica, and Senna uniflora. Another group of flora in this habitat are the perennial succulents, such as Pedilanthus camporum, Melocactus curvispinus, Bromelia plumieri, Furcraea cabuya, and Hechtia guatemalensis. Almost all the species of trees and shrubs in the very dry tropical forest are deciduous (Sherry Thorn, et al., 2000). Although epiphytes are not very abundant in the very dry tropical forest, there are a few very well adapted species, such as the orchids Myrmecophylla tibicis, which live in big groups on the largest species of cactus, Encyclia nematocaulon and Laelia rubescens. The following epiphytes are found in the largest trees: Aechmea bracteata and Tillandsia fasciculata, which are a good source of food for the Honduran emerald hummingbird (Amazilia luciae) (Sherry Thorn et al., 2000). The surface area covered by very dry tropical forest has decreased significantly. According to INOCSA et al. (2010), the main conservation issue for the very dry tropical forest is deforestation. It is thought that the existing cover of this habitat is only 2% of its original surface area (Asesora, 2009):
In 1938, the surface area of very dry tropical forest was about 30,000 ha.
In 2000, the surface area was estimated as 8,495 ha. In 2009, the surface area was estimated as 2,962.8 ha.
In addition to the high reduction in the cover of this habitat, it is also very fragmented. Because of this, the RVSCEH is formed by a number of isolated areas scattered across the Aguan Valley, as described in Section 0.0.-1556586336. Figure 5.46 shows two different photographs of very dry tropical forest taken during the field survey conducted in in the Project Area (June 2018).

ENVIRONMENTAL RESOURCES MANAGEMENT PAA PROJECT FINANCE A/S
5-55
Figure 5.46 View of very dry tropical forest in the Project Area
Notes: left (very dry tropical forest next to the road) and right (very dry tropical forest in RVSCEH) Source: ERM, 2018
Dry Tropical Forest
The dry tropical forest is found at higher altitudes than the very dry tropical forest, between 280 and 600 m ASL. The presence of the species Dioon mejiae is a key indicator of the dry tropical forest. This plant is similar to a palm and is predominantly found in shrubland and deciduous forests, but not in the very dry tropical forest. Dioon mejiae can live for more than 1,000 years, and is the longest-lived species in Honduras. Other typical flora of the dry tropical forest includes Zamia standleyi, Dracaenea americana, Leucaena lempirana, Acacia deamii, Opuntia hondurensis, Pilosocereus chrysacanthus, Enterelobium cyclocarpum, Quercus sp., Pinus oocarpa, Anacardium excelsum, Samanea saman, Tabebia rosea, Hymenaea courbaril, Cochlospermum vitifolioum, Calycophyllum candidissimum and Ceiba sp. The main differences with the very dry tropical forest are (Fournier, 1980) (USIGME, 2004):
It is found at higher altitude than the very dry tropical forest (280-600 m ASL versus 220-300 m ASL).
Some of the flora of the dry tropical forest is semi-deciduous. There is a lower plant density than in the very dry tropical forest. The flora is not as thorny. Flowering during the dry season in the dry tropical forest is more
evident than in the very dry tropical forest. Key findings - field survey (June 2018)
The field survey was aimed at: (1) gathering information on the dynamics of the habitats in the Project Area; and (2) observing the different habitats existing in the Project Area.

ENVIRONMENTAL RESOURCES MANAGEMENT PAA PROJECT FINANCE A/S
5-56
Interviews held with local environmental experts1 confirmed that one of the current reasons for natural habitat loss (dry and very dry tropical forest) in the Aguan River Valley is the search for new grazing areas for the cattle during the dry season. During the rainy season, the cattle is kept at the bottom of the valley, where there is sufficient food. However, food is not as abundant during the dry season, and farmers take the cattle to higher areas in the hills, where they chop down forest to create new grazing areas where they can feed the cattle. Figure 5.47 shows an example of an area that has been transformed from natural habitat to pasture. It can be seen that the area is in the upper part of the valley (it is quite hilly) rather than at the bottom. In the background, some remaining natural habitats can be observed. Next to the fields shown in the photographs is a creek used to provide water for the cattle (see Figure 5.45 – bottom left). The location of this area is shown in Figure 5.48.
Figure 5.47 View of natural habitat degradation into pasture in the dry season
Source: ERM, 2018
1 Interview with the engineer Anke Alvarado Bejarano, from CINSA.
ENVIRONMENTAL RESOURCES MANAGEMENT PAA PROJECT FINANCE A/S
5-57
Figure 5.48 Location of natural habitat identified during the field survey degraded into pasture
Source: ERM, 2018
Visits conducted during the field survey allowed habitats to be recorded, supporting the preparation of Figure 5.40.
5.4.2 Flora
Overview
According to the Honduran Catalogue of Vascular Flora (Cirilo Nelson, 2008 - Catálogo de las Plantas Vasculares de Honduras), there are 7,276 species of plants in Honduras, distributed between 270 families and 2,028 genera. Taking into account all the species, subspecies and varieties, there are 10,127 different plant types. These include: 41 species that, although expected in the country, have not yet been found; 214 endemic species; 414 cultivated species; and 107 naturalized species. With regard to the flora in the Project Area, conservation and management reports from the Honduran Emerald Hummingbird Wildlife Refuge (RVSCEH, acronym in Spanish)1 provide a very detailed assessment of the flora found in the protected area, based on scientific flora inventories. These reports summarize a study of the flora conducted over a very large area of the Alto Aguan and reflect a large quantity of flora, some of which is endangered according to national and international classifications.
1 RVSCEH – Refugio de Vida Silvestre Colibrí Esmeralda Hondureño

ENVIRONMENTAL RESOURCES MANAGEMENT PAA PROJECT FINANCE A/S
5-58
The RVSCEH is split into different zones across the Project Area (see further details in Section 0.0.-1556586336). Because of this, the flora in the RVSCEH is considered to be representative of the overall flora in the Project Area, excluding cultivated species, which although common in the agricultural fields and pastures do not occur in the RVSCEH. However, these cultivated areas do not have any specific biodiversity value in terms of flora. Flora in the Project Area
Table 5.16 provides a list of flora in the Project Area, based on a desktop review of the available information, together with the information gathered during the June 2018 field survey. Although the RVSCEH covers a small surface area, it includes heterogeneous shrubland and forest in the low areas (near the bottom of the Aguan River Valley) and forest in the upper areas, characterized by irregular topography. This results in an interesting and important community of flora, as described in the description of the very dry and dry tropical forest habitat (see Section 5.4.1). A total of 306 species1 of plants are listed in Table 5.16. The species highlighted in bold are more significant, considering their level of protection and conservation concern based on: (1) international references such as the IUCN and CITES; (2) their level of endemicity; and (3) a list of flora and fauna of special concern in Honduras. Section 2.1.7 provides a description of the international and national references considered. These more significant species (50 in total) are also included in Table 5.17, where further details of their protection, conservation, and sensitivity (see Section 6.2.2 for further references on sensitivity) are included. The remainder of the species (256 in total) are likely to be common and widespread, and therefore less likely to be of concern in terms of conservation and protection. Because of this, their level of sensitivity is defined as low. Based on the information included in Table 5.17, it can be concluded that the most significant findings with regard to flora in the Project Area are:
The following families are the most numerous: Cactaceae (17 species) and Fabaceae (11 species).
Up to 10 species are endemic, with a distribution limited to Honduras: Bakeridesia molinae, Caesalpinia yucatanensis (subsp. Hondurensis), Capparicordis yunckeri, Dioon mejiae, Eugenia lempana, Eugenia coyolensis, Leucaena lempirana, Lonchocarpus trifolius, Opuntia hondurensis and Zamia standleyi. The other species are not endemic and are therefore also found in other countries in America, and even on other continents.
1 The final number of species is higher than 306, since Table 5.16 also includes ten genera of flora present in the Project Area, but without defining particular species. These are Agonandra spp., Ceiba spp., Eucalyptus spp., Ficus spp., Leucaena spp., Oplismenus spp., Pennisetum spp., Quercus spp., Salix spp. and Trichilia spp.
ENVIRONMENTAL RESOURCES MANAGEMENT PAA PROJECT FINANCE A/S
5-59
Up to 11 species are assessed as threatened by the IUCN. The remainder have not been assessed by IUCN or if they have, were assessed as Near Threatened (NT), Least Concern (LC) or Data Deficient (DD). Those species regarded as threatened by the IUCN are distributed as follows:
o Six Vulnerable (VU) species: Acanthocereus chiapensis
(Peniocereus chiapensis), Cedrela odorata, Leucaena lempirana, Swietenia macrophylla, Swietenia humilis and Zamia standleyi.
o Two Endangered (EN) species: Parathesis vulgate and Vanilla planifolia.
o Three Critically Endangered (CR) species: Eugenia coyolensis, Lonchocarpus trifolius and Lonchocarpus yoroensis.
Up to 26 species are included in the Appendices of CITES:
o Only one species is included in Appendix I: Swietenia macrophylla.
o 24 species are included in Appendix II: Acanthocereus tetragonus, Acanthocereus chiapensis (Peniocereus chiapensis), Dalbergia glabra, Dioon mejiae, Guaiacum sanctum, Monstera spruceana, Melocactus curvispinus, Nyctocereus guatemalensis, Opuntia hondurensis, Opuntia guatemalensis, Opuntia deamii, Opuntia decumbens, Opuntia lutea (Nopalea lutea), Opuntia pubescens, Pilosocereus maxonii, Pilosocereus leucosephalus, Stenocereus yunckeri, Selenicereus testudo, Swietenia humilis, Stenocereus pruinosus, Stenocereus aragonii, Trigonidium egertonianum and Zamia standleyi.
o Only one species is included in Appendix III: Cedrela odorata.
Only one species is classified as a Species of Special Concern in Honduras: Nyctocereus guatemalensis.
Up to 16 species, although included in Table 5.17, are only assessed by the IUCN as species of Least Concern (LC) or Data Deficient (DD).
Up to 14 species are considered high sensitivity (endemic and / or CR / EN by IUCN). They are included in Annex 6, where additional information (habitat, ecology, and distribution) of high sensitivity flora and fauna is included. The remainder of the species (low / medium sensitivity) are likely to be common and widespread, and therefore less likely to be of concern with regard to conservation and protection.
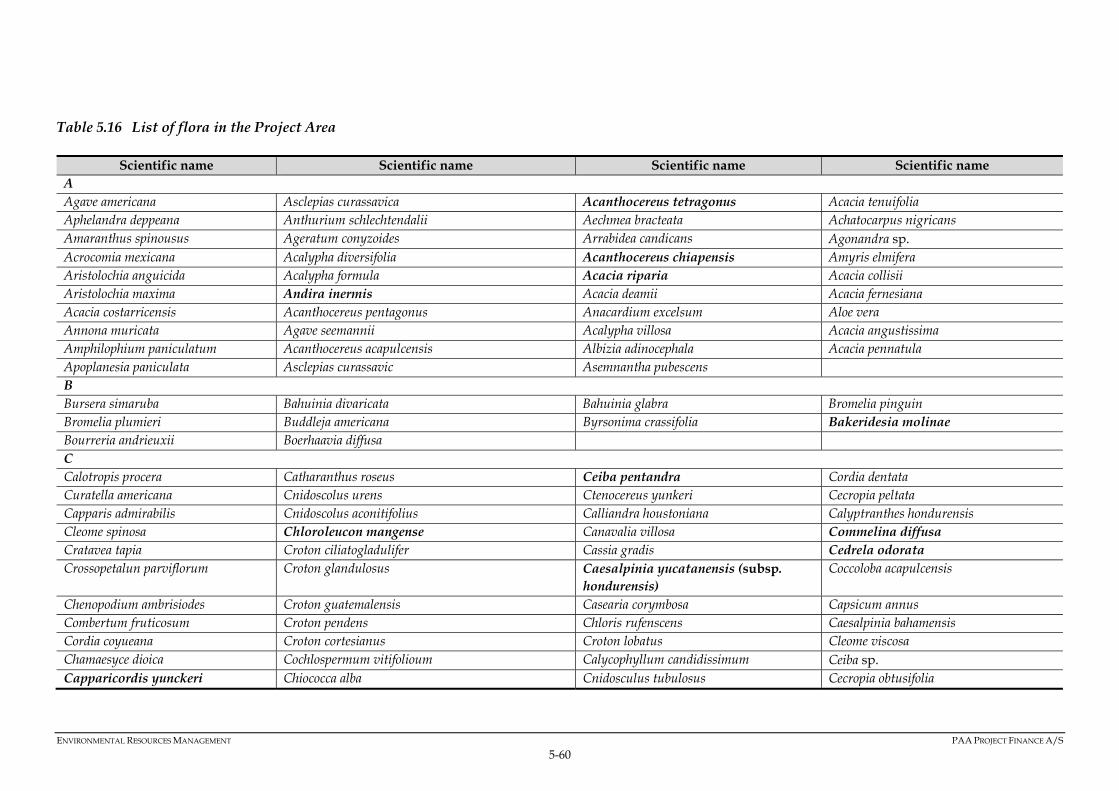
ENVIRONMENTAL RESOURCES MANAGEMENT PAA PROJECT FINANCE A/S
5-60
Table 5.16 List of flora in the Project Area
Scientific name Scientific name Scientific name Scientific name A Agave americana Asclepias curassavica Acanthocereus tetragonus Acacia tenuifolia Aphelandra deppeana Anthurium schlechtendalii Aechmea bracteata Achatocarpus nigricans Amaranthus spinousus Ageratum conyzoides Arrabidea candicans Agonandra sp. Acrocomia mexicana Acalypha diversifolia Acanthocereus chiapensis Amyris elmifera Aristolochia anguicida Acalypha formula Acacia riparia Acacia collisii Aristolochia maxima Andira inermis Acacia deamii Acacia fernesiana Acacia costarricensis Acanthocereus pentagonus Anacardium excelsum Aloe vera Annona muricata Agave seemannii Acalypha villosa Acacia angustissima Amphilophium paniculatum Acanthocereus acapulcensis Albizia adinocephala Acacia pennatula Apoplanesia paniculata Asclepias curassavic Asemnantha pubescens B Bursera simaruba Bahuinia divaricata Bahuinia glabra Bromelia pinguin Bromelia plumieri Buddleja americana Byrsonima crassifolia Bakeridesia molinae Bourreria andrieuxii Boerhaavia diffusa C Calotropis procera Catharanthus roseus Ceiba pentandra Cordia dentata Curatella americana Cnidoscolus urens Ctenocereus yunkeri Cecropia peltata Capparis admirabilis Cnidoscolus aconitifolius Calliandra houstoniana Calyptranthes hondurensis Cleome spinosa Chloroleucon mangense Canavalia villosa Commelina diffusa Cratavea tapia Croton ciliatogladulifer Cassia gradis Cedrela odorata Crossopetalun parviflorum Croton glandulosus Caesalpinia yucatanensis (subsp.
hondurensis) Coccoloba acapulcensis
Chenopodium ambrisiodes Croton guatemalensis Casearia corymbosa Capsicum annus Combertum fruticosum Croton pendens Chloris rufenscens Caesalpinia bahamensis Cordia coyueana Croton cortesianus Croton lobatus Cleome viscosa Chamaesyce dioica Cochlospermum vitifolioum Calycophyllum candidissimum Ceiba sp. Capparicordis yunckeri Chiococca alba Cnidosculus tubulosus Cecropia obtusifolia

ENVIRONMENTAL RESOURCES MANAGEMENT PAA PROJECT FINANCE A/S
5-61
Scientific name Scientific name Scientific name Scientific name Cissus cacumensis Cyperus ochraceus D Dracaena americana Dichaea glauca Desmathodium guatemalensis Dalbergia glabra Dioon mejiae Dioscorea spiculiflora Desmodium sericophyllum Delonix regia Diphysa spinosa Dichondra sericea Diphysa carthagense Digitaria insularis Dicraspidia donnell-smithii E Echites yucatenensis Enterolobium cyclocarpum Evolvulus ovatus Enterelobium cyclocarpus Eugenia coyolensis Encyclia nematocaulon Erythroxylum rotundifolium Eugenia lempana Eugenia hypargyrea Evolvulus alsinoides Eucalyptus sp. Ehretia tinifolia Epidendrum xipheres F Furcraea cabuya Ficus sp. G Gliricidia sepium Guapira linearibracteata Guaiacum sanctum Guazuma ulmifolia Gyrocarpus americanus Guattarda deami H Hisbucus grandiflorus Heliotropiuim angiospermum Hylocerus undatum Hechtia guatemalensis Haematoxylum brasiletto Hypericum gniodioides Hyptis suaveolens Hylocereus minutiflora Hylocereus undatus Hymenaea courbaril Hyperbaena mexicana I Irisine diffusa Inga vera J Jatropha curca Jacquinia nitida Jatropha gossipiifolia Jacquinia schipii K Karwinskia calderonii L Lonchocarpus minimiflorum Ludwigia octovalis Lobelia laxiflora Lueha candida Lonchocarpus trifolius Leucaena lempirana Laelia rubescens Leucaena sp. Lonchocarpus yoroensis Lueha speciosa Leonotis nepetifolia Lygodium clavatum Lysiloma auritum Lippia graveolens

ENVIRONMENTAL RESOURCES MANAGEMENT PAA PROJECT FINANCE A/S
5-62
Scientific name Scientific name Scientific name Scientific name M Mangifera indica Macfadyaena anguis-cati Melocactus curvispinus Muntigia calabura Mimosa albida Momordica charantia Mimosa pudica Malipighia glabra Melinis repens Miconia mexicana Miconia albicans Miconia glaberrima Myrmecophylla tibicis Mammellaria eichlamii Mammillaria colombiana Melocatus curvispinus Malpighia glabra Monstera spruceana Machaerium pittieri Melochia tomentosa Merremia umbellata Maclura tinctoria Malvaviscus arboreus N Nopalea guatemalensis Neomeollspaughia paniculata Neea psychotrioides Nyctocereus guatemalensis Nopalea hondurensis O Opuntia hondurensis Ocimum campechianum Oncidium carthagenense Oplismenus sp. Opuntia guatemalensis Opuntia decumbens Opuntia lutea (Nopalea lutea) Opuntia pubescens Opuntia deamii Oxalis neaei P Plumeria rubra Perymenium ghiesbreghtii Peniocereus hirschtianum Pilosocereus chrysacanthus Philodendron hederaceum Pedilanthus camporum Pithecellobuim dulce Psidium guajava Panicum maximun Phoradendron quadrangulare Persea americana Podopterus mexicanus Paspalum botterii Psittacanthus schiedeanus Pteridium aquilinum Polygonum hydropiper Pennisetum sp. Psittacanthus rhynchanthus Paullinia fuscescen Portulacca pilosa Phyllostylon brasilienses Parathesis vulgata Petiveria alliacea Peperomia acuminata Pilosocereus leucosephalus Phyllostylon rhamniodes Phytolacca rivinoides Piper aduncum Pilosocereus maxonii Pereskia lychnidiflora Pesudosamnea quachapele Piper auritum Piper koepperi Piper jacquemontianum Pithecelobium unguis-cati Pyllocarpus septentrionalis Pectris prostrata Pinus oocarpa Phyllostylon rhamnoides Pennisetum setaceum Pithecellobium lanceolatum Petrea volubilis Philodendron scandens Passiflora holosericea Paullinia cururu Pisonia aculeata Q Quercus sp. R Rauvolfia tetraphylla Randia armata Randia cookii Rivina humilis
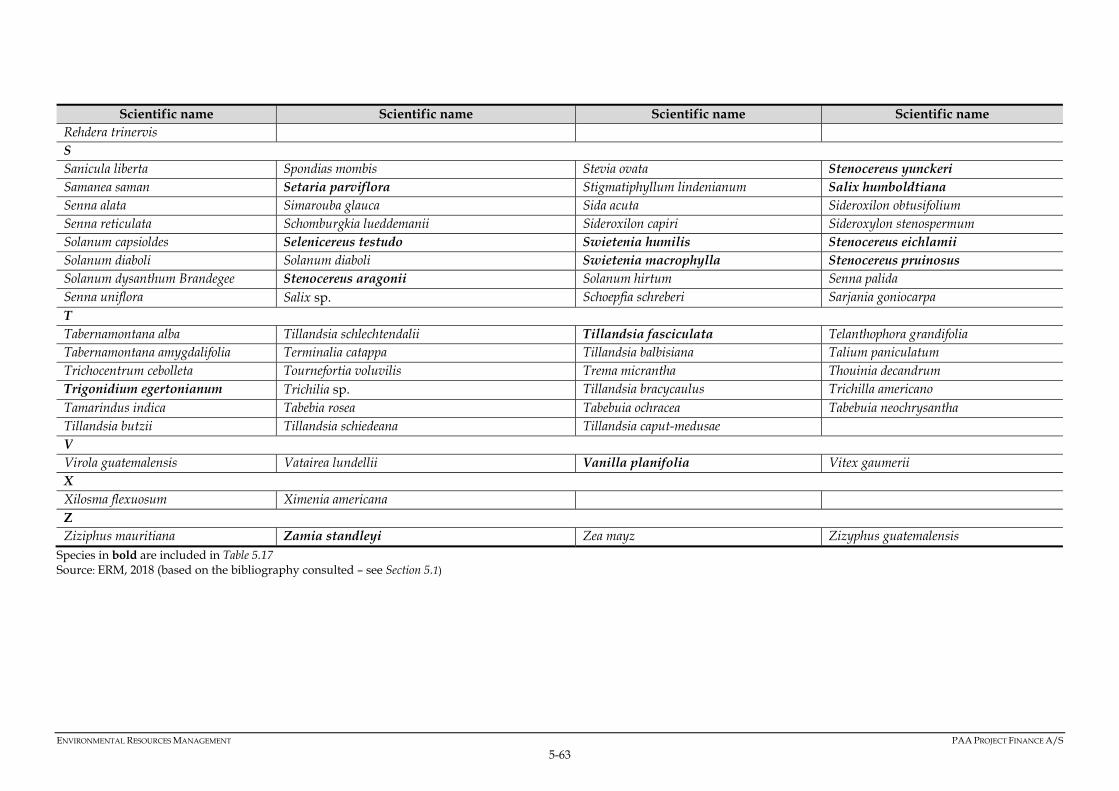
ENVIRONMENTAL RESOURCES MANAGEMENT PAA PROJECT FINANCE A/S
5-63
Scientific name Scientific name Scientific name Scientific name Rehdera trinervis S Sanicula liberta Spondias mombis Stevia ovata Stenocereus yunckeri Samanea saman Setaria parviflora Stigmatiphyllum lindenianum Salix humboldtiana Senna alata Simarouba glauca Sida acuta Sideroxilon obtusifolium Senna reticulata Schomburgkia lueddemanii Sideroxilon capiri Sideroxylon stenospermum Solanum capsioldes Selenicereus testudo Swietenia humilis Stenocereus eichlamii Solanum diaboli Solanum diaboli Swietenia macrophylla Stenocereus pruinosus Solanum dysanthum Brandegee Stenocereus aragonii Solanum hirtum Senna palida Senna uniflora Salix sp. Schoepfia schreberi Sarjania goniocarpa T Tabernamontana alba Tillandsia schlechtendalii Tillandsia fasciculata Telanthophora grandifolia Tabernamontana amygdalifolia Terminalia catappa Tillandsia balbisiana Talium paniculatum Trichocentrum cebolleta Tournefortia voluvilis Trema micrantha Thouinia decandrum Trigonidium egertonianum Trichilia sp. Tillandsia bracycaulus Trichilla americano Tamarindus indica Tabebia rosea Tabebuia ochracea Tabebuia neochrysantha Tillandsia butzii Tillandsia schiedeana Tillandsia caput-medusae V Virola guatemalensis Vatairea lundellii Vanilla planifolia Vitex gaumerii X Xilosma flexuosum Ximenia americana Z Ziziphus mauritiana Zamia standleyi Zea mayz Zizyphus guatemalensis
Species in bold are included in Table 5.17 Source: ERM, 2018 (based on the bibliography consulted – see Section 5.1)

ENVIRONMENTAL RESOURCES MANAGEMENT PAA PROJECT FINANCE A/S
5-64
Table 5.17 Significant flora species in the Project Area
Scientific name Common name (English)
Common name (Spanish / Local)
Family Endemic IUCN CITES Species of Special Concern
in Honduras
Sensitivity
Acanthocereus tetragonus Triangle cactus Pitaya Cactaceae - LC Appendix II - Medium Acanthocereus chiapensis (Peniocereus chiapensis)
- - Cactaceae - VU Appendix II - Medium
Acacia riparia - Jamacuau Fabaceae - LC - - Low Andira inermis Cabbage tree Almendro de río Fabaceae - LC - - Low Bakeridesia molinae - Gallinazo Malvaceae Yes - - - High Caesalpinia yucatanensis (subsp. hondurensis)
- Aguán Fabaceae Yes - - - High
Capparicordis yunckeri - - Capparaceae Yes - - - High Cedrela odorata Spanish cedar Cedro rojo Meliceae - VU Appendix III - Medium Ceiba pentandra - Ceiba Malvaceae - LC - - Low Chloroleucon mangense - Espino verde Fabaceae - LC - - Low Commelina diffusa Climbing
dayflower - Commelinaceae - LC - - Low
Dalbergia glabra - - Fabaceae - - Appendix II - Medium Delonix regia Flame tree - Fabaceae - LC - - Low Dioon mejiae - Palma teosinte Zamiaceae Yes LC Appendix II - High Eugenia lempana - Guayabo de cerro Myrtaceae Yes - - - High Eugenia coyolensis - Mestizo Myrtaceae Yes CR - - High Guaiacum sanctum Holywood
lignum vitae Guayacán Zygophyllaceae - NT Appendix II - Medium
Leucaena lempirana - - Fabaceae Yes VU - - High Lonchocarpus trifolius - - Fabaceae Yes CR - - High Lonchocarpus yoroensis - - Fabaceae - CR - - High Mangifera indica Mango Mango Anacardiaceae - DD - - Low

ENVIRONMENTAL RESOURCES MANAGEMENT PAA PROJECT FINANCE A/S
5-65
Scientific name Common name (English)
Common name (Spanish / Local)
Family Endemic IUCN CITES Species of Special Concern
in Honduras
Sensitivity
Mimosa albida - - Fabaceae - LC - - Low Mimosa pudica Sensitive Plant Dormilona Fabaceae - LC - - Low Monstera spruceana - Canculunco Araceae - - Appendix II - Medium Melocactus curvispinus - - Cactaceae - LC Appendix II - Medium Nyctocereus guatemalensis - Cola de Coyote Cactaceae - LC Appendix II Yes Medium Opuntia hondurensis - Tuna oreja de vaca Cactaceae Yes - Appendix II - High Opuntia guatemalensis - Oreja de Vaca Cactaceae - LC Appendix II - Medium Opuntia deamii - - Cactaceae - - Appendix II - Medium Opuntia decumbens - - Cactaceae - LC Appendix II - Medium Opuntia lutea (Nopalea lutea)
- - Cactaceae - DD Appendix II - Medium
Opuntia pubescens - - Cactaceae - LC Appendix II - Medium Pilosocereus maxonii - Barba de Viejo Cactoideae - - Appendix II - Medium Parathesis vulgata - - Myrsinaceae - EN - - High Persea americana Avocado Aguacate Lauraceae - LC - - Low Pereskia lychnidiflora - Pitittache Cactaceae - LC - - Low Pilosocereus leucosephalus - - Cactaceae - - Appendix II - Medium Stenocereus yunckeri - - Cactaceae - CR (*) Appendix II - High Swietenia macrophylla Big leaf
mahogany Caoba Meliaceae - VU Appendix I - Medium
Selenicereus testudo - Pitaya de tortuga Cactaceae - - Appendix II - Medium Salix humboldtiana - Sauce Salicaceae - LC - - Low Swietenia humilis Honduras
mahogany Caoba de Honduras
Meliaceae - VU Appendix II - Medium
Stenocereus eichlamii - - Cactaceae - DD - - Low Stenocereus pruinosus - - Cactaceae - LC Appendix II - Medium Stenocereus aragonii - - Cactaceae - LC Appendix II - Medium Setaria parviflora Marsh brittlegrass - Poaceae - LC - - Low

ENVIRONMENTAL RESOURCES MANAGEMENT PAA PROJECT FINANCE A/S
5-66
Scientific name Common name (English)
Common name (Spanish / Local)
Family Endemic IUCN CITES Species of Special Concern
in Honduras
Sensitivity
Trigonidium egertonianum - - Orchidaceae - - Appendix II - Medium Tillandsia fasiculata Cardinal air plant Gallito Bromeliaceae - LC - - Low Vanilla planifolia - Vainilla mansa Orchidaceae - EN Appendix II - High Zamia standleyi - Camotillo Zamiaceae Yes VU Appendix II - High
Notes: Flora included in Table 5.16 but not in Table 5.17 is considered to have a low level of sensitivity. (*) See Annex 6 for further clarification. Source: Documents RVSCEH – Edited by ERM, 2018

ENVIRONMENTAL RESOURCES MANAGEMENT PAA PROJECT FINANCE A/S
5-67
Use of Flora in the Project Area
The local population in the Project Area use certain species of plants for the following purposes:
Grazing livestock, both forage plants and natural shrub vegetation. Medicinal plants, used for various health problems. It should be noted
that the guayacan (Guaiacum sanctum) is commercially used to treat renal diseases. It is the only Honduran species listed in Appendix II of CITES for medicinal plants.
Provision of wood: most of the tree species are used for the construction of fences, firewood, and as a construction material.
Table 5.18 includes a list of some of the species of plants commonly used by the local population.
Table 5.18 Medicinal and lumber plants in the Project Area
Scientific name Common name (Spanish / Local)
Main use
Guaiacum sanctum Guayacán Medicinal / wood Phyllostylon rhamnoides Palo blanco Wood Ocimun campechianum Orégano Medicinal Lippia graveolens Oreganillo Medicinal Bromelia plumieri Piñuelo Medicinal Solanum diaboli Frutica Medicinal Cnidoscolus aconitifolius Chayo Medicinal Acacia deamii Jamacuau Wood Leucaena lempirana - Wood Haematoxylum brasiletto Brasileto Wood Diphysa carthagense Guachipilin Wood Chloroleucon mangense Espino verde Wood Cedrela odorata Cedro Wood Trichilla americano Cedrillo Wood Pennisetum setaceum Zacate verde Medicinal Aloe vera Sábila Medicinal Annona muricata guanabana Medicinal Eucalyptus sp. - Medicinal Guazuma ulmifolia Caulote Medicinal Enterolobium cyclocarpum Guanacaste Wood Swietenia macrophylla Caoba Wood
Source: Asesora, 2009 – Modified by ERM, 2018
Key findings - field survey (June 2018)
The field survey aimed to gather information on: (1) use of medicinal plants; (2) lumbering activities; and (3) the flora present in the area. Annex 4 (Field Survey Map- Biological Baseline) shows the locations where specific information on flora was gathered during the field survey. Table 5.4 summarizes the feedback on medicinal plants received during the field survey. The use of medicinal plants has decreased and is currently only
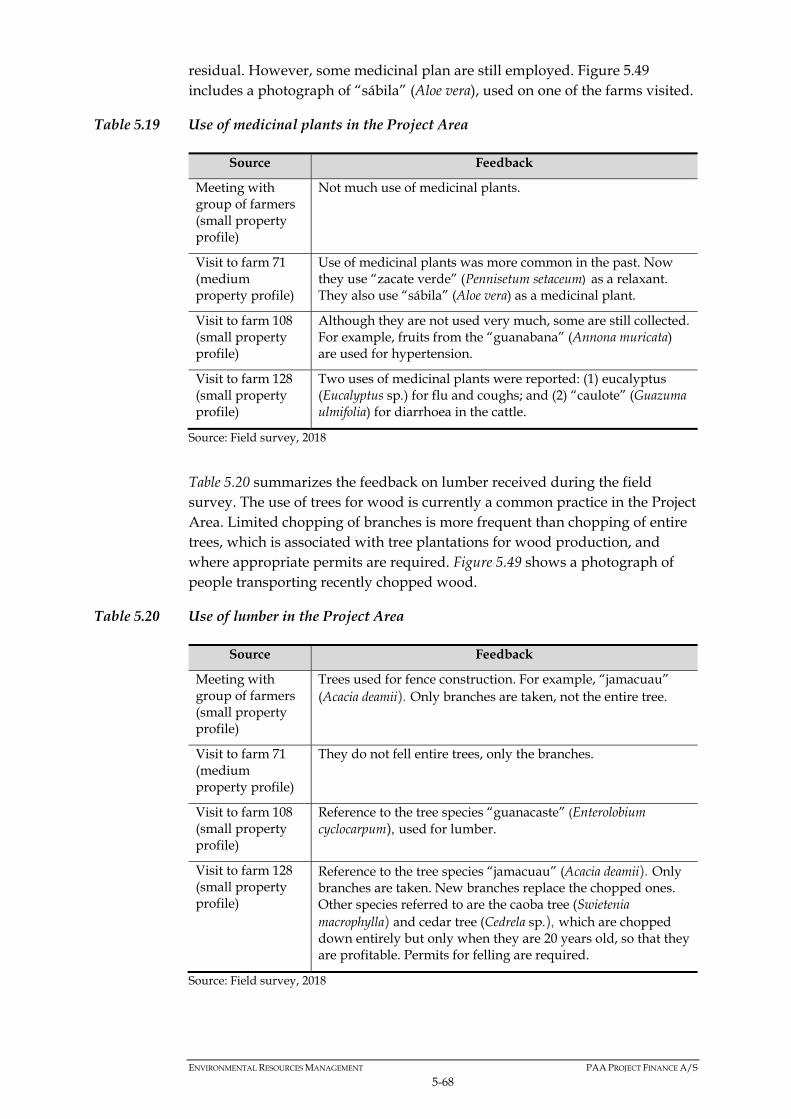
ENVIRONMENTAL RESOURCES MANAGEMENT PAA PROJECT FINANCE A/S
5-68
residual. However, some medicinal plan are still employed. Figure 5.49 includes a photograph of “sábila” (Aloe vera), used on one of the farms visited.
Table 5.19 Use of medicinal plants in the Project Area
Source Feedback
Meeting with group of farmers (small property profile)
Not much use of medicinal plants.
Visit to farm 71 (medium property profile)
Use of medicinal plants was more common in the past. Now they use “zacate verde” (Pennisetum setaceum) as a relaxant. They also use “sábila” (Aloe vera) as a medicinal plant.
Visit to farm 108 (small property profile)
Although they are not used very much, some are still collected. For example, fruits from the “guanabana” (Annona muricata) are used for hypertension.
Visit to farm 128 (small property profile)
Two uses of medicinal plants were reported: (1) eucalyptus (Eucalyptus sp.) for flu and coughs; and (2) “caulote” (Guazuma ulmifolia) for diarrhoea in the cattle.
Source: Field survey, 2018
Table 5.20 summarizes the feedback on lumber received during the field survey. The use of trees for wood is currently a common practice in the Project Area. Limited chopping of branches is more frequent than chopping of entire trees, which is associated with tree plantations for wood production, and where appropriate permits are required. Figure 5.49 shows a photograph of people transporting recently chopped wood.
Table 5.20 Use of lumber in the Project Area
Source Feedback
Meeting with group of farmers (small property profile)
Trees used for fence construction. For example, “jamacuau” (Acacia deamii). Only branches are taken, not the entire tree.
Visit to farm 71 (medium property profile)
They do not fell entire trees, only the branches.
Visit to farm 108 (small property profile)
Reference to the tree species “guanacaste” (Enterolobium cyclocarpum), used for lumber.
Visit to farm 128 (small property profile)
Reference to the tree species “jamacuau” (Acacia deamii). Only branches are taken. New branches replace the chopped ones. Other species referred to are the caoba tree (Swietenia macrophylla) and cedar tree (Cedrela sp.), which are chopped down entirely but only when they are 20 years old, so that they are profitable. Permits for felling are required.
Source: Field survey, 2018

ENVIRONMENTAL RESOURCES MANAGEMENT PAA PROJECT FINANCE A/S
5-69
Figure 5.49 Lumber and medicinal plants in the Project Area
Source: ERM, 2018
Figure 5.50 includes a selection of photographs of flora taken during the field survey.
Figure 5.50 Flora observed in the Project Area
Source: ERM, 2018
Pedilanthus camporum
Acacia riparia
Pilosocerus maxonii
Opuntia sp. Delonix regia

ENVIRONMENTAL RESOURCES MANAGEMENT PAA PROJECT FINANCE A/S
5-70
5.4.3 Fauna
Overview
Conservation and management reports on the fauna in the Project Area from the Honduran Emerald Hummingbird Wildlife Refuge1 provide a very detailed assessment of the existing fauna, based on scientific fauna inventories. These reports summarize the study of fauna conducted over a very large area of the Alto Aguan. The study reflects a large quantity of fauna, some of which is endangered according to national and international classifications. The RVSCEH is split into different zones across the Project Area, as described in Section 0.0.-1556586336. The fauna found in the RVSCEH can also be observed in neighbouring areas where natural habitats occur (e.g., very dry and dry tropical forest). In absence of natural habitats (i.e., in agricultural fields and pastures), the presence of the fauna described in the RVSCEH is only occasional (limited to specific activities, such as searching for food) and limited to species with a wider range of suitable habitats and / or which are more mobile (e.g., birds). The following groups of fauna are described separately in specific sections: fish, amphibians, reptiles, birds, and mammals. Fish
According to Matamoros et al. (2009), there are at least 172 species of fish in Honduras, inhabiting mainland and insular freshwater systems. Six of these species are exotic species, while the remaining 166 are native. The actual number of fish species in Honduras is likely to be higher, taking into account the variety of remote areas in the country that are still unstudied. Inventories of fauna conducted in the RVSCEH do not provide a list of fish species. However, the list of fish in the article published by Matamoros et al. (2009) is organized by major drainage basins in Honduras, incluing the Aguan River as one of the major basins in the country. Table 5.21 includes the specific list of fish identified by Matamoros et al. (2009) in the Aguan River Basin: this can be considered very representative of the fish species potentially found in the Project Area. For each species, Table 5.21 also includes a level of protection, conservation concern, and sensitivity (see Section 6.2.2 for further references on sensitivity) based on: (1) international references such as the IUCN and CITES; (2) the level of endemicity; and (3) a list of species of flora and fauna of special
1 RVSCEH – Refugio de Vida Silvestre Colibrí Esmeralda Hondureño

ENVIRONMENTAL RESOURCES MANAGEMENT PAA PROJECT FINANCE A/S
5-71
concern in Honduras. Section 2.1.7 provides a description of the international and national references considered. Based on the information included in Table 5.21, the most significant findings on fish potentially present in the Project Area are:
Up to 33 species of fish are potentially present in the Project Area. The following families are the most numerous: Ciclidae (8 species) and
Poeciliidae (8 species). None of the species is endemic. All the species are found in other
countries in America, and even on other continents. Only one species is assessed as threatened by the IUCN: Megalops
atlanticus (VU). The other species have not been assessed by the IUCN or if they have, were assessed as Least Concern (LC) or Data Deficient (DD).
None of the species is included in Appendixes of CITES. Two species are classified as Species of Special Concern in Honduras:
Agonostomus monticola and Joturus pichardi. All the species of fish are considered to be of low and medium
sensitivity. They are likely to be common and widespread, and therefore less likely to be of concern in terms of conservation and protection. Therefore, none of the fish species is included in Annex 6, which includes additional information (habitat, ecology and distribution) on high sensitivity flora and fauna.
To conclude, Figure 5.51 includes some fish observed during the June 2018 field survey in the Project Area.

ENVIRONMENTAL RESOURCES MANAGEMENT PAA PROJECT FINANCE A/S
5-72
Figure 5.51 Fish observed in the Project Area
Source: ERM, 2018
Cryptoheros cutteri Fam. Poeciliidae
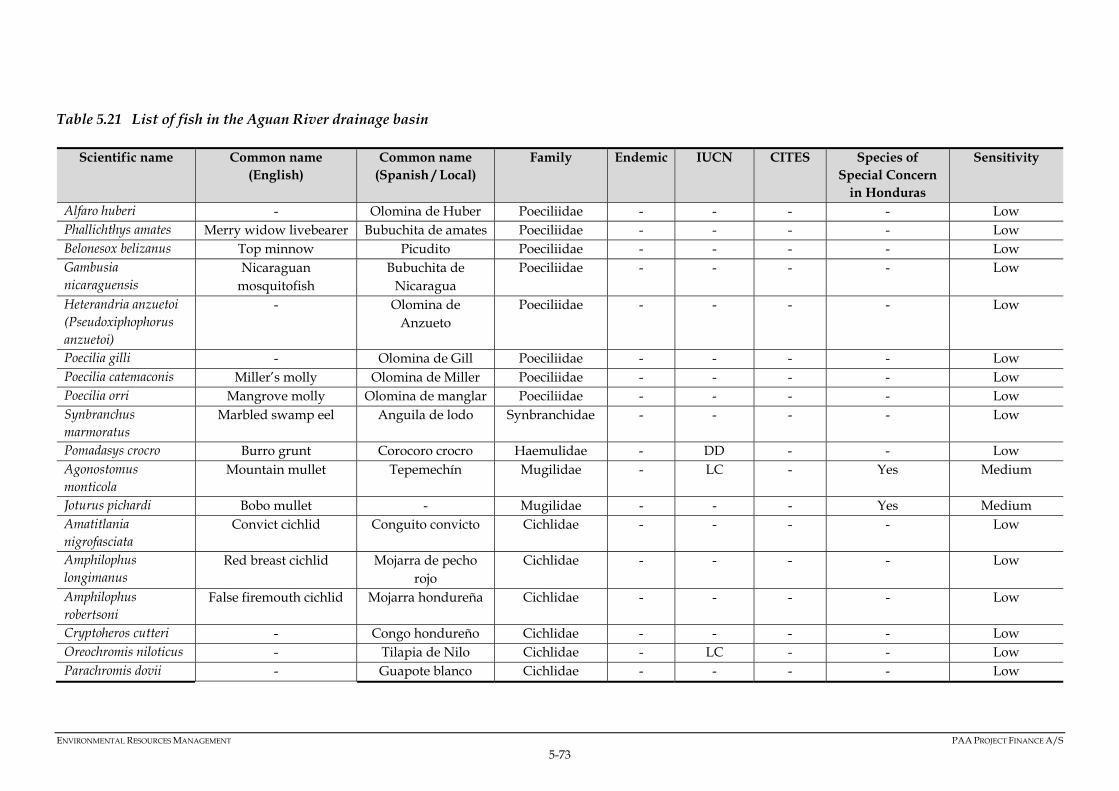
ENVIRONMENTAL RESOURCES MANAGEMENT PAA PROJECT FINANCE A/S
5-73
Table 5.21 List of fish in the Aguan River drainage basin
Scientific name Common name (English)
Common name (Spanish / Local)
Family Endemic IUCN CITES Species of Special Concern
in Honduras
Sensitivity
Alfaro huberi - Olomina de Huber Poeciliidae - - - - Low Phallichthys amates Merry widow livebearer Bubuchita de amates Poeciliidae - - - - Low Belonesox belizanus Top minnow Picudito Poeciliidae - - - - Low Gambusia nicaraguensis
Nicaraguan mosquitofish
Bubuchita de Nicaragua
Poeciliidae - - - - Low
Heterandria anzuetoi (Pseudoxiphophorus anzuetoi)
- Olomina de Anzueto
Poeciliidae - - - - Low
Poecilia gilli - Olomina de Gill Poeciliidae - - - - Low Poecilia catemaconis Miller’s molly Olomina de Miller Poeciliidae - - - - Low Poecilia orri Mangrove molly Olomina de manglar Poeciliidae - - - - Low Synbranchus marmoratus
Marbled swamp eel Anguila de lodo Synbranchidae - - - - Low
Pomadasys crocro Burro grunt Corocoro crocro Haemulidae - DD - - Low Agonostomus monticola
Mountain mullet Tepemechín Mugilidae - LC - Yes Medium
Joturus pichardi Bobo mullet - Mugilidae - - - Yes Medium Amatitlania nigrofasciata
Convict cichlid Conguito convicto Cichlidae - - - - Low
Amphilophus longimanus
Red breast cichlid Mojarra de pecho rojo
Cichlidae - - - - Low
Amphilophus robertsoni
False firemouth cichlid Mojarra hondureña Cichlidae - - - - Low
Cryptoheros cutteri - Congo hondureño Cichlidae - - - - Low Oreochromis niloticus - Tilapia de Nilo Cichlidae - LC - - Low Parachromis dovii - Guapote blanco Cichlidae - - - - Low

ENVIRONMENTAL RESOURCES MANAGEMENT PAA PROJECT FINANCE A/S
5-74
Scientific name Common name (English)
Common name (Spanish / Local)
Family Endemic IUCN CITES Species of Special Concern
in Honduras
Sensitivity
Parachromis loisellei Guapote amarillo Cichlidae - - - - Low Vieja maculicauda Blackbelt cichlid Machaca Cichlidae - - - - Low Dormitator maculatus Fat sleeper Dormilón del
Atlántico Eleotridae - LC - - Low
Eleotris amblyopsis Large-scaled spinycheek sleeper
Dormilón oscuro. Eleotridae - LC - - Low
Eleotris perniger Smallscaled spinycheek sleeper
Guavina espinosa Eleotridae - LC - - Low
Gobiomorus dormitor Bigmouth sleeper Guavina del Atlántico
Eleotridae - LC - - Low
Awaous banana River goby Gobio de río Gobiidae - - - - Low Megalops atlanticus Tarpon Sábalo Megalopidae - VU - - Medium Astyanax aeneus Banded tetra Sardina Characidae - - - - Low Rhamdia guatemalensis
Pale catfish Barbudo de Guatemala
Heptapteridae - - - - Low
Rhamdia laticauda Filespine chulin Chulín Heptapteridae - - - - Low Gymnotus cylindricus - Pez cuchillo Gymnotidae - - - - Low Atherinella milleri Miller's silverside Plateadira de Miller Atherinopsidae - LC - - Low Pseudophallus mindii Freshwater pipefish Pez pipa Syngnathidae - DD - - Low
Source: Matamoros et al., 2009 – Edited by ERM, 2018
ENVIRONMENTAL RESOURCES MANAGEMENT PAA PROJECT FINANCE A/S
5-75
Amphibians
According to McCranie (2009) there are 129 species of amphibians in Honduras, from three different orders: two species of caecilian (order Apoda), 31 species of salamander (order Caudata) and 96 species of frogs and toads (order Anura). When considering amphibians together with reptiles (herpetofauna) the number of species in Honduras is higher than in neighbouring countries: there are 389 species of herpetofauna in Honduras; only 130 species in El Salvador (Köhler, Vesely and Greenbaum, 2005); and in 244 in Nicaragua (Sunyer, J., 2009). On the other hand, the number of herpetofauna species in Honduras is lower than in countries like Costa Rica, where there are 432 species (Bolaños et al., 2009). However, some areas of Honduras have not yet been studied, so the actual number of herpetofauna species might be higher. Table 5.22 shows the list of amphibians in the Project Area, based on a desktop review of availalable information together with the information gathered during the June 2018 field survey. For each species, Table 5.22 also includes the level of protection, conservation concern and sensitivity (see Section 6.2.2 for further references about sensitivity) based on: (1) international references such as the IUCN and CITES; (2) the level of endemicity; and (3) a list of species of flora and fauna of special concern in Honduras. Section 2.1.7 provides a description of the international and national references considered. Based on the information included in Table 5.22, the most significant findings on the amphibians present in the Project Area are:
Up to 15 species of amphibians present in the Project Area. The most numerous family is Hylidae, with four species. None of the species is endemic. They are all found in other countries in
America. None of the species is assessed as threatened by the IUCN. They are
assessed as Least Concern (LC). None of the species is included in the Appendices of CITES. None of the species is classified as a Species of Special Concern in
Honduras. All the species of amphibians are considered to be of low
sensitivity.They are likely to be common and widespread species, and therefore less likely be of concern in terms of conservation and protection. Therefore, none of the amphibian species is included in Annex 6, which includes additional information (habitat, ecology and distribution) on high sensitivity flora and fauna.
Figure 5.52 includes some amphibians observed during the field survey conducted in the Project Area in June 2018. It was not possible to identify the species. In the first case (photograph on the left), this was because the

ENVIRONMENTAL RESOURCES MANAGEMENT PAA PROJECT FINANCE A/S
5-76
individual was in a very bad condition (flattened and dehydrated). In the second case (photograph on the right), beause they were only tadpoles.
Figure 5.52 Amphibians observed in the Project Area
Source: ERM, 2018

ENVIRONMENTAL RESOURCES MANAGEMENT PAA PROJECT FINANCE A/S
5-77
Table 5.22 List of amphibians in the Project Area
Scientific name Common name (English)
Common name (Spanish / Local)
Family Endemic IUCN CITES Species of Special Concern
in Honduras
Sensitivity
Bolitoglossa mexicana Mexican mushroomtongue salamander
Salamandra de vientre oscuro
Plethodontidae - LC - - Low
Rhinella marina Cane toad Sapo común Bufonidae - LC - - Low Incilius valliceps Southern Gulf coast toad Sapo comun de crestas
grandes Bufonidae - LC - - Low
Incilius luetkenii Yellow toad - Bufonidae - LC - - Low Dendropsophus microcephalus
Small-headed treefrog Ranita trepadora amarilla Hylidae - LC - - Low
Smilisca baudinii Common Mexican treefrog Rana trepadora común Hylidae - LC - - Low Trachycephalus venulosus
- Rana trepadora lechosa Hylidae - LC - - Low
Scinax staufferi Stauffer's treefrog Rana trepadora nariguda Hylidae - LC - - Low Engystomops pustulosus
Tungara frog Sapito tungara Leptodactylidae - LC - - Low
Leptodactylus fragilis American white lipped frog Ranita de charco Leptodactylidae - LC - - Low Leptodactylus melanonotus
Sabinal frog Ranita de charco de dos espinas
Leptodactylidae - LC - - Low
Hypopachus variolosus Mexican narrow-mouthed toad
- Mycrohylidae - LC - - Low
Lithobates brownorum (Lithobates berlandieri / Rana brownorum)
Rio Grande leopard frog Rana leopardo Ranidae - LC - - Low
Lithobates vaillanti Vaillant's frog - Ranidae - LC - - Low Rhinophrynus dorsalis Burrowing toad Sapo borracho Rhinophrynidae - LC - - Low
Source: Documents RVSCEH – Edited by ERM, 2018

ENVIRONMENTAL RESOURCES MANAGEMENT PAA PROJECT FINANCE A/S
5-78
Reptiles
According to McCranie (2009), there are 260 species of reptiles in Honduras, from four different orders: two species of crocodiles (order Crocodylia), 31 species of turtles (order Testudines), 93 species of lizards (order Squamata) and 134 species of snakes (order Squamata). As described in the amphibians section, when considering reptiles together with amphibians (herpetofauna), the number of species in Honduras is higher than in the neighbouring countries of El Salvador and Nicaragua, although lower than other Central American countries like Costa Rica. However, because areas of Honduras remain unstudied, the actual number of herpetofauna species might be higher. Table 5.23 shows the list of reptiles in the Project Area, based on a desktop review of availalable information together with the information gathered during the June 2018 field survey. For each species Table 5.23 also includes a level of protection, conservation concern, and sensitivity (see Section 6.2.2 for further references on sensitivity) based on: (1) international references such as the IUCN and CITES; (2) the level of endemicity; and (3) a list of species of flora and fauna of special concern in Honduras. Section 2.1.7 provides a description of the international and national references considered. Based on the information included in Table 5.23, the most significant findings of the reptiles present in the Project Area are as follows:
Up to 40 species of reptiles are present in the Project Area. The following families are the most numerous: Colubridae (11 species)
and Dipsadidae (6 species). Two species are endemic, with a distribution that is limited to
Honduras: Ctenosaura melanosterna and Sphaerodactylus dunni. The other species are not endemic and therefore are also found in other countries in America, and even on other continents.
Only one species is assessed as threatened by the IUCN: Ctenosaura melanosterna (CR). The other species have not been assessed by the IUCN or, if they have, they are of Least Concern (LC) or Near Threatened (NT).
Three species are included in the Appendices of CITES: Ctenosaura melanosterna (Appendix II); Crotalus simus (Appendix III); and Caiman crocodilus (Appendix I and II).
None of the species is classified as a Species of Special Concern in Honduras.
Two species of reptiles (Ctenosaura melanosterna and Sphaerodactylus dunni) are considered high sensitivity (endemic and / or CR / EN by IUCN). They are included in Annex 6, which includes additional information (habitat, ecology and distribution) on high sensitivity flora and fauna. The other species (low / medium sensitivity) are likely to

ENVIRONMENTAL RESOURCES MANAGEMENT PAA PROJECT FINANCE A/S
5-79
be common and widespread, and therefore less likely to be of concern in terms of conservation and protection.
To conclude, Figure 5.53 includes some reptiles observed during the field survey conducted in the Project Area in June 2018.
Figure 5.53 Reptiles observed in the Project Area
Note: Identification of the species Rhinoclemmys pulcherrima and Aspidoscelis motaguae is the most likely case only. The tortoise’s shell was in bad condition and the observation of the lizard was only fleeting, resulting in a bad quality photo that hinders accurate identification.
Rhinoclemmys pulcherrima
Ctenosaura melanosterna
Aspidoscelis motaguae
ENVIRONMENTAL RESOURCES MANAGEMENT PAA PROJECT FINANCE A/S
5-80
Source: ERM, 2018

ENVIRONMENTAL RESOURCES MANAGEMENT PAA PROJECT FINANCE A/S
5-81
Table 5.23 List of reptiles in the Project Area
Scientific name Common name (English)
Common name (Spanish / Local)
Family Endemic IUCN CITES Species of Special
Concern in Honduras
Sensitivity
Ctenosaura similis Common spiny-tailed iguana
Garrobo Iguanidae - LC - - Low
Ctenosaura melanosterna Black-chested spiny-tailed iguana
Jamo negro Iguanidae Yes CR Appendix II - High
Conophis lineatus - Guardacaminos Dipsadidae - LC - - Low Dryadophis melanolomus (Mastigodryas melanolomus)
Salmon-bellied racer Sabanera Colubridae - LC - - Low
Drymobius margaritiferus Speckled racer Terciopelo Colubridae - LC - - Low Imantodes cenchoa Blunthead tree snake Bejuquilla cabezona Colubridae - - - - Low Leptophis mexicanus Mexican parrot snake Falso tamagas
verde Colubridae - LC - - Low
Ninia sebae Redback coffee snake Coralito falso Dipsadidae - LC - - Low Leptodeira annulata (Leptodeira rhombifera)
- Falso tamagás Dipsadidae - LC - - Low
Sibon anthracops Cope's snail sucker Caracolera Dipsadidae - LC - - Low Trimorphodon biscutatus (Trimorphodon quadruplex)
Central American lyre snake
Zorcuata Colubridae - LC - - Low
Coniophanes fissidens Yellowbelly snake Culebra de tierra Dipsadidae - LC - - Low Xenodon rabdocephalus - Falso barba
amarilla Colubridae - - - - Low
Porthidium ophryomegas Slender hognose viper Tamagás negro Viperidae - LC - - Low Crotalus simus Middle American
rattlesnake Cascabel Viperidae - LC Appendix III - Medium
Epictia ater - Culebra gusano Leptotyphlopidae - LC - - Low Micrurus nigrocinctus - Coral Elapidae - LC - - Low

ENVIRONMENTAL RESOURCES MANAGEMENT PAA PROJECT FINANCE A/S
5-82
Scientific name Common name (English)
Common name (Spanish / Local)
Family Endemic IUCN CITES Species of Special
Concern in Honduras
Sensitivity
Drymarchon melanurus Western indigo snake Yugalan Colubridae - LC - - Low Enulius flavitorques Pacific longtail snake - Dipsadidae - LC - - Low Leptodrymus pulcherrimus Striped lowland snake - Colubridae - LC - - Low Spilotes pullatus - Mica Colubridae - - - - Low Tantilla armillata - - Colubridae - LC - - Low Trachemys venusta - Jicotea Emydidae - - - - Low Rhinoclemmys pulcherrima - Tortuga dragón Geoemydidae - - - - Low Kinosternon scorpioides (Kinosternon acutum)
Tabasco mud turtle Culuco Kinosternidae - NT - - Medium
Norops sericeus Silky anole Lagartija Polychrotidae - - - - Low Mabuya unimarginata (Marisora unimarginata)
Central American mabuya Lisa Scincidae - LC - - Low
Sceloporus olloporus (Sceloporus variabilis)
Rose-bellied lizard Escorpión Phrynosomatidae - LC - - Low
Basiliscus vittatus Brown basilisk Charancaco Corytophanidae - LC - - Low Coleonyx mitratus Central American banded
gecko Geko Eublepharidae - LC - - Low
Hemidactylus frenatus Common house gecko Geko Gekkonidae - LC - - Low Sphaerodactylus dunni Dunn's least gecko - Sphaerodactylidae Yes LC - - High Sphaerodactylus millepunctatus
- Geko Sphaerodactylidae - - - - Low
Thecadactylus rapicauda Turniptail gecko Geko Phyllodactylidae - - - - Low Ameiva festiva (Holcosus festivus)
Middle American ameiva - Teiidae - LC - - Low
Ameiva undulata (Holcosus undulatus)
Rainbow ameiva - Teiidae - LC - - Low
Aspidoscelis deppei (Cnemidophorus deppei)
Blackbelly racerunner Quijina rayada / Tijo coliazul
Teiidae - LC - - Low

ENVIRONMENTAL RESOURCES MANAGEMENT PAA PROJECT FINANCE A/S
5-83
Scientific name Common name (English)
Common name (Spanish / Local)
Family Endemic IUCN CITES Species of Special
Concern in Honduras
Sensitivity
Aspidoscelis motaguae - - Teiidae - LC - - Low Spilotes pullatus Chicken snake Mica Colubridae - - - - Low Caiman crocodilus Spectacled caiman Caimán / Lagarto Alligatoridae - LC Appendix I
and II - Medium
Source: Documents RVSCEH – Edited by ERM, 2018

ENVIRONMENTAL RESOURCES MANAGEMENT PAA PROJECT FINANCE A/S
5-84
Birds
According to Monroe (1968) and Bonta & Anderson (2002), there are 701 species of birds in Honduras. Table 5.24 shows the list of birds in the Project Area, based on a desktop review of the available information together with the information gathered during the June 2018 field survey. The species highlighted in bold are more significant, considering their level of protection and conservation concern based on: (1) international references such as the IUCN, CMS, and CITES; (2) their level of endemicity; and (3) a list of species of flora and fauna of special concern in Honduras. Section 2.1.7 provides a description of the international and national references considered. These more significant species (41 in total) are also included in Table 5.25, which includes further details on their level of protection, conservation concern, and sensitivity (see Section 6.2.2 for further references about sensitivity). The rest of the bird species (1481 in total) are likely to be common and widespread, and therefore less likely to be of concern in terms of conservation and protection. Because of this, their level of sensitivity is defined as low. Based on the information included in Table 5.24 and Table 5.25, the most significant findings on the birds present in the Project Area are:
Up to 189 species of birds are present in the Project Area. The following families are the most numerous: Tyrannidae (24
species), Parulidae (20 species), Icteridae (14 species) and Accipitridae (10 species).
Only one species is endemic, with a distribution limited to Honduras: Amazilia luciae. The other species are not endemic and are therefore are also found in other countries in America, and even on other continents.
Only one species is assessed as threatened by IUCN: Amazilia luciae (EN). The other species have been assessed by the IUCN as Least Concern (LC) or Near Threatened (NT).
Seven species are included in Appendix II of the CMS (Convention on the Conservation of Migratory Species of Wild Animals): Anas clypeata (Spatula clypeata), Ardea alba, Nycticorax nycticorax, Pandion haliaetus, Falco columbarius, Falco peregrinus, and Calidris minutilla.
34 species are included in the Appendices of CITES: most in Appendix II (31 species), whilst only three of them are included in Appendix III.
None of the species is classified as a Species of Special Concern in Honduras.
1 All the 148 species are assessed by the IUCN as Least Concern (LC). None are endemic, nor included in the Appendices of of CITES and CMS.

ENVIRONMENTAL RESOURCES MANAGEMENT PAA PROJECT FINANCE A/S
5-85
One species of bird (Amazilia luciae) is considered of high sensitivity (endemic and / or CR / EN by IUCN), and included in Annex 6, where additional information (habitat, ecology and distribution) on high sensitivity flora and fauna is included. The other species (low / medium sensitivity) are likely to be common and widespread, and therefore less likely to be of concern in terms of conservation and protection.
To conclude, Figure 5.54 and Figure 5.55 include photographs of birds taken during the June 2018 field survey.
Figure 5.54 Birds observed in the Project Area
Note: Pitangus sulphuratus, Myiozetetes similis and Tyrannus melancholicus have yellow bellies and white chins, and are similarly sized species. For this reason it is not possible to differentiate them from the quality of the photographs achieved. Source: ERM, 2018
Figure 5.55 Hummingbirds observed in the Project Area
Note: Both species (Amazilia tzacatl and Amazilia rutila) are similar and from the same genus, and therefore cannot be differentiated considering the quality of the photographs achieved. Source: ERM, 2018
Amazilia luciae
Coragypus atratus
Amazilia tzacatl – Amazilia rutila
Pitanigus sulphuratus – Myiozetetes similis – Tyrannus melancholicus

ENVIRONMENTAL RESOURCES MANAGEMENT PAA PROJECT FINANCE A/S
5-86
Table 5.24 List of birds in the Project Area
Scientific name Scientific name Scientific name Scientific name A Anas discors Actitis macularia Amazilia luciae Aramides cajanea Anas clypeata (Spatula clypeata) Aratinga holochlora (Psittacara
holochlorus) Amazilia tzacatl Anthracothorax prevostii
Anhinga anhinga Aratinga nana (Eupsittula nana) Archilochus colubris Amblycercus holosericeus Ardea herodias Amazona albifrons Amazilia rutila Agelaius phoeniceus Ardea alba Amazona autumnalis Amblycercus holosericeus B Bubulcus ibis Buteogallus anthracinus Buteo brachyurus Buteo platypterus Butorides virescens Buteo nitidus Buteo albonotatus Bartramia longicauda Burhinus bistriatus Buteo magnirostris (Rupornis
magnirostris) Buteo albicaudatus
C Crypturellus cinnamomeus Charadrius semipalmatus Crotophaga sulcirostris Contopus virens Crypturellus soui Charadrius vociferus Chordeiles acutipennis Contopus cinereus Cairina moschata Calidris minutilla Chaetura vauxi Contopus pertinax Colinus cristatus Columba livia Chlorostilbon canivetii Cyclarhis gujanensis Coragyps atratus Columbina inca Chloroceryle amazona Cyanocorax morio Cathartes aura Columbina passerina Camptostoma imberbe Cyanocorax yncas Chondrohierax uncinatus Columbina talpacoti Catharus ustulatus Carduelis psaltria Caracara cheriway Coccyzus americanus Ceryle alcylon D Dendrocygna autumnalis Dumetella carolinensis Dendroica petechia Dendroica coronata Dromococcyx phasianellus Dendroica magnolia Dendroica pensylvanica Dendroica virens Dryocopus lineatus Dendroica dominica Dendroica fusca Dendroica townsendi Dives dives E Egretta thula Eudocimus albus Elaenia flavogaster Empidonax flaviventris

ENVIRONMENTAL RESOURCES MANAGEMENT PAA PROJECT FINANCE A/S
5-87
Scientific name Scientific name Scientific name Scientific name Egretta caerulea Elanus leucurus Euphonia affinis Empidonax traillii Egretta tricolor Eumomota superciliosa Euphonia hirundinacea Empidonax minimus F Falco sparverius Falco columbarius Falco rufigularis Falco peregrinus G Geococcyx velox Geothlypis trichas Geothlypis poliocephala Glaucidium brasilianum H Herpetotheres cachinnans Henicorhina leucosticta Hirundo rustica Helmitheros vermivorum Himantopus mexicanus Hylocichla mustelina I Ictinia mississippiensis Ictinia plumbea Icterus spurius Icterus pectoralis Icterus galbula Icterus gularis Icterus chrysatertyr J Jacana spinosa L Leptotila verreauxi M Mycteria americana Myiarchus tyrannulus Megarhynchus pitangua Myiodynstes luteiventris Micrastur semitorquatus Mionectes oleagineus Myiozetetes similis Mniotilta varia Morococcyx erythropygus Mylarchus tuberculifer Mimus gilvus Megaceryle alcyon Melanerpes aurifrons Myiarchus crinitus Molothrus aeneus Molothrus oryzivorus Momotus momota N Nycticorax nycticorax Nyctidromus albicollis O Ortalis vetula Oporornis formosus P Phalacrocorax brasilianus Pachyramphus aglaiae Pheucticus ludovicianus Psarocolius montezuma Platalea ajaja Progne subis Passerina cyanea Passer domesticus Pandion haliaetus Progne chalybea Patagioenas flavirostris Parula americana Porphyrio martinica Polioptila albiloris Pionus senilis Psarocolius wagleri

ENVIRONMENTAL RESOURCES MANAGEMENT PAA PROJECT FINANCE A/S
5-88
Scientific name Scientific name Scientific name Scientific name Piaya cayana Pteroglossus torquatus Pitangus sulphuratus Q Quiscalus mexicanus S Sarcoramphus papa Seiurus aurocapillus Stelgidopteryx serripennis Setophaga ruticilla Streptoprocne zonaris Sporophila torqueola T Tachybaptus dominicus Trogon melanocephalus Thamnophilus doliatus Tyrannus forficatus Tringa solitaria Trogon elegans Todirostrum cinereum Tyrannus savana Tapera naevia Trogon violaceus Tolmomyias sulphurescens Tyrannus melancholicus Tyrannus tyrannus Tachycineta thalassina Thryothorus maculipectus Tityra semifasciata Troglodytes aedon Tachycineta albilinea Thryothorus modestus Turdus grayi U Uropsila leucogaster hawkinsi V Vireo griseus Vireo gilvus Vireo flavoviridis Vermivora chrysoptera Vireo flavifrons Vireo philadelphicus Vermivora pinus Vermivora peregrina W Wilsonia citrina Z Zenaida asiática Zenaida macroura Zimmerius vilissimus
Species in bold are included in Table 5.25 Source: Documents RVSCEH – Edited by ERM, 2018

ENVIRONMENTAL RESOURCES MANAGEMENT PAA PROJECT FINANCE A/S
5-89
Table 5.25 Significant birds in the Project Area
Scientific name Common name (English)
Common name (Spanish / Local)
Family Endemic IUCN CMS CITES Species of Special
Concern in Honduras
Sensitivity
Dendrocygna autumnalis
Black-bellied whistling-duck
Pichiche común Anatidae - LC - Appendix III - Medium
Anas clypeata (Spatula clypeata)
Northern shoveler
Pato pico de cuchara
Anatidae - LC Appendix II - - Medium
Ortalis vetula Plain chachalaca Chachalaca Cracidae - LC - Appendix III - Medium Ardea alba Great white egret Garzón blanco Ardeidae - LC Appendix II - - Medium Nycticorax nycticorax
Black-crowned night-heron
Garza nocturna corona negra
Ardeidae - LC Appendix II - - Medium
Sarcoramphus papa King vulture Rey zope Cathartidae - LC - Appendix III - Medium Pandion haliaetus Osprey Aguila pescadora Pandionidae - LC Appendix II Appendix II - Medium Chondrohierax uncinatus
Hook-billed kite Milano pico de gancho
Accipitridae - LC - Appendix II - Medium
Elanus leucurus White-tailed kite Milano de hombros negros
Accipitridae - LC - Appendix II - Medium
Ictinia mississippiensis
Mississippi kite Milano migratorio
Accipitridae - LC - Appendix II - Medium
Ictinia plumbea Plumbeous kite Milano plúmbeo Accipitridae - LC - Appendix II - Medium Buteogallus anthracinus
Common black hawk
Gavilán cangrejero
Accipitridae - LC - Appendix II - Medium
Buteo nitidus Grey-lined hawk Gavilán gris Accipitridae - LC - Appendix II - Medium Buteo magnirostris (Rupornis magnirostris)
Roadside hawk Gavilán de caminos
Accipitridae - LC - Appendix II - Medium
Buteo platypterus Broad-winged hawk
Gavilán ala ancha Accipitridae - LC - Appendix II - Medium
Buteo brachyurus Short-tailed hawk Gavilán chingo Accipitridae - LC - Appendix II - Medium

ENVIRONMENTAL RESOURCES MANAGEMENT PAA PROJECT FINANCE A/S
5-90
Scientific name Common name (English)
Common name (Spanish / Local)
Family Endemic IUCN CMS CITES Species of Special
Concern in Honduras
Sensitivity
Buteo albonotatus Zone-tailed hawk Gavilán tincute Accipitridae - LC - Appendix II - Medium Buteo albicaudatus (Geranoaetus albicaudatus)
White-tailed hawk
Gavilán cola blanca
Accipitridae - LC - Appendix II - Medium
Micrastur semitorquatus
Collared forest-falcon
Halcón montés Falconidae - LC - Appendix II - Medium
Caracara cheriway Crested caracara Pecho blanco cara cara
Falconidae - LC - Appendix II - Medium
Herpetotheres cachinnans
Laughing falcon Guaco Falconidae - LC - Appendix II - Medium
Falco sparverius American kestrel Lis-lis Falconidae - LC - Appendix II - Medium Falco columbarius Merlin Halcón palomero Falconidae - LC Appendix II Appendix II - Medium Falco rufigularis Bat falcon Halcón
murciélago Falconidae - LC - Appendix II - Medium
Falco peregrinus Peregrine falcon Halcón peregrino Falconidae - LC Appendix II - - Medium Burhinus bistriatus Double-striped
thick-knee Alcaraván Burhinidae - LC - Appendix III - Medium
Calidris minutilla Least sandpiper Playerito menudo Scolopacidae - LC Appendix II - - Medium Aratinga holochlora (Psittacara holochlorus)
Green parakeet Perico verde Psittacidae - LC - Appendix II - Medium
Aratinga nana (Eupsittula nana)
Jamaican parakeet
Perico azteco Psittacidae - NT - Appendix II - Medium
Pionus senilis White-crowned parrot
Lora cabeza blanca
Psittacidae - LC - Appendix II - Medium
Amazona albifrons White-fronted amazon
Lora frente blanca Psittacidae - LC - Appendix II - Medium

ENVIRONMENTAL RESOURCES MANAGEMENT PAA PROJECT FINANCE A/S
5-91
Scientific name Common name (English)
Common name (Spanish / Local)
Family Endemic IUCN CMS CITES Species of Special
Concern in Honduras
Sensitivity
Amazona autumnalis Red-lored amazon
Lora cariamarilla Psittacidae - LC Appendix II - Medium
Glaucidium brasilianum
Ferruginous pygmy-owl
Piza piedras Strigidae - LC - Appendix II - Medium
Anthracothorax prevostii
Green-breasted mango
Colibrí Pecho Verde
Trochilidae - LC - Appendix II - Medium
Chlorostilbon canivetii
Canivet's emerald Esmeralda de Canivet
Trochilidae - LC - Appendix II - Medium
Amazilia luciae Honduran emerald
Colibrí esmeralda hondureño
Trochilidae Yes EN - Appendix II - High
Amazilia tzacatl Rufous-tailed hummingbird
Colibrí cola rufa Trochilidae - LC - Appendix II - Medium
Archilochus colubris Ruby-throated hummingbird
Colibrí de garganta roja
Trochilidae - LC - Appendix II - Medium
Amazilia rutila Cinnamon hummingbird
Colibrí canelo Trochilidae - LC - Appendix II - Medium
Hylocichla mustelina Wood thrush Tordo de bosque zorzal
Turdidae - NT - - - Medium
Vermivora chrysoptera
Golden-winged warbler
Chipe ala dorada Parulidae - NT - - - Medium
Notes: Species of birds included Table 5.24 but not in Table 5.25 are considered of low level of sensitivity. Source: Documents RVSCEH – Edited by ERM, 2018

ENVIRONMENTAL RESOURCES MANAGEMENT PAA PROJECT FINANCE A/S
5-92
Mammals
According to the Honduran National Biodiversity Strategy (Miambiente, 2017), there are 221 species of mammal in Honduras, distributed between 36 different families. Table 5.26 shows the list of mammals in the Project Area, based on a desktop review of the available information together with the information gathered during the June 2018 field survey. For each species, Table 5.26 also includes a level of protection, conservation concern, and sensitivity (see Section 6.2.2 for further reference on sensitivity) based on: (1) international references such as the IUCN and CITES; (2) their level of endemicity; and (3) a list of species of flora and fauna of special concern in Honduras. Section 2.1.7 provides a description of the international and national references considered. Based on the information included in Table 5.26, the most significant findings on the mammals present in the Project Area are:
Up to 40 species of mammals are present in the Project Area. The most numerous family is Phyllostomidae, with 15 species. None of the species is endemic. They are all found in other countries in
America. Only one species is assessed as threatened by the IUCN: Spilogale
putorius (VU). The other species were assessed as Least Concern (LC). Five species are included in the Appendices of CITES: Puma
yagouaroundi (Herpailurus yagouaroundi) and Puma concolor (Appendices I and II); and Dasyprocta punctate, Odocoileus virginianus and Dasyprocta punctate (Appendix III). In addition, Tamandua Mexicana is included in Appendix III, but only for Guatemala, not Honduras; and the IUCN has suggested that Conepatus mesoleucus be included in Appendix II.
None of the species is classified as a Species of Special Concern in Honduras.
All the species of mammals are considered to be of low / medium sensitivity. Therefore, none are included in Annex 6, where additional information (habitat, ecology and distribution) on high sensitivity flora and fauna is included. They are likely to be common and widespread, and therefore less likely to be of concern in terms of conservation and protection.
To conclude, Figure 5.56 includes photographs of mammals taken during the June 2018 field survey. It should be noted that they were observed in a tourist centre, in fenced enclosures. Moreover, Cebus capucinus has not been identified in the fauna inventories conducted in the RVSCEH and is therefore not included in Table 5.26. However, since it is a widespread species in Honduras, it is very likely

ENVIRONMENTAL RESOURCES MANAGEMENT PAA PROJECT FINANCE A/S
5-93
that this species can be found in the mountains around the Aguan River Valley, near the Project Area.
Figure 5.56 Mammals observed in the Project Area
Source: ERM, 2018
Odocoileus virginianus Cebus capucinus

ENVIRONMENTAL RESOURCES MANAGEMENT PAA PROJECT FINANCE A/S
5-94
Table 5.26 List of mammals in the Project Area
Scientific name Common name (English)
Common name (Spanish / Local)
Family Endemic IUCN CITES Species of Special Concern in Honduras
Sensitivity
Dasypus novemcinctus Nine-banded armadillo
Cusuco / pitero Dasypodidae - LC - - Low
Sylvilagus floridanus Eastern cottontail Conejo Leporidae - LC - - Low Dasyprocta punctata Central American
agouti Guatuza Dasyproctidae - LC Appendix III - Medium
Canis latrans Coyote Coyote Canidae - LC - - Low Odocoileus virginianus White-tailed deer Venado cola
blanca Cerviade - LC Appendix III - Medium
Didelphis marsupialis Common opossum Comadreja grande Didelphidae - LC - - Low Didelphis virginiana Virginia opossum - Didelphidae - LC - - Low Philander opossum Grey four-eyed
opossum Comadreja de
cuatro ojos Didelphidae - LC - - Low
Tamandua mexicana Northern tamandua
Oso hormiguero Myrmecophagidae - LC Appendix III (Guatemala)
- Low
Noctilio leporinus Greater bulldog bat
- Noctilionidae - LC - - Low
Pteronotus parnellii Common moustached bat
- Mormoopidae - LC - - Low
Pteronotus personatus Wagner's moustached bat
Murciélago Bigotón de Wagner
Mormoopidae - LC - - Low
Pteronotus davyi Davy's naked-backed bat
- Mormoopidae - LC - - Low
Moormoops megalophylla
Ghost-faced bat - Mormoopidae - LC - - Low
Artibeus lituratus (Artibeus intermedius)
Great fruit-eating bat
- Phyllostomidae - LC - - Low

ENVIRONMENTAL RESOURCES MANAGEMENT PAA PROJECT FINANCE A/S
5-95
Scientific name Common name (English)
Common name (Spanish / Local)
Family Endemic IUCN CITES Species of Special Concern in Honduras
Sensitivity
Artibeus jamaicensis Jamaican fruit-eating bat
- Phyllostomidae - LC - - Low
Artibeus phaeotis Pygmy fruit-eating bat
- Phyllostomidae - LC - - Low
Artibeus watsoni (Dermanura Watsoni)
Thomas's fruit-eating bat
- Phyllostomidae - LC - - Low
Sturnira ludovici Highland yellow-shouldered bat
- Phyllostomidae - LC - - Low
Sturnira lilium Little yellow-shouldered bat
- Phyllostomidae - LC - - Low
Vampyressa pusilla Little yellow-eared bat
- Phyllostomidae - LC - - Low
Uroderma bilobatum Tent-making bat - Phyllostomidae - LC - - Low Phyllostomus discolor Pale spear-nosed
bat - Phyllostomidae - LC - - Low
Tonatia silvicola (Lophostoma silvicolum)
White-throated round-eared bat
- Phyllostomidae - LC - - Low
Carollia perspicillata Seba's short-tailed bat
- Phyllostomidae - LC - - Low
Carollia brevicauda Silky short-tailed bat
- Phyllostomidae - LC - - Low
Glossophaga soricina Pallas's long-tongued bat
- Phyllostomidae - LC - - Low
Glossophaga leachii Grey long-tongued bat
- Phyllostomidae - LC - - Low
Desmodus rotundus Vampire bat - Phyllostomidae - LC - - Low Myotis nigricans Black myotis - Vespertilionidae - LC - - Low

ENVIRONMENTAL RESOURCES MANAGEMENT PAA PROJECT FINANCE A/S
5-96
Scientific name Common name (English)
Common name (Spanish / Local)
Family Endemic IUCN CITES Species of Special Concern in Honduras
Sensitivity
Rhogeessa tumida Black-winged little yellow bat
- Vespertilionidae - LC - - Low
Urocyon cinereoargenteus
Grey fox Gato cervan Canidae - LC - - Low
Puma yagouaroundi (Herpailurus yagouaroundi)
Jaguarundi Jaguarundi / tigrillo
Felidae - LC Appendix I and II
- Medium
Puma concolor Puma León americano Felidae - LC Appendix I and II
- Medium
Conepatus mesoleucus American hog-nosed skunk
Zorrillo Mephitidae - LC Suggested by IUCN to be included in Appendix II
- Medium
Mephitis macroura Hooded skunk Zorrillo Mephitidae - LC - - Low Spilogale putorius Eastern spotted
skunk Zorrillo manchado Mephitidae - VU - - Low
Sciurus variegatoides Variegated squirrel
- Sciuridae - LC - - Low
Dasyprocta punctata Central American agouti
Agoutí rojizo Dasyproctidae - LC Appendix III - Low
Liomys salvini Raton semiespinoso
Dasyproctidae - LC - - Low
Source: Documents RVSCEH – Edited by ERM, 2018

ENVIRONMENTAL RESOURCES MANAGEMENT PAA PROJECT FINANCE A/S
5-97
Key findings - field survey (June 2018)
The field survey was aimed at gathering information on: (1) hunting and bushmeat activities; (2) presence of fauna; and (3) observation of fauna. Annex 4 (Field Survey Map- Biological Baseline) shows the locations where specific information on fauna was gathered. Table 5.27 summarizes the feedback on hunting and bushmeat received during the field survey. Hunting and bushmeat are associated with low economic resources. Although it is reportedly only occasional, bushmeat hunting still occurs, and includes protected species such as the black-chested spiny-tailed iguana (Ctenosaura melanosterna).
Table 5.27 Hunting and bushmeat in the Project Area
Source Feedback
Meeting with group of farmers (small property profile)
No hunting of wildlife is reported.
Visit to farm 71 (medium property profile)
Hunting and bushmeat is associated with people with low levels of economic resources. Wildlife hunted includes rabbits and armadillo. Hunting of Ctenosaura melanosterna is very limited because it is a protected species. However, bushmeat hunting is residual only, the main sources of meat being farmed species, such as cows, pigs and chickens.
Visit to farm 108 (small property profile)
Hunting and bushmeat is associated with people with low levels of economic resources. Wildlife hunted includes the protected species Ctenosaura melanosterna. However, bushmeat hunting is residual only, the main sources of meat being farmed species, such as cows, pigs and chickens.
Visit to farm 128 (small property profile)
Hunting and bushmeat occur occasionally. Wildlife species hunted include the Ctenosaura melanosterna and birds such as the “chachalaca” (Ortalis spp.). However, bushmeat hunting is residual only, the main sources of meat being farmed species, such as cows, pigs and chickens.
Source: Field survey, 2018
Table 5.28 summarizes the feedback received on the presence of fauna, during the field survey, in particular protected species. The black-chested spiny-tailed iguana (Ctenosaura melanosterna) and the Honduran Emerald Hummingbird (Amazilia luciae) have been described both within the protected area (RVSCEH – see Section 5.4.4) and beyond. Although Amazilia luciae can be observed in various habitats, especially when searching for food, Ctenosaura melanosterna is a more specialized species which is mostly found within the very dry tropical forest.

ENVIRONMENTAL RESOURCES MANAGEMENT PAA PROJECT FINANCE A/S
5-98
Table 5.28 Presence of fauna in the Project Area
Source Feedback
Meeting with the Arenal municipality
Both Ctenosaura melanosterna and Amazilia luciae are reported to also occur outside the protected area (RVSCEH – see Section 5.4.4).
Meeting with SAGO
Both Ctenosaura melanosterna and Amazilia luciae are reported to also occur outside the RVSCEH. This is a consequence of the declaration of the protected area, which has enabled these species to consolidate their populations inside the protected areas, and enabling some individuals to spread to other areas with appropriate habitats.
Meeting with group of farmers (small property profile)
Ctenosaura melanosterna farms are thought to be a good idea to provide an additional source of food for the people used to eating this species of iguana.
Amazilia luciae is reported to be more frequent within the RVSCEH.
Visit to farm 30 (small property profile)
Ctenosaura melanosterna is not very frequent due to being hunted (bushmeat).
Amazilia luciae: the farmer explains that he keeps 17.5 ha of his property with natural habitat, with no agricultural or livestock activity on it, in order to contribute to the conservation of Amazilia luciae. Since this area is not part of the RVSCEH, he does not receive financial benefit for this. He is, however, keen to do it because of his personal interest in the conservation of the species and its habitats.
Visit to farm 71 (medium property profile)
Ctenosaura melanosterna: regular presence. Amazilia luciae: occasional presence. Both the protected species, although more frequent in the
RVSCEH, also occur in non-protected areas. A group of mantled howlers (Alouatta palliata) used to live
on the farm many years ago (20-30 years ago, approximately). The grandparents of the farmer tried to feed them, but unsuccessfully, since these monkeys are very wary of human beings.
Visit to farm 108 (small property profile)
Ctenosaura melanosterna: regular presence. Individuals in the area are described to have a whitish colour.
Amazilia luciae: regular presence.
Visit to farm 128 (small property profile)
Ctenosaura melanosterna: regular presence. Amazilia luciae: absent.
Visit to farm 165 (big property profile)
A caiman (Caiman crocodilus) was observed once on the farm, in a surface water body near the river.
Ctenosaura melanosterna: occasional presence. Amazilia luciae: regular presence.
Source: Field survey (2018)
Figure 5.51 to Figure 5.56 above include a selection of photographs of fauna taken during the field survey conducted in the Project Area (June 2018).

ENVIRONMENTAL RESOURCES MANAGEMENT PAA PROJECT FINANCE A/S
5-99
5.4.4 Protected areas
Overview
Protected areas in Honduras are managed by the ICF (Institute of Conservation of Forestry, Protected Areas and Wildlife – Instituto de Conservación Forestal, Áreas Protegidas y Vida Silvestre). All the protected areas in Honduras are part of the SINAPH (National System of Protected Areas – Sistema Nacional de Areas Protegidas), whose main objective is to conserve the biodiversity of the country and the ecosystem services this provides to Honduran society. The ICF has developed a co-management system involving various stakeholders, such as public sector bodies, municipalities, universities, and NGOs. This co-management system enables effective management of the protected areas. There is one protected area within the Project Area: Honduran Emerald Hummingbird Wildlife Refuge (RVSCEH – Refugio de Vida Silvestre Colibrí Esmeralda Hondureño). Figure 5.57 shows the location of this protected area, within the limits of the Project Area.
Figure 5.57 Map of the Protected Area in the Project Area: Honduran Emerald Hummingbird Wildlife Refuge (RVSCEH – Refugio de Vida Silvestre Colibrí Esmeralda Hondureño)
Source: Integra Ingeniería, 2017 – Edited by ERM, 2018
ENVIRONMENTAL RESOURCES MANAGEMENT PAA PROJECT FINANCE A/S
5-100
Honduran Emerald Hummingbird Wildlife Refuge (RVSCEH - Refugio de Vida Silvestre Colibrí Esmeralda Hondureño)
The RVSCEH is located in the western section of the Aguan Valley, between the municipalities of Olanchito and Arenal in the Department of Yoro. The limits of the RVSCEH limits are:
North: Pico Bonito National Park. East: municipality of Olanchito. West: villages of San Lorenzo Abajo and San Lorenzo Arriba. South: municipality of Arenal.
The RVSCEH was declared a protected area by Legislative Decree 159-2005 and it is part of the SINAPH. The original protected surface are as per the Legislative Decree 159-2005 was 1,217.46 ha, mostly owned by the government (1,157.4 ha), with 60.07 ha being private property. However, in 2011, Legislative Decree 159-2005 was modified and new areas were also declared protected (another 835 ha). This modification meant the total surface area of the RVSCEH increased to 1,992.7 ha. The RVSCEH comprises 27 separated zones, all with different levels of conservation and surface areas, ranging from small (2 ha) to the large zone historically managed by the Air Forces of Honduras (1,200 ha). Twentysix of the 27 areas are private property. Private properties are preserved by Environmental Services Payments (PSA - Pagos por Servicios Ambientales) agreed with the landowners. These private zones represent about 600 ha of the total surface area of the RVSCEH. In the case of the RVSCEH, the co-management system developed by the ICF for the protected areas in Honduras involves the following organisations:
ICF. Ministry of Defence. The Olanchito and Arenal municipalities. IHT (Honduran Tourism Institute – Instituto Hondureño de Turismo). Secretary of Public Works and Transport. National Autonomous University of Honduras. Ministry of Education and Secretary of Natural Resources and the
Environment. ASIDE (Research Association for Ecological and Socioeconomic
Development - Asociación de Investigación para el Desarrollo Ecológico y Socioeconómico).
The main ecological features in the RVSCEH are as follows (Asesora, 2009):
Fauna: Honduran emerald hummingbird (Amazilia luciae), and Black-chested spiny-tailed iguana (Ctenosaura melanosterna), both endemic to Honduras.

ENVIRONMENTAL RESOURCES MANAGEMENT PAA PROJECT FINANCE A/S
5-101
Flora: there are 10 endemic species occurring only in the RVSCEH or nearby. This concentration of endemic species is the highest in Honduras. These species are Bakeridesia molinae, Caesalpinia yucatanensis (subsp. hondurensis), Capparicordis yunckeri, Dioon mejiae, Eugenia lempana, Eugenia coyolensis, Leucaena lempirana, Lonchocarpus trifolius, Opuntia hondurensis and Zamia standleyi.
Habitats: very dry tropical forest, dry tropical forest, and humid subtropical forest. Most of the RVSCEH is within very dry tropical forest and dry tropical forest zones, representing one of the very few areas of this habitat in the tropics. In Central America, there are only two areas with this habitat: the Motagua Valley, in Guatemala; and the Aguan Valley, in Honduras, where the RVSCEH is located. Further descriptions of the two types of habitats are included in Section 5.4.1.
Although the RVSCEH documents consulted during the desktop review do not refer to the IUCN categories for protected areas, the RVSCEH could be considered a type IV protected area (Habitat/Species Management Area). This is defined by the IUCN as follows: protected area that usually helps protect, or restore: 1) a flora species of international, national, or local importance; 2) a fauna species of international, national, or local importance including resident or migratory fauna; and/or 3) habitats. The size of the area varies but can often be relatively small; this is however not a distinguishing feature. Management will differ depending on need. Protection may be sufficient to maintain particular habitats and/or species. However, as category IV protected areas often include fragments of an ecosystem, these areas may not be self-sustaining and will require regular and active management interventions to ensure the survival of specific habitats and/or to meet the requirements of particular species. In addition to this, it should be noted that the RVSCEH is not included in the UNESCO World Heritage List. Key findings - field survey (June 2018)
The field survey included a meeting in the RVSCEH with some of the members responsible for managing the protected area (ASIDE and ICF). The meeting was aimed at gathering information on: (1) the management of the protected area; (2) conservation concerns; (3) expectations of the implementation of the irrigation project; (4) additional inventories of fauna and flora in the protected area; and (5) observation of flora and fauna in the protected area. The information provided by ASIDE and ICF during the meeting held in the RVSCEH on the management of the protected area is summarized in Box 5.2.

ENVIRONMENTAL RESOURCES MANAGEMENT PAA PROJECT FINANCE A/S
5-102
Box 5.2 Management of the RVSCEH
Source: Field survey, 2018 – meeting with ASIDE and ICF
Information provided on conservation concerns for the protected area and its biodiversity, by ASIDE and ICF during the meeting held in the RVSCEH, is summarized in Box 5.3.
A technical committee manages the protected area. It comprises: the Air Force, ICF, ICEP, Autonomous University of Honduras, Olanchito and Arenal municipalities, ASIDE, MiAmbiente, and IHT.
ASIDE is a NGO co-managing the protected area with a 5 years contract. MiAmbiente is not participating in the co-management because their closest
office is in La Ceiba. IHT (Honduran Institute of Turism - Instituto Hondureño de Turismo): is not
participating in the co-management because their office is in Tegucigalpa. Management of the protected areas is economically supported by an escrow
set up in 2011 with $1 million. In 2018, the escrow had generated 15 million lempiras in interest, which has been used to develop the environmental baseline of the protected area and pay the farmers with lands within the protected area for the environmental services of their land as part of the protected area.
The first management plan for the protected area was produced in 2009. In 2011, an addendum was produced.
An update of the management plan is being written (draft prepared in March 2018 is under review by the Department of Protected Areas).
The management plan prepared in 2009 included the concept of buffer zones (zonas de amortiguamiento). However, buffer zones could not be implemented due to lack of engagement (insufficient economic benefit) of the farmers whose lands would have been within these buffer zones.
The updated management plan (under review) will clarify that there are no buffer zones in the protected area.
The Honduran Air Force provides security for the protected area. In 1988, the area where part of the protected area is located was assigned to the Air Force. Because of this, when the area was designated a protected area (2005), the Air Force was assigned to provide security. They patrol the protected area 3-4 times a day, by foot or in a vehicle, and at various times (morning, afternoon, evening and night). They report that illegal activities occasionally occur in the protected area, such as hunting (for bushmeat - black-chested spiny-tailed and deers; and for selling - parrots).
Other partners helping in the management of the protected area: ABC (American Birds Conservation – collaborated in the past, but not anymore), TNC (The Natural Conservancy), World Bank, the Spanish Government.
Decree 32/2014 did not include the geographical system considered in the limits of the protected area. PAT (Lands Management Program - Programa de Administración de Tierras) reviewed the protected area limits and systematically adopted the geographical system WGS84.

ENVIRONMENTAL RESOURCES MANAGEMENT PAA PROJECT FINANCE A/S
5-103
Box 5.3 Conservation concerns in the RVSCEH
Source: Field survey, 2018 – meeting with ASIDE and ICF
Regarding the expectations towards the implementation of the irrigation project, information provided by ASIDE and ICF during the meeting held in the RVSCEH is summarized in Box 5.4.
Landowners in the RVSCEH and the Project Area already respect the wildlife. Awareness activities should be focused on farm workers and the populations of nearby communities.
No changes in land use has been observed within the protected area. Four monitoring events are conducted per year to identify any incompliance regarding hunting, fires, vegetation chopping, and livestock. Economic penalties are not applied in case of incompliance, taking into account the reduced economical benefit given to landowners with land within the protected area, for the economical services provided. The landowner is present during the monitoring, so that he can explain and be advised about any incompliance observed, in order to avoid the incompliance happening again. This positive approach is considered to be more successful than a negative approach involving economic penalties.
The economic benefit received by landowners with lands within the protected area is very small, more symbolic than a real environmental service payment. Because of this, the main reasons why landowners keep part of their lands within the protected area (and therefore, unexploited) are: (1) they have more land outside the protected area, which they exploit; and (2) personal opinions on the importance of keeping protected areas for the conservation of natural habitats and biodiversity.
Both the black-chested spiny-tailed iguana (Ctenosaura melanosterna) and the Honduran Emerald hummingbird (Amazilia luciae) occur outside the limits of the protected area. Ctenosaura melanosterna is mostly limited to other areas where the very dry tropical forest has been preserved. Amazilia luciae can be observed in other habitats, especially when searching for food. Both species are endemic in Honduras.
The main conservation concern for Amazilia luciae is the loss of suitable habitat (very dry tropical forest), because of the increase in areas dedicated to forage crops and pasture for livestock.
The main conservation concern for Ctenosaura melanosterna is the loss of suitable habitat (very dry tropical forest), as in the case of Amazilia luciae, because of the increase in areas dedicated to forage crops and pasture for livestock. Another conservation concern for Ctenosaura melanosterna is hunting (bushmeat).
Changes in land use can therefore affect these two species, due to the loss of suitable habitat. This has actually occurred due to the historical transformation of natural habitats (including the very dry tropical forest) into areas dedicated to agricultural fields and pastures.

ENVIRONMENTAL RESOURCES MANAGEMENT PAA PROJECT FINANCE A/S
5-104
Box 5.4 Expectations of the irrigation project
Source: Field survey, 2018 – meeting with ASIDE and ICF
Regarding the existence of additional inventories of flora and fauna in the protected area, information provided by ASIDE and ICF during the meeting held in the RVSCEH is summarized in Box 5.5.
According to ASIDE / ICF, diversification is important in the conservation of the protected areas. Diversification due to two main elements: development of agriculture, rather than economic activity limited to livestock; and processing activites linked to meat and milk.
ASIDE / ICF should be involved in coordinating the irrigation project, in implementing the mitigation measures related to the biodiversity and the protected area. For example, ASIDE / ICF could provide environmental training on biodiversity conservation. This has been implemented in other areas, such as Trujillo, where the CREA (Environmental Training Regional Center - Centro Regional de Educación Ambiental) provided training on environmental management in African palm plantations. Thanks to the training, the farmers are now more aware of the importance of the wildlife on their land, and this helps in the consolidation of biodiversity corridors.
ASIDE / ICF suggested that landowners with land within the limits of the protected area should benefited from the irrigation project too, so that they can implement the irrigation project in the land they own outside the protected area. Although the project designation criteria are not yet defined, a deduction in the irrigation project fee for these people might be fair compensation for their contribution in terms of environmental services.
According to ASIDE / ICF, if farmers are capable of improving the productivity of their lands (e.g., through implementation of an irrigation project, such as the Alto Aguan Irrigation Project), they will not need to increase the areas dedicated to agricultural fields and pastures. In this way, the risk of losing additional areas of natural habitats to be transformed in agricultural fields and pastures is reduced. This would be very beneficial for the conservation of the very dry tropical forest, and subsequently for the key species within this habitat, such as the Honduran emerald hummingbird (Amazilia luciae) and the black-chested spiny-tailed iguana (Ctenosaura melanosterna).
ASIDE / ICF wondered about additional crops that could be developed in the Project Area through the irrigation project. According to the SAG personnel from Olanchito attending the meeting, the main species to be considered are corn (a variety suitable to dry areas or areas with drought periods) and forage plants. Both would enable storage in silos, so that food is available for the cattle during the dry season. This technical development would also avoid the farmers buying concentrated food (expensive) and implementing bad management practices (e.g., feeding the cattle with oranges during the dry season, resulting in acidic milk).
The Technical Committee has approved a proposal for an escrow interest for productive projects, very much aligned with the irrigation project: promoting productive projects compatible with biodiversity conservation.

ENVIRONMENTAL RESOURCES MANAGEMENT PAA PROJECT FINANCE A/S
5-105
Box 5.5 Additional inventories of flora and fauna in the RVSCEH (post-2012)
Source: Field survey, 2018 – meeting with ASIDE and ICF
The flora and fauna observations in the RVSCEH made during the field survey are included in Section 5.4.2 and Section 5.4.3, including photographs of flora and fauna taken in the RVSCEH. Figure 5.58 shows some additional photographs taken during the meeting with ASIDE and ICF in the RVSCEH.
Figure 5.58 Visit to the RVSCEH
Notes: top left (ASIDE personnel explaining biodiversity in the RVSCEH); top right (offices in the RVSCEH where the meeting was conducted), bottom left (meeting in the RVSCEH); and bottom right (former landing strip in the RVSCEH used by the Air Force) Source: ERM, 2018
Insect monitoring was conducted in 2018. It is still pending publication. Preliminary data refers to more than 400 species of insects in the Project Area. Some key findings are: (1) up to 24 species of lepidoptera never previously found in Honduras; and (2) a potential new species of lepidoptera (currently under taxonomic review).
Monitoring of Honduran Emerald hummingbird (Amazilia luciae) in the RVSCEH confirms the populations are stable. The monitoring was conducted by ASIDE / ICF and Rosalina Martínez, from CURLA University (Atlantic Coast Regional University Center - Centro Universitario Regional del Litoral Atlántico). The results of the monitoring have not yet been published.
Overall, there is a high degree of endemism in the RVSCEH. Addendum to the Flora Management Plan is pending approval.

ENVIRONMENTAL RESOURCES MANAGEMENT PAA PROJECT FINANCE A/S
5-106
5.4.5 Critical Habitats
This is described and developed in detail in Annex 9 of this report, Critical Habitat Assessment. In terms of baseline the objective of the assessment is to determine which areas within the Project footprint constitute natural habitat, which areas constitute modified habitats, and which habitats (natural or modified) and species found within the ecological landscape in and around the Project footprint may be regarderd as critical habitat (CH) triggers by the provisions of IFC Performance Standard 6. The main conclusions of the Critical Habitat Assessment in this regard are that the Aguan River Valley is a mosaic of natural and modified habitats, and available evidence discards for the latter the possibility of being classified as Critical. For the natural habitats within the area, some of them could be classified as Critical Habitats The nature of these CH will be restricted to very dry and dry forests, as recognized by local and international institutions. The majority of those CHs in the Project total footprint (the area encompassing the envelope of all potential beneficiaries plots) are within the current protected area, but as stated in the previous Section 5.4.4 of this ESIA, the size and footprint of the protected area is a mix of biological features (areas where the very dry forest patches are better preserved) and socio-economic (areas where landowners have volunteered to relinquish land use change. In any case, as stated above, the modified habitats, including the socioeconomic features, located in the Project total footprint cannot be classified as CH. The irrigation equipment will be located on agricultural land as opposed to natural or Critical Habitats and will therefore no affected any critical habitat located within the protected area.

ENVIRONMENTAL RESOURCES MANAGEMENT PAA PROJECT FINANCE A/S
5-107
5.5 SOCIOECONOMIC ENVIRONMENT
5.5.1 Social Study Area
The Social Study Area largely corresponds to the Project Area covering an area of 60,000 ha where most potential socioeconomic impacts are expected. The Project Area is composed mostly of the municipality of Olanchito (88.9%) with a smaller area in El Arenal (10.3%) and an even smaller portion touching upon the municipalities of Jocon to the West (0.4%) and Sabá (0.4%) to the East. The baseline description of the Study Area will therefore focus on the municipalities of Olanchito and El Arenal, and to the extent possible, on the communities of these two municipalities that are located inside the Project Area. The communities included in the Project Area are shown in Figure 5.59 in the following section.
5.5.2 Administrative structure
Administrative divisions
The territory of Honduras extends over 112,492 km2 and is organised into 18 departments. The department of Yoro, where the Project Area is located covers an area of 7,781 km2 and is divided into 11 municipalities. Each municipality is further divided into hamlets (Aldeas) and settlements (Caseríos). 1 The Project Area is divided into a total of 61 hamlets (Aldeas) and 147 settlements (Caseríos), of which 54 hamlets and 132 settlements belong to the municipality of Olanchito, and five (5) hamlets and 12 settlements to Arenal. The remaining hamlets and settlements belong to the municipalities of Sabá and Jocón. The administrative divisions and hamlets in the Project Area are shown in Figure 5.59 below. A list of the hamlets (aldeas) and settlements (caseríos) found in the Project Area is provided in Annex 7.
1 Aldeas are settlements with over 100 inhabitants while caseríos are smaller settlements with less than 100 inhabitants.

ENVIRONMENTAL RESOURCES MANAGEMENT PAA PROJECT FINANCE A/S
5-108
Figure 5.59 Administrative divisions in the Project Area
Source: ERM, 2018
ENVIRONMENTAL RESOURCES MANAGEMENT PAA PROJECT FINANCE A/S
5-109
Olanchito covers an area of approximately 2,000 km2 (200,000 ha) and is located in the Aguán Valley. It borders Nombre de Dios mountain range to the North and the Sierra de la Esperanza mountain range to the South. The municipality of Olanchito is divided into 81 hamlets or “aldeas” and 392 smaller settlements or “caseríos”.1 The urban centre of Olanchito town is composed of eight (8) neighbourhoods (barrios) and 48 smaller neighbourhoods (colonias). The rural area also includes eight (8) banana plantations (Rosario A, Rosario B, Palo Verde Finca, Trojas A, Trojas B, Nerones, Limones 4, and Limones 6).2 The municipality of El Arenal covers an area of approximately 180 km2 (18,000 ha) and borders with the municipality of Olanchito to the North and East, Mangulile (Olancho department) to the South, and with Jacón to the West. Arenal municipality is primarily rural and is divided into seven (7) hamlets (aldeas), eight (8) settlements (caseríos), seven (7) neighbourhoods (barrios), and three (3) colonies (colonias).3 Local governance
According to the Law of Municipalities (Ley de Municipalidades), municipalities are autonomous entities governed by a municipal corporation (corporación municipal) and administered by the municipal administration (administración municipal). The municipal corporation is the highest authority at the municipality level. It is headed by a Mayor (alcalde), a vice mayor (vice alcalde) and four (4) to 10 councillors or aldermen (regidores) depending on the size of the municipality elected directly by the people.4 The municipal administration is the administrative body composed of the specific departments. In rural areas, both aldeas and caseríos are governed by an assistant mayor (Alcalde Auxiliar) selected in a communal assembly and appointed by the municipal corporation. The municipal administration is organized into specialized units including an Environment Unit (Unidad de Medioambiente or UMA). The municipal environment units are responsible for planning, promoting, implementing, coordinating and supervising all activities related to the environment in the municipality. This includes coordination with the relevant National Secretaries (i.e. Environment, Arts and Culture, National Tourism Institute, and the Anthropology and History Institute). The UMA is also responsible for conducting environmental inspections and for ensuring compliance with
1 Olanchito Strategic Municipal Development Plan for 2004-2020 (2004) and Colibri Esmeralda Habitat Management Plan (ICF and the Nature Conservancy, 2009).
2 Olanchito Strategic Municipal Development Plan for 2004-2020 (2004) and Colibri Esmeralda Habitat Management Plan (ICF and the Nature Conservancy, 2009).
3 Arenal Municipality Website: https://portalunico.iaip.gob.hn/portal/index.php?portal=318 . Accessed August 2018 and Strategic Development Plan for the Municipality of Arenal (2013).
4 Law of Municipalities (Ley de Municipalidades), Articles 25 and 26.

ENVIRONMENTAL RESOURCES MANAGEMENT PAA PROJECT FINANCE A/S
5-110
environmental norms of exploitation and commercialization of natural resources, related contracts and operations.1 Water boards operate the drinking water systems at the local level and are composed of members selected among an assembly of water users for a period of one to two years. Membership and services provided by the boards are voluntary and to the community’s benefit. The boards are therefore self-organized by local residents with supervision and support from the Municipal Corporation. Water boards are explained in more detail in Section 5.5.12. The municipal administration’s Governance and Transparency Department (previously referred to as Community Development Department) is responsible among other things to provide capacity building and assistance to the Water Boards in collaboration with the Honduran Association of Water Administration Boards (Asociación Hondureña de Juntas Administradoras de Agua or AHJASA).2 Olanchito’s Farmers and Livestock Breeders Society (Sociedad de Agricultores y Ganaderos de Olanchito or SAGO) and local Milk Collection Centres (Centros de Recolección de Leche or CRELES) also play a role in local administration and governance of the agriculture and milk production sectors, which represent the most important economic sectors of the area. The roles of the SAGO and CRELES are described in more detail in Section 5.5.8.
5.5.3 Overview of potential project beneficiaries
The beneficiaries of the Aguan Irrigation Project will be chosen among all the livestock breeders and milk producers present in the area. Currently, there are approximately 350 milk producers and farmers members of the SAGO; most of whom are also members of the 16 CRELES present in the Project Area.3 All milk producers and farmers of Olanchito and El Arenal will be able to apply to become beneficiaries provided they meet the criteria set by the SAG and PAA Project as described in the Project Description Chapter (Chapter 3).4 All applications will be reviewed and the decision-making on the selection of the final beneficiaries will be based on strict selection criteria. Considering that 75% of the 301 milk producers and farmers surveyed by CINSA and PAA Project Finance in November 2017 as part of their preliminary assessment met the pre-established criteria (see Section 3.4.1), it is envisaged that the project could benefit between 260-300 milk producers in the area. CINSA & PAA preliminary findings also show that these producers cultivate 70% of the cultivated and pasture land in the Project Area, over 16,000 ha of land. This finding is aligned with the land use distribution in the Project Area explained
1 Environmental Unit Primary Functions (Unidad Municipal del Ambiente (UMA) Atribuciones Principales). Official Arenal Municipality Website: https://portalunico.iaip.gob.hn/portal/ver_documento.php?uid=MTMwOTI0ODkzNDc2MzQ4NzEyNDYxOTg3MjM0Mg==
2 Olanchito Municipality Institutional and Financial Diagnostic (2005).
3 It was reported during the June 2018 field survey that two new CRELES are being established which indicates that the number of milk producers in the Project Area could be close to 400.
4 Land plots eligible for the Project should meet the following criteria: (a) Belong to the beneficiary (landowner); (b) Not to be located in protected areas; (c) Land plot not to be installed within natural habitats such as shrubland or forest; (d) Have water availability, either surface or underground water; ( e) Have a flat land; (d) Not to be located in indigenous land.

ENVIRONMENTAL RESOURCES MANAGEMENT PAA PROJECT FINANCE A/S
5-111
in Section 5.5.7.These will be able to apply for a number of irrigation sets depending on land availability and resources, and will be required to meet a set of responsibilities with regards to the Project (Chapter 3). As stated above, during the preliminary survey conducted by CINSA & PAA Project Finance in 2017, a sample of 301 out of approximately 350 SAGO livestock breeders, milk producers and farmers were visited and interviewed, which represents 86% of the current estimated population of livestock breeders,milk producers and farmers. The preliminary survey included 47 women, and 52 independent producers who do not belong to any CREL (of which 8 women). As such, the information collected through this process is considered representative of the total livestock,milk producer and farmer population in the area. Most producers are located in the municipality of Olanchito (91%) and a few are located in the municipalities of El Arenal (8%) and Jocon (1%). The distribution of the 301 producers and farmers per CREL and Municipality is presented in Table 5.29 below.
Table 5.29 Distribution of farmers and milk producers per CREL and municipality in the Project Area
# CREL Members in Olanchito Members in El Arenal Members in Jocon 1 Andino Munguía 18 2 Armín Jerónimo
Figueroa 13
3 Bustillo Martínez 30 4 Cárcamo Martínez 23 5 CRELCA 11 6 Cruz Nuñez 19 7 Fabricio Puerto 19 8 Heberto Chirinos
Ponce 20
9 Leopoldo Duran Dueñas
9
10 Martinez Hernández
1
11 Martínez Lobo 2 23 12 Mejía Rodríguez 15 13 Puerto Lozano 14 14 Salinas Gonzales 15 15 Salvador Figueroa 3 16 Superación 11 3 Total CREL
Members 223 23 3
Independent Producers
51 1
Total Farmers and Milk Producers
274 24 3
TOTAL 301 Note: The number of potential beneficiaries may increase considering that new CRELs are being created and the distribution may change. Source: Field survey 2017
Basic information was collected during the initial field survey (2017) in order to obtain a preliminary understanding of the socioeconomic characteristics of

ENVIRONMENTAL RESOURCES MANAGEMENT PAA PROJECT FINANCE A/S
5-112
the potential beneficiaries (including CREL membership, community and municipality where they are located, ownership title, farm size, land available for irrigation, type of water source available for irrigation, type of production and crops, average monthly income, etc.). Preliminary findings show that 70% of potential beneficiaries do not have access to a source of surface water for irrigation and would therefore require underground wells. Note that these preliminary visits were not conducted as part of any formal beneficiary selection process. The final list of beneficiaries will be confirmed only after potential beneficiaries have presented their applications and after closure of the application process which will be managed by the SAG-PIU. This preliminary information was subsequently complemented with more detailed data collected during the June 2018 field survey through interviews with the SAGO, CRELES and a sample of 13 producers (of which eight (8) are new potential beneficiaries that were not surveyed in 2017). The information collected serves as a basis for the socioeconomic baseline description presented in this Chapter. The following subsections present the socioeconomic characteristics of the general population in the Project Area with a focus on livestock breeders,milk producers and farmer populations and economic sector.
5.5.4 Demographics
Population
Based on the latest population census conducted in 2013, the total population of Honduras as of 2013 is of 8,303,771 with an annual growth rate of 1.99%, which represents a 37% increase from 6,076,885 in 2001. A large portion of the population still resides in rural areas although the urban population has been increasing steadily over the years showing a tendency towards urbanization with 53.4% of the population residing in urban areas in 2013 compared to 46% in 2001.1 The urbanization rate is expected to continue to increase with an estimated annual rate of change at 2.75% between 2015 and 2020, leading to an estimated 57.1% of urbanized population in 2018.2 The population in Honduras is fairly young with over 40% under 19 years of age, and only a minority (less than 10%) above 60. Gender distribution is balanced with approximately 48% male and 52% female.3 As of 2013, the population in the Department of Yoro is of 570,595. In line with gender distribution and urbanization levels at the national level, the population of Yoro is 49% male and 51% female, with 52% residing in urban areas versus 48% in rural areas.4 At the municipality level, the population numbers in Olanchito and El Arenal municipalities amounted to 104,609 and
1 INE, Population Census 2013 and 2001.
2 CIA, World Factbook. Web: https://www.cia.gov/library/publications/the-world-factbook/geos/ho.html. Accessed 08 Aug. 2018.
3 INE, National Households and Housing Survey, 2013.
4 INE population census 2013.

ENVIRONMENTAL RESOURCES MANAGEMENT PAA PROJECT FINANCE A/S
5-113
5,949 in 2013, representing around 18% and 1% of the population of Yoro respectively. Since 2001, the population of Olanchito and Arenal have increased by 25% and 17% respectively, and both municipalities are experiencing an urbanization trend with an increasing number of people living in urban areas. The population of Arenal remains primarily rural, with around 64% residing in rural areas and 36% in urban areas, versus 49% rural and 51% urban for Olanchito. The population density as of 2013 in Olanchito is of 52 inhab/km2 and 34 inhab/km2 for Arenal. More recent estimates for 2015 calculate the population density for Olanchito and Arenal at 51 inhab/km2 and 30 inhab/km2 respectively, which is considerably lower than the country average of about 75 inhab/km2.1 Within the Project Area, according to the 2013 population census, the total population is of 89,166 inhabitants, with 84,894 included in the municipality of Olanchito and 4,272 in the municipality of Arenal. This represents 86% of the population of Olanchito, and 76% of the population of Arenal in 2013. For Olanchito and Arenal combined, the Project Area therefore represents 86% of the total population of both municipalities as of 2013. The information collected for Olanchito and Arenal municipalities as a whole is therefore considered representative of the situation in the Project Area. The population density in the Project Area at the hamlet (aldea) level is presented in Figure 5.60.
Figure 5.60 Population distribution per hamlet in the Project Area (2013)
Source: INE Population Census 2013 modified by ERM (2018).
1 ICF, Olanchito Atlas Forestal Municipal, 2015. Accessed at: http://icf.gob.hn/wp-content/uploads/2015/09/1807-Olanchito-Atlas-Forestal-Municipal.pdf

ENVIRONMENTAL RESOURCES MANAGEMENT PAA PROJECT FINANCE A/S
5-114
Age and gender distribution
In line with demographic trends at the national and regional levels, the population in the municipalities of Olanchito and Arenal is quite young, with approximately 49% below 19 and less than 10% is aged 60 and over. About 53% of the population is of working age (age group 15 to 54). The age and gender distribution in Olanchito and Arenal is summarized in Table 5.30, while Figure 5.61 and Figure 5.62 present the gender pyramids for the two municipalities.
Table 5.30 Age and gender distribution in Olanchito and Arenal municipalities
Olanchito Arenal Age group Male Female Male Female 0-9 11974 11385 668 624 10-19 12411 12046 735 716 20-29 7712 8884 446 427 30-39 4994 6170 304 358 40-49 3950 4574 243 247 50-59 3041 3318 189 194 60+ 3835 4178 223 258 Total 47917 50555 2808 2824
Source: INE population census, 2013.
Figure 5.61 Gender distribution in Olanchito (2013)
Source: Prepared by ERM, 2018 based on INE population census, 2013.
‐15% ‐10% ‐5% 0% 5% 10% 15%
00 ‐ 04
10 ‐ 14
20 ‐ 24
30 ‐ 34
40 ‐ 44
50 ‐ 54
60 ‐ 64
70 ‐ 74
80 ‐ 84
90 ‐ 94
100+

ENVIRONMENTAL RESOURCES MANAGEMENT PAA PROJECT FINANCE A/S
5-115
Figure 5.62 Gender distribution in El Arenal (2013)
Source: Prepared by ERM, 2018 based on INE population census, 2013.
The specific age and gender distribution per hamlet (aldeas) included in the Project Area is summarized in Table 5.31 below based on the population census of 2013.
‐15% ‐10% ‐5% 0% 5% 10% 15%
00 ‐ 04
10 ‐ 14
20 ‐ 24
30 ‐ 34
40 ‐ 44
50 ‐ 54
60 ‐ 64
70 ‐ 74
80 ‐ 84
90 ‐ 94
Female Male

ENVIRONMENTAL RESOURCES MANAGEMENT PAA PROJECT FINANCE A/S
5-116
Table 5.31 Population distribution in the Project Area per municipality (2013 official census)
Hamlet (Aldea) Total Population Male Female Age 0-9
Age 9-19
Age 20-29
Age 30-39
Age 40-49
Age 50-59
Age 60+
Agalteca 1,233 50% 50% 24% 25% 19% 10% 9% 7% 7% Armenia 2,133 49% 51% 25% 26% 18% 11% 7% 5% 7% Bálsamo Oriental 1,833 49% 51% 24% 27% 17% 10% 8% 5% 8% Barranco 411 45% 55% 25% 30% 16% 13% 7% 3% 6% Boca de Mame 309 51% 49% 22% 27% 16% 13% 7% 7% 8% Calpules 656 53% 47% 24% 22% 18% 9% 10% 7% 9% Campo Agua Buena 56 52% 48% 27% 29% 20% 14% 9% 0% 2% Campo Bálsamo 51 59% 41% 16% 22% 18% 10% 6% 16% 14% Campo Calpules 194 51% 49% 19% 26% 21% 11% 10% 8% 6% Campo El Chorro 30 50% 50% 27% 27% 13% 13% 10% 10% 0% Campo Limones No.4 545 50% 50% 20% 22% 18% 14% 11% 8% 6% Campo Limones No.6 298 49% 51% 17% 23% 18% 10% 16% 11% 4% Campo Nerones 3,492 48% 52% 22% 25% 17% 12% 9% 8% 8% Campo Nuevo 812 49% 51% 23% 26% 18% 11% 8% 7% 8% Campo Palo Verde No.2 522 49% 51% 21% 21% 20% 13% 9% 9% 6% Campo Trojas No.2 56 52% 48% 30% 20% 14% 21% 7% 4% 4% Campo Trojas No.3 2 50% 50% 0% 0% 0% 100% 0% 0% 0% Chorrera 995 50% 50% 25% 25% 14% 11% 10% 7% 8% Cliftón 185 54% 46% 30% 23% 20% 9% 4% 6% 9% Cooperativa Brisas de Cuyamapa 1,479 50% 50% 26% 27% 18% 11% 8% 5% 5% Cooperativa Doce de Diciembre 1,800 49% 51% 25% 26% 18% 11% 7% 7% 7% Coyoles 1,181 49% 51% 26% 26% 13% 10% 9% 7% 8% Coyoles Central 1,049 50% 50% 19% 23% 16% 12% 11% 9% 9% El Carril 2,801 47% 53% 23% 24% 17% 11% 8% 7% 10% El Chaparral 472 53% 47% 22% 29% 14% 11% 8% 6% 10% El Nance 559 50% 50% 23% 23% 16% 11% 10% 9% 9% El Ocote 2,239 49% 51% 22% 24% 16% 10% 10% 7% 10% La Reforma 195 54% 46% 26% 26% 18% 10% 4% 10% 8% La Sabana de San Carlos 1,018 49% 51% 28% 25% 17% 12% 6% 4% 7% Las Hicoteas 576 51% 49% 24% 26% 15% 13% 9% 6% 6%

ENVIRONMENTAL RESOURCES MANAGEMENT PAA PROJECT FINANCE A/S
5-117
Hamlet (Aldea) Total Population Male Female Age 0-9
Age 9-19
Age 20-29
Age 30-39
Age 40-49
Age 50-59
Age 60+
Las Minas 235 51% 49% 21% 27% 14% 13% 7% 7% 12% Maloa 1,095 51% 49% 27% 26% 15% 11% 8% 6% 7% Medina 675 49% 51% 25% 21% 19% 11% 9% 8% 7% Méndez 1,089 49% 51% 27% 26% 16% 12% 7% 5% 6% Nombre de Jesús 1,893 50% 50% 25% 25% 18% 11% 9% 6% 7% Olanchito 32,702 46% 54% 22% 25% 17% 12% 9% 7% 7% Potrerillos 1,132 51% 49% 27% 27% 14% 12% 8% 6% 6% Puerto Escondido 571 51% 49% 21% 25% 16% 11% 10% 9% 8% Sabanetas 796 52% 48% 22% 26% 21% 12% 7% 5% 7% San Dimas 249 49% 51% 23% 19% 15% 11% 10% 6% 15% San Francisco 1,294 48% 52% 22% 24% 18% 10% 10% 6% 11% San Jerónimo 120 51% 49% 18% 17% 19% 15% 12% 5% 16% San José 2,274 48% 52% 24% 22% 18% 11% 10% 6% 10% San Juan 222 48% 52% 27% 21% 18% 7% 8% 6% 13% San Lorenzo Abajo 296 49% 51% 27% 26% 15% 9% 9% 6% 7% San Lorenzo Arriba 1,194 52% 48% 21% 24% 14% 13% 9% 9% 10% San Marcos 647 52% 48% 22% 27% 15% 13% 9% 6% 9% Tacualtuste 343 49% 51% 22% 24% 15% 13% 7% 4% 16% Teguajinal 1,156 48% 52% 20% 19% 15% 11% 11% 9% 15% Tejeras 523 50% 50% 21% 27% 19% 10% 9% 6% 7% Tepusteca 5,407 49% 51% 26% 25% 17% 10% 8% 6% 7% Trojas 3,799 52% 48% 27% 25% 17% 10% 7% 6% 7% Total Olanchito 84,894 41,009 43,885 19,886 20,974 14,415 9,616 7,469 5,576 6,958 Arenal 2423 51% 49% 23% 25% 16% 11% 9% 7% 0.09 Campo El Cayo 631 48% 52% 21% 22% 18% 13% 10% 8% 0.07 Champerío El Cayo 88 49% 51% 39% 24% 5% 11% 8% 7% 0.06 Santa Cruz 290 49% 51% 25% 18% 15% 14% 9% 9% 0.1 Tierra Blanca 840 49% 51% 24% 29% 15% 13% 7% 6% 0.06 Total El Arenal 4272 2,123 2,149 995 1,069 665 510 371 304 358 Total Project Area 89166 43,132 46,034 20,881 22,043 15,080 10,126 7,840 5,880 7,316
Source: INE, Population Census 2013. Note: Census data for 2013 is not available for two hamlets of Olanchito: Campo Rosario and Santa Bárbara.

ENVIRONMENTAL RESOURCES MANAGEMENT PAA PROJECT FINANCE A/S
5-118
Ethnicity and religion
Based on 2013 census data, the indigenous population in Honduras represents approximately 8% of the total population, including 6% who identify themselves as Amerindian and 2% as AfroHondurans. 29 Over 90% of the population are considered Mestizos or a mix between European and Amerindian, and less than 1% of the population belongs to other ethnic groups of Palestinian, Arab-Honduran, and Chinese descent.30 As of 2014, the majority of the population is primarily Christian with 46% of Roman Catholics and 41% of Protestants. One percent of the population is considered atheist, 2% have other religions, and 9% reportedly have no religion. 31 Migration and population change
Honduras, like other Central American countries, has serious limitations in retaining its population, mainly due to the lack of jobs and insecurity. The general migration pattern observed since the beginning of the twentieth century, currently remains the same. The internal migrants leave from the South, West and Center of the country towards the north coast and towards Francisco Morazán where Tegucigalpa is located, the capital of the country.32 In fact, the 2013 population census has shown that approximately 15% of the population reside outside their department of origin. Most internal emigration occurs from the departments of Copán and Valle with emigration rates of 22% and 26%, while the main “pull” departments are departments presenting more attractive employment and education opportunities such as Cortés and Francisco Morazán with lower emigration rates of 8%. In Yoro, 19% of the population has emigrated to other departments in 2013 compared to 81% of the population who is native from Yoro and remained in Yoro. The emigration rate in Yoro is therefore greater than the national average. Migration outside of the country is also quite important, and it is expected that population growth and limited job prospects outside of agriculture will continue to drive emigration. In fact, net migration is negative in Honduras, with - 1.1 migrant(s) per 1,000 population based on estimates for 2017, with remittances representing about a fifth of the national GDP. (33) In fact in 2012, The Central Bank of Honduras, in its document on remittances, affirms that there are around 963,000 Hondurans living in the United States, both legal and illegal. According to data from the Census Bureau and the US Department of 29 INE population census 2013.
30 CIA, World Factbook. Web: https://www.cia.gov/library/publications/the-world-factbook/geos/ho.html . Accessed 08 August 2018.
31 CIA, World Factbook. Web: https://www.cia.gov/library/publications/the-world-factbook/geos/ho.html . Accessed 08 August 2018
32 Migration, Labor Market and Poverty in Honduras 2006. Secretary of State in the Presidential Office
http://prejal.oit.org.pe/prejal/docs/bib/200803110054_4_2_0.pdf
33 CIA, World Factbook. Web: https://www.cia.gov/library/publications/the-world-factbook/geos/ho.html . Accessed 08 August 2018

ENVIRONMENTAL RESOURCES MANAGEMENT PAA PROJECT FINANCE A/S
5-119
Homeland Security, in the last decade there has been a significant increase in Honduran migration to that northern country: 191.1% for those who are legalized and 106.3% for illegal immigrants.34 In 2005, 28% of the population migrated out of the municipality of Olanchito, including 10% who emigrated to the United States in search of employment opportunities and education. 35 During the field survey conducted in the Project Area, no migrants were identified in the area and the workforce was reportedly primarily local. Human development and poverty
Honduras’ latest Human Development Index (HDI) value was of 0.625 in 2015, positioning it at 130 out of 188 countries and territories.36 The HDI assesses progress in three basic aspects of human development: longevity and health (measured by life expectancy at birth), access to knowledge (years of education among the adult population), and standard of living (Gross National Income (GNI) per capita). Figure 5.63 below shows the evolution of Honduras’ HDI components since 1990.
Figure 5.63 Trends in Honduras' HDI component indices 1990-2015
Source: UNDP, Honduras Human Development Report, 2016
Honduras is one of the poorest countries in Latin America with 64.50% of the population in 2013 living in poverty with income levels below the cost of a basic “consumption basket” including food and other basic goods and services. Although poverty rates are higher in rural areas, more than half of the households in urban areas also live under the poverty line (60.4% for urban areas versus 68.5% for rural areas). In terms of basic needs, 40.8% of 34 Central Bank of Honduras. Half-yearly Survey of Family Remittances sent by Hondurans living abroad and expenses incurred in the country during their visits. January 2012
35 Institutional and Financial Diagnosis of Olanchito, 2005. 36 UNDP, Human Development Report 2016, Honduras. Accessed at: http://hdr.undp.org/sites/all/themes/hdr_theme/country-notes/HND.pdf

ENVIRONMENTAL RESOURCES MANAGEMENT PAA PROJECT FINANCE A/S
5-120
households in Honduras have some of their basic needs unsatisfied (48.9% rural versus 32.3% urban). 37 Poverty is also higher in the south, west, and along the eastern border than in the north and central areas where most of Honduras' industries and infrastructure are concentrated.38
At the municipality level, the 2015 dynamic categorization framework categorizes the municipalities according to their municipal development indicator, which is calculated based on a combination of factors, including the following:39 Satisfaction of basic needs, which considers access to water and sanitation, access to primary education, subsistence capacity (i.e. employment status of household members), number of individuals per room, and housing status. This indicator is calculated using the Unsatisfied Basic Needs indicator (Necesidades Básicas Insatisfechas or NBI).
Human Development Index (i.e. life expectancy, access to education, and GNI).
Level of urbanization and access to basic infrastructure and services. Access to electricity. Financial and fiscal autonomy and capacity of the municipal
administration, including savings, financial dependency with respect to the central government, tax management, and local investment.
Within this municipality categorization framework, the municipality of Olanchito is classified as a category B municipality (“Satisfactory Development Category”) and Arenal as category C (“Low Development Category”).40 Arenal’s official municipal website reports that 51% of households of the municipality live in conditions of extreme poverty with some of their basic needs unmet (i.e. access to water and sanitation, education, etc.)41 The level of basic needs unmet in Olanchito and Arenal is summarized in Table 5.32 below. NBI 0 refers to the number of households with no basic needs unmet while NBI 1 to 4+ refers to the number of basic needs that are unmet. Most of the unmet needs have to do with sanitation and the number of dependent individuals per household members employed. Access to sanitation is discussed in detail in Section 5.5.12.
37 INE, Encuesta Permanente de Hogares de Propósitos Múltiples, 2013.
38 CIA, World Factbook. Web: https://www.cia.gov/library/publications/the-world-factbook/geos/ho.html . Accessed 08 August 2018
39 Municipal Categorization in Honduras, 2015. Accessed at: http://observatoriodescentralizacion.org/descargas/wp-content/uploads/2017/08/categorizacion_municipal_2014.pdf
40 ICF, Olanchito Atlas Forestal Municipal, 2015. Accessed at: http://icf.gob.hn/wp-content/uploads/2015/09/1807-Olanchito-Atlas-Forestal-Municipal.pdf
41 Arenal municipality website, 2018. Accessed at: https://portalunico.iaip.gob.hn/portal/index.php?portal=318

ENVIRONMENTAL RESOURCES MANAGEMENT PAA PROJECT FINANCE A/S
5-121
Table 5.32 Households per number of Basic Needs Unmet (NBI 0 to 4+) in 2013
Basic Needs Unsatisfied Olanchito Cases % Acumulated % Homes with 0 NBI 10777 46.5 46.5 Homes with 1 NBI 6220 73.34 73.34 Homes with 2 NBI 2765 95.26 85.26 Homes with 3 NBI 2075 94.91 94.22 Homes with 4 + NBI 1340 100 100 Total 23177 100 100
Basic Needs Unsatisfied Arenal Cases % Acumulated % Homes with 0 NBI 500 39.73 39.73 Homes with 1 NBI 371 69.26 69.26 Homes with 2 NBI 167 82.55 82.55 Homes with 3 NBI 130 92.91 92.91 Homes with 4 + NBI 89 100 100 Total 1257 100 100
Source: INE, Population Census 2013
5.5.5 Indigenous groups
Overview
The IFC Performance Standard 7 (PS7) recognized indigenous peoples as “social groups with identities that are distinct from mainstream groups in national societies, are often among the most marginalized and vulnerable segments of the population”. “In many cases, their economic, social, and legal status limits their capacity to defend their rights to, and interests in, lands and natural and cultural resources, and may restrict their ability to participate in and benefit from development”. This makes them more vulnerable to project impacts than non-indigenous communities.42 Population
National level
There are nine recognized indigenous and African-Honduran peoples in Honduras, representing about 8% of the population in 2013 (compared to 7% in 2001). According to the 2001 population census, the distribution is as follows: Lencas (4.6%), Misquitos (0.85%), Tolupanes (0.16%), Pech (0.06%) Maya-Chorti (0.57%), Tawahka (0.04%), Garífunas (0.76%), Nahoas or Paya (0.06%), and English-speaking islanders of African Descent (Creoles) belonging to four linguistic branches including Chipchas Hokan Siux, Maya, Aztec and African (0.20%). 43 The largest indigenous groups are therefore the Lenca (63.5% of the indigenous population) followed by the Mískitu (11.7%) and the Garífuna (10.5%). The population size, geographical distribution, and linguistic families of the indigenous groups is summarized in Table 5.33 below.
42 IFC Performance Standard 7, 2012
43 FIDA, Nota técnica de país sobre cuestiones de los pueblos indígenas, República de Honduras, 2017

ENVIRONMENTAL RESOURCES MANAGEMENT PAA PROJECT FINANCE A/S
5-122
Table 5.33 Indigenous and afro honduran peoples in Honduras
Town Population (2001)
% Linguistic family
Geographic location by Departments
Lenca 27,9507 63.5 Chibcha Intibucám, Lempira, Ocorepque, Comayagua, and small towns in La Paz, Santa Bárbara, Copán, Valle and Francisco Morazán.
Misquitos 51,607 11.7 Misumalpa Gracias a Dios, and Small conglomerates in larger cities.
Cho’rti’ 34,453 7.8 Maya Copán, Ocoteque. Tolupán 9,617 2.2 Tronco
Hokan Yoro, Francisco Morazán.
Pech 3,848 0.9 Chibcha Olancho, Colón, Gracias a Dios, and small towns in Puerto Cortés, Francisco Morazán, Lempira and Intibucá.
Tawahka 2,463 0.6 Misumalpa Río Patuca, El Paraíso, Gracias a Dios, Olancho.
Nahoa - - - Olancho, El Paraíso and Catacamas.
Garífuna 46,448 10.5 Arawak Cortés, Atlántida, Colón, Gracias a Dios, Islas de la Bahía, Cayos Cochinos and main cities.
English-speaking islanders of African Descent
12,370 2.8 Aru o Jaqi Cortés, Atlántida, Colón, Gracias a Dios and Islas de la Bahía.
Note: no detailed data available for the Nahoa population. Source: FIDA, 2017
Figure 5.64 below shows the geographical distribution of indigenous communities and ancestral lands in Honduras.
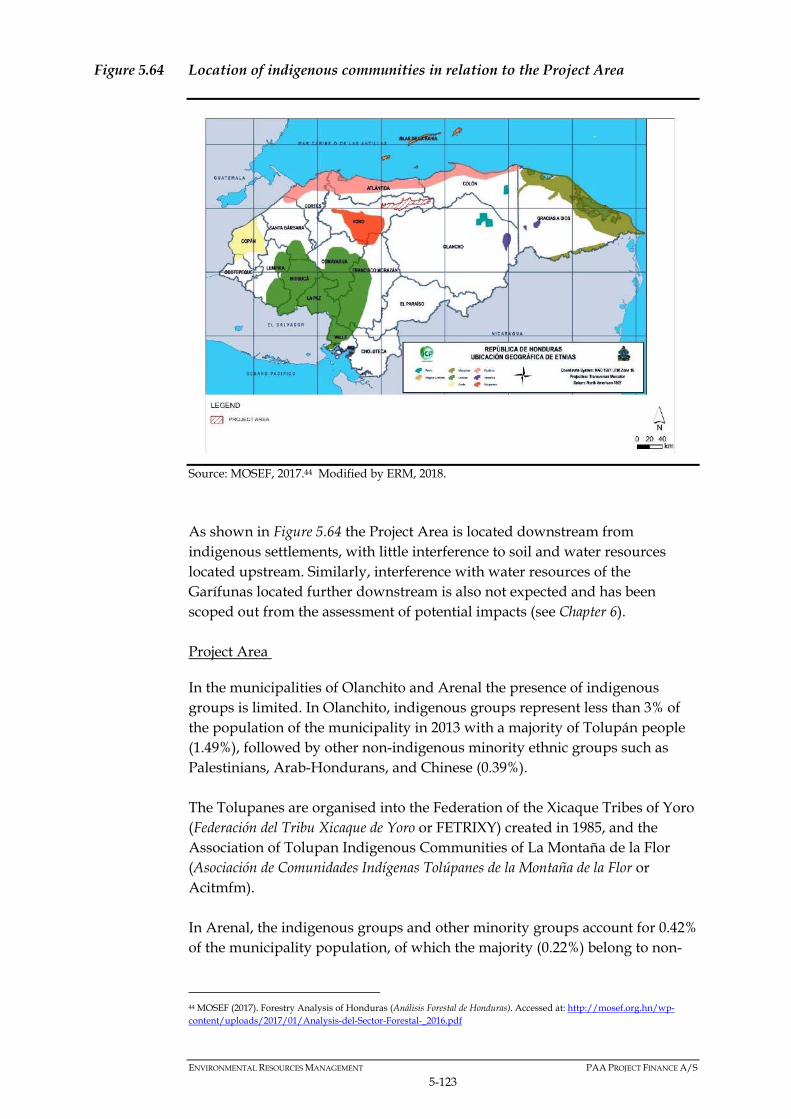
ENVIRONMENTAL RESOURCES MANAGEMENT PAA PROJECT FINANCE A/S
5-123
Figure 5.64 Location of indigenous communities in relation to the Project Area
Source: MOSEF, 2017.44 Modified by ERM, 2018.
As shown in Figure 5.64 the Project Area is located downstream from indigenous settlements, with little interference to soil and water resources located upstream. Similarly, interference with water resources of the Garífunas located further downstream is also not expected and has been scoped out from the assessment of potential impacts (see Chapter 6). Project Area
In the municipalities of Olanchito and Arenal the presence of indigenous groups is limited. In Olanchito, indigenous groups represent less than 3% of the population of the municipality in 2013 with a majority of Tolupán people (1.49%), followed by other non-indigenous minority ethnic groups such as Palestinians, Arab-Hondurans, and Chinese (0.39%). The Tolupanes are organised into the Federation of the Xicaque Tribes of Yoro (Federación del Tribu Xicaque de Yoro or FETRIXY) created in 1985, and the Association of Tolupan Indigenous Communities of La Montaña de la Flor (Asociación de Comunidades Indígenas Tolúpanes de la Montaña de la Flor or Acitmfm). In Arenal, the indigenous groups and other minority groups account for 0.42% of the municipality population, of which the majority (0.22%) belong to non-
44 MOSEF (2017). Forestry Analysis of Honduras (Análisis Forestal de Honduras). Accessed at: http://mosef.org.hn/wp-content/uploads/2017/01/Analysis-del-Sector-Forestal-_2016.pdf

ENVIRONMENTAL RESOURCES MANAGEMENT PAA PROJECT FINANCE A/S
5-124
indigenous minority ethnic groups. The distribution of indigenous and ethnic groups in Olanchito and Arenal in 2013 is presented in Table 5.34 below.
Table 5.34 Distribution of indigenous groups in the municipalities of Olanchito and Arenal (2013)
Indigenous group Number % of Indigenous Pop % of Municipality Pop Olanchito Maya -Chortí 127 4.43 0.12 Lenca 243 8.48 0.23 Miskito 182 6.35 0.17 Nahua 120 4.19 0.11 Pech 21 0.73 0.02 Tolupán 1,562 54.48 1.49 Tawahka 26 0.91 0.02 Garífuna 170 5.93 0.16 Negro de habla inglesa 13 0.45 0.01 Otro 403 14.06 0.39 Total Olanchito 2,867 100 2,72
Arenal Maya -Chortí 1 4 0.02 Lenca 5 20 0.08 Nahua 5 20 0.08 Tawahka 1 4 0.02 Otro 13 52 0.22 Total Arenal 25 100 0,42
Source: INE, Population Census 2013
The Field surveys conducted in November 2017 (CINSA & PAA 2017) and June 2018 have shown that individuals from indigenous communities come down from the mountains to find employment opportunities in the Valley. In fact, interviews with CRELs and potential beneficiaries have confirmed that the farms in the area also employ indigenous individuals and that these individuals are also well integrated into the labour and commercial activities of the Valley. The June 2018 Field survey has also shown that a small population of Tolúpan individuals reside and work in the Valley and in the Project Area, as part of non-indigenous communities. Settlements where indigenous populations can be found in the Project Area includes the hamlets of Agalteca 1km northeast of Olanchito town as well as El Aguacate, El Chorro, Carboneras, and El Aleman, with an average of 30 - 40 households composed of 3-4 members per community. Indigenous people residing in these settlements are employed in the area, some as workers in farms of potential Project beneficiaries. These individuals are reportedly intermarried and have assimilated into the local society.
5.5.6 Vulnerable groups
A vulnerable individual or group is one that could experience adverse impacts more severely than others, or have a limited ability to take advantage of positive impacts, due to a vulnerable or disadvantaged status. Vulnerability is

ENVIRONMENTAL RESOURCES MANAGEMENT PAA PROJECT FINANCE A/S
5-125
a pre-existing status that is independent of the Project but that could be exacerbated if existing sensitivities and coping mechanisms are not adequately understood or considered. Vulnerability can be exacerbated where people have inadequate or differential access to legal, political or socio-cultural structures and processes. This may be due to ethnicity, gender, language, religion, political views, sickness or disability and must be assessed in the context of a specific condition and time. The following groups are anticipated to be more vulnerable than the ‘general population’:
Beneficiaries with limited financing capacity (low income and reduced access to savings or credit): although the field survey has shown that high levels of indebtedness are not likely among stockbreeders and milk producers, the initial investment related to the purchase and installation of the irritation kit and the well drilling may still present a financial burden for beneficiaries with lower incomes.
Small producers (potential beneficiaries): Small producers are more vulnerable to overhead costs and capital investments as they have smaller economies of scale than the larger farms and therefore higher production costs. These producers may have more difficulty absorbing the equipment fee to be paid to the SAG – the amount has not yet been determined but is expected to be relatively small covering only a small portion of the equipment’s real cost.
Small-scale subsistence farmers (non-beneficiaries) with lower incomes and reduced access to savings or credit: subsistence farmers are either landless farmers who need to rent land to cultivate, or have limited access to land to cultivate. Landless farmers tend be employed as labour with the livestock breeders and milk producers of the area or with the larger multinationals. 45 These individuals are less able to cope with financial / livelihood changes and may be more disproportionally affected by potential Project impacts such as degradation of water quality and availability. This being said these landless farmers may benefit from increased and more stable employment opportunities with Project beneficiaries. Subsistence farmers identified during the field survey also included farmers who cultivate small parcels of land and are employed in another sector. These are considered less vulnerable as they do not rely entirely on agriculture. 46
Potential female landowner beneficiaries (approximately 50 individuals) and female-headed households who may experience limits on amount of income generating activities they can undertake due to primary care duties.
Individuals or households where the household head is elderly or disabled and therefore the household members have less opportunity to maximise
45 Plan Estrategico de Desaarrollo Municipal de Olanchito, 2004-2020
46 Overall, small scale subsistence farmers may be more present in Arenal municipality where agriculture is a more important economic sector and income levels are reportedly lower

ENVIRONMENTAL RESOURCES MANAGEMENT PAA PROJECT FINANCE A/S
5-126
potential income-generating opportunities due to travel, physical or capacity limitations or the need to provide care.
Employed children: children below 14 years old may be employed as farm labour in livestock and milk production farms. These children would be most vulnerable to occupation health and safety issues and labour rights issues related to the Project. Child labour is discussed in more detail in Section 5.5.8 under Working practice and labour rights.
Individuals belonging to indigenous groups or of indigenous background who may find themselves marginalized or unable to fully benefit from opportunities related to the Project. In the Project Area, no indigenous communities were identified; rather indigenous individuals live among non-indigenous communities and represent a small percentage of the population. They are mainly there for work, including in livestock and milk production farms where they reportedly benefit from the same working conditions as other workers. Indigenous groups are described in Section 5.5.6 above.
5.5.7 Land use and ownership
Land use
In line with the description of habitats described in Section 5.3.1, the main land uses of interest present in the Project Area are the following:
Agricultural land Shrubland and forest Urban and residential areas
Agricultural land is the predominant land use representing 50.5% of land coverage in the Project Area, followed by shrubland and forested areas which represent 43% of the area, while residential areas represent less than 5% of the total area. The prevalence of different land use types in the Project Area is presented in Figure 5.65 below and their geographical distribution in Figure 5.40.
Figure 5.65 Land use distribution in the Project Area
Source: ERM, 2018
43%
7%
39%
4% 2% 5%
Forest and vegetation Large‐scale agriculture
Cultivated land and pasture African palm plantations
Aquatic systems Urban areas

ENVIRONMENTAL RESOURCES MANAGEMENT PAA PROJECT FINANCE A/S
5-127

ENVIRONMENTAL RESOURCES MANAGEMENT PAA PROJECT FINANCE A/S
5-128
Figure 5.66 Land uses in the Project Area
Source: ERM, 2018
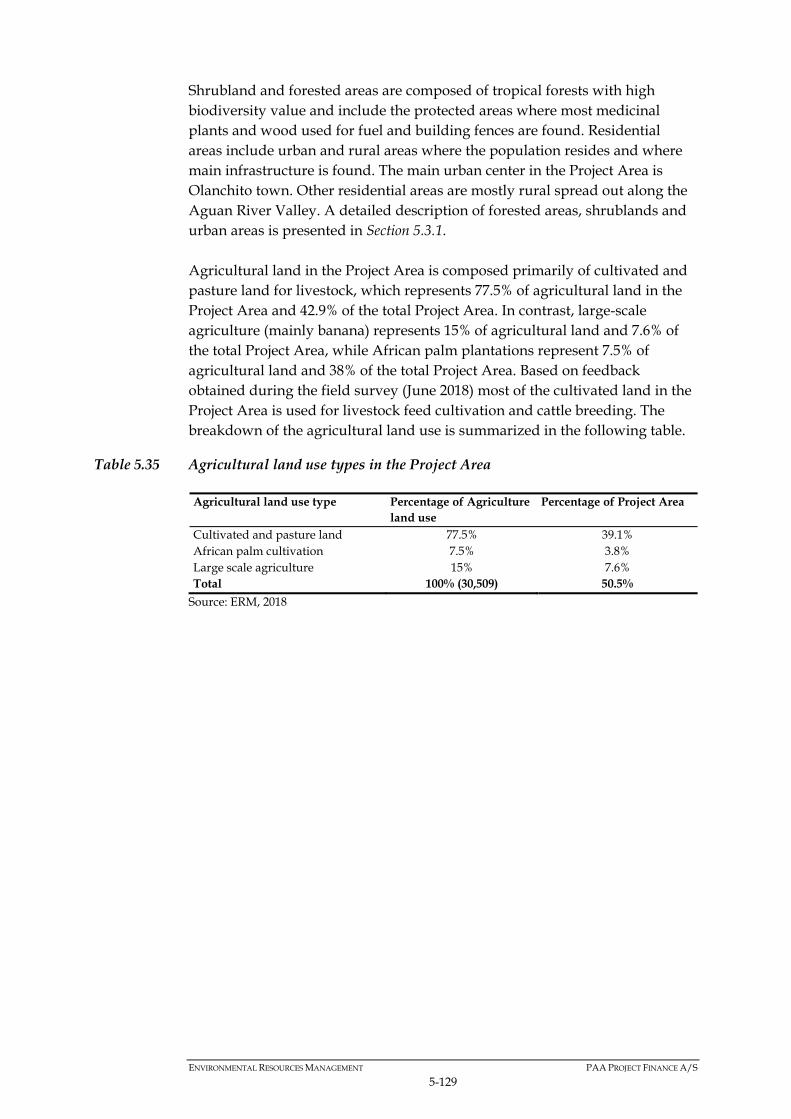
ENVIRONMENTAL RESOURCES MANAGEMENT PAA PROJECT FINANCE A/S
5-129
Shrubland and forested areas are composed of tropical forests with high biodiversity value and include the protected areas where most medicinal plants and wood used for fuel and building fences are found. Residential areas include urban and rural areas where the population resides and where main infrastructure is found. The main urban center in the Project Area is Olanchito town. Other residential areas are mostly rural spread out along the Aguan River Valley. A detailed description of forested areas, shrublands and urban areas is presented in Section 5.3.1. Agricultural land in the Project Area is composed primarily of cultivated and pasture land for livestock, which represents 77.5% of agricultural land in the Project Area and 42.9% of the total Project Area. In contrast, large-scale agriculture (mainly banana) represents 15% of agricultural land and 7.6% of the total Project Area, while African palm plantations represent 7.5% of agricultural land and 38% of the total Project Area. Based on feedback obtained during the field survey (June 2018) most of the cultivated land in the Project Area is used for livestock feed cultivation and cattle breeding. The breakdown of the agricultural land use is summarized in the following table.
Table 5.35 Agricultural land use types in the Project Area
Agricultural land use type Percentage of Agriculture land use
Percentage of Project Area
Cultivated and pasture land 77.5% 39.1% African palm cultivation 7.5% 3.8% Large scale agriculture 15% 7.6% Total 100% (30,509) 50.5%
Source: ERM, 2018

ENVIRONMENTAL RESOURCES MANAGEMENT PAA PROJECT FINANCE A/S
5-130
Figure 5.67 View of agriculture fields and pastures in the Project Area
Notes: top left (plowed field next to camerun forage crop with irrigation system); top right (pastures and livestock), bottom left (African palm plantation, young palms); and bottom right (banana plantation). All pictures taken in June during the rainy season. Source: ERM Field Survey June 2018
Land tenure and ownership
According to the Food and Agriculture Organization (FAO), land tenure in Honduras is grouped into the following categories: (1)
State property Individual private property “Ejidal” or Municipal Land (i.e. stated land conceded to the
municipality) Leasing and sharecropping Ancestral Indigenous land holdings
In line with these categories, information collected for Olanchito and Arenal through municipality meetings during the June 2018 field survey is summarized in Table 5.36 below.
Table 5.36 Land tenure in Olanchito and Arenal (2018)
Olanchito Arenal Land Tenure
Category Description (%) of
Territory Description (%) of
Territory State property Mountainous area 40 Mountainous areas 10
1 FAO, Gender and Land Rights Database. Web: http://www.fao.org/gender-landrights-database/country-profiles/countries-list/land-tenure-and-related-institutions/en/?country_iso3=HND. Accessed on 09/09/2018.

ENVIRONMENTAL RESOURCES MANAGEMENT PAA PROJECT FINANCE A/S
5-131
Olanchito Arenal Land Tenure
Category Description (%) of
Territory Description (%) of
Territory Individual private property
Mostly land owned by farmers dedicated to livestock breeding and to a lesser extent to timer activity.
50 Mostly land owned by farmers and livestock breeders (55%) and by one banana planation (5%).
60
Ejidal or Municipal Land
Urban area of Olanchito (1,280 blocks) as well as hamlets and settlements (4,000 blocks) are property of the municipality.
10 Urban area along with hamlets and smaller settlements are property of the municipality.
30
Leasing and sharecropping
Very few people rent their land to the National Agrarian Institute (Instituto Nacional Agrario or INA).
Close to 0%
No information provided.
Close to 0%
Ancestral land holdings
No information provided.
Not available
No information provided.
Not available
Note: Ancestral land holdings in Olanchito are primarily found in the occidental side of the municipal territory, in the mountains surrounding the Aguan Valley outside the Project Area to the West. Source: ERM Field Survey (June 2018). Municipality Meetings.
Private land ownerships
There are two types of private land ownerships:
Full ownership (dominio pleno): transfers all rights in the immovable property, including disposal, use and usufruct, to the owner. The owner has a land ownership title.
Useful ownership (dominio útil): de facto ownership where the owner does not have a land ownership title, but it is commonly agreed that they are the owner having used the land over many years.
Based on feedback collected during the field survey (June 2018), both full ownership and useful ownership are common types of land tenure in the Project Area (according to the SAGO). According to other sources (CREL members), full ownership is the most common situation, with most producers having formal land titles, as proof of full ownership is required to obtain credit from banks. Ownership titles are registered in the Ownership Institute (Instituto de la Propiedad or IP) and in the National Agrarian Institute (Instituto Nacional Agrario or INA). Most of the time, ownership is inherited and land is passed down through generations. Note that all potential beneficiaries are required to be formal landowners with formal titles (Full Ownership) – See Chapter 3.
Land leasing
Based on feedback collected in June 2018 through interviews with the municipality and CRELs leasing of agricultural land was consistently reported as an infrequent type of land tenure in the Project Area. Rather, workers
ENVIRONMENTAL RESOURCES MANAGEMENT PAA PROJECT FINANCE A/S
5-132
employed by livestock producers in the area sometimes receive a parcel of land to cultivate for their own consumption in addition to their salary, but without any rental agreement. This finding is also aligned with information provided in Arenal Strategic Municipal Development Plan (2013), which states that less than 1% of households rent their land, while 8.21% of the population cultivates land that is “borrowed”, i.e. land for which the owner has allowed them to cultivate on, as in the case of workers receiving a portion of land to cultivate. 1 Nevertheless, the Strategic Municipal Development Plan for Olanchito for 2004 – 2020 (published in 2003) identifies land leasing as one of the tenure-related issues in Olanchito affecting mostly small agricultural producers and subsistence farmers who do not own any land. This being said, the Strategic Plan does not specify whether these farmers represent a large or a small portion of the population and based on the latest information collected during the field survey (June 2018) through official sources, it is safe to assume that land leasing applies to a limited portion of the population in the Project Area, if any. In addition to landless farmers, the Strategic Municipal Development Plan for Olanchito (2004-2020) identifies subsistence farmers who cultivate small parcels of land but are employed in another sector and do not rely entirely on agriculture. Both landless subsistence farmers and those with limited access to land are considered in Section 5.5.5 on Vulnerable Groups. Ancestral indigenous lands
As discussed previously in Section 5.5.5, indigenous communities represent a small minority (less than 3%) of Olanchito’s population. These communities are located primarily in the occidental side of the municipal territory, in the mountains surrounding the Aguan Valley west of the Project Area where indigenous ancestral land holdings of the Tolúpan tribe are mainly found.2 This being said, the Tolupan people residing in the hamlet of Agalteca (approx. 1 km northeast of Olanchito town) have claimed ancestral ownership over land in the hamlet. According to a 2011 report of the Honduras Land Adminisitration Program (Programa de Administración de Tierras de Honduras or PATH), the Tolupan people residing in Agalteca reported holding ancestral ownership titles granted by the State in 1838 over land located in Agalteca. However, subsequent investigations by the PATH have shown that the land that the Tolupanes of Agalteca claimed as ancestral land had been registered in 1942 as state land of communal nature (“ejidal”) belonging to the hamlet of Agalteca. Despite the offical resolution, Tolupan community leaders have
1 Plan Estratégico de Desarrollo Municipal de Arenal (2013).
2 Plan Estratégico de Desarrollo Municipal de Olanchito 2004-2020

ENVIRONMENTAL RESOURCES MANAGEMENT PAA PROJECT FINANCE A/S
5-133
stressed that any activity in the sense of promoting land tenure security in the area should consider the remediation and delimitation of the area that was historically considered as part of the Tolupan indigenous territory. 1 It is important to note however, that the land in the hamlet of Agalteca is considered urban with no agricultural activities and therefore no potential beneficiaries for the Project identified. Background of land-related conflicts
Land-related conflicts in the Alto Aguan Valley and in the Project Area specifically have not been reported. However violent conflicts have been ongoing in the Bajo Aguan Valley just downstream of the Project Area since the 1990s resulting in more than 120 people being killed between 2008 and 2013, mostly peasants (90), but also security guards (10) and one police officer.2 According to a report by the US embassy in Honduras, the roots of the conflict date back to the 1970s and 1990s when the Honduran government introduced a process of agrarian reform through collective land ownership turning over mostly public lands to farmer (campesino) cooperatives. In 1992, the land reform started being reversed with the Government authorizing the sale of collectively-held land to individual landowners, which resulted in land being sold by campesino collectives to large, individual landowners.3 The vast majority of the arable land in the Lower Aguán Valley was then converted for the production of African palm oil. Some groups have disputed the legality of these land sales, some through legal claims in the court system, and others through land occupations resulting in violent conflicts between campesinos, security guards hired by the large plantations, and police forces. The land conflict in the Bajo Aguan was also mentioned in the June 2018 field survey during the meeting with the National Agrarian Institute, stating that some of the land bought by the Dinant Corporation to produce African Palm was later bought by the Dole Food Company owning banana plantations in the Project Area (see Section 5.5.8). Local farmers in the area had reportedly pressured the government to recover the lands, resulting in 4,000 manzanas (2,789 ha) being bought back by the government and redistributed to the local farmers. The distribution of African oil plantations downstream of the Project Area are shown in Figure 5.68 below.
1 Honduras Land Administration Programme (PATH). Indigenous Participation Plan for PATH Phase II. June 2011.
2 Irish times. “Death Valley: the Land War Gripping Honduras”. May 2015. Accessed at: https://www.irishtimes.com/news/world/death-valley-the-land-war-gripping-honduras-1.2205506
3 US Embassy in Honduras, July 2014. Accessed at: https://hn.usembassy.gov/our-relationship/policy-history/current-issues/lrc-bajo-aguan/

ENVIRONMENTAL RESOURCES MANAGEMENT PAA PROJECT FINANCE A/S
5-134
Figure 5.68 Location of African Palm plantations in the middle and lower Aguan River Valley with respect to the Project Area
Source: ERM, 2018
5.5.8 Economy and employment
National overview
Overview
Honduras, is the second poorest country in Central America, and presents unequal income distribution along with high underemployment levels. In 2017 5.9% of the population was unemployed however, one-third of the occupied population is considered underemployed. The economy registered modest economic growth of 3.1%-4.0% from 2010 to 2017 with $46.2 billion in GDP in 2017. As of 2017, the services sector is the main economic sector in terms of contribution to the GDP (57.8%), followed by industry (28.4%) and agriculture (13.8%). 1 The GDP composition by sector is shown in Figure 5.69 below.
11 Honduras World Factbook, CIA. 2017. Accessed at: https://www.cia.gov/library/publications/the-world-factbook/geos/ho.html

ENVIRONMENTAL RESOURCES MANAGEMENT PAA PROJECT FINANCE A/S
5-135
Figure 5.69 Honduras GDP composition by Sector (2017)
Source: CIA World Factbook, 2017 adapted by ERM (2018)
The milk production and milk processing sectors are important sectors in terms of contribution to the national economy and the country’s commercial balance. In 2017, total milk production reached 900 million litres increasing from 650 million in 2008. 1 According to El País, national newspaper, milk production has increased by 5% per year with an associated $70 million reduction in the deficit of the commercial balance. Of the total produced, 80% is acquired by artisanal milk-processors and the remaining by the industrial milk-processing companies. About 20-25% of the final product is exported to El Salvador and Guatemala. 2 The national exports value of dairy products has reportedly increased by 35% from 2016 to 2017 according to the Honduran Association of Milk Processors. 3 Milk processing centers are primarily located in the department of Olancho and in San Pedro Sula (department of Cortés). However, based on a 2011 study of the dairy value chain in Honduras and Nicaragua, the average growth rate of the milk production sector is not considered sufficient to meet the growing domestic demand, which is primarily “exacerbated by high seasonal fluctuations in milk availability with markedly reduced production levels during the dry period”. 4
1 http://www.elheraldo.hn/economia/1114647-466/producci%C3%B3n-de-leche-superar%C3%A1-900-millones-de-litros-en-el-pa%C3%ADs
2 http://www.elpais.hn/2018/06/27/bajan-precio-derivados-la-leche-produccion/
3 http://www.latribuna.hn/2017/10/21/5-ciento-anual-crece-produccion-leche-honduras/
4 Dairy value chain in Honduras and Nicaragua: Background proposals for the CGIAR Research Program on Livestock and Fish. https://cgspace.cgiar.org/bitstream/handle/10568/16971/LivestockFish_DairyVCHondNicarag.pdf?sequence=1
57,80%28,40%
13,80%
Services
Industry
Agriculture

ENVIRONMENTAL RESOURCES MANAGEMENT PAA PROJECT FINANCE A/S
5-136
Employment
Based on the 2013 national household survey, the economically active population (Población Economicamente Activa 1 or PEA) in Honduras represented 53.7% of the population of working age, including 63% of men and 37% of women. Out of the PEA, 96% of the population is employed or self-employed, and 4% is unemployed. Note however that one third of the occupied population is underemployed. In Honduras, 35.8% of the occupied population works in the agriculture sector, 24.1% in commerce and 12.7% in the industry sector. These three fields of activity concentrate more than 70% of the employed population in the country. Project Area
Employment
In the department of Yoro, 76% (433,416) of the population is of working age (Población en edad de trabajar or PET) of which 37% (160,543) is employed or self-employed. In other words, 63% of the population of working age is either inactive or unemployed. As shown in Figure 5.70, the occupied population is primarily composed of qualified farmers and agricultural and forestry workers (35%), followed by 18% of low-skilled workers (ocupaciones elementales), and 13% of workers in commerce and services. Technicians, mechanics and artisans represent 11% of the labour force and machinery operators and installers 7%. Note that low-skilled employment category also includes low-skilled workers employed in agricultural and livestock holdings (peones de explotaciones agrícolas y ganaderas), which represent 12.5% of occupations in Yoro. The agricultural, livestock and forestry sector therefore employs about 48% of the population in Yoro. A further breakdown of 2013 census data shows that the milk processing sector employs 0.11% of the population in Yoro. As discussed in the previous section, industrial milk-processing centres are located outside the Study Area and constitute an important economic sector at the national level.
1 The Economically Active Population (PEA) is defined by the National Statistics Institute of Honduras as: all persons over 10 years of age who claim to have a job, or do not have one but have actively searched for work or seek for the first time. The PEA is composed of employed and unemployed.

ENVIRONMENTAL RESOURCES MANAGEMENT PAA PROJECT FINANCE A/S
5-137
Figure 5.70 Occupation distribution in Yoro Department
Note: white collar employees include directors and managers in various sectors as well as scientific professionals and intellectuals. The blue collar category groups technicians and medium level professionals as well as administrative support employees. Source: INE, 2013 adapted by ERM, 2018.
In 2013 in Olanchito, the economically active population (población economicamente activa or PEA) is of approximately 29,000 people and represents 34% of the population of working age in the municipality (82,000 people). Approximately 97% of the PEA (28,000) is employed while 3% is unemployed. Similarly, in Arenal, the PEA (approximately 1,380 people) represents 29% of the working age population of 4,500. Approximately 98% of the PEA (approximately 1,400 people) is employed and 2% unemployed. In line with employment trends at the department and national levels, underemployment is predominant in the Study Area (80% in Olanchito according to the Municipality). In Olanchito, 25% of the occupied population (7,000 people) is employed as qualified farmers and workers in the agriculture, livestock and forestry sector, while 23% (5,980 people) are employed as low-skilled farm labour or farmhand (peones). In Arenal 27% (370 people) of the occupied population is employed as qualified farmers and workers and 30% (414 people) as low-skilled labour. Overall therefore, agriculture, livestock and forestry employs 48% and 57% of the population in Olanchito and Arenal respectively. In turn, milk processing represents only 0.22% and 0.23% of employment Olanchito and Arenal. The main sectors of occupation in Olanchito and Arenal are presented in Figure 5.71 below.
5,17,09
13,35
34,73
11,3
7,07
18,29
0,3 2,77
1. White collar
2. Blue collar
5. Service workers andVendors of Shops and Markets
6. Farmers and QualifiedAgricultural and ForestryWorkers7. Officers Operators andArtisans of Mechanical Artsand other trades8. Operators of Installationsand Machines and Assemblers
9. Elementary Occupations

ENVIRONMENTAL RESOURCES MANAGEMENT PAA PROJECT FINANCE A/S
5-138
Figure 5.71 Sectors of occupation the Olanchito and Arenal (2013)
Note: white collar employees include directors and managers in various sectors as well as scientific professionals and intellectuals. The blue collar category groups technicians and medium level professionals as well as administrative support employees. Source: INE, 2013 adapted by ERM, 2018.
In terms of income, approximately 12% of households in Arenal in 2013 had a monthly income of less than 1,000 lempiras (around 42 USD at time of writing) and 65% of less than 4,000 lempiras (around 166 USD). Almost 11% of the households relied on remittances from abroad. 1 In Olanchito the poorest households also rely on remittances from family members who have immigrated, mostly to the United States. 2
1 Arenal Strategic Municipal Development Plan 2013.
2 Olanchito Strategic Municipal Development Plan 2004-2020
White collar6% 2. Blue collar
7%
5. Service workers and Vendors of Shops and
Markets14%
6. Farmers and Qualified Agricultural and Forestry
Workers25%
7. Officers Operators and Artisans of Mechanical Arts
and other trades12%
8. Operators of Installations and Machines and
Assemblers3%
9. Elementary Occupations30%
10. Military Occupations0%
11. Undeclared3%
OLANCHITO
White collar7% 2. Blue collar
6% 5. Service workers and Vendors of Shops and
Markets8%
6. Farmers and Qualified Agricultural and Forestry
Workers26%
7. Officers Operators and Artisans of Mechanical Arts
and other trades5%
8. Operators of Installations and Machines and
Assemblers3%
9. Elementary Occupations39%
10. Undeclared6%
ARENAL

ENVIRONMENTAL RESOURCES MANAGEMENT PAA PROJECT FINANCE A/S
5-139
Economic sectors
In line with 2013 census results and municipality strategic development plans as well as field survey findings, the main income and employment-generating sector for households in the Project Area is livestock breeding and milk production, and employment in the large multinational banana, and to a lesser extent, African Palm production companies. Other important economic activities include agriculture and farming of basic crops and grains such as corn and beans, especially in the municipality of Arenal. Households in the area also rely on remittances from relatives who have emigrated. Additional economic activities in the area include small-scale artisanal cheese production and commerce and services in Olanchito. The banana and African palm plantations correspond to large-scale production by multinational companies and are characterized by heavy investments in technology including the implementation of pest control, irrigation, and mechanized earthwork. In contrast, the remaining agriculture and livestock areas have varying degrees of technology and mechanization and rely mostly on low production techniques. Other large banana and African palm plantations are found downstream of the Project Area in the Lower Aguan Valley, while some are also present in the Project Area, based on field survey feedback and observations. Overall, seven out of the eight banana plantations of Olanchito are located in the Project Area, including the Dole Food Company or Dole (American agricultural multinational corporation). The location of the large-scale production companies in the Project Area and downstream are presented in Figure 5.68 of Section 5.5.7 above. These multinational companies also contribute to employment in the municipalities of the Project Area. Dole in particular reportedly employs 5,000 individuals according to the Olanchito municipality. However, most workers are employed in the livestock sector in local farms. As stated above, about 30% of the occupied population in the Project Area is employed as low-skilled farm labour in the agriculture and livestock sector. A more detailed description of potential beneficiary farms and farm labour in the Project Area is presented in Section 5.5.9. As discussed above, milk processing only employs a small portion of the population locally and at the department level (0.22% in Olanchito and Arenal and 0.11% in the department of Yoro). As discussed previously, the milk processing centres are located outside the Study Area, primarily in the Department of Olancho and in San Pedro Sula (department of Cortés), Farming, livestock breeding and milk production, and forest-related activities are described in Section 5.5.9 on Livelihoods and Income.

ENVIRONMENTAL RESOURCES MANAGEMENT PAA PROJECT FINANCE A/S
5-140
Working practice and labour rights
Formal employment in Honduras is overseen by the Secretariat of Labour and Social Security (Secretaría de Trabajo y Seguridad Social) and is primarily regulated by the National Labour Code and National Program of Employment per Hour along with the dispositions of social security and minimum wage. According the Labour Code, employment contracts may be verbal or written, with verbal contracts authorized only in specific cases including:
domestic service; temporary work of up to sixty days; activity remunerated at no more than 200 Lempiras to be completed
within a specified timeframe of no less than sixty days; and farming and livestock activities excluding industrial and commercial
enterprises. For 2018, the minimum salary published by the Secretary of Labour and Social Security for the agriculture and livestock sector is set at 6,000 lempiras (around 249 USD at time of writing) per month for companies employing up to 10 employes. 1 Although beneficiary farms are not considered companies, this gives an indication of the monthly wages paid in the sector. Child labour
According to ILO standards on child labour, the general minimum age for admission to employment or work is set at 15 years (13 for light work) and the minimum age for hazardous work at 18 (16 under certain strict conditions). Child labor in Honduras is prevalent with 14.7% of children between 5 and 14 who work (6.1% work and study at the same time, and 8.6%drop out of school and only work), and 57.5% of working children employed in the agriculture sector (sugarcane, coffee, etc.). Working children in Honduras are either employed as salaried employees, self-employed, or unpaid family workers.2 According to the Labor Code, children are allowed to start work at 14 as long as they continue to attend school, otherwise the minimum working age is 16. No child labour has been observed during the June 2018 field survey on visited farms of potential beneficiaries. However it has been reported that children in some cases drop out of school at age 12 and start working. In most cases, it has been reported that children under 14 help-out at the farm on their free time outside of school. Farm labour in the Study Area is described in detail in the following Section 5.5.9 on Livelihoods and Income.
1 http://www.trabajo.gob.hn/tabla-de-salario-minimo-2018/
2 http://www.ine.gob.hn/images/Productos%20ine/TrifoliosHogares/Trabajo%20Infantil.pdf; https://www.dol.gov/agencies/ilab/resources/reports/child-labor/honduras

ENVIRONMENTAL RESOURCES MANAGEMENT PAA PROJECT FINANCE A/S
5-141
Forced labour
Although the Labour Code sets the working hours at a maximum of 44 hours per week with overtime pay, secondary sources highlight cases of forced over-time and low pay in in the agricultural sector in Honduras. 1 This is mainly explained based on the lack of specific legal sanctions, and culture of tolerance of labour rights violations encouraged by the economic crisis, unemployment, and low salaries, etc. However no specific reports were found with respect to over time in the livestock and milk production sector.
5.5.9 Livelihoods and income
The primary livelihood activities in the Study Area are described below in the following sub-sections. These activities include agriculture, livestock and milk production, commerce and trade, and use of forest products and other natural resources.
Agriculture and livestock production
Overview
The agricultural production cycle of the Alto Aguan River Valley starts with the rainy season in the month of May and ends in November, with highest rainfall in the months of June and September (see Section 5.3.1). The production cycle is interrupted by the dry season (January to April), which prevent the satisfactory development of crops and animal feed which are affected by the heat and the period of drought. Although a few irrigation systems are present in the area (mostly from surface water sources), lack of irrigation in the dry season remains a major issue and the primary cause of the reduction in the production of forage crops and milk (see Section 5.5.12 on Irrigation networks). In the Project Area, most of the agricultural producers are livestock breeders whose agricultural output focuses on forage crops for livestock feed, which is mostly grass, corn and sorghum. Some producers sometimes also diversify their production with the cultivation of basic grains such as corn and beans, vegetables, African palm, sugar cane, citrus fruits, as well as livestock of minor importance such as pork, chicken, goat, and sheep. Other produce also coffee, banana, watermelon and yucca. The potential beneficiaries of the Project will be selected among these farmers and livestock breeders present in the Project Area. The quantity, quality and daily availability of livestock feed determine the volume of milk produced by the cow. Therefore, in dairy production, the timely availability of feed for livestock is essential. This factor has limited the increase in milk production per cow, which according to livestock farmers in
1 ASEPROLA. Flexibility: the Labor Strategy of Free Trade. An Examination of Six Basic Labour Rights in Honduras. Accessed at: https://laborrights.org/sites/default/files/publications-and-resources/HondurasLaborRights.pdf

ENVIRONMENTAL RESOURCES MANAGEMENT PAA PROJECT FINANCE A/S
5-142
the area averages 6 litres per head (4-5 litres in the dry season and 7-10 litres in the rainy season), and prevents increasing the population of livestock per farm (CINSA & PAA Project Finance 2017 preliminary information and ERM June 2018 field survey). According to the Olanchito’s Farmers and Stockbreeders’s Society (Sociedad de Agricultores y Ganaderos de Olanchito or SAGO, the production in 2017 was of 50,000 litres per day or 18.2 million in total for the year.1 The milk production is sold directly by the CRELs (or the producers themselves in the case of independent producers) to national processing companies such as LEYDE, SULA, LECHOSA, SANPILES and to local artisanal cheese producers. More detail on the organization of the milk production sector is provided in the following subsections. As described in Section 5.5.8, in addition to the producers and farm owners, the agricultural and livestock sector also employs low-skilled farm workers. This category includes lower income households including individuals of indigenous background who rely primarily on agriculture and livestock breeding for income generation and livelihoods.
Box 5.6 Other Farmer Categories
The remainder of the section therefore focuses on the description of farmers and livestock breeders identified as potential Project beneficiaries as well as the farm workers employed in potential beneficiaries’ farms. Livestock and milk producers and the farm workers represent the majority of the population involved in the agricultural sector in the Project Area. Organization of livestock breeders and milk producers
All farmers and livestock breeders and milk producers in the area are members of Olanchito’s Farmers and Stockbreeders’s Society (Sociedad de Agricultores y Ganaderos de Olanchito or SAGO). Most of them (90-95%) are also members of Centers for the Collection and Cooling of milk (Centro de Recogida
1 Note that the total milk production recorded in the Olanchito Strategic Development Plan for 2004 was of 40 million litres.
Although crop farmers do exist in the Project Area, very few farmers are only dedicated to the cultivation of crops for income generation and/or subsistence. According to field survey information (June 2018), these farmers are usually small-scale farmers with limited access to land who cultivate crops for self-consumption and tend to be employed in other sectors and therefore do not rely entirely on agriculture for income and subsistence. The Olanchito Strategic Municipal Development Plan 2004-2020 also identified a category of subsistence farmers with no land titles who tend to rent land for cultivation and who seek employment as farm workers for the livestock producers in the area (see Section 5.5.7). However based on recent field survey information (June 2018), land leasing is reportedly very rare and is not known to occur in the Project Area. Rather, farm workers who do not own land are sometimes given a piece of land to cultivate for their own consumption in addition to the salary they receive from the landowner. Labour conditions for farm workers are discussed further below in this section.

ENVIRONMENTAL RESOURCES MANAGEMENT PAA PROJECT FINANCE A/S
5-143
de Leche or CREL) while a minority (5-10%) are independent producers with no CREL affiliation. The SAGO counts approximately 350 members, most of whom are organized into CRELES for the recollection and cooling of milk. CRELs were created as a result of mitigation and climate change adaptation efforts after hurricane Mitch, and have received government support for their organization as well as capacity building. They are considered associations of common interest rather than land-based cooperatives and serve as a collection points for national milk processing companies who collect their milk directly from the CREL. Payment is made directly to the CREL who then transfers the payment to the farmers and milk producers. CRELs also sometimes act as financial guarantee for farmers asking credit from the bank. In this case the CREL pays the monthly interest payment to the bank and deducts this amount from the farmer’s revenue. New members are also required to contribute a fee upon joining from 50,000 to 100,000 lempiras (around 2,000 – 4,200 USD). There are currently 16 CRELs established in the Project Area with an average of 20-25 members per CREL (see Table 5.29). Two new CRELs were also recently established with more independent producers joining, meaning that the total number of producers may increase beyond the 350 SAGO members identified to approximately 400. Note that SAGO and CRELs in the Project Area have been extensively consulted during the project design stages.
Figure 5.72 CREL facilities in the Project Area
Note: Left: Aerial water storage tank in CREL Eberto Chirinos Ponce. Right: Milk conservation deposits in CREL Cruz Núñez. Source: ERM Field Survey (June 2018)
Potential beneficiaries
Farmers and Livestock breeders in the Project Area may be grouped into small, medium and large producers. Producers with farms or “fincas” with a total size of less than 40 ha are considered “small” producers, while producers with farmland comprised between 40 and 84 hectares are considered “medium” producers and farms of more than 84 ha are categorized as “large”

ENVIRONMENTAL RESOURCES MANAGEMENT PAA PROJECT FINANCE A/S
5-144
producers.1 Based on preliminary baseline data collected by CINSA and PAA in 2017, the majority of producers in the Project Area (48%) can be considered small producers, while 33% are medium, and 19% large producers.
Table 5.37 Livestock and milk producers by size in the Project Area
Producer Size Number Percentage Small (less than 40 ha) 145 48% Medium (40 to 84 ha) 100 33% Large (larger than 84 ha) 56 19% Total (sample) 301 100%
Source: Potential beneficiary assessment by CINSA & PAA (2017)
Further breaking down the small producer category, most small producers (49%) have access to between 21 and 39 ha, while 23% of small producers have between 11 and 20 ha, and 28% have less than 10 ha of land. Potential beneficiaries therefore include 14% of small producers with less than 10 ha of land, 11% with 11 to 20 ha and 24% with 21 to 39 ha. As discussed above, the vast majority of livestock breeders and milk producers in the Project Area engage primarily in cattle breeding and milk production activities, which includes the cultivation of forage crops and livestock feed such as corn, grass and sorghum. Overall, apart from forage crops and cattle feed, livestock breeders and milk producers who reportedly engage in additional agricultural activities as complementary income sources or for self-consumption represent approximately 10% of the total (CINSA & PAA 2017). Most producers sell their milk to national milk production companies and in some cases (residual only) to local artisanal cheese producers. It should be noted however that in the municipality of Arenal, over 80% of farmers and livestock breeders also cultivate crops for self-consumption. Since the Project Area is primarily located in Olanchito with only about 10% of the area included in Arenal, agriculture for self-consumption is less present in the Project Area. Income and production levels
The average size of the farms of potential beneficiaries is of 55 h, with an average of 28 ha of irrigable land. At present only a few irrigation systems are in place to irrigate the land during the dry seasons. Irrigation systems are mainly found in the large-scale banana plantations. Table 5.38 below presents a summary of basic characteristics of milk producers grouped by producer size. Note that this information was obtained by triangulating data collected during the June 2018 survey with preliminary data from CINSA & PAA (2017) for the sample of 301 producers.2
1 Note that this classification was confirmed with the SAGO during the field survey in June 2018.
2 Note: The June 2018 data being based on a relatively small sample, range estimates are presented rather than specific values to account for potential discrepancies, and triangulation with the larger sample of 2017 was used to provide more representative information. For indicators that were not collected by CINSA and PAA Project Finance in 2017 such as cattle

ENVIRONMENTAL RESOURCES MANAGEMENT PAA PROJECT FINANCE A/S
5-145
heads and milk production per cattle head in particular, information relies primarily on small meetings during the June 2018 survey. All the ranges and values presented are therefore estimates (see Section 5.2 Data Collection and Limitations).

ENVIRONMENTAL RESOURCES MANAGEMENT PAA PROJECT FINANCE A/S
5-146
Table 5.38 Producer characteristics by size
Note: * Family revenue: Lower monthly averages were reported by the SAGO and the CRELs (16,500 and 12,000 respectively). However, these were not deemed realistic as they would mean that the producers would be running at a loss considering the expenses related to the payment of labour, etc. The information presented therefore combines results from FGDs with small producers, visits to farms, and data from the sample of 301 beneficiaries (CINSA & PAA 2017). Source: CINSA & PAA (2017); ERM Field Survey (June 2018).
As discussed previously, milk production per cattle head reportedly varies between four and five (3-5) litres per day in the dry season and seven to ten (6-12) litres per day in the rainy season, with an overall yearly average of six to seven (6-7) litres per day per head.1 Small producers typically have fewer cattle heads but a larger cattle to land ratio which implies less grazing land available per cattle head (less than 1 ha per cattle). In contrast, medium and large producers have more land available and a smaller cattle to land ratio with more land available for grazing, as well as a wider variety of forage crops and cattle feed, allowing them to produce larger quantities of milk, especially in the rainy season. The litre of milk typically sells for 8.5 to 10 lempiras. During the dry season, milk production and related revenues reportedly drop by 50% due to water
1 The average yearly range is calculated considering 6 months of rainy season and 4 months of dry season and taking into account that 48% of producers are small, 33% medium, and 19% small.
Small farms (up to 40 ha) Medium farms (40-84 ha) Large farms (over 85 ha)
Cat
tle
hea
ds
& p
rod
uct
ion
Average cattle heads: 30-50 average cattle heads per farm (20 producing milk) Cattle to land ratio: less than 1 ha per cattle head (between 0.4 and 0.88ha) i.e. more cattle per ha and less land available for grazing per cattle head. Daily production yields: 7-8 Litres per cattle head in the rainy season vs. 3-5-4 Litres in the dry season.
Average cattle heads: 40-60 average cattle heads per farm (30 producing milk). Cattle to land ratio: approximately 1 ha per cattle head. More land available for the cattle than with small producers. Daily production yields: 8-10 litres per cattle head in the rainy season vs. 4-5 litres in the dry season.
Average cattle heads: 75 – 150 average cattle heads per farm (50 producing milk) Cattle to land ratio: 1.5-2 ha per cattle head. More land available for grazing per cattle head. Daily production yields: 8-12 litres / cattle head in rainy season vs. 4-5 litre / head in dry season
Fam
ily
Rev
enu
e (g
ross
p
rofi
t) *
Rainy season monthly average: 20,000-40,000 lempiras (832 – 1,663 US) Dry season monthly average: 10,000-20,000 lempiras (416 – 832 USD)
Rainy season monthly average: 30,000–60,000 lempiras (1,247 – 2,495 USD) Dry season monthly average: 20,000-30,000 lempiras (832 – 1,247 USD)
Rainy season monthly average: 40,000–80,000 lempiras (1,663 – 3,326 USD) Dry season monthly average: 20,000-40,000 lempiras (832 – 1.663 USD)

ENVIRONMENTAL RESOURCES MANAGEMENT PAA PROJECT FINANCE A/S
5-147
scarcity and lack of appropriate technology. It is expected that irrigation from the Project will ensure additional food for the cattle during the dry season keeping production and revenues stable throughout the year. According to the SAGO, average production and revenues for medium producers is approximately 1.5 times the production of small farms, while the average production for large producers is approximately twice the production of small farms. With large producers, agriculture production sometimes exceeds cattle feeding needs, creating an additional economic income. Independent producers
As indicated previously, about 5-10% of the producers are independent and not members of any CREL.1 Based on the preliminary baseline data collected in 2017, it can be assumed that the majority of independent livestock and milk producers are small producers (54%), and will typically have smaller monthly incomes. Small independent producers tend to sell their milk to local artisanal cheese makers rather than to the national milk processing companies such as LEYDE, as these companies usually collect their milk directly from the CRELs. With no CREL affiliation, these producers may be considered more vulnerable in terms of access to technical and financial backing from CRELs and access to national milk processing companies. While small producers represented the majority of independent producers based on preliminary information from CINSA & PAA Project Finance (2017) the preliminary results also showed that 31% of independent producers are large producers with over 84 ha of land. These large producers do not need to use CREL facilities to store their milk, as they have their own facilities, including a milk deposit, to maintain the milk at low temperatures for conservation purposes. Labour force and working conditions
Based on field survey interviews with the SAGO, CRELs and local producers, most of these farms employ local workers to conduct specific activities on the farm. There are reportedly no migrant farm workers in the area and indigenous workers are present in small numbers. As discussed in Section 5.5.4 workers of indigenous descent in the area are mostly Tolupan living since generations in nearby communities. Workers are mostly men. Workers do not usually live on the farms and rather tend to commute daily by bicycle, motorbike, by foot or on horseback, although there are a few cases where workers and their families do live on the farm. Some workers also receive a small portion of land to cultivate for their own consumption as well as free milk. When the family lives on the farm, children sometimes help with farm work during holidays or after school (so do children of the owner).
1 Note: the information presented is based on preliminary data from CINSA&PAA (2017) and feedback obtained in June 2018. The sample of 301 producers included in the preliminary field survey is considered representative of the total number of producers in the Project Area. Information obtained can therefore be extrapolated to the total population of producers.

ENVIRONMENTAL RESOURCES MANAGEMENT PAA PROJECT FINANCE A/S
5-148
Workers are mostly permanent although some seasonal workers are employed at the beginning of the agricultural season in May and June, when the workforce size in a given farm tends to double. Small producers tend to employ between two (2) and four (4) permanent workers which tends to increase up to 10 in the rainy season. Medium and large producers employ 6-8 and 10-12 permanent workers respectively, doubling in the rainy season with additional seasonal workers. Since small farms represent 48% of potential beneficiaries, medium farms 33% and large farms 19%, it may be estimated that each potential beneficiary farm employs on average 6 permanent employees and 12 in the rainy season. This results in a total of approximately 1,800 permanent workers and 3,600 workers in the rainy season in potential beneficiary farms. The yearly average in both rainy and dry season is estimated at approximately 2,100 workers. These estimates are aligned with the job creation numbers obtained for a similar irrigation project implemented by the SAG in 2015 with funding from the Austrian Government. The 2015 project introduced irrigation equipment on cultivated land in multiple departments including in Yoro. 1 Figure 5.73 below provides an estimate of jobs per hectare of land irrigated per crop for the 2015 Austrian project and Table 5.39 calculates the number of jobs created per hectare of irrigated land for each type of crop, showing that vegetable crops are the most labour intensive. Job creation therefore depends on the type of crops. In the Project Area, producers mostly cultivate forage grass (pasto) as well as corn and beans and sorghum. On average these crops generate 0.55 jobs per hectare of irrigated land.
1 Bauer, Irrigation Project for High Value Crops (“Cultivos de Alto Valor Bajo Riego por Aspersión”). October 2015

ENVIRONMENTAL RESOURCES MANAGEMENT PAA PROJECT FINANCE A/S
5-149
Figure 5.73 Employment creation per hectare of irrigated land in the Bauer Project Area Honduras
Source: Bauer, 2015
Table 5.39 Job creation per irrigated hectare per crop
Crop # jobs per hectare Corn 0.8 Bean 0.6 Watermelon 1.4 Forage grass (pasto) 0.6 Sorghum 0.2 Rice 0.85 Chili 1.53 Tomato 2.4 Cucumber 2 Yuca 0.5 Onion 4
Source: Prepared by ERM (2018) based on Bauer 2015 report
Contracts are verbal in most cases, although there may be some written contracts. Salaries are usually fixed per hour or per day and vary according to the type of activity conducted. Milking earns between 4,000-6,000 Lempiras (166 – 249 USD) per month while cleaning earns 3,000 – 4,000 Lempiras (125 – 166 USD). The chief worker (capataz) can get up to 7,000 lempiras (291 USD) per month. Working hours are reportedly 6am to 12pm for general tasks, and 4am to 12pm for milking. As discussed in Section 5.5.9, the minimum salary for the agriculture and livestock sector for 2018 is set at 6,000 lempiras
560
246
107 104
5121 16 10 2 2 2
1121
450
148 150
2241
1840 24
4 1 8
906
0
200
400
600
800
1000
1200
Hectares Jobs

ENVIRONMENTAL RESOURCES MANAGEMENT PAA PROJECT FINANCE A/S
5-150
(259 USD) per month for companies employing up to 10 employees. 1 Although beneficiary farms are not considered companies, the official minimum wage may be used as an indication that farm workers may be underpaid. Workers do not benefit from any formal medical coverage plan, although in some cases, the employer (farm owner) may cover some of the medical expenses including salary payment during the time the worker is not able to work.
Financial profile and cost structure
In addition to production levels, farm revenues are also determined by the farm’s cost structure. A USDA study on the dairy farming sector in the United States indicates that smaller dairy production farms with less than 200 cattle heads incur higher costs than larger farms (500 or more cattle heads) due to lower economies of scale. Specifically, the study shows that the production costs for the large farms were 18% below average costs on farms with 200-499 cows, and that costs were much higher for farms with fewer than 200 cows. 2 According to the study, “ownership costs” in particular for milking facilities and machinery, fall sharply as the farm size increases, which suggests economies of scale for larger farms who use their equipment and structures more intensively. Labour costs per litre of milk also falls sharply. Although the potential beneficiary farms considered for the present Project have fewer cattle numbers and cattle capacity, the study’s findings are still considered generally applicable. In terms of financing, farmers and producers are reportedly used to requesting loans, mainly to banks, which lend up to 65% of the property value. Small producers consulted during the 2018 field survey reported managing their loans properly although cases of mismanagement were recorded in the 1990s. According to the municipality of Olanchito, groups of farmers who had obtained credits in the context of an economic development project had poorly managed their loans and in some cases were forced to sell their lands and emigrate to the United States.
In addition to bank financing, institutional support is available in the form of farmers associations (cooperatives), rural funding organizations or savings banks (Cajas Rurales) and the SAGO and CRELs. Farmers associations and rural funding organizations are mostly addressed to farmers while SAGO and CRELs focus on livestock breeders and milk producers. Farmer associations can secure favourable credit conditions to their members through negotiation with the central bank for lower interest rate loans. These associations are also sometimes organized into savings banks (Cajas Rurales) through which members lend money among themselves using membership
1 http://www.trabajo.gob.hn/tabla-de-salario-minimo-2018/
2 USDA. Profits, Costs, and the Changing Structure of Dairy Farming. 2007. Accessed at: https://ageconsearch.umn.edu/bitstream/6704/2/er070047.pdf
ENVIRONMENTAL RESOURCES MANAGEMENT PAA PROJECT FINANCE A/S
5-151
fees. Some banks have also reportedly expressed interest to fund these savings banks at very low rates. At present, there are more than 80 Cajas Rurales in Olanchito, each of them, with more than 15 members. Cajas Rurales are governed by the National Agrarian Insitute (INA) and managed primarily by farmers associations rather than CRELs. However CRELs are reportedly starting to manage Cajas Rurales as well to secure loans for milk producers. In the livestock and milk production sector, members of the SAGO and CRELs fund themselves their activities or get credit primarily from commercial banks as stated above. However, in some cases the SAGO and the CRELs can act as guarantees for their members as banks tend to provide credit more easily if the farmer belongs to a CREL or the SAGO since it provides some assurance as to the correct management of the farm business. CRELs may also act as guarantee for the bank by paying the monthly interest directly to the bank and deducting from the producer’s revenues at month end. It has also been reported that in some cases the CREL may also lend money to members at 0% interest rates. Commerce and trade
Based on Olanchito’s Strategic Municipal Development Plan (2004-2020) households that are not involved in the agriculture sector tend to engage in commerce and trade-related activities. Individuals of indigenous background also reportedly engage in commerce to a limited extent, including the sale of artisanal artifacts created by women. The primary commerce activities in the Study Area include trading of agricultural inputs, grains, and cattle as well as the commercialization of agricultural produce, milk and milk-related products such as cheese and butter. Milk is mainly sold to national processing companies such as LEYDE, SULA, LECHOSA, SANPILES and to local artisanal producers. The sale of consumption goods and services, and the provision of loans and credits to the agriculture sector are also activities conducted in the Municipality. 1
In contrast commercial activity is reportedly weak in Arenal according to the Strategic Development Plan of 2013 and population census results.
1 Plan Estrategico de Desarrollo Municipal de Olanchito 2004-2020 (2003).

ENVIRONMENTAL RESOURCES MANAGEMENT PAA PROJECT FINANCE A/S
5-152
Figure 5.74 Shop in the hamlet of Coyoles (Olanchito municipality)
Source: ERM Field Visit, June 2018
Forest products and other natural resources
Medicinal plants
According to information presented in Section 5.3.2 on Flora, about 30 species of flora present in the Honduran Emerald Wildlife Refuge are used for medicinal purposes and as a source of wood. Since the Refuge is split across different areas in the Study Area, the existing flora in the Refuge considered representative of the overall flora in the Project Area, excluding cultivated agricultural fields and pastures, which do not present any specific biodiversity value in terms of flora. Based on feedback obtained from farmers and workers during the June 2018 Field survey, some medicinal plants are collected in forested areas but this practice is not widespread and has decreased over time. Most commonly used species include the “Zacate verde” (Pennisetum setaceum) used as a relaxant as well as the “sábila” (Aloe vera) used as a medicinal plant for its soothing properties. Fruits from the “guanabana” tree (Annona muricata) are reportedly used for hypertension, eucalypt (Eucalyptus sp.) for flu and cough, and “caulote” (Guazuma ulmifolia) for cattle loose stool. Camomile was also reportedly used to calm headaches. As stated above these medicinal plants occur primarily in shrubland and forested areas and not in the cultivated land and pasture areas in the Project Area.

ENVIRONMENTAL RESOURCES MANAGEMENT PAA PROJECT FINANCE A/S
5-153
Wood collection and lumbering
Lumbering activities are also present in the area, mostly for the construction of small fences and fuel wood for cooking and were observed during the Field survey in June 2018 as shown in Source: Field survey, 2018
Figure 5.49 below. Limited chopping of branches is most frequent as opposed to chopping entire trees, for which special permits are required and linked to tree plantations for wood production.
Figure 5.75 Lumbering and medicinal plants in the Project Area
Note: Left: medicinal plant (savila). Right: Wood processing facility near the road. Source: ERM Field survey (June 2018)
Bushmeat hunting
Based on feedback received during the June 2018 Field survey, bushmeat hunting is reportedly occasional and is associated with low-income households to complement sources of protein when necessary. The main source of meat remains farmed animals such as cows, pigs and chicken. Apiculture
Apiculture activities mostly takes place in Alto Aguan area. No apiculture was found during the field survey (June 2018) except in Los Horcones where one man reportedly has some bees, but production is limited.
5.5.10 Health
In Olanchito the most common types of diseases reported in 2005 were intestinal, respiratory, and hypertension. 1 Similarly in Arenal, the most common diseases reported in 2013 were respiratory infections (42.06%) and intestinal infections or diarrheas (16.48%). 2 Water-borne infections are the most common causes of intestinal infections and diarrheas. Based on official reports, 18% of all reported cases in Olanchito occurred among children under 5 years of age and 20% among children 1 Diagnostico institucional y financiero de Olanchito 2005
2 Arenal Strategic Municipal Development Plan (2013).

ENVIRONMENTAL RESOURCES MANAGEMENT PAA PROJECT FINANCE A/S
5-154
between 5 and 14, which indicates that children under 14 are the most vulnerable population. 1 In fact, 21% of children between 1 and 4 years old in Honduras die of diarrhea. 2 Figure 5.76 below presents the occurrences of Intestinal Parasites and Acute Diarrheic Syndrome (ADS) in the municipality of Olanchito for the first semester of 2016.
Figure 5.76 Occurance of water-related health cases diagnosed in the municipality of Olanchito in the first half of 2016
Source: Diagnostic and Analysis of the Rural Water and Sanitation Sector, Municipality of Olanchito, CONASA, 2016
As for vector-borne diseases in the Project Area, high occurrence of dengue fever was reported in Arenal (10.4% of reported cases), and occurrence of malaria was also reported in Olanchito, which according to the Olanchito Emergency Response and Prevention Plan of 2007, is located in an area at risk of inundations and epidemiological issues related to the presence of malaria.3 In fact, the WHO epidemiological profile of Honduras for 2016 shows that the Project Area is located in an area where malaria occurrence is of 1 to 10 cases per 1000 population. 4
1 CONASA (2016). Diagnostic and Analysis of the Rural Water and Sanitation Sector, Municipality of Olanchito,
2 CARE and Municipality of Olanchito (2009). Diagnóstico de las Condiciones del Sector Agua y Saneamiento en el Municipio de Olanchito
3 COPECO Honduras (2007). Plan de Prevención y Respuesta Casco Urbano Municipio de Olanchito, Yoro. Accessed at: http://cidbimena.desastres.hn/RIDH/pdf/doch0056/pdf/doch0056.pdf
4 WHO (2016). Honduras epidemiological profile. Accessed at: http://www.who.int/malaria/publications/country-profiles/profile_hnd_en.pdf?ua=1
1
4
17
7
2
2
3
11
0 5 10 15 20 25
50 Years and more
From 15 to 49 years
From 5 to 14 years
Less than 5 years
Percentage (%)
Intestinal parasitism Accute diarrheic syndrome

ENVIRONMENTAL RESOURCES MANAGEMENT PAA PROJECT FINANCE A/S
5-155
Figure 5.77 below shows the distribution of malaria cases in Honduras with respect to the Project Area.
Figure 5.77 Occurrence of malaria cases with respect to the Project Area in 2016
Source: WHO, 2016 Note: the blue circle indicates the approximate location of the Project Area.
This being said, based on feedback obtained in June 2018 from the head of the Environmental Health Programme at the Hospital of Olanchito, malaria and dengue breakouts have been successufully controlled in the Alto Aguan Valley wih very limited occurrence of malaria and dengue fever in the Municipality of Olanchito.
5.5.11 Education
National overview
In 2013, 11% of the population above 15 years old does not know how to read or write, with higher illiteracy rates in rural areas (17.2%).1 In the department of Yoro the illiteracy rate was of 22.1%, well above the national average and also higher than the average in rural areas.2 Project Area
In Olanchito and Arenal respectively 20.3% and 20.6% of the population is illiterate, resulting in an average of 20.4% in the Project Area, compared to 22.1% at the department level. In the Study Area, 57% of the population has received basic (elementary) education and 21% has completed secondary education. The majority (78%) of the population has therefore achieved primary or secondary education levels. 1 INE (2013). “XLIV Encuesta Permanente de Hogares de Propósitos Múltiples”, May 2013.
2 INE 2013 census.

ENVIRONMENTAL RESOURCES MANAGEMENT PAA PROJECT FINANCE A/S
5-156
Education level attainment for the population in Olanchito and Arenal is presented in Figure 5.78 below.
Figure 5.78 Education levels in Olanchito and Arenal (2013)
Source: INE 2013 adapted by ERM, 2018
5.5.12 Infrastructure and public services
Water supply and sanitation
Water sources, access and quality
Based on field survey information collected through interviews with the municipality of Olanchito, superficial water sources represent over 95% of drinking water sources for the population in the Study Area, while underground water from wells represent less than 5% of the drinking water consumption. Specifically, according to a 2016 CONASA report on Water and Sanitation in the Municipality of Olanchito, there are 82 water supply systems
19%
57%
21%
1% 2% 0%
Olanchito
None or basic reading and writing Pre‐basic and basic
Secondary Superior (Technical and non‐university)
University degree Post university
18%
60%
20%
0% 2% 0%
Arenal
None or basic reading and writing Pre‐basic and basic
Secondary Superior (Technical and non‐university)
University degree Post university

ENVIRONMENTAL RESOURCES MANAGEMENT PAA PROJECT FINANCE A/S
5-157
in operation that are supplied by 98% of surface sources driven by gravity whereas 2% are pumped from drilled wells. Water for domestic uses other than drinking are also mainly sourced from surface water bodies through the municipal water supply systems. Over 30% of the water supply systems are between 20 and 30 years old and require repairs or replacement. Figure 5.79 below provides an example of water extraction from surface water sources observed in the Study Area.
Figure 5.79 Extraction of water from surface water feature
Source: CINSA & PAA Project Finance Field survey (November 2017)
Superficial water for domestic consumption is sourced primarily from river affluents and watersheds located upstream of the main rivers and flowing down from the mountains. In Honduras, as of 2010, 7% of the forested areas that form the watersheds and water supply systems for human consumption are formally declared and protected to guarantee proper water supply and avoid contamination (i.e. no activities of any sort including agriculture, grazing, logging, construction, or exploitation of resources). According to the National Strategy on the Management of Micro basins in Honduras, 575 micro basins are declared as protected, including 31 in the Department of Yoro covering 26,224.03 ha. In the Project Area, the municipality of Olanchito has six (6) micro-basins associated to the Aguan River Basin as shown in Table 5.40 below. As for the municipality of El Arenal, based on field survey findings, two (2) micro catchments of surface water provide water to the municipality, except during the dry season when the catchments dry up and water is extracted from an emergency groundwater well instead. Figure 5.80 shows the location of declared micro basins in Honduras between 1987 and 2010 in relation to the Project Area. More information on the hydrology of the area in Section 5.2.7.

ENVIRONMENTAL RESOURCES MANAGEMENT PAA PROJECT FINANCE A/S
5-158
Table 5.40 Basins and micro basins in Olanchito municipality
Nº Basin and Sub-basin of Aguan River A Aguan Basin
Sub basins of Aguan River a Mame River b Nombre de Jesús y Calpules River c San Marcos, San Lorenzo and San Juan Rivers d Coyoles, Agalteca, Uchapa and Pimienta River e Uyuca River f Maloa, Jaguaca, Qda. Bálsamo, Tepusteca and Terrero River
Source: Diagnostic and Analysis of the Rural Water and Sanitation Sector, Municipality of Olanchito, CONASA, 2016
Figure 5.80 Location of declared microbasins in Honduras (1987 - 2010) vs. Project Area
Source: National Strategy for the Management of Basins in Honduras (“Estrategia Nacional de Manejo de Cuencas en Honduras”), ICF 2010. Adapted by ERM, 2018.
In terms of access to water, CONASA’s report indicates that as of November 2015, 88.29% of the population of Olanchito municipality had access to drinking water via the 82 water systems in place and administered by the 100 Water Boards (Juntas de Aguas), also referred to as water providers. In other words, 11.7% of the population of Olanchito municipality was not connected to the water supply systems, which translated into 2,968 households in 345 communities without access. Most of these communities are small settlements composed of 1 to 10 houses that rely on small springs, private wells, rivers, streams, etc. for water consumption. In Arenal, the Strategic Development Plan for 2013 reports that 65% of the population had access to water, with the

ENVIRONMENTAL RESOURCES MANAGEMENT PAA PROJECT FINANCE A/S
5-159
majority (61.5%) receiving water through the aqueducts of the municipal distribution network, and the remaining few relying on private wells (2.25%) and water from the water streams (1.27%).
Table 5.41 Water supply system coverage in Olanchito
With Access to Service
Without Access to service
Total
Settlements 105 345 450 Households 22,377 2,968 25,345
Source: Diagnostic and Analysis of the Rural Water and Sanitation Sector, Municipality of Olanchito, CONASA, 2016
According to the 2016 CONASA report, water quality measurements according to two chemical and bacteriological parameters have shown that only about 10% of the 82 water systems of Olanchito municipality provide water that is safe for human consumption. Based on feedback collected during the June 2018 field survey through interviews with the SAGO and with farmers and milk producers in the area, the use of chemical herbicides, pesticides, and fertilizers is punctual and usually limited to once or twice a year in relatively small quantities. The use of pesticides is also regulated by the municipality with regular compliance checks, which reduces the risk of drainage and related surface water contamination. More information on the use of chemical products in the agricultural sector in Section 5.2.6 and Section 5.2.7. Rather, the sanitation and wastewater management system poses a greater risk of organic water contamination due to potential wastewater leakages from sceptic tanks. This being said, the presence of fish in the surface waters observed during the field survey indicate that the water is still in good conditions (see Section 5.2.7). The methods used to purify drinking water in the Study Area consist in water filtration and adding chlorine. This basic approach is widely used throughout the Study Area in most of the settlements with very few exceptions. Sanitation and wastewater management
Sanitation coverage in Olanchito municipality is 88%, while 12% of the rural population has no access to any form of sanitation. The preferred sanitation system is the latrine with hydraulic lock (60%), followed by the simple pit present in 17% of homes, and the septic tank (11% of homes). In Arenal, coverage in excreta disposal is 93.84%, distributed in sewer service having 39.88% and 53.96% with latrines. 1 The most common latrine problems include the risk of latrine or pit sinking, pit overflow, deterioration of the house/structure enclosing the latrine or pit, and poor conditions of the pit latrine slab or platform. 1 Plan Estrategico de Desarrollo Municipal de Arenal (2013)

ENVIRONMENTAL RESOURCES MANAGEMENT PAA PROJECT FINANCE A/S
5-160
Water and sanitation governance
At the municipality level, the municipal government has the key role of overseeing and managing the water and sanitation sectors for the municipality through the Municipal Water and Sanitation Commission or “Comisión Municipal de Agua y Saneamiento” (COMAS). Water management at the municipal level is governed by the Law of Municipalities and the Municipal Plan of Taxes and Fees (Plan de Arbitrios Municipal). The plan specifies the taxes and fees that municipality members are required to pay for connection to the various networks and services provided by the municipality, including the drinking water. 1 At the community level Water Administration Boards or “Juntas Administradoras de Agua (JAAS)” operate the water supply systems. According to the CONASA 2016 report, there are 100 Water Boards in Olanchito Municipality as of November 2015, meaning that 5 of the communities with access to the municipality water supply systems do not have a Water Board. Water Boards are usually composed of 5 to 7 members selected among an assembly of beneficiaries or water users for a period of 1 to 2 years. Membership and services provided by the Boards are voluntary and to the community’s benefit. The JAAS are in charge of all aspects related to water service provision, administration, operation, maintenance, commercialization, water treatment, and client service among others. Water boards are also faced with a number of challenges, which have to do mainly with limited capacity and skills in the administration, operation and maintenance of water systems, the absence of studies and initiatives to improve or expand the systems and water quality, as well as the low service fees they charge making them financially unsustainable. Water rights and permits
Based on discussions with representatives of the Municipality of Olanchito and Arenal including the Environmental Unit directors, no water permits are required for the use of surface water as these water sources are owned and managed by the municipalities as per the Municipal Plan for Taxes and Fees. Restrictions are in place regarding the use of natural resources in areas formally declared as part of water supply systems (such as buffer areas of various sizes) in accordance with requirements of the forestry law. For groundwater sources, for the drilling of wells, the municipalities will grant appropriate permits and licenses for irrigation systems not exceeding a total of 10 ha as stipulated in Article 67 of General Water Law described in Chapter 2. In the case of irrigators who use infrastructure and irrigation volumes greater than 10 ha, Art.68 of the Water Law, stipulates that it is the national Water Authority that grants rights of use, through concession
1 Municipal Plan of Taxes and Fees of Olanchito (2016). Plan de Arbitrios Municipal de Olanchito.

ENVIRONMENTAL RESOURCES MANAGEMENT PAA PROJECT FINANCE A/S
5-161
agreements based on the precepts of the Law on Concessions and applicable administrative laws (Chapter 2). In the case of well drillings, the permit granting process is governed by Article 117 of the Municipal Plan of Taxes and Fees (Plan de Arbitrios Municipal) under which the municipality is responsible for granting the permits. The application is reviewed at the Municipal Corporation meeting after which a field investigation is conducted by the Environmental Unit (Unidad de Medio Ambiente or UMA) who is then responsible for approving or rejecting the application. For permits that are granted, the applicant is required to pay specific fees including the following: 1
Environmental fee of 400 Lempiras (17 USD) for domestic use. Well drilling fee of 2,000 Lempiras (83 USD) Well opening permit fee of 1,000 Lempiras (42 USD) for domestic use. Use of groundwater resources fee of 500 Lempiras (21 USD) paid to the
municipality. The non-compliance fine for the drilling of a well amounts to 5,000 Lempiras (208 USD) per well. However the SAGO reported that application of the law is limited in practice. Irrigation networks
In the Project Area, surface water is commonly used for irrigation purposes, while the use of groundwater is marginal. Based on feedback obtained from the SAGO and CRELs, irrigation from surface water sources is mostly used in the rainy season. In contrast groundwater wells are used to a lesser extent and mainly during the dry season, in the form of shallow dug wells in locations that are near the river, or as drilled wells if located further away from the river. As such, although a few irrigation systems are present in the area (mostly from surface water sources), the lack of irrigation in the dry season remains a major issue and the primary cause of the reduction in the production of forage crops and milk. Additional information is presented in Section 5.2.7 and Section 5.2.8. Note that the community water supply outlets for domestic and potable use are located upstream of irrigation outlets and of the agricultural production area. Electricity
Access to electricity at the national level is predominant in urban areas with 99% of coverage in 2013, although electricity cuts are frequent.2 In rural areas electricity coverage is of 75% combined with 16% of alternative energy sources including candles, gas lamps, and fuel wood. In Arenal specifically, electricity
1 1 Municipal Plan of Taxes and Fees of Olanchito (2016). Plan de Arbitrios Municipal de Olanchito.
2 INE (2013). “XLIV Encuesta Permanente de Hogares de Propósitos Múltiples”, May 2013.
ENVIRONMENTAL RESOURCES MANAGEMENT PAA PROJECT FINANCE A/S
5-162
coverage is of 77.2% according to the Strategic Development Plan for 2013. No specific data was available for Olanchito. Waste
Based on the Municipal Taxation Plans for the municipalities of Olanchito and Arenal, waste collection and disposal services are present in both municipalities and cover domestic users and non-domestic users including commercial and industrial.1 Waste collected is taken to the municipal landfill where it is burned. The collection and disposal of toxic or contaminated waste from hospitals, chemical plants, or similar is excluded from this service. As such, industries that generate hazardous wastes are responsible for establishing their own system of hazardous waste disposal with approval from the municipality. Note however that the service mostly covers the urban area of Olanchito with limited coverage in rural areas. In fact, according to an Emergency Prevention and Response Plan for Olanchito, 35% of the neighbourhoods in the urban area did not have access to the waste collection service in 2007.2 In the rural area coverage is even more limited or non-existent. In the absence of a dedicated landfill or waste disposal location, residents either berry or burn their waste themselves. Road transport
In the last 10 years, Honduras has managed to establish a paved road network with reasonable levels of service. However, the distribution throughout the territory is not uniform, particularly in the rural area, where improvement of the road network is most needed. The state of the rural network becomes critical during the rainy season, in particular in June and September which are the months with the heaviest rainfall reducing accessibility, limiting the development of productive activities or access to basic social services, and increasing transport costs and travel times. The road leading to Olanchito from the port of San Pedro Sula where the kits will be delivered is approximately 320 km long and is mostly composed of national roads and primary roads connecting the municipalities together. The first portion of the road from San Pedro Sula to El Progreso is part of the national road network and is paved and well-maintained. The remaining section to Olanchito through the municipalities of Yoro and Jocon are municipal roads which includes both paved and unpaved roads. The road infrastructure in the western portion of the Project Area up to the hamlet of San Juan is less developed and is mainly unpaved dirt roads, while the middle and eastern portion of the Project Area from San Jeronimo up to Olanchito is more developed and roads are mostly paved and relatively well maintained.
1 Plan de Arbitrios Municipal de Olanchito (2016). Plan de Arbitrios Municipal de Arenal (2016-2018).
2 CODEM (2007), Plan de Prevención y Respuesta Casco Urbano Municipio de Olanchito, Yoro.

ENVIRONMENTAL RESOURCES MANAGEMENT PAA PROJECT FINANCE A/S
5-163
Figure 5.81 National road network from San Pedro Sula to El Progreso
Note: Toll along National Road CA13 between San Pedro Sula and El Progreso, outside the Project Area. Source: Google Earth, April 2017.
Figure 5.82 Municipal roads from Yoro to Olanchito
Note: Top pictures: unpaved road and river crossing near the hamlet of Las Delicias in the most eastern portion of the Project Area. Bottom picture: paved road near Palo Verde hamlet in the middle / eastern portion of the Project Area. Source: Google Earth, January 2014 and August 2017.

ENVIRONMENTAL RESOURCES MANAGEMENT PAA PROJECT FINANCE A/S
5-164
As highlighted in the municipal development plans of Olanchito and Arenal, internal access roads and dirt roads tend to lack proper maintenance and appropriate paving and present deficiencies in terms of signage, landslides, and potholes. The road network in the area is also susceptible to flooding in the rainy season especially in the valley along the river. Based on feedback from the municipality of Olanchito collected during the June 2018 field survey, improvements to the road network are planned, including the section between Yoro and Olanchito of the road leading to San Pedro Sula, as well as some sections of the road between Olanchito and Tegucigalpa. The road network in the Project Area is presented in Figure 5.83 below.
Figure 5.83 Road and transport infrastructure in the Project Area
Source: Prepared by ERM based on ICF, 2013
Access to healthcare
The most important centre is the area’s public hospital located in Olanchito’s urban centre, which provides health services to other municipalities in the department of Yoro, including Arenal. Olanchito and Arenal municipalities also count with additional health centres of the following categories:
Dental Medical Centre (Centros de Salud Médico Odontológico or CESAMO)
Rural Health Centre (Centros de Salud Rural or CESAR) Health centres with a permanent doctor Health centres only staffed with medical assistants

ENVIRONMENTAL RESOURCES MANAGEMENT PAA PROJECT FINANCE A/S
5-165
Table 5.42 below presents the health centres in Olanchito by category as of 2004.
Table 5.42 Health centres in Olanchito by category
CESAMO Health Centers with Permanent Doctors CESAMO Olanchito CESAMO El Carril (does not has an
odontology service currently)
Juncal Tepusteca
CESAR Health Center with assistants only San Lorenzo San José Trojas Aldea El Ocote Amenia Carbajales 24 de Mayor (City Center)
La HIcaca El Nace Santa Bábara El Terrero San Francisco
Source: Olanchito plan de desarrollo 2004-2020
In addition, according to a 2005 Institutional and Financial Diagnostic Report for Olanchito, seven (7) permanent doctors were present in the urban and rural areas of the municipality.1 Considering a total population of 84,725 as per the 2001 census, this translates into a very low doctor per capita ratio of 0.083 out of 1,000. More recent information collected during the field survey in June 2018 indicates that there are about 12 Rural Health Centres (CESAR) in total in the municipality of Olanchito located in hamlets with a population over 2,000 inhabitants. Private clinics are also present in Olanchito and provide general healthcare services. As for Arenal, in line with information presented in the 2013 Municipal Development Plan, field survey interviews have confirmed that the municipality has two (2) CESARs and one (1) CESAMO.2 The population of Arenal also has access to the Hospital located in Olanchito urban centre. One of the health centre is located in the urban centre of Arenal while the remaining two are in the rural areas. Access to education
Based on data obtained through the official Education Statistics System online (Sistema de Estadística Educativa) Olanchito and Arenal have approximately 300 and 40 education establishments respectively. These centres are summarized in Table 5.43 below.
1 Institutional and Financial Diagnostic of the Municipality of Olanchito, 2005.
2 Arenal Municipality Strategic Development Plan, July 2013.

ENVIRONMENTAL RESOURCES MANAGEMENT PAA PROJECT FINANCE A/S
5-166
Table 5.43 Education facilities per Municipality (2017)
Education Centres Olanchito Arenal Pre-basic 146 9 Básic 50 4 Secondary (Medio) 18 1 Pre-basic Community Education Centers (Centros Comunitarios de Educación Pre-Basica or CCEPREB)
83 25
Superior (Adulto) 1 1 University 1 0 TOTAL 299 40
Source: Education Statistics System (Sistema de Estadística Educativa). 2017
The Regional University Centre of the Aguan Valley (Centro Universitario Regional del Valle de Aguán or CURVA) belonging to the Autonomous University of Honduras is also located in Olanchito’s urban centre. CURVA specialises in agroindustry, dairy processing and livestock production, and microfinance.
5.5.13 Gender, security and human rights
This section describes the gender, security and Human Rights context in the Study Area. The Human Rights context in relation to working conditions and labour rights including child labour and forced labour are discussed in Section 5.5.8. Conflicts and Human Rights abuses related to land rights are also addressed in Section 5.5.7. Gender context
According to the Law on Equal Opportunities adopted in 2000 by the Government of Honduras, the representation of women in elected positions should be of at least 30%. In the context of this Law, the SAG has implemented the Gender Equality Policy (Politica de Equidad de Género) in the agricultural sector. Awareness and institutional capacity building campaigns were carried out to disseminate gender policies among the different management and technical levels of the SAG and to coordinate the issue with civil society stakeholders.1 In addition, based on CINSA & PAA Project Finance’s preliminary assessment of 2017, The SAG has implemented productive development programmes and services for households in rural areas across the country that that are engaged in agriculture, with special emphasis on the participation of women who are household heads. Despite these efforts, the participation of women in decision-making and their representation in elected positions remains low. In fact, in Olanchito, women
1 SAG website. Accessed at: http://sag.gob.hn/acerca-de-la-sag/politicas/

ENVIRONMENTAL RESOURCES MANAGEMENT PAA PROJECT FINANCE A/S
5-167
only represent 25% of Water Boards members in 2016 which is still below the 30%.1 Similarly, women’s representation in the CRELs is reportedly around 10%. Women’s representation in the livestock breeding and milk production sector is slightly higher with 15% of potential beneficiaries being women (see Section 5.5.3). In the Project Area, the role of women as highlighted in the focus group discussion with small producers, is still mainly limited to the household. Some women are also employed in the large-scale banana plantations where they are involved in seeding and in packaging activities. No women are reportedly employed as farm labour. Security context
Honduras together with El Salvador and Guatemala present the highest crime and violence rates in Latin America. The main causes that lie behind the violence in the region are drug trafficking, youth violence, gangs and the availability of firearms and weak justice institutions.2 The rate of homicides in Honduras increased by 55.8 points from 30.7 out of 100,000 inhabitants in 2004 to 86.5 out of 100,000 in 2011.3 Homicide rates in the Study Area for 2016 are shown in the Table 5.44 below.
Table 5.44 Homicide rates per 100,000 in Olanchito and Arenal as of December 2016
Cases Homicide Rate Olanchito municipality 64 58 Arenal municipality 4 66.9 Olachito and Arenal (combined) 68 62 Department (Yoro) 420 70.5 National Total 5,150 59.1
Source: National Bolletin of the Violence Observatory (Observatorio de la Violencia), National Autonomous University of Honduras, (December 2016). Modified by ERM (2018).
Although, homicide rates for Olanchito and Arenal are below the department rate, compared to the national level, the average rate of 62 per 100,000 for both municipalities is higher than the national rate. In terms of security arrangements, security is managed by the police forces based out of six police stations with a total of 25 agents and 3 patrol vehicles. Citizen Security Committees (Comités de Seguridad Ciudadana) have been created at the community levels to support the police posts in patrolling and maintaining public order.4
1 CONASA (2016), Diagnóstico y Análisis del Sector Agua y Saneamiento Rural, Municipio de Olanchito.
2 Crime and Violence in Central America. A Challenge for Development. 2011. World Bank. LAC. Accessed at: http://siteresources.worldbank.org/INTLAC/Resources 3 Bulletin of the Observatory of Violence UNAH. January to December 2011 44 Diagnostico Institucional y Financiero, Municipalidad de Olanchito, Septiembre 2005.

ENVIRONMENTAL RESOURCES MANAGEMENT PAA PROJECT FINANCE A/S
5-168
Based on feedback collected from potential beneficiaries and the SAGO during the field survey in June 2018, farmers and livestock breeders do not employ any security for their farms, and no cases of abuse by law enforcement were reported in the Study Area. In addition, as stated in Chapter 3, no arrangement between the Project and police forces or security providers is planned.
5.5.14 Archaeological and cultural heritage
Based on the preliminary assessment conducted by CINSA and PAA Project Finance in 2017, the national Forestry Conservation Institute (Instituto de Conservación y Desarrollo Forestal or ICF) did not report the existence of any archaeological protected sites in the Project Area. Nevertheless, considering the high potential of the area, a high level archaeological and cultural heritage baseline overview has been included in this baseline chapter. Note that no cultural heritage specific data was collected during the field survey. Most of the information presented in this section is based on “The archaeology of the Mosquitia” by Chris Begley.1 Honduras dating periods
Period I (up to 8000 BC): The earliest period with traces of human activity known from Central America. Only the site of Cueva del Gigante has yielded dates from this period.
Period II (8000-4000 BC): This period, the equivalent to the Mesoamerican early and middle Archaic, is when the Cueva del Gigante shows plant remains that include squashes and beans.
Period III (4000-1000 BC): Pollen cores from the Copan Valley and Lake Yojoa suggest the landscape changed due to the cultivation of maize for the first time. At Copan, Los Naranjos, and Puerto Escondido, the earliest remains of villages known in Honduras have been documented.
Early Period IV (1000-300 BC): This period sees villages emerge across Honduras along with a distinctive material culture. Figurines in the ‘Playa de los Muertos’ style emerge in the lower Ulua valley, while burial shrines in caves are found in the Copan, Cuyamel and Aguan valleys. There are clear connections with the Olmec culture on the Mexican Gulf Coast suggesting long distance trading connections. The earliest form of monumental architecture is seen in the form of tall broad earthen platforms (as seen at Los Naranjos and Yarumela).
Late Period IV (300 BC- AD 500): Corresponding to the Maya Late Preclassic and Early Classic, Usulutan resist pottery decoration emerges concentrated in western Honduras and El Salvador. Many settlement sites from this period are found under later period sites demonstrating continuous occupation. In places earthen platforms were also built but smaller than before(Rio Pelo). Towards the end of
1 www.archaeomosquitia.wordpress.com
ENVIRONMENTAL RESOURCES MANAGEMENT PAA PROJECT FINANCE A/S
5-169
this period, Copan developed its distinctive style of public architecture and monuments.
Period V (AD 500-1000): Corresponding to the Maya Middle Classic, Late Classic, and Terminal Classic, this is when most houses were built on raised stone platforms. Ballcourts are found in sites from Copan (to the west) to Mosquitia to the east. The people made and used a variety of painted polychrome pots, including Chamelecon Polychrome, Ulua Polychrome, Sulaco Polychrome, Cancique Polychrome, and more. In the lower Ulua Valley, Ulua Marble Vases were produced from local marble sources, transported to Uaxactun in the north and Costa Rica in the south. In Salitron Viejo in the Sulaco Valley, local production of jade took place, traded into Yucatan and down to Costa Rica. The period is when Copan’s rulers reached its height of power. In each area where extensive settlement pattern studies have taken place, one site seems to be larger and tries to exercise more power in the last part of this period: La Sierra in the Naco Valley; Cerro Palenque in the lower Ulua Valley; Tenampua in the Comayagua Valley; and Salitron Viejo in the Sulaco Valley.
Period VI (AD 1000-1550): This corresponds to the Myan Postclassic period. At the beginning many existing sites decline in size or are abandoned. Newly establishes sites are harder to identify. In eastern Honduras, this is the period when new incised kinds of pottery, the Cocal style, is found throughout. Sites are easily identified based on this new pottery. In western Honduras, people stopped using polychrome painted pottery for everyday use, so two new polychrome styles – Las Vegas Polychrome and Bay Islands Polychrome– are rare finds, usually seen in tombs or caches. Unslipped and red-slipped everyday pottery looks a lot like that used in earlier periods. New technology (copper metal working) and imported ceramics (Tohil Plumbate, from Mexico-Guatemala) are seen from this period. Towards the end of the fourteenth century, new painted pottery, red on white slipped or red and black on white slipped, is found in a few sites that were still occupied when the first Spanish arrived in Honduras. Spanish colonial control begins to be exerted in the 1520s, and by the 1550s has changed conditions across much of the country.
Overview of the archaeology of Eastern Honduras
Human occupation in eastern Honduras can be traced back 3,000 years, when linguistic evidence suggests Macro-Chibchan speakers from Lower Central America or northern South America migrated northward (Hasemann 1991: 50). The oldest known human remains in eastern Honduras come from burial sites within caves. Some of the earliest evidence of human occupation in Honduras comes from the Aguan Valley, such as the Cuyamel Caves, which are located in the hills that separate Trujillo from the Aguan River, towards the eastern end of the Aguan Valley (outside the Project Area). The Cuyamel caves in the Aguan Valley have been dated to 1000-300 BC (Period IV), while the Talgua Cave,

ENVIRONMENTAL RESOURCES MANAGEMENT PAA PROJECT FINANCE A/S
5-170
near Catacamas, have been dated to 980-800 BC (Brady et al. 1995: 39). These may represent the remains of the first humans who migrated into the area. Recent research suggests these initial populations subsisted in root-cropping rather than maize (Brady et al. 1995). Pottery recovered from the Cuyamel Caves, show decorative motifs suggestive of contact with the Olmec, (Healy 1974, 1984a). The Cuyamel and Talgua Caves may represent two distinct populations. No open-air sites dating to the same period have been identified. The first settlements date to around AD 300 (Period IV), from the Selin Farm site (Healy 1984a: 136). The emergence of many open-air settlement sites may indicate a substantial increase in population. These early sites appear to be residential with no civic-ceremonial architecture (Begley). The earliest evidence of complex societies occurs between AD 250 – 600, as is evidenced from sites at Altas de Subirana and Wankybila on the Patuca river. Pottery types, vertical strap handles and manatee lugs, are common at the enormous sites of Dos Quebradas and San Marcos near Catacamas, which reportedly contain mounds over 10 meters in height. The earliest evidence of complexity shows some element of contact with Mesoamerica, evident in the formal, orthogonal site plans and in imported materials (obsidian). This early interaction with northern groups focuses on elite paraphernalia and symbols (jade, obsidian) and templates for public buildings (Begley). Maize first appears around AD 600 to 900, dated through association with ceramics found from a cave near the Talgua Village. It is unsure as to what extant this changed the local diet. Stable isotope analysis from an individual from a Period V (AD 500-1000) context in the Talgua cave showed little maize in the diet (Brady et al. 1998). At the start of Period VI a change appears in the archaeological record, which may be related to the Maya ‘collapse’. The eastern Honduras cultures began to show less connections to the north, and began to resemble those from the south. Large public constructions were organized in ways not seen elsewhere. It has been suggested that this period represents the height of civilisation for Eastern Honduras. Most large sites such as Rio Claro are primarily Period VI but areas of eastern Honduras, (such as the lower Paulaya drainage) remain temporally undefined. Many of the large sites in eastern Honduras are associated with an elaborate stone carving tradition which includes large, intricately-carved metates (grinding stones for maize). Several sites in eastern Honduras with large quantities of metates have a Period V component and some, like the Upper Group of Marañones, have no Period VI component. The tradition of elaborate stoneworking continued in eastern Honduras after its decline in the south at the end of Period V (AD 800-1000 – Epstein, 1957 and Healy 1983, 1984a).

ENVIRONMENTAL RESOURCES MANAGEMENT PAA PROJECT FINANCE A/S
5-171
There appears to have been a widespread demographic collapse of the population in Honduras during Period VI, affecting western and central Honduras (Healy 1984a; Hirth 1989; Messenger 1991). Eastern Honduran populations do not show this collapse, however. Many of the larger sites appear to have been abandoned by the time the Spanish arrived. However early Spanish chroniclers reported large communities that declined in less than 100 years. No archaeological site has yet been identified with these large villages described by the Spanish, although there have been suggestions that the site of Rio Claro in the Aguan Valley may be the village of Chapagua, the centre of one recorded civilisation (Healy 1984a: 153). One possible reason for the lack of late Period VI sites may involve a change in architectural style. It is possible construction of platform mounds declined. Sites in the vicinity of Olanchito may be late Period VI (AD 1000-1550) but contain little visible architecture, despite large artifact scatters (Begley). A non-mounded site near Trujillo may be one of the large settlements mentioned by conquistador Cortes (Begley). Architecture
Eastern Honduras sites typically consist of rectangular plazas, rectangular structures, and ball courts. This is similar to sites in Mesoamerica. Further south, towards south-eastern Nicaragua and into Costa Rica, rectangular mounds are replaced by round ones, and the orthogonal, Mesoamerican planning is not found. The architecture of Eastern Honduras is distinctive. Most mounds are either cobble covered or have no stone at all. Some have vertical retaining walls, but always of unmodified cobbles (almost always river cobbles). Preservation is very good, until forest cover is cleared and agriculture quickly erode the features (Begley). As stated above, known sites in the wider area of Eastern Honduras include the Cuyamel caves (where evidence for the earliest humans in Honduras has been found) and Rio Claro to the east. Many archaeological sites in eastern Honduras are currently inhabited. It is common to find stone sculptures in modern villages, often incorporated into the architecture. Archaeological sites within the Project Area
The Project Area contains a number of known archaeological sites, such as Puerto Escondido, located south of Olanchito town. It was occupied from 900BC to 1000AD and the buildings found appear to have been large farmsteads rather than substantial public buildings. In fact, many early sites are under or beside existing settlements, such as at Olanchito as described previously.

ENVIRONMENTAL RESOURCES MANAGEMENT PAA PROJECT FINANCE A/S
5-172
As such, the area can be regarded as having a high archaeological potential. Archaeological work in Eastern Honduras has shown that sites (houses rather than towns) and artefacts (pottery, carved stone) are often found in abundance. In addition, as farming, particularly of Maize, goes back to AD600, the fields would have seen human interventions since then.

ENVIRONMENTAL RESOURCES MANAGEMENT PAA PROJECT FINANCE A/S
6-I
CONTENTS
6 IMPACT ASSESSMENT METHODOLOGY 6-1
6.1 INTRODUCTION 6-16.2 IMPACT ASSESSMENT METHODOLOGY 6-16.2.1 Identification and characterisation of impacts 6-16.2.2 Receptor sensitivity characterisation 6-36.2.3 Impact significance assessment 6-36.2.4 Unplanned events significance assessment 6-46.2.5 Identification of Mitigation and Enhancement Measures 6-66.3 IMPACT IDENTIFICATION MATRIX 6-6
LIST OF TABLES
Table 6.1 Impact Definitions 6-2Table 6.2 Criteria for magnitude of impacts 6-2Table 6.3 Sensitivity Value of Receptors 6-3Table 6.4 Probability scale for an unplanned events 6-4Table 6.5 Consequence scale for an unplanned event 6-5Table 6.6 Description of impact risk significance and required action for unplanned
events 6-5Table 6.7 Justification of non-existent and non-significant impacts 6-9
LIST OF FIGURES
Figure 6.1 Impact risk significance matrix 6-5Figure 6.2 Mitigation Hierarchy 6-6Figure 6.3 Impact Matrix Identification 6-8
LIST OF BOXES
Box 6.1 ERM Impact Assessment Approach 6-1

ENVIRONMENTAL RESOURCES MANAGEMENT PAA PROJECT FINANCE A/S
6-1
6 IMPACT ASSESSMENT METHODOLOGY
6.1 INTRODUCTION
This chapter presents the methodology for assessing potential environmental, social and health impacts that may result from both routine and non-routine (unplanned events) Project activities throughout its lifecycle (pre-operation phase, operation phase and abandonment phase).
6.2 IMPACT ASSESSMENT METHODOLOGY
The methodology employed in the environmental, social and health impact assessment was prepared in accordance with the ERM Impact Assessment Standard v1.1 (2012). Box 6.1 presents the ERM Impact Assessment Approach which is aligned with international best practices.
Box 6.1 ERM Impact Assessment Approach
6.2.1 Identification and characterisation of impacts
The first step in impact identification is to identify the various activities associated with the project, as well as the environmental, social and health resources and receptors. The relevant project activities and baseline information have been collated and are presented in Chapter ¡Error! No se
A project can have potential significant impacts on a wide range of environmental, social and health receptors. The importance or significance of these impacts depends upon a number of factors, principally the level of magnitude of the impact and secondly the sensitivity of a receptor to be affected by the impact. It is therefore important to:
Identify those processes or actions which will lead to an impact (i.e., a change in the environment) and evaluate the magnitude of this change; and,
Identify any environmental receptors upon which the impacts may act and
evaluate their sensitivity.
The significance of the impact is determined by comparing, wherever possible, against accepted company, national or international standards. If no standards are available then it is necessary to develop project-specific limits, based on guidance or experience, as necessary. Such standards or limits are referred to as the significance threshold. Wherever possible the significance thresholds are based on a measurable value and compared with a legal, policy or guideline value. If the size and type of the impact is greater than the significance threshold, this is then termed a significant impact, which is further defined as high, moderate or low. A significant impact may be broadly defined as one which should be brought to the attention of those involved in the decision-making process and therefore any significant impacts identified must be reported in the ESIA Report and, wherever possible, avoided or mitigated to reduce them to an acceptable level.

ENVIRONMENTAL RESOURCES MANAGEMENT PAA PROJECT FINANCE A/S
6-2
encuentra el origen de la referencia.and Chapter ¡Error! No se encuentra el origen de la referencia. respectively. The following exercise serves to screen potential impacts. An ‘impact identification’ matrix identifies and scopes the predicted interactions between project activities, environmental and socioeconomic resources, and receptors. The identification matrix is presented in Section 6.3 below. Once the screening exercise is complete and the potential preliminary impacts have been identified, the next step in the impact assessment is to define the characteristics of each impact. ERM’s impact assessment uses a set of standards that are detailed in Table 6.1.
Table 6.1 Impact Definitions
Characteristics Definition Designation Type A descriptor indicating the
relationship of the impact to the project (in terms of cause and effect)
Direct/Indirect/Induced
Extent The “reach” of the impact (e.g., confined to a small area around the project, or projected for several kilometres)
Local/Regional/International
Duration The time period over which a resource or receptor will be affected
Temporary/Short-term/ Long-term/Permanent
Frequency A measure of the constancy or periodicity of the impact
(no fixed designations; intended to be a numerical value)
The following criteria are used in the current assessment in order to assign a consequence/magnitude to potential impacts.
Table 6.2 Criteria for magnitude of impacts
Magnitude Description of Adverse Consequence
Description of Beneficial Consequence
Large Loss of resource and/or quality and integrity; severe damage to key characteristics, features or elements.
Large scale or major improvement of resource quality; extensive restoration or enhancement; major improvement of attribute quality.
Medium Significant impact on the resource, but not adversely affecting the integrity; partial loss of/damage to key characteristics, features or elements.
Benefit to, or addition of, key characteristics, features or elements; improvement of attribute quality.
Small Some measurable change in quality or vulnerability; minor loss of, or alteration to, one or more key characteristics, features or elements.
Minor benefit to, or addition of, one or more key characteristics, features or elements; some beneficial impact on an attribute or a reduced risk of negative impact occurring.
Negligible Very minor loss or detrimental alteration to one or more characteristics, features or elements
Very minor benefit to or positive addition of one or more characteristics, features or elements

ENVIRONMENTAL RESOURCES MANAGEMENT PAA PROJECT FINANCE A/S
6-3
6.2.2 Receptor sensitivity characterisation
Sensitive receptors can be defined as:
elements of the environment that are of value to the functioning of natural or human systems (i.e., areas or elements of ecological, landscape or heritage value, soil and sediment, air and water bodies);
human receptors, such as people (i.e., users of dwellings, places of recreation or worship, places of employment and community facilities), and human systems (e.g., the employment market).
The environmental value (or sensitivity) of the receptors identified is defined using the criteria in Table 6.3.
Table 6.3 Sensitivity Value of Receptors
Value / Sensitivity Description of Value
International/
High Sensitivity
Highly important and rare on an international scale with limited potential for substitution (e.g., international fresh water aquifer).
National/
Medium sensitivity
Highly important and rare on a national scale with limited potential for substitution (e.g., residential receptor).
Local/
Low sensitivity
Low or medium importance and rarity, local scale.
6.2.3 Impact significance assessment
Once the magnitude of impact and the sensitivity of the resource/receptor have been characterised, significance is assigned for each impact. The current assessment uses a matrix to determine the significance of an impact which is presented in ¡Error! No se encuentra el origen de la referencia.. Significance is therefore a function of the value or sensitivity of the receptor being considered, as defined in Table 6.3 and in Table 6.2. As mentioned in Chapter 4, since 2016, various meetings and field survey activities have been undertaken in the Project Area in order to identify and anticipate potential effects on the environmental and social receptors as a result of the planned Project activities. The observations and results of these meetings and field survey activities have been summarised throughout Chapter 4 and Chapter 5. Furthermore, impact prediction and evaluation have taken into account any embedded controls (i.e., physical or procedural controls that are already planned as part of the Project design, regardless of the results of the impact assessment process). An example of an embedded control is for example the inclusion of water meters in the irrigation system to ensure water extraction can be monitored.

ENVIRONMENTAL RESOURCES MANAGEMENT PAA PROJECT FINANCE A/S
6-4
Figure 6.1 Impact significance matrix
6.2.4 Unplanned events significance assessment
Impacts resulting from unplanned events are different to impacts that would reasonably be predicted to occur in the normal course of venting and decommissioning activities. The methodology for evaluating impacts resulting from unplanned events is slightly different and the impact magnitude includes the likelihood of the event occurring. The impacts / risks will be assessed as follows:
1. Identification of potential risks: The identification of risks will be based on potential Source-Pathway-Receptor (S-P-R) linkages.
2. Estimation of probability of the risk being realised (or event happening): Likelihood is determined based on professional judgement, as well as quantitative information (statistical frequency) where available.
3. Identification of consequences. 4. Estimation of the impact risk significance.
Table 6.4 Probability scale for an unplanned events
Likelihood Descriptor Comment/clarification High Repeated occurrences
expected Very likely to occur in the short term and almost certain to occur over the long term. Repeated occurrences expected based on experience in comparable industries. Where no comparable industry experience is available, a cautious approach will typically be adopted to allow for uncertainty.
Medium Can be expected to occur several times per year
An event is possible, but not inevitable, in the short term, and likely over the long term.
Low Infrequent occurrence An occurrence is by no means certain in the long term and less likely in the shorter term. May have been reported in the past in other similar industries.
Very low Rarely encountered, never reported, or highly unlikely
It is improbable that an event would occur even in the long term. Very few, if any, industry examples are available.
Low Medium High
Negligible Negligible Negligible Negligible
Small Negligible Minor Moderate
Medium Minor Moderate Major
Large Moderate Major MajorMag
nitu
de o
f
Impa
ct
Sensitivity / Vulnerability / Importance
of Resource/ Receptor
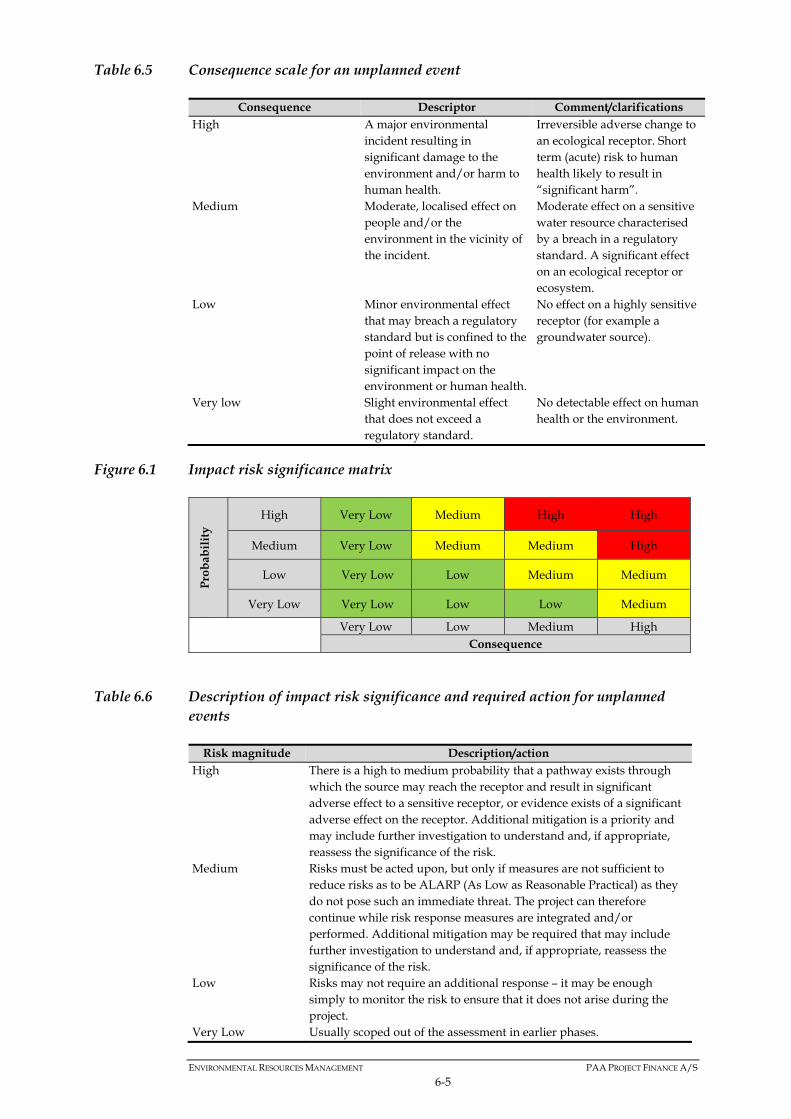
ENVIRONMENTAL RESOURCES MANAGEMENT PAA PROJECT FINANCE A/S
6-5
Table 6.5 Consequence scale for an unplanned event
Consequence Descriptor Comment/clarifications High A major environmental
incident resulting in significant damage to the environment and/or harm to human health.
Irreversible adverse change to an ecological receptor. Short term (acute) risk to human health likely to result in “significant harm”.
Medium Moderate, localised effect on people and/or the environment in the vicinity of the incident.
Moderate effect on a sensitive water resource characterised by a breach in a regulatory standard. A significant effect on an ecological receptor or ecosystem.
Low Minor environmental effect that may breach a regulatory standard but is confined to the point of release with no significant impact on the environment or human health.
No effect on a highly sensitive receptor (for example a groundwater source).
Very low Slight environmental effect that does not exceed a regulatory standard.
No detectable effect on human health or the environment.
Figure 6.1 Impact risk significance matrix
Pro
bab
ilit
y
High Very Low Medium High High
Medium Very Low Medium Medium High
Low Very Low Low Medium Medium
Very Low Very Low Low Low Medium
Very Low Low Medium High Consequence
Table 6.6 Description of impact risk significance and required action for unplanned events
Risk magnitude Description/action High There is a high to medium probability that a pathway exists through
which the source may reach the receptor and result in significant adverse effect to a sensitive receptor, or evidence exists of a significant adverse effect on the receptor. Additional mitigation is a priority and may include further investigation to understand and, if appropriate, reassess the significance of the risk.
Medium Risks must be acted upon, but only if measures are not sufficient to reduce risks as to be ALARP (As Low as Reasonable Practical) as they do not pose such an immediate threat. The project can therefore continue while risk response measures are integrated and/or performed. Additional mitigation may be required that may include further investigation to understand and, if appropriate, reassess the significance of the risk.
Low Risks may not require an additional response – it may be enough simply to monitor the risk to ensure that it does not arise during the project.
Very Low Usually scoped out of the assessment in earlier phases.

ENVIRONMENTAL RESOURCES MANAGEMENT PAA PROJECT FINANCE A/S
6-6
Given the nature of the Project activities, unplanned -events will be limited to accidental spills or leaks of fuels or wastes due to the operation of the Project irrigation equipment, drilling vehicles and/or due to an inappropriate handling or storage of pollutant materials.
6.2.5 Identification of Mitigation and Enhancement Measures
A key objective of the ESIA is to identify mitigation measures for all significant negative impacts on the environmental, socioeconomic, and health resources and receptors, and determine the potential residual impact after their implementation. Recommended mitigation measures have been identified and follow a mitigation hierarchy as shown in Figure 6.2. Mitigation is clearly described for all significant environmental and social impacts to a level appropriate for the stage of project development.
Figure 6.2 Mitigation Hierarchy
6.3 IMPACT IDENTIFICATION MATRIX
The impact identification matrix identifies the predicted interactions between project activities and environmental/socioeconomic resources and receptors. The impact identification matrix is presented in Figure 6.3, below. Each marked cell on the impact matrix represents a potential interaction between a project activity and an environmental or social receptor or resource (i.e., potential impact).

ENVIRONMENTAL RESOURCES MANAGEMENT PAA PROJECT FINANCE A/S
6-7
Shaded cells in the matrix indicate no primary effect or an absence of the resources in the general area. These interactions have not been included in the detailed impact assessment (Chapter 7), as their impact is considered non-existent or negligible (i.e., they are not expected to lead to a significant impact). A detailed justification for scoping out of impacts is provided in Table 6.7 below.

ENVIRONMENTAL RESOURCES MANAGEMENT PAA PROJECT FINANCE A/S
6-8
Figure 6.3 Impact Matrix Identification
Source: ERM, 2018
Clim
ate
Air Quality
Noise
Topografy and
Geo
logy
Soils
Surface W
ater
Sources
Groundwater
Sources
Biodiversity
(habitats, flora and
fauna)
Protected
areas
Economy an
d
Employm
ent
Land and
Livelih
oods
Labour Rights and
Workers’ H
ealth and
Safety
Community Hea
lth,
and Safety
Infrastructure and
Services
Community
Cohesion
Routine activities
Pre‐operation phaseDelivery of the Project irrigation equipment and accessories
(transport and associated logistics) and storage of the Project
irrigation equipment
OHS1
Selection of beneficiaries, signing of contracts, payment of fee EE2 LL2
Training delivery to SAG technicians and/or personnel designated
by the SAG and to Project beneficiaires EE1
Operation phaseCollection and transport of Project irrigation equipment to
beneficiary land
Beneficiary procurement of submerssible water pumps and
water tanks EE2
Conditioning of beneficiary land (drilling of water well /
construction of artesian well, and additional works related to the
proper installation of Project equipment such as buried irrigation
network)
EE3 OHS2
Irrigation equipment operation and maintenance CA1 CA1 N1 S1SW1, SW2,
SW3
GW1, GW2,
GW3B1, B2, B3 PA1 EE4, EE5
LL1, LL3,
LL4OHS3, OHS4 CHS1, CHS2 CHS3 CC1
Abandonment phaseIrrigation equipment abandonment, water well abandonment
and/or irrgated land abandonment
Non‐routine events
Non‐routine events related to accidental spills or leaks of fuels or
wastesAcc.1
Physical Biological Environment
RECEPTORS
Social

ENVIRONMENTAL RESOURCES MANAGEMENT PAA PROJECT FINANCE A/S
6-9
Table 6.7 Justification of non-existent and non-significant impacts
Interactions between Project activity and receptors Justification of non-significant impact Project activity Receptor
Delivery of the Project irrigation equipment and accessories (transport and associated logistics during pre-operation phase)
Climate change and air quality
The transport of the Project irrigation equipment will be undertaken progressively, during an overall and non-continuous period of approximately 15 months.
The transport by truck of the containers, containing the Project irrigation equipment once delivered to Honduras, will be equivalent to other vehicles movement in the Project Area, such as vehicles and agricultural machinery.
Emissions of air pollutants and GHGs due to the transport required for the delivery of equipment will not add a significant emission in comparison with the existing sources of air pollutants and GHGs in the Project Area.
Considering the existing vehicle movement and the progressive and non-continuous transport of equipment, the potential effects of the pre-operation phase in the climate and air quality are considered not significant.
Acoustic environment
As for the previous receptor (climate change and air quality), the transport of the Project irrigation equipment will be equivalent to other vehicles movement in the Project Area, such as vehicles and agricultural machinery.
Emission of noise due to the transport required for the delivery of equipment will not add a significant emission in comparison with the existing sources of noise in the Project Area.
Considering the existing vehicle movement and the progressive and non-continuous transport of equipment, the potential effects of the pre-operation phase in the acoustic environment are considered not significant.
Economy and Employment Considering that the delivery and transport of the equipment to the SAGO warehouse in Olanchito will be gradual and non-continuous over a period of approximately 15 months, the number of workers to employ is negligible since the same individuals can perform the activity repeated times.
Note however that the number of batches for equipment delivery and the number of transports is unknown. Road infrastructure and traffic
Reception and transport of equipment to the SAGO warehouse in Olanchito will be progressive and will occur over a 15-month period in a non-continuous manner.
As such, potential impacts on road infrastructure and road traffic is not considered significant and is therefore scoped out.
Collection and transport of Project irrigation equipment to beneficiary land. Conditioning of beneficiary land Irrigation equipment operation and maintenance
Road infrastructure and traffic
The assignation and retrieval of the kits will take place progressively over a period of 15 to 20 months. It is assumed that no more than one vehicle per kit is required. As such, the potential on the road infrastructure and traffic from equipment pick-up and transport to the
beneficiaries’ land is not significant and is therefore scoped out.

ENVIRONMENTAL RESOURCES MANAGEMENT PAA PROJECT FINANCE A/S
6-10
Interactions between Project activity and receptors Justification of non-significant impact Project activity Receptor
Topography and geology Project activities limited to, where applicable, the conditioning water source supply and the installation and operation of the Project irrigation system. These activities are standard ones within the irrigation projects, which are a common practice in the agriculture sector worldwide.
Absence of any earth movement activities. Main project interaction results from the drilling of groundwater wells on the land of the beneficiaries that require
it. However, standard drilling activities at shallow depths (no deeper than 80 m) for the installation of groundwater wells do not represent any impact to the substrate (geology).
Considering that no earth movement activities will be necessary and that the drilling of groundwater wells where necessary will not impact the substrate, potential effects on the topography and geology are considered not existent.
Groundwater resources downstream of Project Area
The annual decrease in groundwater calculated for the Project Area in the worst-case scenario assuming a stationary aquifer is of 0.5 meters, which is minimal.
In the area downstream of the Project Area, precipitation levels are higher which implies higher recharge levels and therefore a negligible decrease.
As potential impacts on groundwater levels downstream of the Project Area are insignificant, related impacts on farmers and producers and indigenous land of the Garífuna tribe located downstream are also expected to be insignificant and therefore scoped out.

ENVIRONMENTAL RESOURCES MANAGEMENT PAA PROJECT FINANCE A/S
6-11
Interactions between Project activity and receptors Justification of non-significant impact Project activity Receptor
Irrigation equipment abandonment, groundwater well abandonment and/or irrigated land abandonment
Groundwater resources The abandonment phase includes the abandonment of the irrigation system, which may involve as well the abandonment of the irrigated land and the abandonment of the groundwater well in case this was the water source of the beneficiary during operations.
Past the 10 years of operation, once the life expectancy of the irrigation equipment is achieved, the beneficiary can either continue with the operation through a change of equipment or abandon the irrigation equipment. This abandonment is considered unlikely in the short term, due to the expected economic benefits of the irrigation system.
Similarly, groundwater wells are beneficial to land owners, their abandonment in the event the beneficiary decides to abandon the Project irrigation equipment is considered even more unlikely.
Shall the abandonment of the irrigation system occur, it following convenient procedures, in particular regarding the closure of the groundwater well, in order to avoid any potential affection to the groundwater from potential contamination sources located in the surface, near the groundwater well would be an efficient mitigation. For that purpose the Project’s design involves the delivery of trainings to the beneficiaries including training on good environmental practices.
The SAG will be responsible for monitoring of the correct implementation and management of environmental measures related to the abandonment activities.
Considering the previous points potential effects of the abandonment activities are considered not significant. Economy and Employment As stated above, the abandonment is considered unlikely in the short term, due to the expected economic benefits
of the irrigation system. The abandonment phase includes the abandonment of the irrigation system, which may imply a return to
baseline conditions in terms of irrigation during the dry season, including with respect to the labour needed during the dry season. The number of permanent farm workers may therefore be decreased to pre-Project levels and temporary labour increased during the rainy season.
The Project’s design involves the delivery of trainings to the beneficiaries including training on good social practices aimed to ensure that beneficiaries implement these throughout the Project’s lifetime.
The SAG will be responsible for monitoring the correct implementation and management of environmental and social measures related to the abandonment activities, including proper employment termination measures such as prior notice, etc.
Considering that the likelihood of abandonment is low, and that the beneficiaries will have received training applicable to abandonment activities and that the correct abandonment of activities and related labour changes will be monitored, potential effects of the abandonment activities on employment are considered not significant.
Source: ERM, 2018

ENVIRONMENTAL RESOURCES MANAGEMENT PAA PROJECT FINANCE A/S
7-I
CONTENTS
7 ASSESSMENT OF ENVIRONMENTAL AND SOCIAL IMPACTS 7-1
7.1 INTRODUCTION 7-1 7.2 CLIMATE AND AIR QUALITY 7-3 7.2.1 Overview 7-3 7.2.2 Operation phase 7-4 7.3 ACOUSTIC ENVIRONMENT 7-7 7.3.1 Overview 7-7 7.3.2 Operation phase 7-9 7.4 SOILS 7-11 7.4.1 Overview 7-11 7.4.2 Operation phase 7-12 7.5 WATER RESOURCES 7-15 7.5.1 Overview 7-15 7.5.2 Operation phase 7-17 7.6 BIODIVERSITY 7-31 7.6.1 Overview 7-31 7.6.2 Operation phase 7-33 7.7 PROTECTED AREAS 7-44 7.7.1 Overview 7-44 7.8 ECONOMY AND EMPLOYMENT 7-46 7.8.1 Overview 7-46 7.8.2 Pre-Operation and Operation Phase 7-48 7.8.3 Operation Phase 7-51 7.9 LIVELIHOODS AND INCOME 7-60 7.9.1 Overview 7-60 7.9.2 Operation Phase 7-62 7.10 OCCUPATIONAL HEALTH AND SAFETY AND LABOUR RIGHTS 7-71 7.10.1 Overview 7-71 7.10.2 Pre-Operation Phase 7-73 7.10.3 Operation Phase 7-76 7.11 COMMUNITY HEALTH AND SAFETY 7-84 7.11.1 Overview 7-84 7.11.2 Operation Phase 7-85 7.12 COMMUNITY COHESION 7-90 7.12.1 Overview 7-90 7.12.2 Operation Phase 7-91 7.13 ARCHAEOLOGICAL AND CULTURAL HERITAGE 7-95 7.13.1 Overview 7-95 7.13.2 Operation Phase 7-96 7.14 NON-ROUTINE EVENTS 7-97 7.14.1 Overview 7-97 7.14.2 Operation phase 7-98 7.15 CUMULATIVE IMPACTS 7-102 7.15.1 Overview 7-102

ENVIRONMENTAL RESOURCES MANAGEMENT PAA PROJECT FINANCE A/S
7-II
LIST OF TABLES
Table 7.1 Key Potential Impacts –Air Quality and Climate change 7-4 Table 7.2 Summary of impact assessment on air quality and climate change during the
operation phase 7-7 Table 7.3 Key Potential Impacts – Acoustic Environment 7-9 Table 7.4 Summary of the impact assessment on the acoustic environment during the
operation phase 7-11 Table 7.5 Key Potential Impacts – Soils 7-12 Table 7.6 Summary of impact assessment on the soils during the operation phase 7-14 Table 7.7 Key Potential Impacts –Water Resources 7-17 Table 7.8 Summary of impact assessment on the water resources during the operation
phase 7-28 Table 7.9 Key Potential Impacts – Biodiversity 7-33 Table 7.10 Summary of impact assessment on the biodiversity during the operation
phase 7-43 Table 7.11 Key Potential Impacts – Protected Areas 7-45 Table 7.12 Summary of impact assessment on the protected areas during the operation
phase 7-46 Table 7.13 Key Potential Impacts – Economy and Employment 7-48 Table 7.14 Summary of impact assessment of SAG financing, procurement, and capacity
building and enhancement measures during pre-operation and operation 7-51 Table 7.15 Summary of impact assessment on economic growth and employment during
the operation phase 7-59 Table 7.16 Key Potential Impacts – Livelihoods and Income 7-62 Table 7.17 Summary of impact assessment on livelihoods and income during the
operation phase 7-69 Table 7.18 Key Potential Impacts – Occupational Health and Safety and Labour Rights
7-73 Table 7.19 Summary of impact assessment of occupational health and safety and labour
rights during the pre-operation phase 7-76 Table 7.20 Summary of impact assessment of workers’ health and safety and labour
rights during the operation phase 7-82 Table 7.21 Key Potential Impacts – Community Health and Safety 7-85 Table 7.22 Summary of impact assessment of workers’ health and safety and labour
rights during the operation phase 7-88 Table 7.23 Key Potential Impacts – Community Cohesion 7-91 Table 7.24 Summary of impact assessment on community cohesion during the operation
phase 7-94 Table 7.25 Summary of impact assessment of archaeological or cultural heritage
elements in the Project Area during the operation phase 7-97 Table 7.26 Key Potential Impacts – Non-routine events 7-98 Table 7.27 Summary of non-routine events 7-101 Table 7.28 Potential cumulative impacts from the interaction between the Alto Aguan
Project and other projects 7-103 LIST OF BOXES
Box 7.1 Key Considerations for Assessment - Air Quality and Climate change 7-3

ENVIRONMENTAL RESOURCES MANAGEMENT PAA PROJECT FINANCE A/S
7-III
Box 7.2 Key Considerations for Assessment – Acoustic Environment 7-8 Box 7.3 Key Considerations for Assessment – Soils 7-11 Box 7.4 Key Considerations for Assessment –Water Resources 7-15 Box 7.5 Key Considerations for Assessment – Biodiversity 7-32 Box 7.6 Key Considerations for Assessment – Protected Areas 7-44 Box 7.7 Key Considerations for Assessment – Economy and Employment 7-47 Box 7.8 Key Considerations for Assessment –Livelihoods and Income 7-61 Box 7.9 Key Considerations for Assessment –Occupational Health and Safety and
Labour Rights 7-72 Box 7.10 Key Considerations for Assessment – Community Health and Safety 7-84 Box 7.11 Key Considerations for Assessment – Community Cohesion 7-90 Box 7.12 Key Considerations for Assessment – Archaeological and Cultural Heritage 7-
95 Box 7.13 Key Considerations for Assessment – Non-routine events 7-98

ENVIRONMENTAL RESOURCES MANAGEMENT PAA PROJECT FINANCE A/S
7-1
7 ASSESSMENT OF ENVIRONMENTAL AND SOCIAL IMPACTS
7.1 INTRODUCTION
This section identifies and assesses the environmental and socioeconomic impacts and risks of the Project as well as detailing of any proposed mitigation measures. The assessment has been undertaken as per the method presented in Chapter 6. The residual impacts and risks are assessed taking into account the implementation of the mitigation measures. These are either embedded in the Project Design, i.e., the delivery of a training programme for the beneficiaries, or are additionally identified as a result of the assessment. The latter measures will need to be detailed and implemented in the final Project design and/or Environmental and Social procedures and plans. Potentially relevant sources of impacts and risks have been screened1 and identified in the previous sections of this ESIA, in particular Chapters 3, 4, and 5 as well as Chapter 6. These chapters have established:
the technical, spatial and temporal scope assessed in the ESIA; the relevant interactions between Project activities and the receiving
environments (physical, biological, and social); and the impact identification matrix of anticipated regular, cumulative,
and unplanned impacts associated with the Project. The temporal scope of the ESIA covers the three main phases of the Project:
Pre-operation Operation Abandonment
The duration of the activities within each of these three phases is described in Chapter 3 - Project Description and Alternatives and each has its own environmental and socioeconomic impacts, and risk potential. As previously established, impacts in the following sections are described and assessed according to the receptor they affect (see Chapter 5 - Baseline Description for details on the potential receptors, their importance, and values and sensitivities towards Project activities). The Project Area is described in Section 3.2. It covers the Alto Aguan River Valley, representing a total surface area of 60,000 ha. The ESIA corresponds spatially to the Study Area, defined as the area where direct or indirect impacts might occur due to the Project activities. It is considered that for most
1 A detailed account of scoped-out impacts including justification is presented in Table 6.7 in Section 6.3. This is the result of a careful scoping assessment process.

ENVIRONMENTAL RESOURCES MANAGEMENT PAA PROJECT FINANCE A/S
7-2
receptors the area of influence will correspond to the Project Area. However, in some cases, the area of influence might vary. The specifics of these cases are also included. Risks and impacts resulting from accidental events and their mitigation are assessed in Section 7.14. Cumulative impacts arising from the combination of activities associated with the Aguan Irrigation Project, together with other third party developments or projects in the same area of influence, are assessed in Section 7.15. Each impact assessment discussion is presented in a systematic manner detailing the following:
Likely impacts – describing the magnitudes of the impacts; Foreseen mitigation - the key mitigation measures adopted as well as a
discussion of the various mitigation alternatives considered; and Evaluation of the significance of residual impacts – an indication as to the
significance of the residual impacts and whether this will be minor, moderate, major, or critical.

ENVIRONMENTAL RESOURCES MANAGEMENT PAA PROJECT FINANCE A/S
7-3
7.2 CLIMATE AND AIR QUALITY
7.2.1 Overview
This section assesses the potential impacts on climate and air quality as a result of the Project activities. Box 7.1 presents the key sources of impacts, potentially impacted receptors, baseline, and factors influencing the project.
Box 7.1 Key Considerations for Assessment - Air Quality and Climate change
Sources of Impact
Operation and maintenance of irrigation equipment
Potentially Impacted Receptors
Climate change
Air quality
Other receptors potentially impacted by effects on climate and air quality are flora and fauna (see Section 7.6) and Community Health (see Section 7.13).
Particular Baseline Conditions that Potentially Influence Impacts
Low contribution of Honduras to global climate change.
High sensitivity of Honduras to global climate change.
GHG emissions in Honduras are 3,749.83 Gg CO2 equivalent (data from UN website, 2010).
Scarce information on air quality in Honduras.
Overall, poor air quality conditions in urban areas, due to emissions from urban transport, dust in the streets (unpaved streets), and lime and brick plants operating in urban surroundings.
Rural areas also face air quality problems, due to forest fires and agricultural burning, which produce emissions of suspended particles.
Project Factors that Potentially Influence Impacts
The Project will provide irrigation to about 3,110 ha within the Project Area which covers a total surface of about 60,000 ha.
Emissions of exhaust gases into the atmosphere from motor pumps&generators will be temporary only: irrigation will only be required during 3.5 months in the dry season (from January to April), and probably for 3-4 days / week, rather than on daily basis.
311 Motor pumps/generators are expected to be distributed
Each motor pump will consume approximately 3.8 l/h of diesel.
The life expectancy of a motor pump is about 10,000 h.
The operations phase is estimated to be 10 years.
Considering the motor pumps expected to be distributed and a maximum irrigation rate of 20 h/day for 3.5 months per year, the maximum fuel consumption is approximately 2,500 m3/year.
References
Chapter 3 Project Description and Alternatives – specifically Section 3.1, Section 3.5, Section 3.6.1 and Section 3.6.2.
Chapter 5 Baseline Description – specifically Section 5.2.1 and Section 5.2.2.
Source: ERM, 2018

ENVIRONMENTAL RESOURCES MANAGEMENT PAA PROJECT FINANCE A/S
7-4
Table 7.1 presents the key impacts of the Project on air quality and climate change.
Table 7.1 Key Potential Impacts –Air Quality and Climate change
Pre-operation phase Operation phase Abandonment phase None CA1 – Emissions of air
pollutants and GHGs potentially affecting air quality and climate change
None
Source: ERM, 2018
7.2.2 Operation phase
Potential impacts
CA1 – Emissions of air pollutants and GHGs potentially affecting air quality and climate change
The operation and maintenance of the irrigation equipment involves the consumption of fuel (diesel) by the motor pumps/generators distributing the water from the water source to the irrigation network at 10 l/s and a pressure of 8 bars. See Box 7.1 for key considerations on baseline conditions and project factors that can potentially influence the impact. The combustion of fuel (diesel)1 results mostly in carbon dioxide (CO2) and water vapour (H2O). However, due to inefficiencies in the fuel (diesel) combustion process within the engine, some other chemical products are emitted in minor proportions: carbon monoxide (CO), unburned hydrocarbons (HC), nitrogen oxides (NOx), volatile organic compounds (VOCs), and particulate matter (PM). Some of these chemical products (CO, HC, NOx, VOCs, and PM) are pollutants, which can potentially affect the air quality. Additionally, CO2, although not a pollutant, is a GHG. Therefore, the CO2 emitted due to the combustion of fuel (diesel) can potentially affect climate change, due to its GHG properties. In terms of air quality, the emissions will be an immediate effect of the operation of the irrigation equipment, affecting the Project Area throughout the operation phase, which is estimated to be 10 years taking into account the life expectancy of the equipment.
1 https://www.dieselnet.com/standards/eu/fuel_reference.php

ENVIRONMENTAL RESOURCES MANAGEMENT PAA PROJECT FINANCE A/S
7-5
However, it must be considered that the motor pumps/generators will not be functioning continuously. They will only operate when the irrigation system is required, which will be limited to 3.5 months in the dry season (from January to April). No further emissions will occur outside the dry season, when due to the typical rainfall pattern, the farmer is not expected to operate the irrigation system. In addition to this, it is unlikely that the irrigation will be required every day during the dry season. A scenario where the irrigation is applied on 3-4 days / week is considered more realistic. In addition, the Training Programme embedded into the Project design will provide technical training on the adequate use and maintenance of the irrigation equipment. This will contribute to minimizing the use of the motor pumps as much as feasible, and consequently, their emissions of air pollutants. The motor pumps/generators have an engine power limited to 42 HP. This is small if compared with the engine of a small car (e.g., 90 HP) or the engine of a truck (e.g., 300 HP)1. Therefore, the consumption and emissions of each motor pump are smaller than those produced by a standard vehicle. The Project Area covers a surface area of about 60,000 ha. Considering the number of motor pumps/generators to be distributed within the Project Area is 311, the average distribution will be approximately one pump/generator for every 10 ha in the Project Area. In addition to this, since the aim of the Project is to distribute as many irrigation systems to as many farmers possible, the resulting distribution is expected to be spread throughout the Project Area, avoiding a concentration of motor pumps and, consequently, a concentration of air emission sources in any particular location within the Project Area. In general, the motor pumps/generators to be distributed by the Project are no different from other sources of air pollutants already existing in the Project Area (e.g., vehicles). Other air emissions, besides standard vehicles, include other motor pumps already used in the Project Area for groundwater wells, generators, and so on. With regard to air pollutant emissions, considering the aspects mentioned above, the air quality impact is considered to be small in magnitude: some measurable change in quality or vulnerability, minor loss, or alteration to one or more key characteristics, features, or elements. Considering the fact that the irrigation activities will be undertaken in rural areas, away from sensitive receptors (residential areas), a medium sensitivity level of air quality has been assumed in the Project Area. The main GHG resulting from the combustion of diesel is CO2. According to the emissions factors proposed by the Oil Industry International Exploration & Production Forum (1994)2, the combustion of 1 ton of diesel results in the
1 Data provided are approximate only. Range of engines power in vehicles is very variable. 2 This forum later became the OGP (International Association of Oil and Gas Producers).

ENVIRONMENTAL RESOURCES MANAGEMENT PAA PROJECT FINANCE A/S
7-6
emission of 3.2 tonnes of CO2. Applying this factor and taking into account the density of the diesel (832 kg/m3)1, the combustion of 2,500 m3 of diesel in one year would result in the emission of 6,400 tonnes of CO2 per year. The estimated GHG emissions for Honduras (data from year 2010 – according to the UN website) are 3,749.83 Gg CO2 equivalent. Therefore, the estimated emission of CO2 during the operation phase in one year will be limited to 0.17% of the total emissions in Honduras in one year (as per specific data of 2010). Considering the estimated low contribution of the Project activities to GHG emissions, the impact on climate change is considered to be of negligible magnitude: very minor loss or detrimental alteration to one or more characteristics, features, or elements. As a country that is vulnerable to the incidence of extreme weather conditions, such as hurricanes and prolonged periods of drought, Honduras is raising awareness of adaptation to climate change. At a local level, the main economic activity of the Olanchito and Arenal municipalities is livestock rearing and agriculture (mostly focused on the livestock), and, consequently, periods of drought affect production. The Project will contribute to improving the adaptive capacity of the farmers in the Project Area to climate change, reducing their vulnerability to drought. According to Secaira, E. (2013), global climate change in Honduras could have the following consequences: increased temperatures (0.5–1.5 ºC by 2050, and 2.0-3.5º by 2080); decreased rainfall (3-7% by 2050, and 12-17% by 2080), mostly during the dry season; and increased climate variability because of the El Niño climate event. These changes would indirectly affect a number of receptors, including the biodiversity, population, and economy, confirming the importance of climate in the country. However, it is also worth noting that the climate vulnerability is low, since only very high magnitude impacts could produce a noticeable effect. Because of this, the overall sensitivity of the climate is considered to be medium. Mitigation measures
The Project Design includes the following embedded measure:
Training Programme including technical training on the adequate use and maintenance of the irrigation equipment. This will contribute to minimizing the use of the motor pumps/generators as much as feasible and, consequently, their emissions of air pollutants and GHGs.
Beneficiaries will acquire a series of responsibilities linked to the irrigation system such as the maintenance of the equipment and its components and accessories, as recommended by the manufacturer or supplier. Equipment maintenance will contribute to minimizing air
1 https://www.dieselnet.com/standards/eu/fuel_reference.php

ENVIRONMENTAL RESOURCES MANAGEMENT PAA PROJECT FINANCE A/S
7-7
pollutant and GHG emissions, since well-maintained equipment produces fewer emissions as a result of more efficient combustion.
In addition, the following recommendation measure is provided, considered as good management practice:
The SAG will require beneficiaries to implement a logbook with records of fuel used. .
Residual impacts
Taking into account the impact magnitude and receptor sensitivity discussed above, it can be concluded that the impact significance on air quality and climate change due to air pollutant and GHG emissions as a result of the operation and maintenance of the irrigation equipment is Negligible. Table 7.2 summarises the impacts on air quality and climate change as a result of the Project activities during the operation phase.
Table 7.2 Summary of impact assessment on air quality and climate change during the operation phase
Impact / Risk Measures to address the impact / risk
Residual Impact
CA1 - Emissions of air pollutants and GHGs potentially affecting air quality and climate change
Embedded measures: Training Programme Beneficiary
responsibilities acquired linked to the irrigation system such as the maintenance of the equipment, which will contribute to minimizing air pollutant and GHG emissions.
Implementation of
logbook with records of fuel used recommended as good practice.
Negligible The motor pumps/generators are no
different from other sources of air pollutants in the Project Area. Their expected level of emissions is actually lower than a standard vehicle, for example, one of the main air pollutant sources in the Project Area.
Yearly CO2 emissions will be limited to 0.17% of the total yearly emissions in Honduras.
Irrigation limited to 5% of the total surface are in the Project Area.
Irrigation limited to 3.5 months a year.
Source: ERM, 2018
7.3 ACOUSTIC ENVIRONMENT
7.3.1 Overview
This section assesses the potential impacts on the acoustic environment as a result of Project activities. Box 7.2 presents the key sources of impacts, potentially impacted receptors, the baseline, and factors influencing the project.
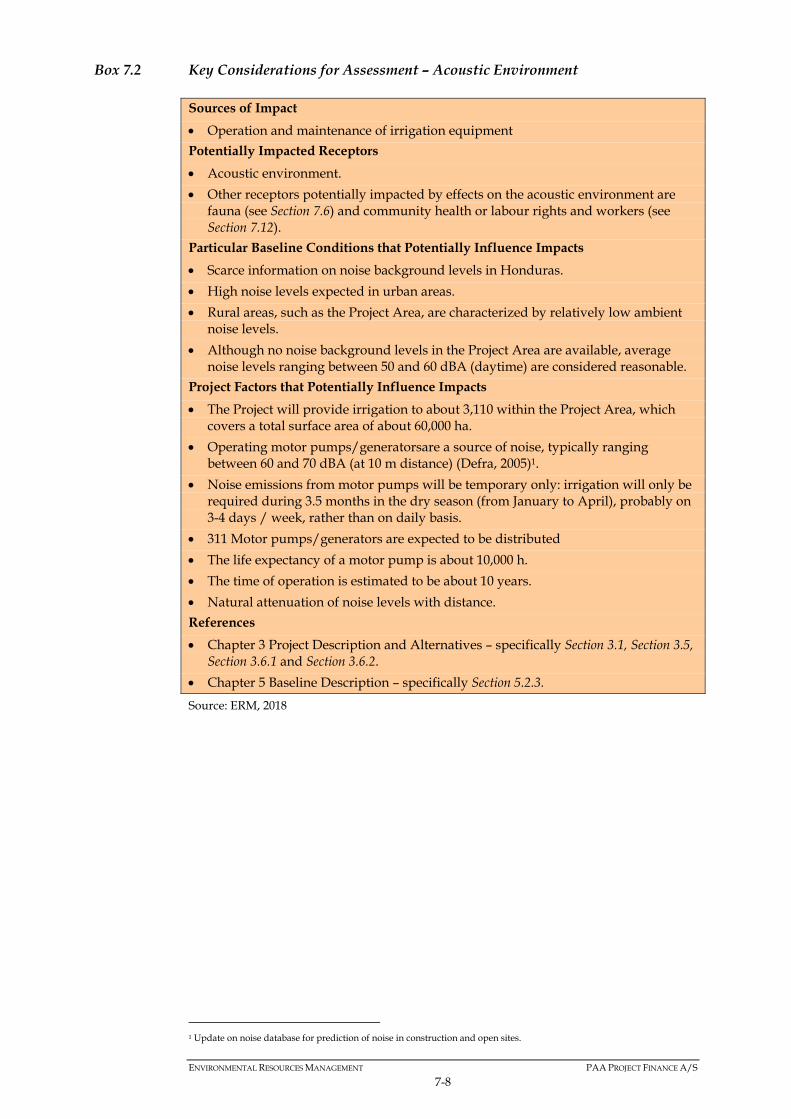
ENVIRONMENTAL RESOURCES MANAGEMENT PAA PROJECT FINANCE A/S
7-8
Box 7.2 Key Considerations for Assessment – Acoustic Environment
Sources of Impact
Operation and maintenance of irrigation equipment
Potentially Impacted Receptors
Acoustic environment.
Other receptors potentially impacted by effects on the acoustic environment are fauna (see Section 7.6) and community health or labour rights and workers (see Section 7.12).
Particular Baseline Conditions that Potentially Influence Impacts
Scarce information on noise background levels in Honduras.
High noise levels expected in urban areas.
Rural areas, such as the Project Area, are characterized by relatively low ambient noise levels.
Although no noise background levels in the Project Area are available, average noise levels ranging between 50 and 60 dBA (daytime) are considered reasonable.
Project Factors that Potentially Influence Impacts
The Project will provide irrigation to about 3,110 within the Project Area, which covers a total surface area of about 60,000 ha.
Operating motor pumps/generatorsare a source of noise, typically ranging between 60 and 70 dBA (at 10 m distance) (Defra, 2005)1.
Noise emissions from motor pumps will be temporary only: irrigation will only be required during 3.5 months in the dry season (from January to April), probably on 3-4 days / week, rather than on daily basis.
311 Motor pumps/generators are expected to be distributed
The life expectancy of a motor pump is about 10,000 h.
The time of operation is estimated to be about 10 years.
Natural attenuation of noise levels with distance.
References
Chapter 3 Project Description and Alternatives – specifically Section 3.1, Section 3.5, Section 3.6.1 and Section 3.6.2.
Chapter 5 Baseline Description – specifically Section 5.2.3.
Source: ERM, 2018
1 Update on noise database for prediction of noise in construction and open sites.

ENVIRONMENTAL RESOURCES MANAGEMENT PAA PROJECT FINANCE A/S
7-9
Table 7.3 presents the key impacts of the Project on the acoustic environment.
Table 7.3 Key Potential Impacts – Acoustic Environment
Pre-operation phase Operation phase Abandonment phase None N1 – Potential disturbance to
workers and/or fauna None
Source: ERM, 2018
7.3.2 Operation phase
Potential impacts
N1 – Potential disturbance to workers and/or fauna due to noise levels
See Box 7.2for key considerations on baseline conditions and project factors that can potentially influence the impact. The noise levels produced by the motor pumps are similar to other noise sources existing in the Project Area. For example, the noise generated by a vehicle (standard car) at 45 km/h is about 62 dBA (at 15 m distance), whilst the noise generated by a medium-sized truck at the same speed is about 73 dBA (at 15 m distance) (Cowan, Environmental Acoustics)1. There is a correlation between the noise level and the distance receptor - noise source: sound levels decay 6 dB when the distance between the receptor and the noise source is doubled at open space (L. Beranek & McGraw-Hill, 19542; Moore D.R., 20103). Therefore, the noise level produced by the motor pumps will be reduced to 54 - 64 dBA at 20 m, 48 – 58 dBA at 40 m, 42 – 52 dBA at 80 m, and so on. The expected distribution of motor pumps/generators in the Project Area will be very spread out (one motor pump for every 10 ha in the Project Area), avoiding any concentration of the pumps and, consequently, a concentration of noise sources in a specific location of the Project Area. In addition, the Training Programme embedded into the Project design will provide technical training on the adequate use and maintenance of the irrigation equipment. This will contribute to minimizing the use of the motor pumps as much as feasible, and consequently, their noise emissions. Considering the aspects mentioned above, the magnitude of the impact on the acoustic environment is considered to be small.
1 https://www.nonoise.org/resource/trans/highway/spnoise.htm#top 2 Acoustics, L. Beranek, McGraw-Hill, 1954. 3 The Oxford Handbook of Auditory Science: Hearing. David R. Moore, 2010.
ENVIRONMENTAL RESOURCES MANAGEMENT PAA PROJECT FINANCE A/S
7-10
The motor pumps will be located next to the fields to be irrigated. In most cases, the agricultural fields and pastures that are the subject of the irrigation project are located in unpopulated areas. Because of this, the presence of receptors of the noise generated by the motor pumps is likely to be limited to farm workers, and only while the motor pump is operating, whenever the workers are in the proximity of the motor pump. Some fauna could occasionally be disturbed too. The natural attenuation of noise levels with distance will avoid any effect on nearby populated areas. Although there is no specific information on the existing noise levels in the Project Area, it is very likely the acoustic environment is similar to other rural areas, where noise levels are described to be between of around 30dBA (daytime) except in urban centers (50-60 dBA). Considering the fact that the irrigation activities will be undertaken in rural areas, away from sensitive receptors (residential areas) and that receptors will likely be limited to farm workers and the fauna present near-by the sensitivity of the acoustic environment in the Project Area is considered to be low. Mitigation measures
The Project Design includes the following embedded measures:
The Training Programme will include a topic on the adequate use and maintenance of the irrigation equipment. This will contribute to minimizing the use of the motor pumps/generators as much as feasible, and consequently, their emissions of noise.
Beneficiaries will acquire a series of responsibilities linked to the irrigation system, including carrying out the maintenance of equipment, its components, and accessories, as recommended by the manufacturer or supplier. Equipment maintenance will also contribute to minimizing the emissions of noise, as well-maintained equipment is quieter.
Residual impacts
Table 7.4 summarises the impacts on the acoustic environment as a result of the Project activities during the operation phase.

ENVIRONMENTAL RESOURCES MANAGEMENT PAA PROJECT FINANCE A/S
7-11
Table 7.4 Summary of the impact assessment on the acoustic environment during the operation phase
Impact / Risk Measures to address the impact / risk
Residual Impact
N1 - Potential disturbance to workers and/or fauna due to noise levels
Embedded measures: Training Programme. Beneficiary responsibilities
acquired linked to the irrigation system, such as the maintenance of the equipment, which will contribute to minimizing noise emissions.
Negligible The noise levels produced
by the motor pumps/generator (60 - 70 dBA – at 10 m distance) are similar to other noise sources existing in the Project Area.
The presence of receptors of the noise generated by the motor pumps is likely to be limited to farm workers and, occasionally, fauna.
Natural attenuation of noise levels with distance. Irrigation limited to 5% of the total surface area in the Project Area.
Irrigation limited to 3.5 months a year.
Source: ERM, 2018
7.4 SOILS
7.4.1 Overview
This section assesses the potential impacts on the soils as a result of the Project activities. Box 7.3 presents the key sources of impacts, potentially impacted receptors, the baseline, and factors influencing the project.
Box 7.3 Key Considerations for Assessment – Soils
Sources of Impact
Operation and maintenance of irrigation equipment.
Potentially Impacted Receptors
Soils.
Other receptors potentially impacted by effects on the soil are surface water resources and groundwater resources (see Section 7.5) and flora and fauna (see Section 7.6).
Particular Baseline Conditions that Potentially Influence Impacts
The main types of soils found in the Project Area are alluvial soils and two types of lithosols (Jacaleapa and Yaruca).
Although chemical products (herbicides, pesticides, and fertilizers) are commonly employed on the farms in the Project Area, only small quantities are used.
Soil quality conditions in the Project Area are expected to be good, in the absence of evidence of erroneous use of use of chemical products.
Project Factors that Potentially Influence Impacts

ENVIRONMENTAL RESOURCES MANAGEMENT PAA PROJECT FINANCE A/S
7-12
The Project will provide irrigation to about 3,110 ha within the Project Area, which covers a total surface area of about 60,000 ha.
Waste generation will be limited to lubricants used in the maintenance of the irrigation equipment.
References
Chapter 3 Project Description and Alternatives – specifically Section 3.1, Section 3.5, Section 3.6.1 and Section 3.6.2.
Chapter 5 Baseline Description – specifically Section 5.2.6.
Source: ERM, 2018
Table 7.5 presents the key impacts of the Project on the soils.
Table 7.5 Key Potential Impacts – Soils
Pre-operation phase Operation phase Abandonment phase None S1 – Loss of soil properties and
soil disturbance None
Source: ERM, 2018
7.4.2 Operation phase
Potential impacts
S1 – Potential loss of soil properties due to excessive irrigation and soil disturbance
The irrigation of agricultural fields and pastures has the potential to affect the soil properties. Two main causes of soil property affection are described below:
Excessive irrigation can lead to the accumulation of salts, which can damage the soil structure. This occurs particularly in clay soils due to the presence of sodium, and in soils that already have a naturally high content of sodium (salinity soil). Damage to the soil structure would result in less stability, and greater vulnerability to a structural decline.
Excessive irrigation can also lead to increased erosion. Two typical erosion processes are:
o Gully erosion: characterized by the removal of the top soil and the formation of channels or gullies that become wider and deeper as a result of being preferential paths for water in heavy rain events.
o Sheet erosion: characterized by the loss of a thin layer of topsoil from sloping land.
Some soil disturbance near the surface may occur routinely because of machinery use and tilling, water drops and irrigation, water flow, and livestock activities. Soil disturbance at depth (e.g., compaction) is not expected because deep tilling and the passage of heavy machinery are not habitual in the type of crops expected in the Project Area.
ENVIRONMENTAL RESOURCES MANAGEMENT PAA PROJECT FINANCE A/S
7-13
Soil impact will only occur as a result of poor irrigation practices (accumulation of salts and erosion), and will only affect the soils where the irrigation system will be implemented in the Project Area (maximum 4,240 ha). This may last longer than the operation phase itself, since recovering soil properties and quality can be a long process, both in the case of natural recovery and soil improvement or remediation projects. In addition, the Training Programme embedded into the Project design will provide technical training on the adequate use and maintenance of the irrigation equipment. This will contribute to minimizing the amount of water used as much as feasible, and consequently, reduce the risk of salinization and / or erosion events. Moreover, it must be taken into account that an excessive irrigation would require a financial effort from the farmer. This is not realistic taking into account that irrigating in excess agricultural fields and pastures does not lead to a higher production. The soil conditions in the Project Area are expected to be good. Information gathered during the field survey conducted in June 2018 confirmed that chemical products (fertilizers, herbicides, and pesticides) were used correctly in the agricultural practices: they are commonly employed, but only in small quantities. Good soil quality is related to a high level of vulnerability. In addition to this, the most important economic sector in the Project Area is livestock, which depends on pasture and forage crops to provide food for the cattle. The soil condition is a key factor in the development of both pasture and forage crops. Because of this, the importance of the soil is high too. To sum up, taking into account its high vulnerability and its high importance, the sensitivity of the soil in the Project Area is considered to be high. Mitigation measures
The Project Design includes the following embedded measure:
Training Programme including technical training on the adequate use and maintenance of the irrigation equipment. This will contribute to minimizing the amount of water used as much as feasible, and consequently, reduce the risk of salinization and / or erosion events.
Training will also impart good irrigation practices, aligned with the FAO guidelines:
o Guidelines for Water Management and Irrigation Development.
o Guidelines for Planning Irrigation and Drainage Investment Projects.
Planned monitoring of irrigation equipment use and maintenance for a period of no less than 10 years, including the beneficiaries’ water consumption (water meters are included in the irrigation system). This embedded measure will enable some of the mitigation measures described below to be monitored.

ENVIRONMENTAL RESOURCES MANAGEMENT PAA PROJECT FINANCE A/S
7-14
Beneficiaries will acquire a series of responsibilities linked to the irrigation system. These will include compliance with the mitigation measures described below.
The following mitigation measures will be implemented in order to minimize the loss of soil properties as a result of inadequate irrigation:
The SAG will require beneficiaries to follow irrigation plans and schedules as per FAO’s guidelines when using the irrigation equipment.
In addition, the following recommendation measure is provided, considered as good management practice:
The SAG will require the beneficiaries to implement a logbook with records of the water pumped (or hours of pumping), and share this with the CRELES.
Residual impacts
Table 7.6 summarises the soil impacts as a result of the Project activities during the operation phase. The embedded measures considered in the Project Design and the mitigation measures defined during the impact assessment result in a Residual Impact assessed as minor.
Table 7.6 Summary of impact assessment on the soils during the operation phase
Impact / Risk Measures to address the impact / risk Residual Impact SI - Potential loss of soil properties due to excessive irrigation and soil disturbance
Embedded measures:
• Implementation of the Project’s Training Programme including technical training on the adequate use and maintenance of the irrigation equipment. This will contribute to minimizing the amount of water used as much as feasible, and consequently, reduce the risk of salinization and / or erosion events.
Training Programme including good irrigation practices (aligned with FAO guidelines).
• Monitoring of the irrigation equipment for a period of no less than 10 years including the beneficiaries’ water consumption (water meters are included in the irrigation system).
• Beneficiaries required to comply with the mitigation measures proposed.
Mitigation measures:
Minor Effect on soil properties is
limited to an indirect effect resulting from excess of irrigation.
Irrigation limited to up to 5% of the total surface area in the Project Area.
Irrigation limited to 3.5 months a year (105 days).

ENVIRONMENTAL RESOURCES MANAGEMENT PAA PROJECT FINANCE A/S
7-15
Impact / Risk Measures to address the impact / risk Residual Impact
• Follow irrigation plans and schedules as per FAO’s guidelines.
• Implementation of logbook with records of water pumped (or hours of pumping), and share this with the CRELs.
Source: ERM, 2018
7.5 WATER RESOURCES
7.5.1 Overview
This section assesses the potential impacts on the surface and groundwater resources as a result of the Project activities. Box 7.4 presents the key sources of impacts, potentially impacted receptors, the baseline, and factors influencing the project.
Box 7.4 Key Considerations for Assessment –Water Resources
Sources of Impact
Operation and maintenance of irrigation equipment
Potentially Impacted Receptors
Surface water resources.
Ground water resources.
Other receptors potentially impacted by effects on the water resources are biodiversity (see Section 7.6), land user livelihoods and incomes (see Section 7.11) and Community Health (see Section 7.13)
Particular Baseline Conditions that Potentially Influence Impacts
Surface water resources:
Project Area located in the Aguan River basin.
Aguan River characterized by a very active dynamic. Water flow of the Aguan River fluctuates between the dry season (January – April) and the rainy season (rest of the year).
Average water flow in Sabana Larga: 9.62 m3/s (dry season) and 23.22 m3/s (rainy season).
Average water flow in Olanchito: 20.95 m3/s (dry season) and 32.00 m3/s (rainy season).
Connection between the Aguan River and the Alluvial Aquifer.
Surface water features in the Project Area are used for irrigating agricultural fields and providing water for the cattle. Tributaries of the Aguan River also used as a water supply for the communities (human consumption).Lack of information on surface water quality from chemical analysis.

ENVIRONMENTAL RESOURCES MANAGEMENT PAA PROJECT FINANCE A/S
7-16
Groundwater resources:
Most of the Project Area is located on the Alluvial Aquifer of the Aguan River, which is described as a highly productive and extensive aquifer.
Water flows ranging between 4 and 67 l/s.
Transmissivity is 470 m2/day.
Most of the Project Area is characterized by groundwater levels at depths of < 10 m to 40 m.
There is no official register of groundwater wells, so there is no accurate information available on the exact number of these in the Project Area.
The use of groundwater is minor in comparison with the use of surface water. Groundwater wells are mostly utilized for farming activities (cleaning and water for cattle), but in a few cases they are also used as a water supply for the communities (human consumption).
Project Factors that Potentially Influence Impacts
The Project will provide irrigation to about 3,110 ha within the Project Area, which covers a total surface area of about 60,000 ha.
Irrigation water requirement will be 32 l/m2 per week and the irrigation activities will be limited to 3.5 months / year (rounded to 105 days).
The total water consumption is estimated to be 14,93 Hm3/year, when the irrigated surface reaches the maximum of 3,110 ha. This last volume is approximately a 3,89% of the minimum available reserve in worst scenario. If the 870.000.000 m3 of the average reserves are considered, the maximum water consumption would mean a 1,7 % of the average reserves of the Alto Aguan Valley.
Two water source options are proposed: surface water (option 1) and groundwater (option 2).
Time of operation is estimated to be about 10 years.
References
Chapter 3 Project Description and Alternatives – specifically Section 3.1, Section 3.5, Section 3.6.1 and Section 3.6.2.
Chapter 5 Baseline Description – specifically Section 5.2.7 and Section 5.2.8.
Source: ERM, 2018
Table 7.7 presents the key impacts of the Project on the water resources.

ENVIRONMENTAL RESOURCES MANAGEMENT PAA PROJECT FINANCE A/S
7-17
Table 7.7 Key Potential Impacts –Water Resources
Pre-operation phase Operation phase Abandonment phase None W1 - Loss of surface and
groundwater quality.
W2 – Eutrophication of surface water.
W3 – Effects on river flow.
W4 - Increase of organic matter in the groundwater.
W5 – Effect on groundwater level.
None
Source: ERM, 2018
7.5.2 Operation phase
Potential impacts
W1 – Loss of surface and groundwater quality
An indirect consequence of the Project might be the increased use of chemical products (herbicides, pesticides, and fertilizers). Herbicides and pesticides include toxic chemical compounds in their composition, which affect the biological integrity of the elements they are meant to eliminate (weeds in the crops, different types of insects, or other types of pests). These toxic chemical compounds can contribute to water pollution, if they are not used appropriately, for example through excessive doses or an excessively high frequency of use. Although water pollution would affect surface water in the first instance, it could also affect the groundwater by the chemical compounds filtering through the subsoil, especially where groundwater levels are shallow. In the case of the Project Area, the groundwater level ranges between depths of <10 and 40 m in most cases. Two wells have been identified in the Project Area where the groundwater level was reported to be < 4 m: the well on farm 108 (visited in June 2018), where the water level is 3.6 m; and the “Palo Verde A” well (identified in 2017), where the water level is 3.05 m. Another condition that must be met for surface water pollution to reach the groundwater is suitable subsoil lithology. In cases of impermeable materials (for example, clays) the filtration would be very slow and might not even reach the groundwater level. As described in Section 5.2.6, the soils in the
ENVIRONMENTAL RESOURCES MANAGEMENT PAA PROJECT FINANCE A/S
7-18
Project Area are alluvial (sandy and silty soils) and lithosols (Jacaleapa and Yaruca – described as soils with a high stone content or thin soils on rock). Therefore, neither the alluvial soils nor the lithosols can be considered impermeable, and, consequently, filtration through the subsoil could occur. In addition to this, since the groundwater level in the Project Area is not very deep, if herbicides and / or pesticides were not used appropriately, they could affect the groundwater quality through filtration. Loss of water quality, in both surface and groundwater, will occur only as a result of bad practices in the use of herbicides and pesticides on the irrigated land (maximum 3,110 ha) located within the Project Area, potentially affecting water resources limited to the Project Area, throughout the duration of the irrigation activities. In the case of groundwater resources, although recovery of groundwater quality can be a long process, in the case of the Project Area this is unlikely to be the case considering the connection between the Aguan River and the Alluvial Aquifer. However, taking into account the feedback received during the June 2018 field survey, there is limited use of pesticides and herbicides in the Project Area, reducing the likelihood of inappropriate use in the future:
Herbicides are used 1 – 2 times / year and in quantities below 1.5 l / ha.
The use of pesticides is very low. These are only employed regularly in the banana plantations; however, the Project will not be implemented in these areas.
Farmers are advised by SENASA1 to consider alternatives to pesticides, such as IPC (integrated pest control) management and the use of standard detergents (non-hazardous for the environment).
In addition, the Training Programme embedded in the Project design will provide technical training on the adequate use of pesticides and herbicides, focusing on minimizing their use as much as possible and selecting low toxicity pesticides and herbicides. With regard to the surface water bodies in the Project Area, it has to be taken into account that:
The Aguan River has a high surface water flow. The western section of the Project Area maintains an average water flow of 9.62 m3/s during the dry season (data corresponding to Sabana Larga). In the case of Olanchito, located in the centre of the Project Area, the average water flow is 20.95 m3/s during the dry season. There is, therefore, a significant contribution of water from tributaries across the Project Area.
1 National Service of Health and Agro-food Safety – Servicio Nacional de Sanidad e Inocuidad Agroalimentaria

ENVIRONMENTAL RESOURCES MANAGEMENT PAA PROJECT FINANCE A/S
7-19
This data shows that even in the dry season, when the water flows are lower, the Aguan River and its tributaries have very high capacity for diluting any potential herbicide or pesticide that may reach the rivers as a result of an inadequate use. For example, in the case of herbicides, it was described that about 1.5 l/ha is applied 1 – 2 times/year on the farms; this represents a maximum quantity of 3 l/ha, which would in turn be a maximum quantity of 9,330 l (assuming a maximum of 3,110 ha of irrigated fields as a result of the Project).
This volume is similar to the amount of water in the Aguan River in the area of Sabana Larga in just one second (9,620 l) during the dry season, and almost only half of the amount of water in the Aguan River in Olanchito (20,950 l) in one second. Because of this, it is considered that even if, due to inadequate use of pesticides or herbicides, some quantities reached the rivers in the Project Area (mostly from the groundwater flowing towards the Aguan River and its tributaries), their dilution capacity, based on their water flow, would avoid significant effects on the surface water quality of the rivers.
The small surface water bodies in the Project Area, not connected to the Aguan River and / or its tributaries, such as ponds and reservoirs, would be more vulnerable to the loss of water quality, if they were located near irrigated fields where there was bad management of pesticides and herbicides.
As described in Section 5.2.7, no surface water quality analysis are available. However, observations during the field survey included fish in several river locations (tributaries of the Aguan River) and the occasional presence of caiman (Caiman cocodrilus) was reported. This is evidence of good surface water quality. However, there is a risk of loss of quality through organic contamination as a result of poor wastewater management in the communities near the Aguan River or its tributaries. This expected good quality, together with the potential risk of organic contamination, results in a high level of vulnerability. In addition, surface water is used by the local population: mostly for irrigation and to provide water for the cattle (in the case of the Aguan River), but also as a potable water source (in the case of the upper areas of the Aguan River tributaries).
Considering the aspects mentioned above, the magnitude of the impact on surface water is considered to be small: some measurable change in quality or vulnerability, minor loss, or alteration to one or more key characteristics, features or elements. Other future and potential uses and services provided by the Aguan River and its tributaries are future hydropower stations (Arenal Etapa I-II Hydroelectric project, Aguan Energy Complex), the Irrigation

ENVIRONMENTAL RESOURCES MANAGEMENT PAA PROJECT FINANCE A/S
7-20
Project Austria II (all three projects evaluated in Section 7.15 Cumulative impact assessment) and potential local, low-intensity fishing (for self-consumption only). As a result of the uses described, the importance of the surface water sources is also high. In summary, taking into account its high vulnerability and high importance, the sensitivity of the surface water resources (Aguan River, its tributaries, and any other surface water sources such as ponds or small lakes) is considered to be high.
With regard to the groundwater in the Project Area, it has to be taken into account that:
The Alluvial Aquifer and the Aguan River are connected, therefore any persistent chemicals will migrate through the groundwater to the river.
As described in Section 5.2.8, the groundwater resources of the Olanchito municipality are adequate for irrigation purposes. However, the groundwater samples were collected in 1997, and since then no more recent samples have been available. The feedback received during the field survey stated that the groundwater wells used for human consumption were initially analysed, the results being favourable, but once again no further information on the current water quality has been provided. For this reason, there is a reasonable level of uncertainty about the current groundwater quality.
In addition to this, due to the poor wastewater management procedures in the communities in the Project Area (the most common management system in the small communities scattered across the Project Area involves latrines that filter into the subsoil), there is a risk of organic contamination in the groundwater. Because of this, the vulnerability of the groundwater is considered to be medium.
Groundwater use is minor in comparison with the surface water use. However, the implementation of the irrigation project will increase the use of groundwater. Because of this, the importance of the groundwater resources is considered to be medium (currently) to high (after the implementation of the Project). To sum up, taking into account its medium vulnerability and its medium to high importance, the sensitivity of the groundwater is considered to be medium.
W2 – Surface water eutrophication
As described in Impact W1, an indirect consequence of the improvement of the agricultural / livestock sector in the Project Area is the increased of use of chemical products (herbicides, pesticide, and fertilizers). Fertilizers provide additional amounts of key chemical elements for the growth of crops, including nutrients such as nitrogen (N), phosphorus (P), and

ENVIRONMENTAL RESOURCES MANAGEMENT PAA PROJECT FINANCE A/S
7-21
potassium (K). Fertilizers can be organic (e.g., manure from livestock) or inorganic (e.g., commercial fertilizers). If not used appropriately, these chemical elements can contribute to water eutrophication, for example by excessive dosing and frequency of use. A summary of the eutrophication process is included below:
Additional nutrients (e.g., erroneous of fertilizers) in a water body produce an increase in aquatic plants and phytoplankton.
This increase in aquatic plants and phytoplankton produces: (1) depleted oxygen levels due to the increase in aerobic metabolism; and (2) blocks sunlight which cannot reach the deeper levels of the water.
Depletion of oxygen and lack of sunlight contribute to the death of aerobic and photosynthetic organisms. Their degradation results in an additional depletion of oxygen.
This provokes a change from an aerobic environment to an anaerobic environment, which has a significant effect on the overall aquatic life in the water body. For example, most fish species will die when dissolved oxygen levels are dramatically reduced.
This process is more significant in static waters (e.g., reservoirs and lakes), since in mobile waters, the continual contribution upstream water compensates for the eutrophication process by adding oxygen-rich water into the system.
Surface water eutrophication would only occur as a result of bad practices in the use of fertilizers on irrigated land (maximum 4,240 ha) located within the Project Area, potentially affecting water resources limited to the Project Area, for the duration of the irrigation activities. However, the same considerations as for surface water in Impact W1 have to be taken into account: the potential surface to be irrigated (3,110ha which only represents 5% of the total Project Area); the current use of fertilizers in the Project Area is limited; the Project includes an embedded Training Programme that will contribute to the adequate use of fertilizers. In addition, as the Aguan River and its tributaries have a high dilution capacity, it is considered that even if there were inadequate use of fertilizers resulting in some quantities reaching the rivers in the Project Area (mostly from the groundwater flowing towards the Aguan River and its tributaries), eutrophication would be avoided as a result of dilution process. Taking into account these aspects, the magnitude of the impact is considered to be small: some measurable change in quality or vulnerability, minor loss, or alteration to one or more key characteristics, features, or elements. As described in Impact W1, the sensitivity of the surface water resources (Aguan River, its tributaries and any other surface water sources such as ponds or small lakes) is considered to be high. Small surface water features in the Project Area, not connected to the Aguan River and / or its tributaries, such as ponds and reservoirs, will be more vulnerable to eutrophication

ENVIRONMENTAL RESOURCES MANAGEMENT PAA PROJECT FINANCE A/S
7-22
processes if they are located near irrigated fields where there is bad management of fertilizers. W3 – Effect on river flow
As described in Section 3.5, the irrigation system designed considers two water resource options:
Option 1 - groundwater, extracted via a drilled groundwater well on the beneficiary’s land.
Option 2 - surface water, through the construction of a dug well / pit on the beneficiary’s land, next to the nearest surface water body.
The Alluvial Aquifer is one of the sources of water flow in the Aguan River. Because of this connection, abstraction of water by the Project might produce a depletion of the water, as follows:
Direct depletion of the groundwater level (assessed in Impact W5), in the case of option 1.
Direct depletion of the surface water level, in the case of option 2. Indirect depletion of the surface water level, in the case of option 1.
The effect on river flow will be direct or indirect, based on the water abstraction option considered, potentially affecting surface water resources limited to the Project Area, for the duration of the irrigation activities. A complete Water Resource Balance was developed by PAA Project Finance and Integra Ingeniería in 2017. Annex 8 provides a summary of this. The main conclusion was that the Alto Aguan Valley has a hydric excess of 384 Hm3/year. As described in Section 3.6.2, the irrigation water requirement will be 32 l/m2 over 3.5 months each year. Thus, maximum water consumption will be approximately 14,93 Hm3/year, when considering the maximum irrigation surface (311 ha) and a 100% of use of irrigation systems. This water consumption is 3,89% of the calculated hydric excess in the Alto Aguan Valley (384 Hm3/year), meaning the planned water abstraction by the Project is sustainable and renewable. Sustainable and renewable water abstraction would avoid a depletion of the surface water levels in the Aguan River and / or its tributaries, which will contribute to maintaining the biodiversity associated with the fluvial ecosystems and the use by the local communities: as a water source; for fishing; hydropower; and so on. This would also avoid any effect downstream of the Project Area. In addition, sustainable and renewable water abstraction contributes to maintaining the chemical dilution capacity of the Aguan River and its tributaries, as discussed in Impacts W1 and W2. A changing hydrological
ENVIRONMENTAL RESOURCES MANAGEMENT PAA PROJECT FINANCE A/S
7-23
regime and a depletion of water flow can alter the capacity of the rivers to assimilate water-soluble chemicals (e.g., those from pesticides, herbicides, and fertilizers). In any case, no direct abstraction from the river courses is assumed by the Project activities and therefore a reduction of the streamflow of the river would be caused only by a temporary reduction of the groundwater flow discharge into the river stream. This groundwater discharge depends on geological conditions and the difference of level between groundwater table and the river surface. In the Project Area, the groundwater level is clearly above the river surface level which leads to groundwater to move into the river stream (gaining stream). According to the Water Resource Balance, the total pumping proposed will result in an estimated theoretical depletion of less than 0.5 m in the groundwater levels. It is a negligible change in the groundwater level and thus it will not affect the fact that the river stream is a gaining stream. Taking into account the sustainable and renewable water abstraction considered in the Project Design, the fact the potential surface area to be irrigated (3,110ha) only represents 5% of the total Project Area, and the embedded Training Programme that will include a topic on the adequate use and maintenance of the irrigation equipment which will contribute to minimizing the amount of water used as much as feasible, and consequently, reduce the risk of affecting the river water flow, the magnitude of the impact is considered to be small: some measurable change in quality or vulnerability, minor loss, or alteration to one or more key characteristics, features, or elements. As described in Impacts W1 and W2, the sensitivity of the surface water sources (the Aguan River, its tributaries, and any other surface water sources such as ponds or small lakes) is considered to be high. W4 – Increase of organic matter in groundwater resources Fertilizers provide additional amounts of key chemical elements for the growth of the crops, including nutrients such as nitrogen (N), phosphorus (P), and potassium (K). Fertilizers can be organic (e.g., manure from livestock) or inorganic (commercial fertilizers). In the case of surface water, these chemical elements can contribute to water eutrophication, as described in Impact W2. In the case of groundwater resources, the fertilizers may increase the levels of nitrates in the groundwater, if fertilizers are not used appropriately, for example, they are excessively dosed or applied too frequently. High levels of nitrates in the groundwater can produce health problems (methaemoglobinaemia) as a result of the reduction of nitrates into nitrites. Because of this, the WHO (World Health Organization) provides guideline

ENVIRONMENTAL RESOURCES MANAGEMENT PAA PROJECT FINANCE A/S
7-24
values for nitrate and nitrite concentrations in water for human consumption: 100 mg/l and 3 mg/l, respectively (WHO, 2011)1. Any increase of organic matter in groundwater resources will be indirect, only occurring as a result of bad practices in the use of fertilizers, potentially affecting groundwater resources limited to the Project Area, for the duration of the irrigation activities. However, as for previous impacts, it should be noted that the potential surface to be irrigated (3,110 ha) is relatively reduced, there is limited current use of fertilizers in the Project Area, and the Training Programme embedded into the Project will contribute to the adequate use of fertilizers. In addition, as described in Impact W1, the connection between the Alluvial Aquifer and the Aguan River would result in a potential migration of persistent chemicals to the river. Considering all these aspects, the magnitude of the impact is considered to be small: some measurable change in quality or vulnerability, minor loss, or alteration to one or more key characteristics, features, or elements. As described in W1, taking into account its medium vulnerability and its medium to high importance, the groundwater sensitivity is considered to be medium. W5 – Effect on groundwater level As described in Section 3.5 and Impact W3, the irrigation system designed considers two water source options: groundwater and surface water.
The Alluvial Aquifer is one of the sources of water flow in the Aguan River. Because of this connection, the abstraction of water by the Project might produce a depletion of the water, as follows:
Direct depletion of the groundwater level, in the case of option 1. Direct depletion of the surface water level, in the case of option 2. Indirect depletion of the surface water level, in the case of option 1.
The effect on the groundwater level will be direct, as a result of groundwater abstraction (option 1), potentially affecting groundwater resources limited to the Project Area, for the duration of the irrigation activities As described in Impact W3, the planned water abstraction by the Project is sustainable and renewable. A sustainable and renewable water abstraction would avoid depletion of groundwater levels, and help maintain the use of groundwater by the local communities. A general depletion of the groundwater levels is not expected. The Water Resource Balance estimated a
1 Nitrate and Nitrite in Drinking-water. Background document for development of WHO Guidelines for Drinking-water Quality. WHO, 2011.
ENVIRONMENTAL RESOURCES MANAGEMENT PAA PROJECT FINANCE A/S
7-25
theoretical depletion of the water table for a low porosity substrate of 4% of less than 0.5 m with a extraction of 14,93 Hm3/year without considering any recharge in the aquifer during the dry period; which is not real and therefore these estimations are very conservative. Recharge from rainfall, for example, would compensate for this theoretical depletion (see further details in Annex 8) 1. This aquifer depletion of the water resource is not relevant in terms of water balance based on the calculated hydric excess in the Alto Aguan Valley (384 Hm3/year). Likewise, it is not expected to significantly change in the river flow due to this small depletion in the aquifer's reserve; which is temporary and not cumulative, since it is offset by the rains that also occur in the dry season and within the annual hydrological cycle by the excess of contribution during the wet period. It is unlikely that groundwater wells installed by the Project will be located near other groundwater wells. First of all, because the use of groundwater was reported to be minor in the Project Area, suggesting there are few groundwater wells in the Project Area. Secondly, because the land where the irrigation systems will be installed only represents 5% of the Project Area. Because of this, effects on other groundwater users are not expected. The drawdown in the wells is considered as minor and can be estimated using the Thiem method of well hydraulics and assuming a transmissivity of 470 m2/day, a flow of 10 l/seg. a 10” well diameter and a radius of influence of 400 m in 2.4 m or 2 m when a radius of influence of 100 m is assumed. In addition, the Training Programme will include a topic on the adequate use of the irrigation equipment. This will contribute to minimizing the amount of water used as much as feasible and, consequently, reduce the risk of affecting the groundwater level. Taking into account the aspects mentioned above, the magnitude of the impact is considered to be small. As described in Impacts W1 and W4, the sensitivity of the groundwater is considered to be medium. Mitigation measures
The Project Design includes the following embedded measure:
A Training Programme including a topic on the adequate use of the irrigation equipment. This will contribute to minimizing the amount of water used as much as feasible and, consequently, reduce the risk of affecting the river water flow. As described in Section 1.3, a reduction of water use up to 40% occurs when training on efficient water irrigation, water use optimization, and good agricultural practices is conducted.
1 According to rainfall maps the Project area has about 14 l/m2/week of rain during the dry period.

ENVIRONMENTAL RESOURCES MANAGEMENT PAA PROJECT FINANCE A/S
7-26
The Training Programme will also impart good irrigation practices, aligned with following FAO guidelines:
o Guidelines for Water Management and Irrigation Development.
o Guidelines for Planning Irrigation and Drainage Investment Projects.
The Training Programme will include a topic on the adequate use of chemical products (pesticides, herbicides, and fertilizers) focused on minimizing their use as much as possible and selecting low toxicity pesticides and herbicides. This will contribute to reducing the risk of affecting the water quality and the risk of eutrophication.
Planned monitoring of the irrigation equipment use and maintenance for a period of no less than 10 years, including the beneficiaries’ water consumption (water meters are included in the irrigation system). This embedded measure will enable some of the mitigation measures described below to be monitored.
Beneficiaries will acquire a series of responsibilities linked to the irrigation system. These will include compliance with the mitigation measures described below.
The location of the water abstraction source will be selected making sure that it is situated away from other water sources (e.g. other existing groundwater wells) and away from potential contamination sources.
The following mitigation measures will be implemented in order to minimize the loss of surface and groundwater quality, surface water eutrophication, and any increase of organic matter in the groundwater as a result of the inadequate use of pesticides, herbicides, and fertilizers:
A Pesticides, Herbicides, and Fertilizer Management Plan will be prepared and implemented by the SAG.
The SAG will ensure that the monitoring of the use of pesticides, herbicides, and fertilizers is undertaken by SENASA.
The SAG will ensure that the monitoring of the pesticides, herbicides, and fertilizers sold in Olanchito by consultation in distribution shops is undertaken by SENASA.
The SAG will ensure that SENASA monitors that only products recommended by SENASA are used.
The SAG will ensure that the monitoring of the nitrate and nitrite levels in the groundwater wells installed as a result of the Project activities is undertaken by SENASA.
Note: considering the low risk for contamination from pesticides and the high costs of analysing pesticides, monitoring of the levels of pesticides in irrigation has been deemed unnecessary. The mitigation measures in place to prevent contamination are considered sufficient. Moreover, the following recommendation measure is provided, considered as good management practice:

ENVIRONMENTAL RESOURCES MANAGEMENT PAA PROJECT FINANCE A/S
7-27
The SAG will require beneficiaries to implement a logbook to record any pesticides and/or herbicides used.
The following mitigation measures will be implemented in order to minimize the effect on river flow and groundwater levels as a result of inappropriate irrigation:
The SAG will ensure beneficiaries follow irrigation plans and schedules when using the irrigation equipment.
The beneficiaries will share and discuss water consumption in the CRELES, in order to improve the management of irrigation water.
A Water Management Plan will be prepared and implemented by the SAG. Aspects to be covered by the plan include: an assessment of water use and monitoring data; coordination with other water users and management response as needed; participation of the local administration; and control of the groundwater wells installed.
The SAG will ensure that the monitoring of the Aguan River flow upstream and downstream of the Project Area is undertaken by UMA. Two monitoring events will be conducted during the year: in the dry and rainy season. This monitoring will be extended to the main tributaries of the Aguan River within the Project Area, limited to one location only, in the proximity of their union with the Aguan River.
The SAG will ensure that the monitoring of the groundwater levels in the wells installed for the Project activities, as well as in any other potential existing well located within an approximate ratio of 100 m from the installed groundwater wells, is undertaken by UMA.
In addition, the following recommendation measure is provided, considered as good management practice:
The SAG will require that beneficiaries implement a logbook to record the water pumped (or hours of pumping).
Residual impacts
Table 7.8 summarises the impacts on the water resources as a result of the Project activities during the operation phase. The embedded measures considered in the Project Design and the mitigation measures defined during the impact assessment result in the Residual Impacts being assessed as Minor.

ENVIRONMENTAL RESOURCES MANAGEMENT PAA PROJECT FINANCE A/S
7-28
Table 7.8 Summary of impact assessment on the water resources during the operation phase
Impact / Risk Measures to address the impact / risk Residual Impact W1 - Loss of surface and groundwater quality
Embedded measures: Implementation of the Project’s
Training Programme including a topic on the adequate use of the irrigation equipment. This will contribute to minimizing the amount of water used as much as feasible and, consequently, reduce the risk of affecting the river water flow.
Training Programme including good irrigation practices (aligned with FAO guidelines).
Implementation of the Project’s Training Programme including a topic on the adequate use of chemical products (pesticides, herbicides, and fertilizers) focused on minimizing their use as much as possible and selecting low toxicity pesticides and herbicides. This will contribute to reducing the risk of affecting the water quality and the risk of eutrophication.
Monitoring of the irrigation equipment for a period of no less than 10 years including the beneficiaries’ water consumption (water meters are included in the irrigation system).
The location of the water abstraction source will be selected making sure that it is situated away from other water sources (e.g. other existing groundwater wells) and away from potential contamination sources.
Beneficiaries required to comply with mitigation measures proposed.
Minor Surface water resources
in the Project Area of high sensitivity.
Loss of surface water quality is limited to an indirect effect resulting from bad practices in the use of herbicides and pesticides.
Irrigation limited to 5% of the total surface area in the Project Area.
Irrigation limited to 3.5 months a year (105 days).
Limited use of pesticides and herbicides in the Project Area.
Dilution capacity of the rivers in the Project Area.
Mitigation measures: Development and implementation of a
Pesticides and Herbicides Management Plan.
Monitoring of pesticides and herbicides used.
Monitoring of pesticides and herbicides sold in Olanchito.
Monitor that only products recommended by SENASA are used.
Monitoring of the nitrate and nitrite levels in the groundwater wells installed as a result of the Project activities.
Implementation of logbook with records of pesticides and herbicides used recommended as good practice.
Negligible Groundwater resources
in the Project Area of medium sensitivity.
Loss of groundwater quality is limited to an indirect effect resulting from bad practices in the use of herbicides and pesticides.
Irrigation limited to 5% of the total surface area in the Project Area.
Irrigation limited to 3.5 months a year.

ENVIRONMENTAL RESOURCES MANAGEMENT PAA PROJECT FINANCE A/S
7-29
Impact / Risk Measures to address the impact / risk Residual Impact Limited use of
pesticides and herbicides in the Project Area.
Connection between the Alluvial Aquifer and the Aguan River enables the migration of persistent chemicals through the groundwater to the river.

ENVIRONMENTAL RESOURCES MANAGEMENT PAA PROJECT FINANCE A/S
7-30
Impact / Risk Measures to address the impact / risk Residual Impact Impact / Risk Measures to address the impact / risk Residual Impact
• W2 – Eutrophication of surface water.
Same embedded measures as W1. Mitigation measures: Development and implementation of
a Fertilizer Management Plan. Monitoring of fertilizers used. Monitoring of fertilizers sold in
Olanchito. Monitoring of the nitrate and nitrite
levels in the groundwater wells installed as a result of the Project activities.
Implementation of logbook with records of fertilizers used recommended as good practice.
Minor Surface water resources in
the Project Area of high sensitivity.
Loss of surface water quality is limited to an indirect effect resulting from bad practices in the use of fertilizers.
Irrigation limited to 5% of the total surface area in the Project Area.
Irrigation limited to 3.5 months a year (105 days).
Limited use of fertilizers in the Project Area.
Dilution capacity of the rivers in the Project Area.
• W3 – Effect on river flow.
Same embedded measures as W1. Mitigation measures:
Follow irrigation plans and schedules as per FAO’s guidelines.
Development and implementation of a Water Management Plan. Aspects to be covered by the plan include: an assessment of water use and monitoring data; coordination with other water users and management response as needed; participation of the local administration; and control of the groundwater wells installed.
Water flow monitoring in Aguan River and main tributaries (upstream and downstream). Two monitoring events will be conducted during the year: in the dry and rainy season. This monitoring will be extended to the main tributaries of the Aguan River within the Project Area, limited to one location only, in the proximity of their union with the Aguan River.
Implementation of logbook with records of water pumped recommended as good practice.
Minor Surface water resources in
the Project Area of high sensitivity.
Irrigation limited to 5% of the total surface area in the Project Area.
Irrigation limited to 3.5 months a year (105 days).
Water abstraction by the Project activities will be sustainable and renewable, according to the Water Resource Balance developed by PAA Project Finance and Integra Ingeniería in 2017.
Impact / Risk Measures to address the impact / risk Residual Impact

ENVIRONMENTAL RESOURCES MANAGEMENT PAA PROJECT FINANCE A/S
7-31
Impact / Risk Measures to address the impact / risk Residual Impact • W4 -
Increase of organic matter in the groundwater.
Same embedded measures as W1. Mitigation measures: Development and implementation of
a Fertilizer Management Plan. Monitoring of fertilizers used. Monitoring of fertilizers sold in
Olanchito. Monitoring of the nitrate and nitrite
levels in the groundwater wells installed as a result of the Project activities.
Implementation of logbook with records of fertilizers used recommended as good practice.
Negligible Groundwater resources in
the Project Area of medium sensitivity.
Loss of groundwater quality is limited to an indirect effect resulting from bad practices in the use of fertilizers.
Irrigation limited to 5% of the total surface area in the Project Area.
Irrigation limited to 3.5 months a year (105 days).
Limited use of fertilizers in the Project Area.
Connection between the Alluvial Aquifer and the Aguan River enables the migration of persistent chemicals through the groundwater to the river.
• W5 – Effect on groundwater level.
Same embedded measures as W1. Mitigation measures:
Follow irrigation plans and schedules as per FAO’s guidelines.
Development and implementation of a Water Management Plan. Aspects to be covered by the plan include: an assessment of water use and monitoring data; coordination with other water users and management response as needed; participation of the local administration; and control of the groundwater wells installed.
Groundwater level monitoring in the wells installed for the Project activities, as well as in any other potential existing well located within an approximate ratio of 100 m from the installed groundwater wells.
Implementation of logbook with records of water pumped recommended
Negligible Irrigation limited to 5%
of the total surface area in the Project Area.
Irrigation limited to 3.5 months a year (105 days).
Water abstraction by the Project activities will be sustainable and renewable, according to the Water Resource Balance developed by PAA Project Finance and Integra Ingeniería in 2017.
It is unlikely that groundwater wells installed by the Project are located near other groundwater wells.
Source: ERM, 2018
7.6 BIODIVERSITY
7.6.1 Overview
This section assesses the potential impacts on the biodiversity (habitats, flora, and fauna) as a result of the Project activities. Box 7.5 presents the key sources
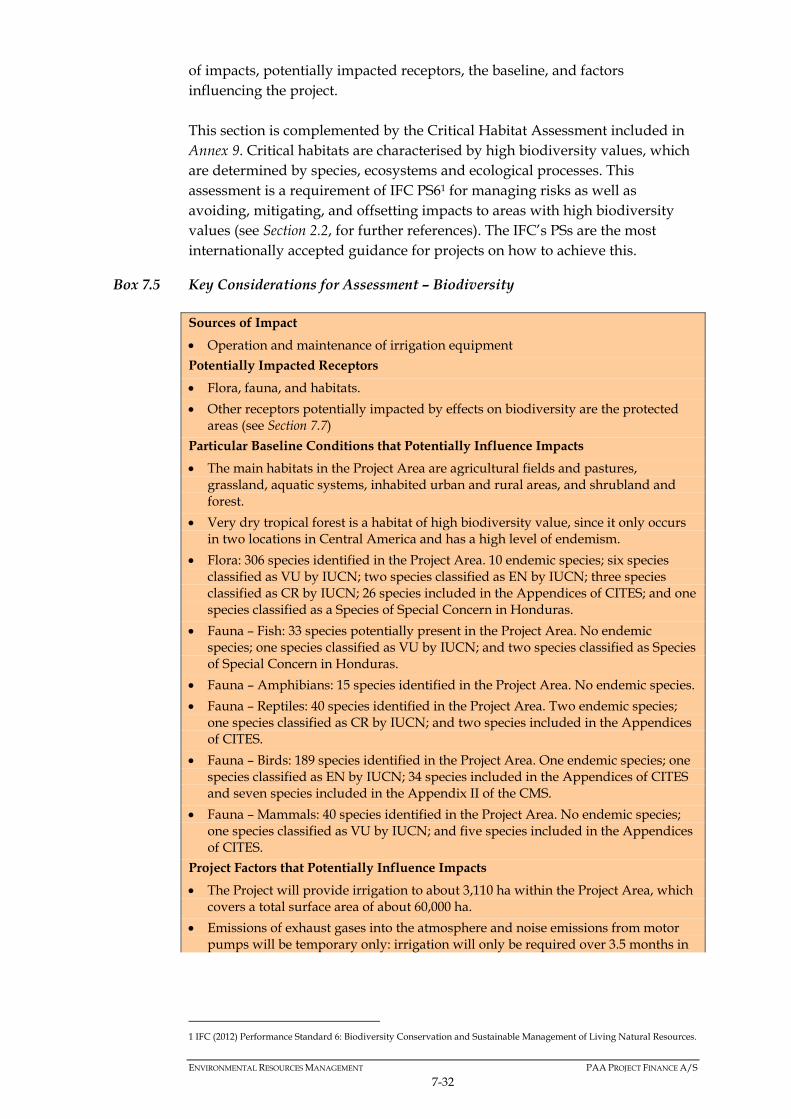
ENVIRONMENTAL RESOURCES MANAGEMENT PAA PROJECT FINANCE A/S
7-32
of impacts, potentially impacted receptors, the baseline, and factors influencing the project. This section is complemented by the Critical Habitat Assessment included in Annex 9. Critical habitats are characterised by high biodiversity values, which are determined by species, ecosystems and ecological processes. This assessment is a requirement of IFC PS61 for managing risks as well as avoiding, mitigating, and offsetting impacts to areas with high biodiversity values (see Section 2.2, for further references). The IFC’s PSs are the most internationally accepted guidance for projects on how to achieve this.
Box 7.5 Key Considerations for Assessment – Biodiversity
Sources of Impact
Operation and maintenance of irrigation equipment
Potentially Impacted Receptors
Flora, fauna, and habitats.
Other receptors potentially impacted by effects on biodiversity are the protected areas (see Section 7.7)
Particular Baseline Conditions that Potentially Influence Impacts
The main habitats in the Project Area are agricultural fields and pastures, grassland, aquatic systems, inhabited urban and rural areas, and shrubland and forest.
Very dry tropical forest is a habitat of high biodiversity value, since it only occurs in two locations in Central America and has a high level of endemism.
Flora: 306 species identified in the Project Area. 10 endemic species; six species classified as VU by IUCN; two species classified as EN by IUCN; three species classified as CR by IUCN; 26 species included in the Appendices of CITES; and one species classified as a Species of Special Concern in Honduras.
Fauna – Fish: 33 species potentially present in the Project Area. No endemic species; one species classified as VU by IUCN; and two species classified as Species of Special Concern in Honduras.
Fauna – Amphibians: 15 species identified in the Project Area. No endemic species.
Fauna – Reptiles: 40 species identified in the Project Area. Two endemic species; one species classified as CR by IUCN; and two species included in the Appendices of CITES.
Fauna – Birds: 189 species identified in the Project Area. One endemic species; one species classified as EN by IUCN; 34 species included in the Appendices of CITES and seven species included in the Appendix II of the CMS.
Fauna – Mammals: 40 species identified in the Project Area. No endemic species; one species classified as VU by IUCN; and five species included in the Appendices of CITES.
Project Factors that Potentially Influence Impacts
The Project will provide irrigation to about 3,110 ha within the Project Area, which covers a total surface area of about 60,000 ha.
Emissions of exhaust gases into the atmosphere and noise emissions from motor pumps will be temporary only: irrigation will only be required over 3.5 months in
1 IFC (2012) Performance Standard 6: Biodiversity Conservation and Sustainable Management of Living Natural Resources.

ENVIRONMENTAL RESOURCES MANAGEMENT PAA PROJECT FINANCE A/S
7-33
the dry season (from January to April) and probably for 3-4 days / week, rather than on a daily basis.
311 motor pumps/generators are expected to be distributed.
Time of operation is estimated to be about 10 years.
Waste generation will be limited to lubricants used in the maintenance of the irrigation equipment.
Accidental spills of fuel (diesel) used by the motor pumps.
The irrigation equipment will not be used in natural or critical habitats as it will be limited to agricultural land for irrigation.
References
Chapter 3 Project Description and Alternatives – specifically Section 3.1, Section 3.4.1, Section 3.5, Section 3.6.1 and Section 3.6.2.
Chapter 5 Baseline Description – specifically Section 5.3.1, Section 5.3.2 and Section 5.3.3.
Source: ERM, 2018
Table 7.9 presents the key impacts of the Project on the biodiversity.
Table 7.9 Key Potential Impacts – Biodiversity
Pre-operation phase Operation phase Abandonment phase None B1– Disturbance to fauna.
B2 – Disturbance to flora.
B3 – Loss of natural habitats and subsequent loss of flora and fauna.
None
Source: ERM, 2018
7.6.2 Operation phase
Potential impacts
B1- Disturbance to fauna The operation and maintenance of the irrigation equipment will produce:
Emissions of pollutants (CO, HC, NOx, VOCs and PM) to the atmosphere. As described in Impact CA1 (Section 7.2), the maximum estimated diesel consumption is less than 2,500 m3/year.
Noise emissions. As described in Impact N1 (Section 7.3), the motor pumps are a source of noise, typically ranging between 60 and 70 dBA.
Accidental spills of fuel (diesel) or wastes (lubricants), as described in Section 7.16 Non-routine events.
Increased of use of chemical products (herbicides, pesticides, and fertilizers), as an indirect consequence of the improvement of the agricultural / livestock sector in the Project Area.

ENVIRONMENTAL RESOURCES MANAGEMENT PAA PROJECT FINANCE A/S
7-34
All these factors have the potential to disturb the fauna in the proximity of the irrigated fields. In the case of air pollutants and noise, the disturbance would be limited to a temporary displacement of fauna, which would probably move away from the areas where these factors are present. Disturbance can also affect breeding and foraging activities in fauna. Accidental spills of fuel (diesel) or wastes (lubricants or bentonite-based muds), and an increase in the use of chemical products (herbicides, pesticides and fertilizers), would result in different effects. Fuel (diesel), waste (lubricants or bentonite-based muds), herbicides and pesticides, can include in their composition toxic chemical compounds, which would affect the fauna if ingested. It should be noted that not all pesticides and herbicides lead to serious consequences for the fauna. The most likely scenario involves ingestion of plants containing traces of herbicides and / or pesticides, which can be found within the crop field or the field borders. The consequences to the fauna will vary depending on the toxicity of the herbicides / pesticides and the quantity ingested; these can include:
Loss of individuals. Pesticides may affect the fauna indirectly when part of its habitat or
food supply is modified. Pesticides may diminish insect populations that are fed on by bird or fish species; insect pollinators may be reduced too, thereby affecting plant pollination.
Herbicides may reduce food, cover, and nesting sites needed by insect, bird, and mammal populations.
Ingestion of fuel (diesel) or waste (lubricants) is not likely, but disturbance can occur due to dermal contact, if, for example, a spill occurs that is not removed promptly. In the case of fertilizers, as described in Impact W2, the eutrophication process can have negative consequences for the aquatic life of a water body due to the transformation from an aerobic environment to an anaerobic environment. Most fish species are, for example, very sensitive to the levels of dissolved oxygen in the water and loss of individuals can occur in an anaerobic environment. This impact on the fauna can be characterised as follows:
Direct impact as an immediate effect of the Project activities, in the case of disturbance by air pollutants and noise.
Indirect impact, only occurring as a result of bad practices in the use of herbicides, pesticides, and / or fertilizers and through accidental spills of fuel (diesel) or waste (lubricants or bentonite-based muds).

ENVIRONMENTAL RESOURCES MANAGEMENT PAA PROJECT FINANCE A/S
7-35
Local extent only, limited to the Project Area. No disturbance to fauna is expected outside the Project Area.
Duration limited to the operation phase, estimated to be about 10 years, taking into account the life expectancy of the equipment. In addition, over this period, the impact would occur intermittently: only during the irrigation period, comprising 3.5 months in the dry season (from January to April), and probably 3-4 days/week, rather than daily.
It should be taken into account that:
The residual impact of Impact CA1 was assessed as negligible (Section 7.2). The same assessment applies for the disturbance to fauna due to air pollutant emissions: the motor pumps/generators will not function continuously; the Project Design involves an embedded Training Programme that includes technical training on the adequate use and maintenance of the irrigation equipment (minimizing its use as much as possible); the emissions from the motor pumps/generators are expected to be lower than those produced by other air pollutant sources in the Project Area (e.g., vehicles); and there will be a scattered distribution of motor pumps/generators in the Project Area (one every 140 ha).
The residual impact of Impact N1 was assessed as negligible (see Section 7.3). The same assessment applies in the case of the disturbance to fauna due to noise levels, for the same reasons described above for the air pollutant emissions.
With regard to disturbance to fauna due to exposure to toxic chemical compounds present in fuel (diesel), waste (lubricants), herbicides and pesticides, it should be noted that:
o The potential surface to be irrigated only represents 5% of the total surface area of the Project Area. Therefore, any potential exposure would only occur in a very small part of the Project Area.
o Exposure to fuel (diesel) and waste (lubricants or bentonite-based muds) would only occur as a result of an accidental spill.
o Exposure to pesticides and herbicides would only occur as a result of their inappropriate use. However, they are only used in a limited way in the Project Area and the Training Programme will include a topic on their adequate use, focused on minimizing their use as much as possible and selecting low toxicity pesticides and herbicides.
With regard to the disturbance of fauna due to eutrophication, it
should be noted that: o The potential surface to be irrigated only represents 5 % of the
total surface area of the Project Area. Therefore, eutrophication processes could only occur in a very small part of the Project Area.

ENVIRONMENTAL RESOURCES MANAGEMENT PAA PROJECT FINANCE A/S
7-36
o An eutrophication process would only occur as a result of the inappropriate use of fertilizers. However, these are used in a limited way in the Project area and the Training Plan will include a topic on their adequate use.
o Even in the case that some quantities of fertilizers reached the rivers in the Project Area, eutrophication would be avoided as a result of dilution thanks to the high dilution capacity of the Aguan River and its tributaries. Only small surface water bodies not connected to the Aguan River and / or its tributaries, such as ponds and reservoirs, would be vulnerable to eutrophication.
The Project will provide irrigation equipment to be installed in areas
already used for agricultural or pasture purposes. No irrigation equipment will be installed in natural habitats. The risk of disturbance to fauna in agricultural fields and pastures is low since this habitat has a continuous level of disturbance due to on-going agricultural and livestock activities. Because of this, if any disturbance occurs, it is likely to only affect species used to human presence (frequent in agricultural fields and livestock pastures).
Considering the aspects mentioned above, the magnitude of the impact is considered to be negligible. The sensitivity of the fauna depends on the particular species, as described in Section 5.3.3., as different species have different levels of sensitivity. B2- Disturbance to flora The following factors related to the operation and maintenance of the irrigation equipment (see Impact B1 for further details) have the potential to disturb the flora present in the proximity of irrigated fields:
Emissions of air pollutants to the atmosphere. Accidental spills of fuel (diesel) or waste (lubricants or bentonite-based
muds). Increased of use of chemical products (herbicides and pesticides).
Air pollutants can affect plants, for example: PM emissions can affect photosynthesis by reducing the exposure of leaves to the sunlight; and NOx can produce leaf damage, result in reduced growth, and increase susceptibility to diseases. Accidental spills of fuel (diesel) or wastes (lubricants or bentonite-based muds), and an increase in the use of chemical products (herbicides, pesticides and fertilizers), would result in different effects. Herbicides are products designed to eliminate plant species that can interfere in normal crop development. They have different mechanism of action, such

ENVIRONMENTAL RESOURCES MANAGEMENT PAA PROJECT FINANCE A/S
7-37
as inhibiting photosynthesis or mitosis. When herbicides are applied by spray, they can hit non-target vegetation. Fuel (diesel), waste (lubricants), and pesticides can include in their composition toxic chemical compounds, which can also affect the flora, in the case of contact, both through the surface of the plant tissues or root absorption. This impact on the flora can be characterised as follows:
Direct impact as an immediate effect of the Project activities, in the case disturbance by air pollutants.
Indirect impact, only occurring as a result of bad practices in the use of herbicides and / or pesticides and by accidental spills of fuel (diesel) or wastes (lubricants or bentonite-based muds).
Local extent only, limited to the Project Area. No disturbance on flora is expected outside the Project Area.
Duration limited to the operation phase, estimated to be about 10 years, taking into account the life expectancy of the equipment. In addition, over this period, the impact would occur intermittently: only during the irrigation period, comprising 3.5 months in the dry season (from January to April), and probably 3-4 days/week, rather than daily.
The magnitude of the impact is considered to be negligible due to the following considerations:
The residual impact of Impact CA1 was assessed as negligible (see Section 7.2). The same assessment applies for the disturbance to flora due to air pollutant emissions: the motor pumps will not function continuously; the Project Design involves an embedded Training Programme that includes technical training on the adequate use and maintenance of the irrigation equipment (minimizing its use as much as possible); the emissions from the motor pumps are expected to be lower than those produced by other air pollutant sources in the Project Area (e.g., vehicles); and there will be a scattered distribution of motor pumps in the Project Area (one every 140 ha).
With regard to disturbance to flora due to exposure to toxic chemical
compounds present in fuel (diesel), waste (lubricants), herbicides and pesticides, it should be noted that:
o The potential surface to be irrigated represents only 5% of the total surface area of the Project Area. Therefore, any potential exposure would only occur in a very small part of the Project Area.
o Exposure to fuel (diesel) and waste (lubricants or bentonite-based muds) would only occur as a result of an accidental spill.
o Exposure to pesticides would only occur as a result of their inappropriate use. However, these are used in a limited way in

ENVIRONMENTAL RESOURCES MANAGEMENT PAA PROJECT FINANCE A/S
7-38
the Project area and the Training Plan will include a topic on their adequate use, focused on minimizing their use as much as possible and selecting low toxicity pesticides and herbicides.
The Project will provide irrigation equipment to be installed in areas
already used as agricultural fields or pastures. No irrigation equipment will be installed in natural habitats. These habitats – agricultural fields and pastures – are not characterized by a rich flora. Therefore, the risk of disturbance to flora is low and mostly limited to the action of pesticides, when used, which generally involves widely distributed species that affect the normal growth of crop species. Such widely distributed species are not likely to have significant conservation or protection concerns (for example, ruderal species).
Considering the aspects mentioned above, the magnitude of the impact is considered to be negligible. The sensitivity of the flora described in Section 5.3.2 depends on the particular plant species, as different species have different levels of sensitivity. B3- Loss of natural habitats and subsequent loss of flora and fauna An irrigation plan has the potential to modify the habitats where it is implemented, since irrigation could produce a change in the environment. There are two potential effects of the operation and maintenance of the irrigation equipment in the Project Area:
Direct effect, produced by the potential changes of habitat Indirect effect, produced by new land potentially being transformed
into irrigated land, to increase agriculture and livestock efficiency.
In both cases, in addition to the effect on habitats, there is an additional effect on the flora and fauna, which could also be affected as result of a change or loss of habitat, assessed already in previous sections In the first case, the irrigation equipment will be used in existing agricultural fields and pastures, in order to improve their productivity during the dry season. The land to be irrigated will already be a modified habitat which could be modified slightly further by being artificially maintained in a condition of higher humidity than “natural” conditions. On the other hand, if the run off from irrigated areas, due to topographical conditions, could enter forested areas, the maintenance of higher humidity than “natural” conditions in those habitats, adapted to summer dry conditions could result in minor habitat change. With regard to indirect effects, it is reasonable to think that an efficient irrigation project will increase farm productivity. With increased productivity, farmers could consider the option of expanding their areas of production, meaning natural habitats being transformed into new productive areas (agricultural fields and pastures). This issue was the subject of a detailed

ENVIRONMENTAL RESOURCES MANAGEMENT PAA PROJECT FINANCE A/S
7-39
assessment conducted during the June 2018 field survey. The main key findings noted during the field survey are listed below:
There are several criteria that must be met in order to obtain the irrigation equipment. One of these criteria aims specifically to avoid any effect on natural habitats: in principle, beneficiaries with land within the protected areas will not be eligible for irrigation equipment, although this could be considered on a case-by-case basis, depending on where the land to be irrigated would be located with relation to the remaining well-preserved critical habitat.
Most of the surface area in the Project Area is already agricultural fields and pastures (approximately of 50.5%). As described in Section 5.3, the area of agricultural fields and pastures has increased over recent decades, so that the remaining surface occupied by natural habitats is smaller and, in most cases, is already part of the protected areas (RVSCEH, see Section 7.7).
The transformation of a natural habitat into an agricultural field or pasture would require a financial effort from the farmer (e.g., additional workers hired for chopping activities). This is not realistic when there is already an excess of available agricultural fields and pastures where irrigation equipment could be installed without the need for further financial investment. The limiting factor in the economy of the activity is not land but water availability in the dry season. Overall, the density of cattle on the farms observed during the field survey is not high. For example, during a meeting held with small producers, it was reported that an approximate average of cattle per farm is 40 animals. It was considered that small producers were those with farms between 11 and 39 ha. If considering an average surface of 25 ha, the resulting density of cattle would be 1.6 animals/ha. Although this is not the exact average of cattle per hectare in the Project Area, it is a good estimate of the cattle density in the context of the Project Area. For example, there are areas in the EU where the density of cattle is higher than 7.5 animals/ha (Eurostat, 2017)1. Moreover, it is likely that the average of cattle in the Project Area is lower than 1.6 animals/ha, since only the feedback from small producers was used in this estimation. It is very likely that larger producers have lower densities (although more cattle). Therefore, it is considered that there is sufficient room to increase the amount of cattle, without the need to increase the surface area dedicated to agricultural fields and pastures. There would be a change in the livestock production system, from an extensive pattern to an
1 http://ec.europa.eu/eurostat/statistics-explained/index.php/Agri-environmental_indicator_-_livestock_patterns

ENVIRONMENTAL RESOURCES MANAGEMENT PAA PROJECT FINANCE A/S
7-40
intermediate pattern, where cattle would be kept using the same extensive management during the rainy season, but would be intensively managed during the dry season, being housed and fed with silage.
One of the current reasons for the loss of natural habitats in the Aguan Valley is the search for new grazing areas for the cattle during the dry season. During the rainy season, the cattle is kept at the bottom of the valley, where there is enough food for them. However during the dry season, food is not as abundant, and farmers may take the cattle to upper areas of the hills. Here they chop down trees in forested areas to create new grazing land and keep the cattle fed. The immediate consequence of implementing the irrigation project would be that the cattle would not need to move to higher areas during the dry season. They could be kept near the farms, at the bottom of the valley, in fields already devoted to agriculture and pasture, and be fed with silage produced as a result of the improved crop management made possible by the irrigation system.
The Project could in fact benefit the conservation of the natural habitats in the Protected Area, such as the very dry tropical forest, and, consequently, the key species within the habitat, such as the Honduran emerald hummingbird (Amazilia luciae) and the black-chested spiny-tailed iguana (Ctenosaura melanosterna). The impact on the habitats can therefore be characterised as follows:
Direct impact, as an immediate effect of the Project activities. Indirect impact, only occurring due to the potential transformation of
natural land for agriculture and livestock activity. In both cases, the impact would be of local extent only, limited to the
Project Area. No effect on habitats, flora, or fauna is expected outside the Project Area.
The duration is limited to the operation phase, estimated to be about 10 years, taking into account the life expectancy of the equipment.
Based in the rationale provided above, the magnitude of this impact is as follows:
Negligible, with regard to the direct change of habitats as any habitat modification would be limited to modification of the existing agricultural fields and pastures which are considered to have a low sensitivity, due to their continuous exposure to human activities (agriculture and livestock).
Minor or negligible, depending on the actual location of the plots to be irrigated, in the case of the potential run off from irrigated plot towards forested areas.

ENVIRONMENTAL RESOURCES MANAGEMENT PAA PROJECT FINANCE A/S
7-41
Medium with a positive/beneficial consequence, with regard to the indirect change of habitat, as the transformation of natural land to increase agriculture and livestock activity is not expected due to the reasons described above: the selection criteria of beneficiaries, the financial limiting factors and the fact that the irrigation system during the dry season will keep the cattle in fields already devoted to agriculture and pasture. In addition, based on the feedback received from local environmental experts, ASIDE and ICF, it is expected that the diversification resulting from the Project will contribute to the conservation of the remaining natural habitats in the Project Area.
Mitigation measures
The Project design includes the following embedded measures:
Development of a Biodiversity Management Plan prepared and implemented by the SAG. This will contribute to increasing awareness of the importance of the biodiversity and how to sustainably manage farms with regard to biodiversity.
Potential beneficiaries whose land is partially within or adjacent to protected areas and/or natural habitats (such as shrubland or forest), will be selected on a case-by-case basis by the PIU-SAG, with the contractual condition that these protected areas are not within the irrigated plot, and the natural habitats are maintained as they are, including prevention of irrigation or its run-off entering the natural habitat, if these beneficiaries are ultimately provided with Project irrigation equipment.
The travelling reels/micro-sprinklers hold a hose or PVC connection of 125 ms maximum length, which have a maximum irrigation distance of 25 ms from each hose, from irrigation hydrant/micro-sprinklers locations. In this way it is easy to locate the hydrantmicro-sprinkler location nearest the natural habitat (if relevant) at a sufficient distance as to irrigate the plot without irrigating the natural habitat
Embedded mitigation measures described in Impact CA1 (see Section 7.2), regarding the disturbance of fauna (Impact B1) and flora (Impact B2) as a result of the emissions of pollutants to the atmosphere.
Embedded mitigation measures described in Impact N1 (see Section 7.3), regarding the disturbance of fauna (Impact B1) as a result of the emission of noise.
Embedded mitigation measures described in Section 7.14 Non-routine events), regarding the disturbance of fauna (Impact B1) and flora (Impact B2) as a result of accidental spills of fuel (diesel) or waste (lubricants or bentonite-based muds).
Embedded mitigation measures described in the impacts on surface water and groundwater resources (see Section 7.5), regarding the disturbance of fauna (Impact B1) and flora (Impact B2) as a result of the increased use of chemical products (herbicides, pesticides, and fertilizers).

ENVIRONMENTAL RESOURCES MANAGEMENT PAA PROJECT FINANCE A/S
7-42
In addition to these embedded mitigation measures, it should be noted that the mitigation measures to be adopted in Impact S1 (see Section 7.4), Impacts W1,W2, and W4 (see Section 7.5) will also be beneficial for minimizing and avoiding any disturbance to the fauna (Impact B1) and flora (Impact B2). Residual impacts
Table 7.10 summarises the impacts on biodiversity as a result of the Project activities during the operation phase. The embedded measures considered in the Project Design result in the Residual Impacts being assessed as Negligible and Positive.

ENVIRONMENTAL RESOURCES MANAGEMENT PAA PROJECT FINANCE A/S
7-43
Table 7.10 Summary of impact assessment on the biodiversity during the operation phase
Impact / Risk Measures to address the impact / risk Residual Impact B1– Disturbance to fauna.
Embedded measures: Development and implementation
of a Biodiversity Management Plan.
Case-by-case selection of potential beneficiaries whose plot is partially within or adjacent to protected areas and/or natural habitats, such as shrubland and forest, with the contractual
condition, with the contractual condition that these protected areas are not within the irrigated plot, and the natural habitats are maintained as they are, including prevention of irrigation or its run-off entering the natural habitat if ultimately provided with Project irrigation equipment.
The selection will include a site visit the beneficiary plots to confirm that no sensitive resources will be affected.
Embedded mitigation measures as described in: o Impact CA1, o Impact N1, o Impact S1, o Impact W1, o Impact W2, o Impact W4.
Embedded mitigation measures as described in: non-routine events (Acc1) (see Section 7.14), Mitigation measures:
• Mitigation measures as described in:
o Impact CA1, o Impact N1, o Impact S1, o Impact W1, o Impact W2, o Impact W4.
Negligible Impact CA1 and Impact N1
were assessed as Negligible. Exposure to toxic chemical
compounds only occurring as the result of an accidental spill.
Irrigation equipment to be installed in areas already used as agricultural fields or pastures, where presence of fauna is lower than in natural habitats.
Irrigation limited to up to 5% of the total surface area in the Project Area.
Irrigation limited to 3.5 months a year.
Only agricultural fields and pasture to be irrigated; no irrigation systems installed in natural habitats
B2 – Disturbance to flora.
Negligible Impact CA1 assessed as
Negligible. Exposure to toxic chemical
compounds only occurring as the result of an accidental spill.
Irrigation equipment to be installed in areas already used as agricultural fields or pastures, where presence of fauna is lower than in natural habitats.
Irrigation limited to up to 5% of the total surface area in the Project Area.
Irrigation limited to 3.5 months a year.
Only agricultural fields and pasture to be irrigated; no irrigation systems installed in natural habitats

ENVIRONMENTAL RESOURCES MANAGEMENT PAA PROJECT FINANCE A/S
7-44
Impact / Risk Measures to address the impact / risk Residual Impact B3 – Loss of natural habitats and subsequent loss of flora and fauna.
Negligible Direct impact – change of
habitat Only agricultural fields and
pasture to be irrigated; no irrigation systems installed in natural habitats
Positive – Medium The expectation of local
environmental experts, ASIDE and ICF is that the irrigation will benefit the conservation of natural habitats and will not contribute to its transformation.
Source: ERM, 2018
7.7 PROTECTED AREAS/ CRITICAL HABITATS
7.7.1 Overview
This section assesses the potential impacts on protected areas and critical habitats as a result of the Project activities. Box 7.6 presents the key sources of impacts, potentially impacted receptors, the baseline, and factors influencing the project.
Box 7.6 Key Considerations for Assessment – Protected Areas
Sources of Impact
Operation and maintenance of irrigation equipment
Potentially Impacted Receptors
Protected Areas: Honduran Emerald Hummingbird Wildlife Refuge (RVSCEH).
The other receptor potentially impacted by effects on the protected areas is biodiversity/ critical habitats (see Section 7.6 and Annex 9).
Particular Baseline Conditions that Potentially Influence Impacts
Main ecological features in the RVSCEH and adjacent Critical Habitats are: (1) fauna – Honduran emerald hummingbird and black-chested spiny-tailed iguana, both endemic; (2) up to 10 species of endemic flora; (3) very dry tropical forest habitat.
Project Factors that Potentially Influence Impacts
The Project will provide irrigation to about 4,240 ha within the Project Area, which covers a total surface of about 60,000 ha.
The irrigation equipment will not be used in natural or critical habitats within the limits of any protected area.

ENVIRONMENTAL RESOURCES MANAGEMENT PAA PROJECT FINANCE A/S
7-45
References
Chapter 3 Project Description and Alternatives – specifically Section 3.1, Section 3.4.1, Section 3.5, Section 3.6.1 and Section 3.6.2.
Chapter 5 Baseline Description – specifically Sections 5.3.4& 5.3.5
Annex 9
Source: ERM, 2018
Table 7.11 presents the key impacts of the Project on the protected areas.
Table 7.11 Key Potential Impacts – Protected Areas & Critical Habitats
Pre-operation phase Operation phase Abandonment phase None PA1 – Effect on habitats, flora,
and fauna in the Protected Area/ Critical Habitats during operation
None
Source: ERM, 2018
Operation phase Potential impacts
PA1 – Effect on habitats, flora and fauna in the Protected Area/Critical Habitats This has already been assessed under Impacts B1, B2 and B3. As any impact on the protected area (PA1) and other potential Critical Habitats outside Protected Areas (possible but of relatively infrequent occurrence and limited footprint, as explained in Section 5.4.5 of the Baseline) would occur as a result of the effects on habitats within the protected area, or any species of fauna and / or flora considered a main ecological feature in the Protected Area, the conclusions of those impacts are the same as for this impact. In particular and with respect to Critical Habitats, as explained in previous sections and Annex 9, with the application of the mentioned mitigation measures, the project itself could result in a Net Gain for the Critical Habitats within the project footprint. Mitigation measures
The embedded measures and mitigation measures described and referred to in Section 7.6also apply to Impact PA1. Although the significance was assessed as Negligible, with regard to the potential disturbance of fauna and flora in the RVSCEH and direct changes of habitat in this protected area, the following two mitigation measures will be included, taking into account the high sensitivity of the RVSCEH:
The Pesticides and Herbicides Management Plan will have specific considerations regarding the use of pesticides and herbicides in the proximity of the protected area.

ENVIRONMENTAL RESOURCES MANAGEMENT PAA PROJECT FINANCE A/S
7-46
The Fertilizers Management Plan will have specific considerations regarding the use of fertilizers in the proximity of the protected area.
Residual impacts
Table 7.12 summarises the impacts on the protected areas as a result of Project activities during the operation phase. The embedded measures considered in the Project Design result in the Residual Impacts being assessed as Negligible and Positive.
Table 7.12 Summary of impact assessment on the protected areas/critical habitats during the operation phase
Impact / Risk
Measures to address the impact / risk Residual Impact
PA1 – Effect on habitats, flora, and fauna in the Protected Area
Embedded measures: Same embedded measures as B1, B2 and B3. Mitigation measures: Same mitigation measures as B1, B2 and B3. In addition to this:
The Pesticides and Herbicides Management Plan will have specific considerations regarding the use of pesticides and herbicides in the proximity of the protected area.
The Fertilizers Management Plan will have specific considerations regarding the use of fertilizers in the proximity of the protected area.
Negligible Aligned with Impacts B1 and B2
regarding effect on flora and fauna in the RVSCEH.
Aligned with Impact B3 regarding direct effects on habitats in the RVSCEH.
Positive - Medium Indirect impact - change of
habitat occurring due to the transformation of natural land to increase agriculture and livestock activity
ASIDE and ICF, co-managers of the RVSCEH, expect that the diversification resulting from the Project will contribute to the conservation of the remaining natural (including critical) habitats in the Project Area and will therefore benefit the protected area.
Source: ERM, 2018
7.8 ECONOMY AND EMPLOYMENT
7.8.1 Overview
This section assesses the potential economic and employment impacts associated with the Aguan Irrigation Project. The assessment is divided into pre-operation and operation. The abandonment phase has been scoped out
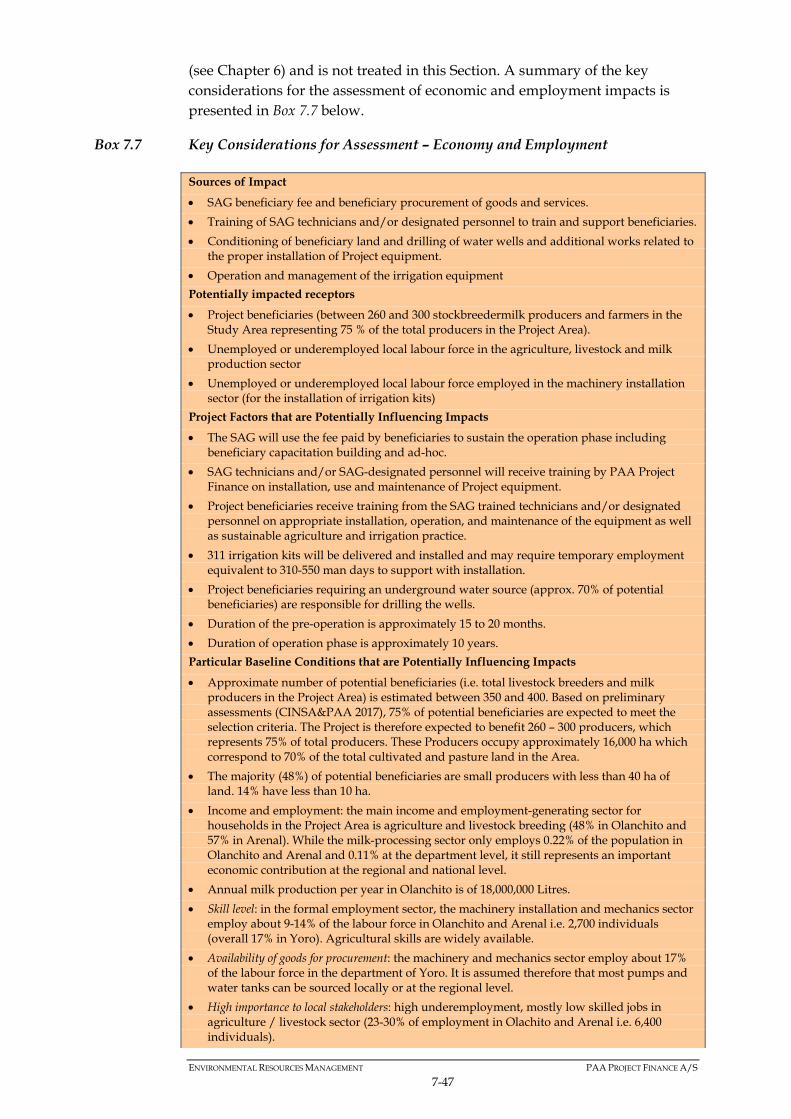
ENVIRONMENTAL RESOURCES MANAGEMENT PAA PROJECT FINANCE A/S
7-47
(see Chapter 6) and is not treated in this Section. A summary of the key considerations for the assessment of economic and employment impacts is presented in Box 7.7 below.
Box 7.7 Key Considerations for Assessment – Economy and Employment
Sources of Impact
SAG beneficiary fee and beneficiary procurement of goods and services.
Training of SAG technicians and/or designated personnel to train and support beneficiaries.
Conditioning of beneficiary land and drilling of water wells and additional works related to the proper installation of Project equipment.
Operation and management of the irrigation equipment
Potentially impacted receptors
Project beneficiaries (between 260 and 300 stockbreedermilk producers and farmers in the Study Area representing 75 % of the total producers in the Project Area).
Unemployed or underemployed local labour force in the agriculture, livestock and milk production sector
Unemployed or underemployed local labour force employed in the machinery installation sector (for the installation of irrigation kits)
Project Factors that are Potentially Influencing Impacts
The SAG will use the fee paid by beneficiaries to sustain the operation phase including beneficiary capacitation building and ad-hoc.
SAG technicians and/or SAG-designated personnel will receive training by PAA Project Finance on installation, use and maintenance of Project equipment.
Project beneficiaries receive training from the SAG trained technicians and/or designated personnel on appropriate installation, operation, and maintenance of the equipment as well as sustainable agriculture and irrigation practice.
311 irrigation kits will be delivered and installed and may require temporary employment equivalent to 310-550 man days to support with installation.
Project beneficiaries requiring an underground water source (approx. 70% of potential beneficiaries) are responsible for drilling the wells.
Duration of the pre-operation is approximately 15 to 20 months.
Duration of operation phase is approximately 10 years.
Particular Baseline Conditions that are Potentially Influencing Impacts
Approximate number of potential beneficiaries (i.e. total livestock breeders and milk producers in the Project Area) is estimated between 350 and 400. Based on preliminary assessments (CINSA&PAA 2017), 75% of potential beneficiaries are expected to meet the selection criteria. The Project is therefore expected to benefit 260 – 300 producers, which represents 75% of total producers. These Producers occupy approximately 16,000 ha which correspond to 70% of the total cultivated and pasture land in the Area.
The majority (48%) of potential beneficiaries are small producers with less than 40 ha of land. 14% have less than 10 ha.
Income and employment: the main income and employment-generating sector for households in the Project Area is agriculture and livestock breeding (48% in Olanchito and 57% in Arenal). While the milk-processing sector only employs 0.22% of the population in Olanchito and Arenal and 0.11% at the department level, it still represents an important economic contribution at the regional and national level.
Annual milk production per year in Olanchito is of 18,000,000 Litres.
Skill level: in the formal employment sector, the machinery installation and mechanics sector employ about 9-14% of the labour force in Olanchito and Arenal i.e. 2,700 individuals (overall 17% in Yoro). Agricultural skills are widely available.
Availability of goods for procurement: the machinery and mechanics sector employ about 17% of the labour force in the department of Yoro. It is assumed therefore that most pumps and water tanks can be sourced locally or at the regional level.
High importance to local stakeholders: high underemployment, mostly low skilled jobs in agriculture / livestock sector (23-30% of employment in Olachito and Arenal i.e. 6,400 individuals).

ENVIRONMENTAL RESOURCES MANAGEMENT PAA PROJECT FINANCE A/S
7-48
Number of employees on the farms tend to increase by 50% to 100% in the rainy season through the hiring of temporary labour.
Vulnerable Groups
Indigenous individuals reside in the Project Area among non-indigenous communities and are reportedly well integrated into the labour market in the Study Area. Some individuals of indigenous descent are also reportedly employed on potential beneficiary farms and benefit from the same conditions as non-indigenous workers.
High levels of underemployment in the area. One third of the occupied population in Honduras is underemployed with higher numbers in rural areas.
References
Chapter 1 Introduction – specifically Section 1.3.
Chapter 3 Project Description and Alternatives – specifically Section 3.4, Section 3.5, and Section 3.6.
Chapter 5 Baseline Description – specifically Section 5.5.3, Section 5.5.5, Section 5.5.6, Section 5.5.8, and Section 5.5.9.
Source: ERM, 2018
Potential economic impacts relating to local livelihoods are covered separately under Land and Livelihoods in Section 7.9. Table 7.13 presents the key impacts of the Project on the economy and employment during the three phases of pre-operation, operation, and abandonment.
Table 7.13 Key Potential Impacts – Economy and Employment
Pre-operation phase Operation phase Abandonment phase EE1 - Long-term benefits of capacity enhancement for SAG technicians and beneficiaries
Note: this impact also extends to the operation phase.
EE2- Temporary economic impacts from beneficiary fee payment to the SAG and beneficiary procurement.
EE3 – Temporary direct employment of labour for installation of the irrigation equipment.
EE4 – Long-term economic growth from production increase and improvements in the agriculture, milk production sector and related sectors.
EE5 - Long-term direct and indirect employment in the agriculture, livestock breeding and milk production sector and related sectors.
None
Source: ERM, 2018
7.8.2 Pre-Operation and Operation Phase
Potential impacts
EE1 – Long-term benefits of capacity enhancement for SAG technicians and beneficiaries
ENVIRONMENTAL RESOURCES MANAGEMENT PAA PROJECT FINANCE A/S
7-49
As part of the Project pre-operation phase, PAA Project Finance, with support from the SAG, will be responsible for training SAG technicians and/or SAG-designated personnel on the correct installation, operation, and maintenance of the irrigation equipment and use of drilling vehicles. Training of SAG and designated technicians will also include capacity building on proper agricultural consulting in order to support beneficiaries as needed throughout the installation and operation of the equipment. The SAG technicians training programme will contribute to the capacity building and long-term skill acquisition of the technicians, which in turn will also increase the SAG’s capacity to implement similar irrigation projects in other areas in the future and to support local producers through the provision of adequate technical advice on agricultural practices and proper equipment and groundwater well maintenance. Since the beneficiaries themselves are responsible for the installation of the equipment and not the SAG, the SAG formed technicians will train project beneficiaries from the agriculture, livestock breeding and milk production sectors on proper installation, use and maintenance of irrigation equipment, as well as on sustainable agriculture and irrigation techniques and environmental and social good practice. The training received and the operation of the irrigation equipment will result in increased skills and capacity building for producers in the agriculture, livestock breeding and milk production sectors through the introduction of innovation into the local production process. In summary, capacity building is expected to benefit SAG technicians on the one hand, as well as the SAG itself for the implementation of similar projects. The number of SAG technicians and designated staff is unknown at this stage.As for the beneficiaries, the Project is expected to benefit 75% of potential beneficiaries in the area (i.e. 260-300 producers). Therefore 75% of the producers are expected to benefit from the acquisition of new skills which will improve their productivity throughout the 10-year operation phase. Enhancement Measures
The project design already includes the following embedded measures:
PAA Project Finance, with support from the SAG, is responsible for implementing the Project’s Training Programme which includes training SAG technicians and/or personnel designated by the SAG on the correct installation and use of the irrigation equipment and drilling vehicles. The technical training also includes capacity building on agricultural consulting.
As part of the embedded Training Programme, the SAG will in turn provide training to the beneficiaries on the installation, use, and maintenance of equipment as well as on agricultural and irrigation good practice and environmental and social measures.

ENVIRONMENTAL RESOURCES MANAGEMENT PAA PROJECT FINANCE A/S
7-50
In order to enhance the positive impacts to the local economy from capacity building in the irrigation and agriculture sector, the following enhancement measures will apply:
In addition to the embedded Training Programme by PAA Project Finance, the SAG will develop in partnership with local organisations a training programme to provide ongoing technical support and agricultural/irrigation advice to Project beneficiaries during the operation phase.
As part of the training program, the SAG will develop and implement ad-hoc additional training on relevant aspects as required.
Residual Impacts
Table 7.14 summarises the impacts of SAG financing and procurement and capacity enhancement as a result of the Project activities during both the pre-operation and operation phase. The embedded measures considered in the Project Design and the enhancement measures defined during the impact assessment further enhance the Positive impact.

ENVIRONMENTAL RESOURCES MANAGEMENT PAA PROJECT FINANCE A/S
7-51
Table 7.14 Summary of impact assessment of SAG financing, procurement, and capacity building and enhancement measures during pre-operation and operation
Impact / Risk Measures to address the impact / risk Residual Impact EE1 – Long-term benefits of capacity enhancement for SAG technicians and Project beneficiaries
Embedded measures PAA Project Finance, with support
from the SAG, will implement the Project’s Training Programme including training of SAG technicians and designated personnel on the correct installation and use of the irrigation equipment and drilling vehicles. The technical training also includes capacity building on agricultural consulting.
The SAG will in turn provide training to the beneficiaries on the installation, use, and maintenance of equipment as well as on agricultural and irrigation good practice and environmental and social measures.
Enhancement measures: In addition to the embedded Training
Programme by PAA Project Finance, the SAG will develop in partnership with local organisations a training programme to provide ongoing technical support and agricultural/irrigation advice to Project beneficiaries during the operation phase.
As part of the training program, the SAG will develop and implement ad-hoc additional training on relevant aspects as required.
Positive - Moderate Capacity building is
expected to benefit 75% of producers in the Project Area.
Productivity gains from capacity building will extend throughout the 10-year operation phase.
Capacity building of SAG technicians and the SAG will extend beyond the operation phase.
The number of SAG technicians to train is unknown.
The enhancement measures will further enhance the benefits of capacity building through the provision of continuous ad-hoc support.
Source: ERM, 2018
7.8.3 Operation Phase
Potential impacts
EE2 – Temporary economic impacts from beneficiary fee payment to the SAG and beneficiary procurement
During the pre-operation phase, the selected beneficiaries will be required to pay a fee to the SAG in return of the irrigation equipment. The fee amount has not yet been specified, but is expected to only covering a small portion of the equipment cost and intended to support the long-term sustainability of the Project during the Operation phase. The fee is expected to be set at 2,000 USD based on a similar fee used for a similar irrigation project in the area. As such, the fees paid will be used as funds for the SAG to finance additional training and capacity building as well as supervision, ad-hoc support and monitoring of Project implementation during the Operation phase. Specifically, this will

ENVIRONMENTAL RESOURCES MANAGEMENT PAA PROJECT FINANCE A/S
7-52
contribute to financing the technical Training Programme (included in Project Design) and additional capacity building programmes such as those recommended in the present ESIA including annual crop production and irrigation good practices, sustainable use of water, use of pesticides and fertilizers, waste management, etc. Considering the importance of the agriculture, livestock breeding and milk production sectors in the Study Area, additional investments in the sector to build capacity and increase productivity will reach about 48% and 57% of the population in Olanchito and Arenal employed in this sector at the local level. The impacts are expected to extend throughout the 10-year operation phase, and potentially beyond, depending on the amount of funds available and their reinvestment. The economic impact of the Project on this sector is assessed in more detail in Impact EE4 (Section 7.8.3) In terms of procurement, PAA Project Finance will provide the irrigation equipment, which will be imported from outside Honduras. Beneficiaries will need to have available or acquire themselves is limited to an underground well to place the submersible pumps provided by the project. This only applies to beneficiaries who require underground water supply, which represents the majority (approx. 70%) of potential beneficiaries, i.e. 210 potential beneficiaries. Considering that the machinery and mechanics sector employs between 9 and 14% of local labour force in Olanchito and Arenal and about 17% in the department of Yoro, it is assumed that most drilling works can be sourced by companies locally or at the regional level. The economic benefits will therefore primarily occur at the local and regional levels and will be spread out over the first two years of the operation phase in a punctual manner (non-continuous). EE3 –Temporary direct employment of labour for installation of the irrigation equipment
The execution of the drilling of water wells, the placement of the collection pipe and the installation of the pump is the responsibility of the beneficiaries who will be trained by SAG technicians and/or designated personnel. Nevertheless, it is expected that beneficiaries may require additional support and hire temporary labour in addition to the existing farm labour to help them with the installation (i.e. digging and installing the buried pipe network, covering up the pipes and connecting the different components, etc.). Assuming installation of a total of 311 irrigation kits, one support worker per kit and average installation of one to two days per kit depending on each spot, it can be concluded that the labour required for the installation will be around 310-550man days. (1) Since 9-14% of the population in the Study Area are employed in the machinery installation and mechanics sector, the labour will be hired locally and contribute to temporary employment in this sector. Employment duration will be very short-term. 1 Man-days refer to the number of man-hours in a day of work and is used as a measure of how much work or labor is required or consumed to perform some task. Work calculated in man-days does not correspond to full time employment as the work may be distributed over a more flexible timeframe.

ENVIRONMENTAL RESOURCES MANAGEMENT PAA PROJECT FINANCE A/S
7-53
As for the drilling of underground water wells, these activities will be performed by specialist local or regional companies for beneficiaries that do not have access to surface water sources for irrigation (approx. 70% of beneficiaries). It is estimated that 182 to 210 underground water wells will be drilled (1) over a 2-year period. As such different companies can conduct multiple installations one after the other on a business as usual mode resulting in a negligible number of jobs. To summarise, the potential employment creation related to installation and drilling is expected to be limited with a small number of very short-term and punctual employment opportunities at the local level. EE4 – Long-term economic growth from production increase and improvements in the agriculture, milk production sector and the related sectors
Based on Project objectives, irrigation technology is expected to prolong the production cycle and even-out production during the rainy and dry seasons resulting in an increase in agricultural output and associated milk production. According to the SAGO, the increase in agricultural output is expected to reach up to 40% per year depending on the crops (see Section 1.3), which is expected to translate into a similar increase in annual milk production. Similarly, based on feedback collected through interviews with the SAGO and CRELs it is projected that milk production will increase by 40-50% during Project implementation. However, it was noted that these projections rely primarily on assumptions made by the SAGO and the CRELs which are based on the fact that production in the rainy season increases by up to 150% and that the annual production would increase by about 40%-50% if production is made constant throughout the year and if productivity gains are achieved. No formal economic feasibility study was conducted and therefore these projections require further confirmation. Based on more conservative calculations, the annual milk production increase would be of approximately 17% assuming a constant production rate equal to that of the rainy season throughout the year.2 This production increase is expected to translate into increased economic activity in the milk production sector and related sectors such as milk processing and artisanal cheese production. Increased economic activity in the milk production sector is also expected to contribute to employment (Impact EE5) and potentially higher disposable incomes for Project beneficiaries and their households (Impact LL1).
1 The estimation of underground water wells to be drilled is based on the fact that approximately 75% of potential beneficiaries are expected to meet the selection criteria based on preliminary findings of CINSA&PAA’s assessment in 2017. Considering that the total number of potential beneficiaries is estimated between 350 and 400, the number of eligible potential beneficiaries is estimated between 260-300 (see Section 5.5.3). Since 70% of potential beneficiaries require underground water wells, then the estimated number of wells is between 182 and 210.
2 Considering an annual production of milk of 18,000,000 liters, and assuming that production in the rainy season (9 months) increases by up to 150% from the dry season (3 months), the milk production value in the dry season was calculated using the following equation: 9*(150%*X+X) + 3 X = 18,000,000. Monthly production rate in the dry season is therefore 705,882 and 1,764,706 in the rainy season. Assuming constant production during the 12 months of production at the rainy season rate, total production per year increases to 21,176,471 which corresponds to a 17.65% increase.

ENVIRONMENTAL RESOURCES MANAGEMENT PAA PROJECT FINANCE A/S
7-54
Milk production and access to market
An important increase in milk production could potentially lead to a drop in the price of milk if the demand does not match the increased supply. Since a formal supply-and-demand market study for the milk production and milk processing sectors was not conducted, the potential risks and opportunities related to the increased supply cannot be fully assessed. However, according to a national newspaper article from June 2017, milk processing industries do not have the capacity to process all the milk produced during the rainy season, when milk production sometimes increases by up to 150% and results in overproduction and losses in the milk production sector.1 That being said, it has been reported during the 2018 field survey that national milk processing companies such as LEYDE have been asking CRELs and producers to improve reliability and stability of the supply throughout the year. Also, desk-based research of available online sources also show that in-spite of the annual increase in milk production, milk production is reportedly not sufficient to meet the growing domestic demand.2 In addition, the Municipality of Olanchito has also planned improvements to the road network (independent from the Project), which are expected to facilitate increased access to milk processing centers and markets for the sale of dairy products, such as San Pedro Sula in the department of Cortés. Overall, this supports the existence of a market for an increased production as long as the supply remains stable and peaks are reduced. However overproduction remains a potential risk if not properly managed. Production diversification and related sectors
Based on data collected during the 2018 field survey, the Project is also seen as an opportunity to diversify the type of cattle feed and increase the production of forage species and crops that can be collected in the rainy season and then stored in silos to feed the cattle throughout the year. This includes corn, sorghum, and other forage species. The increased and more reliable supply of cattle feed will be the key to improving productivity in the milk production sector and to stabilize the production during the whole year. The Project also presents an opportunity to diversify agricultural output of non-cattle feed crops such as citric, vegetables and grains in order to adjust more easily to market variations, thus positively influencing the creation or establishment of agro-food industries and related job opportunities in the agriculture sector at the local level over the 10-year operation phase. At the local level, a more stable milk production throughout the year will also benefit local artisanal cheese producers whose milk input decreases significantly during the dry season, when most milk producers sell their milk
1 “Sector Ganadero Afronta Sobreproducción de Leche”. La Prensa, June 2017. Accessed at: http://www.laprensa.hn/economia/1080703-410/leche-sobreproduccion-hector_ferreira-camara_leche-ganadero
2 Dairy value chain in Honduras and Nicaragua: Background proposals for the CGIAR Research Program on Livestock and Fish. Accessed at: https://cgspace.cgiar.org/bitstream/handle/10568/16971/LivestockFish_DairyVCHondNicarag.pdf?sequence=1
ENVIRONMENTAL RESOURCES MANAGEMENT PAA PROJECT FINANCE A/S
7-55
to the higher-paying milk processing industries (10 to 11 lempiras per litre ie. 0.42 to 0.46 USD). Artisanal cheese producers usually get to buy the production surplus during the rainy season at a lower price (7 to 8 lempiras per litre – i.e. 0.29 to 0.33 USD). However, with an increased and more stable production as a result of the Project, cheese producers can also stabilise their production throughout the year and increase their revenues over the 10-year operation phase. In addition, improvements in the industrial milk production sector in the Study Area are also expected to translate into increased economic activity and growth for the milk-processing and dairy product industries located outside the Study Area, and outside the department of Yoro, mainly in the department of Olancho and in San Pedro Sula (department of Cortés). In the rainy season when the supply of milk more than doubles, milk processing industries do not always have the capacity to absorb all the production, resulting in lost milk production and losses for milk producers who are not able to sell their milk.1 An increased and more stable milk production throughout the year, will allow these industries to better adjust their processing capacity and increase their production and revenues. Milk processing industries are also important at the national level as they strongly contribute to the national commercial balance. Increased disposable income and spending As discussed above, higher milk production volumes and increased economic activity in the milk production sector and agricultural sector will result in higher revenues for Project beneficiaries. Beneficiaries in turn will have more disposable income to spend, which is expected to contribute to the local economy during the 10-year period. Revenue gains and higher incomes are also expected to create more opportunities for investing in more efficient technology contributing to further improvements of the sector beyond the operation phase. EE5 – Long-term direct and indirect employment for workers in the agriculture, livestock and milk production sector and related agriculture and milk processing sectors
As discussed previously in Impact EE4, milk production is estimated to increase by 17% per year although the SAGO and CRELs report expectations of a greater increase. This in turn is expected to generate additional employment opportunities for farm labour, especially permanent workers, as well as increased income stability during the 10-year operations phase. The average number of permanent employees is reportedly 2-4 for small producers, 6-8 for medium producers and 10-12 for large producers. The numbers usually tend to increase by 50% in the rainy season through the hiring of temporary labour, and up to 100% in the first two months of the rainy season. With a stable production throughout the year the number of
1 http://www.laprensa.hn/economia/1080703-410/leche-sobreproduccion-hector_ferreira-camara_leche-ganadero

ENVIRONMENTAL RESOURCES MANAGEMENT PAA PROJECT FINANCE A/S
7-56
permanent workers is therefore expected to increase compared to seasonal workers, which offers a more stable source of livelihoods (see Section 7.9). Based on a similar irrigation project undertaken by the SAG in various departments including Yoro in 2015, job creation per hectare of irrigated land for the main forage species (pasto) and crops in the Project Area (ie. corn, beans, and sorghum) was approximately 0.55 jobs (see Section 5.5.10).1 Considering that the Project Area will irrigate an area of 3,110 ha, this translates into approximately 1,700 jobs. According to estimates provided by SAGO and CRELs representatives each farm on average employs approximately six (6) permanent workers. Since the project is expected to benefit up to 300 producers, the number of permanent workers currently employed in beneficiary farms is estimated at 1,800. Furthermore, since the 300 beneficiaries cultivate a total of approximately 16,000 ha, job creation per hectare of land pre-irrigation is estimated at 0.11 jobs. Considering that out of the 16,000 ha owned by beneficiaries, 3,110 are irrigated by the Project and the remaining 12,000 are not, labor estimates are the following:
The required labour for the approximate 12,000 ha of land not irrigated by the Project is 1,320.
The required labour for the 3,110 ha of land irrigated by the Project is 1,700
Therefore the total number of permanent labour (all year round) required to cultivate the 16,000 ha of land is 3,020 which represents a 51% increase, and corresponds to the reported labour increase during the rainy season. Since employment increase is not linear, a more conservative estimate between 30%-51% would be more adequate. Overall, since 23% and 30% of the active population in Olanchito and Arenal respectively (i.e. approximately 6,000 and 400 people respectively) are employed as low-skilled farm labour, assuming a 30% employment increase the number of new jobs created is estimated to be 1,920.2 Considering the high levels of underemployment in the area, jobs are expected to be filled locally, providing additional and more stable jobs in the sector for the local population, especially in the dry season when employment opportunities tend to decrease. This estimated increase in low-skilled job opportunities it is expected to also benefit individuals of indigenous descent working in the Study Area, as it is the case for a number of indigenous individuals who reportedly reside in the area and are employed in some potential beneficiary farms.
1 Bauer, Irrigation Project for High Value Crops (“Cultivos de Alto Valor Bajo Riego por Aspersión”). October 2015.
2 The calculation is the following: 6400 x 1.3 = 8,320 and 8,320 – 6400 = 1,920.

ENVIRONMENTAL RESOURCES MANAGEMENT PAA PROJECT FINANCE A/S
7-57
With respect to the milk processing sector, a milk production increase of 17% would also imply more milk to process in total per year, however production would be spread out more evenly between the rainy season and the dry season, which might not require additional milk processing jobs to cover the additional supply. The impact on the milk-processing sector in terms of indirect employment opportunities is therefore not expected to be very significant. Enhancement Measures
The project design already includes the following embedded measures:
In addition to the technical training provided to beneficiaries during the pre-operation phase, other relevant trainings for beneficiaries will be implemented by the SAG as part of the Project’s Training Programme to ensure the application of environmental and social good practice, such as annual crop production and irrigation good practices, sustainable use of water recommendations, use of pesticides and fertilizers, waste management. These trainings will be delivered by technicians from the SAG-DICTA (Directorate of Agricultural Science and Technology) and from other local organizations such as ASIDE, SENASA, Health Secretary / Coordination of Environmental Health Program of the Municipality of Olanchito to the selected beneficiaries.
In addition to the existing measures, and in order to enhance positive impacts to the local economy from beneficiary fee payment to the SAG and procurement the following enhancement measures will apply:
The SAG will conduct an assessment of local content potential for the procurement of submersible water pumps and water tanks for Project beneficiaries, including:
o identifying the local suppliers in the study area and in nearby municipalities that meet the required quality standards and assess their ability to meet the expected demand;
o as required, providing appropriate capacity-building and technical or financial information support to ensure adequate supply over the 10 years installation period; and
o providing beneficiaries with a list of approved water pump and water tanks suppliers, first at the local level in the Study Area, and then at the Department level in order to promote local procurement.
In order to enhance positive impacts from employment creation for installation workers who may be hired by the beneficiaries, the following enhancement measures will apply:
The SAG will ensure that beneficiaries employ workers from the local labour force prioritizing workers from the Project Area followed by

ENVIRONMENTAL RESOURCES MANAGEMENT PAA PROJECT FINANCE A/S
7-58
workers from Olanchito and Arenal more broadly and neighbouring municipalities as needed.
The SAG will ensure that beneficiaries rely on the CRELs and the municipality employment department to advertise their employment needs with a clear application procedure and ensure equal opportunities for all and transparent hiring practices.
For Project impact on economic growth and improvements in the agriculture, livestock and milk production and related milk processing sector, the following enhancement measures apply:
The SAG will conduct a detailed economic feasibility study and supply-and-demand market study for the agriculture, milk production and milk-processing sectors to assess risks and opportunities related to an increased milk and agriculture production.
As for employment opportunities for workers in the agriculture, livestock and milk production sector, the following applies:
The SAG will consider as part of the beneficiary selection criteria the potential beneficiary’s financial solvency to cultivate the minimum 10 ha of irrigated land and to generate additional employment in order to increase their agriculture or milk production output.
The SAG will require potential beneficiaries to present an investment plan showing how they plan to cultivate the land irrigated by the Project including the number of permanent jobs expected.
The SAG will agree with selected Project beneficiaries on the expected level of yearly employment and will ensure that best efforts are made to employ workers from within the Project Area including individuals of indigenous descent, while guaranteeing equal pay and working conditions. Additional labour requirement with respect to employment conditions and labour rights will also be agreed jointly with the Project beneficiaries. These specific requirements are discussed in Section 7.12.
The SAG through relevant technical departments will monitor compliance with labour related commitments both during the rainy and dry season.
Residual Impacts
Table 7.15 summarises the impacts on economic growth and employment as a result of the Project activities during the operation phase. The enhancement measures defined during the impact assessment results in Positive Residual Impacts of Minor to Major significance.

ENVIRONMENTAL RESOURCES MANAGEMENT PAA PROJECT FINANCE A/S
7-59
Table 7.15 Summary of impact assessment on economic growth and employment during the operation phase
Impact / Risk Measures to address the impact / risk Residual Impact EE2 – Temporary economic impacts from beneficiary fee payment to the SAG and procurement
Embedded measures As part of the Project’s Training
Programme, the SAG to ensure that relevant technical departments and partner organizations (ASIDE, SENASA, Health Secretary, etc.) implement relevant trainings for beneficiaries to ensure application of environmental and social good practice, such as annual crop production and irrigation good practices, sustainable use of water, use of pesticides and fertilizers, and waste management.
Enhancement measures SAG to conduct an assessment of
local procurement potential including: identification of local suppliers
that meet required quality standards and ability to meet the demand;
capacity building and support to identified suppliers to ensure continuous supply; and
promotion of local procurement by beneficiaries by providing a list of local and regional suppliers.
Positive - Moderate The beneficiary fee
amount is not known at this stage however the estimated number of beneficiaries is 260 to 300.
Productivity gains from reinvestments of the fees will reach between 48% and 57% of the population in the Study Area over a 10-year period and potentially beyond.
The procurement of 190 pumps will benefit 9 to 14% of the local labour spread out over a 2 year period, non-continuous.
EE3 – Temporary direct employment of labour for installation of irrigation equipment
SAG to ensure that beneficiaries employ workers from the local labour force prioritizing workers from the Project Area followed by workers from Olanchito and Arenal more broadly and neighbouring municipalities as needed.
The SAG will ensure that beneficiaries rely on the CRELs and the municipality employment department to advertise their employment needs with a clear application procedure to and ensure equal opportunities for all and transparent hiring practices.
Positive – Negligible to Minor Employment of support
workers for the installation will be very short term and temporary (1 to 2 days over 20 months).
A limited number of temporary jobs will be required over this period (approximately more than 400).
Enhancement measures will ensure that employment opportunities benefit the local labour force.

ENVIRONMENTAL RESOURCES MANAGEMENT PAA PROJECT FINANCE A/S
7-60
Impact / Risk Measures to address the impact / risk Residual Impact EE4 – Long-term economic growth from production increase and improvements in the milk production sector and related sectors
The SAG will conduct a detailed supply-and-demand market study for the agriculture, milk production and milk-processing sectors to assess risks and opportunities related to an increased milk production.
Positive – Moderate / Major Impacts are distributed
across multiple sectors (milk production, agriculture, artisanal cheese production, milk processing industries, etc.) at the local, regional, and national levels.
The operation phase will last 10-years with impacts potentially extending beyond this period in the case of technological improvements and capacity-building in the different sectors.
Development of a supply and demand market study will ensure that opportunities are maximized and that risks are managed adequately.
EE5 - Long-term direct and indirect employment in the agriculture, livestock breeding and milk production sector and related sectors.
SAG to consider as criteria the potential beneficiary’s financial solvency to generate additional employment in order to cultivate the irrigated land.
SAG to require potential beneficiaries to present an investment plan including the number of permanent jobs expected to be created.
SAG to agree with selected Project beneficiaries on the expected level of yearly employment and ensure best efforts to employ workers from within the Project Area including individuals of indigenous descent, while guaranteeing equal pay and working conditions.
SAG technical relevant technical departments to monitor compliance with labour related commitments both during the rainy and dry season.
Positive – Moderate / Major The Project is expected to
increase the number of permanent employees by 50% throughout the 10-year operation phase.
The local labour force will benefit from more stable employment opportunities over a 10-year period.
The implementation of enhancement measures will ensure that employment opportunities will be maximized, in particular for low-skilled farm labour.
Source: ERM, 2018
7.9 LIVELIHOODS AND INCOME
7.9.1 Overview
This section assesses the potential impacts to existing livelihoods as a result of the Aguan Irrigation Project. The assessment focuses on the operations phase when all potential livelihood impacts are expected. In addition to embedded measures in the Project Design, a series of mitigation measures have been designed to ensure that the level of impacts to socioeconomic receptors is avoided, minimized or reduced. Box 7.7 below shows the key sources of

ENVIRONMENTAL RESOURCES MANAGEMENT PAA PROJECT FINANCE A/S
7-61
impacts, potential impacted receptors, as well as baseline and Project influencing factors related to Project impact on land and livelihoods.
Box 7.8 Key Considerations for Assessment –Livelihoods and Income
Sources of Impact
Conditioning of beneficiary land (drilling of water well and additional works related to the proper installation of Project equipment)
Operation and management of the irrigation equipment
Potentially impacted receptors
Project beneficiaries
Non-beneficiary land users and other groundwater and surface water users
Project Factors that are Potentially Influencing Impacts
Project beneficiaries receive training from the SAG trained technicians and/or designated personnel on appropriate installation, operation, and maintenance of the equipment as well as sustainable agriculture and irrigation practice.
Duration of operation phase is approximately 10 years.
The Project is expected to irrigate 3,110 ha of land (i.e. 12% of cultivated and pasture land in the Project Area).
Particular Baseline Conditions that are Potentially Influencing Impacts
Agriculture, livestock and milk production is the main livelihood activity in the Study Area, followed by employment in large scale production companies, and agriculture. In Olanchito and Arenal 48% and 57% of the population respectively is employed in the agriculture and livestock sector, including 23% and 30% as low-skilled farm workers.
Approximately 10% of potential beneficiaries currently cultivate additional crops not destined for livestock feed such as beans, watermelon and sugar-cane.
Average income of small producers is currently estimated between 20,000 and 40,000 lempiras (834 – 1,665 USD) in the rainy season compared to 10,000 and 20,000 (416 – 834 USD) in the dry season with an overall average of 30,000 lempiras (1,249 USD) per month.
Farm workers reportedly receive monthly salaries between 4000-6000 (167 – 250 USD) for milking activities and 3000-4000 (125 – 167 USD) for cleaning.
The official minimum wage for the agricultural sector established by the Secretary of Labour and Social Security in 2018 is set at 6,000 lempiras (250 USD)per month for enterprises of up to 10 employees.
Use of chemical products (herbicides, pesticides and fertilizers) is common in the farms in the Project Area, but only in small quantities and once or twice a year.
Water balance assessment shows that water consumption from the Project (14,93Hm3/year) represents about 4 % of the calculated hydric excess in the Alto Aguan Valley.
Use of groundwater for irrigation and human consumption is minor in comparison to surface water.
Vulnerable Groups
Some individuals of indigenous descent residing in the Project Area reportedly employed on potential beneficiary farms and benefit from the same conditions as non-indigenous workers.
Small producers (with less than 40 ha of land) are more vulnerable to overhead costs as they have smaller economies of scale than the larger farms and therefore higher operating costs. Small producers represent approx. 48% of potential beneficiaries, including 14% of producers with less than 10 ha of land.
Small-scale crop farmers with limited access to land and who cultivate crops for self-consumption and/or supplemental income generation. These farmers reportedly tend to engage in other income-generating activities.

ENVIRONMENTAL RESOURCES MANAGEMENT PAA PROJECT FINANCE A/S
7-62
References
Chapter 3 Project Description and Alternatives – specifically Section 3.6.
Chapter 5 Baseline Description – specifically Section 5.5.5, Section 5.5.7, Section 5.5.7, Section 5.5.8, and Section 5.5.9.
Chapter 7 Impact Assessment - specifically Section 7.5.
Source: ERM, 2018
Table 7.13 presents the key impacts of the Project on land and livelihoods during the three phases of pre-operation, operation, and abandonment.
Table 7.16 Key Potential Impacts – Livelihoods and Income
Pre-operation phase Operation phase Abandonment phase None LL1 –Improved livelihoods and food
security for Project beneficiaries and farm labour.
LL2 – Risk of livelihood losses for beneficiaries due to increased financial pressure on beneficiaries
LL3 – Risk of livelihood losses for beneficiaries and other land users due to loss of soil fertility
LL4 – Risk of livelihood and losses for non-project beneficiaries due to decreased availability of water
None
Source: ERM, 2018
7.9.2 Operation Phase
Potential impacts
LL1 – Improved livelihoods and food security for Project beneficiaries and farm labour
The Aguan irrigation Project is expected to improve agriculture and milk production stability in the dry season and increase the total volume of milk produced (by at least 50% according to the SAGO). As discussed in Impacts EE4 and EE5 (Section 7.8.3), this will lead to increased economic activity in the milk production sector including the creation of additional jobs, and higher disposable incomes for Project beneficiaries and the farm workers they employ. 1 Increased revenues and disposable incomes
Specifically, it is assumed that a stable or semi-stable production (with increased quantities and quality of preserved forage for the dry season)
1 As stated in Impact EE4, the 50% production increase and associated increase in revenues is an assumption based on estimations and feedback collected by the SAG, SAGO, and interested parties and is not based on any formal sector and market analysis.

ENVIRONMENTAL RESOURCES MANAGEMENT PAA PROJECT FINANCE A/S
7-63
throughout the year will allow farmers to replicate production levels in the dry season as well as related revenues assuming a stable demand. Considering that 48% of potential beneficiaries are small producers with less than 40 ha including 14% with less than 10 ha, the project is expected to impact mostly small producers. As such, small producers who generate on average 20,000 to 40,000 Lempiras (832 – 1,664 USD) per month in the rainy season would be able to generate similar amounts in the dry season and nearly double their revenue yearly average to 60,000 Lempiras (2,497 USD) per month. (1) This would translate into an approximate 50% increase in revenues throughout a 10-year period. Some of the potential beneficiaries interviewed in June 2018 mentioned that they would use the additional revenue to further improve their production process. As such, assuming that a portion of the generated income will be spent on fixed costs for operation of the irrigation equipment such as fuel, labour and maintenance, and that another portion will be reinvested in technology improvements, labour, additional inputs, etc. the remaining portion will be used as disposable income and contribute to increasing standards of living for the beneficiaries and their households. With respect to farm workers, a more stable production throughout the year will lead to increased employment of permanent workers compared to seasonal workers, which will contribute to increased income stability for workers and improvement in their standards of living, including for indigenous workers living in the Study Area. As discussed in Impact EE5 above (Section 7.8.3), employment of farm labour is expected to increase by 20% to 40%. Increased employment opportunities may also potentially lead to an increase in the salaries of workers as they will be dealing with larger production volumes throughout the year. Currently, workers’ monthly salaries on average are below the 6,000 Lempiras minimum wage established for the sector in 2018. Considering current levels of employment of the population as low-skilled farm labour (23% and 30% in Olanchito and Arenal respectively), relatively higher incomes and improved income stability will impact over 25% of the population in the Study Area over an extended period of 10-years. Diversified sources of income and increased food security
In addition to increased incomes from milk production, the Project will also create opportunities to diversify the sources of income and increase food security. The use of a more reliable irrigation process and more sustainable irrigation and cultivation practices will allow a greater number of beneficiaries to diversify into additional crops and to generate complementary income by better adjusting for market fluctuations. Some of the potential beneficiaries interviewed have also mentioned the possibility to purchase additional cattle
1 Note: monthly income averages are only estimates calculated based on June 2018 field survey findings and data from the sample of 301 beneficiaries (CINSA & PAA 2017).

ENVIRONMENTAL RESOURCES MANAGEMENT PAA PROJECT FINANCE A/S
7-64
heads for the same amount of land and diversify into the meat production sector, and generate additional income. Beneficiaries will also be able to better address their consumption needs by growing specific crops for self-consumption (such as corn, sugar cane, watermelon, beans, etc.), thereby improving food security throughout the year. Currently approximately 10% of potential beneficiaries cultivate additional corps that are not intended as animal feed. With the Project implementation, more beneficiaries may decide to grow additional crops for self-consumption and for small trade, improving their food security and the general food security at the community level which would also benefit lower-income residents. Overall the impact is expected to last over a long-term period (10-years) and will benefit 75% of the producers in the area, of which 48% are small producers, and are therefore more sensitive to revenue increases and diversification. Similarly, low-skilled farm workers who present almost one third of the occupied population will also benefit from improvements in their standards of living. As such magnitude is expected to be medium and receptor sensitivity is considered medium to high. LL2 – Risk of livelihood losses for beneficiaries due to increased financial pressure on beneficiaries
Small producers and beneficiaries with low financial solvency will be faced with increased financial pressure due to the required initial investment and additional fixed costs. As explained in Section 3.4.2 of the Project Description, selected beneficiaries will incur the following initial investment costs:
One-time fee payment to the SAG. Relevant permit fees (including well drilling permit and municipality
fee). Transport costs and drilling materials. Cost of well drilling activities (underground or hand-dug). Cost of submersible water pump and water container (for beneficiaries
with no access to surface water sources – ie. 70% of potential beneficiaries).
Any labour cost to support with equipment installation. Additional fixed operation costs will include:
Increased labour costs. Diesel for the motor pump/generators. Maintenance of well and irrigation equipment.
Note that the fee amount has not yet been decided. It is expected to guarantee that the equipment is properly maintained and to ensure long-term sustainability of the Project during the Operation phase. Underground drilling activities will be undertaken by local or regionalspecialized drilling

ENVIRONMENTAL RESOURCES MANAGEMENT PAA PROJECT FINANCE A/S
7-65
companies. Also, the motor pump/generator included in the kit consumes less than 3.8l /h. Nevertheless, despite these embedded measures to reduce costs, overall costs might still be too cumbersome for beneficiaries with lower solvency. Small producers are also generally more vulnerable to overhead costs due to the limited economies of scale they experience compared to larger farms who use their equipment and structures more intensively. In addition, beneficiaries may be encouraged to seek credits to boost production further, for example by increasing livestock population for the same amount of land, which would allow them to achieve higher economies of scale and reduce their production costs. This however may expose them to higher risks of solvency and inability to pay back their loans if the demand does not match the supply for milk. That said, although purchasing additional cattle has been mentioned in some cases during the field survey, increasing the cattle population is not considered necessary to increasing production in the dry season given the efficiency gains from the irrigation itself. As for the demand for milk, as discussed in Impact EE4, milk processing companies have been asking for a more constant production of milk throughout the year, which indicates the existence of a market for a more stable production. Road infrastructure is also being updated at the municipality and inter-municipality level, which will improve connection between Olanchito and other areas that present potentially interesting markets milk processing and dairy products. However, market opportunities and risks cannot be fully assessed without a formal supply-and-demand study and supply chain analysis. In terms of solvency and capacity to manage and repay loans, farmers and producers are reportedly used to requesting credit and to managing it properly, although some have reported bad experiences with cases of mismanagement. Credits are mainly taken from banks, as institutional support in the form of farmer associations (cooperativas) and rural funding organizations and savings banks (cajas rurales), is more focused on the agricultural sector rather than on the agriculture, livestock and milk production sector. As such, beneficiaries may not be fully equipped to make informed decision in terms of investment or to manage their loans adequately. This increases the risk of over indebtedness and associated loss of livelihoods over the long-term. Since 48% of potential beneficiaries are small producers with less than 40 ha, and 14% with less than 10 ha, and considering the weak financial support structure available, the sensitivity of the receptor is considered high. LL3 – Risk of livelihood losses for beneficiaries and other land users due to loss of soil fertility
Poor irrigation management and excessive use of pesticides, herbicides and fertilizers may potentially lead to loss of soil fertility and result in long-term livelihood losses for Project beneficiaries. As described in Impact SI on the soil (Section 7.5), the impact on soil quality is expected to be localized and should

ENVIRONMENTAL RESOURCES MANAGEMENT PAA PROJECT FINANCE A/S
7-66
not affect non-beneficiary land. The impact assessment therefore focuses on the potential impact on beneficiaries. As described in Impact S1 loss of soil fertility may occur only as a result of bad irrigation practices (accumulation of salts and erosion) and by accidental spills. This would only affect beneficiary land, which represents 5% of the total Project Area and up to 12% of the total cultivated and pasture land in the Project Area. This would also affect approximately 60% of the agriculture, livestock breeders and milk producers in the area. Soil quality is of high importance to the livestock and agriculture sector which represent the main economic sectors of the area. Receptor sensitivity is therefore medium. This being said, information gathered during the field survey conducted in June 2018 has indicated that the use of chemical products is considered appropriate as these products are used only in small quantities and a few times a year. In addition, to enhance appropriate use, the Project’s embedded Training Programme will address adequate use of the irrigation equipment and sustainable irrigation approach, which includes minimizing use of chemical products as much as possible. Sustainable irrigation also involves increasing water use efficiency in order to minimize water usage, which would subsequently reduce the risk of salinization and / or erosion events. Considering the embedded mitigation measures, the magnitude of the impact is therefore considered medium. LL4 – Risk of livelihood losses for non-project beneficiaries due to decreased availability of groundwater and surface water
The potential decrease in the groundwater table due to ground water extraction for the Project implies a potential reduction in the availability of both groundwater and surface water resource, which could adversely affect existing water users, especially at dry times of the year. This in turn would lead to reductions in agricultural production and related livelihood losses for non-beneficiaries in the Project Area. Note that farmers and producers located downstream of the Project Area should not be impacted by groundwater and surface water reductions, and have been scoped out from this assessment. A more detailed justification is presented in Table 6.7 of the Impact Assessment Methodology chapter. As discussed in Impact W5 (Section 7.5), the water balance assessment shows that water consumption from the Project (14,93 Hm3/year) represents about 4% of the calculated hydric excess in the Alto Aguan Valley, and therefore, the planned water abstraction by the Project is considered sustainable. However, although a general depletion of the groundwater level is not expected, the local behavior of the groundwater flows can be very variable and therefore localized groundwater depletions cannot be discarded. This being said, it is very unlikely that groundwater wells installed by the Project are located near other groundwater wells. Firstly, because the use of groundwater was reported to be minor in the Project Area, secondly, because

ENVIRONMENTAL RESOURCES MANAGEMENT PAA PROJECT FINANCE A/S
7-67
the Project irrigated-land will be spread out over a large area of 60,000 ha. As such, local groundwater level depletion events and affection to other groundwater users is not expected. Impact magnitude is therefore considered small. Nevertheless, considering that local farmers and livestock and milk producers rely mostly on surface water for irrigation but that the groundwater level also affects indirectly the surface water levels, the sensitivity of these producers to the reduction in groundwater levels is considered high, in particular for small-scale crop farmers in the area who are more vulnerable to livelihood losses and income drops. Mitigation and Enhancement Measures
Mitigation measures already embedded in the Project Design include the following:
The SAG will implement measures to reduce initial investment costs for beneficiaries including fee minimization, efficient motor pump/generator with low diesel consumption (3.8l/h),.
The SAG and relevant technical departments will implement the Training Programme including training on appropriate use of irrigation equipment and sustainable irrigation and agricultural practices, training on adequate use of chemical pesticides, herbicides and fertilizers, and minimizing water usage for irrigation.
The SAG will ensure that beneficiaries allow monitoring of the irrigation equipment for a period of no less than 10 years. This embedded measure will enable to monitor some of the mitigation measures described below.
In order to enhance the impact of improved livelihoods for beneficiaries and farm labour and to mitigate potential losses from increased financial pressure the following enhancement and mitigation measures will apply:
The SAG will conduct a detailed sector and market study for agriculture or milk production to provide official estimates of production increases from the Project and related revenue increases for beneficiaries including a supply-and-demand market assessment. This study will allow the SAG and beneficiaries as well as actors in the dairy production sector to plan their operations and investments accordingly in order to maximize opportunities and manage risks including risks of over indebtedness.
As part of the beneficiary selection process, the SAG will require proof of financial solvency to minimize the risk of over indebtedness and financial pressure on beneficiaries, especially small producers.
The SAG, in collaboration with the SAGO and CRELs will support the creation and capacity building of rural funding organizations (Cajas Rurales) for the agriculture, livestock breeding and milk production sectors specifically.

ENVIRONMENTAL RESOURCES MANAGEMENT PAA PROJECT FINANCE A/S
7-68
The SAG, in collaboration with the rural funding organizations, will provide project management support and financial literacy trainings to beneficiaries to allow them to prepare long-term business plans for their operations including for the reinvestment of revenues in additional technology.
Measures to mitigate the potential livelihood losses due to the loss of soil properties as a result of an inadequate irrigation and use of chemical products are presented in Impact S1 (Section 7.4.2¡Error! No se encuentra el origen de la referencia.), and mitigation measures for potential livelihood losses related to groundwater and surface water availability are addressed in Impact W5 (Section 7.5) With respect to livelihood losses related to groundwater and surface water availability specifically, additional measures include the following:
As part of the Stakeholder Engagement Plan, the SAG will disclose and implement the grievance mechanism to the wider community, including in particular farmers associations or cooperatives to ensure that small-scale crop framers in the area are able to voice any grievances or complaints related to the Project and seek proper remedy.
Residual Impacts
Table 7.17 summarises the impacts on livelihoods and incomes as a result of the Project activities during the operation phase. The embedded mitigation measures along with additional enhancement and mitigation measures The embedded measures considered in the Project Design defined as part of the impact assessment result in Positive impacts and impacts of Minor significance.

ENVIRONMENTAL RESOURCES MANAGEMENT PAA PROJECT FINANCE A/S
7-69
Table 7.17 Summary of impact assessment on livelihoods and income during the operation phase
Impact / Risk Measures to address the impact / risk Residual Impact LL1 - Improved livelihoods and food security for Project beneficiaries and farm labour.
SAG to undertake a sector and market study for agriculture, milk production including a supply-and-demand market assessment.
SAG and relevant technical departments to provide project management support and financial literacy trainings.
Positive –Major Revenues generated in the
rainy season are expected to be replicated in the dry season increasing yearly revenues by 50%.
Impacted beneficiaries are mostly (48%) small beneficiaries including 14% with less than 10 ha.
Beneficiaries will also improve their food security through crop diversification.
Farm labour including indigenous individuals will benefit from increased employment stability and potentially higher incomes resulting in higher standards of living.
Impact is long-term (10-years).
The development of a formal market study will allow beneficiaries to plan their operations and investments in order to maximize opportunities and manage risks.

ENVIRONMENTAL RESOURCES MANAGEMENT PAA PROJECT FINANCE A/S
7-70
Impact / Risk Measures to address the impact / risk Residual Impact LL2 – Risk of livelihood losses for beneficiaries due to increased financial pressure on beneficiaries
Embedded measures: The SAG will implement measures to
reduce initial investment costs for beneficiaries including fee minimization, efficient motor pump with low diesel consumption (3.8l/h), and minimized groundwater well drilling costs through hiring of a specialized NGO.
Mitigation measures: As part of the beneficiary selection
process, the SAG will require proof of financial solvency to minimize the risk of over indebtedness and financial pressure on beneficiaries, especially small producers.
The SAG, in collaboration with the SAGO and CRELs will support the creation and capacity building of rural funding organizations (Cajas Rurales) for the agriculture and milk production sectors specifically.
The SAG, in collaboration with the rural funding organizations, will provide project management support and financial literacy trainings to beneficiaries to allow them to prepare long-term business plans for their operations.
Minor Small producers (48% of
potential beneficiaries) are more exposed to solvency risks and therefore highly sensitive to increased financial pressure.
Institutional support for the agriculture, livestock and milk production sector is not sufficiently developed.
The impact is long-term (10 years).
Implementation of the mitigation measures will allow beneficiaries to improve their ability to manage farm operations and funding adequately and minimize risks of over indebtedness. These measures will also improve the institutional financial support available to producers reducing the residual impact to a Minor significance.
LL3 – Risk of livelihood losses for beneficiaries and other land users due to loss of soil fertility
Embedded measures: The SAG and relevant technical
departments will implement the Training Programme including training on appropriate use of irrigation equipment and sustainable irrigation and agricultural practices, training on adequate use of chemical products and minimizing water usage for irrigation.
The SAG will ensure that beneficiaries allow monitoring of the irrigation equipment for a period of no less than 10 years.
Mitigation measures:
Same Mitigation measures as S1 (Section 7.4.2).
Minor Affection to soil properties
may only result from bad irrigation practices.
Irrigation is limited to 17% of the total cultivated and pasture land.
Irrigation is limited to the dry season (3.5 months per year or 105 days).
Impact significance is reduced to Minor through implementation of the mitigation measures described in Impact S1.

ENVIRONMENTAL RESOURCES MANAGEMENT PAA PROJECT FINANCE A/S
7-71
Impact / Risk Measures to address the impact / risk Residual Impact LL4 – Risk of livelihood and losses for non-project beneficiaries due to decreased availability of water
Embedded measures: • Same embedded mitigation
measures as W5 (Section 7.5.2).
Mitigation measures:
• Same mitigation measures as W5 (Section 7.5.2).
Additional mitigation measures: As part of the Stakeholder
Engagement Plan, the SAG will disclose and implement the grievance mechanism to the wider community, including in particular farmers associations or cooperatives to ensure that small-scale crop framers in the area are able to voice any grievances or complaints related to the Project and seek proper remedy.
Minor Irrigation is limited to 12%
of cultivated and pasture land in the Project Area.
Irrigation is limited to 3.5 months a year.
Water abstraction by the Project activities will be sustainable and renewable, according to the Water Resource Balance developed by PAA and Integra Ingeniería in 2017.
It is very unlikely that groundwater wells installed by the Project are located near other groundwater wells.
Impact significance is reduced to Minor through implementation of the mitigation measures described in Impact W5.
Source: ERM, 2018
7.10 OCCUPATIONAL HEALTH AND SAFETY AND LABOUR RIGHTS
7.10.1 Overview
This section assesses potential impacts to workers directly employed by the SAG or by its contractors/partners and by the beneficiaries themselves as a result of the Aguan Irrigation Project. This assessment addresses occupational health and safety and labour rights including working hours, fair remuneration and working conditions in the pre-operation and operation phase of the Project. A series of mitigation measures have been designed to ensure that the level of impacts to workers is avoided, minimized or reduced. Box 7.9¡Error! No se encuentra el origen de la referencia. below shows the key sources of impacts, potential impacted receptors, as well as baseline and Project influencing factors related to Project impact on workers’ health and safety and labour rights.
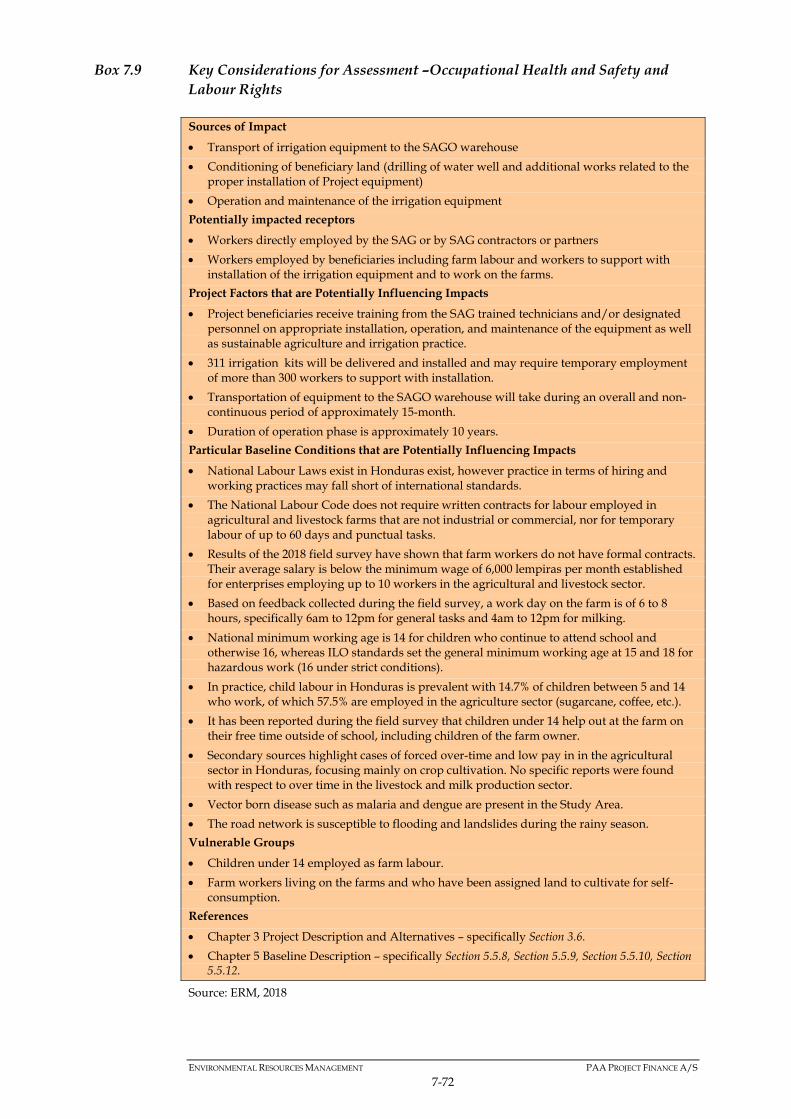
ENVIRONMENTAL RESOURCES MANAGEMENT PAA PROJECT FINANCE A/S
7-72
Box 7.9 Key Considerations for Assessment –Occupational Health and Safety and Labour Rights
Sources of Impact
Transport of irrigation equipment to the SAGO warehouse
Conditioning of beneficiary land (drilling of water well and additional works related to the proper installation of Project equipment)
Operation and maintenance of the irrigation equipment
Potentially impacted receptors
Workers directly employed by the SAG or by SAG contractors or partners
Workers employed by beneficiaries including farm labour and workers to support with installation of the irrigation equipment and to work on the farms.
Project Factors that are Potentially Influencing Impacts
Project beneficiaries receive training from the SAG trained technicians and/or designated personnel on appropriate installation, operation, and maintenance of the equipment as well as sustainable agriculture and irrigation practice.
311 irrigation kits will be delivered and installed and may require temporary employment of more than 300 workers to support with installation.
Transportation of equipment to the SAGO warehouse will take during an overall and non-continuous period of approximately 15-month.
Duration of operation phase is approximately 10 years.
Particular Baseline Conditions that are Potentially Influencing Impacts
National Labour Laws exist in Honduras exist, however practice in terms of hiring and working practices may fall short of international standards.
The National Labour Code does not require written contracts for labour employed in agricultural and livestock farms that are not industrial or commercial, nor for temporary labour of up to 60 days and punctual tasks.
Results of the 2018 field survey have shown that farm workers do not have formal contracts. Their average salary is below the minimum wage of 6,000 lempiras per month established for enterprises employing up to 10 workers in the agricultural and livestock sector.
Based on feedback collected during the field survey, a work day on the farm is of 6 to 8 hours, specifically 6am to 12pm for general tasks and 4am to 12pm for milking.
National minimum working age is 14 for children who continue to attend school and otherwise 16, whereas ILO standards set the general minimum working age at 15 and 18 for hazardous work (16 under strict conditions).
In practice, child labour in Honduras is prevalent with 14.7% of children between 5 and 14 who work, of which 57.5% are employed in the agriculture sector (sugarcane, coffee, etc.).
It has been reported during the field survey that children under 14 help out at the farm on their free time outside of school, including children of the farm owner.
Secondary sources highlight cases of forced over-time and low pay in in the agricultural sector in Honduras, focusing mainly on crop cultivation. No specific reports were found with respect to over time in the livestock and milk production sector.
Vector born disease such as malaria and dengue are present in the Study Area.
The road network is susceptible to flooding and landslides during the rainy season.
Vulnerable Groups
Children under 14 employed as farm labour.
Farm workers living on the farms and who have been assigned land to cultivate for self-consumption.
References
Chapter 3 Project Description and Alternatives – specifically Section 3.6.
Chapter 5 Baseline Description – specifically Section 5.5.8, Section 5.5.9, Section 5.5.10, Section 5.5.12.
Source: ERM, 2018
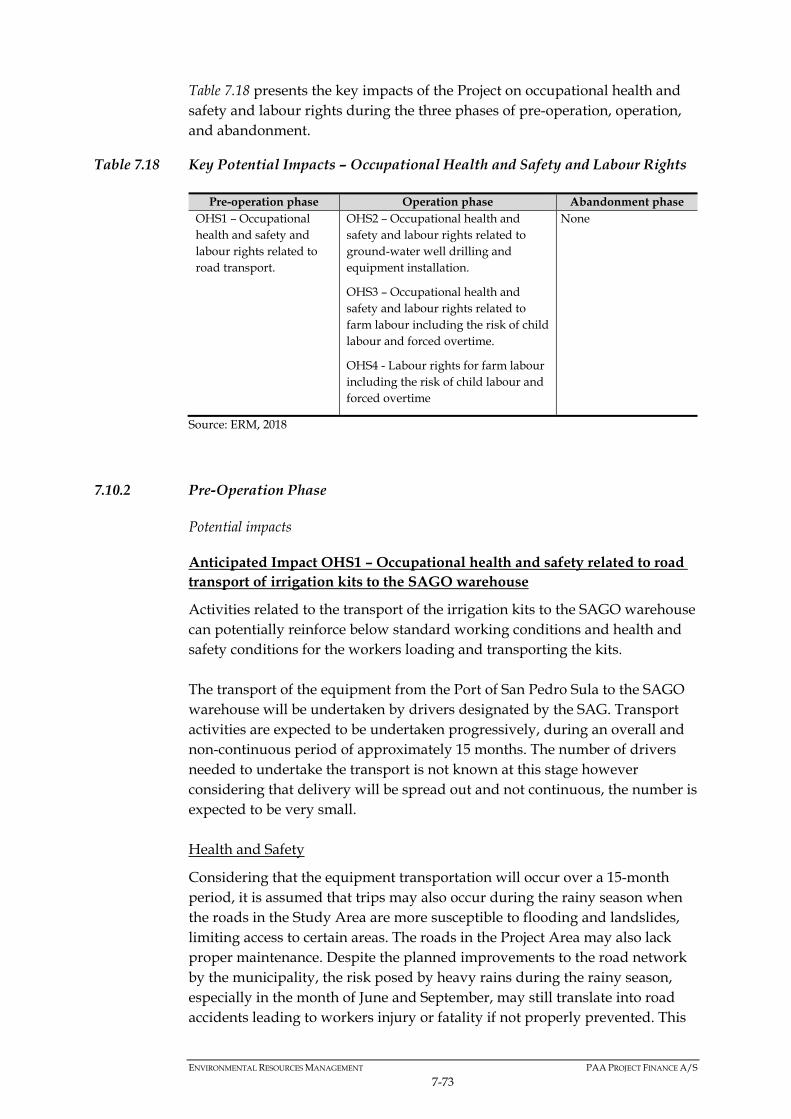
ENVIRONMENTAL RESOURCES MANAGEMENT PAA PROJECT FINANCE A/S
7-73
Table 7.18 presents the key impacts of the Project on occupational health and safety and labour rights during the three phases of pre-operation, operation, and abandonment.
Table 7.18 Key Potential Impacts – Occupational Health and Safety and Labour Rights
Pre-operation phase Operation phase Abandonment phase OHS1 – Occupational health and safety and labour rights related to road transport.
OHS2 – Occupational health and safety and labour rights related to ground-water well drilling and equipment installation.
OHS3 – Occupational health and safety and labour rights related to farm labour including the risk of child labour and forced overtime.
OHS4 - Labour rights for farm labour including the risk of child labour and forced overtime
None
Source: ERM, 2018
7.10.2 Pre-Operation Phase
Potential impacts
Anticipated Impact OHS1 – Occupational health and safety related to road transport of irrigation kits to the SAGO warehouse
Activities related to the transport of the irrigation kits to the SAGO warehouse can potentially reinforce below standard working conditions and health and safety conditions for the workers loading and transporting the kits. The transport of the equipment from the Port of San Pedro Sula to the SAGO warehouse will be undertaken by drivers designated by the SAG. Transport activities are expected to be undertaken progressively, during an overall and non-continuous period of approximately 15 months. The number of drivers needed to undertake the transport is not known at this stage however considering that delivery will be spread out and not continuous, the number is expected to be very small. Health and Safety
Considering that the equipment transportation will occur over a 15-month period, it is assumed that trips may also occur during the rainy season when the roads in the Study Area are more susceptible to flooding and landslides, limiting access to certain areas. The roads in the Project Area may also lack proper maintenance. Despite the planned improvements to the road network by the municipality, the risk posed by heavy rains during the rainy season, especially in the month of June and September, may still translate into road accidents leading to workers injury or fatality if not properly prevented. This

ENVIRONMENTAL RESOURCES MANAGEMENT PAA PROJECT FINANCE A/S
7-74
risk is highest along unpaved roads, tunnels and bridges in the western portion of the Project Area where the road network is less developed, and less so along the middle and eastern portion of the main road leading to Olanchito. In addition, given the distance from the Port of San Pedro Sula to Olanchito (approx. 300 km and a 5-6 hours drive), drivers are also exposed to road accidents due to long hours of continuous driving if not properly trained on safe driving practices. Loading and offloading the kits onto the transport vehicles also present health and safety risks for the workers related to heavy lifting, which requires adequate training and good physical condition. Individuals with back problems will be more susceptible to potential injuries. Labour rights
The hiring of labour for the project will be carried out within the framework of the Honduran Labour Code, and the laws and statutes in force in Honduras, including provisions for overtime pay, minimum working age, and the rights of children and adolescents. However, in practice working conditions and labour rights in Honduras may fall short of ILO standards in terms of overtime work and minimum age. Also certain provisions of the Labour Code such as the requirement of a written contract do not apply to temporary labour employed for less than 60 days. In the case of the drivers, since the transport of equipment is not continuous, they may not be employed on the basis of a written contract. However, considering the punctual nature of the work, the impact is considered negligible. Overall, assuming that Project transport will follow the main municipal road which is relatively well maintained, and considering the short-term and temporary nature of the work, the impact magnitude is considered small for both health and safety and labour rights. Receptor sensitivity is high considering the risk of serious injury and death. Mitigation Measures
The project design already includes the following embedded measures:
The SAG will employ labour for the project within the framework of the Honduran Labour Code, and the laws and statutes in force in Honduras, including provisions for overtime pay, minimum working age, and the rights of children and adolescents.
Mitigation measures to ensure improved health and safety for workers during pre-operation:
The SAG will develop and implement a Traffic Management Plan indicating the route to follow especially during the rainy season when smaller roads in the Study Area are less accessible due to flooding and landslides. The plan will include measures such as stopping the car in case of heavy rains, not crossing rivers and creeks during floods, hours of driving and rest periods, etc.

ENVIRONMENTAL RESOURCES MANAGEMENT PAA PROJECT FINANCE A/S
7-75
The SAG through relevant technical departments or partner organizations will provide training on traffic safety to selected drivers.
As part of the hiring process, the SAG will request medical approval for loading and offloading heavy packages and provide adequate training to selected drivers on good loading and offloading techniques.
Mitigation measures to ensure respect for workers’ rights while keeping in mind the national context:
As part of the Project’s Stakeholder Engagement Plan, the SAG will develop and disclose a grievance mechanism for all Project stakeholder including workers to ensure that a stakeholder can voice concerns with respect to the Project and have access to a fair and transparent resolution mechanism. The grievance mechanisms and disclosure process is described in detail in Annex 1 of the present ESIA.
The SAG through relevant technical departments will conduct regular monitoring of labour issues through following up on the grievances raised.
Residual Impacts
Table 7.19 summarises the impacts on workers’ health and safety and labour rights as a result of the Project activities during the pre-operation phase. The embedded measures considered in the Project Design and the mitigation measures defined during the impact assessment reduce the residual impact significance to Minor.
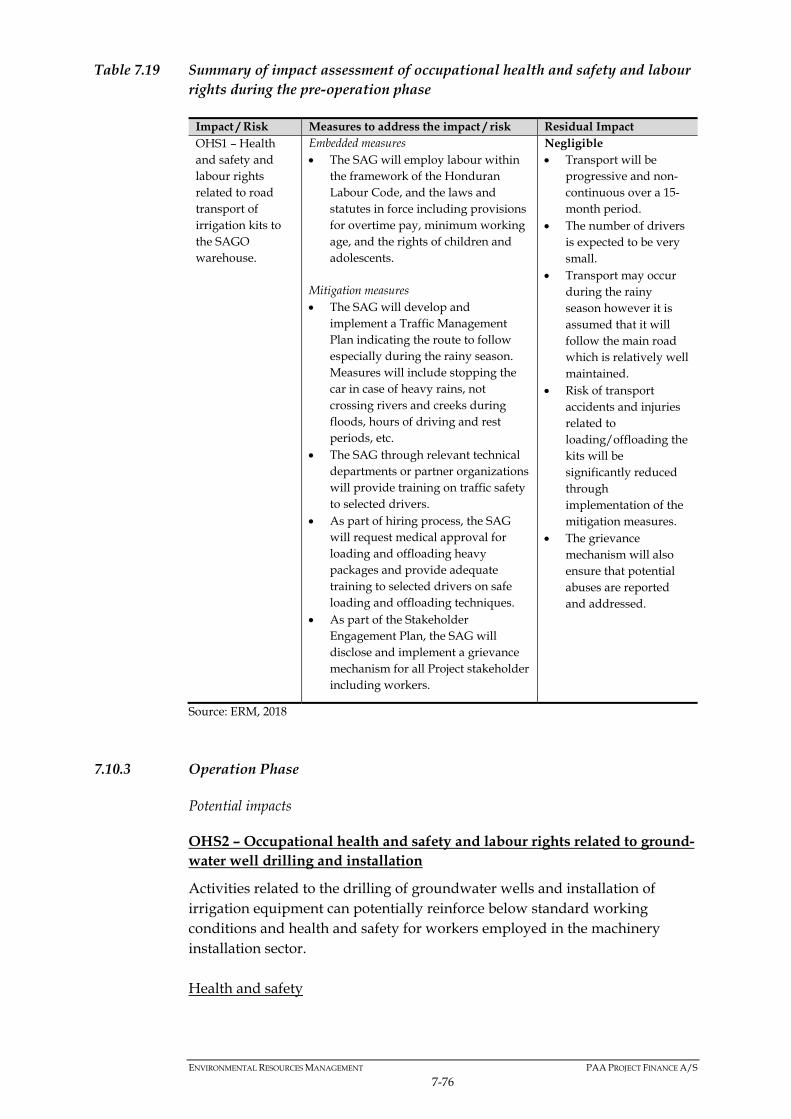
ENVIRONMENTAL RESOURCES MANAGEMENT PAA PROJECT FINANCE A/S
7-76
Table 7.19 Summary of impact assessment of occupational health and safety and labour rights during the pre-operation phase
Impact / Risk Measures to address the impact / risk Residual Impact OHS1 – Health and safety and labour rights related to road transport of irrigation kits to the SAGO warehouse.
Embedded measures The SAG will employ labour within
the framework of the Honduran Labour Code, and the laws and statutes in force including provisions for overtime pay, minimum working age, and the rights of children and adolescents.
Mitigation measures The SAG will develop and
implement a Traffic Management Plan indicating the route to follow especially during the rainy season. Measures will include stopping the car in case of heavy rains, not crossing rivers and creeks during floods, hours of driving and rest periods, etc.
The SAG through relevant technical departments or partner organizations will provide training on traffic safety to selected drivers.
As part of hiring process, the SAG will request medical approval for loading and offloading heavy packages and provide adequate training to selected drivers on safe loading and offloading techniques.
As part of the Stakeholder Engagement Plan, the SAG will disclose and implement a grievance mechanism for all Project stakeholder including workers.
Negligible Transport will be
progressive and non-continuous over a 15-month period.
The number of drivers is expected to be very small.
Transport may occur during the rainy season however it is assumed that it will follow the main road which is relatively well maintained.
Risk of transport accidents and injuries related to loading/offloading the kits will be significantly reduced through implementation of the mitigation measures.
The grievance mechanism will also ensure that potential abuses are reported and addressed.
Source: ERM, 2018
7.10.3 Operation Phase
Potential impacts
OHS2 – Occupational health and safety and labour rights related to ground-water well drilling and installation
Activities related to the drilling of groundwater wells and installation of irrigation equipment can potentially reinforce below standard working conditions and health and safety for workers employed in the machinery installation sector. Health and safety

ENVIRONMENTAL RESOURCES MANAGEMENT PAA PROJECT FINANCE A/S
7-77
As discussed in Impact EE3 (Section 7.8.3), beneficiaries may seek to hire temporary labour to support them in installing the irrigation equipment. The workers involved in the installation will be exposed to potential health and safety risks primarily related to weather conditions such as high temperatures that may cause sunstroke, heat stroke and burns for installation workers. Assuming one workers per installation kit, it is estimated that more than 300 workers may be hired on a temporary basis and for a very short-term of one or two days, which limits exposure of workers to health and safety risks. Also, as an embedded measure in Project design, the beneficiaries will receive training on adequate equipment installation, use and maintenance. Assuming that beneficiaries in turn train the workers they hire, this should contribute to reducing the risks of potential accidents and injuries related to equipment installation, resulting in an impact of small magnitude As for the specialized local or regional drilling companies’ workers conducting the groundwater wells drilling activities, in addition to heat related risk, other hazardous conditions specifically related to groundwater well drilling include the risk of injury associated with a drilling rig and its ancillary equipment (moving parts, heat, noise, falls, crushing) as well as the storage and use of hazardous materials (such as fuels, lubricants, cement, grouts, etc.) on site.1 Assuming that two three employees per vehicle are employed, the magnitude of the impact is considered negligible. Labour rights
As stated in Impact OHS1 above (Section 7.10.2), verbal contracts are not required by law for activities of temporary nature of up to 60 days or for punctual activities priced at 200 Lempiras or less, which increases the precariousness of working conditions for the workers and increases the risk of labour abuses such as unpaid overtime. This applies to the NGO workers performing the well-drilling activities since the activity may last between one and 10 days depending on the characteristics of the well. Similarly, labour that may be hired by the beneficiaries to support with the installation will also be employed on the basis of verbal contracts, increasing the risk of potential labour abuses as mentioned above. However, considering the short-term and punctual nature of the work performed and the limited number of workers required, the impact is considered of small magnitude. Overall, the impact magnitude is considered small although receptor sensitivity is medium considering the risks of injuries if appropriate measures are not in place. OHS3 – Occupational health and safety of farm labour
The operation and maintenance of the irrigation equipment could potentially reinforce below standard health and safety conditions for farm workers 1 UK Environment Agency (2006). Guidance on the Design and Installation of Groundwater Quality Monitoring Points. Accessed at: https://assets.publishing.service.gov.uk/government/uploads/system/uploads/attachment_data/file/290727/scho0106bkct-e-e.pdf

ENVIRONMENTAL RESOURCES MANAGEMENT PAA PROJECT FINANCE A/S
7-78
employed by beneficiaries, mainly exposure to vector-borne disease and noise from the motor pump. Vector-borne disease
As part of the operation of the irrigation equipment, water will be extracted from the groundwater or hand-dug wells and stored in water tanks before being pumped into the irrigation system and redistributed across the fields. This process will imply the creation of stagnant water sources some intended (ie. well and container) and other unintended such as small puddles or patches of water due to possible leaks. These piles of stagnant water constitute breeding grounds for mosquitos carrying vector-borne diseases and increase the risk of transmission of diseases such as malaria and dengue fever. In fact, dengue has been reported to occur in the Study Area with 10.4% of the population of Arenal affected in 2011. Malaria is also reportedly present in Olanchito, especially during the rainy season when the risk is highest. This being said dengue and malaria occurrences have reportedly been very limited in recent years in the Study Area. Farm workers working on the fields on a daily basis will be most exposed to these mosquitos gathering near the stagnant water piles. The risk of transmission is even higher given that workers reportedly start working in the early morning between 4am or 6am when malaria-carrying mosquitos are most active. Also, some farms do not have access to basic services such as wastewater management systems, which may also contribute to spreading vector-borne diseases. Workers and poor families, especially children, are considered most vulnerable to these diseases as they may lack the capacity or awareness necessary to prevent infection. Considering the expected increase in production as a result of the Project, the number of permanent labour is also expected to increase, which may imply more workers and their families living on the farms. Considering that about 23% of the occupied population of the Project Area is employed as low-skilled farm labour, and that this number is expected to increase as a result of Project-induced hiring, the population exposed to an increased risk of transmission of vector-borne disease would represent over 25% of the population in the Project Area. This being said, it is expected that the irrigation system will be used during the dry season, which reduces the risk considerably. In addition, vector-borne disease occurrences are reportedly very limited in the Area. As such, the impact magnitude is considered small with highly sensitive receptors. Noise from the pumps/generators
Farm workers will also be exposed to the noise from the motor pumps/generators. As described in Impact N1 on the Acoustic Environment (Section 7.3), the impact is expected to be negligible considering that the noise levels produced by the pumps/generators are similar to other existing noises in the Project Area. Also, the pump/generator will only be operating 3 months

ENVIRONMENTAL RESOURCES MANAGEMENT PAA PROJECT FINANCE A/S
7-79
a year during the dry season and 3-4 days a week. As an embedded measure, the Project will include training to beneficiaries on adequate use of the irrigation equipment which involves minimizing the use of the pump/generator as much as possible. OHS4 – Labour rights of farm labour including child labour and forced overtime
Field survey findings show that workers in the farms of potential beneficiaries do not have written employment contracts as formal employment contracts are not required for farm workers under the national Labour Code. Similarly, the law does not state minimum salary requirements for labour not employed in companies. The field survey has also highlighted the absence of medical coverage or insurance, clear remuneration criteria or working hours. However, it has been noted that despite the absence of formal contracts, most of the time, the producer covers medical costs for worker hospitalization, who usually also benefits from a paid medical leave. Workers also reportedly receive a fixed monthly salary depending on the task they perform and have more or less specific working hours. In the case of workers who live on the farms with their families, it has been reported, that some of them receive a portion of land for cultivation for personal consumption. Despite the reported conditions, the lack of a formal contract leaves room to potential labour abuses including low pay and forced overtime, and makes workers vulnerable to changes in the employers’ disposition for covering medical expenses and other benefits such as access to land for self-cultivation. Specifically, workers who have been informally assigned a plot of land to cultivate face the risk that the employer reassigns the plot to use it for cultivation of additional cattle feed, leading to a loss of livelihood for the worker if he is not assigned alternative land to cultivate on. Considering workers’ vulnerable economic situation and their reliance on subsistence farming, workers may be highly sensitive to loss of access to land and to the absence of a formal contract protecting their rights. Child labour
According to the Labour code, children are allowed to start work at 14, which is below the minimum age set out by ILO as 15 for general work and 18 for hazardous work. No child labour has been observed during the June 2018 field survey on visited farms of potential beneficiaries. However it has been reported that in most cases, children under 14 help-out at the farm on their free time outside of school. Nevertheless, in case of shortage of workforce in the area there is a risks that children under 14 could be required to work. Forced labour
Based on secondary sources, cases of forced over-time and low pay in the agricultural sector in Honduras are reportedly common and are mainly due to the lack of specific legal sanctions, and mostly, to the culture of tolerance of
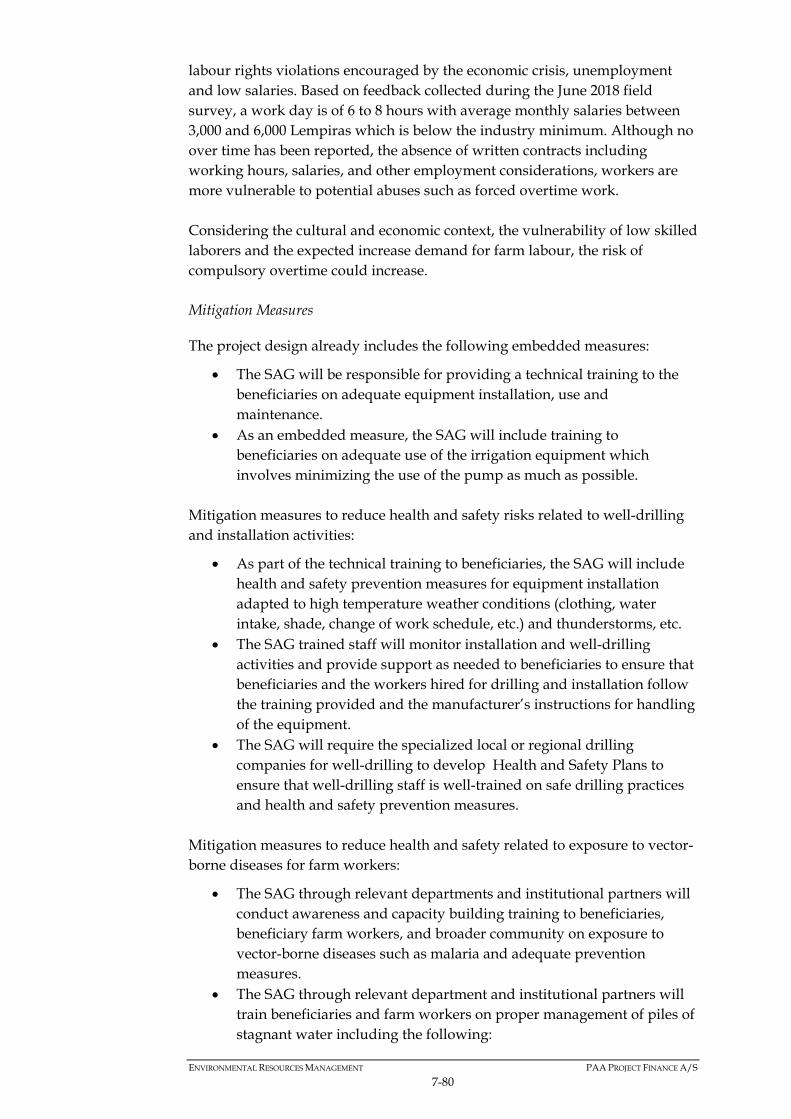
ENVIRONMENTAL RESOURCES MANAGEMENT PAA PROJECT FINANCE A/S
7-80
labour rights violations encouraged by the economic crisis, unemployment and low salaries. Based on feedback collected during the June 2018 field survey, a work day is of 6 to 8 hours with average monthly salaries between 3,000 and 6,000 Lempiras which is below the industry minimum. Although no over time has been reported, the absence of written contracts including working hours, salaries, and other employment considerations, workers are more vulnerable to potential abuses such as forced overtime work. Considering the cultural and economic context, the vulnerability of low skilled laborers and the expected increase demand for farm labour, the risk of compulsory overtime could increase. Mitigation Measures
The project design already includes the following embedded measures:
The SAG will be responsible for providing a technical training to the beneficiaries on adequate equipment installation, use and maintenance.
As an embedded measure, the SAG will include training to beneficiaries on adequate use of the irrigation equipment which involves minimizing the use of the pump as much as possible.
Mitigation measures to reduce health and safety risks related to well-drilling and installation activities:
As part of the technical training to beneficiaries, the SAG will include health and safety prevention measures for equipment installation adapted to high temperature weather conditions (clothing, water intake, shade, change of work schedule, etc.) and thunderstorms, etc.
The SAG trained staff will monitor installation and well-drilling activities and provide support as needed to beneficiaries to ensure that beneficiaries and the workers hired for drilling and installation follow the training provided and the manufacturer’s instructions for handling of the equipment.
The SAG will require the specialized local or regional drilling companies for well-drilling to develop Health and Safety Plans to ensure that well-drilling staff is well-trained on safe drilling practices and health and safety prevention measures.
Mitigation measures to reduce health and safety related to exposure to vector-borne diseases for farm workers:
The SAG through relevant departments and institutional partners will conduct awareness and capacity building training to beneficiaries, beneficiary farm workers, and broader community on exposure to vector-borne diseases such as malaria and adequate prevention measures.
The SAG through relevant department and institutional partners will train beneficiaries and farm workers on proper management of piles of stagnant water including the following:

ENVIRONMENTAL RESOURCES MANAGEMENT PAA PROJECT FINANCE A/S
7-81
o Preventing that water stays stagnant for more than 10 to 12 days as water renewal prevents mosquito larvae from competing their growth cycle.
o Placing a protection mesh on top of water tanks to protect the water.
o Using biological / organic products (bacteria) to destroy the larvae in the water.
Mitigation measures to ensure improved working conditions and labour rights for farm workers:
As part of the Project’s Stakeholder Engagement Plan, the SAG will develop and disclose a grievance mechanism for all Project stakeholder including workers to ensure that a stakeholder can voice concerns with respect to the Project and have access to a fair and transparent resolution mechanism.
The SAG through relevant technical departments will conduct regular monitoring of labour issues through following up on the grievances raised.
The SAG will monitor farm labour working conditions on beneficiary farms to ensure that worker’s rights are respected, including minimum age requirements and overtime work.
The SAG will conduct a preliminary identification of the number of farm workers who have been assigned land for self-cultivation on beneficiary land and will require that beneficiaries commit to ensuring that these workers continue having access to the land in question or to alternative parcels of equal or higher quality.
Residual Impacts
Table 7.20 summarises the impacts on occupational health and safety and labour rights as a result of the Project activities during the operation phase. The embedded measures considered in the Project Design and the mitigation measures defined during the impact assessment reduce the residual impact significance to Negligible to Minor.

ENVIRONMENTAL RESOURCES MANAGEMENT PAA PROJECT FINANCE A/S
7-82
Table 7.20 Summary of impact assessment of workers’ health and safety and labour rights during the operation phase
Impact / Risk Measures to address the impact / risk Residual Impact OHS2 – Occupational health and safety and labour rights related to installation and well drilling.
Embedded measures The SAG will be responsible for
providing a technical training to the beneficiaries on adequate equipment installation, use and maintenance.
Mitigation measures: As part of the technical training to
beneficiaries, the SAG will include health and safety prevention measures for equipment installation adapted to high temperature weather conditions (clothing, water intake, shade, change of work schedule, etc.) and thunderstorms, etc.
The SAG trained staff will monitor installation and well-drilling activities and provide support as needed.
The SAG will require the specialised local or regional drilling companies for well-drilling to develop Health and Safety Plans to ensure that well-drilling staff is well-trained on safe drilling practices and health and safety prevention measures.
As part of the Project’s Stakeholder Engagement Plan, the SAG will disclose and implement the grievance mechanism for all Project stakeholder including workers.
The SAG will conduct regular monitoring of labour issues by following up on the grievances raised.
Negligible to Minor Very short term and
punctual work (one to two days for installation and up to 10 days for wells).
Limited exposure to OHS risk and labour abuse considering adequate mitigation measures will be implemented.
Workers sensitivity remains high since accidents can lead to injuries and even death.

ENVIRONMENTAL RESOURCES MANAGEMENT PAA PROJECT FINANCE A/S
7-83
Impact / Risk Measures to address the impact / risk Residual Impact OHS3 – Occupational health and safety of farm labour
Embedded measures The SAG will include training to
beneficiaries on adequate use of the irrigation equipment which involves minimizing the use of the pump as much as possible.
Mitigation measures The SAG through relevant departments
and institutional partners will conduct awareness and capacity building training to beneficiaries, beneficiary farm workers, and the broader community on exposure to vector-borne diseases such as malaria and adequate prevention measures.
The SAG through relevant department and institutional partners will train beneficiaries and farm workers on proper management of piles of stagnant water.
Minor Presence of dengue
and malaria in the Study Area.
Workers and poor families, especially children are most vulnerable.
The irrigation system will be used during the dry season when the risk of vector-borne disease is significantly lower.
The motor pump will only operate 3 months a year.
The implementation of awareness raising programmes, proper management of piles of water, and appropriate use of the motor pump will further reduce impact significance.
OHS4 - Labour rights for farm labour including the risk of child labour and forced overtime
Mitigation measures As part of the Project’s Stakeholder
Engagement Plan, the SAG will develop and disclose a grievance mechanism for all Project stakeholder including workers to ensure that a stakeholder can voice concerns and have access to a fair and transparent resolution mechanism.
The SAG through relevant technical departments will conduct regular monitoring of labour issues through following up on the grievances raised.
The SAG will monitor farm labour working conditions on beneficiary farms to ensure that worker’s rights are respected, including minimum age requirements and overtime work.
The SAG will conduct a preliminary identification of the number of farm workers who have been assigned land for self-cultivation on beneficiary land and will require beneficiaries to commit to ensuring that these workers continue having access to the land in question or to alternative parcels of equal or higher quality. The SAG will conduct regular monitoring during the operation phase to ensure that workers have not lost access to land.
Negligible to Minor Important
shortcomings of the labour law (no contract or salary requirements for farm labour)
Approximately 25% of the occupied population is employed as farm labour.
Farm workers are considered highly vulnerable in particular those who risk losing the land they have been assigned for self-cultivation.
Child labour (under 14) and overtime work are common in the sector.
The impact is long-term (10-years).
The measures in place will contribute to minimizing the impact to moderate or minor.
Source: ERM, 2018

ENVIRONMENTAL RESOURCES MANAGEMENT PAA PROJECT FINANCE A/S
7-84
7.11 COMMUNITY HEALTH AND SAFETY
7.11.1 Overview
Project implementation during the operation phase could affect the health and safety of the beneficiaries as a result of exposure to a potential increase in vector-borne and water-borne diseases in relation to the use of the irrigation equipment. Any beneficiary and non-beneficiary concerns or perceptions with regard to reduced health also need to be addressed. Box 7.10 below shows the key sources of impacts, potential impacted receptors, as well as baseline and Project influencing factors related to Project impact on community health and safety.
Box 7.10 Key Considerations for Assessment – Community Health and Safety
Sources of Impact
Operation and maintenance of the irrigation equipment
Potentially impacted receptors
Beneficiaries and their families
Non-beneficiaries in the Project Area
Primary health care facilities in the Project Area.
Project Factors that are Potentially Influencing Impacts
Project beneficiaries receive training from the SAG trained technicians and/or designated personnel on appropriate installation, operation, and maintenance of the equipment as well as sustainable agriculture and irrigation practice.
Duration of operation phase is approximately 10 years.
Particular Baseline Conditions that are Potentially Influencing Impacts
Vector-borne diseases such as malaria and dengue are present in the Study Area.
Limited access to health care especially in rural areas, with health centres located in hamlets of 2,000 inhabitants or more.
Limited number of doctors (0.083 per 1,000 population).
Limited sanitation coverage and poor waste wastewater management in rural settlements..
Vulnerable Groups
Children under 14 who are most vulnerable to vector-borne and water-borne diseases.
Water-borne infections are the most common causes of intestinal infections and diarrheas for which 18% of all reported cases in Olanchito occurred among children under 5 years of age and 20% among children between 5 and 14.
21% of children between 1 and 4 years old in Honduras die of diarrhea.
References
Chapter 3 Project Description and Alternatives – specifically Section 3.6.
Chapter 5 Baseline Description – specifically Section 5.5.10 and Section 5.5.12.
Chapter 7 Impact Assessment - specifically Section 7.5.
Source: ERM, 2018
Table 7.21 presents the key impacts of the Project on community health and safety during the three phases of pre-operation, operation, and abandonment.

ENVIRONMENTAL RESOURCES MANAGEMENT PAA PROJECT FINANCE A/S
7-85
Table 7.21 Key Potential Impacts – Community Health and Safety
Pre-operation phase Operation phase Abandonment phase None CHS1 – Increased risk of water-borne
diseases due to poor drinking water quality
CHS2 – Increased transmission of vector-borne diseases
CH3 – Increased tension on healthcare infrastructure and access to healthcare
None
Source: ERM, 2018
7.11.2 Operation Phase
Potential impacts
CHS1 –Increased risk of water-borne diseases due to poor drinking water quality
The use of fertilisation and pest control and the handling of hazardous substances such as fuel in the areas irrigated by the Project could reach surface water sources if not properly managed. The risk of contamination of water sources poses a threat to the health of local communities who rely on surface water for drinking purposes. Health issues related to poor quality of drinking water already exist in the Project Area due to poor waste water management and lack of potabilisation. Most cases were reported among young children, who are particularly sensitive to water-borne diseases. As described in Impact W1 (Section 7.5), the loss of water quality, both surface and groundwater, will occur only as a result of bad practices in the use of herbicides and pesticides on the irrigated land located inside the Project Area and will be primarily limited to water resources inside the Project Area. Taking into account field survey findings, the use of chemical products in the Study Area is considered appropriate as these products are used only in small quantities and a few times a year. In any case, in the event of agricultural runoff, surface water flow data shows that the Aguan River and its tributaries have a very good capacity to dilute potential herbicide or pesticide that may reach the rivers, even during the dry season when the surface water flows are lower (Impact W1). Nevertheless, small surface water features in the Project Area, not connected to the Aguan River and / or its tributaries, such as ponds and reservoirs, would be more vulnerable to the loss of water quality. As an embedded measure, the Project’s Training Programme will include minimizing the use of chemical products as much as possible and favouring chemical products with low toxicity levels, which contributes to reducing further the potential impact magnitude. Farmers also receive advice from SENASA to consider alternative options to pesticides.

ENVIRONMENTAL RESOURCES MANAGEMENT PAA PROJECT FINANCE A/S
7-86
Finally, potable water sources for human consumption are located in upper areas of the tributaries of the Aguan River upstream of the Project Area, which makes potential contamination by the Project unlikely. As such, potential contamination of surface drinking waters in the Project Area is more likely to occur due to existing conditions such as poor wastewater management and organic contamination in settlements near the Aguan River or its tributaries. Given the vulnerability of children to water-borne diseases, receptors are considered highly sensitive to any potential decrease in drinking water quality. CHS2 - Increased transmission of vector-borne diseases
As discussed previously in Impact OHS3 (Section 7.10.3), the operation of the irrigation equipment is expected to generate stagnant water piles which increases the risk of transmission of vector-borne diseases on beneficiary farms and surrounding areas if not properly contained. Since both dengue and malaria are reportedly present in the Study Area, although occurrences are low, Project implementation may further increase the risk of transmission, which was raised as a concern by the municipal organism in charge of monitoring vector-borne disease in Olanchito during the field survey. This being said, the irrigation system will be used primarily during the dry season, when the risk of vector-born disease transmission is significantly lower. The magnitude is therefore considered small. Low-income beneficiaries (small producers), especially children, are considered most vulnerable to diseases transmission as they may lack the awareness or knowledge necessary to prevent infection. Since 14% of beneficiaries are small producers with less than 10 ha of land, receptor sensitivity is therefore considered medium. CHS3 - Increased pressure on health infrastructure and access to health care
As described in previously in Impact OHS2 (Section 7.10.3) Project implementation increases the exposure to potential accidents and injuries related to well-drilling activities and equipment installation if appropriate preventive measures are not taken. The operation of the irrigation system will also potentially increase the risk of transmission of vector-borne (Impact CHS2) and water-borne (Impact CHS1) disease during the 10-year operation phase. Since access to healthcare services is limited in rural areas as health centres are mostly located in hamlets of 2,000 or more inhabitants and given the low doctor to population ratio in the area (0.1 per 1000), the increased risk of injuries and diseases may result in increased pressure on health infrastructure and healthcare services if these risks are not properly managed and if healthcare offering in the Study Area is not improved. With respect to the installation of irrigation equipment and well-drilling activities Impact OHS2 (Section 7.10.3), the nature of the work is temporary and very punctual (one to two days for installation and up to 10 days for well-drilling) and will be spread out over a 2-year period which reduces the likelihood of overlap of installations activities. Despite the limited access to

ENVIRONMENTAL RESOURCES MANAGEMENT PAA PROJECT FINANCE A/S
7-87
healthcare in rural areas and the low doctor to population ratio in the Study Area, pressure on health infrastructure and healthcare services as a result of these activities is therefore not expected, and as such the related potential impact is considered insignificant or negligible. As for water-borne disease (Impact CHS1) and vector-borne disease (Impact CHS2), the impact magnitude is rated as small since irrigation will occur only 3.5 months a year during the dry season and considering a number of other factors, such as the appropriate use of chemical substances observed in the Area, the hydrological features of the Aguan River, and the Training Programme in place. Nevertheless focusing irrigation during 3.5 months implies that the occurrence of Project-related diseases will also be focused over a 3.5 months period. If not prevented, this can lead to an increase in cases that the existing healthcare infrastructure might not be able to absorb efficiently, which would translate into longer waiting times and worse health outcomes. Children and poor households are most vulnerable to these diseases and are considered highly sensitive to the potential increased pressure on healthcare. Mitigation Measures
The Project design already includes the following embedded measures:
The SAG and relevant technical departments will implement the Training Programme including training on appropriate use of irrigation equipment and sustainable irrigation and agricultural practices, training on adequate use of chemical pesticides, herbicides and fertilizers, and minimizing water usage for irrigation.
Measures to mitigate the potential impacts on community health due to the potential decrease in drinking water quality are presented in Impact W1 (Section 7.5). With respect to the increased exposure to vector-borne diseases the mitigation measures listed for Impact OHS3 in Section 7.10.3 apply. Additional measures include the following:
The SAG will partner with the relevant institutional and organizational partners to develop and implement a Community Health and Safety Plan including awareness raising and capacity building programmes for settlements in the Project Area on the prevention of vector-borne and water-borne diseases.
In order to mitigate the increased pressure on health infrastructure and healthcare services the following measures will apply:
The SAG will partner with the relevant institutional and organizational partners to develop and implement a Community Health and Safety Plan including community awareness programmes in order to prevent potential disease occurrence and therefore reduce the risk of increased pressure on the healthcare system in the Study Area during the 3.5 months of irrigation.

ENVIRONMENTAL RESOURCES MANAGEMENT PAA PROJECT FINANCE A/S
7-88
As part of the Community Health and Safety Plan, the SAG and relevant partners will promote any developments to the healthcare sector in the Study Area, including the delivery of capacity building on the prevention and treatment of vector-borne and water-borne diseases.
Residual Impacts
Table 7.22 summarises the impacts on community health and safety as a result of the Project activities during the operation phase.
Table 7.22 Summary of impact assessment of workers’ health and safety and labour rights during the operation phase
Impact / Risk Measures to address the impact / risk Residual Impact CHS1 – Increased risk of water-borne disease due to poor drinking water quality
Embedded measures SAG and relevant technical
departments to implement the Training Programme including training on adequate use of chemical pesticides, herbicides and fertilizers.
Mitigation measures: Same mitigation measures as Impact
W1 (Section 7.5) SAG to partner with the relevant
institutional and organizational partners to develop and implement a Community Health and Safety Plan including awareness raising and capacity building programmes for settlements in the Project Area on the prevention of vector-borne and water-borne diseases.
Minor Irrigation is limited to
5% of the Project Area and to 3.5 months a year.
Limited use of pesticides and herbicides in the Project Area.
Good dilution capacity in the rivers in the Project Area and no impacts expected on water resources outside the Area.
Drinking water outlets are located in upper areas of the tributaries.
Communities, especially children under 14 are highly sensitive to degradation of water quality.
The implementation of the mitigation measures reduces the impact significance to Minor.

ENVIRONMENTAL RESOURCES MANAGEMENT PAA PROJECT FINANCE A/S
7-89
Impact / Risk Measures to address the impact / risk Residual Impact
CHS2 – Increased transmission of vector-borne diseases
Embedded measures SAG to include training to beneficiaries
on adequate use of the irrigation equipment which involves minimizing the use of the pump as much as possible.
Mitigation measures Same mitigation measures as Impact
OHS3 (Section 7.10.3) SAG to partner with the relevant
institutional and organizational partners to develop and implement a Community Health and Safety Plan including awareness raising and capacity building programmes for settlements in the Project Area on the prevention of vector-borne and water-borne diseases.
SAG through relevant department and institutional partners to train beneficiaries and farm workers on proper management of piles of stagnant water.
Minor Presence of dengue
and malaria in the Study Area.
Children are most vulnerable.
The irrigation system will be used during the dry season when the risk of vector-borne disease is significantly lower.
The implementation of awareness raising programmes, and proper management of piles of water will reduce impact significance to Minor.
CHS3- Increased pressure on health infrastructure care and access to health care
Mitigation measures: SAG will partner with the relevant
institutional and organizational partners to develop and implement a Community Health and Safety Plan including community awareness programmes in order to prevent potential disease occurrence and therefore reduce the risk of increased pressure on the healthcare system in the Study Area during the 3.5 months of irrigation.
As part of the Community Health and Safety Plan, the SAG and relevant partners will promote any developments to the healthcare sector in the Study Area, including the delivery of capacity building on the prevention and treatment of vector-borne and water-borne diseases.
Minor Increased risk of
exposure to diseases concentrated over 3.5 months a year.
Limited access to healthcare services in rural areas and low capacity of healthcare providers (0.1 doctors for 1,000 people).
Limited ability of the healthcare system to absorb an increase in disease occurrence over a concentrated period of time.
Children are highly sensitive to poor healthcare delivery.
Impact magnitude for the increase in vector-borne and water-borne disease occurrence is considered small.
Implementation of mitigation measures to prevent disease occurrence and to improve healthcare service delivery will reduce the impact to a significance of minor.
Source: ERM, 2018
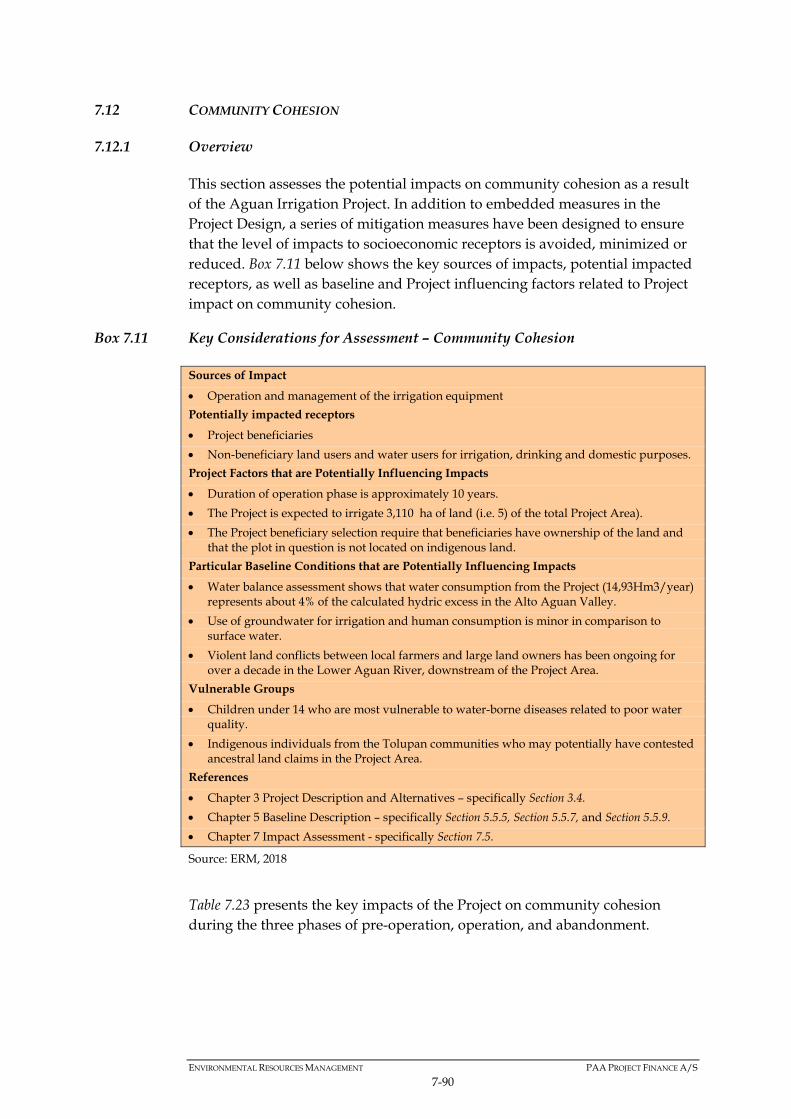
ENVIRONMENTAL RESOURCES MANAGEMENT PAA PROJECT FINANCE A/S
7-90
7.12 COMMUNITY COHESION
7.12.1 Overview
This section assesses the potential impacts on community cohesion as a result of the Aguan Irrigation Project. In addition to embedded measures in the Project Design, a series of mitigation measures have been designed to ensure that the level of impacts to socioeconomic receptors is avoided, minimized or reduced. Box 7.11 below shows the key sources of impacts, potential impacted receptors, as well as baseline and Project influencing factors related to Project impact on community cohesion.
Box 7.11 Key Considerations for Assessment – Community Cohesion
Sources of Impact
Operation and management of the irrigation equipment
Potentially impacted receptors
Project beneficiaries
Non-beneficiary land users and water users for irrigation, drinking and domestic purposes.
Project Factors that are Potentially Influencing Impacts
Duration of operation phase is approximately 10 years.
The Project is expected to irrigate 3,110 ha of land (i.e. 5) of the total Project Area).
The Project beneficiary selection require that beneficiaries have ownership of the land and that the plot in question is not located on indigenous land.
Particular Baseline Conditions that are Potentially Influencing Impacts
Water balance assessment shows that water consumption from the Project (14,93Hm3/year) represents about 4% of the calculated hydric excess in the Alto Aguan Valley.
Use of groundwater for irrigation and human consumption is minor in comparison to surface water.
Violent land conflicts between local farmers and large land owners has been ongoing for over a decade in the Lower Aguan River, downstream of the Project Area.
Vulnerable Groups
Children under 14 who are most vulnerable to water-borne diseases related to poor water quality.
Indigenous individuals from the Tolupan communities who may potentially have contested ancestral land claims in the Project Area.
References
Chapter 3 Project Description and Alternatives – specifically Section 3.4.
Chapter 5 Baseline Description – specifically Section 5.5.5, Section 5.5.7, and Section 5.5.9.
Chapter 7 Impact Assessment - specifically Section 7.5.
Source: ERM, 2018
Table 7.23 presents the key impacts of the Project on community cohesion during the three phases of pre-operation, operation, and abandonment.

ENVIRONMENTAL RESOURCES MANAGEMENT PAA PROJECT FINANCE A/S
7-91
Table 7.23 Key Potential Impacts – Community Cohesion
Pre-operation phase Operation phase Abandonment phase None CC1 – Increased tensions between
communities, producers, and beneficiaries over land ownership and water availability in the dry season
None
Source: ERM, 2018
7.12.2 Operation Phase
Potential impacts
CC1 – Increased tensions between communities, producers, and beneficiaries over land ownership and water availability in the dry season
Project implementation may lead to increased tensions in the communities around the use of water and land ownership if these issues are not foreseen and properly managed. Specifically, groundwater extraction for irrigation by the Project could potentially lead to increased tensions and risk of conflict around both groundwater and surface water availability between competing water users for irrigation, drinking and domestic purposes, especially during the dry period. As discussed in Impact LL4 (Section 7.9.2) and Impact W5 (Section 7.5), depletion of groundwater resources and the interaction between groundwater wells is not likely to occur (water balance assessment shows only a very low % of the hydric excess will be abstracted). It is also unlikely that groundwater wells installed by the Project are located near other groundwater wells which should prevent interaction between wells. However, potential localized decrease in water table cannot be discarded and the potential risk must be analysed at each well opening. As for drinking water sources, as discussed in Impact CHS1 (Section 7.11.2), the community drinking water supply outlets are located upstream of the agricultural production area, and as such, irrigation activity is not expected to interfere on the quantity or quality of the water delivered to the communities for drinking or domestic purposes. Also, as embedded measures in Project design, the location of the water abstraction source will be selected making sure that it is away from other water sources such as existing groundwater wells and from potential contamination sources. As such, the risk of tensions between water users is considered low and the magnitude of the impacts is therefore small to medium. However the sensitivity of water users for irrigation and drinking water is considered high given the importance of water availability for irrigation and the vulnerability of the community to poor water quality (see Impact CHS1).

ENVIRONMENTAL RESOURCES MANAGEMENT PAA PROJECT FINANCE A/S
7-92
With respect to land-related tensions, it is noted that beneficiaries are not allowed to sell the irrigation equipment and are required to return the equipment to the SAG in the event of a land sale (Chapter 3). As such, the attractiveness of the land for potential buyers disappears in the absence of the irrigation equipment, which makes major land acquisitions by large land owners due to the Project very unlikely. Similarly, as part of the beneficiary selection criteria, the Project requires that selected beneficiaries have ownership of the land to be irrigated and that the plot in question is not located on indigenous land. Nevertheless, contested land claims may still exist in the Project Area, such as the one identified in the hamlet of Agalteca. As such, the possibility of other claims in the Project Area cannot be discarded, which may lead to tensions if not addressed adequately. Since most ancestral lands of the Tolupan community are located in the mountainous areas of Olanchito outside the Project Area, the impact magnitude is considered small however the sensitivity of indigenous communities is high. Overall, good relationships have been reported in the Project Area along with a strong social conscience among the communities, especially since Hurricane Mitch in 1998, which strengthened community cohesion and engagement in collaborative initiatives such as the creation of CRELs. Indigenous individuals residing in the area are also reportedly well integrated with cases of inter-marriage with non-indigenous communities. Considering the above, the overall impact magnitude is considered small to medium while receptor sensitivity is considered high for water users and for indigenous people with potential land claims. Mitigation measures
The Project design includes the following embedded measures:
The Project has planned monitoring of the irrigation equipment use and maintenance for a period of no less than 10 years, including the beneficiaries’ water consumption (water meters are included in the irrigation system).
The location of the water abstraction source will be selected making sure that it is situated away from other water sources (e.g. other existing groundwater wells) and away from potential contamination sources.
Land beneficiaries are not allowed to sell the irrigation equipment and are required to return the equipment to the SAG in the event of a land sale.
As part of the beneficiary selection criteria, the Project requires that selected beneficiaries have ownership of the land to be irrigated and that the plot in question is not located on indigenous land.
To mitigate potential impacts on community cohesion due to the potential decrease in water availability in the dry season, the mitigation measure presented in Impact W5 (Section 7.5) apply, in particular the following:

ENVIRONMENTAL RESOURCES MANAGEMENT PAA PROJECT FINANCE A/S
7-93
A Water Management Plan will be prepared and implemented by the SAG. Aspects to be covered by the plan include: an assessment of water use and monitoring data; coordination with other water users and management response as needed; participation of the local administration; and control of the groundwater wells installed.
The SAG will ensure beneficiaries follow irrigation plans and schedules when using the irrigation equipment.
The beneficiaries will share and discuss water consumption in the CRELs, in order to improve the management of irrigation water.
The SAG will ensure that the monitoring of the Aguan River flow upstream and downstream of the Project Area is undertaken by UMA. Two monitoring events will be conducted during the year: in the dry and rainy season.
The SAG will ensure that the monitoring of the groundwater levels in the wells installed for the Project activities, as well as in any other potential existing well wells located within an approximate ratio of 100 m from the installed groundwater wells, is undertaken by UMA.
The SAG will require that beneficiaries implement a logbook to record the water pumped (or hours of pumping).
Additional mitigation measures to mitigate potential impacts on community cohesion related to land ownership include:
During the beneficiary selection process, the SAG will investigate the existence of potential ancestral land claims and exclude beneficiaries whose land ownership is contested regardless of their ownership title.
As part of the Stakeholder Engagement Plan, the SAG will disclose and implement the grievance mechanism to the wider community, to ensure that all potential grievances or concerns are raised and addressed in order to address issues on time and reduce the risk of tensions.
Residual Impacts
Table 7.24 summarises the impacts on community cohesion as a result of the Project activities during the operation phase. The embedded measures considered in the Project Design and the mitigation measures defined during the impact assessment reduce the residual impact significance to Minor.

ENVIRONMENTAL RESOURCES MANAGEMENT PAA PROJECT FINANCE A/S
7-94
Table 7.24 Summary of impact assessment on community cohesion during the operation phase
Impact / Risk Measures to address the impact / risk Residual Impact CC1 – Increased tensions between communities, producers, and beneficiaries over land ownership and water availability in the dry season
Embedded measures: The Project has planned monitoring of the
irrigation equipment use and maintenance for a period of no less than 10 years, including the beneficiaries’ water consumption.
The location of the water abstraction source will be situated away from other water sources and away from potential contamination sources.
Land beneficiaries are not allowed to sell the irrigation equipment and are required to return the equipment to the SAG in the event of a land sale.
The Project requires that selected beneficiaries have ownership of the land to be irrigated and that the plot in question is not located on indigenous land.
Mitigation measures: A Water Management Plan will be prepared
and implemented by the SAG. The SAG will ensure beneficiaries follow
irrigation plans and schedules when using the irrigation equipment.
The beneficiaries will share and discuss water consumption in the CRELs, in order to improve the management of irrigation water.
The SAG will ensure that the monitoring of the Aguan River flow upstream and downstream of the Project Area is undertaken by UMA.
The SAG will ensure that the monitoring of the groundwater levels in the wells installed for the Project activities, as well as in any other potential existing well located within an approximate ratio of 100 m from the installed groundwater wells, is undertaken by UMA.
The SAG will require that beneficiaries implement a logbook to record the water pumped (or hours of pumping).
During the beneficiary selection process, the SAG will investigate the existence of potential ancestral land claims and exclude beneficiaries whose land ownership is contested regardless of their ownership title.
As part of the Stakeholder Engagement Plan, the SAG will disclose and implement the grievance mechanism to the wider community, to ensure that all potential grievances or concerns are raised and addressed in order to address issues on time and reduce the risk of tensions.
Minor Irrigation limited to
3.5 months a year (105 days).
Water abstraction by the Project activities will be sustainable and renewable, based on the Water Resource Balance.
It is unlikely that groundwater wells installed by the Project are located near other groundwater wells.
Drinking water outlets are located in upper areas of the tributaries.
Communities, especially children under 14 are highly sensitive to the availability and quality of water.
Land sales due to the Project are highly unlikely.
Most ancestral lands of the Tolupan group are located outside the Project Area but contested land claims may still exist.
Implementation of mitigation measures will reduce the impact to a significance of minor.

ENVIRONMENTAL RESOURCES MANAGEMENT PAA PROJECT FINANCE A/S
7-95
Source: ERM, 2018
7.13 ARCHAEOLOGICAL AND CULTURAL HERITAGE
7.13.1 Overview
This section presents an assessment of potential impacts, specific mitigation measures, and anticipated residual impacts associated with the archaeological and cultural heritage environment. Box 7.12 below shows the key sources of impacts, potential impacted receptors, as well as baseline and Project influencing factors related to Project impact on archaeological and cultural heritage.
Box 7.12 Key Considerations for Assessment – Archaeological and Cultural Heritage
Sources of Impact
Conditioning of beneficiary land in particular ground-disturbing activities (drilling of groundwater wells)
Potentially impacted receptors
Archaeological sites, Monuments, and Sites with cultural heritage value.
Project Factors that are Potentially Influencing Impacts
The National Forestry Institute has not reported the existence of any archaeological protected sites in the Project Area. No further cultural heritage assessment was undertaken.
Approximately 70% of potential beneficiaries require a groundwater source, ie. 210 potential beneficiaries. This implies that approximately 210 underground wells will be drilled and distributed over 3,110 ha of cultivated land.
Particular Baseline Conditions that are Potentially Influencing Impacts
The region of Eastern Honduras presents a high archaeological and cultural heritage potential and the Project Area can be regarded as having high archaeological potential.
Some of the earliest evidence of human occupation in Honduras comes from the Aguan Valley, such as the Cuyamel Caves, located outside the Project Area towards the eastern end of the Aguan Valley.
The Project Area contains a number of known archaeological sites, such as Puerto Escondido, located south of Olanchito town.
Many early sites may be located under or beside existing settlements, such as at Olanchito.
As farming, particularly of Maize, goes back to AD600, the agricultural fields in the Project Area would have seen human interventions since then.
References
Chapter 5 Baseline Description – specifically Section 5.5.14.
Source: ERM, 2018
Table 7.13 presents the key impacts of the Project on archaeological and cultural heritage during the three phases of pre-operation, operation, and abandonment.

ENVIRONMENTAL RESOURCES MANAGEMENT PAA PROJECT FINANCE A/S
7-96
Table 7.13 Key Potential Impacts – Archaeological and Cultural Heritage
Pre-operation phase Operation phase Abandonment phase None CH 1 – Potential damage to
archaeological or cultural heritage elements in the Project Area
None
Source: ERM, 2018
7.13.2 Operation Phase
Potential impacts
CH 1 – Potential damage to archaeological or cultural heritage elements in the Project Area
Direct physical disturbance of; or damage to, cultural heritage sites will result in the loss of scientific, historic, or cultural value. Ground-disturbing activities, such as the planned groundwater drilling activities, are key sources of impacts, as these activities have the potential to destroy archaeological resources. Considering that approximately 70% of beneficiaries will require a groundwater source and that the depth of each well will vary between 6 and 80 m deep (depending on geology of the site), that the Project Area contains a number of known archaeological sites and that it can be regarded as having a high archaeological potential, direct physical disturbance on unknown archaeological or cultural heritage sites during the groundwater well drilling activities is likely to exist. The sensitivity of the impact depends of the value of the cultural heritage resource. Considering that some of the earliest evidence of human occupation in Honduras comes from the Aguan Valley, although outside of the Project Area, it is considered that the sensitivity of the cultural heritage resource is high. Mitigation Measures
In order to mitigate direct physical disturbance to archaeological or cultural heritage sites, the following measures will apply:
The SAG through relevant technical departments or partner organizations will prepare and develop a Cultural Heritage Management and Monitoring Plan.
The SAG through relevant technical departments or partner organizations will map locations of known archaeological sites within the Project Area.
The SAG through relevant technical departments or partner organizations will undertake a site survey of the beneficiary land plot and selected groundwater well locations.
The SAG through relevant technical departments or partner organizations will ensure that groundwater well locations are avoided

ENVIRONMENTAL RESOURCES MANAGEMENT PAA PROJECT FINANCE A/S
7-97
if there are indications that archaeological material will be encountered;
The SAG through relevant technical departments or partner organizations will undertake archaeological monitoring during the drilling of the wells in locations where archaeology may be encountered. A Chance Find Procedure will be implemented during these monitoring activities.
Residual Impacts
Table 7.19 summarises the impacts on archaeological or cultural heritage elements as a result of the Project activities during the operation phase. The mitigation measures defined during the impact assessment reduce the residual impact significance to Minor
Table 7.25 Summary of impact assessment of archaeological or cultural heritage elements in the Project Area during the operation phase
Impact / Risk Measures to address the impact / risk Residual Impact CH1- Potential damage to archaeological or cultural heritage elements in the Project Area
Mitigation measures The SAG will prepare and develop a
Cultural Heritage Management and Monitoring Plan.
The SAG will map locations of known archaeological sites within the Project Area.
The SAG will undertake a site survey of the beneficiary land plot and selected groundwater well locations.
The SAG will ensure that groundwater well locations are avoided if there are indications that archaeological material will be encountered;
The SAG will undertake archaeological monitoring during the drilling of the wells in locations where archaeology may be encountered. A Chance Find Procedure will be implemented during these monitoring activities.
Minor High sensitivity of
cultural heritage resources.
Potentially unknown archaeological or cultural heritage sites located in the Project Area
Limited duration of drilling activities (non-continuous and spread out over 2 years).
Source: ERM, 2018
7.14 NON-ROUTINE EVENTS
7.14.1 Overview
This section assesses the potential impacts derived from non-routine events as a result of the Project activities, these refer to accidental spills of fuel (diesel) and / or wastes (such as lubricants or bentonite-based muds). Box 7.13 presents the key sources of impacts, potentially impacted receptors, baseline and project influencing factors.
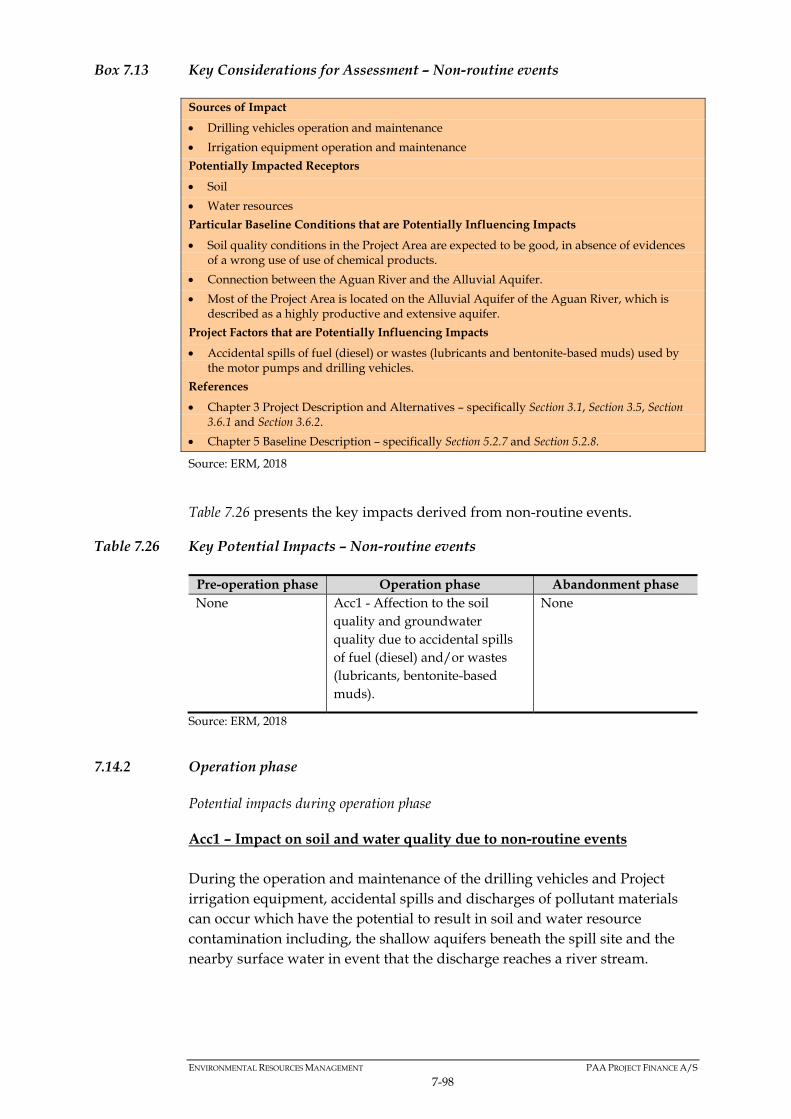
ENVIRONMENTAL RESOURCES MANAGEMENT PAA PROJECT FINANCE A/S
7-98
Box 7.13 Key Considerations for Assessment – Non-routine events
Sources of Impact
Drilling vehicles operation and maintenance
Irrigation equipment operation and maintenance
Potentially Impacted Receptors
Soil
Water resources
Particular Baseline Conditions that are Potentially Influencing Impacts
Soil quality conditions in the Project Area are expected to be good, in absence of evidences of a wrong use of use of chemical products.
Connection between the Aguan River and the Alluvial Aquifer.
Most of the Project Area is located on the Alluvial Aquifer of the Aguan River, which is described as a highly productive and extensive aquifer.
Project Factors that are Potentially Influencing Impacts
Accidental spills of fuel (diesel) or wastes (lubricants and bentonite-based muds) used by the motor pumps and drilling vehicles.
References
Chapter 3 Project Description and Alternatives – specifically Section 3.1, Section 3.5, Section 3.6.1 and Section 3.6.2.
Chapter 5 Baseline Description – specifically Section 5.2.7 and Section 5.2.8.
Source: ERM, 2018
Table 7.26 presents the key impacts derived from non-routine events.
Table 7.26 Key Potential Impacts – Non-routine events
Pre-operation phase Operation phase Abandonment phase None Acc1 - Affection to the soil
quality and groundwater quality due to accidental spills of fuel (diesel) and/or wastes (lubricants, bentonite-based muds).
None
Source: ERM, 2018
7.14.2 Operation phase
Potential impacts during operation phase
Acc1 – Impact on soil and water quality due to non-routine events During the operation and maintenance of the drilling vehicles and Project irrigation equipment, accidental spills and discharges of pollutant materials can occur which have the potential to result in soil and water resource contamination including, the shallow aquifers beneath the spill site and the nearby surface water in event that the discharge reaches a river stream.

ENVIRONMENTAL RESOURCES MANAGEMENT PAA PROJECT FINANCE A/S
7-99
Pollutant materials derived from the operation of the drilling vehicles and of the Project irrigation equipment include fuel (diesel) and/or wastes (used lubricants or bentonite-based muds for drilling activities). Non-routine impacts from accidental spills/leaks may occur during the operation phase, at the beneficiaries’ plot:
During the drilling of the groundwater wells, that will be undertaken only at the beginning of the operation phase for a limited period of time and only on the plots that require a groundwater source;
During the operation of the Project irrigation equipment, during the 3,5 months per year it will be used; or/and
Due to an inappropriate handling, storage or management of pollutant materials.
It should be taken into account that:
The Project will include a Training Programme, meant to be provided to the beneficiaries receiving the irrigation system. This Training Programme will include a topic of adequate use and maintenance of the irrigation equipment and management of pollutant materials.
The drilling of the groundwater wells at the beneficiary’s plot that require it will be undertaken by specialised local or regional drilling companies which will be screened by the SAG-PIU.
Wastes generated by the project are limited to lubricants used in the maintenance of the irrigation equipment. As described in Section 3.6.2, the beneficiary will be responsible for the management of the used lubricants. In addition to this, it should be noted that use of lubricants will not be a new activity, since they are used frequently in the farms (e.g. maintenance activities for farm machinery or vehicles).
As described in Section 3.6.2, specific groundwater construction wells drilling fluids will be used, bentonite-based preferably for the drilling of groundwater wells for the beneficiaries that require one. Any chemical additive used will be biodegradable.
The accidental event can be therefore characterised as follows:
Probability: These events, even if unplanned and unwanted, can occasionally happen. The probability of a single event at a single location can be considered medium to high, however, the probability of more than one event and of happening simultaneously is considered low. The combined probability is thus medium.
Consequence: The consequence is dependent on the nature of the product accidentally spilled and the quantity. The soil of the Project Area is considered of good quality and the groundwater table ranges from less than 10 m and up to more than 40 m. Considering that the operation will be conducted in a small plot, that the potential quantity of pollutant material with a risk of being spilled (fuel, lubricants or bentonite-based muds) used by each beneficiary individually for the

ENVIRONMENTAL RESOURCES MANAGEMENT PAA PROJECT FINANCE A/S
7-100
operation of the Project irrigation equipment or by the drilling vehicles will be small, and it is not expected that such a small shallow spill can reach the groundwater table or a near-by river stream, the consequence is be considered low.
Taking into account the medium probability and the low consequence, the overall risks from spills and/or leaks are considered low. Mitigation measures
The Project design includes the following embedded measures:
Training Programme including a topic of adequate use and maintenance of the irrigation equipment. This will contribute to avoid the risk of an inadequate management of wastes resulting from the maintenance of the irrigation equipment (used lubricants for the start-up of the equipment and used spill absorbent materials) subsequently the risk of affecting soil and groundwater quality and indirectly fauna and flora species and protected areas.
The drilling of the groundwater wells at the beneficiary’s plot that require it will be undertaken by specialised local drilling companies which will be screened by the SAG-PIU.
This will contribute to avoid the risk of an inadequate management of wastes (used drilling fluids).
The provision of the irrigation equipment will include the requirement to the beneficiary of the irrigation equipment of allowing the monitoring of the irrigation equipment for a period of no less than 10 years. This embedded measure will enable to monitor some of the mitigation measures described below.
The provision of the irrigation equipment will include the requirement to the beneficiary of acquiring a series of responsibilities linked to the irrigation system such as carrying out the maintenance of equipment and its components, accessories, as recommended by the manufacturer or supplier. These will include the compliance with the mitigation measures described below.
The following mitigation measures will be implemented in order to minimize the affection to soil and groundwater quality due to accidental spills of pollutants (fuel (diesel) or wastes (lubricants)):
Motor pumpswill to be installed on impermeable surfaces, so that if a spill of fuel (diesel) or wastes (lubricants) occurs, it does not lay on the ground directly.
Absorbing materials will be available in the proximity of the motor pumps/generators, so that if a spill of fuel (diesel) or wastes (lubricants) occurs, it can be cleaned promptly.
Fuel (diesel) and lubricants will be stored in certified and specific storages for such products.

ENVIRONMENTAL RESOURCES MANAGEMENT PAA PROJECT FINANCE A/S
7-101
In addition, the following recommendation measure is provided, considered as good management practices:
Implementation of logbook with records of fuel (diesel) used, spills occurred (if any)
Residual impacts
Table 7.27 summarises the impacts derived from non-routine events. The embedded measures considered in the Project Design and the mitigation measures defined during the impact assessment results in a Residual Impact assessed as very low.
Table 7.27 Summary of non-routine events
Impact / Risk Measures to address the impact / risk Residual Impact Operation and maintenance of drilling vehicles and Project irrigation equipment: Affection to
the soil quality and water resource quality due to accidental spills of fuel (diesel) and/or wastes (lubricants, bentonite-based muds).
Embedded measures: Implementation of the Project’s
Training Programme Drilling of the groundwater wells
at the beneficiary’s plot that required it will be undertaken The drilling of the groundwater wells at the beneficiary’s plot that require it will be undertaken by specialised local or regional drilling companies which will be screened by the SAG-PIU.
. This will contribute to avoid the risk of an inadequate management of wastes.
Monitoring of the irrigation equipment for a period of no less than 10 years.
Beneficiary responsibilities acquired linked to the irrigation system such as the maintenance of the equipment.
Mitigation measures: Motor pumps will be installed on
impermeable surfaces. Absorbing materials will be
available in the proximity of the motor pumps.
Fuel (diesel) will be stored in certified and specific storages for such products.
Implementation of logbook recording for fuel used, spills occurred recommended as good practice.
Low Residual risks of
accidental events are impossible to eliminate. The embedded measures of the Project Design and the implementation of the mitigation measures will however keep this risk as low as reasonably practicable (ALARP).
Source: ERM, 2018

ENVIRONMENTAL RESOURCES MANAGEMENT PAA PROJECT FINANCE A/S
7-102
7.15 CUMULATIVE IMPACTS
7.15.1 Overview
Cumulative impacts may be broadly defined as impacts that result from the accumulation of a number of individual impacts (European Commission DG XI (1999) Guidelines for the Assessment of Indirect and Cumulative Impacts as well as Impact Interactions, OOPEC, May 1999, p iii and Section 2.1). They may result from various types of interaction, including:
Impacts that arise from the accumulation of different impacts at a specific location (e.g. impacts of irrigation activities affecting the same receptor such as soils – individually these may not be significant, but the accumulation of different impacts may give rise to an overall significant impact) – these impacts were identified in the relevant thematic topic assessment earlier in this Chapter (e.g. Soil in Section 7.4).; and
The accumulation of impacts of the same type at different locations (e.g. non-significant individual groundwater level impacts at different sites collectively may give rise to an overall significant impact in the overall Project Area) – these impacts have been identified in the relevant thematic topic assessment earlier in this Chapter (e.g. Groundwater in Section 7.5).
Impacts which are the result of the combination of activities associated with the Alto Aguan Project (i.e. irrigation activities and water use) together with other similar ongoing or foreseen activities expected to take place in the near-by area. These potential impacts are assessed in this section
The mentioned other similar ongoing or foreseen activities expected to take place in the near-by area have been identified and summarised in the following Table 7.28.

ENVIRONMENTAL RESOURCES MANAGEMENT PAA PROJECT FINANCE A/S
7-103
Table 7.28 Potential cumulative impacts from the interaction between the Alto Aguan Project and other projects
Project Description of the ongoing or planned projects and potential interaction with the Alto Aguan Project
Aguan Energy Complex
The Aguan Energy Complex1 consists of the development of the first Energy Complex of Honduras comprised of hydroelectric, biomass and photovoltaic plants, managed by the ENEE (Empresa Nacional de Energía Eléctrica). The Complex is planned to be consolidated in the Aguan Basin and it will occupy an area of 11.005 km2. It is planned to generate 220 MW.
The hydroelectric component will use three different water sources following three consecutive steps: the basin of the Aguan river (planned to generate 64 MW), the basin of the river Mame (tributary of the Aguan river planned to generate 36.46 MW) and the basin of the Yaguala river (tributary of the Aguan river planned to the generate 71.39 MW).
The disruption to water flows is possible on the Aguan river, the river Mame and the river Yaguala as a result of the construction and operation of the planned hydroelectric dams. These effects on the river flow could be perceived by the irrigation activities of the Alto Aguan Irrigation Project.
Providing there is a limited amount of information available on the Aguan Energy Complex, specifically on the planned project design of its hydroelectric component, the potential interaction and subsequent cumulative environmental impacts of the hydroelectric’ s construction and operation cannot be assessed.
The Stakeholder Engagement Plan (SEP) (see Chapter 4 and Annex 1) developed for the Alto Aguan Irrigation Project will be implemented throughout the Project’s phases. One aspect raised in the SEP by the SAG is that future projects such as the Aguan Energy Complex will be undertaken in cooperation with the Alto Aguan Irrigation Project to guarantee the sustainable use of resources, in particular water resources.
1 http://enee.hn/pdfs/Aguan.pdf
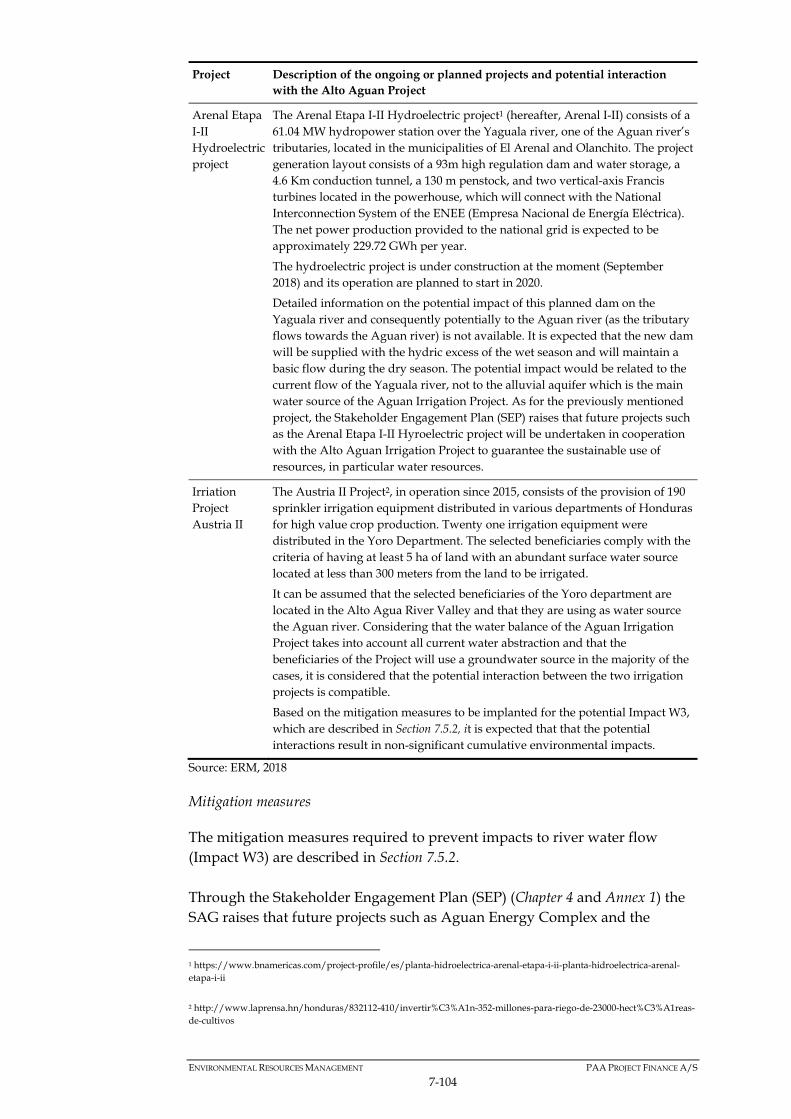
ENVIRONMENTAL RESOURCES MANAGEMENT PAA PROJECT FINANCE A/S
7-104
Project Description of the ongoing or planned projects and potential interaction with the Alto Aguan Project
Arenal Etapa I-II Hydroelectric project
The Arenal Etapa I-II Hydroelectric project1 (hereafter, Arenal I-II) consists of a 61.04 MW hydropower station over the Yaguala river, one of the Aguan river’s tributaries, located in the municipalities of El Arenal and Olanchito. The project generation layout consists of a 93m high regulation dam and water storage, a 4.6 Km conduction tunnel, a 130 m penstock, and two vertical-axis Francis turbines located in the powerhouse, which will connect with the National Interconnection System of the ENEE (Empresa Nacional de Energía Eléctrica). The net power production provided to the national grid is expected to be approximately 229.72 GWh per year.
The hydroelectric project is under construction at the moment (September 2018) and its operation are planned to start in 2020.
Detailed information on the potential impact of this planned dam on the Yaguala river and consequently potentially to the Aguan river (as the tributary flows towards the Aguan river) is not available. It is expected that the new dam will be supplied with the hydric excess of the wet season and will maintain a basic flow during the dry season. The potential impact would be related to the current flow of the Yaguala river, not to the alluvial aquifer which is the main water source of the Aguan Irrigation Project. As for the previously mentioned project, the Stakeholder Engagement Plan (SEP) raises that future projects such as the Arenal Etapa I-II Hyroelectric project will be undertaken in cooperation with the Alto Aguan Irrigation Project to guarantee the sustainable use of resources, in particular water resources.
Irriation Project Austria II
The Austria II Project2, in operation since 2015, consists of the provision of 190 sprinkler irrigation equipment distributed in various departments of Honduras for high value crop production. Twenty one irrigation equipment were distributed in the Yoro Department. The selected beneficiaries comply with the criteria of having at least 5 ha of land with an abundant surface water source located at less than 300 meters from the land to be irrigated.
It can be assumed that the selected beneficiaries of the Yoro department are located in the Alto Agua River Valley and that they are using as water source the Aguan river. Considering that the water balance of the Aguan Irrigation Project takes into account all current water abstraction and that the beneficiaries of the Project will use a groundwater source in the majority of the cases, it is considered that the potential interaction between the two irrigation projects is compatible.
Based on the mitigation measures to be implanted for the potential Impact W3, which are described in Section 7.5.2, it is expected that that the potential interactions result in non-significant cumulative environmental impacts.
Source: ERM, 2018
Mitigation measures
The mitigation measures required to prevent impacts to river water flow (Impact W3) are described in Section 7.5.2. Through the Stakeholder Engagement Plan (SEP) (Chapter 4 and Annex 1) the SAG raises that future projects such as Aguan Energy Complex and the
1 https://www.bnamericas.com/project-profile/es/planta-hidroelectrica-arenal-etapa-i-ii-planta-hidroelectrica-arenal-etapa-i-ii
2 http://www.laprensa.hn/honduras/832112-410/invertir%C3%A1n-352-millones-para-riego-de-23000-hect%C3%A1reas-de-cultivos

ENVIRONMENTAL RESOURCES MANAGEMENT PAA PROJECT FINANCE A/S
7-105
Arenal Etapa I-II Hydroelectric project or current projects such as the Austria II project will be undertaken in cooperation with the Alto Aguan Irrigation Project to guarantee the sustainable use of resources and to ensure that the potential interactions related to the water resources do not result in significant environmental impacts. Residual impacts
River flow related impacts would be associated with the construction and operation of other planned or foreseen projects such as the Austria II project, Aguan Energy Complex and the Arenal Etapa I-II Hydroelectric project. All three projects pose the use of surface water in two tributaries of the river Aguan as well as in the river Aguan and do not include direct actions on the underground water from the alluvial aquifer of the river Aguan. In addition; the application of the planned stakeholder engagement activities will allow the cooperation of these projects with the Aguan Irrigation Project in order to make sure that potential interactions between the projects do not result in significant environmental impacts. On the basis that the mitigation measures are implemented, the overall magnitude of the residual cumulative impact would be expected to be not significant.
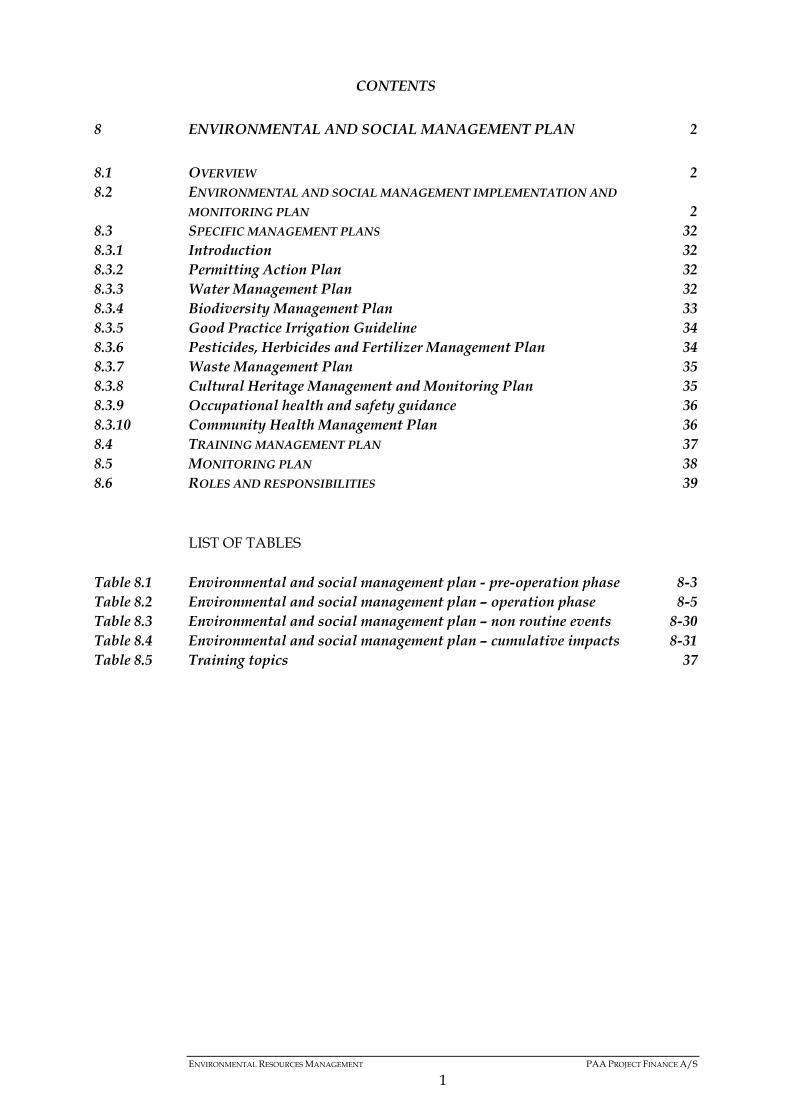
ENVIRONMENTAL RESOURCES MANAGEMENT PAA PROJECT FINANCE A/S
1
CONTENTS
8 ENVIRONMENTAL AND SOCIAL MANAGEMENT PLAN 2
8.1 OVERVIEW 28.2 ENVIRONMENTAL AND SOCIAL MANAGEMENT IMPLEMENTATION AND
MONITORING PLAN 28.3 SPECIFIC MANAGEMENT PLANS 328.3.1 Introduction 328.3.2 Permitting Action Plan 328.3.3 Water Management Plan 328.3.4 Biodiversity Management Plan 338.3.5 Good Practice Irrigation Guideline 348.3.6 Pesticides, Herbicides and Fertilizer Management Plan 348.3.7 Waste Management Plan 358.3.8 Cultural Heritage Management and Monitoring Plan 358.3.9 Occupational health and safety guidance 368.3.10 Community Health Management Plan 368.4 TRAINING MANAGEMENT PLAN 378.5 MONITORING PLAN 388.6 ROLES AND RESPONSIBILITIES 39
LIST OF TABLES
Table 8.1 Environmental and social management plan - pre-operation phase 8-3Table 8.2 Environmental and social management plan – operation phase 8-5Table 8.3 Environmental and social management plan – non routine events 8-30Table 8.4 Environmental and social management plan – cumulative impacts 8-31Table 8.5 Training topics 37

ENVIRONMENTAL RESOURCES MANAGEMENT PAA PROJECT FINANCE A/S
2
8 ENVIRONMENTAL AND SOCIAL MANAGEMENT PLAN
8.1 OVERVIEW
This section sets out the approach to the management and monitoring of environmental and socioeconomic issues related to the pre-operation, operation and abandonment phases of the Alto Aguan Irrigation Project. The main objective of the Environmental and Social Management Plan (ESMP) is to provide a framework for the implementation of the measures identified in the impact assessment (Chapter 7) to avoid, mitigate or offset adverse impacts and to minimise and manage risks on the physical, biological and social environments from Project activities. The broad purpose of the ESMP is to:
Ensure that good industry practice with regards to environmental and socioeconomic management is adopted during all phases of the Project (pre-operation, operation and abandonment);
Define strategies and methods and control approaches to ensure implementation of measures to effectively mitigate potentially adverse environmental or socioeconomic impacts;
Provide a framework for compliance monitoring (auditing and inspection) by which the identified responsible parties will assure that the environmental and socioeconomic performance commitments of the Project are being met.
Following the objective of the ESMP, the chapter is structured as follows:
Section ¡Error! No se encuentra el origen de la referencia.: list of the potential environmental and social impacts and identified mitigation measures per Project phase;
Section 8.3: definition and commitments of the proposed specific environmental and social management plans;
Section 8.3.12: definition of the proposed monitoring plan including the roles and responsibilities of the involved stakeholders to ensure a fully effective implementation of the ESMP.
8.2 ENVIRONMENTAL AND SOCIAL MANAGEMENT IMPLEMENTATION AND
MONITORING PLAN
Table 8.1, Table 8.2, Table 8.3 and Table 8.4 present the Environmental and Social Management Plan for the Project summarizing the mitigation measures identified in Chapter 7 along with implementation timelines and milestones, responsible party, monitoring and reporting requirements.

ENVIRONMENTAL RESOURCES MANAGEMENT PAA PROJECT FINANCE A/S
8-3
Table 8.1 Environmental and social management plan - pre-operation phase
Receptor Impact/Risk Mitigation Measures Implementation Timeline / Milestone
Responsible party
Economy and employment
EE1 – Long-term benefits of capacity enhancement for SAG technicians and Project beneficiaries
Note: this impact also extends to the operation phase.
Embedded measures Implementation of the Project’s Training
Programme including training of SAG technicians and designated personnel on the correct installation and use of the irrigation equipment. The technical training also includes capacity building on agricultural consulting.
Provide training to the beneficiaries on the installation, use, and maintenance of equipment as well as on agricultural and irrigation good practice and environmental and social measures.
Enhancement measures Development in partnership with local
organisations a training programme to provide ongoing technical support and agricultural/irrigation advice to Project beneficiaries during the operation phase.
As part of the training program, development and implementation of ad-hoc additional training on relevant aspects as required.
During pre-operation phase
PAA Project Finance (training of SAG technicians)
The SAG

ENVIRONMENTAL RESOURCES MANAGEMENT PAA PROJECT FINANCE A/S
8-4
Receptor Impact/Risk Mitigation Measures Implementation Timeline / Milestone
Responsible party
Occupational health and safety and labour rights
OHS1 – Health and safety and labour rights related to road transport of irrigation kits to the SAGO warehouse
Embedded measures Employment of labour within the framework of
the Honduran Labour Code, and the laws and statutes in force including provisions for overtime pay, minimum working age, and the rights of children and adolescents.
Mitigation measures Development and implementation of a Traffic
Management Plan indicating the route to follow especially during the rainy season. Measures will include stopping the car in case of heavy rains, not crossing rivers and creeks during floods, hours of driving and rest periods, etc.
Provide training on traffic safety to selected drivers through relevant technical departments or partner organizations.
As part of hiring process, request medical approval for loading and offloading heavy packages and provide adequate training to selected drivers on safe loading and offloading techniques.
As part of the Stakeholder Engagement Plan, disclose and implement a grievance mechanism for all Project stakeholder including workers.
During pre-operation phase
The SAG

ENVIRONMENTAL RESOURCES MANAGEMENT PAA PROJECT FINANCE A/S
8-5
Table 8.2 Environmental and social management plan – operation phase
Receptor Impact/Risk Mitigation Measures Implementation Timeline / Milestone
Responsible party
Air Quality and Climate change
CA1 – Emissions of air pollutants and GHGs potentially affecting air quality and climate change
Embedded measures: Implementation of the Project’s Training
Programme including technical training on the adequate use and maintenance of the irrigation equipment, which will contribute to minimizing the use of the motor pumps/generators as much as feasible and, consequently, their emissions of air pollutants and GHGs
Beneficiary responsibilities acquired linked to the irrigation system such as the maintenance of the equipment, which will contribute to minimizing air pollutant and GHG emissions.
Implementation of logbook with records of fuel used recommended as good practice.
During pre-operation phase (training).
During operation phase (maintenance of the equipment and implementation of logbook)
The SAG
Beneficiaries (maintenance of the equipment)
Acoustic Environment
N1 – Potential disturbance to workers and/or fauna
Embedded measures: Implementation of the Project’s Training
Programme including a topic on the adequate use and maintenance of the irrigation equipment, which will contribute to minimizing the use of the motor pumps/generators as much as feasible, and consequently, their emissions of noise.
Beneficiary responsibilities acquired linked to the irrigation system, such as the maintenance of the equipment, which will contribute to minimizing noise emissions.
During pre-operation phase (training).
During operation phase (maintenance of the equipment).
The SAG
Beneficiaries (maintenance of the equipment)
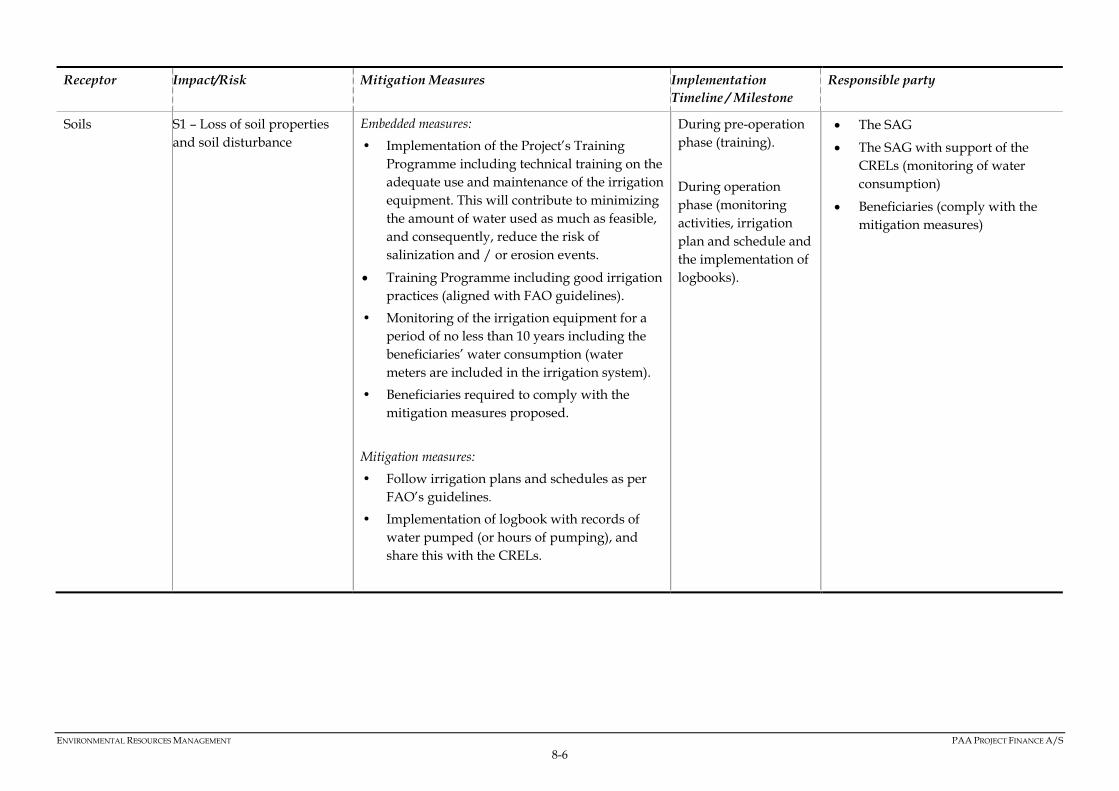
ENVIRONMENTAL RESOURCES MANAGEMENT PAA PROJECT FINANCE A/S
8-6
Receptor Impact/Risk Mitigation Measures Implementation Timeline / Milestone
Responsible party
Soils S1 – Loss of soil properties and soil disturbance
Embedded measures:
• Implementation of the Project’s Training Programme including technical training on the adequate use and maintenance of the irrigation equipment. This will contribute to minimizing the amount of water used as much as feasible, and consequently, reduce the risk of salinization and / or erosion events.
Training Programme including good irrigation practices (aligned with FAO guidelines).
• Monitoring of the irrigation equipment for a period of no less than 10 years including the beneficiaries’ water consumption (water meters are included in the irrigation system).
• Beneficiaries required to comply with the mitigation measures proposed.
Mitigation measures:
• Follow irrigation plans and schedules as per FAO’s guidelines.
• Implementation of logbook with records of water pumped (or hours of pumping), and share this with the CRELs.
During pre-operation phase (training).
During operation phase (monitoring activities, irrigation plan and schedule and the implementation of logbooks).
The SAG
The SAG with support of the CRELs (monitoring of water consumption)
Beneficiaries (comply with the mitigation measures)

ENVIRONMENTAL RESOURCES MANAGEMENT PAA PROJECT FINANCE A/S
8-7
Water Resources W1 - Loss of surface and groundwater quality.
Embedded measures: Implementation of the Project’s Training
Programme including a topic on the adequate use of the irrigation equipment. This will contribute to minimizing the amount of water used as much as feasible and, consequently, reduce the risk of affecting the river water flow.
Training Programme including good irrigation practices (aligned with FAO guidelines).
Implementation of the Project’s Training Programme including a topic on the adequate use of chemical products (pesticides, herbicides, and fertilizers) focused on minimizing their use as much as possible and selecting low toxicity pesticides and herbicides. This will contribute to reducing the risk of affecting the water quality and the risk of eutrophication.
Monitoring of the irrigation equipment for a period of no less than 10 years including the beneficiaries’ water consumption (water meters are included in the irrigation system).
The location of the water abstraction source will be selected making sure that it is situated away from other water sources (e.g. other existing groundwater wells) and away from potential contamination sources.
Beneficiaries required to comply with mitigation measures proposed.
Mitigation measures:
During pre-operation phase (training and development of management plans).
During operation phase (construction of water abstraction source, monitoring activities and implementation of logbook).
The SAG
The SAG with the support of SENASA (monitoring of pesticides, herbicides, fertilizers used/sold)
The SAG with support of the CRELs (monitoring of water consumption)
The SAG with the support of UMA (monitoring of Aguan River and tributaries upstream and downstream)
The SAG with the support of UMA (monitoring of groundwater levels in wells)
Beneficiaries (comply with the mitigation measures)

ENVIRONMENTAL RESOURCES MANAGEMENT PAA PROJECT FINANCE A/S
8-8
Receptor Impact/Risk Mitigation Measures Implementation Timeline / Milestone
Responsible party
Development and implementation of a Pesticides and Herbicides Management Plan.
Monitoring of pesticides and herbicides used.
Monitoring of pesticides and herbicides sold in Olanchito.
Monitor that only products recommended by SENASA are used.
Monitoring of the nitrate and nitrite levels in the groundwater wells installed as a result of the Project activities.
Implementation of logbook with records of pesticides and herbicides used recommended as good practice.
W2 – Eutrophication of surface water.
Embedded measures: Same embedded measures as W1. Mitigation measures: Development and implementation of a
Fertilizer Management Plan. Monitoring of fertilizers used. Monitoring of fertilizers sold in Olanchito. Monitoring of the nitrate and nitrite levels in
the groundwater wells installed as a result of the Project activities.
Implementation of logbook with records of fertilizers used recommended as good practice.

ENVIRONMENTAL RESOURCES MANAGEMENT PAA PROJECT FINANCE A/S
8-9
Receptor Impact/Risk Mitigation Measures Implementation Timeline / Milestone
Responsible party
W3 – Effects on river flow.
Embedded measures: Same embedded measures as W1. Mitigation measures:
Follow irrigation plans and schedules as per FAO’s guidelines.
Development and implementation of a Water Management Plan. Aspects to be covered by the plan include: an assessment of water use and monitoring data; coordination with other water users and management response as needed; participation of the local administration; and control of the groundwater wells installed.
Water flow monitoring in Aguan River and main tributaries (upstream and downstream). Two monitoring events will be conducted during the year: in the dry and rainy season. This monitoring will be extended to the main tributaries of the Aguan River within the Project Area, limited to one location only, in the proximity of their union with the Aguan River.
Implementation of logbook with records of water pumped recommended as good practice.
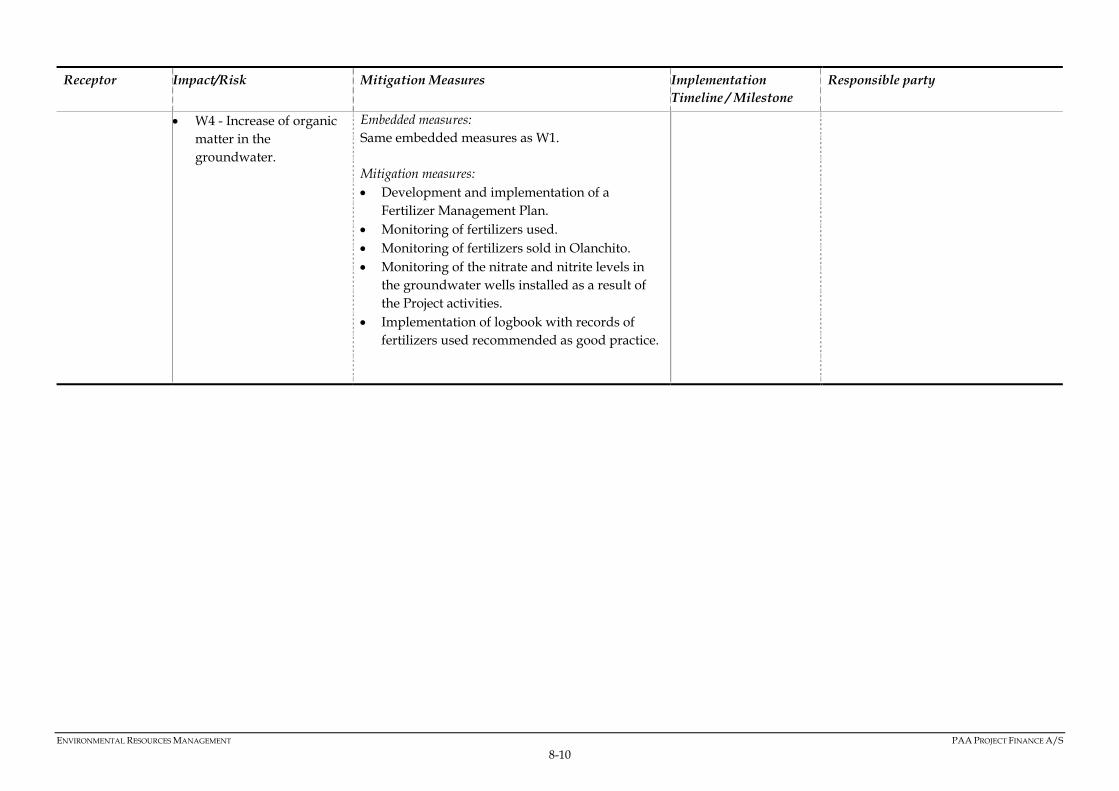
ENVIRONMENTAL RESOURCES MANAGEMENT PAA PROJECT FINANCE A/S
8-10
Receptor Impact/Risk Mitigation Measures Implementation Timeline / Milestone
Responsible party
W4 - Increase of organic matter in the groundwater.
Embedded measures: Same embedded measures as W1. Mitigation measures: Development and implementation of a
Fertilizer Management Plan. Monitoring of fertilizers used. Monitoring of fertilizers sold in Olanchito. Monitoring of the nitrate and nitrite levels in
the groundwater wells installed as a result of the Project activities.
Implementation of logbook with records of fertilizers used recommended as good practice.

ENVIRONMENTAL RESOURCES MANAGEMENT PAA PROJECT FINANCE A/S
8-11
Receptor Impact/Risk Mitigation Measures Implementation Timeline / Milestone
Responsible party
W5 – Effect on groundwater level.
Embedded measures: Same embedded measures as W1. Mitigation measures:
Follow irrigation plans and schedules as per FAO’s guidelines.
Development and implementation of a Water Management Plan. Aspects to be covered by the plan include: an assessment of water use and monitoring data; coordination with other water users and management response as needed; participation of the local administration; and control of the groundwater wells installed.
Groundwater level monitoring in the wells installed for the Project activities, as well as in any other potential existing well located within an approximate ratio of 100 m from the installed groundwater wells.
Implementation of logbook with records of water pumped recommended
Biodiversity B1– Disturbance to fauna.
Embedded measures: Development and implementation of a
Biodiversity Management Plan. Case-by-case selection of potential
beneficiaries whose plot is partially within or adjacent to protected areas and/or natural habitats, such as shrubland and
The SAG
The SAG – PIU (selection of beneficiaries)
The SAG with support of ASIDE and ICF (case-by-case selection of potential beneficiaries whose plot

ENVIRONMENTAL RESOURCES MANAGEMENT PAA PROJECT FINANCE A/S
8-12
Receptor Impact/Risk Mitigation Measures Implementation Timeline / Milestone
Responsible party
B2 – Disturbance to flora.
forest, with the contractual condition that these protected areas are not within the irrigated plot, and the natural habitats are maintained as they are, including prevention of irrigation or its run-off entering the natural habitat, if these beneficiaries are ultimately provided with
is partially within or adjacent to protected areas and/or natural habitats)
Monitor of irrigation/run-off into natural habitats by SAG with

ENVIRONMENTAL RESOURCES MANAGEMENT PAA PROJECT FINANCE A/S
8-13
Receptor Impact/Risk Mitigation Measures Implementation Timeline / Milestone
Responsible party
B3 – Loss of natural habitats and subsequent loss of flora and fauna.
Project irrigation equipment. The selection will include a site visit to the beneficiary plots to confirm that no sensitive resources will be affected.
Monitor beneficiaries to prevent irrigation and/or run-off outside plot borders into natural habitats
Embedded mitigation measures as described in: o Impact CA1, o Impact N1, o Impact S1, o Impact W1, o Impact W2, o Impact W4.
Embedded mitigation measures as described in: non-routine events (Acc1) (See Table 8.3)
Mitigation measures:
• Mitigation measures as described in:
o Impact CA1, o Impact N1, o Impact S1, o Impact W1, o Impact W2, o Impact W4.
During pre-operation phase (development of management plans, selection of beneficiaries)
See implementation timing of Impact CA1, Impact N1, Impact S1, Impact W1, Impact W2, Impact W4
potential support from ASIDE and ICF
See responsible parties of Impact CA1, Impact N1, Impact S1, Impact W1, Impact W2, Impact W4

ENVIRONMENTAL RESOURCES MANAGEMENT PAA PROJECT FINANCE A/S
8-14
Receptor Impact/Risk Mitigation Measures Implementation Timeline / Milestone
Responsible party
Protected Areas/Critical Habitats
PA1 – Effect on habitats, flora, and fauna in the Protected Area/Critical Habitats/during operation
Embedded measures: Same embedded measures as B1, B2 and B3. Mitigation measures: Same mitigation measures as B1, B2 and B3. In addition to this: • The Pesticides and Herbicides Management
Plan will have specific considerations regarding the use of pesticides and herbicides in the proximity of the protected area.
• The Fertilizers Management Plan will have specific considerations regarding the use of fertilizers in the proximity of the protected area.
During pre-operation phase (development of management plans, selection of beneficiaries)
See implementation timing of Impact CA1, Impact N1, Impact S1, Impact W1, Impact W2, Impact W4
The SAG
The SAG – PIU (selection of beneficiaries)
The SAG with support of ASIDE and ICF (case-by-case selection of potential beneficiaries whose plot is partially within or adjacent to protected areas and/or natural habitats)
See responsible parties of Impact CA1, Impact N1, Impact S1, Impact W1, Impact W2, Impact W4
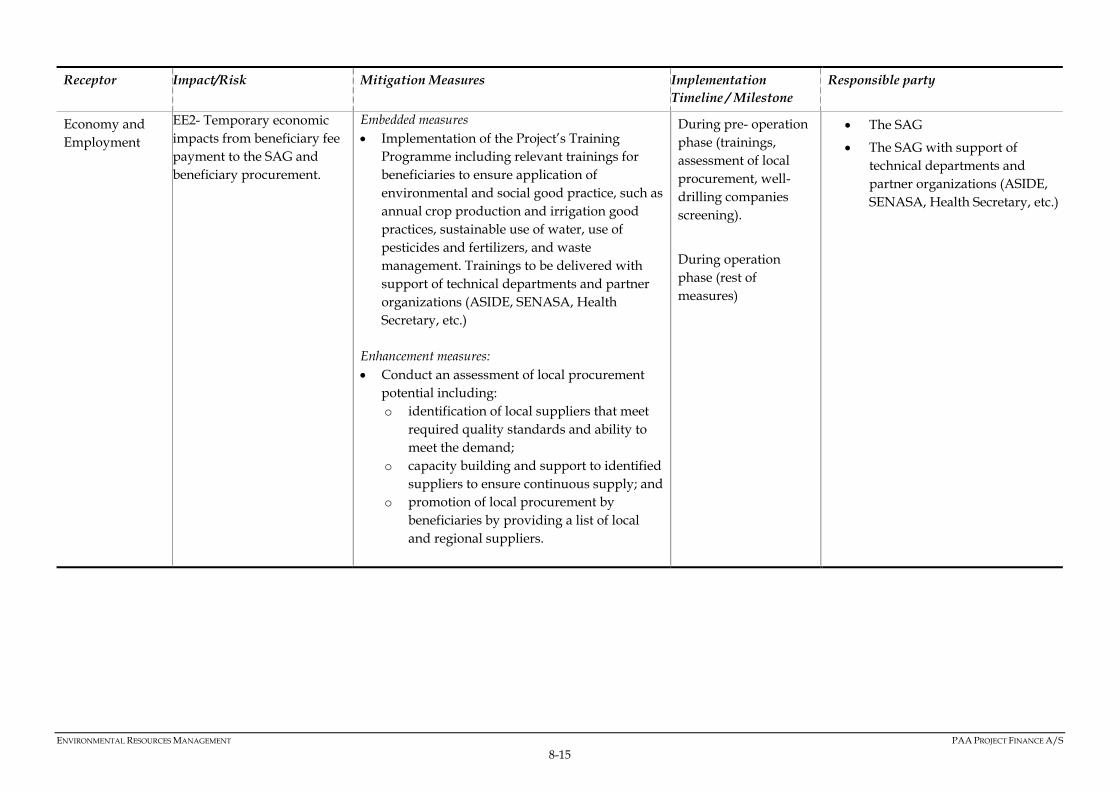
ENVIRONMENTAL RESOURCES MANAGEMENT PAA PROJECT FINANCE A/S
8-15
Receptor Impact/Risk Mitigation Measures Implementation Timeline / Milestone
Responsible party
Economy and Employment
EE2- Temporary economic impacts from beneficiary fee payment to the SAG and beneficiary procurement.
Embedded measures Implementation of the Project’s Training
Programme including relevant trainings for beneficiaries to ensure application of environmental and social good practice, such as annual crop production and irrigation good practices, sustainable use of water, use of pesticides and fertilizers, and waste management. Trainings to be delivered with support of technical departments and partner organizations (ASIDE, SENASA, Health Secretary, etc.)
Enhancement measures: Conduct an assessment of local procurement
potential including: o identification of local suppliers that meet
required quality standards and ability to meet the demand;
o capacity building and support to identified suppliers to ensure continuous supply; and
o promotion of local procurement by beneficiaries by providing a list of local and regional suppliers.
During pre- operation phase (trainings, assessment of local procurement, well-drilling companies screening).
During operation phase (rest of measures)
The SAG
The SAG with support of technical departments and partner organizations (ASIDE, SENASA, Health Secretary, etc.)

ENVIRONMENTAL RESOURCES MANAGEMENT PAA PROJECT FINANCE A/S
8-16
Receptor Impact/Risk Mitigation Measures Implementation Timeline / Milestone
Responsible party
EE3 – Temporary direct employment of labour for installation of the irrigation equipment.
Enhancement measures: Ensure that the beneficiaries employ workers
from the local labour force prioritizing workers from the Project Area followed by workers from Olanchito and Arenal more broadly and neighbouring municipalities as needed.
Ensure that beneficiaries rely on the CRELs and the municipality employment department to advertise their employment needs with a clear application procedure to and ensure equal opportunities for all and transparent hiring practices
EE4 – Long-term economic growth from production increase and improvements in the agriculture and milk production sectors and related sectors.
Enhancement measures: Conduct a detailed supply-and-demand market
study for the agriculture, milk production and milk-processing sectors to assess risks and opportunities related to an increased production.

ENVIRONMENTAL RESOURCES MANAGEMENT PAA PROJECT FINANCE A/S
8-17
Receptor Impact/Risk Mitigation Measures Implementation Timeline / Milestone
Responsible party
EE5 - Long-term direct and indirect employment in the agriculture, livestock breeding and milk production sector and related sectors.
Enhancement measures:
• Consider as criteria the potential beneficiary’s financial solvency to generate additional employment in order to cultivate the irrigated land.
Require potential beneficiaries to present an investment plan including the number of permanent jobs expected to be created.
Agree with selected Project beneficiaries on the expected level of yearly employment and ensure best efforts to employ workers from within the Project Area including individuals of indigenous descent, while guaranteeing equal pay and working conditions.
Monitor compliance with labour related commitments both during the rainy and dry season through technical and relevant technical departments

ENVIRONMENTAL RESOURCES MANAGEMENT PAA PROJECT FINANCE A/S
8-18
Receptor Impact/Risk Mitigation Measures Implementation Timeline / Milestone
Responsible party
Livelihoods and Income
LL1 –Improved livelihoods and food security for Project beneficiaries and farm labour.
Mitigation measures: Undertake a sector and market study for
production including a supply-and-demand market assessment.
Provide project management support and financial literacy trainings through relevant technical departments.
During pre-operation phase (sector and market study, selection of beneficiaries, trainings and capacity building, and development of management plans).
The SAG
The SAG-PIU (selection of beneficiaries)
The SAG with support of SAGO and CRELs (creation and capacity building)
The SAG with support of rural funding organizations (project management support and financial literacy trainings)
The SAG with the support of UMA (monitoring of surface water flow and groundwater levels)
The SAG with support of the CRELs (monitoring of water consumption)

ENVIRONMENTAL RESOURCES MANAGEMENT PAA PROJECT FINANCE A/S
8-19
Receptor Impact/Risk Mitigation Measures Implementation Timeline / Milestone
Responsible party
LL2 – Risk of livelihood losses for beneficiaries due to increased financial pressure on beneficiaries
Embedded measures: Implement measures to reduce initial
investment costs for beneficiaries including fee minimization, efficient motor pump with low diesel consumption (3.8l/h)
Mitigation measures: As part of the beneficiary selection process,
require proof of financial solvency to minimize the risk of over indebtedness and financial pressure on beneficiaries, especially small producers.
Support the creation and capacity building of rural funding organizations (Cajas Rurales) for the agriculture and milk production sectors specifically, in collaboration with the SAGO and CRELs
Provide project management support and financial literacy trainings to beneficiaries to allow them to prepare long-term business plans for their operations, in collaboration with the SAGO and CRELs

ENVIRONMENTAL RESOURCES MANAGEMENT PAA PROJECT FINANCE A/S
8-20
Receptor Impact/Risk Mitigation Measures Implementation Timeline / Milestone
Responsible party
LL3 – Risk of livelihood losses for beneficiaries and other land users due to loss of soil fertility
Embedded measures: Implementation of the Project’s Training
Programme including training on appropriate use of irrigation equipment and sustainable irrigation and agricultural practices, training on adequate use of chemical products and minimizing water usage for irrigation.
Monitoring of the irrigation equipment for a period of no less than 10 years
Mitigation measures:
• Same Mitigation measures as S1.

ENVIRONMENTAL RESOURCES MANAGEMENT PAA PROJECT FINANCE A/S
8-21
Receptor Impact/Risk Mitigation Measures Implementation Timeline / Milestone
Responsible party
LL4 – Risk of livelihood and losses for non-project beneficiaries due to decreased availability of water
Embedded measures: • Same embedded mitigation measures as W5.
Mitigation measures:
• Same mitigation measures as W5.
Additional mitigation measures: As part of the Stakeholder Engagement Plan,
disclose and implement the grievance mechanism to the wider community, including in particular farmers associations or cooperatives to ensure that small-scale crop framers in the area are able to voice any grievances or complaints related to the Project and seek proper remedy.

ENVIRONMENTAL RESOURCES MANAGEMENT PAA PROJECT FINANCE A/S
8-22
Receptor Impact/Risk Mitigation Measures Implementation Timeline / Milestone
Responsible party
Occupational Health and Safety and Labour Rights
OHS2 – Occupational health and safety and labour rights related to groundwater well drilling and equipment installation.
Embedded measures • Implementation of the Project’s Training
Programme including technical training on the adequate use and maintenance of the irrigation equipment.
Mitigation measures: As part of the technical training to beneficiaries,
include health and safety prevention measures for equipment installation adapted to high temperature weather conditions (clothing, water intake, shade, change of work schedule, etc.) and thunderstorms, etc.
Monitor installation and well-drilling activities and provide support as needed.
Require the local drilling companies for well drilling to develop Health and Safety Plans to ensure that well-drilling staff is well trained on safe drilling practices and health and safety prevention measures.
As part of the Project’s Stakeholder Engagement Plan, disclose and implement the grievance mechanism for all Project stakeholder including workers.
Conduct regular monitoring of labour issues by following up on the grievances raised.
During pre-operation phase (trainings).
During operation phase (rest of measures).
The SAG

ENVIRONMENTAL RESOURCES MANAGEMENT PAA PROJECT FINANCE A/S
8-23
Receptor Impact/Risk Mitigation Measures Implementation Timeline / Milestone
Responsible party
OHS3 – Occupational health and safety and labour rights related to farm labour including the risk of child labour and forced overtime.
Embedded measures: Same embedded measures as OHS2.
Mitigation measures: Conduct awareness and capacity building
training to beneficiaries, beneficiary farm workers, and the broader community on exposure to vector-borne diseases such as malaria and adequate prevention measures, through relevant departments and institutional partners.
Train beneficiaries and farm workers on proper management of piles of stagnant water, through relevant departments and institutional partners.

ENVIRONMENTAL RESOURCES MANAGEMENT PAA PROJECT FINANCE A/S
8-24
Receptor Impact/Risk Mitigation Measures Implementation Timeline / Milestone
Responsible party
OHS4 - Labour rights for farm labour including the risk of child labour and forced overtime
Mitigation measures: As part of the Project’s Stakeholder
Engagement Plan, develop and disclose a grievance mechanism for all Project stakeholder including workers to ensure that a stakeholder can voice concerns and have access to a fair and transparent resolution mechanism.
Conduct regular monitoring of labour issues through following up on the grievances raised, through relevant technical departments.
Monitor farm labour working conditions on beneficiary farms to ensure that worker’s rights are respected, including minimum age requirements and overtime work.
Conduct a preliminary identification of the number of farm workers who have been assigned land for self-cultivation on beneficiary land and will require beneficiaries to commit to ensuring that these workers continue having access to the land in question or to alternative parcels of equal or higher quality.
Conduct regular monitoring during the operation phase to ensure that workers have not lost access to land.

ENVIRONMENTAL RESOURCES MANAGEMENT PAA PROJECT FINANCE A/S
8-25
Receptor Impact/Risk Mitigation Measures Implementation Timeline / Milestone
Responsible party
Community Health and Safety
CHS1 – Increased risk of water-borne diseases due to poor drinking water quality
Embedded measures: • Implementation of the Project’s Training
Programme including a topic on the adequate use of chemical products (pesticides, herbicides, and fertilizers)
Mitigation measures:
• Same mitigation measures as W1.
Additional mitigation measures: • Develop and implement a Community Health
and Safety Plan including awareness raising and capacity building programmes for settlements in the Project Area on the prevention of vector-borne and water-borne diseases, partnering with the relevant institutional and organizational partners.
During pre-operation phase (development of management plans and trainings).
During operation (rest of measures).
The SAG

ENVIRONMENTAL RESOURCES MANAGEMENT PAA PROJECT FINANCE A/S
8-26
Receptor Impact/Risk Mitigation Measures Implementation Timeline / Milestone
Responsible party
CHS2 – Increased transmission of vector-borne diseases
Embedded measures • Implementation of the Project’s Training
Programme including a topic on the adequate use of the irrigation equipment.
Mitigation measures: Same mitigation measures as OHS3.
Additional mitigation measures: • Develop and implement a Community Health
and Safety Plan including awareness raising and capacity building programmes for settlements in the Project Area on the prevention of vector-borne and water-borne diseases, partnering with the relevant institutional and organizational partners.
• Train beneficiaries and farm workers on proper management of piles of stagnant water through relevant department and institutional partners.

ENVIRONMENTAL RESOURCES MANAGEMENT PAA PROJECT FINANCE A/S
8-27
Receptor Impact/Risk Mitigation Measures Implementation Timeline / Milestone
Responsible party
CH3 – Increased tension on healthcare infrastructure and access to healthcare
Mitigation measures: Develop and implement a Community Health
and Safety Plan including community awareness programmes in order to prevent potential disease occurrence and therefore reduce the risk of increased pressure on the healthcare system in the Study Area during the 3.5 months of irrigation, through relevant departments and institutional partners.
As part of the Community Health and Safety Plan, promote any developments to the healthcare sector in the Study Area, including the delivery of capacity building on the prevention and treatment of vector-borne and water-borne diseases.

ENVIRONMENTAL RESOURCES MANAGEMENT PAA PROJECT FINANCE A/S
8-28
Community Cohesion
CC1 – Increased tensions between communities, producers, and beneficiaries over land ownership and water availability in the dry season
Embedded measures: Monitoring of the irrigation equipment for a
period of no less than 10 years including the beneficiaries’ water consumption (water meters are included in the irrigation system).
The location of the water abstraction source will be selected making sure that it is situated away from other water sources (e.g. other existing groundwater wells) and away from potential contamination sources.
Land beneficiaries are not allowed to sell the irrigation equipment and are required to return the equipment to the SAG in the event of a land sale.
The Project requires that selected beneficiaries have ownership of the land to be irrigated and that the plot in question is not located on indigenous land.
Mitigation measures : Development and implementation of a Water
Management Plan.
Follow irrigation plans and schedules as per FAO’s guidelines.
Implementation of logbook with records of water pumped (or hours of pumping), and share this with the CRELs.
Water flow monitoring in Aguan River and main tributaries (upstream and downstream). Two monitoring events will be conducted during the year: in the dry and rainy season.
Groundwater level monitoring in the wells installed for the Project activities, as well as in
During pre-operation phase (management plans and selection of beneficiaries).
During operation phase (rest of measures).
The SAG
The SAG-PIU (selection of beneficiaries)
The SAG with the support of UMA (monitoring of surface water flow and groundwater levels
The SAG with support of the CRELs (monitoring of water consumption))

ENVIRONMENTAL RESOURCES MANAGEMENT PAA PROJECT FINANCE A/S
8-29
Receptor Impact/Risk Mitigation Measures Implementation Timeline / Milestone
Responsible party
any other potential existing well located within an approximate ratio of 100 m from the installed groundwater wells.
During the beneficiary selection process, the SAG will investigate the existence of potential ancestral land claims and exclude beneficiaries whose land ownership is contested regardless of their ownership title.
As part of the Stakeholder Engagement Plan, disclose and implement the grievance mechanism to the wider community, to ensure that all potential grievances or concerns are raised and addressed in order to address issues on time and reduce the risk of tensions.
Archaeological and Cultural Heritage
CH 1 – Potential damage to archaeological or cultural heritage elements in the Project Area
Mitigation measures: • Development and implementation of a
Cultural Heritage Management and Monitoring Plan.
• Map locations of known archaeological sites within the Project Area.
• Undertake a site survey of the beneficiary land plot and selected groundwater well locations.
• Ensure that groundwater well locations are avoided if there are indications that archaeological material will be encountered;
• Undertake archaeological monitoring during the drilling of the wells in locations where archaeology may be encountered. A Chance Find Procedure will be implemented during these monitoring activities.
During pre-operational phase (management plans and procedures, mapping).
During operational phase (rest of measures).
The SAG
The SAG through relevant technical departments or partner organizations

ENVIRONMENTAL RESOURCES MANAGEMENT PAA PROJECT FINANCE A/S
8-30
Table 8.3 Environmental and social management plan – non routine events
Receptor Impact/Risk Mitigation Measures Implementation Timeline / Milestone
Responsible party
Non-routine events
Acc1 - Affection to the soil quality and groundwater quality due to accidental spills of fuel (diesel) and/or wastes (lubricants, bentonite-based muds).
Embedded measures: Implementation of the Project’s Training
Programme Drilling of the groundwater wells at the
beneficiary’s plot that required itwill be undertaken by specialised local drilling companies.. This will contribute to avoid the risk of an inadequate management of wastes.
Monitoring of the irrigation equipment for a period of no less than 10 years.
Beneficiary responsibilities acquired linked to the irrigation system such as the maintenance of the equipment.
Mitigation measures:
Motor pumps will be installed on impermeable surfaces.
Absorbing materials will be available in the proximity of the motor pumps.
Fuel (diesel) will be stored in certified and specific storages for such products.
Implementation of logbook recording for fuel used, spills occurred recommended as good practice.
During Pre-operation phase (trainings)
During operational phase (rest of measures).
The SAG

ENVIRONMENTAL RESOURCES MANAGEMENT PAA PROJECT FINANCE A/S
8-31
Table 8.4 Environmental and social management plan – cumulative impacts
Receptor Impact/Risk Mitigation Measures Implementation Timeline / Milestone
Responsible party
Current of future projects
The disruption to surface water flow
Mitigation measures: Same Mitigation measures as Impact W3. Additional mitigation measure: Through the Stakeholder Engagement Plan, it is
raised that future projects such as Aguan Energy Complex and the Arenal Etapa I-II Hydroelectric project or current projects such as the Austria II project will be undertaken in cooperation with the Alto Aguan Irrigation Project to guarantee the sustainable use of resources and to ensure that the potential interactions related to the water resources do not result in significant environmental impacts.
During pre-operation phase (management plans and irrigation plans and schedules)
During operation phase (rest of measures).
The SAG
The SAG with support of the CRELs (monitoring of water consumption))
The SAG with the support of UMA (monitoring of Aguan River and tributaries upstream and downstream)
The SAG with the support of UMA (monitoring of groundwater levels in wells)

ENVIRONMENTAL RESOURCES MANAGEMENT PAA PROJECT FINANCE A/S
32
8.3 SPECIFIC MANAGEMENT PLANS
8.3.1 Introduction
The above proposed mitigation measures as well as the embedded measures of the Project design make reference to a number of specific management plans that will need to be developed to address in detail key areas of potential environmental and socioeconomic impacts and risks. Additional management plans may be introduced as the Project progresses to aid in the management of any newly identified impacts or sensitive receptors or changes that may occur in the course of Project implementation. These plans are regarded as ‘live’ documents and will need to be updated periodically as the implementation of the Project evolves. This section provides a brief presentation of plans and programs foreseen for the Project in the context of the mitigation and embedded measures proposed based on the outcomes of the impact assessment as well as the Project design. It should be noted that the management plans presented below are not comprehensive independent plans, but represent the basis for the development of these plans.
8.3.2 Permitting Action Plan
The aim of the Permitting Action Plan is to identify the required permits and approvals that have to be processed by the beneficiaries as well as the administrative departments and resources that will be implicated in the process.
This Plan shall include information on:
The required permits to be acquired by the beneficiaries and the administrative departments where permits need to be applied for;
Approximate permitting time necessary to obtain the permits, administrative resources to manage applications and consultations that may arise during the permitting process;
Follow up actions on the beneficiaries’ permitting process.
8.3.3 Water Management Plan
The overall objective of the Water Management Plan (WMP) is to protect water resources and minimize potential environmental and social impacts that Project activities may cause through the definition of an appropriate Water Management Strategy to be implemented by the SAG throughout the Project lifetime.
The Water Management Plan will have the following objectives:
Ensure compliance with legislation/permitting regulations, relevant IFC requirements and industry best standards.

ENVIRONMENTAL RESOURCES MANAGEMENT PAA PROJECT FINANCE A/S
33
Monitor water use: the Plan will set procedures for estimating water used by the project, identifying the indicators of the monitoring programme, as well as activities that use this resource and following a reporting procedure for registering used volumes of water.
Minimize water use: the Plan will provide a series of measures to be considered for minimising the use of water.
Document water sources and extraction locations: water sources to be used will be agreed previously with the relevant local authorities and, potentially, with other water users. Sources of water will be identified and registered in the Plan, together with the GPS coordinates and the maximum water volumes allowed from the source.
Define training needs in water management. Define the responsible parties required to ensure the achievement of
each objective.
8.3.4 Biodiversity Management Plan
The Biodiversity Management Plan (BMP) will seek to limit adverse impacts to habitats, flora and fauna species to the extent practical, and to avoid adverse impacts to populations of any endangered, sensitive and protected species. The BMP will be developed in coordination with ASIDE and ICF, co-managers of the RVSCEH and implemented by the SAG with support from these organisations. It aims at:
Protecting habitats, flora and fauna species. Limiting disturbances to the natural habitat resulting from Project
activities. Addressing the protection of endangered, sensitive and protected
species. Developing sustainable management practices for biodiversity. Defining monitoring tasks, indicators, frequency and reporting
requirements. Defining training needs in biodiversity management. Defining the responsible parties required to ensure the achievement of
each objective.
The BMP will provide a comprehensive plan for the Project to address issues of biodiversity protection. In addition, the BMP will address specific requirements related to Critical Habitat as specified in the IFC Performance Standards regarding how net gain is to be achieved for the key species and habitats of concern.

ENVIRONMENTAL RESOURCES MANAGEMENT PAA PROJECT FINANCE A/S
34
8.3.5 Good Practice Irrigation Guideline
According to the FAO, good agricultural practices are practices that address environmental, economic and social sustainability for on-farm processes and result in safe and quality food. The aim of the Good Practice Irrigation Guideline will be to provide a practical framework to ensure that the Project’s irrigation is performed sustainably according to the local context requirements. For the elaboration of this document, FAO’s irrigation guidelines as well as other technical and scientific based documents (e.g. World Bank technical reports) will be assessed to provide technically sound and practical information coherent with the local agricultural context (e.g. environmental and geographic setting). The guideline shall address at least the following issues:
Analysis of local/regional knowledge and local practices. Environmental implications of irrigation systems (e.g. water quality
and pollution, water availability, etc.). Water quality requirements for irrigation. Required frequency of irrigations considering local context and crops
to ensure a sustained production based on the crops needs. Methodology for selection of crops suitable for irrigation. Training needs in good irrigation practices. Aspects of food security and local preparedness for natural hazards
and disasters in both drought and floods.
8.3.6 Pesticides, Herbicides and Fertilizer Management Plan
The Pesticides, Herbicides and Fertilizer Management Plan shall be a guidance document for the prevention, evaluation and mitigation of occurrences of pesticides or herbicides products in groundwater and surface waters of the Project Area.
The Pesticides and Herbicides Management Plan will have the following objectives:
Ensure compliance with legislation/permitting regulations, relevant IFC requirements and industry best standards.
Monitor pesticides, herbicides and fertilizers use: the Plan will set procedures for estimating pesticides, herbicides and fertilizers used by the Project, identifying the indicators of the monitoring programme, identifying activities that use this resource and following a reporting procedure for registering used pesticides, herbicides and fertilizers.
Minimize pesticides, herbicides and fertilizers use, providing a series of measures to be considered for this.

ENVIRONMENTAL RESOURCES MANAGEMENT PAA PROJECT FINANCE A/S
35
Define training needs in pesticides, herbicides and fertilizers management.
Define the responsible parties required to ensure the achievement of each objective.
8.3.7 Waste Management Plan
The Waste Management Plan shall be developed to manage solid and liquid wastes and to avoid any discharges into the soil or water. It establishes procedures for the storage, collection and disposal of waste, including liquid and solid waste and hazardous and non-hazardous waste. The overall objective of the Waste Management Plan (WMP) is to minimise impact of waste generated during Project activities through the following:
Ensure generated wastes are properly managed and disposed of in accordance with local regulations.
Maximise the amount of waste that is recovered for recycling.
The WMP will aim at:
Defining produced waste characteristics, existing collection and treatment systems.
Defining monitoring tasks, indicators, frequency and reporting requirements.
Defining training needs in waste management. Defining the responsible parties required to ensure the achievement of
each objective.
8.3.8 Cultural Heritage Management and Monitoring Plan
The Cultural Heritage Management and Monitoring Plan (CHMMP) will have the objective of avoiding potential damages to cultural resources.
The Plan will include:
Summary of applicable legislation, International legislation and the ESIA commitments.
Assessment of the known cultural heritage in the Project Area. Definition of the Chance Find Procedure. Verification and monitoring, including procedures for the
identification of additional resources not initially identified. Define training needs in cultural heritage management. Define the responsible parties required to ensure the achievement of
each objective, including details on the communication lines between the beneficiaries, the SAG and local and national conservation bodies.
Avoidance of cultural heritage resources is the preferred mitigation method. Marking and protection of cultural heritage sites with temporary barriers such

ENVIRONMENTAL RESOURCES MANAGEMENT PAA PROJECT FINANCE A/S
36
as a bright coloured plastic or mesh wire fence with highly visible flagging is recommended.
8.3.9 Occupational Health and Safety Guidance
In order to avoid or mitigate potential adverse Occupational Health and Safety (OH&S) risks that may arise from implementation of the Project activities (road transport during pre-operation phase and working conditions, vector born disease during operation phase), an OH&S Management Plan will be developed.
This OH&S Plan will have the following objectives:
Avoid or minimize risks to and impacts on the health and safety of beneficiaries and workers employed by the beneficiaries (farm workers and hired workers for the drilling and installation activities).
Define health and safety prevention measures to beneficiaries and workers employed by the beneficiaries (farm workers and hired workers for the drilling and installation activities).
Ensuring compliance with national legislation and international good practices.
Define monitoring tasks, indicators, frequency and reporting requirements.
Define training needs in health and safety guidance. Define the responsible parties required to ensure the achievement of
each objective.
8.3.10 Community Health Management Plan
The Community Health Management Plan (Community Health MP) will be developed to avoid or minimise the risks and adverse impacts to community health (including safety and security) that may arise from Project activities (poor water quality, vector born disease, pressure on health care infrastructure and access to it) to ensure safe operations that protect communities. This plan will be developed in collaboration with the local health institutions in Olanchito.
The objectives of the Community Health MP are to:
Avoid or minimize risks to and impacts on the health and safety of the community (including vector and water born disease).
Define health and safety prevention measures to beneficiaries and workers employed by the community.
Ensuring compliance with national legislation and international good practices.
Define monitoring tasks, indicators, frequency and reporting requirements.
Define training needs in community health guidance. Define the responsible parties required to ensure the achievement of
each objective.

ENVIRONMENTAL RESOURCES MANAGEMENT PAA PROJECT FINANCE A/S
37
8.3.11 Training Management Plan
Once the management plans are developed, it is essential that all stakeholders implicated in the Aguan Irrigation Project are properly trained as to ensure that they are efficiently implemented. As so, the Training Plan aims at disseminating information, increasing awareness and building capacity of all those who have a shared responsibility to support the Project in achieving high environment, health and safety standards. The Training Plan will include the training defined as part of the Project Design (described in Section 3.6.1 of Chapter 3) as well as the training needs identified in the environmental and social impact assessment (Chapter 7). The objectives of the Training Plan are to:
Define training topics based on those embedded in the Project Design and those identified in the environmental and social impact assessment.
Define the responsible parties in charge of preparing the training material and imparting each training.
Define the stakeholders that have to attend to the training. The training topics either defined as part of the Project Design or identified in the environmental and social impact assessment are summarized in Table 8.5.
Table 8.5 Training topics
Training topic Responsible party
Installation of the irrigation equipment and its accessories and use of the equipment
PAA Project Finance Maintenance and upkeep of the irrigation equipment Guidelines for groundwater well abandonment Guidelines for Water Management and Irrigation Development
SAG-DICTA (Directorate of Agricultural Science and Technology) and from other local organizations such as ASIDE, SENASA, Health Secretary / Coordination of Environmental Health Program of the Municipality of Olanchito
Guidelines for Planning Irrigation and Drainage Investment Projects Use and management of pesticides, herbicides and fertilizers Waste management Cultural heritage management including chance-find procedure Health and safety Traffic safety Biodiversity management Project management support and financial literacy
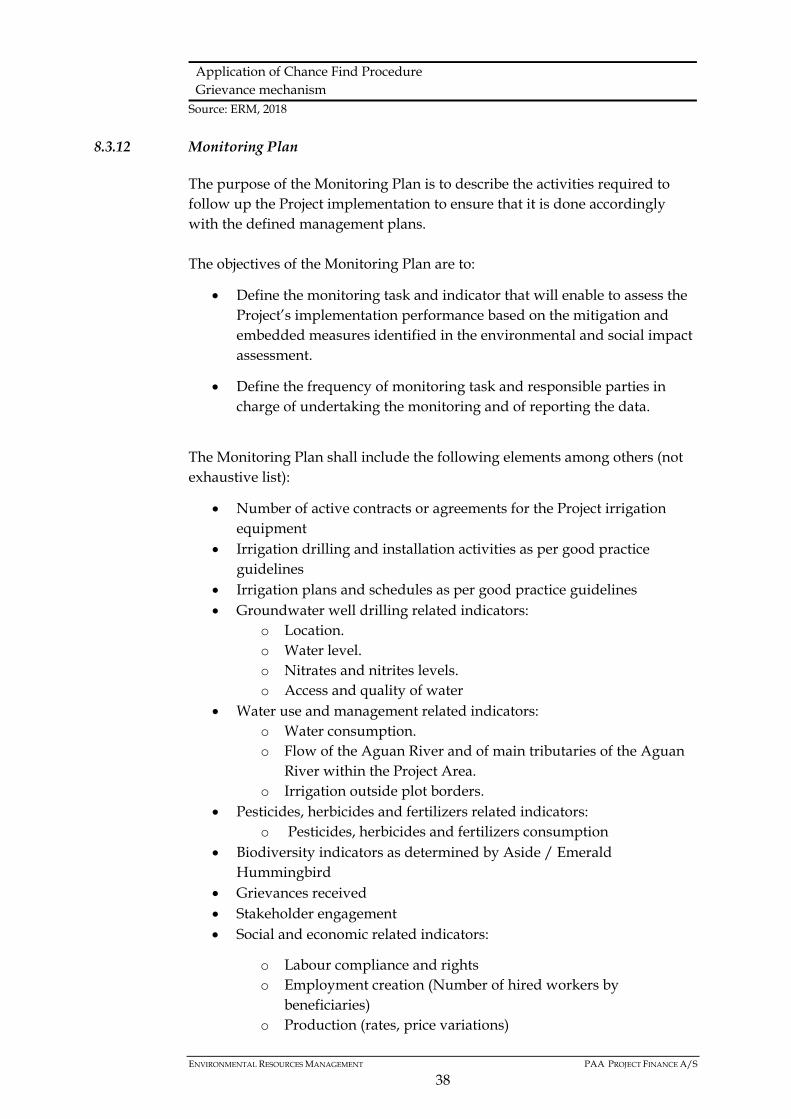
ENVIRONMENTAL RESOURCES MANAGEMENT PAA PROJECT FINANCE A/S
38
Application of Chance Find Procedure Grievance mechanism
Source: ERM, 2018
8.3.12 Monitoring Plan
The purpose of the Monitoring Plan is to describe the activities required to follow up the Project implementation to ensure that it is done accordingly with the defined management plans. The objectives of the Monitoring Plan are to:
Define the monitoring task and indicator that will enable to assess the Project’s implementation performance based on the mitigation and embedded measures identified in the environmental and social impact assessment.
Define the frequency of monitoring task and responsible parties in charge of undertaking the monitoring and of reporting the data.
The Monitoring Plan shall include the following elements among others (not exhaustive list):
Number of active contracts or agreements for the Project irrigation equipment
Irrigation drilling and installation activities as per good practice guidelines
Irrigation plans and schedules as per good practice guidelines Groundwater well drilling related indicators:
o Location. o Water level. o Nitrates and nitrites levels. o Access and quality of water
Water use and management related indicators: o Water consumption. o Flow of the Aguan River and of main tributaries of the Aguan
River within the Project Area. o Irrigation outside plot borders.
Pesticides, herbicides and fertilizers related indicators: o Pesticides, herbicides and fertilizers consumption
Biodiversity indicators as determined by Aside / Emerald Hummingbird
Grievances received Stakeholder engagement Social and economic related indicators:
o Labour compliance and rights o Employment creation (Number of hired workers by
beneficiaries) o Production (rates, price variations)

ENVIRONMENTAL RESOURCES MANAGEMENT PAA PROJECT FINANCE A/S
39
o Beneficiary satisfaction Health related indicators:
o Vector-borne diseases Occupational Health and Safety (OHS) Status of equipment (damaged and stolen) Training and capacity building Cultural heritage
8.4 ROLES AND RESPONSIBILITIES
As the Project owner, the SAG will have the responsibility of implementing the ESMP, which will include:
Ongoing management of environmental and socioeconomic issues throughout the Project’s lifetime.
Monitoring of beneficiaries’ performance and reporting procedures. Development of strategies / mechanisms for dealing with problems. Acting as a point of contact for consultation and feedback with lenders. Implementing the Stakeholder Engagement Plan and grievance
mechanism. In addition, the SAG will be responsible for ensuring compliance with:
All relevant national legislation and international good practices. Environmental and socioeconomic controls and mitigation measures
contained in the ESMP The specific management plans will be developed by ERM on behalf of PAA Project and the SAG. ERM is expected to develop these over a four and a half month period, once the ESIA is approved.

The business of sustainability
Stakeholder Engagement Plan (SEP) for the Alto Aguan River Valley Irrigation Project in Honduras Rev01 PAA Project Finance A/S January 2018 www.erm.com

ENVIRONMENTAL RESOURCES MANAGEMENT PAA PROJECT FINANCE A/S
i
Stakeholder Engagement Plan (SEP) for the Alto Aguan River Valley Irrigation PAA Project Finance A/S Rev01
For ERM Approved by: Maria Quintana Title: Partner Date: 15th January 2018
This Report has been prepared by ERM, the trading name of Environmental Resources Management Iberia S.A., with all reasonable skill, care and diligence within the terms of the Contract with the client, incorporating our General Terms and Conditions of Business and taking account of the resources devoted to it by agreement with the client. We disclaim any responsibility to the client and others in respect of any matters outside the scope of the above. This report is confidential to the client and we accept no responsibility of whatsoever nature to third parties to whom this report, or any part thereof, is made known. Any such party relies upon the report at their own risk.

ENVIRONMENTAL RESOURCES MANAGEMENT PAA PROJECT FINANCE A/S
ii
CONTENTS
ABBREVIATIONS I
1 INTRODUCTION 1
1.1 BACKGROUND 1 1.2 PROJECT LOCATION 2 1.3 PROJECT OVERVIEW 4 1.4 SCOPE 7 1.5 STAKEHOLDER ENGAGEMENT PRINCIPLES 8 1.6 OBJECTIVES 8
2 REGULATIONS AND REQUIREMENTS 10
2.1 PAA PROJECT FINANCE CSR STANDARDS 10 2.2 HONDURAS REGULATIONS 12 2.3 LENDERS REQUIREMENTS 13
3 SUMMARY OF PREVIOUS STAKEHOLDER ENGAGEMENTS 17
3.1 INTRODUCTION 17 3.2 ENGAGEMENT ACTIVITIES DURING ESIA FOR LENDERS PREPARATION (2017) 17 3.3 ENGAGEMENT ACTIVITIES DURING ESIA UPDATE PREPARATION (2018) 19
4 PROJECT STAKEHOLDERS 21
4.1 STAKEHOLDER IDENTIFICATION 21 4.2 STAKEHOLDER ANALYSIS AND PRIORITISATION 27
5 STAKEHOLDER ENGAGEMENT PROGRAMME 30
5.1 OVERVIEW 30 5.2 PRE-OPERATION PHASE ENGAGEMENT 32 5.3 OPERATIONS PHASE ENGAGEMENT 38 5.4 ABANDONMENT PHASE ENGAGEMENT 39 5.5 TOOLS 39
6 COMMUNITY GRIEVANCE MECHANISM 41
6.1 DEFINITIONS AND GOOD PRACTICE 41 6.2 PURPOSE 41 6.3 DETAILED GRIEVANCE PROCEDURE 42
7 RESOURCES AND RESPONSIBILITIES 48
8 MONITORING AND REPORTING 50

ENVIRONMENTAL RESOURCES MANAGEMENT PAA PROJECT FINANCE A/S
iii
8.1 STAKEHOLDER INVOLVEMENT IN PROJECT MONITORING 50 8.2 REPORTING TO STAKEHOLDERS 50
ANNEX A: BENEFICIARY RESPONSABILITIES TOWARDS THE PROJECT 52
ANNEX B.1: STAKEHOLDER ENGAGEMENT ACTIVITIES DURING ESIA FOR LENDERS PREPARATION (2017) ¡ERROR! MARCADOR NO DEFINIDO.
ANNEX B.2: STAKEHOLDER ENGAGEMENT ACTIVITIES DURING ESIA UPDATE PREPARATION (2018) ¡ERROR! MARCADOR NO DEFINIDO.
ANNEX C.1: SAMPLE GRIEVANCE REGISTRATION FORM ¡ERROR! MARCADOR NO DEFINIDO.
ANNEX C.2: SAMPLE GRIEVANCE REGISTER LOG ¡ERROR! MARCADOR NO DEFINIDO.

ENVIRONMENTAL RESOURCES MANAGEMENT PAA PROJECT FINANCE A/S
i
ABBREVIATIONS
ACITMFM Association of Indigenous Tolupan Communities of “La Montaña de la Flor”
AHJASA Representante municipal de la Asociación Hondureña de Juntas Administradoras de Sistemas de Agua (Municipal Representative of the Hunduran Association of Water Systems Management Boards)
AJAASPIB Asociación de Juntas Administradoras de Sistemas de Agua del Sector Sur del Parque Nacional Pico Bonito (Water System Management Boards Association of the South Sector of the Pico Bonito National Park)
ASIDE Co-manager of the Emerald Hummingbird Wildlife Refuge in Honduras
ALFALIT Literacy, community development, food safety
CBOs Community-Based Organisations
CINSA Consultores en Ingeniería, S.A (Honduran Engineering Consulting Company)
COMAS Municipal Water and Sanitation Commission
CONASA National Council of Potable Water and Sanitation
CREL(ES) Centro de Recolección de Leche (Milk Collection Centre)
CURLA Regional University Center of Aguan Valley
DECA Dirección General de Evaluación y Control Ambiental de la MiAmbiente (General Directorate of Environmental Assessment and Control of MIAMBIENTE)
ESIA Environmental and Social Impact Assessment
FENAGH Federación Nacional de a Agricultores y Ganaderos de Honduras (National Farmers’ and Stockbreeders’ Federation of Honduras)
FETRIXY Federation of Xicaque of Yoro
FGD Focus Groups Discussions
ENVIRONMENTAL RESOURCES MANAGEMENT PAA PROJECT FINANCE A/S
ii
FUPNAPIB Protection, Conservation and Responsible Use of Natural Resources Present in Pico Bonito National Park
ICF Instituto de Conservación Forestal (Institute of Forest Conservation)
IFC-PS International Finance Corporation Performance Standards
IHAH Instituto Hondureño de Antropología e Historia (Honduran Institute of Anthropology and History)
INA Instituto Nacional Agrario (Agrarian National Institute)
INE Instituto Nacional de Estadísticas (National Institute of Statistics)
INFOP National Institute for Professional Training
IUCN The International Union for Conservation of Nature
MiAmbiente Secretaría del Estado en el Despacho de Energía, Recursos Naturales, Ambiente y Minas (Secretariat of State in the Office of Energy, Natural Resources, the Environment and Mining)
NGO Non-Governmental Organisation
OXFAM Oxford Committee for Famine Relief
PIU Project Implementing Unit (Unidad Ejecutora del Proyecto -UEP)
SAG Secretaría de Agricultura y Ganadería (Secretary of Agriculture and Livestock)
SAG-DICTA Dirección de Ciencia y Tecnología Agropecuaria (Directorate of Agricultural Science and Technology)
SAGO Sociedad de Agricultores y Ganaderos de Olanchito (Olanchito Farmers’ and Stockbreeders Society)
SEDINAFROH Secretaría de Estado de Pueblo Indígenas y Afrohondureños (State Secretariat for Indigenous and Afrohonduran People)
SENASA Servicio Nacional de Sanidad e Inocuidad Agroalimentaria (National Service for Agrifood Health and Safety)
SEP Stakeholder Engagement Plan
SERNA Secretaría de Integración Económica Centroamericana (Ministry of Central American Economic Integration)
ENVIRONMENTAL RESOURCES MANAGEMENT PAA PROJECT FINANCE A/S
iii
SEFIN Secretaría de Finanzas (Finances Secretary)
SIECA Secretaría de Integración Económica Centroamericana (Ministry of Central American Economic Integration)
UMA Unidad Municipal de Ambiente (Environmental Municipal Unit)
UNAH Honduras National Autonomous University
WWF World Wildlife Fund
ENVIRONMENTAL RESOURCES MANAGEMENT PAA PROJECT FINANCE A/S 1
1 INTRODUCTION
1.1 BACKGROUND
PAA Project Finance A/S, hereafter referred to as “PAA Project Finance”, have appointed Environmental Resources Management (ERM) to act as independent environmental and social consultants to undertake the Stakeholder Engagement Plan (SEP) for the Alto Aguan River Valley Irrigation Project in the Municipalities of Olanchito and Arenal in central Honduras hereafter known as “The Project”. The Project is an initiative of the Secretary of Agriculture and Livestock of Honduras (Secretaría de Agricultura y Ganadería or SAG) ascribed to the Government of Honduras. The Project, by the implementation of individual irrigation systems across the municipalities of Olanchito and Arenal, aims to support the policies and strategies of the Government of Honduras to reach poverty alleviation, creation of job opportunities and agricultural and livestock production output improvement. The Government of Honduras, through the SAG, has awarded PAA Project Finance the contract for delivering irrigation sets and accessories, in addition to training SAG technicians/trainers in their use and maintenance. In order to conduct this Irrigation System Project, the SAG will designate a Project Implementation Unit – PIU (Unidad Ejecutora del Proyecto or UEP), in charge of managing the project throughout its lifetime. The PAA Finance Project will collaborate with the SAG-PIU in the provision and delivery of the irrigation equipment and its accessories, as well as training in its use and appropriate maintenance. Additionally, PAA Project Finance will provide one off financial support for the establishment of the PIU. PAA Project Finance assumes no responsibility for the subsequent operation, use of the systems and decommissioning of the irrigation system. The Government of Honduras is receiving financing from ING Bank, and EKF, Denmark’s Export Credit Agency, to transform the Alto Aguan river valley and is expected to conduct the activities in line with the World Bank Group Standards: IFC Performance Standards and IFC/World Bank Environmental, Health and Safety (EHS) General Guidelines. According to local regulations, the Project does not require the development of an Environmental and Social Impact Assessment (ESIA), as the activities that will be carried out, namely the supply of equipment such as portable pumps and irrigation units, are not subject to a specific environmental licence. However, in 2017, PAA Project started developing an Environmental and Social Impact Assessment (ESIA) to comply with lender requirements. Currently, PAA Project Finance has commissioned ERM to update and finalize the draft 2017 ESIA, according to the gaps in this ESIA identified by lenders.

ENVIRONMENTAL RESOURCES MANAGEMENT PAA PROJECT FINANCE A/S 2
1.2 PROJECT LOCATION
The Project is located within the Yoro department, within the Olanchito and El Arenal municipalities. A small portion of the potential areas to be irrigated touch the Jocón and Sabá municipalities. The 3,110 ha to be irrigated are distributed over an area of 60,000 ha which coincides with the Alto Aguan River Valley area, and represents approximately 6.7% of the total area of the Alto Aguan River Valley. The specific locations of the plots to be irrigated will be defined only once the beneficiaries have been selected; the overall perimeter of the 60,000 ha that encompasses the maximum total area where the irrigation system may be implementation has been assumed as the Project Area (see Section ¡Error! No se encuentra el origen de la referencia. for details on the beneficiary selection process). Figure 1.1 shows the location of the Project Area

ENVIRONMENTAL RESOURCES MANAGEMENT PAA PROJECT FINANCE A/S 3
Figure 1.1 Location of the Project Area
Source: ERM, 2018

ENVIRONMENTAL RESOURCES MANAGEMENT PAA PROJECT FINANCE A/S 4
1.3 PROJECT OVERVIEW
1.3.1 Project Overview and Organisation
The Project consists in the establishment of an irrigation system for approximately 3,110 hectares of agricultural land located in the Alto Aguan Valley. Through the establishment of an irrigation system, the Project, designed by the Engineering Company Integra Ingeniería and managed by PAA Project Finance, aims to support the SAG, owner of the Project, to improve the socioeconomic status of the population in the Aguan Valley. This objective is sought through the efficient and sustainable use of soil and water resources for the existing agricultural and livestock production of the Valleys, by supplying irrigation equipment to pre-selected beneficiaries among the milk producers and farmers in the area. The SAG will establish a Project Implementation Unit - PIU (Unidad Ejecutora del Proyecto or UEP), formed by members of the SAG, and whose role will be to manage the Project throughout its lifetime. It is estimated that the number of milk producers in the Project Area, and thus potential beneficiaries, is between 350 and 400. The majority1 of the producers in the Project Area are members of a CREL, a common interest association. There are currently 16 CRELs in the Project Area. These will be able to apply to become beneficiaries provided they meet the criteria set by the SAG and PAA Project Finance.2 All applications will be reviewed and the decision-making on the final beneficiaries of the irrigation system will be based on strict selection criteria. This selection process will be undertaken by the PIU of the SAG. It is envisaged that the project could benefit between 250-300 milk producers out of the approximately 400 in the area. These will be able to apply for a number of irrigation sets depending on land availability and resources. In addition to complying with the strict selection criteria set, beneficiaries will have to pay a fee (canon) to receive the irrigation equipment and accept the responsibilities that he/she acquires by converting himself/herself into a beneficiary of the Agua Irrigation Project The responsibilities that beneficiaries will acquire with regards to the Project are presented in detail in Annex A to this report. The fee or canon will be established by the SAG based on socioeconomic criteria and a series of to-be-defined Project variables. To this date it has not been established by the SAG yet. Its purpose is the assurance of a long-term viability of the Project and the correct use of the equipment received. The fees
1 Based on the field survey activities undertaken in 2017 and in 2018, it has been estimated that between 85% and 90% of the milk producers in the Project Area are members of a CREL.
2 Land plots eligible for the Project should meet the following criteria: (a) Belong to the beneficiary; (b) Not to be located in protected areas; (c) Not to be under forested use; (d) Have water availability, either surface or underground water; (e) Not to be located in indigenous land.

ENVIRONMENTAL RESOURCES MANAGEMENT PAA PROJECT FINANCE A/S 5
collected will be used for the Project (e.g. for training purposes, for supervision activities). The Project activities under PAA Project Finance include the delivery of an irrigation equipment and its accessories to thewharehouse defined by SAG, as well as training in its use, maintenance and other relevant training (this phase is designated as the pre-operation phase). It is noted that PAA Project Finance involvement will be limited to the initial phase of the Project when equipment will be delivered and train the trainers provided. After this phase the Project will be entirely managed by the SAG. The operation phase is expected to extend over a ten year period. The activities and responsible parties of each phase are specified in the following sections and in more detail in Chapter 3 of the ESIA.
1.3.2 Project Activities
Project activities will take place in three different phases: pre-operation, operation, and abandonment, in which the responsible parties differ from one phase to another. Pre-Operation phase (20 months approximately)
During the pre-operation phase, PAA Project Finance will be responsible for the delivery of irrigation equipment. The irrigation equipment consists of a diesel surface motor pump or electrical underground pump with diesel surface electrical generator, two easy-to-handle travelling cannons, a set of aluminium pupe ducts and accessories for the farmer type irrigation systems; and consists of surface motorpump or underground electrical pump with surface electrical generator, PVC pipe ducts, microsprinklers and associated accessories for the agriculture type irrigation systems. Each irrigation system is designed to irrigate up to 10 ha of land. The delivered irrigation equipment will be stored in warehouse defined by SAG until the beneficiaries are selected by the SAG-PIU. In addition, PAA Project Finance, with the support of the SAG-PIU, will be responsible for preparing and delivering the necessary training to SAG technicians (in other words training the trainers) to ensure the correct use of the irrigation equipment. The technical training will address the following aspects:
installation of the irrigation equipment, its accessories, and use of the equipment,
maintenance and upkeep of the irrigation equipment, and
ENVIRONMENTAL RESOURCES MANAGEMENT PAA PROJECT FINANCE A/S 6
In addition, other relevant training will be prepared to ensure good practices, which will be defined in the corresponding Training Management Plan. Trainings will be provided by technicians from the SAG-DICTA (Directorate of Agricultural Science and Technology) and from other local organizations such as ASIDE, SENASA, Health Secretary / Coordination of Environmental Health Program of the Municipality of Olanchito (Secretaría de Salud / Coordinación del Programa de Salud Ambiental del Municipio de Olanchito) to the selected beneficiaries. The pre-operation phase is estimated to take place during less than 20 months. Operation phase (10 years)
This phase consists of the operation of the irrigation system. It also includes associated monitoring activities. Once the beneficiary’s application is accepted, training received, the conditions for the use of the equipment agreed to and the fee for the reception of the irrigation equipment paid, the beneficiary will be assigned an irrigation equipment set. This equipment will be collected by the selected beneficiaries from the warehouse defined by SAG and transported to his/her land plot. Each beneficiary will be responsible for the conditioning of his/her water source supply (groundwater or surface water) the installation of the Project irrigation equipment and other necessary equipment and finally start irrigating. As mentioned previously, along with the equipment, the beneficiary will acquire a series of responsibilities linked to the irrigation equipment as well as all usage rights of natural resources (see Annex A). In addition, the beneficiary shall be liable for certain environmental services costs such as those related to the use of water and of electricity. Beneficiaries will also be responsible for the safeguarding of the irrigation equipment3 as well as the proper storage of the equipment when not in use during the rainy season. Monitoring activities of the irrigation equipment will be managed by the SAG directly with the support of other organisations such as the CRELs and the SAGO. During these monitoring activities, the condition and correct operation of the irrigation equipment will be verified as well as the correct implementation and management of environmental and social measures (which will be defined in the corresponding Environmental and Social Impact Assessment).
3 No additional security measures will be implemented during the operation phase. Once the Project irrigation equipment is appointed to the beneficiary, he/she is the responsible for the security of the equipment.
ENVIRONMENTAL RESOURCES MANAGEMENT PAA PROJECT FINANCE A/S 7
The operation phase is estimated to extend during the expected operational life of the irrigation equipment which corresponds to 10 years. Abandonment Phase
The following abandonment activities have been considered:
The abandonment of the irrigation equipment, i.e., assuming that the equipment is no longer used for the purpose initially planned by the Project.
The abandonment of the water wells, i.e., assuming that the water wells are no longer used for extracting water for irrigation purposes, or assuming that no water can be extracted.
The abandonment of the irrigated areas, i.e., assuming that the land is no longer irrigated and no longer used for agricultural or livestock purposes, as initially planned by the Project.
During this phase, the beneficiaries will be responsible for correctly abandoning the irrigation equipment and water wells. Abandoned Project irrigation equipment can be either managed and recycled by a specialist company or reused by the milk producer or farmer on other machinery, or for other purposes. In the event that the producer decides to no longer use it, the abandoned water wells will need to be decommissioned as appropriate, following good practice. As for the operation phase, the SAG will be responsible for monitoring of the correct implementation and management of environmental and social measures related to the abandonment activities.
1.4 SCOPE
This SEP describes how PAA Project Finance shall engage with the SAG and Project beneficiaries as well as with other stakeholders during pre-operation and operation phases. Decommissioning is also considered at a high level. This SEP provides the following: Description of regulatory, lender, company, and/or other requirements for
consultation and disclosure;
Identification and prioritisation of stakeholders;
Strategy and timetable for sharing information and consulting with stakeholders;
Resources and responsibilities for implementing stakeholder engagement
activities; and
Description of how stakeholder engagement activities will be incorporated into the PAA Project Finance’s overall management system.

ENVIRONMENTAL RESOURCES MANAGEMENT PAA PROJECT FINANCE A/S 8
1.5 STAKEHOLDER ENGAGEMENT PRINCIPLES
PAA Project Finance understands that effective stakeholder engagement and public consultation is a cornerstone of successful Project development, and is committed to free, prior, and informed engagement with stakeholders throughout the Project lifecycle. The key principles guiding PAA Project Finance’s approach to stakeholder engagement on this Project are:
To be open and transparent with stakeholders.
To be accountable and willing to accept responsibility as a corporate citizen and to account for impacts associated with the Project activities.
To have a relationship with stakeholders that is based on trust and a mutual commitment to acting in good faith.
To respect stakeholders’ interests, opinions and aspirations.
To work collaboratively and cooperatively with stakeholders to find solutions that meet common interests.
To be responsive and to coherently respond in good time to stakeholders.
To be pro-active and to act in anticipation of the need for information or potential issues.
To engage with stakeholders such that they feel they are treated fairly and their issues and concerns are afforded fair consideration.
To be accessible and within reach of stakeholders so that they feel heard and to provide comprehensive information.
To be inclusive and proactively anticipate, identify and include all stakeholders.
The SAG is the owner of the Irrigation System Project, where PAA Project Finance was contracted by the SAG in order to design the irrigation system, provide the equipment and collaborate with the SAG and the Project Implementation Unit (PIU) in the installation of the irrigation equipment in the selected plots.
1.6 OBJECTIVES
The main objectives of the development and implementation of the SEP for the Project are outlined in Table 1.1 below.
Table 1.1 Objectives of the Project Stakeholder Engagement Plan
Objective Rationale Identify relevant stakeholders for this Project.
Identify and categorise individuals or organisations that may be affected by the Project or have an effect on how the Project is implemented, noting that this is an ongoing process which many change throughout the life of the Project.
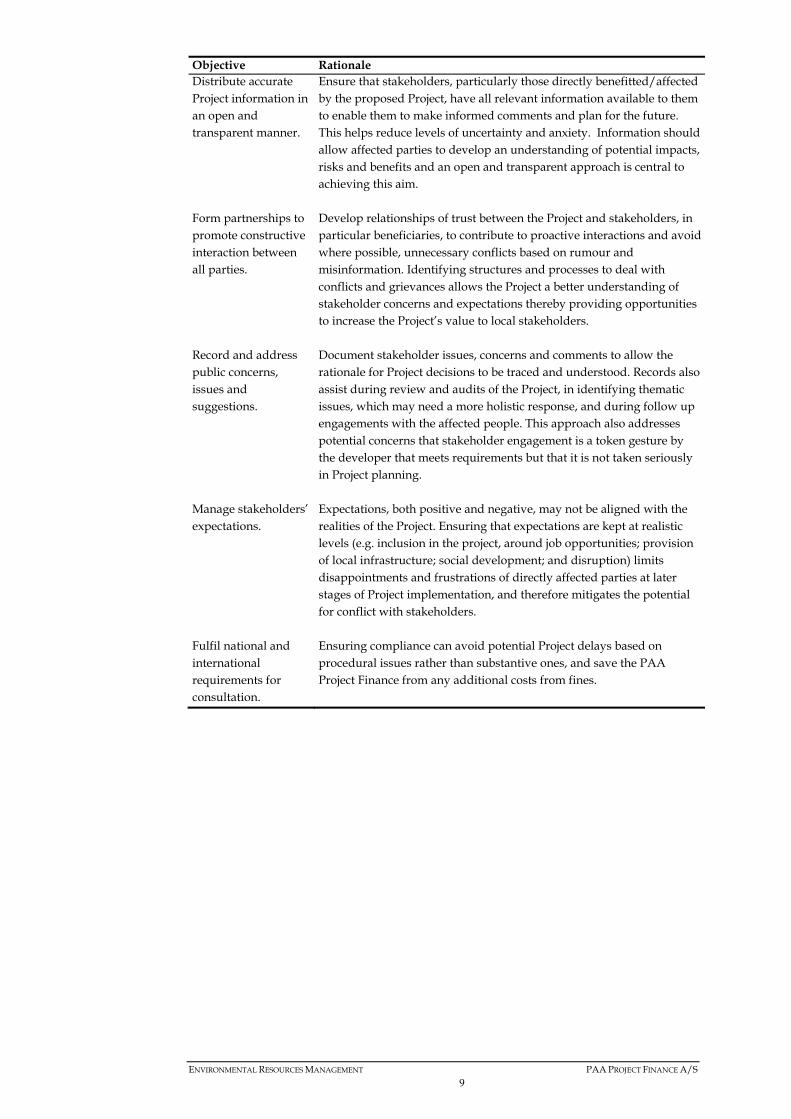
ENVIRONMENTAL RESOURCES MANAGEMENT PAA PROJECT FINANCE A/S 9
Objective Rationale Distribute accurate Project information in an open and transparent manner.
Ensure that stakeholders, particularly those directly benefitted/affected by the proposed Project, have all relevant information available to them to enable them to make informed comments and plan for the future. This helps reduce levels of uncertainty and anxiety. Information should allow affected parties to develop an understanding of potential impacts, risks and benefits and an open and transparent approach is central to achieving this aim.
Form partnerships to promote constructive interaction between all parties.
Develop relationships of trust between the Project and stakeholders, in particular beneficiaries, to contribute to proactive interactions and avoid where possible, unnecessary conflicts based on rumour and misinformation. Identifying structures and processes to deal with conflicts and grievances allows the Project a better understanding of stakeholder concerns and expectations thereby providing opportunities to increase the Project’s value to local stakeholders.
Record and address public concerns, issues and suggestions.
Document stakeholder issues, concerns and comments to allow the rationale for Project decisions to be traced and understood. Records also assist during review and audits of the Project, in identifying thematic issues, which may need a more holistic response, and during follow up engagements with the affected people. This approach also addresses potential concerns that stakeholder engagement is a token gesture by the developer that meets requirements but that it is not taken seriously in Project planning.
Manage stakeholders’ expectations.
Expectations, both positive and negative, may not be aligned with the realities of the Project. Ensuring that expectations are kept at realistic levels (e.g. inclusion in the project, around job opportunities; provision of local infrastructure; social development; and disruption) limits disappointments and frustrations of directly affected parties at later stages of Project implementation, and therefore mitigates the potential for conflict with stakeholders.
Fulfil national and international requirements for consultation.
Ensuring compliance can avoid potential Project delays based on procedural issues rather than substantive ones, and save the PAA Project Finance from any additional costs from fines.

ENVIRONMENTAL RESOURCES MANAGEMENT PAA PROJECT FINANCE A/S 10
2 REGULATIONS AND REQUIREMENTS
2.1 PAA PROJECT FINANCE CSR STANDARDS
In 2007, The Aarsleff Group acquired PAA Project Finance (formerly called EAC Trading) as a fully owned subsidiary. PAA Project Finance services are rendered internally within the Aarsleff Group as well as to customers and partners in a global environment. For this reason, PAA Project Finance policies and corporate social responsibility standards comply with those of the Aarsleff Group. In addition, PAA Project Finance applies OHSAS 18001 – Occupational health and safety management standards, DS/ISO 9001 – Quality management standards, and DS/ISO 14001 – Environmental management standards whenever these are relevant to their services and customers. The Aarsleff Group currently works on identifying the CSR matters that are most important to the Group and its stakeholders. The Group takes responsibility for its business activities and wants to ensure positive and clear coherence between the activities of the Group and a sustainable society. The four main strategic areas of the Group are:
2.1.1 Environment and climate
The Aarsleff Group has incorporated a number of policies, principles and working methods to protect the environment on a short- and long-term basis. One of the relevant policies is the environmental policy, which describes the Group’s awareness of their influence on the environment and how it works to protect it and prevent pollution. The Aarsleff Group is committed to minimising their environmental impact through planning, design, and choice of method. The Group measures significant environmental parameters and seeks to minimise waste and excessive consumption of materials. The environmental policy covers issues such as fuel efficiency, energy-saving measures, and purchasing products from environmentally friendly companies. Furthermore, the Aarsleff Group’s quality, environment and occupational health and safety management system (QE&OHS) provides guidelines for environmentally responsible actions and operating procedures.
ENVIRONMENTAL RESOURCES MANAGEMENT PAA PROJECT FINANCE A/S 11
2.1.2 Employees
The Aarsleff Group has been certified in occupational health and safety since 2009. To achieve its goals, it has developed a number of policies, principles and working methods all incorporated into everyday work routines. The Group’s occupational health and safety policy shows that it wants to offer attractive workplaces with a focus on occupational health and safety, job satisfaction, and lifelong development. The Aarsleff Group has already incorporated OHS aspects in the design phase and method selection; prioritising order, tidiness, and a systematic fitting out of the workplaces; and the Group continuously improves its occupational health and safety measures. Aarsleff’s One Company approach and Code of Conduct are the cornerstones for its code of good management. The OHS policy states that the Group wants a sound and stimulating working environment that enhances job satisfaction.
2.1.3 Society
The Aarsleff Group wishes to contribute to a sound, democratic, and competitive development of society. The Group aspires to comply with applicable competition legislation and oppose all types of corruption, including blackmail and bribery. It has developed a guideline for compliance with competition legislation providing information on the prohibition of agreements or the exchange of information that coordinates tenders or splits up markets or customers. As stated in its policy on respect for human rights, the Aarsleff Group wishes to avoid negative impacts on human rights, and it actively manages any negative impacts it may have caused or contributed to. The Group’s approach is based on the UN Guiding Principles for Business and Human Rights. Actively entering into applicable collective agreements is a fundamental principle of the Aarsleff Group, and it does everything possible to counteract social dumping.
2.1.4 External business partners
As stated in the Aarsleff Group quality policy, it complies with legislation, rules and agreements entered into, and customer satisfaction is an important quality parameter. It is committed to engaging in professional collaboration, making customer satisfaction a high priority. Planning and preparation are essential to the Group, and it continuously seeks to improve through systematic control. In addition it deliberately seeks to cultivate a culture of improvement that allows experience and creativity to be communicated and applied.

ENVIRONMENTAL RESOURCES MANAGEMENT PAA PROJECT FINANCE A/S 12
The Aarsleff Group has defined a set of principles applying to “Activities with customers and business partners” that provides specific rules concerning gifts, lunches, dinners, study trips, and training courses. Actively creating collaborations and good stakeholder relations on projects is a fundamental principle of the Aarsleff Group, as this benefits project implementation and increases stakeholder satisfaction.
2.1.5 Equality
Aarsleff Group believes that equality helps generate better results, wiser decisions, increased innovation ability, an improved internal working environment, and make the Group an attractive employer.
2.2 HONDURAS REGULATIONS
With the aim of assuring the regulation compliance, an official letter request was sent to MiAmbiente, to receive confirmation of the environmental licensing requirements for the Project. In this regard, according the environmental regulation in Honduras (Ministerial Agreement 016-2015, published in the Gazette on 6.10.2015) the Project does not require undergoing Environmental and Social Impact Assessment (ESIA). The two main regulations relevant to the Project, which require stakeholder engagement, include the following: Public Participation in the Environmental Assessment (Decree No. 800-2015) Public participation in the environmental evaluation is regulated by Executive Decree nº008-2015, in force since September 14th, 2015 (Chapter VII: Elements of the Environmental Assessment and Control Process) which declares the following: Art. 58: MIAMBIENTE will promote the participation of the general public
during the environmental evaluation process, in all its phases, for any projects, work, or activities considered significant from the environmental point of view, according to the Principles of Proportionality and Gradualness.
Art. 59: The proponent of the project, work, or activity subject to environmental assessment, in accordance with the terms of reference established by MIAMBIENTE, must involve the neighbouring population of the project area at the earliest possible stage of the ESIA preparation process.
However, as the Project requires no environmental licensing, no public participation is required. General Water Act (Decree nº181-2009)
ENVIRONMENTAL RESOURCES MANAGEMENT PAA PROJECT FINANCE A/S 13
The General Water Act states that: Art.3: Citizen participation will be effective in the planning of water
management, use, protection, and conservation. This Act is described in detail in the following subsection Water Resource (Decree 181-2009) Article 3 of the General Water Act, Decree nº181-2009, in force since December 14th, 2009, declares the principles and foundations of water management. These include the following:
Water is an essential resource for life, as well as social and economic development. Its protection and conservation constitute a priority action of the State.
Human consumption has a preferential and privileged relationship over other uses.
Water is a social resource, and its access will be equitable. Citizen participation will be effective in the planning of its
management, use, protection, and conservation. The comprehensive management of the resource, linked to the water
cycle and the natural environment, will take place with the involvement and responsibility of all Government bodies, their organizations.
Remuneration for services will be linked to the use, protection, and conservation of water.
2.3 LENDERS REQUIREMENTS
2.3.1 IFC Performance Standards
The International Finance Corporation Performance Standards (IFC PS) on Environmental and Social Sustainability are considered a benchmark for good practice for environmental and social risk management in private sector developments. The IFC PSs require that clients engage affected communities through disclosure of information, consultation, and informed participation, in a manner commensurate with the risks to and impacts of the Project on the affected communities. The IFC PSs include specific guidance on conducting stakeholder engagement both during the planning phase and through the project lifecycle. Stakeholder engagement requirements are outlined in PS1: Assessment and Management of Environmental and Social Risks and Impacts. The key requirements for consultation and disclosure through the life of the project are summarised in Box 2.1.

ENVIRONMENTAL RESOURCES MANAGEMENT PAA PROJECT FINANCE A/S 14
Box 2.1 Outline of IFC Performance Standard 1
Source: ERM 2018
The IFC PSs also have stakeholder engagement and consultation requirements to manage specific impacts as described in the following PSs and presented in more detail in Table 2.1:
Stakeholder Analysis and Engagement Planning
Stakeholder engagement is an on-going process that may involve, in varying degrees, the following elements: stakeholder analysis and planning, disclosure and dissemination of information, consultation and participation, grievance mechanism, and on-going reporting to Affected Stakeholders.
Disclosure of Relevant Project Information
Provide affected stakeholders with access to relevant information on: (i) the purpose, nature, and scale of the project; (ii) the duration of proposed project activities; (iii) any risks to and potential impacts on such stakeholders and relevant mitigation measures; (iv) the envisaged stakeholder engagement process; and (v) the grievance mechanism.
Consultation
Consultation will be in line with the degree of impact of the Project and should: i) begin early and continue through project, ii) be based on prior disclosure of relevant and easily accessible information on the project, iii) focus engagement on those who are directly affected, iv) be free of outside interference and external manipulation, v) enable meaningful participation, vi) be documented.
Informed Consultation and Participation
For projects with potentially significant adverse impacts on affected stakeholders, conduct an informed consultation and participation process. It should involve deep exchange of views and information, and an organized and iterative consultation, leading to the project incorporating into their decision-making process the views of the affected stakeholders on matters that affect them directly, such as the proposed mitigation measures, the sharing of development benefits and opportunities, and implementation issues. The process should be documented, in particular the measures taken to avoid or minimize risks to and adverse impacts on the affected stakeholders. The stakeholders should be informed about how their concerns have been considered.
External Communications
Implement and maintain a procedure for external communications that includes methods to (i) receive and register external communications from the public; (ii) screen and assess the issues raised and determine how to address them; (iii) provide, track, and document responses, if any; and (iv) adjust the management program, as appropriate. In addition, clients are encouraged to make publicly available periodic reports on their environmental and social sustainability.
Grievance Mechanism for Affected Stakeholders
Establish a grievance mechanism to receive and facilitate resolution of affected stakeholders’ concerns and grievances about the client’s environmental and social performance.
On-going Reporting to Affected Stakeholders
Provide periodic reports to the affected stakeholders that describe progress with implementation of the project Action Plans on issues that involve on-going risk to or impacts on affected stakeholders and on issues that the consultation process or grievance mechanism have identified as a concern to those stakeholders. The Performance Standards require that after completion of an environmental assessment the consultation and disclosure must continue throughout the life cycle (construction and operation phase) of the project.

ENVIRONMENTAL RESOURCES MANAGEMENT PAA PROJECT FINANCE A/S 15
IFC PS2: Labour and Working Conditions;
IFC PS3: Resource Efficiency and Pollution Prevention;
IFC PS4: Community Health, Safety and Security;
IFC PS6: Biodiversity Conservation and Sustainable Natural Resource Management; and
IFC PS8: Cultural Heritage. IFC PS 5 on Land Acquisition and Involuntary Resettlement requires prior, informed and inclusive engagement with affected persons. However, this Project does not require any land acquisition since irrigation equipment will be installed in agricultural plots property of the beneficiaries and no economic or physical displacement is envisaged. As such IFC PS5 was not triggered and engagement related to resettlement is not covered in this SEP. PS7 on Indigenous People also includes requirements for engagement where indigenous people are impacted by Projects. However, as indigenous people are not found within the Project area this is not considered in this SEP.
Table 2.1 Other Relevant IFC Performance Standards
Standard Key Components PS2: Labour and Working Conditions
Recognises that the pursuit of economic growth through employment creation and income generation should be balanced with the protection of basic rights for workers. Acknowledges that constructive worker-management relationship and safe and healthy working conditions may enhance the efficiency and productivity of operations. As such, requires engagement between projects and their workers including mechanisms for workers to report grievances.
PS3: Resource Efficiency and Pollution Prevention
Recognizes that increased economic activity and urbanization often generate increased levels of pollution to air, water, and land and consume finite resources in a manner that may threaten people and the environment at the local, regional, and global levels
PS 4: Community Health, Safety & Security
Recognizes that project activities, equipment and infrastructure bring benefits to communities including employment, services and opportunities for economic development. However, the project can also increase the potential for community exposure to risks from development. Where project activities pose risks of adverse impacts on the health, safety and security of affected communities the developer is required to make available relevant information (including the details of an Action Plan), in an appropriate form, to affected parties and government authorities so that they can fully understand the nature and extent of the risks.

ENVIRONMENTAL RESOURCES MANAGEMENT PAA PROJECT FINANCE A/S 16
PS 6: Biodiversity Conservation and Sustainable Natural Resource Management
Recognises that protecting and conserving biodiversity in all its forms is fundamental to sustainable development. Where the project has potential impacts on legally protected or critical habitats consultation with relevant authorities, specialists and communities must be undertaken.
PS8: Cultural Heritage Recognises the importance of cultural heritage for current and future generations and is consistent with the convention concerning the protection of the world’s cultural and natural heritage. Where sites of cultural heritage are potentially impacted by the project the developer will consult with local communities as well as relevant national authorities responsible for the maintenance of such sites.
Source: ERM 2018
2.3.2 Good Practice
In addition to the requirements of the IFC PSs, the Project has adopted certain good practices such as accessibility to information (through the use of oral and visual methods), and respect of local traditions.

ENVIRONMENTAL RESOURCES MANAGEMENT PAA PROJECT FINANCE A/S 17
3 SUMMARY OF PREVIOUS STAKEHOLDER ENGAGEMENTS
3.1 INTRODUCTION
Stakeholder consultations for the Project began during Project planning phase in 2017 and has been continuous through the feasibility studies, Environmental and Social Impact Assessment (ESIA) update including field visit for new engagement with key stakeholders conducted in June 2018. Engagement as part of the project development and ESIA process for lenders was conducted between 2016 and 2018. Initial consultations took place with the Government ministries and departments, the interested farmers, the Local Administration Authorities as well as social institutions in the area. Both public and private stakeholders were included in the engagement process, which was undertaken in 2017.
3.2 ENGAGEMENT ACTIVITIES DURING ESIA FOR LENDERS PREPARATION (2017)
Stakeholder engagement activities during ESIA preparation in 2017 consisted on the following:
Continuous engagement with the Secretary of Agriculture and Livestock (SAG).
Face to face meetings with the relevant Government Ministries and Institutions such as MiAmbiente (Secretariat of State in the Office of Energy, Natural Resources, the Environment and Mining), MiAmbiente-DECA (Directorate General of Environmental Assessment and Control of MiAmbiente); MiAmbiente Water Authority and, ICF (Institute of Forest Conservation).
Discussions and social interaction with the Local Administration Authorities and Municipalities: Environmental Department of the Municipality of Olanchito and, UMA (Municipal Environmental Unit).
Assembly-type meeting with representatives of livestock and milk producers: SAGO (Farmers’ and Stockbreeders’ Society of Olanchito), FENAGH (National Farmers’ and Stockbreeders’ Federation of Honduras) and, CREL (Milk Collection Centre).
Discussions and visits to local farmers interested in becoming Project beneficiaries of the proposed irrigation Project. The assessment included a survey of potential interested farmers in becoming Project beneficiaries (see further details below).
Meetings with Water Board Representatives: Association of Water Boards and Well Drilling technician
Focus group discussions with community members and members of the general public in the Project Area of Influence.
Meetings with local NGOs and key informants in particular ASIDE (Asociación de Investigación para el Desarrollo Ecológico y Socioeconómico).

ENVIRONMENTAL RESOURCES MANAGEMENT PAA PROJECT FINANCE A/S 18
In particular, a personalised communication approach was established with the key representatives of the CRELS, the leaders of the National Farmers’ and Stockbreeders’ Federation of Honduras (FENAGH) and the Olanchito Stockbreeders’ Society (SAGO), and the Mayor of Olanchito and Arenal. During the preliminary survey conducted by CINSA & PAA Project Finance in 2017, a sample of 301 out of approximately 350 SAGO livestock breeders and milk producers were visited and interviewed, which represents 86% of the current estimated population of livestock breeders and milk producers. The preliminary survey included 47 women, and 52 independent producers who do not belong to any CREL (of which 8 women). As such, the information collected through this process is considered representative of the total livestock and milk producer population in the area. Most producers are located in the municipality of Olanchito (91%) and a few are located in the municipalities of El Arenal (8%) and Jocon (1%). Irrigated land will be evenly distributed across the Project Area.4
Throughout the project promotion stage, the local press was called for a conference to explain the project benefits and selection criteria. This included a written booklet of the project benefits, the responsibilities, the selection criteria and the application procedure. These project promotion meetings were held at the SAGO. Table 3.1 below outlines the exchange with the Honduras State Institutions as part of the ESIA process initiated in 2017:
Table 3.1 Stakeholder Consultation Summary (2017)
Stakeholder Date Discussion Topics Exchange with the Honduras State Institutions MiAmbiente 27.11.2017 Project classification. Letter number:
SAG.939-2017 MiAmbiente – Water Resources 16.11.2017 Water contract application
21.11.2017 Registration of wells in Alto Aguan, progress with the formation of the water authority
ICF central offices n/a Protected areas ICF office in Tocoa (Interview Karina Turcios)
10.11.2017 Prevention measures in the lands adjacent to the Honduran Emerald Hummingbird Wildlife Refuge
Socialisation of the Project with the Co-manager of the Wildlife Refuge ASIDE –Hummingbird Wildlife Refuge (Interview José Luis Ramos)
Presentation of the Project and receipt of comments
Socialisation with Municipalities Environment Department of the Municipality of Olanchito (Interview Ramón Rosa)
10.11.2017 Project classification
Socialisation with Water Board Representatives Association of Water Boards (Interview Ricardo Cruz)
8.11.2017 Water board activities and water availability
Well drilling technician (Braulio Pastor)
9.11.2017 Location of wells and their capacity
Socialisation with Milk Producers
4 A map showing the even distribution of irrigated land is presented in Chapter 3 of the ESIA.

ENVIRONMENTAL RESOURCES MANAGEMENT PAA PROJECT FINANCE A/S 19
Stakeholder Date Discussion Topics National Farmers’ and Stockbreeders’ Federation of Honduras (FENAGH) / Farmers’ and Stockbreeders’ Society of Olanchito (SAGO) -
7.11.2017 Assembly-type meeting- Presentation of the irrigation Project, exchange of opinions
8.11.2017 Visit to the following farms: Rogelio Cruz in Ocotes Altos; Rony Rogelio Núñez; Estuary of the Aguan River, Milton Puerto; Juan José Molina in Rancho Don Juan (before Villa Sara); Farm Santa Rosa, José Antonio Salas; Milton Munguía, Calpules; Hacienda La Flor – Santa Bárbara
CREL – Milk Collection Centre 7.11.2017 Discussion on equipment for the CREL 8.11.2017 Visit to the following farms - Cruz Nuñez &
Asociados; Leopoldo Durán Dueñas; Mejía Rodríguez Potrero; Bustillo – Martínez, Lijia Elizabeth Bustillo, Juan Bustillo
Source: PAA & CINSA 2017
See Annex B.1 for more details and evidence of engagement activities in 2017.
3.3 ENGAGEMENT ACTIVITIES DURING ESIA UPDATE PREPARATION (2018)
In the field visit performed in June 2018 as part of the ESIA update process, additional engagement meetings have been conducted to fill data gaps and reconfirm assessment of impacts. The following activities were undertaken:
Introduction to the project, review of field survey planning, definition of the selection criteria for potential beneficiaries and fees, technical aspects of the project, baseline conditions and training to beneficiaries with members of the core team: the SAG Subdirector and Engineer, SAG Olanchito, PAA Project Finance and Integra Ingeniería representatives, an environmental expert from CINSA and an ERM consultant.
Meeting with SAG and SAGO representatives to confirm SAGO organization, requirements to join, profile of members, crops and production issues, working conditions, water management and land tenure.
Discussions with CRELs and SAG regarding to management of a CREL, their organization and requirements to join.
Consultation with Municipality of Olanchito and El Arenal with member of the core team about the project introduction to the members of the municipality, water and wastewater management in the municipality.
Discussion between SENASA and the core team concerning the use and management of chemical products in the agriculture and livestock sector.
Focus groups with small farmers and visit/interview to local farms for confirmation of farm/water management, land tenure, among others.
Meeting with INA (Agrarian National Institute) to review the management of Cajas Rurales.
General visit to the project arena for habitats observation.
Meetings with Olanchito Hospital representatives to review health condition in the Project Area.
Interview with Indigenous workers regarding location, socioeconomic profile, working conditions, conflict assessment, etc.

ENVIRONMENTAL RESOURCES MANAGEMENT PAA PROJECT FINANCE A/S 20
Dialogue with AJAASPIB (Water Boards Management Systems Association of the South Sector of Pico Bonito National Park) with regard to water management.
Discussion with ASIDE and ICF related to protected areas management.
See Annex B.2 for more details of engagement activities in 2018.

ENVIRONMENTAL RESOURCES MANAGEMENT PAA PROJECT FINANCE A/S 21
4 PROJECT STAKEHOLDERS
4.1 STAKEHOLDER IDENTIFICATION
Stakeholder identification began at Project inception and planning and has continued through the various stages of the project development. Stakeholders identified to date represent the organisations and individuals who may be directly or indirectly (positively or negatively) affected by the Project or who may have an effect on how the Project is implemented. Stakeholders identified for inclusion in engagement activities meet one of the following criteria:
have an interest in the Project;
would potentially be impacted by or have an influence on the Project (negatively or positively); and/or,
could provide commentary on issues and concerns related to the Project. Identified stakeholders can be summarized as follows: Primary Stakeholders: Those directly affected or benefitted by the Project
such as milk and livestock producers, farm workers and nearby communities to beneficiary farms, including members of the public, vulnerable and various institutions.
Secondary Stakeholders: Those indirectly affected by the Project but who will influence the Project implementation. These include the responsible agencies, National Government Agencies, Government ministries, National Associations and Federations, Regional Federations, National Regulatory bodies, Traditional Authorities / Local Government, technical departments, and Local administration.
Stakeholders were categorised, based on their various needs, interests, and potential influence on the Project.

ENVIRONMENTAL RESOURCES MANAGEMENT PAA PROJECT FINANCE A/S
22
Table 4.1 Stakeholder Category List
Stakeholder
Category Stakeholder Group Connection to the Project Stakeholders
Internal Stakeholders
Project Owner Equipment Provider Consultants
Approves the design, provides resources, approves applications, delivers equipment, trains, and monitors; Commercial Agreement
Project Owner / Leader: Secretary of Agriculture and Livestock of Honduras (Secretaría de
Agricultura y Ganadería or SAG)
Equipment Provider: - PAA Project Finance
Engineers and Advisors: Integra Ingeniería CINSA en Ingeniería S.A. (Honduran Engineering Consulting
Company) Environmental Resource Management (ERM)
Implementing Partners
National Government agencies
Collaboration agreements with other government bodies; Budget management; Surveillance and communication and engagement with local population; Reforestation Plan
SAG Irrigation Department, Project Implementation Unit (PIU) (Unidad Ejecutora del Proyecto – UEP)
- SAG Olanchito - Finances Secretary (Secretaría de Finanzas – SEFIN)
Financial Institution
Lender Loan agreement and funding ING Bank, and EKF’s Denmark Export Credit Agency
Project Partners (External)
National associations and federations
Regional associations University and research
centers
Formal, legal and functional organizations with credibility in the area and experience in other project implementations. CRELs have been consulted and involved during the project design and diverse studies so far. Collaboration agreement.
- Honduran National Farmer’s and Stockbreeders’ Federation (Federación Nacional de Agricultores y Ganadores de Honduras - FENAGH)
- Olanchito Farmers and Stockbreeders’s Society (Sociedad de Agricultores y Ganaderos de Olanchito - SAGO)
- National Agrarian Institute (Instituto Nacional Agrario – INA) - Fund for Agricultural Development (Fondo Internacional de Desarrollo
Agrícola - FIDA) - Honduras Land Administration Program (Programa de Administración de
Tierras de Honduras – PATH - Regional University Center of Aguan Valley (Centro Universitario Regional
del Valle Aguan - CURVA) of the National Autonomous University of Honduras (Universidad National Autonoma de Honduras - UNAH)
- Centers for the collection and cooling of milk (Centro de Recoleccion y Enfríamiento de Leche - CREL)
National Government
National Regulatory bodies
National Government are of primary national political importance throughout all stages of the Project life cycle, in charge of licensing, granting permits/authorizations for the
- MiAmbiente – DECA General Directorate of Environmental Assessment and Control of MIAMBIENTE (Dirección General de Evaluación y Control Ambiental de la MiAmbiente-DECA)
- MiAmbiente – Water Authority

ENVIRONMENTAL RESOURCES MANAGEMENT PAA PROJECT FINANCE A/S
23
Stakeholder Category
Stakeholder Group Connection to the Project Stakeholders
Project; monitoring and enforcing compliance with Honduran Law. The ICF is the National Institute that ensures the forest cover and suitable forest management, declares protected natural areas and grants permits to cut down trees and issuing compensation measures.
- Institute for Forestry Conservation and Development (Instituto de Conservación y Desarollo Forestal - ICF)
- Ministry of Health - Property Institute (Instituto de la Propiedad – IP) - Honduran Institute of Anthropology and History (Instituto Hondureño de
Antropología e Historia – IHAH) - National Council of Potable Water and Sanitation (Consejo Nacional de
Agua Potable y Saneamiento - CONASA) - State Secretariat for Indigenous and Afrohonduran Peoples (Secretaría de
Estado de Pueblo Indígenas y Afrohondureños – SEDINAFROH - Secretariat of Labour / Social Security Institution
Municipal Government
Municipal Authorities and Government bodies
Regional and local government are responsible for implementation of legislation, and development plans and policies at the Regional and Local levels. Municipal corporations are elected by residents and are also responsible for granting permits to the farms as well as water extraction permits. Municipal environmental units typically have low technical capacity level. They are involved in the monitoring of the fulfilment of the environmental control measures.
Olanchito and El Arenal Municipal corporation headed by the Mayor (Alcalde)
Municipal Environmental Unit (Unidades Municipales de Ambiente – UMA) Department of Human Resources (Employment) Municipal Administration (Administración municipal)
- Urban Areas: Boards of Trustees (Consejos de Administración) - Rural Areas (both aldeas and caseríos) governed by an Assistant
Mayor (Alcalde Auxiliar) and Alternate selected in a communal assembly and appointed by the Municipal Administration
- The Municipal Administration’s Governance and Transparency Department (previously referred to as Community Development Department)
Municipal Water and Sanitation Commission (Comisión Municipal de Agua Potable y Saneameinto - COMAS)
Municipal representative of the Honduran Society of Administrative Boards of Water Systems (Asociación Hondureña de Juntas Administradoras de Sistemas de Agua - AHJASA)
Health Centers - In the Municipality of Olanchito 2 Health Centers with permanent
doctor (Centro de Salud con Médico Permanente - CESAMO) - In the Municipality of Arenal: 1 CESAMO and 2 Health centers only
with assistants (Centro de Salud con Auxiliares – CESAR) Project Potential Beneficiaries
Selected livestock and milk producers
Farm workers
Livestock and milk producer with no or up to extensive experience in irrigation. Interests and expectations lie in improving economic income, reducing vulnerability to drought and improving income stability. Getting benefits from the project.
- Potential Beneficiaries of the project: 350-400 livestock and milk producers present in the Project Area
members of SAGO (grouped into CRELs or independent) There are 16 CRELs in the Project Area: Andino Munguía; Armín;
Jerónimo Figueroa; Bustillo Martínez; Cárcamo Martínez; CRELCA; Cruz Nuñez; Fabricio Puerto; Heberto Chirinos Ponce; Leopoldo Duran Dueñas; Martinez Hernández; Martínez Lobo; Mejía

ENVIRONMENTAL RESOURCES MANAGEMENT PAA PROJECT FINANCE A/S
24
Stakeholder Category
Stakeholder Group Connection to the Project Stakeholders
Connection to the Project established by the Conditional Grant and the agreement established between SAG and the beneficiary.
Rodríguez; Puerto Lozano; Salinas Gonzales; Salvador Figueroa; and Superación
Potentially affected stakeholders
Landowners and farm workers in the area
Residents / other water users Water boards (resident
associations) Downstream communities5
Users of water for human consumption and livestock and agriculture. No direct participation in decision-making. Representative participation via water boards, associations and municipal corporations.
61 Hamlets (aldeas) and 147 settlements (caseríos) in the Project Area Hamlets (“Aldeas”) located downstream of Project Area Landowners and farm workers not selected as beneficiaries Residents or other water users Water Administration Boards (Juntas Administradoras de Agua - JAAS)
in each hamlet (aldea)
Vulnerable and Indigenous Persons/Groups
Vulnerable groups within the Project Area
Vulnerable groups may be affected by the Project by virtue of their physical disability, social or economic standing, limited education, lack of employment or access to land. No indigenous communities are found within the Project Area, nonetheless indigenous individuals live among non-indigenous communities representing a small percentage of the population who are employed in farms of potential Project beneficiaries. These indigenous individuals are employed in livestock and milk production farms and/or reportedly intermarried. Furthermore, the Project Area is located downstream from indigenous settlements, with little interference to soil and water resources located upstream. Appropriate engagement practices and tools will be adopted to ensure adequate access to information and participation.
Vulnerable people within the hamlets in the Project Area: 6 Beneficiaries with limited financing capacity (low income and
reduced access to savings or credit) Very small producers (potential beneficiaries) Small-scale subsistence farmers (non-beneficiaries) with lower
incomes and reduced access to savings or credit Potential female landowner beneficiaries (approximately 50
individuals) and female-headed households Individuals or households where the household head is elderly or
disabled Individuals belonging to indigenous groups or of indigenous
background Unemployed youth Elderly and orphans
Representatives of Indigenous and Afro-descendant groups residing /working in the Project Area7 as part of non-indigenous communities:
Federation of Xicaque Tribes of Yoro (Federación del Tribu Xicaque de Yoro - FETRIXY)
Association of Indigenous Tolupan Communities of La Montaña de la Flor (Asociación de Comunidades Indígenas Tolúpanes de la Montaña de la Flor - Acitmfm)
5 The assessment of impacts presented in the ESIA have concluded that as potential impacts on groundwater levels downstream of the Project Area will be insignificant, related impacts on farmers and producers and indigenous land of the Garífuna tribe located downstream are also expected to be insignificant. As such these have been scoped out of the assessment. For further justification please refer to Chapters 6 and 7 in the ESIA.
6 A detailed assessment and definition of vulnerable groups is presented in Chapter 5- Baseline of the ESIA.
7 Some individuals of indigenous background live and work in the communities within the Project Area, however no ancestral land associated to indigenous communities have been identified. The individuals that live in the valley are intermarried and assimilated into the local society.

ENVIRONMENTAL RESOURCES MANAGEMENT PAA PROJECT FINANCE A/S
25
Stakeholder Category
Stakeholder Group Connection to the Project Stakeholders
Settlements where indigenous populations can be found in the Project Area includes the hamlets of Calderas located approximately 50 to 60 km West of Olanchito and in Agalteca neighbourhood 1km northeast of Olanchito town. Other settlements where indigenous households reside include El Aguacate, El Chorro, Carboneras, and El Aleman, with an average of 30 - 40 households composed of 3-4 members per community
Civil Society Community-Based Organisations (CBOs)
Local Associations Research and Academic
Institutions (national and local)
Organisations with direct interest in the Project, and its social and environmental aspects and that are able to influence the Project directly or through public opinion.
Such organisations may also have useful data and insight and may potentially become partners to the Project in areas of common interest such as the implementation of training programs, etc.
ASIDE co-manager of the Emerald Hummingbird Wildlife Refuge in Honduras (Refugio de Vida Silvestre Colibrí Esmeralda)
Alfalit in Honduras (literacy, community development, food safety) CARE-PASOS FUPNAPIB - Protection, Conservation and Responsible Use of Natural
Resources Present in Pico Bonito National Park CURVA University (see potential Project partners above) National Institute for Professional Training (Instituto Nacional de
Formación Profesional - INFOP) SAGO (see potential Project partners above) Milk Collection Centres (Centros de Recolección de Leche or CRELs) Olanchito Red Cross
Non-Governmental Organizations (NGOs)
International National Local
NGOs with direct interest in the Project (social and environmental aspects) with the ability to directly influence the project or through public opinion. NGOs could potentially become partners to the Project in areas of common interest.
NGO projects are coordinated through the National Agrarian Institute, SAG, and the Public Prosecutor’s Office.
International NGOs include organisations based within and outside Honduras with an interest in the Project. They include international NGOs, multilateral and bilateral organisations.
National and international NGOs present in the area: ASIDE (co-manager of the Emerald Hummingbird Wildlife Refuge in
Honduras) Alfalit in Honduras (literacy, community development, food safety) FUPNAPIB Other potential international NGOs and Pressure Groups: Human
Rights Watch, World Vision, IUCN, OXFAM, WWF, Food and Agriculture Organization - FAO
Other interest groups:
Media Private sector / multinational
companies Law enforcement
Multinational companies are economic actors with strong economic and political influence. Although they have no direct participation in the Project they have an interest in ensuring that the Project does not generate sanitary issues and problems of access to water that may disrupt their operations. The Dairy production sector also has a vested interest in modernising and stabilising milk production and supply and reducing prices through the Project. Law enforcement is responsible for maintaining security in the area.
Local and municipal media (radio, newspaper, TV) Banana plantations (DOLE) located in the Project Area and downstream Palm trees plantations located in the Project Area and downstream Dairy product producers (micro and large enterprises) Police and law enforcement in the area National Processing Companies: LEYDE, SULA, LECHOSA, SANPILES, Local artisanal cheese producers.
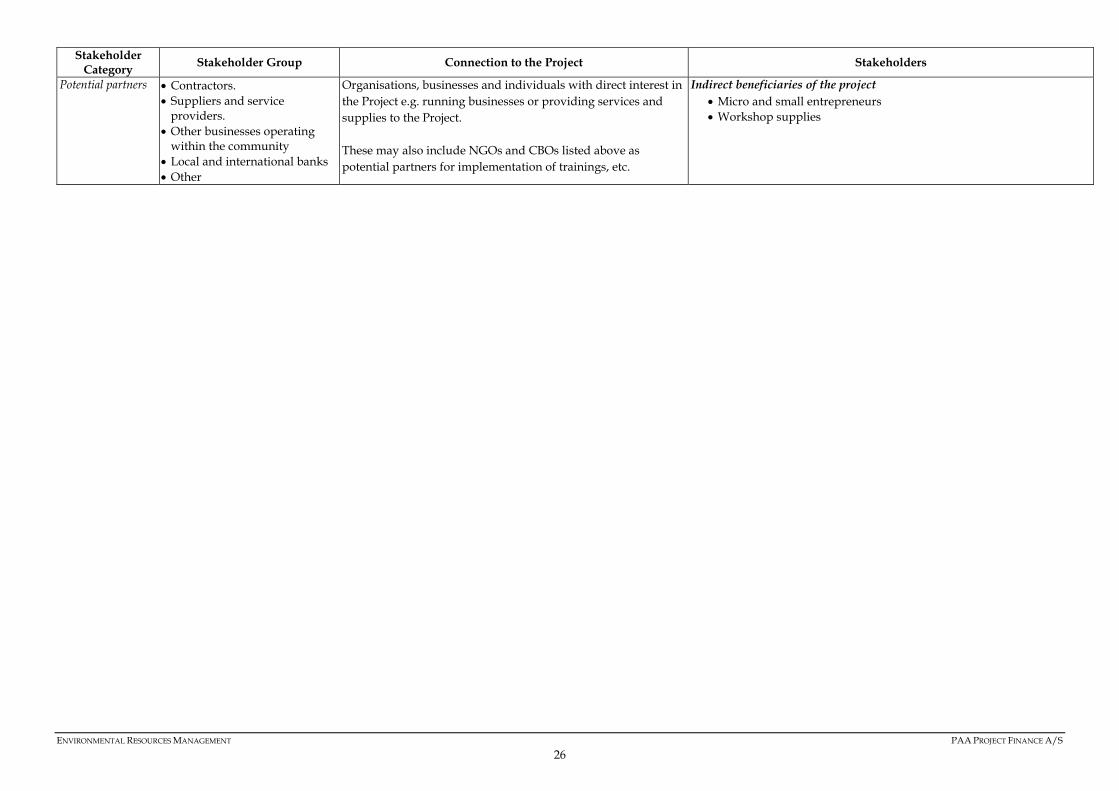
ENVIRONMENTAL RESOURCES MANAGEMENT PAA PROJECT FINANCE A/S
26
Stakeholder Category
Stakeholder Group Connection to the Project Stakeholders
Potential partners Contractors. Suppliers and service
providers. Other businesses operating
within the community Local and international banks Other
Organisations, businesses and individuals with direct interest in the Project e.g. running businesses or providing services and supplies to the Project. These may also include NGOs and CBOs listed above as potential partners for implementation of trainings, etc.
Indirect beneficiaries of the project Micro and small entrepreneurs Workshop supplies

ENVIRONMENTAL RESOURCES MANAGEMENT PAA PROJECT FINANCE A/S
27
4.2 STAKEHOLDER ANALYSIS AND PRIORITISATION
In order to clearly develop a systematic and effective means of engagement, stakeholders were mapped and their feedback analysed to understand their key issues, comments and concerns about the Project. To support the analysis of stakeholders and help develop an appropriate approach for engagement, the following additional information was recorded:
influence on the Project (high, medium, low); and
interest and impact in the Project (high, medium, low). Influence refers to the power that the stakeholders have in relation to decisions either taken by, or affecting the Project. This power may be in the form of stakeholders that have formal control over the decision-making process or it can be informal in the sense of protesting against, blocking or allowing Project operations to continue. It is also important to map those stakeholders whose interests determine them as stakeholders, i.e. may be directly involved with the Project or have something to either gain or lose because of Project implementation. Understanding stakeholder level of interest can help clarify the motivations of different actors and the ways in which they might be able to influence the Project. Impact refers to the consequences for the stakeholder of undertaking the Project in relation to their environment, socio-economic and cultural context. The level of impact also influences affected stakeholder’s interest in the Project; the higher the level of impact, the higher the interest in the way impacts are being addressed. It should be noted that the positions of stakeholders may change over time as the Project progresses and that the stakeholder map should be reviewed and updated as appropriate. In addition, any new stakeholders identified should be added into the map. Using the information, stakeholders have been mapped and graphically represented according to interest, influence and impact. Figure 4.1 below illustrates the outcome of the stakeholder mapping.
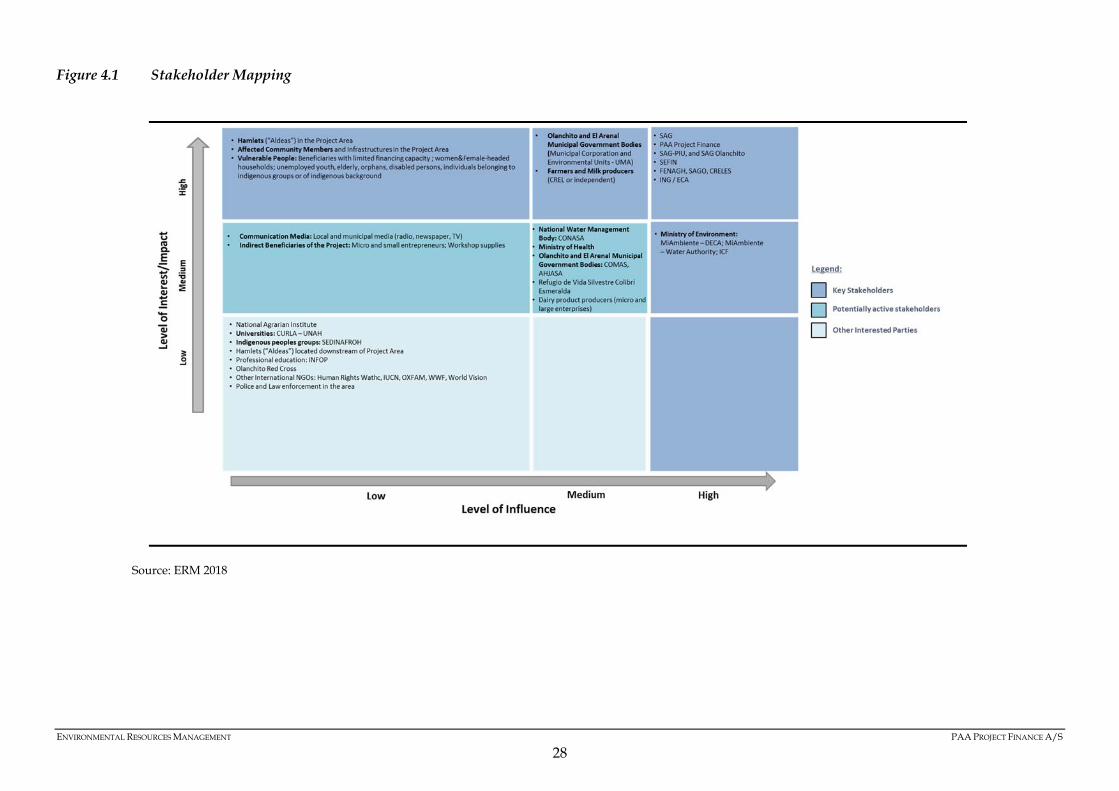
ENVIRONMENTAL RESOURCES MANAGEMENT PAA PROJECT FINANCE A/S
28
Figure 4.1 Stakeholder Mapping
Source: ERM 2018
ENVIRONMENTAL RESOURCES MANAGEMENT PAA PROJECT FINANCE A/S
29
Different levels of engagements will be proposed for different categories of stakeholders. This is primarily based on experience with similar projects and the analysis of the stakeholder consultation and engagement process since the Project began. Less intensive forms of engagement such as disseminating information may be adequate to keeping stakeholders informed about Project progress. However, solving the more systemic and deep-rooted challenges or major changes in Project activities requires more collaborative engagement as it has been the case so far.

ENVIRONMENTAL RESOURCES MANAGEMENT PAA PROJECT FINANCE A/S
30
5 STAKEHOLDER ENGAGEMENT PROGRAMME
5.1 OVERVIEW
The stakeholder engagement programme is designed to cover all phases of the Project. However, PAA Project Finance will hand over the Project to the SAG once the irrigation equipment is installed and the training for beneficiaries has been completed. During the operation phase PAA Project Finance’s responsibilities regarding the irrigation project will be limited to supplying spare parts. In this regard, all engagement activities during the operation will be managed and promoted by the Project Implementation Unit (PIU). The general objectives of stakeholder engagement under this SEP are as outlined in ¡Error! No se encuentra el origen de la referencia. below.

ENVIRONMENTAL RESOURCES MANAGEMENT PAA PROJECT FINANCE A/S
31
Figure 5.1 Stakeholder Engagement Objectives for Each Project Phase
Source: ERM 2018

ENVIRONMENTAL RESOURCES MANAGEMENT PAA PROJECT FINANCE A/S
32
Specific planning and engagement activities will be necessary at each Project phase; however, some activities will be ongoing throughout the entire Project cycle and therefore common to the different phases. Common activities include the following:
Regular update and revision of the stakeholder register including stakeholder analysis and re-evaluation as necessary throughout the different Project phases.
Addressing comments, questions, and grievances regularly and through appropriate channels, and issuing information to stakeholders. This includes regular refreshers to stakeholders about the Grievance Mechanism and related processes.
Regular reporting to the different stakeholders as appropriate (see Section 8.2).
Regular Project Monitoring reports. The following sections detail the planned engagements at each Project phase.
5.2 PRE-OPERATION PHASE ENGAGEMENT
5.2.1 Approach and Objectives
Establishment of the Project Implementation Unit (PIU)
The SAG will establish a Project Implementation Unit (PIU), formed by members of the SAG, and whose role will be to manage the Project during pre-operation phase and part of the operation phase. The PIU will be responsible to coordinate the beneficiary eligibility conditions approval programs, equipment delivery and user training for installation, user maintenance, environmental training and monitoring; using the existing technical and operational elements, in addition to delivering periodic reports on financial management. Usually formed by the following positions: Project Director, administrative manager, logistics manager, irrigation systems technician and agricultural consultant. SAG-PIU responsibilities are described in detail in Section 7.
The PIU will be established at the start of the pre-operation phase and located in the offices of the SAG in Olanchito. A cooperation agreement between PIU and SAGO (Olanchito Stockbreeders’ Society, which provides technical support to the CRELs) shall be established to implement the irrigation project. In this way, SAGO and the CRELs, key stakeholders in the agriculture and livestock sector in the Project Area, will also be involved in the project implementation.
ENVIRONMENTAL RESOURCES MANAGEMENT PAA PROJECT FINANCE A/S
33
Re-Engagement
Stakeholder engagement activities have taken place during the Project design and ESIA development process since 2014 in order to consult relevant stakeholders at all levels and collect their feedback (see Section 3.2). Some follow-up engagement activities have also taken place during the ESIA update process (see Section 3.3). To formalise these engagements, within the SEP framework, and ensure that all stakeholders have the same understanding (including selection criteria and socialisation of the grievance mechanism), a round of refresher engagement meetings will be undertaken during the pre-operation phase. The re-engagement activities are summarized in the next Section 5.2.2. It is noted that the re-engagement activities presented in the summary table should be led by the PIU with the support of PAA Project Finance. BA booklet summarizing information will have information on Project development activities and shared with stakeholders during engagement activities. Beneficiary Selection Process
The potential beneficiaries of the Aguan Irrigation Project have been estimated to be between 350-400 livestock and milk producers of the Alto Aguan River Valley, members of the SAGO; most of whom are also members of the 16 CRELs present in the Project Area. Once the Project starts, the milk producers will be able to reconfirm their interest to become potential beneficiaries. All applications will be then reviewed and the decision-making on the final beneficiaries of the irrigation system will be based on strict selection criteria. This selection process will be undertaken by the PIU of the SAG during the Pre-Operation phase. More details on the responsibilities and requirements of beneficiaries are included in Annex A to this report. It is envisaged that the SAG-PIU will regularly engage with potential beneficiaries to disseminate information and updates on the selection process. Site Presence and Regular Engagement with Beneficiaries
PAA Project Finance will undertake the following engagement actions during the equipment installation with the objective of maintaining the social license to operate:
PAA Project Finance will collaborate with the SAG-PIU to regular release information related to the equipment delivery and start-up, during the pre-operation phase. The irrigation system includes pumping units, water distribution and sprinkler systems, and accessories.
PAA Project Finance will collaborate with the SAG-PIU to inform and disseminate the requirements/criteria for beneficiary selection and the grievance mechanism developed by the SAG to all the potential beneficiaries.

ENVIRONMENTAL RESOURCES MANAGEMENT PAA PROJECT FINANCE A/S
34
PAA project Finance will collaborate with the SAG-PIU in the provision of information on potential Project benefits to non-beneficiary stakeholders including indigenous individuals living in settlements in the Project Area.
Update stakeholders and beneficiaries in particular on installation progress and schedule.
Address upon indication of the SAG-PIU any grievances in relation to installation of pumps, beneficiary selection and capacity building program.
Training of SAG technicians (“train the trainers”), enabling them to carry out training for the beneficiaries of the project, on the following aspects: o Installation of irrigation equipment and its accessories, use of irrigation
equipment. o Preservation and maintenance of irrigation equipment (motor pump,
irrigation cannons, etc.). o Agricultural consulting. o
Establish and Maintain Grievance Procedure
In addition to the information indicated in Table 5.1, the following actions will be included but not limited to:
PAA Project Finance through its local representative will collaborate with the PIU to inform and disseminate the grievance mechanism developed by the SAG.
PAA Project Finance through its local representative will collaborate with the PIU to keep a complaint register on site. The register will contain the contact details of the complainant and information regarding to the complaint itself and any measures or agreements made in resolution to such complaint.
PAA Project Finance will provide support to the PIU and SAG to install an adequate number of complaints/suggestion mailboxes at strategic points in Olanchito. For more detail related to grievance mechanism, please refer to Section 6.
5.2.2 Summary of Engagement Activities
The stakeholder engagement to be implemented during pre-operation phase is presented in Table 5.1 below.

ENVIRONMENTAL RESOURCES MANAGEMENT PAA PROJECT FINANCE A/S
35
Table 5.1 Stakeholder engagement activities during Pre-Operations
Activity Stakeholders Purpose Timeframe Responsible
Disclosure of relevant Project information to key institutional stakeholders
Honduras State Institutions, Municipality representatives Milk & livestock Producers
(FENAGH, SAGO, CREL) Water Board Representatives
such as: AJAASPIB, association of water boards, among others
Present the updated ESIA Present the Stakeholder Engagement Plan Updated Project schedule and activities Familiarize new identified stakeholder with the project Introduce Project´s Environmental and Social
management procedures Grievance mechanism
Early in the pre-operation phase
SAG-PIU supported by PAA Project Finance
Information update to key non-governmental stakeholders
NGOs Local associations Community Based
Organisations (CBOs) Research and Academic
Institutions (national and local) Indigenous associations
Foster understanding of the Project; Allay fears and avoid miscommunication. Obtain and maintain social licence to operate. Maintain regular contact and communication interaction
Regular SAG-PIU supported by PAA Project Finance
Provision of information to potential Project beneficiaries
Interested stockbreeder’s and milk producers affiliated to FENAGH, SAGO, CRELs
Reminder of SAG and PAA Project’s agreed requirements and criteria for beneficiary selection (Minimum requirements such as water sources availability/contract, making adequate use of the received material, complying with legal/environmental/social requirements and permits)
Confirmation of fees payment procedure (Benefit fee established by the SAG)
Presentation of grievance mechanism Timeframe for beneficiary selection
Early in the pre-operation phase
SAG-PIU supported by PAA Project Finance
Provision of information to selected beneficiaries regarding irrigation equipment provision and training program (regular updates)
Selected stockbreeder and milk producers beneficiaries
Information disclosure and participation process: Criteria for beneficiary selection (Minimum
requirements such as water sources availability/contract, making adequate use of the received material, complying with legal/environmental/social requirements and permits)
Fees payment procedure (Benefit fee established by the SAG)
Regular PAA Project Finance supported by SAG-PIU

ENVIRONMENTAL RESOURCES MANAGEMENT PAA PROJECT FINANCE A/S
36
Activity Stakeholders Purpose Timeframe Responsible
Local radio broadcasts will be used by the PIU to provide Project updates and information related to enrolment dates for trainings.
Provision of information regarding irrigation equipment installation (regular updates)
Selected stockbreeder’s beneficiaries
Update beneficiaries on installation progress and schedule through SAG webpage, notice board in SAG Olanchito
Regular PAA Project Finance collaborating with PIU for equipment installation
PAA Project Finance in-country representative in charge to ensure proper grievances management by PIU
PAA Project Finance train the trainers of SAG technicians, enabling them to carry out training for the beneficiaries of the project, on the following aspects: Installation of irrigation equipment and its
accessories, use of irrigation equipment Preservation and maintenance of irrigation
equipment (motor pump, irrigation cannons) Agricultural consulting
Selected stockbreeder’s beneficiaries SAG-Technical Support
Meetings – Project Presentation; focus groups discussions Regarding training of beneficiaries conducted by the SAG-PIU: notice boards, webpage, project leaflets, radio broadcast
PAA Project Finance
External Communications - Implement and maintain a procedure for external communications
NGOs / Co-manager of the Wildlife Refuge: ASIDE, Alfalit, CARE, FUPNAPIB and other international NGOs and pressure groups
Water Board Representatives Civil Society: CURLA of
UNAH; INFOP, SAGO Media, law enforcement, private sector / multinational companies
Distribution of booklet for the Application of the Project’s Environmental and Social Regulations and Procedures; notice boards; webpage, radio broadcast; regular reporting, grievance forms, iterative consultations These engagement tools include methods to: Receive and register external communications from the
public; Screen and assess the issues raised and determine how
to address them; Provide, track, and document responses, if any; and
SAG, PIU

ENVIRONMENTAL RESOURCES MANAGEMENT PAA PROJECT FINANCE A/S
37
Activity Stakeholders Purpose Timeframe Responsible
Adjust the management program, as appropriate. Grievance Mechanism for Affected Stakeholders- Establish a grievance mechanism to receive and facilitate resolution of affected stakeholders’ concerns and grievances
Honduras State Institutions Milk Producers (FENAGH,
SAGO, CREL) NGOs / Co-manager of the
Wildlife Refuge Water Board Representatives Excluded Project Candidates Potentially affected
stakeholders
Present the Project Community Grievance Mechanism and resolution and feedback to complainant Grievance forms that include: 1.Grievance Reception and Registration 2.Screening and Prioritization 3.Examination 4.Resolution and Response 5.Closure (Please refer to Section 6 for more detail)
PIU through its Grievance Officer, supported by PAA Project Finance in-country representative

ENVIRONMENTAL RESOURCES MANAGEMENT PAA PROJECT FINANCE A/S
38
5.3 OPERATIONS PHASE ENGAGEMENT
During the operation phase, PAA Project Finance assumes no responsibility for the operation process (water extraction and water irrigation), which consist of the actual function of the irrigation equipment. Engagement with Project beneficiaries and other key stakeholders will still be conducted by the PIU during early phases of the operation phase and later by the SAG directly. The engagement process will include:
The PIU will prepare regular reports to the SAG including a summary of stakeholder engagement activities and all grievances received and resolved.
The PIU will maintain updated the information in order to allow stakeholders to be informed about the educational offers, project and contact details and make available grievance forms.
Information will be released every two (2) months regarding the project’s progress.
5.3.1 Approach to engagement
Continued Stakeholder Engagement Management through the PIU
The PIU, in a proactive manner will commit to the following activities during operation phase:
Respond in an efficient and timely manner to beneficiaries needs, questions, request of information, feedback on project implementation (irrigation system/equipment installation, water supply, among others
Address any grievances
Sustain a peaceful working relationship with stakeholders; in particular other water users and relevant institutional stakeholders
Maintain information boards in the position (placed at the entrance to the SAG-PIU office and other location accessible to the communities), quantity, design and dimensions that are considered appropriate (For more information related to Stakeholder Engagement Tools see Table 5.2).
Request support from PAA Project Finance with regards to provision of technical support related to the irrigation equipment.
Maintain Grievance Procedure
The following actions will be included but not limited to:
PIU will continue to disseminate the grievance mechanism
PIU to keep the complaints/suggestion mailboxes in good condition to receive the grievances that arose from the community.

ENVIRONMENTAL RESOURCES MANAGEMENT PAA PROJECT FINANCE A/S
39
PIU to maintain an on-going reporting to the affected stakeholders in order to open a new channel for grievances.
5.4 ABANDONMENT PHASE ENGAGEMENT
PAA Project Finance assumes no responsibility for the decommissioning process. This phase refers to the decommissioning of water well and demobilisation of the irrigation equipment which will be conducted by the SAG and beneficiaries.
5.5 TOOLS
To achieve a consistent and effective stakeholder engagement programme, standardised tools need to be developed and reviewed by PAA Project Finance Project management with the approval of the SAG, for use in the engagements. The tools outlined in Table 5.2 below will be key to stakeholder engagement in all phases of the Project, and the contents and messages shall be reviewed and approved prior to dissemination.
Table 5.2 Stakeholder Engagement Tools
Tool Description Project Information Booklet
The SAG-PIU or designed entity will elaborate a booklet for the Application of the Project’s Environmental and Social Regulations and Procedures. This document will be prepared in the local language and will be distributed during pre-operation phase engagements.
The booklet will provide a description of the proposed Project, the Project schedule for the engagement programme, contact details of the Project Implementation Unit (PIU), PAA Project Finance In-Country Representative or additional entity/SAG contact, and information on the grievance mechanism.
The booklet will be delivered to all the beneficiaries and will be available to the public for comments, potential concerns and grievances
Training Activities The Project Implementing Unit of the SAG, in collaboration with PAA Project Finance will design and conduct training on the project’s environmental and social procedures.
Notice Board Notice boards will serve as information dissemination tools (contact details, grievance forms, educational programmes, recruitment updates, webpage link, etc.).
Notice boards will be erected at the entrance to the Implementing Unit of the SAG and PIU Office and at other agreed locations, accessible to the communities, and updated on a regular basis.
Project information will be available in local language. Wherever possible, maps or visual aids will be used to increase accessibility of the notices.
Radio Broadcast Local radio broadcasts will be used by the PIU to provide Project updates and information (to reach a broader audience) related to enrolment dates for trainings carried out by the educational and research institutions supporting the project.

ENVIRONMENTAL RESOURCES MANAGEMENT PAA PROJECT FINANCE A/S
40
Tool Description Regular Reporting to Stakeholders
The PIU will prepare regular reports to the SAG; and in the case of issues and grievances related to the irrigation system will be transmitted to PAA Project Finance
The report shall include a summary of stakeholder engagement activities and all grievances received in the reporting period, any material deviations or non-compliances to the requirements of this SEP, planned activities for the next reporting period and any other issues of potential concern.
Focus Groups Discussions (FGD)
Semi- structured approach for conducting engagements with different stakeholder groups for example men and elders, women with specific issues of concern and other party’s non-beneficiaries from the project
The questions explored during a FGD can be grouped by specific themes (e.g. grievances, labour related issues, and livelihoods, gender issues, etc.).
Project leaflets The project benefits, the responsibilities, the selection criteria and the application procedure will be written in a project leaflets. The project leaflets can be obtained at the project area’s key points (SAGO, municipality of Arenal and Olanchito, FENAGH, the project’s local office, the SAG’s website).
Complaints/Suggestion mailboxes
The PIU will install several complaints/suggestion mailboxes at strategic points in Olanchito (such as the established Milk Collection Centres), specially to make allegations of corruption which can be approached anonymously
Stakeholder Engagement Register
The PIU will maintain a stakeholder engagement register to plan and track engagements.

ENVIRONMENTAL RESOURCES MANAGEMENT PAA PROJECT FINANCE A/S
41
6 COMMUNITY GRIEVANCE MECHANISM
6.1 DEFINITIONS AND GOOD PRACTICE
The IFC’s Good Practice Guide to addressing grievances from Project-affected communities describes a grievance as: ‘a concern or complaint raised by an individual or a group within communities affected by company operations. Both concerns and complaints can result from either real or perceived impacts of a company’s operations, and may be filed in the same manner and handled with the same procedure’ A Project-level grievance mechanism for affected communities is described as: ‘a process for receiving, evaluating, and addressing project-related grievances from affected communities at the level of the company, or project’ The Community Grievance Mechanism should be broadly and regularly publicized, throughout the complete cycle of the project to ensure that comments, questions and grievances are appropriately channelled and registered.
6.2 PURPOSE
The Community Grievance Mechanism enables any stakeholder to make a complaint or a suggestion about the way the Project is being implemented. Grievances may take the form of specific complaints for damages/injury, concerns about routine Project activities, or perceived incidents or impacts.
The purpose of the Community Grievance Mechanism Procedure is to implement a formalised process (identification, tracking and redress) to manage complaints/grievances from communities and other local stakeholders during pre-operation and operation in a systematic and transparent manner that could potentially arise from the Irrigation Project, through the following key aspects (but not limited to):
Writing and publicizing complaints/grievances
Bringing them to third parties where needed
Making the Grievance mechanism accessible
Communicating the response and resolution to the complainants and providing feedback in a transparent manner
Keeping good records for follow-up In this Stakeholder Engagement Plan, the objective of PAA Project Finance is to enhance the current grievance mechanism developed by the SAG, providing structured actions to be taken into account by the pertinent

ENVIRONMENTAL RESOURCES MANAGEMENT PAA PROJECT FINANCE A/S
42
Authorities in order to give resolution and response of eventual complains/grievances that might arise from the affected stakeholders during the complete cycle of the Irrigation Project. The existing grievance mechanism will be tailored to serve the purpose of the Project and the needs of the potentially affected stakeholders including vulnerable groups.
6.3 DETAILED GRIEVANCE PROCEDURE
The SAG has in place a grievance mechanism that allows identifying negative attitudes with the aim to systematically transform concerns into positive experiences through an adequate response protocol. It is assumed that the Project Implementing Unit (PIU) will be in charge of managing this grievance mechanism for the Project on behalf of the SAG. The SAG grievance mechanism form, is indicated in the webpage8, is presented below:
In addition to the webpage mentioned above, the contact details of the SAG to report any concern are indicated below:
8 Retrieved from http://premperhn.com/sag-new/formulario-de-denuncias/

ENVIRONMENTAL RESOURCES MANAGEMENT PAA PROJECT FINANCE A/S
43
SAG - Secretaría de Agricultura y Ganadería Honduras Colonia Loma Linda, Avenida La FAO, Bulevar Centroamérica. Tegucigalpa Honduras Teléfono PBX: (504) 2232-5029 Correo electrónico: [email protected] Horario de atención: 9:00am a 5:00pm
Although grievance management is a responsibility of the SAG, PAA Project Finance will propose a series of actions (as a minimum) to the SAG in order to enhance the current grievance mechanism to have clear procedures that make filing grievances easy for communities with various levels of literacy and access to infrastructure. PAA Finance will also ensure that consultation on design of the mechanism provides for inclusion and participation of women in the grievance process, facilitating women’s access. Trained personnel in handling gender-sensitive issues shall be part of the PIU team.
Any person will be able to raise complaints in their own local language and anonymously. Illiterate people will be able to raise complaints verbally.
Complaints will be received through designated access points and mechanisms: o The designated access points will be accessible especially for
vulnerable people.
The information of physical exact location of the offices and complaint boxes will be given to Olanchito inhabitants in advance through notice boards, radio broadcast, webpage and meetings;
o Face-to-face with PIU field staff; o By email and website; o By a letter; o Through a dedicated phone number; o Through complaint boxes at different locations (specially placed in the
established Milk Collection Centres); o Through trusted third parties (such as NGOs); o Through traditional/local Authorities, leaders, etc.
Upon receiving a complaint/grievance, the receptor (PIU) will explain the process with very clear timelines for the remaining steps in the procedures, and inform on how the complaint will be handled as well as the types of remedies that the SAG can, or cannot, provide. The receptor will ensure confidentiality of the complainant from the lodging of a grievance onwards. Only those directly involved in the examination process will be provided with the details. Sensitive information will only be disclosed upon users’ knowledge and approval.
Recording grievances at the time they come in will be the responsibility of the onsite personnel (PIU) who receives it at first place. A sample
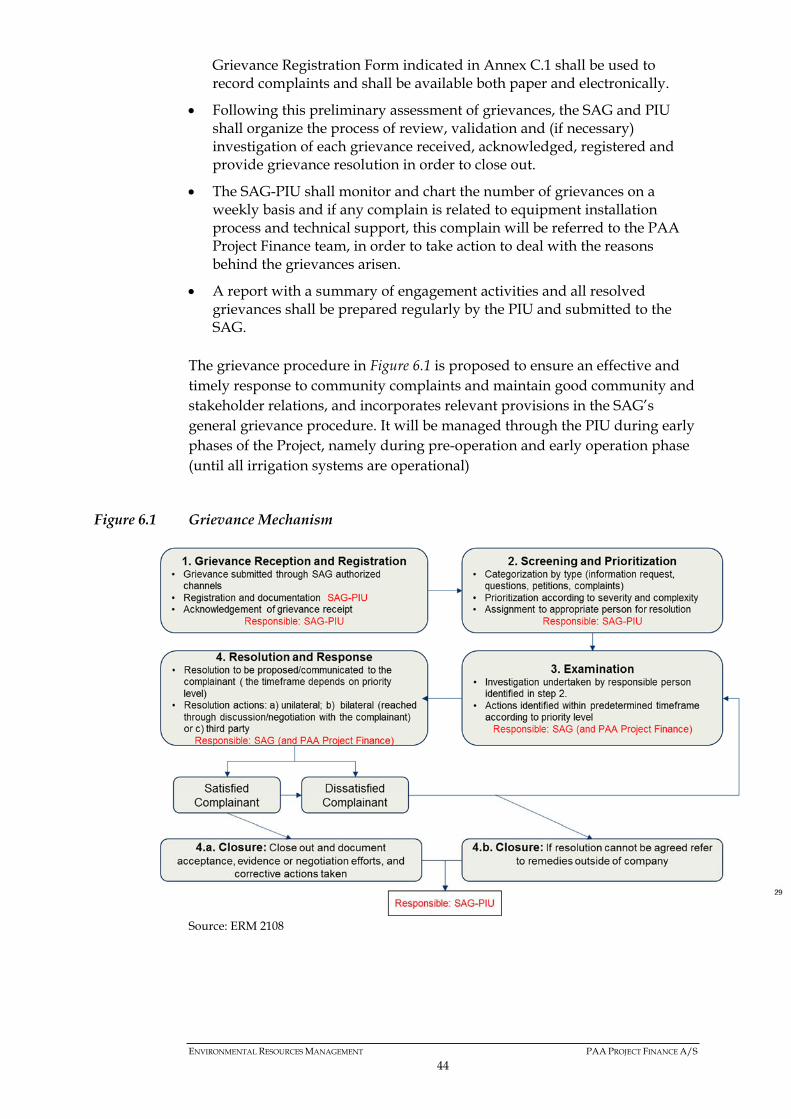
ENVIRONMENTAL RESOURCES MANAGEMENT PAA PROJECT FINANCE A/S
44
Grievance Registration Form indicated in Annex C.1 shall be used to record complaints and shall be available both paper and electronically.
Following this preliminary assessment of grievances, the SAG and PIU shall organize the process of review, validation and (if necessary) investigation of each grievance received, acknowledged, registered and provide grievance resolution in order to close out.
The SAG-PIU shall monitor and chart the number of grievances on a weekly basis and if any complain is related to equipment installation process and technical support, this complain will be referred to the PAA Project Finance team, in order to take action to deal with the reasons behind the grievances arisen.
A report with a summary of engagement activities and all resolved grievances shall be prepared regularly by the PIU and submitted to the SAG.
The grievance procedure in Figure 6.1 is proposed to ensure an effective and timely response to community complaints and maintain good community and stakeholder relations, and incorporates relevant provisions in the SAG’s general grievance procedure. It will be managed through the PIU during early phases of the Project, namely during pre-operation and early operation phase (until all irrigation systems are operational)
Figure 6.1 Grievance Mechanism
Source: ERM 2108

ENVIRONMENTAL RESOURCES MANAGEMENT PAA PROJECT FINANCE A/S
45
The following sections explain the procedure in detail:
6.3.1 Step 1: Grievance Receipt and Registration
Grievances or complaints shall be received through different channels and recorded by PIU and eventually PAA Project Finance in-country representative. It is also expected that grievances and complaints will be recorded during face to face meetings and FGDs as well as through webpage, mailboxes or office meetings. In either case, the received grievances as well as the details of the complainants shall be noted down and passed on to the PIU/SAG for registration within the day of receipt. These grievances may be in written form or verbal complaints and shall be treated with equal respect. The filing of grievances shall be made easy for communities with various levels of literacy and shall be accessible and culturally appropriate (see Grievance Registration form in Annex B.1). Once received, the PIU/SAG shall review and register the complaint. This activity shall entail capture of complete details of the complaint and may involve phone calls or meeting with the complainant, review of records of previous similar incidents or occurrences, any available evidence, supporting documents or statements. The details of the complaint shall be recorded in a grievance register/book/database for follow-up and future reference (see Annex B.2). During this process, the PIU/SAG shall also acknowledge receipt of the complaint within a standardised time period (ideally at reception) or within 12 hours and explain to the complainant the process including timelines of the remaining steps in the procedure.
6.3.2 Step 2: Screening and Prioritisation
All grievances will need to undergo some degree of screening and prioritisation. The responsible person (or grievance owner) and the nature of the examination (Step 3) will be determined by the type of grievance and the potential social risk attached to it. Prior to the start of the examination process therefore, the PIU/SAG shall establish the nature of the grievance to determine the measures needed for review and investigation. Depending on the circumstances of the complaint, various SAG-PIU units or departments may need to get involved, including PAA Project Finance team if their input is required by the SAG. To expedite the screening process, all incoming grievances will be classified, according to their nature based on the following Stakeholder Grievance (SG) categories:
SG 0: Request for information not directly related to the Project
SG 1: Questions / Doubts
SG 2: Requests / Petitions

ENVIRONMENTAL RESOURCES MANAGEMENT PAA PROJECT FINANCE A/S
46
SG 3: Complaints Complaints (SG 3) will be given a higher priority level and will be further classified into the following sub-categories:
SG 3-A: Relatively minor and one-time problems
SG 3- B: Relatively minor but repetitive problem
SG 3- C: Significant, larger problems related to Project activities
SG 3-D: Major claim, significant adverse impact on a larger group or several groups.
SG 3- E: Major allegations regarding policy or procedures or legal issues Following this preliminary assessment, the PIU/SAG will organize the process of review and investigation of each grievance received.
6.3.3 Step 3: Grievance Examination
The PIU /SAG will be designated as the central unit or person responsible for grievance evaluation and shall organize the process to validate the complaint’s legitimacy and arrange for investigation of details. He/ she will determine the fate of a complaint within 48 hours of receipt; where he/she establishes that a complaint is not genuine or not related to the Project, he/she shall formally communicate the verdict to the complainant within 48 hours of receipt. If the complaint is established to be valid, the investigation process will begin and some complaints will need that the PIU/SAG units or departments and PAA Project Finance team get involved. The investigations will involve meetings with responsible offices, dialogue over identified complaints, development of corrective actions, action time frames, and implementation of responsibilities. The PIU will document the proceedings and final communication to the complainant. The grievance evaluation/investigation process may also involve the complainant, depending on the category of complaint.
6.3.4 Step 4: Resolution and Feedback to Complainant(s)
Once complaint investigations are completed, the PIU/SAG shall draft a formal communication to the complainant, advising of findings and the outcome. He/she shall communicate the response, stipulate mutual commitments, and ask for the complainants’ agreement. If the complainant is not satisfied with the resolution, or the outcome of the agreed corrective actions the response should be reviewed and if appropriate amended in light of any discussions or negotiations. If the complainant is still no satisfied, they should be free to take their grievances to a dispute resolution mechanism outside of the company grievance mechanism. Proposed resolution actions may be of the following types:

ENVIRONMENTAL RESOURCES MANAGEMENT PAA PROJECT FINANCE A/S
47
Unilateral: the PIU and SAG addresses the source of the problem directly
(eg. reducing noise or dust). Bilateral: The PIU convenes a meeting with the complainant, and
appropriate management levels (according to the complaint category) to reach a resolution through discussion or negotiation. As during the evaluation process, the SAG is committed to considering all the evidence and meeting with all the relevant parties, in an effort to give complainants every opportunity to present their views.
Third party: Informally or through mediation. While collating and communicating the response to the complainant, the PIU/SAG shall: Take photos or collect other documentary evidence to form a
comprehensive record of the grievance and how it was resolved; Create a record of resolution internally, with the date and time it took
place, and have responsible staff sign off;
Have a meeting with the complainants to get a collective agreement to close out the claim; and
If the issue was resolved to the satisfaction of the complainants, get a
confirmation and file it along with the case documentation.
6.3.5 Step 5: Grievance Close-out and Register Update
Where the stakeholder is satisfied with the responses provided to their grievances, the specific grievances will be concluded by the SAG-PIU and the register updated to indicate as much. All correspondences will be filed and the corrective actions clearly updated against the grievances. As stated in the previous section, if the complainant is not satisfied with the resolution, or the outcome of the agreed corrective actions, they should be free to take their grievances to a dispute resolution mechanism outside of the company grievance mechanism. PAA Project Finance through their In-Country Representative will ensure that all grievances raised by all Project stakeholders are treated impartially, respectfully and confidentially

ENVIRONMENTAL RESOURCES MANAGEMENT PAA PROJECT FINANCE A/S
48
7 RESOURCES AND RESPONSIBILITIES
Table 7.1 describes the roles and responsibilities of the persons in charge to execute the irrigation project.
Table 7.1 Roles and Responsibilities with regards to stakeholder engagement and grievance management
Roles Responsibilities Project Phase PAA Project Finance Manager (Madrid, Spain)
Approve communication to relevant external interested and affected parties in line with the SEP and in close collaboration with the SAG through PIU.
Responsible for planning and delivery of the irrigation systems.
Responsible for offering training programmes to SAG technicians, with the support of PAA Project Finance In-Country Representative.
Pre-Operation
PAA Project Finance In-Country Representative
Responsible to provide support to the SAG-PIU As part of the support to the SAG-PIU, responsible
for providing technical support to SAG representatives during pre-operation phase..
Participation in communication and information sharing activities as per SEP
As part of the support to the SAG-PIU, responsible for addressing grievances in relation to irrigation equipment delivery
Pre-operation
SAG - Irrigation Department (responsible project representative)
Responsible for appointment of a Project Implementation Unit (PIU) and its supervision. The PIU will be formed by a team covering the following functions: Project Director, administrative and logistics manager, agriculture and irrigation system technician consultancy and grievance management.
Responsible for appointment of the Technical Support of the SAG
Responsible for implementing, and maintaining Project programmes, including compliance with the SEP
Validation of selection criteria of potential beneficiaries by PIU.
All Phases
SAG – Project Implementing Unit (PIU) Note: PIU will be operational during pre-operation and early operation phase). After this
Responsible for selecting the beneficiaries according to the defined criteria.
Responsible for organisation and delivery of beneficiaries’ training.
Responsible for day-to-day implementation of the SEP and Grievance Mechanism including monitoring and
Responsible for managing grievances according to established procedure.
Responsible for providing monitoring activities of the irrigation equipment with the support of other organisations such as Milk Collection Centres or SAGO, FENAH and UMA of Olanchito
Pre-operation and partly during operation

ENVIRONMENTAL RESOURCES MANAGEMENT PAA PROJECT FINANCE A/S
49
Roles Responsibilities Project Phase period the SAG will assume responsibility for engagement and grievance management
Responsible for monitoring of the correct implementation and management of environmental and social measures related to the abandonment activities.
Act as the primary interface between the Project and stakeholders including: Responsible for providing technical support to
beneficiaries during the irrigation equipment installation through the CRELs representatives.
Providing beneficiary management and liaison as necessary to ensure successful Project outcomeEnsure to disclose planned engagement schedule to stakeholders
Providing support for the organisation of training on the project’s environmental and social procedures for beneficiaries.
Prepare regular reports to the SAG Responsible for maintaining a stakeholder
engagement register to plan and track engagements and grievances.
Responsible for elaborating the booklet for the Application of the Project’s Environmental and Social Regulations and Procedures and distribute to all the beneficiaries and the public during pre-operation phase engagements.
Ensure to implement and update the dissemination tools (the notice boards, complaints/suggestion mailbox, contact details, etc.)
SAGO/FENAH/ UMA of Olanchito
Responsible for monitoring the irrigation equipment in conjunction with the PIU.
Responsible for providing technical inspections
Operation
Other Project Staff and Contractors
Understand and work within the requirements of the SEP
Attend meetings convened to discuss SEP issues when invited.
Pre-operation
Beneficiaries Correct use of the irrigation system, in compliance with guidelines received during the training programmes.
During the abandonment phase, the beneficiary will be responsible for the correct abandonment of the irrigation equipment and water wells.
Operation and abandonment

ENVIRONMENTAL RESOURCES MANAGEMENT PAA PROJECT FINANCE A/S
50
8 MONITORING AND REPORTING
8.1 STAKEHOLDER INVOLVEMENT IN PROJECT MONITORING
Monitoring of the irrigation equipment will be conducted by the PIU in collaboration with the SAGO, FENAH and UMA of Olanchito. Involvement of beneficiaries and project-affected stakeholders in monitoring Project implementation can assist in addressing their concerns and promote transparency. This can also empower communities as it enables them to have a role in addressing Project-related issues that affect their lives. This, in turn, strengthens relationships between the Project and its stakeholders. Stakeholder involvement in monitoring of this Project will include the following:
CRELs and stockbreeder’s representatives will be involved in the technical inspections and monitoring of the irrigation equipment
Involvement of affected stakeholders when selecting methods for any social surveys and in the analysis of results. Training will be conducted where needed to build capacities.
Observations of audit activities by affected parties.
Grievance follow-up meetings and calls with affected stakeholders in relation to installation of pumps, beneficiary selection and capacity building program.
8.2 REPORTING TO STAKEHOLDERS
The PIU will prepare regular reports to the SAG, which mainly describe as a minimum:
Progress with implementation of the project
Action Plans on issues that involve on-going risk to or impacts on affected stakeholders and on issues that the consultation process or grievance mechanism have identified as a concern to those stakeholders.
A summary of engagement activities and all resolved grievances
The Performance Standards require that after completion of an environmental assessment the consultation and disclosure must continue throughout the life cycle of the project. Additionally, other modes of reporting shall be prepared as outlined in Table 8.1 below:

ENVIRONMENTAL RESOURCES MANAGEMENT PAA PROJECT FINANCE A/S
51
Table 8.1 Outline of Reports to Stakeholders
Report Content Stakeholder Frequency Environmental Audit Report
Evaluation of the Project’s environmental and social performance
Lenders To be defined by lenders
Monitoring Report Evaluation of the correct implementation of the irrigation equipment
SAG Yearly
Technical Inspections Reports
Inspections of the correct usage and maintenance of the irrigation system
PAA Project Finance, SAG, PIU
tbc
Training Reports
Training records conducted to the SAG technicians
PAA Project Finance
tbc
Progress Update Reports Project development activities, challenges and opportunities
SAG At agreed timelines
The internal schedule of preparation and dissemination of all formal disclosures shall be determined by the SAG-PIU and shall be communicated to PAA Project Finance.

ENVIRONMENTAL RESOURCES MANAGEMENT PAA PROJECT FINANCE A/S
52
ANNEX A: BENEFICIARY RESPONSABILITIES TOWARDS THE PROJECT
The beneficiary responsibilities/requirements are indicated below: Attesting to the veracity of all documents to be included in the file for the
irrigation equipment application.
Attesting that the title deed submitted for the land where the irrigation system will be installed is free of all encumbrances, mortgages, and that they are the absolute owner of the property, as well as any other aspects of a legal nature that may affect their possession for a period of at least 10 years.
Complying with and attesting to all the requirements demanded in the operating regulations of the agreement between the SAG and the beneficiary, which are mainly indicated below:
o Application signed by the applicant producer.
o Photocopy of public deed or any other title that is registered in the Property Institute of the Department to which the property to be cultivated and the irrigation equipment to be installed are ascribed.
o Photocopy of the applicant’s identity document.
o Photocopy of the applicant’s National Tax Registry (numerical RTN).
o Proof of neighbourhood of the applicant issued by the Municipal Mayor, or their representative, for the place where the property in the application is located.
o Investment plan or crop feasibility study that is being, or will be, carried out.
Once the application has been approved by the Ministry of Agriculture and Livestock, the benefit fee amount must be settled.
The beneficiary takes the responsibility for processing all permits related to their productive and commercial activity, if any.
The beneficiary of the equipment must acquire all the usage rights for natural resources and any respective environmental permits necessary for their activity, which could include:
o The environmental licence for the type of crop they wish to farm.
o The water contract.
o The permit for connecting any additional necessary equipment to the national electric power grid.
o The permit for exploring and exploiting groundwater.
The beneficiary shall be liable for the costs of the environmental services regarding the use of water or the corresponding environmental compensation.
Covering all expenses for the loading, transport, and operability of the irrigation equipment from the city of delivery to its final destination (farm).
If necessary, covering expenses for the conditioning of their water source, such as the drilling of underground water wells or the construction of a dug well near a surface water supply, in addition to all the associated accessories, materials, and other work required for the proper installation and functioning of the equipment.

ENVIRONMENTAL RESOURCES MANAGEMENT PAA PROJECT FINANCE A/S
53
Acquiring, on their own, all the accessories or materials that are needed to install the irrigation equipment from the site of the water supply to their property, as well as that necessary for the proper functioning of the equipment.
Providing, on their own, all fluids such as lubricants, fuel, battery acids, and anything else necessary for the installation and start up of the irrigation equipment received, as well as electric power if necessary.
Paying the compensation, where applicable, corresponding to third parties for the use of the irrigation equipment.
If the beneficiary producer sells or loses the equipment, they must reimburse its value to the General Treasury of the Republic, and should they fail to do so, a case must be submitted to the corresponding judicial authorities.
Complying with the objectives and commitments established in the Conditional Donation Agreement, as well as with the technical assistance and manuals recommended for the irrigation equipment.
Correctly using and maintaining the irrigation equipment acquired through this Conditional Donation Agreement.
Carrying out, on their own, all the equipment and hydrant pipe installation work on the plot where the received irrigation equipment is going to operate.
Maintaining the equipment and its components, accessories, as recommended by the manufacturer or supplier.
Taking responsibility for any damage to the equipment due to mishandling, theft, or loss, and repairing or replacing the parts within a period of no more than 30 days after the event has been detected.
Additionally, they authorise the Ministry of Security or another related institution to designate the SAG to take the equipment away from them if they are not using it or are misusing it. The beneficiary will be responsible for transporting the equipment to SAGO’s warehouse.
The irrigation equipment acquired through the agreement between the SAG and the beneficiary cannot be unused as this would imply the immediate termination of the equipment agreement, nor can it be sold or used as collateral for a loan with a natural person or financial entity, nor removed from the property to which it is assigned or belongs, unless this is with the approval of the SAG.
The irrigation equipment received by the beneficiary can only be handled or operated by the beneficiary and cannot be loaned, rented or temporarily used by any persons other than the beneficiary themselves.
The responsibility for the management of water and soil resources lies with the beneficiary. The project only intervenes in raising awareness and contributes to the improvement of the educational offering for the beneficiary to acquire the knowledge and the will to implement preventive measures aimed at preserving the sustainability of the water and soil resources.
Allowing the monitoring of the irrigation equipment for a period of no less than 10 years, by the SAG, SAGO, FENAGH, or the Environment Unit (Unidad de Medioambiente or UMA) of Olanchito, in order to verify its condition and correct operation. At the same time, providing information about the crops they are managing through its operation.

ENVIRONMENTAL RESOURCES MANAGEMENT PAA PROJECT FINANCE A/S
54
The beneficiary must authorise technical inspections by the SAG, as well as provide the information requested by the SAG on the use of the equipment and crop yields.
The SAG may authorise the transfer of the equipment or its damaged parts for repair, outside the property of the beneficiary.
In the event of sale of the plot or transfer of ownership of the land exploited by the irrigation equipment, its beneficiary must deliver all of the Irrigation Equipment in good working condition to the SAG, whilst being responsible for all logistics expenses, as well as any other costs generated by this. The SAG will proceed to make a decision on the equipment. If the equipment is damaged, the beneficiary is obliged to replace it for the SAG so that it can be delivered to another producer in good condition.
In the event that the equipment is transferred to another property owned by the same beneficiary, this party must inform the SAG in order to determine the technical feasibility, attaching the relevant data on the new property that is to be exploited, whilst entering into a new agreement according to the data on that property and the adjoining areas.
Supporting the SAG in priority actions that are decreed in support of national food security or sovereignty.

ENVIRONMENTAL RESOURCES MANAGEMENT PAA PROJECT FINANCE A/S
55
ANNEX B.1: STAKEHOLDER ENGAGEMENT ACTIVITIES DURING ESIA FOR LENDERS PREPARATION (2017)
The following are attached:
A 1 Stockbreeders’ Socialisation Minutes (7.11.2017)
A 2 Farm visits Minutes 7 (8.11.2017)
A 3 Hummingbird Refuge Meeting Minutes ASIDE (9.11.2017)
A 4 Braulio Pastor Minutes (9.11.2017)
A 5 ICF meeting in Tocoa office Minutes (10.11.2017)
A 6 Municipal Environmental Unit UMA-Olanchito Minutes (9.11.2017)
A 7 ICF ICF-DE 626 -2017
A 8 SAG-ICF Honduras Letter (October 2017)
A 9 SAG-MIAMBIENTE Letter requesting water data from Water Resources Department
A 9bis SAG-885-2017 TO ENG. Jose Antonio Galdames
A 10 Letter to MiAmbiente - Project Categorisation
A 11 Letter of Response Official Letter MiAmbiente no requirement ESIA for Aguan project - DMA-1132-2017
A 12 MiAmbiente Response (31.10.2017)
A 13 Alto Aguan Minutes (30.08.2017)
A6 b Summary of Aguan Visits (Nov2017)
A14a Alto Aguan meeting Minutes - MiAmbiente DECA Tegucigalpa – Attendance List (31.08.2017)
A14b Alto Aguan meeting Minutes - MiAmbiente DECA Tegucigalpa - Attendance List – (31.08.2017)
A15 ICF Letter with Map of Alto Aguan beneficiaries and protected areas - Sacre Environment (August 2017)

ENVIRONMENTAL RESOURCES MANAGEMENT PAA PROJECT FINANCE A/S
56
INCLUDE MINUTES OF MEETINGS IN PDF VERSION

ENVIRONMENTAL RESOURCES MANAGEMENT PAA PROJECT FINANCE A/S
57
ANNEX B.2: STAKEHOLDER ENGAGEMENT ACTIVITIES DURING ESIA UPDATE PREPARATION (2018)
Date Stakeholder Objetive Location Participants Photographs of the meetings undertaken
18/06/2018 SAG and PAA Project
Introduction to the project
Review of field survey planning
Hotel in Olanchito
Core team: Antonio Losilla (Integra Ingeniería) Marío Ochoa (SAG – Subdirector) Wendy Padilla (SAG – Engineer) Anke Alvarado (CINSA – Environmental Expert) Emilio García (PAA Project - PAA Project) Mario Murillo (PAA Project – PAA Project) Daniel Alonso (ERM – Consultant) +Rafael Palacios (SAG Olanchito)
19/06/2018 SAG and PAA Project
Project management and government organizations involved
Selection criteria for potential beneficiaries and fees
Hotel in Olanchito
Core team
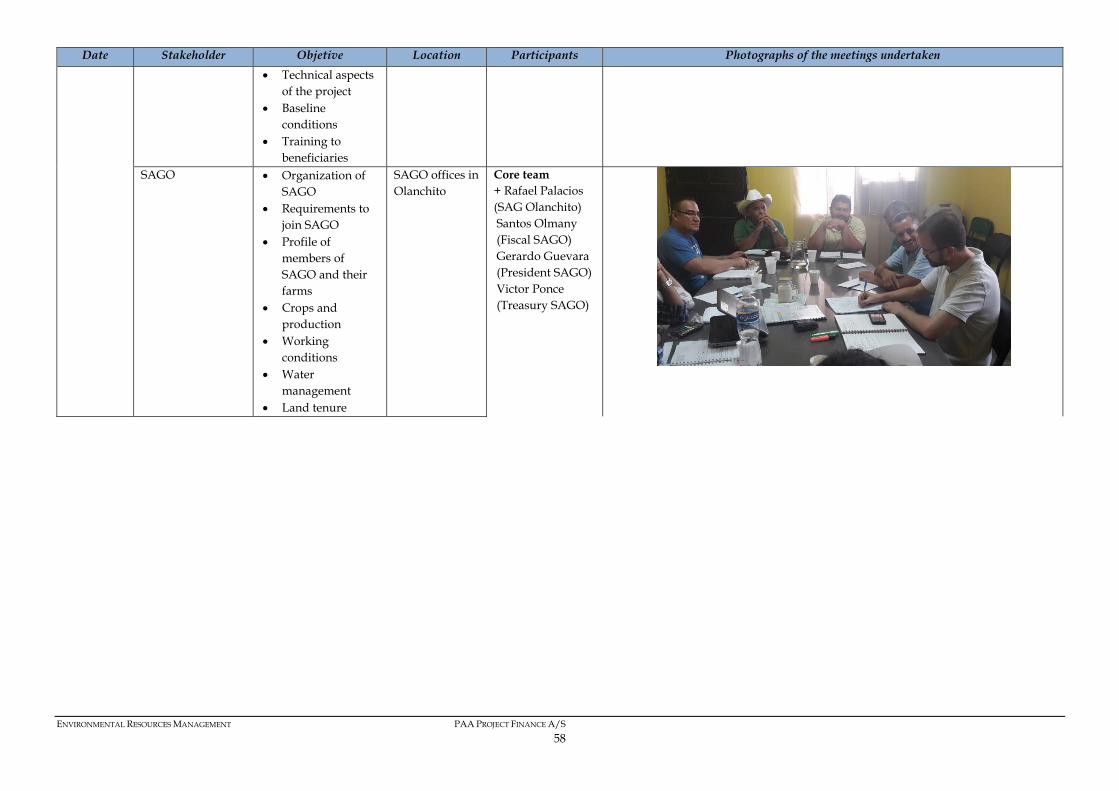
ENVIRONMENTAL RESOURCES MANAGEMENT PAA PROJECT FINANCE A/S
58
Date Stakeholder Objetive Location Participants Photographs of the meetings undertaken
Technical aspects of the project
Baseline conditions
Training to beneficiaries
SAGO Organization of SAGO
Requirements to join SAGO
Profile of members of SAGO and their farms
Crops and production
Working conditions
Water management
Land tenure
SAGO offices in Olanchito
Core team + Rafael Palacios (SAG Olanchito) Santos Olmany (Fiscal SAGO) Gerardo Guevara (President SAGO) Victor Ponce (Treasury SAGO)

ENVIRONMENTAL RESOURCES MANAGEMENT PAA PROJECT FINANCE A/S
59
Date Stakeholder Objetive Location Participants Photographs of the meetings undertaken
CREL Tejeras Understand management of a CREL
CREL Tejeras Core team +Rafael Palacios (SAG Olanchito) Informal meeting in the CREL – no attendance list is taken. Several members of the CREL
Farm owned by Jose Guadalupe Bustillo
Confirmation water extraction methods
Visit farm of a potential beneficiary to understand farm management (livestock, crops, water, chemical products, workers, economy, etc.)
Observation of habitats
Farm #30 Core team +Rafael Palacios (SAG Olanchito) Jose Guadalupe Bustillo (Farmer)
20/06/2018 PAA Project Stakeholders
identification Hotel in Olanchito
Emilio García (PAA Project - PAA Project)
N/A

ENVIRONMENTAL RESOURCES MANAGEMENT PAA PROJECT FINANCE A/S
60
Date Stakeholder Objetive Location Participants Photographs of the meetings undertaken
Mario Murillo (PAA Project – PAA Project) Daniel Alonso (ERM – Consultant)
CRELs Organization of CRELs
Requirements to join CRELs
Profile of members of CRELs and their farms
Crops and production
Working conditions
Water management
Land tenure
CREL San Jerónimo
Core team +Rafael Palacios (SAG Olanchito) Natividad de Jesús Vargas (President CREL San Jerónimo) Ramón Rainerio Lubina (Member CREL Superación San Marco) Marco Adilio Mejía (Member CREL Superación San Marco) Osman Fajardo (Treasury CREL Leopoldo Durán Dueñas San Patricio)
Farm owned by Osman Fajardo
Confirmation water extraction methods
Visit farm of a potential benefitiary to understand farm management (livestock, crops, water, chemical products,
Farm #165 Core team +Rafael Palacios (SAG Olanchito) Osman Fajardo (Farmer)
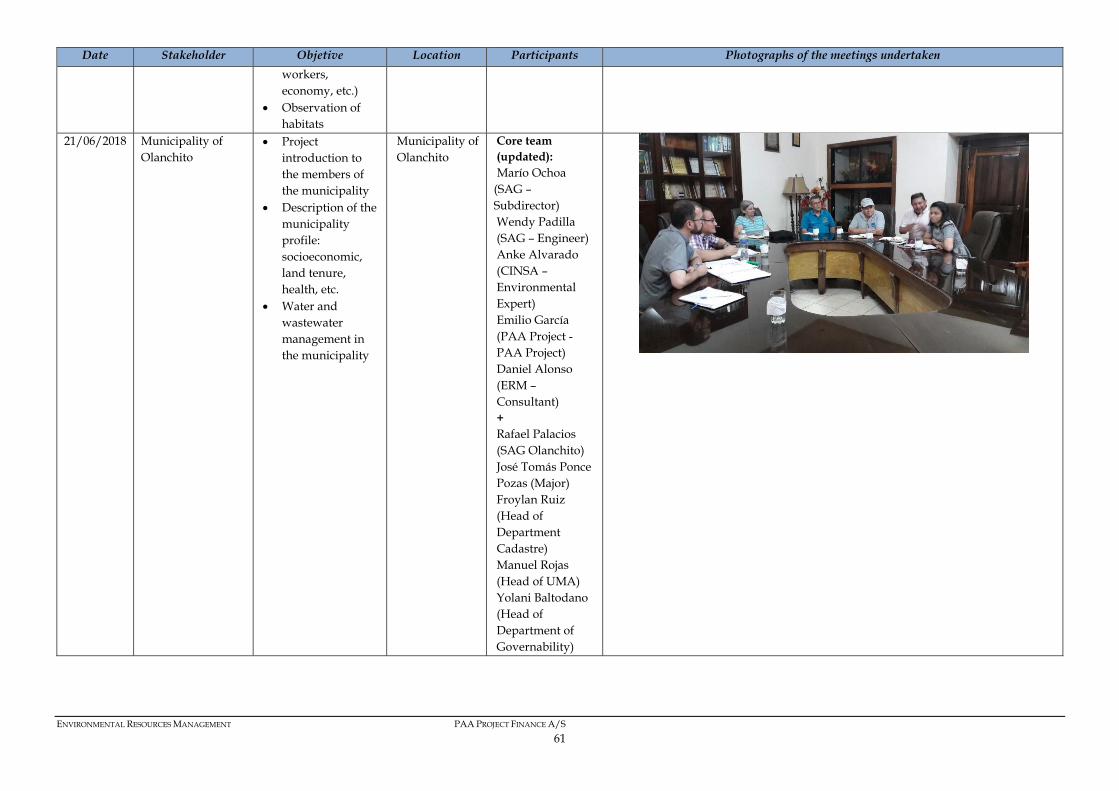
ENVIRONMENTAL RESOURCES MANAGEMENT PAA PROJECT FINANCE A/S
61
Date Stakeholder Objetive Location Participants Photographs of the meetings undertaken
workers, economy, etc.)
Observation of habitats
21/06/2018 Municipality of Olanchito
Project introduction to the members of the municipality
Description of the municipality profile: socioeconomic, land tenure, health, etc.
Water and wastewater management in the municipality
Municipality of Olanchito
Core team (updated): Marío Ochoa (SAG – Subdirector) Wendy Padilla (SAG – Engineer) Anke Alvarado (CINSA – Environmental Expert) Emilio García (PAA Project - PAA Project) Daniel Alonso (ERM – Consultant) + Rafael Palacios (SAG Olanchito) José Tomás Ponce Pozas (Major) Froylan Ruiz (Head of Department Cadastre) Manuel Rojas (Head of UMA) Yolani Baltodano (Head of Department of Governability)

ENVIRONMENTAL RESOURCES MANAGEMENT PAA PROJECT FINANCE A/S
62
Date Stakeholder Objetive Location Participants Photographs of the meetings undertaken
Municipality of El Arenal
Project introduction to the members of the municipality
Description of the municipality profile: socioeconomic, land tenure, health, etc.
Water and wastewater management in the municipality
Municipality of El Arenal
Core team + Rafael Palacios (SAG Olanchito) Carlos Alberto Zuñiga (Major) Juan Ramón Lago (Department Cadastre) José Díaz (UMA) Engineer Montoya (Assistant)
22/06/2018 SENASA Use and
management of chemical products in the agriculture / livestock sector: fertilizers, herbicides and pesticides
Types of products Quantities and
application system
SAG office in Olanchito
Core team (updated): Emilio García (PAA Project - PAA Project) Mario Murillo (PAA Project – PAA Project) Daniel Alonso (ERM – Consultant) + Rafael Palacios (SAG Olanchito) Angel Arteaga (SENASA) David Vallecillo (SENASA)

ENVIRONMENTAL RESOURCES MANAGEMENT PAA PROJECT FINANCE A/S
63
Date Stakeholder Objetive Location Participants Photographs of the meetings undertaken
INA (Instituto Nacional Agrario – Agrarian National Institute)
Management of Cajas Rurales
SAG office in Olanchito
Core team +Rafael Palacios (SAG Olanchito) Carlos Eliseo Sánchez (Jefe Sectorial del INA en Olanchito – INA Local Lead in Olanchito)
Focal group: small farmers
Socioeconomic profile: livestock, crops and production, financial conditions, profit, etc.
Working conditions
Water management
Land tenure Expectations
CREL Salinas Gonzales
Core team +Rafael Palacios (SAG Olanchito) Nilia Zumilda Duarte (CREL Salinas Gonzales) (Farm: Los Guayacanes) José Francisco Salina Soto (CREL Salinas Gonzales) (Farm: Rancho el Jinete) Rocibel Orellana Torres (CREL Salinas Gonzales) (Farm: Finca el Mirador) Neri Elisabet Gomez (CREL Nueva Alianza) (Farm: Rancho La
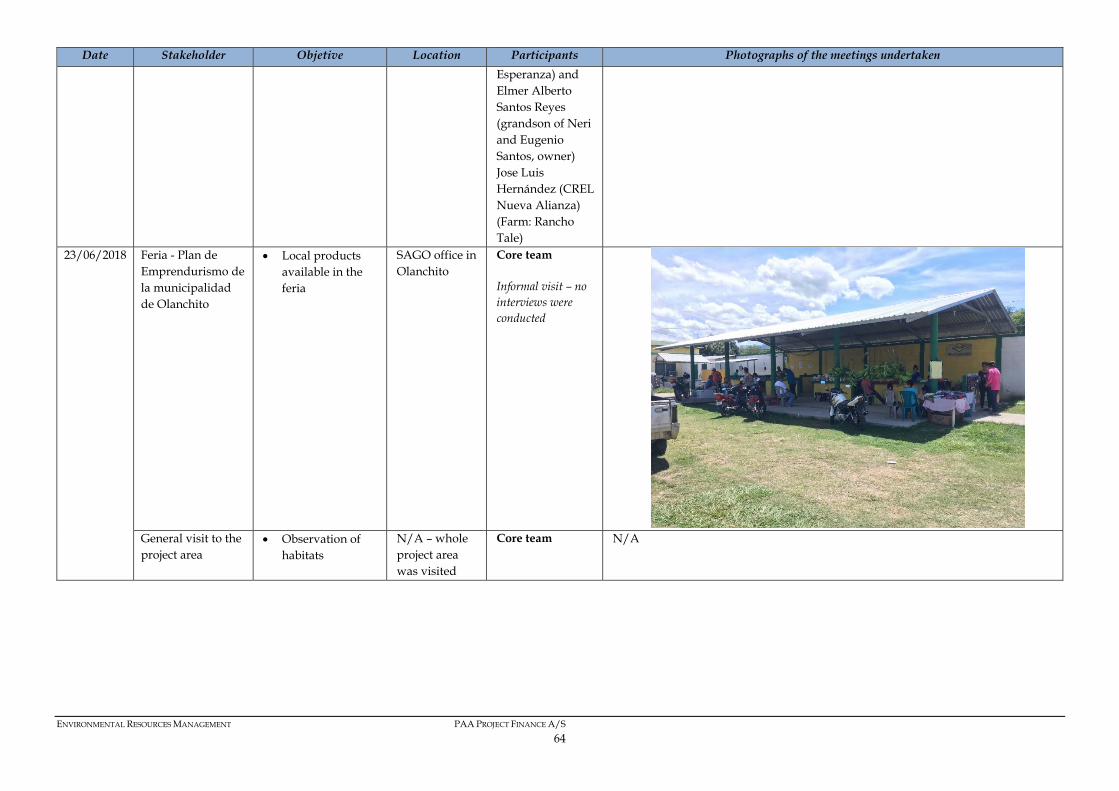
ENVIRONMENTAL RESOURCES MANAGEMENT PAA PROJECT FINANCE A/S
64
Date Stakeholder Objetive Location Participants Photographs of the meetings undertaken
Esperanza) and Elmer Alberto Santos Reyes (grandson of Neri and Eugenio Santos, owner) Jose Luis Hernández (CREL Nueva Alianza) (Farm: Rancho Tale)
23/06/2018 Feria - Plan de Emprendurismo de la municipalidad de Olanchito
Local products available in the feria
SAGO office in Olanchito
Core team Informal visit – no interviews were conducted
General visit to the project area
Observation of habitats
N/A – whole project area was visited
Core team N/A

ENVIRONMENTAL RESOURCES MANAGEMENT PAA PROJECT FINANCE A/S
65
Date Stakeholder Objetive Location Participants Photographs of the meetings undertaken
24/06/2018 Hospital Olachito – Emergency Services
Review of health conditions in the project area.
Vector transmission illnesses
Water consumption illnesses
Hospital Olanchito
Core team + Dra. Soraya Delgado
Farm owned by José Luis Chirinos
Confirmation of water extraction methods
Visit farm of a potential benefitiary to understand farm management (livestock, crops, water, chemical products, workers, economy, etc.)
Observation of hábitats
Interview to worker in farm
Farm #108 Core team + José Luis Chirinos (farmer) Cristian Bustillos (worker)

ENVIRONMENTAL RESOURCES MANAGEMENT PAA PROJECT FINANCE A/S
66
Date Stakeholder Objetive Location Participants Photographs of the meetings undertaken
Farm owned by Jesús Vallecillo
Confirmation of water extraction methods
Visit farm of a potential benefitiary to understand farm management (livestock, crops, water, chemical products, workers, economy, etc.)
Observation of hábitats
Interview to worker (DOLE) in farm
Farm #128 Core team + Jesús Vallecillo (farmer) Marcos Tulio Zelaya (DOLE worker)
25/06/2018 Indigenous worker Indigenous population in the area: location, socioeconomic profile, working conditions, conflict assessment, etc.
Aldea between Los Perritos and El Aguacate
Core team + Rafael Palacios (SAG Olanchito) Felix Soto (Indigenous worker)

ENVIRONMENTAL RESOURCES MANAGEMENT PAA PROJECT FINANCE A/S
67
Date Stakeholder Objetive Location Participants Photographs of the meetings undertaken
Indigenous worker Indigenous population in the area: location, socioeconomic profile, working conditions, conflict assessment, etc.
Aldea between Los Perritos and El Aguacate
Core team + Rafael Palacios (SAG Olanchito) José Francisco Martínez (Indigenous worker)
AJAASPIB (Asociación de Juntas Administradoras se Sistemas de Agua del Sector Sur del Parque Nacional Pico Bonito)
Water management
CREL Cruz Núñez
Core team + Rafael Palacios (SAG Olanchito) Carlos Estrada Cruz (Vicepresident AJAASPIB)

ENVIRONMENTAL RESOURCES MANAGEMENT PAA PROJECT FINANCE A/S
68
Date Stakeholder Objetive Location Participants Photographs of the meetings undertaken
ASIDE and ICF Protected areas management: Emerald Hummingbird Wildlife Refuge in Honduras
Biodiversity Hazards in
biodiversity conversation
Interactions between irrigation project in Alto Aguan and the protected areas
Offices in Emerald Hummingbird Wildlife Refuge
Core team + Rafael Palacios (SAG Olanchito) Kenia Ponce (ICF) Dorian Rodríguez (Fuerzas Aéreas – Air Forces) José Luis Ramos (ASIDE)
26/06/2018 Hospital Olachito – Health Secretary
Review of health conditions in the project area.
Vector transmission illnesses
Water consumption illnesses
Activities conducted by Health Secretary – prevention plans and induction to the population
Hospital Olanchito
Core team + Marlon Banegas (Coordinador del Programa de Salud Ambiental del Municipio de Olanchito)

ENVIRONMENTAL RESOURCES MANAGEMENT PAA PROJECT FINANCE A/S
69
Date Stakeholder Objetive Location Participants Photographs of the meetings undertaken
Farm owned by Angel Núñez – medium side farm
Confirmation water extraction methods
Visit farm of a potential benefitiary to understand farm management (livestock, crops, water, chemical products, workers, economy, etc.)
Observation of hábitats
Interview to worker in farm
Farm #71 Core team + Angel Núñez (farmer) Marvin Antonio Díaz (worker)
27/06/2018 N/A – travel to Tegucigalpa
N/A N/A N/A N/A
28/06/2018 Secretary of Agriculture
Summary and conclusions of field survey
Hotel in Tegucigalpa
Core team + Ing. Federico Brev (Delegate in the Secretary of Agriculture)

ENVIRONMENTAL RESOURCES MANAGEMENT PAA PROJECT FINANCE A/S
70
ANNEX C.1: SAMPLE GRIEVANCE REGISTRATION FORM
Stakeholder Grievance Mechanism
Grievance Registration Form Grievance Reference No: Grievance Registration Date
(dd/mm/year):
Full Name of SAG/PIU Representative and Position: Full Name of Complainant: Contact Information Please mark how you wish to be contacted (telephone, mail, e-mail).
By Telephone: _______________________________________________ By Post: Please provide mailing address: ________________________________________________________________________________________________________________________________________________________________________ By E-mail _______________________________________________
Description of Grievance:
When did it happen (date and time)? What happened? Where did it happen? Who did it happen to? What is the result of the problem? Were there any witnesses? (Continue on additional pages as required)
Date of Grievance ------------------------------
One time grievance (date _______________) Happened more than once (how many times? _____) On-going (currently experiencing problem)
What would you like to see happen to resolve the problem?

ENVIRONMENTAL RESOURCES MANAGEMENT PAA PROJECT FINANCE A/S
71
Signature: _______________________________ Date: _______________________________ Please return this form to:
Action identified to resolve the grievance
Date taken
By whom
Complainant satisfaction with implemented action?

ENVIRONMENTAL RESOURCES MANAGEMENT PAA PROJECT FIANANCE A/S
72
ANNEX C.2: SAMPLE GRIEVANCE REGISTER LOG
Acknowledgement date
Rapid Response by
Associated Dpt/ Contractor/Third Party
Complaint Owner
Proposed Resolution/Feedback to Complainant
Preliminary Resolution
Date
Satisfied with Process
(yes/no)?
If no, why not?
Conclusive Resolution
Date
Satisfied w ith Outcome (yes/no)?
If no, why not?Closure
Date
24-Jan-13 XXX Exploration XXXX Provide compensation to complainant

ANNEX 2
ASSESSMENT OF POTENTIAL BENEFICIARIES (2017)

Nº BENEFICIAR IO CREL Nombre del Productor Comunidad Municipio Nombre de la finca Area (Ha) Disponibilidad de agua para
irrigación
Area disponible de
riego (ha)
Tipo de Productor Tipos de Cultivos Cuenta con
sistema de riego
Tipo de
sistema con
que cuenta
1 Andino Munguía Amelia del Carmen Lozano Calpules Aldea Olanchito Hda. El Guanacaste 70 Subterránea 70 Ganadero Pasto no no
2 Andino Munguía Danilo Meléndez Calpules Aldea Olanchito La Cueva 56 Subterránea 56 Ganadero Pasto no no
3 Andino Munguía Darío Danilo Munguía Díaz Calpules Aldea Olanchito Villa Real 21 Subterránea 21 Ganadero Pasto no no
4 Andino Munguía Dimas Omar Savillón Calpules Aldea Olanchito Villa Sarahí 53 53 Ganadero Granos Básicos, Pasto no no
5 Andino Munguía Israel Munguía Calpules Aldea Olanchito Villa Sandra 40 Subterránea 14 Ganadero Pasto no no
6 Andino Munguía Jairo Esaú Cárcamo Sandoval Calpules Aldea Olanchito Pozo Seco 105 Subterránea 84 Ganadero Pasto no no
7 Andino Munguía Juan Emilio Munguía Meléndez Calpules Aldea Olanchito Villa Ricarda 53 Subterránea 53 Ganadero Pasto no no
8 Andino Munguía Leroy Antonio Munguía Díaz Calpules Aldea Olanchito 56 Subterránea 56 Ganadero Pasto no no
9 Andino Munguía Leroy Antonio Munguía Puerto Calpules Aldea Olanchito Los Pinos 18 Subterránea 18 Ganadero Pasto no no
10 Andino Munguía Luis Antonio Chavez Calpules Aldea Olanchito Villa Nina 21 Subterránea 21 Ganadero Pasto, Chile no no
11 Andino Munguía Milton Armando Munguía Calpules Aldea Olanchito Villa Ricarda 84 Subterránea 35 Ganadero Pasto no no
12 Andino Munguía Milton Emilio Munguía Calpules Aldea Olanchito Villa Monserrat 46 Subterránea 35 Ganadero Pasto no no
13 Andino Munguía Tomas Dionisio Andino Calpules Aldea Olanchito Villa Hermosa 84 Subterránea 56 Ganadero Pasto no no
14 Armín Jerónimo Figueroa AliRío Martínez Puerto San Francisco Olanchito Santa Marta 196 Subterránea 196 Ganadero Pasto no no
15 Armín Jerónimo Figueroa Ana Alfredina Amaya San Francisco Olanchito Las Amazonas 7 Subterránea 7 Ganadero Pasto no no
16 Armín Jerónimo Figueroa Cecilio Alejandro Diaz San Francisco Olanchito Flor del Campo 70 Superficial 70 Ganadero pasto no no
17 Armín Jerónimo Figueroa Digna Emérita Hernández Urbin San Francisco Olanchito Mango Moncho 599 Subterránea 21 Ganadero Pasto no no
18 Armín Jerónimo Figueroa Heliodoro Núñez San Francisco Olanchito La Florida 140 Subterránea 14 Ganadero pasto no no
19 Armín Jerónimo Figueroa Mirian Elizabeth Zanchez Paz San Francisco Olanchito Los Encinos 35 Superficial 7 Ganadero pasto no no
20 Armín Jerónimo Figueroa Walter Uyoa Olanchito Olanchito Camila, Plan Grande 36 Superficial 25 Ganadero Pasto no no
21 Bustillo Martínez Camilo Bustillo Santa Bárbara Olanchito Rancho Corozal 28 Subterránea 0 Ganadero pasto no no
22 Bustillo Martínez Camilo Eduardo Bustillo Santa Bárbara Olanchito El Corozal 57 Subterránea 57 Ganadero pasto no no
23 Bustillo Martínez Carmen Patricia Bustillo Santa Bárbara Olanchito Las Cruces 10 Subterránea 7 Ganadero pasto no no
24 Bustillo Martínez Claudia Lizeth Sosa Carretera Punta Pa Olanchito 35 Subterránea 35 Ganadero pasto no no
25 Bustillo Martínez Didier Martínez Santa Bárbara Olanchito Hda. Guayacán 126 Subterránea 126 Ganadero Pasto no no
26 Bustillo Martínez Enil Anay Martínez Santa Bárbara Olanchito Buenos Aires 61 Superficial 7 Ganadero Pasto si Aspersión
27 Bustillo Martínez Jesús Darío Martínez Santa Bárbara Olanchito Villa Yeimi 17 Subterránea 17 Ganadero Pasto no no
28 Bustillo Martínez Jose Conrado Bustillo Santa Bárbara Olanchito Potrero de Juan 10 Subterránea 10 Ganadero pasto no no
29 Bustillo Martínez Jose Elias Bustillo Santa Bárbara Olanchito Chiripa 35 35 Ganadero pasto no no
30 Bustillo Martínez Jose Guadalupe Bustillo Santa Bárbara Olanchito Rancho Crike 35 Superficial 35 Ganadero pasto no no
31 Bustillo Martínez José Román Martínez Santa Bárbara Olanchito Yarely 6 Superficial 6 Ganadero Pasto si Aspersión
32 Bustillo Martínez Maria del Carmen Quezada Pag Olanchito Olanchito Maria deL Carmen Queza 0 Superficial 35 Ganadero pasto no no
33 Bustillo Martínez Melvin Martínez Santa Bárbara Olanchito Puntilla 91 Subterránea 7 Ganadero pasto no no
34 Bustillo Martínez Olga Martínez Santa Bárbara Olanchito Villa Olga 133 Subterránea 70 Ganadero Pasto no no
35 Bustillo Martínez Ramon Armando Munguia Santa Bárbara Olanchito El Aguan 35 Subterránea 35 Ganadero pasto no no
36 Bustillo Martínez Robilio Enrique Martínez Santa Bárbara Olanchito Las Acacias 35 Superficial 21 Ganadero Pasto si Aspersión
37 Bustillo Martínez Ronal Arturo Molina Serrano Santa Bárbara Olanchito Los Posos 84 Subterránea 84 Ganadero pasto no no
38 Bustillo Martínez Silvio Axduhal Bustillo Santa Bárbara Olanchito Rancho Leyla 105 Superficial 63 Ganadero Pasto si Aspersión
39 Cárcamo Martínez Abdolio Herrera El Ocote Olanchito El Puente 53 Subterránea 13 Ganadero pasto no no
40 Cárcamo Martínez Carlos Alfredo Posas Rodríguez El Ocote Olanchito La Jaiba 32 Subterránea 14 Ganadero Pasto no na
41 Cárcamo Martínez Carlos Nasser El Ocote Olanchito Finca Lia 7 Subterránea 7 Ganadero Pasto no na
42 Cárcamo Martínez Constantino Armando Nuñez El Ocote Olanchito Las Vegas 91 Superficial 29 Agricultor y Ganadero Pasto, Frijol y no na
43 Cárcamo Martínez Dolores Jimenes El Ocote Olanchito Rancho la Esperanza95 67 Subterránea 2 Ganadero pasto no no
44 Cárcamo Martínez Donaldo Ocampo Teguajinal Olanchito Santa Teresa 7 Subterránea 0 Ganadero pasto no no
45 Cárcamo Martínez Exel Dilfredo Juarez El Ocote Olanchito Rancho Loren 14 Subterránea 14 Ganadero Pasto no na
46 Cárcamo Martínez Filomena Martínez El Ocote Olanchito La Mora 18 Subterránea 3 Ganadero Pasto no na
47 Cárcamo Martínez Guadalberto Sanchez El Ocote Olanchito La Bonita 53 Subterránea 14 Ganadero Pasto no no
48 Cárcamo Martínez Hector Armando Melendez El Ocote Olanchito El RosaRío 121 Subterránea 70 Agricultor y Ganadero Pasto, Frijol y no na
49 Cárcamo Martínez Hector Puerto Cárcamo El Ocote Olanchito Rancho Buenos Aires 84 Subterránea 28 Ganadero Pasto no na
50 Cárcamo Martínez Ines Martínez Martínez El Ocote Olanchito 14 Subterránea 11 Ganadero Pasto no na
51 Cárcamo Martínez Joel Sanchez El Ocote Olanchito 70 Subterránea 14 Ganadero Pasto no na
52 Cárcamo Martínez Jorge Arturo Nuñez El Ocote Olanchito Rancho los Cedros 109 Subterránea 109 Ganadero Pasto no no
53 Cárcamo Martínez Julio Sanchez El Ocote Olanchito 56 Subterránea 14 Ganadero Pasto no na
54 Cárcamo Martínez Kathy Jackeline Valdes El Ocote Olanchito Angeles 1 Subterránea 1 Ganadero Pasto si Aspersión
55 Cárcamo Martínez Martha Lilian Vallecillos El Ocote Olanchito La Confianza 65 Superficial 28 Ganadero Pasto no na
56 Cárcamo Martínez Melvin Omar Cano Zapata El Ocote Olanchito El Corral 6 Subterránea 4 Agricultor y Ganadero Pasto y Maiz no na
57 Cárcamo Martínez Miguel Posas Rodríguez El Ocote Olanchito Las Cejas 128 Subterránea 42 Ganadero pasto no no
58 Cárcamo Martínez Milton Edgardo Posas El Ocote Olanchito El Paso 46 Subterránea 14 Ganadero pasto no no
59 Cárcamo Martínez Mirna Cárcamo El Ocote Olanchito El Brazilete 70 Subterránea 7 Ganadero Pasto no na
60 Cárcamo Martínez Noe Antonio Solis El Ocote Olanchito El RosaRío 28 Subterránea 3 Ganadero pasto no no
61 Cárcamo Martínez Rosa Acevedo El Ocote Olanchito Rancho los Cascabeles 0 Superficial 7 Ganadero pasto no no
62 Independiente Miguel Angel Galeas San Lorenzo Olanchito El Uno 280 Subterránea 14 Ganadero pasto no no
63 CRELCA Alejandro Martínez Calpules Aldea Olanchito El Mazapan 7 Subterránea 6 Ganadero Pasto no no
64 CRELCA Jairo Ramón Romero Vallecillo Calpules Aldea Olanchito 6 Subterránea 6 Ganadero Pasto no no
65 CRELCA Jorge Andino Calpules Aldea Olanchito Las Acacias 32 Río Calpules 32 Ganadero Pasto no no
66 CRELCA Juan R Posas Calpules Aldea Olanchito Hda. Reitoca 70 Subterránea 56 Ganadero Pasto no no
67 CRELCA Julio Cesar Mejía Calpules Olanchito El Eden 98 Superficial 0 Ganadero pasto no no
68 CRELCA Karla Patricia Posas Palma Calpules Aldea Olanchito Soe 56 Río Calpules 56 Ganadero Pasto no no
69 CRELCA Luis Antonio Hoch Mejía Calpules Aldea Olanchito 140 Subterránea 70 Ganadero Granos Básicos, Pasto no no
70 Cruz Nuñez Alirio Cruz San Marcos Olanchito La Laguna 42 Río San Marcos 42 Ganadero Pasto no no
71 Cruz Nuñez Angel Adan Nuñez San Marcos Olanchito San Vicente 56 Subterránea 25 Ganadero Pasto no no
72 Cruz Nuñez Dilcia Cruz San Marcos Olanchito La Laguna 14 Subterránea 14 Ganadero Pasto no no
73 Cruz Nuñez Ernesto Urbina Cruz San Marcos Olanchito 112 Río San Marcos 35 Ganadero Pasto no no
74 Cruz Nuñez Inocente Nuñez Salmerón San Marcos Olanchito 56 Río San Marcos 28 Ganadero Pasto si Aspersión
75 Cruz Nuñez Juan José Molina Puerto San Marcos Olanchito Rancho Don Juan 98 Río San Marcos 35 Ganadero Pasto si Aspersión
76 Cruz Nuñez Leoncio Alfredo Cruz San Marcos Olanchito San Lorenzo 21 Subterránea 14 Ganadero Pasto no no
77 Cruz Nuñez Leoncio Cruz Olanchito Olanchito El Barracon 18 Subterránea 0 Ganadero pasto no no
78 Cruz Nuñez Manuel de Jesus Nuñez San Marcos Olanchito La Estación 126 Subterránea 56 Ganadero Pasto no no
79 Cruz Nuñez Marco Antonio Cruz San Marcos Olanchito La Laguna 14 Río San Marcos 14 Ganadero Pasto no no
Environmental Resources Management Annex 2-1 PAA PROJECT FINANCE A/S

Nº BENEFICIAR IO CREL Nombre del Productor Comunidad Municipio Nombre de la finca Area (Ha) Disponibilidad de agua para
irrigación
Area disponible de
riego (ha)
Tipo de Productor Tipos de Cultivos Cuenta con
sistema de riego
Tipo de
sistema con
que cuenta
80 Cruz Nuñez Miguel Antonio Cruz San Marcos Olanchito Guayacán 70 Río San Marcos 70 Ganadero Pasto no no
81 Cruz Nuñez Nívida Argentina Cruz San Marcos Olanchito Las Delicias 126 Río San Marcos 35 Ganadero Pasto si Aspersión
82 Cruz Nuñez Rigoberto Nuñez Salmerón San Marcos Olanchito San Vicente 56 Río San Marcos 56 Ganadero Pasto no no
83 Cruz Nuñez Yunior Aldubin Martínez Salas San Marcos Olanchito La Laguna 11 Río San Marcos 11 Ganadero Pasto no no
84 Fabricio Puerto Adalberto Paz Puerto Escondido Olanchito El Paraiso 70 Subterránea 63 Ganadero pasto no no
85 Fabricio Puerto Eddy Alberto Posas Padilla Puerto Escondido Olanchito 154 Subterránea 7 Ganadero Pasto no na
86 Fabricio Puerto Edward Navarro Puerto Escondido Olanchito 126 Subterránea 4 Ganadero Pasto no na
87 Fabricio Puerto Fredy Lozano Puerto Escondido Olanchito Rancho Baraja 53 Subterránea 14 Ganadero Pasto no na
88 Fabricio Puerto Hernan Calixto Posas Puerto Escondido Olanchito 91 Subterránea 7 Ganadero Pasto no na
89 Fabricio Puerto Hernan Posas Puerto Escondido Olanchito 49 Subterránea 4 Ganadero Pasto no na
90 Fabricio Puerto Jorge Alberto Melendez Puerto Escondido Olanchito Villa Yesenia 41 Subterránea 7 Ganadero Pasto no na
91 Fabricio Puerto Jose Roberto Melendez Puerto Escondido Olanchito 35 Subterránea 2 Ganadero Pasto no na
92 Fabricio Puerto Juan Esau Sandoval La Sabana de San C Olanchito San Fernando 4 Subterránea 57 Ganadero pasto no no
93 Fabricio Puerto Leonardo Miranda Puerto Escondido Olanchito 35 Subterránea 7 Ganadero Pasto no na
94 Fabricio Puerto Luis Alonzo Tablada Puerto Escondido Olanchito El Guanacaste 32 Subterránea 18 Ganadero Pasto no na
95 Fabricio Puerto Luis Gustavo Orellana Puerto Escondido Olanchito Santa Elena 7 Subterránea 7 Ganadero Pasto no na
96 Fabricio Puerto Luis Sanchez Puerto Escondido Olanchito 42 Subterránea 6 Ganadero Pasto no na
97 Fabricio Puerto Mario Ramon Espinoza La Sabana de San C Olanchito La Pipa 161 Subterránea 161 Ganadero pasto no no
98 Fabricio Puerto Orlando Amancio Mejía Calpules Aldea Olanchito Villa Nicha 35 Subterránea 161 Ganadero pasto no no
99 Fabricio Puerto Oscar Donaldo Martínez Puerto Escondido Olanchito Finca el Eden 63 Superficial 14 Ganadero pasto no no
100 Fabricio Puerto Ramon Fernando Melendez Pos Puerto Escondido Olanchito El corozal 51 Subterránea 1 Ganadero Pasto no na
101 Fabricio Puerto Vilfredo Lozano Avila Puerto Escondido Olanchito Uchapita 67 Subterránea 63 Ganadero Pasto no na
102 Heberto Chirinos Ponce Antonio Chirinos Herrera El Juncal Olanchito La Confianza 60 Subterránea 60 Ganadero Pasto no na
103 Heberto Chirinos Ponce Armando Soto Mejía El Juncal Olanchito El Recreo 42 Subterránea 28 Ganadero Pasto no na
104 Heberto Chirinos Ponce Claudio Wilfredo Chirinos Herre El Juncal Olanchito La Confianza 60 Subterránea 60 Ganadero Pasto no na
105 Heberto Chirinos Ponce Guerty Mariela Zelaya El Juncal Olanchito Villa Guerty 56 Subterránea 35 Ganadero Pasto no no
106 Heberto Chirinos Ponce Jorge Alfonzo Zelaya El Juncal Olanchito Janine 147 Subterránea 28 Ganadero Pasto no na
107 Heberto Chirinos Ponce José David Oliva El Juncal Olanchito 14 Subterránea 14 Ganadero Pasto, maíz no no
108 Heberto Chirinos Ponce José Luis Chirinos El Juncal Olanchito El Potrillo 21 Subterránea 21 Ganadero Pasto, maíz no no
109 Heberto Chirinos Ponce José Román Ponce El Juncal Olanchito Dunia 20 Superficial 2 Ganadero Granos Básicos, Pasto no no
110 Heberto Chirinos Ponce Martha Reyes El Juncal Olanchito 56 Subterránea 7 Ganadero Pasto, maíz si Aspersión
111 Heberto Chirinos Ponce Orfa Herrera El Juncal Olanchito 28 Subterránea 28 Ganadero Pasto no no
112 Heberto Chirinos Ponce Salma Marina Acosta Mejía El Juncal Olanchito San Ignacio 18 Subterránea 7 Ganadero Pasto no na
113 Heberto Chirinos Ponce Victor Ramiro Cárcamo El Jacal Olanchito El Marañón 44 Superficial 44 Ganadero pasto no no
114 Heberto Chirinos Ponce Victor Zelaya Ponce El Juncal Olanchito La Coronada 11 Superficial 11 Agricultor y Ganadero Pasto, maíz, Plátano no no
115 Heberto Chirinos Ponce Leopoldo Duron El Juncal Olanchito 84 Subterránea 8 Ganadero Pasto no na
116 Independiente Alejandro Leonidas Puerto El Nance Olanchito El Spray 22 Subterránea 22 Ganadero pasto no no
117 Independiente Anibal Alberto Nuñez Soto La Estación, San Lo Olanchito La Estación 42 Subterránea 42 Ganadero Pasto no no
118 Independiente Arcadio Alfredo Cano Teguajinal Olanchito La Cuarta 28 Subterránea 2 Ganadero pasto no no
119 Independiente Arlen Jeovany Vargas El Nance Olanchito Sole 7 Subterránea 91 Ganadero pasto no no
120 Independiente Bernardo Virgilio Euceda Olanchito Olanchito 0 98 Subterránea 1 Ganadero pasto no no
121 Independiente Blas Odilio Dueñas Durán El Nance Olanchito El Tigre 21 Subterránea 21 Ganadero Pasto no no
122 Independiente Dilcia Rely Jimenez de Mejía Olanchito Olanchito Telica 73 Subterránea 70 Ganadero Pasto no no
123 Independiente Eduardo Enrique Posas El Teoguajical Olanchito La Ceja 18 Subterránea 4 Ganadero pasto no no
124 Independiente Edwin Joel Sanchez Teguajinal Olanchito La Galana 20 Subterránea 14 Ganadero Pasto no na
125 Independiente Elio Miguel Lozano El Nance Olanchito Culuco 2 Superficial 2 Ganadero pasto no no
126 Independiente Heriberto Edgardo alfaro Campo Cayo Arenal La Estancia 140 Río Aguan 91 Ganadero Pasto no no
127 Independiente Hernan Asuncion Reyes El Nance Olanchito Villa Sarahí 28 Subterránea 28 Ganadero pasto no no
128 Independiente Jesus Vallecillo El Nance Olanchito San Lorenzo 18 Superficial 18 Ganadero pasto no no
129 Independiente Joaquina Gonzales Núñez El Barranco Olanchito San Ramón 105 Subterránea 70 Ganadero Pasto no no
130 Independiente Jorge Antonio Padilla El Teoguajical Olanchito El Mulato 8 Subterránea 20 Ganadero pasto no no
131 Independiente Jorge Armando Puerto El Nance Olanchito El Spray 17 Subterránea 17 Ganadero pasto no no
132 Independiente José Luis Galeas Puerto San José Olanchito San José 35 Subterránea 7 Ganadero Pasto no no
133 Independiente Jose Miguel Angel Romero Calpules Aldea Olanchito Villa Digna 70 Subterránea 42 Ganadero Pasto si Aspersión
134 Independiente José Nahúm Puerto Santa Bárbara Olanchito Villa Raquel 7 Superficial 7 Ganadero Pasto si Aspersión
135 Independiente Jose Wilfredo Romero Olanchito Olanchito Villa Elena 98 Subterránea 11 Ganadero pasto no no
136 Independiente Juan Lino Oseguera Santa Bárbara Olanchito El Paso 30 Subterránea 0 Ganadero pasto no no
137 Independiente Ligia Bustillo Santa Bárbara Olanchito La Flor 13 Subterránea 13 Ganadero Pasto no no
138 Independiente Luis Enrique Cárcamo Olanchito Rancho Colibri 86 Ambos 86 Ganadero Maiz,Sorgo M si Aspersión
139 Independiente Manuel de Jesus Ocampo El Patrono Olanchito Miraflores 70 Superficial 0 Ganadero pasto no no
140 Independiente Maria Beatriz Santos Melendez Macoa Olanchito mis lagunas 28 Subterránea 28 Ganadero pasto no no
141 Independiente Maria Eugenia Cárcamo Martín Ocaciones Olanchito El Zapote 95 Ambos 18 Agricultor y Ganadero Pastos y cere no
142 Independiente Mario Adolfo Ocampo Bustillo San Jerónimo Olanchito San Jerónimo 29 Subterránea 29 Ganadero Pasto no no
143 Independiente Mario Anibal Gonzales Flores Olanchito Olanchito Palo Verde 175 Subterránea 175 Ganadero pasto no no
144 Independiente Mario Ramón Martínez Gonzale San Francisco Olanchito Finca El Encanto 88 Subterránea 70 Agricultor y Ganadero Granos Básicos, Pasto no no
145 Independiente Marvin Hernández El Nance Olanchito La Mulera 28 Subterránea 11 Ganadero pasto no no
146 Independiente Maximino Martínez Santa Bárbara Olanchito Finca Guayacán 133 Subterránea 70 Ganadero Pasto no no
147 Independiente Melvin Martínez Arenal Olanchito Puntilla 91 Subterránea 0 Ganadero pasto no no
148 Independiente Miguel Angel Galeas Puerto El Ocote Olanchito RosaRío 280 Subterránea 21 Agricultor y Ganadero Pasto, sorgo y no na
149 Independiente Miguel Omar Ocampo El Nance Olanchito San Gerónimo 14 Subterránea 14 Ganadero Pasto no no
150 Independiente Milexi Rodríguez El Nance Olanchito El Spray 10 Subterránea 10 Ganadero pasto no no
151 Independiente Milton Armando Munguía Calpules Aldea Olanchito Villa Monserrat 42 Subterránea 11 Ganadero Pasto no no
152 Independiente Milton Puerto Santa Bárbara Olanchito Finca Buenos Aires 74 Superficial 14 Ganadero Pasto no no
153 Independiente Nelson Adalberto Flores San Jerónimo Olanchito Villa Hermosa 25 Subterránea 25 Ganadero Pasto no no
154 Independiente Odin Alain Sanchez Posas Teguajinal Olanchito La Roca 14 Superficial 14 Ganadero pasto no no
155 Independiente Ricardo Arturo Cruz Navarro Aldea el Chaparral Olanchito El Dorado 123 Subterránea 14 Agricultor y Ganadero sorgo y maiz no
156 Independiente Sinia Yumisa Puerto Rosales La Chorrera Olanchito Rancho San Vicente 35 Subterránea 14 Ganadero Pasto no no
157 Independiente Tomas Obdulio Nuñez Carretera hacia Zap Olanchito Rancho El Mirador 15 15 Agricultor y Ganadero no
158 Independiente Tulio M Dueñas El Nance Olanchito La Ceiba 8 Subterránea 14 Ganadero pasto no no
Environmental Resources Management Annex 2-2 PAA PROJECT FINANCE A/S

Nº BENEFICIAR IO CREL Nombre del Productor Comunidad Municipio Nombre de la finca Area (Ha) Disponibilidad de agua para
irrigación
Area disponible de
riego (ha)
Tipo de Productor Tipos de Cultivos Cuenta con
sistema de riego
Tipo de
sistema con
que cuenta
159 Independiente Yemil Eduardo Flores San Jerónimo Olanchito Hacienda La Bendición 70 Subterránea 70 Ganadero Pasto no no
160 Leopoldo Duran Dueñas Asteria Nuñez Nuñez San Patricio Olanchito Las Campiñas 91 Subterránea 11 Ganadero Pasto no no
161 Leopoldo Duran Dueñas CarlosRoberto Puerto Fúnez San Patricio Olanchito La Esperanza 42 Subterránea 11 Ganadero Pasto no no
162 Leopoldo Duran Dueñas Derly Liliana Moya Nuñez San Patricio Olanchito La Compañía 55 Subterránea 11 Ganadero Pasto no no
163 Leopoldo Duran Dueñas Edin Leobigildo Cárcamo Soto San Patricio Olanchito San Patricio 91 Subterránea 4 Ganadero Pasto no na
164 Leopoldo Duran Dueñas Leopoldo Duran Dueñas San Patricio Olanchito San Patricio 378 Superficial 11 Ganadero Pasto no na
165 Leopoldo Duran Dueñas Osman Fajardo/ Matilda Merce San Patricio Olanchito Villa Massielle 140 Subterránea 35 Ganadero Pasto no na
166 Martínez Hernández Alirio Salatiel Martínez Orellana Maloa Olanchito Rancho Texas 24 Subterránea 7 Ganadero Pasto no na
167 Martínez Lobo Adan Antonio Quezada Santa Cruz Arenal Olanchito Aguan Ariiba 84 Subterránea 21 Ganadero Pasto no na
168 Martínez Lobo Allan Vicente Puerto Santa Bárbara Olanchito Villa Paty 63 Subterránea 4 Ganadero pasto no no
169 Martínez Lobo Danilo Antonio Lozano Santa Cruz Arenal Olanchito El Coyol 42 Subterránea 7 Ganadero Pasto no na
170 Martínez Lobo Ernesto Urbina Santa Cruz Arenal Yoro Torre Fuerte 0 Superficial 0 Ganadero pasto no no
171 Martínez Lobo Francisco Fuentes Santa Cruz Yoro El Encanto 35 Subterránea 0 Ganadero pasto no no
172 Martínez Lobo Gilda Araceli Fuentes Santa Cruz Arenal Yoro Araceli 28 Superficial 6 Ganadero pasto no no
173 Martínez Lobo Jorge Ologorio Ramos Tierra Blanca Yoro Casa Blanca 48 Superficial 35 Ganadero pasto no no
174 Martínez Lobo Juan Ramon Salmeron Santa Cruz Arenal Yoro Rancho Timon 0 Subterránea 0 Ganadero pasto no no
175 Martínez Lobo Juana Deysi Martínez Nuñez Santa Cruz Arenal Olanchito El Coyol 56 Subterránea 11 Agricultor y Ganadero sacate de cor no na
176 Martínez Lobo Juana Dolores Lozano Santa Cruz Arenal INDIMAR 7 Río Aguan 7 Ganadero Pasto no no
177 Martínez Lobo Julio Lazo Murillo Santa Cruz Arenal Yoro La Vega 3 Superficial 3 Ganadero pasto no no
178 Martínez Lobo Luis Alonzo Rodríguez Santa Cruz Arenal Yoro Rancho Bonito 66 Subterránea 0 Ganadero pasto no no
179 Martínez Lobo Luis Roberto Reyes Arenal Olanchito Villa Cori 0 Subterránea 0 Ganadero pasto no no
180 Martínez Lobo Marcio Anibal Lozano Santa Cruz Arenal Olanchito Los Platanares 84 Subterránea 14 Ganadero Pasto no na
181 Martínez Lobo Marcio Fuentes Santa Cruz Arenal Yoro Villa Franci 0 Subterránea 0 Ganadero pasto no no
182 Martínez Lobo Nelson Efrain Fuentes El Barranco Olanchito Juinete 0 Superficial 0 Ganadero pasto no no
183 Martínez Lobo Oscar Amilcar Lobo Cruz Santa Cruz Arenal El Chile 118 Subterránea 42 Ganadero Pasto no no
184 Martínez Lobo Rafael Landaverde Santa Cruz Arenal Fortaleza 71 Subterránea 70 Ganadero Pasto no no
185 Martínez Lobo Telmo Orlando Fuentes Santa Cruz Arenal Yoro Miramar 9 Subterránea 8 Ganadero pasto no no
186 Mejía Rodríguez Adan Ernesto Pineda La Envidia Olanchito Rexx 35 Superficial 18 Ganadero pasto no no
187 Mejía Rodríguez Cesar Emilson Diaz Martínez La Envidia Olanchito Finca Emily 44 Subterránea 44 Ganadero Pasto no na
188 Mejía Rodríguez Delmy Yolanda Martínez La Envidia Olanchito *********** 1 Subterránea 1 Ganadero Pasto no na
189 Mejía Rodríguez Difredo HilaRío Romero La Envidia Olanchito La Esperanza 70 Subterránea 70 Ganadero pasto no no
190 Mejía Rodríguez Enil Osmin Cárcamo La Envidia Olanchito Monterreal Serrano 70 Subterránea 35 Ganadero Pasto no na
191 Mejía Rodríguez Julio Cesar Mejía Diaz La Envidia Olanchito El Paraiso 105 Subterránea 95 Ganadero Pasto no na
192 Mejía Rodríguez Leila Mariela Ochoa Gonzales La Envidia Olanchito Finca Leyla 42 Subterránea 21 Ganadero Pasto no na
193 Mejía Rodríguez Luis Enrique Meza Romero La Envidia Olanchito La Bendicion 42 Subterránea 11 Ganadero Pasto no na
194 Mejía Rodríguez Marlen Susana Diaz La Envidia Olanchito Marx 18 Superficial 18 Ganadero pasto no no
195 Mejía Rodríguez Oscar Armando Cano La Envidia Olanchito El Triangulo 21 Superficial 21 Ganadero pasto no no
196 Mejía Rodríguez Ramon Concepcion Cárcamo La Envidia Olanchito Campo Zoyo 17 Superficial 70 Ganadero pasto no no
197 Mejía Rodríguez Ramon Heriberto Murillo La Envidia Olanchito Villa Mary 55 Superficial 18 Ganadero pasto no no
198 Mejía Rodríguez Santos de Olivane Alvarado Zap La Envidia Olanchito Los Tres Potrillos 112 Subterránea 35 Ganadero Pasto no na
199 Puerto Lozano Danilo Salomón Estrada Machig San Jerónimo Olanchito La Vega 27 Subterránea 27 Ganadero Pasto si Aspersión
200 Puerto Lozano Elio Manuel Ocampo San Jerónimo Olanchito Rancho La Vega 14 Río Aguan 14 Ganadero Pasto no no
201 Puerto Lozano Enirson Arnoldo Fúnez Lozano San Jerónimo Olanchito Brisas del Aguan 56 Subterránea 28 Ganadero Granos Básicos, Pasto si Aspersión
202 Puerto Lozano Evelio Martínez San Jerónimo Olanchito Culuco 53 Subterránea 12 Ganadero pasto no no
203 Puerto Lozano Fco Javier Funes Ortega San Jerónimo Olanchito Los Hermanos 13 Río San Marcos 4 Ganadero pasto no no
204 Puerto Lozano Jeronimo Hernández San Jerónimo Olanchito Villa Ana 39 Superficial 28 Ganadero pasto no no
205 Puerto Lozano José Armando Lozano Puerto San Jerónimo Olanchito Rancho Yina 56 Superficial 21 Ganadero Pasto no no
206 Puerto Lozano Juan Ramón Vargas San Jerónimo Olanchito Mira Playa 56 Subterránea 8 Ganadero Pasto no no
207 Puerto Lozano Julio Cesar Bustillo San Jerónimo Olanchito Culuco 39 Superficial 14 Ganadero pasto si si
208 Puerto Lozano Natividad vargas San Jerónimo Olanchito El Chaguite 42 Subterránea 21 Ganadero Pasto no no
209 Puerto Lozano Oscar René Bertrand San Jerónimo Olanchito Los Profesores 35 Superficial 14 Ganadero Pasto si Aspersión
210 Puerto Lozano Ramón Ulises Puerto San Jerónimo Olanchito La Bodega 39 Subterránea 39 Ganadero Pasto no no
211 Puerto Lozano Reina Puerto San Jerónimo Olanchito Guaracan 8 Subterránea 8 Ganadero pasto no no
212 Puerto Lozano Roger Puerto Turcios San Jerónimo Olanchito Puerto Alegre 117 Subterránea 28 Ganadero Pasto no no
213 Salinas Gonzales Constantino Valeriano Gonzale Coyoles aldea Olanchito El Bunker 18 Subterránea 18 Ganadero Pasto si Aspersión
214 Salinas Gonzales Dilia Zumilda Duarte Coyoles aldea Olanchito Los Guayacones 21 Superficial 3 Ganadero pasto no no
215 Salinas Gonzales Edman Orlando Zelaya Martíne Coyoles aldea Olanchito San Luis 70 Superficial 7 Ganadero Pasto no no
216 Salinas Gonzales Jesus Reyes Martínez Coyoles aldea Olanchito Rancho Geisy 28 Subterránea 28 Ganadero pasto no si
217 Salinas Gonzales Jhimy Armando Zelaya Coyoles aldea Olanchito Rancho Alegre 70 Subterránea 4 Ganadero Pasto no no
218 Salinas Gonzales José Orlando Mejía Coyoles aldea Olanchito El Tanque 8 Superficial 8 Ganadero Pasto no no
219 Salinas Gonzales Kidia Valessa Zelaya Martínez Coyoles aldea Olanchito Agua Blanca 43 Subterránea 4 Ganadero Pasto no no
220 Salinas Gonzales Osman Renan Salinas Puerto Coyoles aldea Olanchito Rancho El Limon 42 Superficial 4 Ganadero pasto si si
221 Salinas Gonzales Selvin Orlando Vargas Coyoles aldea Olanchito El Paraiso 49 Superficial 21 Ganadero Pasto no no
222 Salinas Gonzales Victor Gonzales Coyoles aldea Olanchito Victoria 203 Subterránea 203 Ganadero pasto no no
223 Salinas Gonzales Francisco Salinas Coyoles Olanchito 84 Subterránea 7 Ganadero Pasto no na
224 Salinas Gonzales German Aguirre Orellana Coyoles Olanchito 42 Subterránea 7 Ganadero Pasto no na
225 Salinas Gonzales Gloria Gonzales Coyoles Olanchito 42 Subterránea 7 Ganadero Pasto no na
Environmental Resources Management Annex 2-3 PAA PROJECT FINANCE A/S

Nº BENEFICIAR IO CREL Nombre del Productor Comunidad Municipio Nombre de la finca Area (Ha) Disponibilidad de agua para
irrigación
Area disponible de
riego (ha)
Tipo de Productor Tipos de Cultivos Cuenta con
sistema de riego
Tipo de
sistema con
que cuenta
226 Salinas Gonzales Jose Ricardo Ramos Coyoles Olanchito 56 Subterránea 7 Ganadero Pasto no na
227 Salinas Gonzales Luis Alonzo Rosales Coyoles Olanchito 70 Subterránea 14 Ganadero Pasto no na
228 Salvador Figueroa Armando Sosa El Bambú Olanchito Unión de Hermanos 35 Río Cahuaca 35 Ganadero Pasto no no
229 Salvador Figueroa José Nicolas Fúnez Tejada El Bambú Olanchito El Mango 140 Subterránea 53 Agricultor y Ganadero Palma, Pasto no no
230 Salvador Figueroa Wilfredo Sosa El Bambú Olanchito Rancho La Concepción 21 Subterránea 21 Ganadero Pasto no no
231 Superación Nelson Darío Navarro Aquino Río Abajo Jocon Rancho Nacho 21 Superficial 4 ganadero Sorgo si tiene abunda
232 Superación Carlos Humberto Urbina Cruz Río Abajo Jocon La Concepción 7 Ambos 0 Agricultor y Ganadero maiz,frijol, sa no
233 Superación Jorge Enrique Urbina Cruz Río Abajo Jocon La Concepción 19 Superficial 19 Agricultor y Ganadero leche,sandia, no
234 Superación Victor Manuel Puerto Suazo Las Delicias, San M Olanchito Los Tres Hermanos 0 Subterránea 21 Ganadero Pasto no
235 Superación Carlos Alberto Bourdeth Las Delicias, San M Olanchito Villa Lala 7 Subterránea 7 Ganadero Pasto no
236 Superación Jose Antonio Valle Urbina Las Delicias, San M Olanchito El Sauce 84 Subterránea 7 Ganadero Pasto no
237 Superación Manuel Santiago Murillo Contr Las Delicias, San M Olanchito 3 Subterránea 3 Ganadero Pasto no
238 Superación Enil Josue Murillo Contreras Las Delicias, San M Olanchito Los Olivos 21 Subterránea 21 Ganadero Pasto no
239 Superación Marco Antonio Mejía Perez Las Delicias, San M Olanchito La Estación 15 Subterránea 15 Ganadero Pasto no
240 Superación Marco Antonio Urbina Cruz Las Delicias, San M Olanchito Las Brisas 42 Subterránea 42 Ganadero Pasto no
241 Superación Adilio Cruz Salmeron Las Delicias, San M Olanchito Río Abajo 4 Subterránea 4 Ganadero Pasto no
242 Superación Carlos Roberto Urbina Las Delicias, San M Olanchito Las Delicias 70 Subterránea 70 Ganadero Pasto no
243 Superación Cesar Agusto Romero Arteaga Las Delicias, San M Olanchito Estación 21 Subterránea 21 Agricultor y Ganadero Pasto no
244 Superación Ramon Reynerio Urbina Sandov Las Delicias, San M Olanchito Rancho Victoria 0 Subterránea 7 Ganadero Pasto no no
245 Andino Munguía Abel Posas Calpules Aldea Olanchito Piñon 39 Ambos 39 Ganadero Pasto no no
246 Independiente Nora Azucena Galindo Lozano Nombre de Jesus Olanchito Los 4 Hermanos 130 Superficial 130 Ganadero Pasto no no
247 Andino Munguía Carlos Darío Romero Calpules Aldea Olanchito Casa Blanca 11 Superficial 11 Ganadero Pasto no no
248 Andino Munguía Emil Edgardo Martinez Calpules Aldea Olanchito Agua Blanca 28 Subterranea 28 Ganadero Pasto no no
249 Andino Munguía Carlos alberto Melendez Calpules Aldea Olanchito Agua Blanca 38 Subterranea 38 Agricultor y Ganadero Pasto y Maiz no no
250 Andino Munguía Pablo Antonio Melendez Calpules Aldea Olanchito El Higuero 21 Subterranea 21 Agricultor y Ganadero Pasto y Maiz no no
251 Independiente Jorge Antonio Munguia Melend Calpules Aldea Olanchito Hacienda Jalisco 14 Subterranea 14 Ganadero Pasto no no
252 CRELCA Concepción Calpules Aldea Olanchito El Cabloal 21 Ambos 21 Ganadero Pasto no no
253 CRELCA Jose leonardo Hernandez Andin Calpules Aldea Olanchito Brazilete 11 Subterranea 11 Ganadero Pasto no no
254 CRELCA Julio Melendez Calpules Aldea Olanchito El Heredero 27 Ambos 27 Ganadero Pasto no
255 CRELCA Calpules Aldea Calpules Aldea Olanchito El Mango 35 Ambos 14 Agricultor y Ganadero maiz, pasto no no
256 Mejía Rodríguez la Envidia Calpules Aldea Olanchito Villa El Carmen 35 Ambos 14 Agricultor y Ganadero Pasto no no
257 Independiente Ana Olinda Mejía Puerto San Jose Aldea Olanchito Cucapa 70 Ambos 70 Agricultor y Ganadero Pasto no no
258 Mejía Rodríguez David Antonio Funez Mejia La Envidia los Toloas 21 Ambos 21 Agricultor y Ganadero Pasto no no
259 Independiente Luis Martinez Tejeras Olanchito 0 Subterranea 0 Ganadero Pasto no no
260 Bustillo Martínez Saul Bustillo Tejeras Olanchito Local del creel 1 Ambos 1 Ganadero Pasto si Aspersión
261 Bustillo Martínez Basilio Bustillo Santa Bárbara Olanchito El Higuero 4 Subterranea 4 Ganadero Pasto no no
262 Bustillo Martínez Jose Andres Lozano Santa Bárbara Olanchito Rancho Lucita 26 Subterranea 26 Ganadero Pasto no no
263 Bustillo Martínez Juan Blas Puerto Santa Bárbara Olanchito Villa Zoila 28 Superficial 28 Ganadero Pasto no no
264 Bustillo Martínez Amilcar Reyes Santa Bárbara Olanchito Rancho Aguan 49 Superficial 49 Ganadero Pasto no no
265 Bustillo Martínez Walter Martinez Trochez Tejeras,Olanchito Olanchito Rancho Norteño 32 Superficial 32 Ganadero Pasto no no
266 Bustillo Martínez Miguel Angel Galeas Puerto Tejeras,Olanchito Olanchito Rancho Galeas 36 Ambos 14 Ganadero Pasto si no
267 Bustillo Martínez Irene Martinez Santa Bárbara Olanchito Brisas de Aguan 56 Ambos 56 Ganadero Pasto no no
268 Bustillo Martínez Carmen Gerardina Martinez Santa Bárbara Olanchito Tolondron 84 Ambos 4 Ganadero Pasto si no
269 Bustillo Martínez Juan Blas Bustillo Tacualtuste Olanchito Angelica 25 Subterranea 21 Ganadero Pasto si no
270 Bustillo Martínez Jose Ramon Rosales Santa Bárbara Olanchito El tres de vasto 56 Superficial 35 Agricultor y Ganadero Pasto y Maiz no no
271 Bustillo Martínez Guillermo Francisco Florea Bust Santa Bárbara Olanchito La Ceiba 21 Ambos 21 Agricultor y Ganadero Pasto no no
272 Independiente Milton Jesus Puerto Oseguera San Juan Olanchito Las Bujajas 175 Ambos 105 Agricultor y Ganadero Pasto Si no
273 Cruz Nuñez Denis Omar Garcia Puerto San Marcos Olanchito Rio Chiquito 70 Ambos 18 Ganadero Pasto no no
274 Cruz Nuñez Carlos Alberto Estrada Calbatos San Marcos Olanchito paso de rio San Marcos a 35 Superficial 28 Agricultor y Ganadero Pasto si no
275 Cruz Nuñez Lauro Nuñez San Marcos Olanchito Rio Chiquito 105 Superficial 28 Ganadero Pasto si no
276 Cruz Nuñez Melvin Urbina Nuñez San Marcos Olanchito Rio Aguacate 140 Superficial 18 Ganadero Pasto no no
277 Cruz Nuñez Jose Antonio Salas San Marcos Olanchito Las Flores 196 Ambos 35 Ganadero Pasto si no
278 Armín Jerónimo Figueroa Carlos Urribiera San Francisco Olanchito EL Bosque 28 Ambos 8 Agricultor y Ganadero Pasto no no
279 Armín Jerónimo Figueroa Roger Dario Nuñez San Francisco Olanchito Cantarranas 28 Subterranea 28 Ganadero Pasto no no
280 Armín Jerónimo Figueroa Jairo Cruz San Francisco Olanchito La permuta 70 Subterranea 14 Ganadero Pasto no no
281 Armín Jerónimo Figueroa Mabel Figueroa San Francisco Olanchito Mabel Figueroa 53 Superficial 53 Ganadero Pasto no no
282 Armín Jerónimo Figueroa Jose Luis Nuñez Sondres San Francisco Olanchito Jose Luis Nuñez Sandres 49 Subterranea 49 Agricultor y Ganadero Pasto no no
283 Armín Jerónimo Figueroa Onis Hayde Saandoval San Francisco Olanchito El Paraiso 74 Subterranea 42 Ganadero Pasto no no
284 Independiente Jose leonardo Miranda Quezad Puerto Escondido Olanchito Finca Oropel 140 Subterranea 35 Agricultor y Ganadero Pasto si Aspersión
285 Fabricio Puerto Ramon Melendez Sabana San Carlos Olanchito Creel Fabricio Puerto 4 Subterranea 4 Ganadero Pasto no no
286 Heberto Chirinos Ponce Jorge Alfonzo Zelaya Juncal Olanchito Janine 51 Subterranea 42 Ganadero Pasto no no
287 Heberto Chirinos Ponce Adalberto Mejia Soto Juncal Olanchito La Esperanza 21 Ambos 14 Agricultor y Ganadero Pasto y Maiz no no
288 Heberto Chirinos Ponce Wilfredo Soto Mejia Juncal Olanchito El Barracon 20 Superficial 14 Agricultor y Ganadero Pasto y Maiz no no
289 Heberto Chirinos Ponce Jose luis Mendoza Rivera Juncal Olanchito el guanacaste 28 Subterranea 21 Agricultor y Ganadero Pasto no no
290 Heberto Chirinos Ponce Jorge Arturo Colindres Carcamo Juncal Olanchito El eden 42 Subterranea 42 Agricultor y Ganadero Pasto no no
291 Heberto Chirinos Ponce Carlos Augusto Zelaya Rivera Juncal Olanchito Los Carlos 42 Subterranea 7 Agricultor y Ganadero Pasto y Maiz no no
292 Martínez Lobo Justo Roberto Puerto Tinoco Santa Cruz Arenal Modelo 123 Subterranea 11 Ganadero Pasto no no
293 Martínez Lobo Jose Arturo Mejia Santa Cruz Arenal Rancho Durango 229 Subterranea 14 Ganadero Pasto no no
294 Martínez Lobo Francisco Joaquin Romero Santa Cruz Arenal La Esperanza 104 Subterranea 104 Ganadero Pastos no no
295 Martínez Lobo Samuel Mendoza Santa Cruz Arenal Rancho Chitor 35 Subterranea 20 Ganadero Pastos no no
296 Martínez Lobo Amilcar Lobo Santa Cruz Arenal no tiene 21 Subterranea 18 Ganadero Pastos no no
297 Martínez Lobo Hector Danilo Mejia Romero Santa Cruz Arenal Rancho Grande 120 Subterranea 14 Ganadero Pasto no no
298 Leopoldo Duran Dueñas Marco Antonio Cruz Ocampo San Patricio Olanchito Hacienda Ocote Alto 56 Subterranea 42 Ganadero Pastos no no
299 Leopoldo Duran Dueñas Rony Rogelio Nuñez Cruz San Patricio Olanchito Villa el Carmen 28 Superficial 28 Ganadero Pastos no no
300 Leopoldo Duran Dueñas Fredis Felipe Cruz Ocampo San Patricio Olanchito Monte de Sion 42 Superficial 28 Ganadero Pasto no no
301 Independiente Wladimiro Lozano Avila Olanchito Olanchito 18 Ambos 18 Ganadero Pasto no no
Note: Potential beneficiaries highlighted in orange refer to the 227 potential beneficiaries who met the preliminary selection criteria based on the CINSA and PAA Project Finance preliminary assessment conducted in 2017
Environmental Resources Management Annex 2-4 PAA PROJECT FINANCE A/S

Proyected Coordinate System: WGS_1984_UTM_Zone_16NDatum: D_WGS_1984
Aguan Irrigation Project
ERM Iberia S.A. Paseo de la Castellana 184, 3º28046 Madrid
Tel. +34 91 411 1440Fax +34 91 563 6213
1
Progetto:
Potential BeneficiariesClient
0463668
Site
EFDAMCPA3 map1.mxd00
Figure:
Version
Scale
DateAugust 2018
HONDURASOlanchito
Project Number
Pro ject
FilePaper Author Reviewed by Pro ject Manager
!.
!.
!.
!.
!.
!.
!.
!.
!.
!.
!.
!(
!(
!(
!(
!( !(
!(
!( !(!(
!(
!(
!(
!(
!(!(
!(
!(
!(!(
!(
!(
!(
!(
!(
!( !(
!(
!(
!(
!(
!(!(
!( !(
!(
!(
!(
!(
!(
!(
!(
!(
!(
!(
!(
!(
!(
!(!(
!( !(!(
!(
!(
!(!(
!(
!(
!(!(
!(
!(!(
!(
!(
!(
!(
!(
!(
!(!(
!(
!(!(
!(
!(
!(
!(
!(
!(
!(
!(
!(
!(
!(
!(
!(
!(!(
!(
!(!(
!(
!(
!(
!(
!(
!(
!(
!(
!(
!(
!(
!(
!(
!( !(
!(
!(
!(
!(
!(
!(
!(
!(
!(
!(
!(
!(
!(
!(
!(!(
!(!(!( !(!(
!(
!(
!(
!(
!(
!(
!(
!(
!(!(
!(
!(!(!(
!(
!(
!(
!(
!(
!(
!(!(
!(
!(
!(
!(!(
!(
!(
!(
!(!(
!(
!(
!(
!(
!(
!(
!(!(
!(
!(!(
!(
!(
!(
!(
!(
!(
!(
!(
!(
!(!(
!(
!(
!(
!(
!(!(
!(
!(!(
!(
!( !(!(
!(
!(
!(
!(
!(
!(!(
!(
!(
!( !( !(!(!(
!(
!(
!(!(
!(
!(
!(
!(
!(
!(
!(
!( !(
!(
!(
!(
!(
!(
!(
!(!(
!(
!(
!(
!(
!(
!(!(
!(
L a C e ibaJ u t i apa
SanFrancisco
B a l f ate
Saba
S o n a g uera
E s q u i p u l a s del Norte
Gualaco
G u a ta
J a no
L a U n ion
M a n g u lile
Y o ro
A r e nal
J o c on
O l a n c hito
E l P o r v enir
El Porvenir Jutiapa
Sonagüera
Esquipulasdel Norte
Arenal
Jocón
Olanchito
21
25
36 4243 44
4654
5660
67
77 86
89
91100
109112
118120
125
139
151
156163
170171 174177
178
179
181 182
188189
190192
193
203
214
217
219220
231
232
233
234
237
240241242
243 245
1
2 34
5 67
89
1011
12
13
14
15
16
17
18 19
20
2223 24
26
27 28
29
30
3133
34
35
37
39
40
4145
47
484950
515253
55
5758
59
61
6364
6566
686970
71
72
73
7475
76
78
79 8081
8283
8485
87
88
90
92 9394
95
9697
9899
101
102
103
104105
106
107108
110 111
113
114
115
62
116
117 119
121
122
123
124
126127
128
129
130
131
132
133
134135
137
138
140141
142
144146
148
149
152
153
154
155
157
158
159
160161
162 164
165
166
167169 172
173175
176
180183184
185186
187
191
194195
196
197 198
199
200201 202
204
205
206207208
209
210
211
212
213
215
216218
221
222223224
225
226
227
228 229230
235236
239
244
246
247
38
0 2 4km
see graphic scale®
Legend!(
POTENTIAL BENEFICIARIES WHO METTHE PRELIMINARY CRITERIA (227) (*)
!(
POTENTIAL BENEFICIARIES WHO DIDNOT MEET THE PRELIMINARY CRITERIA(74) (*)PROYECT AREA
!. MUNICIPAL CENTERMUNICIPAL LIMITHONDURAS NATIONAL BOUNDARY
Note:(*) Based on findings of November 2017 field survey by CINSA andPAA Project Finance

ENVIRONMENTAL RESOURCES MANAGEMENT PAA PROJECT FINANCE A/S
ANNEX 3-1
ANNEX 3
FIELD SURVEY PHOTO LOG

ENVIRONMENTAL RESOURCES MANAGEMENT PAA PROJECT FINANCE A/S
ANNEX 3-1
ANNEX 1.1
FIELD SURVEY 2017

ENVIRONMENTAL RESOURCES MANAGEMENT PAA PROJECT FINANCE A/S
ANNEX 3-2
(11/2017)
On-site sessions and interviews with stakeholders, CRELES and beneficiaries.
(11/2017)
On-site sessions and interviews with stakeholders, CRELES and beneficiaries.
(11/2017)
On-site sessions and interviews with stakeholders, CRELES and beneficiaries.
(11/2017)
On-site sessions and interviews with stakeholders, CRELES and beneficiaries.
(08/11/2017)
Interview with director of ASIDE in RVSCEH.
(19/06/2017)
Interview with director of ASIDE in RVSCE.

ENVIRONMENTAL RESOURCES MANAGEMENT PAA PROJECT FINANCE A/S
ANNEX 3-3
(08/11/2017)
Interview with director of ASIDE in RVSCEH.
(08/11/2017)
Interview with director of ASIDE in RVSCEH.
(08/11/2017)
Visit to CREL Cruz – Núñez: possible beneficiary.
(08/11/2017)
Interview with producer in Santa Rosa.
(08/11/2017)
Interview with producer belonging to CREL Leopoldo Duran Dueñas San Patricio
community.
(08/11/2017)
Interview with producers of right side of Aguan River.

ENVIRONMENTAL RESOURCES MANAGEMENT PAA PROJECT FINANCE A/S
ANNEX 3-4
(08/11/2017)
Visit of a possible superficial water source in San Marcos river in Santa Rosa.
(08/11/2017)
Rancho Don Juan, using underground water source.
(08/11/2017)
Protection stall for underground well in Leopoldo Duran Dueñas.
(08/11/2017)
Underground well with pump beside Aguan River.
(08/11/2017)
Underground well with pump beside Aguan River.
(08/11/2017)
Rogelio Cruz, Ocotes Altos: underground well.
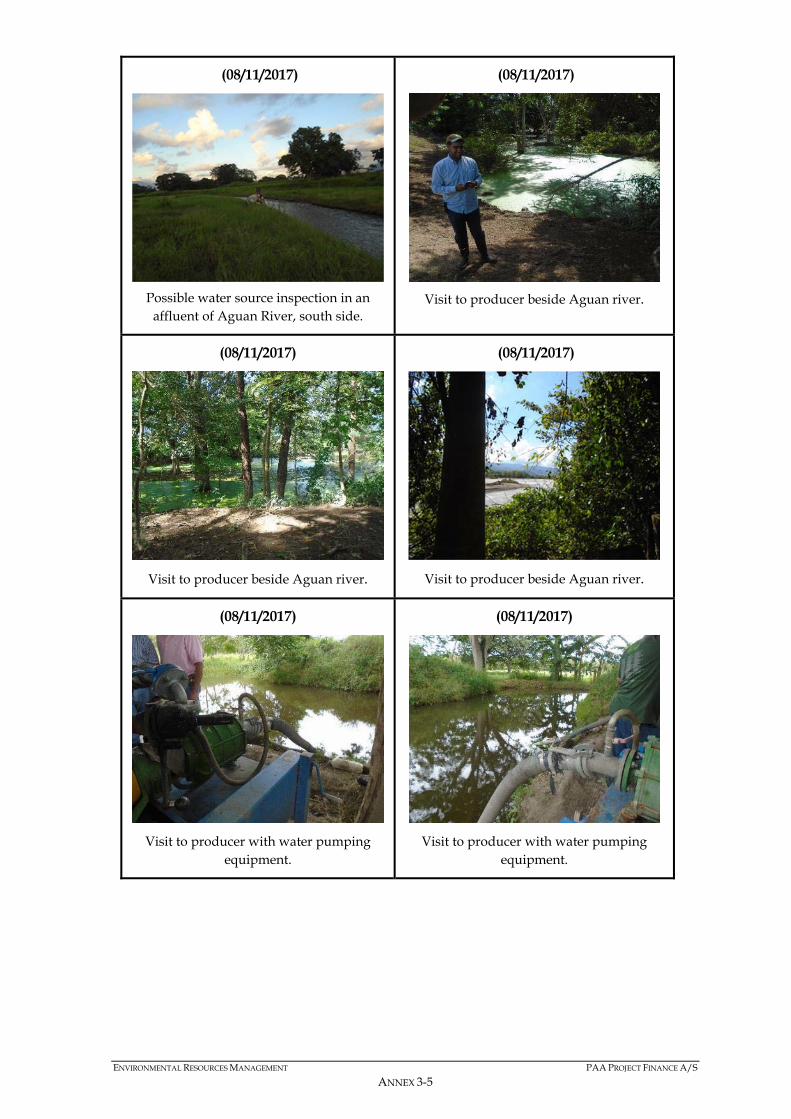
ENVIRONMENTAL RESOURCES MANAGEMENT PAA PROJECT FINANCE A/S
ANNEX 3-5
(08/11/2017)
Possible water source inspection in an affluent of Aguan River, south side.
(08/11/2017)
Visit to producer beside Aguan river.
(08/11/2017)
Visit to producer beside Aguan river.
(08/11/2017)
Visit to producer beside Aguan river.
(08/11/2017)
Visit to producer with water pumping equipment.
(08/11/2017)
Visit to producer with water pumping equipment.

ENVIRONMENTAL RESOURCES MANAGEMENT PAA PROJECT FINANCE A/S
ANNEX 3-6
(08/11/2017)
Possible water source inspection in an affluent of Aguan River, south side.
(08/11/2017)
Visit to Production area in Hacienda Santa Rosa.
(08/11/2017)
Production area.
(08/11/2017)
Beef cattle stall in Rancho Don Juan.
(08/11/2017)
Corn production area of producer belonging to CREL Leopoldo Duran
Dueñas.
(08/11/2017)
Beef cattle stalls in Rogelio Cruz, Ocotes Altos.

ENVIRONMENTAL RESOURCES MANAGEMENT PAA PROJECT FINANCE A/S
ANNEX 3-7
(08/11/2017)
Storage and milk cooling infrastructure in CREL Leopoldo Duran Dueñas San
Patricio’s community.
(08/11/2017)
CREL Salvador F.
(08/11/2017)
CREL Fabricio y Puerto y Asociados.
(08/11/2017)
CREL Superación.
(08/11/2017)
CREL Mejía Rodríguez.
(08/11/2017)
Well drilling.

ENVIRONMENTAL RESOURCES MANAGEMENT PAA PROJECT FINANCE A/S
ANNEX 3-8
(08/11/2017)
Well drilling.
(08/11/2017)
Dry Tropical Forest.
(08/11/2017)
Dry Tropical Forest.
(08/11/2017)
Aguan river in Arenal
(08/11/2017)
CREL Mejía Rodríguez.
(08/11/2017)
Well drilling.

ENVIRONMENTAL RESOURCES MANAGEMENT PAA PROJECT FINANCE A/S
ANNEX 3-9
(08/11/2017)
Visit of a possible superficial water source in San Marcos river in Santa Rosa.
(08/11/2017)
Visit of a possible superficial water source in San Marcos river in Santa Rosa.
(08/11/2017)
Dry Tropical Forest.
(08/11/2017)
Aguan river in Arenal.
(08/11/2017)
CREL Mejía Rodríguez.
(08/11/2017)
Interview with director of ASIDE in
RVSCEH.

ENVIRONMENTAL RESOURCES MANAGEMENT PAA PROJECT FINANCE A/S
ANNEX 3-10
(08/11/2017)
Interview with director of ASIDE in RVSCEH.
(08/11/2017)
Interview with director of ASIDE in RVSCEH.
(08/11/2017)
Interview with director of ASIDE in RVSCEH.
(08/11/2017)
Rancho Don Juan, using underground water source.
(08/11/2017)
Rancho Don Juan, using underground water source.
(08/11/2017)
Rancho Don Juan, using underground water source.

ENVIRONMENTAL RESOURCES MANAGEMENT PAA PROJECT FINANCE A/S
ANNEX 3-12
FSL-01 (21/06/2018)
Banana plantation (background) near Arenal
FSL-02 (23/06/2018)
Hummingbird in the hotel in Olanchito
FSL-03 (19/06/2018)
SAGO site in Olanchito
FSL-04 (19/06/2018)
Main building of CREL Tejeras
FSL-05 (19/06/2018)
Arable field, surrounded by irrigated forage field (camerún) in farm #30

ENVIRONMENTAL RESOURCES MANAGEMENT PAA PROJECT FINANCE A/S
ANNEX 3-13
FSL-05 (19/06/2018)
Tractor in farm #30
FSL-05 (19/06/2018)
Herbicide (combatran) in farm #30
FSL-06 (19/06/2018)
Groundwater well in farm #30
FSL-07 (26/06/2018)
Soil profile: gravels and pebbles in a sandy matrix
FSL-08 (20/06/2018)
Forage in farm #165
FSL-08 (20/06/2018)
Cowhouse in farm #165

ENVIRONMENTAL RESOURCES MANAGEMENT PAA PROJECT FINANCE A/S
ANNEX 3-14
FSL-09 (20/06/2018)
CREL building where meeting with representatives of different CRELES is
conducted
FSL-10 (21/06/2018)
Aguan River: high turbidity due to recent rainfalls
FSL-11 (22/06/2018)
Main building of SAG in Olanchito
FSL-12 (22/06/2018)
CREL Salinas Gonzales y Asociados, where the meeting with farmers owning small
farms is conducted
FSL-12 (20/06/2018)
CREL Salinas Gonzales y Asociados: WC with septic tank system by filtration to the
subsoil
FSL-12 (22/06/2018)
CREL Salinas Gonzales y Asociados: tree plantation for generation of wood

ENVIRONMENTAL RESOURCES MANAGEMENT PAA PROJECT FINANCE A/S
ANNEX 3-15
FSL-13 (23/06/2018)
Forage in the western section of the Project Area, near the community of Perritos
FSL-14 (23/06/2018)
San Marcos River: low water level
FSL-15 (23/06/2018)
Forage plantation in San Lorenzo de Arriba. Some cattle is observed in the background
FSL-15 (23/06/2018)
Detail of forage plantation in San Lorenzo de Arriba
FSL-15 (23/06/2018)
Dead turtle found in farm in San Lorenzo de Arriba
FSL-16 (23/06/2018)
White-headed capuchin (Cebus capucinus) in the Tourism Center La Mora

ENVIRONMENTAL RESOURCES MANAGEMENT PAA PROJECT FINANCE A/S
ANNEX 3-16
FSL-16 (23/06/2018)
White-tailed deer (Odocoileus virginianus) in the Tourism Center La Mora
FSL-17 (23/06/2018)
Asphalted road, fence, telephone cables and electrical line
FSL-18 (23/06/2018)
Electrical line and fence next to the road
FSL-18 (23/06/2018)
Forage, fence, pond and electrical line next to the road
FSL-18 (23/06/2018)
Deciduous vegetation
FSL-18 (23/06/2018)
Transport by horse

ENVIRONMENTAL RESOURCES MANAGEMENT PAA PROJECT FINANCE A/S
ANNEX 3-17
FSL-19 (23/06/2018)
Very dry tropical forest
FSL-20 (23/06/2018)
Road and communication antenna
FSL-21 (23/06/2018)
Farm next to the road: aerial water storage tank
FSL-21 (23/06/2018)
Farm next to the road: low tree density
FSL-21 (23/06/2018)
Farm next to the road: low tree density
FSL-22 (23/06/2018)
Village next to the road

ENVIRONMENTAL RESOURCES MANAGEMENT PAA PROJECT FINANCE A/S
ANNEX 3-18
FSL-23 (23/06/2018)
Water reservoir next to the road. Great white egrets (Ardea alba)
FSL-23 (23/06/2018)
Water reservoir next to the road. Great white egrets (Ardea alba)
FSL-24 (23/06/2018)
Village of Coyoles
FSL-24 (23/06/2018)
DOLE facilities in Coyoles
FSL-24 (23/06/2018)
Petrol station in Coyoles
FSL-24 (23/06/2018)
Shop in Coyoles

ENVIRONMENTAL RESOURCES MANAGEMENT PAA PROJECT FINANCE A/S
ANNEX 3-19
FSL-25 (23/06/2018)
Signal of a water purification system
FSL-25 (23/06/2018)
Road and community where the signal of a water purification system was found
FSL-26 (23/06/2018)
Wood processing facility next to road
FSL-27 (23/06/2018)
Irrigation system in a forage crop
FSL-27 (23/06/2018)
People leaving protected area with wood
FSL-27 (23/06/2018)
Bird in electrical line

ENVIRONMENTAL RESOURCES MANAGEMENT PAA PROJECT FINANCE A/S
ANNEX 3-20
FSL-28 (23/06/2018)
New urban area development in Olanchito
FSL-29 (23/06/2018)
African Palm plantation
FSL-29 (23/06/2018)
Forage crop
FSL-30 (23/06/2018)
Orange plantation
FSL-31 (31/06/2018)
Irrigation system
FSL-31 (23/06/2018)
Banana plantation

ENVIRONMENTAL RESOURCES MANAGEMENT PAA PROJECT FINANCE A/S
ANNEX 3-21
FSL-32 (23/06/2018)
Aguan River: brown color of water due to sediments
FSL-32 (23/06/2018)
View of the Aguan River from bridge. A great white heron observed
FSL-32 (23/06/2018)
Sand and gravel extraction in the Aguan River
FSL-32 (23/06/2018)
Abandoned/stolen emergency water level station
FSL-32 (31/06/2018)
Abandoned/stolen meteorological station
FSL-33 (24/06/2018)
Hospital Dr. Anibal Murillo in Olanchito

ENVIRONMENTAL RESOURCES MANAGEMENT PAA PROJECT FINANCE A/S
ANNEX 3-22
FSL-33 (26/06/2018)
Bioproduct used to fight vector diseases
FSL-33 (26/06/2018)
Map of vector disease cases in the area of Olanchito
FSL-34 (24/06/2018)
Unpaved streets and church in the community of Juncal
FSL-35 (24/06/2018)
Cowhouse under construction in farm #108
FSL-35 (31/06/2018)
Forage crop in farm #108
FSL-35 (24/06/2018)
Small silage in farm #108

ENVIRONMENTAL RESOURCES MANAGEMENT PAA PROJECT FINANCE A/S
ANNEX 3-23
FSL-35 (24/06/2018)
Forage crop and cattle in farm #108
FSL-36 (23/06/2018)
Groundwater well with pump in farm #108
FSL-37 (23/06/2018)
Pond and cow in farm #108
FSL-38 (24/06/2018)
Former water potabilization system in the community of Juncal
FSL-39 (24/06/2018)
Groundwater font the community of Juncal
FSL-39 (24/06/2018)
Petrol station owned by the CREL Eberto Chirinos Ponce
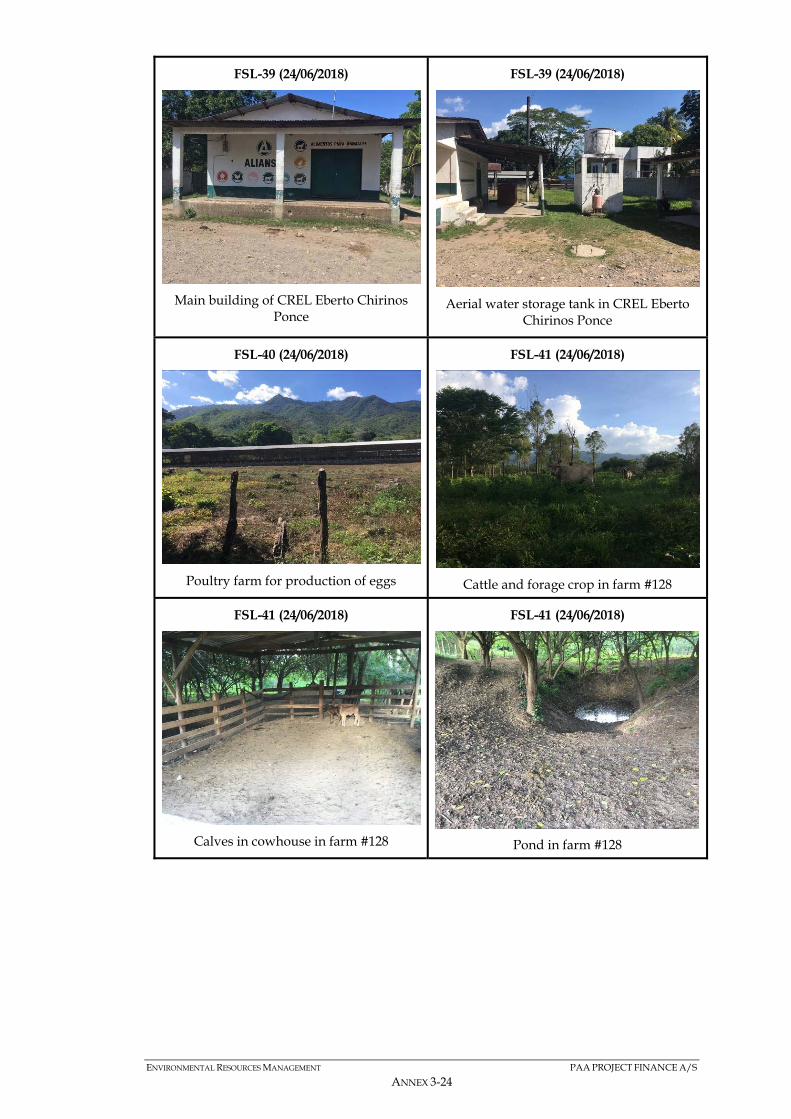
ENVIRONMENTAL RESOURCES MANAGEMENT PAA PROJECT FINANCE A/S
ANNEX 3-24
FSL-39 (24/06/2018)
Main building of CREL Eberto Chirinos Ponce
FSL-39 (24/06/2018)
Aerial water storage tank in CREL Eberto Chirinos Ponce
FSL-40 (24/06/2018)
Poultry farm for production of eggs
FSL-41 (24/06/2018)
Cattle and forage crop in farm #128
FSL-41 (24/06/2018)
Calves in cowhouse in farm #128
FSL-41 (24/06/2018)
Pond in farm #128

ENVIRONMENTAL RESOURCES MANAGEMENT PAA PROJECT FINANCE A/S
ANNEX 3-25
FSL-41 (24/06/2018)
Pond in farm #128
FSL-42 (24/06/2018)
Detail of banana plantation: plastic protection of fruits
FSL-43 (24/06/2018)
Groundwater well and pump
FSL-44 (26/06/2018)
Groundwater well in farm #71 providing water cattle consumption
FSL-44 (26/06/2018)
Water pile for the cattle in farm #71. Tadpoles are observed
FSL-44 (26/06/2018)
Forage in farm #71. In the background, natural vegetation kept by the farmer for
conservation purposes, even though it is not protected

ENVIRONMENTAL RESOURCES MANAGEMENT PAA PROJECT FINANCE A/S
ANNEX 3-26
FSL-44 (26/06/2018)
Cattle in farm #71
FSL-45 (26/06/2018)
Groundwater well in farm #71 providing water for human consumption
FSL-46 (25/06/2018)
Creek, tributary of Aguan River
FSL-46 (25/06/2018)
Degradation of natural habitats in upper areas of the valley into forage crops, typically used during the dry season
FSL-47 (25/06/2018)
CREL Cruz Nuñez, where meeting with AJASPIIB is conducted
FSL-47 (25/06/2018)
Milk conservation deposits in CREL Cruz Núñez
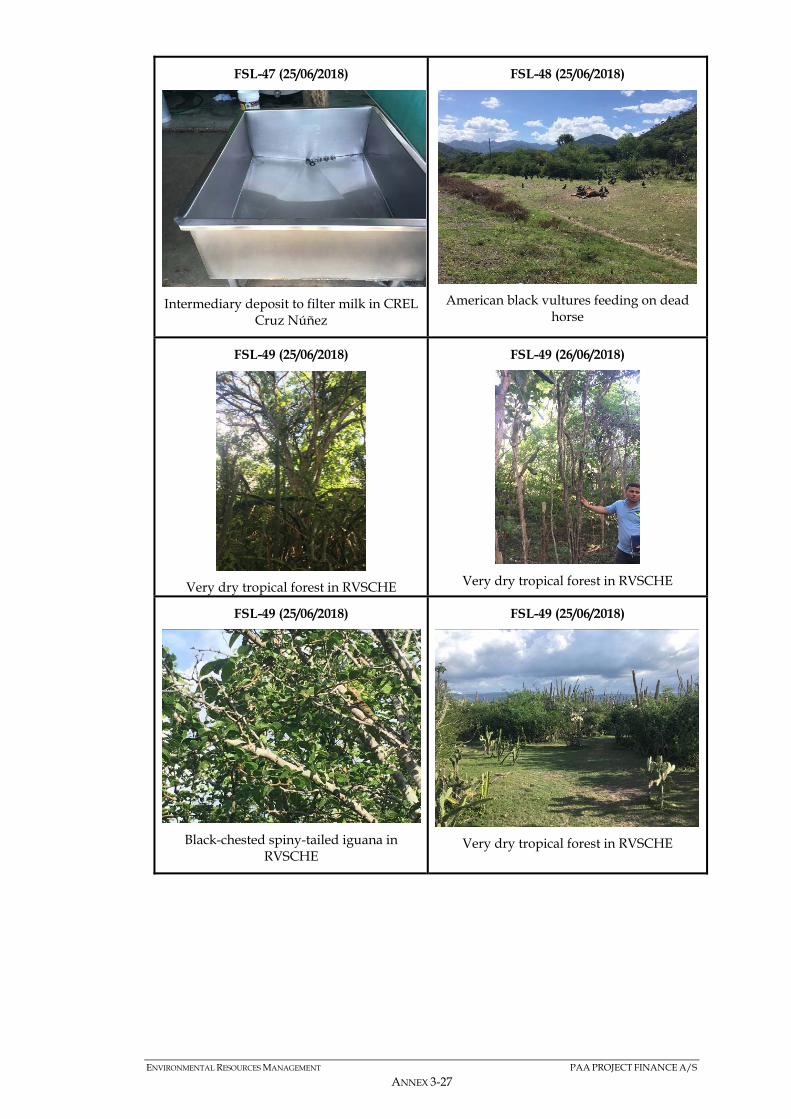
ENVIRONMENTAL RESOURCES MANAGEMENT PAA PROJECT FINANCE A/S
ANNEX 3-27
FSL-47 (25/06/2018)
Intermediary deposit to filter milk in CREL Cruz Núñez
FSL-48 (25/06/2018)
American black vultures feeding on dead horse
FSL-49 (25/06/2018)
Very dry tropical forest in RVSCHE
FSL-49 (26/06/2018)
Very dry tropical forest in RVSCHE
FSL-49 (25/06/2018)
Black-chested spiny-tailed iguana in RVSCHE
FSL-49 (25/06/2018)
Very dry tropical forest in RVSCHE

ENVIRONMENTAL RESOURCES MANAGEMENT PAA PROJECT FINANCE A/S
ANNEX 3-28
FSL-49 (25/06/2018)
Species of lizard in RVSCHE
FSL-49 (25/06/2018)
ASIDE offices in RVSCHE
FSL-50 (26/06/2018)
Soil profile: predominance of gravels
FSL-51 (26/06/2018)
Tributary of the Aguan River: good riverine vegetation
FSL-51 (26/06/2018)
Fishes in a tributary of the Aguan River
FSL-51 (26/06/2018)
Dead amphibian in a road next to a tributary of the Aguan River

ENVIRONMENTAL RESOURCES MANAGEMENT PAA PROJECT FINANCE A/S
ANNEX 3-29
FSL-52 (26/06/2018)
Forage crops in farm #71
FSL-52 (26/06/2018)
Forage crops and veteran tree in farm #71
FSL-52 (26/06/2018)
Medicinal plant (savila) in farm #71
FSL-52 (26/06/2018)
Forage crops in farm #71

ENVIRONMENTAL RESOURCES MANAGEMENT PAA PROJECT FINANCE A/S
ANNEX 3-10
ANNEX 1.2
FIELD SURVEY 2018

ANNEX 4
FIELD SURVEY MAPS

Geographic System: WGS_1984_UTM_Zone_16NDatum: D_WGS_1984
Aguan Irrigation Project
ERM Iberia S.A. Paseo de la Castellana 184, 3º28046 Madrid
Tel. +34 91 411 1440Fax +34 91 563 6213
1
Progetto:
Field Survey MapClient
0463668
Site
EFDAMCPA3 map1.mxd00
Figure:
Version
Scale
DateAugust 2018
HONDURASOlanchito
Project Number
Pro ject
FilePaper Author Reviewed by Pro ject Manager
!.
!.
!(
!(!(
!(
!(!(!(
!( !(
!(
!(
!(!( !( !( !( !( !(
!(!(
!(
!(
!(
!(
!(!( !(
!(!(!(
!(
!(
!(
!(!(!(
!(!(
!(
!(!(!(
!(
!(!(
!(
!(!(
!(!(!(
!(
Aguan River
Arenal
Olanchito
FSL-3FSL-6
FSL-11
FSL-16
FSL-17
FSL-25
FSL-30FSL-32
FSL-38
FSL-47 FSL-49
FSL-50
FSL-45
FSL-7
FSL-1
FSL-2FSL-4
FSL-5
FSL-8
FSL-9FSL-10
FSL-12
FSL-13FSL-14
FSL-15
FSL-18
FSL-19 FSL-20FSL-21
FSL-22FSL-23
FSL-24
FSL-26 FSL-27
FSL-28FSL-29 FSL-31
FSL-33 FSL-34FSL-35FSL-36
FSL-37
FSL-39FSL-40
FSL-41
FSL-42FSL-43
FSL-46
FSL-48
FSL-51
FSL-52 FSL-44
0 2 4km
see graphic scale®
Legend!( FIELD SURVEY LOCATIONS
PROYECT AREA!. MUNICIPAL CENTER
HYDROGRAPHIC NETWORKMAIN RIVERSECONDARY RIVERSHONDURAS NATIONAL BOUNDARY

Geographic System: WGS_1984_UTM_Zone_16NDatum: D_WGS_1984
Aguan Irrigation Project
ERM Iberia S.A. Paseo de la Castellana 184, 3º28046 Madrid
Tel. +34 91 411 1440Fax +34 91 563 6213
2
Progetto:
Physical BaselineField Survey Map
Client
0463668
Site
EFDAMCPA3 map2.mxd00
Figure:
Version
Scale
DateAugust 2018
HONDURASOlanchito
Project Number
Pro ject
FilePaper Author Reviewed by Pro ject Manager
!.
!.
!( !(!(
!(!(
!(
!(
!(
@A
@A
@A@A
@A
@A@A
!
!
!?
Aguan River
Arenal
Olanchito
FSL-7
FSL32FSL-50
FSL-8 FSL-10FSL-14
FSL-23
FSL32
FSL-37
FSL-41
FSL-46 FSL-6
FSL-12
FSL-36FSL-39
FSL-43FSL-45
FSL-44
0 2 4km
see graphic scale®
Legend!? METEOROLOGICAL STATION! SOIL PROFILE!( SURFACE WATER FEATURE@A GROUNDWATER WELL
PROYECT AREA!. MUNICIPAL CENTER
HYDROGRAPHIC NETWORKMAIN RIVERSECONDARY RIVERSHONDURAS NATIONAL BOUNDARY

Geographic System: WGS_1984_UTM_Zone_16NDatum: D_WGS_1984
Aguan Irrigation Project
ERM Iberia S.A. Paseo de la Castellana 184, 3º28046 Madrid
Tel. +34 91 411 1440Fax +34 91 563 6213
3
Progetto:
Biological BaselineField Survey Map
Client
0463668
Site
EFDAMCPA3 map3.mxd00
Figure:
Version
Scale
DateAugust 2018
HONDURASOlanchito
Project Number
Pro ject
FilePaper Author Reviewed by Pro ject Manager
!.
!.!.
!.!. !. !.
!.
!.
!.
!.
!.
!.
!.
")
")") ") ")
")
")
")
")
")
Aguan River
Arenal
Olanchito
FSL-13
FSL-19FSL-24
FSL-41
FSL-52
FSL-16
FSL-2FSL-8
FSL-15
FSL-18
FSL-23 FSL-27FSL32
FSL-48FSL-49
FSL-51
FSL-44
0 2 4km
see graphic scale®
Legend") OBSERVATIONS OF FLORA!. OBSEVATIONS OF FAUNA
WILDLIFE REFUGE HONDURANEMERALD HUMMINGBIRD(RVSCEH_Decree 32-2015)PROYECT AREA
!. MUNICIPAL CENTERHYDROGRAPHIC NETWORK
MAIN RIVERSECONDARY RIVERSHONDURAS NATIONAL BOUNDARY

ANNEX 5
LITHOLOGICAL PROFILE OF ABSTRACTION WELLS IN THE PROJECT
AREA

ENVIRONMENTAL RESOURCES MANAGEMENT PAA PROJECT FINANCE A/S
ANNEX 5-3
PUMP A
Original graphic (in Spanish) Summary of original graphic (in English)
10.6 m
9.1 m
Depth
(m)
Lithological
Stratum
0 Surface
2
3
5
6
8
9
11
12
14
15
17
18
20
21
23
24
26
27
29
30
32
34
35
37
38Clay and
Gravels
Sandy Silt
Fine Gravels
Clay and
Gravels
Coarse
Gravels
Monitoring Well
Design
DRILLING #5 FOR EXPLOTATION PUMP #1
DESCRIPTION OF PUMP #1
Operating Flow
Maximum pumping rate 1500 GPM
1350 GPM
Dejection
Dejection

ENVIRONMENTAL RESOURCES MANAGEMENT PAA PROJECT FINANCE A/S
ANNEX 5-4
PUMP B
Original graphic (in Spanish) Summary of original graphic (in English)
DRILLING #4 FOR EXPLOTATION PUMP #2
Maximum pumping rate 1500 GPM Dejection 9.1 m1500 GPM Dejection 9.1 m
Depth
(m)
Lithological
Stratum
0 Surface
2
3
5
6
8
9
11 Fine Gravels
12
14
15
17
18
20
21
23
24
26
27
29
30
32
34
Clay and
Gravels
1350 GPM Dejection 7.6 m
Monitoring Well
Design
Coarse
Gravels
Coarse
Gravels
Sandy Silt
DESCRIPTION OF PUMP #2
Operating Flow
Clay and
Gravels

ENVIRONMENTAL RESOURCES MANAGEMENT PAA PROJECT FINANCE A/S
ANNEX 5-5
PUMP C
Original graphic (in Spanish) Summary of original graphic (in English)
DRILLING #1 FOR EXPLOTATION PUMP #3
DESCRIPTION OF PUMP #3
Maximum pumping rate 1700 GPM Dejection 6.7 m
Operating Flow 1350 GPM Dejection 6.1 m
Depth
(m)
Lithological
Stratum
0 Surface
2
3
5Sand and
fine gravel
6
8
9
11
12
14
15
17
18
20
21
23Clay and
Gravels
Monitoring Well
Design
Sandy Silt
Coarse
Gravels
Fine Gravels

ENVIRONMENTAL RESOURCES MANAGEMENT PAA PROJECT FINANCE A/S
ANNEX 5-6
PUMP D
Original graphic (in Spanish) Summary of original graphic (in English)
DRILLING #2 FOR EXPLOTATION PUMP #4
DESCRIPTION OF PUMP #4
Maximum pumping rate 1500 GPM Dejection 9.7 m
1350 GPM Dejection 9.1 m
Depth
(m)
Lithological
Stratum
0 Surface
2
3
5
6
8
9
11
12
14
15
17
18
20
21
23
24
26
27
29
30
32
34
35
37
38Clay and
Gravels
Operating Flow
Coarse
Gravels
Fine Gravels
Coarse
Gravels
Sandy Silt
Monitoring Well
Design
Clay and
Gravels

ENVIRONMENTAL RESOURCES MANAGEMENT PAA PROJECT FINANCE A/S
ANNEX 5-7
PUMP E
Original graphic (in Spanish) Summary of original graphic (in English)
DRILLING #3 FOR EXPLOTATION PUMP #5
DESCRIPTION OF PUMP #5
Maximum pumping rate 1800 GPM Dejection 7.6 m
Operating Flow 1500 GPM Dejection 6.1 m
Depth
(m)
Lithological
Stratum
0 Surface
2
3
5Sand and
fine gravel
6
8
9
11
12
14
15
17
18
20
21Clay and
Gravels
Monitoring Well
Design
Sandy Silt
Fine Gravels
Coarse
Gravels
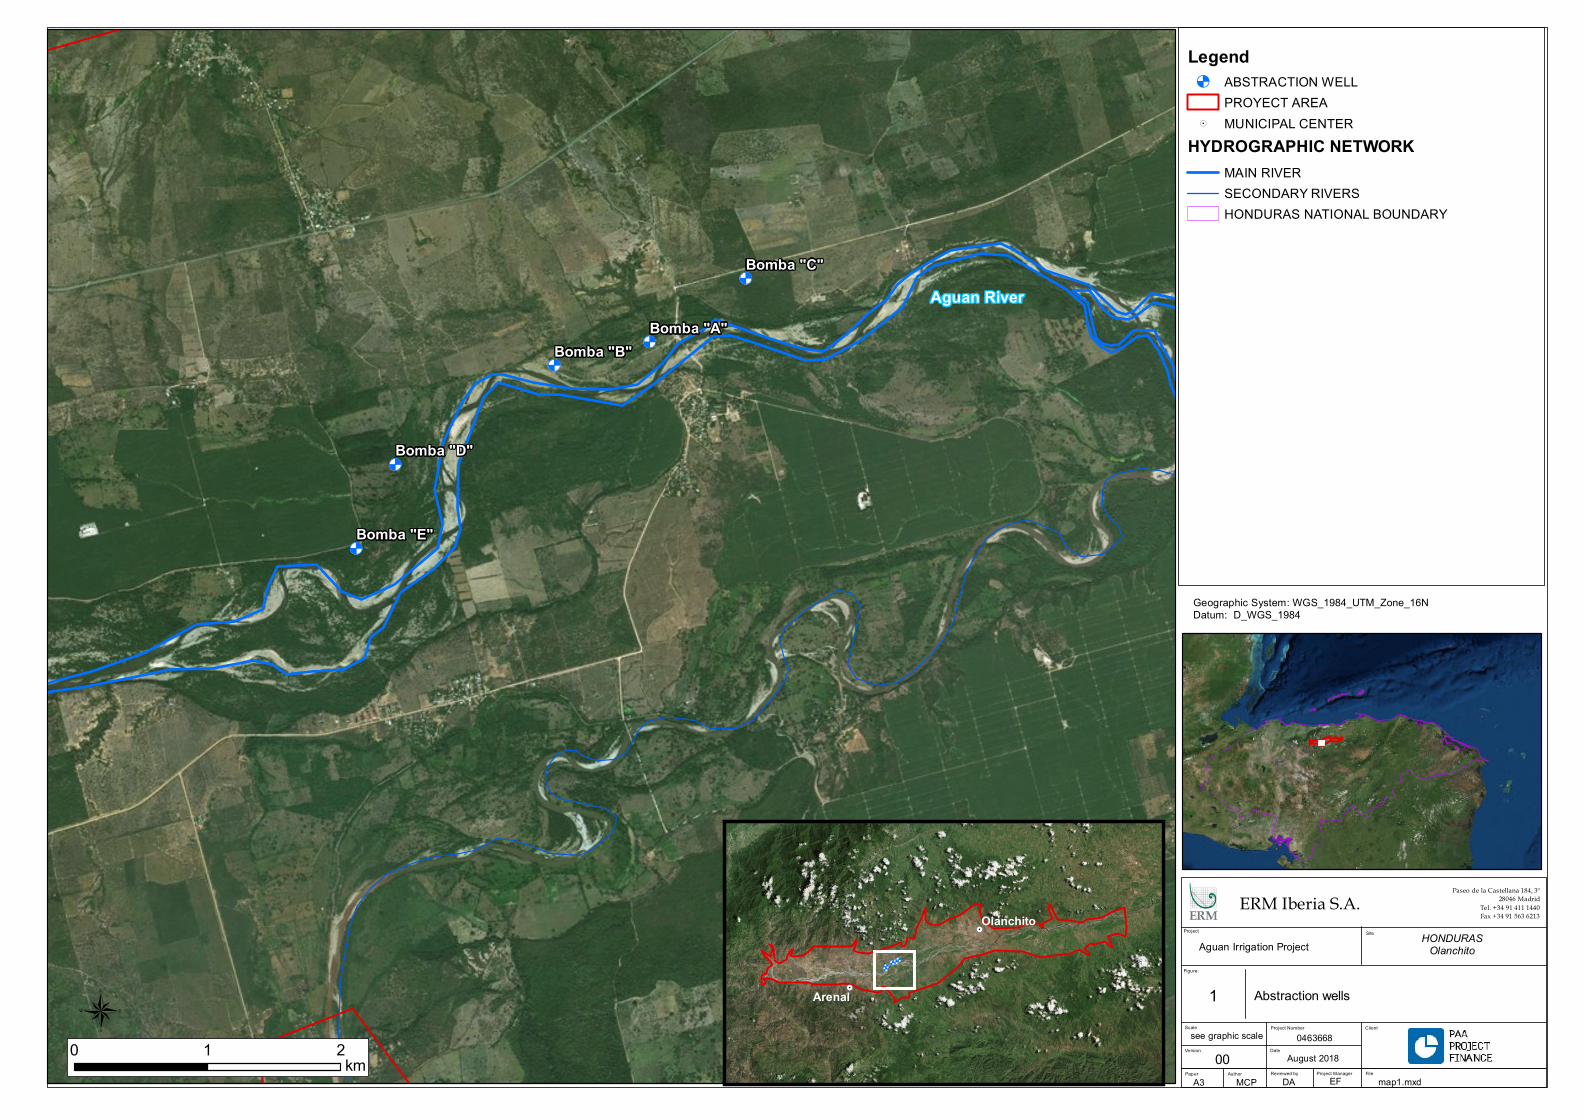
Geographic System: WGS_1984_UTM_Zone_16NDatum: D_WGS_1984
Aguan Irrigation Project
ERM Iberia S.A. Paseo de la Castellana 184, 3º28046 Madrid
Tel. +34 91 411 1440Fax +34 91 563 6213
1
Progetto:
Abstraction wellsClient
0463668
Site
EFDAMCPA3 map1.mxd00
Figure:
Version
Scale
DateAugust 2018
HONDURASOlanchito
Project Number
Pro ject
FilePaper Author Reviewed by Pro ject Manager
&<
&<
&<
&<
&<
Aguan RiverBomba "C"
Bomba "A"Bomba "B"
Bomba "D"
Bomba "E"
0 1 2km
see graphic scale®
Legend&< ABSTRACTION WELL
PROYECT AREA!. MUNICIPAL CENTER
HYDROGRAPHIC NETWORKMAIN RIVERSECONDARY RIVERSHONDURAS NATIONAL BOUNDARY
&<&<&<
&<&<
!.
!.
Arenal
Olanchito

ANNEX 6
HIGH SENSITIVE FLORA AND FAUNA
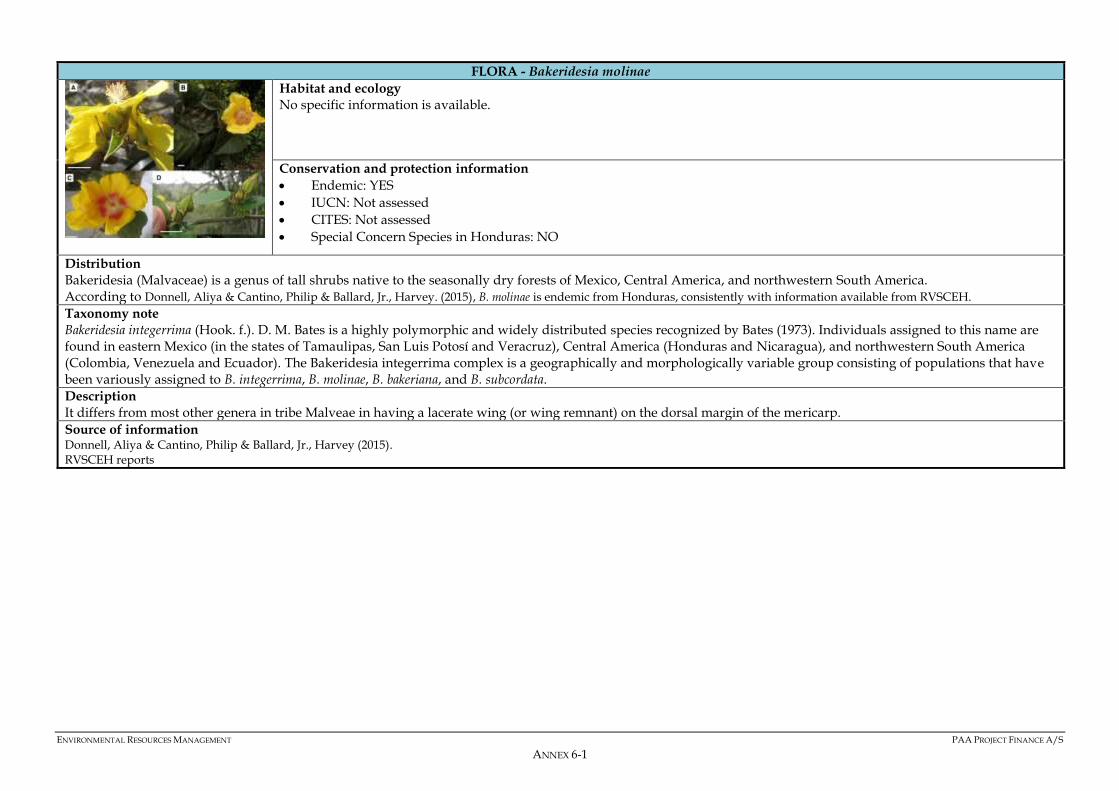
ENVIRONMENTAL RESOURCES MANAGEMENT PAA PROJECT FINANCE A/S
ANNEX 6-1
FLORA - Bakeridesia molinae
Habitat and ecology
No specific information is available.
Conservation and protection information
Endemic: YES
IUCN: Not assessed
CITES: Not assessed
Special Concern Species in Honduras: NO
Distribution
Bakeridesia (Malvaceae) is a genus of tall shrubs native to the seasonally dry forests of Mexico, Central America, and northwestern South America. According to Donnell, Aliya & Cantino, Philip & Ballard, Jr., Harvey. (2015), B. molinae is endemic from Honduras, consistently with information available from RVSCEH.
Taxonomy note
Bakeridesia integerrima (Hook. f.). D. M. Bates is a highly polymorphic and widely distributed species recognized by Bates (1973). Individuals assigned to this name are found in eastern Mexico (in the states of Tamaulipas, San Luis Potosí and Veracruz), Central America (Honduras and Nicaragua), and northwestern South America (Colombia, Venezuela and Ecuador). The Bakeridesia integerrima complex is a geographically and morphologically variable group consisting of populations that have been variously assigned to B. integerrima, B. molinae, B. bakeriana, and B. subcordata.
Description
It differs from most other genera in tribe Malveae in having a lacerate wing (or wing remnant) on the dorsal margin of the mericarp.
Source of information Donnell, Aliya & Cantino, Philip & Ballard, Jr., Harvey (2015). RVSCEH reports

ENVIRONMENTAL RESOURCES MANAGEMENT PAA PROJECT FINANCE A/S
ANNEX 6-2
FLORA - Caesalpinia yucatanensis (subsp. Hondurensis)
Habitat and ecology
Found in wet forests and scrubs, ascends to an altitude of 300 m.
Conservation and protection information
Endemic: YES
IUCN: Not assessed
CITES: Not assessed
Special Concern Species in Honduras: NO
According to RVSCEH reports, this species should be assessed as CR by IUCN
Distribution
The species is original from a small area in Central America, it is present in southern Mexico, especially in the Yucatán peninsula, in Belize, Guatemala and Honduras. Central America to Honduras.
Description
Small twisted tree, branching heavily with a spreading crown to 5 m ht. Bark greenish grey, smooth, slightly shiny, covered in pale grey-brown pustulating lenticels, inner bark green. Leaves recently flushed and immature, leaf rachis tinged reddish. Striking show of bright yellow flowers attracting numerous small bees. Calyx yellow or greenish yellow, petals bright vermillion, banner petal with yellow glands to the rear, stamen filaments and style greenish yellow, densely white, hairy at the base, anthers dirty yellow brown. A few multiple glossy green pods. Infrequent, scattered. Lightly disturbed dry thorn scrub with Haematoxylon brasiletto, Acacia picachensis, Chloroleucon mangense and Guaiacum sanctum.
Source of information https://plants.jstor.org/stable/10.5555/al.ap.specimen.k000081719 New York Botanical Garden: http://sweetgum.nybg.org/science/vh/specimen_details.php?irn=545058

ENVIRONMENTAL RESOURCES MANAGEMENT PAA PROJECT FINANCE A/S
ANNEX 6-3
FLORA - Capparicordis yunckeri
No specific photograph is available. Habitat and ecology
No specific information is available.
Conservation and protection information
Endemic: YES
IUCN: Not assessed
CITES: Not assessed
Special Concern Species in Honduras: NO
Distribution
Endemic species of Honduras. It was rediscovered by Paul House in 2011 and had not been registered for 50 years. There are only two known individuals in the world and the points where they are found are unique. By the year 2020, the presence of Capparicordis yunckeri is expected to increase from 0 to 7-13 fragments (25-49%) of the RVSCEH, and that the number of individuals of reproductive age of this species increases from zero to the range of 51-100.
Description
No specific information is available.
Source of information RVSCEH reports

ENVIRONMENTAL RESOURCES MANAGEMENT PAA PROJECT FINANCE A/S
ANNEX 6-4
FLORA - Dioon mejiae
Habitat and ecology
This species is typically an understorey component of semi-deciduous tropical rain forest and is found on steep slopes and in canyons, but also grows on flat terrain. Some populations thrive in sandy soil or sandy to clayey alluvial deposits, while others grow in loamy, limestone-derived soils; in soils weathered from metamorphics (schists, gneisses); etc.
Conservation and protection information
Endemic: YES
IUCN: LC
CITES: Appendix II
Special Concern Species in Honduras: NO
This species has important cultural value and is hence protected by local inhabitants. This species' biggest threat comes from habitat destruction as a result of the conversion of habitat to farmland and to a lesser extent the effects of logging and road-building on the habitat.
Distribution
This species occurs in the states of Colon, Olancho and Yoro of Honduras. Recent surveys in Honduras indicate that there are many large and healthy subpopulations with little evidence of decline despite use by local people.
Description
Dioon mejiae is a small to medium, erect and usually unbranched cycad species mimicking the look of short palm trees. It is a very tropical looking Dioon that resembles Dioon spinulosum, though usually much shorter, or Dioon rzedowskii in appearance. It show well developed aerial stems growing in habitat up to 1 m in length over centuries. It is usually a vigorous grower that holds a number of leaves in the crown. Primeval cycads like this Dioon mejiae are some of the oldest plants still living on the planet that trace their origins back to the ancient flora of the early Mesozoic era more than 170 million years ago. It is dioecious - it takes two plants to produce viable seeds.
Source of information RVSCEH reports IUCN website: http://www.iucnredlist.org/details/42184/0 http://www.llifle.com/Encyclopedia/PALMS_AND_CYCADS/Family/Zamiaceae/18072/Dioon_mejiae

ENVIRONMENTAL RESOURCES MANAGEMENT PAA PROJECT FINANCE A/S
ANNEX 6-5
FLORA - Eugenia lempana
No specific photograph is available. Habitat and ecology
No specific information is available.
Conservation and protection information
Endemic: YES
IUCN: Not assessed
CITES: Not assessed
Special Concern Species in Honduras: NO
Distribution
Endemic species of Honduras.
Description
No specific information is available.
Source of information RVSCEH reports

ENVIRONMENTAL RESOURCES MANAGEMENT PAA PROJECT FINANCE A/S
ANNEX 6-6
FLORA - Eugenia coyolensis
No specific photograph is available. Habitat and ecology
A species of the dry Atlantic lowlands.
Conservation and protection information
Endemic: YES
IUCN: CR
CITES: Not assessed
Special Concern Species in Honduras: NO
Distribution
Endemic species of Honduras. According to RVSCEH reports, it is a regular species, expected to remain in the future, taking into account it is present in 25% and 49% of the fragmented monitored.
Description
No specific information is available.
Source of information RVSCEH reports IUCN website: http://www.iucnredlist.org/details/37446/0

ENVIRONMENTAL RESOURCES MANAGEMENT PAA PROJECT FINANCE A/S
ANNEX 6-7
FLORA - Leucaena lempirana
No specific photograph is available. Habitat and ecology
A highly localised species confined to northern Honduras. It is found in degraded forests.
Conservation and protection information
Endemic: YES
IUCN: VU
CITES: Not assessed
Special Concern Species in Honduras: NO
Distribution
Endemic species of Honduras (North of the country).
Description
No specific information is available.
Source of information RVSCEH reports IUCN website: http://www.iucnredlist.org/details/37484/0

ENVIRONMENTAL RESOURCES MANAGEMENT PAA PROJECT FINANCE A/S
ANNEX 6-8
FLORA - Lonchocarpus trifolius
No specific photograph is available. Habitat and ecology
Pine-oak forests.
Conservation and protection information
Endemic: YES
IUCN: CR
CITES: Not assessed
Special Concern Species in Honduras: NO
Distribution
Endemic species of Honduras. Only a seldom collected tree is reported. RVSCEH reports referred that only one individual of this species has been observed.
Description
No specific information is available.
Source of information RVSCEH reports IUCN website: http://www.iucnredlist.org/details/30704/0
ENVIRONMENTAL RESOURCES MANAGEMENT PAA PROJECT FINANCE A/S
ANNEX 6-9
FLORA - Lonchocarpus yoroensis
No specific photograph is available. Habitat and ecology
Generally found in dry forests.
Conservation and protection information
Endemic: NO
IUCN: CR
CITES: Not assessed
Special Concern Species in Honduras: NO
Distribution
Native from Honduras; Mexico; Nicaragua.
Description
A rarely collected tree.
Source of information RVSCEH reports IUCN website: http://www.iucnredlist.org/details/37453/0
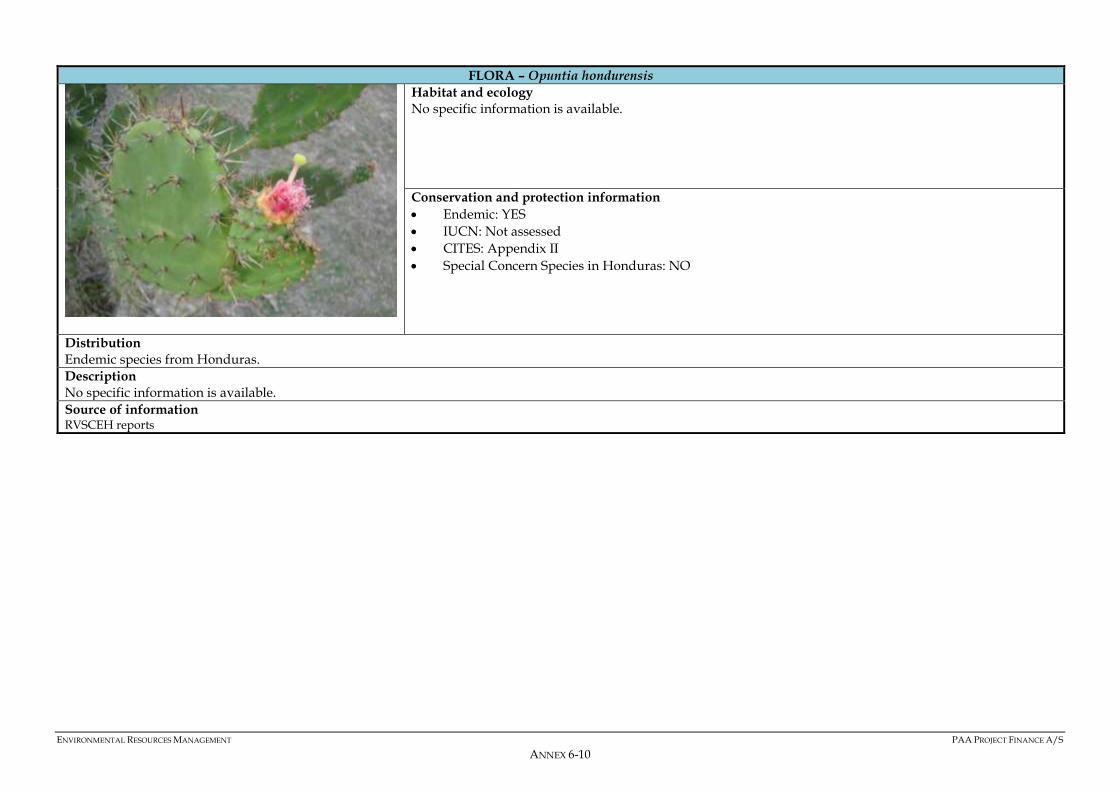
ENVIRONMENTAL RESOURCES MANAGEMENT PAA PROJECT FINANCE A/S
ANNEX 6-10
FLORA – Opuntia hondurensis
Habitat and ecology
No specific information is available.
Conservation and protection information
Endemic: YES
IUCN: Not assessed
CITES: Appendix II
Special Concern Species in Honduras: NO
Distribution
Endemic species from Honduras.
Description
No specific information is available.
Source of information RVSCEH reports

ENVIRONMENTAL RESOURCES MANAGEMENT PAA PROJECT FINANCE A/S
ANNEX 6-11
FLORA – Parathesis vulgata
No specific photograph is available. Habitat and ecology
Mainly occurring at middle and upper elevations of mountain slopes, the species is found in areas of rainforest or cloud forest.
Conservation and protection information
Endemic: NO
IUCN: EN
CITES: Not assessed
Special Concern Species in Honduras: NO
Distribution
Guatemala; Honduras
Description
No specific information is available.
Source of information RVSCEH reports IUCN website: http://www.iucnredlist.org/details/37461/0
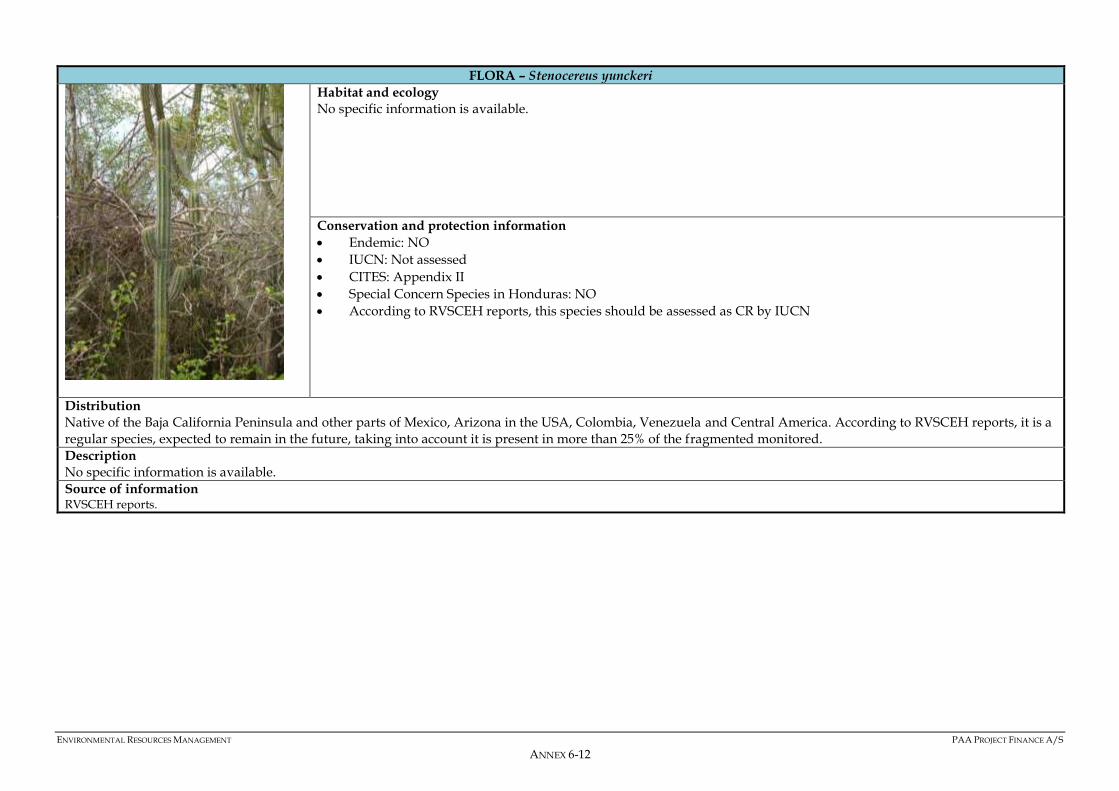
ENVIRONMENTAL RESOURCES MANAGEMENT PAA PROJECT FINANCE A/S
ANNEX 6-12
FLORA – Stenocereus yunckeri
Habitat and ecology
No specific information is available.
Conservation and protection information
Endemic: NO
IUCN: Not assessed
CITES: Appendix II
Special Concern Species in Honduras: NO
According to RVSCEH reports, this species should be assessed as CR by IUCN
Distribution
Native of the Baja California Peninsula and other parts of Mexico, Arizona in the USA, Colombia, Venezuela and Central America. According to RVSCEH reports, it is a regular species, expected to remain in the future, taking into account it is present in more than 25% of the fragmented monitored.
Description
No specific information is available.
Source of information RVSCEH reports.

ENVIRONMENTAL RESOURCES MANAGEMENT PAA PROJECT FINANCE A/S
ANNEX 6-13
FLORA – Vanilla planifolia
Habitat and ecology
This species can be found in subtropical/tropical moist lowland forest. It seems to prefer moist forest, seasonally dry in spring, and favours calcareous terrain. It is absent in volcanic areas and in the wet tropical rainforests of Mexico. In moister areas, it can be found in secondary, mature forests. It flowers mainly in April to May, towards the end of the dry season.
Conservation and protection information
Endemic: NO
IUCN: EN
CITES: Appendix II
Special Concern Species in Honduras: NO
This species is mainly threatened by habitat reduction and unregulated exploitation for scientific collections and research. Furthermore, wild individuals are extracted to be planted in existing vanilla plantations and for hybridization trials with cultivated individuals.
Distribution
Native to Mexico, where it can be found in the states of Puebla, Oaxaca, Chiapas, Quintana Roo. It is also native to Belize. It occurs at altitudes of 150 to 900 m asl, rarely to 1300 m asl. Also found in Florida, Central and South America in countries such as in Venezuela, Ecuador, Panamá.
Description
Vanilla planifolia is a tropical vine, which can reach a length of over 30 m. It has thick, fleshy stems and greenish flowers that open early in the morning and are pollinated by bees. The flowers have only a slight scent, with no element of the vanilla flavour or aroma. Once pollinated, the ovaries swell and develop into fruits called 'pods' similar to long, thin runner beans over a period of four weeks. The pods contain thousands of tiny black seeds.
Source of information RVSCEH reports. IUCN website: http://www.iucnredlist.org/details/103090930/0 Kew Gardens website: http://powo.science.kew.org/taxon/urn:lsid:ipni.org:names:262578-2
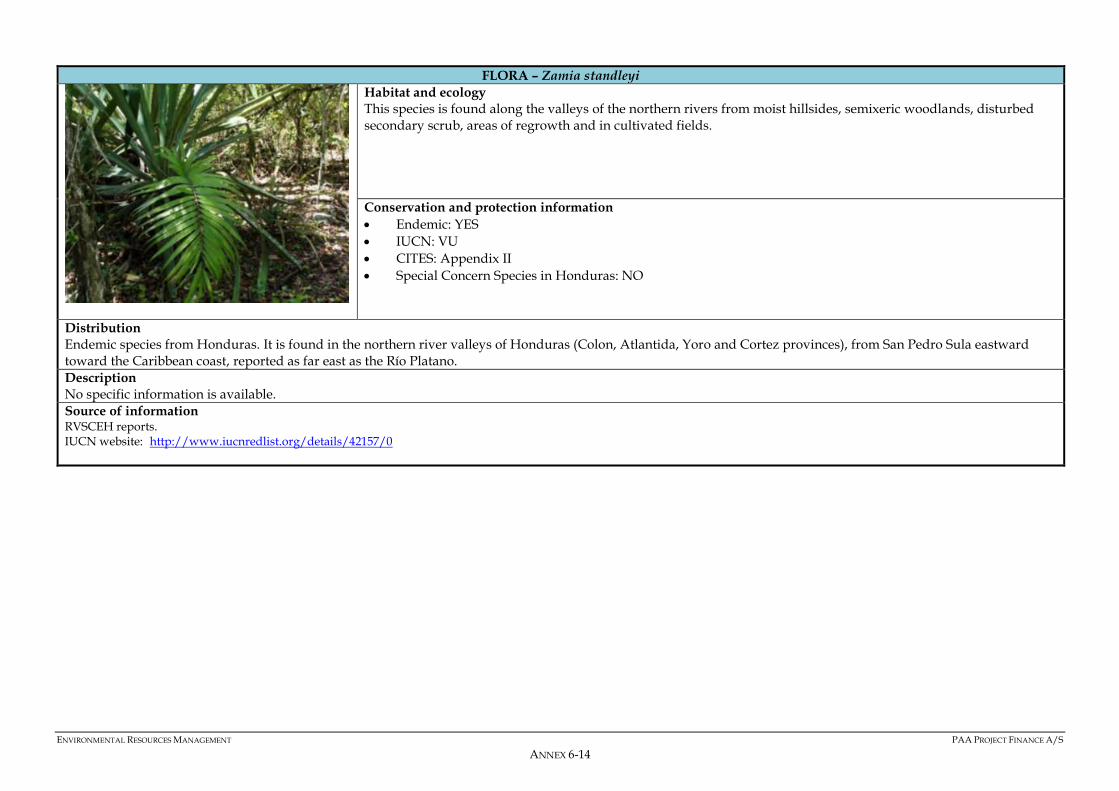
ENVIRONMENTAL RESOURCES MANAGEMENT PAA PROJECT FINANCE A/S
ANNEX 6-14
FLORA – Zamia standleyi
Habitat and ecology
This species is found along the valleys of the northern rivers from moist hillsides, semixeric woodlands, disturbed secondary scrub, areas of regrowth and in cultivated fields.
Conservation and protection information
Endemic: YES
IUCN: VU
CITES: Appendix II
Special Concern Species in Honduras: NO
Distribution
Endemic species from Honduras. It is found in the northern river valleys of Honduras (Colon, Atlantida, Yoro and Cortez provinces), from San Pedro Sula eastward toward the Caribbean coast, reported as far east as the Río Platano.
Description
No specific information is available.
Source of information RVSCEH reports. IUCN website: http://www.iucnredlist.org/details/42157/0

ENVIRONMENTAL RESOURCES MANAGEMENT ALTO AGUAN RIVER VALLEY IRRIGATION PROJECT
ANNEX 6-15
REPTILES - Ctenosaura melanosterna
Habitat and ecology
The Black-chested Spiny-tailed Iguana inhabits tropical and subtropical dry forest and scrubland from 0 to 250 meters above sea level. It is semi-arboreal and diurnal, taking refuge in hollow logs and rock crevices at night. On Cayos Cochinos, iguanas utilize forest edge habitat consisting of sandy beach strand vegetation and rocky cliffs, as well as areas of open forest, including tree fall gaps. Within the Valle de Aguán it is found most often in undisturbed tropical scrub forests consisting of abundant Acacia and cacti, where it retreats in the hollows of these dominant species. This iguana is omnivorous, consuming fruit, flowers, leafy vegetation, arthropods, a variety of lizards, birds (especially fledglings), and carrion.
Conservation and protection information
Endemic: YES
IUCN: CR
CITES: Appendix II
Special Concern Species in Honduras: NO
The primary threat to the Black-chested Spiny-tailed Iguana is habitat destruction and fragmentation. Limited habitat destruction occurs on both islands of the Cayos Cochinos as palm trees are harvested for thatch roofs. The amount of destruction within the Valle de Aguán poses a much larger threat. Land conversion for agriculture began in the 1970s in this region. Dole Fruit Company has a large and expanding banana plantation, causing optimal habitat to be continually cleared and pesticides to be spread throughout the area. Smaller scale destruction also occurs as land is being cleared for cattle. Adult iguanas and eggs are sought for both immediate consumption and sale. On Cayos Grande, individuals are collected for consumption, but this threat is much more extreme within the Valle de Aguán.

ENVIRONMENTAL RESOURCES MANAGEMENT ALTO AGUAN RIVER VALLEY IRRIGATION PROJECT
ANNEX 6-16
REPTILES - Ctenosaura melanosterna
Distribution
Endemic species from Honduras. The Black-chested Spiny-tailed Iguana is known only from the Valle de Aguán in northern Honduras and the Cayos Cochinos Archipelago off the Caribbean coast of Honduras, where it occurs primarily on the two largest islands: Cayo Mayor (Grande) and Cayo Menor (Pequeño). The total population size is not known, but is estimated to be less than 5,000 mature individuals within the two range areas (Aguán Valley and Cayos Cochinos). Although the geographic range of this iguana is substantially greater for the Valle de Aguán subpopulation than for the Cayos Cochinos subpopulation, the density of individuals throughout the Valle is extremely low, making this species very rare within this part of its range and seldom observed.
Description
On Cayo Menor, marked sexual dimorphism in size has been observed with males being larger. Males are territorial, with multiple females and juveniles residing within the territory. Nesting takes place in sandy substrates from April through July, with 7-18 eggs laid per nest. Hatchlings emerge from June through September. In captivity, the Black-chested Spiny-tailed Iguana lives from 10 to 15 years and reaches sexual maturity at 2 to 3 years. They lay eggs twice a year in February/March and August/September. Clutch sizes range from 11 to 41 eggs. The incubation period ranges from 85 to 90 days. Hatchlings have a snout-vent length of 41-52 mm, a total length of 114-149 mm, and average weight of 4 grams.
Source of information RVSCEH reports. IUCN website: http://www.iucnredlist.org/details/44189/0

ENVIRONMENTAL RESOURCES MANAGEMENT ALTO AGUAN RIVER VALLEY IRRIGATION PROJECT
ANNEX 6-17
REPTILES - Sphaerodactylus dunni
Habitat and ecology
This species occurs in lowland wet and dry forest where it inhabits the leaf litter of closed canopy forest. It is diurnal. It is not known to occur in secondary forest. It occurs at elevations from 60-700 m.
Conservation and protection information
Endemic: YES
IUCN: LC
CITES: Not assessed
Special Concern Species in Honduras: NO
Distribution
Endemic species from Honduras (North of the country).
Description
No specific information is available.
Source of information RVSCEH reports. IUCN website: http://www.iucnredlist.org/details/178652/0

ENVIRONMENTAL RESOURCES MANAGEMENT ALTO AGUAN RIVER VALLEY IRRIGATION PROJECT
ANNEX 6-18
BIRDS - Amazilia luciae
Habitat and ecology
Specific to arid forests, especially the Very Dry Tropical Forest. In intact areas of Very Dry Tropical Forest, it becomes quite common, especially during the breeding season when fights between males are common. According to RVSCEH reports, more than 20 individuals were seen in a 250 meter transept during a monitoring.
Conservation and protection information
Endemic: YES
IUCN: EN
CITES: Appendix II
Special Concern Species in Honduras: NO
Distribution
Endemic species from Honduras. Amazilia luciae occurs in the arid interior valleys of Honduras, where it is currently known from three sites in the northeast, and has recently been rediscovered in the west of the country. In addition to Olanchito and Arenal, it is reported in the dry forest of the municipality of San Esteban, in the department of Olancho and in Santa Bárbara. It is estimated that the emerald hummingbird population in the protected area is approximately 1,200 individuals, reported in 16 of the 27 fragments of dry forest that are currently protected as part of the RVSCEH. It should be noted that the degree of conservation of these fragments is variable, observing individuals of emerald hummingbird in altered sites.

ENVIRONMENTAL RESOURCES MANAGEMENT ALTO AGUAN RIVER VALLEY IRRIGATION PROJECT
ANNEX 6-19
Description
9.5 cm. Medium-sized, green hummingbird. Male has glittering blue-green throat and upper chest, sometimes appearing grey, mottled dusky. Rest of underparts pale grey with mottled green sides. Bright green upperparts with bronzy tinge on uppertail-coverts. Bronze-green tail. Black bill with reddish mandible and dark tip. Female similar with less intense and more restricted gorget. Immature has greyish throat spotted turquoise. VoiceSlightly metallic ticking repeated steadily. Also buzzy chatters.
Source of information RVSCEH reports. IUCN website:

Municipality Hamlet Settlement
Olanchito Agalteca Agalteca
Armenia Armenia Cooperativa El Destino
Cooperativa El Destino
Bálsamo Oriental Bálsamo Oriental
Barranco Barranco
Boca de Mame Boca de Mame
Calpules Calpules
Hacienda Jalisco
San Andrés
Hacienda Reitoca
Dinamarca
Pozo Seco
Campo Agua Buena Campo Agua Buena
Campo Bálsamo Campo Bálsamo
Campo Calpules Campo Calpules No.2
Campo Calpules
Campo El Chorro Campo Drake
Campo El Chorro
Campo Limones No.4 El Cinco
Campo Limones No.4
Campo Limones No.6 Campo Limones No.6
Campo Nerones Campo Nerones
Cooperativa Luz y Esperanza
Campo Nuevo Campo Nuevo
Campo Palo Verde No.2 Campo Palo Verde No.2
Campo Rosario Campo Rosario
Campo Trojas No.2 Campo Trojas No.2
Campo Trojas No.3 Campo Trojas No.3
Chorrera La Puntilla
Paso El Cayo
Hacienda La Flor
Hacienda San Vicente
Chorrera
Cliftón Cliftón
Cooperativa Brisas de Cuyamapa
Cooperativa Fé y Esperanza
Cooperativa Brisas de Cuyamapa
Cooperativa Doce de Diciembre
Cooperativa Brisas de Monga Lt
Coyoles Coyoles
Coyoles Central Coyoles Central
El Carril El Carril
El Chaparral Hacienda Moreno
El Jícaro
El Nance Paso de Arenal
Culuco
Hacienda Los Piñones
El Nance
El Ocote El Ocote
Chirinos
Campo Rosario No.1
Campo El Olvido

Buenos Aires
Las Minas
Hacienda El Rosario
La Reforma La Reforma
La Sabana de San Carlos Bocatema
La Sabana de San Carlos
Las Hicoteas Jaguas Arriba
Jaguas Abajo
La Zanja
Las Minas Las Minas
El Roble
Maloa Piedra del Tigre
El Desvío de Maloa
La Hacienda
La Conferencia
Maloa
Loma de Plata
San Pedro
Medina Medina
Méndez Jalisco
Hacienda Uchapa
Méndez
Tibombo
Finca San Carlos
Nombre de Jesús Casa Blanca
Nombre de Jesús
Hacienda Santa Lucía
Olanchito El Crucete
San Luis
Hacienda La Revista
Olanchito
Hacienda La Meseta
Hacienda La Florida
Hacienda San Félix
Hacienda Santa Clara
Hacienda El Tempisque
Potrerillos Ciudad Vieja
Potrerillos
Hacienda Germania
El Puente
Nuevo Londres
Puerto Escondido Hacienda Santa Rita
El Barranco de Santa Ana
El Masical
Puerto Escondido
Sabanetas Sabanetas
San Dimas San Dimas
Buena Vista
San Francisco Plan Grande
San Francisco
Hacienda El Edén
San Jerónimo San Jerónimo

San José San José
San José Arriba
San Juan San Juan
San Lorenzo Abajo Las Lajas
Hacienda La Mora
El Enea
El Agua Caliente
San Patricio
San Lorenzo Abajo
San Lorenzo Arriba Buenos Aires
La Estación
Hacienda San Vicente
Sabana Larga
La Laguna
Hacienda Ocotes Altos
Los Horcones
El Zangarro
San Marcos Las Delicias
El Pacífico
Hacienda La Isla
Hacienda San José
Hacienda El Sauce
Río Chiquito
Santa Bárbara Santa Bárbara
Tacualtuste Tacualtuste
Teguajinal La Ceja
Teguajinal
Tejeras El Tolondrón
Tejeras
Tepusteca Tepusteca
Trojas La Envidia
El Arenal Arenal Hacienda Modelo o Villa Estela
La Hacienda
Campo El Cayo Campo Rojo
Buenos Aires
Tiestos
Campo El Cayo
Champerío El Cayo Bomba Nueve
Champerío El Cayo
Santa Cruz Santa Cruz
Tierra Blanca Rancho Bonito
La Jigua
Tierra Blanca

ENVIRONMENTAL RESOURCES MANAGEMENT PAA PROJECT FINANCE A/S
ANNEX 8-I
ANNEX 8
SUMMARY OF THE WATER RESOURCE BALANCE

ENVIRONMENTAL RESOURCES MANAGEMENT PAA PROJECT FINANCE A/S
ANNEX 8-II
CONTENTS
1 INTRODUCTION 1
2 INPUT DATA 1
3 HONDURAN WATER BALANCE 2
4 AGUAN RIVER BASIN WATER BALANCE 2
4.1 ANNUAL WATER CONSUMPTION BY THE PROJECT 2 4.2 SURFACE WATER 2 4.3 GROUNDWATER 4 4.4 INFILTRATION 5
5 CONCLUSION 5

ENVIRONMENTAL RESOURCES MANAGEMENT PAA PROJECT FINANCE A/S
ANNEX 8-1
1 INTRODUCTION
The present Annex provides a summary of the of the Water Resource Balance conducted by PAA Project Finance and Integra Ingeniería in 2017, as part of the Project Design. Such water balance was done in order to evaluate the water availability for the irrigation project in a large area of the Alto Aguan River valley. The objective of this Annex is to provide the basic information of the water resource balance in the context of the ESIA, so that it is understood the impact assessment regarding the water abstraction.
2 INPUT DATA
The following data were considered in the water balance assessment:
Situation of Water Resources in Central America. Global Water Partnership (March, 2017).
Data on the flow measurements of river in the basin and sub-basins of Alto Aguan taken by PAA Project and SAG in May 2017.
Diagnosis and Analysis of the Water and Sewerage Sector, CONASA (October, 2016).
Evaluation of water resources in natural regime of the National Autonomous University of Honduras, Honduran Institute of Earth Science and the Energy and Natural Resources, Environment and Mining – Directorate General of Water Resources.
Water sector diagnosis in Olanchito Municipality report, 2010, financed by the Canadian International development agency. (“Diagnóstico del Sector del Agua y Saneamiento en el Municipio de Olanchito”, 2010).
The Centre for Public Works Studies and Experimentation of Spain (CEDEX - Centro de Estudios y Experimentación de Obras Públicas) carried out an evaluation of water resources in natural regime of the Honduran territory, using a hydrologic model that simulates the main flows and water transferences from the atmosphere, soil and aquifer. The simulation covered the monthly period between the years 1970/71 until 2001/02.
Information obtained during the technical visits on site conducted by PAA Project and Integra Ingeniería in 2017, especially the surveys carried out and existing underground wells gauging with historic data which enable the evaluation of the future behavior.

ENVIRONMENTAL RESOURCES MANAGEMENT PAA PROJECT FINANCE A/S
ANNEX 8-2
3 HONDURAN WATER BALANCE
The main socioeconomic variables that have an impact on the use of water were analysed for the year 2003 and forecasted for the year 2025 (based in document Situation of Water Resources in Central America), with the following main conclusions for Honduras, in a nation-wide approach:
Data in 2003: o Gross demand of water: 1,900 hm3/year. o Consumptive demand of water: 1,000 hm3/year.
Forecasts for the year 2025, if the irrigation potential identified in the country is developed:
o Gross demand of water: 7,500 hm3/year. o Consumptive demand of water: 5,000 hm3/year.
The water consumption due to irrigation will increase from 60% of the total water consumption in Honduras (2003) to 75-80% (2025).
4 AGUAN RIVER BASIN WATER BALANCE
4.1 ANNUAL WATER CONSUMPTION BY THE PROJECT
The maximum demand of water by the Project has been calculated by PAA Project Finance and Integra Ingeniería, taking into account that irrigation with groundwater will be limited to the dry period of approximately 3 months / year. The following table provides a summary of the estimated water consumption.
Table 1 Summary of maximum water consumption by the Project
Weekly provision of water
Monthly provision of water
Annual provision of water (3
months irrigation)
Annual provision by hectare
Maximum irrigation surface in the Project
Area
Maximum water
consumption by the
Project in 1 year
32 l/m2 137 l/m2 480 l/m2 4,800 m3 3,110 ha 14.928,000 m3 Source: PAA Project Finance and Integra Ingeniería, 2017 – Edited by ERM, 2018
4.2 SURFACE WATER
The Aguan River Basin is composed by the Aguan River and its tributaries. It has a surface of 10,266 km2. The Aguan River has a length of 275 km and a maximum altitude of 1,300 ASL.

ENVIRONMENTAL RESOURCES MANAGEMENT PAA PROJECT FINANCE A/S
ANNEX 8-3
CEDEX evaluation of water resources in natural regime of the Honduran territory provides data about the water balance in the different basins in Honduras. The balances1 are provided both monthly and yearly. They are included in the tables below:
Table 2 Annual water balance in the Aguan Basin (2003 and 2025)
Balance 2003 (Hm3) Balance 2025 (Hm3) 2,000 – 5,000 2,000 – 5,000
Source: PAA Project Finance and Integra Ingeniería, 2017 – Edited by ERM, 2018
Table 3 Monthly water balance in the Aguan Basin (2003 and 2025)
Month Balance 2003 (Hm3) Balance 2025 (Hm3) May 200 - 300 50 - 100 June 200 - 300 150 - 200 July 300 - 500 300 - 500
August 300 - 500 300 - 500 September 300 - 500 200 - 300
October 500 - 700 300 - 500 November 300 - 500 500 - 700 December 300 - 500 500 - 700
January 200 - 300 300 - 500 February 300 - 500 200 - 300
March 200 - 300 150 - 200 April 50 - 100 25 - 50
Source: PAA Project Finance and Integra Ingeniería, 2017 – Edited by ERM, 2018
These water balances show that there is not any negative water balance in the global Aguan River Basin neither in the year 2003 nor in the year 2025. In the case of the sub-basins data, some negative balances were observed in the 2025 forecast (limited to three sub-basins and limited to 2 months), these can be balanced by the groundwater recharge into the basin, which is always positive. The following should be taken into account:
The north mountain range Aguan River Valley, especially in the Alto Aguan, has rainfall levels of 3,000 mm/year, which guarantees the recharge of the Alluvial Aquifer of the Aguan River.
This contribution would compensate the partial sub-basins negative balances.
Table 4 below provides a summary of the key hydrological data from the Aguan River Basin.
1 The original water balance developed by PAA Project and Integra Ingeniería in 2017 provides additional information by sub-basins. However, for the purpose of the ESIA, the general information about the Aguan River Basin is considered sufficient.

ENVIRONMENTAL RESOURCES MANAGEMENT PAA PROJECT FINANCE A/S
ANNEX 8-4
Table 4 Aguan River Basin: key hydrological data
Parameter Average value
Maximum value
Minimum value
Rainfall (mm/year) 1,648 2,022 1,334 Potential evaporation (mm/year) 1,248 1,320 1,184 Underground supply (mm/year) 281 Specific supply (mm/year) 560 887 281 Total supply (Hm3) 6,162
Source: Diagnóstico del Sector del Agua y Saneamiento en el Municipio de Olanchito” report, 2010
Taking into account that the municipality has a water flow of 22,181,187 m3/year in 2010 based on the data provided by water supply sources gauging stations (Municipality Olanchito, 2010), the availability of surface water sources has been estimated of 267 m3/person/year in 2010, expected to decrease to 185 m3/person/year in the future1.
4.3 GROUNDWATER
Four different aquifers are found in the Project Area:
Highly productive and extensive aquifer (intergranular flow): it includes the alluvial deposits of the Aguan River Valley. Groundwater levels in this aquifer are between 20 and 30 m depth. Wells in this aquifer show water flows ranging between 4 to 30 l/s.
Local aquifers moderate to highly productive (fissures flow): it includes the geological unit “Valle de Angeles – Kva). Groundwater levels in this aquifer are between 60 and 70 m depth. Wells in this aquifer show water flows ranging between 1 and 20 l/s.
Aquifers local to extensive poor or moderately productive (fissures flow): it includes the volcanic rocks not differentiated (Tv). No information about groundwater levels nor water flows is available.
Rocks with local and limited underground water resources: it includes the unit “Esquistos Cacaguapa - Pzm”. No information about groundwater levels nor water flows is available.
It should be noted that most of the Project Area is located on the Alluvial deposits of the Aguan River Valley, which is an extensive and highly productive aquifer. The water balance assessment conducted by PAA Project and Integra Ingeniería estimates that the maximum Project water consumption (14.93 Hm3) would produce a theoretical depletion of the groundwater less than 0.5 m, considering a static regime. Such static regime therefore does not consider any recharge in the aquifer. As described before, the north mountain range
1 Diagnóstico del Sector del Agua y Saneamiento en el Municipio de Olanchito” report, 2010

ENVIRONMENTAL RESOURCES MANAGEMENT PAA PROJECT FINANCE A/S
ANNEX 8-5
Aguan River Valley has rainfall levels of 3,000 mm/year, part of which contribute to the recharge of the Alluvial Aquifer of the Aguan River. Moreover, recharge in the Aguan River Valley is described to be between 350 and 680 mm / year. This recharge would compensate (or would keep a negligible groundwater depletion) the estimated groundwater depletion (0.5 m) in static regime.
4.4 INFILTRATION
The infiltration refers to the entry of water from the surface into the soil. It is a process that is directly related to the conditions and characteristics of the surface of the soil and it depends on the soil’s infiltration capacity and the intensity of the rain (Chow et al., 1964). Based on monthly water infiltration maps of Honduras, the average annual volume of water infiltrated in the Project Area ranges from a maximum of 1,357.11 Hm3 to a minimum of 383.30 Hm3. This minimum volume corresponds to the minimum annual volume of water available in the Project Area due to water infiltration. The following Table 5 presents the maximum and minimum average volume of water infiltrated in the Project Area categorised in three categories (Sector A being the area of the project with the highest volume of water infiltrated and Sector C the area of the project with the lowest).
Sectors of Project Area Sector A (Hm3) Sector B (Hm3) Sector C (Hm3)
Infiltrated water availability
1,357.11 968.13 968.13 645.71 682.88 383.80
Source: PAA Project Finance and Integra Ingeniería, 2017 – Edited by ERM, 2018
5 CONCLUSION
According to the Water Resource Balance conducted by PAA Project Finance and Integra Ingeniería in 2017, together with the studies carried out by the CEDEX and the Honduran Autonomous National University, there is a minimum volume of available water in the Project Area of approximately 384 Hm3 due to water infiltration to which translates into a positive balance in the Alto Aguan of 384 Hm3. Considering that the irrigation demand is estimated of 14.93 Hm3/year, it can be concluded that the planned irrigation is feasible and does not alter the environment conditions of the area or the system´s sustainability.
ENVIRONMENTAL RESOURCES MANAGEMENT PAA PROJECT FINANCE A/S
ANNEX 8-i
ANNEX 8
CRITICAL HABITAT ASSESSMENT

ENVIRONMENTAL RESOURCES MANAGEMENT PAA PROJECT FINANCE A/S
ANNEX 8-ii
CONTENTS
1 INTRODUCTION 1
2 METHODOLOGY 3
2.1 OVERVIEW 3 2.2 CRITICAL HABITAT CRITERIA 3
3 CRITICAL HABITAT DETERMINATION 8
3.1 DISCRETE MANAGEMENT UNIT 8 3.2 HABITATS 9 3.3 CRITERIA 1 AND 2 9 3.4 CRITERION 3 11 3.5 CRITERION 4 11 3.6 CRITERION 5 12 3.7 APPLICATION OF ADDITIONAL CRITERIA 12
4 CONCLUSIONS 14
4.1 OVERVIEW 14 4.2 IMPLICATIONS FOR THE PROJECT 14

ENVIRONMENTAL RESOURCES MANAGEMENT PAA PROJECT FINANCE A/S
ANNEX 8-iii
LIST OF ACRONYMS The following table presents a list of acronyms in the context of the critical habitat assessment.
Acronym Definition AoI Area of Influence BAP Biodiversity Action Plan BMP Biodiversity Management Plan CH Critical Habitat CHR Critical Habitat Review CR Critically Endangered (IUCN classification) DD Data Deficient (IUCN classification) DMU Discrete Management Unit EIA Environmental Impact Assessment EN Endangered (IUCN classification) EDGE Evolutionarily Distinct and Globally Endangered ERM Environmental Resources Management GN Guidance Note to the PS6 IBA Important Bird Area IFC International Finance Corporation IUCN International Union of the Conservation of Nature KBA Key Biodiversity Area LC Least Concern (IUCN classification) NG Net Gain NNL No Net Loss NT Near Threatened (IUCN classification) PS6 Performance Standard 6 (IFC) SCFR VU Vulnerable (IUCN classification) WWF World Wildlife Fund

ENVIRONMENTAL RESOURCES MANAGEMENT PAA PROJECT FINANCE A/S
ANNEX 8-iv
GLOSSARY OF TERMS The following table presents a list of definitions in the context of the critical habitat assessment.
Acronym Definition Biodiversity The structural, functional and compositional attributes of an area,
ranging from genes to landscapes. Critical Habitat Areas with high biodiversity value, including (i) habitat of significant
importance to Critically Endangered (CR) and/or Endangered (EN) species; (ii) habitat of significant importance to endemic and / or restricted-range species; (iii) habitat supporting globally significant concentrations of migratory species and/or congregatory species; (iv) highly threatened and / or unique ecosystems; and/or (v) areas associated with key evolutionary processes (see IFC PS6, Paragraph 16).
Critically Endangered
A taxon is Critically Endangered (CR) when it is facing an extremely high risk of extinction in the wild in the immediate future, as defined by IUCN criteria (www.iucnredlist.org).
Endangered A taxon is Endangered (EN) when it is not Critically Endangered but is facing a very high risk of extinction in the wild in the near future, as defined by the IUCN criteria (www.iucnredlist.org) or provisionally assessed by expert group.
Endemic A species that has ≥ 95 % of its global range inside the country or region of analysis (IFC PS6 GN79).
Habitat The environmental or ecological area in which an animal, plant species or other organism lives.
IUCN Red List This list has been developed by the International Union for Conservation of Nature (IUCN) and details the global conservation status of a wide range of biological species. The Red List website is http:/www.iucnredlist.org.
Keystone species A species that has a disproportionate effect on its environment relative to its biomass and whose removal initiates significant changes in ecosystem structure and loss of biodiversity
Mitigation Measures designed to avoid, reduce or remedy adverse negative impacts.
Modified Habitat An area that may contain a large proportion of plant and/or animal species of non-native origin, and / or where human activity has substantially modified the primary ecological functions and species composition.
Natural Habitat An area composed of viable assemblages of plant and/or animal species of largely native origin, and/or where human activity has not essentially modified an area’s primary functions and species composition.
Near Threatened A taxon is Near Threatened when it has been evaluated against the criteria but does not qualify for Critically Endangered, Endangered or Vulnerable now, but is close to qualifying for or is likely to qualify for a threatened category in the near future.
Net Gain Net Gain is defined by in IFC PS6 (paragraph 18) as additional conservation outcomes that can be achieved for the biodiversity values for which the critical habitat was designated. Net gains may be achieved through the development of a biodiversity offset and/or through the implementation of programs that could be implemented in situ (on-the-ground) to enhance habitat, and protect and conserve biodiversity.
No Net Loss No net loss is defined as the point at which project-related impacts on biodiversity are balanced by measures taken to avoid and minimize the project’s impacts, to undertake on-site restoration and finally to

ENVIRONMENTAL RESOURCES MANAGEMENT PAA PROJECT FINANCE A/S
ANNEX 8-v
offset significant residual impacts, if any, on an appropriate geographic scale (e.g., local, landscape-level, national, regional)
Offset Biodiversity offsets are measurable conservation outcomes resulting from actions designed to compensate for significant residual adverse biodiversity impacts arising from project development and persisting after appropriate avoidance, minimization and restoration measures have been taken.
Restricted Range Restricted range species include those with ranges in the following criteria: endemic to a site or found globally at fewer than 10 sites; animal species having a distribution range less than 50,000 km2; or bird species with a global breeding range less than 50,000 km2.
Vulnerable A taxon is Vulnerable (VU) when it is not Critically Endangered (CR) or Endangered (EN) but is facing a high risk of extinction in the wild in the medium-term future, as defined by the IUCN criteria (www.iucnredlist.org).

ENVIRONMENTAL RESOURCES MANAGEMENT PAA PROJECT FINANCE A/S
ANNEX 9-1
1 INTRODUCTION
This Annex presents the outputs of an assessment of the extent to which the Alto Aguan River Valley Irrigation Project triggers the natural and critical habitat provisions of IFC Performance Standard 6. It determines which areas within the Project footprint constitute natural habitat, which areas constitute modified habitats, and which habitats (natural or modified) and species found within the ecological landscape in and around the Project footprint may be regards as critical habitat triggers by Lenders. Critical habitats are characterised by high biodiversity values, which are determined by species, ecosystems and ecological processes. This assessment is a requirement of IFC PS61 to manage risks and avoid, mitigate, and offset impacts to areas with high biodiversity values. Different levels of mitigation measures / project design apply in non-critical habitat and in critical habitat. Whilst, no net loss of biodiversity2 is required in non-critical habitats, net gain of biodiversity3 is required in the case of critical habitats. This difference (no net loss vs net gain) might result in a higher level of project mitigation requirements (including changes in the project design and offset measures). Prior to funding projects, most lenders require a demonstration of how environmental and social impacts / risks associated with the project will be managed. The IFC’s Performance Standards are the most internationally accepted guidance for projects on how to achieve this. For biodiversity-related impacts, IFC PS6 is used, as described before. IFC PS6 divides habitats into three types that require different levels of management of effects: modified, natural, and critical. Critical habitats require the highest level of assessment and management of effects. Some specific requirements of IFC PS6 include the following:
As a matter of priority, avoid impacts on biodiversity and ecosystem services. When avoidance of impacts is not possible, measures to minimise impacts and restore biodiversity and ecosystem services should be implemented, in line with the mitigation hierarchy.
For critical habitat, retain external experts with appropriate regional experience to assist in the development of appropriate mitigation and management.
1 IFC (2012) Performance Standard 6: Biodiversity Conservation and Sustainable Management of Living Natural Resources. 2 No net loss is defined (IFC PS6) as the point at which project-related impacts on biodiversity are balanced by measures
taken to avoid and minimize the project’s impacts, to undertake on-site restoration and finally to offset significant residual impacts, if any, on an appropriate geographic scale (e.g., local, landscape-level, national, regional).
3 Net gain is defined (IFC PS6) as additional conservation outcomes that can be achieved for the biodiversity values for which the critical habitat was designated. Net gains may be achieved through the development of a biodiversity offset
and/or the implementation of programs that could be implemented in situ (on-the-ground) to enhance habitat, and protect
and conserve biodiversity.

ENVIRONMENTAL RESOURCES MANAGEMENT PAA PROJECT FINANCE A/S
ANNEX 9-2
The main objective of this Annex is to identify key biodiversity features of concern that may be qualified as Critical Habitat, and impacted by the Project. Key biodiversity features were identified using the process and criteria described in the IFC PS6. The process involves the following:
Defining the Discrete Management Unit (DMU). Characterising the environmental baseline through desktop review
and focused field survey (See Section 5.4). Reviewing the habitats within the DMU to determine the presence of
Natural or Modified Habitat. Reviewing the conservation status of species present in the DMU. Determining the presence of Critical Habitat within the DMU. Recommending measures to address risks related to Critical Habitat.
The assessment presented here has been informed by the ESIA undertaken for the Project.

ENVIRONMENTAL RESOURCES MANAGEMENT PAA PROJECT FINANCE A/S
ANNEX 9-3
2 METHODOLOGY
2.1 OVERVIEW
Critical Habitat is defined in IFC PS6, paragraph 16: ‘Critical habitats” are areas with high biodiversity value, including (i) habitat of significant importance to Critically Endangered and/or Endangered species; (ii) habitat of significant importance to endemic and/or restricted-range species; (iii) habitat supporting globally significant concentrations of migratory species and/or congregatory species; (iv) highly threatened and/or unique ecosystems; and/or (v) areas associated with key evolutionary processes.’ The description of these criteria (along with their quantitative thresholds (for the first three criterions) are further described in the associated Guidance Notes . The IFC PS6 describes three steps that should be used to identify and characterize Critical Habitat. Step 1: Stakeholder Consultation/Initial Literature Review Aim: To obtain an understanding of biodiversity within the landscape from the perspective of all relevant stakeholders. This has taken place during fieldwork for the ESIA (see references to the field survey conducted in June 2018 in Section 5.4, including meetings with different stakeholders). Step 2: In-field Data Collection and Verification of Available Information
Aim: To collect field data and verify available detailed information necessary for the critical habitat review. This has been done in the process of developing this EIA (see references to the field survey conducted in June 2018 in Section 5.4). Step 3: Critical Habitat Determination
Aim: Determine whether the project is situated in Critical Habitat. Analysis and interpretation of the desktop and field data collected. An overview of the results of the CH are described, along with recommended actions in Section 3 of this Annex.
2.2 CRITICAL HABITAT CRITERIA
The term Critical Habitat is broadly defined in Paragraph 16 of IFC PS6 as areas with high biodiversity value. This includes areas that meet one or more of the following criteria:

ENVIRONMENTAL RESOURCES MANAGEMENT PAA PROJECT FINANCE A/S
ANNEX 9-4
Criterion 1: Critically Endangered (CR) and/or Endangered (EN) Species.
Criterion 2: Endemic and/or Restricted-range Species.
Criterion 3: Migratory and/or Congregatory Species.
Criterion 4: Highly Threatened and/or Unique Ecosystems.
Criterion 5: Key Evolutionary Processes.
Further description of each of the criteria is detailed in IFC PS6, a summary of each follows below.
2.2.1 Criterion 1: Critically Endangered and/or Endangered Species
The IFC PS6 defines Endangered (EN) and Critically Endangered (CR) according to IUCN and as reported on the IUCN Red List of Threatened Species (Red List). The guidance on applying a particular listing is as follows: If the species is listed nationally or regionally as EN or CR, in countries
that adhere to IUCN guidance, the critical habitat determination will be made on a project by project basis in consultation with competent professionals.
2.2.2 Criterion 2: Endemic and/or Restricted-range Species
The IFC PS6 provides the following definitions for endemic and restricted-range species. An endemic species is defined as one that has ≥ 95% of its global range inside the country or region of analysis. A restricted-range species is defined for animals as: Those species which have an extent of occurrence of 50,000 km2 or less. Plants are more commonly referred to as “endemic”.
2.2.3 Criterion 3: Migratory and Congregatory Species
The IFC PS6 defines migratory species as any species of which a significant proportion of its members cyclically and predictably move from one geographical area to another (including within the same ecosystem). Congregatory species are those whose individuals gather in large groups on a cyclical or otherwise regular and/or predictable basis, form colonies. These congregation can occur for non-breeding purposes (e.g. foraging, roosting) or due to bottleneck sites where significant numbers of individuals of a species pass over a concentrated period of time (e.g. during migration).

ENVIRONMENTAL RESOURCES MANAGEMENT PAA PROJECT FINANCE A/S
ANNEX 9-5
2.2.4 Criterion 4: Highly Threatened and/or Unique Ecosystems
The IFC PS6 defines highly threatened or unique ecosystems as those that are at risk of significantly decreasing in area or quality; are of small spatial extent; and/or contain unique assemblages of species including assemblages or concentrations of biome-restricted species (i.e. species whose distributions are largely or wholly confined to one biome).
2.2.5 Criterion 5: Key Evolutionary Processes
Evolutionary processes are often strongly influenced by structural attributes of a region, such as its topography, geology, soil and climate over a period of time. The IFC PS6 suggests that this criterion is defined by: (1) physical features of a landscape that might be associated with particular evolutionary processes; and/or (2) sub-populations of species that are phylogenetically or morphogenetically distinct and may be of special conservation concern given their distinct evolutionary history (i.e. Evolutionarily Distinct and Globally Endangered (EDGE) species or Evolutionary Significant Units at population level). Criterion 5 is usually considered to be heavily reliant on scientific knowledge, and thus would be triggered in areas that have already been thoroughly investigated or where significant research has been conducted that may have already indicated the potential or existence of unique evolutionary processes. Furthermore the Guidance Notes indicates that internationally and/or nationally recognized areas of high biodiversity value will likely qualify as critical habitat.
2.2.6 Quantitative Criteria for Criterions 1 to 3
The IFC PS6 recognises that there are gradients of critical habitat or a continuum of degrees of biodiversity value associated with critical habitats based on the relative vulnerability (degree of threat) and irreplaceability (rarity or uniqueness) of the specific location. This gradient or continuum of criticality is true for all criteria. Even within a location designated as Critical Habitat there might be habitats or habitat features of higher or lower biodiversity value. There also will be cases where a project is sited within a greater area recognized as Critical Habitat, but where the specific project site itself has been highly modified. This is particularly the case in this project, where the project actions will take place in highly modified habitat. The Guidance Notes detail the tiers of Critical Habitat. For Criteria 1 to 3, quantitative thresholds are provided to assign critical habitat into either Tier 1 or Tier 2. Criteria 1 through 3 are focused on species level, whilst Criteria 4 and 5 focus on ecosystem and landscape levels. Table 2.1 details the relevant thresholds.

ENVIRONMENTAL RESOURCES MANAGEMENT PAA PROJECT FINANCE A/S
ANNEX 9-6
Table 2.1 Quantitative Thresholds for Tiers 1 and 2 of Critical Habitat Criteria 1 to 3
Criteria Tier 1 Tier 2 Criterion 1. Critically Endangered (CR)/ Endangered (EN) Species
(1a) Habitat required to sustain ≥ 10 percent of the global population of a CR or EN species/subspecies where there are known, regular occurrences of the species and where that habitat could be considered a discrete management unit for that species. (1b) Habitat with known, regular occurrences of CR or EN species where that habitat is one of 10 or fewer discrete management sites globally for that species.
(1c) Habitat that supports the regular occurrence of a single individual of a CR species and/or habitat containing regionally- important concentrations of a Red-listed EN species where that habitat could be considered a discrete management unit for that species/ subspecies. (1d) Habitat of significant importance to CR or EN species that are wide-ranging and/or whose population distribution is not well understood and where the loss of such a habitat could potentially impact the long-term survivability of the species. (1e) As appropriate, habitat containing nationally/regionally important concentrations of an EN, CR or equivalent national/regional listing.
Criterion 2. Endemic/ Restricted Range Species
(2a) Habitat known to sustain ≥ 95 percent of the global population of an endemic or restricted-range species where that habitat could be considered a discrete management unit for that species (e.g., a single-site endemic).
(2b) Habitat known to sustain ≥ 1 percent but < 95 percent of the global population of an endemic or restricted-range species where that habitat could be considered a discrete management unit for that species, where data are available and/or based on expert judgment.
Criterion 3. Migratory/ Congregatory Species
(3a) Habitat known to sustain, on a cyclical or otherwise regular basis, ≥ 95 percent of the global population of a migratory or congregatory species at any point of the species’ lifecycle where that habitat could be considered a discrete management unit for that species.
(3b) Habitat known to sustain, on a cyclical or otherwise regular basis, ≥ 1 percent but < 95 percent of the global population of a migratory or congregatory species at any point of the species’ lifecycle and where that habitat could be considered a discrete management unit for that species, where adequate data are available and/or based on expert judgment. (3c) For birds, habitat that meets Birdlife International’s Criterion A4 for congregations and/or Ramsar Criteria 5 or 6 for Identifying Wetlands of International Importance. (3d) For species with large but clumped distributions, a provisional threshold is set at ≥5 percent of the global population for both terrestrial and marine species.

ENVIRONMENTAL RESOURCES MANAGEMENT PAA PROJECT FINANCE A/S
ANNEX 9-7
Criteria Tier 1 Tier 2 (3e) Source sites that contribute ≥ 1 percent of the global population of recruits.
Source: IFC, 2012 (Guidance Note 89 to PS6)
Criterion 4 is triggered by ecosystems that are threatened, house unique assemblages of biome-restricted species, or are recognized for high conservation value, including protected areas. No quantitative thresholds are provided by the IFC Performance Standards; nonetheless, quantitative categories and criteria from Rodriguez et al. (2011) and Bland et al. (2016) may be applied to evaluate ecosystem status if availability and quality of data allow. Criterion 5 applies to landscape-level features that can influence key evolutionary processes. Key landscape features such as unique topography that creates unique habitats and areas important for climate change adaptations have been identified using literature review and through expert consultation. This criterion also applies at the species level for ‘distinct species’ which includes those coined as ‘Evolutionarily Distinct and Globally Endangered’ (EDGE) (GN 95 IFC 2012b). Species within the unit of analysis identified as EDGE species where evaluated for Critical Habitat on a case-by-case basis.

ENVIRONMENTAL RESOURCES MANAGEMENT PAA PROJECT FINANCE A/S
ANNEX 9-8
3 CRITICAL HABITAT DETERMINATION
Based on the biodiversity data obtained as part of Steps 1 and 2 (i.e. desktop study and field survey), information is screened against the criteria and thresholds.
3.1 DISCRETE MANAGEMENT UNIT
The scale at which a critical habitat determination takes places depends on underlying ecological processes for the habitat in question and is not necessarily limited to the footprint of the project. For Criteria 1 to 3, the determination of critical habitat is based on a Discrete Management Unit (DMU), an area that has a definable boundary within which the biological communities have more in common with each other than they do with those outside the boundary: ‘A discrete management unit may or may not have an actual management boundary (e.g., legally protected areas, World Heritage sites, KBAs, IBAs, community reserves) but could also be defined by some other sensitive ecologically definable boundary (e.g., watershed, interfluvial zone, intact forest patch within patchy modified habitat, seagrass habitat, coral reef, concentrated upwelling area, etc.). The delineation of the management unit will depend on the species (and, at times, subspecies) of concern.’ In the case of the Alto Aguan River Valley Irrigation Project, the definition of the DMU in order to determine the quantitative thresholds for CH become largely irrelevant. Whether the DMU is defined as the whole of the Aguan River watershed as one extreme case, or the footprint of the protected area on the other, the species and habitats involved would provide the same calculations. What has become clear and is stated in Section 5.4.4 of the ESIA, is that the size of the protected area is a mix of biological features (areas where the very dry forest patches are better preserved) and socio-economic (areas where landowners have volunteered to relinquish land use change), and as such the size and location of the habitat which could qualify as Critical extends beyond the current protected area. On the other hand the Aguan River Valley is a mosaic of natural and modified habitats, which available evidence discards for the latter the possibility of being classified as Critical. In terms of connectivity, in fact the mobility of the key species which have determined the protection of the area is actually low or very low, thus the patchiness and mosaic pattern of the area is a difficulty in the preservation of genetically viable population sets in each well preserved habitat patch. In any case, and for the purposes of defining CH ,as mentioned, the DMU is largely irrelevant as the nature of the potential CH will be restricted to those very dry and dry forests, as recognized by local and international institutions.

ENVIRONMENTAL RESOURCES MANAGEMENT PAA PROJECT FINANCE A/S
ANNEX 9-9
3.2 HABITATS
According to the Section 5.4.1 of the ESIA, habitat categorizations in the Project’s AoI include:
Agricultural fields and pastures. Grassland. Aquatic systems. Urban and rural areas. Shrubland and forest, including: very dry tropical forest, dry tropical
forest and other types of shrubland and forest (e.g. conifer forests, mixed areas, etc.).
3.2.1 Natural Habitat
According existing habitat categorizations, Natural Habitats correspond to well preserved vegetation (terrestrial) habitat (very dry and dry tropical forest), along with those of existing water bodies.
3.2.2 Modified Habitat
With regards to Modified Habitats, these would correspond to all identified areas with secondary vegetation, especially secondary forest (sparsely/ partially vegetated), grassland which most of the times are abandoned areas that were used by livestock in the past, and agricultural fields and pastures.
3.3 CRITERIA 1 AND 2
3.3.1 Identification of Trigger Species
Species identified during the desktop search as being likely to be present within the DMU have been screened in order to identify those that are classified as EN or CR as well as their endemicity/range restriction. Table 3.1 shows the species identified.
Table 3.1 IUCN Red List Terrestrial Species and Status
Scientific name Endemic IUCN Flora Bakeridesia molinae Yes - Caesalpinia yucatanensis (subsp. Hondurensis) Yes - Capparicordis yunckeri Yes - Dioon mejiae Yes LC Eugenia lempana Yes - Eugenia coyolensis Yes CR Leucaena lempirana Yes VU Lonchocarpus trifolius Yes CR Lonchocarpus yoroensis - CR Opuntia hondurensis Yes -

ENVIRONMENTAL RESOURCES MANAGEMENT PAA PROJECT FINANCE A/S
ANNEX 9-10
Scientific name Endemic IUCN Parathesis vulgata - EN Stenocereus yunckeri - CR (*) Vanilla planifolia - EN Zamia standleyi Yes VU Reptiles Ctenosaura melanosterna Yes CR Sphaerodactylus dunni Yes LC Birds Amazilia luciae Yes EN
Notes: (*) See Annex 6 for further clarifications. Source: Documents RVSCEH – Edited by ERM, 2018
3.3.2 Discussion
Depending on each species features as described in the preceding table, their tier status according to Criterions 1 and 2 are discussed in the following tables.
Table 3.2 Criteria 1 and 2 Tier Status for Amazilia luciae
Criterion 1: Critically Endangered and/or Endangered Species Tier 1 a It is considered certain that over 10% of the global population may occur in
the DMU. b Given the biology of the species and geographical features of the unit of
analysis, the DMU may be considered a discrete management site. Criterion 2: Endemic and / or restricted range species Tier 1 a It is considered certain that over 95% of the global population may occur in
the DMU.
Table 3.3 Criteria 1 and 2 Tier status for Ctenosaura melanosterma
Criterion 1: Critically Endangered and/or Endangered Species Tier 1 a It is considered certain that over 10% of the global population may occur in
the DMU. b Given the biology of the species and geographical features of the unit of
analysis, the DMU may be considered a discrete management site. Criterion 2: Endemic and / or restricted range species Tier 1 a It is considered certain that over 95% of the global population may occur in
the DMU.
Table 3.4 Criterion 2 Tier status for Sphaerodactylus dunni
Criterion 2: Endemic and / or restricted range species Tier 1 a Taking into account its distribution map, it is not expected that over 95% of
the global population of this species may occur in the DMU. Tier 2 b DMU is certain to sustain regular occurrence of single individuals or groups,
considering their limited extent of occurrence (range restriction), it is likely that between over 1% to less than 95% may inhabit the DMU; and thus may be considered a discrete management site.

ENVIRONMENTAL RESOURCES MANAGEMENT PAA PROJECT FINANCE A/S
ANNEX 9-11
Table 3.5 Criteria 1 and 2 Tier status for Endemic and / or CR / EN flora
It is considered that the presence of endemic and or CR / EN plant species within the DMU is certain. Though there is a lack of data with regards to the distribution and abundance of some of these species, it is highly likely that most of them are range restricted. Thus under a precautionary approach identified species are assessed as likely of triggering critical habitat under Criterions 1 and 2, a short review of the tier criteria is presented. Criterion 1: Critically Endangered and/or Endangered Species Tier 1 a It is considered likely that over 10% of the global of some species may
potentially occur in the DMU. b Given the biology of these plant species and geographical features of the unit
of analysis, it is considered probable that the DMU may be considered a discrete management site.
Tier 2 c It is certain that that DMU sustain regular occurrence of single individuals or groups, and thus probable that it may contain regionally important concentrations or be a discrete management site for the endangered species.
d It is considered likely that the loss of habitat at DMU level may impact long-term survivability of species.
e Habitats within the DMU may likely contain nationally/regionally important concentrations.
Criterion 2: Endemic and / or restricted range species Tier 1 a It is considered probable that over 95% of the global population of any of
these species may occur in the DMU. Tier 2 b DMU is certain to sustain regular occurrence of single individuals or groups,
considering their limited extent of occurrence (range restriction), it is likely that between over 1% to less than 95% may inhabit the DMU; and thus may be considered a discrete management site.
3.4 CRITERION 3
There is currently no information that indicates that the DMU or part of it represents a major flyway where migratory birds would congregate on a cyclical/regular basis in a number in excess of 1% of its global population.
3.5 CRITERION 4
According to the table below the main habitats that comprise the DMU have been assessed qualitatively against IFC descriptors for endangered ecosystems.
Table 3.6 Critical Habitat Identification of Highly Threatened or Unique Ecosystems
Identified habitat type within the DMU
Critical habitat criteria
Critical habitat trigger
At risk of significantly decreasing in
area or quality
Small spatial extent
Presence of unique
assemblages of species
Very dry forest Yes Yes Yes Yes Dry forest Yes Yes Probable Yes

ENVIRONMENTAL RESOURCES MANAGEMENT PAA PROJECT FINANCE A/S
ANNEX 9-12
As specified in Section 5.4.1 of the ESIA, the surface of very dry tropical forest has decreased significantly. It is considered that the existing surface nowadays only represent 2% of the original surface:
In 1938, the surface of very dry tropical forest was about 30,000 ha. In 2000, the surface was estimated in 8,495 ha. In 2009, the surface was estimated in 2,962.8 ha.
In addition to this high level of reduction of the surface of this habitat, it is also a very fragmented habitat. Because of this, the RVSCEH is formed by a number of spread and isolated areas across the Aguan River Valley. With regards to the presence of unique assemblages in the forested habitats of the DMU, previous sections have discussed the presence of sensitive fauna (both endemic and of high conservation concern) which suggest that unique species assemblages exist.
3.6 CRITERION 5
Criterion 5 is mainly defined by the presence of physical landscape features that may be associated to particular evolutionary processes as well as the presence of subpopulations of species that are phylogenetically or morphogenetically distinct and may be of special conservation concern given their distinct evolutionary history (e.g. EDGE). With regards to the former, the DMU seemingly has no major physical features that may set it apart from other areas that may be found along the ecoregion. Whilst for the latter, none of the species initially screened the following are considered EDGE species. This criterion may overlap with Criterion 2 for endemic species (IFC, 2012). It has been noted that extensive surveys are required to gain a better understanding of the biodiversity features in the area (especially presence of endemic flora, as well as distribution of screened species throughout the earlier sections of this report). Thus information is not sufficient to determine whether or not critical habitat is triggered for the DMU under Criterion 5.
3.7 APPLICATION OF ADDITIONAL CRITERIA
It is not clear what the protected area would be designated according to IUCN Protected Area designation which ranges from strict protection Category I to resource managed areas Category VI). Brauneder et al. (2018) commented that IUCN management categories Ia, Ib and II (e.g. Strict Nature Reserves and National Parks) are explicitly mentioned in GN6, indicating they should be treated as critical habitat; whereas for management categories III-VI and areas for which the IUCN management category was not reported or not assigned (as is the case for the Honduran Emerald Wildlife Refuge) may qualify as

ENVIRONMENTAL RESOURCES MANAGEMENT PAA PROJECT FINANCE A/S
ANNEX 9-13
critical habitat if underlying biodiversity values align with critical habitat criteria. Given the latter, it is deemed that the DMU does qualify as Critical Habitat with regards to the management status of the Honduran Emerald Wildlife Refuge.

ENVIRONMENTAL RESOURCES MANAGEMENT PAA PROJECT FINANCE A/S
ANNEX 9-14
4 CONCLUSIONS
4.1 OVERVIEW
Three animal species inhabiting the DMU trigger classification as Critical Habitat. In addition, there are several species of endangered or endemic flora which are thought to be range restricted which would trigger the designation. The forest habitats found in the DMU would also trigger classification as Critical Habitat based on their scarcity, existing trends in forest cover loss, and for their ability to host specific biodiversity values.
4.2 IMPLICATIONS FOR THE PROJECT
The IFC Performance Standards sets compliance objectives requiring the demonstration of No Net Loss (NNL) and potentially Net Gain (NG) measures for proposed projects located within either Natural and Critical habitats; or a combination of these. In terms of Natural Habitat the Project is not to significantly convert or degrade natural habitats, and mitigation measures are to be designed to achieve no net loss of biodiversity where feasible.
4.2.1 Critical Habitat
In areas of Critical Habitat, PS6 paragraph 17 indicates the Project is not to implement any project activities unless certain conditions are met, these are shown in Table 4.1 along with a brief discussion on their status.
Table 4.1 Review of Project conditions located in Critical Habitat.
Conditions for Projects in critical habitat Status of Aguan River Valley Irrigation Project
No other viable alternatives within the region exist for development of the Project on Modified or Natural habitats that are not Critical
Project location intrinsic to the climatic region, which is inherent of the presence of CH
The Project does not lead to measurable adverse impacts on those biodiversity values for which the Critical Habitat was designated, and on the ecological processes supporting those biodiversity values
Based on the ESIA findings, it is considered unlikely that significant adverse impacts may occur on CH trigger species/habitats.
The project does not lead to a net reduction in the global and/or national/regional population of any Critically Endangered or Endangered species over a reasonable period of time
Based on the ESIA findings, it is considered unlikely that significant net reduction may occur on CH trigger species/habitats over a reasonable period of time.
A robust, appropriately designed, and long-term biodiversity monitoring and evaluation program is integrated into the client’s management program
The ESIA advances the main features of the BMP indicating that the Project shall implement specific management and monitoring programs for sensitive species.

ENVIRONMENTAL RESOURCES MANAGEMENT PAA PROJECT FINANCE A/S
ANNEX 9-15
In such cases where the Project is able to meet the requirements, the mitigation strategy is to be described in a Biodiversity Management or Action Plan and will be designed to achieve, when relevant, net gains of those biodiversity values for which the Critical Habitat was designated. Net Gain measures should be applied to the biodiversity components that are confirmed to trigger Critical Habitat, unless the Project demonstrates that it will not impact those biodiversity components. In this case, to implement the requirements identified in the various studies (ESIAs, CHR) the Project will develop a Biodiversity Management Plan (BMP) to consolidate mitigations and management related to biodiversity protection. The BMP will provide a comprehensive plan for the Project to address issues of biodiversity protection. The implementation of mitigation measures will avoid or reduce impacts and risks to acceptable levels. In addition, the BMP will address specific requirements related to Critical Habitat as specified in the IFC Performance Standards: ‘Net gains may be achieved through the biodiversity offset, and in instances where a biodiversity offset is not part of the client’s mitigation strategy (i.e., there are no significant residual impacts), net gains would be obtained by identifying additional opportunities to enhance habitat and protect and conserve biodiversity.’ Specifically, the BMP will describe how net gain is to be achieved for the key species and habitats of concern. Considering that there are no significant residual impacts to those species and habitats derived from the project, those will no entail offsets, but will rather be additional opportunities to enhance habitat and protect and conserve biodiversity.