
ESI Data 1 200/266-nm femtosecond laser ablation system ...
24
ESI Data 1 200/266-nm femtosecond laser ablation system The LA-ICPMS measurements were performed using a 200/266-nm femtosecond laser ablation (200/266FsLA) system that was developed in-house with OK Laboratory Limited at the Institute for Research on Earth Evolution, Japan Agency for Marine-Earth Science and Technology (IFREE/JAMSTEC), and was manufactured by OK-Fs2000K (OK Laboratory, Tokyo, Japan) (ESI Data 1 Fig. 1A). This 200/266FsLA system uses a Solstice one-box Ti: Sapphire femtosecond regenerative amplifier (Spectra-Physics, Santa Clara, CA, USA) with TP-1A THG and TP-1A FHG frequency tripling and quadrupling harmonic generators (Spectra-Physics, Santa Clara, CA, USA). Sets of flip-in mirrors enable co-axial switching between the two different frequency laser beams. Herein, two objective lenses of either excimer laser-grade high-power fused silica (266 nm) or fluorite (200 nm) are used to focus the beams onto the sample surfaces. 1 The two objective lenses are motor driven, and the changeovers are synchronized with the flip-in mirrors. The resulting craters are 30 μm and 90 μm for 200 nm and 266 nm at the maximum sizes, respectively, and can be reduced to 25, 20, 15, 10, and 5 μm for 200 nm and 70, 50, 40, 30, and 15 μm for 266 nm by applying apertures with different diameters. The laser fluences on the sample surface are ~6 J cm -2 at 200 nm and ~12 J cm -2 at 266 nm (ESI Data 1 Table 1). Modified sector field mass spectrometer and settings The 200/266FsLA is coupled to an Element XR sector-field ICPMS (Thermo Fisher Scientific, Bremen, Germany) at the IFREE/JAMSTEC. The Element XR employs both magnetic mass jumps and electrostatic scanning to encompass the mass spectrum range of 6 to 240 amu. Further, the Element XR is equipped with two separate detectors that can be rapidly switched to detect the ion signal from the peak of interest; the detectors include a dual mode secondary electron multiplier (SEM) and a Faraday cup, thereby providing a dynamic range from 0 to 10 12 cps. The dual mode SEM employs ion counting (0–4 × 10 6 cps) and analogue (10 4 –10 9 cps) modes, while the Faraday cup has a range of 10 7 –10 12 cps. Note that daily cross-calibrations of the three detector modes were performed by scanning the 38 Ar peak. No mass-dependent fractionation of the detector linearity was observed. However, in this study, the Faraday cup was not used due to the loss of some peak signals in a rapid peak jumping mode. 2 Instead, the detector was forced to use the analogue mode to measure the element peaks with high background and signal intensities (used only for 23 Na). This forced analogue mode can provide a dynamic range of 3 × 10 3 –4 × 10 9 cps with a reasonably linear response that is well suited to measuring isotopes with a high count rate and background. Electronic Supplementary Material (ESI) for Journal of Analytical Atomic Spectrometry This journal is © The Royal Society of Chemistry 2012
-
Upload
khangminh22 -
Category
Documents
-
view
3 -
download
0
Transcript of ESI Data 1 200/266-nm femtosecond laser ablation system ...
ESI Data 1
200/266-nm femtosecond laser ablation system
The LA-ICPMS measurements were performed using a 200/266-nm femtosecond laser ablation
(200/266FsLA) system that was developed in-house with OK Laboratory Limited at the Institute for
Research on Earth Evolution, Japan Agency for Marine-Earth Science and Technology
(IFREE/JAMSTEC), and was manufactured by OK-Fs2000K (OK Laboratory, Tokyo, Japan) (ESI
Data 1 Fig. 1A). This 200/266FsLA system uses a Solstice one-box Ti: Sapphire femtosecond
regenerative amplifier (Spectra-Physics, Santa Clara, CA, USA) with TP-1A THG and TP-1A FHG
frequency tripling and quadrupling harmonic generators (Spectra-Physics, Santa Clara, CA, USA).
Sets of flip-in mirrors enable co-axial switching between the two different frequency laser beams.
Herein, two objective lenses of either excimer laser-grade high-power fused silica (266 nm) or
fluorite (200 nm) are used to focus the beams onto the sample surfaces.1 The two objective lenses are
motor driven, and the changeovers are synchronized with the flip-in mirrors. The resulting craters
are 30 µm and 90 µm for 200 nm and 266 nm at the maximum sizes, respectively, and can be
reduced to 25, 20, 15, 10, and 5 µm for 200 nm and 70, 50, 40, 30, and 15 µm for 266 nm by
applying apertures with different diameters. The laser fluences on the sample surface are ~6 J cm-2 at
200 nm and ~12 J cm-2 at 266 nm (ESI Data 1 Table 1).
Modified sector field mass spectrometer and settings
The 200/266FsLA is coupled to an Element XR sector-field ICPMS (Thermo Fisher Scientific,
Bremen, Germany) at the IFREE/JAMSTEC. The Element XR employs both magnetic mass jumps
and electrostatic scanning to encompass the mass spectrum range of 6 to 240 amu. Further, the
Element XR is equipped with two separate detectors that can be rapidly switched to detect the ion
signal from the peak of interest; the detectors include a dual mode secondary electron multiplier
(SEM) and a Faraday cup, thereby providing a dynamic range from 0 to 1012 cps. The dual mode
SEM employs ion counting (0–4 × 10⁶ cps) and analogue (104–109 cps) modes, while the Faraday
cup has a range of 107–1012 cps. Note that daily cross-calibrations of the three detector modes were
performed by scanning the 38Ar peak. No mass-dependent fractionation of the detector linearity was
observed. However, in this study, the Faraday cup was not used due to the loss of some peak signals
in a rapid peak jumping mode.2 Instead, the detector was forced to use the analogue mode to
measure the element peaks with high background and signal intensities (used only for 23Na). This
forced analogue mode can provide a dynamic range of 3 × 10³–4 × 10⁹ cps with a reasonably linear
response that is well suited to measuring isotopes with a high count rate and background.
Electronic Supplementary Material (ESI) for Journal of Analytical Atomic SpectrometryThis journal is © The Royal Society of Chemistry 2012

In order to obtain an enhanced-sensitivity low oxide molecular SF-ICPMS, we added a
high efficiency rotary pump (S60B, Oerlikon Leybold Vacuum, Cologne, Germany) to our Element
XR in parallel with the existing expansion rotary pump (UNO35, Pheiffer Vacuum, Asslar,
Germany); this led to improvements in the vacuum at the interface—from 2.5 mbar to 1 mbar in
solution mode (Ar carrier gas) and to 1.5 mbar in the LA mode (He carrier gas) (ESI Data 1 Fig.
1B). We electrically disconnected the guard electrode (GE) shield at the ICP torch and used the
normal Ni sampling and Ni skimmer cones (ESI Data 1 Table 1). An alternative option is to use
cones made from different materials (e.g. Al, Pt),3 but the conventional normal-Ni cones gave
sufficient results, as noted below.
By using the GE, high efficiency X-skimmer, and JET sample cones (Thermo Fischer
Scientific, Bremen, Germany)4 individually, the sensitivity increased by several times; using all of
the options together improved the sensitivity by about an order of magnitude in many isotopes.1, 4, 5
However, the oxide molecular yields, measured as ThO+/Th+, was >15% for the solution mode when
the normal cyclone nebulizer was used. More than 10% ThO+/Th+ was observed even when
operating a dry (H2O solvent free) plasma in the LA mode.6 Such high oxide molecular yields do not
permit the precise determination of elements that have oxide interferences from higher abundance
lighter elements (e.g. middle and heavy rare earth elements) in a practical sense.7 This is particularly
true in the case of the LA mode because it is not possible to properly determine the molecular oxide
yields unless a set of well-arranged element-doped glass standards are available.7 Kent and Ungerer
(2005) examined the oxide molecular yield in the LA mode by using synthetic glasses and showed
that ThO+/Th+ < ~2.5% is an acceptable range for the accurate determination of MREEs in most
natural sold earth samples.7 The sizes of molecular oxide interferences were reduced when the ion
sampling depth was adjusted by increasing the distance between the ICP torch and sampling cone,
and by reducing the sample gas flow.7-9 However, the signal intensity was also reduced, and the
stability of the signal was degraded in our experiments. Even with the ‘reduced oxide’ setting, it was
difficult to achieve ThO+/Th+ less than 1% using our SF-ICPMS with the GE-on mode, even when
using normal-Ni cones.
In contrast, ThO+/Th+ was <0.5% for the solution mode analysis with the normal-Ni cones
in the GE-off mode, but instrumental sensitivity was only 0.2 Gcps ppm-1 at 115In, which is
approximately 10 times less than that at the GE-on mode. After the addition of the high-efficiency
rotary pump at the interface (ESI Data 1 Fig. 1B), the sensitivity improved to 1.4 Gcps ppm-1 in the
solution mode when a chilled cyclone splay chamber PC3 (Elemental Scientific Inc. (ESI), Nebraska,
USA) was used; this is comparable to that with the GE-on mode and is realized without causing an
increase in the number of oxide molecular ions (ThO+/Th+ < 0.5%). When the laser (dry plasma) was
used, ThO+/Th+ was <0.3%, and signal intensities were 1000–7000 cps ppm-1 at 200 nm and 2500–
21000 cps ppm-1 at 266 nm for the laser crater size of ~30 µm (see details below). We also examined
Electronic Supplementary Material (ESI) for Journal of Analytical Atomic SpectrometryThis journal is © The Royal Society of Chemistry 2012
other interface settings, such as the torch-sample cone distance, sample gas flow, and plasma power.
Thus far, for our enhanced sensitivity SF-ICPMS, we have ascertained that our present setting is the
most reproducible and stable condition over a period of 18 months (ESI Data 1 Table 1).
Sample cell
For LA analysis, the sample was placed in an in-house developed ablation cell with an inner volume
of 7 cm3. Six parallel fine nozzles (diameter 1 mm) generated steady state gas flows inside the cell at
>3 cm downstream of the nozzles, and the samples were set within a distance of 3–6 cm downstream.
The steady state gas flow was confirmed by (1) a stable ablation, (2) the sensitivity unrelated to the
ablation location in the cell, and (3) quick washout of the aerosols, suggesting there were no standing
vortexes in the cell. Industrial grade He gas flowed through the cell at a fixed flow rate (1.2 L min-1)
to transport the aerosol produced by ablation. We have tested gas blank levels of the isotopes of
interest using the industrial grade and the analytical grade gases of both He and Ar; however, no
difference was found between the two grades from our supplier. Therefore, we constantly use the
industrial grade gases. The He carrier gas with the aerosol flowed into a cylindrical Teflon mixing
chamber with an inner volume of 170 cm3 and mixed with Ar gas (~1 L min-1) just prior to the
ICP-torch. The Ar gas flow alone was tuned to achieve a stable optimized signal from the
SF-ICPMS.
193ExLA system used for comparison
Along with the 200/266FsLA analyses, a 193-nm excimer (193Ex) LA system (OK-ExLA2000; OK
Laboratory, Tokyo, Japan)5 was also applied. The purpose of this analysis was to provide
comparisons between 200/266FsLA and 193ExLA using the same sample cell and SF-ICPMS in
order to test the differences of the LA aerosols from the different laser systems. The 193ExLA
analyses were performed on SRM612, BHVO-2G, and BCR-2G standard samples and used for
determinations of element sensitivity and effect of matrix-induced element fractionation. To achieve
this, we used the repetition rate at 10 Hz, laser fluence at the sample surface of ~15 J cm-2, crater
diameter at ~30 µm, and analysis using a spot mode. The same rotation raster mode used in the
200/266FsLA (see ESI Data 2) is not available with the current 193ExLA system, so we used the
spot mode which generated the same crater diameter. Moreover, these analytical conditions of
193ExLA are almost identical to those reported by other researches,3, 10 so that comparisons to the
previous works were also conducted.
Grain size analysis of the laser aerosols
Electronic Supplementary Material (ESI) for Journal of Analytical Atomic SpectrometryThis journal is © The Royal Society of Chemistry 2012
Measurement of the grain size distribution of the laser aerosols from SRM612 and BHVO-2G
glasses were made using a Scanning Mobility Particle Sizer SMPS3936L75 (TSI Inc., Minnesota,
U.S.A.) at a filtered air flow rate of 0.3 L m-1, and the same laser ablation cell was used with both the
193ExLA and 200/266FsLA systems. The purpose of this was to test the difference in grain size
distribution caused by the different laser systems or different matrices, and to examine the effect of
grain size distribution on the ionization at the ICP.
References
1. J.-I. Kimura, Q. Chang and K. Tani, Geochemical Journal, 2011, 45, 283-296. 2. M. Humayun, F. A. Davis and M. M. Hirschmann, Journal of Analytical Atomic
Spectrometry, 2010, 25, 998-1005. 3. C. Latkoczy and S. Günther, Journal of Analytical Atomic Spectrometry, 2002, 17,
1264-1270. 4. C. Bouman, M. Deerberg, J. B. Schwieters and T. F. Scientific, Application Note of
Thermo Fischer Scientific, 2008, 30187, 1-4. 5. J.-I. Kimura, K. Tani and Q. Chang, Geochemical Journal, in press. 6. M. Gaboardi and M. Humayun, Journal of Analytical Atomic Spectrometry, 2009, 24,
1188-1197. 7. A. J. R. Kent and C. A. Ungerer, Journal of Analytical Atomic Spectrometry, 2005, 20,
1256-1262. 8. S. Gao, X. Liu, H. Yuan, B. Hattendorf, D. Günther, L. Chen and S. Hu, Geostandards
Newsletter, 2007, 26, 181-196. 9. Z. Wang, B. Hattendorf and D. Gunther, Journal of Analytical Atomic Spectrometry,
2006, 21, 1143–1151. 10. Y. Liu, Z. Hu, S. Gao, D. Günther, J. Xu, C. Gao and C. Chen, Chemical Geology, 2008,
257, 34-43.
Electronic Supplementary Material (ESI) for Journal of Analytical Atomic SpectrometryThis journal is © The Royal Society of Chemistry 2012
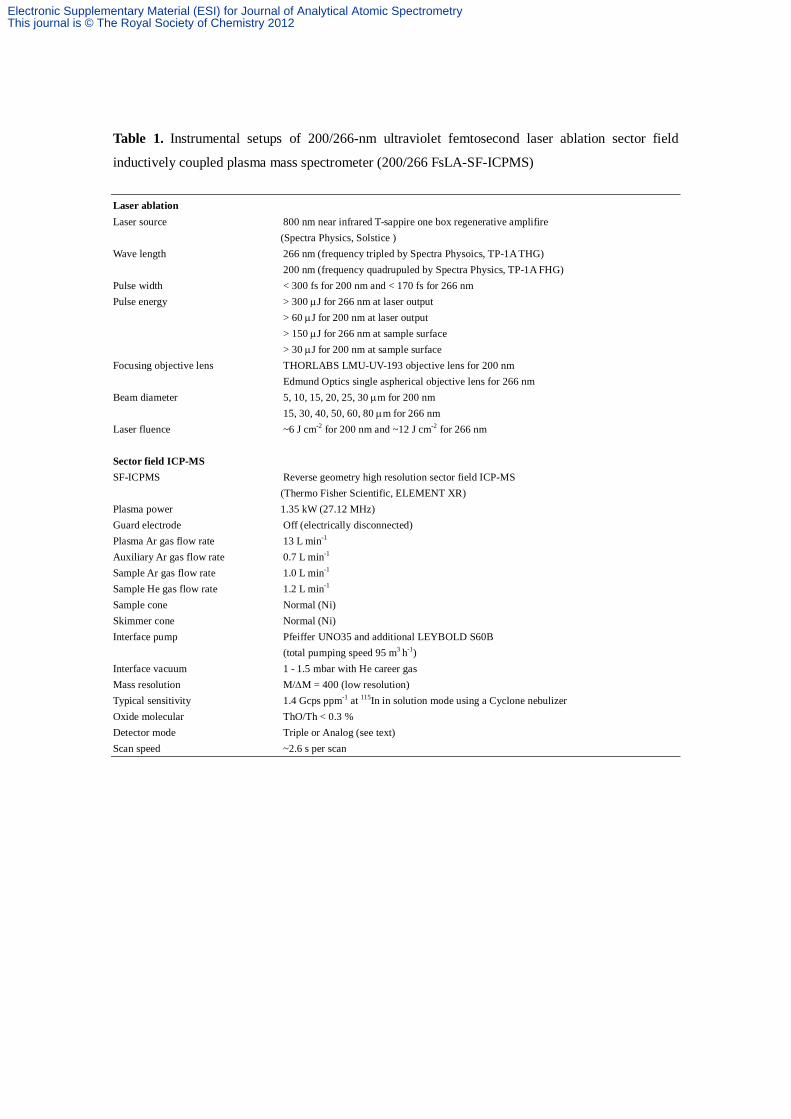
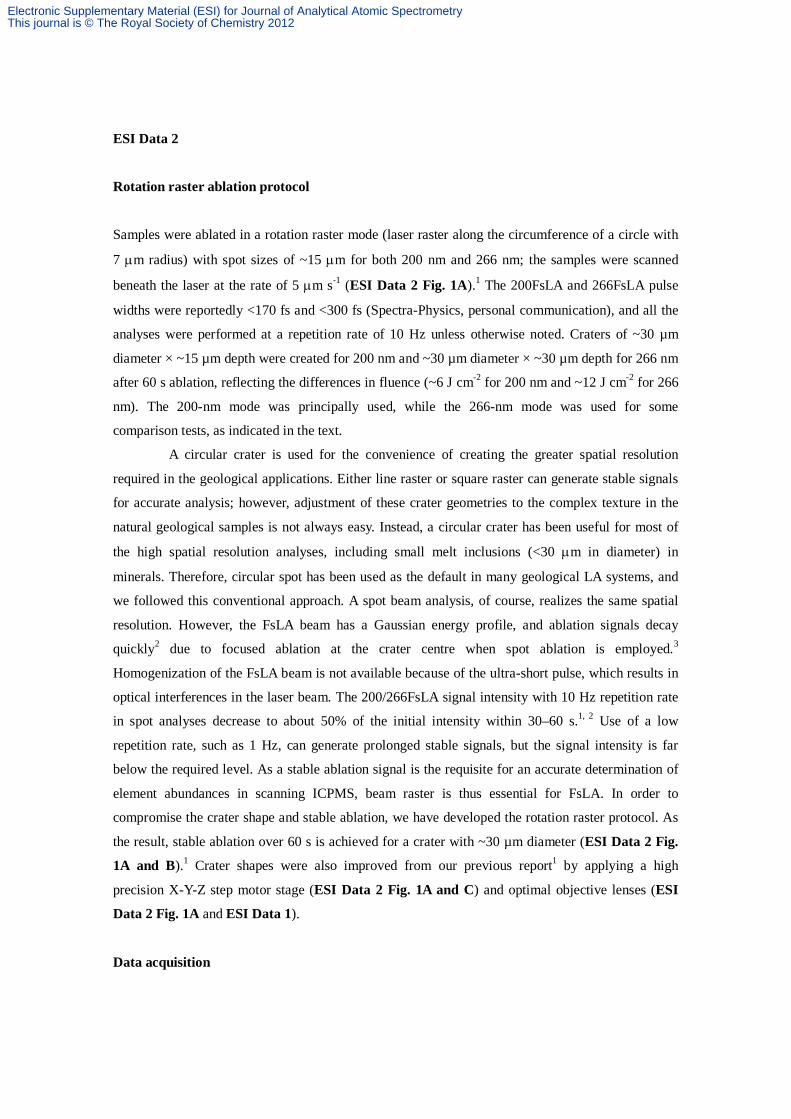
Table 1. Instrumental setups of 200/266-nm ultraviolet femtosecond laser ablation sector field
inductively coupled plasma mass spectrometer (200/266 FsLA-SF-ICPMS)
Laser ablation Laser source 800 nm near infrared T-sappire one box regenerative amplifire (Spectra Physics, Solstice ) Wave length 266 nm (frequency tripled by Spectra Physoics, TP-1A THG)
200 nm (frequency quadrupuled by Spectra Physics, TP-1A FHG) Pulse width < 300 fs for 200 nm and < 170 fs for 266 nm Pulse energy > 300 µJ for 266 nm at laser output > 60 µJ for 200 nm at laser output > 150 µJ for 266 nm at sample surface > 30 µJ for 200 nm at sample surface Focusing objective lens THORLABS LMU-UV-193 objective lens for 200 nm Edmund Optics single aspherical objective lens for 266 nm Beam diameter 5, 10, 15, 20, 25, 30 µm for 200 nm 15, 30, 40, 50, 60, 80 µm for 266 nm Laser fluence ~6 J cm-2 for 200 nm and ~12 J cm-2 for 266 nm Sector field ICP-MS SF-ICPMS Reverse geometry high resolution sector field ICP-MS (Thermo Fisher Scientific, ELEMENT XR) Plasma power 1.35 kW (27.12 MHz) Guard electrode Off (electrically disconnected) Plasma Ar gas flow rate 13 L min-1 Auxiliary Ar gas flow rate 0.7 L min-1 Sample Ar gas flow rate 1.0 L min-1 Sample He gas flow rate 1.2 L min-1
Sample cone Normal (Ni) Skimmer cone Normal (Ni) Interface pump Pfeiffer UNO35 and additional LEYBOLD S60B (total pumping speed 95 m3 h-1) Interface vacuum 1 - 1.5 mbar with He career gas Mass resolution M/∆M = 400 (low resolution) Typical sensitivity 1.4 Gcps ppm-1 at 115In in solution mode using a Cyclone nebulizer Oxide molecular ThO/Th < 0.3 % Detector mode Triple or Analog (see text) Scan speed ~2.6 s per scan
Electronic Supplementary Material (ESI) for Journal of Analytical Atomic SpectrometryThis journal is © The Royal Society of Chemistry 2012

Plasma gas
Career gas(Ar = 1 L min-1 + He = 1 L min-1)
Guard Electrode(switch off)
UNO35(35 m3 h-1)
Turbo molecular pump
S60B rotoay pump(60 m3 h-1)
Ni skimmer cone (N-cone)
Ape
rture
s
X-Y-Z stage
Co-
axia
l bea
m li
ne
Flip-in mirrors
Shutter
Extractionlens
Ni sampling cone (N-cone)
Interface vacuum 1-1.5 mbarLoad coil
ICP-torch
Cool gas
B. Modefied high sensitivity interface of SF-ICPMS
A. 200/266 nm UV femtsecond laser ablation system
266 nm - observation - 200 nm objective lenses
Mirrors
Focusing optics
Solstice Ti:Sapphire Regenerative Amplifire
800 nm1-1000Hz
3.5 mJ/pulse
TP-1ATHG
2ω-3ω
TP-1AFHG4ω
Fig. 1 Schematic pictures of (A) a 200/266-nm
femtosecond laser ablation (200/266FsLA) system and
(B) a modified interface sector-field inductively coupled
plasma mass spectrometer (SF-ICPMS).
Electronic Supplementary Material (ESI) for Journal of Analytical Atomic SpectrometryThis journal is © The Royal Society of Chemistry 2012
ESI Data 2
Rotation raster ablation protocol
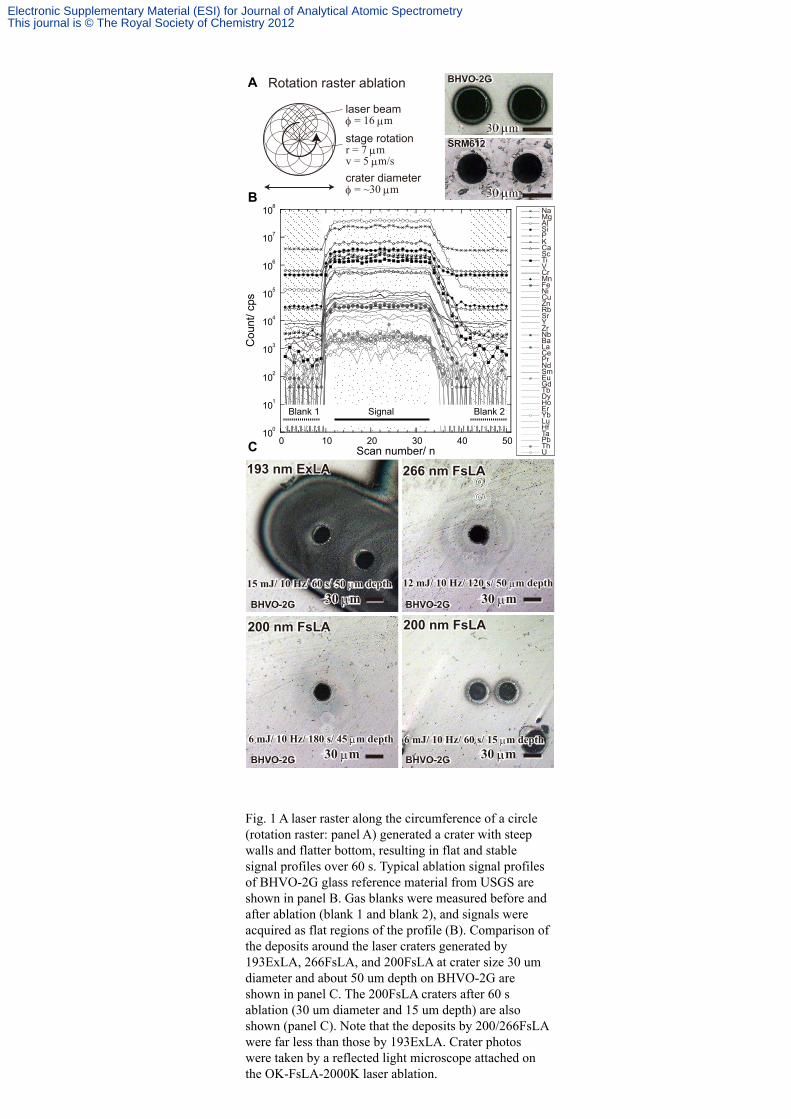
Samples were ablated in a rotation raster mode (laser raster along the circumference of a circle with
7 µm radius) with spot sizes of ~15 µm for both 200 nm and 266 nm; the samples were scanned
beneath the laser at the rate of 5 µm s-1 (ESI Data 2 Fig. 1A).1 The 200FsLA and 266FsLA pulse
widths were reportedly <170 fs and <300 fs (Spectra-Physics, personal communication), and all the
analyses were performed at a repetition rate of 10 Hz unless otherwise noted. Craters of ~30 µm
diameter × ~15 µm depth were created for 200 nm and ~30 µm diameter × ~30 µm depth for 266 nm
after 60 s ablation, reflecting the differences in fluence (~6 J cm-2 for 200 nm and ~12 J cm-2 for 266
nm). The 200-nm mode was principally used, while the 266-nm mode was used for some
comparison tests, as indicated in the text.
A circular crater is used for the convenience of creating the greater spatial resolution
required in the geological applications. Either line raster or square raster can generate stable signals
for accurate analysis; however, adjustment of these crater geometries to the complex texture in the
natural geological samples is not always easy. Instead, a circular crater has been useful for most of
the high spatial resolution analyses, including small melt inclusions (<30 µm in diameter) in
minerals. Therefore, circular spot has been used as the default in many geological LA systems, and
we followed this conventional approach. A spot beam analysis, of course, realizes the same spatial
resolution. However, the FsLA beam has a Gaussian energy profile, and ablation signals decay
quickly2 due to focused ablation at the crater centre when spot ablation is employed.3
Homogenization of the FsLA beam is not available because of the ultra-short pulse, which results in
optical interferences in the laser beam. The 200/266FsLA signal intensity with 10 Hz repetition rate
in spot analyses decrease to about 50% of the initial intensity within 30–60 s.1, 2 Use of a low
repetition rate, such as 1 Hz, can generate prolonged stable signals, but the signal intensity is far
below the required level. As a stable ablation signal is the requisite for an accurate determination of
element abundances in scanning ICPMS, beam raster is thus essential for FsLA. In order to
compromise the crater shape and stable ablation, we have developed the rotation raster protocol. As
the result, stable ablation over 60 s is achieved for a crater with ~30 µm diameter (ESI Data 2 Fig.
1A and B).1 Crater shapes were also improved from our previous report1 by applying a high
precision X-Y-Z step motor stage (ESI Data 2 Fig. 1A and C) and optimal objective lenses (ESI
Data 2 Fig. 1A and ESI Data 1).
Data acquisition
Electronic Supplementary Material (ESI) for Journal of Analytical Atomic SpectrometryThis journal is © The Royal Society of Chemistry 2012

With SF-ICPMS, all the signals were acquired in the low-resolution mode (M/ΔM = 400) by
peak-jumping between peak-tops with a mass window of 5% and an acquisition time of 50 ms per
peak. The mass peaks used for each element are given in ESI Data 2 Table 1. The multi-isotope
elements were monitored using isotopes that are favourable to ascertain lesser molecular isobaric
interference.4, 5 Isobaric interferences from the sample (48Ca, 58Fe) affect 48Ti and 58Ni, and minor
isotopes were used to monitor interferences for these elements. Note that strong doubly charged ion
interferences (e.g. 47Ti+ by 94Zr++, 45Sc+ by 90Zr++) could not be resolved and were substantial for
certain minerals (e.g. zircon). These peaks were either not selected (47Ti+ by 94Zr++) or the data were
discarded (45Sc+ by 90Zr++). The amount of isobaric interferences from the plasma gas was acquired
as a gas blank. All the peaks were acquired by repeatedly sweeping the mass spectrometer in
combining six magnet jumps and EScan peak-jumping mode; a single scan from 23Na to 238U took
~2.6 s. Faster scans with shorter settle time and peak acquisition time were available,6 but those
results showed deterioration in the standard deviation of the acquired values. Therefore, the faster
scan, which can be used for transient signals such as analysis on fluid inclusions, was not used in this
study and is not discussed further.
All the analyses were conducted in the time resolved analysis mode with a time of ~135 s
for one spot (Fig. 1B). The laser was switched off for the first 20 s after the data acquisition began
and was continuously pulsed for the subsequent 60 s. Finally, during the remaining 70 s, the washout
sequence of the laser aerosol was measured until the signals returned to the gas blank levels; this
normally took 20–30 s after the laser was switched off. Gas blanks were measured before and after
the laser signal acquisition during the first and last 20 s, respectively, of the 150 s acquisition.
Sample signals were measured in the flat-signal region during 60 s ablation (ESI Data 2 Fig. 1B).
The background intensities were calculated from the average of the two backgrounds and were
subtracted from the peak intensities.
Data processing
The net peak intensities were converted to oxide in wt.% following the method described by Liu et
al. (2008).7 As a result, the sum of the concentration of the oxides was 100.00 wt.%, including for
cases in which some elements other than normal silicate minerals were the major constituents of the
sample (e.g. ZrO2 and HfO2 in the case of zircon crystals). This normalization was applicable when
the total sum of the 44 analyzed elements were close to 100 wt.%. Involvement of large amounts of
halogens (e.g. F and Cl), sulfur (S), and H2O increased the analytical errors of this method. However,
most anhydrous silicate minerals and glasses contain these unanalyzed elements at less than 1 wt.%
and thus can be analyzed by this method.7
Errors were also propagated from the elements with plural oxidation states (e.g. FeO and
Electronic Supplementary Material (ESI) for Journal of Analytical Atomic SpectrometryThis journal is © The Royal Society of Chemistry 2012

Fe2O3); however, resultant errors from the most significant uncertainty in ferric-ferrous iron ratios
were less than 10% of the total FeO wt.% (total Fe reported as FeO wt.%), which means that the
propagated errors from this uncertainty were less than 1.5% in most cases. The errors are smaller
than the typical analytical errors in LA-ICPMS.7 For convenience, the total sum of the major oxides
were presented in this paper as a 100 wt.% basis, with total Fe and Mn reported as FeO and MnO
after re-calculations. The total sum of the trace element oxide wt.% were also reported and were
always <0.8 wt.% in the silicate glasses and minerals examined in this study. Trace element
concentrations were then presented as ppm (see Tables in ESI Data 4).
The total sum correction method used was proposed by Guillong et al. (2005),8 and
followed by Liu et al. (2008).7 We examined only one single standard,8 as opposed to using multiple
standards with various element concentration levels, as was done by Liu et al. (2008) and Gaboardi
and Humayun (2009).4, 7 By using a single standard, the analytical time for the standard and the
unknowns was reduced. Even so, in order to minimize the time-dependent drifts,6, 7 the calibration
standard was analyzed between each of five unknown spots. Elemental response factors analyzed by
the standards before and after the five unknowns were linearly interpolated to calibrate the
concentrations of the unknown samples. All of these designs of the analytical protocol were for the
purpose of creating an analysis of a wide range of anhydrous silicate minerals and glasses with a
simpler calibration method. With this calibration method, the elemental sensitivities (cps ppm-1)
were determined using BHVO-2G as the standard, which was, thus far, found to be ideal (see text).
References
1. J.-I. Kimura, Q. Chang and K. Tani, Geochemical Journal, 2011, 45, 283-296. 2. J. Koch, M. Wälle, J. Pisonero and D. Günther, Journal of Analytical Atomic
Spectrometry, 2006, 21, 932-940. 3. R. Freydier, F. Candaudap, F. Poitrasson, A. Arbouet, B. Chatelb and B. Dupré, Journal
of Analytical Atomic Spectrometry, 2008, 23, 702-710. 4. M. Gaboardi and M. Humayun, Journal of Analytical Atomic Spectrometry, 2009, 24,
1188-1197. 5. M. Humayun, F. A. Davis and M. M. Hirschmann, Journal of Analytical Atomic
Spectrometry, 2010, 25, 998-1005. 6. C. Latkoczy and S. Günther, Journal of Analytical Atomic Spectrometry, 2002, 17,
1264-1270. 7. Y. Liu, Z. Hu, S. Gao, D. Günther, J. Xu, C. Gao and C. Chen, Chemical Geology, 2008,
257, 34-43. 8. M. Guillong, K. Hametner, E. Reusser, S. A. Wilson and D. Günther, Geostandards and
Geoanalytical Research, 2005, 29, 315-331.
Electronic Supplementary Material (ESI) for Journal of Analytical Atomic SpectrometryThis journal is © The Royal Society of Chemistry 2012
100
101
102
103
104
105
106
107
108
0 10 20 30 40 50
NaMgAlSiPKCaScTiVCrMnFeNiCuZnRbSrYZr
Cou
nt/ c
ps
Scan number/ n
NbBaLaCePrNdSmEuGdTbDyHoErYbLuHfTaPbThU
Blank 1 Signal Blank 2
SRM612
30 µm
30 µmSRM612
BHVO-2GBHVO-2G
30 µm
30 µm
Rotation raster ablation
laser beamφ = 16 µmstage rotationr = 7 µmv = 5 µm/scrater diameter φ = ~30 µm
6 mJ/ 10 Hz/ 60 s/ 15 µm depth
200 nm FsLA
30 µm
193 nm ExLA
15 mJ/ 10 Hz/ 60 s/ 50 µm depth30 µm
266 nm FsLA
12 mJ/ 10 Hz/ 120 s/ 50 µm depth
6 mJ/ 10 Hz/ 180 s/ 45 µm depth
200 nm FsLA
30 µm 30 µm6 mJ/ 10 Hz/ 60 s/ 15 µm depth
200 nm FsLA
30 µm
193 nm ExLA
15 mJ/ 10 Hz/ 60 s/ 50 µm depth30 µm
266 nm FsLA
12 mJ/ 10 Hz/ 120 s/ 50 µm depth
6 mJ/ 10 Hz/ 180 s/ 45 µm depth
200 nm FsLA
30 µm 30 µm
A
B
C
BHVO-2GBHVO-2G BHVO-2GBHVO-2G
BHVO-2GBHVO-2G BHVO-2GBHVO-2G
Fig. 1 A laser raster along the circumference of a circle (rotation raster: panel A) generated a crater with steep walls and flatter bottom, resulting in flat and stable signal profiles over 60 s. Typical ablation signal profiles of BHVO-2G glass reference material from USGS are shown in panel B. Gas blanks were measured before and after ablation (blank 1 and blank 2), and signals were acquired as flat regions of the profile (B). Comparison of the deposits around the laser craters generated by 193ExLA, 266FsLA, and 200FsLA at crater size 30 um diameter and about 50 um depth on BHVO-2G are shown in panel C. The 200FsLA craters after 60 s ablation (30 um diameter and 15 um depth) are also shown (panel C). Note that the deposits by 200/266FsLA were far less than those by 193ExLA. Crater photos were taken by a reflected light microscope attached on the OK-FsLA-2000K laser ablation.
Electronic Supplementary Material (ESI) for Journal of Analytical Atomic SpectrometryThis journal is © The Royal Society of Chemistry 2012
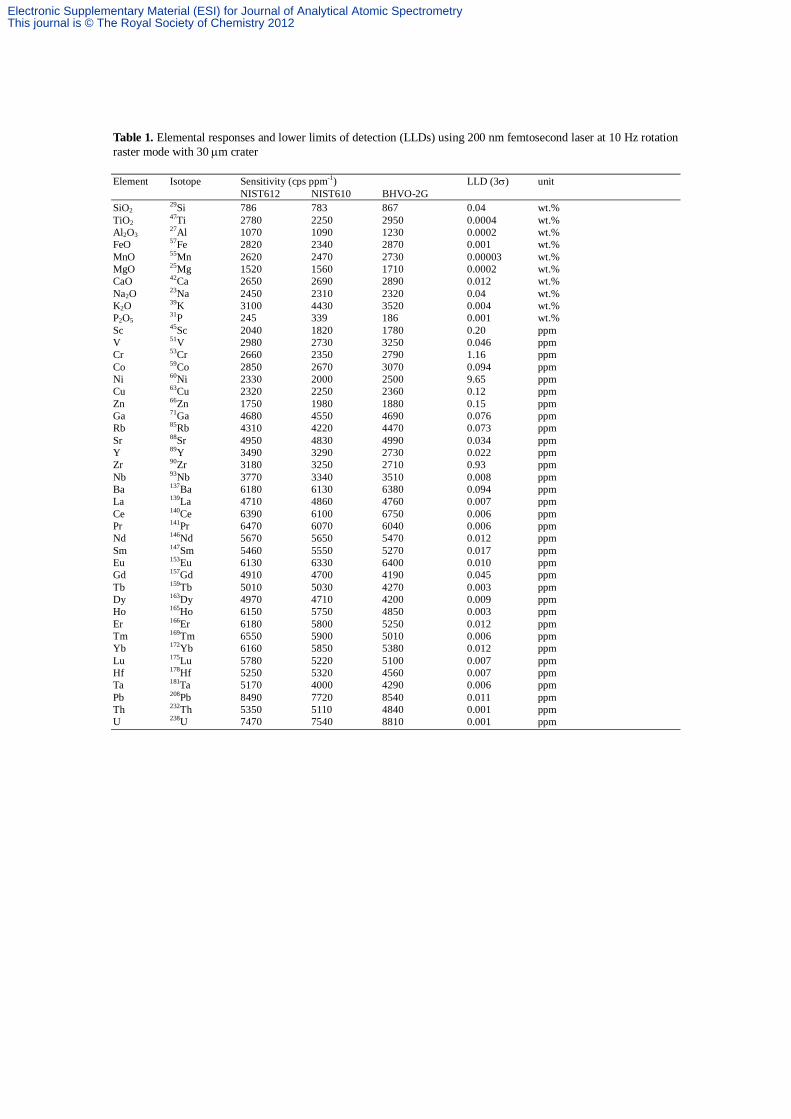
Table 1. Elemental responses and lower limits of detection (LLDs) using 200 nm femtosecond laser at 10 Hz rotation raster mode with 30 µm crater Element Isotope Sensitivity (cps ppm-1) LLD (3σ) unit NIST612 NIST610 BHVO-2G SiO2 29Si 786 783 867 0.04 wt.% TiO2 47Ti 2780 2250 2950 0.0004 wt.% Al2O3 27Al 1070 1090 1230 0.0002 wt.% FeO 57Fe 2820 2340 2870 0.001 wt.% MnO 55Mn 2620 2470 2730 0.00003 wt.% MgO 25Mg 1520 1560 1710 0.0002 wt.% CaO 42Ca 2650 2690 2890 0.012 wt.% Na2O 23Na 2450 2310 2320 0.04 wt.% K2O 39K 3100 4430 3520 0.004 wt.% P2O5 31P 245 339 186 0.001 wt.% Sc 45Sc 2040 1820 1780 0.20 ppm V 51V 2980 2730 3250 0.046 ppm Cr 53Cr 2660 2350 2790 1.16 ppm Co 59Co 2850 2670 3070 0.094 ppm Ni 60Ni 2330 2000 2500 9.65 ppm Cu 63Cu 2320 2250 2360 0.12 ppm Zn 66Zn 1750 1980 1880 0.15 ppm Ga 71Ga 4680 4550 4690 0.076 ppm Rb 85Rb 4310 4220 4470 0.073 ppm Sr 88Sr 4950 4830 4990 0.034 ppm Y 89Y 3490 3290 2730 0.022 ppm Zr 90Zr 3180 3250 2710 0.93 ppm Nb 93Nb 3770 3340 3510 0.008 ppm Ba 137Ba 6180 6130 6380 0.094 ppm La 139La 4710 4860 4760 0.007 ppm Ce 140Ce 6390 6100 6750 0.006 ppm Pr 141Pr 6470 6070 6040 0.006 ppm Nd 146Nd 5670 5650 5470 0.012 ppm Sm 147Sm 5460 5550 5270 0.017 ppm Eu 153Eu 6130 6330 6400 0.010 ppm Gd 157Gd 4910 4700 4190 0.045 ppm Tb 159Tb 5010 5030 4270 0.003 ppm Dy 163Dy 4970 4710 4200 0.009 ppm Ho 165Ho 6150 5750 4850 0.003 ppm Er 166Er 6180 5800 5250 0.012 ppm Tm 169Tm 6550 5900 5010 0.006 ppm Yb 172Yb 6160 5850 5380 0.012 ppm Lu 175Lu 5780 5220 5100 0.007 ppm Hf 178Hf 5250 5320 4560 0.007 ppm Ta 181Ta 5170 4000 4290 0.006 ppm Pb 208Pb 8490 7720 8540 0.011 ppm Th 232Th 5350 5110 4840 0.001 ppm U 238U 7470 7540 8810 0.001 ppm
Electronic Supplementary Material (ESI) for Journal of Analytical Atomic SpectrometryThis journal is © The Royal Society of Chemistry 2012
ESI Data 3
Performance of 200/266FsLA-SF-ICPMS: Sensitivity
We describe herein the basic analytical performance of the 200/266FsLA-SF-ICPMS. First, ESI
Data 3 Fig. 1A shows the element sensitivity of the system analyzed at 30 µm crater diameters with
rotation raster and 10 Hz repetition rate using both 200-nm and 266-nm wavelengths. Resultant
crater depths after 60 s ablation were different between the two modes (~15 µm by 200 nm and ~30
µm by 266 nm) because of the difference in the laser fluence (~6 J cm-2 and ~12 J cm-2, respectively).
Elemental sensitivity therefore differed and was about 2.3 times higher in 266 nm than in 200 nm,
reflecting the sampling volume. The apparent elemental sensitivity of 266FsLA was almost identical
to that by 193ExLA (ESI Data 3 Fig. 1A). However, the depth of the 193FsLA craters after 60 s was
~50 µm; therefore, elemental sensitivity of the 266FsLA is 1.7 to 2.5 times better than in 193ExLA.
Due to the lower fluence, the 200FsLA showed about half of the elemental sensitivity (ESI Data 3
Fig. 1A). Considering the smaller sampling volume, the elemental sensitivity of the 266FsLA and
200FsLA were almost identical (ESI Data 3 Fig. 1A). These levels of sensitivity, however, are still
good enough for most of the analyses. The shallower crater penetration (15 µm) into the sample by
200FsLA is preferred for a better spatial resolution.
The enhancement factor by 266FsLA was not as great as in the previous report (8 times),
which compared a 266Nd-YAGLA and a 266FsLA, due to the use of a more efficient 193ExLA in
this study.1 The elemental sensitivity was almost comparable to or slightly better than that reported
by Latkoczy and Günther (2002) using 193ExLA-SF-ICPMS.2 Modified SF-ICPMS in this study
was almost identical to their facility, apart from the use of normal-Ni sample and skimmer cones,
whereas they used Al cones. Latkoczy and Günther (2002) operated a 193ExLA at 10 Hz at 30 µm
crater diameter with fluence 15 J cm-2, which is comparable to our 193ExLA. Although it is hard to
compare exactly the sampling volume, as the depth of the laser crater was not reported by Latkoczy
and Günther (2002), the overall sensitivity of our 193ExLA-SF-ICPMS is identical to their
193ExLA-SF-ICPMS (ESI Data 3 Fig. 1A).
Performance of 200/266FsLA-SF-ICPMS: Lower limit of detection
The second basic test was lower limit of detection (LLD). The LLDs were obtained by analyzing
standard and gas blank intensities. LLDs were calculated by 3 σ deviations of the elemental
concentrations measured from the gas blank intensities (ESI Data 3 Fig. 1B). As shown, LLDs by
266FsLA were better than those reported by Latkoczy and Günther (2002). Nearly the same is true
even with our 200FsLA, although elemental sensitivity was twice as low as in 266FsLA (ESI Data 3
Electronic Supplementary Material (ESI) for Journal of Analytical Atomic SpectrometryThis journal is © The Royal Society of Chemistry 2012

Fig. 1B). This is because of the lower backgrounds obtained by our system, because the elemental
sensitivity was almost identical. The only difference which may have affected backgrounds between
the two systems was the cone material or impurities in the gases used. It is difficult to do immediate
comparisons; however, LLDs of our system are obviously better apart from Na (ESI Data 3 Fig. 1B).
Comparison is also available to the Liu et al. (2008)’s 193ExLA-Q-ICPMS system.3 The LLDs are
almost an order to two orders of magnitude lower, particularly for heavier elements, due to the
difference in elemental sensitivities (ESI Data 3 Fig. 1B).
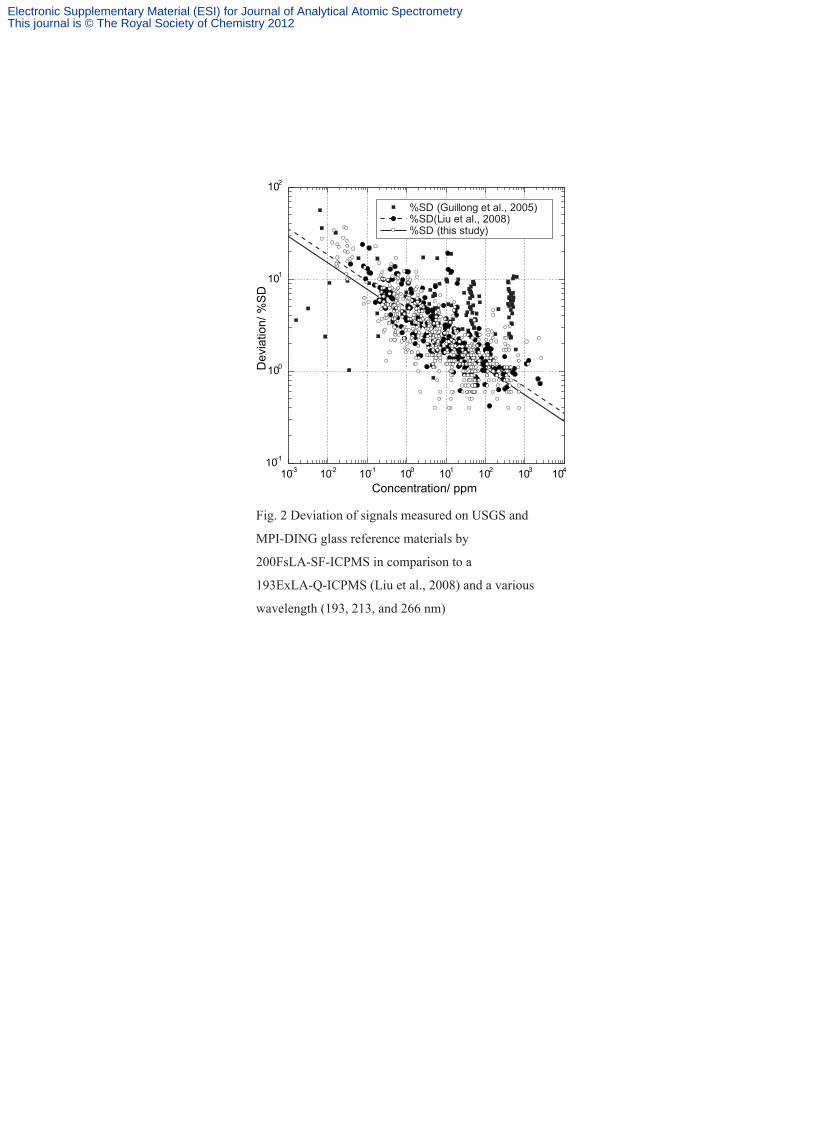
Performance of 200/266FsLA-SF-ICPMS: Precision
The third test was the analytical precision represented by the standard deviation of analyzed data.
ESI Data 3 Fig. 2 shows percent standard deviations (% SD) plotted against element concentrations
analyzed on the glass reference materials by our 200FsLA-SF-ICPMS, by a 193ExLA-Q-ICPMS by
Liu et al. (2008),3 and by a various wavelength (193, 213, and 266 nm) optical parametric oscillator
(OPO)-Nd-YAGLA-Q-ICPMS by Guillong et al. (2005).4 The results indicated that analytical
precision was almost identical to those reported by Liu et al. (2008).3 In the concentration range
between 0.1 ppm to 3000 ppm, the % RDs ranged from <10% to <1%. In the concentration range
between 0.008 ppm to 0.1 ppm, the precisions became 10–30% RD. The % RDs by Guillong et al.
(2005) showed wide variation, mostly <10% RD, irrespective of the concentration levels. Our results
were thus almost identical to those reported by Liu et al. (2008). Although the sensitivity and LLDs
of our system were better than those by Liu et al. (2008) (ESI Data 3 Fig. 1B), the similar % RDs
are from the shorter net acquisition time for an isotope by SF-ICPMS. Notwithstanding improvement
of the scan speed in SF-ICPMS,2 Q-ICPMS provides faster peak jumping with shorter settle time,
resulting in longer acquisition time for an isotope during data acquisition. Even so, the performance
shown by our 200FsLA-SF-ICPMS is promising, providing the similar counting statistics with those
by a high-quality 193ExLA-Q-ICPMS with extended element concentration down to 0.008 ppm.
Overall, our 200/266FsLA-SF-ICPMS showed the best sensitivity by far as compared to
that reported by 193ExLA-SF-ICPMS, and the analytical precisions comparable to high-quality
193ExLA-Q-ICPMS data. Moreover, our ion sampling interface gave the lowest LLDs as compared
to the previous reports. With these performances of the 200FsLA-SF-ICPMS, we, in this study,
investigated the matrix effect induced at the laser ablation site and in the ICP ion source.
Reference
1. J. J. Gonzalez, C. Liu, S.-B. Wen, X. Mao and R. E. Russo, Talanta, 2007, 73, 577-582,
doi:510.1016/j.talanta.2007.1004.1028. 2. C. Latkoczy and S. Günther, Journal of Analytical Atomic Spectrometry, 2002, 17,
Electronic Supplementary Material (ESI) for Journal of Analytical Atomic SpectrometryThis journal is © The Royal Society of Chemistry 2012

1264-1270. 3. Y. Liu, Z. Hu, S. Gao, D. Günther, J. Xu, C. Gao and C. Chen, Chemical Geology, 2008,
257, 34-43. 4. M. Guillong, K. Hametner, E. Reusser, S. A. Wilson and D. Günther, Geostandards and
Geoanalytical Research, 2005, 29, 315-331.
Electronic Supplementary Material (ESI) for Journal of Analytical Atomic SpectrometryThis journal is © The Royal Society of Chemistry 2012

10-4
10-3
10-2
10-1
100
101
102
103
Na
Mg Al Si P K Ca Sc Ti V Cr
Mn Fe Co Ni
Cu Zn Ga
Rb Sr Y Zr Nb Ba La Ce Pr Nd
Sm Eu Gd Tb Dy
Ho Er Tm Yb Lu Hf
Ta Pb Th U
Det
ectio
n lim
its /
ppm
101
102
103
104
105
Na
Mg Al Si P K Ca Sc Ti V Cr
Mn Fe Co Ni
Cu Zn Ga
Rb Sr Y Zr Nb Ba La Ce Pr Nd
Sm Eu Gd Tb Dy
Ho Er Tm Yb Lu Hf
Ta Pb Th U
Sen
sitiv
ity/c
ount
s s-1
ppm
-1
200nm FsLA (this study)266nm FsLA (this study)Latkoczy and Günther (2002)Liu et al. (2008)
200nm FsLA (this study)266nm FsLA (this study)
Latkoczy and Günther (2002)193nm ExLA (this study)
A
B
Fig. 1 Elemental responses (panel A) and lower limits of detection (3 σ notation: panel B) of our
200/266Fs-SF-LA-ICPMS and 193Ex-SF-LA-ICPMS in this study, as compared to results from a
193Ex-SF-ICPMS (Latkoczy and Günther, 2002) and a 193ExLA-Q-ICPMS (Liu et al., 2008).
Electronic Supplementary Material (ESI) for Journal of Analytical Atomic SpectrometryThis journal is © The Royal Society of Chemistry 2012
10-1
100
101
102
10-3 10-2 10-1 100 101 102 103 104
Dev
iatio
n/ %
SD
Concentration/ ppm
%SD (Guillong et al., 2005)%SD(Liu et al., 2008)%SD (this study)
Fig. 2 Deviation of signals measured on USGS and
MPI-DING glass reference materials by
200FsLA-SF-ICPMS in comparison to a
193ExLA-Q-ICPMS (Liu et al., 2008) and a various
wavelength (193, 213, and 266 nm)
Electronic Supplementary Material (ESI) for Journal of Analytical Atomic SpectrometryThis journal is © The Royal Society of Chemistry 2012

ESI Data 4 Table 1. USGS glass standards analyzed by BHVO-2G and NIST SRM612 as standards under various laser beam conditions Sample BCR-2G BCR-2G BCR-2G BCR-2G BCR-2G BCR-2G BCR-2G Standard BHVO-2G BHVO-2G BHVO-2G BHVO-2G NIST612 NIST612 FsLA 200 nm 200 nm 266 nm 266 nm 200 nm 266 nm Repetition rate 5 Hz 10 Hz 5 Hz 10 Hz 10 Hz 10 Hz Crater diameter 30 µm 30 µm 35 µm 35 µm 30 µm 35 µm Element Ref. AVG SD% RD% AVG SD% RD% AVG SD% RD% AVG SD% RD% AVG SD% RD% AVG SD% RD% SiO2 55.16 54.10 0.7 -1.9 53.64 0.5 -2.8 55.48 0.7 0.6 54.12 0.6 -1.9 54.43 0.7 -1.3 54.77 0.5 -0.7 TiO2 2.30 2.36 0.9 2.7 2.40 0.9 4.5 2.30 1.4 0.1 2.36 1.3 2.3 2.54 1.2 10.5 2.61 1.0 13.3 Al2O3 13.59 14.61 1.4 7.5 14.33 0.8 5.5 13.86 1.3 2.0 14.20 0.8 4.5 14.36 0.8 5.7 15.07 0.8 10.9 FeO 12.57 12.46 0.9 -0.9 12.78 1.2 1.7 12.15 2.2 -3.4 12.92 1.6 2.7 12.97 1.4 3.1 11.53 1.3 -8.3 MnO 0.19 0.20 1.4 2.2 0.20 1.0 4.0 0.19 2.2 -1.7 0.20 1.2 2.8 0.21 1.5 7.0 0.21 1.3 8.1 MgO 3.61 3.54 1.3 -2.0 3.58 0.4 -0.9 3.39 1.4 -6.2 3.51 1.1 -2.8 3.94 0.6 9.3 4.07 0.5 12.6 CaO 7.16 7.33 0.8 2.4 7.45 0.5 4.1 7.02 0.8 -1.9 7.08 1.3 -1.1 7.24 0.8 1.2 7.42 0.4 3.7 Na2O 3.28 3.32 0.8 1.5 3.48 0.9 6.2 3.57 2.1 8.9 3.44 1.8 5.1 2.96 1.1 -9.6 3.10 1.8 -5.4 K2O 1.76 1.70 0.5 -3.4 1.74 0.7 -1.4 1.67 3.2 -5.2 1.78 0.9 1.0 1.12 0.8 -36.7 1.00 1.0 -43.1 P2O5 0.38 0.38 1.7 2.2 0.39 0.7 4.3 0.38 1.3 0.6 0.39 1.4 3.7 0.22 0.3 -41.0 0.22 2.4 -40.7 Total 100.00 100.00 0.0 100.00 0.0 100.00 0.0 100.00 0.0 100.00 0.0 100.00 0.0 ΣTrOx. 0.284 0.282 0.284 0.279 0.280 0.283 0.287 C.F. 0.87 1.1 0.95 0.8 0.90 1.2 0.94 0.4 0.86 1.1 1.04 0.2 Sc 33 37.4 0.8 13.4 37.0 0.6 12.1 34.4 1.9 4.4 35.7 1.5 8.2 34.5 0.6 1.4 34.3 0.9 3.8 V 425 402 1.7 -5.4 412 1.1 -3.1 413 3.1 -2.9 405 0.6 -4.7 444 0.6 4.6 445 0.8 4.8 Cr 17.0 15.8 5.7 -6.9 15.5 3.9 -8.7 15.6 4.6 -8.3 15.0 4.0 -11.7 16.3 2.6 -4.0 14.9 5.0 -12.6 Co 38.0 34.7 1.9 -8.6 35.7 0.9 -6.1 35.5 2.5 -6.5 36.0 1.4 -5.2 38.3 1.0 0.8 39.5 1.2 3.9 Ni 13.0 8.91 32.7 -31.5 9.86 28.3 -24.1 10.6 34.7 -18.6 9.10 25.8 -30.0 12.4 15.6 -4.5 14.9 15.3 14.4 Cu 21.0 17.0 1.3 -19.1 17.3 1.6 -17.9 17.1 2.7 -18.4 16.7 1.9 -20.2 15.8 1.7 -24.8 15.3 1.5 -27.0 Zn 125.0 134 1.4 7.0 131 1.2 5.0 142 2.7 13.3 136 2.1 9.1 126 1.1 0.7 115 1.0 -8.2 Ga 23.0 - - - - - - - - - - - - - - - - - - Rb 47.0 46.2 1.4 -1.7 46.6 0.8 -0.9 46.5 2.3 -1.1 48.3 1.3 2.7 45.4 0.7 -3.4 46.0 1.0 -2.2 Sr 342 352 1.0 2.9 351 0.6 2.6 332 2.3 -2.9 339 1.7 -0.7 347 0.9 1.4 362 0.8 5.9 Y 35.0 39.8 0.9 13.6 37.7 0.8 7.7 36.5 1.3 4.4 36.4 0.9 4.0 29.6 1.0 -15.4 32.1 1.2 -8.2 Zr 184 203 0.7 10.3 197 0.5 7.2 189 1.2 2.6 193 1.2 5.0 162 1.0 -11.7 175 0.8 -5.1 Nb 12.5 13.1 1.2 4.8 13.2 0.8 5.4 12.6 3.4 0.4 12.9 1.9 3.5 12.9 0.4 3.5 13.2 0.5 5.6 Ba 683 690 0.7 1.0 701 0.4 2.7 682 1.5 -0.1 691 1.3 1.2 710 1.1 4.0 715 0.6 4.7 La 24.7 26.4 1.2 7.0 26.1 0.6 5.8 24.9 2.3 0.7 25.5 1.5 3.1 24.0 1.3 -2.8 25.7 0.7 4.2 Ce 53.3 53.4 1.0 0.2 54.3 1.4 1.9 51.3 1.9 -3.7 53.2 2.0 -0.2 52.8 0.8 -1.0 54.7 1.0 2.5 Pr 6.7 7.13 1.5 6.4 7.05 0.6 5.3 6.84 2.3 2.1 6.90 1.8 2.9 6.51 2.0 -2.8 6.87 1.0 2.5 Nd 28.9 30.5 1.6 5.7 29.4 2.5 1.5 27.8 1.5 -3.8 29.1 0.8 0.6 27.4 1.0 -5.2 29.3 0.9 1.4 Sm 6.59 6.03 3.4 -8.5 7.32 3.1 11.1 6.43 2.8 -2.4 6.70 2.2 1.6 6.22 2.0 -5.7 6.60 2.4 0.2 Eu 1.97 1.96 4.2 -0.4 1.98 3.1 0.7 2.02 4.5 2.4 2.01 1.4 1.9 1.94 5.7 -1.3 2.11 2.9 7.0 Gd 6.71 6.62 2.4 -1.4 7.15 3.9 6.5 6.64 4.5 -1.0 7.02 1.4 4.6 5.93 3.3 -11.7 6.51 1.5 -3.0 Tb 1.02 1.09 4.4 6.6 1.12 2.8 9.8 1.06 5.7 3.9 1.07 1.7 5.1 0.91 3.0 -11.2 1.00 2.8 -2.4 Dy 6.44 6.88 2.7 6.8 7.00 1.3 8.6 6.26 4.6 -2.7 6.52 3.6 1.3 5.79 2.9 -10.1 6.07 2.1 -5.7 Ho 1.27 1.41 2.4 11.0 1.35 2.3 6.5 1.25 3.7 -1.3 1.34 1.6 5.3 1.14 4.9 -9.9 1.24 2.1 -2.5 Er 3.70 4.22 3.0 14.1 3.93 3.4 6.3 3.54 1.8 -4.4 3.87 3.2 4.6 3.17 2.9 -14.3 3.40 2.4 -7.2 Tm 0.51 0.56 5.8 10.4 0.57 3.5 11.3 0.50 3.8 -1.1 0.60 5.5 16.7 0.44 5.2 -13.5 0.48 5.2 -5.9 Yb 3.39 3.80 3.5 12.0 3.76 1.5 10.8 3.54 3.5 4.4 3.22 3.7 -5.0 3.22 2.7 -4.9 3.35 2.9 -1.1 Lu 0.50 0.60 8.1 19.8 0.51 2.6 1.4 0.52 2.9 3.6 0.51 2.5 1.9 0.44 5.1 -13.3 0.49 2.2 -2.5 Hf 4.84 5.54 3.9 14.4 5.10 5.8 5.3 4.72 2.3 -2.6 4.87 3.3 0.7 4.31 2.9 -11.0 4.85 1.2 0.2 Ta 0.78 0.82 6.1 4.6 0.86 4.2 10.7 0.75 2.1 -3.8 0.81 2.9 4.0 0.72 3.9 -7.3 0.81 2.3 3.4 Pb 11.0 10.6 2.7 -3.5 10.9 1.6 -1.2 10.4 2.6 -5.1 10.8 1.2 -1.7 10.5 1.7 -4.9 9.88 2.0 -10.2 Th 5.90 6.21 3.1 5.3 6.21 1.9 5.2 6.06 2.6 2.7 6.03 0.8 2.1 5.62 1.4 -4.7 6.07 1.7 2.9 U 1.69 1.60 1.2 -5.6 1.66 2.7 -1.5 1.56 3.8 -7.7 1.56 3.4 -7.6 1.69 1.2 0.1 1.73 3.4 2.2 Reference values are from GeoReM; Rep.rate: Repetition rate; Crater dia.: Crater diameter; Ref.: Reference; AVG: Average; SD%: percent one standard deviation; RD%: percent relative deviation; C.F.: Correction factor. Total Fe reported as FeO, ΣTrOx.: total oxide wt.% of trace elements analyzed
Electronic Supplementary Material (ESI) for Journal of Analytical Atomic SpectrometryThis journal is © The Royal Society of Chemistry 2012
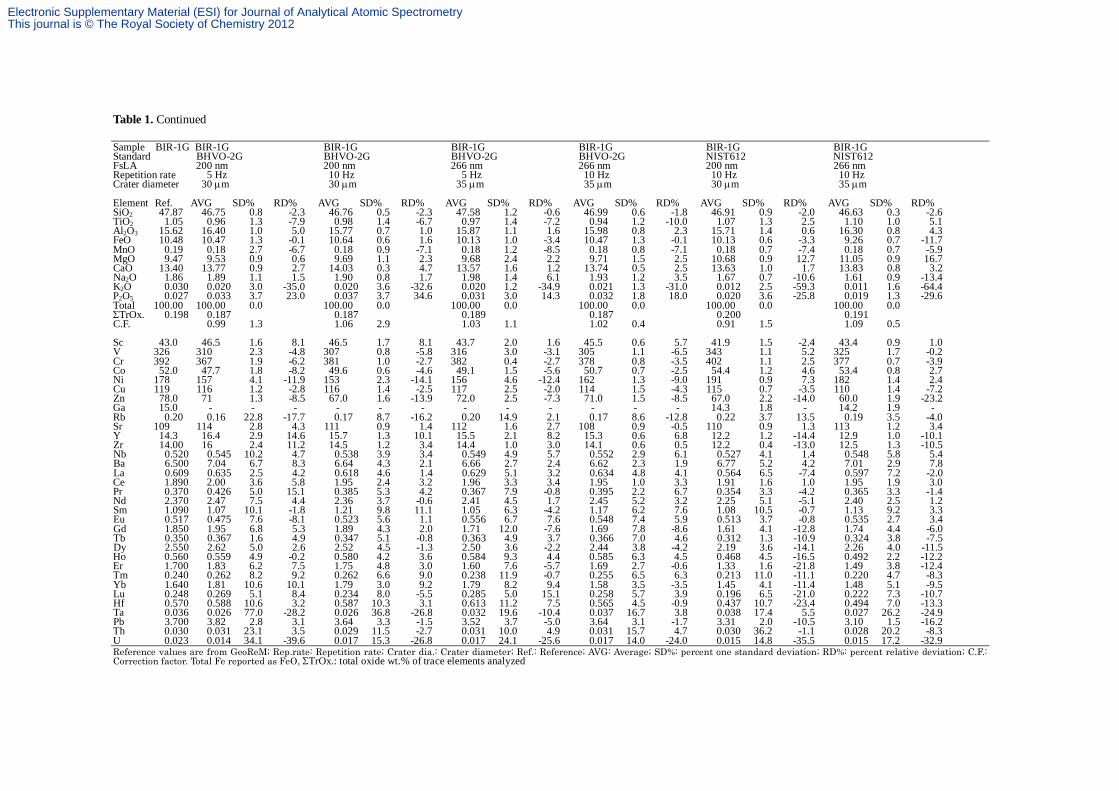
Table 1. Continued Sample BIR-1G BIR-1G BIR-1G BIR-1G BIR-1G BIR-1G BIR-1G Standard BHVO-2G BHVO-2G BHVO-2G BHVO-2G NIST612 NIST612 FsLA 200 nm 200 nm 266 nm 266 nm 200 nm 266 nm Repetition rate 5 Hz 10 Hz 5 Hz 10 Hz 10 Hz 10 Hz Crater diameter 30 µm 30 µm 35 µm 35 µm 30 µm 35 µm Element Ref. AVG SD% RD% AVG SD% RD% AVG SD% RD% AVG SD% RD% AVG SD% RD% AVG SD% RD% SiO2 47.87 46.75 0.8 -2.3 46.76 0.5 -2.3 47.58 1.2 -0.6 46.99 0.6 -1.8 46.91 0.9 -2.0 46.63 0.3 -2.6 TiO2 1.05 0.96 1.3 -7.9 0.98 1.4 -6.7 0.97 1.4 -7.2 0.94 1.2 -10.0 1.07 1.3 2.5 1.10 1.0 5.1 Al2O3 15.62 16.40 1.0 5.0 15.77 0.7 1.0 15.87 1.1 1.6 15.98 0.8 2.3 15.71 1.4 0.6 16.30 0.8 4.3 FeO 10.48 10.47 1.3 -0.1 10.64 0.6 1.6 10.13 1.0 -3.4 10.47 1.3 -0.1 10.13 0.6 -3.3 9.26 0.7 -11.7 MnO 0.19 0.18 2.7 -6.7 0.18 0.9 -7.1 0.18 1.2 -8.5 0.18 0.8 -7.1 0.18 0.7 -7.4 0.18 0.7 -5.9 MgO 9.47 9.53 0.9 0.6 9.69 1.1 2.3 9.68 2.4 2.2 9.71 1.5 2.5 10.68 0.9 12.7 11.05 0.9 16.7 CaO 13.40 13.77 0.9 2.7 14.03 0.3 4.7 13.57 1.6 1.2 13.74 0.5 2.5 13.63 1.0 1.7 13.83 0.8 3.2 Na2O 1.86 1.89 1.1 1.5 1.90 0.8 1.7 1.98 1.4 6.1 1.93 1.2 3.5 1.67 0.7 -10.6 1.61 0.9 -13.4 K2O 0.030 0.020 3.0 -35.0 0.020 3.6 -32.6 0.020 1.2 -34.9 0.021 1.3 -31.0 0.012 2.5 -59.3 0.011 1.6 -64.4 P2O5 0.027 0.033 3.7 23.0 0.037 3.7 34.6 0.031 3.0 14.3 0.032 1.8 18.0 0.020 3.6 -25.8 0.019 1.3 -29.6 Total 100.00 100.00 0.0 100.00 0.0 100.00 0.0 100.00 0.0 100.00 0.0 100.00 0.0 ΣTrOx. 0.198 0.187 0.187 0.189 0.187 0.200 0.191 C.F. 0.99 1.3 1.06 2.9 1.03 1.1 1.02 0.4 0.91 1.5 1.09 0.5 Sc 43.0 46.5 1.6 8.1 46.5 1.7 8.1 43.7 2.0 1.6 45.5 0.6 5.7 41.9 1.5 -2.4 43.4 0.9 1.0 V 326 310 2.3 -4.8 307 0.8 -5.8 316 3.0 -3.1 305 1.1 -6.5 343 1.1 5.2 325 1.7 -0.2 Cr 392 367 1.9 -6.2 381 1.0 -2.7 382 0.4 -2.7 378 0.8 -3.5 402 1.1 2.5 377 0.7 -3.9 Co 52.0 47.7 1.8 -8.2 49.6 0.6 -4.6 49.1 1.5 -5.6 50.7 0.7 -2.5 54.4 1.2 4.6 53.4 0.8 2.7 Ni 178 157 4.1 -11.9 153 2.3 -14.1 156 4.6 -12.4 162 1.3 -9.0 191 0.9 7.3 182 1.4 2.4 Cu 119 116 1.2 -2.8 116 1.4 -2.5 117 2.5 -2.0 114 1.5 -4.3 115 0.7 -3.5 110 1.4 -7.2 Zn 78.0 71 1.3 -8.5 67.0 1.6 -13.9 72.0 2.5 -7.3 71.0 1.5 -8.5 67.0 2.2 -14.0 60.0 1.9 -23.2 Ga 15.0 - - - - - - - - - - - - 14.3 1.8 - 14.2 1.9 - Rb 0.20 0.16 22.8 -17.7 0.17 8.7 -16.2 0.20 14.9 2.1 0.17 8.6 -12.8 0.22 3.7 13.5 0.19 3.5 -4.0 Sr 109 114 2.8 4.3 111 0.9 1.4 112 1.6 2.7 108 0.9 -0.5 110 0.9 1.3 113 1.2 3.4 Y 14.3 16.4 2.9 14.6 15.7 1.3 10.1 15.5 2.1 8.2 15.3 0.6 6.8 12.2 1.2 -14.4 12.9 1.0 -10.1 Zr 14.00 16 2.4 11.2 14.5 1.2 3.4 14.4 1.0 3.0 14.1 0.6 0.5 12.2 0.4 -13.0 12.5 1.3 -10.5 Nb 0.520 0.545 10.2 4.7 0.538 3.9 3.4 0.549 4.9 5.7 0.552 2.9 6.1 0.527 4.1 1.4 0.548 5.8 5.4 Ba 6.500 7.04 6.7 8.3 6.64 4.3 2.1 6.66 2.7 2.4 6.62 2.3 1.9 6.77 5.2 4.2 7.01 2.9 7.8 La 0.609 0.635 2.5 4.2 0.618 4.6 1.4 0.629 5.1 3.2 0.634 4.8 4.1 0.564 6.5 -7.4 0.597 7.2 -2.0 Ce 1.890 2.00 3.6 5.8 1.95 2.4 3.2 1.96 3.3 3.4 1.95 1.0 3.3 1.91 1.6 1.0 1.95 1.9 3.0 Pr 0.370 0.426 5.0 15.1 0.385 5.3 4.2 0.367 7.9 -0.8 0.395 2.2 6.7 0.354 3.3 -4.2 0.365 3.3 -1.4 Nd 2.370 2.47 7.5 4.4 2.36 3.7 -0.6 2.41 4.5 1.7 2.45 5.2 3.2 2.25 5.1 -5.1 2.40 2.5 1.2 Sm 1.090 1.07 10.1 -1.8 1.21 9.8 11.1 1.05 6.3 -4.2 1.17 6.2 7.6 1.08 10.5 -0.7 1.13 9.2 3.3 Eu 0.517 0.475 7.6 -8.1 0.523 5.6 1.1 0.556 6.7 7.6 0.548 7.4 5.9 0.513 3.7 -0.8 0.535 2.7 3.4 Gd 1.850 1.95 6.8 5.3 1.89 4.3 2.0 1.71 12.0 -7.6 1.69 7.8 -8.6 1.61 4.1 -12.8 1.74 4.4 -6.0 Tb 0.350 0.367 1.6 4.9 0.347 5.1 -0.8 0.363 4.9 3.7 0.366 7.0 4.6 0.312 1.3 -10.9 0.324 3.8 -7.5 Dy 2.550 2.62 5.0 2.6 2.52 4.5 -1.3 2.50 3.6 -2.2 2.44 3.8 -4.2 2.19 3.6 -14.1 2.26 4.0 -11.5 Ho 0.560 0.559 4.9 -0.2 0.580 4.2 3.6 0.584 9.3 4.4 0.585 6.3 4.5 0.468 4.5 -16.5 0.492 2.2 -12.2 Er 1.700 1.83 6.2 7.5 1.75 4.8 3.0 1.60 7.6 -5.7 1.69 2.7 -0.6 1.33 1.6 -21.8 1.49 3.8 -12.4 Tm 0.240 0.262 8.2 9.2 0.262 6.6 9.0 0.238 11.9 -0.7 0.255 6.5 6.3 0.213 11.0 -11.1 0.220 4.7 -8.3 Yb 1.640 1.81 10.6 10.1 1.79 3.0 9.2 1.79 8.2 9.4 1.58 3.5 -3.5 1.45 4.1 -11.4 1.48 5.1 -9.5 Lu 0.248 0.269 5.1 8.4 0.234 8.0 -5.5 0.285 5.0 15.1 0.258 5.7 3.9 0.196 6.5 -21.0 0.222 7.3 -10.7 Hf 0.570 0.588 10.6 3.2 0.587 10.3 3.1 0.613 11.2 7.5 0.565 4.5 -0.9 0.437 10.7 -23.4 0.494 7.0 -13.3 Ta 0.036 0.026 77.0 -28.2 0.026 36.8 -26.8 0.032 19.6 -10.4 0.037 16.7 3.8 0.038 17.4 5.5 0.027 26.2 -24.9 Pb 3.700 3.82 2.8 3.1 3.64 3.3 -1.5 3.52 3.7 -5.0 3.64 3.1 -1.7 3.31 2.0 -10.5 3.10 1.5 -16.2 Th 0.030 0.031 23.1 3.5 0.029 11.5 -2.7 0.031 10.0 4.9 0.031 15.7 4.7 0.030 36.2 -1.1 0.028 20.2 -8.3 U 0.023 0.014 34.1 -39.6 0.017 15.3 -26.8 0.017 24.1 -25.6 0.017 14.0 -24.0 0.015 14.8 -35.5 0.015 17.2 -32.9 Reference values are from GeoReM; Rep.rate: Repetition rate; Crater dia.: Crater diameter; Ref.: Reference; AVG: Average; SD%: percent one standard deviation; RD%: percent relative deviation; C.F.: Correction factor. Total Fe reported as FeO, ΣTrOx.: total oxide wt.% of trace elements analyzed
Electronic Supplementary Material (ESI) for Journal of Analytical Atomic SpectrometryThis journal is © The Royal Society of Chemistry 2012
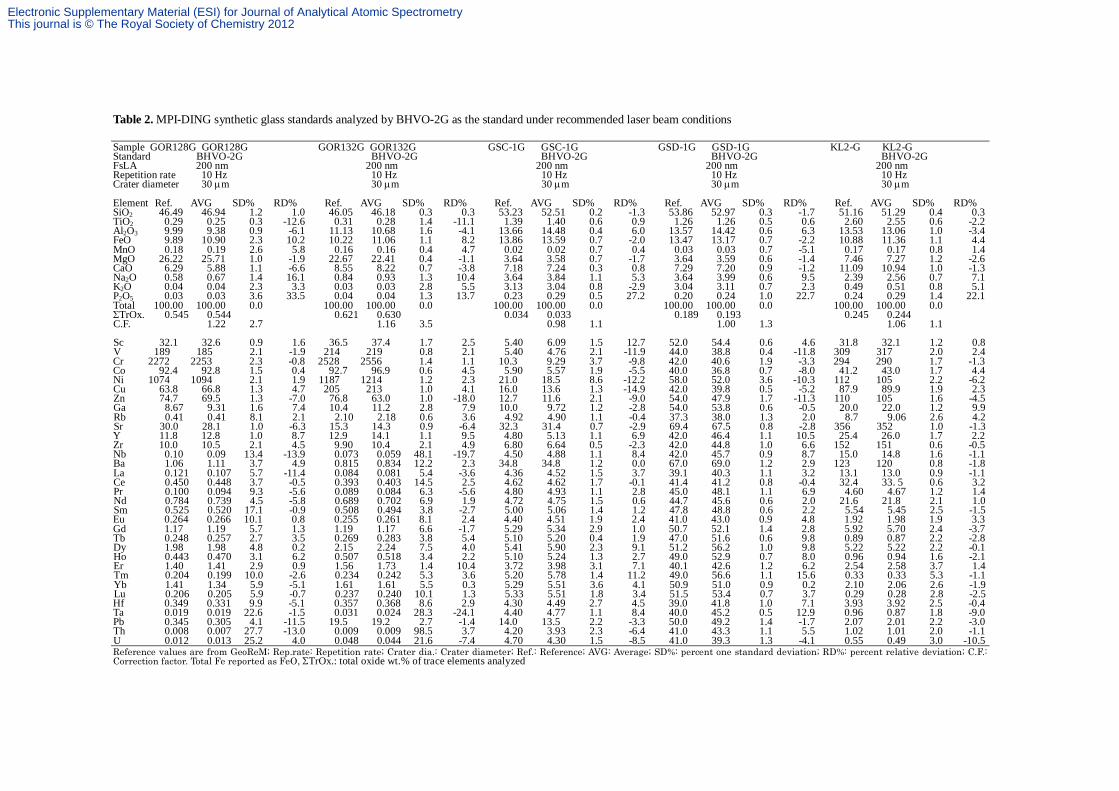
Table 2. MPI-DING synthetic glass standards analyzed by BHVO-2G as the standard under recommended laser beam conditions Sample GOR128G GOR128G GOR132G GOR132G GSC-1G GSC-1G GSD-1G GSD-1G KL2-G KL2-G Standard BHVO-2G BHVO-2G BHVO-2G BHVO-2G BHVO-2G FsLA 200 nm 200 nm 200 nm 200 nm 200 nm Repetition rate 10 Hz 10 Hz 10 Hz 10 Hz 10 Hz Crater diameter 30 µm 30 µm 30 µm 30 µm 30 µm Element Ref. AVG SD% RD% Ref. AVG SD% RD% Ref. AVG SD% RD% Ref. AVG SD% RD% Ref. AVG SD% RD% SiO2 46.49 46.94 1.2 1.0 46.05 46.18 0.3 0.3 53.23 52.51 0.2 -1.3 53.86 52.97 0.3 -1.7 51.16 51.29 0.4 0.3 TiO2 0.29 0.25 0.3 -12.6 0.31 0.28 1.4 -11.1 1.39 1.40 0.6 0.9 1.26 1.26 0.5 0.6 2.60 2.55 0.6 -2.2 Al2O3 9.99 9.38 0.9 -6.1 11.13 10.68 1.6 -4.1 13.66 14.48 0.4 6.0 13.57 14.42 0.6 6.3 13.53 13.06 1.0 -3.4 FeO 9.89 10.90 2.3 10.2 10.22 11.06 1.1 8.2 13.86 13.59 0.7 -2.0 13.47 13.17 0.7 -2.2 10.88 11.36 1.1 4.4 MnO 0.18 0.19 2.6 5.8 0.16 0.16 0.4 4.7 0.02 0.02 0.7 0.4 0.03 0.03 0.7 -5.1 0.17 0.17 0.8 1.4 MgO 26.22 25.71 1.0 -1.9 22.67 22.41 0.4 -1.1 3.64 3.58 0.7 -1.7 3.64 3.59 0.6 -1.4 7.46 7.27 1.2 -2.6 CaO 6.29 5.88 1.1 -6.6 8.55 8.22 0.7 -3.8 7.18 7.24 0.3 0.8 7.29 7.20 0.9 -1.2 11.09 10.94 1.0 -1.3 Na2O 0.58 0.67 1.4 16.1 0.84 0.93 1.3 10.4 3.64 3.84 1.1 5.3 3.64 3.99 0.6 9.5 2.39 2.56 0.7 7.1 K2O 0.04 0.04 2.3 3.3 0.03 0.03 2.8 5.5 3.13 3.04 0.8 -2.9 3.04 3.11 0.7 2.3 0.49 0.51 0.8 5.1 P2O5 0.03 0.03 3.6 33.5 0.04 0.04 1.3 13.7 0.23 0.29 0.5 27.2 0.20 0.24 1.0 22.7 0.24 0.29 1.4 22.1 Total 100.00 100.00 0.0 100.00 100.00 0.0 100.00 100.00 0.0 100.00 100.00 0.0 100.00 100.00 0.0 ΣTrOx. 0.545 0.544 0.621 0.630 0.034 0.033 0.189 0.193 0.245 0.244 C.F. 1.22 2.7 1.16 3.5 0.98 1.1 1.00 1.3 1.06 1.1 Sc 32.1 32.6 0.9 1.6 36.5 37.4 1.7 2.5 5.40 6.09 1.5 12.7 52.0 54.4 0.6 4.6 31.8 32.1 1.2 0.8 V 189 185 2.1 -1.9 214 219 0.8 2.1 5.40 4.76 2.1 -11.9 44.0 38.8 0.4 -11.8 309 317 2.0 2.4 Cr 2272 2253 2.3 -0.8 2528 2556 1.4 1.1 10.3 9.29 3.7 -9.8 42.0 40.6 1.9 -3.3 294 290 1.7 -1.3 Co 92.4 92.8 1.5 0.4 92.7 96.9 0.6 4.5 5.90 5.57 1.9 -5.5 40.0 36.8 0.7 -8.0 41.2 43.0 1.7 4.4 Ni 1074 1094 2.1 1.9 1187 1214 1.2 2.3 21.0 18.5 8.6 -12.2 58.0 52.0 3.6 -10.3 112 105 2.2 -6.2 Cu 63.8 66.8 1.3 4.7 205 213 1.0 4.1 16.0 13.6 1.3 -14.9 42.0 39.8 0.5 -5.2 87.9 89.9 1.9 2.3 Zn 74.7 69.5 1.3 -7.0 76.8 63.0 1.0 -18.0 12.7 11.6 2.1 -9.0 54.0 47.9 1.7 -11.3 110 105 1.6 -4.5 Ga 8.67 9.31 1.6 7.4 10.4 11.2 2.8 7.9 10.0 9.72 1.2 -2.8 54.0 53.8 0.6 -0.5 20.0 22.0 1.2 9.9 Rb 0.41 0.41 8.1 2.1 2.10 2.18 0.6 3.6 4.92 4.90 1.1 -0.4 37.3 38.0 1.3 2.0 8.7 9.06 2.6 4.2 Sr 30.0 28.1 1.0 -6.3 15.3 14.3 0.9 -6.4 32.3 31.4 0.7 -2.9 69.4 67.5 0.8 -2.8 356 352 1.0 -1.3 Y 11.8 12.8 1.0 8.7 12.9 14.1 1.1 9.5 4.80 5.13 1.1 6.9 42.0 46.4 1.1 10.5 25.4 26.0 1.7 2.2 Zr 10.0 10.5 2.1 4.5 9.90 10.4 2.1 4.9 6.80 6.64 0.5 -2.3 42.0 44.8 1.0 6.6 152 151 0.6 -0.5 Nb 0.10 0.09 13.4 -13.9 0.073 0.059 48.1 -19.7 4.50 4.88 1.1 8.4 42.0 45.7 0.9 8.7 15.0 14.8 1.6 -1.1 Ba 1.06 1.11 3.7 4.9 0.815 0.834 12.2 2.3 34.8 34.8 1.2 0.0 67.0 69.0 1.2 2.9 123 120 0.8 -1.8 La 0.121 0.107 5.7 -11.4 0.084 0.081 5.4 -3.6 4.36 4.52 1.5 3.7 39.1 40.3 1.1 3.2 13.1 13.0 0.9 -1.1 Ce 0.450 0.448 3.7 -0.5 0.393 0.403 14.5 2.5 4.62 4.62 1.7 -0.1 41.4 41.2 0.8 -0.4 32.4 33. 5 0.6 3.2 Pr 0.100 0.094 9.3 -5.6 0.089 0.084 6.3 -5.6 4.80 4.93 1.1 2.8 45.0 48.1 1.1 6.9 4.60 4.67 1.2 1.4 Nd 0.784 0.739 4.5 -5.8 0.689 0.702 6.9 1.9 4.72 4.75 1.5 0.6 44.7 45.6 0.6 2.0 21.6 21.8 2.1 1.0 Sm 0.525 0.520 17.1 -0.9 0.508 0.494 3.8 -2.7 5.00 5.06 1.4 1.2 47.8 48.8 0.6 2.2 5.54 5.45 2.5 -1.5 Eu 0.264 0.266 10.1 0.8 0.255 0.261 8.1 2.4 4.40 4.51 1.9 2.4 41.0 43.0 0.9 4.8 1.92 1.98 1.9 3.3 Gd 1.17 1.19 5.7 1.3 1.19 1.17 6.6 -1.7 5.29 5.34 2.9 1.0 50.7 52.1 1.4 2.8 5.92 5.70 2.4 -3.7 Tb 0.248 0.257 2.7 3.5 0.269 0.283 3.8 5.4 5.10 5.20 0.4 1.9 47.0 51.6 0.6 9.8 0.89 0.87 2.2 -2.8 Dy 1.98 1.98 4.8 0.2 2.15 2.24 7.5 4.0 5.41 5.90 2.3 9.1 51.2 56.2 1.0 9.8 5.22 5.22 2.2 -0.1 Ho 0.443 0.470 3.1 6.2 0.507 0.518 3.4 2.2 5.10 5.24 1.3 2.7 49.0 52.9 0.7 8.0 0.96 0.94 1.6 -2.1 Er 1.40 1.41 2.9 0.9 1.56 1.73 1.4 10.4 3.72 3.98 3.1 7.1 40.1 42.6 1.2 6.2 2.54 2.58 3.7 1.4 Tm 0.204 0.199 10.0 -2.6 0.234 0.242 5.3 3.6 5.20 5.78 1.4 11.2 49.0 56.6 1.1 15.6 0.33 0.33 5.3 -1.1 Yb 1.41 1.34 5.9 -5.1 1.61 1.61 5.5 0.3 5.29 5.51 3.6 4.1 50.9 51.0 0.9 0.2 2.10 2.06 2.6 -1.9 Lu 0.206 0.205 5.9 -0.7 0.237 0.240 10.1 1.3 5.33 5.51 1.8 3.4 51.5 53.4 0.7 3.7 0.29 0.28 2.8 -2.5 Hf 0.349 0.331 9.9 -5.1 0.357 0.368 8.6 2.9 4.30 4.49 2.7 4.5 39.0 41.8 1.0 7.1 3.93 3.92 2.5 -0.4 Ta 0.019 0.019 22.6 -1.5 0.031 0.024 28.3 -24.1 4.40 4.77 1.1 8.4 40.0 45.2 0.5 12.9 0.96 0.87 1.8 -9.0 Pb 0.345 0.305 4.1 -11.5 19.5 19.2 2.7 -1.4 14.0 13.5 2.2 -3.3 50.0 49.2 1.4 -1.7 2.07 2.01 2.2 -3.0 Th 0.008 0.007 27.7 -13.0 0.009 0.009 98.5 3.7 4.20 3.93 2.3 -6.4 41.0 43.3 1.1 5.5 1.02 1.01 2.0 -1.1 U 0.012 0.013 25.2 4.0 0.048 0.044 21.6 -7.4 4.70 4.30 1.5 -8.5 41.0 39.3 1.3 -4.1 0.55 0.49 3.0 -10.5 Reference values are from GeoReM; Rep.rate: Repetition rate; Crater dia.: Crater diameter; Ref.: Reference; AVG: Average; SD%: percent one standard deviation; RD%: percent relative deviation; C.F.: Correction factor. Total Fe reported as FeO, ΣTrOx.: total oxide wt.% of trace elements analyzed
Electronic Supplementary Material (ESI) for Journal of Analytical Atomic SpectrometryThis journal is © The Royal Society of Chemistry 2012

Table 2. Continued Sample ML3B-G ML3B-G TB-1G TB-1G StHs680-G StHs680-G ATHO-G ATHO-G Standard BHVO-2G BHVO-2G BHVO-2G BHVO-2G FsLA 200 nm 200 nm 200 nm 200 nm Repetition rate 10 Hz 10 Hz 10 Hz 10 Hz Crater diameter 30 µm 30 µm 30 µm 30 µm Elem. Ref. AVG SD% RD% Ref. AVG SD% RD% Ref. AVG SD% RD% Ref. AVG SD% RD% SiO2 52.29 52.38 0.7 0.2 54.91 54.29 0.5 -1.1 63.83 63.34 0.3 -0.8 75.87 74.23 0.3 -2.2 TiO2 2.17 2.07 1.1 -4.5 0.86 0.84 0.9 -2.4 0.70 0.67 0.6 -5.2 0.26 0.24 0.7 -4.7 Al2O3 13.83 13.57 0.7 -1.9 16.89 17.12 0.7 1.4 17.84 17.84 0.8 0.0 12.24 12.53 0.6 2.4 FeO 11.09 11.62 2.3 4.8 8.25 8.67 1.4 5.1 4.38 4.56 0.7 4.1 3.28 3.51 1.4 7.1 MnO 0.17 0.18 2.0 1.4 0.19 0.18 1.0 -1.0 0.08 0.07 1.2 -2.6 0.11 0.11 0.9 0.8 MgO 6.70 6.49 0.9 -3.2 3.69 3.51 1.0 -4.8 1.97 1.82 0.8 -7.8 0.10 0.09 0.8 -16.1 CaO 10.68 10.36 1.1 -3.0 6.96 6.70 0.5 -3.7 5.29 4.97 1.4 -6.0 1.71 1.59 1.5 -6.7 Na2O 2.44 2.69 1.7 10.0 3.24 3.56 2.4 9.7 4.45 5.21 1.0 17.2 3.76 4.86 1.3 29.1 K2O 0.39 0.40 2.0 1.7 4.43 4.52 1.1 2.2 1.29 1.33 0.9 3.3 2.65 2.80 1.0 5.6 P2O5 0.23 0.25 2.0 7.7 0.60 0.61 1.1 1.9 0.16 0.17 1.3 4.7 0.03 0.03 3.5 38.0 Total 100.00 100.00 0.0 100.00 100.00 0.0 100.00 100.00 0.0 100.00 100.00 0.0 ΣTrOx. 0.204 0.207 0.427 0.426 0.163 0.156 0.240 0.244 C.F. 1.10 0.6 1.03 1.5 1.22 1.4 1.10 2.7 Sc 31.6 30.7 1.5 -2.9 22.8 23.0 0.6 0.8 11.5 10.8 3.1 -6.2 7.00 7.67 1.3 9.5 V 268 287 1.9 7.2 189.2 179 1.3 -5.5 90.3 82.4 1.5 -8.8 3.91 3.24 2.8 -17.2 Cr 177 164 2.7 -7.4 60.0 55.8 3.0 -7.1 16.9 12.5 9.6 -26.3 6.10 4.15 18.3 -32.0 Co 41.2 43.1 0.8 4.6 23.5 22.8 0.2 -3.2 13.2 12.5 1.7 -5.6 2.13 1.27 2.5 -40.3 Ni 107 104 2.6 -3.0 19.4 14.5 6.5 -25.5 23.7 19.8 5.7 -16.7 13.0 5.97 34.0 -54.1 Cu 112 115 1.7 3.0 73.1 76.1 1.0 4.1 41.5 37.4 2.7 -9.9 18.6 18.7 1.4 0.3 Zn 108 108 1.8 -0.1 102.3 106 2.0 4.0 67.0 56.7 1.6 -15.4 141 137 1.5 -3.1 Ga 19.6 21.0 1.4 7.3 19.8 23.6 1.4 19.1 20.9 21.1 1.7 1.0 25.3 27.2 1.3 7.6 Rb 5.80 6.12 3.0 5.5 144.7 150 1.2 4.2 30.7 30.1 1.1 -2.0 65.3 66.4 1.2 1.7 Sr 312 311 1.7 -0.4 1363 1315 1.4 -3.5 482 466 1.0 -3.4 94.1 86.3 1.3 -8.3 Y 23.9 24.7 1.5 3.2 26.9 26.4 1.6 -1.9 11.4 11.9 1.7 4.0 94.5 106 1.5 12.1 Zr 122 125 1.0 2.8 250 245 2.2 -2.0 118 122 1.7 3.1 512 565 1.5 10.3 Nb 8.61 8.54 3.2 -0.8 28.2 29.8 1.2 5.5 6.94 6.81 2.1 -1.8 62.4 64.1 1.8 2.7 Ba 80.1 80.2 1.0 0.1 924.9 976 1.5 5.6 298 293 1.6 -1.7 547 526 1.6 -3.8 La 8.99 9.08 0.8 1.0 45.3 44.1 1.1 -2.7 12.0 11.5 2.2 -4.1 55.6 54.7 1.5 -1.7 Ce 23.1 23.3 0.9 2.1 89.7 92.0 1.7 2.1 26.1 25.4 1.2 -2.6 121 121 2.1 -0.2 Pr 3.43 3.45 1.0 0.7 10.6 10.7 1.8 1.4 3.20 3.09 1.1 -3.5 14.6 14.7 1.7 0.7 Nd 16.7 16.6 1.4 -0.6 40.0 40.1 2.9 1.4 13.0 12.7 2.5 -2.1 60.9 61.3 1.0 0.7 Sm 4.75 4.90 4.8 3.2 7.63 7.23 2.6 -5.2 2.78 2.68 4.7 -3.6 14.2 14.2 2.2 -0.3 Eu 1.67 1.72 2.9 2.9 1.91 1.81 3.7 -5.4 0.95 0.89 1.3 -6.1 2.76 2.73 1.1 -1.0 Gd 5.26 5.25 3.7 -0.3 6.20 5.79 3.8 -6.7 2.59 2.48 5.1 -4.3 15.3 15.3 2.5 0.2 Tb 0.80 0.81 3.6 1.7 0.84 0.78 3.3 -6.8 0.37 0.35 2.3 -5.2 2.51 2.70 2.1 7.4 Dy 4.84 4.94 2.3 2.1 4.95 4.79 1.8 -3.2 2.22 2.09 6.2 -5.9 16.2 17.4 1.3 7.5 Ho 0.91 0.92 3.1 1.7 0.98 0.90 3.7 -7.9 0.42 0.43 3.2 1.5 3.43 3.80 1.5 10.7 Er 2.44 2.42 4.0 -0.7 2.76 2.67 5.0 -3.2 1.18 1.19 6.0 1.1 10.3 11.7 2.4 13.5 Tm 0.32 0.32 2.3 0.3 0.39 0.41 3.8 4.4 0.17 0.18 7.0 1.8 1.52 1.63 1.9 7.4 Yb 2.06 1.95 3.6 -5.5 2.58 2.64 4.7 2.4 1.13 1.10 7.5 -3.1 10.5 10.8 2.9 2.8 Lu 0.29 0.29 4.6 -0.2 0.40 0.39 6.4 -3.4 0.17 0.17 6.5 0.5 1.54 1.71 2.8 10.9 Hf 3.22 3.23 3.6 0.4 5.87 5.93 2.4 1.0 3.07 3.06 2.7 -0.3 13.7 14.9 1.5 8.8 Ta 0.56 0.54 3.3 -1.9 1.51 1.60 4.3 6.1 0.42 0.40 2.2 -4.2 3.90 4.10 1.1 5.1 Pb 1.38 1.34 6.4 -2.8 16.0 16.8 1.2 5.0 10.3 10.0 1.7 -2.9 5.67 5.69 2.2 0.3 Th 0.55 0.54 2.5 -2.3 15.0 15.1 2.2 0.5 2.28 2.24 2.3 -1.8 7.40 7.68 1.8 3.8 U 0.44 0.46 3.8 4.0 4.20 4.11 2.5 -2.0 1.01 0.91 2.8 -10.0 2.37 2.16 3.3 -8.9 Reference values are from GeoReM; Rep.rate: Repetition rate; Crater dia.: Crater diameter; Ref.: Reference; AVG: Average; SD%: percent one standard deviation; RD%: percent relative deviation; C.F.: Correction factor. Total Fe reported as FeO, ΣTrOx.: total oxide wt.% of trace elements analyzed
Electronic Supplementary Material (ESI) for Journal of Analytical Atomic SpectrometryThis journal is © The Royal Society of Chemistry 2012
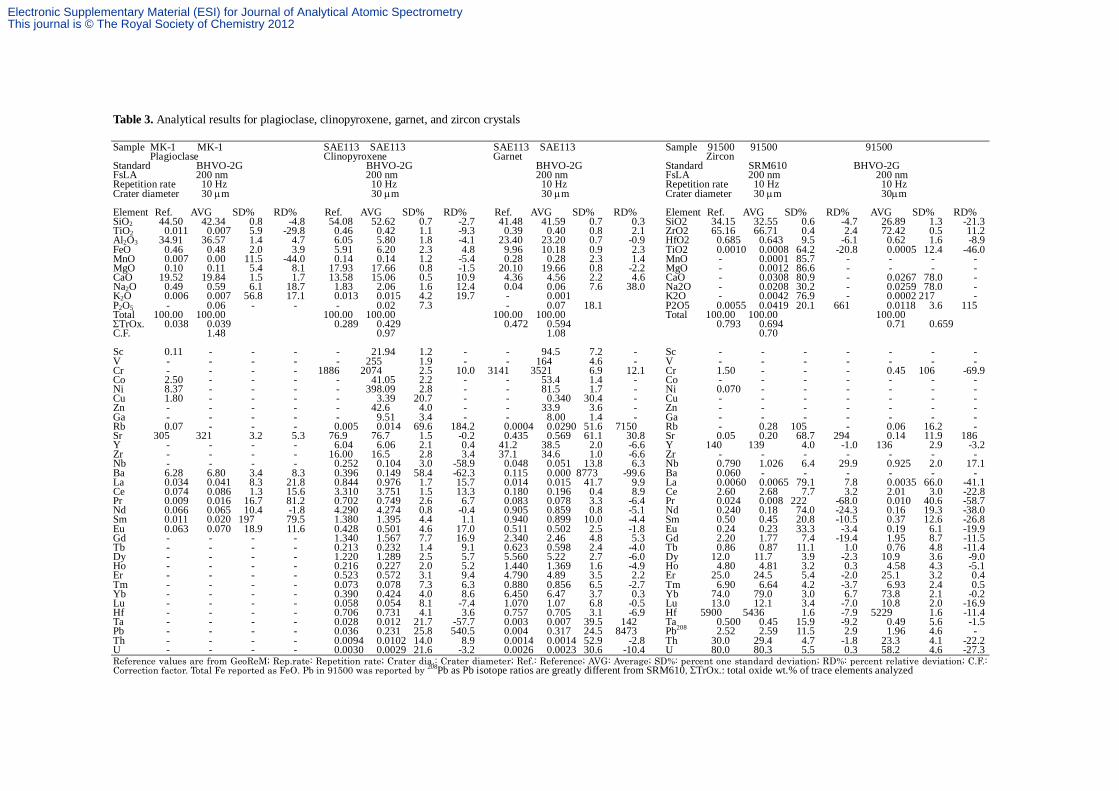
Table 3. Analytical results for plagioclase, clinopyroxene, garnet, and zircon crystals Sample MK-1 MK-1 SAE113 SAE113 SAE113 SAE113 Sample 91500 91500 91500 Plagioclase Clinopyroxene Garnet Zircon Standard BHVO-2G BHVO-2G BHVO-2G Standard SRM610 BHVO-2G FsLA 200 nm 200 nm 200 nm FsLA 200 nm 200 nm Repetition rate 10 Hz 10 Hz 10 Hz Repetition rate 10 Hz 10 Hz Crater diameter 30 µm 30 µm 30 µm Crater diameter 30 µm 30µm Element Ref. AVG SD% RD% Ref. AVG SD% RD% Ref. AVG SD% RD% Element Ref. AVG SD% RD% AVG SD% RD% SiO2 44.50 42.34 0.8 -4.8 54.08 52.62 0.7 -2.7 41.48 41.59 0.7 0.3 SiO2 34.15 32.55 0.6 -4.7 26.89 1.3 -21.3 TiO2 0.011 0.007 5.9 -29.8 0.46 0.42 1.1 -9.3 0.39 0.40 0.8 2.1 ZrO2 65.16 66.71 0.4 2.4 72.42 0.5 11.2 Al2O3 34.91 36.57 1.4 4.7 6.05 5.80 1.8 -4.1 23.40 23.20 0.7 -0.9 HfO2 0.685 0.643 9.5 -6.1 0.62 1.6 -8.9 FeO 0.46 0.48 2.0 3.9 5.91 6.20 2.3 4.8 9.96 10.18 0.9 2.3 TiO2 0.0010 0.0008 64.2 -20.8 0.0005 12.4 -46.0 MnO 0.007 0.00 11.5 -44.0 0.14 0.14 1.2 -5.4 0.28 0.28 2.3 1.4 MnO - 0.0001 85.7 - - - - MgO 0.10 0.11 5.4 8.1 17.93 17.66 0.8 -1.5 20.10 19.66 0.8 -2.2 MgO - 0.0012 86.6 - - - - CaO 19.52 19.84 1.5 1.7 13.58 15.06 0.5 10.9 4.36 4.56 2.2 4.6 CaO - 0.0308 80.9 - 0.0267 78.0 - Na2O 0.49 0.59 6.1 18.7 1.83 2.06 1.6 12.4 0.04 0.06 7.6 38.0 Na2O - 0.0208 30.2 - 0.0259 78.0 - K2O 0.006 0.007 56.8 17.1 0.013 0.015 4.2 19.7 - 0.001 K2O - 0.0042 76.9 - 0.0002 217 - P2O5 - 0.06 - - - 0.02 7.3 - 0.07 18.1 P2O5 0.0055 0.0419 20.1 661 0.0118 3.6 115 Total 100.00 100.00 100.00 100.00 100.00 100.00 Total 100.00 100.00 100.00 ΣTrOx. 0.038 0.039 0.289 0.429 0.472 0.594 0.793 0.694 0.71 0.659 C.F. 1.48 0.97 1.08 0.70 Sc 0.11 - - - - 21.94 1.2 - - 94.5 7.2 - Sc - - - - - - - V - - - - - 255 1.9 - - 164 4.6 - V - - - - - - - Cr - - - - 1886 2074 2.5 10.0 3141 3521 6.9 12.1 Cr 1.50 - - - 0.45 106 -69.9 Co 2.50 - - - - 41.05 2.2 - - 53.4 1.4 - Co - - - - - - - Ni 8.37 - - - - 398.09 2.8 - - 81.5 1.7 - Ni 0.070 - - - - - - Cu 1.80 - - - - 3.39 20.7 - - 0.340 30.4 - Cu - - - - - - - Zn - - - - - 42.6 4.0 - - 33.9 3.6 - Zn - - - - - - - Ga - - - - - 9.51 3.4 - - 8.00 1.4 - Ga - - - - - - - Rb 0.07 - - - 0.005 0.014 69.6 184.2 0.0004 0.0290 51.6 7150 Rb - 0.28 105 - 0.06 16.2 - Sr 305 321 3.2 5.3 76.9 76.7 1.5 -0.2 0.435 0.569 61.1 30.8 Sr 0.05 0.20 68.7 294 0.14 11.9 186 Y - - - - 6.04 6.06 2.1 0.4 41.2 38.5 2.0 -6.6 Y 140 139 4.0 -1.0 136 2.9 -3.2 Zr - - - - 16.00 16.5 2.8 3.4 37.1 34.6 1.0 -6.6 Zr - - - - - - - Nb - - - - 0.252 0.104 3.0 -58.9 0.048 0.051 13.8 6.3 Nb 0.790 1.026 6.4 29.9 0.925 2.0 17.1 Ba 6.28 6.80 3.4 8.3 0.396 0.149 58.4 -62.3 0.115 0.000 8773 -99.6 Ba 0.060 - - - - - - La 0.034 0.041 8.3 21.8 0.844 0.976 1.7 15.7 0.014 0.015 41.7 9.9 La 0.0060 0.0065 79.1 7.8 0.0035 66.0 -41.1 Ce 0.074 0.086 1.3 15.6 3.310 3.751 1.5 13.3 0.180 0.196 0.4 8.9 Ce 2.60 2.68 7.7 3.2 2.01 3.0 -22.8 Pr 0.009 0.016 16.7 81.2 0.702 0.749 2.6 6.7 0.083 0.078 3.3 -6.4 Pr 0.024 0.008 222 -68.0 0.010 40.6 -58.7 Nd 0.066 0.065 10.4 -1.8 4.290 4.274 0.8 -0.4 0.905 0.859 0.8 -5.1 Nd 0.240 0.18 74.0 -24.3 0.16 19.3 -38.0 Sm 0.011 0.020 197 79.5 1.380 1.395 4.4 1.1 0.940 0.899 10.0 -4.4 Sm 0.50 0.45 20.8 -10.5 0.37 12.6 -26.8 Eu 0.063 0.070 18.9 11.6 0.428 0.501 4.6 17.0 0.511 0.502 2.5 -1.8 Eu 0.24 0.23 33.3 -3.4 0.19 6.1 -19.9 Gd - - - - 1.340 1.567 7.7 16.9 2.340 2.46 4.8 5.3 Gd 2.20 1.77 7.4 -19.4 1.95 8.7 -11.5 Tb - - - - 0.213 0.232 1.4 9.1 0.623 0.598 2.4 -4.0 Tb 0.86 0.87 11.1 1.0 0.76 4.8 -11.4 Dy - - - - 1.220 1.289 2.5 5.7 5.560 5.22 2.7 -6.0 Dy 12.0 11.7 3.9 -2.3 10.9 3.6 -9.0 Ho - - - - 0.216 0.227 2.0 5.2 1.440 1.369 1.6 -4.9 Ho 4.80 4.81 3.2 0.3 4.58 4.3 -5.1 Er - - - - 0.523 0.572 3.1 9.4 4.790 4.89 3.5 2.2 Er 25.0 24.5 5.4 -2.0 25.1 3.2 0.4 Tm - - - - 0.073 0.078 7.3 6.3 0.880 0.856 6.5 -2.7 Tm 6.90 6.64 4.2 -3.7 6.93 2.4 0.5 Yb - - - - 0.390 0.424 4.0 8.6 6.450 6.47 3.7 0.3 Yb 74.0 79.0 3.0 6.7 73.8 2.1 -0.2 Lu - - - - 0.058 0.054 8.1 -7.4 1.070 1.07 6.8 -0.5 Lu 13.0 12.1 3.4 -7.0 10.8 2.0 -16.9 Hf - - - - 0.706 0.731 4.1 3.6 0.757 0.705 3.1 -6.9 Hf 5900 5436 1.6 -7.9 5229 1.6 -11.4 Ta - - - - 0.028 0.012 21.7 -57.7 0.003 0.007 39.5 142 Ta 0.500 0.45 15.9 -9.2 0.49 5.6 -1.5 Pb - - - - 0.036 0.231 25.8 540.5 0.004 0.317 24.5 8473 Pb208 2.52 2.59 11.5 2.9 1.96 4.6 - Th - - - - 0.0094 0.0102 14.0 8.9 0.0014 0.0014 52.9 -2.8 Th 30.0 29.4 4.7 -1.8 23.3 4.1 -22.2 U - - - - 0.0030 0.0029 21.6 -3.2 0.0026 0.0023 30.6 -10.4 U 80.0 80.3 5.5 0.3 58.2 4.6 -27.3 Reference values are from GeoReM; Rep.rate: Repetition rate; Crater dia.: Crater diameter; Ref.: Reference; AVG: Average; SD%: percent one standard deviation; RD%: percent relative deviation; C.F.: Correction factor. Total Fe reported as FeO. Pb in 91500 was reported by 208Pb as Pb isotope ratios are greatly different from SRM610, ΣTrOx.: total oxide wt.% of trace elements analyzed
Electronic Supplementary Material (ESI) for Journal of Analytical Atomic SpectrometryThis journal is © The Royal Society of Chemistry 2012
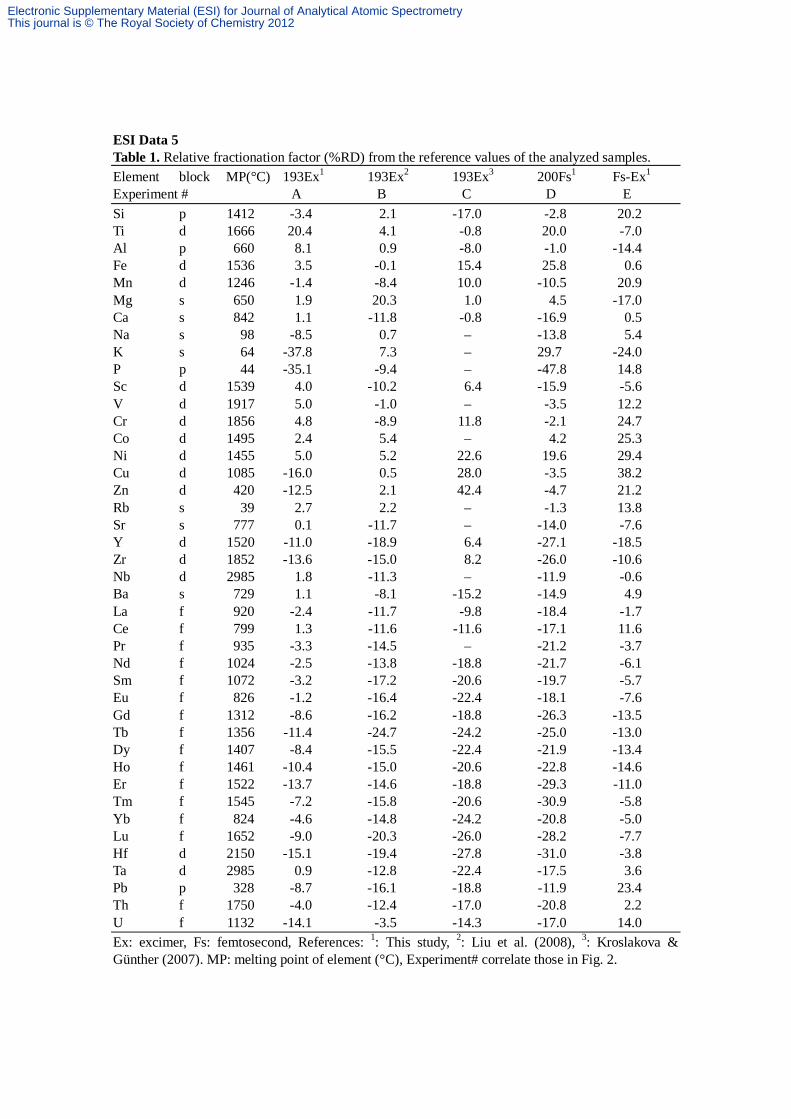
ESI Data 5 Table 1. Relative fractionation factor (%RD) from the reference values of the analyzed samples. Element block MP(°C) 193Ex1 193Ex2 193Ex3 200Fs1 Fs-Ex1
Experiment # A B C D E Si p 1412 -3.4 2.1 -17.0 -2.8 20.2 Ti d 1666 20.4 4.1 -0.8 20.0 -7.0 Al p 660 8.1 0.9 -8.0 -1.0 -14.4 Fe d 1536 3.5 -0.1 15.4 25.8 0.6 Mn d 1246 -1.4 -8.4 10.0 -10.5 20.9 Mg s 650 1.9 20.3 1.0 4.5 -17.0 Ca s 842 1.1 -11.8 -0.8 -16.9 0.5 Na s 98 -8.5 0.7 – -13.8 5.4 K s 64 -37.8 7.3 – 29.7 -24.0 P p 44 -35.1 -9.4 – -47.8 14.8 Sc d 1539 4.0 -10.2 6.4 -15.9 -5.6 V d 1917 5.0 -1.0 – -3.5 12.2 Cr d 1856 4.8 -8.9 11.8 -2.1 24.7 Co d 1495 2.4 5.4 – 4.2 25.3 Ni d 1455 5.0 5.2 22.6 19.6 29.4 Cu d 1085 -16.0 0.5 28.0 -3.5 38.2 Zn d 420 -12.5 2.1 42.4 -4.7 21.2 Rb s 39 2.7 2.2 – -1.3 13.8 Sr s 777 0.1 -11.7 – -14.0 -7.6 Y d 1520 -11.0 -18.9 6.4 -27.1 -18.5 Zr d 1852 -13.6 -15.0 8.2 -26.0 -10.6 Nb d 2985 1.8 -11.3 – -11.9 -0.6 Ba s 729 1.1 -8.1 -15.2 -14.9 4.9 La f 920 -2.4 -11.7 -9.8 -18.4 -1.7 Ce f 799 1.3 -11.6 -11.6 -17.1 11.6 Pr f 935 -3.3 -14.5 – -21.2 -3.7 Nd f 1024 -2.5 -13.8 -18.8 -21.7 -6.1 Sm f 1072 -3.2 -17.2 -20.6 -19.7 -5.7 Eu f 826 -1.2 -16.4 -22.4 -18.1 -7.6 Gd f 1312 -8.6 -16.2 -18.8 -26.3 -13.5 Tb f 1356 -11.4 -24.7 -24.2 -25.0 -13.0 Dy f 1407 -8.4 -15.5 -22.4 -21.9 -13.4 Ho f 1461 -10.4 -15.0 -20.6 -22.8 -14.6 Er f 1522 -13.7 -14.6 -18.8 -29.3 -11.0 Tm f 1545 -7.2 -15.8 -20.6 -30.9 -5.8 Yb f 824 -4.6 -14.8 -24.2 -20.8 -5.0 Lu f 1652 -9.0 -20.3 -26.0 -28.2 -7.7 Hf d 2150 -15.1 -19.4 -27.8 -31.0 -3.8 Ta d 2985 0.9 -12.8 -22.4 -17.5 3.6 Pb p 328 -8.7 -16.1 -18.8 -11.9 23.4 Th f 1750 -4.0 -12.4 -17.0 -20.8 2.2 U f 1132 -14.1 -3.5 -14.3 -17.0 14.0 Ex: excimer, Fs: femtosecond, References: 1: This study, 2: Liu et al. (2008), 3: Kroslakova & Günther (2007). MP: melting point of element (°C), Experiment# correlate those in Fig. 2.
Electronic Supplementary Material (ESI) for Journal of Analytical Atomic SpectrometryThis journal is © The Royal Society of Chemistry 2012

Table 2. Regression curve parameters and correlation coefficients between %RD and melting point of rare earth elements. Laser type Exp.# Standard Sample a b r2
193Ex1 A SRM610 Basalt -0.0131 -7.25 0.7876 193Ex2 B SRM610 Basalt -0.0137 -4.6947 0.6704 193Ex3 C SRM610+Rb SRM610 -0.0100 -6.6644 0.2197 200Fs1 D SRM612 Basalt -0.0128 9.283 0.7794 Fs-Ex1 E 612-266Fs 612-193Ex -0.0155 11.852 0.4731 Ex: excimer, Fs: femtosecond, Bas: Basalt, +Rb: Rb addition through ARIDUS, a and b: linear regression parameters for %RD = a X + b where X = melting point (°C) of REE, r2: regression coefficient, References: 1: This study, 2: Liu et al. (2008), 3: Kroslakova & Günther (2007), Exp.# correlate those in Fig. 2. ESI Data 5 Table 3. Relative fractionation factor (D(%RD)Ref.line) from the REE reference line of the analyzed samples. Element block FIE 193Ex1 193Ex2 193Ex3 200Fs1 Fs-Ex1
Experiment # A B C D E Si p 786.5 22.9 5.4 26.7 3.8 30.3 Ti d 658.8 49.1 32.5 10.9 22.5 7.0 Al p 277.5 14.9 7.2 11.7 5.3 -16.0 Fe d 762.5 53.2 13.9 23.5 37.4 12.6 Mn d 717.3 13.1 5.3 23.3 29.1 28.4 Mg s 737.3 20.3 0.9 6.6 14.2 -18.8 Ca s 589.8 1.4 2.6 4.9 14.3 1.8 Na s 495.8 -5.3 -16.5 3.8 7.6 -5.0 K s 418.8 37.8 -46.3 13.4 7.3 -34.8 P p 1011.8 -39.9 -43.8 -3.7 7.1 3.7 Sc d 633.1 11.5 14.4 -0.8 28.5 6.5 V d 650.9 28.9 20.2 26.6 25.8 30.2 Cr d 652.9 29.5 19.3 23.9 37.0 41.7 Co d 760.4 31.0 12.3 28.3 21.6 36.7 Ni d 737.1 45.9 14.3 30.9 43.8 40.1 Cu d 745.5 18.0 -11.4 17.9 45.5 43.2 Zn d 906.4 8.1 -16.4 13.1 53.3 15.9 Rb s 403.0 6.4 -6.1 8.0 7.1 2.6 Sr s 549.5 3.5 0.8 2.5 14.4 -7.4 Y d 600.0 0.1 -0.8 -4.1 28.3 -6.7 Zr d 640.1 5.6 0.8 6.8 33.4 6.3 Nb d 652.1 34.4 30.8 16.8 36.5 33.9 Ba s 502.9 1.9 1.1 0.6 -1.2 4.3 Hf d 658.5 4.4 3.2 15.1 0.4 17.7 Ta d 761.0 28.9 29.9 21.6 14.1 38.1 Pb p 715.6 -0.3 -13.7 -5.6 -8.8 16.6 Th f 587.0 9.4 9.1 11.7 7.2 17.6 U f 597.6 5.0 -8.9 15.6 3.7 19.7 Ex: excimer, Fs: femtosecond, References: 1: This study, 2: Liu et al. (2008), 3: Kroslakova & Günther (2007). FIE: first ionization energy of element (kJ/mol), Experiment# correlate those in Fig. 2. REEs are not shown as they are used as normalization reference line.
Electronic Supplementary Material (ESI) for Journal of Analytical Atomic SpectrometryThis journal is © The Royal Society of Chemistry 2012
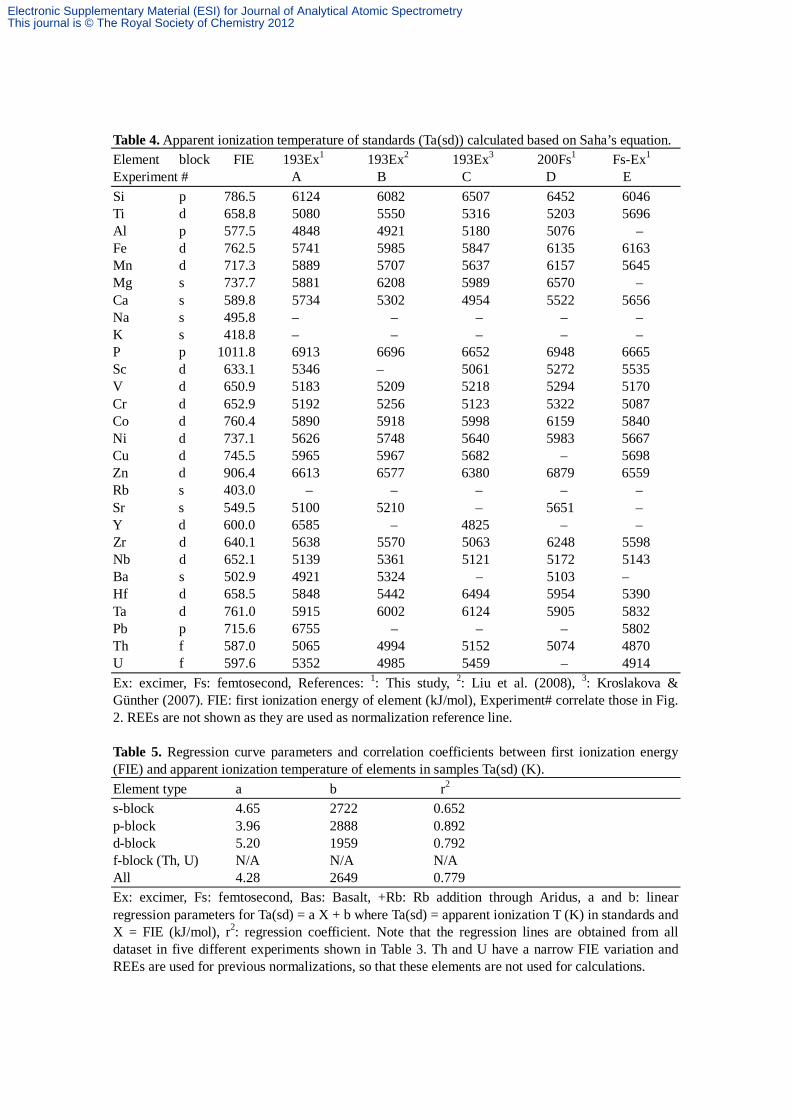
Table 4. Apparent ionization temperature of standards (Ta(sd)) calculated based on Saha’s equation. Element block FIE 193Ex1 193Ex2 193Ex3 200Fs1 Fs-Ex1
Experiment # A B C D E Si p 786.5 6124 6082 6507 6452 6046 Ti d 658.8 5080 5550 5316 5203 5696 Al p 577.5 4848 4921 5180 5076 – Fe d 762.5 5741 5985 5847 6135 6163 Mn d 717.3 5889 5707 5637 6157 5645 Mg s 737.7 5881 6208 5989 6570 – Ca s 589.8 5734 5302 4954 5522 5656 Na s 495.8 – – – – – K s 418.8 – – – – – P p 1011.8 6913 6696 6652 6948 6665 Sc d 633.1 5346 – 5061 5272 5535 V d 650.9 5183 5209 5218 5294 5170 Cr d 652.9 5192 5256 5123 5322 5087 Co d 760.4 5890 5918 5998 6159 5840 Ni d 737.1 5626 5748 5640 5983 5667 Cu d 745.5 5965 5967 5682 – 5698 Zn d 906.4 6613 6577 6380 6879 6559 Rb s 403.0 – – – – – Sr s 549.5 5100 5210 – 5651 – Y d 600.0 6585 – 4825 – – Zr d 640.1 5638 5570 5063 6248 5598 Nb d 652.1 5139 5361 5121 5172 5143 Ba s 502.9 4921 5324 – 5103 – Hf d 658.5 5848 5442 6494 5954 5390 Ta d 761.0 5915 6002 6124 5905 5832 Pb p 715.6 6755 – – – 5802 Th f 587.0 5065 4994 5152 5074 4870 U f 597.6 5352 4985 5459 – 4914 Ex: excimer, Fs: femtosecond, References: 1: This study, 2: Liu et al. (2008), 3: Kroslakova & Günther (2007). FIE: first ionization energy of element (kJ/mol), Experiment# correlate those in Fig. 2. REEs are not shown as they are used as normalization reference line. Table 5. Regression curve parameters and correlation coefficients between first ionization energy (FIE) and apparent ionization temperature of elements in samples Ta(sd) (K). Element type a b r2
s-block 4.65 2722 0.652 p-block 3.96 2888 0.892 d-block 5.20 1959 0.792 f-block (Th, U) N/A N/A N/A All 4.28 2649 0.779 Ex: excimer, Fs: femtosecond, Bas: Basalt, +Rb: Rb addition through Aridus, a and b: linear regression parameters for Ta(sd) = a X + b where Ta(sd) = apparent ionization T (K) in standards and X = FIE (kJ/mol), r2: regression coefficient. Note that the regression lines are obtained from all dataset in five different experiments shown in Table 3. Th and U have a narrow FIE variation and REEs are used for previous normalizations, so that these elements are not used for calculations.
Electronic Supplementary Material (ESI) for Journal of Analytical Atomic SpectrometryThis journal is © The Royal Society of Chemistry 2012