erratum: Uptake of apoptotic cells drives the growth of a pathogenic trypanosome in macrophages
21
Received 15 October 1999; accepted 10 February 2000. 1. Wang, J. C. Moving one DNA double helix through another by a type II DNA topoisomerase: the story of a simple molecular machine. Q. Rev. Biophys. 31, 107–144 (1998). 2. Liu, L. F., Liu, C. C. & Alberts, B. M. Type II DNA topoisomerases: enzymes that can unknot a topologically knotted DNA molecule via a reversible double-stranded break. Cell 19, 697–707 (1980). 3. Hsieh, T. Knotting of the circular duplex DNA by type II DNA topoisomerase from D. melanogaster. J. Biol. Chem. 258, 8413–8420 (1983). 4. Roca, J. & Wang, J. C. The capture of a DNA double helix by an ATP-dependent protein clamp: a key step in DNA transport by type II DNA topoisomerase. Cell 71, 833–840 (1992). 5. Roca, J., Berger, J. M. & Harrison, S. C. & Wang, J. C. DNA transport by a type II topoisomerase: Direct evidence for a two-gate mechanism. Proc. Natl Acad. Sci. USA 93, 4057–4062 (1996). 6. Rybenkov, V. V., Ullsperger, C. Vologodskii, A. V. & Cozzarelli, N. R. Simplification of DNA topology below equilibrium values by type II topoisomerases. Science 277, 690–693 (1997). 7. Osheroff, N., Shelton, E. R. & Brutlag, D. L. DNA topoisomerase II from D. melanogaster: relaxation of supercoiled DNA. J. Biol. Chem. 258, 9536–9543 (1983). 8. Uemura, T. & Yanagida, M. Mitotic spindle pulls but fails to separate chromosomes in type II DNA topoisomerase mutants: uncoordinated mitosis. EMBO J. 5, 1003–1010 (1986). 9. Ishida, R. et al. Inhibition of DNA topoisomerase II by ICRF-193 induces polyploidization by uncoupling chromosome dynamics from other cell cycle events. J. Cell Biol. 126, 1341–1351 (1994). 10. Strick, T. R., Allemand, J. F., Bensimon, D., Bensimon, A. & Croquette, V. The elasticity of a single supercoiled DNA molecule. Science 271, 1835–1837 (1996). 11. Strick, T. R., Allemand, J. F., Bensimon, D. & Croquette, V. The behavior of super-coiled DNA. Biophys. J. 74, 2016–2028 (1998). 12. Strick, T. R., Croquette, V. & Bensimon, D. Homologous pairing in stretched supercoiled DNA. Proc. Natl Acad. Sci. USA 95, 10579–10583 (1998). 13. Allemand, J. F., Bensimon, D., Lavery, R. & Croquette, V. Stretched and overwound DNAforms a Pauling-like structure with exposed bases. Proc. Natl Acad. Sci. USA 95, 14152–14157 (1998). 14. Landau, L. & Lifchitz, E. Theory of Elasticity (Mir Editions, Moscow, 1967). 15. Moroz, J. D. & Nelson, P. Torsional directed walks, entropic elasticity and DNAtwist stiffness. Proc. Natl Acad. Sci. USA 94, 14418–14422 (1998). 16. Bouchiat, C. & Me ´zard, M. Elasticity model of a supercoiled DNA molecule. Phys. Rev. Lett. 80, 1556– 1559 (1998). 17. Brown, P. O. & Cozzarelli, N. R. A sign inversion mechanism for enzymatic supercoiling of DNA. Science 206, 1081–1083 (1979). 18. Hua, W., Young, E. C., Fleming, M. L. & Gelles, J. Coupling of kinesin steps to ATP hydrolysis. Nature 388, 390–393 (1997). 19. Harkins, T. T. & Lindsley, J. E. Pre-steady-state analysis of ATP hydrolysis by Saccharomyces cerevisiae DNA topoisomerase II. 1. A DNA-dependent burst in ATP hydrolysis. Biochemistry 37, 7292–7298 (1998). 20. Harkins, T. T., Lewis, T. J. & Lindsley, J. E. Pre-steady-state analysis of ATP hydrolysis by Saccharomyces cerevisiae DNAtopoisomerase II. 2. Kinetic mechanism for the sequential hydrolysis of two ATP. Biochemistry 37, 7299–7312 (1998). 21. Wang, M. D. et al. Force and velocity measured for single molecules of RNA polymerase. Science 282, 902–907 (1998). 22. Visscher, K., Schnitzer, M. J. & Block, S. M. Single kinesin molecules studied with a molecular force clamp. Nature 400, 184–189 (1999). 23. Zechiedrich, E. L. & Osheroff, N. Eukaryotic topoisomerases recognize nucleic acid topology by preferentially interacting with DNA crossovers. EMBO J. 9, 4555–4562 (1990). 24. Roca, J., Berger, J. M. & Wang, J. C. On the simultaneous binding of eukaryotic DNAtoposiomerase II to a pair of double-stranded DNA helices. J. Biol. Chem. 268, 14250–14255 (1993). 25. Froelich-Ammon, S. J. & Osheroff, N. Topoisomerase poisons: harnessing the dark side of enzyme mechanism. J. Biol. Chem. 270, 21429–21432 (1995). Acknowledgements We thank B. Maier and J.-F. Allemand for helpful comments and O. Hyrien, J.-L. Sikorav, M. Duguet, V. Rybenkov, N. Crisona and N. Cozzarelli for stimulating conversations. We also thank N. Cozzarelli for a gift of cloned topo II. T.R.S. was supported by a CNRS BDI fellowship. Correspondence and requests for materials should be addressed to T.R.S. or D.B. letters to nature 904 NATURE | VOL 404 | 20 APRIL 2000 | www.nature.com ................................................................. errata Uptake of apoptotic cells drives the growth of a pathogenic trypanosome in macrophages Ce ´ lio G. Freire-de-Lima, Danielle O. Nascimento, Milena B. P. Soares, Patricia T. Bozza, Hugo C. Castro-Faria-Neto, Fernando G. de Mello, George A. DosReis & Marcela F. Lopes Nature 403, 199–203 (2000) .................................................................................................................................. In Fig. 4b and c the label beneath the fourth column should have read ‘Apo-1 + indomethacin’rather than ‘Anti-a v + indomethacin’. M ................................................................. Formation of molecular gas in the tidal debris of violent galaxy–galaxy interactions Jonathan Braine, Ute Lisenfeld, Pierre-Alain Duc & Ste ´ phane Leon Nature 403, 867–869 (2000) .................................................................................................................................. The name of the third author, Pierre-Alain Duc, was inadvertently mis-spelled as Due. In Fig. 3, the right-hand vertical axis label should have been the same as that for the left-hand vertical axis: ‘CO(1 ! 0) temperature (mK)’. M ................................................................. corrections The DNA sequence of human chromosome 22 I. Dunham, N. Shimizu, B. A. Roe, S. Chissoe et al. Nature 402, 489–495 (1999) .................................................................................................................................. The names of the following authors were omitted from the complete list at the end of the Article: P. Wilkinson (The Sanger Centre, Wellcome Trust Genome Campus, Hinxton, Cambridge CB10 1SA, UK); A. Bodenteich, K. Hartman, X. Hu, A. S. Khan, L. Lane, Y. Tilahun & H. Wright (Department of Chemistry and Bio- chemistry, The University of Oklahoma, 620 Parrington Oval, Room 311, Norman, Oklahoma 73019, USA). M ................................................................. Tribosphenic mammal from the North American Early Cretaceous Richard L. Cifelli Nature 401, 363–366 (1999) .................................................................................................................................. The binomen Montanalestes keebleri was established for a tribo- sphenic mammal of probable eutherian affinities from the Lower Cretaceous (Aptian–Albian) Cloverly Formation, Montana, USA. The trivial name was designated for the Keebler family, of Billings, Montana. As pointed out to me by T. Harrison, this designation is implicitly plural, hence, the proper suffix is -orum 1 . The species name is hereby corrected to Montanalestes keeblerorum, as provided by articles 19 and 32 of the International Code of Zoological Nomenclature 1 . M 1. International Commission on Zoological Nomenclature. International Code of Zoological Nomenclature 4th edn (International Trust for Zoological Nomenclature, The Natural History Museum, London, 1999). © 2000 Macmillan Magazines Ltd
-
Upload
independent -
Category
Documents
-
view
2 -
download
0
Transcript of erratum: Uptake of apoptotic cells drives the growth of a pathogenic trypanosome in macrophages
Received 15 October 1999; accepted 10 February 2000.
1. Wang, J. C. Moving one DNA double helix through another by a type II DNA topoisomerase: the story
of a simple molecular machine. Q. Rev. Biophys. 31, 107±144 (1998).
2. Liu, L. F., Liu, C. C. & Alberts, B. M. Type II DNA topoisomerases: enzymes that can unknot a
topologically knotted DNA molecule via a reversible double-stranded break. Cell 19, 697±707
(1980).
3. Hsieh, T. Knotting of the circular duplex DNA by type II DNA topoisomerase from D. melanogaster. J.
Biol. Chem. 258, 8413±8420 (1983).
4. Roca, J. & Wang, J. C. The capture of a DNA double helix by an ATP-dependent protein clamp: a key
step in DNA transport by type II DNA topoisomerase. Cell 71, 833±840 (1992).
5. Roca, J., Berger, J. M. & Harrison, S. C. & Wang, J. C. DNA transport by a type II topoisomerase: Direct
evidence for a two-gate mechanism. Proc. Natl Acad. Sci. USA 93, 4057±4062 (1996).
6. Rybenkov, V. V., Ullsperger, C. Vologodskii, A. V. & Cozzarelli, N. R. Simpli®cation of DNA topology
below equilibrium values by type II topoisomerases. Science 277, 690±693 (1997).
7. Osheroff, N., Shelton, E. R. & Brutlag, D. L. DNA topoisomerase II from D. melanogaster: relaxation of
supercoiled DNA. J. Biol. Chem. 258, 9536±9543 (1983).
8. Uemura, T. & Yanagida, M. Mitotic spindle pulls but fails to separate chromosomes in type II DNA
topoisomerase mutants: uncoordinated mitosis. EMBO J. 5, 1003±1010 (1986).
9. Ishida, R. et al. Inhibition of DNA topoisomerase II by ICRF-193 induces polyploidization by
uncoupling chromosome dynamics from other cell cycle events. J. Cell Biol. 126, 1341±1351 (1994).
10. Strick, T. R., Allemand, J. F., Bensimon, D., Bensimon, A. & Croquette, V. The elasticity of a single
supercoiled DNA molecule. Science 271, 1835±1837 (1996).
11. Strick, T. R., Allemand, J. F., Bensimon, D. & Croquette, V. The behavior of super-coiled DNA.
Biophys. J. 74, 2016±2028 (1998).
12. Strick, T. R., Croquette, V. & Bensimon, D. Homologous pairing in stretched supercoiled DNA. Proc.
Natl Acad. Sci. USA 95, 10579±10583 (1998).
13. Allemand, J. F., Bensimon, D., Lavery, R. & Croquette, V. Stretched and overwound DNA forms a
Pauling-like structure with exposed bases. Proc. Natl Acad. Sci. USA 95, 14152±14157 (1998).
14. Landau, L. & Lifchitz, E. Theory of Elasticity (Mir Editions, Moscow, 1967).
15. Moroz, J. D. & Nelson, P. Torsional directed walks, entropic elasticity and DNA twist stiffness. Proc.
Natl Acad. Sci. USA 94, 14418±14422 (1998).
16. Bouchiat, C. & MeÂzard, M. Elasticity model of a supercoiled DNA molecule. Phys. Rev. Lett. 80, 1556±
1559 (1998).
17. Brown, P. O. & Cozzarelli, N. R. A sign inversion mechanism for enzymatic supercoiling of DNA.
Science 206, 1081±1083 (1979).
18. Hua, W., Young, E. C., Fleming, M. L. & Gelles, J. Coupling of kinesin steps to ATP hydrolysis. Nature
388, 390±393 (1997).
19. Harkins, T. T. & Lindsley, J. E. Pre-steady-state analysis of ATP hydrolysis by Saccharomyces cerevisiae
DNA topoisomerase II. 1. A DNA-dependent burst in ATP hydrolysis. Biochemistry 37, 7292±7298
(1998).
20. Harkins, T. T., Lewis, T. J. & Lindsley, J. E. Pre-steady-state analysis of ATP hydrolysis by Saccharomyces
cerevisiae DNA topoisomerase II. 2. Kinetic mechanism for the sequential hydrolysis of two ATP.
Biochemistry 37, 7299±7312 (1998).
21. Wang, M. D. et al. Force and velocity measured for single molecules of RNA polymerase. Science 282,
902±907 (1998).
22. Visscher, K., Schnitzer, M. J. & Block, S. M. Single kinesin molecules studied with a molecular force
clamp. Nature 400, 184±189 (1999).
23. Zechiedrich, E. L. & Osheroff, N. Eukaryotic topoisomerases recognize nucleic acid topology by
preferentially interacting with DNA crossovers. EMBO J. 9, 4555±4562 (1990).
24. Roca, J., Berger, J. M. & Wang, J. C. On the simultaneous binding of eukaryotic DNA toposiomerase II
to a pair of double-stranded DNA helices. J. Biol. Chem. 268, 14250±14255 (1993).
25. Froelich-Ammon, S. J. & Osheroff, N. Topoisomerase poisons: harnessing the dark side of enzyme
mechanism. J. Biol. Chem. 270, 21429±21432 (1995).
Acknowledgements
We thank B. Maier and J.-F. Allemand for helpful comments and O. Hyrien, J.-L. Sikorav,M. Duguet, V. Rybenkov, N. Crisona and N. Cozzarelli for stimulating conversations. Wealso thank N. Cozzarelli for a gift of cloned topo II. T.R.S. was supported by a CNRS BDIfellowship.
Correspondence and requests for materials should be addressed to T.R.S. or D.B.
letters to nature
904 NATURE | VOL 404 | 20 APRIL 2000 | www.nature.com
.................................................................errata
Uptake of apoptotic cells drivesthe growth of a pathogenictrypanosome inmacrophagesCeÂlio G. Freire-de-Lima, Danielle O. Nascimento,Milena B. P. Soares, Patricia T. Bozza, Hugo C. Castro-Faria-Neto,Fernando G. de Mello, George A. DosReis & Marcela F. Lopes
Nature 403, 199±203 (2000)..................................................................................................................................In Fig. 4b and c the label beneath the fourth column should have readApo-1 + indomethacin' rather than Anti-av + indomethacin'. M
.................................................................Formation of molecular gasin the tidal debris ofviolent galaxy±galaxy interactionsJonathan Braine, Ute Lisenfeld, Pierre-Alain Duc& SteÂphane Leon
Nature 403, 867±869 (2000)..................................................................................................................................The name of the third author, Pierre-Alain Duc, was inadvertentlymis-spelled as Due. In Fig. 3, the right-hand vertical axis labelshould have been the same as that for the left-hand vertical axis:`CO(1 ! 0) temperature (mK)'. M
.................................................................corrections
The DNA sequence of humanchromosome 22
I. Dunham, N. Shimizu, B. A. Roe, S. Chissoe et al.
Nature 402, 489±495 (1999)..................................................................................................................................The names of the following authors were omitted from the completelist at the end of the Article: P. Wilkinson (The Sanger Centre,Wellcome Trust Genome Campus, Hinxton, Cambridge CB10 1SA,UK); A. Bodenteich, K. Hartman, X. Hu, A. S. Khan, L. Lane,Y. Tilahun & H. Wright (Department of Chemistry and Bio-chemistry, The University of Oklahoma, 620 Parrington Oval,Room 311, Norman, Oklahoma 73019, USA). M
.................................................................Tribosphenic mammal from theNorth American Early CretaceousRichard L. Cifelli
Nature 401, 363±366 (1999)..................................................................................................................................The binomen Montanalestes keebleri was established for a tribo-sphenic mammal of probable eutherian af®nities from the LowerCretaceous (Aptian±Albian) Cloverly Formation, Montana, USA.The trivial name was designated for the Keebler family, of Billings,Montana. As pointed out to me by T. Harrison, this designation isimplicitly plural, hence, the proper suf®x is -orum1. The species nameis hereby corrected to Montanalestes keeblerorum, as provided byarticles 19 and 32 of the International Code of ZoologicalNomenclature1. M
1. International Commission on Zoological Nomenclature. International Code of Zoological
Nomenclature 4th edn (International Trust for Zoological Nomenclature, The Natural History
Museum, London, 1999).
© 2000 Macmillan Magazines Ltd
© 2000 Macmillan Magazines Ltd
14. Suessbrich, H. Speci®c blockade of slowly activating IsK channels by chromanolsÐimpact on the role
of IsK channels in epithelia. FEBS Lett. 396, 271±275 (1996).
15. Abbott, G. W. et al. MiRP1 forms IKr potassium channels with HERG and is associated with cardiac
arrhythmia. Cell 97, 175±187 (1999).
16. Busch, A. E. et al. The role of the IsK protein in the speci®c pharmacological properties of the IKs
channel complex. Br. J. Pharmacol. 122, 187±189 (1997).
17. Devor, D. C., Singh, A. K., Gerlach, A. C., Frizzell, R. A. & Bridges, R. J. Inhibition of intestinal Cl-
secretion by clotrimazole: direct effect on basolateral membrane K+ channels. Am. J. Physiol. 273,
C531±C540 (1997).
18. Rufo, P. A. et al. The antifungal antibiotic, clotrimazole, inhibits chloride secretion by human
intestinal T84 cells via blockade of distinct basolateral K+ conductances. Demonstration of ef®cacy in
intact rabbit colon and in an in vivo mouse model of cholera. J. Clin. Invest. 100, 3111±3120 (1997).
19. Yang, W. P. et al. KvLQT1, a voltage-gated potassium channel responsible for human cardiac
arrhythmias. Proc. Natl Acad. Sci. USA 94, 4017±4021 (1997).
20. Schroeder, B. C., Kubisch, C., Stein, V. & Jentsch, T. J. Moderate loss of function of cyclic-AMP-
modulated KCN2Q2/KCNQ3 K+ channels causes epilepsy. Nature 396, 687±690 (1998).
21. Zerangue, N., Schwappach, B., Jan, Y. N. & Jan, L. Y. A new ER traf®cking signal regulates the subunit
stoichiometry of plasma membrane KATP channels. Neuron 22, 537±548 (1999).
22. McDonald, T. V. et al. A minK-HERG complex regulates the cardiac potassium current IKr. Nature
388, 289±292 (1997).
23. Curran, M. E. et al. A molecular basis for cardiac arrhythmia: HERG mutations cause long QT
syndrome. Cell 80, 795±803 (1995).
24. Lohrmann, E. et al. A new class of inhibitors of cAMP-mediated Cl- secretion in rabbit colon, acting
by the reduction of cAMP-activated K+ conductance. P¯uÈgers Arch. 429, 517±530 (1995).
25. Devor, D. C., Singh, A. K., Frizzell, R. A. & Bridges, R. J. Modulation of Cl- secretion by
benzimidazolones. I. Direct activation of a Ca2+-dependent K+ channel. Am. J. Physiol. 271, L775±
L784 (1996).
26. Mall, M. et al. Cholinergic ion secretion in human colon requires coactivation by cAMP. Am. J. Physiol.
275, G1274±G1281 (1998).
27. MacVinish, L. J., Hickman, M. E., Mufti, D. A., Durrington, H. J. & Cuthbert, A. W. Importance of
basolateral K+ conductance in maintaining Cl- secretion in murine nasal and colonic epithelia. J.
Physiol. (Lond.) 510, 237±247 (1998).
28. Warth, R. et al. The cAMP-regulated and 293B-inhibited K+ conductance of rat colonic crypt base
cells. P¯uÈgers Arch. 432, 81±88 (1996).
29. Diener, M., Hug, F., Strabel, D. & Scharrer, E. Cyclic AMP-dependent regulation of K+ transport in the
rat distal colon. Br. J. Pharmacol. 118, 1477±1487 (1996).
30. Trezise, A. E. & Buchwald, M. In vivo cell-speci®c expression of the cystic ®brosis transmembrane
conductance regulator. Nature 353, 434±437 (1991).
Supplementary information is available on Nature's World-Wide Web site (http://www.nature.com) or as paper copy from the London editorial of®ce of Nature.
Acknowledgements
We thank J. P. Hardelin and C. Petit for performing KCNE3 in situ hybridization ofcochlear sections. This work was supported by grants from the Deutsche Forschungsge-meinschaft and the Fonds der Chemischen Industrie to R.G. and T.J.J.
Correspondence and requests for materials should be addressed to T.J.J.(e-mail: [email protected]).
letters to nature
NATURE | VOL 403 | 13 JANUARY 2000 | www.nature.com 199
.................................................................Uptake of apoptotic cells drivesthe growth of a pathogenictrypanosome in macrophagesCeÂlio G. Freire-de-Lima*, Danielle O. Nascimento*, Milena B. P. Soares²,Patricia T. Bozza³, Hugo C. Castro-Faria-Neto³, Fernando G. de Mello*,George A. DosReis* & Marcela F. Lopes*
* Instituto de Bio®sica Carlos Chagas Filho, Universidade Federal do
Rio de Janeiro, 21944-970, Rio de Janeiro, RJ, Brazil² Centro de Pesquisas GoncËalo Moniz, FIOCRUZ, 40295-001, Salvador, BA,
Brazil³ Instituto Oswaldo Cruz, FIOCRUZ, 21045-900, Rio de Janeiro, RJ, Brazil
..............................................................................................................................................
After apoptosis, phagocytes prevent in¯ammation and tissuedamage by the uptake and removal of dead cells1. In addition,apoptotic cells evoke an anti-in¯ammatory response throughmacrophages2,3. We have previously shown that there is intenselymphocyte apoptosis in an experimental model of Chagas'disease4, a debilitating cardiac illness caused by the protozoanTrypanosoma cruzi. Here we show that the interaction of apopto-
tic, but not necrotic T lymphocytes with macrophages infectedwith T. cruzi fuels parasite growth in a manner dependent onprostaglandins, transforming growth factor-b (TGF-b) and poly-amine biosynthesis. We show that the vitronectin receptor iscritical, in both apoptotic-cell cytoadherence and the inductionof prostaglandin E2/TGF-b release and ornithine decarboxylaseactivity in macrophages. A single injection of apoptotic cells ininfected mice increases parasitaemia, whereas treatment withcyclooxygenase inhibitors almost completely ablates it in vivo.These results suggest that continual lymphocyte apoptosis andphagocytosis of apoptotic cells by macrophages have a role inparasite persistence in the host, and that cyclooxygenase inhibi-tors have potential therapeutic application in the control ofparasite replication and spread in Chagas' disease.
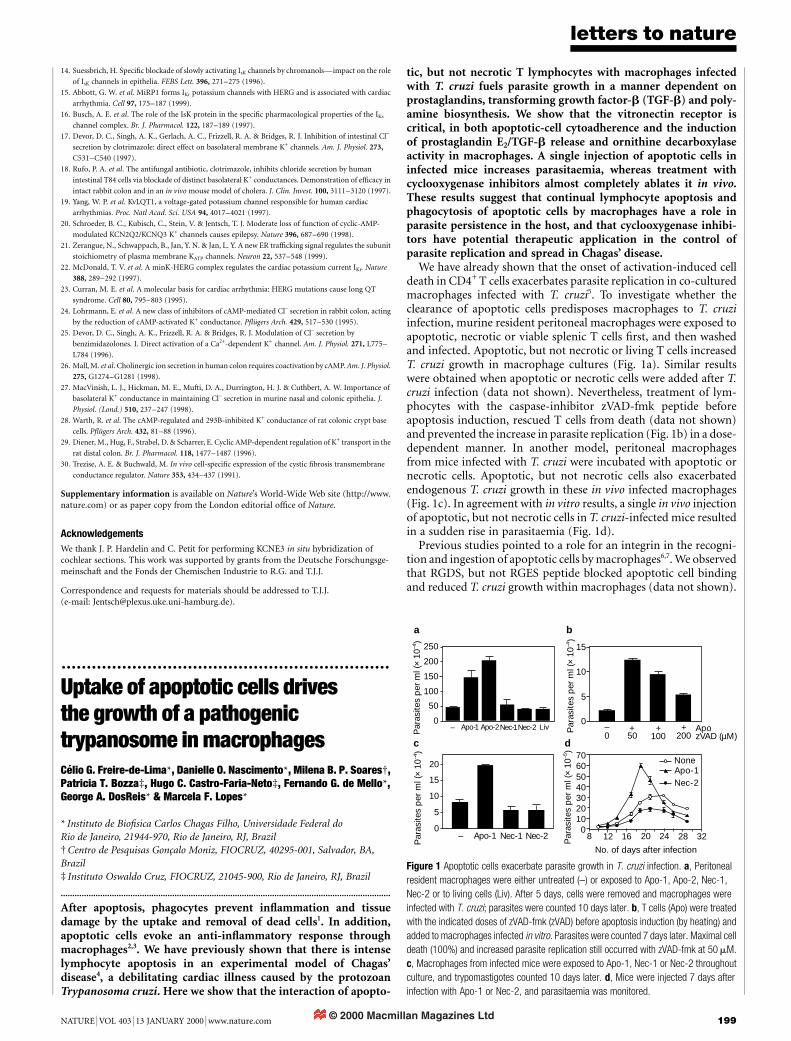
We have already shown that the onset of activation-induced celldeath in CD4+ T cells exacerbates parasite replication in co-culturedmacrophages infected with T. cruzi5. To investigate whether theclearance of apoptotic cells predisposes macrophages to T. cruziinfection, murine resident peritoneal macrophages were exposed toapoptotic, necrotic or viable splenic T cells ®rst, and then washedand infected. Apoptotic, but not necrotic or living T cells increasedT. cruzi growth in macrophage cultures (Fig. 1a). Similar resultswere obtained when apoptotic or necrotic cells were added after T.cruzi infection (data not shown). Nevertheless, treatment of lym-phocytes with the caspase-inhibitor zVAD-fmk peptide beforeapoptosis induction, rescued T cells from death (data not shown)and prevented the increase in parasite replication (Fig. 1b) in a dose-dependent manner. In another model, peritoneal macrophagesfrom mice infected with T. cruzi were incubated with apoptotic ornecrotic cells. Apoptotic, but not necrotic cells also exacerbatedendogenous T. cruzi growth in these in vivo infected macrophages(Fig. 1c). In agreement with in vitro results, a single in vivo injectionof apoptotic, but not necrotic cells in T. cruzi-infected mice resultedin a sudden rise in parasitaemia (Fig. 1d).
Previous studies pointed to a role for an integrin in the recogni-tion and ingestion of apoptotic cells by macrophages6,7. We observedthat RGDS, but not RGES peptide blocked apoptotic cell bindingand reduced T. cruzi growth within macrophages (data not shown).
0
50
100
150
200
250
0
5
10
15
0ApozVAD (µM)20010050
– + + +
a b
c
0
5
10
15
20
– Apo-1 Nec-1 Nec-2
No. of days after infection
Par
asite
s p
er m
l (×
10–5
)
Par
asite
s p
er m
l (×
10–4
)
Par
asite
s p
er m
l (×
10–4
)
Par
asite
s p
er m
l (×
10–4
)
8 12 16 20 24 28 320
10203040506070
Apo-1Nec-2
None
d
– Apo-1 Apo-2Nec-1Nec-2 Liv
Figure 1 Apoptotic cells exacerbate parasite growth in T. cruzi infection. a, Peritoneal
resident macrophages were either untreated (-) or exposed to Apo-1, Apo-2, Nec-1,
Nec-2 or to living cells (Liv). After 5 days, cells were removed and macrophages were
infected with T. cruzi; parasites were counted 10 days later. b, T cells (Apo) were treated
with the indicated doses of zVAD-fmk (zVAD) before apoptosis induction (by heating) and
added to macrophages infected in vitro. Parasites were counted 7 days later. Maximal cell
death (100%) and increased parasite replication still occurred with zVAD-fmk at 50 mM.
c, Macrophages from infected mice were exposed to Apo-1, Nec-1 or Nec-2 throughout
culture, and trypomastigotes counted 10 days later. d, Mice were injected 7 days after
infection with Apo-1 or Nec-2, and parasitaemia was monitored.
© 2000 Macmillan Magazines Ltd
letters to nature
200 NATURE | VOL 403 | 13 JANUARY 2000 | www.nature.com
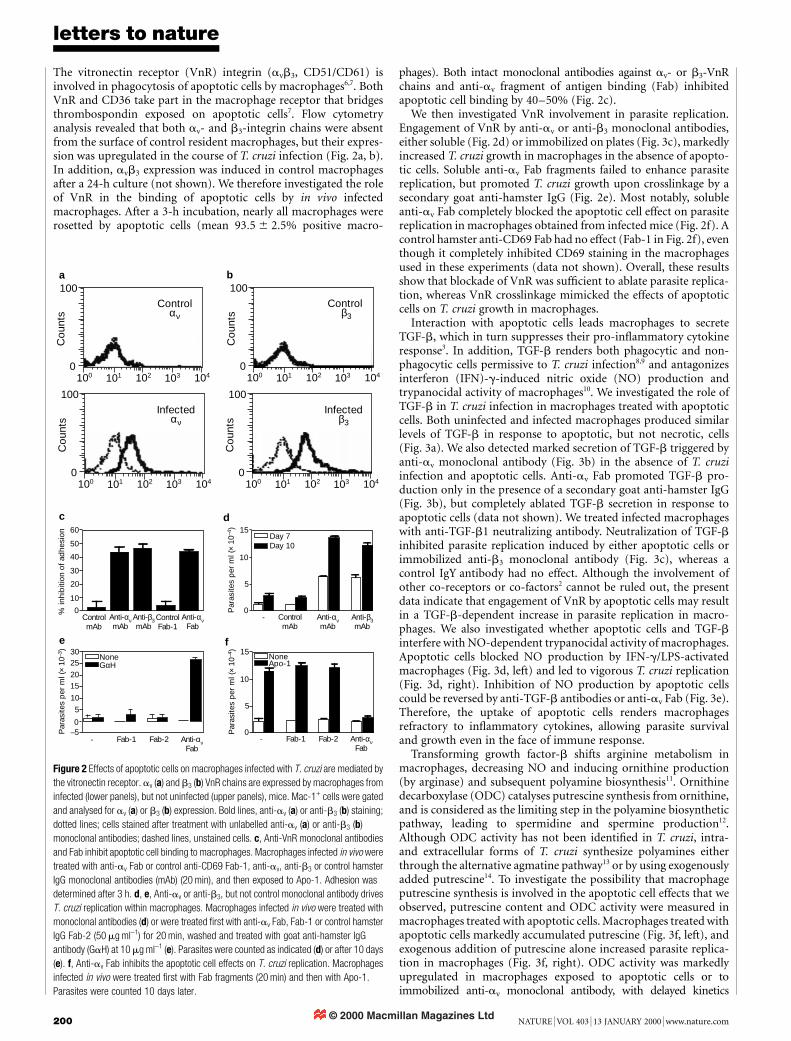
The vitronectin receptor (VnR) integrin (avb3, CD51/CD61) isinvolved in phagocytosis of apoptotic cells by macrophages6,7. BothVnR and CD36 take part in the macrophage receptor that bridgesthrombospondin exposed on apoptotic cells7. Flow cytometryanalysis revealed that both av- and b3-integrin chains were absentfrom the surface of control resident macrophages, but their expres-sion was upregulated in the course of T. cruzi infection (Fig. 2a, b).In addition, avb3 expression was induced in control macrophagesafter a 24-h culture (not shown). We therefore investigated the roleof VnR in the binding of apoptotic cells by in vivo infectedmacrophages. After a 3-h incubation, nearly all macrophages wererosetted by apoptotic cells (mean 93:5 6 2:5% positive macro-
phages). Both intact monoclonal antibodies against av- or b3-VnRchains and anti-av fragment of antigen binding (Fab) inhibitedapoptotic cell binding by 40±50% (Fig. 2c).
We then investigated VnR involvement in parasite replication.Engagement of VnR by anti-av or anti-b3 monoclonal antibodies,either soluble (Fig. 2d) or immobilized on plates (Fig. 3c), markedlyincreased T. cruzi growth in macrophages in the absence of apopto-tic cells. Soluble anti-av Fab fragments failed to enhance parasitereplication, but promoted T. cruzi growth upon crosslinkage by asecondary goat anti-hamster IgG (Fig. 2e). Most notably, solubleanti-av Fab completely blocked the apoptotic cell effect on parasitereplication in macrophages obtained from infected mice (Fig. 2f). Acontrol hamster anti-CD69 Fab had no effect (Fab-1 in Fig. 2f), eventhough it completely inhibited CD69 staining in the macrophagesused in these experiments (data not shown). Overall, these resultsshow that blockade of VnR was suf®cient to ablate parasite replica-tion, whereas VnR crosslinkage mimicked the effects of apoptoticcells on T. cruzi growth in macrophages.
Interaction with apoptotic cells leads macrophages to secreteTGF-b, which in turn suppresses their pro-in¯ammatory cytokineresponse3. In addition, TGF-b renders both phagocytic and non-phagocytic cells permissive to T. cruzi infection8,9 and antagonizesinterferon (IFN)-g-induced nitric oxide (NO) production andtrypanocidal activity of macrophages10. We investigated the role ofTGF-b in T. cruzi infection in macrophages treated with apoptoticcells. Both uninfected and infected macrophages produced similarlevels of TGF-b in response to apoptotic, but not necrotic, cells(Fig. 3a). We also detected marked secretion of TGF-b triggered byanti-av monoclonal antibody (Fig. 3b) in the absence of T. cruziinfection and apoptotic cells. Anti-av Fab promoted TGF-b pro-duction only in the presence of a secondary goat anti-hamster IgG(Fig. 3b), but completely ablated TGF-b secretion in response toapoptotic cells (data not shown). We treated infected macrophageswith anti-TGF-b1 neutralizing antibody. Neutralization of TGF-binhibited parasite replication induced by either apoptotic cells orimmobilized anti-b3 monoclonal antibody (Fig. 3c), whereas acontrol IgY antibody had no effect. Although the involvement ofother co-receptors or co-factors2 cannot be ruled out, the presentdata indicate that engagement of VnR by apoptotic cells may resultin a TGF-b-dependent increase in parasite replication in macro-phages. We also investigated whether apoptotic cells and TGF-binterfere with NO-dependent trypanocidal activity of macrophages.Apoptotic cells blocked NO production by IFN-g/LPS-activatedmacrophages (Fig. 3d, left) and led to vigorous T. cruzi replication(Fig. 3d, right). Inhibition of NO production by apoptotic cellscould be reversed by anti-TGF-b antibodies or anti-av Fab (Fig. 3e).Therefore, the uptake of apoptotic cells renders macrophagesrefractory to in¯ammatory cytokines, allowing parasite survivaland growth even in the face of immune response.
Transforming growth factor-b shifts arginine metabolism inmacrophages, decreasing NO and inducing ornithine production(by arginase) and subsequent polyamine biosynthesis11. Ornithinedecarboxylase (ODC) catalyses putrescine synthesis from ornithine,and is considered as the limiting step in the polyamine biosyntheticpathway, leading to spermidine and spermine production12.Although ODC activity has not been identi®ed in T. cruzi, intra-and extracellular forms of T. cruzi synthesize polyamines eitherthrough the alternative agmatine pathway13 or by using exogenouslyadded putrescine14. To investigate the possibility that macrophageputrescine synthesis is involved in the apoptotic cell effects that weobserved, putrescine content and ODC activity were measured inmacrophages treated with apoptotic cells. Macrophages treated withapoptotic cells markedly accumulated putrescine (Fig. 3f, left), andexogenous addition of putrescine alone increased parasite replica-tion in macrophages (Fig. 3f, right). ODC activity was markedlyupregulated in macrophages exposed to apoptotic cells or toimmobilized anti-av monoclonal antibody, with delayed kinetics
a
Controlαν
100 101
Cou
nts
0
100
102 103 104
b
Control β3
100 101
Cou
nts
0
100
102 103 104
Infectedαν
100 101
Cou
nts
0
100
102 103 104
Infectedβ3
100 101
Cou
nts
0
100
102 103 104
ControlmAb
60
50
40
30
20
10
0ControlFab-1
Anti-ανmAb
% in
hib
ition
of a
dhe
sion
Anti-ανFab
Anti-β3mAb
c
-
15
10
5
0ControlmAb
Day 7Day 10
Par
asite
s p
er m
l (×
10–4
)
Anti-β3mAb
Anti-ανmAb
d
-
15
10
5
0Fab-1
NoneApo-1
Par
asite
s p
er m
l (×
10–4
)
Anti-ανFab
Fab-2
3025
2015
10
5
0–5P
aras
ites
per
ml (
× 10
–3)
e f
- Fab-1
NoneGαH
Anti-ανFab
Fab-2
Figure 2 Effects of apoptotic cells on macrophages infected with T. cruzi are mediated by
the vitronectin receptor. av (a) and b3 (b) VnR chains are expressed by macrophages from
infected (lower panels), but not uninfected (upper panels), mice. Mac-1+ cells were gated
and analysed for av (a) or b3 (b) expression. Bold lines, anti-av (a) or anti-b3 (b) staining;
dotted lines; cells stained after treatment with unlabelled anti-av (a) or anti-b3 (b)
monoclonal antibodies; dashed lines, unstained cells. c, Anti-VnR monoclonal antibodies
and Fab inhibit apoptotic cell binding to macrophages. Macrophages infected in vivo were
treated with anti-av Fab or control anti-CD69 Fab-1, anti-av, anti-b3 or control hamster
IgG monoclonal antibodies (mAb) (20 min), and then exposed to Apo-1. Adhesion was
determined after 3 h. d, e, Anti-av or anti-b3, but not control monoclonal antibody drives
T. cruzi replication within macrophages. Macrophages infected in vivo were treated with
monoclonal antibodies (d) or were treated ®rst with anti-av Fab, Fab-1 or control hamster
IgG Fab-2 (50 mg ml-1) for 20 min, washed and treated with goat anti-hamster IgG
antibody (GaH) at 10 mg ml-1 (e). Parasites were counted as indicated (d) or after 10 days
(e). f, Anti-av Fab inhibits the apoptotic cell effects on T. cruzi replication. Macrophages
infected in vivo were treated ®rst with Fab fragments (20 min) and then with Apo-1.
Parasites were counted 10 days later.
© 2000 Macmillan Magazines Ltd
letters to nature
NATURE | VOL 403 | 13 JANUARY 2000 | www.nature.com 201
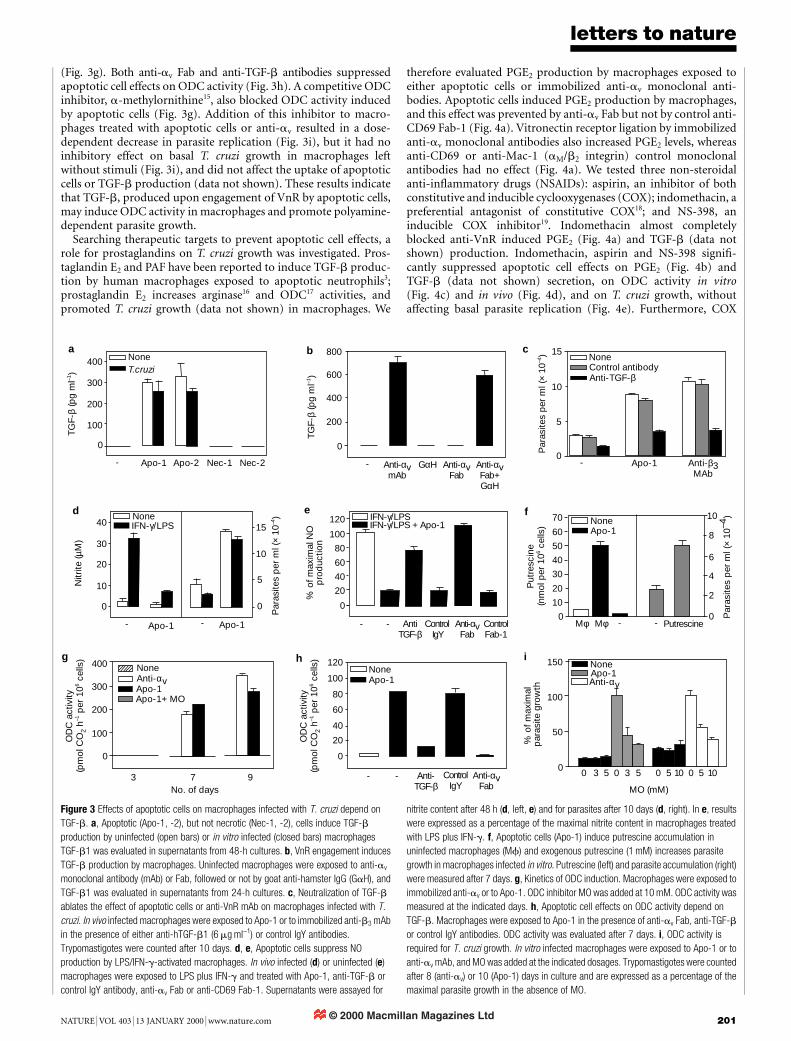
(Fig. 3g). Both anti-av Fab and anti-TGF-b antibodies suppressedapoptotic cell effects on ODC activity (Fig. 3h). A competitive ODCinhibitor, a-methylornithine15, also blocked ODC activity inducedby apoptotic cells (Fig. 3g). Addition of this inhibitor to macro-phages treated with apoptotic cells or anti-av resulted in a dose-dependent decrease in parasite replication (Fig. 3i), but it had noinhibitory effect on basal T. cruzi growth in macrophages leftwithout stimuli (Fig. 3i), and did not affect the uptake of apoptoticcells or TGF-b production (data not shown). These results indicatethat TGF-b, produced upon engagement of VnR by apoptotic cells,may induce ODC activity in macrophages and promote polyamine-dependent parasite growth.
Searching therapeutic targets to prevent apoptotic cell effects, arole for prostaglandins on T. cruzi growth was investigated. Pros-taglandin E2 and PAF have been reported to induce TGF-b produc-tion by human macrophages exposed to apoptotic neutrophils3;prostaglandin E2 increases arginase16 and ODC17 activities, andpromoted T. cruzi growth (data not shown) in macrophages. We
therefore evaluated PGE2 production by macrophages exposed toeither apoptotic cells or immobilized anti-av monoclonal anti-bodies. Apoptotic cells induced PGE2 production by macrophages,and this effect was prevented by anti-av Fab but not by control anti-CD69 Fab-1 (Fig. 4a). Vitronectin receptor ligation by immobilizedanti-av monoclonal antibodies also increased PGE2 levels, whereasanti-CD69 or anti-Mac-1 (aM/b2 integrin) control monoclonalantibodies had no effect (Fig. 4a). We tested three non-steroidalanti-in¯ammatory drugs (NSAIDs): aspirin, an inhibitor of bothconstitutive and inducible cyclooxygenases (COX); indomethacin, apreferential antagonist of constitutive COX18; and NS-398, aninducible COX inhibitor19. Indomethacin almost completelyblocked anti-VnR induced PGE2 (Fig. 4a) and TGF-b (data notshown) production. Indomethacin, aspirin and NS-398 signi®-cantly suppressed apoptotic cell effects on PGE2 (Fig. 4b) andTGF-b (data not shown) secretion, on ODC activity in vitro(Fig. 4c) and in vivo (Fig. 4d), and on T. cruzi growth, withoutaffecting basal parasite replication (Fig. 4e). Furthermore, COX
0
10
20
30
40
- Apo-1
NoneIFN-γ/LPS
- Apo-1
0
5
10
15
0
100
200
300
400 NoneT.cruzi
- Apo-1
TGF-
β (p
g m
l–1)
Apo-2 Nec-1 Nec-2
0
200
400
600
800a
g
0
100
200
300
400
3 7 9
Apo-1Anti-αv
Apo-1+ MO
None
No. of days
0
50
100
150Apo-1
Anti-αv
None
0 3 5 0 3 5 0 5 10 0 5 10
MO (mM)
0
5
10
15
0
20
40
60
80
100
120
Anti-αvFab
Anti-TGF-β
ControlIgY
Apo-1None
- -
0
10
20
30
40
50
60
70
-Mφ Mφ
Apo-1None
0
20
40
60
80
100
120
Anti-αvFab
ControlFab-1
- - AntiTGF-β
Control IgY
- Putrescine0
2
4
6
8
10
- Anti-αvmAb
TGF-
β (p
g m
l–1)
Anti-αvFab
GαH Anti-αvFab+GαH
bNoneControl antibodyAnti-TGF-β
-
Par
asite
s p
er m
l (×
10–4
)
Par
asite
s p
er m
l (×
10–4
)P
utre
scin
e(n
mol
per
106 c
ells
)
OD
C a
ctiv
ity(p
mol
CO
2 h–1
per
106 c
ells
)
Apo-1 Anti-β3MAb
c
h i
Nitr
ite (µ
M)
Par
asite
s p
er m
l (×
10–4
)dIFN-γ/LPSIFN-γ/LPS + Apo-1
% o
f max
imal
NO
pro
duc
tion
% o
f max
imal
p
aras
ite g
row
th
e f
OD
C a
ctiv
ity(p
mol
CO
2 h–1
per
106 c
ells
)
Figure 3 Effects of apoptotic cells on macrophages infected with T. cruzi depend on
TGF-b. a, Apoptotic (Apo-1, -2), but not necrotic (Nec-1, -2), cells induce TGF-b
production by uninfected (open bars) or in vitro infected (closed bars) macrophages
TGF-b1 was evaluated in supernatants from 48-h cultures. b, VnR engagement induces
TGF-b production by macrophages. Uninfected macrophages were exposed to anti-av
monoclonal antibody (mAb) or Fab, followed or not by goat anti-hamster IgG (GaH), and
TGF-b1 was evaluated in supernatants from 24-h cultures. c, Neutralization of TGF-b
ablates the effect of apoptotic cells or anti-VnR mAb on macrophages infected with T.
cruzi. In vivo infected macrophages were exposed to Apo-1 or to immobilized anti-b3 mAb
in the presence of either anti-hTGF-b1 (6 mg ml-1) or control IgY antibodies.
Trypomastigotes were counted after 10 days. d, e, Apoptotic cells suppress NO
production by LPS/IFN-g-activated macrophages. In vivo infected (d) or uninfected (e)
macrophages were exposed to LPS plus IFN-g and treated with Apo-1, anti-TGF-b or
control IgY antibody, anti-av Fab or anti-CD69 Fab-1. Supernatants were assayed for
nitrite content after 48 h (d, left, e) and for parasites after 10 days (d, right). In e, results
were expressed as a percentage of the maximal nitrite content in macrophages treated
with LPS plus IFN-g. f, Apoptotic cells (Apo-1) induce putrescine accumulation in
uninfected macrophages (Mf) and exogenous putrescine (1 mM) increases parasite
growth in macrophages infected in vitro. Putrescine (left) and parasite accumulation (right)
were measured after 7 days. g, Kinetics of ODC induction. Macrophages were exposed to
immobilized anti-av or to Apo-1. ODC inhibitor MO was added at 10 mM. ODC activity was
measured at the indicated days. h, Apoptotic cell effects on ODC activity depend on
TGF-b. Macrophages were exposed to Apo-1 in the presence of anti-av Fab, anti-TGF-b
or control IgY antibodies. ODC activity was evaluated after 7 days. i, ODC activity is
required for T. cruzi growth. In vitro infected macrophages were exposed to Apo-1 or to
anti-av mAb, and MO was added at the indicated dosages. Trypomastigotes were counted
after 8 (anti-av) or 10 (Apo-1) days in culture and are expressed as a percentage of the
maximal parasite growth in the absence of MO.
© 2000 Macmillan Magazines Ltd
letters to nature
202 NATURE | VOL 403 | 13 JANUARY 2000 | www.nature.com
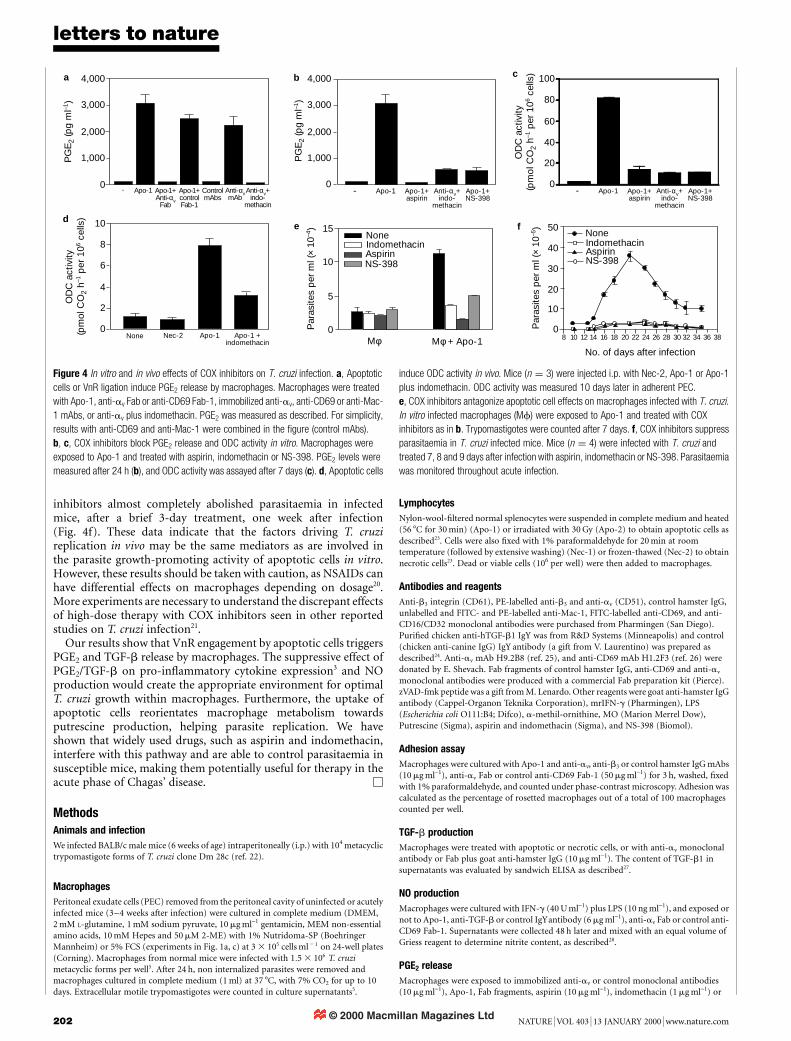
inhibitors almost completely abolished parasitaemia in infectedmice, after a brief 3-day treatment, one week after infection(Fig. 4f). These data indicate that the factors driving T. cruzireplication in vivo may be the same mediators as are involved inthe parasite growth-promoting activity of apoptotic cells in vitro.However, these results should be taken with caution, as NSAIDs canhave differential effects on macrophages depending on dosage20.More experiments are necessary to understand the discrepant effectsof high-dose therapy with COX inhibitors seen in other reportedstudies on T. cruzi infection21.
Our results show that VnR engagement by apoptotic cells triggersPGE2 and TGF-b release by macrophages. The suppressive effect ofPGE2/TGF-b on pro-in¯ammatory cytokine expression3 and NOproduction would create the appropriate environment for optimalT. cruzi growth within macrophages. Furthermore, the uptake ofapoptotic cells reorientates macrophage metabolism towardsputrescine production, helping parasite replication. We haveshown that widely used drugs, such as aspirin and indomethacin,interfere with this pathway and are able to control parasitaemia insusceptible mice, making them potentially useful for therapy in theacute phase of Chagas' disease. M
MethodsAnimals and infection
We infected BALB/c male mice (6 weeks of age) intraperitoneally (i.p.) with 104 metacyclictrypomastigote forms of T. cruzi clone Dm 28c (ref. 22).
Macrophages
Peritoneal exudate cells (PEC) removed from the peritoneal cavity of uninfected or acutelyinfected mice (3±4 weeks after infection) were cultured in complete medium (DMEM,2 mM L-glutamine, 1 mM sodium pyruvate, 10 mg ml-1 gentamicin, MEM non-essentialamino acids, 10 mM Hepes and 50 mM 2-ME) with 1% Nutridoma-SP (BoehringerMannheim) or 5% FCS (experiments in Fig. 1a, c) at 3 3 105 cells ml 2 1 on 24-well plates(Corning). Macrophages from normal mice were infected with 1:5 3 106 T. cruzimetacyclic forms per well5. After 24 h, non internalized parasites were removed andmacrophages cultured in complete medium (1 ml) at 37 8C, with 7% CO2 for up to 10days. Extracellular motile trypomastigotes were counted in culture supernatants5.
Lymphocytes
Nylon-wool-®ltered normal splenocytes were suspended in complete medium and heated(56 8C for 30 min) (Apo-1) or irradiated with 30 Gy (Apo-2) to obtain apoptotic cells asdescribed23. Cells were also ®xed with 1% paraformaldehyde for 20 min at roomtemperature (followed by extensive washing) (Nec-1) or frozen-thawed (Nec-2) to obtainnecrotic cells23. Dead or viable cells (106 per well) were then added to macrophages.
Antibodies and reagents
Anti-b3 integrin (CD61), PE-labelled anti-b3 and anti-av (CD51), control hamster IgG,unlabelled and FITC- and PE-labelled anti-Mac-1, FITC-labelled anti-CD69, and anti-CD16/CD32 monoclonal antibodies were purchased from Pharmingen (San Diego).Puri®ed chicken anti-hTGF-b1 IgY was from R&D Systems (Minneapolis) and control(chicken anti-canine IgG) IgY antibody (a gift from V. Laurentino) was prepared asdescribed24. Anti-av mAb H9.2B8 (ref. 25), and anti-CD69 mAb H1.2F3 (ref. 26) weredonated by E. Shevach. Fab fragments of control hamster IgG, anti-CD69 and anti-av
monoclonal antibodies were produced with a commercial Fab preparation kit (Pierce).zVAD-fmk peptide was a gift from M. Lenardo. Other reagents were goat anti-hamster IgGantibody (Cappel-Organon Teknika Corporation), mrIFN-g (Pharmingen), LPS(Escherichia coli O111:B4; Difco), a-methil-ornithine, MO (Marion Merrel Dow),Putrescine (Sigma), aspirin and indomethacin (Sigma), and NS-398 (Biomol).
Adhesion assay
Macrophages were cultured with Apo-1 and anti-av, anti-b3 or control hamster IgG mAbs(10 mg ml-1), anti-av Fab or control anti-CD69 Fab-1 (50 mg ml-1) for 3 h, washed, ®xedwith 1% paraformaldehyde, and counted under phase-contrast microscopy. Adhesion wascalculated as the percentage of rosetted macrophages out of a total of 100 macrophagescounted per well.
TGF-b production
Macrophages were treated with apoptotic or necrotic cells, or with anti-av monoclonalantibody or Fab plus goat anti-hamster IgG (10 mg ml-1). The content of TGF-b1 insupernatants was evaluated by sandwich ELISA as described27.
NO production
Macrophages were cultured with IFN-g (40 U ml-1) plus LPS (10 ng ml-1), and exposed ornot to Apo-1, anti-TGF-b or control IgYantibody (6 mg ml-1), anti-av Fab or control anti-CD69 Fab-1. Supernatants were collected 48 h later and mixed with an equal volume ofGriess reagent to determine nitrite content, as described28.
PGE2 release
Macrophages were exposed to immobilized anti-av or control monoclonal antibodies(10 mg ml-1), Apo-1, Fab fragments, aspirin (10 mg ml-1), indomethacin (1 mg ml-1) or
0
20
40
60
80
100
0
2
4
6
8
10
0
1,000PG
E2
(pg
ml–1
)
2,000
3,000
4,000
- Apo-1+Anti-αv
Fab
Apo-1 Anti-αvmAb
Apo-1+controlFab-1
ControlmAbs
Anti-αv+indo-
methacin
PG
E2
(pg
ml–1
)
Apo-1+aspirin
Apo-1 Apo-1+NS-398
Anti-αv+indo-
methacin
0
1,000
2,000
3,000
4,000
-
a b c
de f
No. of days after infection
8 10 12 14 16 18 20 22 24 26 28 30 32 34 36 380
10
20
30
40
50
IndomethacinAspirin
None
NS-398
0
5
10
15
Mφ Mφ + Apo-1
NoneIndomethacinAspirinNS-398
Par
asite
s p
er m
l (×
10–4
)
Par
asite
s p
er m
l (×
10–5
)
OD
C a
ctiv
ity(p
mol
CO
2 h–1
per
106
cells
)
Apo-1+aspirin
Apo-1 Apo-1+NS-398
Anti-αv+indo-
methacin
-
OD
C a
ctiv
ity(p
mol
CO
2 h–1
per
106
cells
)
Nec-2 Apo-1 Apo-1 +indomethacin
None
Figure 4 In vitro and in vivo effects of COX inhibitors on T. cruzi infection. a, Apoptotic
cells or VnR ligation induce PGE2 release by macrophages. Macrophages were treated
with Apo-1, anti-av Fab or anti-CD69 Fab-1, immobilized anti-av, anti-CD69 or anti-Mac-
1 mAbs, or anti-av plus indomethacin. PGE2 was measured as described. For simplicity,
results with anti-CD69 and anti-Mac-1 were combined in the ®gure (control mAbs).
b, c, COX inhibitors block PGE2 release and ODC activity in vitro. Macrophages were
exposed to Apo-1 and treated with aspirin, indomethacin or NS-398. PGE2 levels were
measured after 24 h (b), and ODC activity was assayed after 7 days (c). d, Apoptotic cells
induce ODC activity in vivo. Mice (n � 3) were injected i.p. with Nec-2, Apo-1 or Apo-1
plus indomethacin. ODC activity was measured 10 days later in adherent PEC.
e, COX inhibitors antagonize apoptotic cell effects on macrophages infected with T. cruzi.
In vitro infected macrophages (Mf) were exposed to Apo-1 and treated with COX
inhibitors as in b. Trypomastigotes were counted after 7 days. f, COX inhibitors suppress
parasitaemia in T. cruzi infected mice. Mice (n � 4) were infected with T. cruzi and
treated 7, 8 and 9 days after infection with aspirin, indomethacin or NS-398. Parasitaemia
was monitored throughout acute infection.
© 2000 Macmillan Magazines Ltd
letters to nature
NATURE | VOL 403 | 13 JANUARY 2000 | www.nature.com 203
NS-398 (1 mM). Culture supernatants (24 h) were collected and assayed for PGE2 using acompetitive ELISA kit (Cayman Chemicals).
ODC activity and putrescine content
Macrophages were cultured (106 per ml) with Apo-1 (3 3 106 per well), anti-av mono-clonal antibody, MO or other reagents. Ornithine decarboxydase activity and putrescinecontent were evaluated as described29.
Flow cytometry
Peritoneal exudate cells (PEC) were treated with Fc block (anti-CD16/CD32) and stainedwith FITC-labelled anti-Mac-1 plus PE-labelled anti-av or anti-b3 monoclonal antibodies.Unlabelled anti-av or anti-b3 monoclonal antibodies were used to block stainingspeci®cally. Uninfected macrophages were also cultured for 24 h, detached and stained.Antibodies were used at 1 mg per 106 cells. 104 cells were acquired, and Mac-1-positive cellswere gated and analysed for either av or b3 expression on a B-D Xcalibur ¯ow cytometer.
In vivo experiments
Infected mice (n � 4) were injected i.p. with 107 Apo-1 or Nec-2, 7 days after infection, orleft without treatment. Parasitaemia was determined on blood samples from the tail. Inother experiments, infected mice (n � 4) were injected i.p. at 7, 8 and 9 days afterinfection, with aspirin (50 mg kg-1), indomethacin (1 mg kg-1) or NS-398 (5 mg kg-1), orleft untreated, and parasitaemia was followed. For ex-vivo determination of ODC activity,mice (n � 3) were injected i.p. with 107 Apo-1 or Nec-2, or left without treatment. Miceinjected with Apo-1 were untreated or treated with indomethacin (1 mg kg-1) in the sameday, and 4 days later. ODC activity was measured in adherent PEC (106 per well) 10 dayslater.
Presentation of results and statistics
Each experiment presented is representative of at least three independent experiments.Data are expressed as mean 6 s:e: of duplicate determinations. For in vivo experiments,results are expressed as mean 6 s:e: of individual animals. Signi®cance was evaluated byStudent's unpaired t-test, and all positive results mentioned were signi®cant (P , 0:05 or,0.01) compared with controls.
Received 13 September; accepted 5 November 1999.
1. Savill, J. Apoptosis: Phagocytic docking without shocking. Nature 392, 442±443 (1998).
2. Voll, R. E., Herrmann, M., Roth, E. A., Stach, C. & Kalden, J. R. Immunosuppressive effects of
apoptotic cells. Nature 390, 350±351 (1997).
3. Fadok, V. A. et al. Macrophages that have ingested apoptotic cells in vitro inhibit proin¯ammatory
cytokine production through autocrine/paracrine mechanisms involving TGF-b, PGE2 and PAF. J.
Clin. Invest. 101, 890±898 (1998).
4. Lopes, M. F., Veiga, V. F., Santos, A. R., Fonseca, M. E. F. & DosReis, G. A. Activation-induced CD4+ T
cell death by apoptosis in experimental Chagas disease. J. Immunol. 154, 744±752 (1995).
5. Nunes, M. P., Andrade, R. M., Lopes, M. F. & DosReis, G. A. Activation-induced T cell death
exacerbates Trypanosoma cruzi replication in macrophages cocultured with CD4+ T lymphocytes
from infected hosts. J. Immunol. 160, 1313±1319 (1998).
6. Savill, J., Drans®eld, I., Hogg, N. & Haslett, C. Vitronectin receptor-mediated phagocytosis of cells
undergoing apoptosis. Nature 343, 170±173 (1990).
7. Savill, J., Hogg, N., Ren, Y. & Haslett, C. Thrombospondin cooperates with CD36 and the vitronectin
receptor in macrophage recognition of neutrophils undergoing apoptosis. J. Clin. Invest. 90, 1513±
1522 (1992).
8. Silva, J. S., Twardzik, D. R. & Reed, S. G. Regulation of Trypanosoma cruzi infection in vitro and in vivo
by transforming growth factor b (TGF-b). J. Exp. Med. 174, 539±545 (1991).
9. Ming, M., Ewen, M. E. & Pereira, M. E. A. Trypanosome invasion of mammalian cells requires
activation of the TGF-b signaling pathway. Cell 82, 287±296 (1995).
10. Gazzinelli, R. T., Oswald, I. P., Hieny, S., James, S. L. & Sher, A. The microbicidal activity of interferon-
g-treated macrophages against Trypanosoma cruzi involves an L-arginine-dependent, nitrogen oxide-
mediated mechanism inhibitable by interleukin-10 and transforming growth factor-b. Eur. J.
Immunol. 22, 2501±2506 (1992).
11. Boutard, V. et al. Transforming growth factor-b stimulates arginase activity in macrophages:
implications for the regulation of macrophage cytoxocity. J. Immunol. 155, 2077±2084 (1995).
12. Pegg, A. E. & McCann, P. P. Polyamine metabolism and function. Am. J. Physiol. 243, C212±221
(1982).
13. Kierszembaum, F., Wirth, J. J., McCann, P. P. & Sjoerdsma, A. Arginine decarboxylase inhibitors
reduce the capacity of Trypanosoma cruzi to infect and multiply in mammalian host cells. Proc. Natl
Acad. Sci. USA 84, 4278±4282 (1987).
14. Hunter, K. J., Le Quesne, S. A. & Fairlamb, A. H. Identi®cation and biosynthesis of N1,N9-
bis(glutathionyl)aminopropylcadaverine (homotrypanothione) in Trypanosoma cruzi. Eur. J. Bio-
chem. 226, 1019±1027 (1994).
15. Mamont, P. S. et al. a-Methyl ornithine, a potent competitive inhibitor of ornithine decarboxylase,
blocks proliferation of rat hepatoma cells in culture. Proc. Natl Acad. Sci. USA 73, 1626±1630 (1976).
16. Corraliza, I. M., Modolell, M., Ferber, E. & Soler, G. Involvement of protein kinase A in the induction
of arginase in murine bone marrow-derived macrophages. Biochim. Biophys. Acta 1334, 123±128
(1997).
17. Prosser, F. H. & Wahl, L. M. Involvement of the ornithine decarboxylase pathway in macrophage
collagenase production. Arch. Biochem. Biophys. 260, 218±225 (1998).
18. Meade, E. A., Smith, W. L. & DeWitt, D. L. Differential inhibition of prostaglandin endoperoxide
synthase (cyclooxygenase) isozymes by aspirin and other non-steroidal anti-in¯ammatory drugs. J.
Biol. Chem. 268, 6610±6614 (1993).
19. Futaki, N. et al. Selective inhibition of NS-398 on prostanoid production in in¯amed tissue in rat
carrageenan-air-pouch in¯ammation. J. Pharm. Pharmacol. 45, 753±755 (1993).
20. Jiang, C., Ting, A. T. & Seed, B. PPAR-g agonists inhibit production of monocyte in¯ammatory
cytokines. Nature 391, 82±85 (1998).
21. Celentano, A. M. et al. PGE2 involvement in experimental infection with Trypanosoma cruzi
subpopulations. Prostaglandins 49, 141±153 (1995).
22. Contreras, V. T., Salles, J. M., Thomas, N., Morel, C. M. & Goldenberg, S. In vitro differentiation of
Trypanosoma cruzi under chemically de®ned conditions. Mol. Biochem. Parasitol. 16, 315±327 (1985).
23. Grif®th, T. S., Yu, X., Herndon, J. M., Green, D. R. & Ferguson, T. A. CD95-induced apoptosis of
lymphocytes in an immune privileged site induces immunological tolerance. Immunity 5, 7±16
(1996).
24. Sturmer, A. M., Driscoll, D. P. & Jackson-Matthews, D. E. A quantitative immunoassay using chicken
antibodies for detection of native and recombinant a-amidating enzyme. J. Immunol. Methods 146,
105±110 (1992).
25. Max®eld, S. R. et al. Murine T cells express a cell surface receptor for multiple extracellular matrix
proteins. Identi®cation and characterization with monoclonal antibodies. J. Exp. Med. 169, 2173±
2190 (1989).
26. Yokoyama, W. M. et al. Characterization of a cell surface-expressed disul®de-linked dimer involved in
murine T cell activation. J. Immunol. 141, 369±376 (1988).
27. Soares, M. B. P., David, J. R. & Titus, R. G. An in vitro model for infection with Leishmania major that
mimics the immune response in mice. Infect. Immun. 65, 2837±2845 (1997).
28. Green, L. C. et al. Analysis of nitrate, nitrite and [15N] nitrate in biological ¯uids. Anal. Biochem. 126,
131±138 (1982).
29. De Mello, F. G., Bachrach, U. & Nirenberg, M. Ornithine and glutamic acid decarboxylase activities in
the developing chick retina. J. Neurochem. 27, 847±851 (1976).
Acknowledgement
We thank E. M. Shevach, M. Lenardo and V. Laurentino for the gifts of peptides andantibodies; and M. A. Vannier dos Santos for reading the manuscript and for helpfuldiscussions. This work was supported by CNPq, FAPERJ, FUJB-UFRJ and PRONEX.C.F.L. is a doctoral fellow of Institute of Microbiology (UFRJ).
Correspondence and request for materials should be addressed to M.F.L.(e-mail: [email protected]) or to G.A.D.R. (e-mail: [email protected]).
.................................................................The major protein import receptorof plastids is essentialfor chloroplast biogenesisJoÈrg Bauer*², Kunhua Chen²³, Andreas Hiltbunner*², Ernst Wehrli§,Monika Eugster*, Danny Schnell³ & Felix Kessler*
* Institute of Plant Sciences, Swiss Federal Institute of Technology,UniversitaÈtstrasse 2, CH-8092 ZuÈrich, Switzerland³ Department of Biological Sciences, Rutgers, The State University of New Jersey,
101 Warren Street, Newark, New Jersey 07102, USA§ Laboratory for Electronmicroscopy I, Institute of Biochemistry, Swiss Federal
Institue of Technology, Schmelzbergstrasse 7, CH-8092 ZuÈrich, Switzerland² These authors contributed equally to this work
..............................................................................................................................................
Light triggers the developmental programme in plants that leadsto the production of photosynthetically active chloroplasts fromnon-photosynthetic proplastids1. During this chloroplast biogen-esis, the photosynthetic apparatus is rapidly assembled, mostlyfrom nuclear-encoded imported proteins2±4, which are synthe-sized in the cytosol as precursors with cleavable amino-terminaltargeting sequences called transit sequences. Protein transloconcomplexes at the outer (Toc complex)5±7 and inner (Ticcomplex)6,8,9 envelope membranes recognize these transitsequences, leading to the precursors being imported. The Toccomplex in the pea consists of three major components, Toc75,Toc34 and Toc159 (formerly termed Toc86)6,7,10,11. Toc159, which isan integral membrane GTPase12, functions as a transit-sequencereceptor5±7,13. Here we show that Arabidopsis thaliana Toc159(atToc159) is essential for the biogenesis of chloroplasts. In anArabidopsis mutant (ppi2) that lacks atToc159, photosyntheticproteins that are normally abundant are transcriptionallyrepressed, and are found in much smaller amounts in the plastids,although ppi2 does not affect either the expression or the import
NATURE | VOL 403 | 24 FEBRUARY 2000 | www.nature.com 867
letters to nature
.................................................................Formation of molecular gasin the tidal debris ofviolent galaxy±galaxy interactionsJonathan Braine*, Ute Lisenfeld², Pierre-Alain Due³ & SteÂphane Leon§
* Observatoire de Bordeaux, UMR 5804, CNRS/INSU, BP89, F-33270 Floirac,
France² Institut de Radioastronomie MillimeÂtrique, Avenida Divina Postora 7,NC18012 Granada, Spain³ Institute of Astronomy, Madingley Road, Cambridge CB3 0HA, UK and CNRS
and CEA/DSM/DAPNIA Service d'astrophysique, Saclay, 91191 Gif sur Yvette
cedex, France§ ASIAA, Academia Sinica, PO Box 1-87, Nanking, Taipei 115, Taiwan
..............................................................................................................................................
In many gravitational interactions between galaxies, gas and starsthat have been torn from the precursor galaxies can collect in tidal`tails'. Star formation begins anew in some of these regions,producing tidal dwarf galaxies1±4. Observations of these newgalaxies provides insight into processes relevant to galaxy forma-tion more generally, because the timescale of the interaction iswell de®ned. But tracking the star formation process has hithertobeen dif®cult because the tidal dwarf galaxies with young starsshowed no evidence of the molecular gas out of which those youngstars formed5±8. Here we report the discovery of molecularhydrogen (traced by carbon monoxide emission) in two tidal
dwarf galaxies. In both cases, the concentration of molecular gaspeaks at the same location as the maximum in atomic-hydrogendensity, unlike the situation in most gas-rich galaxies. We inferfrom this that the molecular gas formed from the atomic hydro-gen, rather than being torn in molecular form from the interact-ing galaxies. Star formation in the tidal dwarf galaxies thereforeappears to mimic the process in normal spiral galaxies like ourown.
Tidal dwarf galaxies (TDGs) are gas-rich irregular galaxies madeout of stellar and gaseous material pulled out by tidal forces from thedisks of the colliding parent galaxies into the intergalacticmedium9±12. They are found at the ends of long tidal tails, some-times 100 kpc from the nuclei of their progenitors, and host activestar-forming regions. TDGs contain two main stellar components:young stars recently formed by collapse of expelled atomic hydrogen(H I) clouds, and an older stellar population, at least 1 Gyr old,originally part of the disk of the parent galaxies. Their overallgaseous and stellar properties range between those of classicaldwarf irregular galaxies and blue compact dwarf galaxies, with theexception of their metallicity which is higherÐtypical of the outerdisk of a spiral galaxy12. Whether a large fraction of dwarf galaxieswere formed through tidal encounters in the early UniverseÐwhenspiral galaxies were more gaseous and less metal-rich, and collisionsmore frequentÐis an open question, and one of the reasons tostudy TDGs. One way to answer this question is the dark-mattercontent of dwarf galaxies. Observations of ordinary dwarf galaxiesshow that a lot of dark matter, or mass that is in some as yet invisibleform, is necessary to account for their rotation velocities. Numericalsimulations of gravitational interactions indicate that TDGsshould have very little dark matter13 if the dark matter is, ascurrently believed, in the form of a large halo and not in, say, a
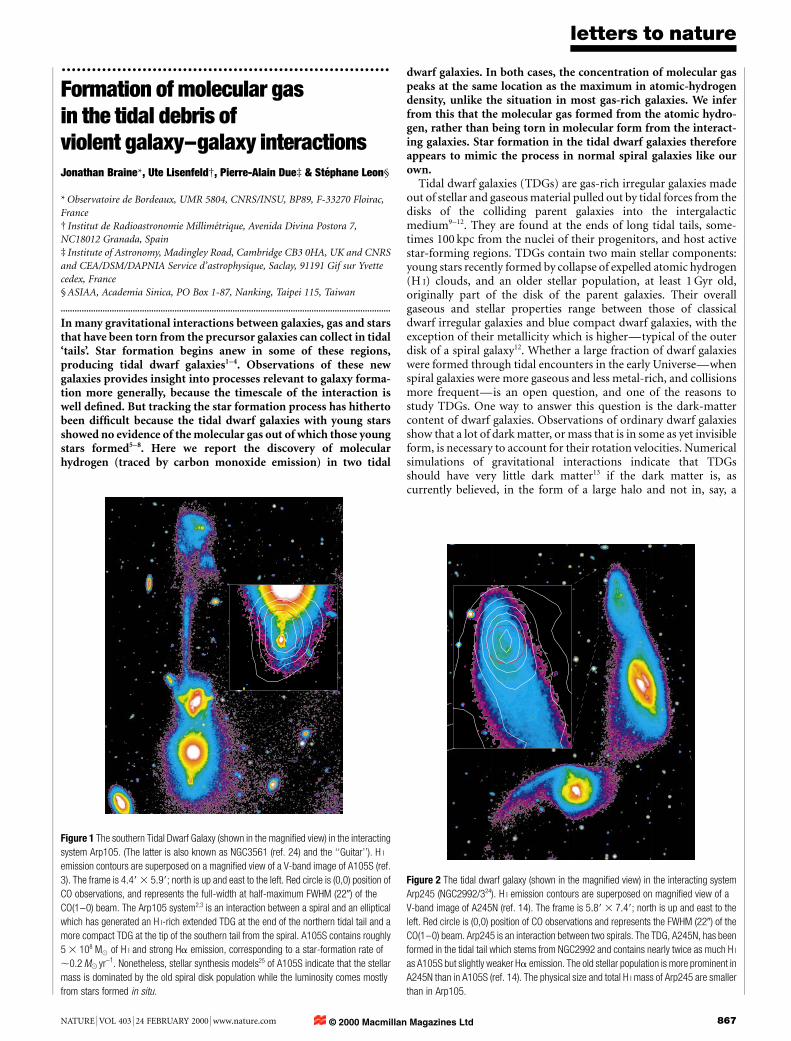
Figure 1 The southern Tidal Dwarf Galaxy (shown in the magni®ed view) in the interacting
system Arp105. (The latter is also known as NGC3561 (ref. 24) and the ``Guitar''). H I
emission contours are superposed on a magni®ed view of a V-band image of A105S (ref.
3). The frame is 4:49 3 5:99; north is up and east to the left. Red circle is (0,0) position of
CO observations, and represents the full-width at half-maximum FWHM (220) of the
CO(1±0) beam. The Arp105 system2,3 is an interaction between a spiral and an elliptical
which has generated an H I-rich extended TDG at the end of the northern tidal tail and a
more compact TDG at the tip of the southern tail from the spiral. A105S contains roughly
5 3 108 M( of H I and strong Ha emission, corresponding to a star-formation rate of
,0.2 M( yr-1. Nonetheless, stellar synthesis models25 of A105S indicate that the stellar
mass is dominated by the old spiral disk population while the luminosity comes mostly
from stars formed in situ.
Figure 2 The tidal dwarf galaxy (shown in the magni®ed view) in the interacting system
Arp245 (NGC2992/324). H I emission contours are superposed on magni®ed view of a
V-band image of A245N (ref. 14). The frame is 5:89 3 7:49; north is up and east to the
left. Red circle is (0,0) position of CO observations and represents the FWHM (220) of the
CO(1±0) beam. Arp245 is an interaction between two spirals. The TDG, A245N, has been
formed in the tidal tail which stems from NGC2992 and contains nearly twice as much H I
as A105S but slightly weaker Ha emission. The old stellar population is more prominent in
A245N than in A105S (ref. 14). The physical size and total H I mass of Arp245 are smaller
than in Arp105.
© 2000 Macmillan Magazines Ltd
rotating disk. Thus, if TDGs are found to possess the same dark-matter properties as other dwarf galaxies, then powerful constraintsare placed on the form of dark matter. If, on the other hand, TDGsdo not contain such dark matter, then tidal interactions cannot bethe principal formation mechanism for these small galaxies, nor candark matter be part of galactic disks.
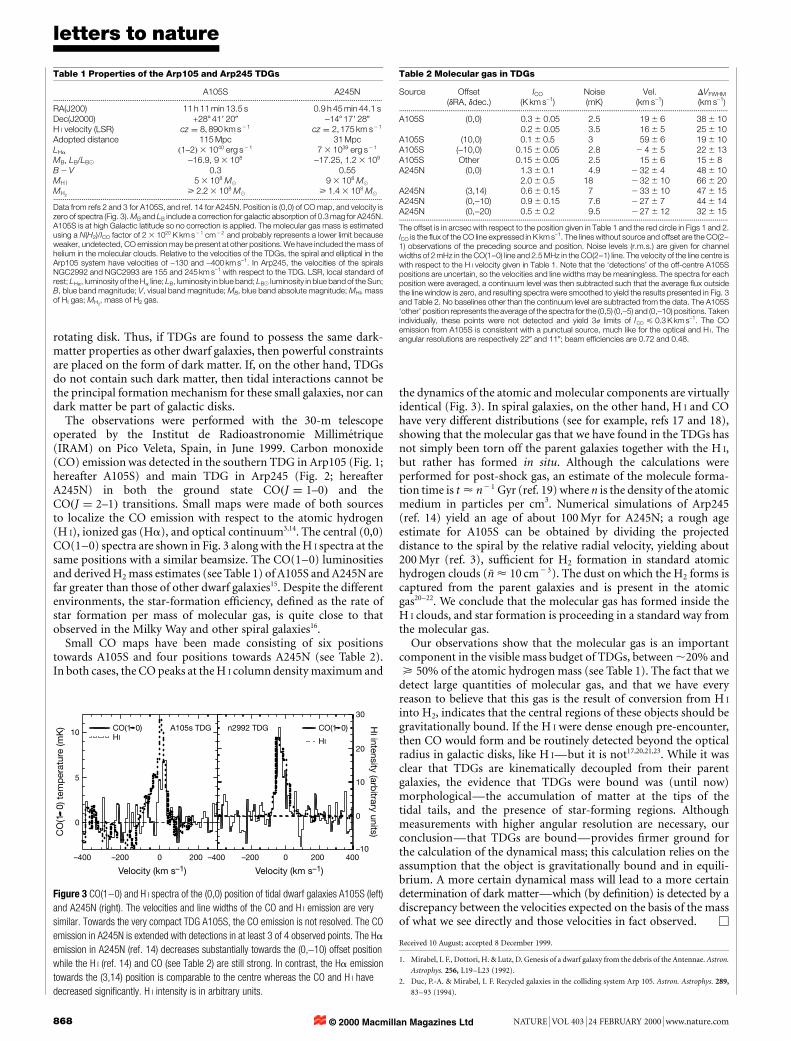
The observations were performed with the 30-m telescopeoperated by the Institut de Radioastronomie MillimeÂtrique(IRAM) on Pico Veleta, Spain, in June 1999. Carbon monoxide(CO) emission was detected in the southern TDG in Arp105 (Fig. 1;hereafter A105S) and main TDG in Arp245 (Fig. 2; hereafterA245N) in both the ground state CO�J � 1±0� and theCO�J � 2±1� transitions. Small maps were made of both sourcesto localize the CO emission with respect to the atomic hydrogen(H I), ionized gas (Ha), and optical continuum3,14. The central (0,0)CO(1±0) spectra are shown in Fig. 3 along with the H I spectra at thesame positions with a similar beamsize. The CO(1±0) luminositiesand derived H2 mass estimates (see Table 1) of A105S and A245N arefar greater than those of other dwarf galaxies15. Despite the differentenvironments, the star-formation ef®ciency, de®ned as the rate ofstar formation per mass of molecular gas, is quite close to thatobserved in the Milky Way and other spiral galaxies16.
Small CO maps have been made consisting of six positionstowards A105S and four positions towards A245N (see Table 2).In both cases, the CO peaks at the H I column density maximum and
the dynamics of the atomic and molecular components are virtuallyidentical (Fig. 3). In spiral galaxies, on the other hand, H I and COhave very different distributions (see for example, refs 17 and 18),showing that the molecular gas that we have found in the TDGs hasnot simply been torn off the parent galaxies together with the H I,but rather has formed in situ. Although the calculations wereperformed for post-shock gas, an estimate of the molecule forma-tion time is t < n 2 1 Gyr (ref. 19) where n is the density of the atomicmedium in particles per cm3. Numerical simulations of Arp245(ref. 14) yield an age of about 100 Myr for A245N; a rough ageestimate for A105S can be obtained by dividing the projecteddistance to the spiral by the relative radial velocity, yielding about200 Myr (ref. 3), suf®cient for H2 formation in standard atomichydrogen clouds (Ån < 10 cm 2 3). The dust on which the H2 forms iscaptured from the parent galaxies and is present in the atomicgas20±22. We conclude that the molecular gas has formed inside theH I clouds, and star formation is proceeding in a standard way fromthe molecular gas.
Our observations show that the molecular gas is an importantcomponent in the visible mass budget of TDGs, between ,20% and) 50% of the atomic hydrogen mass (see Table 1). The fact that we
detect large quantities of molecular gas, and that we have everyreason to believe that this gas is the result of conversion from H I
into H2, indicates that the central regions of these objects should begravitationally bound. If the H I were dense enough pre-encounter,then CO would form and be routinely detected beyond the opticalradius in galactic disks, like H IÐbut it is not17,20,21,23. While it wasclear that TDGs are kinematically decoupled from their parentgalaxies, the evidence that TDGs were bound was (until now)morphologicalÐthe accumulation of matter at the tips of thetidal tails, and the presence of star-forming regions. Althoughmeasurements with higher angular resolution are necessary, ourconclusionÐthat TDGs are boundÐprovides ®rmer ground forthe calculation of the dynamical mass; this calculation relies on theassumption that the object is gravitationally bound and in equili-brium. A more certain dynamical mass will lead to a more certaindetermination of dark matterÐwhich (by de®nition) is detected by adiscrepancy between the velocities expected on the basis of the massof what we see directly and those velocities in fact observed. M
Received 10 August; accepted 8 December 1999.
1. Mirabel, I. F., Dottori, H. & Lutz, D. Genesis of a dwarf galaxy from the debris of the Antennae. Astron.
Astrophys. 256, L19±L23 (1992).
2. Duc, P.-A. & Mirabel, I. F. Recycled galaxies in the colliding system Arp 105. Astron. Astrophys. 289,
83±93 (1994).
letters to nature
868 NATURE | VOL 403 | 24 FEBRUARY 2000 | www.nature.com
10
5
0
–400 –200 0 200 –400 –200 0 200 400
30
20
10
–10
0
CO(1 0)HI
n2992 TDGA105s TDG CO(1 0)
HI
CO
(1 0
) tem
per
atur
e (m
K)
Velocity (km s–1) Velocity (km s–1)
HI intensity (arb
itrary units)
Figure 3 CO(1±0) and H I spectra of the (0,0) position of tidal dwarf galaxies A105S (left)
and A245N (right). The velocities and line widths of the CO and H I emission are very
similar. Towards the very compact TDG A105S, the CO emission is not resolved. The CO
emission in A245N is extended with detections in at least 3 of 4 observed points. The Ha
emission in A245N (ref. 14) decreases substantially towards the (0,-10) offset position
while the H I (ref. 14) and CO (see Table 2) are still strong. In contrast, the Ha emission
towards the (3,14) position is comparable to the centre whereas the CO and H I have
decreased signi®cantly. H I intensity is in arbitrary units.
Table 1 Properties of the Arp105 and Arp245 TDGs
A105S A245N.............................................................................................................................................................................
RA(J200) 11 h 11 min 13.5 s 0.9 h 45 min 44.1 sDec(J2000) +288 419 200 -148 179 280H I velocity (LSR) cz � 8; 890 km s2 1 cz � 2;175 km s2 1
Adopted distance 115 Mpc 31 MpcLHa �1±2� 3 1040 erg s2 1 7 3 1039 erg s2 1
MB, LB/LB( -16.9, 9 3 108 -17.25, 1:2 3 109
B 2 V 0.3 0.55MH I 5 3 108 M( 9 3 108 M(
MH2> 2:2 3 108 M( > 1:4 3 108 M(
.............................................................................................................................................................................
Data from refs 2 and 3 for A105S, and ref. 14 for A245N. Position is (0,0) of CO map, and velocity iszero of spectra (Fig. 3). MB and LB include a correction for galactic absorption of 0.3 mag for A245N.A105S is at high Galactic latitude so no correction is applied. The molecular gas mass is estimatedusing a N(H2)/ICO factor of 2 3 1020 K km s2 1 cm2 2 and probably represents a lower limit becauseweaker, undetected, CO emission may be present at other positions. We have included the mass ofhelium in the molecular clouds. Relative to the velocities of the TDGs, the spiral and elliptical in theArp105 system have velocities of -130 and -400 km s-1. In Arp245, the velocities of the spiralsNGC2992 and NGC2993 are 155 and 245 km s-1 with respect to the TDG. LSR, local standard ofrest; LHa, luminosity of the Ha line; LB, luminosity in blue band; LB( luminosity in blue band of the Sun;B, blue band magnitude; V, visual band magnitude; MB, blue band absolute magnitude; MHI, massof HI gas; MH2
, mass of H2 gas.
Table 2 Molecular gas in TDGs
Source Offset(dRA, ddec.)
ICO
(K km s-1)Noise(mK)
Vel.(km s-1)
DVFWHM
(km s-1).............................................................................................................................................................................
A105S (0,0) 0:3 6 0:05 2.5 19 6 6 38 6 100:2 6 0:05 3.5 16 6 5 25 6 10
A105S (10,0) 0:1 6 0:5 3 59 6 6 19 6 10A105S (-10,0) 0:15 6 0:05 2.8 2 4 6 5 22 6 13A105S Other 0:15 6 0:05 2.5 15 6 6 15 6 8A245N (0,0) 1:3 6 0:1 4.9 2 32 6 4 48 6 10
2:0 6 0:5 18 2 32 6 10 66 6 20A245N (3,14) 0:6 6 0:15 7 2 33 6 10 47 6 15A245N (0,-10) 0:9 6 0:15 7.6 2 27 6 7 44 6 14A245N (0,-20) 0:5 6 0:2 9.5 2 27 6 12 32 6 15.............................................................................................................................................................................The offset is in arcsec with respect to the position given in Table 1 and the red circle in Figs 1 and 2.ICO is the ¯ux of the CO line expressed in K km s-1. The lines without source and offset are the CO(2±1) observations of the preceding source and position. Noise levels (r.m.s.) are given for channelwidths of 2 mHz in the CO(1±0) line and 2.5 MHz in the CO(2±1) line. The velocity of the line centre iswith respect to the H I velocity given in Table 1. Note that the `detections' of the off-centre A105Spositions are uncertain, so the velocities and line widths may be meaningless. The spectra for eachposition were averaged, a continuum level was then subtracted such that the average ¯ux outsidethe line window is zero, and resulting spectra were smoothed to yield the results presented in Fig. 3and Table 2. No baselines other than the continuum level are subtracted from the data. The A105S`other' position represents the average of the spectra for the (0,5) (0,-5) and (0,-10) positions. Takenindividually, these points were not detected and yield 3j limits of ICO ( 0:3 K km s-1. The COemission from A105S is consistent with a punctual source, much like for the optical and H I. Theangular resolutions are respectively 220 and 110; beam ef®ciencies are 0.72 and 0.48.
© 2000 Macmillan Magazines Ltd
3. Duc, P.-A., Brinks, E., Wink, J. E. & Mirabel, I. F. Gas segregation in the interacting system Arp 105.
Astron. Astrophys. 326, 537±553 (1997).
4. Duc, P.-A. & Mirabel, I. G. Young tidal dwarf galaxies around the gas-rich disturbed lenticular NGC
5291. Astron. Astrophys. 333, 813±826 (1998).
5. Brouillet, N., Henkel, C. & Baudry, A. Detection of an intergalactic molecular complex? Astron.
Astrophys. 262, L5±L8 (1992).
6. Walter, F. & Heithausen, A. The discovery of a molecular complex in the tidal arms near NGC 3077.
Astrophys. J. 519, L69±L72 (1999).
7. Smith, B. J. & Higdon, J. L. A search for CO(1±0) emission from the tidal structures of interacting and
merging galaxies. Astron. J. 108, 837±843 (1994).
8. Smith, B. J., Struck, C., Kenney, J. D. P. & Jogee, S. The molecule-rich tail of the peculiar galaxy NGC
2782 (Arp 215). Astron. J. 117, 1237±1248 (1999).
9. Zwicky, F. Multiple galaxies. Ergenisse Exakten Naturwissenschaften 29, 344±385 (1956).
10. Schweizer, F. in Structure and Properties of Nearby Galaxies (eds Berkhuijsen, E. M. & Wielebinski, R.)
279±284 (Riedel, Dordrecht, 1978).
11. Hibbard, J. E. & van Gorkom, J. H. HI, HII, and R-Band observations of a galactic merger sequence.
Astron. J. 111, 655±695 (1996).
12. Duc, P.-A. & Mirabel, I. F. in Galaxy Interactions at Low and High Redshift (eds Barnes, J. & Sanders,
D.) 61±70 (IAU Symp. 186, Kluwer, Dordrecht, 1997).
13. Barnes, J. E. & Hernquist, L. Formation of dwarf galaxies in tidal tails. Nature 360, 715±717 (1992).
14. Duc, P.-A. et al. The interacting system NGC 2992/3 (Arp 245). Astron. J. (submitted).
15. Taylor, C. L., Kobulnicky, H. A. & Skillman, E. D. CO emission in low-luminosity, HI-rich galaxies.
Astron. J. 116, 2746±2756 (1998).
16. Kennicutt, R. C. Jr Star formation in galaxies along the Hubble sequence. Annu. Rev. Astron. Astrophys.
36, 189±232 (1998).
17. GueÂlin, M. et al. 1.3 mm emission in the disk of NGC 891: Evidence of cold dust. Astron. Astrophys.
279, L37±L40 (1993).
18. Braine, J., Combes, F. & Van Driel, W. NGC 4414: A ¯occulent galaxy with a high gas surface density.
Astron. Astrophys. 280, 451±467 (1993).
19. Hollenbach, D. & MCKee, C. F. Molecule formation and infrared emission in fast interstellar shocks.
IIIÐresults for J shocks in molecular clouds. Astrophys. J. 342, 306±336 (1989).
20. Neininger, N., GueÂlin, M., Garcia-Burillo, S., Zylka, R. & Wielebinski, R. Cold dust and molecular line
emission in NGC 4565. Astron. Astrophys. 310, 725±736 (1996).
21. Dumke, M. et al. the interstellar medium in the edge-on galaxy NGC 5907. Cold dust and molecular
line emission. Astron. Astrohys. 325, 124±134 (1997).
22. Braine, J. et al. Gas and dust in the active spiral galaxy NGC 3079. Astron. Astrophys. 326, 963±975
(1997).
23. Sage, L. J. The properties and origins of molecular gas in the lenticular galaxies NGC 404, 4710 and
5195. Astron. Astrophys. 239, 125±136 (1990).
24. Arp, H. Atlas of peculiar galaxies. Astrophys. J. Suppl. Ser. 14, 1±20 (1966).
25. Fritze-v.Alvensleben, U. & Duc, P.-A. in The Magellanic Clouds and other Dwarf Galaxies (eds Braun, J.
M. & Richtler, T.) 141±145 (Proceedings of the Workshop of the Graduiertenkolleg Bonn-Bochum,
Shaker, Aachen, 1998).
Correspondence and requests for materials should be addressed to J.B.(e-mail: [email protected]).
letters to nature
NATURE | VOL 403 | 24 FEBRUARY 2000 | www.nature.com 869
.................................................................Geometric quantum computationusing nuclear magnetic resonanceJonathan A. Jones*², Vlatko Vedral*, Artur Ekert*& Giuseppe Castagnoli³
* Centre for Quantum Computation, Clarendon Laboratory, Parks Road,
Oxford OX1 3PU, UK² Oxford Centre for Molecular Sciences, New Chemistry Laboratory,
South Parks Road, Oxford OX1 3QT, UK³ Elsag, Via Puccini 2, 1615 Genova, Italy
..............................................................................................................................................
A signi®cant development in computing has been the discovery1
that the computational power of quantum computers exceeds thatof Turing machines. Central to the experimental realization ofquantum information processing is the construction of fault-tolerant quantum logic gates. Their operation requires condi-tional quantum dynamics, in which one sub-system undergoes acoherent evolution that depends on the quantum state of anothersub-system2; in particular, the evolving sub-system may acquire aconditional phase shift. Although conventionally dynamic inorigin, phase shifts can also be geometric3,4. Conditional geo-metric (or `Berry') phases depend only on the geometry of thepath executed, and are therefore resilient to certain types oferrors; this suggests the possibility of an intrinsically fault-
tolerant way of performing quantum gate operations. Nuclearmagnetic resonance techniques have already been used to demon-strate both simple quantum information processing5±9 and geo-metric phase shifts10±12. Here we combine these ideas byperforming a nuclear magnetic resonance experiment in whicha conditional Berry phase is implemented, demonstrating acontrolled phase shift gate.
Any quantum computation can be built out of simple operationsinvolving only one or two quantum bits (qubits)13. A particularlysimple two-qubit gate in many experimental implementations, suchas nuclear magnetic resonance (NMR)14, is the controlled phaseshift. This may be achieved using a conditional Berry phase, andthus quantum geometrical phases can form the basis of quantumcomputation. We will use spin half nuclei as an example todemonstrate the feasibility of this approach, but the basic idea isgeneral. In our experiments the state of one spin determines theBerry phase acquired by the other spin.
Suppose that a spin half nucleus undergoes a conical evolutionwith cone angle v. Then the Berry phase is simply g � 6 1
2 �
6 p�1 2 cosv� where the 6 signs depend on whether the system isin the eigenstate aligned with or against the ®eld, and is the solidangle subtended by the conical circuit. We note that any deforma-tion of the path of the spin which preserves this solid angle leaves thephase unchanged. Thus the phase is not affected by the speed withwhich the path is traversed; nor is it very sensitive to random¯uctuations about the path.
Berry phases can be conveniently demonstrated in an NMRexperiment15 by working in a rotating frame. We consider anensemble of spin half particles in a magnetic ®eld, B0, alignedalong the z-axis; their precession frequency is then given by theLarmor frequency, q0. If the spins are irradiated by a circularlypolarized radio-frequency ®eld, B1, at a frequency qrf, the totalhamiltonian (neglecting relaxation) may be written in the rotatingframe as H � �q0 2 qrf �Iz � q1Ix, where, following conventionalNMR practice, the hamiltonian is described in product operatornotation16 and the ®eld strengths are written in terms of theircorresponding Larmor frequencies.
When jq1jp jq0 2 qrf j the hamiltonian lies close to the z-axis,while when jq1jq jq0 2 qrf j, the hamiltonian lies close to the x-axis. If radio-frequency radiation is applied far from resonance, thesystem is effectively quantized along the z-axis, and if the radiofrequency is swept towards resonance (qrf � q0), the effectivehamiltonian rotates from the z-axis towards the x-axis. If thefrequency sweep is applied adiabatically then the spin will followthe hamiltonian. Next, a circular motion can be imposed byadiabatically varying the phase of the radio frequency. When thehamiltonian returns to the x-axis the frequency sweep may bereversed, so that the spin returns to its original state, alignedalong the z-axis. The Berry phase acquired in this cyclic process is6p. If the radio-frequency ®eld is not swept all the way toresonance, but only to some ®nal value qf, the hamiltonian endsat some angle to the z-axis, and so circuits with arbitrary cone anglescan be implemented. A similar case occurs if the frequency sweep isreplaced by an amplitude sweep, in which the radio frequency isalways applied away from resonance, and its amplitude is raisedsmoothly from zero to some ®nal value, q1.
This situation arises naturally in a system of two weakly coupledspins, I and S. For simplicity we consider a heteronuclear system, sothat qI and qS are very different, and only one spin (say I) is close toresonance. The two transitions of I (corresponding to the twopossible states of spin S) will be split by 6pJ, and so will havedifferent resonance offsets. After an amplitude sweep the orienta-tion of the effective hamiltonian depends on the resonance offset,and so v (and hence the Berry phase acquired) will depend on thestate of spin S. This permits a conditional Berry phase to be appliedto spin I, where the size of the phase shift is controlled by spin S. Ifthe radio frequency is applied at a frequency d (measured in Hz)
© 2000 Macmillan Magazines Ltd
NATURE | VOL 402 | 2 DECEMBER 1999 | www.nature.com 489
articles
The DNA sequence of humanchromosome 22I. Dunham, N. Shimizu, B. A. Roe, S. Chissoe et al.²
² A full list of authors appears at the end of this paper............................................................................................................................................................................................................................................................................
Knowledge of the complete genomic DNA sequence of an organism allows a systematic approach to de®ning its geneticcomponents. The genomic sequence provides access to the complete structures of all genes, including those without knownfunction, their control elements, and, by inference, the proteins they encode, as well as all other biologically important sequences.Furthermore, the sequence is a rich and permanent source of information for the design of further biological studies of theorganism and for the study of evolution through cross-species sequence comparison. The power of this approach has been amplydemonstrated by the determination of the sequences of a number of microbial and model organisms. The next step is to obtain thecomplete sequence of the entire human genome. Here we report the sequence of the euchromatic part of human chromosome 22.The sequence obtained consists of 12 contiguous segments spanning 33.4 megabases, contains at least 545 genes and 134pseudogenes, and provides the ®rst view of the complex chromosomal landscapes that will be found in the rest of the genome.
Two alternative approaches have been proposed to determine thehuman genome sequence. In the clone by clone approach, a map ofthe genome is constructed using clones of a suitable size (forexample, 100±200 kilobases (kb)), and then the sequence is deter-mined for each of a representative set of clones that completelycovers the map1. Alternatively, a whole genome shotgun2 requiresthe sequencing of unmapped genomic clones, typically in a sizerange of 2±10 kb, followed by a monolithic assembly to produce theentire sequence. Although the merits of these two strategies con-tinue to be debated3, the public domain human genome sequencingproject is following the clone by clone approach4 because it ismodular, allows ef®cient organization of distributed resourcesand sequencing capacities, avoids problems arising from distantrepeats and results in early completion of signi®cant units of thegenome. Here we report the ®rst sequencing landmark of thehuman genome project, the operationally complete sequence ofthe euchromatic portion of a human chromosome.
Chromosome 22 is the second smallest of the human autosomes,comprising 1.6±1.8% of the genomic DNA5. It is one of ®ve humanacrocentric chromosomes, each of which shares substantialsequence similarity in the short arm, which encodes the tandemlyrepeated ribosomal RNA genes and a series of other tandem repeatsequence arrays. There is no evidence to indicate the presence of anyprotein coding genes on the short arm of chromosome 22 (22p). Incontrast, direct6 and indirect7,8 mapping methods suggest that thelong arm of the chromosome (22q) is rich in genes compared withother chromosomes. The relatively small size and the existence of ahigh-resolution framework map of the chromosome9 suggested tous that sequencing human chromosome 22 would provide anexcellent opportunity to show the feasibility of completing thesequence of a substantial unit of the human genome. In addition,alteration of gene dosage on part of 22q is responsible for theaetiology of a number of human congenital anomaly disordersincluding cat eye syndrome (CES, Mendelian Inheritance in Man(MIM) 115470, http:// www.ncbi.nlm.nih.gov/omim/) and velocar-diofacial/DiGeorge syndrome (VCFS, MIM 192430; DGS, MIM188400). Other regions associated with human disease are theschizophrenia susceptibility locus10,11, and the sequences involvedin spinocerebellar ataxia 10 (SCA10)12. Making the sequence ofhuman chromosome 22 freely available to the community early inthe data collection phase has bene®ted studies of disease-related andother genes associated with this human chromosome13±19.
Genomic sequencingTo identify genomic clones as the substrate for sequencing chromo-
some 22, extensive clone maps of the chromosome were constructedusing cosmids, fosmids, bacterial arti®cial chromosomes (BACs)and P1-derived arti®cial chromosomes (PACs). Clones representingparts of chromosome 22 were identi®ed by screening BAC and PAClibraries representing more than 20 genome equivalents usingsequence tagged site (STS) markers known to be derived from thechromosome, or by using cosmid and fosmid libraries derived from¯ow-sorted DNA from chromosome 22. Overlapping clone contigswere assembled on the basis of restriction enzyme ®ngerprints andSTS-content data, and ordered relative to each other using theestablished framework map of the chromosome9. The resultingnascent contigs were extended and joined by iterative cycles ofchromosome walking using sequences from the end of each contig.In two places, yeast arti®cial chromosome (YAC) clones were usedto join or extend contigs (AL049708, AL049760). The sequence-ready map covers 22q in 11 clone contigs with 10 gaps and stretchesfrom sequences containing known chromosome 22 centromerictandem repeats to the 22q telomere20.
In the ®nal sequence, one additional gap that was intractable tosequencing is found 234 kb from the centromere (see below). Thegaps between the clone contigs are located at the two ends of themap, in the 4.3 Mb adjacent to the centromere and in 7.3 Mb at thetelomeric end. These regions are separated by a central contig of23 Mb. We have concluded that the gaps contain sequences that areunclonable with the available host-vector systems, as we wereunable to detect clones containing the sequences in these gaps byscreening more than 20 genome equivalents of bacterial clonesusing sequences adjacent to the contig ends.
The size of the seven gaps in the telomeric region has beenestimated by DNA ®bre ¯uorescence in situ hybridization (FISH).No gap in this region is judged to be larger than ,150 kb. For threeof these gaps, a number of BAC and PAC clones that contain STSs oneither side of the gap were shown to be deleted for at least a minimalcore region by DNA ®bre FISH. As these clones come from multipledonor DNA sources, these results are unlikely to be due to deletionin the DNA used to make the libraries. Furthermore, the same resultwas observed for the gap at 32,600 kb from the centromeric end ofthe sequence, when the DNA ®bre FISH experiments were per-formed on DNA from two different lymphoblastoid cell lines. Onepossible explanation for this observation is that DNA fragmentscontaining the gap sequences are initially cloned in the BAC librarybut clones that delete these sequences have a signi®cant selectiveadvantage as the library is propagated. As the observed size range ofthe cloned inserts in the BAC libraries ranges from 100 kb to morethan 230 kb (http://bacpac.med.buffalo.edu/), such deletion events
are not distinguishable on the basis of size from undeleted BACs.Additional analysis of the distribution of BAC end sequences fromdbGSS (http://www.ncbi.nlm.nih.gov/dbGSS/index.html) suggeststhat the BAC coverage is sparser closer to the gaps and that thisanalysis did not identify any BACs spanning the gaps. The threeremaining clone-map gaps in the proximal region of the long armare in regions that may contain segments of previously characterizedlow-copy repeats21. These gaps could not be sized by DNA ®breFISH because of the extensive intra- and interchromosomal repeatsequences (see below) but were amenable to long-range restrictionmapping. The gap between AP000529 and AP000530 was estimatedto be shorter than 150 kb by comparison with a previously estab-lished long-range restriction map22. The gap closest to the centro-mere, which is less than 2 kb in size, could not be sequenced despiteBAC clone coverage as it was unrepresented in plasmid or M13libraries, and was intractable to all sequencing strategies applied.Detailed descriptions of several of the clone contigs have beenpublished21,23,24 or will be published elsewhere.
Each sequencing group took responsibility for completion of adja-cent areas of the sequence as illustrated in Fig. 1. A set of minimallyoverlapping clones (the `tile path') was chosen from the physical mapand sequenced using a combination of a random shotgun assembly,followed by directed sequencing to close gaps and resolve ambiguities(`®nishing'). The major problems encountered during completionof the sequence in the directed sequencing phase were CpG islands,tandem repeats and apparent cloning biases. Directed sequencingusing oligonucleotide primers, very short insert plasmid libraries, oridenti®cation of bridging clones by screening high complexityplasmid or M13 libraries solved these problems.
The completed sequence covers 33.4 Mb of 22q with 11 gaps andhas been estimated to be accurate to less than 1 error in 50,000 bases,by internal and external checking exercises25. The order and size ofeach of the contiguous pieces of sequence is detailed in Table 1. Thelargest contiguous segment stretches over 23 Mb. From our gap-sizeestimates, we calculate that we have completed 33,464 kb of a totalregion spanning 34,491 kb and that therefore the sequence iscomplete to 97% coverage of 22q. The complete sequence andanalysis is available on the internet (http://www.sanger.ac.uk/HGP/Chr22 and http://www.genome.ou.edu/Chr22.html).
Sequence analysis and gene contentAnalysis of the genomic sequence of the model organisms has madeextensive use of predictive computational analysis to identifygenes26±28. In human DNA, identi®cation of genes by these methodsis more dif®cult because of extensive splicing, lower density of exonsand the high proportion of interspersed repetitive sequences. Theaccuracy of ab initio gene prediction on vertebrate genomicsequence has been dif®cult to determine because of the lack ofsequence that has been completely annotated by experiment. Todetermine the degree of overprediction made by such algorithms, allgenes within a region need to be experimentally identi®ed andannotated, however it is virtually impossible to know when this jobis complete. A 1.4-Mb region of human genomic sequence aroundthe BRCA2 locus has been subjected to extensive experimentalinvestigation, and it is believed that the 170 exons identi®ed isclose to the total number expressed in the region.
The most recent calibration of ab initio methods against thisregion (R.B.S.K. and T.H., manuscript in preparation) shows thatwith the best methods29,30 more than 30% of exon predictions do notoverlap any experimental exons, in other words, they are over-predictions. Furthermore, having now applied this analysis to largeramounts of data (more than 15 Mb from the Sanger AnnotatedGenome Sequence Repository which can be obtained as part of theGenesafe collection (http://www.hgmp.mrc.ac.uk/Genesafe/)), it iscon®rmed that prediction accuracy also varies considerablybetween different regions of sequence. It was hoped that thesecalibration efforts would lead to rules for reliable gene prediction
based on ab initio methods alone, perhaps on the basis of combiningseveral different methods, GC content and so on. However, so farthis has not been possible. The same analysis also shows thatalthough ,95% of genes are at least partially predicted by abinitio methods, few gene structures are completely correct (nonein BRCA2) and more than 20% of experimental exons are notpredicted at all. The comparison of ab initio predictions and theannotated gene structures (see below) in the chromosome 22sequence is consistent with this, with 94% of annotated genes atleast partially detected by a Genscan gene prediction, but only 20%of annotated genes having all exons predicted exactly. Sixteen percent of all the exons in annotated genes were not predicted at all,although this is only 10% for internal exons (that is, not 59 and 39ends). As a result, we do not consider that ab initio gene predictionsoftware can currently be used directly to reliably annotate genes inhuman sequence, although it is useful when combined with otherevidence (see below), for example, to de®ne splice-site boundaries,and as a starting point for experimental studies.
Fortunately, a vast resource of experimental data on human genesin the form of complementary DNA and protein sequences andexpressed sequence tags (ESTs) is available which can be used toidentify genes within genomic DNA. Furthermore about 60% ofhuman genes have distinctive CpG island sequences at their 59ends31 which can also be used to identify potential genes. Thus, theapproach we have taken to annotating genes in the chromosome 22sequence relies on a combination of similarity searches against allavailable DNA and protein databases, as well as a series of ab initiopredictions. Upon completion of the sequence of each clone in thetile path, the sequence was subjected to extensive computationalanalysis using a suite of similarity searches and prediction tools.Brie¯y, the sequences were analysed for repetitive sequencecontent, and the repeats were masked using RepeatMasker (http://ftp . genome . washington . edu / RM / RepeatMasker . html). Maskedsequence was compared to public domain DNA and proteindatabases by similarity searches using the blast family of programs32.Unmasked sequence was analysed for C � G content and used topredict the presence of CpG islands, tandem repeat sequences,tRNA genes and exons. The completed analysis was assembledinto contigs and visualized using implementations of ACEDB(http:// www.sanger.ac.uk/Software/Acedb/). In addition, the con-tiguous masked sequence was analysed using gene predictionsoftware29,30.
articles
490 NATURE | VOL 402 | 2 DECEMBER 1999 | www.nature.com
Figure 1 The sequence of human chromosome 22. Coloured boxes depict the annotated
features of the sequence of human chromosome 22, with the centromere to the left and the
telomere to the right. Coordinates are in kilobases. Vertical yellow blocks indicate the
positions of the gaps in the sequence and are proportional in size to the estimated size of
each gap. From bottom to top the following features are displayed: positions of interspersed
repetitive sequences including tandem repeats categorized by nucleotide repeat unit length
(at this resolutrion Alu repeats are not visibly separated in some regions); the positions of the
microsatellite markers in the genetic map of Dib et al.36; the tiling path of genomic clones
used to determine the sequence labelled by their Genbank/EMBL/DDBJ accession number
and coloured according to the source of the sequence; and the annotated gene, pseudogene
and CpG island content of the sequence. Transcripts and pseudogenes oriented 59 to 39 on
the DNA strand from centromere to telomere are designated `+', those on the opposite
strand `-'. In the transcript rows, the annotated genes are subdivided by colour according to
the criteria in the text. Annotated genes with approved gene symbols from the HUGO
nomenclature committee are labelled. For details of all the genes with their positions in the
reference sequence, see Supplementary Information, Table 1. In the case of the
immunoglobulin variable region, the entire locus has been drawn as a single block; in reality,
this is a complex of variable chain genes (see ref. 27). At the top is a graphical plot of the
repeat density for the common interspersed repeats Alu and Line1, and the C � G base
frequency across the sequence. Each is calculated as a percentage of the sequence using a
sliding 100-kb window moved in 50-kb iterations. Since the production of Fig. 1, six
accession codes have been updated. The new codes are AL050347 (for Z73987),
AL096754 (for Z68686), AL049749 (for Z82197), Z75892 (for Z75891), AL078611 (for
Z79997) and AL023733 (for AL023593).
Q
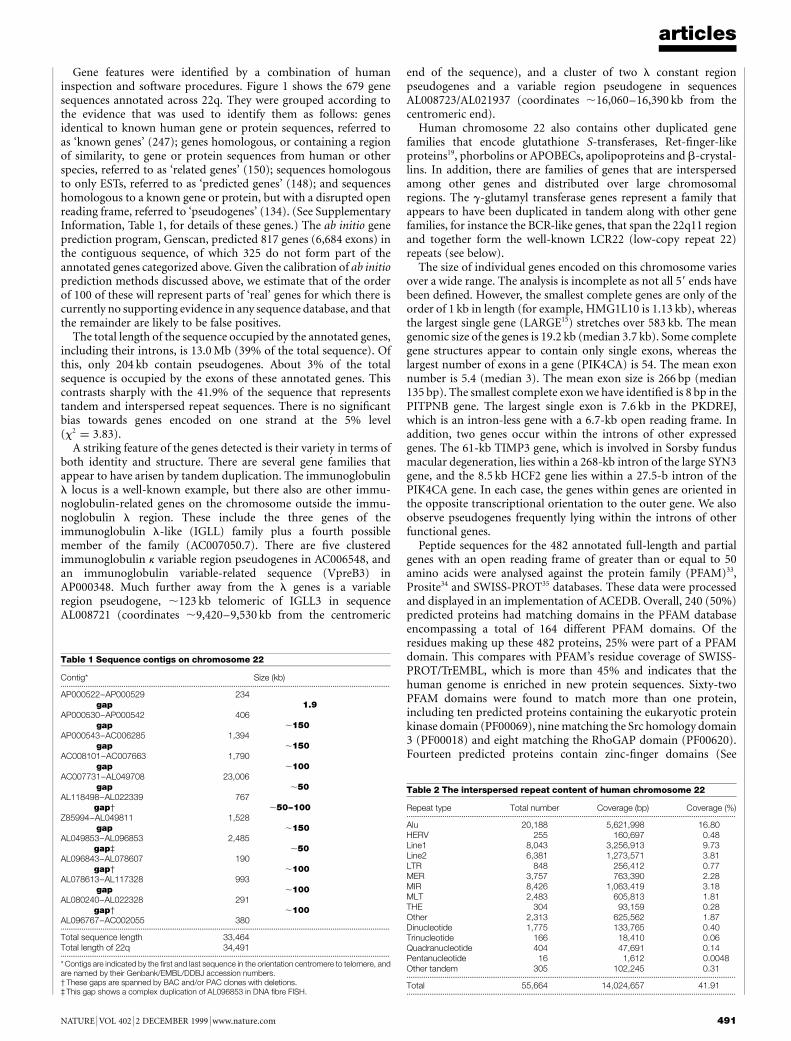
Gene features were identi®ed by a combination of humaninspection and software procedures. Figure 1 shows the 679 genesequences annotated across 22q. They were grouped according tothe evidence that was used to identify them as follows: genesidentical to known human gene or protein sequences, referred toas `known genes' (247); genes homologous, or containing a regionof similarity, to gene or protein sequences from human or otherspecies, referred to as `related genes' (150); sequences homologousto only ESTs, referred to as `predicted genes' (148); and sequenceshomologous to a known gene or protein, but with a disrupted openreading frame, referred to `pseudogenes' (134). (See SupplementaryInformation, Table 1, for details of these genes.) The ab initio geneprediction program, Genscan, predicted 817 genes (6,684 exons) inthe contiguous sequence, of which 325 do not form part of theannotated genes categorized above. Given the calibration of ab initioprediction methods discussed above, we estimate that of the orderof 100 of these will represent parts of `real' genes for which there iscurrently no supporting evidence in any sequence database, and thatthe remainder are likely to be false positives.
The total length of the sequence occupied by the annotated genes,including their introns, is 13.0 Mb (39% of the total sequence). Ofthis, only 204 kb contain pseudogenes. About 3% of the totalsequence is occupied by the exons of these annotated genes. Thiscontrasts sharply with the 41.9% of the sequence that representstandem and interspersed repeat sequences. There is no signi®cantbias towards genes encoded on one strand at the 5% level(x2 � 3:83).
A striking feature of the genes detected is their variety in terms ofboth identity and structure. There are several gene families thatappear to have arisen by tandem duplication. The immunoglobulinl locus is a well-known example, but there also are other immu-noglobulin-related genes on the chromosome outside the immu-noglobulin l region. These include the three genes of theimmunoglobulin l-like (IGLL) family plus a fourth possiblemember of the family (AC007050.7). There are ®ve clusteredimmunoglobulin k variable region pseudogenes in AC006548, andan immunoglobulin variable-related sequence (VpreB3) inAP000348. Much further away from the l genes is a variableregion pseudogene, ,123 kb telomeric of IGLL3 in sequenceAL008721 (coordinates ,9,420±9,530 kb from the centromeric
end of the sequence), and a cluster of two l constant regionpseudogenes and a variable region pseudogene in sequencesAL008723/AL021937 (coordinates ,16,060±16,390 kb from thecentromeric end).
Human chromosome 22 also contains other duplicated genefamilies that encode glutathione S-transferases, Ret-®nger-likeproteins19, phorbolins or APOBECs, apolipoproteins and b-crystal-lins. In addition, there are families of genes that are interspersedamong other genes and distributed over large chromosomalregions. The g-glutamyl transferase genes represent a family thatappears to have been duplicated in tandem along with other genefamilies, for instance the BCR-like genes, that span the 22q11 regionand together form the well-known LCR22 (low-copy repeat 22)repeats (see below).
The size of individual genes encoded on this chromosome variesover a wide range. The analysis is incomplete as not all 59 ends havebeen de®ned. However, the smallest complete genes are only of theorder of 1 kb in length (for example, HMG1L10 is 1.13 kb), whereasthe largest single gene (LARGE15) stretches over 583 kb. The meangenomic size of the genes is 19.2 kb (median 3.7 kb). Some completegene structures appear to contain only single exons, whereas thelargest number of exons in a gene (PIK4CA) is 54. The mean exonnumber is 5.4 (median 3). The mean exon size is 266 bp (median135 bp). The smallest complete exon we have identi®ed is 8 bp in thePITPNB gene. The largest single exon is 7.6 kb in the PKDREJ,which is an intron-less gene with a 6.7-kb open reading frame. Inaddition, two genes occur within the introns of other expressedgenes. The 61-kb TIMP3 gene, which is involved in Sorsby fundusmacular degeneration, lies within a 268-kb intron of the large SYN3gene, and the 8.5 kb HCF2 gene lies within a 27.5-b intron of thePIK4CA gene. In each case, the genes within genes are oriented inthe opposite transcriptional orientation to the outer gene. We alsoobserve pseudogenes frequently lying within the introns of otherfunctional genes.
Peptide sequences for the 482 annotated full-length and partialgenes with an open reading frame of greater than or equal to 50amino acids were analysed against the protein family (PFAM)33,Prosite34 and SWISS-PROT35 databases. These data were processedand displayed in an implementation of ACEDB. Overall, 240 (50%)predicted proteins had matching domains in the PFAM databaseencompassing a total of 164 different PFAM domains. Of theresidues making up these 482 proteins, 25% were part of a PFAMdomain. This compares with PFAM's residue coverage of SWISS-PROT/TrEMBL, which is more than 45% and indicates that thehuman genome is enriched in new protein sequences. Sixty-twoPFAM domains were found to match more than one protein,including ten predicted proteins containing the eukaryotic proteinkinase domain (PF00069), nine matching the Src homology domain3 (PF00018) and eight matching the RhoGAP domain (PF00620).Fourteen predicted proteins contain zinc-®nger domains (See
articles
NATURE | VOL 402 | 2 DECEMBER 1999 | www.nature.com 491
Table 1 Sequence contigs on chromosome 22
Contig* Size (kb).............................................................................................................................................................................
AP000522±AP000529 234gap 1.9
AP000530±AP000542 406gap ,150
AP000543±AC006285 1,394gap ,150
AC008101±AC007663 1,790gap ,100
AC007731±AL049708 23,006gap ,50
AL118498±AL022339 767gap² ,50±100
Z85994±AL049811 1,528gap ,150
AL049853±AL096853 2,485gap³ ,50
AL096843±AL078607 190gap² ,100
AL078613±AL117328 993gap ,100
AL080240±AL022328 291gap² ,100
AL096767±AC002055 380.............................................................................................................................................................................
Total sequence length 33,464Total length of 22q 34,491.............................................................................................................................................................................
* Contigs are indicated by the ®rst and last sequence in the orientation centromere to telomere, andare named by their Genbank/EMBL/DDBJ accession numbers.² These gaps are spanned by BAC and/or PAC clones with deletions.³ This gap shows a complex duplication of AL096853 in DNA ®bre FISH.
Table 2 The interspersed repeat content of human chromosome 22
Repeat type Total number Coverage (bp) Coverage (%).............................................................................................................................................................................
Alu 20,188 5,621,998 16.80HERV 255 160,697 0.48Line1 8,043 3,256,913 9.73Line2 6,381 1,273,571 3.81LTR 848 256,412 0.77MER 3,757 763,390 2.28MIR 8,426 1,063,419 3.18MLT 2,483 605,813 1.81THE 304 93,159 0.28Other 2,313 625,562 1.87Dinucleotide 1,775 133,765 0.40Trinucleotide 166 18,410 0.06Quadranucleotide 404 47,691 0.14Pentanucleotide 16 1,612 0.0048Other tandem 305 102,245 0.31.............................................................................................................................................................................
Total 55,664 14,024,657 41.91.............................................................................................................................................................................
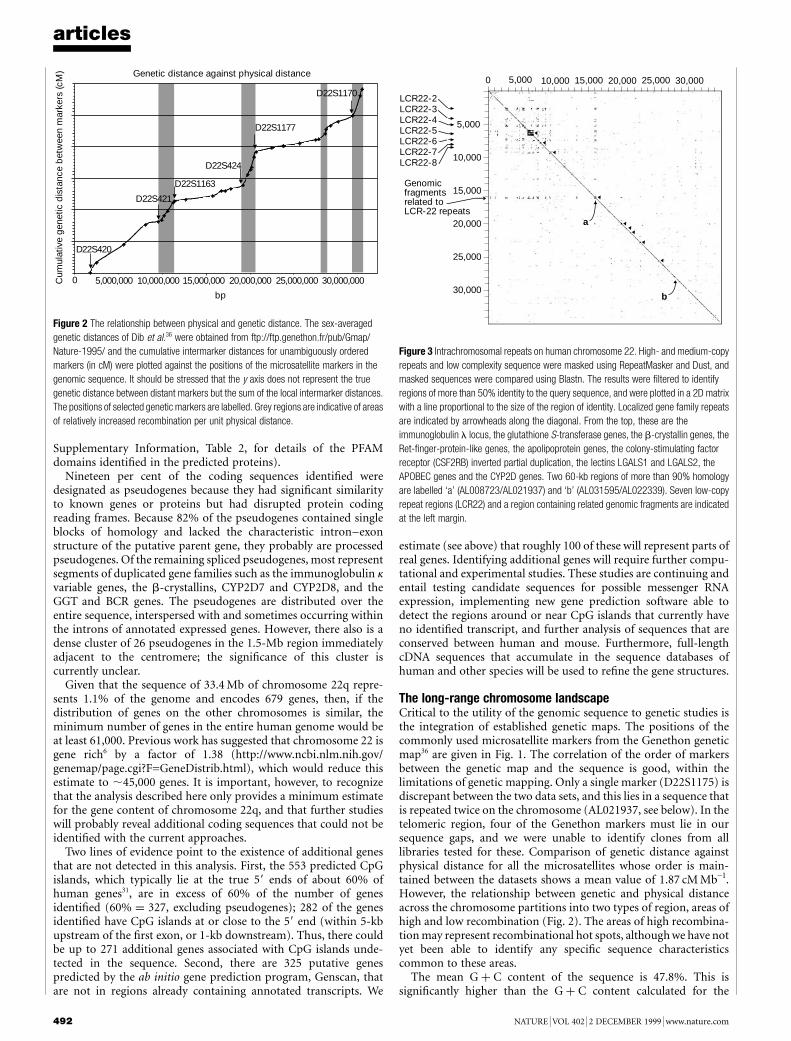
Supplementary Information, Table 2, for details of the PFAMdomains identi®ed in the predicted proteins).
Nineteen per cent of the coding sequences identi®ed weredesignated as pseudogenes because they had signi®cant similarityto known genes or proteins but had disrupted protein codingreading frames. Because 82% of the pseudogenes contained singleblocks of homology and lacked the characteristic intron±exonstructure of the putative parent gene, they probably are processedpseudogenes. Of the remaining spliced pseudogenes, most representsegments of duplicated gene families such as the immunoglobulin kvariable genes, the b-crystallins, CYP2D7 and CYP2D8, and theGGT and BCR genes. The pseudogenes are distributed over theentire sequence, interspersed with and sometimes occurring withinthe introns of annotated expressed genes. However, there also is adense cluster of 26 pseudogenes in the 1.5-Mb region immediatelyadjacent to the centromere; the signi®cance of this cluster iscurrently unclear.
Given that the sequence of 33.4 Mb of chromosome 22q repre-sents 1.1% of the genome and encodes 679 genes, then, if thedistribution of genes on the other chromosomes is similar, theminimum number of genes in the entire human genome would beat least 61,000. Previous work has suggested that chromosome 22 isgene rich6 by a factor of 1.38 (http://www.ncbi.nlm.nih.gov/genemap/page.cgi?F=GeneDistrib.html), which would reduce thisestimate to ,45,000 genes. It is important, however, to recognizethat the analysis described here only provides a minimum estimatefor the gene content of chromosome 22q, and that further studieswill probably reveal additional coding sequences that could not beidenti®ed with the current approaches.
Two lines of evidence point to the existence of additional genesthat are not detected in this analysis. First, the 553 predicted CpGislands, which typically lie at the true 59 ends of about 60% ofhuman genes31, are in excess of 60% of the number of genesidenti®ed (60% � 327, excluding pseudogenes); 282 of the genesidenti®ed have CpG islands at or close to the 59 end (within 5-kbupstream of the ®rst exon, or 1-kb downstream). Thus, there couldbe up to 271 additional genes associated with CpG islands unde-tected in the sequence. Second, there are 325 putative genespredicted by the ab initio gene prediction program, Genscan, thatare not in regions already containing annotated transcripts. We
estimate (see above) that roughly 100 of these will represent parts ofreal genes. Identifying additional genes will require further compu-tational and experimental studies. These studies are continuing andentail testing candidate sequences for possible messenger RNAexpression, implementing new gene prediction software able todetect the regions around or near CpG islands that currently haveno identi®ed transcript, and further analysis of sequences that areconserved between human and mouse. Furthermore, full-lengthcDNA sequences that accumulate in the sequence databases ofhuman and other species will be used to re®ne the gene structures.
The long-range chromosome landscapeCritical to the utility of the genomic sequence to genetic studies isthe integration of established genetic maps. The positions of thecommonly used microsatellite markers from the Genethon geneticmap36 are given in Fig. 1. The correlation of the order of markersbetween the genetic map and the sequence is good, within thelimitations of genetic mapping. Only a single marker (D22S1175) isdiscrepant between the two data sets, and this lies in a sequence thatis repeated twice on the chromosome (AL021937, see below). In thetelomeric region, four of the Genethon markers must lie in oursequence gaps, and we were unable to identify clones from alllibraries tested for these. Comparison of genetic distance againstphysical distance for all the microsatellites whose order is main-tained between the datasets shows a mean value of 1.87 cM Mb-1.However, the relationship between genetic and physical distanceacross the chromosome partitions into two types of region, areas ofhigh and low recombination (Fig. 2). The areas of high recombina-tion may represent recombinational hot spots, although we have notyet been able to identify any speci®c sequence characteristicscommon to these areas.
The mean G � C content of the sequence is 47.8%. This issigni®cantly higher than the G � C content calculated for the
articles
492 NATURE | VOL 402 | 2 DECEMBER 1999 | www.nature.com
Genetic distance against physical distance
0 5,000,000 10,000,000 15,000,000 20,000,000 25,000,000 30,000,000
bp
Cum
ulat
ive
gene
tic d
ista
nce
bet
wee
n m
arke
rs (c
M)
D22S420
D22S1163
D22S421
D22S424
D22S1177
D22S1170
Figure 2 The relationship between physical and genetic distance. The sex-averaged
genetic distances of Dib et al.36 were obtained from ftp://ftp.genethon.fr/pub/Gmap/
Nature-1995/ and the cumulative intermarker distances for unambiguously ordered
markers (in cM) were plotted against the positions of the microsatellite markers in the
genomic sequence. It should be stressed that the y axis does not represent the true
genetic distance between distant markers but the sum of the local intermarker distances.
The positions of selected genetic markers are labelled. Grey regions are indicative of areas
of relatively increased recombination per unit physical distance.
b
a
5,000 10,000 15,000 20,000 25,000 30,0000
5,000
10,000
15,000
20,000
25,000
30,000
LCR22-2 LCR22-3 LCR22-4 LCR22-5 LCR22-6 LCR22-7 LCR22-8
Genomicfragmentsrelated toLCR-22 repeats
Figure 3 Intrachromosomal repeats on human chromosome 22. High- and medium-copy
repeats and low complexity sequence were masked using RepeatMasker and Dust, and
masked sequences were compared using Blastn. The results were ®ltered to identify
regions of more than 50% identity to the query sequence, and were plotted in a 2D matrix
with a line proportional to the size of the region of identity. Localized gene family repeats
are indicated by arrowheads along the diagonal. From the top, these are the
immunoglobulin l locus, the glutathione S-transferase genes, the b-crystallin genes, the
Ret-®nger-protein-like genes, the apolipoprotein genes, the colony-stimulating factor
receptor (CSF2RB) inverted partial duplication, the lectins LGALS1 and LGALS2, the
APOBEC genes and the CYP2D genes. Two 60-kb regions of more than 90% homology
are labelled `a' (AL008723/AL021937) and `b' (AL031595/AL022339). Seven low-copy
repeat regions (LCR22) and a region containing related genomic fragments are indicated
at the left margin.
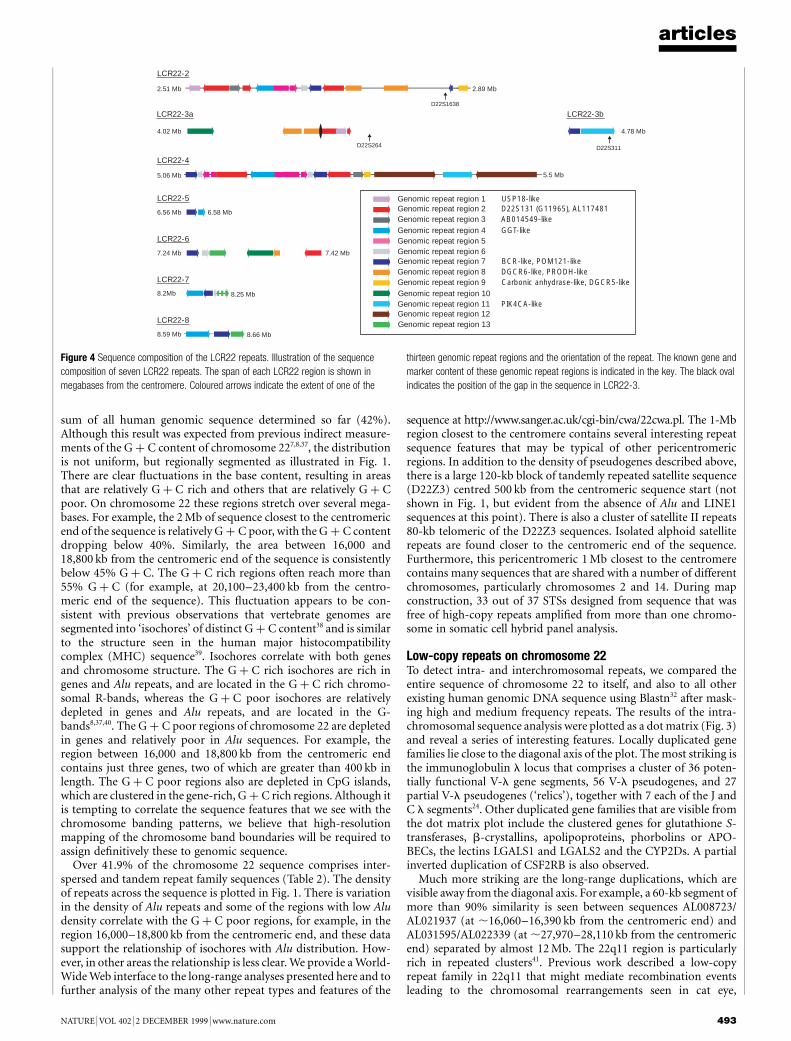
sum of all human genomic sequence determined so far (42%).Although this result was expected from previous indirect measure-ments of the G � C content of chromosome 227,8,37, the distributionis not uniform, but regionally segmented as illustrated in Fig. 1.There are clear ¯uctuations in the base content, resulting in areasthat are relatively G � C rich and others that are relatively G � Cpoor. On chromosome 22 these regions stretch over several mega-bases. For example, the 2 Mb of sequence closest to the centromericend of the sequence is relatively G � C poor, with the G � C contentdropping below 40%. Similarly, the area between 16,000 and18,800 kb from the centromeric end of the sequence is consistentlybelow 45% G � C. The G � C rich regions often reach more than55% G � C (for example, at 20,100±23,400 kb from the centro-meric end of the sequence). This ¯uctuation appears to be con-sistent with previous observations that vertebrate genomes aresegmented into `isochores' of distinct G � C content38 and is similarto the structure seen in the human major histocompatibilitycomplex (MHC) sequence39. Isochores correlate with both genesand chromosome structure. The G � C rich isochores are rich ingenes and Alu repeats, and are located in the G � C rich chromo-somal R-bands, whereas the G � C poor isochores are relativelydepleted in genes and Alu repeats, and are located in the G-bands8,37,40. The G � C poor regions of chromosome 22 are depletedin genes and relatively poor in Alu sequences. For example, theregion between 16,000 and 18,800 kb from the centromeric endcontains just three genes, two of which are greater than 400 kb inlength. The G � C poor regions also are depleted in CpG islands,which are clustered in the gene-rich, G � C rich regions. Although itis tempting to correlate the sequence features that we see with thechromosome banding patterns, we believe that high-resolutionmapping of the chromosome band boundaries will be required toassign de®nitively these to genomic sequence.
Over 41.9% of the chromosome 22 sequence comprises inter-spersed and tandem repeat family sequences (Table 2). The densityof repeats across the sequence is plotted in Fig. 1. There is variationin the density of Alu repeats and some of the regions with low Aludensity correlate with the G � C poor regions, for example, in theregion 16,000±18,800 kb from the centromeric end, and these datasupport the relationship of isochores with Alu distribution. How-ever, in other areas the relationship is less clear. We provide a World-Wide Web interface to the long-range analyses presented here and tofurther analysis of the many other repeat types and features of the
sequence at http://www.sanger.ac.uk/cgi-bin/cwa/22cwa.pl. The 1-Mbregion closest to the centromere contains several interesting repeatsequence features that may be typical of other pericentromericregions. In addition to the density of pseudogenes described above,there is a large 120-kb block of tandemly repeated satellite sequence(D22Z3) centred 500 kb from the centromeric sequence start (notshown in Fig. 1, but evident from the absence of Alu and LINE1sequences at this point). There is also a cluster of satellite II repeats80-kb telomeric of the D22Z3 sequences. Isolated alphoid satelliterepeats are found closer to the centromeric end of the sequence.Furthermore, this pericentromeric 1 Mb closest to the centromerecontains many sequences that are shared with a number of differentchromosomes, particularly chromosomes 2 and 14. During mapconstruction, 33 out of 37 STSs designed from sequence that wasfree of high-copy repeats ampli®ed from more than one chromo-some in somatic cell hybrid panel analysis.
Low-copy repeats on chromosome 22To detect intra- and interchromosomal repeats, we compared theentire sequence of chromosome 22 to itself, and also to all otherexisting human genomic DNA sequence using Blastn32 after mask-ing high and medium frequency repeats. The results of the intra-chromosomal sequence analysis were plotted as a dot matrix (Fig. 3)and reveal a series of interesting features. Locally duplicated genefamilies lie close to the diagonal axis of the plot. The most striking isthe immunoglobulin l locus that comprises a cluster of 36 poten-tially functional V-l gene segments, 56 V-l pseudogenes, and 27partial V-l pseudogenes (`relics'), together with 7 each of the J andC l segments24. Other duplicated gene families that are visible fromthe dot matrix plot include the clustered genes for glutathione S-transferases, b-crystallins, apolipoproteins, phorbolins or APO-BECs, the lectins LGALS1 and LGALS2 and the CYP2Ds. A partialinverted duplication of CSF2RB is also observed.
Much more striking are the long-range duplications, which arevisible away from the diagonal axis. For example, a 60-kb segment ofmore than 90% similarity is seen between sequences AL008723/AL021937 (at ,16,060±16,390 kb from the centromeric end) andAL031595/AL022339 (at ,27,970±28,110 kb from the centromericend) separated by almost 12 Mb. The 22q11 region is particularlyrich in repeated clusters41. Previous work described a low-copyrepeat family in 22q11 that might mediate recombination eventsleading to the chromosomal rearrangements seen in cat eye,
articles
NATURE | VOL 402 | 2 DECEMBER 1999 | www.nature.com 493
Carbonic anhydrase-like, DGCR5-likeGenomic repeat region 9
PIK4CA-likeGenomic repeat region 11Genomic repeat region 10
Genomic repeat region 13
2.51 Mb
4.02 Mb
5.06 Mb
6.56 Mb
7.24 Mb
8.2Mb
8.59 Mb 8.66 Mb
8.25 Mb
7.42 Mb
4.78 Mb
2.89 Mb
6.58 Mb
Genomic repeat region 12
5.5 Mb
LCR22-2
LCR22-3a
LCR22-4
LCR22-5
LCR22-6
LCR22-7
LCR22-8
USP18-likeGenomic repeat region 1D22S131 (G11965), AL117481Genomic repeat region 2AB014549-likeGenomic repeat region 3GGT-likeGenomic repeat region 4
Genomic repeat region 5
BCR-like, POM121-likeGenomic repeat region 7Genomic repeat region 6
DGCR6-like, PRODH-likeGenomic repeat region 8
LCR22-3bD22S1638
D22S264 D22S311
Figure 4 Sequence composition of the LCR22 repeats. Illustration of the sequence
composition of seven LCR22 repeats. The span of each LCR22 region is shown in
megabases from the centromere. Coloured arrows indicate the extent of one of the
thirteen genomic repeat regions and the orientation of the repeat. The known gene and
marker content of these genomic repeat regions is indicated in the key. The black oval
indicates the position of the gap in the sequence in LCR22-3.
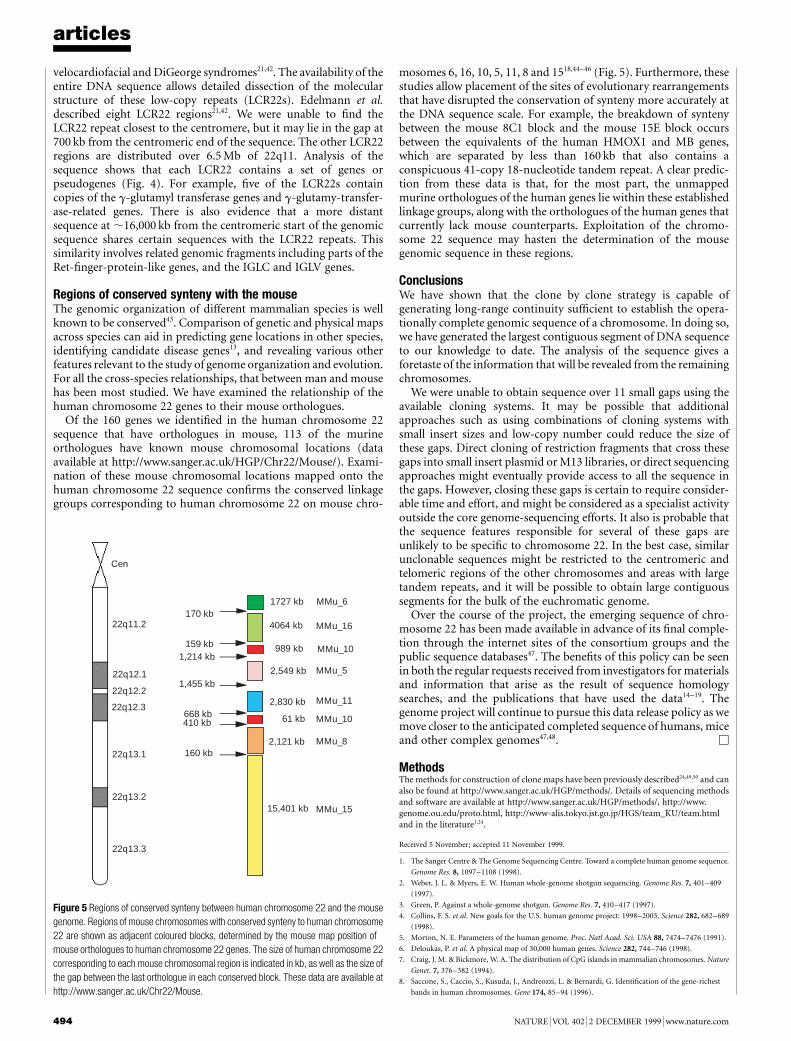
velocardiofacial and DiGeorge syndromes21,42. The availability of theentire DNA sequence allows detailed dissection of the molecularstructure of these low-copy repeats (LCR22s). Edelmann et al.described eight LCR22 regions21,42. We were unable to ®nd theLCR22 repeat closest to the centromere, but it may lie in the gap at700 kb from the centromeric end of the sequence. The other LCR22regions are distributed over 6.5 Mb of 22q11. Analysis of thesequence shows that each LCR22 contains a set of genes orpseudogenes (Fig. 4). For example, ®ve of the LCR22s containcopies of the g-glutamyl transferase genes and g-glutamy-transfer-ase-related genes. There is also evidence that a more distantsequence at ,16,000 kb from the centromeric start of the genomicsequence shares certain sequences with the LCR22 repeats. Thissimilarity involves related genomic fragments including parts of theRet-®nger-protein-like genes, and the IGLC and IGLV genes.
Regions of conserved synteny with the mouseThe genomic organization of different mammalian species is wellknown to be conserved43. Comparison of genetic and physical mapsacross species can aid in predicting gene locations in other species,identifying candidate disease genes13, and revealing various otherfeatures relevant to the study of genome organization and evolution.For all the cross-species relationships, that between man and mousehas been most studied. We have examined the relationship of thehuman chromosome 22 genes to their mouse orthologues.
Of the 160 genes we identi®ed in the human chromosome 22sequence that have orthologues in mouse, 113 of the murineorthologues have known mouse chromosomal locations (dataavailable at http://www.sanger.ac.uk/HGP/Chr22/Mouse/). Exami-nation of these mouse chromosomal locations mapped onto thehuman chromosome 22 sequence con®rms the conserved linkagegroups corresponding to human chromosome 22 on mouse chro-
mosomes 6, 16, 10, 5, 11, 8 and 1518,44±46 (Fig. 5). Furthermore, thesestudies allow placement of the sites of evolutionary rearrangementsthat have disrupted the conservation of synteny more accurately atthe DNA sequence scale. For example, the breakdown of syntenybetween the mouse 8C1 block and the mouse 15E block occursbetween the equivalents of the human HMOX1 and MB genes,which are separated by less than 160 kb that also contains aconspicuous 41-copy 18-nucleotide tandem repeat. A clear predic-tion from these data is that, for the most part, the unmappedmurine orthologues of the human genes lie within these establishedlinkage groups, along with the orthologues of the human genes thatcurrently lack mouse counterparts. Exploitation of the chromo-some 22 sequence may hasten the determination of the mousegenomic sequence in these regions.
ConclusionsWe have shown that the clone by clone strategy is capable ofgenerating long-range continuity suf®cient to establish the opera-tionally complete genomic sequence of a chromosome. In doing so,we have generated the largest contiguous segment of DNA sequenceto our knowledge to date. The analysis of the sequence gives aforetaste of the information that will be revealed from the remainingchromosomes.
We were unable to obtain sequence over 11 small gaps using theavailable cloning systems. It may be possible that additionalapproaches such as using combinations of cloning systems withsmall insert sizes and low-copy number could reduce the size ofthese gaps. Direct cloning of restriction fragments that cross thesegaps into small insert plasmid or M13 libraries, or direct sequencingapproaches might eventually provide access to all the sequence inthe gaps. However, closing these gaps is certain to require consider-able time and effort, and might be considered as a specialist activityoutside the core genome-sequencing efforts. It also is probable thatthe sequence features responsible for several of these gaps areunlikely to be speci®c to chromosome 22. In the best case, similarunclonable sequences might be restricted to the centromeric andtelomeric regions of the other chromosomes and areas with largetandem repeats, and it will be possible to obtain large contiguoussegments for the bulk of the euchromatic genome.
Over the course of the project, the emerging sequence of chro-mosome 22 has been made available in advance of its ®nal comple-tion through the internet sites of the consortium groups and thepublic sequence databases47. The bene®ts of this policy can be seenin both the regular requests received from investigators for materialsand information that arise as the result of sequence homologysearches, and the publications that have used the data14±19. Thegenome project will continue to pursue this data release policy as wemove closer to the anticipated completed sequence of humans, miceand other complex genomes47,48. M
MethodsThe methods for construction of clone maps have been previously described24,49,50 and canalso be found at http://www.sanger.ac.uk/HGP/methods/. Details of sequencing methodsand software are available at http://www.sanger.ac.uk/HGP/methods/, http://www.genome.ou.edu/proto.html, http://www-alis.tokyo.jst.go.jp/HGS/team_KU/team.htmland in the literature1,24.
Received 5 November; accepted 11 November 1999.
1. The Sanger Centre & The Genome Sequencing Centre. Toward a complete human genome sequence.
Genome Res. 8, 1097±1108 (1998).
2. Weber, J. L. & Myers, E. W. Human whole-genome shotgun sequencing. Genome Res. 7, 401±409
(1997).
3. Green, P. Against a whole-genome shotgun. Genome Res. 7, 410±417 (1997).
4. Collins, F. S. et al. New goals for the U.S. human genome project: 1998±2003. Science 282, 682±689
(1998).
5. Morton, N. E. Parameters of the human genome. Proc. Natl Acad. Sci. USA 88, 7474±7476 (1991).
6. Deloukas, P. et al. A physical map of 30,000 human genes. Science 282, 744±746 (1998).
7. Craig, J. M. & Bickmore, W. A. The distribution of CpG islands in mammalian chromosomes. Nature
Genet. 7, 376±382 (1994).
8. Saccone, S., Caccio, S., Kusuda, J., Andreozzi, L. & Bernardi, G. Identi®cation of the gene-richest
bands in human chromosomes. Gene 174, 85±94 (1996).
articles
494 NATURE | VOL 402 | 2 DECEMBER 1999 | www.nature.com
MMu_8
MMu_5
MMu_11
MMu_10
MMu_15
MMu_16
MMu_6
MMu_10
989 kb
1727 kb
2,549 kb
4064 kb
2,830 kb
61 kb
2,121 kb
15,401 kb
170 kb
159 kb1,214 kb
1,455 kb
668 kb410 kb
160 kb
Cen
22q11.2
22q12.1
22q12.2
22q12.3
22q13.1
22q13.2
22q13.3
Figure 5 Regions of conserved synteny between human chromosome 22 and the mouse
genome. Regions of mouse chromosomes with conserved synteny to human chromosome
22 are shown as adjacent coloured blocks, determined by the mouse map position of
mouse orthologues to human chromosome 22 genes. The size of human chromosome 22
corresponding to each mouse chromosomal region is indicated in kb, as well as the size of
the gap between the last orthologue in each conserved block. These data are available at
http://www.sanger.ac.uk/Chr22/Mouse.
9. Collins, J. E. et al. A high-density YAC contig map of human chromosome 22. Nature 377, 367±379
(1995).
10. Pulver, A. E. et al. Psychotic illness in patients diagnosed with velo-cardio-facial syndrome and their
relatives. J. Nerv. Ment. Dis. 182, 476±478 (1994).
11. Gill, M. et al. A combined analysis of D22S278 marker alleles in affected sib-pairs: support for a
susceptibility locus for schizophrenia at chromosome 22q12. Schizophrenia Collaborative Linkage
Group (Chromosome 22). Am. J. Med. Genet. 67, 40±45 (1996).
12. Zu, L., Figueroa, K. P., Grewal, R. & Pulst, S. M. Mapping of a new autosomal dominant
spinocerebellar ataxia to chromosome 22. Am. J. Hum. Genet. 64, 594±599 (1999).
13. Southard-Smith, E. M. et al. Comparative analyses of the dominant megacolon-SOX10 genomic
interval in mouse and human. Mamm. Genome 10, 744±749 (1999).
14. Nishino, I., Spinazzola, A. & Hirano, M. Thymidine phosphorylase gene mutations in MNGIE, a
human mitochondrial disorder. Science 283, 689±692 (1999).
15. Peyrard, M. et al. The human LARGE gene from 22q12.3-q13.1 is a new, distinct member of the
glycosyltransferase gene family. Proc. natl Acad. Sci. USA 96, 598±603 (1999).
16. Kao, H. T. et al. A third member of the synapsin gene family. Proc. Natl Acad. Sci. USA 95, 4667±4672
(1998).
17. Mittman, S., Guo, J., Emerick, M. C. & Agnew, W. S. Structure and alternative splicing of the gene
encoding alpha1I, a human brain T calcium channel alpha1 subunit. Neurosci. Lett. 269, 121±124
(1999).
18. Seroussi, E. et al. TOM1 genes map to human chromosome 22q13.1 and mouse chromosome 8C1
and encode proteins similar to the endosomal proteins HGS and STAM. Genomics 57, 380±388
(1999).
19. Seroussi, E. et al. Duplications on human chromosome 22 reveal a novel ret ®nger protein-like gene
family with sense and endogenous antisense transcripts. Genome Res. 9, 803±814 (1999).
20. Ning, Y., Rosenberg, M., Biesecker, L. G. & Ledbetter, D. H. Isolation of the human chromosome 22q
telomere and its application to detection of cryptic chromosomal abnormalities. Hum. Genet. 97,
765±769 (1996).
21. Edelmann, L., Pandita, R. K. & Morrow, B. E. Low-copy repeats mediate the common 3-Mb deletion
in patients with velo-cardio-facial syndrome. Am. J. Hum. Genet. 64, 1076±1086 (1999).
22. McDermid, H. E. et al. Long-range mapping and construction of a YAC contig within the cat eye
syndrome critical region. Genome Res. 6, 1149±1159 (1996).
23. Johnson, A. et al. A 1.5-Mb contig within the cat eye syndrome critical region at human chromosome
22q11.2. Genomics 57, 306±309 (1999).
24. Kawasaki, K. et al. One-megabase sequence analysis of the human immunoglobulin lambda gene
locus. Genome Res. 7, 250±261 (1997).
25. Felsenfeld, A., Peterson, J., Schloss, J. & Guyer, M. Assessing the quality of the DNA sequence from the
Human Genome Project. Genome Res. 9, 1±4 (1999).
26. Mewes, H. W. et al. Overview of the yeast genome. Nature 387, 7±65 (1997).
27. Blattner, F. R. et al. The complete genome sequence of Escherichia coli K-12. Science 277, 1453±1474
(1997).
28. The C. elegans Sequencing Consortium. Genome sequence of the nematode C. elegans: a platform for
investigating biology. Science 282, 2012±2018 (1998).
29. Solovyev, V. & Salamov, A. The Gene-Finder computer tools for analysis of human and model
organisms genome sequences. Ismb 5, 294±302 (1997).
30. Burge, C. & Karlin, S. Prediction of complete gene structures in human genomic DNA. J. Mol. Biol.
268, 78±94 (1997).
31. Cross, S. H. & Bird, A. P. CpG islands and genes. Curr. Opin. Genet. Dev. 5, 309±314 (1995).
32. Altschul, S. F., Gish, W., Miller, W., Myers, E. W. & Lipman, D. J. Basic local alignment search tool. J.
Mol. Biol. 215, 403±410 (1990).
33. Bateman, A. et al. Pfam 3.1: 1313 multiple alignments and pro®le HMMs match the majority of
proteins. Nucleic Acids Res. 27, 260±262 (1999).
34. Hofmann, K., Bucher, P., Falquet, L. & Bairoch, A. The PROSITE database, its status in 1999. Nucleic
Acis Res. 27, 215±219 (1999).
35. Bairoch, A. & Apweiler, R. The SWISS-PROT protein sequence data bank and its supplement TrEMBL
in 1999. Nucleic Acids Res. 27, 49±54 (1999).
36. Dib, C. et al. A comprehensive genetic map of the human genome based on 5,264 microsatellites.
Nature 380, 152±154 (1996).
37. Holmquist, G. P. Chromosome bands, their chromatin ¯avors, and their functional features. Am. J.
Hum. Genet. 51, 17±37 (1992).
38. Bernardi, G. et al. The mosaic genome of warm-blooded vertebrates. Science 228; 953±958 (1985).
39. The MHC sequencing consortium. Complete sequence and gene map of a human major histocom-
patibility complex. Nature 401, 921±923 (1999).
40. Bernardi, G. The isochore organization of the human genome. Annu. Rev. Genet. 23, 637±661 (1989).
41. Collins, J. E., Mungall, A. J., Badcock, K. L., Fay, J. M. & Dunham, I. The organization of the gamma-
glutamyl transferase genes and other low copy repeats in human chromosome 22q11. Genome Res. 7,
522±531 (1997).
42. Edelman, L. et al. A common molecular basis for rearrangement disorders on chromosome 22q11.
Hum. Mol. Genet. 8, 1157±1167 (1999).
43. Eppig, J. T. & Nadeau, J. H. Comparative maps: the mammalian jigsaw puzzle. Curr. Opin. Genet. Dev.
5, 709±716 (1995).
44. Bucan, M. et al. Comparative mapping of 9 human chromosome 22q loci in the laboratory mouse.
Hum. Mol. Genet. 2, 1245±1252 (1993).
45. Carver, E. A. & Stubbs, L. Zooming in on the human-mouse comparative map: genome conservation
re-examined on a high-resolution scale. Genome Res. 7, 1123±1137 (1997).
46. Puech, A. et al. Comparative mapping of the human 22q11 chromosomal region and the orthologous
region in mice reveals complex changes in gene organization. Proc. Natl Acad. Sci. USA 94, 14608±
14613 (1997).
47. Bentley, D. R. Genomic sequence information should be released immediately and freely in the public
domain. Science 274, 533±534 (1996).
48. Guyer, M. Statement on the rapid release of genomic DNA sequence. Genome Res. 8, 413 (1998).
49. Dunham, I., Dewar, K., Kim, U.-J. & Ross, M. T. in Genome Analysis: A Laboratory Manual Series,
Volume 3: Cloning Systems (eds Birren, B. et al.) 1±86 (Cold Spring Harbor Laboratory Press, Cold
Spring Harbor, New York, 1999).
50. Asakawa, S. et al. Human BAC library: construction and rapid screening. Gene 191; 69±79 (1997).
Supplementary information is available on Nature's World-Wide Web site (http://www.nature.com) or as paper copy from the London editorial of®ce of Nature.
Acknowledgements
We thank S. Povey, J. White and H. Wain for the help with gene nomenclature, andM. Adams for making available the sequence trace ®les of U62317. We thank M. Elharam,H. Jia, L. Lane, R. Morales-Diaz, F. Najar, P. Pham, R. Rahhal, M. Rao, Y. Tilahun, R. Wayt,H. Wright, E. Nakato, J. L. Schmeits, K. Schooler, J. Wang, M. Asahina, M. Takahashi,H. Harigai, Y. G. Xie, F. Y. Han, S. Swahn, B. Funke, R. K. Pandita, C. Chieffo, D. Michaudand all members of the Sanger Centre past and present for their assistance. This work wassupported by grants from the Wellcome Trust, the NIH National Human GenomeResearch Institute to B.A.R. and to B.S.E., the NSF to B.A.R., the University of Oklahoma,the Fund for the Human Genome Sequencing Project of Japan Science and TechnologyCorporation, the Fund for the `Research for the Future' Program from the Japan Societyfor the Promotion of Science, the UK Medical Research Council, the Medical ResearchCouncil of Canada to H.E.M., the Swedish Cancer Foundation, the Swedish MedicalResearch Council, and a Senior/Established Investigator Award from the Swedish CancerFoundation to J.P.D.
Correspondence and requests for materials should be addressed to I.D.(e-mail: [email protected]).
articles
NATURE | VOL 402 | 2 DECEMBER 1999 | www.nature.com 495
Contributors: I. Dunham1, A. R. Hunt1, J. E. Collins1, R. Bruskiewich1, D. M. Beare1, M. Clamp1, L. J. Smink1, R. Ainscough1, J. P. Almeida1, A. Babbage1, C. Bagguley1, J. Bailey1,K. Barlow1, K. N. Bates1, O. Beasley1, C. P. Bird1, S. Blakey1, A. M. Bridgeman1*, D. Buck1*, J. Burgess1*, W. D. Burrill1, J. Burton1, C. Carder1, N. P. Carter1, Y. Chen1, G. Clark1,S. M. Clegg1, V. Cobley1, C. G. Cole1, R. E. Collier1, R. E. Connor1*, D. Conroy1*, N. Corby1, G. J. Coville1, A. V. Cox1, J. Davis1*, E. Dawson1, P. D. Dhami1, C. Dockree1,S. J. Dodsworth1*, R. M. Durbin1, A. Ellington1, K. L. Evans1, J. M. Fey1, K. Fleming1, L. French1, A. A. Garner1, J. G. R. Gilbert1, M. E. Goward, D. Grafham1, M. N. Grif®ths1,C. Hall1*, R. Hall1, G. Hall-Tamlyn1, R. W. Heathcott1*, S. Ho1*, S. Holmes1, S. E. Hunt1, M. C. Jones1, J. Kershaw1, A. Kimberley1, A. King1, G. K. Laird1, C. F. Langford1,M. A. Leversha1, C. Lloyd1, D. M. Lloyd1, I. D. Martyn1, M. Mashreghi-Mohammadi1, L. Matthews1, O. T. McCann1, J. McClay1, S. McLaren1, A. A. McMurray1, S. A. Milne1,B. J. Mortimore1, C. N. Odell1, R. Pavitt1, A. V. Pearce1, D. Pearson1, B. J. Phillimore1, S. H. Phillips1, R. W. Plumb1, H. Ramsay1, Y. Ramsey1, L. Rogers1, M. T. Ross1, C. E. Scott1,H. K. Sehra1, C. D. Skuce1, S. Smalley1, M. L. Smith1, C. Soderlund1, L. Spragon1, C. A. Steward1, J. E. Sulston1, R. M. Swann1, M. Vaudin1*, M. Wall1, J. M. Wallis1,M. N. Whiteley1*, D. Willey1, L. Williams1, S. Williams1, H. Williamson1*, T. E. Wilmer1, L. Wilming1, C. L. Wright1, T. Hubbard1, D. R. Bentley1, S. Beck1, J. Rogers1, N.Shimizu2,S. Minoshima2, K. Kawasaki2, T. Sasaki2, S. Asakawa2, J. Kudoh2, A. Shintani2, K. Shibuya2, Y. Yoshizaki2, N. Aoki2, S. Mitsuyama2, B. A. Roe3, F. Chen3, L. Chu3, J. Crabtree3,S. Deschamps3, A. Do3, T. Do3, A. Dorman3, F. Fang3, Y. Fu1, P. Hu3, A. Hua3, S. Kenton3, H. Lai3, H. I. Lao3, J. Lewis3, S. Lewis3, S.-P. Lin3, P. Loh3, E. Malaj3, T. Nguyen3, H. Pan3,S. Phan3, S. Qi3, Y. Qian3, L. Ray3, Q. Ren3, S. Shaull3, D. Sloan3, L. Song3, Q. Wang3, Y. Wang3, Z. Wang3, J. White3, D. Willingham3, H. Wu3, Z. Yao3, M. Zhan3, G. Zhang3,S. Chissoe4, J. Murray4, N. Miller4, P. Minx4, R. Fulton4, D. Johnson4, G. Bemis4, D. Bentley4, H. Bradshaw4, S. Bourne4, M. Cordes4, Z. Du4, L. Fulton4, D. Goela4, T. Graves4,J. Hawkins4, K. Hinds4, K. Kemp4, P. Latreille4, D. Layman4, P. Ozersky4, T. Rohl®ng4, P. Scheet4, C. Walker4, A. Wamsley4, P. Wohldmann4, K. Pepin4, J. Nelson4, I. Korf4,J. A. Bedell4, L. Hillier4, E. Mardis4, R. Waterston4, R. Wilson4, B. S. Emanuel5, T. Shaikh5, H. Kurahashi5, S. Saitta5, M. L. Budarf6, H. E. McDermid6, A. Johnson6, A. C. C. Wong6,B. E. Morrow7, L. Edelmann7, U. J. Kim8, H. Shizuya8, M. I. Simon8, J. P. Dumanski9, M. Peyrard9, D. Kedra9, E. Seroussi9, I. Fransson9, I. Tapia9, C. E. Bruder9,K. P. O'Brien9.
Addresses: 1, The Sanger Centre, Wellcome Trust Genome Campus, Hinxton, Cambridge CB10 1SA, UK; 2, Department of Molecular Biology, Keio University School of Medicine,35 Shinanomachi, Shinjuku-ku, Tokyo 160-8582, Japan; 3, Department of Chemistry and Biochemistry, The University of Oklahoma, 620 Parrington Oval, Room 311, Norman, Oklahoma73019, USA; 4, Genome Sequencing Center, Washington University School of Medicine, 4444 Forest Park Blvd, St. Louis, Missouri 63108, USA 5, Division of Human Genetics and MolecularBiology, The Children's Hospital of Philadelphia and the Department of Pediatrics, University of Pennsylvania School of Medicine, Philadelphia, Pennsylvania 19104, USA; 6, Department ofBiological Sciences, University of Alberta, Edmonton, Alberta, T6G 2E9, Canada; 7, Department of Molecular Genetics, Albert Einstein College of Medicine, 1300 Morris Park Avenue, Bronx,New York 10461, USA; 8, California Institute of Technology, Division of Biology, Pasadena, California 91125, USA; 9, Department of Molecular Medicine, Clinical Genetics Unit, KarolinskaHospital, CMM bldg. L8:00, 17176 Stockholm, Sweden
* Present addresses: Division of Virology, Department of Pathology, Tennis Court Road, Cambridge CB12 1QP, UK (A. M. Bridgeman); Lark Technologies, Radwinter Road, Saffron WaldenEssex, CB11 3HY, UK (D. Buck, R. E. Connor, S. Ho); Australian Genome Research Facility, Gehrmann Laboratories, University of Queensland, St Lucia QLD 4072, Australia (J. Burgess, J.Davis); Incyte Europe Ltd, 214 Cambridge Science Park, Cambridge CB4 0WA, UK (D. Conroy); Tepnel Life Sciences, Innovation Centre, Scotscroft Building, Wilmslow Road, Didsbury,Manchester M20 8RY, UK (S. J. Dodsworth); Department of Brassica & Oilseeds Research, Cambridge Laboratory, John Innes Centre, Norwich, Norfolk, UK (C. Hall); Cancer Genetics Lab,Department of Biochemistry, University of Otago, P.O. Box 56, Dunedin, New Zealand (R. W. Heathcott); Dept. of Zoology, University of Cambridge, Downing Street, CB2 3EJ, UK (M. N.Whiteley); Monsanto, Genomic Team, Mail Zone N3SA, 800 North Lindbergh Boulevard, St. Louis, Missouri 63167, USA (M. Vaudin); Wellcome Trust Centre for Human Genetics, RooseveltDrive, Oxford OX3 7BN, UK (H. Williamson)
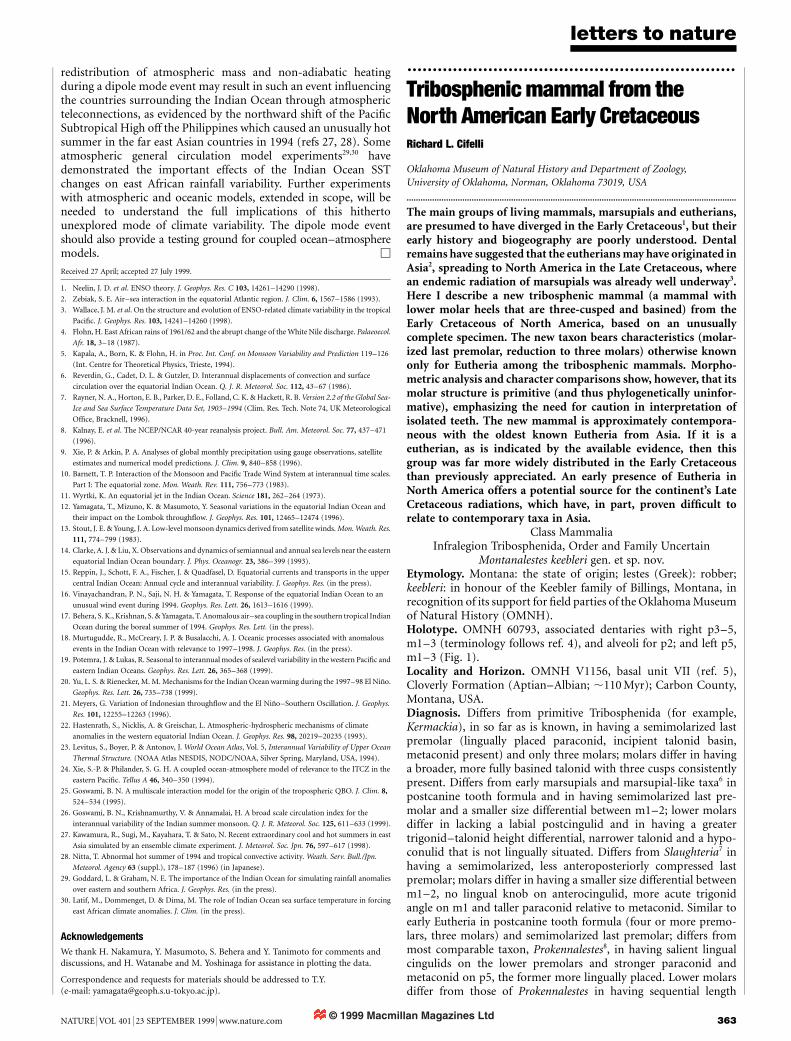
© 1999 Macmillan Magazines Ltd
letters to nature
NATURE | VOL 401 | 23 SEPTEMBER 1999 | www.nature.com 363
redistribution of atmospheric mass and non-adiabatic heatingduring a dipole mode event may result in such an event in¯uencingthe countries surrounding the Indian Ocean through atmosphericteleconnections, as evidenced by the northward shift of the Paci®cSubtropical High off the Philippines which caused an unusually hotsummer in the far east Asian countries in 1994 (refs 27, 28). Someatmospheric general circulation model experiments29,30 havedemonstrated the important effects of the Indian Ocean SSTchanges on east African rainfall variability. Further experimentswith atmospheric and oceanic models, extended in scope, will beneeded to understand the full implications of this hithertounexplored mode of climate variability. The dipole mode eventshould also provide a testing ground for coupled ocean±atmospheremodels. M
Received 27 April; accepted 27 July 1999.
1. Neelin, J. D. et al. ENSO theory. J. Geophys. Res. C 103, 14261±14290 (1998).
2. Zebiak, S. E. Air±sea interaction in the equatorial Atlantic region. J. Clim. 6, 1567±1586 (1993).
3. Wallace, J. M. et al. On the structure and evolution of ENSO-related climate variability in the tropical
Paci®c. J. Geophys. Res. 103, 14241±14260 (1998).
4. Flohn, H. East African rains of 1961/62 and the abrupt change of the White Nile discharge. Palaeoecol.
Afr. 18, 3±18 (1987).
5. Kapala, A., Born, K. & Flohn, H. in Proc. Int. Conf. on Monsoon Variability and Prediction 119±126
(Int. Centre for Theoretical Physics, Trieste, 1994).
6. Reverdin, G., Cadet, D. L. & Gutzler, D. Interannual displacements of convection and surface
circulation over the equatorial Indian Ocean. Q. J. R. Meteorol. Soc. 112, 43±67 (1986).
7. Rayner, N. A., Horton, E. B., Parker, D. E., Folland, C. K. & Hackett, R. B. Version 2.2 of the Global Sea-
Ice and Sea Surface Temperature Data Set, 1903±1994 (Clim. Res. Tech. Note 74, UK Meteorological
Of®ce, Bracknell, 1996).
8. Kalnay, E. et al. The NCEP/NCAR 40-year reanalysis project. Bull. Am. Meteorol. Soc. 77, 437±471
(1996).
9. Xie, P. & Arkin, P. A. Analyses of global monthly precipitation using gauge observations, satellite
estimates and numerical model predictions. J. Clim. 9, 840±858 (1996).
10. Barnett, T. P. Interaction of the Monsoon and Paci®c Trade Wind System at interannual time scales.
Part I: The equatorial zone. Mon. Weath. Rev. 111, 756±773 (1983).
11. Wyrtki, K. An equatorial jet in the Indian Ocean. Science 181, 262±264 (1973).
12. Yamagata, T., Mizuno, K. & Masumoto, Y. Seasonal variations in the equatorial Indian Ocean and
their impact on the Lombok through¯ow. J. Geophys. Res. 101, 12465±12474 (1996).
13. Stout, J. E. & Young, J. A. Low-level monsoon dynamics derived from satellite winds. Mon. Weath. Res.
111, 774±799 (1983).
14. Clarke, A. J. & Liu, X. Observations and dynamics of semiannual and annual sea levels near the eastern
equatorial Indian Ocean boundary. J. Phys. Oceanogr. 23, 386±399 (1993).
15. Reppin, J., Schott, F. A., Fischer, J. & Quadfasel, D. Equatorial currents and transports in the upper
central Indian Ocean: Annual cycle and interannual variability. J. Geophys. Res. (in the press).
16. Vinayachandran, P. N., Saji, N. H. & Yamagata, T. Response of the equatorial Indian Ocean to an
unusual wind event during 1994. Geophys. Res. Lett. 26, 1613±1616 (1999).
17. Behera, S. K., Krishnan, S. & Yamagata, T. Anomalous air±sea coupling in the southern tropical Indian
Ocean during the boreal summer of 1994. Geophys. Res. Lett. (in the press).
18. Murtugudde, R., McCreary, J. P. & Busalacchi, A. J. Oceanic processes associated with anomalous
events in the Indian Ocean with relevance to 1997±1998. J. Geophys. Res. (in the press).
19. Potemra, J. & Lukas, R. Seasonal to interannual modes of sealevel variability in the western Paci®c and
eastern Indian Oceans. Geophys. Res. Lett. 26, 365±368 (1999).
20. Yu, L. S. & Rienecker, M. M. Mechanisms for the Indian Ocean warming during the 1997±98 El NinÄo.
Geophys. Res. Lett. 26, 735±738 (1999).
21. Meyers, G. Variation of Indonesian through¯ow and the El NinÄo±Southern Oscillation. J. Geophys.
Res. 101, 12255±12263 (1996).
22. Hastenrath, S., Nicklis, A. & Greischar, L. Atmospheric-hydrospheric mechanisms of climate
anomalies in the western equatorial Indian Ocean. J. Geophys. Res. 98, 20219±20235 (1993).
23. Levitus, S., Boyer, P. & Antonov, J. World Ocean Atlas, Vol. 5, Interannual Variability of Upper Ocean
Thermal Structure. (NOAA Atlas NESDIS, NODC/NOAA, Silver Spring, Maryland, USA, 1994).
24. Xie, S.-P. & Philander, S. G. H. A coupled ocean-atmosphere model of relevance to the ITCZ in the
eastern Paci®c. Tellus A 46, 340±350 (1994).
25. Goswami, B. N. A multiscale interaction model for the origin of the tropospheric QBO. J. Clim. 8,
524±534 (1995).
26. Goswami, B. N., Krishnamurthy, V. & Annamalai, H. A broad scale circulation index for the
interannual variability of the Indian summer monsoon. Q. J. R. Meteorol. Soc. 125, 611±633 (1999).
27. Kawamura, R., Sugi, M., Kayahara, T. & Sato, N. Recent extraordinary cool and hot summers in east
Asia simulated by an ensemble climate experiment. J. Meteorol. Soc. Jpn. 76, 597±617 (1998).
28. Nitta, T. Abnormal hot summer of 1994 and tropical convective activity. Weath. Serv. Bull./Jpn.
Meteorol. Agency 63 (suppl.), 178±187 (1996) (in Japanese).
29. Goddard, L. & Graham, N. E. The importance of the Indian Ocean for simulating rainfall anomalies
over eastern and southern Africa. J. Geophys. Res. (in the press).
30. Latif, M., Dommenget, D. & Dima, M. The role of Indian Ocean sea surface temperature in forcing
east African climate anomalies. J. Clim. (in the press).
Acknowledgements
We thank H. Nakamura, Y. Masumoto, S. Behera and Y. Tanimoto for comments anddiscussions, and H. Watanabe and M. Yoshinaga for assistance in plotting the data.
Correspondence and requests for materials should be addressed to T.Y.(e-mail: [email protected]).
.................................................................Tribosphenic mammal from theNorth American Early CretaceousRichard L. Cifelli
Oklahoma Museum of Natural History and Department of Zoology,
University of Oklahoma, Norman, Oklahoma 73019, USA
..............................................................................................................................................
The main groups of living mammals, marsupials and eutherians,are presumed to have diverged in the Early Cretaceous1, but theirearly history and biogeography are poorly understood. Dentalremains have suggested that the eutherians may have originated inAsia2, spreading to North America in the Late Cretaceous, wherean endemic radiation of marsupials was already well underway3.Here I describe a new tribosphenic mammal (a mammal withlower molar heels that are three-cusped and basined) from theEarly Cretaceous of North America, based on an unusuallycomplete specimen. The new taxon bears characteristics (molar-ized last premolar, reduction to three molars) otherwise knownonly for Eutheria among the tribosphenic mammals. Morpho-metric analysis and character comparisons show, however, that itsmolar structure is primitive (and thus phylogenetically uninfor-mative), emphasizing the need for caution in interpretation ofisolated teeth. The new mammal is approximately contempora-neous with the oldest known Eutheria from Asia. If it is aeutherian, as is indicated by the available evidence, then thisgroup was far more widely distributed in the Early Cretaceousthan previously appreciated. An early presence of Eutheria inNorth America offers a potential source for the continent's LateCretaceous radiations, which have, in part, proven dif®cult torelate to contemporary taxa in Asia.
Class MammaliaInfralegion Tribosphenida, Order and Family Uncertain
Montanalestes keebleri gen. et sp. nov.Etymology. Montana: the state of origin; lestes (Greek): robber;keebleri: in honour of the Keebler family of Billings, Montana, inrecognition of its support for ®eld parties of the Oklahoma Museumof Natural History (OMNH).Holotype. OMNH 60793, associated dentaries with right p3±5,m1±3 (terminology follows ref. 4), and alveoli for p2; and left p5,m1±3 (Fig. 1).Locality and Horizon. OMNH V1156, basal unit VII (ref. 5),Cloverly Formation (Aptian±Albian; ,110 Myr); Carbon County,Montana, USA.Diagnosis. Differs from primitive Tribosphenida (for example,Kermackia), in so far as is known, in having a semimolarized lastpremolar (lingually placed paraconid, incipient talonid basin,metaconid present) and only three molars; molars differ in havinga broader, more fully basined talonid with three cusps consistentlypresent. Differs from early marsupials and marsupial-like taxa6 inpostcanine tooth formula and in having semimolarized last pre-molar and a smaller size differential between m1±2; lower molarsdiffer in lacking a labial postcingulid and in having a greatertrigonid±talonid height differential, narrower talonid and a hypo-conulid that is not lingually situated. Differs from Slaughteria7 inhaving a semimolarized, less anteroposteriorly compressed lastpremolar; molars differ in having a smaller size differential betweenm1±2, no lingual knob on anterocingulid, more acute trigonidangle on m1 and taller paraconid relative to metaconid. Similar toearly Eutheria in postcanine tooth formula (four or more premo-lars, three molars) and semimolarized last premolar; differs frommost comparable taxon, Prokennalestes8, in having salient lingualcingulids on the lower premolars and stronger paraconid andmetaconid on p5, the former more lingually placed. Lower molarsdiffer from those of Prokennalestes in having sequential length
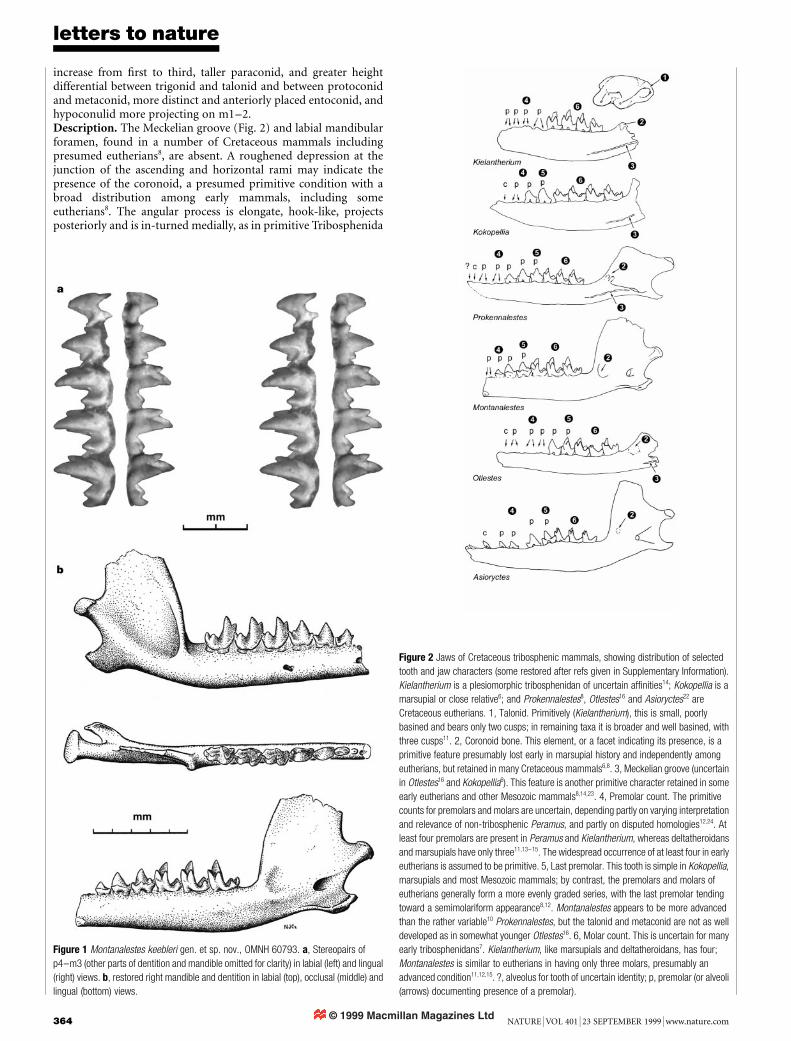
© 1999 Macmillan Magazines Ltd
letters to nature
364 NATURE | VOL 401 | 23 SEPTEMBER 1999 | www.nature.com
increase from ®rst to third, taller paraconid, and greater heightdifferential between trigonid and talonid and between protoconidand metaconid, more distinct and anteriorly placed entoconid, andhypoconulid more projecting on m1±2.Description. The Meckelian groove (Fig. 2) and labial mandibularforamen, found in a number of Cretaceous mammals includingpresumed eutherians8, are absent. A roughened depression at thejunction of the ascending and horizontal rami may indicate thepresence of the coronoid, a presumed primitive condition with abroad distribution among early mammals, including someeutherians8. The angular process is elongate, hook-like, projectsposteriorly and is in-turned medially, as in primitive Tribosphenida
Figure 1 Montanalestes keebleri gen. et sp. nov., OMNH 60793. a, Stereopairs of
p4±m3 (other parts of dentition and mandible omitted for clarity) in labial (left) and lingual
(right) views. b, restored right mandible and dentition in labial (top), occlusal (middle) and
lingual (bottom) views.
Figure 2 Jaws of Cretaceous tribosphenic mammals, showing distribution of selected
tooth and jaw characters (some restored after refs given in Supplementary Information).
Kielantherium is a plesiomorphic tribosphenidan of uncertain af®nities14; Kokopellia is a
marsupial or close relative6; and Prokennalestes8, Otlestes16 and Asioryctes22 are
Cretaceous eutherians. 1, Talonid. Primitively (Kielantherium), this is small, poorly
basined and bears only two cusps; in remaining taxa it is broader and well basined, with
three cusps11. 2, Coronoid bone. This element, or a facet indicating its presence, is a
primitive feature presumably lost early in marsupial history and independently among
eutherians, but retained in many Cretaceous mammals6,8. 3, Meckelian groove (uncertain
in Otlestes16 and Kokopellia6). This feature is another primitive character retained in some
early eutherians and other Mesozoic mammals8,14,23. 4, Premolar count. The primitive
counts for premolars and molars are uncertain, depending partly on varying interpretation
and relevance of non-tribosphenic Peramus, and partly on disputed homologies12,24. At
least four premolars are present in Peramus and Kielantherium, whereas deltatheroidans
and marsupials have only three11,13±15. The widespread occurrence of at least four in early
eutherians is assumed to be primitive. 5, Last premolar. This tooth is simple in Kokopellia,
marsupials and most Mesozoic mammals; by contrast, the premolars and molars of
eutherians generally form a more evenly graded series, with the last premolar tending
toward a semimolariform appearance8,12. Montanalestes appears to be more advanced
than the rather variable10 Prokennalestes, but the talonid and metaconid are not as well
developed as in somewhat younger Otlestes16. 6, Molar count. This is uncertain for many
early tribosphenidans7. Kielantherium, like marsupials and deltatheroidans, has four;
Montanalestes is similar to eutherians in having only three molars, presumably an
advanced condition11,12,15. ?, alveolus for tooth of uncertain identity; p, premolar (or alveoli
(arrows) documenting presence of a premolar).
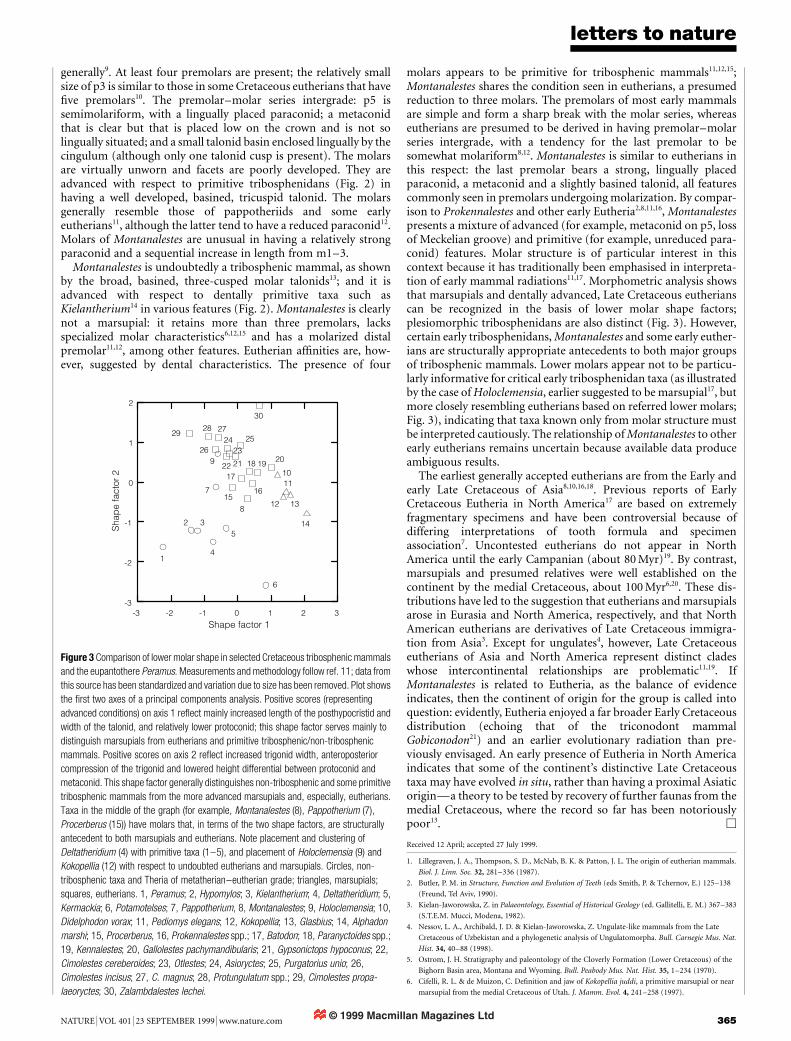
© 1999 Macmillan Magazines Ltd
letters to nature
NATURE | VOL 401 | 23 SEPTEMBER 1999 | www.nature.com 365
generally9. At least four premolars are present; the relatively smallsize of p3 is similar to those in some Cretaceous eutherians that have®ve premolars10. The premolar±molar series intergrade: p5 issemimolariform, with a lingually placed paraconid; a metaconidthat is clear but that is placed low on the crown and is not solingually situated; and a small talonid basin enclosed lingually by thecingulum (although only one talonid cusp is present). The molarsare virtually unworn and facets are poorly developed. They areadvanced with respect to primitive tribosphenidans (Fig. 2) inhaving a well developed, basined, tricuspid talonid. The molarsgenerally resemble those of pappotheriids and some earlyeutherians11, although the latter tend to have a reduced paraconid12.Molars of Montanalestes are unusual in having a relatively strongparaconid and a sequential increase in length from m1±3.
Montanalestes is undoubtedly a tribosphenic mammal, as shownby the broad, basined, three-cusped molar talonids13; and it isadvanced with respect to dentally primitive taxa such asKielantherium14 in various features (Fig. 2). Montanalestes is clearlynot a marsupial: it retains more than three premolars, lacksspecialized molar characteristics6,12,15 and has a molarized distalpremolar11,12, among other features. Eutherian af®nities are, how-ever, suggested by dental characteristics. The presence of four
molars appears to be primitive for tribosphenic mammals11,12,15;Montanalestes shares the condition seen in eutherians, a presumedreduction to three molars. The premolars of most early mammalsare simple and form a sharp break with the molar series, whereaseutherians are presumed to be derived in having premolar±molarseries intergrade, with a tendency for the last premolar to besomewhat molariform8,12. Montanalestes is similar to eutherians inthis respect: the last premolar bears a strong, lingually placedparaconid, a metaconid and a slightly basined talonid, all featurescommonly seen in premolars undergoing molarization. By compar-ison to Prokennalestes and other early Eutheria2,8,11,16, Montanalestespresents a mixture of advanced (for example, metaconid on p5, lossof Meckelian groove) and primitive (for example, unreduced para-conid) features. Molar structure is of particular interest in thiscontext because it has traditionally been emphasised in interpreta-tion of early mammal radiations11,17. Morphometric analysis showsthat marsupials and dentally advanced, Late Cretaceous eutherianscan be recognized in the basis of lower molar shape factors;plesiomorphic tribosphenidans are also distinct (Fig. 3). However,certain early tribosphenidans, Montanalestes and some early euther-ians are structurally appropriate antecedents to both major groupsof tribosphenic mammals. Lower molars appear not to be particu-larly informative for critical early tribosphenidan taxa (as illustratedby the case of Holoclemensia, earlier suggested to be marsupial17, butmore closely resembling eutherians based on referred lower molars;Fig. 3), indicating that taxa known only from molar structure mustbe interpreted cautiously. The relationship of Montanalestes to otherearly eutherians remains uncertain because available data produceambiguous results.
The earliest generally accepted eutherians are from the Early andearly Late Cretaceous of Asia8,10,16,18. Previous reports of EarlyCretaceous Eutheria in North America17 are based on extremelyfragmentary specimens and have been controversial because ofdiffering interpretations of tooth formula and specimenassociation7. Uncontested eutherians do not appear in NorthAmerica until the early Campanian (about 80 Myr)19. By contrast,marsupials and presumed relatives were well established on thecontinent by the medial Cretaceous, about 100 Myr6,20. These dis-tributions have led to the suggestion that eutherians and marsupialsarose in Eurasia and North America, respectively, and that NorthAmerican eutherians are derivatives of Late Cretaceous immigra-tion from Asia3. Except for ungulates4, however, Late Cretaceouseutherians of Asia and North America represent distinct cladeswhose intercontinental relationships are problematic11,19. IfMontanalestes is related to Eutheria, as the balance of evidenceindicates, then the continent of origin for the group is called intoquestion: evidently, Eutheria enjoyed a far broader Early Cretaceousdistribution (echoing that of the triconodont mammalGobiconodon21) and an earlier evolutionary radiation than pre-viously envisaged. An early presence of Eutheria in North Americaindicates that some of the continent's distinctive Late Cretaceoustaxa may have evolved in situ, rather than having a proximal AsiaticoriginÐa theory to be tested by recovery of further faunas from themedial Cretaceous, where the record so far has been notoriouslypoor13. M
Received 12 April; accepted 27 July 1999.
1. Lillegraven, J. A., Thompson, S. D., McNab, B. K. & Patton, J. L. The origin of eutherian mammals.
Biol. J. Linn. Soc. 32, 281±336 (1987).
2. Butler, P. M. in Structure, Function and Evolution of Teeth (eds Smith, P. & Tchernov, E.) 125±138
(Freund, Tel Aviv, 1990).
3. Kielan-Jaworowska, Z. in Palaeontology, Essential of Historical Geology (ed. Gallitelli, E. M.) 367±383
(S.T.E.M. Mucci, Modena, 1982).
4. Nessov, L. A., Archibald, J. D. & Kielan-Jaworowska, Z. Ungulate-like mammals from the Late
Cretaceous of Uzbekistan and a phylogenetic analysis of Ungulatomorpha. Bull. Carnegie Mus. Nat.
Hist. 34, 40±88 (1998).
5. Ostrom, J. H. Stratigraphy and paleontology of the Cloverly Formation (Lower Cretaceous) of the
Bighorn Basin area, Montana and Wyoming. Bull. Peabody Mus. Nat. Hist. 35, 1±234 (1970).
6. Cifelli, R. L. & de Muizon, C. De®nition and jaw of Kokopellia juddi, a primitive marsupial or near
marsupial from the medial Cretaceous of Utah. J. Mamm. Evol. 4, 241±258 (1997).
-3 -2 -1 0 1 2 3
Shape factor 1
-3
-2
-1
0
1
2
Sha
pe
fact
or 2
1
2 3
4
5
6
7
8
91011
12 13
14
1516
17
18 19 202122
2324 25
26
272829
30
Figure 3 Comparison of lower molar shape in selected Cretaceous tribosphenic mammals
and the eupantothere Peramus. Measurements and methodology follow ref. 11; data from
this source has been standardized and variation due to size has been removed. Plot shows
the ®rst two axes of a principal components analysis. Positive scores (representing
advanced conditions) on axis 1 re¯ect mainly increased length of the posthypocristid and
width of the talonid, and relatively lower protoconid; this shape factor serves mainly to
distinguish marsupials from eutherians and primitive tribosphenic/non-tribosphenic
mammals. Positive scores on axis 2 re¯ect increased trigonid width, anteroposterior
compression of the trigonid and lowered height differential between protoconid and
metaconid. This shape factor generally distinguishes non-tribosphenic and some primitive
tribosphenic mammals from the more advanced marsupials and, especially, eutherians.
Taxa in the middle of the graph (for example, Montanalestes (8), Pappotherium (7),
Procerberus (15)) have molars that, in terms of the two shape factors, are structurally
antecedent to both marsupials and eutherians. Note placement and clustering of
Deltatheridium (4) with primitive taxa (1±5), and placement of Holoclemensia (9) and
Kokopellia (12) with respect to undoubted eutherians and marsupials. Circles, non-
tribosphenic taxa and Theria of metatherian±eutherian grade; triangles, marsupials;
squares, eutherians. 1, Peramus; 2, Hypomylos; 3, Kielantherium; 4, Deltatheridium; 5,
Kermackia; 6, Potamotelses; 7, Pappotherium, 8, Montanalestes; 9, Holoclemensia; 10,
Didelphodon vorax; 11, Pediomys elegans; 12, Kokopellia; 13, Glasbius; 14, Alphadon
marshi; 15, Procerberus, 16, Prokennalestes spp.; 17, Batodon; 18, Paranyctoides spp.;
19, Kennalestes; 20, Gallolestes pachymandibularis; 21, Gypsonictops hypoconus; 22,
Cimolestes cereberoides; 23, Otlestes; 24, Asioryctes; 25, Purgatorius unio; 26,
Cimolestes incisus; 27, C. magnus; 28, Protungulatum spp.; 29, Cimolestes propa-
laeoryctes; 30, Zalambdalestes lechei.
© 1999 Macmillan Magazines Ltd
letters to nature
366 NATURE | VOL 401 | 23 SEPTEMBER 1999 | www.nature.com
7. Butler, P. M. A new interpretation of the mammalian teeth of triposphenic pattern from the Albian of
Texas. Breviora 446, 1±27 (1978).
8. Kielan-Jaworowska, Z. & Dashzeveg, D. Eutherian mammals from the Early Cretaceous of Mongolia.
Zool. Scripta 18, 347±355 (1989).
9. Novacek, M. J. The skull of leptictid insectivorans and the higher-level classi®cation of eutherian
mammals. Bull. Am. Mus. Nat. Hist. 183, 1±112 (1986).
10. Sigogneau-Russell, D., Dashzeveg, D. & Russell, D. E. Further data on Prokennalestes (Mammalia,
Eutheria inc. sed.) from the Early Cretaceous of Mongolia. Zool. Scripta 21, 205±209 (1992).
11. Butler, P. M. Early trends in the evolution of tribosphenic molars. Biol. Rev. 65, 529±552 (1990).
12. Clemens, W. A. Jr & Lillegraven, J. A. New Late Cretaceous, North American advanced therian
mammals that ®t neither the marsupial nor eutherian molds. Contrib. Geol. Univ. Wyoming 3, 55±85
(1986).
13. Lillegraven, J. A., Kielan-Jaworowska, Z. & Clemens, W. A. Jr (eds) Mesozoic MammalsÐthe First Two-
thirds of Mammalian History (Univ. of California Press, Berkeley, 1979).
14. Dashzeveg, D. & Kielan-Jaworowska, Z. The lower jaw of an aegialodontid mammal from the Early
Cretaceous of Mongolia. Zool. J. Linn. Soc. 82, 217±227 (1984).
15. Rougier, G. W., Wible, J. R. & Novacek, M. J. Implications of Deltatheridium specimens for early
marsupial history. Nature 396, 459±463 (1998).
16. Nessov, L. A., Sigogneau-Russell, D. & Russell, D. E. A survey of Cretaceous tribosphenic mammals
from middle Asia (Uzbekistan, Kazakhstan and Tajikistan), of their geological setting, age and faunal
environment. Palaeovert. 23, 51±92 (1994).
17. Slaughter, B. H. Mid-Cretaceous (Albian) therians of the Butler Farm local fauna, Texas. Zool. J. Linn.
Soc. 50 (suppl.), 131±143 (1971).
18. Wang, Y. Q., Hu, Y.-M., Chow, M.-C. & Li, C.-K. in Sixth Symposium on Mesozoic Terrestrial
Ecosystems (eds Sun, A.-L. & Wang, Y.-Q.) 221±228 (China Ocean, Beijing, 1995).
19. Fox, R. C. Paranyctoides male®cus (new species), an early eutherian mammal from the Cretaceous of
Alberta. Spec. Publ. Carnegie Mus. Nat. Hist. 9, 9±20 (1984).
20. Cifelli, R. L. et al. in Vertebrate Fossils of Utah (ed. Gillette, D. D.) 219±242 (Utah Geological Survey,
Salt Lake City, 1999).
21. Jenkins, F. A. Jr & Schaff, C. R. The Early Cretaceous mammal Gobiconodon (Mammalia, Tricono-
donta) from the Cloverly Formation in Montana. J. Vert. Paleontol. 8, 1±24 (1988).
22. Kielan-Jaworowska, Z. Evolution of the therian mammals in the Late Cretaceous of Asia. Part II.
Postcranial skeleton in Kennalestes and Asioryctes. Palaeontol. Pol. 37, 65±83 (1974).
23. Luo, Z. in In the Shadow of the DinosaursÐEarly Mesozoic Tetrapods (eds Fraser, N. C. & Sues, H.-D.)
98±128 (Cambridge Univ. Press, Cambridge, 1994).
24. Luckett, W. P. in Mammal Phylogeny, volume 2ÐMesozoic Differentiation, Multituberculates, Mono-
tremes, Early Therians, and Marsupials (eds Szalay, F. S., Novacek, M. J. & McKenna, M. C.) 182±204
(Springer, New York, 1993).
Supplementary Information is available on Nature's World-Wide Web site (http:www.nature.com) or as paper copy from the London editorial of®ce of Nature.
Acknowledgements
I thank W. D. Maxwell and D. Smith for their collaboration in ®eld activities, S. K. Madsenfor fossil preparation, N. J. Czaplewski for illustration, M. Kyte for cooperation of the USBLM, W. Helmer and C. Nomee for the cooperation of the Crow Tribe, and P. Butler forvarious help. Funding was provided by the National Geographic Society and the NSF.
Correspondence and requests for materials should be addressed to R.L.C.
.................................................................Oldest playable musicalinstruments found at Jiahuearly Neolithic site in ChinaJuzhong Zhang*², Garman Harbottle³, Changsui Wang²& Zhaochen Kong§
* Institute of Cultural Relics and Archaeology of Henan Province,Zhengzhou, Henan, China 450000² Archaeometry Laboratory, University of Science and Technology of China, Hefei,
Anhui, China 230026³ Chemistry Department, Brookhaven National Laboratory, Upton,New York 11973, USA
§ Paleobotany Laboratory, Institute of Botany, Academia Sinica, Beijing,
China 100080
..............................................................................................................................................
Excavations at the early Neolithic site of Jiahu1,2 in HenanProvince, China have produced what may be the earliest complete,playable, tightly-dated multinote musical instruments. Jiahu wasoccupied from 7000 BC to 5700 BC, considerably antedating thewell known Peiligang culture3±5. Here we describe six exquisitelymade complete ¯utes which were found in radiocarbon-datedexcavation layers, along with fragments of perhaps 30 more. The
¯utes are made from the ulnae of the red-crowned crane (Grusjaponensis Millen) and have 5, 6, 7 and 8 holes. The best preserved¯ute has been played and tonally analysed. In addition to earlymusical artefacts, the archaeological record at Jiahu1,2 containsimportant information on the very foundations of Chinesesociety. We describe the archaeological characteristics of theJiahu site, details concerning its dating, its place in the prehistoryof the Chinese Neolithic, the ethnicity of its population and theresults of a tonal analysis of a nearly 9,000-year-old musicalinstrument found there.
Jiahu lies in the `Central Yellow River Valley'3 in mid-HenanProvince, east of Mount Funiu and bounded by the ¯ood plains ofthe Ni river to the south and the Sha river to the north. It wasdiscovered by Zhu Zhi in 1962 but its signi®cance was not fullyappreciated until other sites related to the Peiligang culture3±5 hadbeen excavated. Jiahu is an irregular ellipse, 275 m long (east±west)and 260 m wide (north±south). Below a modern agricultural layerof loess 0.3±1.0 m deep lies a layer of the Han Dynasty (206 BC±AD 220), and beneath this Neolithic layers which together are 0.5±0.9 m thick. Of Jiahu's 55,000 m2, only 2,400 m2 (4.4%) have beenexcavated, revealing 45 house foundations, 370 cellars, 9 potterykilns, more than 300 graves and thousands of artefacts made out ofbone, pottery, stone and other materials. There are three sub-periods at Jiahu; during the latest two the site shows distinct areasfor residences, workshops and graves1. The differential furnishing ofthe graves provides evidence for early social strati®cation. Jiahuappears to represent an organized, well established sedentary villageof long duration in the very early Chinese Neolithic.
The dating of Jiahu is crucial. So far we have determined twenty14C dates: nine from charcoal (three in each of the three sub-periodsmentioned above), ®ve from plant ash, four from human bone,one from a whole fruit pit and one from a broken grain ofcarbonized rice. The conventional 14C ages range from 7,017 to8,285 14C years BP. After dendrochronological correction the corre-sponding range is 7,700 to 9,000 calendar years BP or nearly 5700 to7000 cal. (calibrated) BC. The three sub-periods are dated as follows:the oldest is 6600±7000 cal. BC; the second oldest 6200±6600 cal. BC;and the third ,5700±6200 cal. BC. Thus, Jiahu spans some 1,300years. If this range of dates is borne out by subsequent research, thenJiahu represents a Neolithic cultural phase distinctly earlier at itsinception than the Peiligang culture, where the dates of many of thesites range from 5100 BC to 6300 BC
3±5. On the basis of these dates,and considering the repertoire of ceramic shapes and stone tools1,we would tentatively characterize Jiahu as a culture parallel to,overlapping in duration, and very possibly related to, the Peiligang.The same might apply to the site of Houli in the eastern YellowRiver Valley (north-central Shandong Province), dated 5000 BC
to 6200 BC3. For the 14C determinations, see Supplementary
Information.A careful study of the bones of 400 individuals removed from
more than 300 graves indicates that the Jiahu ethnic group may beidenti®ed with the North Asian Mongolian group, and also with theXiawanggang and Miaodigou groups in Henan Province and theDawenkou, Yedian and Xixiahou groups that were later found inShandong Province. The range of male heights was from 170 to180 cm. In the late Palaeolithic Zhoukoudian Cave, `unspecialized'
Table 1 Analysis of intervals of ¯ute M282:20
Location of interval Average value in cents14 Musical description.............................................................................................................................................................................
Between hole 1 and hole 2 284 Minor third.............................................................................................................................................................................
Between hole 2 and hole 3 244 Slightly larger than majorsecond (a whole tone)
.............................................................................................................................................................................
Between hole 7 and tube sound 260 Slightly smaller than minorthird, slightly larger than awhole note.
.............................................................................................................................................................................