Erosional effects on terrestrial resources over the last millennium in Reykjanes, southwest Iceland
13
Erosional effects on terrestrial resources over the last millennium in Reykjanes, southwest Iceland ☆ Guðrún Gísladóttir a,b, ⁎, Egill Erlendsson a,b , Rattan Lal c , Jerry Bigham c a Department of Geography and Tourism, Faculty of Life and Environmental Sciences, University of Iceland, 101 Reykjavík, Iceland b Institute of Earth Sciences, University of Iceland, 101 Reykjavík, Iceland c School of Environment and Natural Resources, The Ohio State University, Columbus, OH 3421-1085, USA abstract article info Article history: Received 15 December 2007 Available online 10 November 2009 Keywords: Erosion Soil accumulation Soil quality Soil organic carbon Carbon sequestration Vegetation change Iceland The study presents the effect of soil erosion on vegetation, soil accumulation (SA), SA rate (SAR), soil quality, soil mass, and the soil organic carbon (SOC) pool in Brown Andosols and Histosols in a 24-km 2 area in southwest Iceland. Undisturbed prehistoric soils were distinguished from disturbed historic soils using tephrochronology. Soil erosion has been severe during historic time (last 1135 yr), resulting in the increase of the soil mass deposited in soils covered by vegetation by a factor of 7.3–9.2 and net loss of soil in unvegetated areas. The SAR correlated positively with SOC sequestration. SOC is easily transported and, given the extensive accumulation of soil, the net effect of burial and subsequent reduction in decomposition is to increase SOC storage. Nevertheless, the increased accumulation and soil depletion has decreased soil quality, including the SOC, and reduced soil resistance to erosion with the depleted SOC contributing to enrichment of atmospheric CO 2 . The initial terrestrial disturbance was triggered by anthropogenic land use during the Medieval Warm Period, followed by volcanic activity approximately three centuries later. The combination of harsh climate during the Little Ice Age and drastic anthropogenic perturbations has led to land degradation at a catastrophic scale. © 2009 University of Washington. Published by Elsevier Inc. All rights reserved. Introduction The Icelandic environment has been strongly influenced by natural processes during the Holocene. Since settlement in AD 874, the introduction of grazing animals and other land use has drastically affected the natural environment. This includes the diminishing of the birch (Betula pubescens) woodlands and other vegetative cover (Hallsdóttir, 1987; Edwards et al., 2005; Erlendsson, 2007; Gathorne- Hardy et al., 2009), which has led to soil exposure and accelerated erosion over large areas, especially when in conjunction with harsh climate (e.g., Gísladóttir 1998; Arnalds et al., 2001; Ólafsdóttir and Guðmundsson, 2002; Gisladottir et al., 2005; Dugmore et al., 2009). This has specifically impacted processes and properties of volcanic soils (Andosols), which are subject to cryoturbation, landslide and acceler- ated erosion by wind and water (Wada, 1985; Arnalds, 2004, 2008). While approximately 46% of the land surface in Iceland has sustained continuous vegetation cover, large areas have lost some or all of their soil cover formed during the postglacial era. Elsewhere, remaining soils have sparse or no vegetation cover (Gísladóttir, 1998; Guðjónsson and Gíslason, 1988; Arnalds et al., 2001), thus impairing soil carbon (C) sequestration. Among their multifunctional roles, soils support plant growth, increase soil biotic activity, enhance nutrient storage and strengthen the cycling of water and nutrients. In contrast, soil degradation by accelerated erosion and other processes impairs soil quality, reduces soil structure and depletes the soil organic matter (SOM) pool (e.g., Brady and Weil, 2002; Lal, 2003). Depletion of the SOM pool has also global implications because the terrestrial C pool is the third largest pool (Batjes, 1996) and strongly impacts the global C cycle (Lal, 2004). Erosional–depositional processes affect soil organic C (SOC) distri- bution in two ways: it is depleted by erosion and increased by deposition. Some SOC-enriched sediments are redistributed over the landscape, while others are deposited in depression sites and transported into aquatic ecosystems (e.g., Stallard, 1998; Jacinthe and Lal, 2001; Smith et al., 2001; Lal, 2004; Rodríguez et al., 2004; Geirsdóttir et al., 2009; Gathorne-Hardy et al., 2009). SOC decompo- sition processes are severely constrained in some environmental settings and any SOC buried under anaerobic conditions is protected against decomposition. Yet, the impact of the SOC transported by erosional processes (e.g., Óskarsson et al., 2004) and redistributed over the landscape is not fully understood because the variability in its turnover characteristics has not been widely studied (Smith et al., 2001). Thus, the fate of C transported by erosional processes remains a debatable issue: is soil erosion a source or a sink of atmospheric CO 2 ? (e.g., Behre et al., 2007). Quaternary Research 73 (2010) 20–32 ☆ Soil erosion and terrestrial resources. ⁎ Corresponding author. Department of Geography and Tourism, and Institute of Earth Sciences, Sturlugata 7, University of Iceland, 101 Reykjavík, Iceland. E-mail address: [email protected] (G. Gísladóttir). 0033-5894/$ – see front matter © 2009 University of Washington. Published by Elsevier Inc. All rights reserved. doi:10.1016/j.yqres.2009.09.007 Contents lists available at ScienceDirect Quaternary Research journal homepage: www.elsevier.com/locate/yqres
-
Upload
independent -
Category
Documents
-
view
0 -
download
0
Transcript of Erosional effects on terrestrial resources over the last millennium in Reykjanes, southwest Iceland
Quaternary Research 73 (2010) 20–32
Contents lists available at ScienceDirect
Quaternary Research
j ourna l homepage: www.e lsev ie r.com/ locate /yqres
Erosional effects on terrestrial resources over the last millennium in Reykjanes,southwest Iceland☆
Guðrún Gísladóttir a,b,⁎, Egill Erlendsson a,b, Rattan Lal c, Jerry Bigham c
a Department of Geography and Tourism, Faculty of Life and Environmental Sciences, University of Iceland, 101 Reykjavík, Icelandb Institute of Earth Sciences, University of Iceland, 101 Reykjavík, Icelandc School of Environment and Natural Resources, The Ohio State University, Columbus, OH 3421-1085, USA
☆ Soil erosion and terrestrial resources.⁎ Corresponding author. Department of Geography
Earth Sciences, Sturlugata 7, University of Iceland, 101 RE-mail address: [email protected] (G. Gísladóttir).
0033-5894/$ – see front matter © 2009 University of Wdoi:10.1016/j.yqres.2009.09.007
a b s t r a c t
a r t i c l e i n f oArticle history:Received 15 December 2007Available online 10 November 2009
Keywords:ErosionSoil accumulationSoil qualitySoil organic carbonCarbon sequestrationVegetation changeIceland
The study presents the effect of soil erosion on vegetation, soil accumulation (SA), SA rate (SAR), soil quality,soil mass, and the soil organic carbon (SOC) pool in Brown Andosols and Histosols in a 24-km2 area insouthwest Iceland. Undisturbed prehistoric soils were distinguished from disturbed historic soils usingtephrochronology. Soil erosion has been severe during historic time (last 1135 yr), resulting in the increaseof the soil mass deposited in soils covered by vegetation by a factor of 7.3–9.2 and net loss of soil inunvegetated areas. The SAR correlated positively with SOC sequestration. SOC is easily transported and, giventhe extensive accumulation of soil, the net effect of burial and subsequent reduction in decomposition is toincrease SOC storage. Nevertheless, the increased accumulation and soil depletion has decreased soil quality,including the SOC, and reduced soil resistance to erosion with the depleted SOC contributing to enrichmentof atmospheric CO2. The initial terrestrial disturbance was triggered by anthropogenic land use during theMedieval Warm Period, followed by volcanic activity approximately three centuries later. The combination ofharsh climate during the Little Ice Age and drastic anthropogenic perturbations has led to land degradation ata catastrophic scale.
© 2009 University of Washington. Published by Elsevier Inc. All rights reserved.
Introduction
The Icelandic environment has been strongly influenced by naturalprocesses during the Holocene. Since settlement in AD 874, theintroduction of grazing animals and other land use has drasticallyaffected the natural environment. This includes the diminishing of thebirch (Betula pubescens) woodlands and other vegetative cover(Hallsdóttir, 1987; Edwards et al., 2005; Erlendsson, 2007; Gathorne-Hardy et al., 2009), which has led to soil exposure and acceleratederosion over large areas, especially when in conjunction with harshclimate (e.g., Gísladóttir 1998; Arnalds et al., 2001; Ólafsdóttir andGuðmundsson, 2002; Gisladottir et al., 2005; Dugmore et al., 2009). Thishas specifically impacted processes and properties of volcanic soils(Andosols), which are subject to cryoturbation, landslide and acceler-ated erosion by wind and water (Wada, 1985; Arnalds, 2004, 2008).
While approximately 46% of the land surface in Iceland hassustained continuous vegetation cover, large areas have lost some orall of their soil cover formed during the postglacial era. Elsewhere,remaining soils have sparse or no vegetation cover (Gísladóttir, 1998;Guðjónsson and Gíslason, 1988; Arnalds et al., 2001), thus impairing
and Tourism, and Institute ofeykjavík, Iceland.
ashington. Published by Elsevier I
soil carbon (C) sequestration. Among their multifunctional roles, soilssupport plant growth, increase soil biotic activity, enhance nutrientstorage and strengthen the cycling of water and nutrients. In contrast,soil degradation by accelerated erosion and other processes impairssoil quality, reduces soil structure and depletes the soil organic matter(SOM) pool (e.g., Brady and Weil, 2002; Lal, 2003). Depletion of theSOM pool has also global implications because the terrestrial C pool isthe third largest pool (Batjes, 1996) and strongly impacts the global Ccycle (Lal, 2004).
Erosional–depositional processes affect soil organic C (SOC) distri-bution in two ways: it is depleted by erosion and increased bydeposition. Some SOC-enriched sediments are redistributed over thelandscape, while others are deposited in depression sites andtransported into aquatic ecosystems (e.g., Stallard, 1998; Jacintheand Lal, 2001; Smith et al., 2001; Lal, 2004; Rodríguez et al., 2004;Geirsdóttir et al., 2009; Gathorne-Hardy et al., 2009). SOC decompo-sition processes are severely constrained in some environmentalsettings and any SOC buried under anaerobic conditions is protectedagainst decomposition. Yet, the impact of the SOC transported byerosional processes (e.g., Óskarsson et al., 2004) and redistributedover the landscape is not fully understood because the variability in itsturnover characteristics has not been widely studied (Smith et al.,2001). Thus, the fate of C transported by erosional processes remains adebatable issue: is soil erosion a source or a sink of atmospheric CO2?(e.g., Behre et al., 2007).
nc. All rights reserved.
21G. Gísladóttir et al. / Quaternary Research 73 (2010) 20–32
For erosion to be a net CO2 sink, a full account of eroded C isrequired. Based on such assumptions, Stallard (1998), Harden et al.(1999), Yoo et al. (2005, 2006) and Van Oost et al. (2007) concludedthat soil erosion is a global C sink. In contrast, other researchers haveemphasized that soil erosion represents a source of atmospheric CO2
(Gregorich et al., 1998; Jacinthe and Lal, 2001; Lal, 2003, 2004;Óskarsson et al., 2004; Polyakov and Lal, 2004; Rodríguez et al., 2004).
Regardless of being a source or sink, erosion strongly impacts soilquality on- and off-site (Lal, 1999). While the impacts of historic andcontemporary erosion on the quality of volcanic soils of Iceland havenot been widely studied, credible data on erosional impacts on soilquality are needed and are essential to land use planning forimplementation of restorative and conservation-effective programs.
In Iceland, Óskarsson et al. (2004) mapped the extent ofdepositional soils in vegetated areas with high SOC content andareas with a severely depleted SOC pool. They suggested that 120–500Tg of SOC had been removed by soil erosion over the past millennium,of which approximately 50% was oxidized and emitted into theatmosphere as CO2. Over large river catchments in Iceland, activeerosion and soil degradation have resulted in net SOC loss, with theremaining soils in the catchment not compensating for the largeannual efflux (Kardjilov et al., 2006). Given the high C storage inAndosols and the fact that SOC does not decrease with depth (Batjes,1996; Óskarsson et al., 2004; Peña-Ramírez et al., 2008), acceleratederosion of such soils may drastically increase C accumulation indepositional sites. Furthermore, the eroded sites would lose aconsiderable amount of SOC pool depending on the depth of soiltruncated by erosion. Thus, there is strong need to study the effects ofaccelerated erosion on SOC pool in landscapes vulnerable to erosion–deposition cycles. Quantitative data of this nature does not exist forsoils of Iceland, especially from studies in which the SOC pool iscompared among undisturbed, uncultivated soils with those ofperturbed by aeolian deposition.
Using multi-proxy evidence derived from the analyses of pollenand soil properties, the objective of this study was to determine theeffects of soil erosion on the terrestrial environment, includingvegetation, soil accumulation and the SOC pool during the lateHolocene in the degraded environment of Krýsuvíkurheiði. The study,assisted by the presence of the Landnám tephra (AD 871±2;Grönvold et al., 1995), was based on the assumption that the pre-settlement erosion and C cycling were at steady-state equilibrium.Field sampling and laboratory analysis, including pollen and soilproperties, were designed to test the hypothesis that accelerated post-settlement erosion, induced or accelerated by anthropogenic andnatural forces, resulted in the depletion of the ecosystem carbon pooland a decline in soil quality.
Study area and sites
The research site, Krýsuvíkurheiði, covers 24 km2 of theReykjanes peninsula, southwest Iceland (Fig. 1). The peninsula ischaracterized by postglacial lava covered by moss heath and sub-glacial hyloclastite ridges and mountains without substantial vegeta-tive cover (Jóhannesson and Sæmundsson, 1988; Guðjónsson andGíslason, 1988). Krýsuvíkurheiði was formed during the late Pleisto-cene and comprises gently sloping lava from shield volcano withstriated lava indicative of interglacial formation (Jónsson 1978,Gísladóttir, 1998). The area was not covered by the Icelandic inlandice sheet in Younger Dryas time at ∼11,300 14C yr BP (Norðdahl andPétursson, 2005), signifying soil formation over the past 11,350 yr.Krýsuvíkurheiði is bounded by the Ögmundarhraun lava, formed AD1151 to thewest and the prehistoric postglacial, Eldborgarhraun to theeast (Jóhannesson and Einarsson, 1988; Jónsson, 1998). Krýsuvíkur-heiði is relatively flat (b100 m a.s.l.) and meets the North AtlanticOcean in the south. The Reykjanes peninsula lacks major rivers andonly two small brooks provide surface drainage in the study area.
The inhabitants of the study area practiced farming, based onanimal grazing, from the 9th up to the mid-20th century. The initialsettlement site (Fig. 1) was destroyed by the lava formed in AD 1151.Ruins of an indeterminate number of farms and a church are partlycovered by lava over a 16-km2 area (Jóhannesson and Einarsson,1988). Based on historical documents Rafnsson (1982) suggested thatthere was a church in the area, indicating settlement from around AD1200, although it declined during mid-16th century. The location isnot known, but from the late 17th century the settlement was locatedfarther east (Fig. 1) until it declined before the mid-20th century(Gísladóttir, 1998). Krýsuvíkurheiði was the largest and best pastureon the Reykjanes peninsula (Gísladóttir, 1998) and must have beenused as grazing land by local farmers and outsiders following theeruption, as it is at present.
Krýsuvíkurheiði is characterized by severe soil erosion and highlydegraded and susceptible landscapes (Fig. 1). About 20% is covered bydwarf shrub heath, 5% by grassland heath, 4% by grassland and 3% bywetland. Moss has been reestablished on 1% of the heavily degradedsoils. Grasslands and wetlands are the least eroded plant communi-ties. The remaining area is heavily degraded or barren and includesareas that have lost the entire soil cover (Gísladóttir, 1998, 2001).Predominant soils in the region are Brown Andosols (Arnalds andGrétarsson, 2001) with part of the area covered by Histosols (currentstudy).
The climate is mild, cold-temperate oceanic. Between 1961 and1990, the annual precipitation in the area was 1400–2000 mm, meanannual temperature was 4.7°C (maximum July–August 9.9°C andminimum in January 0.4°C) and on average 190 days per yearexceeded 4°C. The average wind velocity (1952–2007) was 6.7 m s−1
and wind velocities below 4.4 m s−1 were rare. During cold periods,predominant winds blow from northerly directions (Einarsson, 1988;Icelandic Meteorological Office database, 2001, 2007).
Soil cores were obtained at four sites (Fig. 1): (i) Brown Andosolcovered by dwarf shrub heath (K4), (ii) grassland heath (K7), (iii)grassland (K8), and (iv) Histosol dominated by sedges (K6).
Methods
Chronology
Tephra layers were identified visually within the soil cores. Asample from each tephra layer was also analyzed for major elementalcomposition to verify the literature-constructed tephra stratigraphyfor the study area. Four of these samples were obtained from site K4and one from K6 (Fig. 2). Determination of the origin of tephra layerswas made on the basis of comparison of our results with catalogedreference data, which contain the geochemical signatures of tephralayers, unique to each volcanic system (e.g., Sigurgeirsson, 1992;Newton et al., 2007; Larsen and Eiríksson, 2008).
Pollen analysis
Sub-samples for pollen analysis (1 cm3 each) fromK6were collectedevery two centimeters. The pollen preparation followed standardNaOH, HF, acetolysis methods (Moore et al., 1991) with the additionof Lycopodium clavatum spores (Stockmarr, 1971). Silicon oil of 12,500cSt viscosity was the mounting medium. Pollen and spores wereidentified using the key of Moore et al. (1991). The separation of pollenbetween Betula pubescens from Betula nana was done by assigning allBetula pollen ≤20 μm to B. nana and the remainder to B. pubescens(Caseldine, 2001; Karlsdóttir et al., 2007). The terrestrial indigenouspollen count was ∼250–300, excluding the predominant Cyperaceae,fromwhich sums thepercentages for all palynomorphswere calculated.Diagram construction used TILIA and TGView (Grimm, 1991, 2004).TILIA's statistical routine CONISS was used for numerical analysis andzonation of the pollen assemblages (Fig. 3). Pollen and spore taxonomy
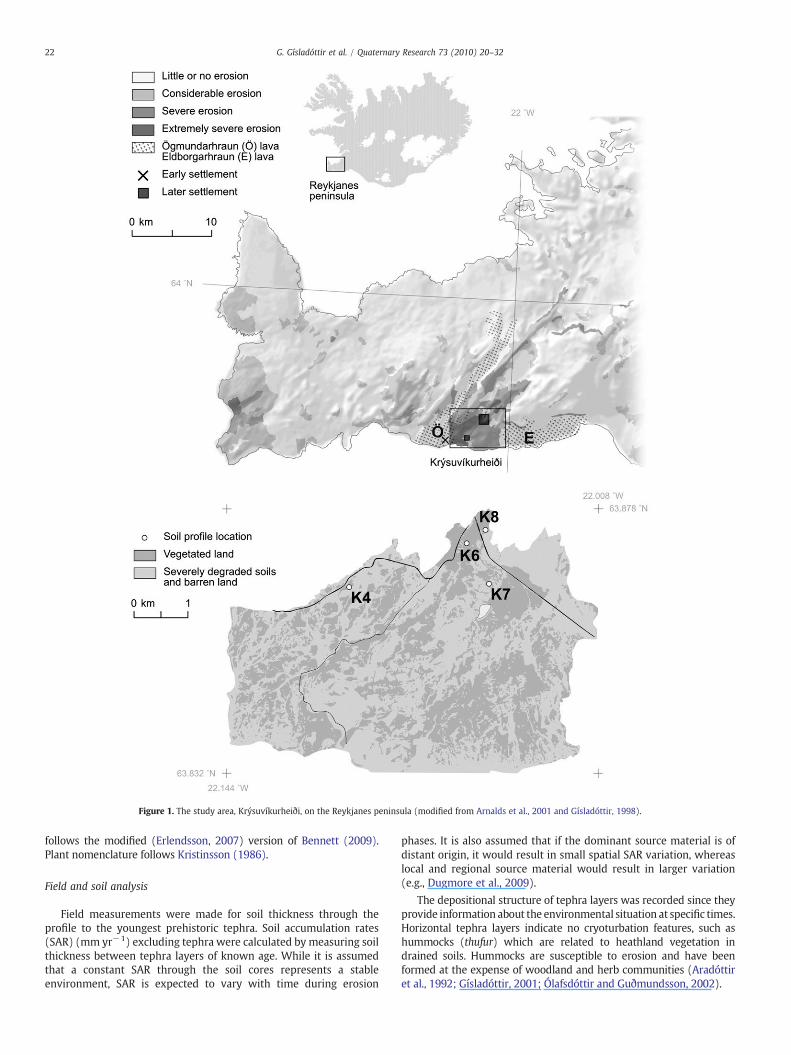
Figure 1. The study area, Krýsuvíkurheiði, on the Reykjanes peninsula (modified from Arnalds et al., 2001 and Gísladóttir, 1998).
22 G. Gísladóttir et al. / Quaternary Research 73 (2010) 20–32
follows the modified (Erlendsson, 2007) version of Bennett (2009).Plant nomenclature follows Kristinsson (1986).
Field and soil analysis
Field measurements were made for soil thickness through theprofile to the youngest prehistoric tephra. Soil accumulation rates(SAR) (mm yr−1) excluding tephra were calculated by measuring soilthickness between tephra layers of known age. While it is assumedthat a constant SAR through the soil cores represents a stableenvironment, SAR is expected to vary with time during erosion
phases. It is also assumed that if the dominant source material is ofdistant origin, it would result in small spatial SAR variation, whereaslocal and regional source material would result in larger variation(e.g., Dugmore et al., 2009).
The depositional structure of tephra layers was recorded since theyprovide information about the environmental situation at specific times.Horizontal tephra layers indicate no cryoturbation features, such ashummocks (thufur) which are related to heathland vegetation indrained soils. Hummocks are susceptible to erosion and have beenformed at the expense of woodland and herb communities (Aradóttiret al., 1992; Gísladóttir, 2001; Ólafsdóttir and Guðmundsson, 2002).
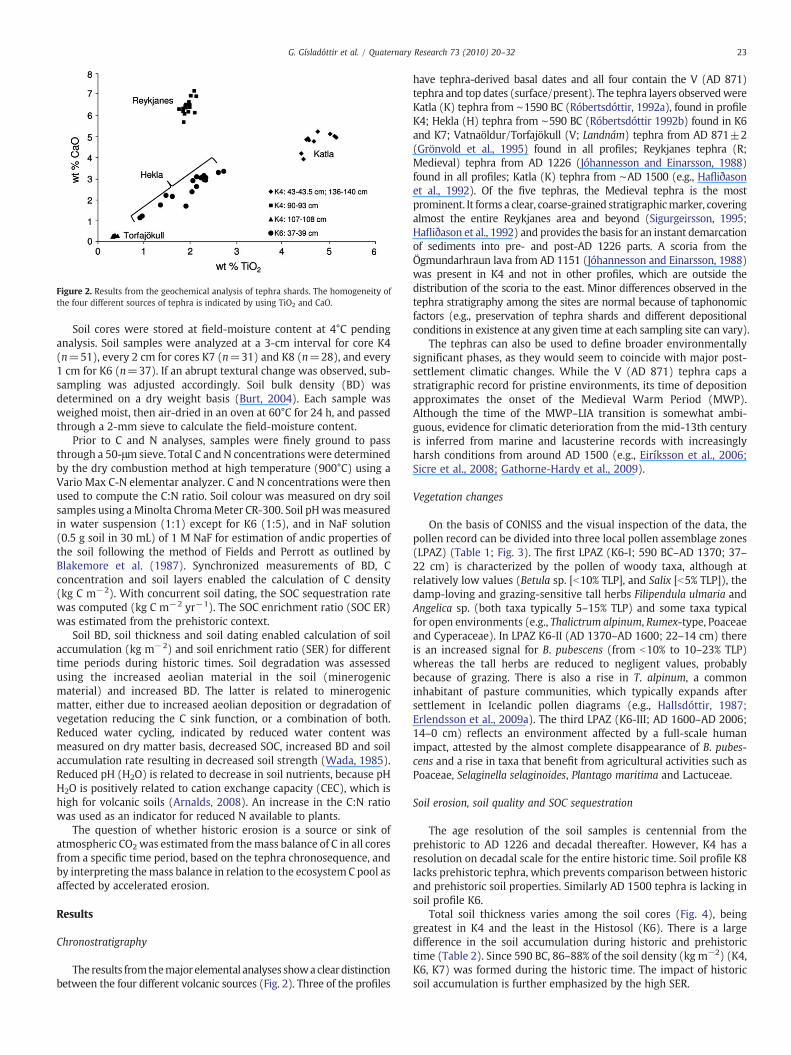
Figure 2. Results from the geochemical analysis of tephra shards. The homogeneity ofthe four different sources of tephra is indicated by using TiO2 and CaO.
23G. Gísladóttir et al. / Quaternary Research 73 (2010) 20–32
Soil cores were stored at field-moisture content at 4°C pendinganalysis. Soil samples were analyzed at a 3-cm interval for core K4(n=51), every 2 cm for cores K7 (n=31) and K8 (n=28), and every1 cm for K6 (n=37). If an abrupt textural change was observed, sub-sampling was adjusted accordingly. Soil bulk density (BD) wasdetermined on a dry weight basis (Burt, 2004). Each sample wasweighed moist, then air-dried in an oven at 60°C for 24 h, and passedthrough a 2-mm sieve to calculate the field-moisture content.
Prior to C and N analyses, samples were finely ground to passthrough a 50-μm sieve. Total C and N concentrations were determinedby the dry combustion method at high temperature (900°C) using aVario Max C-N elementar analyzer. C and N concentrations were thenused to compute the C:N ratio. Soil colour was measured on dry soilsamples using aMinolta ChromaMeter CR-300. Soil pHwasmeasuredin water suspension (1:1) except for K6 (1:5), and in NaF solution(0.5 g soil in 30 mL) of 1 M NaF for estimation of andic properties ofthe soil following the method of Fields and Perrott as outlined byBlakemore et al. (1987). Synchronized measurements of BD, Cconcentration and soil layers enabled the calculation of C density(kg C m−2). With concurrent soil dating, the SOC sequestration ratewas computed (kg C m−2 yr−1). The SOC enrichment ratio (SOC ER)was estimated from the prehistoric context.
Soil BD, soil thickness and soil dating enabled calculation of soilaccumulation (kg m−2) and soil enrichment ratio (SER) for differenttime periods during historic times. Soil degradation was assessedusing the increased aeolian material in the soil (minerogenicmaterial) and increased BD. The latter is related to minerogenicmatter, either due to increased aeolian deposition or degradation ofvegetation reducing the C sink function, or a combination of both.Reduced water cycling, indicated by reduced water content wasmeasured on dry matter basis, decreased SOC, increased BD and soilaccumulation rate resulting in decreased soil strength (Wada, 1985).Reduced pH (H2O) is related to decrease in soil nutrients, because pHH2O is positively related to cation exchange capacity (CEC), which ishigh for volcanic soils (Arnalds, 2008). An increase in the C:N ratiowas used as an indicator for reduced N available to plants.
The question of whether historic erosion is a source or sink ofatmospheric CO2was estimated from themass balance of C in all coresfrom a specific time period, based on the tephra chronosequence, andby interpreting themass balance in relation to the ecosystem C pool asaffected by accelerated erosion.
Results
Chronostratigraphy
The results fromthemajor elemental analyses showacleardistinctionbetween the four different volcanic sources (Fig. 2). Three of the profiles
have tephra-derived basal dates and all four contain the V (AD 871)tephra and top dates (surface/present). The tephra layers observedwereKatla (K) tephra from ∼1590 BC (Róbertsdóttir, 1992a), found in profileK4; Hekla (H) tephra from ∼590 BC (Róbertsdóttir 1992b) found in K6and K7; Vatnaöldur/Torfajökull (V; Landnám) tephra from AD 871±2(Grönvold et al., 1995) found in all profiles; Reykjanes tephra (R;Medieval) tephra from AD 1226 (Jóhannesson and Einarsson, 1988)found in all profiles; Katla (K) tephra from ∼AD 1500 (e.g., Hafliðasonet al., 1992). Of the five tephras, the Medieval tephra is the mostprominent. It forms a clear, coarse-grained stratigraphicmarker, coveringalmost the entire Reykjanes area and beyond (Sigurgeirsson, 1995;Hafliðason et al., 1992) and provides the basis for an instant demarcationof sediments into pre- and post-AD 1226 parts. A scoria from theÖgmundarhraun lava from AD 1151 (Jóhannesson and Einarsson, 1988)was present in K4 and not in other profiles, which are outside thedistribution of the scoria to the east. Minor differences observed in thetephra stratigraphy among the sites are normal because of taphonomicfactors (e.g., preservation of tephra shards and different depositionalconditions in existence at any given time at each sampling site can vary).
The tephras can also be used to define broader environmentallysignificant phases, as they would seem to coincide with major post-settlement climatic changes. While the V (AD 871) tephra caps astratigraphic record for pristine environments, its time of depositionapproximates the onset of the Medieval Warm Period (MWP).Although the time of the MWP–LIA transition is somewhat ambi-guous, evidence for climatic deterioration from the mid-13th centuryis inferred from marine and lacusterine records with increasinglyharsh conditions from around AD 1500 (e.g., Eiríksson et al., 2006;Sicre et al., 2008; Gathorne-Hardy et al., 2009).
Vegetation changes
On the basis of CONISS and the visual inspection of the data, thepollen record can be divided into three local pollen assemblage zones(LPAZ) (Table 1; Fig. 3). The first LPAZ (K6-I; 590 BC–AD 1370; 37–22 cm) is characterized by the pollen of woody taxa, although atrelatively low values (Betula sp. [b10% TLP], and Salix [b5% TLP]), thedamp-loving and grazing-sensitive tall herbs Filipendula ulmaria andAngelica sp. (both taxa typically 5–15% TLP) and some taxa typicalfor open environments (e.g., Thalictrum alpinum, Rumex-type, Poaceaeand Cyperaceae). In LPAZ K6-II (AD 1370–AD 1600; 22–14 cm) thereis an increased signal for B. pubescens (from b10% to 10–23% TLP)whereas the tall herbs are reduced to negligent values, probablybecause of grazing. There is also a rise in T. alpinum, a commoninhabitant of pasture communities, which typically expands aftersettlement in Icelandic pollen diagrams (e.g., Hallsdóttir, 1987;Erlendsson et al., 2009a). The third LPAZ (K6-III; AD 1600–AD 2006;14–0 cm) reflects an environment affected by a full-scale humanimpact, attested by the almost complete disappearance of B. pubes-cens and a rise in taxa that benefit from agricultural activities such asPoaceae, Selaginella selaginoides, Plantago maritima and Lactuceae.
Soil erosion, soil quality and SOC sequestration
The age resolution of the soil samples is centennial from theprehistoric to AD 1226 and decadal thereafter. However, K4 has aresolution on decadal scale for the entire historic time. Soil profile K8lacks prehistoric tephra, which prevents comparison between historicand prehistoric soil properties. Similarly AD 1500 tephra is lacking insoil profile K6.
Total soil thickness varies among the soil cores (Fig. 4), beinggreatest in K4 and the least in the Histosol (K6). There is a largedifference in the soil accumulation during historic and prehistorictime (Table 2). Since 590 BC, 86–88% of the soil density (kg m−2) (K4,K6, K7) was formed during the historic time. The impact of historicsoil accumulation is further emphasized by the high SER.
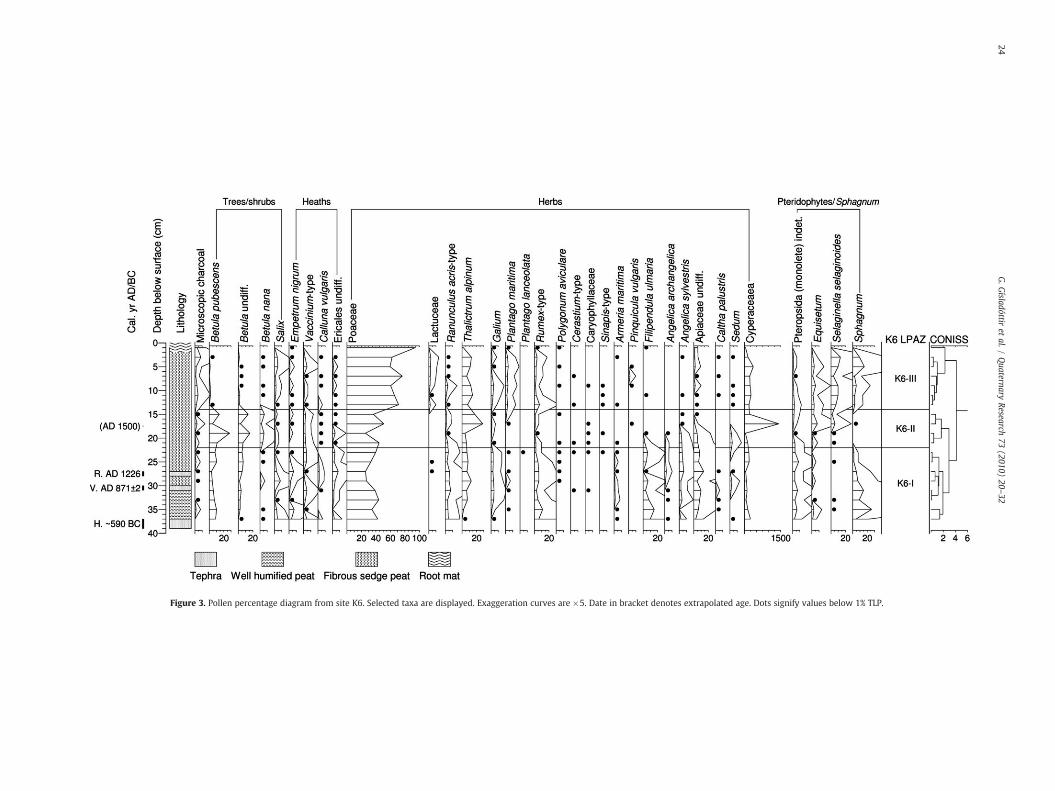
Figure 3. Pollen percentage diagram from site K6. Selected taxa are displayed. Exaggeration curves are ×5. Date in bracket denotes extrapolated age. Dots signify values below 1% TLP.
24G.G
ísladóttiret
al./Quaternary
Research73
(2010)20
–32
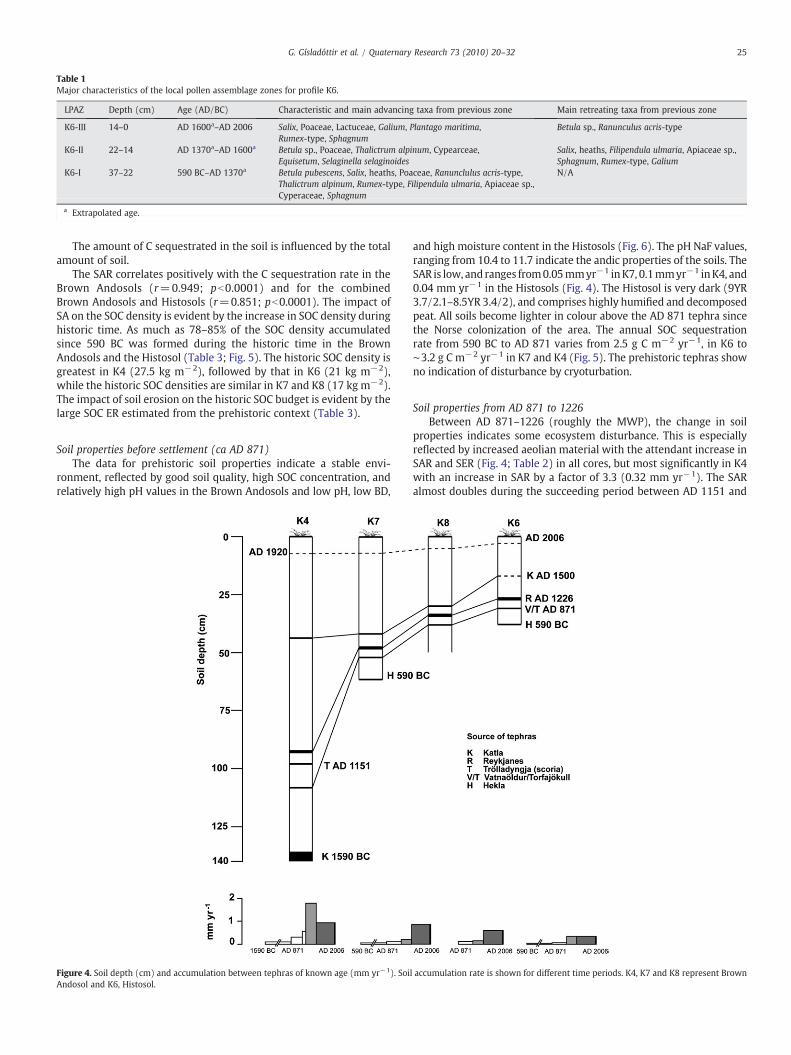
Table 1Major characteristics of the local pollen assemblage zones for profile K6.
LPAZ Depth (cm) Age (AD/BC) Characteristic and main advancing taxa from previous zone Main retreating taxa from previous zone
K6-III 14–0 AD 1600a–AD 2006 Salix, Poaceae, Lactuceae, Galium, Plantago maritima,Rumex-type, Sphagnum
Betula sp., Ranunculus acris-type
K6-II 22–14 AD 1370a–AD 1600a Betula sp., Poaceae, Thalictrum alpinum, Cypearceae,Equisetum, Selaginella selaginoides
Salix, heaths, Filipendula ulmaria, Apiaceae sp.,Sphagnum, Rumex-type, Galium
K6-I 37–22 590 BC–AD 1370a Betula pubescens, Salix, heaths, Poaceae, Ranunclulus acris-type,Thalictrum alpinum, Rumex-type, Filipendula ulmaria, Apiaceae sp.,Cyperaceae, Sphagnum
N/A
a Extrapolated age.
25G. Gísladóttir et al. / Quaternary Research 73 (2010) 20–32
The amount of C sequestrated in the soil is influenced by the totalamount of soil.
The SAR correlates positively with the C sequestration rate in theBrown Andosols (r=0.949; pb0.0001) and for the combinedBrown Andosols and Histosols (r=0.851; pb0.0001). The impact ofSA on the SOC density is evident by the increase in SOC density duringhistoric time. As much as 78–85% of the SOC density accumulatedsince 590 BC was formed during the historic time in the BrownAndosols and the Histosol (Table 3; Fig. 5). The historic SOC density isgreatest in K4 (27.5 kg m−2), followed by that in K6 (21 kg m−2),while the historic SOC densities are similar in K7 and K8 (17 kg m−2).The impact of soil erosion on the historic SOC budget is evident by thelarge SOC ER estimated from the prehistoric context (Table 3).
Soil properties before settlement (ca AD 871)The data for prehistoric soil properties indicate a stable envi-
ronment, reflected by good soil quality, high SOC concentration, andrelatively high pH values in the Brown Andosols and low pH, low BD,
Figure 4. Soil depth (cm) and accumulation between tephras of known age (mm yr−1). SoiAndosol and K6, Histosol.
and high moisture content in the Histosols (Fig. 6). The pH NaF values,ranging from 10.4 to 11.7 indicate the andic properties of the soils. TheSAR is low, and ranges from0.05mmyr−1 inK7, 0.1mmyr−1 inK4, and0.04 mm yr−1 in the Histosols (Fig. 4). The Histosol is very dark (9YR3.7/2.1–8.5YR 3.4/2), and comprises highly humified and decomposedpeat. All soils become lighter in colour above the AD 871 tephra sincethe Norse colonization of the area. The annual SOC sequestrationrate from 590 BC to AD 871 varies from 2.5 g C m−2 yr−1, in K6 to∼3.2 g C m−2 yr−1 in K7 and K4 (Fig. 5). The prehistoric tephras showno indication of disturbance by cryoturbation.
Soil properties from AD 871 to 1226Between AD 871–1226 (roughly the MWP), the change in soil
properties indicates some ecosystem disturbance. This is especiallyreflected by increased aeolian material with the attendant increase inSAR and SER (Fig. 4; Table 2) in all cores, but most significantly in K4with an increase in SAR by a factor of 3.3 (0.32 mm yr−1). The SARalmost doubles during the succeeding period between AD 1151 and
l accumulation rate is shown for different time periods. K4, K7 and K8 represent Brown
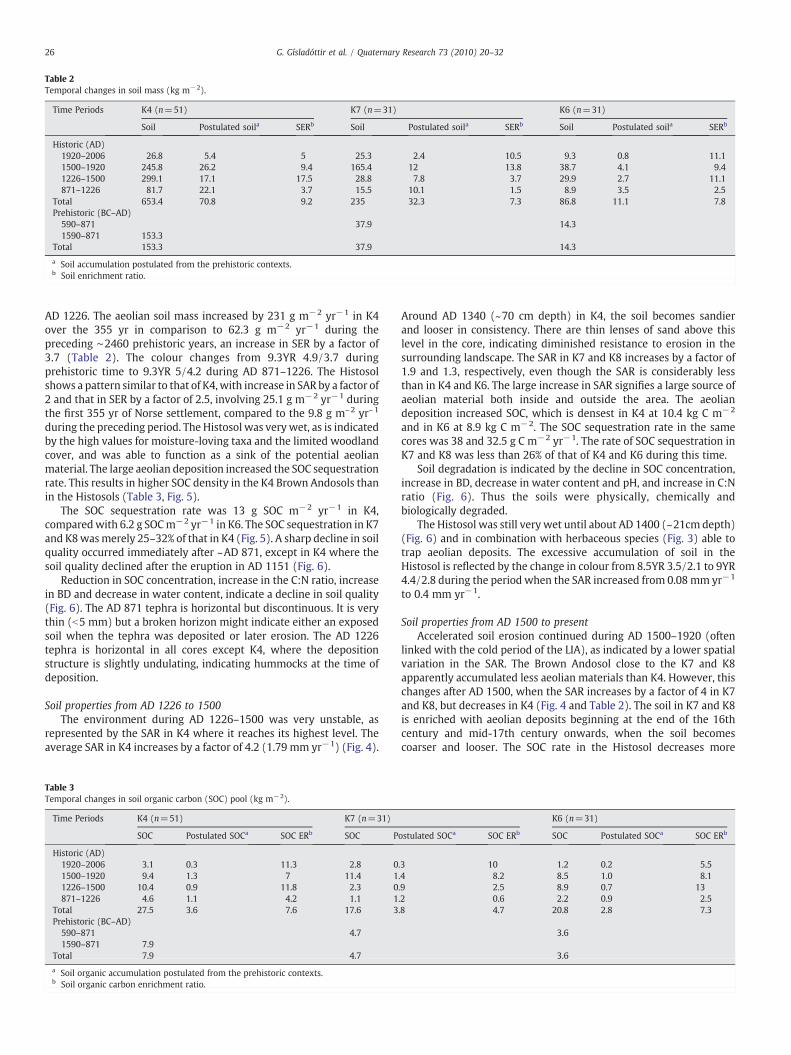
Table 2Temporal changes in soil mass (kg m−2).
Time Periods K4 (n=51) K7 (n=31) K6 (n=31)
Soil Postulated soila SERb Soil Postulated soila SERb Soil Postulated soila SERb
Historic (AD)1920–2006 26.8 5.4 5 25.3 2.4 10.5 9.3 0.8 11.11500–1920 245.8 26.2 9.4 165.4 12 13.8 38.7 4.1 9.41226–1500 299.1 17.1 17.5 28.8 7.8 3.7 29.9 2.7 11.1871–1226 81.7 22.1 3.7 15.5 10.1 1.5 8.9 3.5 2.5
Total 653.4 70.8 9.2 235 32.3 7.3 86.8 11.1 7.8Prehistoric (BC–AD)
590–871 37.9 14.31590–871 153.3
Total 153.3 37.9 14.3
a Soil accumulation postulated from the prehistoric contexts.b Soil enrichment ratio.
26 G. Gísladóttir et al. / Quaternary Research 73 (2010) 20–32
AD 1226. The aeolian soil mass increased by 231 g m−2 yr−1 in K4over the 355 yr in comparison to 62.3 g m−2 yr−1 during thepreceding ∼2460 prehistoric years, an increase in SER by a factor of3.7 (Table 2). The colour changes from 9.3YR 4.9/3.7 duringprehistoric time to 9.3YR 5/4.2 during AD 871–1226. The Histosolshows a pattern similar to that of K4,with increase in SAR by a factor of2 and that in SER by a factor of 2.5, involving 25.1 g m−2 yr−1 duringthe first 355 yr of Norse settlement, compared to the 9.8 g m–2 yr–1
during the preceding period. The Histosol was very wet, as is indicatedby the high values for moisture-loving taxa and the limited woodlandcover, and was able to function as a sink of the potential aeolianmaterial. The large aeolian deposition increased the SOC sequestrationrate. This results in higher SOC density in the K4 Brown Andosols thanin the Histosols (Table 3, Fig. 5).
The SOC sequestration rate was 13 g SOC m−2 yr−1 in K4,comparedwith 6.2 g SOCm−2 yr−1 in K6. The SOC sequestration in K7and K8wasmerely 25–32% of that in K4 (Fig. 5). A sharp decline in soilquality occurred immediately after ~AD 871, except in K4 where thesoil quality declined after the eruption in AD 1151 (Fig. 6).
Reduction in SOC concentration, increase in the C:N ratio, increasein BD and decrease in water content, indicate a decline in soil quality(Fig. 6). The AD 871 tephra is horizontal but discontinuous. It is verythin (b5 mm) but a broken horizon might indicate either an exposedsoil when the tephra was deposited or later erosion. The AD 1226tephra is horizontal in all cores except K4, where the depositionstructure is slightly undulating, indicating hummocks at the time ofdeposition.
Soil properties from AD 1226 to 1500The environment during AD 1226–1500 was very unstable, as
represented by the SAR in K4 where it reaches its highest level. Theaverage SAR in K4 increases by a factor of 4.2 (1.79 mm yr−1) (Fig. 4).
Table 3Temporal changes in soil organic carbon (SOC) pool (kg m−2).
Time Periods K4 (n=51) K7 (n=31)
SOC Postulated SOCa SOC ERb SOC P
Historic (AD)1920–2006 3.1 0.3 11.3 2.8 01500–1920 9.4 1.3 7 11.4 11226–1500 10.4 0.9 11.8 2.3 0871–1226 4.6 1.1 4.2 1.1 1
Total 27.5 3.6 7.6 17.6 3Prehistoric (BC–AD)
590–871 4.71590–871 7.9
Total 7.9 4.7
a Soil organic accumulation postulated from the prehistoric contexts.b Soil organic carbon enrichment ratio.
Around AD 1340 (~70 cm depth) in K4, the soil becomes sandierand looser in consistency. There are thin lenses of sand above thislevel in the core, indicating diminished resistance to erosion in thesurrounding landscape. The SAR in K7 and K8 increases by a factor of1.9 and 1.3, respectively, even though the SAR is considerably lessthan in K4 and K6. The large increase in SAR signifies a large source ofaeolian material both inside and outside the area. The aeoliandeposition increased SOC, which is densest in K4 at 10.4 kg C m−2
and in K6 at 8.9 kg C m−2. The SOC sequestration rate in the samecores was 38 and 32.5 g C m−2 yr−1. The rate of SOC sequestration inK7 and K8 was less than 26% of that of K4 and K6 during this time.
Soil degradation is indicated by the decline in SOC concentration,increase in BD, decrease in water content and pH, and increase in C:Nratio (Fig. 6). Thus the soils were physically, chemically andbiologically degraded.
The Histosol was still very wet until about AD 1400 (~21cm depth)(Fig. 6) and in combination with herbaceous species (Fig. 3) able totrap aeolian deposits. The excessive accumulation of soil in theHistosol is reflected by the change in colour from 8.5YR 3.5/2.1 to 9YR4.4/2.8 during the period when the SAR increased from 0.08mm yr−1
to 0.4 mm yr−1.
Soil properties from AD 1500 to presentAccelerated soil erosion continued during AD 1500–1920 (often
linked with the cold period of the LIA), as indicated by a lower spatialvariation in the SAR. The Brown Andosol close to the K7 and K8apparently accumulated less aeolian materials than K4. However, thischanges after AD 1500, when the SAR increases by a factor of 4 in K7and K8, but decreases in K4 (Fig. 4 and Table 2). The soil in K7 and K8is enriched with aeolian deposits beginning at the end of the 16thcentury and mid-17th century onwards, when the soil becomescoarser and looser. The SOC rate in the Histosol decreases more
K6 (n=31)
ostulated SOCa SOC ERb SOC Postulated SOCa SOC ERb
.3 10 1.2 0.2 5.5
.4 8.2 8.5 1.0 8.1
.9 2.5 8.9 0.7 13
.2 0.6 2.2 0.9 2.5
.8 4.7 20.8 2.8 7.3
3.6
3.6
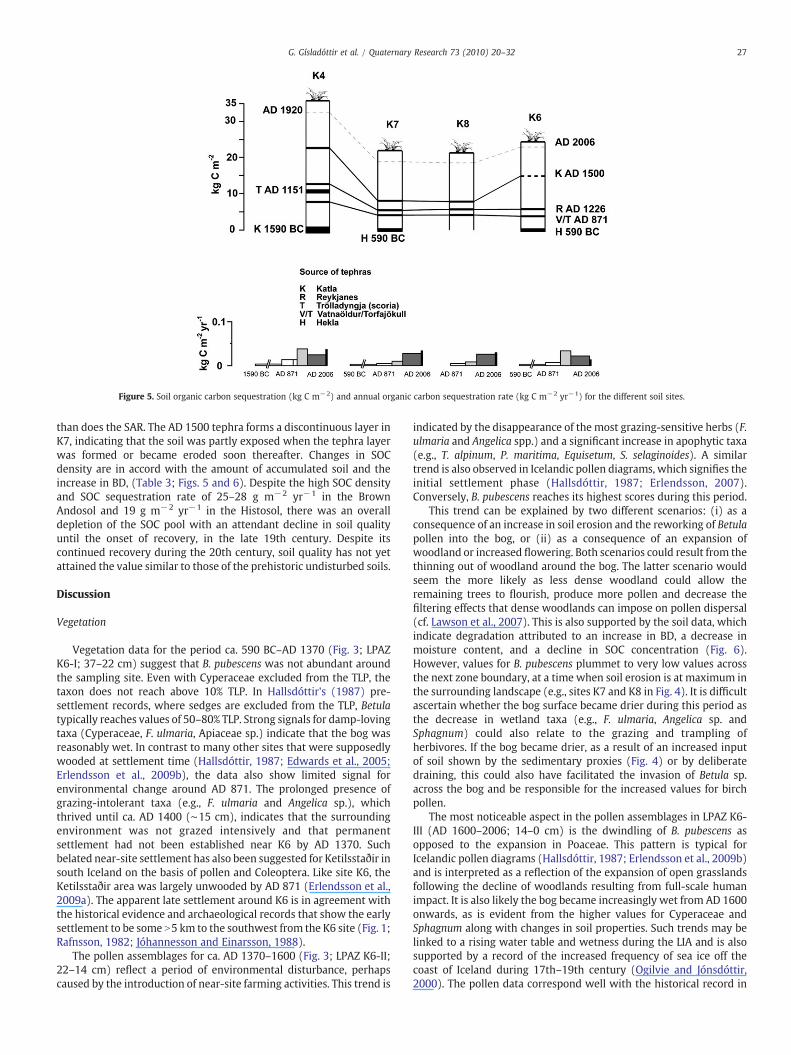
Figure 5. Soil organic carbon sequestration (kg C m−2) and annual organic carbon sequestration rate (kg C m−2 yr−1) for the different soil sites.
27G. Gísladóttir et al. / Quaternary Research 73 (2010) 20–32
than does the SAR. The AD 1500 tephra forms a discontinuous layer inK7, indicating that the soil was partly exposed when the tephra layerwas formed or became eroded soon thereafter. Changes in SOCdensity are in accord with the amount of accumulated soil and theincrease in BD, (Table 3; Figs. 5 and 6). Despite the high SOC densityand SOC sequestration rate of 25–28 g m−2 yr−1 in the BrownAndosol and 19 g m−2 yr−1 in the Histosol, there was an overalldepletion of the SOC pool with an attendant decline in soil qualityuntil the onset of recovery, in the late 19th century. Despite itscontinued recovery during the 20th century, soil quality has not yetattained the value similar to those of the prehistoric undisturbed soils.
Discussion
Vegetation
Vegetation data for the period ca. 590 BC–AD 1370 (Fig. 3; LPAZK6-I; 37–22 cm) suggest that B. pubescens was not abundant aroundthe sampling site. Even with Cyperaceae excluded from the TLP, thetaxon does not reach above 10% TLP. In Hallsdóttir's (1987) pre-settlement records, where sedges are excluded from the TLP, Betulatypically reaches values of 50–80% TLP. Strong signals for damp-lovingtaxa (Cyperaceae, F. ulmaria, Apiaceae sp.) indicate that the bog wasreasonably wet. In contrast to many other sites that were supposedlywooded at settlement time (Hallsdóttir, 1987; Edwards et al., 2005;Erlendsson et al., 2009b), the data also show limited signal forenvironmental change around AD 871. The prolonged presence ofgrazing-intolerant taxa (e.g., F. ulmaria and Angelica sp.), whichthrived until ca. AD 1400 (∼15 cm), indicates that the surroundingenvironment was not grazed intensively and that permanentsettlement had not been established near K6 by AD 1370. Suchbelated near-site settlement has also been suggested for Ketilsstaðir insouth Iceland on the basis of pollen and Coleoptera. Like site K6, theKetilsstaðir area was largely unwooded by AD 871 (Erlendsson et al.,2009a). The apparent late settlement around K6 is in agreement withthe historical evidence and archaeological records that show the earlysettlement to be some N5 km to the southwest from the K6 site (Fig. 1;Rafnsson, 1982; Jóhannesson and Einarsson, 1988).
The pollen assemblages for ca. AD 1370–1600 (Fig. 3; LPAZ K6-II;22–14 cm) reflect a period of environmental disturbance, perhapscaused by the introduction of near-site farming activities. This trend is
indicated by the disappearance of the most grazing-sensitive herbs (F.ulmaria and Angelica spp.) and a significant increase in apophytic taxa(e.g., T. alpinum, P. maritima, Equisetum, S. selaginoides). A similartrend is also observed in Icelandic pollen diagrams, which signifies theinitial settlement phase (Hallsdóttir, 1987; Erlendsson, 2007).Conversely, B. pubescens reaches its highest scores during this period.
This trend can be explained by two different scenarios: (i) as aconsequence of an increase in soil erosion and the reworking of Betulapollen into the bog, or (ii) as a consequence of an expansion ofwoodland or increased flowering. Both scenarios could result from thethinning out of woodland around the bog. The latter scenario wouldseem the more likely as less dense woodland could allow theremaining trees to flourish, produce more pollen and decrease thefiltering effects that dense woodlands can impose on pollen dispersal(cf. Lawson et al., 2007). This is also supported by the soil data, whichindicate degradation attributed to an increase in BD, a decrease inmoisture content, and a decline in SOC concentration (Fig. 6).However, values for B. pubescens plummet to very low values acrossthe next zone boundary, at a time when soil erosion is at maximum inthe surrounding landscape (e.g., sites K7 and K8 in Fig. 4). It is difficultascertain whether the bog surface became drier during this period asthe decrease in wetland taxa (e.g., F. ulmaria, Angelica sp. andSphagnum) could also relate to the grazing and trampling ofherbivores. If the bog became drier, as a result of an increased inputof soil shown by the sedimentary proxies (Fig. 4) or by deliberatedraining, this could also have facilitated the invasion of Betula sp.across the bog and be responsible for the increased values for birchpollen.
The most noticeable aspect in the pollen assemblages in LPAZ K6-III (AD 1600–2006; 14–0 cm) is the dwindling of B. pubescens asopposed to the expansion in Poaceae. This pattern is typical forIcelandic pollen diagrams (Hallsdóttir, 1987; Erlendsson et al., 2009b)and is interpreted as a reflection of the expansion of open grasslandsfollowing the decline of woodlands resulting from full-scale humanimpact. It is also likely the bog became increasingly wet from AD 1600onwards, as is evident from the higher values for Cyperaceae andSphagnum along with changes in soil properties. Such trends may belinked to a rising water table and wetness during the LIA and is alsosupported by a record of the increased frequency of sea ice off thecoast of Iceland during 17th–19th century (Ogilvie and Jónsdóttir,2000). The pollen data correspond well with the historical record in
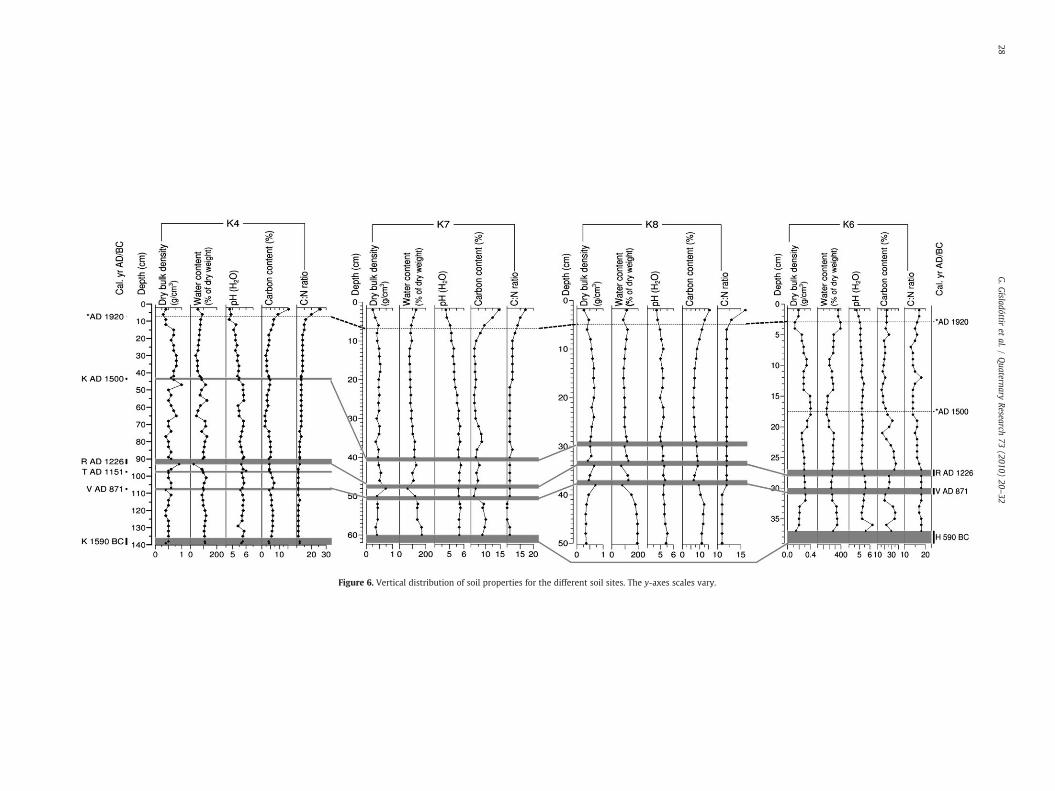
Figure 6. Vertical distribution of soil properties for the different soil sites. The y-axes scales vary.
28G.G
ísladóttiret
al./Quaternary
Research73
(2010)20
–32

Figure 7. Mass balance of soil transported, deposited and redistributed over the landscape since settlement.
29G. Gísladóttir et al. / Quaternary Research 73 (2010) 20–32
the sense that settlement at the modern Krýsuvík, near-site K6,was only established as late as in the late 17th century (Gísladóttir,1998), which appears to roughly coincide with the time of birchdecline. It is possible that the slightly earlier reduction in other, morevulnerable, grazing-intolerant taxa might be the result of increasedgrazing pressure, possibly related to diminished grazing areas in thewider region as a result of soil erosion. As noted above, Krýsuví-kurheiði is now the best pasture in the Reykjanes peninsula and islikely to have been exploited as such. Perhaps the area around K6
Figure 8. Fate of soil organic carbon transported, redistributed and emitted by erosional procIceland Óskarsson et al. (2004) assumed a rate of 50%.
was initially used as a shieling site (grazing outpost) which laterturned into a full farm.
Soil erosion
The increased SAR and SE in all profiles (Fig. 4; Table 2) duringhistorical times accentuate the aeolian activity following the settle-ment, as is also observed elsewhere in Iceland (Þórarinsson, 1961;Dugmore et al., 2009). The spatial and temporal variation in SAR and
esses since settlement. Postscript: Emission assumed as done by Lal (2003). For soils of
30 G. Gísladóttir et al. / Quaternary Research 73 (2010) 20–32
SE during early historic time indicates that the source area is of local orregional origin (cf. Dugmore et al., 2009), especially in K4, reinforcingthe idea that erosion started in the western part of the study area andlater expanded to the eastern part. However, the large SAR and SE inthe eastern wetland areas should not be neglected, because of the sinkpotential of the wetlands. It is likely that these wetlands consumeddispersed aeolian material transported from sources farther awayfrom the immediate site, in contrast to the drained plant communitieslacking shrub or woodland cover (K7 and K8) by that time (cf.McTainsh and Strong, 2007).
The deposition of the R-tephra added a wind-transportableand abrasive element to the already damaged vegetation coverin Krýsuvíkurheiði. The negative perception of the inhabitants ofReykjanes towards this tephra is reflected in naming the winter of AD1226–1227 sandvetur (sand-winter; Jóhannesson and Einarsson,1988). The R-tephra, cold spells during the 13th century AD (Dawsonet al., 2007) and land use intensification because of loss of pastureassociated with the formation of the 16 km2 Ögmundarhraun lavaconspired to mount the pressure on an ecosystem already strained bythe preceding ~300 yrs of agricultural activity. The land use surpassedthe carrying capacity of the ecosystem before AD 1500, after whichthe source of eroded material seems depleted, as inferred fromdecreased SAR and finer soil texture.
It is not after AD 1500 that the erosion culminates in the westernpart of the study area, at a time when the local aeolian sources closeto site K4 seem to have been greatly reduced. Land degradationduring LIA was further exacerbated by the anthropogenic impacts(Gísladóttir, 1998), as is also shown by the change in vegetation(Fig. 3), soil texture and a weaker soil structure. Moreover, the periodafter AD 1500, typically associated with the LIA, represents the mostsevere historical erosion era in Iceland (e.g., Gísladóttir, 1998;Ólafsdóttir and Guðmundsson, 2002; Geirsdóttir et al., 2009;Gathorne-Hardy et al., 2009), with the potential of long-distantaeolian transportation.
Given the heavily degraded soil and the present rate of erosion,soil degradation during historic time may have been a source forlocal aeolian material that was accumulated in the study area,especially in the vegetated sites, relocated over the landscape, andeventually transported to the ocean. To quantify the process, a soilmass balance after settlement in Krýsuvíkurheiði was computed(Fig. 7). It is assumed that by the time of settlement the area wasfully vegetated and prehistoric soils represented stable environmen-tal conditions (postulated soil). Presently barren land was assumedcovered by soils of similar mass as prehistoric soils in K4 and K7(postulated covered by heathland vegetation). Soil mass is based onsoil data related to the dominating plant communities by soil coresand extrapolated to area coverage (cf. Gísladóttir, 1998). Thesevalues (Fig. 7) indicate that a considerable mass of soil wastransported over the landscape. A minimum of 3786–4413 Gg ofsoil was displaced from local and regional sources, of which 3259 Ggwas deposited on the present vegetated land. This was added tothe 417 Gg of postulated soil formation, an increase by a factor ofnearly eight. Significant mass has been lost and most likely a largepart was transported into the ocean and/or redistributed over thelandscape. These components are, however, difficult to estimatefrom the present data. The soil disturbances show clearly that eventhough Andosols in an undisturbed state are relatively resistant toerosion, the disturbed soils are extremely vulnerable to disturbance(cf. Wada, 1985).
Soil quality and soil organic carbon
The movement of the soil mass severely reduced soil quality, ashas also been reported by others (e.g., Brady and Weil, 2002; Lal,2003). There is a general decrease in soil quality during the historictime. Decline in soil quality is characterized by diminished water
cycling, a rise in acidity with an attendant decrease in CEC (Arnalds,2008), and an increase in C:N ratio with a possible decrease in Navailable to plants due to constant recharge of the ecosystem byaeolian deposition. Of primary importance is the conclusion thaterosion depleted the SOC pool. The prehistoric value of SOC ishigher than the historic level, except after AD 1920 (Fig. 6). The SOCconcentration is the highest in K6, as is expected for a Histosolbecause of low decomposition under anaerobic conditions. The SOCconcentration decreased below 20% after AD 1500. The highertemporal resolution of the data shows that SOC enrichmentremains the same (0.030 kg C m−2 yr−1) during the intervals AD1226–1370 and AD 1370–1600. This trend suggests an increase indecomposition of SOC during the drier environmental conditionsbetween AD 1370 and 1600 (Figs. 5 and 6) with a decrease to0.017 kg C m−2 yr−1 between AD 1600 and 1920. The relativelylarger SOC sequestration may also be related to the increase incoverage of shrubs and trees (Fig. 3; Jobbágy and Jackson, 2000)and/or an influx of organic-rich sediments. In addition to theseverely degraded environment, severe cold was characteristicduring this period (Ogilvie and Jónsdóttir, 2000; Eiríksson et al.,2006), which reduced plant production and adversely affected theSOC storage. Even though the soil quality of the Histosol decreasesduring historic time, the Histosols do not dry out as rapidly as dothe Brown Andosols, indicating their stronger resistance toerosional processes.
To understand the fate of C over historic time (Fig. 8) for theKrýsuvíkurheiði region, soil data and present vegetation communitiesand coverage were used to compute the mass balance of the soil. It isapparent that the displaced SOC (215–216 Gg) by erosion is largerthan the historic undisturbed SOC pool in Krýsuvíkurheiði (86–88 Gg). The present vegetated land is assumed to have sequestered27 Gg of SOC under undisturbed conditions, whereas over 1135 yr156 Gg have been added to that amount through deposition, anincrease by a factor of more than 5. This increase in SOC is opposite tothe trend in soil quality that has been depleted in the same soils. Thedeserted soils have lost 59–60 Gg C over the last 1135 yr. Contrary tothe hypothesis of Stallard (1998), SOC has not been replaced in thesedeserted sites.
Given the positive correlation between soil depth and Csequestration, the majority of the deposited SOC (off-site) isderived from eroded soils (on-site). The low percentage of C inthe reworked soils compared to undisturbed soils in situ, supportsthe contention that some of the SOC has been oxidized followingerosion/deposition pathways (cf. Gregorich et al., 1998; Óskarssonet al., 2004; Yoo et al., 2005, 2006). Lack of vegetation at erodingsites reduces the soil's capacity to store C and to compensate for theloss of SOC. SOC moved from the exposed soils may be transportedinto the ocean, redistributed over the landscape and emitted intothe atmosphere through decomposition. A considerable amount isassumed to have been transported into the ocean given the locationof the site, with some redistributed over the area. Assumingthat 20% of the SOC is emitted (Lal, 2003), this is equivalent to4.4 kg C ha−1 yr−1 for the entire study area. Furthermore, assumingthat 20% of the displaced SOC that has been added to ecosystemis also emitted to the atmosphere (Lal, 2003, 2004), this processwould increase the erosion-caused emission by an additional 31 GgC. This would equal to 11.4 kg C ha−1 yr, giving a total emissionof 16 kg C ha−1 yr−1 for the study site. These estimates areconservative compared to the suggestions made by Óskarsson et al.(2004), who assumed an emission rate of 50%. Since SOC is easilytransported and given the extensive accumulation of soil, the neteffect of burial and subsequent reduction in decomposition isincreased SOC storage (Lal, 2003). However, this increased soilaccumulation decreases the quality of the soil and is also animportant source of atmospheric CO2 enrichment (Lal, 2004;Rodríguez et al., 2004).
31G. Gísladóttir et al. / Quaternary Research 73 (2010) 20–32
Conclusions
The land use that initiated disturbance of soils and vegetation inKrýsuvíkurheiði was magnified by frequent volcanism during theMWP. This disturbancewas later exacerbated by the LIA, in addition toanthropogenic perturbations that increased land degradation and soilerosion to a catastrophic degree. As a consequence, large amounts ofaeolian material were transported over the study area during the lastmillennium. The aeolian processes depleted soil quality and causedsignificant sediment influx in vegetated areas, including the accumu-lation of OC and, consequently, an increase in C sequestration in soilscovered by vegetation. Additional soil and SOC were lost from heavilydegraded soils or barren lands. The depleted C contributed to enrich-ment of the atmospheric CO2 to the extent of 16 kg C ha−1 yr−1 over1135 yr. Despite transport of some C to the ocean and depositionalsites, erosion was a net source of atmospheric CO2, even at aconservative emission rate of 20%. Additional studies are needed onmass balance of soil and SOC and the fate of C transport by erosionwith specific regard to the fraction emitted into the atmosphere.
Acknowledgments
This work was supported by the University of Iceland (UI)Research Fund and the Assistantship Fund of the UI. C and N contentsand soil properties were measured at the School of Environment andNatural Resources at Ohio State University (OSU). We greatlyacknowledge technical support provided by Sandy Johns and BasantRimal at OSU. Electronprobe microanalyses were undertaken at theInstitute of Earth Sciences, UI with support from Karl Grönvold andNíels Óskarsson. Haukur Jóhannesson provided help with tephrachronology in the field. We thank Hjördís Linda Jónsdóttir, Marin I.Kardjilov and Theresa L. Colson for help with figures, RannveigGuicharnaud for providing facilities for sample preparation, TraustiJónsson for providing information from the Icelandic MeteorologicalOffice Database (2001; 2007) and Kevin J. Edwards for the preparationof pollen samples.
References
Aradóttir, Á.L., Arnalds, Ó., Archer, S., 1992. Hnignun gróðurs og jarðvegs. GræðumÍsland IV 73–82.
Arnalds, Ó., 2004. Volcanic soils of Iceland. Catena 56, 3–20. doi:10.1016/j.catena.2003.10.002.
Arnalds, Ó., 2008. Soils of Iceland. Jökull 58, 409–421.Arnalds, Ó., Grétarsson, E., 2001. Jarðvegskort af Íslandi. 1:700 000, Second edition.
Rannsóknastofnun landúnaðarins, Reykjavík.Arnalds, O., Þorarinsdottir, E.F., Metusalemsson, S., Jonsson, A., Gretarsson, E., Arnason,
A., 2001. Soil erosion in Iceland. The Soil Conservation Service and the AgriculturalResearch Institute, Reykjavík.
Batjes, N.H., 1996. Total carbon and nitrogen in the soils of the world. European Journalof Soil Science 47, 151–163.
Behre, A.A., Harte, J., Harden, J.W., Torn, M.S., 2007. The significance of the erosion-induced terrestrial carbon sink. BioScience 57, 337–346.
Bennett, K.D. 2009: Catalog of Pollen Types. Queen's University Belfast. Belfast. http://www.chrono.qub.ac.uk/pollen/pc-intro.html (last accessed in June 2009).
Blakemore, L.C., Searle, P.L., Daly, B.K., 1987. Methods for Chemical Analysis of Soils. NZSoil Bureau, Lower Hutt.
Brady, N.C., Weil, R.R., 2002. The Nature and Properties of Soils, 13th Edition. PrenticeHall, Upper Saddle River, New Jersey.
Burt, R. (Ed.), 2004. Soil Survey Laboratory Methods manual. Soil Survey investigation.Report No 42, version 4.0. USDA-NRCA, Lincoln, Nebraska.
Caseldine, C., 2001. Changes in the Holocene record from Iceland — a palaeoclimaticrecord or evidence for early Holocene hybridisation? Review of Palaeobotany andPalynology 117, 139–152.
Dawson, A.G., Hickey, K., Mayewski, P.A., Nesje, A., 2007. Greenland (GISP2) ice coreand historical indicators of complex North Atlantic climate changes during thefourteenth century. The Holocene 17, 427–434.
Dugmore, A.J., Gísladóttir, G., Simpson, I.A., Newton, A., 2009. Conceptual models of1200 years of Icelandic soil erosion reconstructed using tephrochronology. Journalof the North Atlantic 2, 1–18.
Edwards, K.J., Lawson, I.T., Erlendsson, E., Dugmore, A.J., 2005. Landscapes of contrast inViking age Iceland and the Faroe Islands. Landscapes 6, 63–81.
Einarsson, M., 1988. Precipitation in southwestern Iceland. Jökull 38, 61–70.
Eiríksson, J., Bartels-Jónsdóttir, H.B., Cage, A.G., Gudmundsdóttir, E.R., Klitgaard-Kristensen, D., Marret, F., Rodrigues, T., Abrantes, F., Austin,W.E.N., Jiang, H., Knudsen,K.L., Sejrup, H.P., 2006. Variability of the North Atlantic Current during the last2000 years based on shelf bottom water and sea surface temperatures along an openocean/shallow marine transect in Western Europe. The Holocene 16, 1017–1029.
Erlendsson, E., 2007. Environmental change around the time of the Norse settlement ofIceland. Unpublished PhD thesis. University of Aberdeen.
Erlendsson, E., Edwards, K.J., Buckland, P.C., 2009a. Vegetational response to early humancolonisation of the volcanic and coastal environments of Ketilsstaðir, southernIceland. Quaternary Research 72, 174–187. doi:10.1016/j.yqres.2009.05.005.
Erlendsson, E., Vickers, K.A., Gathorne-Hardy, F., Bending, J.M., Gunnarsdóttir, B.,Gísladóttir, G., Edwards, K.J., 2009b. Late-Holocene environmental history of theReykholt area, Borgarfjörður, western Iceland. In: Þorgeirsson, B. (Ed.), Mellan Textoch Materiell Kultur. Snorrastofa, Reykholt.
Gathorne-Hardy, F.J., Erlendsson, E., Langdon, P.G., Edwards, K.J., 2009. Lake sedimentevidence for late Holocene climate change and landscape erosion in westernIceland. Journal of Paleolimnology 42, 413–426. doi:10.1007/s10933-008-9285-4.
Geirsdóttir, Á., Miller, G.H., Thordarson, Th., Ólafsdóttir, K., 2009. A 2000 year record ofclimate variations reconstructed from Haukadalsvatn, West Iceland. Journal ofPaleolimnology 41, 95–115. doi:10.1007/s10933-008-9253-z.
Gísladóttir, G., 1998. Environmental Characterization and Change in South-westernIceland. Dissertation Series 10. Department of Physical Geography, StockholmUniversity, Stockholm.
Gísladóttir, G., 2001. Ecological disturbance and soil erosion on grazing land inSouthwest Iceland. In: Conacher, A. (Ed.), Land Degradation. Kluwer AcademicPublishers, Dordrecht, pp. 109–126.
Gisladottir, F.O., Arnalds, O., Gisladottir, G., 2005. The effect of landscape and retreatingglaciers on wind erosion in South Iceland. Land Degradation and Development 16,177–187. doi:10.1002/ldr.645.
Gregorich, E.G., Greer, K.J., Anderson, D.W., Liang, B.C., 1998. Carbon distribution andlosses: erosion and deposition effects. Soil and Tillage Research 47, 291–302.
Grimm, E.C., 1991. TILIA and TILIA.GRAPH 1. Illinois State Museum, Springfield.Grimm, E.C., 2004. TGview 2.0.2. Illinois State Museum, Springfield.Grönvold, K., Óskarsson, N., Johnsen, J., Clausen, H.B., Hammer, C.U., Bond, G., Bard, E.,
1995. Ash layers from Iceland in the Greenland GRIP ice core correlated withoceanic and land sediments. Earth and Planetary Science Letters 135, 149–155.
Guðjónsson, G., Gíslason, E., 1988. Vegetation map of Iceland. 1:500 000. Generaloverview. Icelandic Institute of Natural History, Reykjavík (1st edition).
Hafliðason, H., Larsen, G., Ólafsson, G., 1992. The recent sedimentation history ofThingvallavatn, Iceland. Oikos 64, 80–95.
Hallsdóttir, M., 1987. Pollen Analytical Studies of Human Influence on Vegetation inRelation to the Landnám Tephra Layer in Southwest Iceland. Lundqua Thesis 18.Lund University. Lund.
Harden, J.W., Sharpe, J.M., Parton, W.J., Ojima, D.S., Fries, T.L., Huntington, T.G., Dabney,S.M., 1999. Dynamic replacement and loss of soil carbon on eroding cropland.Global Biogeochemical Cycles 13, 885–901.
Jacinthe, P.A., Lal, R., 2001. Mass balance approach to assess carbon dioxide evolution duringerosional events. LandDegradation andDevelopment 12, 329–339. doi:10.1002/ldr.454.
Jobbágy, E.G., Jackson, R.B., 2000. The vertical distribution of soil organic carbon and itsrelation to climate and vegetation. Ecological applications 10, 423–436.
Jóhannesson, H., Einarsson, S., 1988. Krísuvíkureldar I. Aldur Ögmundarhrauns ogMiðaldalagsins. Jökull 38, 71–87.
Jóhannesson, H., Sæmundsson, K., 1988. Gological Map of Iceland. 1:500 000. Bedrockgeology. Icelandic Institute of Natural History, Reykjavík, (2nd Edition).
Jónsson, J., 1978. Jarðfræðikort af Reykjanesskaga. Skýringar við jarðfræðikort.Jarðfræðikort. Orkustofnun, Reykjavík.
Jónsson, J., 1998. Eldgos á sögulegum tíma á Reykjanesskaga. Náttufræðingurinn 52,127–139.
Kardjilov, M.I., Gisladottir, G., Gislason, S.R., 2006. Land degradation in North-easternIceland: present and past carbon fluxes. Land Degradation and Development 17 (4),401–417. doi:10.1002/ldr.746.
Karlsdóttir, L., Thórsson, Æ.Th., Hallsdóttir, M., Sigurgeirsson, A., Eysteinsson, Th.,Anamthawat-Jónsson, K., 2007. Differentiating pollen of Betula species fromIceland. Grana 46, 78–84. doi:10.1080/00173130701237832.
Kristinsson, H., 1986. The Flowering Plants and Ferns of Iceland. Örn ogÖrlygur, Reykjavík.Lal, R. (Ed.), 1999. Soil Quality and Soil Erosion. CRC Press, Boca Raton, FL.Lal, R., 2003. Soil erosion and the global carbon budget. Environment International 29,
437–450. doi:10.1016/S0160-4120(02)00192-7.Lal, R., 2004. Soil carbon sequestration impacts on global climate change and food
security. Science 304, 1623–1627. doi:10.1126/science.1097396.Larsen, G., Eiríksson, J., 2008. Late Quaternary terrestrial tephrochronology of Iceland-
frequency of explosive eruptions, type and volume of tephra deposits. Journal ofQuaternary Science 109–120. doi:10.1002/jps.1129.
Lawson, I.T., Gathorne-Hardy, F.J., Church, M.J., Newton, A.J., Edwards, K.J., Dugmore, A.J., Einarsson, Á., 2007. Environmental impacts of the Norse settlement: palaeoen-vironmental data from Mývatnssveit, Northern Iceland. Boreas 36, 1–19.doi:10.1080/03009480600827298.
McTainsh, G., Strong, C., 2007. The role of aeolian dust in ecosystems. Geomorphology89, 39–54. doi:10.1016/j.geomorph.2006.07.028.
Moore, P.D., Webb, J.A., Collinson, M.E., 1991. Pollen Analysis, 2nd ed. Blackwell Science,Oxford.
Newton, A.J., Dugmore, A.J., Gittings, B.M., 2007. Tephrabase: tephrochronology and thedevelopment of a centralised European database. Journal of Quaternary Science 22,737–743. doi:10.1002/jqs.1094.
Norðdahl, H., Pétursson, H.G., 2005. Relative sea-level changes in Iceland; new aspectsof theWeichselian deglaciation of Iceland. In: Caseldine, C., Russel, A., Hardardottir,

32 G. Gísladóttir et al. / Quaternary Research 73 (2010) 20–32
J., Knudsen, O. (Eds.), Iceland-modern Processes and Past Environments. Elsevier,Amsterdam, pp. 25–78.
Ogilvie, A.E.J., Jónsdóttir, I., 2000. Sea ice, climate, and fisheries in the eighteenth andnineteenth centuries. Arctic 53, 383–394.
Ólafsdóttir, R., Guðmundsson, H., 2002. Holocene land degradation and climatic changein northeast Iceland. The Holocene 12, 159–167. doi:10.1191/0959683602hl531rp.
Óskarsson, H., Arnalds, Ó., Gudmundsson, J., Gudbergsson, G., 2004. Organic carbonin Icelandic Andosols: geographical variation and impact of erosion. Catena 56,225–238. doi:10.1016/j.catena.2003.10.013.
Peña-Ramírez, V.M., Vázquez-Selem, L., Siebe, C., 2008. Soil organic carbon stocksand forest productivity in volcanic ash soils of different age (1835–30,500 B.P.) inMexico. Geoderma 149, 224–234. doi:10.1016/j.geoderma.2008.11.038.
Polyakov, V., Lal, R., 2004. Modeling soil organic matter dynamics as affected by soil watererosion. Environmental International 30, 547–556. doi:10.1016/j.envint.2003.10.011.
Rafnsson, S., 1982. Um aldur Ögmundarhrauns. In: Þórarinsdóttir, H., Einarsson, Þ.(Eds.), Eldur er í norðri: afmælisrit helgað Sigurði Þórarinssyni sjötugum 8. janúar.Sögufélagið, Reykjavík, pp. 415–424. 1982.
Róbertsdóttir, B.G., 1992a. Gjóskulagatímatal fyrir SubethNurlandsundirlendi. Forsögu-leg gjóskulög frá Kötlu, áður nefnd “Katla 5000”. Veggspjaldaráðstefna Jarðfræða-félags Íslands. Jarðfræðafélag Íslands, Reykjavík, pp. 8–9. 28 apríl 1992.
Róbertsdóttir, B.G., 1992b. Gjóskulagatímatal fyrir Suðurlandsundirlendi. Þrjú forsögu-leg gjóskulög frá Heklu, HA, HB og HC. Veggspjaldaráðstefna JarðfræðafélagsÍslands. Jarðfræðafélag Íslands, Reykjavík, pp. 6–7. 28 apríl 1992.
Rodríguez, A.R., Guerra, A., Arbelo, C., Mora, J.L., Gorrín, S.P., Armas, C., 2004. Organicforms of eroded soil organic carbon in Andosols of the Canary Islands (Spain).Geoderma 121, 205–219. doi:10.1016/j.geoderma.2003.11.009.
Sicre, M.-A., Jacob, J., Ezat, U., Rousse, S., Kissel, C., Yiou, P., Eiriksson, J., Knudsen, K.L.,Jansen, E., Turon, J.-L., 2008. Decadal variability of sea surface temperatures off
North Iceland over the last 2000 years. Earth and Planetary Science Letters 268,137–142. doi:10.1016/j.epsl.2008.01.011.
Sigurgeirsson, M.Á., 1992. Gjóskumyndanir á Reykjanesi. Unpublished MSc thesis,University of Iceland.
Sigurgeirsson,M.Á., 1995. In: Hróarsson, B., Jónsson, D., Jónsson, S.S (Eds.), Miðaldalagið.Eyjar í eldhafi. Gott mál, Reykjavík, pp. 189–198.
Smith, S.V., Renwick, W.H., Buddemeier, R.W., Crossland, C.J., 2001. Budgetsof soil erosion and deposition for sediments and sedimentary organiccarbon across the conterminous United States. Global Biogeochemical Cycles15, 697–707.
Stallard, R.F., 1998. Terrestrial sedimentation and the carbon cycle: couplingweatheringand erosion to carbon burial. Global Biogeochemical Cycles 12, 231–257.
Stockmarr, J., 1971. Tablets with spores used in absolute pollen analysis. Pollen etSpores 13, 614–621.
Þórarinsson, S., 1961. Uppblástur á Íslandi í ljósi öskulagarannsókna. Ársrit Skógræk-tarfélags Íslands 1960–1961, 17–54.
Van Oost, K., Quine, T.A., Govers, G., De Gryze, S., Six, J., Harden, J.W., Ritchie, J.C.,MaCarty, G.W., Heckrath, G., Kosmas, C., Giraldez, J.V., Marques da Silva, J.R.,Merckx, R., 2007. The impact of agricultural soil erosion on the global carbon cycle.Science 318, 626–629. doi:10.1126/science.1145724.
Wada, K., 1985. The distinctive properties of Andosols. Advances in Soil Science 2,173–229.
Yoo, K., Amundson, R., Heimsath, A.M., Dietrich, W.E., 2005. Erosion of upland hillslopesoil organic carbon: coupling field measurements with sediment transport model.Global Biogeochemical Cycles 19, GB 3003. doi:10.1029/2004GB002271.
Yoo, K., Amundson, R., Heimsath, A.M., Dietrich, W.E., 2006. Spatial patterns of soilorganic carbon on hillslopes: integrating geomorphic processes and the biological Ccycle. Geoderma 130, 47–65. doi:10.1016/j.geoderma.2005.01.008.