
ERCOFTAC international symposium « Unsteady separation in fluid-structure interaction Naturally...
14
ERCOFTAC international symposium « Unsteady separation in fluid-structure interaction » Mykonos, Greece, June 17-21, 2013 Naturally separated turbulent flow around two cylinders in tandem at high Reynolds number by time- resolved PIV. M. ELHIMER, G. HARRAN, T. DELOZE, D. SZUBERT S. FERREIRA, M. BRAZA Institut de Mécanique des Fluides de Toulouse, UMR C.N.R.S.-I.N.P.T-UPS. 5502, Av. du Prof. Camille Soula, 31400 Toulouse, France [email protected] Abstract. In this study the focus is made on the properties of the bistable flow between two cylinder in tandem for a pitch ratio ܮȀ ܦൌ ͵ǡ at a Reynolds number of ൌ ͳ͵ʹ ͺͳʹ. Time resolved particle image velocimetry (PIV) is used to measure the spatial distribution and time fluctuations of the velocity field in the wake of the upstream cylinder. From velocity spectra and statistics fields, we show the existence of two distinct seemingly stable flow patterns, with different spatial structures and Strouhal numbers. Key words: Cylinders in tandem, time resolved PIV, bistable flow, Strouhal number. 1. Introduction Multiple cylinders structures can be found in the designs for heat exchangers, cooling systems for nuclear power plants, offshore structures and cables, in both air and water flow. In many of these engineering applications, the periodic shedding of Kármán vortices is responsible for problems with flow-induced vibration and noise. Example of such cases is the triggering of fluid elastic instability in heat exchanger tubes arrays subjected to a cross-flow (Granger & Paidoussis 1996); the need to predict the critical velocity of this instability in the heat exchangers of nuclear reactors has motivated several experimental studies using PIV and visualization techniques (Paul 2007, Iwaki 2004) that shows the complex interactions between the shear layers, vortices and Karman vortex streets in the flow field between the cylinders. The two cylinders tandem configuration is the simplest form of multiple cylinders structure. The two cylinders are in close proximity, arranged at arbitrary centre-to-centre spacing and zero angle of incidence to the oncoming flow. This arrangement can be found in several locations on a landing gear, such as multiple wheels, axles, and hydraulic lines. It has been chosen by Jenkins et al. (2005) as a canonical problem to identify and assess the effect of the interaction of unsteady flow among components of the landing gear on the airframe noise generation on large aircraft during approach. The tandem arrangement has shown a large variety of flow patterns depending on the pitch (e.g. the distance between the cylinders) to diameter ratio,
Transcript of ERCOFTAC international symposium « Unsteady separation in fluid-structure interaction Naturally...

ERCOFTAC international symposium « Unsteady separation in fluid-structure interaction »
Mykonos, Greece, June 17-21, 2013
Naturally separated turbulent flow around two
cylinders in tandem at high Reynolds number by time-
resolved PIV.
M. ELHIMER, G. HARRAN, T. DELOZE, D. SZUBERT S. FERREIRA, M. BRAZA
Institut de Mécanique des Fluides de Toulouse, UMR C.N.R.S.-I.N.P.T-UPS. 5502, Av. du Prof. Camille
Soula, 31400 Toulouse, France
Abstract. In this study the focus is made on the properties of the bistable flow between two
cylinder in tandem for a pitch ratio at a Reynolds number of . Time
resolved particle image velocimetry (PIV) is used to measure the spatial distribution and time
fluctuations of the velocity field in the wake of the upstream cylinder. From velocity spectra and
statistics fields, we show the existence of two distinct seemingly stable flow patterns, with
different spatial structures and Strouhal numbers.
Key words: Cylinders in tandem, time resolved PIV, bistable flow, Strouhal number.
1. Introduction
Multiple cylinders structures can be found in the designs for heat exchangers,
cooling systems for nuclear power plants, offshore structures and cables, in both air and water flow. In many of these engineering applications, the periodic
shedding of Kármán vortices is responsible for problems with flow-induced
vibration and noise. Example of such cases is the triggering of fluid elastic
instability in heat exchanger tubes arrays subjected to a cross-flow (Granger & Paidoussis 1996); the need to predict the critical velocity of this instability in the
heat exchangers of nuclear reactors has motivated several experimental studies
using PIV and visualization techniques (Paul 2007, Iwaki 2004) that shows the
complex interactions between the shear layers, vortices and Karman vortex streets in the flow field between the cylinders.
The two cylinders tandem configuration is the simplest form of multiple
cylinders structure. The two cylinders are in close proximity, arranged at
arbitrary centre-to-centre spacing and zero angle of incidence to the oncoming flow. This arrangement can be found in several locations on a landing gear, such
as multiple wheels, axles, and hydraulic lines. It has been chosen by Jenkins et al.
(2005) as a canonical problem to identify and assess the effect of the interaction
of unsteady flow among components of the landing gear on the airframe noise
generation on large aircraft during approach.
The tandem arrangement has shown a large variety of flow patterns
depending on the pitch (e.g. the distance between the cylinders) to diameter ratio,

M. ELHIMER ET AL.
2
the Reynolds number and the upstream turbulence intensity These patterns have
been investigated extensively by several authors (Igararashi 1981, Xu et Zhou
2004, Sumner 2000, Alam 2011, Lin et al. 2002) who shows the existence of a Reynolds number dependent critical pitch for the transition from one pattern to
another (Sumner 2010).
For the smallest values of the pitch to diameter ratio , the
tandem act as a single extended body because the downstream cylinder is located
in the vortex formation zone of the upstream one, so this flow regime is called
“extended body regime” in literature (Figure 1). The separated shear layers from
the upstream cylinder wrap around the downstream cylinder, without any
reattachment onto its surface, before rolling up alternately into Karman vortices
behind the downstream cylinder. The flow between the two cylinders is almost stagnant but may behave as a cavity flow (Sumner 2010).
Figure 1 A simplified classification of flow patterns between two cylinders in tandem as
function of the pitch to diameter ratio , from Sumner (2010).
For medium pitch ratio , the shear layers from the upstream
cylinder reattach onto the downstream cylinder, with the formation and shedding of eddies in the gap region between the two cylinders. A wide variety of fluid
behaviour can be observed in this regime that has been first classified by Igarashi
(1981). In addition Lin et al (2002) show that the gap eddies can vary
substantially and intermittently in terms of their strength, asymmetry, and general behavior.
Finally, at higher pitch ratios the downstream cylinder is
sufficiently far away that Von Kármán vortex shedding can now occur from the
upstream cylinder as well as the downstream one. The downstream cylinder is now located outside the vortex formation region of the upstream cylinder and
experiences the periodic impingement of shed vortices from the upstream
cylinder. In this “co-shedding” flow regime, both cylinders undergo vortex
shedding at the same frequency. The transition to and from the co-shedding regime is known to be bistable,
with intermittent appearance of the two flow patterns (Igarashi 1981, Xu et Zhou
2004). This bistable regime appears in several experiments with different aspects
and blockage ratios (Sumner 2010). In the present study the focus is made on this bistable regime, the aim of our experiment is to fully characterize each of the
two flow patterns. Time resolved PIV is used as a tool to simultaneously resolve

Time resolved PIV on cylinders in tandem
the spatial structure and the spectral content of the velocity field at the wake of
the upstream cylinder for each of the two configurations. A comparison between
the properties of the two patterns is done. We have shown that the bistable
regime is observed for tandem cylinder with pitch to diameter at
Reynolds numbers and but not at the smaller ones
and . This suggests the existence of a critical
Reynolds number beyond which the bistable regime appears. In this article the
focus is made on the highest Reynolds number .
2. Experimental set-up, conditions and techniques
The experiments were undertaken in the wind tunnel S4 of IMFT, which
deliver an upstream velocity with low turbulent fluctuations (the turbulence
intensity has been measured by means hot wire anemometry and found to be of
order ). The test section is of width and height. Two
transparent Plexiglas cylinders of diameter have been used, yielding an
aspect ratio of and a blockage ratio of . This compares well with Lin et
al. (2002) experiments were the aspect ratio is and the blockage ratio was
. The aspect ratio and the blockage ratio were in Igarashi (1981) and
respectively and in Xu et Zhou (2004) and respectively.
In the present study, the pitch to diameter ratio of the tandem is so
the gap between the cylinders is wide. The cylinders are positioned in
cross-flow at the mid-height of the test section and spanned over its width.
Figure 2 Tandem cylinder scheme and upstream velocity
The upstream velocity in the wind tunnel was measured using a Pitot tube
with pressure plugs at the inlet and the outlet of the contraction section, and was
controlled by changing the fan angular velocity. The upstream velocity is
yielding a Reynolds number of . The velocity field measurements have been performed using high speed PIV
set-up that includes a double frame high-speed camera (Photron RS3000), a two
cavity LASER (Quantronix Darwin) and a synchronizer.
The camera CMOS sensors have a resolution of and an
internal memory size of 8 GB enabling an acquisition duration of 3 seconds at a
frequency of , the resulting PIV measurements frequency is .
The visualization plan was located in the wake of the upstream cylinder at its
mid-width with the size of . In order to reach the statistical
convergence up to the second order, ten PIV acquisitions were performed for
U=25,5 m/s 3,7 D

M. ELHIMER ET AL.
4
each of the two flow patterns: knowing that the frequency of the Von Kármán
shedding is about , each acquisition contains shedding cycles, thus
about shedding cycles have been covered in our measurements for each
pattern.
The energy of the laser beam delivered by each cavity was set at .
Using a combination of spherical and cylindrical lenses, the LASER beam was
expanded into a light sheet of thickness. The flow was seeded with
droplets of a mix of water and alcohol using a fog generator. The droplets size
distribution was measured using a Malvern granulometer and found to be
on average with a small standard deviation.
The image processing and the cross-correlation analysis were performed
using DAVIS 8 La Vision software. The images intensity was inhomogeneous due to the lighting conditions and the sensor properties. Applying a sliding
minimum subtraction over 20 images on pixel’s grey level values circumvented
this drawback. An iterative cross-correlation analysis with decreasing interrogation windows was used to compute the displacement vectors from the
processed images and a final interrogation window size of pixels
( ) with an overlap of 50% was used, so the spatial resolution of the
measurement was . Finally the resulting vectors fields were post-
processed using an iterative median filter in order to detect and replace “false”
vectors (Adrian et Westreweel 2010).
The high frequency of the PIV measurements allows extracting velocity temporal signal at any location of the visualization domain. For each location the
time series from the ten acquisitions were concatenated in order to form a
sufficiently long time series. The periodogram of these time series was computed
using spectral averaging on multiple windows (Marple 1987) with non-overlapping Hamming windows of size 512 samples, the resulting frequency
resolution is .
3. Statistical and spectral analysis of the flow in the gap region between
the two cylinders
As mentioned above, for the pitch ratio and the Reynolds
number , we observe a random bifurcation of the gap flow
between two flow patterns. The duration of each flow pattern is variable and it is
generally of the order of several minutes, in comparison the Von-Kármán
shedding period being of the order of 20 milliseconds.
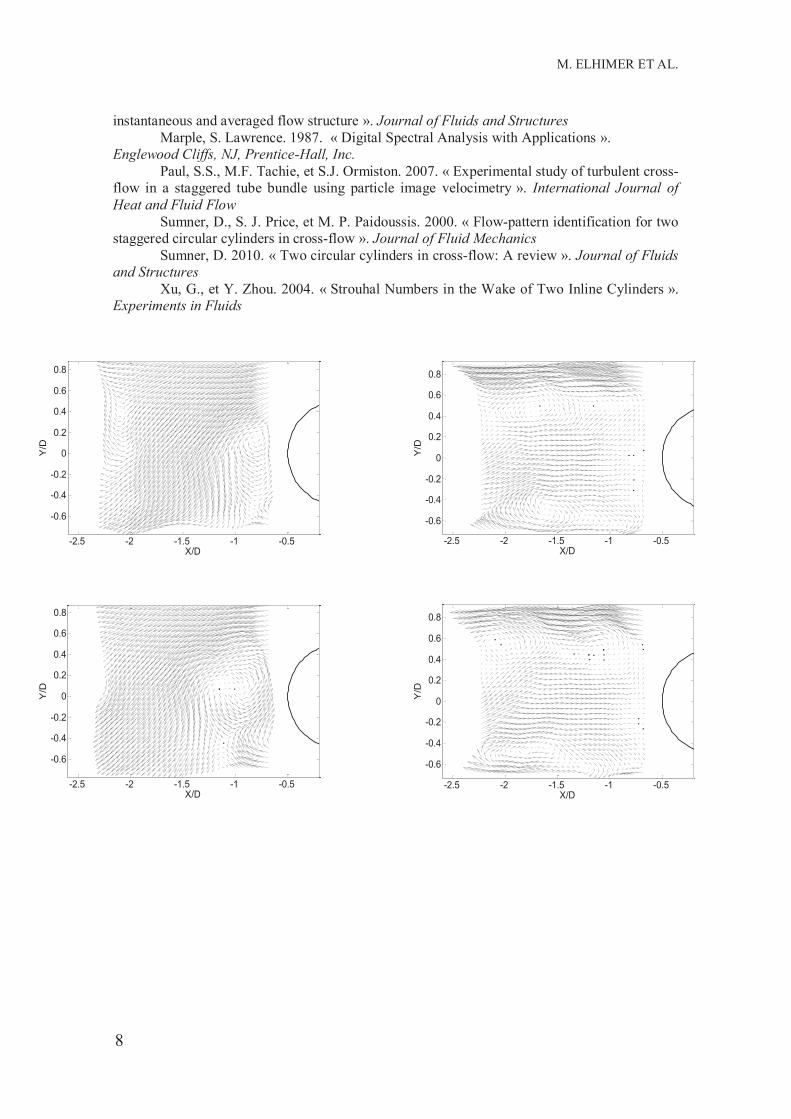
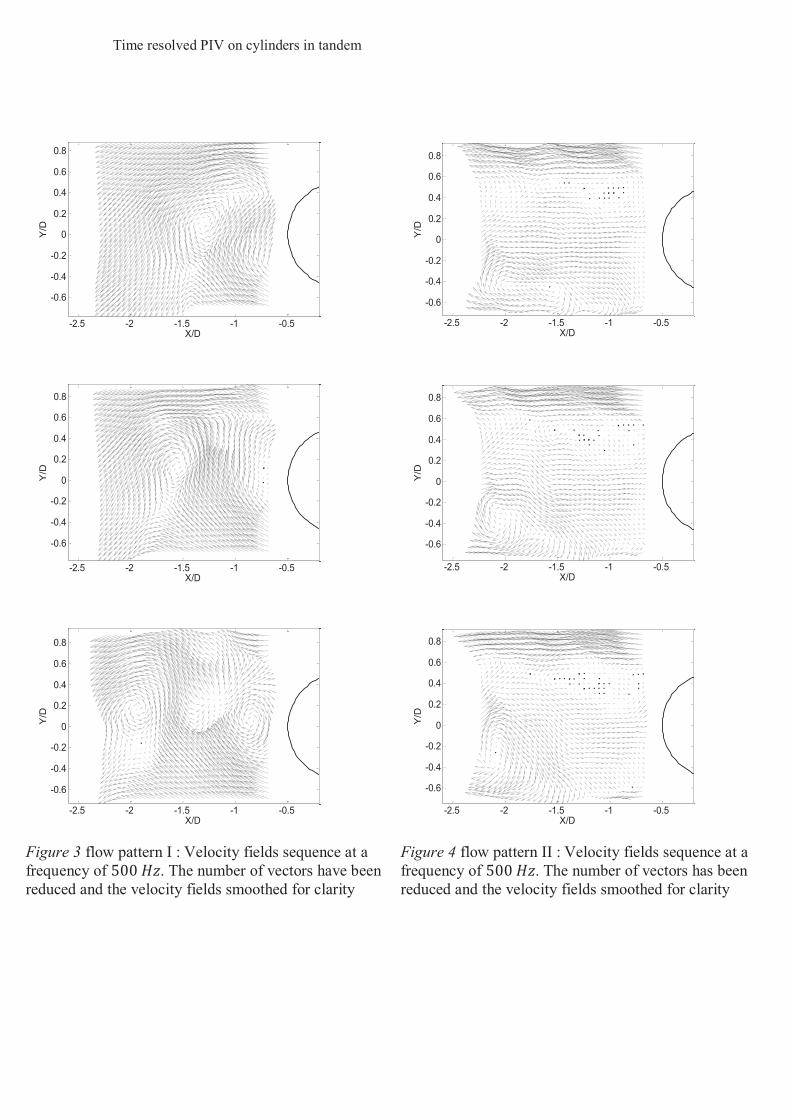
The first flow pattern, named I, consists on a Von Karman vortex shedding in
the wake of the upstream cylinder (Figure 3) but with a different shedding
frequency: the dimensionless Strouhal number is instead of
for a single cylinder. The second flow pattern, named II, appears generally
after the first one. It consists of two stable detached shear layers that reattach on the downstream cylinder and create a recirculating flow in front of this cylinder

Time resolved PIV on cylinders in tandem
(Figure 4). This pattern displays a Strouhal number of close to the
downstream cylinder.
The appearance of the flow pattern II always comes with increase of
the pressure difference between the inlet and the outlet of the contraction section.
Thus the upstream velocity increases by about while the fan’s angular
velocity remains unchanged. This shows the decreases of the pressure drop induced by the presence of the tandem in the test section when the flow patterns
II appears, and is probably due to the decrease of shear stress in comparison with
the first pattern. In our experiments, the velocity was reduced after the
appearance of the second pattern to bring it back to its initial value
. The acquisition was started only two minutes later. This change of the
upstream velocity does not cause the switching towards the first pattern. FLOW PATTERN I
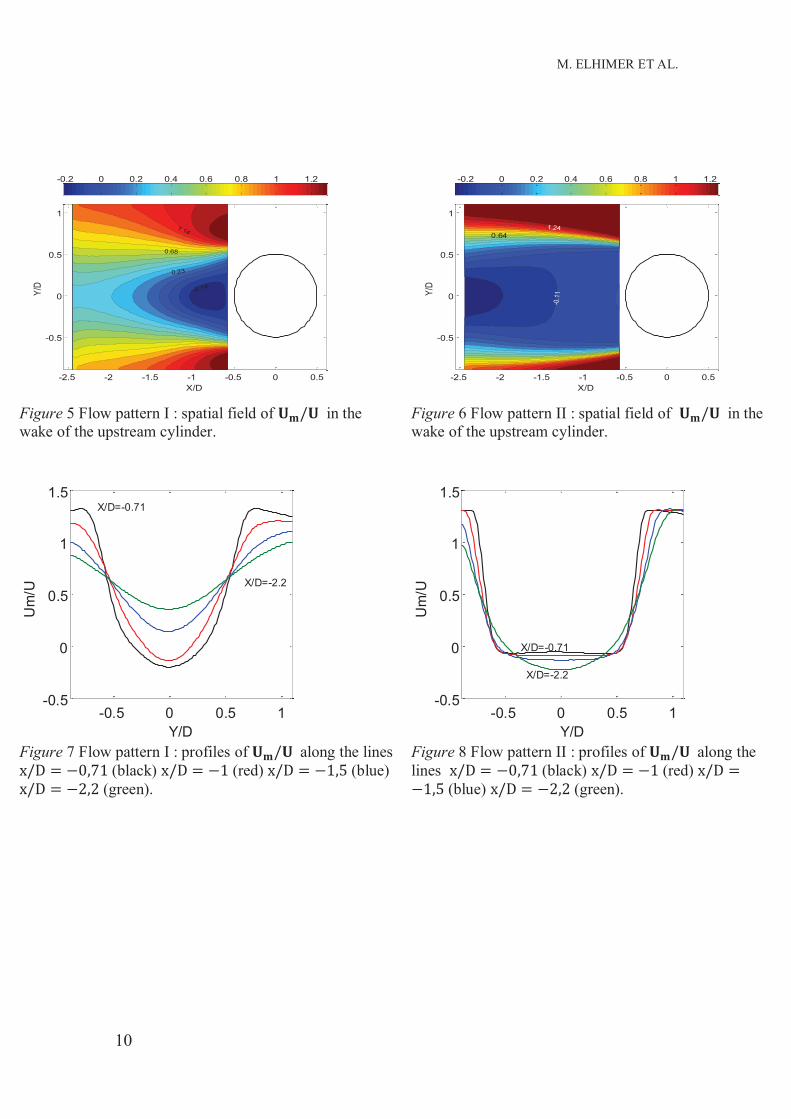
This pattern shows a topology and statistical properties similar to single
cylinder in cross-flow. Indeed, The longitudinal average velocity field is
symmetrical with respect to the axis , and one can clearly identify the
non-rotational zone, the shear zone and the dead water zone (Figure 5, Figure
7). In the non-rotational zone the upstream flow is accelerated to near
the cylinder and beyond the position in agrement with the results
of Braza (2006) for an isolated cylinder at a close Reynolds number
. In addition, the cylinder recirculating length, defined as the distance
between the axis of the cylinder and the point were =0, is
which is in good agreement with the value obtained by Braza
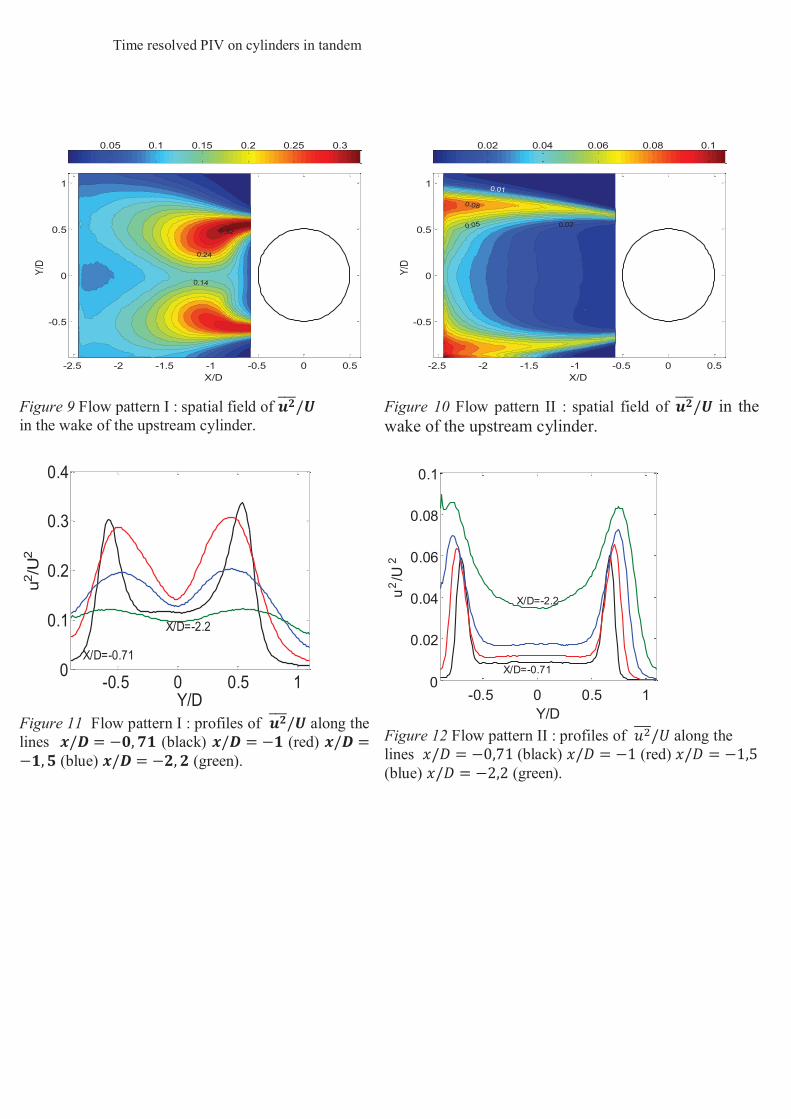
(2006). Finally, the Reynolds stresses fields (Figure 9, Figure 11, Figure 13,
Figure 15, Figure 17, Figure 19,) shows a topology and non-dimensional values
close to the case of an isolated cylinder. The vertical velocity spectra have been measured at different positions on
the line (Figure 21). It clearly shows a peak of power spectral density
at the non-dimensional frequency thus defining the Strouhal
number of the flow. This value is in good agreement with the results of Xu et
Zhou (2004) and Igarashi (1981) for close pitch to diameter ratio but at smaller
Reynolds numbers. As mentioned by Xu et Zhou (2004) the Strouhal number
depends both on the base pressure coefficient and the shear layer thickness
where is a universal Strouhal
number. The shear layer thickness depends on the Reynolds number and the base
pressure coefficient is modified by the presence of the downstream cylinder. This explains the dependence of the Strouhal number on both the pitch and the flow
Reynolds number.
For the same pitch to diameter ratio but at higher Reynolds number
Jenkins et al (2005) found a higher value of the Strouhal number
. However their experiments are not comparable to ours because these

M. ELHIMER ET AL.
6
authors stripped the first cylinder in order to force a turbulent boundary layer
upstream separation.
FLOW PATTERN II
The flow pattern II has a distinct topology comparing to the case of isolated cylinder. The flow structure consists of two stable shear layers issued
from the upstream cylinder. This observation is confirmed by examining the
longitudinal average velocity field (Figure 6).
Two irrotational zones are identified at both sides of the upstream cylinder, were the mean longitudinal velocity reaches a higher value than in the
first pattern: at on the line . The shear zones
located between and delimit a “dead water zone” that
spans over a larger area than in the first flow pattern. Further away from the
cylinder, the average longitudinal velocity becomes negative; this suggests the
existence of a downstream recirculation flow that is however outside the visualization zone in these experiments. This recirculation is most probably
generated by the reattachment of the shear layers on the downstream cylinder.
The normal Reynolds stresses have a symmetrical distribution with
respect to the axis (Figure 10, Figure 14) while the Reynolds shear
stress has an anti-symmetrical distribution with respect to this axis. The Reynolds stresses values are significantly smaller compared to the first flow pattern due to
the attenuation of the organized large-scale flow close to the upstream cylinder.
The Reynolds stresses concentrate at the thickness of the shear zones that
increase away from the cylinder due to the turbulent diffusion of the stresses.
Indeed, the shear zone thickness increases from at to
at (Figure 12, Figure 16). The Reynolds stresses are negligible
close to the cylinder in the “dead water zone” and increase as the recirculation
flow get closer.
The vertical velocity spectra are shown along the line in this flow
pattern (Figure 22). The spectrum is continuous near the cylinder because the large scale alternating motion is attenuated in this region of the flow in case of
pattern II. However small vortex bursts are identified in the instantaneous PIV
velocity fields in the shear zone. These vortices cannot be detected by a classical
spectral analysis due to their high frequency appearance in respect of the
sampling frequency of the TRPIV experiment ( ).
For positions closer to the downstream cylinder a power spectral density
(PSD) peak appears at the non-dimensional frequency that is
different from the Strouhal number value of in the first flow pattern. This
value is however in good agreement with the findings of Xu et Zhou (2004) for
close pitch to diameter ratio and at smaller Reynolds number. This peak is most
probably linked to the recirculation flow in the front of the downstream cylinder
and clearly appears beyond the position . This result indicates that
the Von Kármán mode appears farther downstream and is characterized by a

Time resolved PIV on cylinders in tandem
lower frequency, because of the vicinity with the second cylinder. The fact that
this Strouhal number remains constant for these downstream positions associated
with the presence of two inflexion points in the mean velocity profiles indicates that this mode is a Von Kármán mode.
4. Conclusions
In this paper results of an experimental investigation of the flow between two
cylinders in tandem with a pitch and a Reynolds number of
are reported. The behavior of the separated shear layers from the
upstream cylinder switch intermittently between roll-up with vortex shedding and
reattachment onto the downstream cylinder with recirculation. The first flow
pattern is similar to a Von Karman shedding from an isolated cylinder but with a
smaller Strouhal number. The recirculation is mainly outside our visualization domain but is most probably responsible for the different value of the Strouhal
number measured in the second flow pattern. Another time resolved PIV
measurements campaign is currently undertaken in order to fully characterize the recirculating flow and reattachment dynamics in the vicinity of the downstream
cylinder, in comparison with simulation results for static and freely vibrating
second cylinder.
Acknowledgements
This work has been carried out in the research group EMT2 (Ecoulements
Monophasiques, Transitionnels et Turbulents) of the Institut de Mécanique des
Fluides de Toulouse. It is based on the collaborative efforts of Sébastien Cazin,
Moise Marshal, Hervé Ayroles and Christophe Korbuly for the experiments set
up and the measurements techniques. Authors want to thank Alain Sevrain for
useful discussions. This work has been carried out in the context of the ANR-
BARESAFE.
References
Adrian, Ronald J., et Jerry Westerweel. 2010. Particle Image Velocimetry. Cambridge
University Press
Alam, Md. Mahbub, et J. P. Meyer. 2011. « Two interacting cylinders in cross flow ».
Physical Review E
Braza, M., R. Perrin, et Y. Hoarau. 2006. « Turbulence properties in the cylinder wake
at high Reynolds numbers ». Journal of Fluids and Structures
Granger, S., et M. P. Paidoussis. 1996. « An improvement to the quasi-steady model
with application to cross-flow-induced vibration of tube arrays ». Journal of Fluid Mechanics
Igarashi, T. 1981. « Characteristics of the Flow Around Two Circular Cylinders
Arranged in Tandem. I ». JSME International Journal Series B.
Iwaki, C., K. H. Cheong, H. Monji, et G. Matsui. 2004. « PIV Measurement of the
Vertical Cross-flow Structure over Tube Bundles ». Experiments in Fluids 37
Jenkins, Luther, Mehdi Khorrami, Meelan Choudhari, et Cathy McGinley. 2005.
« Characterization of Unsteady Flow Structures Around Tandem Cylinders for Component
Interaction Studies in Airframe Noise ». American Institute of Aeronautics and Astronautics,
Lin, J.-C., Y. Yang, et D. Rockwell. 2002. « Flow past two cylinders in tandem:
M. ELHIMER ET AL.
8
instantaneous and averaged flow structure ». Journal of Fluids and Structures
Marple, S. Lawrence. 1987. « Digital Spectral Analysis with Applications ».
Englewood Cliffs, NJ, Prentice-Hall, Inc.
Paul, S.S., M.F. Tachie, et S.J. Ormiston. 2007. « Experimental study of turbulent cross-
flow in a staggered tube bundle using particle image velocimetry ». International Journal of
Heat and Fluid Flow
Sumner, D., S. J. Price, et M. P. Paidoussis. 2000. « Flow-pattern identification for two
staggered circular cylinders in cross-flow ». Journal of Fluid Mechanics
Sumner, D. 2010. « Two circular cylinders in cross-flow: A review ». Journal of Fluids
and Structures
Xu, G., et Y. Zhou. 2004. « Strouhal Numbers in the Wake of Two Inline Cylinders ».
Experiments in Fluids
-2.5 -2 -1.5 -1 -0.5
-0.6
-0.4
-0.2
0
0.2
0.4
0.6
0.8
X/D
Y/D
-2.5 -2 -1.5 -1 -0.5
-0.6
-0.4
-0.2
0
0.2
0.4
0.6
0.8
X/D
Y/D
-2.5 -2 -1.5 -1 -0.5
-0.6
-0.4
-0.2
0
0.2
0.4
0.6
0.8
X/D
Y/D
-2.5 -2 -1.5 -1 -0.5
-0.6
-0.4
-0.2
0
0.2
0.4
0.6
0.8
X/D
Y/D
Time resolved PIV on cylinders in tandem
Figure 3 flow pattern I : Velocity fields sequence at a
frequency of . The number of vectors have been
reduced and the velocity fields smoothed for clarity
Figure 4 flow pattern II : Velocity fields sequence at a
frequency of . The number of vectors has been
reduced and the velocity fields smoothed for clarity
-2.5 -2 -1.5 -1 -0.5
-0.6
-0.4
-0.2
0
0.2
0.4
0.6
0.8
X/D
Y/D
-2.5 -2 -1.5 -1 -0.5
-0.6
-0.4
-0.2
0
0.2
0.4
0.6
0.8
X/D
Y/D
-2.5 -2 -1.5 -1 -0.5
-0.6
-0.4
-0.2
0
0.2
0.4
0.6
0.8
X/D
Y/D
-2.5 -2 -1.5 -1 -0.5
-0.6
-0.4
-0.2
0
0.2
0.4
0.6
0.8
X/D
Y/D
-2.5 -2 -1.5 -1 -0.5
-0.6
-0.4
-0.2
0
0.2
0.4
0.6
0.8
X/D
Y/D
-2.5 -2 -1.5 -1 -0.5
-0.6
-0.4
-0.2
0
0.2
0.4
0.6
0.8
X/D
Y/D
M. ELHIMER ET AL.
10
Figure 5 Flow pattern I : spatial field of in the
wake of the upstream cylinder.
Figure 6 Flow pattern II : spatial field of in the
wake of the upstream cylinder.
Figure 7 Flow pattern I : profiles of along the lines
(black) (red) (blue)
(green).
Figure 8 Flow pattern II : profiles of along the
lines (black) (red)
(blue) (green).
-2.5 -2 -1.5 -1 -0.5 0 0.5
-0.5
0
0.5
1
X/D
Y/D
-0.14
0.23
0.68
1.14
-0.2 0 0.2 0.4 0.6 0.8 1 1.2
-2.5 -2 -1.5 -1 -0.5 0 0.5
-0.5
0
0.5
1
X/D
Y/D
-0.1
1
1.24
0.64
-0.2 0 0.2 0.4 0.6 0.8 1 1.2
-0.5 0 0.5 1-0.5
0
0.5
1
1.5X/D=-0.71
X/D=-2.2
Um
/U
Y/D
-0.5 0 0.5 1-0.5
0
0.5
1
1.5
X/D=-0.71
X/D=-2.2
Um
/U
Y/D
Time resolved PIV on cylinders in tandem
Figure 9 Flow pattern I : spatial field of
in the wake of the upstream cylinder.
Figure 10 Flow pattern II : spatial field of in the
wake of the upstream cylinder.
Figure 11 Flow pattern I : profiles of along the
lines (black) (red)
(blue) (green).
Figure 12 Flow pattern II : profiles of along the
lines (black) (red)
(blue) (green).
-2.5 -2 -1.5 -1 -0.5 0 0.5
-0.5
0
0.5
1
X/D
Y/D
0.14
0.24
0.32
0.05 0.1 0.15 0.2 0.25 0.3
-2.5 -2 -1.5 -1 -0.5 0 0.5
-0.5
0
0.5
1
X/D
Y/D
0.05
0.08
0.01
0.02
0.02 0.04 0.06 0.08 0.1
-0.5 0 0.5 10
0.1
0.2
0.3
0.4
X/D=-0.71
X/D=-2.2
u2/U
2
Y/D -0.5 0 0.5 10
0.02
0.04
0.06
0.08
0.1
X/D=-0.71
X/D=-2.2
u2/U
2
Y/D

M. ELHIMER ET AL.
12
Figure 13 Flow pattern I : spatial field of in the
wake of the upstream cylinder.
Figure 14 Flow pattern II : spatial field of in the
wake of the upstream cylinder.
Figure 15 Flow pattern I : profiles of along the
lines (black) (red)
(blue) (green).
Figure 16 Flow pattern II : profiles of along the
lines (black) (red)
(blue) (green).
-2.5 -2 -1.5 -1 -0.5 0 0.5
-0.5
0
0.5
1
X/D
Y/D
0.06
0.17
0.36
0.55
0.1 0.2 0.3 0.4 0.5
-2.5 -2 -1.5 -1 -0.5 0 0.5
-0.5
0
0.5
1
X/D
Y/D
0.010.021
0.04
0.01 0.02 0.03 0.04 0.05 0.06 0.07
-0.5 0 0.5 10
0.2
0.4
0.6
0.8
X/D=-0.71
X/D=-2.2
v2/U
2
Y/D-0.5 0 0.5 1
0
0.01
0.02
0.03
0.04
0.05
X/D=-0.71
X/D=-2.2
v2/U
2
Y/D

Time resolved PIV on cylinders in tandem
Figure 17 Flow pattern I : spatial field of in
the wake of the upstream cylinder.
Figure 18 Flow pattern II: spatial field of in the
wake of the upstream cylinder.
Figure 19 Flow pattern I : profiles of along the
lines (black) (red)
(blue) (green).
Figure 20 Flow pattern II : profiles of along the
lines (black) (red)
(blue) (green).
-2 -1 0
-0.5
0
0.5
1
X/D
Y/D
-0.15 -0.1 -0.05 0 0.05 0.1
-2.5 -2 -1.5 -1 -0.5 0 0.5
-0.5
0
0.5
1
X/D
Y/D
0
0.0150.024
0.027
-0.0137-0.02-0.025
-0.028
-0.03 -0.02 -0.01 0 0.01 0.02
-0.5 0 0.5 1-0.2
-0.1
0
0.1
0.2
X/D=-0.71
X/D=-2.2
uv/
U2
Y/D-0.5 0 0.5 1
-0.04
-0.02
0
0.02
0.04
X/D=-0.71
X/D=-2.2
uv/U
2
Y/D

M. ELHIMER ET AL.
14
Figure 21 Flow pattern I : vertical velocity
periodogram on the horizontal line at
positions from to by a
step of
Figure 22 Flow pattern II : vertical velocity periodogram
on the horizontal line at positions from
to by a step of
100
100
102
104
PS
D v
(d
B)
f.D/U
y/D=0,5
0.178
0.355
0.527
10-1
100
10-2
10-1
100
101
102
PS
D v
(d
B)
f.D/U
y/D=0
X/D=-0.76
X/D=-2.17
0.135