Equity Research - Yale SOM Security Analysis
28
Please refer to important disclosure information on page 27. Current Market Price: $ 52.95 52 Wk Range $ 31.21 - $56.06 Market Cap $ 11.01 bn Trailing P/E 4.97 Forward P/E 24.2 Return on Assets 9.59 Return on Equity 47.43 Current Market Price: $ 104.99 52 Wk Range $ 22.41 - $106.30 Market Cap $ 9.36 bn Trailing P/E 9.78 Forward P/E 16.38 Return on Assets 16.45 Return on Equity 45.84 Company Description: Kmart Corporation is a discount retailer operating through 1,511 Kmart discount stores and Supercenters with locations in 49 states, Puerto Rico, the United States Virgin Islands and Guam, as of January 28, 2004, and through an e-commerce shopping site, www.kmart.com. The Company has one operating segment that consists of its retail business. Its general merchandise retail operations are located in 286 of the 331 metropolitan statistical areas in the United States. Its 60 Kmart Supercenters combine a full grocery, deli and bakery, along with the general merchandise selection of a Kmart discount store. The brands that the Company markets include Martha Stewart Everyday, Joe Boxer, Jaclyn Smith, Sesame Street and Thalia Sodi, among others. On January 22, 2002, Kmart and 37 of its United States subsidiaries filed voluntary petitions for reorganization under Chapter 11 of the United States Bankruptcy Code. In May 2003, the Company emerged from Chapter 11 protection. (Source: Yahoo Finance) Company Description: Sears, Roebuck and Co. is a multi-line retailer that offers an array of merchandise and related services. The Company operates principally in the United States, Puerto Rico and Canada. During the fiscal year ended January 3, 2004 (fiscal 2003), Sears was organized into three domestic segments: Retail and Related Services, Credit and Financial Products and Corporate and Other; and one international segment: Sears Canada. The Retail and Related Services segment consists of merchandise sales and related services, including service contracts, delivery and product installation and repair services. The Credit and Financial Products segment managed the Company's domestic portfolio of Sears Card and MasterCard receivables. This business was sold on November 3, 2003. The Corporate and Other segment includes the operations of Sears Home Improvement Services. The Sears Canada segment includes similar retail, credit and corporate operations conducted by Sears Canada, a 54.4%-owned subsidiary. (Source: Yahoo Finance) Contributing Analysts: Abdullah Karatash Len Rittberg [email protected] [email protected] (917) 703 – 1555 (203) 645 - 1743 November 19, 2004 Sears Holding Corp. ($104.99) Target Price: $91 Rating: Underweight An over-valued turnaround store with limited potential for success: We are underweight Sears Holding Corp.’s equity (the name given to the $11bn combination of Kmart Holding Corp. and Sears Roebuck & Co). When we first started writing our report on Kmart two weeks ago, we were bearish Kmart at its trading levels given the tough operating environment for retailers in general, and the growing margin pressure from Wal-Mart. On a stand-alone basis, we would also have been underweight Sears Roebuck. On November 17, Kmart and Sears made a surprise announcement that the two companies planned on merging. Under the terms of the deal, Kmart shareholders will receive one share of Sears Holding for each of their shares. Sears investors will receive 0.5 shares of the new company (or $50 in cash) for each of their shares. The $50 price represents a 10.6% premium over Sears' closing share price on November 16. Kmart & Sears: Wal-Mart Ate My Lunch… Equity Research
-
Upload
khangminh22 -
Category
Documents
-
view
1 -
download
0
Transcript of Equity Research - Yale SOM Security Analysis

Please refer to important disclosure information on page 27.
Current Market Price: $ 52.95 52 Wk Range $ 31.21 - $56.06 Market Cap $ 11.01 bn Trailing P/E 4.97 Forward P/E 24.2 Return on Assets 9.59 Return on Equity 47.43
Current Market Price: $ 104.99 52 Wk Range $ 22.41 - $106.30 Market Cap $ 9.36 bn Trailing P/E 9.78 Forward P/E 16.38 Return on Assets 16.45 Return on Equity 45.84
Company Description: Kmart Corporation is a discount retailer operating through 1,511 Kmart discount stores and Supercenters with locations in 49 states, Puerto Rico, the United States Virgin Islands and Guam, as of January 28, 2004, and through an e-commerce shopping site, www.kmart.com. The Company has one operating segment that consists of its retail business. Its general merchandise retail operations are located in 286 of the 331 metropolitan statistical areas in the United States. Its 60 Kmart Supercenters combine a full grocery, deli and bakery, along with the general merchandise selection of a Kmart discount store. The brands that the Company markets include Martha Stewart Everyday, Joe Boxer, Jaclyn Smith, Sesame Street and Thalia Sodi, among others. On January 22, 2002, Kmart and 37 of its United States subsidiaries filed voluntary petitions for reorganization under Chapter 11 of the United States Bankruptcy Code. In May 2003, the Company emerged from Chapter 11 protection. (Source: Yahoo Finance) Company Description: Sears, Roebuck and Co. is a multi-line retailer that offers an array of merchandise and related services. The Company operates principally in the United States, Puerto Rico and Canada. During the fiscal year ended January 3, 2004 (fiscal 2003), Sears was organized into three domestic segments: Retail and Related Services, Credit and Financial Products and Corporate and Other; and one international segment: Sears Canada. The Retail and Related Services segment consists of merchandise sales and related services, including service contracts, delivery and product installation and repair services. The Credit and Financial Products segment managed the Company's domestic portfolio of Sears Card and MasterCard receivables. This business was sold on November 3, 2003. The Corporate and Other segment includes the operations of Sears Home Improvement Services. The Sears Canada segment includes similar retail, credit and corporate operations conducted by Sears Canada, a 54.4%-owned subsidiary. (Source: Yahoo Finance)
Contributing Analysts:
Abdullah Karatash Len Rittberg [email protected] [email protected] (917) 703 – 1555 (203) 645 - 1743
November 19, 2004
Sears Holding Corp. ($104.99) Target Price: $91 Rating: Underweight An over-valued turnaround store with limited potential for success: We are underweight Sears Holding Corp.’s equity (the name given to the $11bn combination of Kmart Holding Corp. and Sears Roebuck & Co). When we first started writing our report on Kmart two weeks ago, we were bearish Kmart at its trading levels given the tough operating environment for retailers in general, and the growing margin pressure from Wal-Mart. On a stand-alone basis, we would also have been underweight Sears Roebuck. On November 17, Kmart and Sears made a surprise announcement that the two companies planned on merging. Under the terms of the deal, Kmart shareholders will receive one share of Sears Holding for each of their shares. Sears investors will receive 0.5 shares of the new company (or $50 in cash) for each of their shares. The $50 price represents a 10.6% premium over Sears' closing share price on November 16.
Kmart & Sears: Wal-Mart Ate My Lunch…
Equity Research

Karatash & Rittberg - 2 - 11/19/2004
Equity Research
Sears K-Mart Sears K-MartStock Price History
Market Cap (intraday): 11.01B 9.36B Beta: 0.614 N/AEnterprise Value (24-Nov-04)³: 13.91B 7.13B 52-Week Change: -3.37% 265.20%Trailing P/E (ttm, intraday): 4.97 9.78 52-Week Change (relative to -14.52% 223.05%Forward P/E (fye 3-Jan-06)¹: 24.2 16.38 52-Week High (1-Dec-03): 56.06 119.69PEG Ratio (5 yr expected)¹: 5.82 1.81 52-Week Low (25-Oct-04): 31.21 22.41Price/Sales (ttm): 0.3 0.46 50-Day Moving Average: 40.41 91.89Price/Book (mrq): 2.03 3.04 200-Day Moving Average: 40.2 64.93Enterprise Value/Revenue (ttm)³: 0.37 0.35Enterprise Value/EBITDA (ttm)³: 9.81 3.7 Share Statistics
Average Volume (3 month): 4,584,636 2,556,090
Average Volume (10 day): 11,623,000 7,377,000Shares Outstanding: 206.82M 89.18M
Sears K-Mart Float: 205.90M 37.50MFiscal Year % Held by Insiders: 0.44% 57.95%Fiscal Year Ends: 3-Jan 28-Jan % Held by Institutions: 69.64% 74.06%Most Recent Quarter (mrq): 30-Sep-04 31-Oct-04 Shares Short (as of 8-Nov-04 12.65M 9.19M
Daily Volume (as of 8-Nov-04 N/A N/AProfitability Short Ratio (as of 8-Nov-04): 2.153 6.429Profit Margin (ttm): 7.45% 5.37% Short % of Float (as of 8-Nov 6.14% 24.50%Operating Margin (ttm): 0.23% 9.30% Shares Short (prior month): 15.50M 9.46M
Management Effectiveness Dividends & SplitsReturn on Assets (ttm): 9.59% 16.45% Annual Dividend: 0.92 N/AReturn on Equity (ttm): 47.43% 45.84% Dividend Yield: 1.74% 0.00%
Dividend Date: 3-Jan-05 5-Jun-87Income Statement Ex-Dividend Date: 26-Nov-04 8-Jun-87Revenue (ttm): 37.12B 20.12B Last Split Factor (new per old 2:01 N/ARevenue Per Share (ttm): 164.776 199.876 Last Split Date: 18-Jul-77 N/ARevenue Growth (lfy)³: -0.60% N/AGross Profit (ttm)²: 14.89B 5.41BEBITDA (ttm): 1.42B 1.93B Source: Yahoo Finance
Net Income Avl to Common (ttm): 2.72B 1.08BDiluted EPS (ttm): 10.704 10.738Earnings Growth (lfy)³: 146.90% N/A
Balance SheetTotal Cash (mrq): 2.73B 2.56BTotal Cash Per Share (mrq): 13.22 28.75Total Debt (mrq)²: 5.68B 393.00MTotal Debt/Equity (mrq): 1.048 0.128Current Ratio (mrq): 1.277 3.15Book Value Per Share (mrq): 26.098 34.300999
Cash Flow StatementFrom Operations (ttm)³: -969.00M 2.19BFree Cashflow (ttm)³: -1.90B 2.01B
VALUATION MEASURES
FINANCIAL HIGHLIGHTS
TRADING INFORMATION

Karatash & Rittberg - 3 - 11/19/2004
Equity Research
Kmart Stock Price: 12-month Performance
Sears Stock Price: 12-month Performance

Karatash & Rittberg - 4 - 11/19/2004
Equity Research
K-Mart Major Holders
BREAKDOWN
% of Shares Held by All Insider and 5% Owners: 58%% of Shares Held by Institutional & Mutual Fund Owner 74%% of Float Held by Institutional & Mutual Fund Owners: 176%Number of Institutions Holding Shares: 10
TOP INSIDER & RULE 144 HOLDERS
Holder Shares ReportedESL INVESTMENTS INC 73,140,756 24-Aug-04TISCH, THOMAS J. 1,079,302 6-May-03KELLY, JANET LANGFORD 34,218 3-Sep-03DONLON, JAMES D. 21,552 2-Jan-04GOODMAN, JOHN 21,552 2-Jan-04
TOP INSTITUTIONAL HOLDERS
Holder Shares % Out Value* ReportedThird Avenue Management, LLC 4,481,520 5 $321,773,136 30-Jun-04RBS Partners, L.P. 41,480,635 46.27 $2,978,309,593 30-Jun-04Atticus Capital, L.L.C. 3,182,072 3.55 $228,472,769 30-Jun-04Perry Corp. 2,450,100 2.73 $175,917,180 30-Jun-04Trafelet & Company, LLC 1,362,500 1.52 $97,827,500 30-Jun-04Barclays Bank Plc 1,040,514 1.16 $74,708,905 30-Jun-04Goldman Sachs Group Inc 972,864 1.09 $69,851,635 30-Jun-04Zander Capital Management, LLC 860,401 0.96 $61,776,791 30-Jun-04Vanguard Group, Inc. (The) 843,499 0.94 $73,780,858 30-Sep-04JGD Management Corporation 710,686 0.79 $51,027,254 30-Jun-04
TOP MUTUAL FUND HOLDERS
Holder Shares % Out Value* ReportedThird Avenue Value Fund, Inc. 1,492,913 1.67 $115,596,251 31-Jul-04Vanguard Total Stock Market Index Fund 323,090 0.36 $23,197,862 30-Jun-04College Retirement Equities Fund-Stock Account 314,194 0.35 $22,559,129 30-Jun-04Vanguard Extended Market Index Fund 225,099 0.25 $16,162,108 30-Jun-04Vanguard Mid-Cap Index Fund 152,381 0.17 $10,940,955 30-Jun-04Aegon/Transamerica Ser-Third Avenue Value 109,600 0.12 $7,869,280 30-Jun-04MET Investors Ser Tr-Third Avenue Small Cap Value 100,400 0.11 $7,208,720 30-Jun-04Third Avenue Variable Series Trust Fund 99,600 0.11 $7,151,280 30-Jun-04Diversified Investors Aggressive Equity Portfolio 87,000 0.1 $6,246,600 30-Jun-04CDC Nvest Star Advisers Fund 78,425 0.09 $5,630,915 30-Jun-04

Karatash & Rittberg - 5 - 11/19/2004
Equity Research
Sears Major Holders
BREAKDOWN
% of Shares Held by All Insider and 5% Owners: 0%% of Shares Held by Institutional & Mutual Fund Owners: 70%% of Float Held by Institutional & Mutual Fund Owners: 70%Number of Institutions Holding Shares: 10
TOP INSIDER & RULE 144 HOLDERS
Holder Shares ReportedKP I PARTNERS LP 31,100,000 30-Jun-03ESL INVESTMENTS INC 31,100,000 1-Jul-04LACY, ALAN J. 109,006 20-Aug-04CARTY, DON 50,000 31-Mar-03PADILLA, LUIS A. 50,000 20-Sep-04
TOP INSTITUTIONAL HOLDERS
Holder Shares % Out Value* ReportedHotchkis & Wiley Capital Management, LLC 14,332,648 6.9 $541,200,797 30-Jun-04Barclays Bank Plc 7,098,850 3.42 $268,052,580 30-Jun-04Vanguard Group, Inc. (The) 4,220,294 2.03 $168,178,715 30-Sep-04Axa 4,188,164 2.02 $158,145,075 30-Jun-04RBS Partners, L.P. 31,100,000 14.98 $1,174,336,018 30-Jun-04State Street Corporation 23,498,071 11.32 $887,287,175 30-Jun-04Deutsche Bank Aktiengesellschaft 3,478,210 1.68 $131,337,211 30-Jun-04Equinox Capital Management 3,447,845 1.66 $137,396,623 30-Sep-04Goldman Sachs Group Inc 2,716,769 1.31 $102,585,199 30-Jun-04LSV Asset Management 2,654,050 1.28 $100,216,929 30-Jun-04
TOP MUTUAL FUND HOLDERS
Holder Shares % Out Value* ReportedVanguard/Windsor II 3,928,700 1.89 $144,104,711 31-Jul-04Hotchkis and Wiley Mid-Cap Value Fund 2,109,500 1.02 $79,654,721 30-Jun-04Vanguard 500 Index Fund 1,977,537 0.95 $74,671,798 30-Jun-04College Retirement Equities Fund-Stock Account 1,188,182 0.57 $44,865,753 30-Jun-04SPDR Trust Series 1 1,108,223 0.53 $48,462,590 30-Sep-03Fidelity Equity-Income Fund 1,032,700 0.5 $37,879,434 31-Jul-04Vanguard Institutional Index Fund-Institutional Index Fd 860,785 0.41 $32,503,242 30-Jun-04Hotchkis and Wiley Large Cap Value Fund 780,000 0.38 $29,452,800 30-Jun-04Vanguard Total Stock Market Index Fund 763,216 0.37 $28,819,036 30-Jun-04American Skandia Tr-Hotchkiss & Wiley Large Cap Value 762,600 0.37 $28,795,776 30-Jun-04

Karatash & Rittberg - 6 - 11/19/2004
Equity Research
Insider ownership is significant for Kmart, not surprising given ESL’s huge stake and the company’s restructuring history. Insider ownership is negligible, however, for Sears. Institutional ownership is preponderant for both companies, signaling the firms’ value as stable retail holdings. For the purpose of writing this report, we will assume that the merger deal will work out, although we want to draw attention to the possibility, however remote, that another bidder (such as Vornado Realty Trust) might try to stir the pot by topping Kmart’s bid. Eddie Lampert (of ESL Investments and chairman of Kmart) will run the combined group along with Aylwin Lewis (recently appointed chief executive of Kmart) and Alan Lacy (chief executive of Sears). Sears Holding, which will be the third-largest US retailer after Wal-Mart and Home Depot, will be headquartered in Hoffman Estates, Illinois, at Sears' current home-base. Investors sent the stocks of both companies soaring upon news of the merger plan. Sears Holding, with $55bn in annual revenues still lags far behind Wal-Mart Stores, with $280bn in annual revenues.1 Combining two struggling retailers with dismal sales does not necessarily produce a winner; the aphorism of “two wrongs do not add up to a right” comes to mind. Speculation is rife that Lampert wants to turn the combined entity into a Berkshire Hathaway-like investment vehicle.2 When investors buy Sears Holding’s equity, investors are not really investing in the combined retailer as much as they are investing in Eddie Lampert’s business acumen. If one thinks that Lampert is the second coming of Warren Buffett, then buying the stock at current valuation levels makes sense. Eddie is a great trader, no doubt, but he has yet to earn his spurs as the honcho of a major going concern. Our view is that for an investor looking for stable returns, the risk of owning Sears Holding’s equity is not worth it. In the long-run, we see Eddie consolidating Sears Holding, divesting underperforming stores, accruing tax-shielded cash from the retail operations using $3.8bn in deferred tax assets,3 and eventually spinning
Combining two struggling retailers with dismal sales does not necessarily produce a winner …
I. Overview
… Institutional ownership is preponderant, signaling the firms’ value as stable retail holdings.

Karatash & Rittberg - 7 - 11/19/2004
Equity Research
off the going concern to a strategic player like Target or the European retailing giant Carrefour.4 In a sign that the fixed-income market is not pleased with the merger, S&P warned that the company could end up with a junk rating when the deal is finalized. Moody's has lowered its rating on Sears’ debt to a low investment grade ranking of Baa2. Credit default swap spreads on Sears widened some 20 basis points on the announcement.5
Many investors are confused about why Lampert would engineer such a takeover for cash-rich Kmart, which could have had its pick of investment opportunities. Eddie is often referred to as the next Warren Buffett,6 whose successful investment technique of buying solid, dull, and undervalued companies is one that the 42 year-old Lampert has closely followed. Lampert bought his initial stake in AutoZone Inc., the struggling auto-parts retailer, in 1997. By 1999, Eddie had a seat on AutoZone’s board and eventually brought in a new management team and boosted cash flow. The result was improved earnings and a fourfold surge in the company’s stock price.7 Eddie brought Kmart out of Chapter 11 bankruptcy proceedings on May 6, 2003 with its long-term prime leases intact. Kmart had filed voluntary petitions for reorganization under Chapter 11 of the US Bankruptcy Code on January 22, 2002; the company was forced into bankruptcy mainly by fierce competition from Wal-Mart. Kmart’s bankruptcy restructuring was an all equity deal. The equity stake was wiped out and all of the debt outstanding was converted to new equity in the restructured entity; nothing would have been left over for the creditors had the deal not been an all-equity transaction.8 Eddie led an aggressive strategy of closing or selling about 600 stores. This aggressive cost-cutting and asset divestiture strategy has been the main driver of Kmart’s speedy financial turnaround. Since coming out of bankruptcy, Kmart’s stock has more than quadrupled in value. Before the merger announcement, the consensus estimate was for Kmart shares to hit $110/share by the end of the year, which happened shortly after the merger news hit the tape.9
… why…engineer such a takeover for cash-rich Kmart, which could have had its pick of investment opportunities?
II. Background

Karatash & Rittberg - 8 - 11/19/2004
Equity Research
Kmart has not been plowing its cash flow back into its operations and thus has not been able to sustain any substantial growth on an operational basis. Kmart’s inventories and fixed assets are in bad shape and subject to shrinkage.10 Kmart’s earnings to date have benefited from deferred tax assets that came from writing down assets before the bankruptcy and taking the losses through the process. Aside from this limited source of capital, there is not a lot of potential upside in the Kmart story.
At Kmart, customers’ household incomes are typically $25,000 and below. Kmart was the first discounter to use exclusive brands. Over the past few years, the company’s stable of exclusive brands has expanded to include Jaclyn Smith, Sesame Street, Kathy Ireland, Martha Stewart Everyday, and most recently, Joe Boxer. The latter two lines have been wins for the retailer, as both have raised the profile of its stores and attracted new customers.11 With the merger, there will be difficulties in synchronizing Kmart and Sears with regards to merchandising and planning. There are no guarantees that cross-selling between the stores (i.e. bringing Craftsman tools into Kmart or Martha Stewart-branded goods into Sears) will drive business.12 Lampert, Lewis and Lacy plan on squeezing suppliers as the combined Sears Holding entity buys $40bn a year in merchandise. Sears Holding also plans on lowering costs by streamlining its back-office operations. The new company is expected to have annual savings, or “synergies,” of $500 million over the next three years. Whether these ambitious goals can be achieved remains to be seen.13 Aylwin Lewis, formerly of Yum! Brands, has extensive experience in the restaurant business although he has no prior experience with retail.14 Aylwin’s expertise might not translate over to running Sears Holding Corp, especially in the face of unrelenting competition from Target and Wal-Mart. Aylwin’s strong operations background, however, could help Sears Holding focus on cutting costs and overlapping functions between Kmart and Sears stores.15
We view competition [from Wal-Mart and Target], however, as an unavoidable part of doing business in the retail space.
III. Issues and Concerns

Karatash & Rittberg - 9 - 11/19/2004
Equity Research
Sears Holding is purportedly not going to compete head-to-head with Wal-Mart and Target. We view this competition, however, as an unavoidable part of doing business in the retail space. Kmart and Sears have to generate more consumer traffic; the stock will drop if they do not. Christmas sales will be crucial in determining Sears Holding’s value as a going concern.16 An increased focus on branded goods will help generate more traffic. Sears’ sales have remained weak. Comps were down 4% in the domestic business and the company experienced particularly weak demand in August and September due in part to unseasonably cool weather. Further markdowns were needed in apparel to clear seasonal slower moving inventory.17 Selling off underperforming real estate and tucking away retained earnings appear to be Lampert’s main source of free capital. Kmart’s leases constitute the bulk of Kmart’s value as same-store sales and other retail metrics have been declining steadily. Eddie had sold 45 stores to Sears for $524.5 million and a further 18 stores to Home Depot for $271 million before the merger announcement.18 Geographically, Kmart stores are concentrated in urban areas with a heavy African-American and Hispanic presence. Sears stores are also located primarily in urban areas, and so growth prospects will be limited. According to UBS retail analyst Gary Balter, 64% of Sears’ full-line stores are within one mile of a Kmart store, and 68% of Target and Wal-Mart stores are within one mile of a Kmart or Sears’ store. Kmart and Sears’ overlap could lead to some cannibalization and possible brand deterioration.19 The potential for Sears to improve sales by expanding into some of the stand-alone or off-mall locations occupied by Kmart is substantial. Talking about Sears, Alan Lacy declared that “Off-mall growth is our number one strategic position…We have an opportunity to significantly accelerate” that strategy. Eddie Lampert believes that converting some Kmart stores into Sears’ stores would boost sales among suburban shoppers who bypass Kmart for Wal-Mart and Target. There are over 1,500 Kmart stores in off-mall locations in high traffic areas. Sears’ strategy to move off-mall highlights a trend that some mall-based retailers are starting to adopt in order to stay competitive. Sears had already started moving in this direction prior to the merger
The potential for Sears to improve sales by expanding into some of the stand-alone or off-mall locations occupied by Kmart is substantial.

Karatash & Rittberg - 10 - 11/19/2004
Equity Research
announcement with the build-out of a few Sears Grand stores. Sears' desire to move off-mall, where many Kmart properties are, was most likely one of the main driving forces behind the merger.20 At its stores inside malls, Sears, not unlike JC Penney, has been losing traffic to more exclusive boutiques and branded stores. By moving toward having more stand-alone stores, Sears could boost its product offerings and benefit from reduced competition. According to Darrell Rigby, head of the global retail practice at Bain & Company, a growing segment of consumers is less interested in going to malls. Mall traffic has been declining steadily as more people shop off the mall. One of the reasons is that malls are less convenient than big-box stores where customers can park closer to the entrance. Mr. Rigby continued “As Sears has built off-mall stores they have found it is not cannibalizing their existing stores nearly as much as they expected…it is a different customer base who go there for different purchasing occasions; they are going there more frequently because of the mix of merchandise.”21 Looking at Kmart’s cash position, we certainly see a transformation of Sears Holding into an investment vehicle as a likely strategy, which would not necessarily be good news for investors looking to buy retail stock. In the event that Eddie Lampert elects not to pursue this course, there has not been a lot of clarity on exit strategies for his investment. Lampert's role in the merger is fueling speculation about how the merged company will unlock value in its real-estate holdings. Estimates of Sears’ real estate value remain a little exaggerated. It is very likely that groups of underperforming stores (both Sears’ and Kmart’s) will likely be sold to fund off mall expansion for Sears Holding and to build a mountain of cash for Lampert’s investment vehicle. Kmart and Sears’ corporate cultures will have to be merged, posing additional challenges for the combined retailer. Sears, founded in 1886, is one of America's most well-established shopping institutions. Although its products are often discounted, the retailer is not a pure discounter like Wal-Mart, Target or Kmart. Sears puts a premium on customer service and its staff having very high levels of product knowledge whereas service does not play as big a role at Kmart. The emphasis at Kmart is on a convenient shopping experience as opposed to product knowledge. Over the past year, Kmart has been trying to sell more branded products, while Sears has been adding more soft goods to its stores, which will help make the cultural fusion a little easier.22
… we certainly see a transformation of Sears Holding into an investment vehicle as a likely strategy, which would not necessarily be good news for investors …

Karatash & Rittberg - 11 - 11/19/2004
Equity Research
Regarding inventory, Kmart and Sears have not made any moves toward matching Wal-Mart’s steady progression toward scan-based trading (using checkout scan technology to pressure manufacturers to own each product until it is sold, therefore shedding billions of dollars worth of inventory from the balance sheet).23 This will further put Sears Holding at a disadvantage vis-à-vis Wal-Mart. Eddie Lampert will likely use Sears Holding as an investment vehicle. Kmart is currently sitting on $4 billion of cash and not much of it has been dedicated to retail. It is likely that Lampert will use Sears Holding to generate even more cash. Lampert might buy Toys ‘R Us (or their Babies ‘R Us unit) to add to his real estate portfolio and enhance Sears Holding’s scale and value as a going concern.24 At some point, however, it is likely that Lampert will look for a buyer for the going concern. Target or Carrefour could be potential strategic buyers of Sears Holding’s retail business. Vornado would be a likely buyer of Sears Holding’s divested real-estate properties. Retail is a terrible industry to be in, mainly because the industry is very badly financed. Between 1978 and 1992, an inordinate number of retailers went insolvent and had to reorganize. For every Wal-Mart, there was a Federated Department Stores or an Ames. Moreover, the Wal-Mart phenomenon has caused all kinds of permanent revolutions in the retail space making it harder to compete.25 Owning retailers only makes sense, from an investment vehicle’s standpoint, in order to build a tremendous cash surplus. In terms of retail, cash-rich specialty retailers which cater to a niche, such as Sharper Image, appear to be well-positioned to tough it out for a while longer. And so, we would not be altogether surprised if Lampert decided to transform Sears Holding into a niche player in retail, focusing on branded appliance goods, apparel brands, and catalogue sales instead of simply providing all sorts of goods at a lower price than the next retailer. We do not want to discount the legacy/ego effect; Lampert can truly earn his rightful place in the pantheon of great American business legends if he can cobble together a success story out of two relative failures.
… do not…discount the legacy/ego effect; Lampert can…earn his rightful place in the pantheon of …business legends if he can cobble together a success story out of two relative failures.
At some point, however, it is likely that Lampert will look for a buyer for the going concern.
Karatash & Rittberg - 12 - 11/19/2004
Equity Research
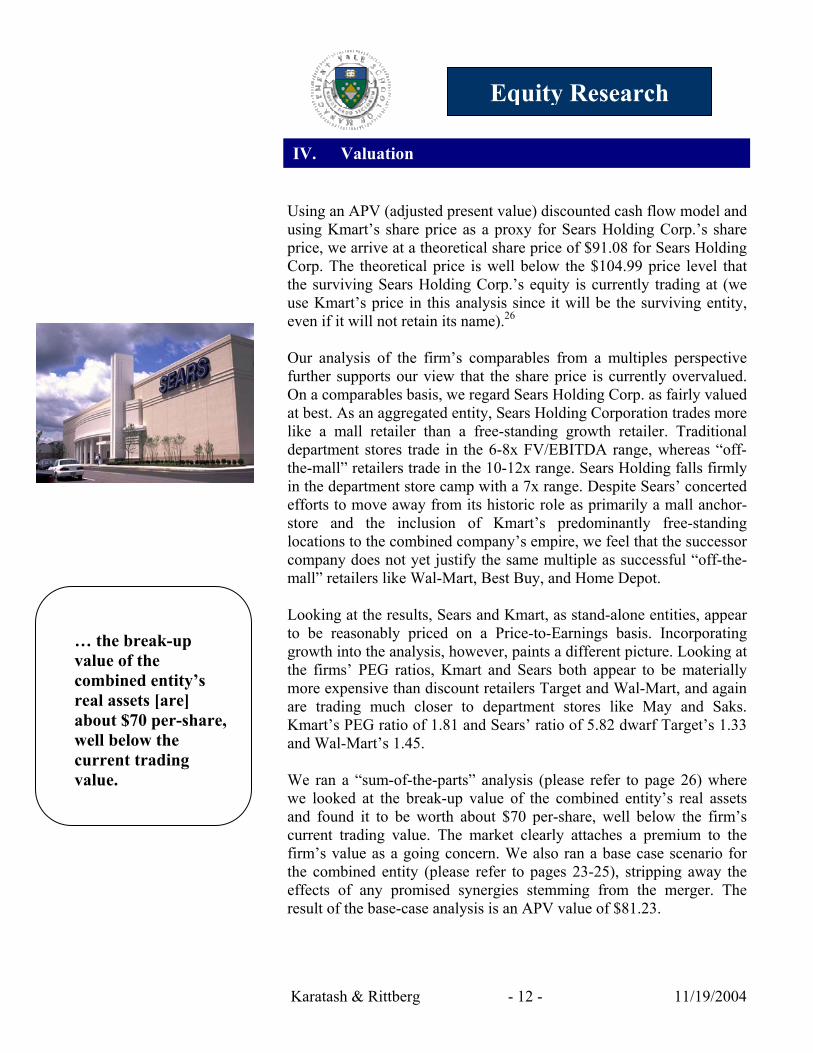
Using an APV (adjusted present value) discounted cash flow model and using Kmart’s share price as a proxy for Sears Holding Corp.’s share price, we arrive at a theoretical share price of $91.08 for Sears Holding Corp. The theoretical price is well below the $104.99 price level that the surviving Sears Holding Corp.’s equity is currently trading at (we use Kmart’s price in this analysis since it will be the surviving entity, even if it will not retain its name).26 Our analysis of the firm’s comparables from a multiples perspective further supports our view that the share price is currently overvalued. On a comparables basis, we regard Sears Holding Corp. as fairly valued at best. As an aggregated entity, Sears Holding Corporation trades more like a mall retailer than a free-standing growth retailer. Traditional department stores trade in the 6-8x FV/EBITDA range, whereas “off-the-mall” retailers trade in the 10-12x range. Sears Holding falls firmly in the department store camp with a 7x range. Despite Sears’ concerted efforts to move away from its historic role as primarily a mall anchor-store and the inclusion of Kmart’s predominantly free-standing locations to the combined company’s empire, we feel that the successor company does not yet justify the same multiple as successful “off-the-mall” retailers like Wal-Mart, Best Buy, and Home Depot. Looking at the results, Sears and Kmart, as stand-alone entities, appear to be reasonably priced on a Price-to-Earnings basis. Incorporating growth into the analysis, however, paints a different picture. Looking at the firms’ PEG ratios, Kmart and Sears both appear to be materially more expensive than discount retailers Target and Wal-Mart, and again are trading much closer to department stores like May and Saks. Kmart’s PEG ratio of 1.81 and Sears’ ratio of 5.82 dwarf Target’s 1.33 and Wal-Mart’s 1.45. We ran a “sum-of-the-parts” analysis (please refer to page 26) where we looked at the break-up value of the combined entity’s real assets and found it to be worth about $70 per-share, well below the firm’s current trading value. The market clearly attaches a premium to the firm’s value as a going concern. We also ran a base case scenario for the combined entity (please refer to pages 23-25), stripping away the effects of any promised synergies stemming from the merger. The result of the base-case analysis is an APV value of $81.23.
IV. Valuation
… the break-up value of the combined entity’s real assets [are] about $70 per-share, well below the current trading value.

Karatash & Rittberg - 13 - 11/19/2004
Equity Research
On a technical basis, our total APV valuation of $91.08 falls into line with our technical analysis of the firm’s share price. There appears to be an upper resistance level in the mid-to-high 90’s and we doubt that the company will stay above it for long, although it has been trading well above that level with the frenzied merger rally. Once the euphoria fizzles out, we see Sears Holding Corp.’s share price (represented by Kmart’s share price) settling back down into the low 90’s range. We are underweight Sears Holding Corp. at current trading levels and would switch to an overweight position only if the share price dips below $88/share, which is unlikely in the near term given that there appears to be a lower resistance band at the $90 level. Comparables:
Successor Company FV/EBITDA
Sears, Roebuck, & Co. 7x LTM
Traditional Department Stores FV/EBITDA
Dillard's 5.9 Federated 5.9 J.C. Penney 8.4 May 7.7 Nordstrom 7.3 Saks Inc. 6.8
"On-the-mall Average" 7.0 Range 6-8x
Off-the-Mall Retailers FV/EBITDA
Best Buy 9.6 Costco 12.1 Home Depot 10.9 Lowe's 10.7 Target 11.2 Wal-Mart 12.7
"Off-the-mall Average" 10.7 Range 10-12x
Source: JP Morgan Securities ("K-Mart and Sears to Merge - Additional Thoughts," 11/17/2004).
Department Store v. Off-Mall Analysis
We would switch to an overweight position only if the share price dips below $88/share …

Karatash & Rittberg - 14 - 11/19/2004
Equity Research
We prepared a more comprehensive comparable analysis, evaluating earnings multiples for a pool of the same retailers as the department store vs. off-mall analysis.
Because of ESL’s proclivity for using leverage to maximize investments, we expect that with Eddie Lampert at the helm, Sears Holding Corp. will make more frequent use of debt to finance the turnaround effort, which will become even more capital intensive now that Lampert must repair two wounded retailers with assets from the same balance sheet. Consequently, we used APV as our primary methodology for deriving a fundamental valuation. Applying an APV calculation to our pro forma financials for the combined companies provides us with a theoretical value of $91.08.
KMRT S TGT WMT FD DDS MAY SKS IndustryMarket Cap: 9.31B 11.02B 46.94B 234.91B 9.81B 2.19B 8.61B 1.92B 3.27BEmploy-ees: 158,000 249,000 328,000 1,500,000 111,000 53,598 58,000 29,640 25.91KRev. Growth (ttm): N/A -0.60% 9.70% 4.90% -1.10% -4.50% -1.10% 2.40% 4.90%Revenue (ttm): 20.12B 37.12B 47.22B 280.36B 15.61B 7.77B 13.90B 6.34B 6.34BGross Margin (ttm): 25.40% 29.47% 31.69% 22.77% 40.57% 32.93% 30.12% 38.27% 34.38%EBITDA (ttm): 1.93B 1.42B 4.95B 20.74B 2.10B 538.03M 1.93B 185.08M 439.04MOper. Margins (ttm): 9.30% 0.23% 6.56% 5.90% 8.93% 1.23% 6.96% 2.92% 1.97%Net Income (ttm): 1.08B 2.72B 1.93B 9.82B 708.00M 60.21M 599.00M 50.08M 180.90MEPS (ttm): 10.738 10.704 2.104 2.291 3.875 0.712 1.978 0.335 1.92PE (ttm): 9.73 4.98 24.7 24.17 14.66 36.59 14.93 41.13 20.56PEG (ttm): 1.81 5.82 1.33 1.45 1.32 5.5 1.81 2.15 1.32PS (ttm): 0.46 0.3 0.99 0.84 0.63 0.28 0.62 0.29 0.52
S = Sears, Roebuck and Co DDS = Dillard's IncTGT = Target Corp MAY = May Department Stores CoWMT = Wal-Mart Stores Inc SKS = Saks Inc
Industry = Retail (Department & Discount)
Source: Y! Finance
Comps Analysis

Karatash & Rittberg - 15 - 11/19/2004
Equity Research
Valuation Date:Trading Price (closing): 52.95
Cost of Equity Calculation:Equity Risk Premium = 7% per Ibbotson Associates SBBIRisk-free rate = 4.115% (10-year Bond [UST4.25 11/15/14] at close 11/18/04)Beta = 1.48% (Sear's Adjusted Beta per Bloomberg)Equity Discount Rate R(e) = [Beta * RP] + R(f)]R(e) = 14.5%
Cost of Debt:Cost of Debt K(d) = 7.168% (6.668 = yield on S6.25 05/01/09 on 11/18/04 + 1.5% penalty for K-Mart credit)K(d) = 7.17%
Terminal Value Calculation:Terminal Value = Final Cash Flow / (rate equity - growth)TV = CF Yr 2010/ (R(e) - g)TV = $2518/ (14.5% - 2%)TV = 20,184$
Cash Flows 2004 2005 2006 2007 2008 2009 TV
EBIT 2,041 1,525 1,177 1,176 1,165 1,147 - Taxes (100% Equity Scenario) 612 458 353 353 350 344 + Depreciation 935 976 1,018 1,063 1,109 1,158 - Delta Working Cap Required 58 (11) 28 67 105 142 - CapEx 17 39 40 40 40 41 All Equity Cash Flows 2,289 2,015 1,775 1,779 1,780 1,777 20,184 Discount Factor (r = 14.5%) 1.00 0.87 0.76 0.67 0.58 0.51 0.51 Discounted Value 2,289 1,760 1,354 1,186 1,036 904 10,267
Total Discounted Value = 18,797.12$ Share Oustanding (mm) = 213 Theoretic Value Equity Cash Flows = 88.25$
Tax Shield:Cash Flow from Tax Shield
Tax Rate 30.0% 30.0% 30.0% 35.0% 35.0% 35.0%D 4,446 4,686 4,940 5,207 5,490 5,787 Kd * 7.17% 7.20% 7.24% 7.28% 7.31% 7.35%
CF(tax shield) 96 101 107 133 140 149 Discount Factor (r = 5.67%) 1.00 0.93 0.87 0.81 0.76 0.71 Discounted Value 96 95 93 108 107 105
Total Discounted Value = 603.09$ Share Oustanding (mm) = 213 Theoretic Value Equity Cash Flows = 2.83$
Total Theoretical Value = 91.08$
* We increase Kd in future periods to enumerate the impact that increasing the firm's leverage will have on the firm's perceived credit quality and hence on its cost of debt financing.* The average maturity of S bonds is 2009 and this is company's second largest bond issue.
Adjusted Present Value Calculations
11/19/2004

Karatash & Rittberg - 16 - 11/19/2004
Equity Research
Financial Projections: In preparing the pro forma financial statements which underlie this APV valuation, we separately analyzed Kmart and Sears and disparate going entities because, in the immediate future at least, Sears and Kmart remain very distinct operating agents. We believe that the most effective approach to valuing the combined company at the moment is to continue to approach the two divisions separately in terms of forecasting. Accordingly, we prepared pro forma forecasts for each retailer individually and then incorporated our beliefs for synergies that appear attainable from the merger when aggregating our results. Underlying this comprehensive approach are our projections for the growth prospects of each company as stand-alone entities and the trajectories of Kmart and Sears. Here we highlight some key items: Income Statement Items:
• For each company, we separately decomposed top-line revenue growth into: (1) geographic expansion (new stores); and (2) same store sales (SSS) growth (increased sales volume at existing stores).
o Sears’ new store growth is expected to remain slow in the short term. The company has issued guidance for flat same store sales for the rest of the year and we find this concerning. Until the company has demonstrated success toward transforming itself, we feel that it will continue to have difficulty boosting SSS and have used a low 1.5% growth rate in our forward-looking analysis.
o We have the Sears’ new store growth moving at a slightly faster 2.25% because of the company’s recent efforts toward (and stated desire to continue) expanding into new free standing locations through building or acquisition.
o Kmart has been shedding less profitable stores (including the sale of several to Sears last year); we have built into our analysis the expectation that they will continue this process, transferring stores to Sears’ centers while slightly improving SSS growth by about 0.5% annually to reflect the survival effect of paring out weaker stores.
o We are increasing the provision for un-collectibles as we believe that credit quality of the customer base will deteriorate as the spending power of the customer base
… we incorporated our beliefs for synergies that appear attainable from the merger when aggregating our results.

Karatash & Rittberg - 17 - 11/19/2004
Equity Research
declines (per the analysis in our industry report, coupled with the possibility that Sears attempts to expand its financing unit to include Kmart customers).
• Sears’ gross margins, which we calculate as a percentage of
sales, have been improving as the company has done a good job improving its cost structure in recent years. We feel that both entities’ margins will continue to improve slightly as the combined company enjoys lower COGS from increased buyer power associated with its new scale and through the realization of further operating efficiencies with Kmart’s national distribution network. We project a 0.2% discount year-on-year in COGS over the 2005-2007 time period. Additionally, we project a 0.5% discount in SAG expenses over the same period.
Balance Sheet Items:
• We established a minimum portion of liquid assets to be retained as cash for operations. Excess cash flows are also retained in the company’s cash balance, commensurate with its recent affinity for building up its cash coffers and a historical precedent of limited use of non-operating investments.
• We view inventories as an important de facto element of fixed
assets for retailers and feel that inventory levels will be especially important for Kmart; we are treating Kmart’s inventory as a fixed asset.
• We have forecasted for the successor company to increase its
use of debt financing as it attempts to construct a rather epic turnaround effort. Because of ESL’s proclivity for using leverage to maximize investments, we expect Sears Holding Corp. will make more frequent use of debt to finance the turnaround endeavor, which will become even more capital intensive now that Lampert must repair two wounded retailers with the same balance sheet. We have increased conventional debt and capital leases by 5% annually until 2009. We have also gradually adjusted the company’s cost of debt (Kd) upward throughout the analysis to account for the increased return that fixed income investors will require as the company ramps up its leverage.
• We increase accounts payable to again enumerate our belief that
the combined entity will enjoy greater buyer power and enjoy
We have forecasted for the successor company to increase its use of debt financing as it attempts to construct a rather epic turnaround effort.

Karatash & Rittberg - 18 - 11/19/2004
Equity Research
some of the better financing terms for inventory currently being negotiated by Wal-Mart and Target.
• We base our CapEx requirements on an expected growth in
square footage and base our forecast of the company’s cost per square foot of new store space on recent transaction prices scaled upward to account for the company’s shift toward opening free-standing stores where they will have to pay for certain amenities which are normally shared in mall space.
Base Case Scenario: In order to compare our merger-based APV valuation with a non-merger based APV benchmark, we prepared a base case scenario for the combined entity (please refer to pages 23-25), stripping each operating company’s income statement of any positive effects stemming from the merger. The result of the base-case analysis is an APV value of $81.23, roughly $10 below our theoretic price of $91.08 which includes all of the synergies we expect the company to realize following the merger. The $81.23 base case scenario value represents where the merged company would trade should the planned synergies associated with the merger somehow not materialize.
The $81.23 base case scenario value represents where the merged company would trade should the planned synergies…somehow not materialize.

Karatash & Rittberg - 19 - 11/19/2004
Equity Research
$ millions
REVENUES:K-Mart Contribution to Revenues $ 21,515 $ 21,623 $ 21,731 $ 21,839 $ 21,949 $ 22,058 Sears Contribution to Revenues 42,527 43,982 45,490 47,052 48,672 50,349 Total Revenues 64,042 65,604 67,220 68,892 70,620 72,407
COSTS AND EXPENSES:K-Mart Cost of Goods Sold 16,708 16,935 16,969 17,002 17,036 17,070 Sears Cost of Goods Sold 27,392 28,715 30,100 31,161 32,258 33,391 Total Cost of sales 44,100 45,650 47,069 48,163 49,294 50,461
GROSS PROFIT:K-Mart Gross Profit 4,807 4,688 4,762 4,837 4,913 4,989 Sears Gross Profit 15,135 15,267 15,389 15,891 16,414 16,957 Total Gross Profit 19,942 19,955 20,151 20,728 21,326 21,946
OPERATING EXPENSES:K-Mart Selling and Administrative, Depreciation, & Other Operating Expenses 4,386 4,396 4,399 4,402 4,406 4,412 Sears Selling and Administrative, Depreciation, & Other Operating Expenses 13,478 14,005 14,556 15,134 15,740 16,374 Total Operating Expenses 17,863 18,401 18,956 19,536 20,146 20,786
OPERATING INCOME:K-Mart Contribution to Operating Income 421 292 363 436 506 577 Sears Contribution to Operating Income 1,657 1,262 833 757 674 583 Total Cost of sales 2,078 1,554 1,196 1,193 1,180 1,160
Other Income 37 28 19 17 15 13 EBIT 2,041 1,525 1,177 1,176 1,165 1,147
Interest Expense 1,110 1,203 1,304 1,413 1,532 1,661 Income Before Taxes 931 322 (127) (238) (367) (515)
Provision for Income Taxes 279 97 (38) (83) (129) (180) Minority interest 14 11 7 6 6 5 NET INCOME $ 637 $ 215 $ (96) $ (161) $ (244) $ (339)
Pro Forma Income Statement: Successor Company
20092004 2005 2006 2007 2008

Karatash & Rittberg - 20 - 11/19/2004
Equity Research
1st 13 weeks of 2nd 39 weeks of $ millions
Sales $ 29,352 $ 6,181 $ 17,072 $ 21,515 $ 21,623 $ 21,731 $ 21,839 $ 21,949 $ 22,058 Cost of Sales, Buying, & Occupancy 24,842 4,762 13,084 16,708 16,935 16,969 17,002 17,036 17,070 Gross Margin 4,510 1,419 3,988 4,807 4,688 4,762 4,837 4,913 4,989
Selling, General, and Administrative Expenses 6,242 1,421 3,577 4,494 4,503 4,512 4,521 4,530 4,541 Restructuring, Impairment, and Other Charges 574 37 - - - - - - - Net (Gains)/Losses on Sale of Assets 5 - (89) (93) (98) (103) (108) (114) (119) Equity Income in Unconsolidated Subsidiaries (34) (7) (5) (15) (9) (10) (11) (10) (10) Income (Loss) before Interest, Reorganization Items, Taxes, and Discontinued Ops . (2,277) (32) 505 421 292 363 436 506 577
Interest Expense, Net 155 57 105 101 103 104 106 107 109 Reorganization Items, Net 363 769 - - - - - - - Income (Loss) before Income Taxes Discontinued Operations (2,795) (858) 400 320 189 258 330 399 468
Provision for (Benefit from) Income Taxes (24) (6) 152 122 72 98 125 152 178 Dividends on Convertible Preferred Securities of Subsidiary Trust - - - - - - - - - Income (Loss) before Discontinued (2,771) (852) 248 198 117 160 204 247 290
Discontinued Operations (Net of Income Taxes) (448) (10) - - - - - - - Net Income (Loss) (3,219) (862) 248 198 117 160 204 247 290
Pro Forma Income Statement: K-Mart Division
20092002 2003 2003 2004 2005 2006 2007 2008
$ millions
REVENUESMerchandise sales and services $ 35,755 $ 35,698 $ 36,372 $ 37,751 $ 39,182 $ 40,666 $ 42,205 $ 43,800 $ 45,452 Credit and financial products revenues 5,235 5,668 4,752 4,776 4,800 4,824 4,848 4,872 4,896 Total revenues 40,990 41,366 41,124 42,527 43,982 45,490 47,052 48,672 50,349
COSTS AND EXPENSESCost of sales, buying and occupancy 26,234 25,646 26,231 27,392 28,715 30,100 31,161 32,258 33,391 Selling and administrative 8,892 9,249 9,111 9,473 9,761 10,057 10,364 10,680 11,006 Provision for uncollectible accounts 1,866 2,261 1,747 1,844 1,945 2,053 2,166 2,286 2,412 Depreciation and amortization 863 875 909 935 976 1,018 1,063 1,109 1,158 Interest, net 1,415 1,143 1,025 1,110 1,203 1,304 1,413 1,532 1,661 Loss on early retirement of debt, net - - 791 - - - - - - Special charges and impairments 542 111 112 116 120 124 128 133 137 Total costs and expenses 39,812 39,285 39,926 40,870 42,719 44,657 46,295 47,997 49,765 Operating income 1,178 2,081 1,198 1,657 1,262 833 757 674 583 Gain on sale of businesses - - 4,224 - - - - - - Other income, net 45 372 27 37 28 19 17 15 13
Income before income taxes, minority interest and cumulative effect of change in accounting principle 1,223 2,453 5,449 1,694 1,291 852 774 689 596 Income taxes 467 858 2,007 624 475 314 285 254 220 Minority interest 21 11 45 14 11 7 6 6 5 Income before cumulative effect of change in accounting principle 735 1,584 3,397 1,056 805 531 483 430 372 Cumulative effect of change in accounting for goodwill - (208) - - - - - - - NET INCOME $ 735 $ 1,376 $ 3,397 $ 1,056 $ 805 $ 531 $ 483 $ 430 $ 372
Pro Forma Income Statement: Sears Division
20092005 2006 2007 20082001 2002 2003 2004

Karatash & Rittberg - 21 - 11/19/2004
Equity Research
$ millions
ASSETSCurrent Assets:Cash and Cash Equivalents 613 1,232 2,088 1,554 1,711 1,913 2,160 2,452 2,789 Merchandise Inventories 4,825 4,431 3,238 3,844 3,859 3,873 3,887 3,901 3,914 Accounts Receivable 473 382 301 279 281 283 286 288 290 Other Current Assets 191 509 182 168 169 170 171 172 173
Total Current Assets 6,102 6,554 5,809 5,846 6,020 6,239 6,504 6,812 7,166
Property and Equipment, Net 4,892 10 153 142 142 143 144 144 145 Other Assets and Deferred Charges 244 96 120 111 112 112 113 113 114
Total Assets 11,238 6,660 6,082 6,099 6,274 6,494 6,760 7,070 7,425
LIABILITIES AND SHAREHOLDER'S EQUITY (DEFICIT)Current Liabilities:Mortgages Payable Due Within One Year - 8 4 5 6 7 8 10 12 Accounts Payable 1,248 1,160 820 774 793 813 834 855 876 Accrued Payroll and Other Liabilities 710 1,321 671 621 624 627 630 633 637 Taxes other Than Income Taxes 162 274 281 265 272 279 286 293 300
Total Current Liabilities 2,120 2,763 1,776 1,665 1,695 1,726 1,758 1,791 1,825
Long-term LiabilitiesLong-term Debt and Mortgages Payable - 108 103 95 96 96 97 97 98 Capital Lease Obligations 623 415 374 346 348 350 351 353 355 Pension Obligation - 854 873 895 917 940 964 988 1,012 Unfavorable Operating Leases - 344 342 316 318 320 321 323 324 Other Long-term Liabilities 181 463 424 392 394 396 398 400 402
Total Long-term Liabilities 804 2,184 2,116 2,045 2,073 2,102 2,131 2,161 2,192
Total Liabilities Not Subject to Compromise 2,924 4,947 3,892 3,710 3,768 3,828 3,889 3,952 4,016 Liabilities Subject to Compromise 7,969 - - - - - - - - Predecessor Company Obligated Convert Preferreds 646 - - - - - - - -
Shareholders' Equity (Deficit):Successor Company Preferred Stock - - - - - - - - - Predecessor Company Common Stock 519 - - - - - - - - Successor Company Common Stock - 1 1 - - - - - - Treasury Stock - - (1) - - - - - - Capital In Excess of Par Value 1,922 1,712 1,943 1,943 1,943 1,943 1,943 1,943 1,943 Retained Earnings (Accumulated Deficit) (1,835) - 248 446 563 724 928 1,175 1,466 Accumulated Other Comprehensive Income (Loss) (907) - 1 - - - - - -
Total Shareholders' Equity (Deficit) (301) 1,713 2,192 2,389 2,506 2,667 2,871 3,118 3,409
Total Liabilties and Shareholders' Equity 11,238 6,660 6,084 6,099 6,274 6,494 6,760 7,070 7,425
Pro Forma Balance Sheet: K-Mart Division
(end of)20092005 2006 20081/29/2003 (A) 4/30/2003 (A) 1/28/2004 (A) 2004 2007

Karatash & Rittberg - 22 - 11/19/2004
Equity Research
$ millionsASSETSCurrent assets Cash and cash equivalents $ 1,962 $ 9,057 $ 12,507 $ 13,683 $ 14,617 $ 15,286 $ 15,918 $ 16,508 Credit card receivables 32,563 1,998 2,126 2,199 2,274 2,353 2,434 2,517 Less allowance for uncollectible accounts 1,832 42 43 45 46 48 50 51 Net credit card receivables 30,731 1,956 2,083 2,154 2,228 2,305 2,384 2,466 Other receivables 891 733 767 802 838 876 916 958 Merchandise inventories, net 5,115 5,335 5,526 5,723 5,929 6,142 6,363 6,592 Prepaid expenses and deferred charges 535 407 421 435 450 466 482 498 Deferred income taxes 749 708 732 757 783 810 838 867 Total current assets 39,983 18,196 22,035 23,555 24,845 25,885 26,901 27,890
Property and equipment Land 442 392 396 400 404 408 412 416 Buildings and improvements 6,930 7,151 7,162 7,172 7,183 7,194 7,205 7,216 Furniture, fixtures and equipment 5,050 4,972 4,979 4,987 4,994 5,002 5,009 5,017 Capitalized leases 557 609 624 640 656 672 689 706 Gross property and equipment 12,979 13,124 13,161 13,199 13,237 13,276 13,315 13,355 Less accumulated depreciation 6,069 6,336 6,347 6,359 6,370 6,382 6,393 6,405 Total property and equipment, net 6,910 6,788 6,814 6,841 6,867 6,894 6,922 6,950
Deferred income taxes 734 378 399 422 445 470 496 523 Goodwill 944 943 929 915 901 888 874 861 Tradenames and other intangible assets 704 710 734 759 785 812 840 869 Other assets 1,134 708 732 757 783 810 838 867 TOTAL ASSETS $ 50,409 $ 27,723 $ 31,644 $ 33,249 $ 34,627 $ 35,759 $ 36,871 $ 37,960
LIABILITIESCurrent liabilities Short-term borrowings $ 4,525 $ 1,033 $ 1,068 $ 1,105 $ 1,143 $ 1,182 $ 1,223 $ 1,265 Current portion of long-term debt and capitalized lease obligations 4,808 2,950 3,051 3,155 3,263 3,375 3,491 3,612 Merchandise payables 2,945 3,106 3,223 3,344 3,470 3,601 3,737 3,878 Income taxes payable 787 1,867 1,931 1,997 2,065 2,136 2,210 2,286 Other liabilities 3,753 2,950 3,051 3,155 3,263 3,375 3,491 3,612 Unearned revenues 1,199 1,244 1,286 1,330 1,376 1,423 1,472 1,523 Other taxes 580 609 630 651 674 697 721 746 Total current liabilities 18,597 13,759 14,239 14,737 15,254 15,790 16,345 16,921
Long-term debt and capitalized lease obligations 21,304 4,218 4,446 4,686 4,940 5,207 5,490 5,787 Pension and postretirement benefits 2,491 1,956 2,054 2,156 2,264 2,378 2,496 2,621 Minority interest and other liabilities 1,264 1,389 1,417 1,445 1,474 1,503 1,534 1,564 Total Liabilities 43,656 21,322 22,156 23,025 23,932 24,878 25,865 26,893 COMMITMENTS AND CONTINGENT LIABILITIESSHAREHOLDERS' EQUITYCommon shares issued ($. 75 par value per share, 1,000 shares authorized, 230.4 and 316.7 shares outstanding, respectively) 323 323 323 323 323 323 323 323 Capital in excess of par value 3,505 3,519 3,519 3,519 3,519 3,519 3,519 3,519 Retained earnings 8,497 11,636 15,033 16,089 16,894 17,425 17,908 18,337 Treasury stock - at cost (4,474) (7,945) (8,216) (8,497) (8,788) (9,090) (9,403) (9,727) Deferred ESOP expense (42) (26) (27) (28) (29) (30) (31) (32) Accumulated other comprehensive loss (1,056) (1,106) (1,144) (1,183) (1,223) (1,265) (1,309) (1,354) Total Shareholders' Equity 6,753 6,401 9,488 10,223 10,695 10,881 11,007 11,066 TOTAL LIABILITIES AND SHAREHOLDERS' EQUITY $ 50,409 $ 27,723 $ 31,644 $ 33,249 $ 34,627 $ 35,759 $ 36,871 $ 37,960
Pro Forma Balance Sheet: Sears Division
2002 (A) 2003 (A) 2004 20062005 20092007 2008

Karatash & Rittberg - 23 - 11/19/2004
Equity Research
1st 13 weeks of 2nd 39 weeks of $ millions
Sales $ 29,352 $ 6,181 $ 17,072 $ 21,515 $ 21,623 $ 21,731 $ 21,839 $ 21,949 $ 22,058 Cost of Sales, Buying, & Occupancy 24,842 4,762 13,084 16,708 17,495 17,670 17,847 17,883 17,918 Gross Margin 4,510 1,419 3,988 4,807 4,128 4,061 3,992 4,066 4,140
Selling, General, and Administrative Expenses 6,242 1,421 3,577 4,494 4,503 4,512 4,521 4,530 4,541 Restructuring, Impairment, and Other Charges 574 37 - - - - - - - Net (Gains)/Losses on Sale of Assets 5 - (89) (93) (98) (103) (108) (114) (119) Equity Income in Unconsolidated Subsidiaries (34) (7) (5) (15) (9) (10) (11) (10) (10) Income (Loss) before Interest, Reorganization Items, Taxes, and Discontinued Ops . (2,277) (32) 505 421 (268) (339) (409) (340) (272)
Interest Expense, Net 155 57 105 101 103 104 106 107 109 Reorganization Items, Net 363 769 - - - - - - - Income (Loss) before Income Taxes Discontinued Operations (2,795) (858) 400 320 (371) (443) (515) (448) (380)
Provision for (Benefit from) Income Taxes (24) (6) 152 122 (141) (168) (196) (170) (144) Dividends on Convertible Preferred Securities of Subsidiary Trust - - - - - - - - - Income (Loss) before Discontinued (2,771) (852) 248 198 (230) (275) (319) (278) (236)
Discontinued Operations (Net of Income Taxes) (448) (10) - - - - - - - Net Income (Loss) (3,219) (862) 248 198 (230) (275) (319) (278) (236)
Pro Forma Income Statement: K-Mart Division (Stand Alone Basis)
20092002 2003 2003 2004 2005 2006 2007 2008
$ millions
REVENUESMerchandise sales and services $ 35,755 $ 35,698 $ 36,372 $ 37,373 $ 38,412 $ 39,471 $ 40,569 $ 41,689 $ 42,849 Credit and financial products revenues 5,235 5,668 4,752 4,776 4,800 4,824 4,848 4,872 4,896 Total revenues 40,990 41,366 41,124 42,149 43,212 44,294 45,417 46,561 47,746
COSTS AND EXPENSESCost of sales, buying and occupancy 26,234 25,646 26,231 27,145 28,206 29,303 30,449 31,634 32,872 Selling and administrative 8,892 9,249 9,111 9,424 9,662 9,904 10,155 10,410 10,675 Provision for uncollectible accounts 1,866 2,261 1,747 1,844 1,945 2,053 2,166 2,286 2,412 Depreciation and amortization 863 875 909 935 976 1,018 1,063 1,109 1,158 Interest, net 1,415 1,143 1,025 1,110 1,203 1,304 1,413 1,532 1,661 Loss on early retirement of debt, net - - 791 - - - - - - Special charges and impairments 542 111 112 115 118 121 124 127 130 Total costs and expenses 39,812 39,285 39,926 40,572 42,110 43,702 45,370 47,098 48,909 Operating income 1,178 2,081 1,198 1,576 1,102 592 47 (538) (1,163) Gain on sale of businesses - - 4,224 - - - - - - Other income, net 45 372 27 36 25 13 1 (12) (26)
Income before income taxes, minority interest and cumulative effect of change in accounting principle 1,223 2,453 5,449 1,612 1,127 606 48 (550) (1,189) Income taxes 467 858 2,007 594 415 223 18 (202) (438) Minority interest 21 11 45 13 9 5 0 (5) (10) Income before cumulative effect of change in accounting principle 735 1,584 3,397 1,005 702 378 30 (343) (741) Cumulative effect of change in accounting for goodwill - (208) - - - - - - - NET INCOME $ 735 $ 1,376 $ 3,397 $ 1,005 $ 702 $ 378 $ 30 $ (343) $ (741)
Pro Forma Income Statement: Sears Division (Stand Alone Basis)
20092005 2006 2007 20082001 2002 2003 2004

Karatash & Rittberg - 24 - 11/19/2004
Equity Research
$ millions
REVENUES:K-Mart Contribution to Revenues $ 21,515 $ 21,623 $ 21,731 $ 21,839 $ 21,949 $ 22,058 Sears Contribution to Revenues 42,149 43,212 44,294 45,417 46,561 47,746 Total Revenues 63,664 64,834 66,025 67,256 68,509 69,804
COSTS AND EXPENSES:K-Mart Cost of Goods Sold 16,708 17,495 17,670 17,847 17,883 17,918 Sears Cost of Goods Sold 27,145 28,206 29,303 30,449 31,634 32,872 Total Cost of sales 43,853 45,701 46,973 48,296 49,516 50,790
GROSS PROFIT:K-Mart Gross Profit 4,807 4,128 4,061 3,992 4,066 4,140 Sears Gross Profit 15,004 15,005 14,992 14,968 14,927 14,874 Total Gross Profit 19,811 19,133 19,053 18,960 18,993 19,014
OPERATING EXPENSES:K-Mart Selling and Administrative, Depreciation, & Other Operating Expenses 4,386 4,396 4,399 4,402 4,406 4,412 Sears Selling and Administrative, Depreciation, & Other Operating Expenses 13,428 13,904 14,399 14,921 15,465 16,037 Total Operating Expenses 17,813 18,300 18,799 19,322 19,871 20,449
OPERATING INCOME:K-Mart Contribution to Operating Income 421 (268) (339) (409) (340) (272) Sears Contribution to Operating Income 1,576 1,102 592 47 (538) (1,163) Total Cost of sales 1,998 834 254 (363) (878) (1,435)
Other Income 36 25 13 1 (12) (26) EBIT 1,962 809 240 (364) (866) (1,408)
Interest Expense 1,110 1,203 1,304 1,413 1,532 1,661 Income Before Taxes 852 (394) (1,064) (1,777) (2,398) (3,070)
Provision for Income Taxes 256 (118) (319) (622) (839) (1,074) Minority interest 13 9 5 0 (5) (10) NET INCOME $ 583 $ (285) $ (750) $ (1,155) $ (1,554) $ (1,986)
Pro Forma Income Statement: Successor Company under Base Case Scenario
20092004 2005 2006 2007 2008

Karatash & Rittberg - 25 - 11/19/2004
Equity Research
Valuation Date:Trading Price (closing): 52.95
Cost of Equity Calculation:Equity Risk Premium = 7% per Ibbotson Associates SBBIRisk-free rate = 4.115% (10-year Bond [UST4.25 11/15/14] at close 11/18/04)Beta = 1.48% (Sear's Adjusted Beta per Bloomberg)Equity Discount Rate R(e) = [Beta * RP] + R(f)]R(e) = 14.5%
Cost of Debt:Cost of Debt K(d) = 7.168% (6.668 = yield on S6.25 05/01/09 on 11/18/04 + 1.5% penalty for K-Mart credit)K(d) = 7.17%
Terminal Value Calculation:Terminal Value = Final Cash Flow / (rate equity - growth)TV = CF Yr 2010/ (R(e) - g)TV = $2518/ (14.5% - 2%)TV = 20,184$
Cash Flows 2004 2005 2006 2007 2008 2009 TV
EBIT 1,962 809 240 (364) (866) (1,408) - Taxes (100% Equity Scenario) 589 243 72 (109) (260) (423) + Depreciation 935 976 1,018 1,063 1,109 1,158 - Delta Working Cap Required 100 (314) (360) (409) (368) (330) - CapEx 17 39 40 40 40 41 All Equity Cash Flows 2,192 1,817 1,507 1,177 831 461 20,184 Discount Factor (r = 14.5%) 1.00 0.87 0.76 0.67 0.58 0.51 0.51 Discounted Value 2,192 1,587 1,150 784 484 234 10,267
Total Discounted Value = 16,699.46$ Share Oustanding (mm) = 213 Theoretic Value Equity Cash Flows = 78.40$
Tax Shield:Cash Flow from Tax Shield
Tax Rate 30.0% 30.0% 30.0% 35.0% 35.0% 35.0%D 4,446 4,686 4,940 5,207 5,490 5,787 Kd * 7.17% 7.20% 7.24% 7.28% 7.31% 7.35%
CF(tax shield) 96 101 107 133 140 149 Discount Factor (r = 5.67%) 1.00 0.93 0.87 0.81 0.76 0.71 Discounted Value 96 95 93 108 107 105
Total Discounted Value = 603.09$ Share Oustanding (mm) = 213 Theoretic Value Equity Cash Flows = 2.83$
Total Theoretical Value = 81.23$
* We increase Kd in future periods to enumerate the impact that increasing the firm's leverage will have on the firm's perceived credit quality and hence on its cost of debt financing.* The average maturity of S bonds is 2009 and this is company's second largest bond issue.
APV Calculations based on Base Case Scenario
11/19/2004

Karatash & Rittberg - 26 - 11/19/2004
Equity Research
Sum-of-the-Parts Valuation: Much has been made of the “break-up” value of Kmart and Sears’ assets. Many research reports discussing the company point to the value of its real assets as a rationale for holding the company.27 We calculated the break-up value of the combined entity, assuming liquidation, at about $70 per-share. We see this analysis as providing a good baseline for valuation—if the trading price drops below $70, it makes sense for Eddie Lampert to break up the company. At the present, however, we do not see the company’s liquidation value exceeding its value as a going concern. The $70 value we derive through the sum-of-the-parts valuation lies below our $91.08 APV valuation (the firm’s value as a going concern) because the sum-of-the-parts method omits the combined firm’s cash flow going forward.
Real Estate Square Footage Price/Sq Ft Value Per Share92.7 48.60 4,505.22 19.55
Brands Sales (mm) Op Inc (approx.) Cap'ed Per Share kd 7.2%Land's End 2,000 192.00 1,808.76 7.85 ke 14.5%Kenmore 5,500 418.00 3,937.83 17.09 wd 52.8%Craftsman 4,100 352.60 3,321.72 14.42 we 47.2%
WACC 10.6%Cash Balance Per Share
9,057.00 39.31
Receivables (net) Balance Per Share2,689.00 11.67
Inventory Liquidation (15% of Inventory balance) Balance Per Share800.25 3.47
Sub-total (Disposable Assets) 113.37
Debt Balance Per Share19,366.00 84.05
Pension Liability Balance Per Share1,956.00 8.49
Sub-total (Transferable Assets) - Sears 20.82
Owned Real Estate Assets Low Average HighValue of Owned Stores 997,500 1,282,500 1,648,929 Less Mortgages 47,000 47,000 47,000 Less Taxes 95,050 123,550 160,193 Less Closing Costs 33,750 33,750 33,750 Total Value 821,700 1,078,200 1,407,986 Per Share Gain 8.25 10.83 14.14
Source: UBS Coverage ("Initiated with a Buy-2 Rating," April 7, 2004)
Subleased Asset Values Low Average HighLease Value 914,915 1,045,635 1,176,355 Expense Today 694,200 694,200 694,200 Unlocked Lease Value Per Year 220,715 351,435 482,155 11-year Value 1,502,008 3,281,157 2,391,585 Per Share Gain 15.08 32.94 24.01
Source: UBS Coverage ("Initiated with a Buy-2 Rating," April 7, 2004)
Deferred Tax AssetsPV of NOL 1,068,800 Value per Share 10.73
Source: UBS Coverage ("Initiated with a Buy-2 Rating," April 7, 2004)
Sub-total (Transferable Assets) - K-Mart 48.88
Total Value of Transferable Assets for Combined Company 69.70
Disc. Rate
Break-Up/Sum-of-Parts Valuation
Sears' Assets:
K-mart's Assets:
The $70 value we derive through the sum-of-the-parts valuation lies below our $91.08 APV valuation (the firm’s value as a going concern) …

Karatash & Rittberg - 27 - 11/19/2004
Equity Research
Important Disclaimer Please read this document before reading this report. This report has been written by MBA students at Yale's School of Management in partial fulfillment of their course requirements. The report is a student and not a professional report. It is intended solely to serve as an example of student work at Yale’s School of Management. It is not intended as investment advice. It is based on publicly available information and may not be complete analyses of all relevant data. If you use this report for any purpose, you do so at your own risk. YALE UNIVERSITY, YALE SCHOOL OF MANAGEMENT, AND YALE UNIVERSITY’S OFFICERS, FELLOWS, FACULTY, STAFF, AND STUDENTS MAKE NO REPRESENTATIONS OR WARRANTIES, EXPRESS OR IMPLIED, ABOUT THE ACCURACY OR SUITABILITY FOR ANY USE OF THESE REPORTS, AND EXPRESSLY DISCLAIM RESPONSIBILITY FOR ANY LOSS OR DAMAGE, DIRECT OR INDIRECT, CAUSED BY USE OF OR RELIANCE ON THESE REPORTS. 1 Beck, Rachel. “Will Kmart-Sears Live Up To Promises?” AP, November 19, 2004. 2 Conversation with Marty Whitman of Third Avenue Management on November 12, 2004, in Third Avenue’s offices in New York City. Meeting was attended by Abdullah Karatash and Len Rittberg. 3Balter, Gary, Nagel, Brian, and Chris Smith. “Kmart: Initiated With Buy 2 Rating.” UBS, April 7, 2004. 4 Marty Whitman of Third Avenue Management mentioned Carrefour as a potential play. 5 Wiggins, Jenny. “Analysts skeptical of group’s chances.” Financial Times, November 19, 2004. 6 One of the most recent proclamations of this sentiment is the November 22, 2004, issue of BusinessWeek where a picture of Eddie Lampert adorns the front cover, entitled “The Next Warren Buffett?” 7 Bloomberg. 8 Marty Whitman of Third Avenue Management. 9 Bloomberg. 10 Marty Whitman of Third Avenue Management. 11 Bloomberg. 12 Beck, Rachel. “Will Kmart-Sears Live Up To Promises?” AP, November 19, 2004. 13 Beck, Rachel. “Will Kmart-Sears Live Up To Promises?” AP, November 19, 2004. 14 Bloomberg. 15 Balter, Gary, and Chris Smith. “Kmart Hired Aylwin Lewis As CEO.” UBS, October 18, 2004.

Karatash & Rittberg - 28 - 11/19/2004
Equity Research
16 Marty Whitman of Third Avenue Management. 17 Melich, Gregory, Lopez, Armando, and Kristina Westura. “Sears Roebuck: Trying to Find The Trough.” Morgan Stanley, October 21, 2004. 18 Bloomberg. 19 Beck, Rachel. “Will Kmart-Sears Live Up To Promises?” AP, November 19, 2004. 20 Foster, Lauren, and James Politi. “Sears Takes to the Streets in Retail Fight.” Financial Times, November 19, 2004. 21 Foster, Lauren, and James Politi. “Sears Takes to the Streets in Retail Fight.” Financial Times, November 19, 2004. 22 Foster, Lauren, and James Politi. “Corporate Cultures Will Have To Be Merged.” Financial Times, November 18, 2004. 23 Hays, Constance. “What Wal-Mart Knows About Customers’ Habits.” New York Times, November 14, 2004. 24 Marty Whitman of Third Avenue Management mentioned Toys ‘R Us as a potential play. 25 Marty Whitman of Third Avenue Management. 26 We want to clarify that we decided to use Kmart’s share price as a proxy for Sears Holding Corp.’s share price and as the benchmark for our valuation. This decision is driven by the fact that Kmart is the entity that is taking over and that will remain the driver of the merged companies, even though the Kmart name will be dropped in favor of Sears Holding Corp. 27 Eberts, Shari, Archille, Lionel, and Nancy Hoch. “Sears Roebuck & Co.: Stuck Between a Rock and a Hard Place.” JP Morgan, August 4, 2004. Balter, Gary, Nagel, Brian, and Chris Smith. “Kmart: Initiated With Buy 2 Rating.” UBS, April 7, 2004.