Equity Report on Linde Bangladesh Limited.pdf
8
Equity Note on Linde Bangladesh Limited (LINDEBD) Date: December 09, 2021 Current Price (BDT): 1,529.40 Resistance: 1,515.83 Support: 1410.03 MFI: 79.11 RSI: 71.08 1 EBL Securities Limited Research *Excluding lease liability Company Overview: Linde Bangladesh Ltd. is engaged in producing and supplying different types of industrial and medical gases, welding products and equipment and ancillary equipment. Company Profile: Incorporation: 1973 Commercial Operation: 1976 Key Personnel: Ayub Quadri (Chairman), Mr. Sujeet Kumar Pai (Managing Director). Number of Employees: 296 Plant Location: Tejgaon (Dhaka), Shitalpur (Chittagong), Rupgonj (Narayanganj). Business Profile: LINDEBD operates its business in three segments- bulk gases, packaged gas and products (PG&P) and healthcare. Growth in shipbuilding, steel and healthcare industries are some of the major drivers of growth in LINDEBD’s business. LINDEBD has developed bulk scheduling and delivery notification system to provide efficient and safe deliveries. LINDEBD provides its services to more than 35,000 customers. Merger of Linde AG and Praxair: Linde AG, Germany and Praxair Inc., USA was merged on 31 October, 2018. A new company named Linde plc has been incorporated in Ireland as a consequence of the merger between Linde AG and Praxair Inc. As such, Linde plc is now the new ultimate holding Company of Linde Bangladesh Limited. Revenue Composition: Revenue Segments 2019 2020 Amount (mn) % Amount (mn) % ASU gases (M 3 ) 1,157 20.4% 1,234 26.2% Dissolved acetylene (M. Ton) 99 1.7% 77 1.6% Electrodes (M 3 ) 3,768 66.3% 2,861 60.7% Others 660 11.6% 540 11.5% Total 5,683 100.0% 4,711 100.0% Capacity Utilization Matrix: ASU GASES (‘000 M 3 ): Particulars 2018 2019 2020 Capacity 43,100 35,018 35,018 Actual Production 20,542 25,269 23,505 Utilization % 47.7% 72.2% 67.1% Carbon Di Oxide (M. Ton): Particulars 2019 2020 Capacity 10,585 13,140 Actual Production 4,626 3,141 Utilization % 43.70% 23.90% Dissolved acetylene (‘000 M 3 ): Electrodes (M. Ton): Particulars 2018 2019 2020 Capacity 31 31 31 Actual Production 26 25 21 Utilization % 84.4% 81.2% 67.7% Company Information Market Cap (BDT mn) 22,399.8 Equity Market Weight 0.4% Paid-up Capital (BDT mn) 152.2 Authorized Capital (BDT mn) 200.0 No. of Share Outstanding (in mn) 15.2 Free-float Shares (Inst.+For.+Public) (in mn) 6.1 3 Months Avg. Turnover (BDT mn) 43.4 3 Months Return -10.0% 52-week price range (BDT) 1,213.0-1,749.0 Sector Forward P/E 12.2 Market Forward P/E 15.2 2018 2019 2020 2021(9m An”) Financial Information (BDT mn): Net Sales 5,460 5,683 4,711 5,004 Gross Profit 2,283 2,513 2,228 2,362 Operating Profit 1,407 1,676 1,450 1,574 Profit After Tax 1,004 1,231 1,074 1,206 Assets 6,849 7,652 8,004 8,337 Debt* - - - - Equity 4,472 5,108 5,413 5,709 Retained Earnings 4,304 4,985 5,298 5,594 Cash & Cash Eqiv. 1,604 1,005 1,145 2,592 Margin: Gross Profit 41.8% 44.2% 47.3% 47.2% Operating Profit 25.8% 29.5% 30.8% 31.5% Pretax Profit 25.0% 29.2% 30.7% 30.4% Net Profit 18.4% 21.7% 22.8% 24.1% Growth (YoY): Sales 10.5% 4.1% -17.1% 6.2% Gross Profit -1.1% 10.0% -11.3% 6.0% Operating Profit 3.7% 19.1% -13.5% 8.6% Net Profit 5.4% 22.7% -12.8% 12.3% Profitability: ROA 15.7% 17.0% 13.7% 14.8% ROE 24.6% 25.7% 20.4% 21.7% Leverage: Debt Ratio n/a n/a n/a n/a Debt-Equity n/a n/a n/a n/a Interest Coverage n/a n/a n/a n/a Valuation: EPS (BDT) 65.95 80.92 70.54 79.22 NAVPS (BDT) 293.9 335.7 355.7 375.2 P/E (x) 18.2 16.1 18.2 19.3 P/NAV (x) 4.1 3.9 3.6 4.1 Dividend (C/B) 375% /0% 500%/ 0% 400%/ 0% n/a Particulars 2018 2019 2020 Capacity 1,150 300 300 Actual Production 188 174 137 Utilization % 16.3% 58.0% 45.7%
-
Upload
khangminh22 -
Category
Documents
-
view
1 -
download
0
Transcript of Equity Report on Linde Bangladesh Limited.pdf

Equity Note on Linde Bangladesh Limited (LINDEBD) Date: December 09, 2021
Current Price (BDT): 1,529.40 Resistance: 1,515.83
Support: 1410.03
MFI: 79.11
RSI: 71.08
1
EBL Securities Limited Research
*Excluding lease liability
Company Overview: Linde Bangladesh Ltd. is engaged in producing and supplying different types of industrial and medical gases, welding products and equipment and ancillary equipment. Company Profile:
Incorporation: 1973
Commercial Operation: 1976
Key Personnel: Ayub Quadri (Chairman), Mr. Sujeet Kumar Pai (Managing Director).
Number of Employees: 296
Plant Location: Tejgaon (Dhaka), Shitalpur (Chittagong),
Rupgonj (Narayanganj).
Business Profile: LINDEBD operates its business in three segments- bulk gases, packaged gas and products (PG&P) and healthcare. Growth in shipbuilding, steel and healthcare industries are some of the major drivers of growth in LINDEBD’s business. LINDEBD has developed bulk scheduling and delivery notification system to provide efficient and safe deliveries. LINDEBD provides its services to more than 35,000 customers. Merger of Linde AG and Praxair: Linde AG, Germany and Praxair Inc., USA was merged on 31 October, 2018. A new company named Linde plc has been incorporated in Ireland as a consequence of the merger between Linde AG and Praxair Inc. As such, Linde plc is now the new ultimate holding Company of Linde Bangladesh Limited. Revenue Composition:
Revenue Segments
2019 2020
Amount (mn)
% Amount
(mn) %
ASU gases (M3)
(
1,157 20.4% 1,234 26.2%
Dissolved acetylene (M.
Ton)
99 1.7% 77 1.6%
Electrodes (M3) 3,768 66.3% 2,861 60.7%
Others 660 11.6% 540 11.5%
Total 5,683 100.0% 4,711 100.0%
Capacity Utilization Matrix: ASU GASES (‘000 M3): Particulars 2018 2019 2020
Capacity 43,100 35,018 35,018
Actual Production 20,542 25,269 23,505
Utilization % 47.7% 72.2% 67.1%
Carbon Di Oxide (M. Ton): Particulars 2019 2020
Capacity 10,585 13,140
Actual Production 4,626 3,141
Utilization % 43.70% 23.90%
Dissolved acetylene (‘000 M3):
Electrodes (M. Ton): Particulars 2018 2019 2020
Capacity 31 31 31
Actual Production 26 25 21
Utilization % 84.4% 81.2% 67.7%
Company Information
Market Cap (BDT mn) 22,399.8
Equity Market Weight 0.4%
Paid-up Capital (BDT mn) 152.2
Authorized Capital (BDT mn) 200.0
No. of Share Outstanding (in mn) 15.2
Free-float Shares (Inst.+For.+Public) (in mn) 6.1
3 Months Avg. Turnover (BDT mn) 43.4
3 Months Return -10.0%
52-week price range (BDT) 1,213.0-1,749.0
Sector Forward P/E 12.2
Market Forward P/E 15.2
2018 2019 2020 2021(9m An”)
Financial Information (BDT mn):
Net Sales 5,460 5,683 4,711 5,004
Gross Profit 2,283 2,513 2,228 2,362
Operating Profit 1,407 1,676 1,450 1,574
Profit After Tax 1,004 1,231 1,074 1,206
Assets 6,849 7,652 8,004 8,337
Debt* - - - -
Equity 4,472 5,108 5,413 5,709
Retained Earnings 4,304 4,985 5,298 5,594
Cash & Cash Eqiv. 1,604 1,005 1,145 2,592
Margin:
Gross Profit 41.8% 44.2% 47.3% 47.2%
Operating Profit 25.8% 29.5% 30.8% 31.5%
Pretax Profit 25.0% 29.2% 30.7% 30.4%
Net Profit 18.4% 21.7% 22.8% 24.1%
Growth (YoY):
Sales 10.5% 4.1% -17.1% 6.2%
Gross Profit -1.1% 10.0% -11.3% 6.0%
Operating Profit 3.7% 19.1% -13.5% 8.6%
Net Profit 5.4% 22.7% -12.8% 12.3%
Profitability:
ROA 15.7% 17.0% 13.7% 14.8%
ROE 24.6% 25.7% 20.4% 21.7%
Leverage:
Debt Ratio n/a n/a n/a n/a
Debt-Equity n/a n/a n/a n/a
Interest Coverage n/a n/a n/a n/a
Valuation:
EPS (BDT) 65.95 80.92 70.54 79.22
NAVPS (BDT) 293.9 335.7 355.7 375.2
P/E (x) 18.2 16.1 18.2 19.3
P/NAV (x) 4.1 3.9 3.6 4.1
Dividend (C/B) 375% /0%
500%/ 0%
400%/ 0%
n/a
Particulars 2018 2019 2020
Capacity 1,150 300 300
Actual Production 188 174 137
Utilization % 16.3% 58.0% 45.7%

Equity Note on Linde Bangladesh Limited (LINDEBD) Date: December 09, 2021
Current Price (BDT): 1,529.40 Resistance: 1,515.83
Support: 1410.03
MFI: 79.11
RSI: 71.08
2
EBL Securities Limited Research
Shareholding Structure:
Covid-19 impact on the business operation of LINDEBD
The demand for medical gases increased to 70-75 tons per day during 2020 and up to 100 tons per day in 2021 whereas the pre-pandemic demand for medical gases used to be 30-35 tons per day. To supply the increased demand, LINDEBD operated its Rupganj plant at full capacity while brought back the closed and mothballed (a production facility that is not used but kept in good action to make it readily usable) Shitalpur plant into operation. However, the total production of these plants failed to meet the required demand and LINDEBD opted to import medical gases from Linde India ltd. Due to breakdown and other problems, LINDEBD had to close down both Rupganj and Shitalpur plant in December, 2020. However, both of those plants were brought back to operation within January 2021. Hard good sales suffered particularly during the Covid-19 period as the overall economic activity declined. LINDEBD witnessed 24% decline in hard good sales in FY’20. As medical gases became the primary focus for LINDEBD during the pandemic period, they had to change the production ratio from 60 (medical gases): 40 (industrial gases) to 80 (medical gases): 20 (industrial gases). As a result, sales of industrial gases suffered as the revenue from Packaged Gas and Products (PG&P) declined by 24.20%.
Industry Overview Linde Bangladesh Ltd. supplies its products (liquefied gases, its solutions and equipment) to a number of industries like healthcare (Pharmaceuticals), Food and Beverage, Shipbuilding and ship recycling industry and construction etc. LINDEBD’s business is correlated with growth/de-growth in these industries.
About 257 licensed manufacturers of pharmaceutical products are operating in Bangladesh. Pharmaceutical industry’s CAGR for the last 5 years is 15.6%. Market size of pharmaceutical products of Bangladesh is BDT 205.12 bn. The market is expected to grow by 15% and reach a total size of $5.11 billion by 2023. Domestic players of this industry meet 98% of local demand and some specialized products are imported to meet the remaining 2% demand in the industry. About 1200 pharmaceutical products are being exported from Bangladesh and the major exporting destinations are India, Sri Lanka, Germany, USA, France, Italy, UK, Canada etc. Bangladesh has exported pharmaceutical products worth USD 135.79 mn in 2019-20 and USD 169.02 million in 2020-21. (Source: EPB).
There are more than 100 shipbuilding yards in Bangladesh which are mainly engaged in building and repairing inland and coastal vessels, up to 12,000 DWT (Dead Weight Tonnage). Bangladesh has a coastal line of 710 km, a sea boundary of 1,18,813 sq. km, 700 rivers and 24,000 km of waterway. At
present 10,000 inland and coastal ships and 36 foreign going ships are plying all over the country, which carry more than 90% of total oil product, 70% of cargo and 35% of passengers. Bangladesh first started its export of ship in 2008 and within these last eight years, Bangladesh has emerged as one of the top small scale shipbuilding nation. Bangladeshi ship builders meet country’s internal demand for ships worth BDT 40 billion per year. Around 10 companies are exporting ship currently among which Western Marine and Ananda Shipyards are the largest player.
In Bangladesh, urban population is showing positive growth over years which is stimulating the growth of construction sector and the real estate sector of Bangladesh. Urban population (%) of Bangaldesh has increased from 29.71% in 2009 to 38.18% in 2020. Real estate sectors contribution to the 2020-21 provisional GDP was 8.53%. Bangladesh Govt. has undertaken different large scale development projects in recent periods. Along with this, private sector investment is also growing which is boosting up the need for infrastructure and thus increasing the construction activities in Bangladesh. In 2020-21, contribution of construction sector in the provisional GDP was 9.56%. Contribution of construction sector in GDP over years is showing a positive trend. The growth in construction sector both from private and public investment is conducive for the steel industry of Bangladesh.
Investment Insight
Investment Positive As the economy has been recovering, LINDEBD’s sales
decline in the non-healthcare segments can also be expected to recover gradually and reach the pre-pandemic level. The sales in non-healthcare products of LINDEBD has declined by 23.04% in FY’20 which LINDEBD can expect to fully recover in the upcoming quarters.
LINDEBD has plans to build a debulking station Hub & Spok Model) near Benapole port which would act as a buffer for Oxygen and other gases. This investment would help LINDEBD to more reliable distribution channel. LINDEBD also has planned to revamp its Shitalpur plant which would help LINDEBD generate higher yield and achieve more efficiency. Within next three to four years, LINDEBD wants to build another ASU plant. Over the last five years, LINDEBD has shown its commitment to make large capital investments to increase its capacity, improve its efficiency and drive business growth. More investments in the future can be also expected to be successful in expanding its current business.
In 2019, LINDEBD has opened a 36 TPD new Carbon-dioxide plant. In 2017, the company had set up the 100 TPD Rupganj ASU plant. As a result of these plants, the production capacity of ASU gases has almost tripled from the existing production capacity. Revenue from ASU gas has also witnessed consistent growth rates over the first four years and contributed 26.2% to LINDEBD’s revenue in FY’20. ASU gases can expected to continue to drive growth in LINDEBD’s business going forward.
As a result of the new ASU plant, LINDEBD no longer requires to import liquid oxygen and nitrogen. LINDEBD has made further BDT 300 million investment in building 2*5 MW captive generator which has started functioning from mid-2020. Both of these investments have made a significant impact in LINDEBD margins as its gross profit
As on Sponsor/ Director
Institutions Foreign Public
Oct, 2021 60.00% 29.70% 0.60% 9.70%
Jun, 2021 60.00% 31.90% 0.00% 8.10%
Dec, 2020 60.00% 31.30% 0.00% 8.70%
Dec, 2019 60.00% 29.40% 0.00% 10.60%
Dec, 2018 60.00% 29.90% 0.00% 10.10%

Equity Note on Linde Bangladesh Limited (LINDEBD) Date: December 09, 2021
Current Price (BDT): 1,529.40 Resistance: 1,515.83
Support: 1410.03
MFI: 79.11
RSI: 71.08
3
EBL Securities Limited Research
and net profit margins has increased from 41.21% and 18.38% to 47.21% and 24.09% respectively.
The cost of wire (the primary raw material) had come down by 11.73% in FY’20 which also positively impacted LINDEBD’s margins.
LINDEBD Ltd. is a zero leverage company. There is no short term or long term debt in its capital structure. All capital investments have been incurred from company’s own resources. As a result, LINDEBD has no financial risk. LINDEBD has also increased its cash & cash equivalents holding by 126.37% as on September 30, 2021 from December 31, 2021 which indicates it has required cash holdings for making further investments and meeting working capital need.
The company offers handsome amount of cash dividend to its shareholders. LINDEBD has increased dividend percentage and payout ratio alongside increases in the EPS. LINDEBD’s dividend yield ratio ranged from 2.39% to 3.85% and dividend payout ratio ranged from 53.54% to 61.79% in the last 5 years period.
LINDEBD currently has negative Cash Conversion cycle which indicates efficient working capital management and as a result LINDEBD does not have any issue in financing its short term working capital need.
Investment Concern
LINDEBD’s sales was mostly driven by growth in medical sales during the first two quarters of FY’21. As the pandemic is slowing down, demand for medical gases has declined and LINDEBD has suffered 9.44% sales decline in Q3’21. LINDEBD is now required to pivot its business and
focus on industrial gases sales & hard goods to drive its business growth.
Covid-19 has negatively affected LINDEBD’s hard good business and its industrial sales. Sales and net profit of LINDEBD suffered 17.1% and 12.8% declined in FY’20 as a result.
The company is facing low demand for its dissolved acetylene gas (colorless gas used in fuel and chemical building block). As a result, both total production (36.30% decrease in 2020 from 2014) and revenue contribution (52.10% decrease in 2020 from 2014) have been decreasing for the last few years.
LINDEBD imports most of its raw materials. Devaluation of BDT against USD would drive up LINDEBD’s cost of sales.
LINDEBD’s business growth is inherently related to its customers’ industries’ growth and overall macroeconomic growth. Any volatility in macroeconomic and private sector growth will directly impact LINDEBD’s business.
Proliferation of Chinese import and lower cost local manufacturers of electrode present significant challenges in the growth of electrode business growing forward.
Recent Financial Performance Q3 Un-audited: EPS was Tk. 17.99 for July-September 2021 as against Tk. 22.67 for July-September 2020; EPS was Tk. 59.41 for January-September 2021 as against Tk. 47.82 for January-September 2020. NOCFPS was Tk. 44.13 for January-September 2021 as against Tk. 54.68 for January-September 2020. NAV per share was Tk. 375.16 as on September 30, 2021 and Tk. 355.75 as on December 31, 2020.
0%
5%
10%
15%
20%
25%
30%
35%
40%
45%
50%
2017 2018 2019 2020 2021 9m An'
Profitability Margins of LINDEBD
GP Margin OP Margin PBT Margin NPAT Margin
62.60 65.95
80.92
70.54
79.22
2017 2018 2019 2020 2021 9m An'
Five Year's EPS (BDT)
310%
340% 375%
500%
400%
2016 2017 2018 2019 2020
Five Year's Cash Dividend
0
50,000
100,000
150,000
200,000
250,000
0.00
500.00
1,000.00
1,500.00
2,000.00
Oct-18 Apr-19 Oct-19 Apr-20 Oct-20 Apr-21 Oct-21
Price Volume Movement of LINDEBD
VOLUME CLOSEP*
Equity Note on Linde Bangladesh Limited (LINDEBD) Date: December 09, 2021
Current Price (BDT): 1,529.40 Resistance: 1,515.83
Support: 1410.03
MFI: 79.11
RSI: 71.08
4
EBL Securities Limited Research
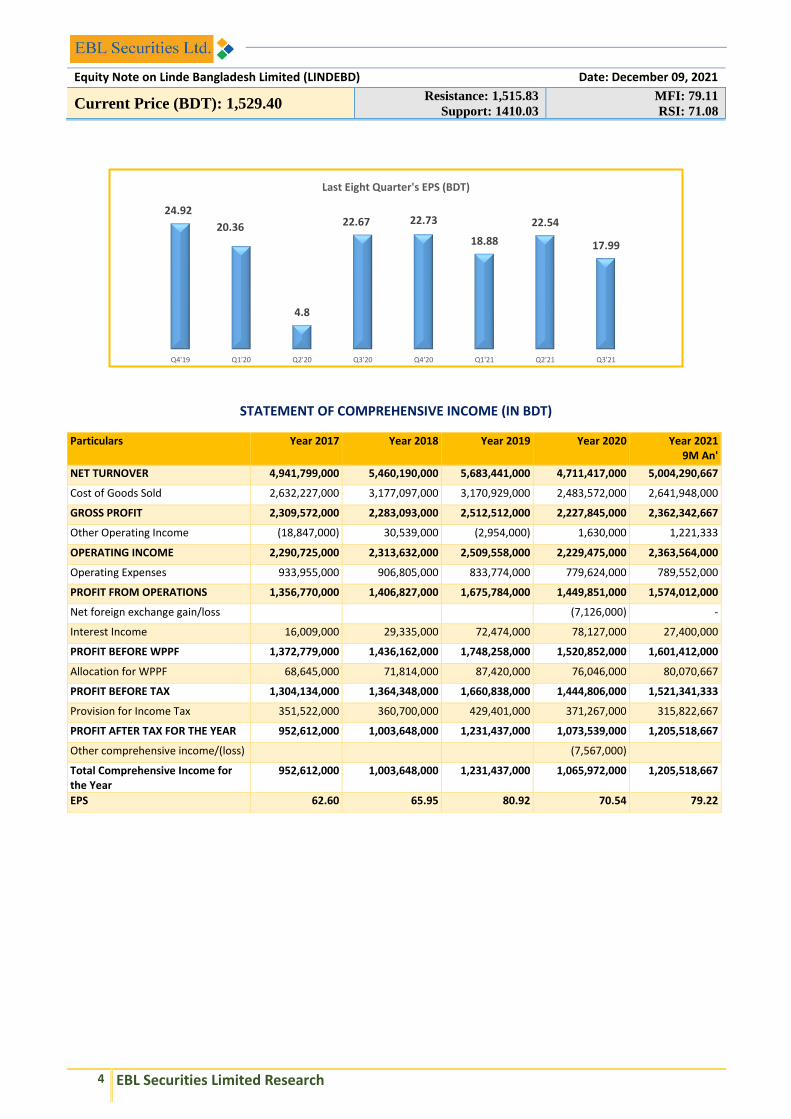
STATEMENT OF COMPREHENSIVE INCOME (IN BDT)
Particulars Year 2017 Year 2018 Year 2019 Year 2020 Year 2021 9M An'
NET TURNOVER 4,941,799,000 5,460,190,000 5,683,441,000 4,711,417,000 5,004,290,667
Cost of Goods Sold 2,632,227,000 3,177,097,000 3,170,929,000 2,483,572,000 2,641,948,000
GROSS PROFIT 2,309,572,000 2,283,093,000 2,512,512,000 2,227,845,000 2,362,342,667
Other Operating Income (18,847,000) 30,539,000 (2,954,000) 1,630,000 1,221,333
OPERATING INCOME 2,290,725,000 2,313,632,000 2,509,558,000 2,229,475,000 2,363,564,000
Operating Expenses 933,955,000 906,805,000 833,774,000 779,624,000 789,552,000
PROFIT FROM OPERATIONS 1,356,770,000 1,406,827,000 1,675,784,000 1,449,851,000 1,574,012,000
Net foreign exchange gain/loss (7,126,000) -
Interest Income 16,009,000 29,335,000 72,474,000 78,127,000 27,400,000
PROFIT BEFORE WPPF 1,372,779,000 1,436,162,000 1,748,258,000 1,520,852,000 1,601,412,000
Allocation for WPPF 68,645,000 71,814,000 87,420,000 76,046,000 80,070,667
PROFIT BEFORE TAX 1,304,134,000 1,364,348,000 1,660,838,000 1,444,806,000 1,521,341,333
Provision for Income Tax 351,522,000 360,700,000 429,401,000 371,267,000 315,822,667
PROFIT AFTER TAX FOR THE YEAR 952,612,000 1,003,648,000 1,231,437,000 1,073,539,000 1,205,518,667
Other comprehensive income/(loss) (7,567,000)
Total Comprehensive Income for the Year
952,612,000 1,003,648,000 1,231,437,000 1,065,972,000 1,205,518,667
EPS 62.60 65.95 80.92 70.54 79.22
24.92
20.36
4.8
22.67 22.73
18.88
22.54
17.99
Q4'19 Q1'20 Q2'20 Q3'20 Q4'20 Q1'21 Q2'21 Q3'21
Last Eight Quarter's EPS (BDT)

Equity Note on Linde Bangladesh Limited (LINDEBD) Date: December 09, 2021
Current Price (BDT): 1,529.40 Resistance: 1,515.83
Support: 1410.03
MFI: 79.11
RSI: 71.08
5
EBL Securities Limited Research
STATEMENT OF FINANCIAL POSITION (IN BDT)
Particulars Year 2017 Year 2018 Year 2019 Year 2020 Year 2021
9M An'
Non-Current Assets: 3,317,837,000 3,547,974,000 3,732,686,000 3,542,241,000 3,434,895,000
Property, Plant and Equipment-Carrying Value
3,218,638,000 3,445,462,000 3,617,639,000 3,424,786,000 3,325,205,000
Intangible assets 18,699,000 11,755,000 5,295,000 485,000 221,000
Right-of-use (ROU) asset 12,159,000 11,349,000
Investement in subsidiary 20,000
Advance, Deposit & Prepayments
80,500,000 90,757,000 109,752,000 104,811,000 98,100,000
Current Assets: 2,626,970,000 3,301,253,000 3,919,018,000 4,461,857,000 4,901,612,000
Inventories 683,575,000 842,895,000 831,800,000 873,442,000 1,210,409,000
Trade Debtors 608,505,000 618,969,000 714,085,000 731,868,000 935,780,000
Advances,Deposits and Prepayments
180,886,000 224,415,000 123,868,000 200,319,000 163,379,000
Current Tax Assets 11,113,000
Investmetnt 10,535,000 10,753,000 1,244,619,000 1,511,202,000
Cash and Cash Equivalents 1,132,356,000 1,604,221,000 1,004,646,000 1,145,026,000 2,592,044,000
TOTAL ASSETS 5,944,807,000 6,849,227,000 7,651,704,000 8,004,098,000 8,336,507,000
Shareholders' Equity: 3,675,659,000 4,472,404,000 5,108,271,000 5,413,314,000 5,709,245,000
Share Capital 152,183,000 152,183,000 152,183,000 152,183,000 152,183,000
General Reserves 3,523,474,000 4,304,151,000 4,984,999,000 5,297,610,000 5,593,541,000
Other Component of Equity -28,911,000 -36,479,000 -36,479,000
Non-Controlling Interest 2,000 16,070,000 -300 -700
Non-Current Liabilities: 696,012,000 731,028,000 795,676,000 854,518,000 834,741,000
Employee benefits 161,342,000 155,465,000 166,963,000 180,180,000 175,960,000
Deferred Tax Liability 299,171,000 327,328,000 374,931,000 405,533,000 385,086,000
Lease liability (non current option)
7,260,000 6,517,000
Other Non-Current Liabilities
235,499,000 248,235,000 253,782,000 261,545,000 267,178,000
Current Liabilities: 1,573,136,000 1,645,795,000 1,747,757,000 1,736,266,000 1,792,521,000
Lease Liability-Current Portion
4,585,000 5,164,000
Accounts Payable 1,411,322,000 1,413,511,000 1,364,789,000 1,341,525,000 1,358,625,000
Current tax liabilities 86,267,000 166,726,000 101,144,000 128,135,000
Provision for Expenses 161,814,000 146,017,000 216,242,000 191,249,000 195,546,000
Unclaimed Dividend 97,763,000 105,051,000
TOTAL SHAREHOLDERS' EQUITY AND LIABILITIES
5,944,807,000 6,849,227,000 7,651,704,000 8,004,098,000 8,336,507,000
Net Asset Value (NAV) per share
241.53 293.88 335.67 355.71 375.16
No. of Share Outstanding 15,218,300 15,218,300 15,218,300 15,218,300 15,218,300
*2021 data are as on 30th September, 2021.
Equity Note on Linde Bangladesh Limited (LINDEBD) Date: December 09, 2021
Current Price (BDT): 1,529.40 Resistance: 1,515.83
Support: 1410.03
MFI: 79.11
RSI: 71.08
6
EBL Securities Limited Research
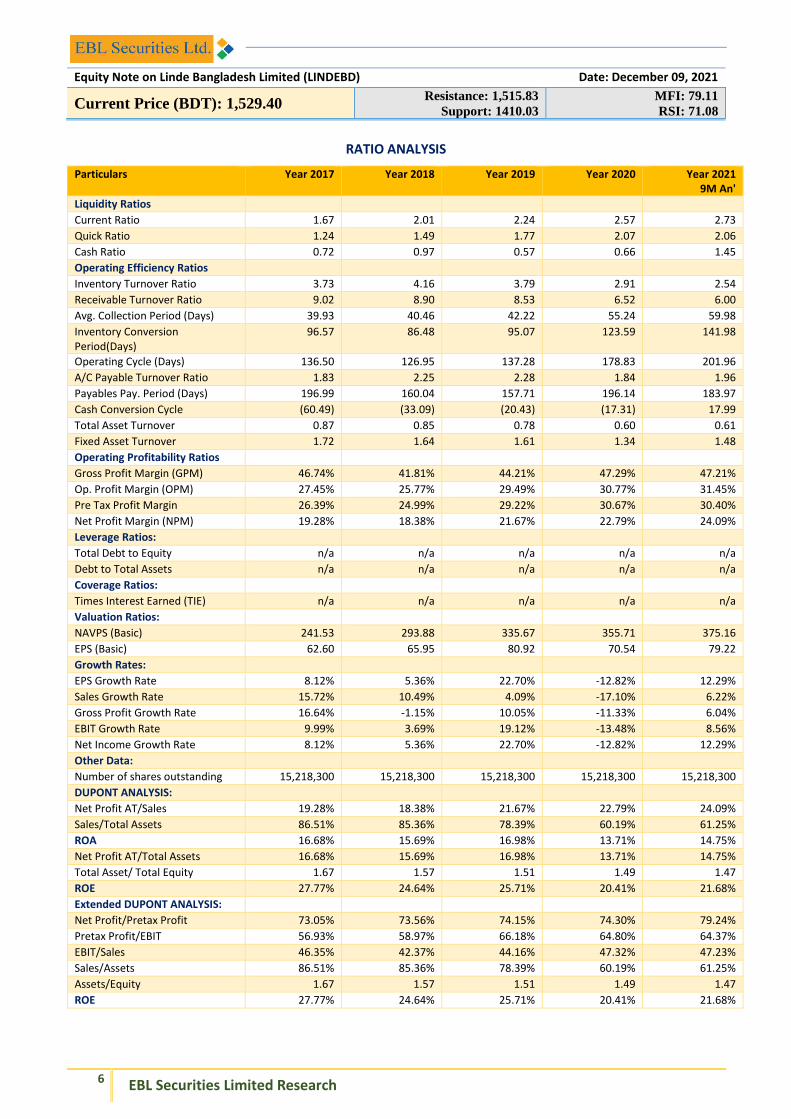
RATIO ANALYSIS
Particulars Year 2017 Year 2018 Year 2019 Year 2020 Year 2021 9M An'
Liquidity Ratios
Current Ratio 1.67 2.01 2.24 2.57 2.73
Quick Ratio 1.24 1.49 1.77 2.07 2.06
Cash Ratio 0.72 0.97 0.57 0.66 1.45
Operating Efficiency Ratios
Inventory Turnover Ratio 3.73 4.16 3.79 2.91 2.54
Receivable Turnover Ratio 9.02 8.90 8.53 6.52 6.00
Avg. Collection Period (Days) 39.93 40.46 42.22 55.24 59.98
Inventory Conversion Period(Days)
96.57 86.48 95.07 123.59 141.98
Operating Cycle (Days) 136.50 126.95 137.28 178.83 201.96
A/C Payable Turnover Ratio 1.83 2.25 2.28 1.84 1.96
Payables Pay. Period (Days) 196.99 160.04 157.71 196.14 183.97
Cash Conversion Cycle (60.49) (33.09) (20.43) (17.31) 17.99
Total Asset Turnover 0.87 0.85 0.78 0.60 0.61
Fixed Asset Turnover 1.72 1.64 1.61 1.34 1.48
Operating Profitability Ratios
Gross Profit Margin (GPM) 46.74% 41.81% 44.21% 47.29% 47.21%
Op. Profit Margin (OPM) 27.45% 25.77% 29.49% 30.77% 31.45%
Pre Tax Profit Margin 26.39% 24.99% 29.22% 30.67% 30.40%
Net Profit Margin (NPM) 19.28% 18.38% 21.67% 22.79% 24.09%
Leverage Ratios:
Total Debt to Equity n/a n/a n/a n/a n/a
Debt to Total Assets n/a n/a n/a n/a n/a
Coverage Ratios:
Times Interest Earned (TIE) n/a n/a n/a n/a n/a
Valuation Ratios:
NAVPS (Basic) 241.53 293.88 335.67 355.71 375.16
EPS (Basic) 62.60 65.95 80.92 70.54 79.22
Growth Rates:
EPS Growth Rate 8.12% 5.36% 22.70% -12.82% 12.29%
Sales Growth Rate 15.72% 10.49% 4.09% -17.10% 6.22%
Gross Profit Growth Rate 16.64% -1.15% 10.05% -11.33% 6.04%
EBIT Growth Rate 9.99% 3.69% 19.12% -13.48% 8.56%
Net Income Growth Rate 8.12% 5.36% 22.70% -12.82% 12.29%
Other Data:
Number of shares outstanding 15,218,300 15,218,300 15,218,300 15,218,300 15,218,300
DUPONT ANALYSIS:
Net Profit AT/Sales 19.28% 18.38% 21.67% 22.79% 24.09%
Sales/Total Assets 86.51% 85.36% 78.39% 60.19% 61.25%
ROA 16.68% 15.69% 16.98% 13.71% 14.75%
Net Profit AT/Total Assets 16.68% 15.69% 16.98% 13.71% 14.75%
Total Asset/ Total Equity 1.67 1.57 1.51 1.49 1.47
ROE 27.77% 24.64% 25.71% 20.41% 21.68%
Extended DUPONT ANALYSIS:
Net Profit/Pretax Profit 73.05% 73.56% 74.15% 74.30% 79.24%
Pretax Profit/EBIT 56.93% 58.97% 66.18% 64.80% 64.37%
EBIT/Sales 46.35% 42.37% 44.16% 47.32% 47.23%
Sales/Assets 86.51% 85.36% 78.39% 60.19% 61.25%
Assets/Equity 1.67 1.57 1.51 1.49 1.47
ROE 27.77% 24.64% 25.71% 20.41% 21.68%
EBLSL RESEARCH
© 2021 EBL Securities Ltd.
This research report is a property of EBL Securities Ltd. | Bangladesh Equities | N.B.: Disclaimer of the EBL Securities Ltd, the author(s) certification and rating definition have been provided at the end of the report.
IMPORTANT DISCLOSURES
Disclaimer: This document has been prepared by EBL Securities Limited (“EBLSL”) for information purpose only of its clients residing both in Bangladesh and abroad, on the basis of the publicly available information in the market and own research. This document does not solicit any action based on the material contained herein and should not be taken as an offer or solicitation to buy or sell or subscribe to any security. Neither EBLSL nor any of its directors, shareholders, member of the management or employee represents or warrants expressly or impliedly that the information or data or the sources used in the documents are genuine, accurate, complete, authentic and correct. However all reasonable care has been taken to ensure the accuracy of the contents of this document. Being a broker, EBLSL may have a business relationship with the public companies from time to time. EBLSL and its affiliates, directors, management personnel and employees may have positions in, and buy or sell the securities, if any, referred to in this document. EBLSL disclaims liability for any direct, indirect, punitive, special, consequential, or incidental damages related to the report or the use of the report.
This document is distributed by EBL Securities Ltd. and its authorized distribution partners on a global basis. This document is not directed to, or intended for distribution to or use by, any person or entity that is citizen or resident of or located in any locality, state, country, or other jurisdiction where such distribution, publication, availability or use would be contrary to law or regulation. The information and data presented herein are the exclusive property of EBLSL and any unauthorized reproduction or redistribution of the same is strictly prohibited.
Analyst Certification: The person or persons named as the author(s) of this report hereby certify that the recommendations and opinions expressed in the research report accurately reflect their personal views about the subject matter(s) discussed. The views of the author(s) do not necessarily reflect the views of the EBL Securities Limited (EBLSL) and/or any of its salespeople, traders and other professionals and are subject to change without any prior notice. All reasonable care has been taken to ensure the accuracy of the contents of this document and the author(s) will not take any responsibility for any decision made by investors based on the information herein.
Compensation of Analyst(s): The compensation of research analyst(s) is intended to reflect the value of the services they provide to the clients of EBLSL. The compensation of the analysts is impacted by the overall profitability of the firm. However, EBLSL and its analyst(s) confirms that no part of the analyst’s compensation was, is, or will be, directly or indirectly, related to the specific recommendations, opinions or views expressed in the research reports.
General Risk Factors: The information provided in the report may be impacted by market data system outages or errors, both internal and external, and affected by frequent movement of market events. The report may contain some forward looking statements, projections, estimates and forecasts which are based on assumptions made and information available to us that we believe to be reasonable and are subject to certain risks and uncertainties. There may be many uncontrollable or unknown factors and uncertainties which may cause actual results to materially differ from the results, performance or expectations expressed or implied by such forward-looking statements. EBLSL cautions all investors that such forward-looking statements in this report are not guarantees of future performance. Investors should exercise good judgment and perform adequate due-diligence prior to making any investment. All opinions and estimates contained in this report are subject to change without any notice due to changed circumstances and without legal liability. Other than certain industry reports published on a periodic basis, the large majority of reports are published at irregular intervals as appropriate in the analyst’s judgment. However, EBLSL disclaims any obligation to update or revise any such forward looking statements to reflect new information, events or circumstances after the publication of this report to reflect the occurrences and results of unanticipated events.
For U.S. persons only: This research report is a product of EBL Securities Ltd., which is the employer of the research analyst(s) who has prepared the research report. The research analyst(s) preparing the research report is/are resident outside the United States (U.S.) and are not associated persons of any U.S. regulated broker-dealer and therefore the analyst(s) is/are not subject to supervision by a U.S. broker-dealer, and is/are not required to satisfy the regulatory licensing requirements of FINRA or required to otherwise comply with U.S. rules or regulations regarding, among other things, communications with a subject company, public appearances and trading securities held by a research analyst account.
This report is intended for distribution by EBL Securities Ltd. only to "Major Institutional Investors" as defined by Rule 15a-6(b)(4) of the U.S. Securities and Exchange Act, 1934 (the Exchange Act) and interpretations thereof by U.S. Securities and Exchange Commission (SEC) in reliance on Rule 15a 6(a)(2). If the recipient of this report is not a Major Institutional Investor as specified above, then it should not act upon this report and return the same to the sender. Further, this report may not be copied, duplicated and/or transmitted onward to any U.S. person, which is not the Major Institutional Investor.
EBLSL Rating Interpretation
Overweight : Stock is expected to provide positive returns at a rate greater than its required rate of return Accumulate : Stock is expected to provide positive inflation adjusted returns at a rate less than its required rate of return Market weight : Current market price of the stock reasonably reflect its fundamental value Underweight : Stock expected to fall by more than 10% in one year Not Rated : Currently the analyst does not have adequate conviction about the stock's expected total return
No part of this material may be (i) copied, photocopied or duplicated in any form by any means (ii) used in any other report or publication or anything of that sort without appropriate credit given or (iii) redistributed without the prior written consent of The EBL Securities Ltd. This disclaimer applies to the report irrespective of being used in whole or in part.
EBLSL RESEARCH
© 2021 EBL Securities Ltd.
This research report is a property of EBL Securities Ltd. | Bangladesh Equities | N.B.: Disclaimer of the EBL Securities Ltd, the author(s) certification and rating definition have been provided at the end of the report.
About EBL Securities Ltd.: EBL Securities Ltd. (EBLSL) is one of the fastest growing full-service brokerage companies in Bangladesh and a fully owned subsidiary of Eastern Bank Limited. EBLSL is also one of the leading stock brokerage houses of the country. EBL Securities Limited is the TREC-holder of both exchanges of the country; DSE (TREC# 026) and CSE (TREC# 021). EBLSL takes pride in its strong commitment towards excellent client services and the development of the Bangladesh capital markets. EBLSL has developed a disciplined approach towards providing capital market services, including securities trading, margin loan facilities, depository services, foreign trading facilities, Bloomberg Terminal, online trading facilities, research services, panel brokerage services, trading through NITA for foreign investors & NRBs etc.
EBLSL Key Management
Md. Sayadur Rahman Managing Director [email protected] M. Shahryar Faiz Chief Operating Officer [email protected] Md. Asaduzzaman Chief Financial Officer [email protected]
EBLSL Research Team
Mohammad Asrarul Haque Research Analyst [email protected] Mohammad Rehan Kabir Senior Research Associate [email protected] Arif Abdullah Research Associate [email protected] Md Rashadur Rahman Ratul Research Associate [email protected]
EBLSL Institutional & Foreign Trade Team
Asif Islam Associate Manager [email protected]
For any queries regarding this report: [email protected]
EBLSL Research Reports are also available on www.eblsecurities.com > Research
Our Global Research Distribution Partners
To access EBLSL research through Bloomberg use <EBLS>
Our Locations
Head Office:
Jiban Bima Bhaban,
10 Dilkusha C/A, 1st Floor, Dhaka-1000
+8802 9553247, 9556845;+8802 47111935
FAX: +8802 47112944 [email protected]
HO Extension:
Bangladesh Sipping Corporation (BSC) Tower 2-3, Rajuk Avenue (4th floor), Motijheel, Dhaka-1000 +880257160801-4
Chattogram Branch:
Suraiya Mansion (6th Floor); 30, Agrabad C/A Chattogram-4100 +031 2522041-43
Dhanmondi Branch:
Sima Blossom, House # 390 (Old), 3 (New), Road # 27 (Old), 16 (New), Dhanmondi R/A, Dhaka-1209. +8802-9130268, +8802-9130294