Equity and energy in global solutions to climate change
35
PUBLISHED IN ‘ENERGY FOR SUSTAINABLE DEVELOPMENT’ , 2015, Vol 26, pp. 72-78. Equity and energy in global solutions to climate change Primal Ekanayake [email protected] Department of Mechanical and Aerospace Engineering, Monash University-Clayton Campus, P.O Box 31, Victoria 3800, Australia. +61-3-99051988 Patrick Moriarty [email protected] Department of Design, Monash University-Caulfield Campus, 900 Dandenong Rd, Caulfield East, Victoria 3145, Australia. +61-3-99032584 Damon Honnery (corresponding author) [email protected] Department of Mechanical and Aerospace Engineering, Monash University-Clayton Campus, P.O Box 31, Victoria 3800, Australia. +61-3-99051988 Abstract This paper explores the prospect for achieving an equitable allocation of country-specific carbon dioxide emissions from the energy sector within the framework of the Cancun climate stability target, as represented by Representative Concentration Pathway 2.6. Three allocation principles are considered, with the primary one (Egalitarian) based on equal per capita emissions for all countries by 2050. The two secondary allocation principles, termed Emission-based and GDP-based, distribute allowable emissions according to cumulative historical emissions and cumulative historical GDP respectively. Neither of these two allocation principles can deliver equal per capita emissions by 2050. Only when a global average constraint factor is introduced, designed to enable 1
Transcript of Equity and energy in global solutions to climate change

PUBLISHED IN ‘ENERGY FOR SUSTAINABLE DEVELOPMENT’,2015, Vol 26, pp. 72-78.
Equity and energy in global solutions to climatechange
Primal [email protected] of Mechanical and Aerospace Engineering, Monash University-Clayton Campus, P.O Box 31, Victoria 3800, Australia.+61-3-99051988
Patrick [email protected] Department of Design, Monash University-Caulfield Campus, 900 Dandenong Rd, Caulfield East, Victoria 3145, Australia.+61-3-99032584
Damon Honnery (corresponding author)[email protected] Department of Mechanical and Aerospace Engineering, Monash University-Clayton Campus, P.O Box 31, Victoria 3800, Australia.+61-3-99051988
AbstractThis paper explores the prospect for achieving an equitable allocation of country-specific carbon dioxide emissions from the energy sector within the framework of the Cancun climate stability target, as represented by Representative Concentration Pathway 2.6. Three allocation principles are considered, with the primary one (Egalitarian) based on equal per capita emissions for all countries by 2050. The two secondary allocation principles, termed Emission-based and GDP-based, distribute allowable emissions according to cumulative historical emissions and cumulative historical GDP respectively. Neither of these two allocation principles can deliver equal per capita emissions by 2050. Only when a globalaverage constraint factor is introduced, designed to enable
1

countries with less than allowed global average per capita emissions in any year to increase their emissions to this level, can emissions parity (the Egalitarian principle) be achieved by 2050. Finally,it is argued that achieving the widespread agreement needed to achieve climate stability is likely to be difficult, given both the size of reductions needed, especially by high-emission countries, and the inadequacies of the technical fixes proposed.
Key words: climate change, emission allocation, equity, Representative Concentration Pathway RCP2.6.
2

Introduction
Since the Conference of Parties of the United Nations
Framework for Climate Change (COP UNFCCC, 2010) (the Cancun
agreement), consensus toward climate change has been to
stabilize atmospheric GHG concentrations to limit the average
temperature rise to below 2oC. Emissions scenarios, or more
recently, Representative Concentration Pathways (RCPs), have
been frequently used to explore the possibility of achieving
such targets (van Vuuren et al., 2011a, 2011b; Organization
for Economic Cooperation and Development (OECD), 2012;
Intergovernmental Panel on Climate Change (IPCC) 2013, 2014).
According to the IPCC, the various RCPs ‘are identified by
their approximate total radiative forcing in year 2100
relative to 1750: 2.6 W/m2 for RCP2.6, 4.5 W/m2 for RCP4.5, 6.0
W/m2 for RCP6.0, and 8.5 W/m2 for RCP8.5.’ The IPCC decided
that these four scenarios ‘would not be developed as part of
the IPCC process, leaving new development to the research
community’ (Van Vuuren et al, 2011b). Of special interest here
is RCP2.6, which aims to achieve climate stability by 2100.
Van Vuuren et al. (2011a) explored the technical feasibility
of achieving the reductions in greenhouse gas (GHG) emissions
needed to meet RCP2.6. They found that RCP2.6 could be met by
reducing GHG emissions, such as CO2 from global fossil fuel
combustion, by using a combination of increased technical
efficiency, wider use of renewable and nuclear power, the use
of fossil fuel carbon capture and storage (CCS) and, to obtain
negative carbon emissions, large scale use of bioenergy CCS
3

(BECCS). In doing so, they assumed that rapid deployment of
new technologies is both possible and necessary. Importantly,
non-technical measures based on behavioural change (e.g.,
demand reduction, (Moriarty and Honnery, 2010)) were not
considered. Interestingly, van Vuuren, et al. (2011b) assumed
that for RCP2.6, the world GDP growth rate will be even faster
than for the three other RCPs, despite greater emission
reductions. Further, the authors concluded that reducing
emissions to limit warming to less than 2oC cannot be achieved
without broadening the participation of countries in
mitigation actions; the reductions needed cannot be allocated
to high emitters alone.
One of the recommendations for further research was to
identify national emission pathways that may be acceptable to
all parties involved in climate negotiations. Van Vuuren et
al. (2011a) detail a purely technical route to achieving
RCP2.6, but non-technical factors will als be important
(Morgan & Waskow, 2014). For example, the level of economic
development of a country could severly limit its capacity to
transition to a low carbon energy economy, particularly if it
has access to a cheap supply of coal and limited access to
renewable energy. Further, the cost of shifting from a fossil
fuel based energy sector in countries with signficiantly lower
standards of health and education could place an unacceptable
burden on their capacity to lift these standards, and limited
access to renewable energy resources could exacerbate this
burden.
4

An important aspect of acceptability is the perceived
fairness of any GHG allocation. The need for fairness in
outcome, and the recognition of differences among countries
are recognised in the UNFCCC principle of common but
differentiated responsibilites (Winkler & Rajamani, 2014). It
has been argued that each country having equal GHG emissions
per capita provides the fairest distribution of emissions
(Kitzes et al, 2008; Singer, 2006; Höhne et al, 2014). This
approach, which stresses the equality of the rights of
individuals, is often termed egalitarian (Cazorla & Toman,
2001). However, given the large disparity in present country
level per capita emissions, achieving such a result within the
constaints of RCP2.6 is likely to take time, suggesting the
need for a methodolgy to allocate emissions until equal per
capita emissions can be achieved. Also known as effort-sharing
(Höhne et al, 2014), a number of approaches, based on
different principles, could be used to arrrive at equal future
per capita emissions (eg Cazorla & Toman, 2001; Singer, 2006;
Pierrehumbert, 2013; Zhang and Shi, 2014). For example,
allocation of future GHG emissions could be based on the
country’s contribution to gobal emissions, or on a country’s
economic capacity to reduce GHG emissions. These are shown in
Table 1 as secondary allocation principles, with equality in
emissions being the primary aim. Note that the secondary
allocation principles can be applied independently of the
primary principle. In this paper the secondary principles are
first applied in turn, then each is applied together with the
5

primary allocation principle to get closer to emissions
equality.
Table1 Emissions allocation principles and descriptions. Source: Cazorla and Toman (2001).
Principle Description
Primary:Egalitarian People have equal rights to use atmospheric
resources (i.e. equal per capita emissions)Secondary:Emission-based allocation Future emissions are allocated based on a
county’s net cumulative emissions as a fraction of global cumulative emissions
GDP-based allocation Future emissions are allocated based on a county’s cumulative GDP as a fraction of global cumulative GDP
Besides those listed above, additional factors often cited
as being important to the development of equitable allocations
of future GHG emissions are: a country’s historical
contribution to the problem, inequities in burdens from the
impacts of climate change, and intergenerational equity
(Giddings et. al., 2002; Thomas and Twyman, 2005; Sovacool,
2013).
Since carbon dioxide remains in the atmosphere for a long
time (Archer, 2005; Hansen, et al., 2008), historical
emissions, expressed as past cumulative emissions, are often
cited as being an important factor in assigning equitable
emission allocations (COP UNFCCC, 1992; Miguez & Oliveira,
2011). To illustrate the importance of historical emissions,
many OECD countries now have stagnant or even falling energy-
based CO2 emissions (and also primary energy use). In contrast,
6

such emissions are rising strongly in many industrialising
countries (BP, 2014). An important reason for this contrast is
that the OECD countries have already built their energy–
intensive infrastructure, whereas newly industrialising
countries have not. Their infrastructure catch-up explains why
China and India together produce and use most of the world’s
cement, and why China dominates world steel production
(Moriarty and Honnery, 2014). Exner et al. (2014) have taken
this argument even further, and advocated equal per capita
stocks of geologically scarce metals such as copper.
Similarly, since most countries’ pursuit of economic growth
has usually led to increased emissions (Moriarty and Honnery,
2009; 2011), and because it provides an indication of capacity
to respond technologically, past cumulative GDP could also be
used to guide any future emission allocation. Gross GDP may
provide a better indication of response capacity than does
average GDP/capita for a given country, for at least two
reasons. First, many low carbon technologies are likely to
benefit from economies of scale (e.g., for CCS, BECSS, and
nuclear power plants, unit costs reduce with plant size), and
so are only available to large economies. Second, large
economies such as India and China, even with low per capita
incomes compared with OECD countries, have the capacity to
develop a range of the innovative technologies that may be
needed. Nor are gross GDP and average GDP per capita the only
options. Chakravarty et al. (2009) have advocated an
allocation system for CO2 reductions ultimately based on the
income of individuals, regardless of where they live, rather than
7

on the income of nations. All high-emitting individuals in the
world would be subject to a ‘universal cap on global
individual emissions’.
The time scales for past and future emissions are very
different. While the benefits accruing from past emissions for
mature industrial countries have occurred over a century or
more (e.g., benefits from transport, energy, and buildings
infrastructure), industrialising countries will now be
required to reduce their emissions and transition to low
carbon emitting technologies within decades.
Consideration must also be given to the unequal burdens on
countries from the impacts of climate change (Morgan & Waskow,
2014). Numerous studies indicate that the least developed
countries will suffer the most from climate change effects
(Anand, 2004; Mitchell et al., 2006; IPCC, 2013; Sovacool,
2013), yet their contributions to global cumulative emissions
have been minimal (BP, 2014). Intergenerational equity is also
important. Failure to reduce future emissions could lead to
global temperature rises as high as 4°C by 2100 (IPCC, 2013;
New et al., 2011), with the result that future generations are
likely to experience severe climatic effects for actions not
attributed to them. Furthermore, adaptation costs are likely
to increase the longer we delay mitigatory action. But at the
same time, it is also necessary to consider impacts on the
present generation; mitigation requirements cannot be so
stringent as to severely compromise well-being in the short-
term (Giddings et al., 2002).
8

An important additional component to achieving equity in
future allocations arises from the link between energy and
emissions. As will be discussed later in this paper, provided
energy use does not reduce in step with emission decreases,
global emissions will become de-coupled from total primary
energy use. Equity in emissions is not therefore the same as
equity in energy consumption; the attainment of an equitable
emissions allocation must not come at the cost of reduced
access to energy, particularly for those living in a state of
energy poverty (Sovacool, 2012). Indeed, Bazilian et al (2010)
have argued that energy policy should drive climate change
policy rather than the reverse.
In this paper we make use of the two secondary allocation
principles shown in Table 1 to explore how a global emission
pathway represented by RCP2.6 could be achieved with the
additional constraint of arriving at equal annual per capita
emissions by 2050. We first present individual mathematical
representations of the two secondary allocation principles,
Emissions-based and GDP-based, each of which includes the role
of historical responsibility. This is followed by a discussion
of how these perform within the framework of the Human
Development Index (HDI) by classifying all countries into one
of three groups: High, Medium, and Low HDI. We then introduce
additional equity constraints under-pinned by the Egalitarian
principle in order to arrive at an approach that enables the
broadest possible level of acceptability in the allowable
allocations by 2050, namely equal per capita emissions. We
conclude by discussing the difficulties in achieving the
9

widespread agreement needed to achieve climate stability,
given both the size of reductions needed, especially by high-
emission countries, and the inadequacies of the technical
fixes proposed.
Emission allocation methodology
As noted, the van Vuuren et al. (2011a) version of RCP2.6
provides an implementation pathway using a range of
technologies to limit climate change to less than 2oC. The
allowable annual emissions under this and the other three
pathways for the energy sector for the period up to 2050 are
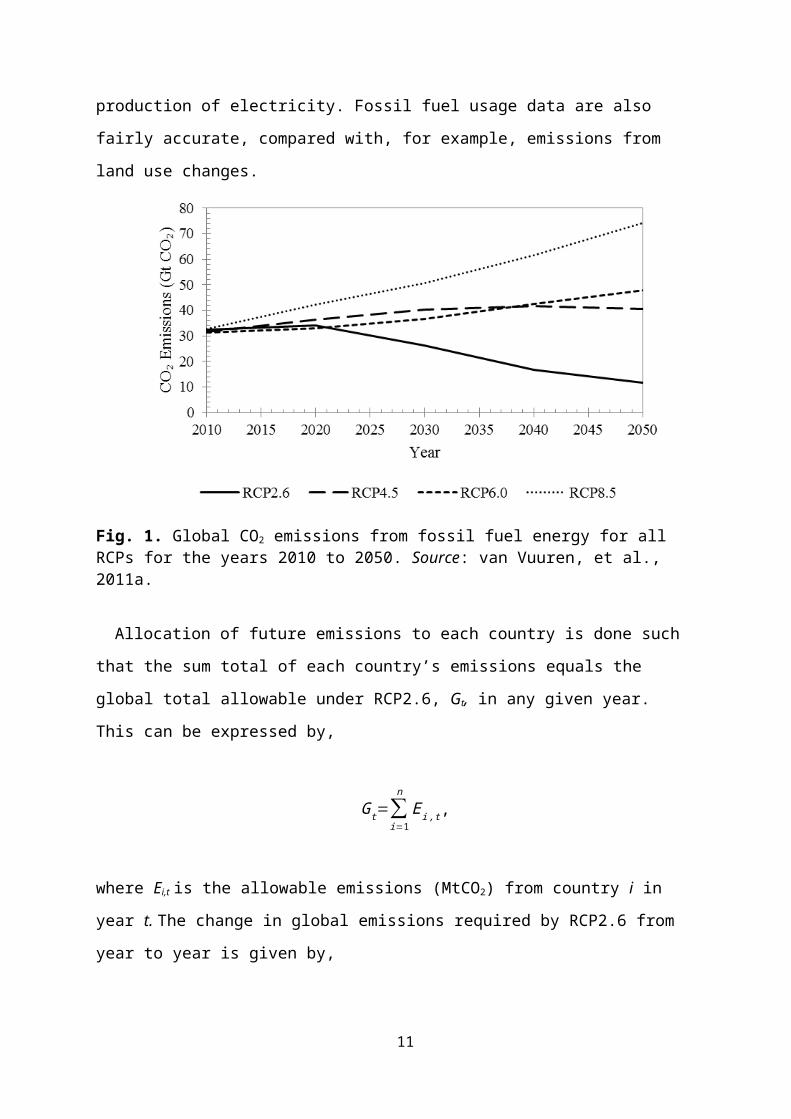
shown in Figure 1. The business-as usual energy sector
emissions path, as given in the OECD Environmental Outlook to 2050
(OECD, 2012), falls between the RCP6.0 and RCP8.5 curves in
Figure 1. The RCP2.6 limit effectively allows no more than
about 800 Gt CO2 to be emitted globally between 2015 and 2050.
Note that the strong egalitarian aim of equal cumulative per
capita emissions for all by 2050 is no longer a realistic
option; OECD country energy-related CO2 emissions from 1970 to
2014 totalled nearly 600 Gt. Even if OECD emissions from 2015-
2050 were zero, the 800 GT remaining global quota would not be
sufficient to give all countries equal per capita cumulative
emissions. Equal annual emissions per capita is the best that
can be hoped for.
We focus here on the energy sector, and its CO2 emissions, as
it not only accounts for most emissions, but also those for
which mitigation technologies are most directly applied, viz.
10
production of electricity. Fossil fuel usage data are also
fairly accurate, compared with, for example, emissions from
land use changes.
Fig. 1. Global CO2 emissions from fossil fuel energy for all RCPs for the years 2010 to 2050. Source: van Vuuren, et al., 2011a.
Allocation of future emissions to each country is done such
that the sum total of each country’s emissions equals the
global total allowable under RCP2.6, Gt, in any given year.
This can be expressed by,
Gt=∑i=1
nEi,t,
where Ei,t is the allowable emissions (MtCO2) from country i in
year t. The change in global emissions required by RCP2.6 from
year to year is given by,
11
∆Gt=Gt−1−Gt=∑i=1
nEi,t−1−∑
i=1
nEi,t.
From this, the allowable emissions for an individual country
can be written as,
Ei,t=Ei,t−1−Di,t∆Gt,
where Di,t is an emissions distribution term equal to the
fraction of the global change in emissions required by an
individual country. We express this equation by writing this
as,
Ei,t=[1−k ]Ei,t−1(1)
where k=Di,t∆Gt/Ei,t−1. Annual global emissions are calculated by
summing each country’s allowable emissions in Equation (1)
over n number of countries.
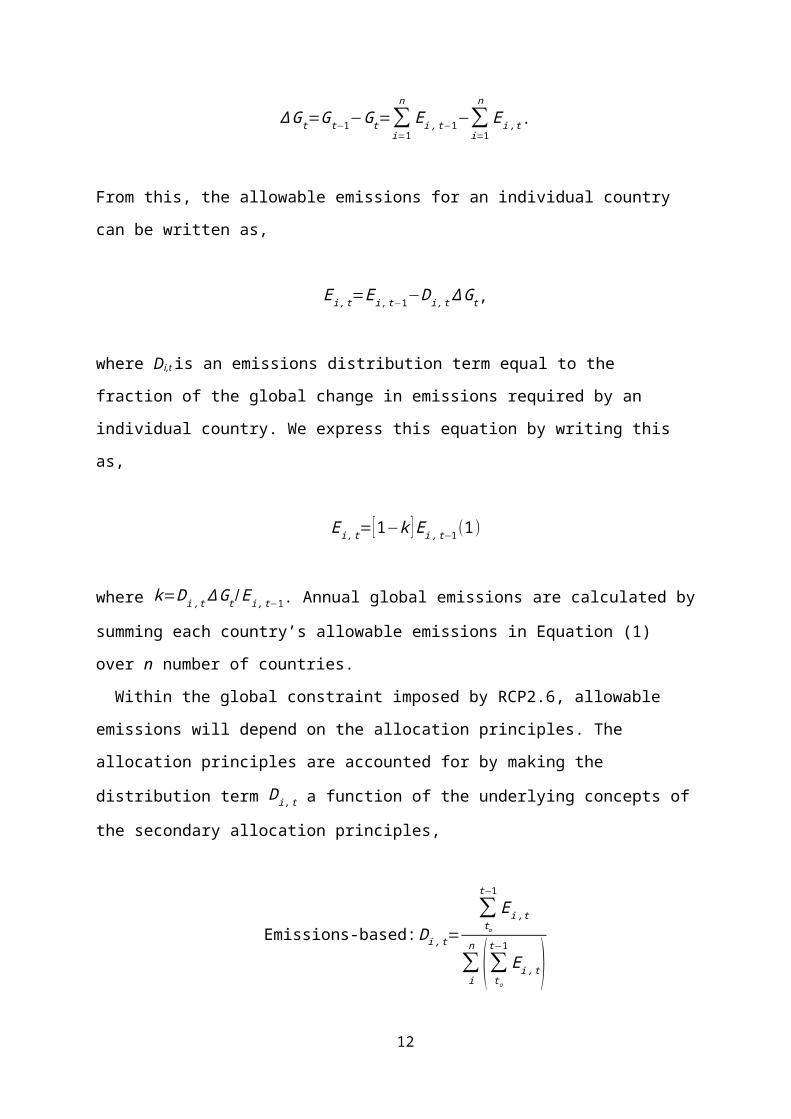
Within the global constraint imposed by RCP2.6, allowable
emissions will depend on the allocation principles. The
allocation principles are accounted for by making the
distribution term Di,t a function of the underlying concepts of
the secondary allocation principles,
Emissions-based:Di,t=∑to
t−1Ei,t
∑i
n (∑to
t−1Ei,t)
12
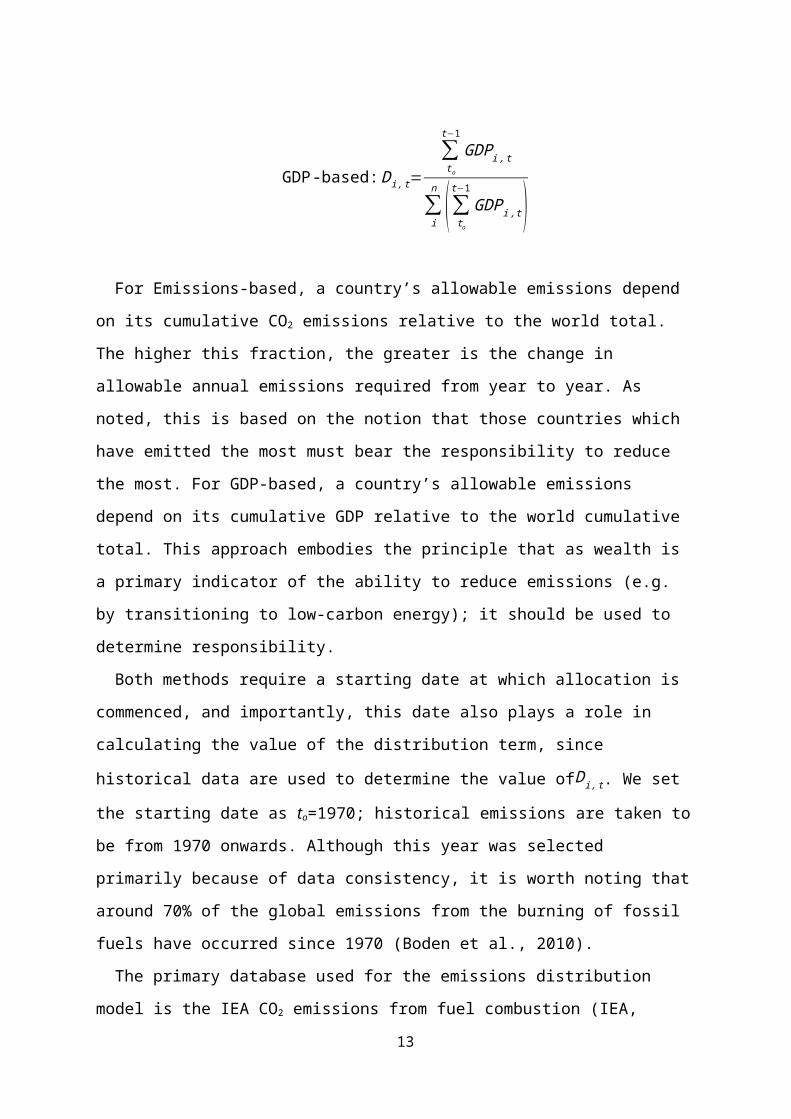
GDP-based:Di,t=
∑to
t−1GDPi,t
∑i
n (∑tot−1
GDPi,t)For Emissions-based, a country’s allowable emissions depend
on its cumulative CO2 emissions relative to the world total.
The higher this fraction, the greater is the change in
allowable annual emissions required from year to year. As
noted, this is based on the notion that those countries which
have emitted the most must bear the responsibility to reduce
the most. For GDP-based, a country’s allowable emissions
depend on its cumulative GDP relative to the world cumulative
total. This approach embodies the principle that as wealth is
a primary indicator of the ability to reduce emissions (e.g.
by transitioning to low-carbon energy); it should be used to
determine responsibility.
Both methods require a starting date at which allocation is
commenced, and importantly, this date also plays a role in
calculating the value of the distribution term, since
historical data are used to determine the value ofDi,t. We set
the starting date as to=1970; historical emissions are taken to
be from 1970 onwards. Although this year was selected
primarily because of data consistency, it is worth noting that
around 70% of the global emissions from the burning of fossil
fuels have occurred since 1970 (Boden et al., 2010).
The primary database used for the emissions distribution
model is the IEA CO2 emissions from fuel combustion (IEA,
13
2012). Baseline GDP and population data are taken from the
International Futures forecasting system (University of
Denver, 2013), while the anticipated changes in GDP per unit
change in CO2 emissions were taken from the OECD Environmental
Outlook to 2050 (OECD, 2012). For example, this approach is used
to approximate losses in GDP resulting from moving from fossil
fuels to low-carbon energy. (These assumed losses contrast
with the gains in GDP growth assumed by van Vuuren et al
(2011b) in moving to a low carbon economy, discussed earlier.)
The model can then map the evolution of GDP relative to CO2
emission reductions. The evolution of GDP in turn influences
the value for the GDP-based distribution term,Di,t.
Calculated data is presented for three discrete groups of
countries based on different levels of the HDI. The HDI levels
were adopted directly from the UN Human Development indicators
data (UN, 2012; UNDP, 2013). The HDI measures three normalised
indices, based on life expectancy at birth, number of years of
formal schooling, and Gross National Income per capita. The
HDI is the geometric mean of these three normalised indices
(UNDP, 2015). In accordance with this data, HDI values ≥ 0.8
represent countries classified as highly developed (High); HDI
values ≤ 0.53 represent countries classified as least
developed (Low); HDI values within the range 0.8 > x > 0.53
represent countries classified as developing (Medium). The
characteristics of each of the representative groups for 2010
based on averages across the total populations in each HDI
group, along with the global averages where relevant, are
shown in Table 2. What is immediately evident from this data
14

is the considerable disparity between the three groups in the
important areas of emissions and GDP. Also, the Medium HDI
group, which includes both China and India, contains over two-
thirds of the global population.
Table 2
Characteristic population weighted data of the three
representative HDI groups for the year 2010.
Sources: IEA, 2012; UN, 2012; UNDP, 2013.
Global
Average
High Medium Low
HDI 0.67 0.87 0.69 0.4
3Population share (%) 17.0 67.7 15.
3Primary energy share (%) 43.2 52.4 4.3
CO2 emissions share (%) 42.2 56.3 1.5
CO₂ (tonne/capita) 4.58 11.5 3.72 0.4
0GDP (PPP 2005) (%) 53.5 42.3 4.2
GDP ($ 1000 PPP
(2005)/capita)
10.2 32.55 6.31 2.4
6Primary energy (GJ/capita) 75.4 192 58.3 21.
2Electricity generation
(MWh/capita)
3.19 9.56 2.25 0.2
7GDP/Electricity generated ($
PPP 2005)/kWh)
3.19 3.34 2.80 9.1
1GDP/CO2 ($ 1000 PPP
2005/tonne CO2)
2.22 2.83 1.70 6.1
5
15
Allocations by emission principle
Figure 2 shows allowable emissions per capita for the three
HDI groups up to 2050 as well as the global average, based on
achieving RCP2.6 annual global emission limits through use of
the secondary allocation principles only. The year 2050 is
chosen for examination because response within the time
leading up to 2050 is crucial if we are to meet the low
emission target represented by RCP2.6, and also because it
allows sufficient time to examine the effect of implementing
the allocation principle.
What is evident from the data in Figure 2 is that, while
emissions have decreased for all three HDI groups for both
secondary allocation principles, significant disparity remains
in per capita emissions by 2050 between the three groups; that
is, neither of these two emission allocation principles alone
is able to arrive at equal emissions per capita by 2050. For
the High HDI group, high historical responsibility greatly
reduces emission allocations for both cases. The high
historical GDP for this group of countries reduces per capita
allocation almost to zero for the GDP-based allocation
principle. The emission reductions needed are for both cases
even greater than if annual rather than cumulative emissions
were used as the basis for allocation (Ekanayake, 2014).
16

Fig. 2. (a) Allowable emissions for the three HDI groups for theEmissions-based allocation principle, Equation (2); (b) Allowableemissions for the three HDI groups for the GDP-based allocation
principle Equation (2).
For the Medium HDI countries under the Emissions-based
allocation principle, allowable emissions remain at or near
the global average, while for the GDP-based allocation
principle allowable emissions diverge from the global average
after 2030. This divergence is caused by a reduction in the
distribution term, since their historical GDP is considerably
lower than for High HDI countries.
17
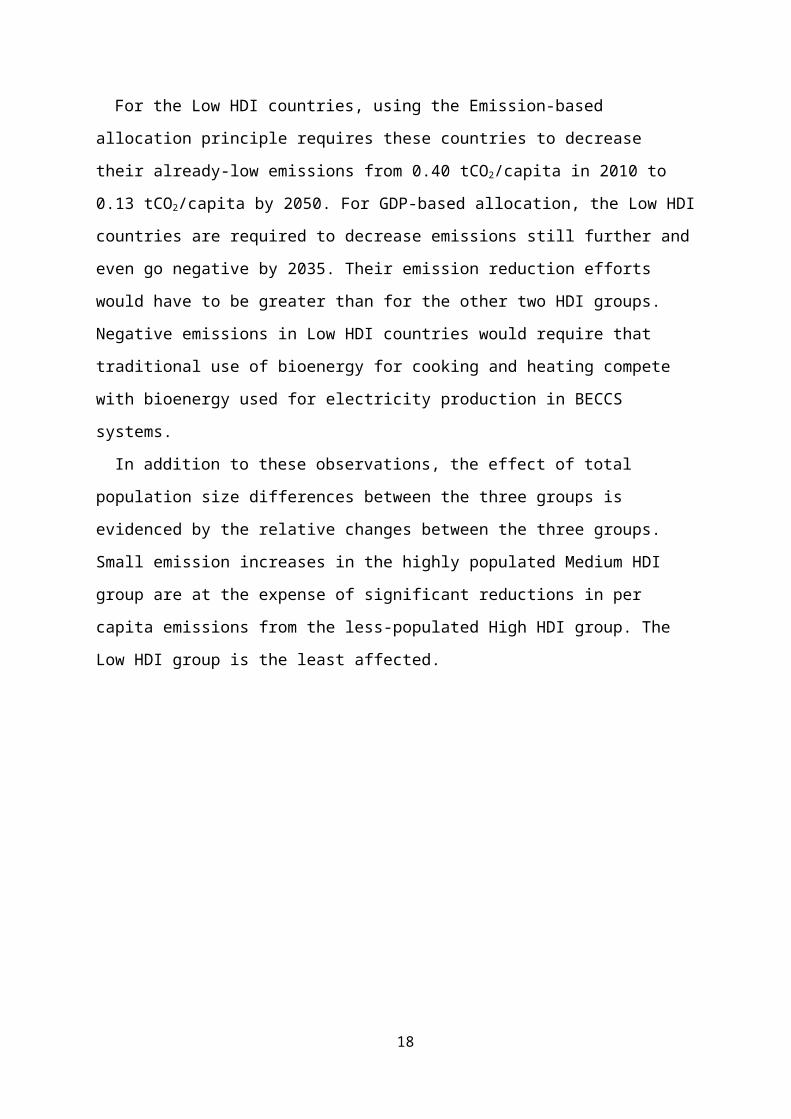
For the Low HDI countries, using the Emission-based
allocation principle requires these countries to decrease
their already-low emissions from 0.40 tCO2/capita in 2010 to
0.13 tCO2/capita by 2050. For GDP-based allocation, the Low HDI
countries are required to decrease emissions still further and
even go negative by 2035. Their emission reduction efforts
would have to be greater than for the other two HDI groups.
Negative emissions in Low HDI countries would require that
traditional use of bioenergy for cooking and heating compete
with bioenergy used for electricity production in BECCS
systems.
In addition to these observations, the effect of total
population size differences between the three groups is
evidenced by the relative changes between the three groups.
Small emission increases in the highly populated Medium HDI
group are at the expense of significant reductions in per
capita emissions from the less-populated High HDI group. The
Low HDI group is the least affected.
18
Fig. 3. 2010 country per capita tCO2 emissions relative to theglobal average against 2050 relative missions for Emissions- andGDP- based allocation principles for the three HDI country groups.
The effect of these two allocation methodologies on
individual countries is shown in Figure 3. The figure presents
the change in emissions from 2010 to 2050 with countries
grouped in the three HDI categories; emissions are shown as
per capita emissions relative to the global average. Increased
equity in per capita emissions among countries would be
indicated by a shift toward a uniform value of 1.0 by 2050.
This shift is not exhibited in Figure 3; significant disparity
remains globally among countries and also among countries
within each HDI group. The improved equity for the Medium and
High HDI group of countries found for the Emissions-based
allocation principle (Fig 2a) is shown in Fig 3 to occur
though a balance of gains and losses among individual 19

countries, rather than being the result of a uniform
reduction. To better examine this, the root mean square of the
population weighted relative per capita emissions can be used
as a measure of the disparity among individuals globally and
in each HDI country group, Table 3; the higher this value, the
greater the disparity. From this measure, rather than reducing
disparity, global emissions disparity increases over the
period 2010-2050 for the two allocation principles. Among the
HDI country groups, disparity among the Medium HDI countries
is seen to increase considerably. Thus, while reductions in
emissions occur sufficient to match the constraints of RCP2.6,
the disparity between nations in per capita CO2 emissions
increases.
Table 3
Root mean square of population weighted country tCO2/capita relative to global average tCO2/capita for 2010 and 2050 for the two minor allocation principles, and repeated for 2050 with the global mean average constraint.
Low HDI Medium HDI High HDI Global2010 0.99 0.28 2.58 1.022050
Emissions
0.99 1.45 1.61 1.21
2050 GDP 0.89 2.20 2.28 1.90With Global Average Constraint2050
Emissions
0.61 0.51 1.01 0.63
2050 GDP 0.37 0.42 0.25 0.37
20
Under the two secondary allocation principles illustrated in
Figure 2, per capita emissions for the Low HDI countries still
remain well below the global average by 2050—in fact, close to
zero for many countries, Figure 3. To remedy this difference,
we modify the distribution to enable individual countries with
below average per capita energy emissions to increase their
emissions up to a specific allocation. We term this the global
average constraint. Equation (1) then becomes,
Ei,t=[1−ke ]Ei,t−1.(3)
The new variableke is defined such that it may either reduce
CO2 emissions (i.e. similar to the previous models), or
increase them, depending on the key constraint: annual per
capita CO2 emissions. If per capita emissions of a given
country are greater than or equal to global RCP2.6 average per
capita emissions in year t-1, ke=k, otherwise ke takes the form:
ke=−(Di,te Ct/Ei,t−1).
Ct is the total quantity of CO2 emissions possible, such that
all countries with per capita CO2 emissions below the global
average for year t-1 can be allocated a sufficient emissions
quota to allow CO2 emissions per capita to exceed a specified
minimum per capita value, which is still less than or equal to
the global average in year t. For all three HDI groups to reach
the same global per capita emissions by 2050, the minimum per
capita value used is varied depending on the allocation
21
principle, but typically ranges between 0.5 and 2.0 tCO2/capita
over the period 2020 to 2050. For the distribution termDi,te we
introduce the primary Egalitarian emission allocation
principle shown in Table 1. This allows us to distributeCt
evenly across countries with below average per capita
emissions, consequently allowing per capita emissions to
converge on the global RCP2.6 average. Di,te takes the form:
Di,te =
Pi,t
∑i
ne
Pi,t
,
where Di,te is equal to the population of country i at year t,
relative to the total population of all countries ne that
qualify for the increase in emissions. For this case, in
calculating the GDP-based principle, the model assumes that
unit GDP increases are proportional to the 2010 world averaged
ratio of GDP to CO2 emissions from fossil fuel use. We assume
that increasing allowable emissions either increases fossil
fuel use proportional to the aforementioned ratio (hence
increasing GDP through better energy access) or increases GDP
due to a form of carbon trading, as discussed in the next
section.
22
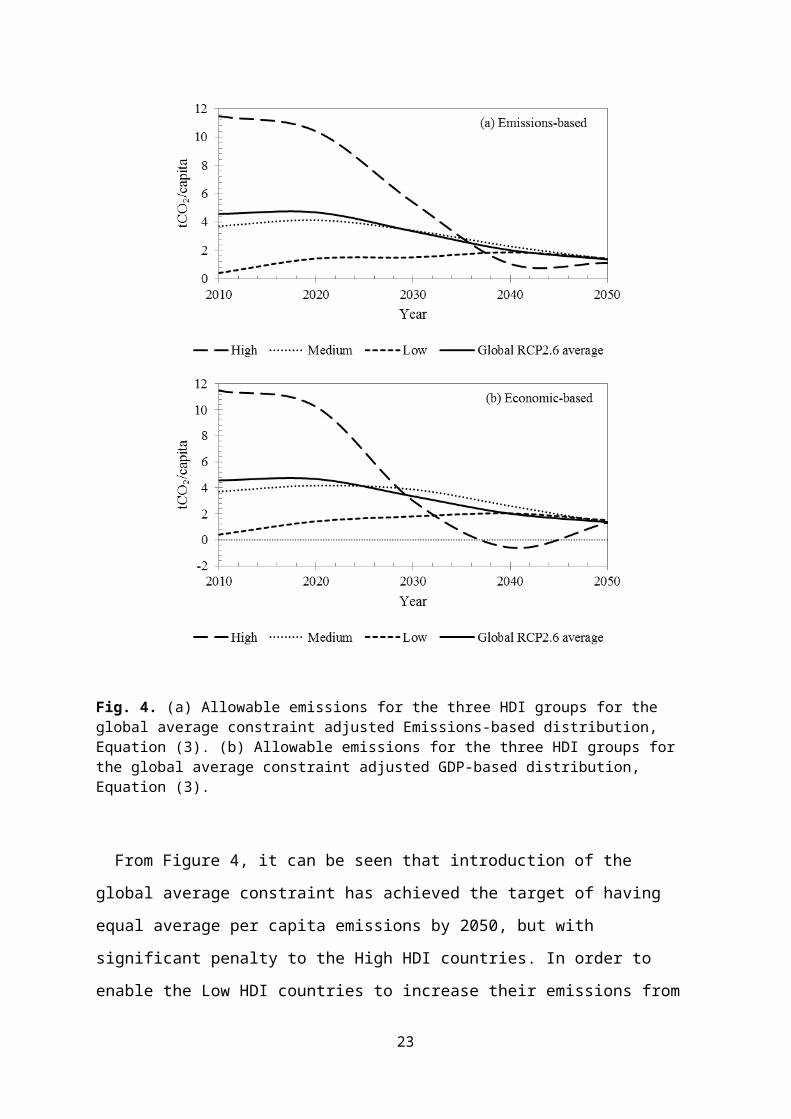
Fig. 4. (a) Allowable emissions for the three HDI groups for the global average constraint adjusted Emissions-based distribution, Equation (3). (b) Allowable emissions for the three HDI groups for the global average constraint adjusted GDP-based distribution, Equation (3).
From Figure 4, it can be seen that introduction of the
global average constraint has achieved the target of having
equal average per capita emissions by 2050, but with
significant penalty to the High HDI countries. In order to
enable the Low HDI countries to increase their emissions from
23
non-CCS fossil fuels, the High HDI countries must severely
limit use of the same energy source after 2030, particularly
for the GDP-based, which shows emissions from High HDI
countries needing to go negative (eg dominant use of BECCS) to
accommodate emissions from the Low HDI countries reaching
equity with the global average. For the Emission-based
distribution, the High HDI countries must continue to limit
use of non-CCS fossil fuels to well below those of the other
two groups after 2035, although there is a capacity for a
modest per capita increase in emissions as the other two
groups converge on the global average. Looking once again at
the results for individual countries, Figure 5, the impact of
the global average constraint is directly apparent; there is a
significant shift toward a relative emission value of 1.0 by
2050. From Table 3, globally, the disparity in emissions among
individual nations has decreased significantly, particularly
for the GDP-based allocation. For the HDI country groups,
disparity has fallen for the Low and High HDI groups, but
increased for the Medium group for both allocations
principles. Thus, use of the average global constraint has
reduced the emissions disparity among individual countries at
a global level, but at the cost of increased emissions
disparity for the Medium HDI countries. Further, while global
emissions disparity is lowest for the GDP-based allocation,
the reductions required by the High HDI countries in the
decade before 2050 are much greater than required for the
Emissions-based allocation. The severity of the reductions
required by the High HDI countries for the GDP-based
24

allocation principle could be interpreted as having the
potential to compromise the well-being of that group in that
decade (Giddings et al., 2002).
Fig. 5. 2010 country per capita tCO2 emissions relative to theglobal average against 2050 relative missions for Emissions- and
GDP-based allocation principles the three HDI country groupsadjusted by the global average constraint.
Discussion
In addition to recognising the need for some groups to do
more than others in achieving an equitable solution to climate
change is the need to recognise that equity in emissions does
not necessarily give equity in access to energy. Just as
failure to reduce disparity in individual CO2 emissions could
limit willingness to be involved in any global emissions
25
reduction agreement, so too could failure to address equity in
access to energy.
One consequence of reducing GHG emissions while increasing
total energy supply is that the link between GHG emissions and
energy access becomes weaker; CO2 emission intensity will
decline as shown in Figure 6. This occurs because future GHG
emissions, rather than being a measure of almost all energy
consumption (fossil fuels currently provide more than 80% of
primary energy), will provide a measure of energy consumption
from non-CCS fossil fuels only. Such fuels are projected to
supply 35% of energy in 2050, falling to about 13% by 2100 in
the van Vuuren, et al. (2011a) analysis. Should per capita
emissions equalise at the required global average by 2050, use
of fossil fuels without CCS would be equivalent to only about
30 GJ/capita for all three HDI groups (assuming equal access
to the year 2050 fossil fuel mix). This value is less than 40%
of the expected average of ~80 GJ/capita primary energy
supplied by 2050; present global average primary energy supply
is about 75 GJ/capita. In High HDI countries it averages
around 192 GJ/capita, and for Low HDI, 21 GJ/capita (Table 2).
Without policy mechanisms to redress the imbalance in access
to energy that currently exists between the High and Low HDI
countries, many Low HDI countries may question the value of
participating in any global emissions agreement.
An additional consideration comes from the possible
inclusion of emission pricing mechanisms to drive GHG
reductions to RCP2.6 levels; prices as high as 160USD/tonne CO2
by 2050 have been argued as being necessary (van Vuuren, et
26

al., 2011a). If per capita energy sector emissions of Low HDI
countries were to reach the RCP2.6 global average by 2050,
their total CO2 emissions would have to increase on average
more than seven-fold from their present value of 0.4 Gt. This
represents such a large emissions growth rate that low HDI
countries may well have unused quota. One possibility would be
for them to sell their unused emission quotas in any year to
other countries, assuming that carbon markets are in place in
these countries. Selling this unused quota may well provide
more economic benefits than using their full quota. Given the
differences in per capita GDP shown in Table 2, without this
mechanism or some other form of alleviation, many Low HDI
countries would likely have little reason to join global
programs to reduce emissions.
Fig. 6. Assumed total primary energy consumption (RCP2.6) and CO2 emission intensity up to 2050. Also shown are the contributions fromnon-CCS fossil fuel and total fossil fuel energy. Source: van Vuuren, et al., 2011a.
27

Reaching a global emission agreement will also need
consideration of the difficulty in achieving a target as
ambitious as RCP2.6. As noted, the van Vuuren et al (2011a)
model achieves the RCP2.6 reductions in GHG emissions using a
combination of fossil fuel with CCS and BECCS, wider use of
renewable and nuclear power, and decreased energy (and carbon)
intensity. Given the substantial shift toward low-carbon
energy required, the importance of fossil fuel with CCS in
achieving emission reductions consistent with the RCP2.6
scenario becomes obvious, especially for High and Medium HDI
countries. In their model, by 2050 just over 30% of global
primary energy is assumed to be supplied by either fossil
fuels with CCS, or BECCS. Large scale implementation of fossil
fuel with CCS would accelerate reserve depletion, because of
its lower efficiency. There is also the prospect of greater
uptake of lower quality fossil fuels, with their higher
extraction and processing costs (IPCC, 2014; Moriarty and
Honnery, 2011; Boßmann, et al., 2012).
Failure of CCS to provide significant emission reductions
remaining low-carbon technologies, particularly renewable and
nuclear energy resources. But these may also provide less
carbon-free energy than desired. Renewable energy faces many
environmental problems, particularly as annual output
increases (Moriarty and Honnery, 2012). Nor can it be assumed
that energy returns will increase with improving technology,
as greater up-take of renewable energy will require accessing
sites with progressively lower quality resources or higher
28
environmental impact, particularly for wind (Honnery and
Moriarty, 2009).
Van Vuuren et al (2011a) project nuclear energy output is
projected to approximately double by 2050 and increase around
6-fold by 2100 with high growth rates forecast for many Medium
HDI countries. Yet nuclear’s share of world electricity output
has been declining for two decades (BP, 2014). Schneider and
Froggatt (2012) have stressed that the aging reactor fleet
means that much new construction will be needed merely to
replace retiring reactors, without expanding capacity.
Further, Dittmar (2013) has argued that future uranium
supplies cannot support for long even a modest rise in nuclear
output.
There have been energy efficiency gains in recent decades,
but they have not stemmed the steady rise in global energy use
or energy CO2 emissions (BP, 2014). Overall, then, the prospect
for technical fixes to effect deep reductions in CO2 emissions
seems poor. This is important, since if CO2 reductions were
readily made and were relatively inexpensive, the challenges
facing the achievement of RCP2.6 would largely disappear.
Instead, such technical solutions will need to be supplemented
by energy and CO2 reductions driven by lifestyle changes,
particularly in the High HDI countries. Should such changes
prove necessary, they will compound the difficulties in
achieving the RCP2.6 target that present inequality in energy
access and use brings.
An important remaining question is whether some countries
can legitimately claim exemption from emissions equality. Many
29

countries can offer plausible reasons for exemption. They can
argue that they have cold climates, with high demands for
heating energy, or alternatively, they have hot climates, and
so need more energy for air-conditioning. Or, their culture
demands high energy use, and so on.
A more compelling reason has to do with net national
emissions, taking into account imports and exports. Davis and
Caldeira (2010) have looked at global CO2 emissions from a
‘consumption-based accounting’ viewpoint. They reported that .
‘In some wealthy countries, including Switzerland, Sweden,
Austria, the United Kingdom, and France, >30% of consumption-
based emissions were imported, with net imports to many
Europeans of >4 tons CO2 per person in 2004.’ (Note that four
tonne/capita is about twice the RCP2.6 allowable global
average in 2050.) These imports of CO2 were mainly balanced by
corresponding exports from Asian countries, particularly
energy (and CO2-) intensive manufactures from China. No similar
data is available for other years, so the present analysis
could not be done with net national emissions. Clearly though,
equity in net emissions by 2050 would be a fairer allocation
solution.
Conclusions
Limiting the global average temperature increase to less than
2oC will require large reductions in GHG emissions, as shown by
30
future emissions scenarios such as RCP2.6. As well as having
the resources and technology needed to achieve this target,
countries must agree to participate in achieving the target.
Greatest participation is likely to occur when the method of
allocating future GHG emissions is perceived as equitable. For
the purpose of this investigation, we define equity as
reducing the presently large disparity in per capita emissions
so that equal per capita emissions can be achieved by 2050,
bounded by the need for global emissions to follow RCP2.6. We
have shown that an emission allocation can be achieved which
significantly reduces the global disparity in per capita CO2
emissions while limiting global emissions to those of RCP2.6.
Importantly, however, allocation methodologies based solely on
historical CO2 emissions or economic performance are unable to
reduce disparity among individual countries; indeed, globally
and particularly for countries with Medium HDI, disparity is
greatly increased.
Reducing disparity in per capita emissions requires the
recognition that countries with above average emissions must
do more to reduce their emissions than would be indicated by
history alone, so that those with below average can increase
theirs. Providing an additional mechanism (termed the global
average constraint) to enable emissions from low emitting
countries to be increased at the cost of high emitting
countries brings with it an increase in the emissions
disparity for countries with Medium HDI, but far less so than
occurs without this mechanism. A further consequence of this
approach is that High HDI countries must reduce their
31
emissions by a greater amount in the decades before 2050 for
an emissions allocation based on historical economic
performance than for one based on historical CO2 emissions. Use
of emissions trading could potentially help the economic
development of Low HDI countries, as an alternative to full
uptake of their emissions quota.
Finally, the difficulties in attaining the RCP2.6 reductions
are discussed. The favoured approach is to de-couple emission
levels from energy supply, through heavy use of CCS/BECCS,
non-carbon fuels and energy efficiency. However, these
approaches have their own problems; they are unlikely to be
cheap, implemented rapidly, or in some cases, even technically
feasible. Achieving the emission reductions necessary for
climate stability will likely require major lifestyle changes,
particularly in High HDI countries.
32

References
Anand R. International environmental justice: a north-south dimension. Hampshire: Ashgate Publishing, 2004.
Archer D. Fate of fossil fuel CO2 in geologic time. J Geophys Res 2005;110:1-6.
Bazilian M, Outhred H, Miller A, Kimble M. Opinion: An energy policy approach to climate change. Energy for Sustain Dev 2010:14;253-5.
Boden T, Marland G, Andres R. Global, regional, and national fossil-fuel CO2 emissions. 2010. Accessed on 2 April 2014 at (http://cdiac.ornl.gov/trends/emis/tre_glob.htm).
Boßmann T, Eichhammer W, Elsland R. Concrete paths of the European Union tothe 2°C scenario: achieving the climate protection targets of the EU by 2050 through structural change, energy savings and energy efficiency technologies. Karlsruhe: Fraunhofer Institute for Systems and Innovation Research ISI, 2012.
BP. BP Statistical review of world energy 2014. bp.com/statisticalreview: London: BP, 2014.
Cazorla, M., & Toman, M. International equity and climate change policy. Ch23 in: Toman, M. (Ed.) Climate change economics and policy. Washington D.C: Resources for the Future, 2001.
Chakravarty S, Chikkatur A, de Coninck H, Pacala S, Socolow R, Tavoni M. Sharing global CO2 emission reductions among one billion high emitters. Proc Natl Acad Sci 2009:106;11884–8.
Conference of Parties, United Nations Framework for Climate Change (COP UNFCCC). Cancun Agreement, 2010. Accessed on 24 August 2013 at (http://unfccc.int/key_steps/cancun_agreements/items/6132.php).
Conference of Parties, United Nations Framework for Climate Change (UNFCCC). Full text of the convention, 1992. Accessed on 16 July 2013at (https://unfccc.int/essential_background/convention/background/items/1350.php).
Davis SJ, Caldeira K. (2010), Consumption-based accounting of CO2 emissions. Proc Natl Acad Sci 2010:107(26);5687-92.
Dittmar, M. The end of cheap uranium. Sci of Total Environ 2013:461/462;792-798.Ekanayake P. The ability to achieve equity in climate change. Master's
thesis, Department of Mechanical and Aerospace Engineering, Monash University, 2014.
Exner A, Lauk C, Zittel W. Growth at the peripheries: distribution and regulation in a degrowth perspective. Antipode 2014. (doi: 10.1111/anti.12107).
Giddings B, Hopwood B, O’Brien G. Environment, economy and society: Fittingthem together into sustainable development. Sustain Dev 2002:10(4);187-196.
Hansen J, Sato M, Kharecha P, Beerling D, Berner, R, Masson-Delmotte V, et al. Target atmospheric CO2: where should humanity aim? Open Atmos SciJ 2008:2; 217-231. (arXiv:0804.1126 [physics.ao-ph]).
33
Höhne N, den Elzen M, Escalante D. Regional GHG reduction targets based oneffort sharing: a
comparison of studies. Clim Policy 2014:14;122-47.Honnery D, Moriarty P. Estimating global hydrogen production from wind.
Intl J Hydrog Energy 2009:34;727-36.International Energy Agency (IEA). CO2 emissions from fuel combustion 2012
highlights. Paris: IEA, 2012.IPCC. Climate Change 2013: The physical science basis. contribution of
working group I to the fifth assessment report of the intergovernmental panel on climate change. [Stocker TF, D Qin, G-K Plattner, M Tignor, SK Allen, J Boschung, et al. (eds.)]. Cambridge, UK: Cambridge University Press, 2013.
IPCC. Climate Change 2014: Mitigation of climate change. contribution of working group III to the fifth assessment report of the intergovernmental panel on climate change [Edenhofer O, R Pichs-Madruga, Y Sokona, E Farahani, S Kadner, K Seyboth, et al. (eds.)]. Cambridge, UK: Cambridge University Press, 2014.
Kitzes J, Wackernagel M, Loh J, Peller A, Goldfinger S, Cheng D, et al. Shrink and share: humanity’s present and future Ecological Footprint.Phil Trans Roy Soc B 2008:363;467–75.
Miguez JD, Oliveira AS. The importance of historical responsibility in the context of the international regime on climate change, 2011. Accessedon 10 June 2014 at (http://www.erc.uct.ac.za/Basic_Experts_Paper.pdf).
Mitchell JF, Lowe J, Wood RA, Michael V. Extreme events due to human-induced climate change. Phil Trans Roy Soc A 2006:364(1845);2117-33.
Morgan J, and Waskow, D. A new look at climate equity in the UNFCCC. Clim Policy 2014:14;17-22.Moriarty P, Honnery D. What energy levels can the Earth sustain? Energy
Policy 2009:37(7);2469-74.Moriarty P, Honnery D. A human needs approach to reducing atmospheric
carbon. Energy Policy 2010:38(2);695-700.Moriarty P, Honnery D. Rise and Fall of the Carbon Civilisation. London:
Springer, 2011.Moriarty P, Honnery D. What is the global potential for renewable energy?
Renew & Sustain Energy Revs 2012:16(1);244-52.Moriarty P, Honnery D. Future Earth: Declining energy use and economic output. Foresight (2014):16(6);512-26. Müller B. Varieties of distributive justice in climate change. Clim Change 2001:48(2-3);273-288.New M, Liverman D, Schroder H, Anderson K. Four degrees and beyond:The
potential for a global temperature increase of four degrees and its implications. Phil Trans Roy Soc A 2011:369;6–19.
Organization for Economic Cooperation and Development (OECD). OECD environmental outlook to 2050. Paris: OECD, 2012. Accessed on 7 June 2014 at (http://dx.doi.org/10.1787/9789264122246-en).
Pardee Centre. International futures at the Pardee Center, 2013. Accessed on 16 June 2013 at (http://www.ifs.du.edu/).
Pierrehumbert R. Cumulative carbon and just allocation of the global carboncommons. Chicago J Intl Law 2013:13(2);527-48.
34

Schneider M, Froggatt A. 2011-2012 world nuclear industry status report. Bull Atom Sci 2012:68(5);8-22.
Singer, P. Ethics and climate change: A commentary on MacCracken, Toman andGardiner. Environ Values 2006:15;415-22.
Sovacool BK. The political economy of energy poverty: a review of key challenges. Energy for Sustain Dev 2012:16;272-82.
Sovacool BK. The complexity of climate justice. Nature Clim Change 2013:3;959-960. (doi:10.1038/nclimate2037).
Thomas D, Twyman C. Equity and justice in climate change adaptation amongstnatural-resource-dependent societies. Glob Environ Change 2005:15(2);115-24.
United Nations (UN). Human development indicators, 2012. Accessed on 10 June 2013 at (http://hdrstats.undp.org/en/indicators/103106.html).
United Nations Development Programme (UNDP). Human development report, 2013. UNDP.
UNDP. Human development index (HDI) 2015. Accessed on 11 March 2015 at (http://hdr.undp.org/en/content/human-development-index-hdi).
University of Denver. International Futures at the Pardee Center, 2013. Accessed on 16 June 2013 at (http://www.ifs.du.edu/ifs/frm_MainMenu.aspx).van Vuuren DP, Stehfest E, Elzen MG, Kram T, Vliet JV, Deetman S, et al.
RCP2.6: exploring the possibility to keep global mean temperature increase below 2⁰C. Clim Change 2011a:109;95-116. (doi: 10.1007/s10584-011-0152-3).
van Vuuren D P, Edmonds J, Kainuma M, Riahi K, Thomson A, Hibbard K, et al.(2011b). The representative concentration pathways: an overview. ClimChange 2011b:109;5-31. (doi: 10.1007/s10584-011-0148-z).
Willems P, Vrac M. Statistical precipitation downscaling for small-scale hydrological impact investigations of climate change. J Hydrol 2011:402(3-4):193-205.
Winkler H, Rajamani L. CBDR & RC in a regime applicable to all. Clim Policy2014:14;102-21.
Zhang Y, Shi H-L. From burden-sharing to opportunity-sharing: unlocking theclimate negotiations. Clim Policy 2014:14;63-81.
35