Equilibrium and Growth Morphology of Oligoacenes: Periodic Bond Chains (PBC) Analysis of Tetracene...
8
Published: August 05, 2011 r2011 American Chemical Society 4639 dx.doi.org/10.1021/cg200924m | Cryst. Growth Des. 2011, 11, 4639–4646 ARTICLE pubs.acs.org/crystal Equilibrium and Growth Morphology of Oligoacenes: Periodic Bond Chains (PBC) Analysis of Tetracene Crystal Francesco Roberto Massaro,* ,† Massimo Moret, † Marco Bruno, ‡ Marco Rubbo, ‡ and Dino Aquilano ‡ † Dipartimento di Scienza dei Materiali, Universit a di Milano Bicocca, via R. Cozzi 53, I-20125 Milano, Italy ‡ Dipartimento di Scienze Mineralogiche e Petrologiche, Universit a di Torino, via Valperga Caluso 35, I-10125 Torino, Italy b S Supporting Information 1. INTRODUCTION Organic π-conjugated organic molecules are intensively in- vestigated in order to ascertain whether they can represent a valid substitute for inorganic semiconductors. 14 Studies on these organic materials involve both single crystals and thin films, allowing researchers to study the material’s intrinsic properties and the possibility to build fully operating devices, respectively. In this respect, one of the most critical issues is crystal morphol- ogy, that is, the collection of faces that bound the macro- or microcrystalline samples. In fact, surface properties and crystal morphology are both relevant in determining the material’s manipulability and its potential exploitation. For example, the film morphology of the donor/acceptor heterostructures used in most organic photovoltaics is a critical variable that rules both the performance of new materials obtained in the lab and the efforts to move them to factory-scale production. Although efficiencies of organic solar cells have improved significantly in recent years, very few accurate studies on crystal morphology were performed, and the morphological optimization of these materials mainly occurs by trial and error. Moreover, morphology can heavily hamper the practical study or use of a selected molecule because of unavailability of suitable faces for studying anisotropy of physical properties of single crystals or due to performance degradation in thin films, for example, charge carrier mobilities dependence upon grain boundaries. In the case of thin films the physicochemical situation is even more complicated due to the presence of a suitable (organic or inorganic) substrate with its own interactions (epitaxial or not) with the organic semicon- ductor crystalline phase. Therefore, the extensive work dedicated in recent years to organic semiconductors includes improved methods to grow high-quality single crystals and thin films. This step necessarily requires a deep knowledge of the intrinsic properties of the material, first of all the role exerted by the crystal structure on determining the final morphology. Recently, a few papers have dealt with the simulation of crystal morphology and surface energies for some organic semiconductors belonging to the oligoacenes, oligothiophenes, and polyphenylenes classes. 58 The most recent paper 8 treated surface energy and equilibrium crystal morphology of an extensive series of molecules covering several oligomers for each of the cited three chemical classes. It analyzes the crystals by means of the density-functional theory, including nonlocal correlations, to account for the van der Waals interactions. However, despite the highly sophisticated compu- tational methods used to treat the weak intermolecular interac- tions, the aforementioned approaches for determining the equilibrium crystal morphologies are heavily biased by an a priori choice of few low indexes crystal faces. This strong assumption leads to quite simple predicted morphologies for all the different classes of compounds. At variance, we report here the results of a Received: July 18, 2011 Revised: August 5, 2011 ABSTRACT: The athermal equilibrium and growth shapes of tetracene crystal were calculated, in a vacuum, by using com- puter codes (CSEHP, GULP, and TINKER) along with three different sets of empirical potentials (UNI, UFF, and MM3 force fields). The surface profiles were obtained by applying the HartmanPerdok method of the periodic bond chains (PBC). The specific surface and attachment energy values were calcu- lated, both for ideal and relaxed surface profiles. From calcula- tions, it follows that the equilibrium shape of tetracene shows a nearly barrel habit: one form, the {001}, rules over the other ones, and several faces roughly belong to the zone axis perpen- dicular to the dominant form. Concerning the growth morphol- ogy, a plate-like habit with the dominant pinacoid is obtained. An excellent agreement among the three force fields employed was observed. A relevant result emerging from this work is the observation that surface relaxation in general weakly affects surface and attachment energies of molecular crystals.
Transcript of Equilibrium and Growth Morphology of Oligoacenes: Periodic Bond Chains (PBC) Analysis of Tetracene...

Published: August 05, 2011
r 2011 American Chemical Society 4639 dx.doi.org/10.1021/cg200924m | Cryst. Growth Des. 2011, 11, 4639–4646
ARTICLE
pubs.acs.org/crystal
Equilibrium and Growth Morphology of Oligoacenes: Periodic BondChains (PBC) Analysis of Tetracene CrystalFrancesco Roberto Massaro,*,† Massimo Moret,† Marco Bruno,‡ Marco Rubbo,‡ and Dino Aquilano‡
†Dipartimento di Scienza dei Materiali, Universit�a di Milano Bicocca, via R. Cozzi 53, I-20125 Milano, Italy‡Dipartimento di Scienze Mineralogiche e Petrologiche, Universit�a di Torino, via Valperga Caluso 35, I-10125 Torino, Italy
bS Supporting Information
1. INTRODUCTION
Organic π-conjugated organic molecules are intensively in-vestigated in order to ascertain whether they can represent a validsubstitute for inorganic semiconductors.1�4 Studies on theseorganic materials involve both single crystals and thin films,allowing researchers to study the material’s intrinsic propertiesand the possibility to build fully operating devices, respectively.In this respect, one of the most critical issues is crystal morphol-ogy, that is, the collection of faces that bound the macro- ormicrocrystalline samples. In fact, surface properties and crystalmorphology are both relevant in determining the material’smanipulability and its potential exploitation. For example, thefilm morphology of the donor/acceptor heterostructures used inmost organic photovoltaics is a critical variable that rules both theperformance of new materials obtained in the lab and the effortsto move them to factory-scale production. Although efficienciesof organic solar cells have improved significantly in recent years,very few accurate studies on crystal morphology were performed,and the morphological optimization of these materials mainlyoccurs by trial and error. Moreover, morphology can heavilyhamper the practical study or use of a selected molecule becauseof unavailability of suitable faces for studying anisotropy ofphysical properties of single crystals or due to performancedegradation in thin films, for example, charge carrier mobilitiesdependence upon grain boundaries. In the case of thin films thephysicochemical situation is even more complicated due to thepresence of a suitable (organic or inorganic) substrate with its
own interactions (epitaxial or not) with the organic semicon-ductor crystalline phase.
Therefore, the extensive work dedicated in recent years toorganic semiconductors includes improved methods to growhigh-quality single crystals and thin films. This step necessarilyrequires a deep knowledge of the intrinsic properties of thematerial, first of all the role exerted by the crystal structure ondetermining the final morphology. Recently, a few papers havedealt with the simulation of crystal morphology and surfaceenergies for some organic semiconductors belonging to theoligoacenes, oligothiophenes, and polyphenylenes classes.5�8
The most recent paper8 treated surface energy and equilibriumcrystal morphology of an extensive series of molecules coveringseveral oligomers for each of the cited three chemical classes. Itanalyzes the crystals by means of the density-functional theory,including nonlocal correlations, to account for the van der Waalsinteractions. However, despite the highly sophisticated compu-tational methods used to treat the weak intermolecular interac-tions, the aforementioned approaches for determining theequilibrium crystal morphologies are heavily biased by an a priorichoice of few low indexes crystal faces. This strong assumptionleads to quite simple predicted morphologies for all the differentclasses of compounds. At variance, we report here the results of a
Received: July 18, 2011Revised: August 5, 2011
ABSTRACT: The athermal equilibrium and growth shapes oftetracene crystal were calculated, in a vacuum, by using com-puter codes (CSEHP, GULP, and TINKER) along with threedifferent sets of empirical potentials (UNI, UFF, and MM3force fields). The surface profiles were obtained by applying theHartman�Perdok method of the periodic bond chains (PBC).The specific surface and attachment energy values were calcu-lated, both for ideal and relaxed surface profiles. From calcula-tions, it follows that the equilibrium shape of tetracene shows anearly barrel habit: one form, the {001}, rules over the otherones, and several faces roughly belong to the zone axis perpen-dicular to the dominant form. Concerning the growth morphol-ogy, a plate-like habit with the dominant pinacoid is obtained. An excellent agreement among the three force fields employed wasobserved. A relevant result emerging from this work is the observation that surface relaxation in general weakly affects surface andattachment energies of molecular crystals.

4640 dx.doi.org/10.1021/cg200924m |Cryst. Growth Des. 2011, 11, 4639–4646
Crystal Growth & Design ARTICLE
classical analysis based on the periodic bond chain (PBC) theoryafter Hartman and Perdock,9�11 assisted by simple and compu-tationally cheap empirical atom�atom potentials. This approachallowed us to thoroughly analyze and classify the intermolecularinteractions together with the character of crystal faces accordingto the PBC theory, eventually leading to a prediction of theequilibrium but also of the growth crystal morphology. As a firstcase study, we chose the classical organic semiconductor tetra-cene which is among the most studied organic systems for itssemiconductor performance. As a corollary, some suggestionsare presented for general application of the proposed method tomolecular crystals.
2. COMPUTATIONAL DETAILS
We made use of different computer codes along with three differentsets of empirical potentials for verifying the adequacy of the performedcalculations, thus obtaining different energetic quantities that are not allavailable from experiments. The choice of the adopted force fields wassuggested by the necessity to operate with potential functions of generaleffectiveness, since their parameters were obtained by fitting data for avariety of organic compounds. The three codes adopted are describedimmediately below.2.1. CSEHP. The crystal site energy according to Hartman and
Perdok (CSEHP)12,13 program is a homemade code. It allows one toobtain a range of noteworthy quantities concerning every kind of crystal,for example, the lattice energy, the specific surface energy (γhkl) of a{hkl} crystal form, the {hkl} slice energy, the attachment energy (Eatt
hkl),the specific edge energy (Fuvwhkl ) along a [uvw] crystal direction on a given(hkl) face, the adsorption energies on surfaces or edges, and the endchain energy (ECE) for each periodic bond chain (PBC) of the crystal.
We chose to include in our code theUNI14,15 force field, principally tocalculate the molecular interactions, the ECE of the PBCs, and the γhklvalues.
The ECE is the energy released when a molecule enters, in acrystallographic position, at one end of a semi-infinite PBC. As anexample, for a given PBC made by the sequence of building units ...ABABAB...:
ECE ¼ 1=2½1=2ðEPBC þ EABÞ þ EBU�where- EPBC represents the interaction energy between the AB pair and theremaining part of the semi-infinite chain
- EAB is the interaction energy between two consecutive buildingunits (A and B)
- EBU is the formation energy of the considered building unit.
Hence, the ECE values rank the hierarchy of the strength of the PBCsof a crystal.
Within CSEHP, a crystal is built from a stacking of slices of dhklthickness fulfilling the systematic extinction rules due to the crystal spacegroup. To calculate a given γhkl value, CSEHP divides the crystal in twoparts, along a given profile of the face. The lower part is a semi-infinitecrystal, while the upper part is made by a semi-infinite column whosebasis coincides with the two-dimensional (2D) elementary cell of the dhklslice whose area is Ahkl.
If Ej represents the interaction energy between the content of the firstupper unit cell with the jth underlying dhkl layer, it is easy to show that thespecific surface energy reads:
γhkl ¼ ðE1 þ 2E2 þ 3E3 þ :::Þ=2Ahkl ¼ ∑∞
j¼ 1ðjEjÞ=2Ahkl
Only the unrelaxed surface energies are calculated, as CSEHP does notallow the optimization of the surface structure.
2.2. GULP. Other calculations, mainly optimizations of slab geome-tries and surface energy estimates, were carried out by using the UFF16
molecular potentials implemented in the General Utility Lattice Pro-gram (GULP 3.4)17 simulation code. In turn, this is based on force fieldmethods and allows foreseeing both structures and properties of crystalsfrom a given set of potentials.
Bulk and slab geometry optimizations were performed by means ofthe Newton�Raphson method and were considered converged whenthe gradient tolerance and the function tolerance (gtol and ftol adimen-sional parameters in GULP) were smaller than 0.0001 and 0.00001,respectively.
All the surfaces were studied by using the 2D-slab model;18 hkl slabsof varying thickness were generated by separating the bulk structurealong the plane of interest. Calculations were performed by consideringthe original 1� 1 surface cell and the slab subdivided into two regions:
- region 1, containing both the surface and the underlying layers thatare allowed to relax
- region 2, having the same number of layers as region 1 andcontaining the rest of the slab material where no relaxation, withrespect to the bulk crystal structure, is assumed to occur.
Calculations were done by considering slabs with thickness up to 12layers (six for each region), which are sufficient to reproduce bulk-likeproperties at the center of the slab and to obtain a careful description ofthe surface.
According to the standard two-regions strategy19 employed byGULP, γhkl values were evaluated from the energy of the surface block(Us, region 1) and the energy of a portion of bulk crystal (Ub, region 2)containing the same number of atoms as the surface block. Both energieshave been referred to Ahkl, the common surface area of the primitive unitcell:
γhkl ¼ ðUs � UbÞ=Ahkl
Evaluating the surface energy values and successively applying theGibbs�Wulff theorem20 allows us to draw the theoretical equilibriumshape (ES) of a crystal. The attachment energy, Eatt
hkl, is on the contraryneeded to predict the theoretical growth shape of a crystal. This is theenergy released when a stoichiometric layer ofmaterial is added on to thesurface cut:
Ehklatt ¼ Un þ 1tot � Un
tot � U1tot
where Utotn represents the total internal energy of a surface model
consisting of n growth layers, and Utot1 is the energy of the growth layer
alone. In practice, the calculation of this exothermic quantity is obtainedfrom the interaction energy of the growth layer at the surface with therest of the underlying structure. While the attachment energy can beobtained from a single calculation, the surface energy arises from amultistage process, the progressive addition of layers until convergenceof γhkl is reached.2.3. TINKER.The last set of our simulations were based on theMM3
force field21,22 and were carried out with the TINKER 4.2 molecularmodeling package23 which allows optimization of slab geometries andsurface energy calculations. The Newton minimization was used with arms gradient equal to 0.0001 kcal mol�1 �1 and a 45 Šcutoff value forthe van der Waals interactions.
The lattice parameters were optimized by means of the Xtalminprogram included in the TINKER package. The surfaces were obtainedby cutting the optimized bulk structure, according to the hkl planes ofinterest, and the calculations were performed by adopting simple 1 � 12D surface cells. No supercells have been used in our calculations.
The 3D slab model we used consists of slabs of selected thicknessstacked along a given direction and separated by vacuum gaps largeenough for the van der Waals interactions between slabs to be negligible(i.e., beyond the cutoff value). For the calculation of the γhkl, we adopted
4641 dx.doi.org/10.1021/cg200924m |Cryst. Growth Des. 2011, 11, 4639–4646
Crystal Growth & Design ARTICLE
the relation:
γhkl ¼ ðEs � EbÞ=2Ahkl
where Es is the optimized slab energy, Eb is the energy of an equivalentnumber of fixed bulk molecules andAhkl is the area of the 2D surface cell.The thickness of the hkl slabs was progressively increased until the γhklvalue reached convergence.
3. METHODOLOGY
In this study, we used the PBC analysis, in the sense ofHartman and Perdok,9�11 which essentially consists of localizing[uvw] crystallographic directions characterized by strong interac-tions between growth units (represented bymolecules in our case).Such directions determine the character of the {hkl} forms,influencing in this way the morphology of a crystal.10 It is worthrecollecting that the character of a {hkl} form can be defined as F(flat), when at least two PBCs run in a slice of thickness dhkl allowedby the extinction rules; S (stepped), if only a PBC runs within a dhklslice; K (kinked), when no PBC can be found in the dhkl slice.
Our computational path is developed as follows:1. Evaluating the Molecular Interactions within the Crys-
tal Bulk. This is achieved by coupling the CSEHP code and theUNI force field. CSEHP allows us to quantify the weak van derWaals interactions among pairs of molecules and to identify the[uvw] directions joining their centers of mass. These energyvalues, once evaluated, can be graded in different orders ofmagnitude (“bond orders” hereafter) starting from the mostattractive interaction. Concerning tetracene crystal, morpholo-gies were drawn by considering only the first two bond orders:- First bond order, from the strongest interaction down to theone representing 10% of the highest interaction energy;
- Second bond order, from 10% down to 1% of the highestinteraction energy.
On this ground, it is possible to build a bond order graph, thatis, a simplified representation of the crystal structure in whichsmall spheres stand for the molecules and lines connecting thespheres represent molecular interactions.2. Evaluating the PBCs in the Crystal Structure. Starting
from the “bond order graph” two steps assisted by moleculargraphics programs allowed us toi) verify the existence of PBCs along the directions identified
by strong molecular bonds and obeying the criterion that
every PBC has to be made of repetitive stoichiometric unitsand cannot have a dipole moment perpendicular to its owndevelopment axis;
ii) look for those PBCs built by more than one stronginteraction; in this case, the direction of the PBC doesnot coincide with that of the bonds.
Once all the likely PBCs are detected, ECEs are calculated bymeans of CSEHP, after which a hierarchy based on the ECEorder of magnitude is made (from now on “PBC rank”).3. Classifying the {hkl} Forms According to Their Character
and Calculating Surface and Attachment Energies. All {hkl}forms that originate from the PBCs just identified must be classifiedas F, S, or K. Therefore, starting from the first PBC rank, F1, S1, andK1 forms appear, followed by lower ranks, F2/S2/K2, F3/S3/K3, etc.Then, the specific surface energies are calculated by means
of the chosen potentials. Finally, utilizing the Gibbs�Wulff’s
Table 1. The Molecular Interactions Issued from the FirstTwo Bond Orders in Tetracenea
bond
order
molecule
label
molecule
label
distance
[Å] direction
interaction
[kJ/mol]
bond
label
1 1 2 4.773 [1 1 0] �41.6 a
1 1 2 5.125 [1 1 0] �39.1 b
1 1 1 6.057 [1 0 0] �25. 7 c
1 1 2 12.192 [1 1 2] �6.0 d
1 1 1 13.436 [1 1 1] �5.1 e
1 1 2 13.308 [3 1 2] �4.4 f
2 1 1 7.838 [0 1 0] �3.1 g
2 1 1 12.553 [1 0 1] �1.7 h
2 2 2 13.612 [0 1 1] �1.3 i
2 1 2 9.626 [3 1 0] �1.3 j
2 1 2 10.155 [3 1 0] �1.1 k
2 1 1 13.010 [0 0 1] �0.7 l
2 1 2 15.151 [1 3 2] �0.4 maThe calculations were performed by means of program-potentialCSEHP-UNI.
Table 2. PBC End Chain Energies (ECE) Limited to the FirstBond Order Falling into Two PBC Ranksa
PBC PBC rank bonds ECE [erg/molecule]
[1 0 0]* 1 a + b �1.11� 10�12
[1 1 1]* 1 b + d �4.27� 10�13
[0 1 0] 1 a + b �4.02� 10�13
[1 1 0]* 1 a �3.66� 10�13
[0 0 1] 1 b + d �3.57� 10�13
[1 1 0]* 1 b �3.43� 10�13
[1 0 1] 2 a + d �7.97� 10�14
[0 1 1] 2 a + d �6.91� 10�14
[1 1 2]* 2 d �5.00� 10�14
[2 1 2] 2 d + f �5.00� 10�14
[2 0 1] 2 a + f �4.39� 10�14
[3 1 2]* 2 f �3.70� 10�14
[2 1 1] 2 b + f �1.88� 10�14
aDirections corresponding to first order molecular bonds are markedwith an asterisk. The “bonds” column shows the name of the inter-molecular bonds forming the PBCs.
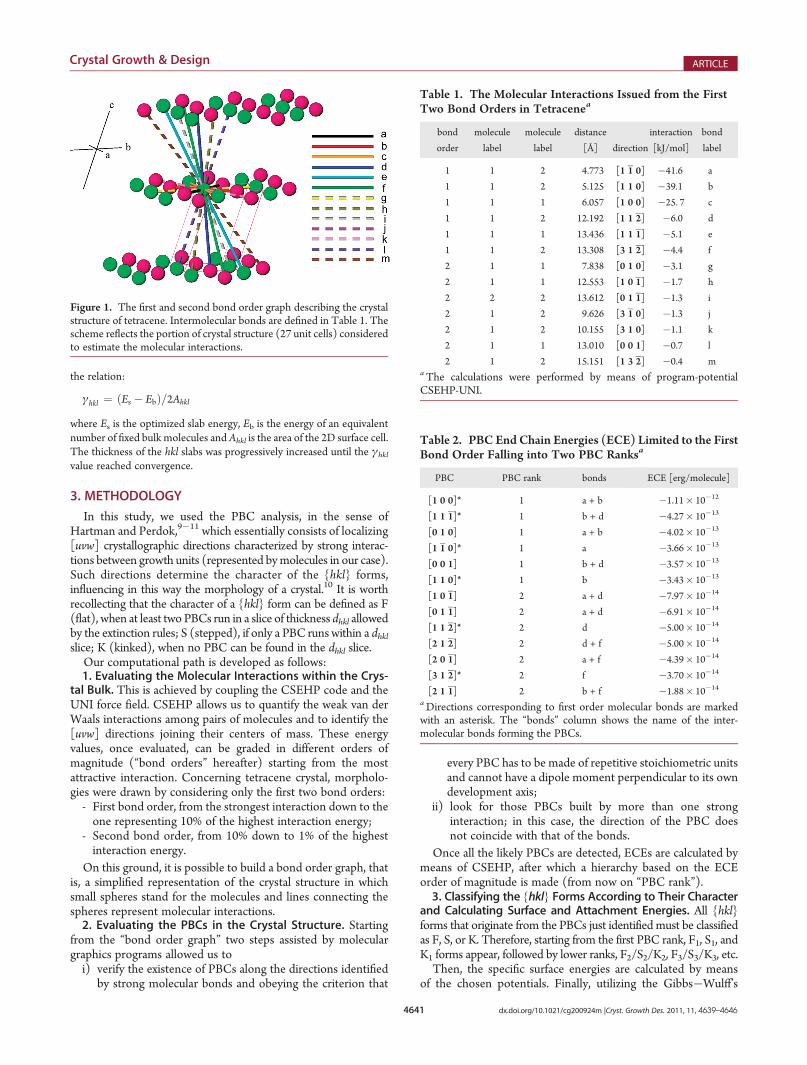
Figure 1. The first and second bond order graph describing the crystalstructure of tetracene. Intermolecular bonds are defined in Table 1. Thescheme reflects the portion of crystal structure (27 unit cells) consideredto estimate the molecular interactions.
4642 dx.doi.org/10.1021/cg200924m |Cryst. Growth Des. 2011, 11, 4639–4646
Crystal Growth & Design ARTICLE
construction, the corresponding crystal equilibrium shapes areobtained. GULP-UFF and TINKER-MM3 programs/potentialsallowed us to deal with surface relaxation to produce morerealistic morphologies to be compared to the unrelaxed ones.By means of CSEHP-UNI and GULP-UFF, attachment energies(Eatt
hkl) can be evaluated as well, by which approximate lineargrowth rates (Rhkl) of the crystal forms can be estimated,according to the following relation:24
Rhkl � Ehklatt
Quantifying the specific edge energies is another peculiarity ofCSHEP that allows to verify the stability of a [uvw] step andpredict themorphology of the 2D islands or growth spirals on themost important crystallographic forms.
4. RESULTS AND DISCUSSION
Starting from the tetracene crystal structure (space group P1,a0 = 6.056, b0 = 7.838, c0 = 13.010 Å, R = 77.13, β = 72.12, γ =85.79�; Z = 2),25 we preliminarily quantified the interactionsamong the molecules of the primitive unit cell and thosebelonging to the first and second neighboring cells. Figure 1shows the reference first and second bond order graph fortetracene. The color of the spheres indicates the two nonsym-metry related molecules (labeled 1 and 2 in the tables) of theasymmetric unit. The bonds of interest are sketched with colored
lines and named in descending energetic and alphabetic order(Table 1).4.1. The Equilibrium Morphology. All the energy values
were classified according to their order of magnitude, by takingthe strongest bond in the structure as a landmark. In the case oftetracene, the strongest interaction is equal to�41.6 kJ/mol andis the bond between molecules 1 and 2 along the [110] direction.As a consequence, the first bond order contains values in therange between �41.6 and �4.2 kJ/mol, the second bond orderspans the interval between�4.2 and�0.4 kJ/mol, and so on. Inthis work, we chose to model first the equilibrium shapesresulting from the first bond order only and then those fromthe first plus the second bond order. In detail, the first and thesecond bond orders include 6 and 7 interactions, respectively(see Table 1).4.1.1. The First Bond Order. When considering the first order
intermolecular bonds, there are 13 PBCs in the tetracenestructure, 6 matching strong molecular directions and 7 arisingfrom a composition of more bonds. In Table 2, the ECE of thesePBCs calculated with CSEHP are reported; they comprise twoPBC ranks: six chains in the first rank and seven in the second one.Eight crystallographic forms are generated by the 6 PBCs of
the first rank. In detail, they all are F1 except the {110} which hasS1 character. The 7 PBCs of the second rank generate 17 forms, 6being F2 while the remaining 11 are S2. Table 3 shows these 25forms classified and ordered according to their PBC rank and
Table 3. Specific Surface Energies of the 25 Crystallographic Forms Determined by the First Bond Order of Tetracenea
UNI UFF MM3
character form γunrelaxed γunrelaxed γrelaxed ΔUR (%) γunrelaxed γrelaxed ΔUR (%)
F1 {0 0 1}* 81.7 83.3 82.6 �0.8 73.5 72.0 �2.0
F1 {1 1 2}* 123.8 122.4 119.3 �2.5 118.0 114.1 �3.3
F1 {1 1 0}* 125.8 126.1 123.0 �2.5 119.0 115.1 �3.3
F1 {0 1 1}* 126.6 125.2 123.3 �1.5 116.7 114.3 �2.1
F1 {0 1 0}* 143.1 141.4 138.8 �1.8 129.2 126.3 �2.2
S1 {1 1 0}* 150.8 151.9 146.6 �3.5 138.5 132.5 �4.3
F1 {1 0 1} 149.9 156.8 149.7 �4.5 139.9 136.2 �2.6
F1 {1 0 0} 162.8 171.3 166.2 �3.0 149.2 145.4 �2.5
F2 {0 2 1}* 128.6 126.3 124.3 �1.6 117.2 114.5 �2.3
S2 {1 1 3} 125.7 128.2 126.2 �1.6 119.5 116.3 �2.7
S2 {2 2 3} 131.1 130.4 127.0 �2.6
S2 {2 2 1} 129.7 131.1 128.7 �1.8 122.6 118.7 �3.2
F2 {1 1 1}* 130.3 132.0 129.6 �1.8 122.1 118.5 �2.9
F2 {1 1 1}* 134.9 134.2 130.1 �3.1 125.5 120.9 �3.7
S2 {1 3 1} 136.7 135.3 133.2 �1.6 127.6 125.2 �1.9
S2 {1 3 3} 137.5 135.8 133.5 �1.7 128.5 125.3 �2.5
S2 {1 1 1}* 134.8 137.5 133.7 �2.8 125.8 122.1 �2.9
F2 {1 2 2} 141.4 140.0 134.7 �3.8 132.2 128.6 �2.7
F2 {1 2 0} 139.3 138.7 136.4 �1.7 130.4 127.5 �2.2
S2 {1 3 0} 140.8 140.0 137.5 �1.8 131.1 128.1 �2.3
S2 {1 3 2} 143.6 141.6 138.0 �2.5 133.2 129.2 �3.0
S2 {1 1 2} 136.1 141.5 138.6 �2.0 127.2 123.4 �3.0
S2 {2 0 3} 147.4 156.1 152.1 �2.6
F2 {1 0 2} 147.7 157.5 154.4 �2.0 138.3 135.4 �2.1
S2 {2 0 1} 154.8 162.9 158.4 �2.8 143.3 139.6 �2.6aThe γ values are expressed in erg/cm2 and ordered by PBC rank and relaxed values obtained by UFF. Asterisks mark forms that enter the finalequilibrium shape. The boxes with no results indicate calculations that did not converge.
4643 dx.doi.org/10.1021/cg200924m |Cryst. Growth Des. 2011, 11, 4639–4646
Crystal Growth & Design ARTICLE
surface energy. A fairly good agreement is evident comparingvalues obtained with different force fields: the UNI and UFFpotentials give surface energies in close agreement, while theMM3 force field originates slightly lower γ values. The energydifference percentage
ΔUR ¼ ðγrelaxed � γunrelaxedÞ=γunrelaxed
between relaxed and unrelaxed surfaces is also indicated in theUFF and MM3 columns for all forms. It is worth outlining theweak relaxation suffered in general by the surfaces of tetracenecrystal: indeed,ΔUR goes fromminima of 0.8% for UFF and 2.0%for MM3 for the {001} form, to a maximum difference alwaysbelow 5%. The average ΔUR are in good agreement, being 2.3%and 2.7% for UFF and MM3, respectively.For quantitatively describing crystal morphologies, we evalu-
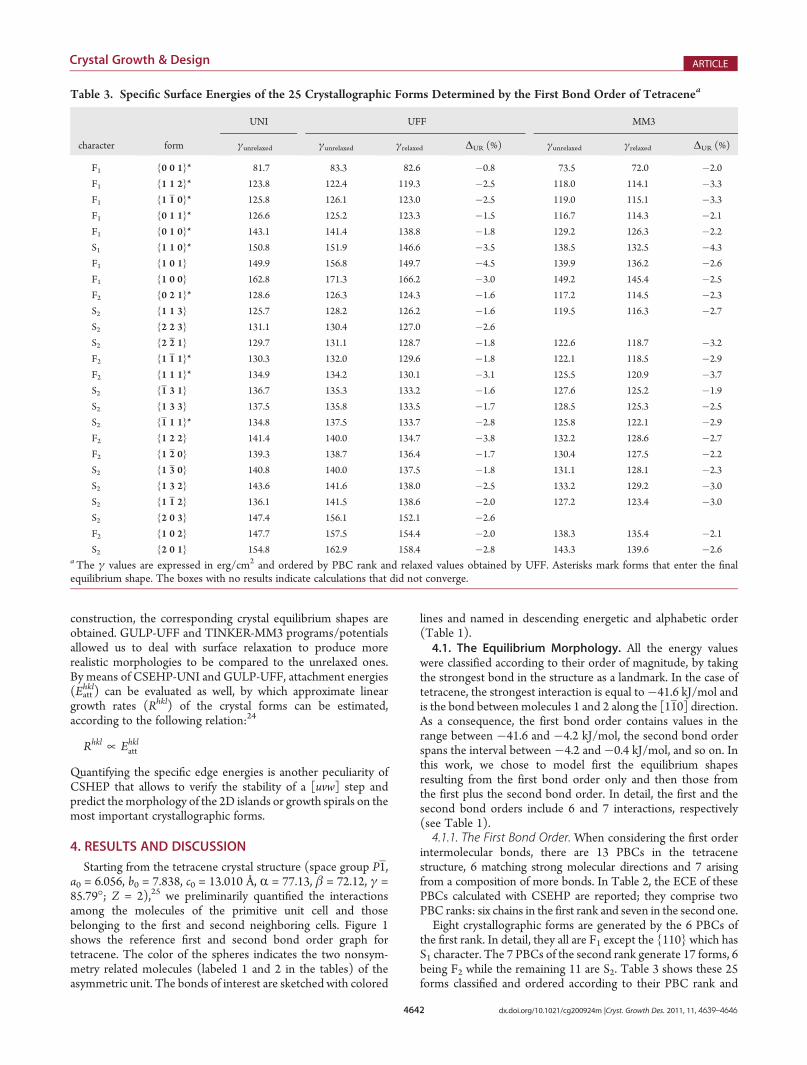
ated the morphological relevance index (MRI) for all {hkl}forms, defined as the percent ratio between the total area ofthe faces belonging to a {hkl} form and the total surface area ofthe crystal. The {hkl} forms in Table 3 marked with an asteriskare forms having MRI g 1.0% that enter the final equilibriummorphology, irrespective of the adopted force field and surfacerelaxation. Color coding of faces (green for F, yellow for S, andred for K faces) in Figures 2 and 3 clearly outlines that all forms(but the {110}) belonging to the first PBC rank exhibit an Fcharacter. When also the second PBC rank is considered, new Fforms appear together with a few narrow S forms sitting betweenF faces; this result of the PBC analysis is more evident with theUNI force field (Figure 3a). Apart from minor differences (such
as the smoothing of the edges between the main F forms),simulations performed with different force fields lead to mor-phologies that are very similar for both the index and the relativesurface area of the faces.4.1.2. The Second Bond Order. When also the second bond
order is taken into account, 7 newmolecular interactions, rangingbetween �4.2 and �0.4 kJ/mol, enter the ECE calculation.Thus, 14 more PBCs (see Table S1, Supporting Information)join the previous ones, and new 84 crystallographic forms appear.When the second bond order is considered, two new PBCs
([101] and [210]) enter the second PBC rank: as a consequence,the first PBC rank is still associated with 8 forms, while thosedetermined by the second PBC rank increase from 17 to 27. It isworth pointing out that a {hkl} form can change its character if higherbond orders are taken into account; this is the case of {110} thatswitches to F1 from S1 on moving from the first to the second bondorder. Table S2, Supporting Information resumes the first two PBCranks obtained from the first two bond orders. Comparing Table S2,Supporting Information with Table 3, the S2 faces (111), (131),(133), (130), (132), (201) and (203) change their character to F2.A first evidence ensues: the crystal equilibrium shape obtained
from the first PBC rank does not change with the bond orderconsidered (see Tables 3 and S2 and Figure 2).The overall 109 forms are completed by the appearance of faces
belonging to the third (69) and to the fourth (5) PBC rank. Welimited our calculations to γ values associated with the third PBCrank that, given the good agreement among the three differentforce fields, were solely studied by the UFF potentials (Table S3,
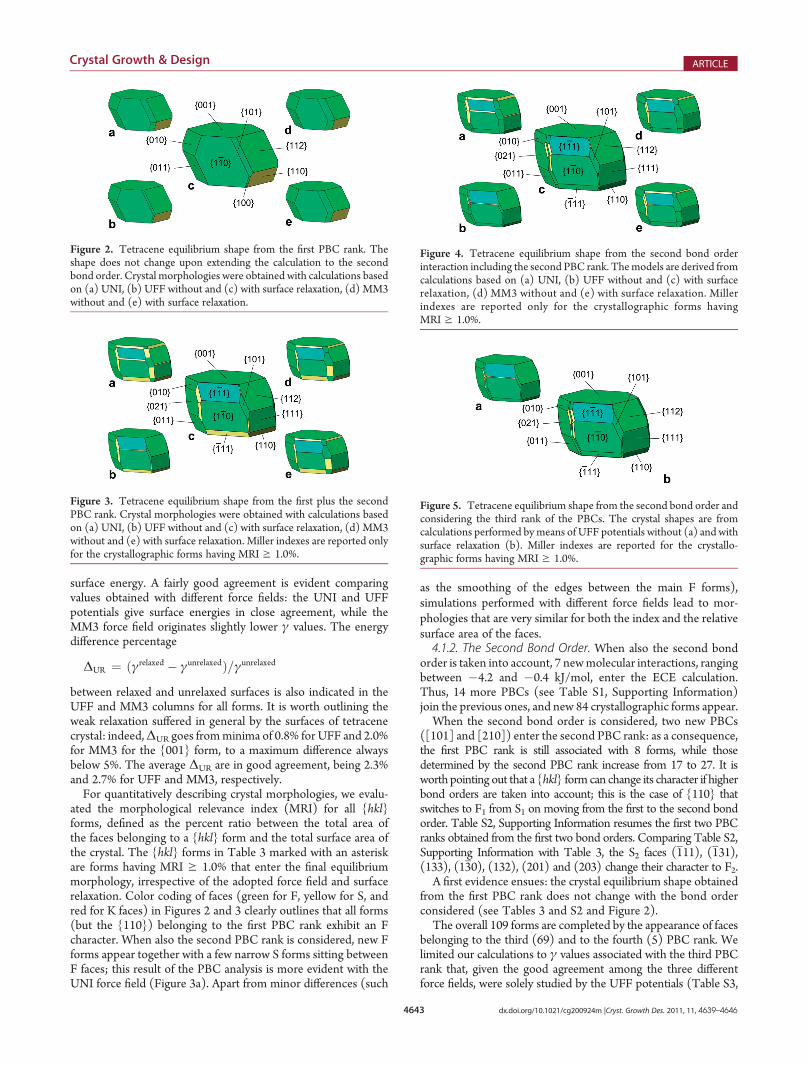
Figure 4. Tetracene equilibrium shape from the second bond orderinteraction including the second PBC rank. Themodels are derived fromcalculations based on (a) UNI, (b) UFF without and (c) with surfacerelaxation, (d) MM3 without and (e) with surface relaxation. Millerindexes are reported only for the crystallographic forms havingMRI g 1.0%.
Figure 5. Tetracene equilibrium shape from the second bond order andconsidering the third rank of the PBCs. The crystal shapes are fromcalculations performed bymeans of UFF potentials without (a) and withsurface relaxation (b). Miller indexes are reported for the crystallo-graphic forms having MRI g 1.0%.
Figure 2. Tetracene equilibrium shape from the first PBC rank. Theshape does not change upon extending the calculation to the secondbond order. Crystal morphologies were obtained with calculations basedon (a) UNI, (b) UFF without and (c) with surface relaxation, (d) MM3without and (e) with surface relaxation.
Figure 3. Tetracene equilibrium shape from the first plus the secondPBC rank. Crystal morphologies were obtained with calculations basedon (a) UNI, (b) UFF without and (c) with surface relaxation, (d) MM3without and (e) with surface relaxation. Miller indexes are reported onlyfor the crystallographic forms having MRI g 1.0%.
4644 dx.doi.org/10.1021/cg200924m |Cryst. Growth Des. 2011, 11, 4639–4646
Crystal Growth & Design ARTICLE
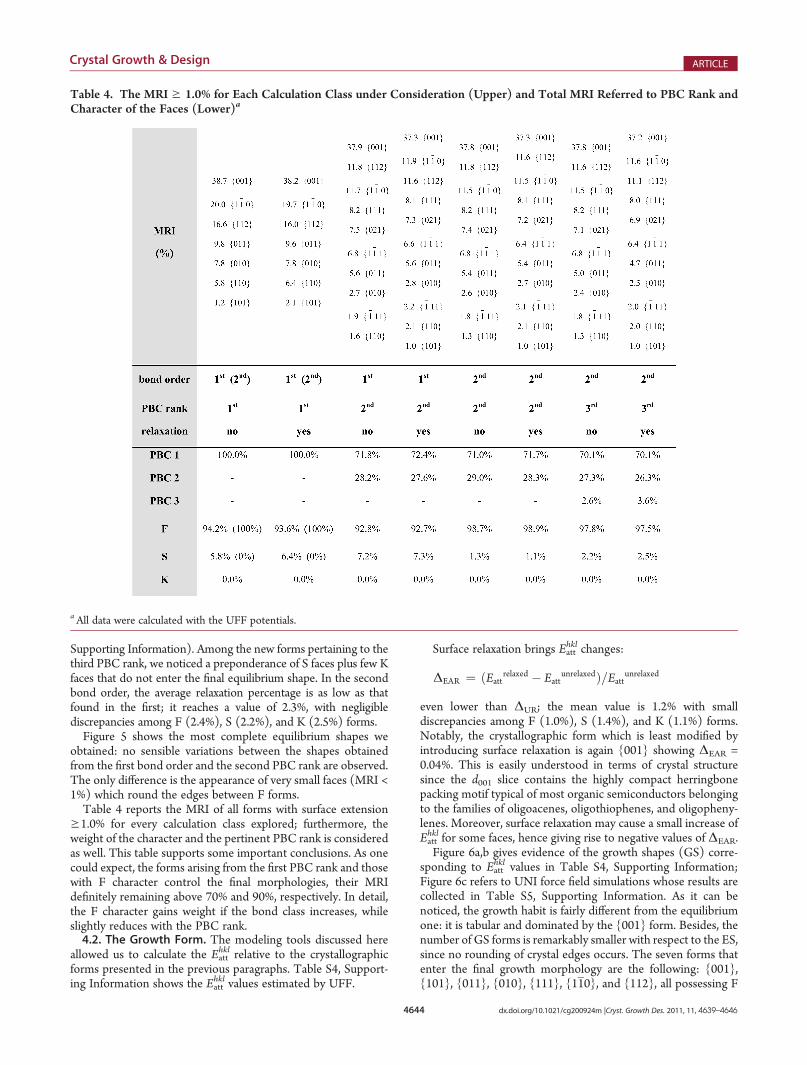
Supporting Information). Among the new forms pertaining to thethird PBC rank, we noticed a preponderance of S faces plus few Kfaces that do not enter the final equilibrium shape. In the secondbond order, the average relaxation percentage is as low as thatfound in the first; it reaches a value of 2.3%, with negligiblediscrepancies among F (2.4%), S (2.2%), and K (2.5%) forms.Figure 5 shows the most complete equilibrium shapes we
obtained: no sensible variations between the shapes obtainedfrom the first bond order and the second PBC rank are observed.The only difference is the appearance of very small faces (MRI <1%) which round the edges between F forms.Table 4 reports the MRI of all forms with surface extension
g1.0% for every calculation class explored; furthermore, theweight of the character and the pertinent PBC rank is consideredas well. This table supports some important conclusions. As onecould expect, the forms arising from the first PBC rank and thosewith F character control the final morphologies, their MRIdefinitely remaining above 70% and 90%, respectively. In detail,the F character gains weight if the bond class increases, whileslightly reduces with the PBC rank.4.2. The Growth Form. The modeling tools discussed here
allowed us to calculate the Eatthkl relative to the crystallographic
forms presented in the previous paragraphs. Table S4, Support-ing Information shows the Eatt
hkl values estimated by UFF.
Surface relaxation brings Eatthkl changes:
ΔEAR ¼ ðEattrelaxed � EattunrelaxedÞ=Eattunrelaxed
even lower than ΔUR; the mean value is 1.2% with smalldiscrepancies among F (1.0%), S (1.4%), and K (1.1%) forms.Notably, the crystallographic form which is least modified byintroducing surface relaxation is again {001} showing ΔEAR =0.04%. This is easily understood in terms of crystal structuresince the d001 slice contains the highly compact herringbonepacking motif typical of most organic semiconductors belongingto the families of oligoacenes, oligothiophenes, and oligopheny-lenes. Moreover, surface relaxation may cause a small increase ofEatthkl for some faces, hence giving rise to negative values of ΔEAR.Figure 6a,b gives evidence of the growth shapes (GS) corre-
sponding to Eatthkl values in Table S4, Supporting Information;
Figure 6c refers to UNI force field simulations whose results arecollected in Table S5, Supporting Information. As it can benoticed, the growth habit is fairly different from the equilibriumone: it is tabular and dominated by the {001} form. Besides, thenumber of GS forms is remarkably smaller with respect to the ES,since no rounding of crystal edges occurs. The seven forms thatenter the final growth morphology are the following: {001},{101}, {011}, {010}, {111}, {110}, and {112}, all possessing F
Table 4. The MRI g 1.0% for Each Calculation Class under Consideration (Upper) and Total MRI Referred to PBC Rank andCharacter of the Faces (Lower)a
aAll data were calculated with the UFF potentials.

4645 dx.doi.org/10.1021/cg200924m |Cryst. Growth Des. 2011, 11, 4639–4646
Crystal Growth & Design ARTICLE
character. Their MRI, including surface relaxation, becomes 61.4,10.5, 10.2, 8.4, 4.7, 3.5, and 1.3%, respectively. Their dhkl layersinclude the strongest PBCs, namely, [100], [111], [010], [110],[001], and [110]. This means that the theoretical growth shape isyet well represented when the sole molecular interactions of thefirst order of magnitude are taken into account, as is commonlyfound in the literature.These results completely agree with the growth shape simu-
lated by Cuppen and co-workers6 who utilized the Dreiding forcefield in combination with ESP derived point charges. In the samepaper, an experimental growth morphology is reported: thetetracene crystals, grown from vapor, show a tabular habitstrongly dominated by the {001}. To our knowledge, this isthe only paper that reports the face indexing of an experimentallygrown single crystal, the great majority of the papers concerningthe deposition of thin films and nanoaggregates.
5. CONCLUSIONS
First of all, we have to underline the excellent agreementamong the three force fields employed in this work. In moredetail, we have to note a better concordance between valuesobtained by UNI and UFF, while energy values from the MM3calculations are slightly lower, on average.
The ensemble of our results for this case study led us to arguethat the equilibrium morphology of organic crystals has to befaced with great care. The a priori exclusion of forms withcomplex indexes can produce big errors when predicting themean γ value that enters the relations used to determine both 3Dand 2D nucleation frequency.26 Moreover, disregarding theexistence of such forms could definitely cause a deficit ofinformation for evaluating the adsorption of both solvent andimpurities.
Unlike ionic structures, these molecular phases are character-ized by a relevant number of stable PBCs: no chains exist withrepulsive ECE because all the molecules can establish a bondamong themselves. As a consequence, apart from the {001}, thiskind of crystal has many forms with similar specific surfaceenergies, that is to say, an equilibrium shape rich in faces. Thisimplies that the equilibrium morphology is strongly influencedby the point group. To confirm this, we have preliminary similarresults with another oligoacene, namely, pentacene, as it will beshown in a forthcoming paper.
In the case of tetracene a nearly barrel habit is produced: oneform, the {001}, rules over the other ones and several facesroughly belong to the zone axis perpendicular to the dominantform. This is not surprising since four out of the six first rankPBCs (i.e., [100], [010], [110], [110]) run within a slice of d001thickness. Some edges are more and more rounded increasingboth the bond order and the PBC rank; we foresee that therounding level of the edges could slightly increase after taking
into account the third bond order and the fourth PBC rank and soon, nevertheless leaving the general shape basically unmodified.
Concerning the character of the surfaces, we can conclude thatthe F faces largely dominate both the equilibrium and the growthmorphologies. Only a few small S faces (about 2.5% of the totalsurface area) touch the edges between F ones, while no K facesappear in the final shape. This perfectly agrees with Hartman’sthought27 about the character of the crystallographic forms innonionic crystals that turns out to be reasonable and fully validuntil now, even if faced with modern calculation facilities andgreatly improved intermolecular force fields.
Another relevant result emerging from the present paper is theobservation that surface relaxation in general weakly affectssurface and attachment energies of molecular crystals; beingconfident of this general behavior (which is apparently broken inonly very few cases,28,29 the crystal shapes do not significantlydiffer from those predicted by simply cutting the bulk structures.The same result is also of relevance for simulation of organic�organic epitaxial systems and evaluation of epitaxial relations andadhesion energies.30�33 This behavior somewhat differs fromwhat observed with ionic structures. As a matter of fact, wedemonstrated in previous works34�37 that relaxation stronglyaffects calcite and gypsum surfaces. In the case of calcite the{0001}, {0112}, and {1010} forms enter the final equilibriumshape (in a vacuum at 0 K) thanks to the geometry optimizationof surfaces, without which only the {1014} rhombohedron couldappear. For what concerns gypsum, apart from the stable {010},every face suffers a relaxation of at least 25�30% with asignificant modification of the final equilibrium shape.
One of the main goals of the present study lies in providinginformation to people who intend to simulate equilibrium andgrowth morphologies of molecular crystals. We propose a meth-odology which represents a compromise between the time ofcalculation and the reliability of the results. Our calculations, at leastabout tetracene, prove that, for the equilibrium shape, it is sufficientto consider themolecular interactions belonging to the first order ofmagnitude (with all the related PBC ranks), being aware that a fewminor faces could originate from calculations in range of the secondorder. Concerning a reasonable evaluation of the growth shape, weprove that it is sufficient to consider the strongest PBCs in thestructure, that is, those from the first bond order.
Obviously, we do not believe that these conclusions are validfor the totality of the known organic phases, but we think theycould have implications on molecular systems similar to tetra-cene, in particular, on the other members of the oligoacenes class,about which an analogous study is underway.
’ASSOCIATED CONTENT
bS Supporting Information. The molecular structure of thesix PBCs belonging to the first PBC rank, tables listing the ECE ofthe PBCs belonging to the second bond order, and specificsurface energies and attachment energies of the forms included inthe first three PBC ranks, considering the first two bond orders.This material is available free of charge via the Internet at http://pubs.acs.org.
’AUTHOR INFORMATION
Corresponding Author*E-mail: [email protected].
Figure 6. Tetracene growth shapes simulated by means of (a) UFFwithout (b) and with surface relaxation, and (c) UNI potentials.
4646 dx.doi.org/10.1021/cg200924m |Cryst. Growth Des. 2011, 11, 4639–4646
Crystal Growth & Design ARTICLE
’REFERENCES
(1) Witte, G.; W€oll, C. J. Mater. Res. 2004, 19, 1889–1916.(2) de Boer, R.W. I.; Gershenson,M. E.;Morpurgo, A. F.; Podzorov,
V. Phys. Status Solidi 2004, 201, 1302–1331.(3) Reese, C.; Bao, Z. J. Mater. Chem. 2006, 16, 329–333.(4) Anthony, J. E. Angew. Chem. Int. Ed. 2007, 46, 452–483.(5) Northrup, J. E.; Tiago, M. L.; Louie, S. G. Phys. Rev. B 2002,
66, 121404.(6) Cuppen, H. M.; Graswinckel, W. S.; Meekes, H. Cryst. Growth
Des. 2004, 4, 1351–1357.(7) Drummy, L. F.; Miska, P. K.; Alberts, D.; Lee, N.; Martin, D. C. J.
Phys. Chem. B 2006, 110, 6066–6071.(8) Nabok, D.; Puschnig, P.; Ambrosch-Draxl, C. Phys. Rev. B 2008,
77, 245316.(9) Hartman, P.; Perdok, W. G. Acta Crystallogr. 1955, 8, 49–52.(10) Hartman, P.; Perdok, W. G. Acta Crystallogr. 1955, 8, 521–525.(11) Hartman, P.; Perdok, W. G. Acta Crystallogr. 1955, 8, 525–529.(12) Aquilano, D.; Rubbo, M.; Catti, M.; Pavese, A. J. Cryst. Growth
1997, 182, 168–184.(13) Rubbo, M.; Aquilano, D. J. Cryst. Growth 1998, 194, 156–159.(14) Filippini, G.; Gavezzotti, A. Acta Crystallogr. B 1993,
49, 868–880.(15) Gavezzotti, A. Molecular Aggregation: Structure Analysis and
Molecular Simulation of Crystals and Liquids; Oxford University Press:New York, 2007.(16) Rapp�e, A. K.; Casewit, C. J.; Colwell, K. S.; Goddard, W. A., III;
Skiff, W. M. J. Am. Chem. Soc. 1992, 114, 10024–10035.(17) Gale, J. D. J. Chem. Soc. Faraday Trans. 1997, 93, 629–637.(18) Dovesi, R.; Civalleri, B.; Orlando, R.; Roetti, C.; Saunders, V. R.
In Reviews in Computational Chemistry; Lipkowitz, B. K.; Larter, R.;Cundari, T. R., Eds.; JohnWiley and Sons Inc.: New York, 2005; Vol. 21,pp 1�125.(19) Gale, J. D.General Utility Lattice Program User’s Manual; Curtin
University of Technology: Perth, Australia.(20) Kern, R. In Morphology of Crystals Part A; Sunagawa, I., Ed.;
Terra Scientific Publishing Co.: Tokyo, 1987; pp 77�206.(21) Allinger, N. L.; Yuh, Y. H.; Lii, J.-H. J. Am. Chem. Soc. 1989,
111, 8551–8566.(22) Lii, J.-H.; Allinger, N. L. J. Am. Chem. Soc. 1989, 111, 8566–8575.(23) Ponder, J. W. Tinker, Software Tools for Molecular Design,
Version 4.2, June 2004.(24) Hartman, P.; Bennema, P. J. Cryst. Growth 1980, 49, 145–156.(25) Holmes, D.; Kumaraswamy, S.; Matzger, A. J.; Vollhardt,
K. P. C. Chem.—Eur. J. 1999, 5, 3399–3412.(26) Mutaftschiev, B. The Atomistic Nature of Crystal Growth; Springer-
Verlag: Berlin, 2001; pp 223�248.(27) Hartman, P. Acta Crystallogr. 1958, 11, 459–464.(28) Hastie, G. P.; Johnstone, J.; Walker, E. M.; Roberts, K. J. J.
Chem. Soc. Perkin Trans. 2 1996, 2049–2050.(29) Overney, R. M.; Howald, L.; Frommer, J.; Meyer, E.; Brodbeck,
D.; G€untherodt, H. J. Ultramicroscopy 1992, 42�44, 983–988.(30) Haber, T.; Resel, R.; Thierry, A.; Campione, M.; Sassella, A.;
Moret, M. Physica E 2008, 41, 133–137.(31) Campione, M.; Moret, M.; Raimondo, L.; Sassella, A. J. Phys.
Chem. C 2009, 113, 20927–20933.(32) Campione, M.; Raimondo, L.; Moret, M.; Campiglio, P.;
Fumagalli, E.; Sassella, A. Chem. Mater. 2009, 21, 4859–4867.(33) Raimondo, L.; Moret,M.; Campione,M.; Borghesi, A.; Sassella,
A. J. Phys. Chem. C 2011, 115, 5880–5885.(34) Bruno, M.; Massaro, F. R.; Prencipe, M. Surf. Sci. 2008,
602, 2774–2782.(35) Bruno, M.; Massaro, F. R.; Prencipe, M.; Aquilano, D. Crys-
tEngComm 2010, 12, 3626–3633.(36) Massaro, F. R.; Bruno, M.; Aquilano, D. Cryst. Growth Des.
2010, 10, 4096–4100.(37) Massaro, F. R.; Rubbo, M.; Aquilano, D. Cryst. Growth Des.
2010, 10, 2870–2878.