EQUALS-Research-Report-2019.pdf - UNU Collections
340
1 Taking Stock: Data and Evidence on Gender Digital Equality PART ONE
-
Upload
khangminh22 -
Category
Documents
-
view
2 -
download
0
Transcript of EQUALS-Research-Report-2019.pdf - UNU Collections

1
Taking Stock: Data and Evidence on Gender Digital Equality PART ONE

2
Taking Stock: Data and Evidence on Gender Digital Equality PART ONE
REPORT OF EQUALS RESEARCH GROUP, LED BY THE UNITED NATIONS UNIVERSITYAraba Sey and Nancy Hafkin, EditorsMacau, March 2019

3
Taking Stock: Data and Evidence on Gender Digital Equality PART ONE

4
Taking Stock: Data and Evidence on Gender Digital Equality PART ONE
ABOUT THE AUTHORS
UNU The United Nations University (UNU) is a global think tank and postgraduate teaching organisation headquartered in Japan. The mission of UNU is to contribute, through collaborative research and education, to efforts to resolve the pressing global problems of human survival, development and welfare that are the concern of the United Nations, its Peoples and Member States. In carrying out this mission, UNU works with leading universities and research institutes in UN Member States, functioning as a bridge between the international academic community and the United Nations system.
UNU-CS
The United Nations University Institute on Computing and Society (UNU-CS) is a research institute at theintersections of information and communication technologies and international development (ICTD),addressing the key challenges faced by developing societies through high-impact innovations in computing and communication technologies.
EQUALS
EQUALS is a global partnership of corporate leaders, governments, non-profit organisations, communities, and individuals around the world working together to bridge gender digital inequalities. EQUALS was founded in 2016 by five partners: the International Telecommunications Union, UN Women, the International Trade Centre, GSMA, and UNU. The Partnership works to reverse the increasing gender digital divide, and to close the gap by 2030 – supporting UN Sustainable Development Goal 5 by empowering women through their use of information and communication technologies.
An action plan of data gathering, knowledge sharing, and advocacy strengthening drives the EQUALS network partnership. To achieve our goals, partners focus on three core issues: Access, Skills and Leadership. By promoting awareness, building political commitment, leveraging resources and knowledge, harnessing the capacities of partners, and supporting real action, EQUALS seeks to achieve gender digital equality and, through this, to improve the livelihoods of millions around the world.

5
Taking Stock: Data and Evidence on Gender Digital Equality PART ONE
THE EQUALS RESEARCH GROUPThe EQUALS Research Group – led by the UNU-CS – supports the work of the three EQUALS Coalitions. Composed of over 30 multidisciplinary experts in information gathering and analysis, the group focuses on:
• generating knowledge about the existence, causes, and remedies for gender digital inequalities
• motivating key stakeholder groups — including private sector companies, government departments, regulatory agencies, and academia — to collect and share gender-relevant data
INDIVIDUAL AUTHORS
Fifty-three researchers, from more than 20 member organisations and associates of the EQUALS Partnership, have contributed to this inaugural report of the EQUALS Research Group.
EDITORS
ARABA SEYis a Principal Research Fellow at UNU-CS and the focal person at UNU-CS responsible for leading the EQUALS Research Group. Her research interests include the use of ICTs in emerging economies, social inclusion, and gender and leadership in the ICT industry.
NANCY HAFKINis a renowned expert on information technology, gender, and international development. She is an associate of Women in Global Science and Technology, an international non-profit promoting women’s development of science, technology, and innovation.
EDITORIAL COMMITTEE
KWASI ANSU-KYEREMEHis a retired adjunct professor at the Department of Communication Studies, University of Ghana, Legon, with research interests in girls’ and women’s empowerment and indigenous communication systems.
ANITA VERNA CROFTSis a Senior Lecturer at the University of Washington in the Department of Communication. She serves as the Associate Director for the Communication Leadership graduate program.
RUHIYA SEWARDis a Senior Program Officer with the Technology and Innovation program at the International Development Research Centre. She oversees a portfolio of research on digital governance issues in the global South, from digital rights, data analytics and AI, to gender and the feminist internet.
CASE STUDY AND CHAPTER AUTHORS
The first part of the report was jointly authored by the EQUALS Research project team at UNU-CS. The Case Studies in Part One, as well as all chapters in Part Two, are contributions by members of the EQUALS Research Group and invited authors, as indicated.
MONICA BARBOVSCHIPh.D., is an associated researcher with the Institute of Sociology of the Romanian Academy and a member and former coordinator of the Romanian team in the EU Kids Online network. Her consulting research focuses on internet and gender issues for young people (e.g., with Cetic.br in Sao Paulo and the European Institute for Gender Equality in Vilnius).
BEI (JENNY) JUis Senior Research Assistant at UNU-CS focusing on ICTs, migration, and intercultural communication.
MICHAEL L. BESTis Associate Professor at the Sam Nunn School of International Affairs and the School of Interactive Computing at the Georgia Institute of Technology.
TINA BEYENEis assistant professor of women, gender, and sexuality studies at California State University, Northridge, concentrating on the colonial genealogy of gender-based violence in contemporary African conflict zones, transnational feminist movements, and applied research on gender, STEM, and development.
ANA BRANDUSESCU is a researcher who promotes a more inclusive and responsible use of data and technology, through research advocacy, and policy initiatives.
STEFANIA LAPOLLA CANTONIhas a master’s degree in political science from the University of São Paulo (USP). She is an information analyst for the Cetic.br, of the NIC.br.
MOON CHOI is an Associate Professor at KAIST Graduate School of Science and Technology Policy and founder-director of a research group, Aging and Technology Policy Lab (http://aging.kaist.ac.kr).

6
Taking Stock: Data and Evidence on Gender Digital Equality PART ONE
ROMINA COLMAN is a data journalist and researcher at Chicas en Tecnologia as well as a university lecturer at Pontifical Catholic University of Argentina.
VANESSA DREIER is Policy Advisor for Education and Digital Development at Deutsche Gesellschaft für Internationale Zusammenarbeit (GIZ).
STEFANIE FELSBERGER a Senior Researcher at the Access to Knowledge for Development Center, American University in Cairo, focuses on questions of access and control of data, knowledge, and technology, as well as the political economy of data and the politics of gender.
BIRGIT FRANK is Senior Policy Officer for Education at the German Federal Ministry for Economic Cooperation and Development (BMZ).
LISA FESALBON is a Visiting Research Assistant at UNU-CS. She is a Master student at the Catholic University of Leuven, Belgium.
ASHLEY FRASER is a Ph.D. student in the Information Security Group at Royal Holloway, University of London, researching formal privacy definitions for cryptographic protocols.
REMY FROST is a recent graduate of the University of New Hampshire where they studied sociology and classics. Their primary research interests include queer and trans linguistics, the politics of psychiatric diagnosis, and the phenomenology of drug addiction, with a focus on the temporal and embodied dimensions of amphetamine abuse.
HELANI GALPAYA is CEO of LIRNEasia, a pro-poor, pro-market think tank based in Colombo, Sri Lanka, promoting research-to policy-influence throughout South East Asia with local research partners.
AILEEN AGÜERO GARCÍA is a researcher at the Institute of Peruvian Studies, based in Lima, Peru, with an economics and rural development background. She leads the “After Access” survey in Latin America.
G. ANTHONY GIANNOUMIS is an Assistant Professor of Universal Design of Information and Communication Technology at Oslo Metropolitan University.
ROBERT GRUNDKE is an Economist at the OECD Economics Department (Argentina/Brazil Country Desk), focusing on international trade, development economics, and labour.
ALISON GILLWALD is the Executive Director of Research ICT Africa (RIA), an African digital policy and regulatory think-tank that works across 20 African countries. As adjunct- professor at the University of Cape Town’s Nelson Mandela School of Public Governance, she convenes a doctoral programme on digital economy and society.
CAROLINA HADAD is a programmer, computer scientist, and social innovation specialist at Chicas en Tecnologia.
SARAH HUGGETT is Analytical Services Product Manager at Elsevier, analysing research performance to help research leaders plan for the future.
SOPHIA HUYER is Gender and Social Inclusion Leader at the CGIAR Climate Change, Agriculture and Food Security Programme (CCAFS) as well as Director of Women in Global Science and Technology (WISAT). She has engaged in research and policy analysis on global gender equality issues relating to technology, innovation, and sustainable development for over 20 years.
MMAKI JANTJIES is a Senior Lecturer in Information Systems at the University of the Western Cape, focusing on research in Education Technology and the development and use of Information and Communication Technologies for Development, particularly in developing countries.
TATIANA JEREISSATI is a researcher in the area of gender with a postgraduate degree in politics, gender, and society from the Latin American School of Social Sciences (Flacso Argentina). She is the coordinator of UNESCO projects at the Regional Center for Studies on the Development of the Information Society (Cetic.br) of the Brazilian Network Information Center (NIC.br).
DON RODNEY JUNIO is a Senior Research Assistant at UNU-CS. Don’s research focus is on meaningful access and use of ICTs and analysing the social, economic, and political impacts of ICT policies and interventions.
JUHEE KANG is a Research Fellow at UNU-CS. She focuses on social science research on using ICTs for development, with thematic interests in gender, mobility, digital skills, and capacity building.
RIDHI KASHYAP is associate professor of social demography at the University of Oxford, leading a Data2X and UN Foundation-supported project on using big data to measure sustainable development and gender inequality indicators.

7
Taking Stock: Data and Evidence on Gender Digital Equality PART ONE
MARIANA LOPEZ is Advocacy Manager for the GSMA Connected Women Programme where she ensures the programme’s insights are disseminated effectively and assists with efforts to drive women’s digital and financial inclusion.
JAVIERA MACAYA is a Ph.D. student at the School of Business Administration of São Paulo of the Getulio Vargas Foundation (EAESP/FGV). She is an information analyst at Cetic.br, of the NIC.br.
MICHAEL MADAIO is a Visiting Research Assistant at UNU-CS. He is a Ph.D. candidate in the Human-Computer Interaction Institute at Carnegie Mellon University and a fellow in the IES-funded Program for Interdisciplinary Education Research, where he researches and designs educational technologies for developing contexts, and he is a Principal Investigator for the Metro21 Smart Cities Institute, where he researches the impact of machine learning on civic decision-making.
LUCA MARCOLIN is an Economist at the OECD Directorate for Science, Technology and Innovation, focusing on the links between technology, labour, and firm dynamics, as well as international trade and productivity.
MELINA MASNATTA is a researcher at Chicas en Tecnologia (M.A., Educational Technology). She is also a university lecturer at Latin American School of Social Sciences (FLACSO).
DHAVAL MODI is a Senior Research Assistant at UNU-CS with research focus on Peacebuilding and Technology.
GLORIA MUHORO is the focal point on Gender, Technology, and Innovation in the Gender, Women and Civil Society Department of the African Development Bank.
SUMAIRA NASEEM is an everyday activist, volunteer, and researcher.
SISA NGABAZA is a Senior Lecturer in the department of Women’s and Gender Studies at the University of the Western Cape in South Africa.
NNENNA NWAKANMA is Interim Policy Director at the Web Foundation who introduces herself as “Nnenna from the Internet”. She works to make sure that everyone, everywhere, can benefit from the opportunities that technology offers: coining the slogan “all of the people – all of the internet – all of the time.”
YANINA PAPARELLA is an education scientist and university coordinator at Chicas en Tecnologia.
ELIZABETH A. QUAGLIA, a cryptographer, has conducted security research in industry and academia for over ten years.
NAGLA RIZK is Professor of Economics and Founding Director of the Access to Knowledge for Development Center (A2K4D) at the School of Business, the American University in Cairo (AUC).
NANCY SALEMa Research Officer at the Access to Knowledge for Development Center, American University in Cairo, researches the social and economic implications of data and technologies in development.
KIMBERLY A. SCOTT is a professor of women and gender studies in the School of Social Transformation at Arizona State University (ASU) and the founding executive director of ASU’s Center for Gender Equity in Science and Technology (CGEST).
RANNVEIG SKJERVE is a student in the Master’s of Universal Design of Information and Communication Technology program at Oslo Metropolitan University.
MARIAGRAZIA SQUICCIARINI is a Senior Economist at the OECD Directorate for Science, Technology and Innovation, working in innovation and technological change (including Intellectual Property Rights), firm and industry dynamics and performance, global value chains, and jobs and skills.
DHANARAJ THAKUR is Research Director at the Web Foundation, leading policy research on broadband affordability, gender equity in Internet access and use, and data protection and openness, with an emphasis on low- and middle-income countries.
MARIANA VARELAis a designer at Chicas en Tecnologia (M.A., Media and Governance).
CECILIA VAZQUEZ is an education scientist, researcher, and university coordinator at Chicas en Tecnologia.
LILIAN EUNICE VOLCAN is a Research Associate of the International Gender Study Centre – Lady Margaret Hall. She advocates for the role of women in innovation and intellectual property protection as a technology transfer manager specialising in gender inclusion, capacity building, and sustainable development. She studied at the University of Oxford and has worked with the Food and Agriculture Organisation (FAO).
POONAM WATINE is an International Consultant for Market Linkages, International Trade Centre.
8
Taking Stock: Data and Evidence on Gender Digital Equality PART ONE
INGMAR WEBER is the Research Director for Social Computing at the Qatar Computing Research Institute, focusing on how big data can be used to monitor social phenomena including digital gender gaps, international migration, and income inequalities.
SABRINA M. WEISS is an interdisciplinary ethicist whose work includes gender, culture, and disability in the context of digital, embodied, and cyborg technologies. She has developed a heuristic analytical framework that examines change in sociotechnical ecologies through five overlapping dimensions.
ACKNOWLEDGEMENTS
UNU-CS is grateful to the following contributors who participated in the drafting of this report as reviewers and/or provided research, administrative, and editorial support:
All EQUALS Partnership members, Aileen Aguero, Andrea Alunni, Colleen Ammerman, Michael Best, Max Bond, Francesca Borgonovi, Agustina Callegari, Claire Sommervile, Laura Cramer, Moon Choi, Helen Croxson, Lorenzo Dalvit, Geneva Damayanti, Anne Delaporte, Kim, Eunsong, Stefanie Felsberger, Lisandra Fesalbon, Maria Garrido, Urs Gasser, Anthony Giannoumis, Nancy Hafkin, Sophia Huyer, Bei (Jenny) Ju, Sara Kingsley, Janet Kwami, Therese Littleton, Mariana Lopez, Michael Madaio, Rector David Malone, Dhaval Modi, Sisa Ngabaza, Smitha Prasad, Nancy Salem, Justine Sass, Lili Shakshi, Matthew Smith, Sharada Srinivasan, Hannah Thinyane, Mamello Thinyane, Jack Qiu, Elizabeth Quaglia, Dhanaraj Thakur, Tim Unwin, Lilian Volcan, Ursula Wynhoven, Calvin Yu, Yuchao Zhao.
This report was produced with the generous support of the German Federal Ministry of Economic Cooperation and Development.
Copyediting: Clare Wolfowitz
Layout and design: Pink Globe Design Studio
Cover design: Pink Globe Design Studio
DisclaimerThe views expressed in this publication are those of the authors from the EQUALS Research Group. They do not necessarily reflect the opinions or views of the United Nations University or other member organisations in the EQUALS Research Group.
The designations of geographical boundaries or regional categorisation mentioned in the report do not reflect any opinion on the part of the United Nations University, EQUALS Partnership or its member organisations concerning the legal status of any country, territory, area, city, or area, or of its authorities, or concerning the delimitation of its frontiers or boundaries.
Attribution: Please cite this report as follows: Sey, A. & Hafkin, N. (Eds). (2019). Taking stock: Data and evidence on gender equality in digital access, skills and leadership. United Nations University Institute on Computing and Society/International Telecommunications Union: Macau.

9
Taking Stock: Data and Evidence on Gender Digital Equality PART ONE
FOREWORD BYANTÓNIO GUTERRES
SECRETARY-GENERAL OF THE UNITED NATIONS
In today’s interconnected society, gender equality and the meaningful participation of women and girls are essential to all sectors, including digital access and skills. Without the full and equal participation of half the population, communities and societies will never reach their potential or achieve the 2030 Agenda for Sustainable Development – our blueprint for stable, resilient societies on a healthy planet. But if we are to devise and implement strategies to get us where we want to be, we must first understand where we are. We know there is a gender digital divide, but we need data and evidence that demonstrate its extent and implications.
This first report by the EQUALS Research Group fulfils that need by providing comprehensive insights on gender digital inequality, highlighting the implications of persistent gaps and the reduced, unequal and even dangerous digital experiences of women and girls compared to men and boys. It outlines the state of gender equality in access to information and communication technologies; differences between men’s and women’s digital skills; and the extent of women’s participation in digital technology industries as employees, leaders and entrepreneurs.
Its findings should urge us to make urgent investments in digital gender equality, as a foundation for all our work.
This report also highlights the importance of gender-disaggregated data to identify and monitor inequalities. Without such data, it is impossible to assess progress and the achievement of development goals.
Gender equality is one of my top priorities, shared throughout the United Nations system, and a key element of my New Technologies Strategy. The Organization is committed to enhancing gender parity and to increasing women’s political and economic participation, opportunities and leadership in all areas of society. Achievement of these goals in the tech-driven 21st century will require digital gender equality, and this report is an important addition to our knowledge base.
I thank the researchers and experts who contributed, and I encourage all stakeholders to continue to work together to achieve gender equality in digital access, skills and leadership.

10
Taking Stock: Data and Evidence on Gender Digital Equality PART ONE
TESTIMONIALS FROM EQUALS STEERING COMMITTEE
EQUALS has undertaken the critical task of examining the state of gender equality in ICT industries and pinpointing areas for action by both policymakers and practitioners. Particularly on issues of leadership, the Research Group Inaugural Report provides insights into barriers to success for women in the technology field and brings to light the key data gaps that remain to be addressed if we are to support more women and girls to enter the digital space.
Ms. Arancha González, Executive Director, International Trade Centre
Narrowing the Gender Digital Divide in the Global South is a key priority of the German Development Cooperation. We aim at increasing women’s and girls’ access to and participation in the digital world by boosting relevant education and employment opportunities. We are therefore delighted with the launch of the report, which provides insights on where we stand with our global efforts and emphasises the need to include gender awareness and analysis already in technology development.
Birgit Frank, Senior Policy Officer for Education at the German Federal Ministry for Economic
Cooperation and Development (BMZ); Vanessa Dreier, Policy Advisor for Education and Digital
Development at Deutsche Gesellschaft für Internationale Zusammenarbeit (GIZ)
The future health of our global economy depends on the empowerment of women and girls. This report highlights the depth and breadth of the existing gender gap in ICT access, skills, and leadership. Widely welcomed by the UN, interested NGOs, and private sector actors in the field, its findings set the foundation needed to build strong, evidence-based strategies to close the gap. Doing so will help improve universal gender equality and the health of the global economy, both priority agenda items for the United Nations in 2019.
Dr David M. Malone, Rector of the United Nations University, Under-Secretary-General of the UN
Research on data collection, analysis, and dissemination related to gender digital equality is necessary to achieve informed decisions at the policy level with a gender lens. This report provides an invaluable evidence-based tool essential to all stakeholders and policy makers working in the development of policies and programmes to advance the status of women and girls in the ICT sector.
Houlin Zhao, Secretary-General of the International Telecommunication Union (ITU)
The gender digital divide affects millions of women and girls worldwide, limiting their access to technology and resources, their ability to gain critical skills, and their opportunities for leadership in the tech sector. To close the gap, we need solid research into all three facets of the gender digital divide — access, skills and leadership. The EQUALS Research Group provides key insights into the problem, so that we can work together for a solution. Doreen Bogdan-Martin, Director, Telecommunication
Development Bureau, ITU
We believe the Internet is for everyone. Yet women and girls continue to face challenges that hinder them from benefiting from the opportunities the Internet provides. The reasons for this are complex, and there is no one conclusive strategy to solve it. And while studies have been conducted, more research is needed. The EQUALS Research Coalition report comes to fill this need for data and analysis by providing us with valuable insights on the challenges women face in gaining meaningful Internet access. These insights will inform our work, and the work of the larger community as well.
Joyce Dogniez, Vice President for Community Development & Engagement, Internet Society

11
Taking Stock: Data and Evidence on Gender Digital Equality PART ONE
TABLE OF CONTENTS - PART ONEABOUT THE AUTHORS 4
UNU 4
UNU-CS 4
EQUALS 4
The EQUALS Research Group 5
Individual Authors 5EDITORS 5
EDITORIAL COMMITTEE 5
CASE STUDY AND CHAPTER AUTHORS 5
Acknowledgements 8
Foreword (UN Secretary General) 9
Testimonials (EQUALS Steering Committee) 10
List of Acronyms 14
Glossary/Definitions 16
Part 1 Tables and Figures 16
Executive Summary/Key Findings 19
Key Findings on the state of gender digital equality 19
Key Findings on the state of data on gender digital equality 20
Report outline 20
References 21
1 Gender Equality in ICT Access 24
1.1 Introduction 25
1.1.1 Why is gender equality in ICT access important? 25
1.1.2 Measuring the gender divide in ICT access 26
1.2 Basic access 26
1.2.1 Computer use 27
1.2.2 Internet access 28
1.2.3 Mobile phone use 30
1.2.4 Mobile phone ownership 32
1.3 Meaningful Access 33
1.3.1 Digital financial transactions 35
1.3.2 Digital payment transactions 38
1.3.3 Accessing an account using mobile phone or the internet 39
1.3.4 Using the internet to pay bills or make purchases online 41
1.3.5 Mobile money account 42
1.4 Conclusion 44
References 44
2 Gender Equality in ICT Skills 46
2.1 Introduction 47
2.1.1 Why is it important for women tohave equal digital skills? 47
2.1.2 Measuring gender equality in digital skills 48
2.2 Basic digital skills 50
2.3 Intermediate digital skills 54
2.4 Advanced Skills: Programming 57
2.5 Pathways to develop digital skills: STEM education 58
2.5.1 Secondary Education 58
2.5.2 Technical and vocational education and training (TVET) 64
2.5.3 Higher education in STEM 65
2.5.4 Alternative pathways for high-level digital skills 68
2.6 Conclusion 74
References 74
3 Gender Equality in ICT Industry Leadership 78
3.1 Introduction 79
3.1.1 Why is women’s equal leadership in the ICT industry important? 79
3.1.2 Measuring gender equality in the ICT industry 80
3.2 Employment – Recruitment 81
3.2.1 Occupation skill levels 81
3.2.2 ICT industries and related fields 82
3.2.3 Employment in ICT professions 84
3.3 Employment – Retention and advancement 91
3.3.1 General leadership positions 91
3.3.2 Leadership positions in the ICT industry 93
3.3.3 Leadership on boards 97
3.3.4 Academies of Science 98
3.4 Entrepreneurship 99
3.4.1 Firm Ownership 99
3.4.2 Access to business training 100
3.4.3 Access to business capital 100
3.4.4 Access to venture capital 103
3.5 Policymaking 104
3.5.1 Participation in national governance 104
3.5.2 Participation in ICT-related policymaking agencies 104
3.6 Conclusion 107
References 108
4 The Dark Side of ICT Access, Skills, and Leadership 112
4.1 Introduction 113
4.2 Cyber violence against women and girls 113
4.2.1 Levels of cyber VAWG 114
4.2.2 Physical violence against women 114
4.2.3 Responding to cyber-VAWG 116
4.3 Sexual harassment 120
4.4 Discrimination 122
4.4.1 Gender pay gap 122
4.4.2 Discriminatory work environments 125
4.5 Work and life balance 128
4.5.1 Number of hours of work 128
4.5.2 Unpaid domestic and care work 129
4.5.3 Parental leave policies 131
4.6 Conclusion 134
References 134
5 Barriers to Gender Equality and Recommendations 136
5.1 Introduction 137
5.2 Barriers to ICT access 139
5.2.1 Availability of infrastructure 139
5.2.2 Financial constraints 139
5.2.3 Ability and aptitude 139
5.2.4 Interest and perceived relevance 139
5.2.5 Safety and security 139
5.2.6 Socio-cultural and institutional contexts 139
5.3 Barriers to ICT skills 140
5.3.1 Perceived ability and aptitude 140
5.3.2 Interest and perceived relevance 140
5.3.3 Safety and security 140
5.3.4 Socio-cultural and institutional contexts 140
5.4 Barriers to ICT leadership 141
5.4.1 Financial constraints 141
5.4.2 Perceived ability and aptitude 141
5.4.3 Interest and perceived relevance 142
5.4.4 Safety and security 142
5.4.5 Socio-cultural and institutional contexts 142
5.5 Recommendations 147
5.5.1 Recommendations for ICT access 150

12
Taking Stock: Data and Evidence on Gender Digital Equality PART ONE
5.5.2 Recommendations for ICT skills 152
5.5.3 Recommendations for ICT leadership 153
Conclusion 155
References 155
6 The State of Sex-disaggregated Data 160
6.1 Introduction 161
6.2 Availability of sex-disaggregated data on ICT access 164
6.2.1 Overview 164
6.2.2 Regional Summary 165
6.3 Availability of sex-disaggregated data on ICT skills 169
6.3.1 Overview 169
6.3.2 Regional Summary 171
6.4 Availability of sex-disaggregated data onICT leadership 176
6.4.1 Overview 176
6.4.2 Regional summary 178
6.5 Availability of sex-disaggregated data on the dark side of ICTs 180
6.5.1 Overview 180
6.5.2 Regional summary 181
6.6 Potential of big data 184
6.7 Conclusion 186
References 186
Appendix A: Country Profiles 188
Introduction 188
Argentina 188
Context 188
Access 188
Skills 189
Leadership 189
Conclusion 189
References 190
Indonesia 190
Context 190
Access 190
Skills 190
Leadership 190
Conclusion 191
References 191
Rwanda 192
Context 192
Access 192
Skills 192
Leadership 192
Conclusion 193
References 193
Data tables 194
Access 194
Skills 195
Leadership 196
Appendix B: Basic ICT Indicators by Gender 197
Appendix C: Individuals with ICT skills, by type of skills and gender 200
Appendix D: Sample ILO Sector and Occupation Classifications 202
TABLE OF CONTENTS - PART TWOIntroduction 205
PEOPLE
1 Gender variance and the gender digital divide 208
Abstract 209
Introduction 209
Emerging Legal Frameworks for Gender and Sexual Rights 210
Gender and Sexual Discrimination: The Leaky Education–Workplace Pipeline 211
The Rise of Cyber Threats against Gender and Sexual Minorities 211
Search Engine Algorithms and Artificial Intelligence (AI): New Frontiers of Discrimination? 212
ICTs as Empowerment Tools for Gender and Sexual Minorities 212
The Need for Data on ICT and Gender and Sexual Minorities 214
Recommendations for Practitioners and Policy Mkers 214
Recommendations for Researchers 215
References 215
2 Towards understanding the Digital Gender Gap in the Global South 220
Abstract 221
Introduction 221
Research challenges 222
Methodology 223
Comparative assessment across selection of countries in the Global South 223
Africa 226
Asia 230
Latin America 233
The ICT index for five Latin American countries 234
Explaining the ICT gender differences 235
Conclusion and recommendations 239
References 240
3 Technologies and youth: Key dimensions for investigating gender differences in internet access and use 244
Abstract 245
Introduction 245
Qualitative Research Framework on Youth, ICT and Gender: key dimensions 246
Implementing the research framework: The case of young internet users in Sao Paulo, Brazil 248
Preliminary results: brief discussion of online privacy and violence 249
Moving forward: key recommendations 250
References 250

13
Taking Stock: Data and Evidence on Gender Digital Equality PART ONE
4 Accessibility, intersectionality, and universal design: How overlapping forms of discrimination limit access to technology for women with disabilities 252
Abstract 253
Introduction 253
Marginalization and discrimination in ICT 254
Universal Design of ICT 256
Gaps in the Literature 257
Recommendations for Research and Practice 257
References 258
5 ICT in a changing climate: A path to gender-transformative food security 262
Abstract 263
Gender and Food Security in a Changing Climate 263
Climate and food security information is not reaching women 264
Designing climate information for gender empowerment 266
Conclusion and recommendations 268
References 268
SKILLS6 The role of educational institutions in closing STEM education gaps 274
Abstract 275
Introduction 275
The role of institutions of higher learning in increasing STEM female participation 275
Impact of state policy on higher education 276
Increasing female representation in STEM education 277
Conclusions and further work 279
References 279
7 The gender wage gap in the digital era: The role of skills 282
Abstract 283
A narrowing gender wage gap? 283
The gender wage gap in the digital era: the role of skills 284
An empirical assessment of the returns to skills in digital-intensive and less digital-intensive sectors 284
Conclusions and policy implications 289
References 289
8 Skills development and young women’s work in the call centre industry in South Africa 294
Abstract 295
Introduction 295
Locating South African call centres in the global economy 296
Understanding the call centre industry in South Africa 296
Women’s work in call centres and socio-economic trends 297
Skills development in the call centre industry 298
Methodology 298
Findings 299
Discussion 301
References 302
9 A gender perspective on security and privacy in the digital age 304
Abstract 305
Introduction 305
Security and privacy concerns for women in the digital age 305
Women in Information Security 306
Gendered security 307
Concluding remarks 308
References 308
PATHWAYS10 Investigating empowering narratives around women, work, and technology 312
Abstract 313
Introduction 313
Technological determinism and women 314
Experiences of women’s work with digital technology 316
Conclusion and recommendations 318
References 318
11 A gender perspective on technology transfer and wealth creation 322
Abstract 323
Introduction 323
Is technology transfer gender-neutral? 325
Can TT benefit women? 327
Recommendations for policy makers 327
References 328
12 “Hello Siri, how does the patriarchy influence you?” — Understanding artificial intelligence and gender inequality 330
Abstract 331
Introduction 331
Key concepts – How do gender and AI intersect? 332
The promises and potential for AI and gender equality 333
How AI challenges gender equality 334
Recommendations 335
Conclusions 336
References 337

14
Taking Stock: Data and Evidence on Gender Digital Equality PART ONE
EDGE Certification Economic Dividends for Gender Equality Certification
EICV Integrated Household and Living Condition Survey (Rwanda)
EIGE European Institute for Gender Equality
EU European Union
EUIPO European Union Intellectual Property Office
EUROSTAT European Statistical Office
FAO Food and Agriculture Organisation
FINDEX Global Financial Inclusion Index
FLASCO Latin American Faculty of Social Sciences
FTSE100 Financial Times Stock Exchange 100
G20 Group of Twenty
GBV Gender-Based Violence
GDP Gross Domestic Product
GEM Global Entrepreneurship Monitor
GFIC Global Female Innovation Council
GGGI Global Gender Gap Index
GIZ German Corporation for International Cooperation GmBH
GNI Gross National Income
GSA Global Sourcing Association
GSMA Groupe Spéciale Mobile Association
HIV/AIDS Human Immunodeficiency Virus/ Acquired Immune Deficiency Syndrome
IBM International Business Machines Corporation
ICT Information and Communications Technology
ICT4D Information and Communications Technology for Development
IDRC International Development Research Centre
IEA International Association for the Evaluation of Educational Achievement
IFAD International Fund for Agricultural Development
ILO International Labour Organisation
ILOSTAT International Labour Organisation Database
IMF International Monetary Fund
IP Intellectual Property
IPCC Intergovernmental Panel on Climate Change
IPU Inter-Parliamentary Union
IRCs Internet Relay Chats
ISCO International Standard Classification of Occupations
ISIC International Standard Industrial Classification
ISIC International Standard Industrial Classification of All Economic Activities
ISOC Internet Society
ITES Information Technology Enabled Services
LIST OF ACRONYMS
A2K4D Access to Knowledge for Development Center
A4AI Alliance for Affordable Internet
AACSB Association to Advance Collegiate Schools of Business
AASSA Association of Academies and Societies of Sciences in Asia
AAUW American Association of University Women
ACW Africa Code Week
AI Artificial Intelligence
APC Association for Progressive Communications
ASU Arizona State University
AUC American University in Cairo
AUTM Association of University Technology Managers
BLID Barne-, likestillings- og inkluderingsdepartementet / Ministry of Children and Equality (Norway)
BMZ German Federal Ministry for Economic Cooperation and Development
BPESA Business Process Enabling South Africa
BPO Business Process Outsourcing
BRIC Brazil, Russia, India, and China
CCAFS Climate Change, Agriculture and Food Security Programme
CEBRAP Brazilian Center for Analysis and Planning
CEDAW Convention on the Elimination of all Forms of Discrimination Against Women
CEOs Chief Executive Officers
Cetic.br Regional Centre for Studies on the Development of the Information Society
CGEST Center for Gender Equity in Science and Technology
CGIAR Consultative Group for International Agricultural Research
CITAD Centre for Information Technology and Development (Nigeria)
CompTIA Computing Technology Industry Association
CRC Culturally Responsive Computing
CSV Comma-separated value
CT Computational Thinking
DIRSI Diálogo Regional sobre Sociedad de la Información (Regional Dialogue on the Information Society)
EAESP/ FGV School of Business Administration of São Paulo of the Getulio Vargas Foundation
EAs Enumeration Areas
EDGE Evidence and Data for Gender Equality

15
Taking Stock: Data and Evidence on Gender Digital Equality PART ONE
ITU International Telecommunication Union
LDCs Least Developed Countries
LGBTQI Lesbian, Gay, Bisexual, Transgender, Queer, and Intersex
LMICs Low-and-middle-income countries
Lyxor GenderEquality ETF Lyxor Gender Equality Exchange Traded Fund
MBA Master of Business Administration
MINCYT Ministry of Science, Technology, and Innovation (Argentina)
MIT Massachusetts Institute of Technology
MOOCs Massive Open Online Courses
MSM Men who have sex with other men
MUDs Multi-user dungeons/domains
NIC.br Brazilian Network Information Centre
NRF South African National Research Foundation
OECD Organisation for Economic Co-operation and Development
OHCHR Office of the United Nations High Commissioner for Human Rights
OLS Ordinary Least Squares
ORCID Open Researcher and Contributor ID
PIAAC Programme for the International Assessment of Adult Skills
PISA Programme for International Student Assessment
POC Proof of Concept
P-RR-DIWOM Drafting Group on Discrimination against Women with Disabilities (Partial Agreement)
QLFS Quarterly Labour Force Survey
R&D Research and Development
RIA Research ICT Africa
RPGs Role-playing Games
S&P100 Standard & Poor’s 100
SADC South African Development Community
SAGA STEM and Gender Advancement (not mentioned again)
SBIR Small Business Innovation Research (United States)
SDGs Sustainable Development Goals
SEC Socio-economic level
SEL Socio-economic level
SIDA Swedish International Development Cooperation Agency
SIM Subscriber Identification Module
SMEs Small and Medium-sized Enterprises SRs Social RepresentationsSTEAM Science, Technology, Engineering, Art, and Mathematics
STEM Science, Technology, Engineering and Mathematics
STTR Small Business Technology Transfer (United States)
SWE Society of Women Engineers
TIMSS Trends in International Mathematics and Science Study
TT Technology Transfer
TTMs Technology Transfer Managers
TTO Technology Transfer Office
TVET Technical and Vocational Education and Training
TWAS The World Academy of Sciences
UCLA University of California, Los Angeles
UCSF University Challenge Seed Fund (Oxford)
UIS UNESCO Institute for Statistics
UK United Kingdom
UN United Nations
UN CRPD United Nations Convention on the Rights of Persons with Disabilities
UNCTAD United Nations Conference on Trade and Development
UNDP United Nations Development Programme
UNECE United Nations Economic Commission for Europe
UNER National University of Entre Ríos
UNESCO United Nations Educational, Scientific and Cultural Organisation
UNFPA United Nations Population Fund
UNGA United Nations General Assembly
UNICEF United Nations International Children’s Emergency Fund
UNSD United Nations Statistics Division
UNSTAT United Nations Statistics Division
UNU United Nations University
UNU-CS United Nations University Institute on Computing and Society
US United States
USAID United States Agency for International Development
USD United States Dollar
USP University of São Paulo
VAWG Violence Against Women and Girls
VC Venture Capital
VR Virtual Reality
W3C World Wide Web Consortium
WCAG Web Content Accessibility Guidelines
WEF World Economic Forum
WEPs Women’s Empowerment Principles

16
Taking Stock: Data and Evidence on Gender Digital Equality PART ONE
TABLES, FIGURES, AND CASE STUDIES
Table 1.1. Gender gap in computer use by region 27
Table 2.1. Percentage of women with ICT skills by region 51
Table 2.2. Difference in percentages between males and females on different aspects of digital skills in Africa, the Americas and Asia 52
Table 2.3. Difference in percentages between males and females on different aspects of digital skills (Europe) 53
Table 2.4. European Commission comprehensive digital skills measurements 55
Table 2.5. Four models of coding bootcamp 71
Table 3.1. Percentage of women employees in telecommunications industry, by region 83
Table 3.2. Percentage of female ICT professionals (%) 86
Table 3.3. Percentage of female electrical and electronic trades workers 86
Table 3.4. Percentage of women faculty at business schools, by region 90
Table 3.5. Percentage of female telecom company employees 94
Table 3.6. Women in senior management – Technology companies 94
Table 3.7. Percentage of women on boards, by industry 97
Table 3.8. The World Academy of Sciences Fellows 98
Table 3.9. Proportion of seats held by women in national parliaments 104
Table 3.10. Proportion of female heads of policymaking agencies 105
Table 4.1. Status of cybercrime and data privacy laws worldwide (May, 2018) 117
Table 5.1. Sample manifestations of barriers 138
Table 5.2. Gender identities of virtual personal assistants 144
Table 5.3. Gender identities of text-to-speech software and applications 145
Table 5.4. Summary of barriers to gender digital equality 146
Table 5.5. Recommendations for addressing barriers to genderequality in ICT access, skills, and leadership (collatedfrom the literature) 147
Table 6.1. State of data and knowledge on gender digital inequality 162
Table 6.2. Status of conceptualisation and collection of sex-disaggregated data on ICT access 164
Table 6.3. Number of countries sharing sex-disaggregated data on selected basic access indicators 166
Table 6.4. Number of countries covered in Global Findex indicators 169
Table 6.5. Status of conceptualisation and collection of sex-disaggregated data on ICT skills 170
Table 6.6. Number of countries covered in ITU sex-disaggregated data on basic digital skills 171
Table 6.7. Countries with sex-disaggregated data on all eight ITU digital skills 172
Table 6.8. Number of countries covered in ITU and OECD data on advanced ICT skills 173
Table 6.9. Status of sex-disaggregated data on general and ICT education, no. of countries reporting 173
Table 6.10. Examples of different classification of STEM-related fields in higher education 175
WHO World Health Organisation
WIC AUTM Women Inventors Committee
WiML Women in Machine Learning
WISAT Women in Global Science and Technology
WISE Women into Science and Engineering
WISE Women in Security Excelling Initiative
WIT Women in Technology
WITD World IT Database
WSIS World Summit for the Information Society
GLOSSARY / DEFINITIONS
Gender: To accommodate diverse researchers and data, this report does not subscribe to any particular definition of gender; see Chapter 7 for a discussion of gender variance, acknowledging the complexity of defining gender. The content therefore incorporates multiple notions of gender.
Gender gap: Unless otherwise indicated, gender gaps are calculated using the absolute approach (percent female minus percent male) rather than a relative ratio (such as [percent men minus percent female] divided by percent men). A negative gap means more men than women, while a positive gap means more women than men.
ICTs: For the purposes of this report, ICTs are defined as computers, mobile phones, and the internet. They do not include older technologies such as television and radio, nor new and emerging technologies such as artificial intelligence (except for the forward-looking chapter on artificial intelligence in Part Two).
ICT access: This refers to people’s access to and ownership of computers, mobile phones, and the internet. It also covers the ability to use these technologies in meaningful ways — possession of the requisite basic digital skills, as well as the types of content and services provided.
ICT skills: ICT skills refer to basic digital literacy (overlapping with the access definition) as well as the more advanced technical skills (such as software development) that are required to enable people become creators, innovators, and leaders in the ICT field.
ICT leadership: This refers to 1) employment in ICT and related fields, especially at leadership levels, and 2) participation as entrepreneurs in the ICT industry.

17
Taking Stock: Data and Evidence on Gender Digital Equality PART ONE
Table 6.11. Number of countries covered in PISA and TIMSS surveys* 176
Table 6.12. Status of conceptualisation and collection of sex-disaggregated data on ICT leadership 177
Table 6.13. Status of sex-disaggregated, internationally comparable data on ICT employment (no. of reporting countries) 178
Table 6.14. Status of sex-disaggregated data on ICT entrepreneurship 179
Table 6.15. Status of sex-disaggregated data on ICT policymaking 180
Table 6.16. Status of sex-disaggregated data on the dark side of ICTs 181
Table 6.17. Status of sex-disaggregated data on general discrimination and sexual harassment (no. of countries reporting) 182
Table 6.18. SDG indicators related to violence against women and girls 182
Table 6.19. Status of sex-disaggregated data on the work-related dark side of ICTs 183
Table A.1. Mobile and internet access, by country 194
Table A.2. Skills and education, by country 195
Table A.3. Women in employment, entrepreneurship, and policymaking, by country 196
Table B.1. Africa, Americas, Oceania: Basic ICT Access Indicator, Most Recent Year (2014–2016) 197
Table B.2. Asia: Basic ICT Access Indicators, Most Recent Year (2014-2016) 198
Table B.3. Europe: Basic ICT Access Indicators, Most Recent Year (2014–2016) 199
Table C.1. Individuals with ICT skills, by type of skills by gender (%): Africa, Americas, Asia 200
Table C.2. Individuals with ICT skills, by type of skills by gender (%): Europe 201
Figure 1.1. Basic Access Indicators from ITU 26
Figure 1.2. Difference between male and female computer use (top 10 and bottom 10 countries) 27
Figure 1.3. Gender gap in internet users in 2013 and 2017 28
Figure 1.4. Difference between male and female internet use (top 10 and bottom 10 countries) 29
Figure 1.5. Gender gap in mobile internet use in low and middle-income countries by region 30
Figure 1.6. Percentage of individuals using a mobile cellular telephone by gender 31
Figure 1.7. Difference between male and female use of mobile phone (top 10 and bottom 10 countries) 31
Figure 1.8. Difference between male and female mobile phone ownership 32
Figure 1.9. World Bank Findex Indicators on Access and Use of Digital Financial Services 35
Figure 1.10. GSMA Connected Women Framework to promote women’s use of mobile services 37
Figure 1.11. Percentage of females and males who made or received digital payments in 2017 38
Figure 1.12. Percentage of females who made or received digital payments in 2017 38
Figure 1.13. Gap between men and women who made or received digital payments in 2017 (top and bottom 10 countries) 39
Figure 1.14. Percentage of male and female use of mobile phone / internet to access an account in 2017 39
Figure 1.15. Percentage of females who used mobile phone / internet to access an account in 2017 40
Figure 1.16. Gap between men and women who used a mobile phone or the internet to access an account in 2017 (top and bottom 10 countries) 40
Figure 1.17. Percentage of male and female use of the internet to pay bills or make purchases online in 2017 41
Figure 1.18. Percentage of females who used the internet to pay bills or make purchases online in 2017 41
Figure 1.19. Gap between men and women who used the internet to pay bills or make purchases online in 2017 (top and bottom 10 countries) 42
Figure 1.20. Percentage of male and female use of mobile money services in 2017 43
Figure 1.21. Gap between men and women who used mobile money services in 2017 (top and bottom 10 countries) 43
Figure 2.1. ITU indicators of digital skills 50
Figure 2.2. Number of countries with greater percentage of skilled women than men, per number of skills 52
Figure 2.3. Gender divide in social media use 54
Figure 2.4. Gender difference in overall digital skills and by age groups (Europe) 55
Figure 2.5. Gender difference among those with above digital skills by skill types (Europe) 56
Figure 2.6. Gender difference in ICT-based problem-solving skills (OECD countries) 56
Figure 2.7. Gender gap in Level 3 ICT-based problem-solving skills (OECD countries) 57
Figure 2.8. Gender gap in programming skills by country 58
Figure 2.9. Percentage of grade 12 female studentstaking advanced math or physics courses 59
Figure 2.10. Gender difference in student performancesat grade 8 (total scores) 60
Figure 2.11. Number of countries with gender gaps in science and math scores in 2015 60
Figure 2.12. Gender differences by countries in math scores at grade 4 61
Figure 2.13. Gender difference in math self-concept 62
Figure 2.14. Changing interest in STEM by age among young European females 62
Figure 2.15. Popular career choices among OECD students 63
Figure 2.16. Expectation of science careers at age 15, by gender 64
Figure 2.17. Enrolment in TVET and secondary education 64
Figure 2.18. Share of females from upper secondary vocational programs in OECD countries, by field of education 65
Figure 2.19. Female participation in higher education and STEM (2001–2017) 66
Figure 2.20. Percentage of female students among higher education students by field of study (2016) 66
Figure 2.21. Status of computing education in Europe (2016) 69
Figure 2.22. Importance of formal/alternative education for coding career 70
Figure 2.23. Digital Skills Initiatives for women, by project types and regions 71
Figure 3.1. Percentage of women employees at three occupation skill levels, global 81
Figure 3.2. Percentage of women by occupation skill level (2017) 82
Figure 3.3. Percentage of women telecommunications industry employees 83
Figure 3.4. Percentage of women telecommunications industry employees, Europe 84
Figure 3.5. Percentage of female employees in ICT-related occupations, regional (2016) 85

18
Taking Stock: Data and Evidence on Gender Digital Equality PART ONE
Figure 3.6. Percentage of female researchers in engineering & technology (2010–15) 89
Figure 3.7. Female share of employment in managerial positions – Total management 92
Figure 3.8. Female share of employment in managerial positions – Senior & middle management 92
Figure 3.9. Female share of employment as chief executives, senior officials and legislators 93
Figure 3.10. Percentage of women in C-level positions (AI industry) 96
Figure 3.11. Percentage of firms with women participating in ownership 99
Figure 3.12. Access to training to start a business 100
Figure 3.13. Access to finance to start a business 101
Figure 3.14. Percentage of adults (15+ years) with an account at a bank or other financial institution or with a mobile-money-service provider 102
Figure 3.15. Percentage of adults (15+ years) who have saved at a financial institution 102
Figure 3.16. Percentage of adults (15+ years) who have borrowed from a financial institution 103
Figure 3.17. Countries with a woman in charge of the ICT ministry 105
Figure 3.18. Countries with a woman in charge of the telecommunications regulator 106
Figure 4.1. SDG Indicators related to Violence Against Women and Girls 115
Figure 4.2. Percentage of women subjected to physical and or sexual violence by a current or former intimate partner in the previous 12 months (most recent year, 2005–2016) 115
Figure 4.3. Percentage of women and girls aged 15 years and older subjected to sexual violence by persons other than an intimate partner in the previous 12 months (most recent year, 2000–2014) 116
Figure 4.4. Status of cybercrime legislation by region (May, 2018) 117
Figure 4.5. Status of data protection and privacy legislation by region (2018) 118
Figure 4.6. Domestic violence legislation by region (2018) 119
Figure 4.7. Countries with no coverage on the different domains of violence against women (2018) 119
Figure 4.8. Percentage of countries by region with legislation dealing with sexual harassment (2018) 121
Figure 4.9. Number of countries with no legislation on sexual harassment in the following areas (2018) 121
Figure 4.10. Legislation explicitly prohibiting sexual harassment in the workplace (2016) 122
Figure 4.11. Gender wage gap by occupation (%), Europe (2014 –2016) 123
Figure 4.12. Gender wage gap by occupation (%), Asia (2014 –2016) 124
Figure 4.13. Gender wage gap by occupation (%), Americas (2015–2016) 124
Figure 4.14. National constitution mentions gender in non-discrimination clause 126
Figure 4.15. Legislation protecting women from discrimination in promotion or demotion 126
Figure 4.16. Legislation protecting women from discrimination in access to vocational training 127
Figure 4.17. Legislation guaranteeing equal pay 127
Figure 4.18. Global gender gap in mean weeklyhours of work per employee, by sex and occupation 128
Figure 4.19. Proportion of time spent on unpaid domestic and care work, Africa (2010 –2014) 129
Figure 4.20. Proportion of time spent on unpaid domestic and care work, the Americas (2010–2015) 130
Figure 4.21. Proportion of time spent on unpaid domestic and care work, Asia (2011–2015) 130
Figure 4.22. Proportion of time spent on unpaid domestic and care work, Europe (2010–2015) 131
Figure 4.23. Paid leave available for mothers of infants (2013) 132
Figure 4.24. Maximum wage replacement rate of paid leave for mothers of infants (2013) 132
Figure 4.25. Mothers of infants guaranteed breastfeeding breaks at work (2013) 133
Figure 4.26. Working mothers guaranteed options to facilitate paid breastfeeding for at least six months (2013) 133
Figure 5.1. Summary of Recommendations to Close the Gender Digital Divide from the Broadband Commission 151
Figure 6.1. UN Minimum Set of Gender Indicators – tier definitions 161
Figure 6.2. UN Minimum Set of Gender Indicators: Internet and mobile phone use 165
Figure 6.3. The internet gender gap index: proportion of female population with internet access divided by proportion of male population with internet access 168
Figure 6.3a. Modeled using ITU ground truth data 168
Figure 6.3b. Modeled using Facebook gender gap index 168
Case Study 1.1. SheTrades — Empowering Women Entrepreneurs with Digital Skills 34
Case Study 1.2. GSMA Connected Women Initiative: bridging the mobile gender gap 36
Case Study 2.1. #eSkills4Girls – A global initiative to promote digital skills for women and girls 72
Case Study 3.1 Women’s participation in online software developer communities 88
Case Study 3.2. Where are the women? Gender disparities in AI research and development 96
Case Study 5.1. “Ok Google: Is AI Gendered?” 144
Case Study 5.2. Gender Digital Inequality from the Life Course Perspective 149
Case Study 6.1. ICT, Gender and Data in Africa 163
Case Study 6.2. Measuring Gender Digital Inequality with Web Data 167
Case Study 6.3. Tracking data on female programmers in Argentina 174
Case Study 6.4. Gender in the Global Research Landscape Gender Disambiguation Methodology 185
LIST OF FIGURES AND TABLES - PART TWO
Figure 2.1. Mobile phone ownership, internet use, and GNI per capita 224
Figure 2.2. Gender disparity in ownership of mobile phone 225
Figure 2.3. Gender gap in the use of internet 226
Figure 2.4. Gender gap in the use of mobile money 227
Figure 2.5. Reasons for not using the internet among women, disaggregated by household income (% of non-internet users, among women aged 15–65 years) 232

19
Taking Stock: Data and Evidence on Gender Digital Equality PART ONE
Figure 2.6. The % ICT index by country and gender (average values) 234
Figure 2.7. Independent variable contribution to the explained ICT gender gap 238
Figure 2.8. Confidence Intervals for the unexplained gap by countries (full set of independent variables) 239
Figure 6.1. Percentage of females among STEM graduates, by country 278
Figure 7.1. Difference in standardised skill scores between men and women (conditional on covariates), 31 countries, 2012 or 2015 286
Figure 7.2. Gender wage gap by country and industry (conditional difference in hourly wages for men and women, in %), 31 countries, 2012 or 2015 287
Figure 7.3. Labour market returns to skills by gender across 31 countries, 2012 or 2015 288
Figure 8.1. South Africa – strengths in business outsourcing 297
Figure 8.2. Skills development in call centres in South Africa 298
Figure 12.1. Relationship between AI, machine learning, and deep learning 332
Table 2.1. Main reasons cited for not using the internet 228
Table 2.2. Urban-rural gender comparison on ICT access and use 229
Table 2.3. Income and education statistics disaggregated by gender 231
Table 2.4. Determinants of ICT adoption 236
Table 2.5. Preliminary analysis – Observed effects of independent variables 237
EXECUTIVE SUMMARY/KEY FINDINGS
The inaugural report of the EQUALS Research Group lays the foundation for the EQUALS Partnership agenda by surveying the landscape of knowledge on gender equality as it relates to the three EQUALS action areas – Access, Skills, and Leadership. It should serve as a planning resource to inform future activities of EQUALS partners and to serve the broader community of policymakers, practitioners, and researchers interested in solving gender inequality challenges in access to information and communication technologies (ICTs), development of basic and advanced ICT skills, and participation in the ICT industry.
While our primary interest is in ICTs, this topic intersects with other issues, in particular the science, technology, engineering, and mathematics (STEM) field in general. Scholars argue that in many respects the state of gender digital equality can be traced back to trends in the socialisation of STEM as a male-dominated field (for example, Quirós et al., 2018; Steinke, 2017). Furthermore, significant definitional issues complicate the analytic focus for this type of research. The continually evolving nature of technology and the existence of different categorisation schemes give rise to questions about what falls within the scope of ICTs and what constitutes an ICT (or ICT-related) occupation.
The nature of available information also affects analysis, as much of the existing research and data (particularly for skills and leadership) relate to STEM, technology, or engineering broadly. Throughout this report, we use a variety of terms including “STEM”, “science and technology”, “technology”, “digital technologies”, “ICT” and “computing”, depending on the scope of the available data.
KEY FINDINGS ON THE STATE OF GENDER DIGITAL EQUALITY
1. While gender gaps are observable in most aspects of ICT access, skills and leadership, the picture is complex. There are large regional variations: some countries are close to parity or have even reversed the gender gap on some indicators, while others still have persistent gaps. Individual countries can have both large and small gaps, depending on the indicator being measured. Interpreting the gaps requires careful and contextualised analysis.
2. Barriers to gender digital equality are generally related to one or more of the following: 1) availability of infrastructure; 2) financial constraints; 3) ICT ability and aptitude; 4) interest and perceived relevance of ICTs; 5) safety and security; and 6) socio-cultural and institutional contexts. Most of these barriers cut across issues of access, skills, and leadership, although they may manifest in slightly different ways. While research has documented these barriers, the evidence from different sources is sometimes contradictory, even within the same country contexts.
3. There is no one conclusive strategy for eliminating gender digital inequalities. Recommendations generally call either for targeting specific contributing factors of gender digital inequality (such as affordability or recruiting practices), or for reshaping deeply ingrained social norms and practices (such as gender stereotypes) that are at the root of gender inequalities. As with the evidence on barriers, research results are sometimes contradictory or nuanced.
4. The dominant approaches to gender equality in ICT access, skills, and leadership mostly frame issues in binary (male/female) terms, thereby masking the relevance of other pertinent identities. Insufficient research has been done on the implications of ICTs for intersectional identities. Data collection should move from binary sex-disaggregation towards finer degrees of status disaggregation in order to recognise multiple and interacting identities (such as sexuality, poverty, class, education, age, disability, and occupation).

20
Taking Stock: Data and Evidence on Gender Digital Equality PART ONE
5. To ensure privacy and safety as well as full participation in the digital economy, women should have equal opportunities to develop adequate basic and advanced digital skills. Cyberstalking, online harassment, image manipulation, privacy violations, geotracking, and surveillance can compromise women’s and girls’ safety both online and offline. In addition, some evidence suggests the digital transformation of labour may be widening gender wage gaps. These outcomes can be averted with the right types of training combined with social and institutional change.
6. Developments in digital technologies open new pathways to gender diversity and inclusion; however, lack of attention to gender dynamics and differences hampers the potential for true progress. For example, evidence suggests that most women’s work in the digital economy, particularly in the Global South, reinforces existing social divisions. Moreover, artificial Intelligence (AI) systems, designed largely by men, tend to ignore the negative gender implications of their designs. Research, government policy and design principles should include gender awareness and analysis, for example by building in data and privacy protections and avoiding gender stereotypes.
KEY FINDINGS ON THE STATE OF DATA ON GENDER DIGITAL EQUALITY
1. There is limited internationally comparable sex-disaggregated official data and geographic coverage on most ICT indicators, especially for developing countries. Most of the official statistics and scholarly research are from North America and Europe. Furthermore, only a few countries have longitudinal data for comparison of trends over time.
2. Official data on gender-related negative and unintended consequences of ICTs are not systematically collected. Both data collection and social change are important to ensure that greater gender inclusion (online and in the ICT field) does not lead to increased exposure to negative experiences, such as cyber violence, sexual harassment, and gender discrimination.
3. Despite the existence of commendable research and data collection efforts, measuring gender digital equality is plagued by definitional and methodological challenges. These include: a lack of internationally agreed definitions and methodologies for collecting data; the sheer range of possible dimensions for measuring gender digital equality; the moving target of technological developments; and low research capacity of both government agencies and academic institutions in most countries. In addition, the existing body of
scholarly and corporate research is often limited to narrow national or topical contexts, and has sometimes produced contradictory findings, thus limiting the ability to generalise beyond the research context. In addition to carrying out targeted systematic reviews and meta-analyses to make sense of existing research, more data collection as well as original quantitative and qualitative research are needed to conceptualise gender digital equality, identify gender gaps with greater specificity and geographic coverage, understand the contexts in which they occur, and determine what works and why in different socio- cultural contexts.
REPORT OUTLINE
The report has two parts. Part One reviews research and data (mostly as of June, 2018) on the three core action areas of the EQUALS Partnership: ICT Access, Skills, and Leadership. It covers trends as represented in official statistics, academic reports, and grey literatu-re, and it assesses the availability of relevant sex-disag-gregated data.
Part One begins with a discussion of selected di-mensions of access to ICTs (Chapter 1), distinguished broadly as basic access (access to computers, mobile phones, and the internet) and meaningful access (fo-cusing on access to use of digital financial services, in the few areas for which official statistics are available). This is followed by a discussion of gender equality in basic and advanced ICT skills (Chapter 2), from early to tertiary education as well as through non-traditional pa-thways. Chapter 3 examines gender equality in ICT lea-dership: employment within the industry and academia; attainment of leadership positions; entrepreneurship participation; and inclusion in relevant policymaking. Chapter 4 deals with the dark side of the digital age — risks and dangers associated with digital technologies, as well as negative outcomes and negative responses to advances in gender equality. Chapter 5 summarises observed obstacles and associated recommendations to improve gender equality in access, skills, and lea-dership. Finally, Chapter 6 assesses the availability of relevant sex-disaggregated data.
Part Two of the report comprises independently au-thored chapters by members of the EQUALS Research Group. It brings together theoretical perspectives and research data on themes to broaden our understan-ding of pathways to gender equality in the digital age, outlining potential agendas for the Partnership. These themes fall into three broad categories: People, Digital Skills, and Pathways.The first section focuses on People — specific popula-tions of interest in technology: diverse sexual minorities (“Gender variance and the gender digital divide”); people in low and middle-income countries (“Unders-
21
Taking Stock: Data and Evidence on Gender Digital Equality PART ONE
tanding the gender gap in the Global South”); children and youth (“‘echnologies and youth”); women with disabilities (“Accessibility, intersectionality and univer-sal design”); and women farmers (“ICT in a changing climate”).
The second section highlights the importance of educational and training institutions in addressing gender gaps in Digital Skills (“The role of educational institutions”) and the implications of gender gaps in the labour market (“The gender wage gap and skills deve-lopment: Perspectives of young women”). Finally, “A gender perspective on security and privacy” discusses the skills needed to deal with these challenges in the digital age.
The third section, Pathways, places the gender digital equality agenda within broader frameworks: the pitfalls of over-enthusiasm about the equalising potential of technology (“Investigating empowering narratives”); arguments for more inclusive technology-driven social innovation (“Technology and wealth creation”); and the potential of artificial intelligence for eliminating gender inequality (“Hello, Siri”).
REFERENCES
Quirós, C. T., Morales, E. G., Pastor, R. R., Carmona, A. F., Ibáñez, M. S., & Herrera, U. M. (2018). Women in the digital age. European Commission. Retrieved from https://ec.europa.eu/digital-single-market/en/news/increase-gender-gap-digital-sector-study-women-digi-tal-age
Steinke, J. (2017). Adolescent Girls’ STEM Identity For-mation and Media Images of STEM Professionals: Considering the Influence of Contextual Cues. Frontiers in Psychology, 8. https://doi.org/10.3389/fpsyg.2017.00716

22
Taking Stock: Data and Evidence on Gender Digital Equality PART ONE

23
Taking Stock: Data and Evidence on Gender Digital Equality PART ONE

24
GENDER EQUALITY IN ICT ACCESSAUTHOR: DON RODNEY JUNIO (UNU-CS)
1

25
Taking Stock: Data and Evidence on Gender Digital Equality PART ONE
KEY FINDINGS
• Gender digital divides are not all the same. The gender digital divide persists irrespective of a country’s overall ICT access levels, economic performance, income level or geographic location. Cultural and institutional constraints help shape how the gender digital divide manifests itself in a country. A one-size-fits-all approach to the issue will not be effective.
• The gender digital divide widens as technologies become more sophisticated and expensive, enabling more transformational use and impacts.
• Basic digital access and literacy are necessary but not sufficient conditions for women to meaningfully use ICTs.
• Use is not the same as ownership. As ITU begins to collect gender-disaggregated data around mobile phone use and ownership, the disparity between the two indicators appears to be key to understanding women’s disadvantages in access to ICTs.
• The potential of mobile phones is under-realised. Despite its lower cost as compared to using a computer, the number of women using mobile internet remains substantially low relative to men. GSMA estimates that in low- and middle-income countries, women are 26% less likely to use mobile internet than men.
1.1 / INTRODUCTION
ICTs, including use of the internet and mobile technologies, expand opportunities and can potentially empower people who have access to them. Many believe that there is no longer a gender gap in ICT access, given the high levels of mobile phone adoption even in less developed regions. However, the latest data from the International Telecommunication Union (ITU) suggests that there are about 250 million fewer women online than men, and the problem is more pronounced in developing countries. Equality in ICT access involves more than mere availability and use of mobile phones. To what extent do women have equal access to devices other than mobile phones, as well as control over those devices and the ability to use the technology in beneficial ways? This chapter assesses data on a variety of indicators related to computer, mobile phone, and internet access, as well as use of digital financial services, to assess gender divides in these areas.
1.1.1 / WHY IS GENDER EQUALITY IN ICT ACCESS IMPORTANT?
A gender perspective on inequality in digital access is an analytical lens that puts structural issues and core concerns that women and girls face online at the centre of our understanding of the problem. Just learning that more than 3 billion people are offline suggests a different kind of policy response, as opposed to understanding that a majority of those who offline are women and girls. Closing this gender digital divide has the potential to empower women both online and offline, in various facets of their lives including their economic and social conditions. ICTs have the potential to alleviate some of the steep barriers faced by women, including illiteracy, poverty, time scarcity, barriers to mobility, and cultural and religious taboos (SIDA, 2015).
In addition to addressing the structural barriers that women face, closing the gender digital divide on basic access would profoundly affect other aspects of women’s participation in the digital economy, including in knowledge creation and leadership. Meaningful participation in the digital economy requires unfettered access to ICT tools. Improving the economic standing of women requires equipping them with the tools and skills to adapt successfully to the evolving requirements of our increasingly knowledge-based and ICT-driven economies.
In recognition of the transformative potential of ICTs, closing the gender digital divide in access is included as part of the UN’s Sustainable Development Goal (SDG) targets (Box 1.1).
Box 1.1Women’s ICT Access and the SDGs
To achieve the UN SDG targeting gender equality will necessitate a data regime and policy framework designed to monitor, track, and measure progress in closing the gender divide. To date, the lack of gender statistics and sex-disaggregated data often clouds the ability of policy makers to respond adequately to social problems that affect women and girls. The SDGs spell out the following targets that, together, would enable greater and equal participation of women in the digital society:
Target 5B: Enhance the use of enabling technology, in particular information and communications technology, to promote the empowerment of women.
Target 9C: Significantly increase access to information and communications technology and strive to provide universal and affordable access to the internet in least developed countries by 2020.
Target 5.2: Eliminate all forms of violence against all women and girls in public and private spheres.

26
Taking Stock: Data and Evidence on Gender Digital Equality PART ONE
1.1.2 / MEASURING THE GENDER DIVIDE IN ICT ACCESS
The success of current initiatives to address gender digital inequalities depends on understanding the forms and extent of the inequalities and why they exist. The starting point for policy makers and researchers is to re-examine how we define and measure ICT access. The definition of access to ICTs has evolved over the years and along with it, definitions of the digital divide (van Deursen & van Djik, 2014; van Djik, 2006). Increasingly, basic access now encompasses not only telephones and computers, but also access to mobile phones including smartphones, the internet, and specifically broadband internet (Tsetsi & Rains, 2017; Rice & Katz, 2003). In addition, the definition of access is being extended to issues of ownership and control over devices, as well as usage patterns and access to different types of content (Lee et.al, 2015; Schradie, 2011; Warschauer, 2003 among others). As new technologies emerge (e.g., artificial intelligence) it is likely that ICT access as a concept will continue to be a moving target. Bearing all this in mind, we focus on two aspects of ICT access — basic access and meaningful access — to capture a spectrum ranging from ability to get access to a device, to differences in the use of these devices. For basic access, we examine the gender digital divide around use of computers and internet and use and ownership of mobile phones. For meaningful use, we focus on the gender digital divide around access and use of digital financial services, as an aspect of meaningful use that has available sex-disaggregated data. The rest of the chapter discusses the state of knowledge on basic access and meaningful access, cognisant of the limited availability of gender-disaggregated data in general.
1.2 / BASIC ACCESS
The most reliable global data in relation to basic access can be culled from the database of the ITU. Since 2004, ITU have been working with National Statistics Offices from developing countries to improve the availability and quality of statistics that can be disaggregated by gender (among other individual or household dimensions). Despite having limited data available, ITU’s basic access indicators illuminate existing gender digital divides.
The most common understanding of basic access is in reference to access to and use of ICT devices such as a computer or a mobile phone. This device-centric conceptualisation of basic access informs much of the current global data regime on basic ICT access indicators. With the use of internet increasingly seen as a prerequisite to participate in the digital economy, countries have also started collecting data to measure this aspect of access. For example, part of ITU’s core list of indicators are gender-disaggregated as they relate to access, as shown in Figure 1.1.
Figure 1.1Basic Access Indicators from ITU

27
Taking Stock: Data and Evidence on Gender Digital Equality PART ONE
While use of devices and internet are the most accepted way of measuring basic access, this tends to overlook power dynamics that may affect women specifically. It is important to frame “access” as relating to ownership and control as well as use. The indicator “proportion of individuals who own a mobile phone” is included as a factor in basic access, in recognition of the multidimensional aspect of ICT access — beyond measures of use. However, problems in global data coverage prevent us from drawing a global picture of ownership and control. In this section, we use the term “basic access” to refer to the following issues: (i) use of computer; (ii) use of the internet; (iii) use of a mobile phone; and (iv) mobile phone ownership. Appendix B presents the data in more detail at the country level.
1.2.1 / COMPUTER USE
The first step in bringing women online and enabling them to use the internet is ensuring that they have unfettered use of access devices such as computers. The gender gap in computer use varies across regions. Of the 78 economies with gender-disaggregated data on use of computer, the largest gap is in Asia — as is the country with the largest gender gap in favour of women. With the exception of Africa, all regions have at least one country where the gender gap favours women (Table 1.1).
REGION NUMBER OF REPORTING ECONOMIES
PERCENTAGE OF LARGEST GAP
PERCENTAGE OF SMALLEST GAP
Africa 6 -8.9 -0.7
Americas 13 -5 3.1
Asia 25 -17 4.3
Europe 34 -9.3 1.4
Countries in the Middle East and Latin America dominate the group with a higher proportion of women than men who use a computer. Countries in the bottom
10 in women’s computer use include some that are associated with a highly developed ICT infrastructure, such as Japan and South Korea (Figure 1.2).
Table 1.1Gender gap in computer use by region
Figure 1.2Difference between male and female computer use (top 10 and bottom 10 countries)
Source: ITU WTI Database 2017
Source: ITU WTI Database 2017Note: Positive value means more women than men.

28
Taking Stock: Data and Evidence on Gender Digital Equality PART ONE
1.2.2 / INTERNET ACCESS
ITU’s latest flagship annual report, Measuring the Information Society 2017, notes that the global gender gap in internet access has increased from 2013 to 2017 (Figure 1.3). In 2017, there are 250 million fewer women
online. Regional variations exist: least developed countries show a substantial gap, while the gender gap has decreased in developed countries. The internet user gender gap increased in Africa, even while it decreased in other regions. With the sole exception of the Americas, there are more men online than women in every region.
Source: ITU MIS 2017 ReportNote: The gender gap represents the difference between the internet use rates for males and females relative to the internet use rate for males, expressed as a percentage.
Looking at the top 10 and bottom 10 countries in terms of difference in percentage between women and men, the results are more varied, with the gender gap ranging from +6% to -16% (Figure 1.4). Countries in Latin America and Europe dominate the list of countries in the top 10, showing a gender gap in favour of
women. However, there are also a number of European countries in the bottom 10 of countries, where the gender gap favours men, as in Germany and Austria. In this sense, the gender gap does not neatly correlate with the degree of economic development of the country.
Figure 1.3Gender gap in internet users in 2013 and 2017

29
Taking Stock: Data and Evidence on Gender Digital Equality PART ONE
While the internet is increasingly being accessed over mobile devices, data on use of mobile internet is not one of the indicators that ITU regularly collates. The private sector is taking the lead in measuring the gender gap in this area: the GSMA conducts surveys across different countries; it creates models to estimate the gender digital gap in mobile internet use, even in countries where a survey was not conducted. GSMA’s Mobile Gender Gap Report 2018 (GSMA, 2018) notes
that there are about 1.2 billion women in low- and middle-income countries that do not use mobile internet; on average, women are 26% less likely to use mobile internet than men. The report also notes regional differences across low- and middle-income countries, ranging as high as 70% in South Asia to as low as 4% in East Asia & Pacific and Latin America & Caribbean (Figure 1.5).
Figure 1.4Difference between male and female internet use (top 10 and bottom 10 countries)
Source: ITU WTI Database 2017. Note: Data obtained by subtracting female percentage from male percentage in internet use. Positive value implies more women using the internet than men.

30
Taking Stock: Data and Evidence on Gender Digital Equality PART ONE
Figure 1.5Gender gap in mobile internet use in low and middle-income countries by region
Source: GSMA Mobile Gender Gap Report 2018. Note: GSMA calculates the gender gap by subtracting male users/owners (% of male population) from female owners/users (% of female population) divided by male owners/users.
1.2.3 / MOBILE PHONE USE
Access to and use of mobile phones have increased over the years, reflecting a combination of factors, including reduction in cost of ownership. Data collated by ITU shows that, for all 34 economies with gender disaggregated data, more than half of the population already use a mobile phone; the lowest percentage for females, in Zimbabwe, is 68.5% (Figure 1.6). Figure
1.7 shows the top 10 and bottom 10 countries, in terms of difference between percentages of female and percentages of male for mobile phone use. Many developing countries are represented in the top 10, i.e., where more women than men are using a mobile phone. Among the bottom 10 countries, in terms of women’s use of mobile phones, are both developing countries and developed countries, such as Japan (Figure 1.7).

31
Taking Stock: Data and Evidence on Gender Digital Equality PART ONE
Figure 1.6Percentage of individuals using a mobile cellular telephone by gender
Figure 1.7Difference between male and female use of mobile phone (top 10 and bottom 10 countries)
Source: ITU WTI Database 2017.
Source: ITU, WTI Database 2017.Note: Data obtained from subtracting female percentage to male per-centage mobile phone use. Positive value implies more women using mobile phones than men.

32
Taking Stock: Data and Evidence on Gender Digital Equality PART ONE
1.2.4 / MOBILE PHONE OWNERSHIP
ITU has recently started collecting data related to mobile phone ownership. In the latest version of the World Telecommunication and ICT Indicators Database 2017, 40 economies show gender-disaggregated data
on mobile phone ownership. With the exception of Burundi, which reported female ownership at 7.3%, all other countries reported more than 50% of women owning a mobile phone. For countries with available data, we can see that mobile phone ownership is generally higher among men than women (Figure 1.8).
Figure 1.8Difference between male and female mobile phone ownership
Source: GSMA Mobile Gender Gap Report 2018. Note: GSMA calculates the gender gap by subtracting male users/owners (% of male population) from female owners/users (% of female population) divided by male owners/users.
GSMA’s Mobile Gender Gap Report 2018 similarly notes this gender gap in mobile phone ownership. According to their estimates, there are 184 million fewer women owning a mobile phone than men. There are also regional differences: for example,
women in South Asia are 26% less likely than men to own a mobile phone; while in East Asia and Pacific, women are only 2% less likely than men to own a mobile phonel.

33
Taking Stock: Data and Evidence on Gender Digital Equality PART ONE
1.3 / MEANINGFUL ACCESS
Once online, there may be noticeable differences in usage patterns between men and women. There is growing recognition that basic access to ICTs is not enough to empower women. For both mobile and internet use, the gender digital divide widens as the technology gets more sophisticated and expensive (Highet, 2017; Deen-Swarray et al., 2012). GSMA (2018) notes that the gender gap does not end at mobile phone ownership but increases when we look at usage patterns, especially for more transformational services. As Chapters 8 and 10 demonstrate, intersecting identities (such as gender, age, socio-economic status, or disability) can exacerbate exclusion from both access and meaningful use of ICTs.
Meaningful access refers to digital competencies and applications that have the potential to transform individuals’ activities, opportunities and outcomes. Case Study 1.1 describes an example of promoting meaningful ICT use for entrepreneurial activity; Chapter
11 discusses meaningful use in the context of gender and food security. However, existing quantitative measures for estimating meaningful use are limited to reports on women’s basic ICT or digital skills, and their use of digital financial services. Meaningful use encompasses more than these two aspects, but lack of data obscures other dimensions of meaningful use, such as women’s ability to produce content and disseminate it online.
Beyond differences in access and usage patterns, researchers have also started to examine a third-level digital divide: “disparities in the returns from internet use, within populations of users who exhibit broadly similar usage profiles and enjoy relatively autonomous and unfettered access to ICTs and the internet infrastructure” (Helsper & van Deursen, 2015). In other words, even if people have equal computer access and skills, they may not experience equal material outcomes. However, research on the third-level digital divide is still at its early stage (Scheerder et al., 2017), and converting these various conceptions of ICT use to measurable indicators has yet to be realised.

34
Taking Stock: Data and Evidence on Gender Digital Equality PART ONE
Case Study 1.1SheTrades — Empowering Women Entrepreneurs with Digital SkillsAuthor: Poonam Watine (International Trade Centre)
In line with the EQUALS Global partnership, the SheTrades Initiative responds to global issues surrounding women and trade, including digital gender-inequality, with a goal of connecting 3 million women entrepreneurs and women-owned businesses to international markets by 2020. SheTrades completed a project with the Indian Ocean Rim Association (IORA), funded by the Australian Department of Foreign Affairs, to support women-owned and led enterprises operating in the services sector in three countries (Jan. 2016–June 2018). IT and ITES (information Technology-Enabled Skills) were the focus in Indonesia and Kenya. The project established networks with private sector, women business associations, and relevant trade and investment support institutions. One key outcome was to increase competitiveness of women entrepreneurs through capacity-building activities, with face-to-face and online trainings geared towards digital marketing, social media, and e-commerce.
Ms. Evelyn M. Kasina, CEO, Eveminet Communication Solutions Ltd.Evelyn Kasina’s information technology firm specialises in digital intelligence for children, including girls. In its third year, the company is working with corporate employers to equip them with essential digital intelligence skills and cyber security solutions. With support from the SheTrades IORA project, Eveminet Communication Solutions Ltd. participated in several major trade fairs. The company generated almost $5000 in sales and has been chosen as a supplier for Safaricom, a leading mobile network operator in Kenya.
In 2018, Ms. Kasina registered a social enterprise focused on digital literacy and data mining to assist children and youth, providing a digital hub for government resources, supporting women’s economic empowerment, and creating an e-commerce platform for markets and trade. Her vision is to “see the young generation become digitally intelligent citizens, leveraging technology and its opportunities.”
Short-term outcomes include supporting over 250 women-owned and -led firms (213 SMEs in Indonesia and 165 in Kenya). Over 47 SMEs under the project have established sizable contracts, totaling around $2.3 million. Collaboration with Facebook Asia Pacific and their #SheMeansBusiness initiative helped women entrepreneurs from Indonesia broaden their knowledge on Facebook and Instagram marketing. The firms were surveyed on their digital literacy and ICT competency. One key finding was that many firms use social media to market their services, due to the low cost. A database was developed to help track the firms’ sales.
Key Lessons
• Collaborative partnerships with the private sector can result in potential sales with buyers for beneficiaries.
• Online trainings and webinars helped to minimise the cost for capacity-building activities.
• Focusing on select countries and the services sector allowed a tighter and stronger delivery.

35
Taking Stock: Data and Evidence on Gender Digital Equality PART ONE
1.3.1 / DIGITAL FINANCIAL TRANSACTIONS
One area of meaningful use that has received considerable attention is the use of ICT tools for financial transactions, and the potential to include the unbanked and underbanked in the formal financial system. Data on some aspects of women’s use of digital
financial services are available through the World Bank’s Global Financial Inclusion Database (Global Findex), which contains modules on topics related to digital payments, mobile money, and making online transactions. Launched in 2011 and updated every three years, the Global Findex contains nationally representative data on access and use of formal and informal financial services by different demographics, including gender (Figure 1.9).
Figure 1.9World Bank Findex Indicators on Access and Use of Digital Financial Services
Multistakeholder partnerships and deeper private sector engagement have provided the needed visibility to help widen the reach of mobile financial services. Case Study 1.2 illustrates how the private sector can play a significant role in bridging the gender digital
divide in mobile money uptake and even mobile internet use, across different countries in Africa, Asia, and Latin America.

36
Taking Stock: Data and Evidence on Gender Digital Equality PART ONE
Case Study 1.2GSMA Connected Women Initiative: bridging the mobile gender gapAuthor: Mariana Lopez (GSMA)
1. ContextMobile can help empower women, providing access to information, services, and life-enhancing opportunities. However, GSMA Connected Women research estimates that women in low- and middle-income countries are, on average, 10% less likely to own a mobile phone than men — which translates into 184 million fewer women owning mobile phones.1
Women who own a mobile phone often report using phones less frequently and intensively than men, especially for transformative services such as mobile internet. We estimate that women are on average 26% less likely to use mobile internet than men; in countries covered by the World Bank’s Global Findex database, women are on average 33% less likely to use mobile money. Women in South Asia are 26% less likely to own a mobile than men, and 70% less likely to use mobile internet. Closing the gender gap in mobile ownership and mobile internet use would generate an estimated incremental revenue of $15 billion over the coming year.2
1 ‘Mobile’ or ‘mobile phone’ ownership refers to personally owning a SIM card, or a mobile phone which does not require a SIM, and using it at least once a month.
2 The $15 billion estimate assumes that the gender gap in mobile ownership and mobile internet use would be closed during 2018, and represents the subsequent 12-month incremental revenue opportunity.
2. Project descriptionThrough the Connected Women Commitment initiative, mobile operators can set defined targets to reduce the gender gap in their mobile money or mobile internet customer base by 2020. As of December 2018, 37 operators across Africa, Asia, and Latin America have made 52 such commitments. Activities include, for example, increasing the number of female agents, improving the mobile data top-up process to be safer and more appealing to women, improving digital literacy among women through educational programmes and interactive content, and developing and marketing use cases designed to appeal to women. To date, since they committed to the Connected Women Initiative, mobile operators have reached over 12 million new women with mobile money or mobile internet services.3
3. Challenges and Key LessonsTargeted intervention is urgently needed from a wide range of stakeholders to overcome the barriers women face to mobile ownership and use. Based on based on their research and experience working with operators across Africa and Asia, GSMA Connected Women developed a framework to guide mobile operators (Figure 1.10).4
3 Connected Women also supports GSMA as lead of the Access Coalition of EQUALS, the global partnership to bridge the digital gender divide.
4 The complete framework can be found at:https://www.gsma.com/mobilefordevelopment/programme/connected-women/framework-mobile-operatorsclose-gender-gap/

37
Taking Stock: Data and Evidence on Gender Digital Equality PART ONE
Recommendations for operators and other stakeholders to address the gender gap
1. Understand the gapOperators need to understand where the gender gap is in their customer base, and why, by analysing their customer data and supplementary field research.
2. Set targetsSet targets and KPIs to increase the proportion of women in the mobile internet and/or mobilemoney customer base from x% to y% by 2020.
3. Address the barriers women faceAccessibility. Women are less likely than men to have access to quality network coverage,handsets, electricity, agents, and identification documents.
• Affordability. The cost of handsets, tariffs, data plans, and transaction fees need to be affordable for women as well as men.
• Usability and skills. The usability of handsets and services must be improved, along with the ability and confidence of women to use them.
• Safety and security. Women must feel safe when using a mobile phone.
• Relevance. Products and services need to meet women’s needs as well as men’s.
To close the gender gap, operators and other stakeholders need to ensure that their products andservices, as well as marketing and distribution approaches, consider women’s needs for these fivethemes. Initiatives need to be socially impactful and commercially sustainable to succeed over thelong term.
Figure 1.10GSMA Connected Women Framework to promote women’s use of mobile services
WHAT OPERATORS SHOULD DO TO CLOSE THE GENDER GAP

38
Taking Stock: Data and Evidence on Gender Digital Equality PART ONE
1.3.2 / DIGITAL PAYMENT TRANSACTIONS
Digital payment transactions include online and mobile transactions, such as remittances and agriculture payments, as well as offline transactions, such as use of a debit or credit card. Figure 1.11 shows females lagging behind males in making or receiving
digital payments in all regions except in Oceania — represented by two advanced economies, Australia and New Zealand. There are also differences within regions: in Africa, Kenya has over 75% female penetration; and in Asia, Iran and Mongolia both have higher than 85% female penetration rate, much higher than the rest of the region (Figure 1.12).
Figure 1.11Percentage of females and males who made or received digital payments in 2017
Figure 1.12Percentage of females who made or received digital payments in 2017
Source: World Bank Global Findex Database 2017.
Source: World Bank Global Findex Database 2017

39
Taking Stock: Data and Evidence on Gender Digital Equality PART ONE
While in general more men make digital transactions, three developing countries have more women than
men who made or received digital payments in the past year: Lesotho, Argentina, and Mongolia (Figure 1.13).
Figure 1.13Gap between men and women who made or received digital payments in 2017 (top and bottom 10 countries)
Source: World Bank Global Findex Database 2017
1.3.3 / ACCESSING AN ACCOUNT USING MOBILE PHONE OR THE INTERNET
While the use of mobile banking has been heralded in many developing countries for bringing the unbanked into the formal sector, with women as the targeted population in most cases, women still lag behind the use of mobile phone or internet to access a financial
account. The exception is Oceania, represented by two developed countries, Australia and New Zealand, reporting higher use for females than males (Figure 1.14). The other regions show higher use for males; Africa, the Americas, and Asia show women’s usage below 18%. There can, however, be significant variations within regions, as seen on the map of Figure 1.15. Notably, South Korea (in Asia) and Kenya (in Africa) show female usage rates higher than the regional average.
Figure 1.14Percentage of male and female use of mobile phone / internet to access an account in 2017
Source: World Bank Global Findex Database 2017

40
Taking Stock: Data and Evidence on Gender Digital Equality PART ONE
Figure 1.15Percentage of male and female use of mobile phone / internet to access an account in 2017
Figure 1.16Gap between men and women who used a mobile phone or the internet to access an account in 2017 (top and bottom 10 countries)
Source: World Bank Global Findex Database 2017
Source: World Bank Global Findex Database 2017
Figure 1.16 shows the gap between men and women (in percentage points) for the top 10 and bottom 10 countries in use of mobile phone or internet to access an account. Among the countries where the gap is in favour of women, we find a developing country,
Lesotho; conversely, we find a highly developed market, the United Kingdom, among the bottom 10 of countries surveyed.
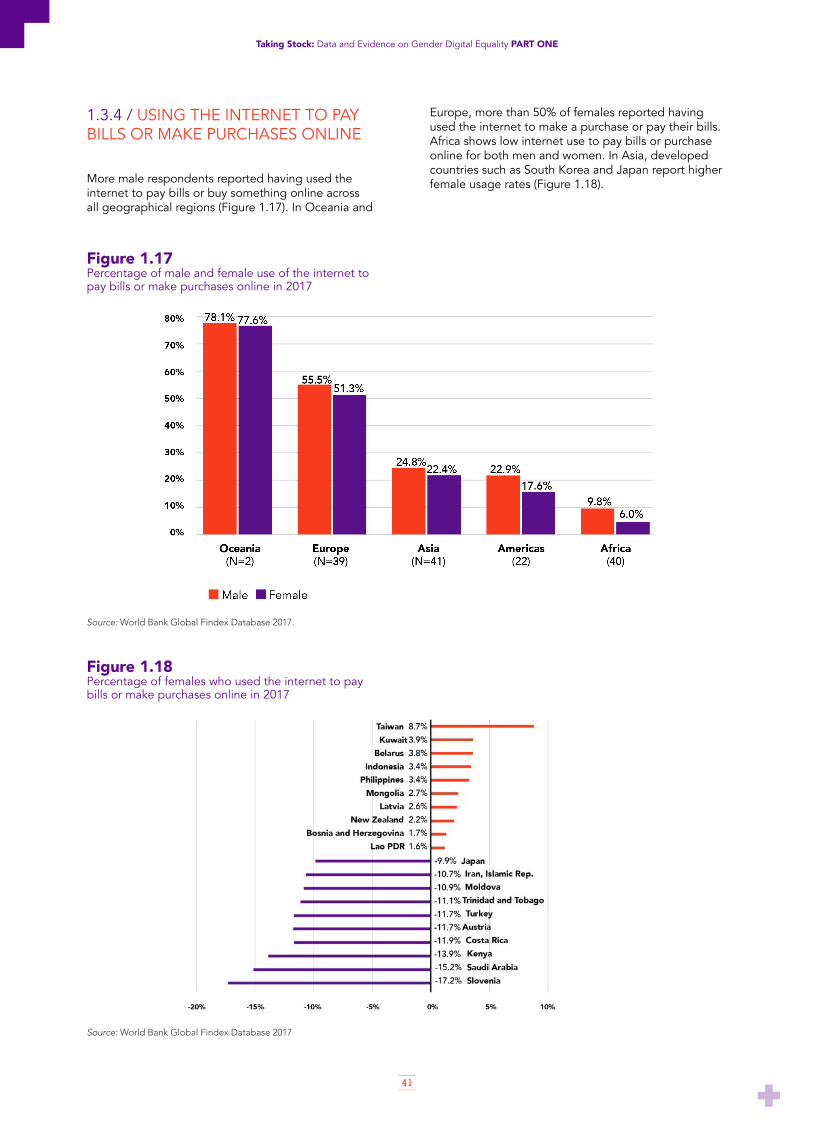
41
Taking Stock: Data and Evidence on Gender Digital Equality PART ONE
Figure 1.17Percentage of male and female use of the internet to pay bills or make purchases online in 2017
Figure 1.18Percentage of females who used the internet to pay bills or make purchases online in 2017
Source: World Bank Global Findex Database 2017.
Source: World Bank Global Findex Database 2017
1.3.4 / USING THE INTERNET TO PAY BILLS OR MAKE PURCHASES ONLINE
More male respondents reported having used the internet to pay bills or buy something online across all geographical regions (Figure 1.17). In Oceania and
Europe, more than 50% of females reported having used the internet to make a purchase or pay their bills. Africa shows low internet use to pay bills or purchase online for both men and women. In Asia, developed countries such as South Korea and Japan report higher female usage rates (Figure 1.18).

42
Taking Stock: Data and Evidence on Gender Digital Equality PART ONE
Figure 1.19Gap between men and women who used the internet to pay bills or make purchases online in 2017 (top and bottom 10 countries)
Source:World Bank Global Findex Database 2017
Even for countries with high women’s usage rates, women can still be at a disadvantage in relation to men, as in the case of Austria, Japan, and Slovenia (Figure 1.19). Those countries where more women than men use the internet to pay bills or make online purchases, such as the Philippines and Laos, in fact show low usage by both men and women.
1.3.5 / MOBILE MONEY ACCOUNT
The survey on use of mobile money services excludes developed markets in the Americas (such as Canada and U.S.) and most of Europe (except Romania and Albania). We can still observe the same trend: women show less use of mobile money services than men,
and their overall average across all regions is less than 20% (Figure 1.20). There are countries where women use these services more than men, as in Lesotho and Jamaica; however, these differences are relatively small compared to the bottom 10 countries, where the percentage difference between women and men can be greater than 10% (Tanzania, Bangladesh, and Uganda) (Figure 1.21).

43
Taking Stock: Data and Evidence on Gender Digital Equality PART ONE
Figure 1.20Percentage of male and female use of mobile money services in 2017
Figure 1.21Gap between men and women who used mobile money services in 2017 (top and bottom 10 countries)
Source: World Bank Global Findex Database 2017
Source: World Bank Global Findex Database 2017

44
Taking Stock: Data and Evidence on Gender Digital Equality PART ONE
1.4 / CONCLUSION
This chapter highlights the state of gender digital inequality across several dimensions of basic access and meaningful use. For basic access, available data suggest that gender gaps exist irrespective of the overall level of access. This is true across the four basic access indicators: computer use, mobile phone ownership, mobile phone use, and access to the internet. Beyond basic access, gender inequalities exist in terms of meaningful use, as represented here by data on use of digital financial services — perhaps the only area of meaningful use for which comparative data are available. Even for existing indicators, better data and wider country coverage are needed.
In general, the current state of gender inequality in basic access is well known. We are only beginning to understand the types and levels of inequality between men and women in their use of ICT services, once basic access issues are resolved. While significant progress has been made in establishing measurement standards and definitions to collect gender-disaggregated data on ICT access and use, more needs to be done to achieve global coverage.
REFERENCES
Broadband Commission. (2017). Working Group on Education: Digital skills for life and work. Retrieved from: http://unesdoc.unesco.org/images/0025/002590/259013e.pdf.
Decent Jobs for Youth. (2017). Digital skills: preparing young people for the future of work in the digital economy, thematic priority of the global initiative on decent jobs for youth. Retrieved from: https://www.decentjobsforyouth.org/wordpress/wp-content/uploads/2017/11/Thematic-Plan-1-Digital-Skills.pdf
Deen-Swarray, M., Gillwald, A., & Morrell, A. (2012). Lifting the veil on ICT gender indicators in Africa. Cape Town: Research ICT Africa and University of Cape Town. Helsper, E. J., & van Deursen, A. J. A. M. (2015). The Third-Level Digital Divide: Who Benefits Most from Being Online? In: Communication and Information Technologies Annual (Vol. 10, pp. 29–52). Emerald Group Publishing Limited. https://doi.org/10.1108/S2050-206020150000010002
Highet, C., Skelly H., Tyers, A. (2017). Gender and Information Communication Technology Survey Toolkit. Retrieved from: https://www.usaid.gov/sites/default/files/documents/15396/Gender_and_ICT_Toolkit.pdf
International Telecommunication Union. (2017). Measuring the Information Society Report 2017, Volume 1. Geneva: ITU. Retrieved from: https://www.itu.int/en/ITU-D/Statistics/Documents/publications/misr2017/MISR2017_Volume1.pdfLee, H., Park, N., Hwang, Y. (2015). A new dimension of the digital divide: Exploring the relationship between broadband connection, smartphone use and communication competence. Telematics and Informatics, 32(1), 45-56.
Rice, R., Katz, J. (2003). Comparing internet and mobile phone usage: Digital divides of usage, adoption, and dropouts. Telecommunications Policy 27 (2003), 597-623.
GSMA. (2018). Connected Women, The Mobile Gender Gap Report 2018. Retrieved from: https://www.gsma.com/mobilefordevelopment/wp-content/uploads/2018/04/GSMA_The_Mobile_Gender_Gap_Report_2018_32pp_WEBv7.pdf
Scheerder, A., van Deursen, A., & van Dijk, J. (2017). Determinants of internet skills, uses and outcomes. A Systematic Review of the Second- and Third-level Digital Divide. Telematics and Informatics, 34(8), 1607–1624. https://doi.org/10.1016/j.tele.2017.07.007
Schradie, J. (2011). The digital production gap: The digital divide and Web 2.0 collide. Poetics, 39 (2011), 145-168.
Swedish International Development Cooperation Agency (SIDA). (2015). Gender and ICT. In: Gender Tool Box [Brief]. Retrieved from: https://www.sida.se/contentassets/3a820dbd152f4fca98bacde8a8101e15/gender-and-ict.pdf
Tsetsi, E., & Rains, S. A. (2017). Smartphone internet access and use: Extending the digital divide and usage gap. Mobile Media and Communication, 5(3), 239-255. DOI: 10.1177/2050157917708329
Van Deursen, A. JAM & Van Djik J. AGM. (2013). The digital divide shifts in differences in usage. New Media & Society, 16 (3), 507-526.
Van Djik, J.A.G.M. (2006). Digital divide research, achievements and shortcomings. Poetics, 34(4-5), 221-235.
Warschauer, M. (2003). Technology and social inclusion: Rethinking the digital divide. Cambridge, MA: MIT Press.
Databases consulted:• ITU- World Telecommunications/ ICT Database• UNCTAD Global Cyberlaw Tracker• UN Stats- SDG Database• World Bank- Findex Database• World Bank Women Business, and the Law Report
2018

45
Taking Stock: Data and Evidence on Gender Digital Equality PART ONE

46
GENDER EQUALITY IN ICT SKILLSAUTHOR: JUHEE KANG AND DON RODNEY JUNIO (UNU-CS)
2

47
Taking Stock: Data and Evidence on Gender Digital Equality PART ONE
KEY FINDINGS
• According to the available data, women are less likely than men to have advanced digital skills in the majority of reporting countries.
• While STEM education can provide the foundation for advanced digital skills and a career in the tech industry, girls in secondary education tend to have lower self-efficacy and interests in studying STEM subjects as well as lower aspirations for STEM careers.
• Only 35% of women major in STEM subjects at higher education; within STEM majors, they tend to study natural sciences more than applied sciences related to ICT.
• Multiple pathways have been developed to equip girls and women with advanced digital skills, such as coding schools, bootcamps, and makerspaces, but their effectiveness in enhancing gender equality in ICT skills has yet to be assessed.
2.1 / INTRODUCTION
As ICTs are increasingly ingrained in our everyday life, the ability to make use of digital technology has become an essential competency in modern societies. Despite their potential to empower women, ICTs are enmeshed with existing gender inequality, hindering women’s participation in the production, management, and use of technology. As the previous chapter demonstrated, considerable gender gaps exist beyond basic access, extending to differential utilisation of ICTs by gender. More than ever, it becomes critical to ask whether men and women have different digital skills not only for accessing and using ICTs, but also for creating digital technologies, ICT services, and contents. Further, where gender gaps exist, it is important to examine whether women and girls have access to equitable education and relevant trainings to obtain adequate digital skills for thriving in the ICT-driven future on par with men. Such understanding will be valuable to achieve the UN’s Sustainable Development Goals 4 and 5, which emphasise (among other goals) inclusive technical, vocational, and higher education for all, including women and the marginalised (Box 2.1). Examining the current contour of our knowledge on gender equality in digital skills, this chapter explores the question: What is the current status of gender equality in digital skills beyond ICT literacy, and what are the opportunities for girls and women to participate in cultivating advanced digital skills?
Box 2.1Women’s Digital Skills and the SDGs
2.1.1 / WHY IS IT IMPORTANT FOR WOMEN TO HAVE EQUAL DIGITAL SKILLS?
Gender gaps in digital skills can have significant ramifications for women’s participation in the digital society, especially as we face the so-called 4th Industrial Revolution. Approaching the 2020s, we must expect seismic changes driven by emerging technologies such as artificial intelligence, robotics, internet of things, and biometrics, to mention a few. These new technologies will digitise, automate, and interconnect our everyday functioning across all sectors, in a way that changes how we live, work, and learn (Schwab, 2017). Like other technical revolutions, these changes will come with several challenges affecting the lives of both women and men, and in some regards it may strike women harder than men.
One foreseeable change is the reconfiguration of jobs. By 2020, it is expected that more than 7.1 million jobs will be displaced due to automation and disintermediation, according to a forecast by the World Economic Forum (WEF, 2016). Most of the estimated job loss (4.7 million) will come from office and administrative jobs, of which women perform a larger share, in most countries. The 4th Industrial Revolution will also create 2.1 million new jobs — mostly relating to computing, mathematics, architecture, and engineering (0.7 million). Yet the current participation of women in these booming fields, as discussed in detail in Chapter 3, is low and problematic. Indeed, despite growing job demands for skilled ICT workers, there is a shortage of women equipped with advanced digital skills ( Box 2.2). The gender gap in
Education and training are critical to cultivating digital skills for both men and women. The 2020 Agenda for Sustainable Development Goals underscores the inclusive and equitable education and lifelong learning (SDG 4) and gender equality and empowerment of girls and women (SDG 5). It sets specific targets including:
Target 4.3: ensure equal access for all women and men to affordable quality technical, vocational and tertiary education including university Target 4.4: substantially increase the number of youth and adults who have relevant skills, including technical and vocational skills, for employment, decent jobs and entrepreneurship
Target 4b: substantially expand the number of scholarships available to developing countries…for enrolment in higher education, including vocational training and ICT, technical, engineering and scientific programmes in developed and developing countries

48
Taking Stock: Data and Evidence on Gender Digital Equality PART ONE
digital skills is most notable in high-level digital skills, and in many countries it is widening due to persistently low numbers of young women studying ICT-related majors at tertiary-level and beyond. If this trend persists, we may continue living in a world driven by technologies that are mostly designed, produced, and managed by men.
2.1.2 / MEASURING GENDER EQUALITY IN DIGITAL SKILLS
Assessing the state of gender equality in digital skills begins with defining digital skills. Until recently, digital skills were understood as more or less equivalent to digital literacy or basic skills to access ICTs. International organisations such as the International Telecommunication Union (ITU) as well as many national governments usually measure digital skills by the range of activities one can perform on a PC
or the internet. Although these data are increasingly sex-disaggregated, this techno-specific approach has drawbacks. It requires a constant update of its definition and measurement, in response to rapid technological change. Moreover, just as literacy only asks whether one can read rather than what one reads, this literacy-oriented approach fails to capture the breadth and depth of digital skills related to a variety of ICT activities.
Recognising these limits, researchers have made efforts to reconceptualise digital skills as a multifaceted concept (Box 2.3). Cutting across the various frameworks, digital skills are commonly classified into three types: basic skills to access ICTs; intermediate skills to use ICTs as effective digital citizens; and high-level skills to create ICTs and participate in the ICT industry. Yet, beyond the basic skills, these emerging frameworks have not yet been extensively discussed or agreed on at the international level. Globally comparable data are rare, as researchers are still developing new methodologies to measure the comprehensive dimensions of digital skills beyond ICT literacy. Furthermore, these frameworks are often designed for a general populace, without acknowledging the issues of global inequalities of income, race, and gender. Differential needs and contextual barriers associated with women and social minorities are not yet fully reflected in these early efforts. It is essential to begin a global dialogue on how digital skills can be reframed in consideration of women and social minorities, before these frameworks are fully established. To do so, we need more evidence-based research to understand the current gender gaps in digital skills and to what extent women and minorities are discouraged from acquiring and utilising more-than-literacy digital skills.
The job demand for skilled-ICT workers is expected to grow fast, as ICTs permeate all industry sectors including manufacturing, transport, healthcare, banking, retail, energy, military, farming, education, and so on. In Europe, it is forecasted that 9 out of 10 jobs will require some kinds of digital skills in the future (European Commission, 2017), while the shortage of skilled workers in the ICT sector will double — from 373,000 in 2015, to 756,000 by 2020 (European Parliament, 2017). In the U.S., it is projected that employment in computer-specific jobs will grow 13% by 2016, faster than all other occupations. Besides the growing quantity of demand, the quality and types of ICT skills required by industry are also changing (see Chapter 13). Certain skills are already in high demand, including expertise in software development, cloud computing, big data, and information security. Other high employment areas may include mobile app/web development, data science, cybersecurity, and emerging technologies, such as machine learning, artificial intelligence, and augmented reality. Despite the growing demand, however, the share of women equipped with such ICT skills is low. The data from OECD countries show that just 1.4% of female workers have jobs developing, maintaining, or operating ICT systems, compared to 5.5% of male workers (OECD, 2017). Moreover, the current gap is expected to get worse, with the stagnating female participation to STEM education in many developed countries.
Box 2.2 Women’s ICT leadership and the SDGs

49
Taking Stock: Data and Evidence on Gender Digital Equality PART ONE
To facilitate our understanding of gender equality in di-gital skills, this chapter provides an analysis of available sex-disaggregated data on certain aspects of digital skills (Box 2.4)1. First we summarise existing data on basic digital skills and advanced ICT skills. We then take a closer look at women’s current participation in ICT and science, technology, engineering, and mathematics (STEM) education, as a proxy for gender equality in the general pathways to high-level digital skills. Finally, we explore recent developments in creating alternative pathways to cultivate women’s high-level skills, such as coding education, massive open online courses (MOOCs), and hackerspaces or makerspaces.
1 There are several different approaches to collect data on digital skills. First, standardised tests can provide the most accurate assessment of one’s skills, but such measures are costly and difficult to expand in scale. Most available data on digital skills are collected via self-reported surveys which individuals assess one’s level of knowledge in performing a range of ICT-based activities. For high-level digital skills, it is often estimated via proxies such as qualifications obtained from educational or training programs relevant to ICT specialisation, or in some cases, occupations or salaries to indicate the economic returns of having a certain level of digital skills. In many countries, the status of gender equality in high-level digital skills is often measured by comparing the number of female and male students who enrolled or graduated in STEM majors at tertiary-level education.
Definitions of digital skills need to be constantly updated in response to rapid technological change. The type of skills required to participate meaningfully in today’s digital economy are very different from a decade ago, and various organisations have adopted different ways of defining digital skills. The United Nations (2017) refers to digital skills as “a range of different abilities, many of which are not only ‘skills’ per se, but a combination of behaviours, expertise, know-how, work habits, character traits, dispositions and critical understandings”. OECD (2016) categorises digital skills into three groups: ‘ICT complementary skills’ for everyday uses; ‘ICT generic skills’ for work; and ‘ICT specialist skills’ to develop technology. The Broadband Commission (2017) defines digital skills as “a range of different abilities, many of which are not only ‘skills’ per se, but a combination of behaviours, expertise, know-how, work habits, character traits, dispositions and critical understandings”. They also conceptualise digital skills as a “gradual continuum” from basic functional skills to high-level skills, with a range of intermediate skills existing in between. The European Commission recently developed the “Digital Competence Framework for Citizens” which identifies and describes key areas of digital competence, providing a conceptual reference model for Europe. In the EC framework, digital skills comprise five core skills: (i) information and data literacy; (ii) communication and collaboration — interacting through digital technologies; (iii) digital content creation; (iv) safety; and (v) problem solving. Translating this concept into a measurable standard, Eurostat has developed a digital skills composite indicator, based on selected activities related to individuals’ internet or software use in four specific areas (information, communication, problem solving, and software skills). ITU (2018) also suggest five different skills for youth employment, including basic skills for using ICTs, advanced skills for developing ICTs, mid-level skills for producing content, soft skills for collaborating, and digital entrepreneurship skills for doing business. According to ITU, basic digital skills refer to effective use of technology including (for example) web search, online communication, use of professional platforms, and digital financial services. Intermediate skills refer to skills needed to perform work-related functions, such as graphic design and digital marketing; while advanced skills refer to skills that are necessary to create, manage, and test ICTs, including coding.Another useful way of examining digital skills is to see it as part of a continuum across three levels: basic, intermediate, and advanced. The Decent Jobs for Youth Initiative, under the lead of the International Labour Organisation, adds to these three types of skills soft skills and digital entrepreneurship skills, as essential to succeed in the digital economy.
Current status of Gender Equality in Digital Skills - Basic Digital Skills- Intermediate Skills- Advanced Skills: Programming Skills
Gender Gaps in Pathways to Develop Digital Skills: STEM Education - Secondary Education a.Gender Gap in STEM participation and performance b.Gender Gap in STEM motivation, confidence and aspiration
- Higher Education a.STEM Participation b.Within STEM Gender Gap c. Global STEM and Gender Gap
Alternative Pathways to Develop Digital Skills - Introductory Computing Education- Coding Bootcamp - MOOC- Maker/Hackerspace
Box 2.3Global efforts to redefine digital skills
Box 2.4Aspects of Gender Equality in Digital Skills

50
Taking Stock: Data and Evidence on Gender Digital Equality PART ONE
2.2 / BASIC DIGITAL SKILLS
Basic digital skills are the minimum foundational skills required to function effectively in the digital economy; they are an integral part of higher-level digital skills. Understanding the issue at this level could provide
insights to shape policy proposals with a broader impact. It is also the area where initial work has been done to operationalise and measure the concept, and where gender disaggregated data are available. As part of the World IT Database, the ITU has collated nine indicators of digital skills (Figure 2.1).
Figure 2.1Aspects of Gender Equality in Digital Skills
ITU’s data on digital skills provide a starting point to assess the gender divide on basic digital skills. Of the nine available indicators, we select eight skills that can be classified as basic digital skills to examine the gen-der divide in these areas. Complete data are reprodu-ced in Appendix C.
Table 2.1 provides a broad summary of data on the per-centage of women with the relevant ICT skills clustered by region and skills type. We note that for countries in Africa and the Americas where data are available, the percentage for all eight skills categories falls below 50%. The types of skills with the highest reported percentage of women in those regions are copying or moving a file or folder (42.2%) and using copy and paste tools to duplicate or move information within a document (42.1%). The skill with the lowest percentage in those regions is creating an electronic presentation (0.1%), followed by using basic arithmetic formula in a spreadsheet (1.4%).
In Asia and Europe, there can be extreme variations within the region, even when on average more than 50% of women are reported able to perform a particu-lar skill. In Asia, for example, 89% of women in Brunei are able to copy or move a file or folder, compared to only 3% in Pakistan. In Europe, while 68% of women in Netherlands can find, download, install, and configure software, only 2% of women from Russia are reportedly able to perform the same task. Where data are available for the eight basic skill ca-tegories, in most countries men outperform women; in 35 countries there is no skill area where women outperform men (as illustrated below in Figure 2.8). In 14 countries, women outperform men in one or two skills; in two countries, women outperform men in three
to four skills; and in two countries, women outperform men in five or more skills areas.
At the country level, more men than women reported having a specific digital skill in the majority of countries across Africa, Americas, Asia (Table 2.2), and Europe (Table 2.3). Tables 2.2 and 2.3 show that not all coun-tries with a high percentage of men and women repor-ting ability for a specific skill would necessarily have a low difference in ability, as in Bahrain (see Appendix C). Statistics cannot tell a complete story: the issues underlying the disadvantages faced by women and girls may be very different in different countries. Furthermo-re, self-reported data may not be completely reliable, as multiple studies find that males tend to overestimate their digital skills while females do the opposite (see Section 2.5.1.2, Attitudes about STEM education).
The reported or perceived low ability of women in basic digital skills should be a cause for concern. If women and girls are disadvantaged at the level of basic skills, we can expect to see greater gender digital divides in higher ICT skills and ICT leadership.

51
Taking Stock: Data and Evidence on Gender Digital Equality PART ONE
Table 2.1Percentage of women with ICT skills by region
Source: ITU WTI Database, 2017.
Note: Red –low percentage reporting ability to perform the specific skill (bottom quintile). Purple – high percentage reporting ability to perform the skill (top quintile). Color range: red, pink, gray, lavender, purple.

52
Taking Stock: Data and Evidence on Gender Digital Equality PART ONE
Table 2.2Difference in percentages between males and females on different aspects of digital skills in Africa, the Americas and Asia
Note: Red – low percentage reporting ability to perform the specific skill (bottom quintile). Purple – high percentage reporting ability to perform the skill (top quintile). Color range: red, pink, gray, lavender, purple.
Figure 2.2Number of countries with greater percentage of skilled women than men, per number of skills
Source: ITU WTI Database, 2017.

53
Taking Stock: Data and Evidence on Gender Digital Equality PART ONE
Table 2.3Difference in percentages between males and females on different aspects of digital skills (Europe)
Note: Red – low percentage reporting ability to perform the specific skill (bottom quintile). Purple – high percentage reporting ability to perform the skill (top quintile). Color range: red, pink, gray, lavender, purple.

54
Taking Stock: Data and Evidence on Gender Digital Equality PART ONE
2.3/ INTERMEDIATE DIGITAL SKILLS
Beyond basic skills, there is currently no globally comparable data that, comprehensively measure the multiple dimensions of digital skills, due to the absence of internationally agreed definitions and methodologies. Some recent data may provide snapshots of the gender gap in intermediate digital skills.
Studies show that 90% of Wikipedia contributors and 69% of Wikipedia readers are male (Wikipedia Foundation, 2011; Glott, et. al, 2010; Economist, 2018). Although social media is more popular among women
than men in most advanced countries, far fewer women in developing countries use it (Pew Research, 2018), possibly reflecting a lack of intermediate skills (such as downloading an app). The Pew survey of 39 countries found a large gender gap favouring men in social media use in Tunisia, Ghana, India, Kenya, and Senegal (Figure 2.3). Similarly, fewer women overall use mobile finance services than men (see Chapter 1). This evidence on differential use of ICTs by gender indicates a possible gender gap in intermediate skills in everyday ICT uses.
Figure 2.3Gender divide in social media use
Source: Pew Research, 2018.Note: Percentage of adults who use social networking sites
Assessing the gender gaps in intermediate digital skills is conceptually and methodologically challenging. With a vast range of everyday digital activities performed on multiple ICTs, it is difficult to measure overall skill gaps. Moreover, differential uses of ICTs by gender may reflect different levels of motivation, social influence, enabling contexts, or structural barriers. Finally, most of the data on online activities is held by private firms and rarely disclosed fully. Thus, it is difficult to assess how many women have the skills (or have already begun) to sell products on Amazon or Alibaba, view or post videos on YouTube, or install anti-virus software.
Beginning in 2014, the European Commission (EC) started to collect data from its 28 member-states on more comprehensive dimensions of digital
skills. Reflecting the new framework for “Digital Competence Framework for Citizens”, it measures digital skills in four different categories: information, communication, problem-solving, and software skills (Table 2.4). Compared to the ITU data on basic skills, a greater variety of digital activities are included, such as seeking information, using social media, uploading contents, using online learning, selling online, and writing a code. (Note that each of these categories may include a range of skill levels, from basic to advanced; the EC survey relies on individuals’ self-reports).

55
Taking Stock: Data and Evidence on Gender Digital Equality PART ONE
Table 2.4European Commission comprehensive digital skills
Source: European Commission, 2015.
Figure 2.4Gender difference in overall digital skills and by age
Source: Eurostat, 2017.
In the EC findings, a sex-disaggregated analysis shows no gender gap in basic digital skills. However, slightly more men (31%) than women (27%) reported having “above basic” digital skills (Figure 2.4). Among those with “above basic skills”, the gender gap increases with age. Except the young group
(i.e., teens and young adults), moderate gender gaps exist disfavouring women: among the adult group, 4 percentage points, and among elders (over 55 years old), 5 percentage points.

56
Taking Stock: Data and Evidence on Gender Digital Equality PART ONE
Figure 2.5Gender difference among those with above digital skills by skill types (Europe
Source: Eurostat, 2017.
Figure 2.6Gender difference among those with above digital skills by skill types (Europe
Source: OECD, 2017
The group with “above basic” digital skills shows some variation by specific skill types. There are only minimum differences between men and women in information and communication skills. However, more men than women have higher skills in both problem-solving and software skills, by 7 percentage points
(Figure 2.5). This finding indicates that European women are generally less skilled than men in handling computer or mobile applications, managing data, using the internet for business and learning, or creating software and digital content.
The OECD’s Survey of Adult Skills (PIAAC) also provides sex-disaggregated data on applied ICT skills (OECD, 2016b). Along with literacy and numeracy, it assesses the ability to solve problems in technology-rich environments, which require integrated skill-sets of digital competency and cognitive abilities such as acquiring, evaluating, and organising information from ICTs. While the digital skills data from the EC and ITU are measured by self-reported surveys, the PIAAC uses a standardised test based on role-playing scenarios. “Acting” as a job seeker, the respondent is given multiple tasks such as: using a search engine to find a job agency, evaluating the information, registering, and bookmarking the page.
The OECD’s sex-disaggregated data on problem-solving skills shows moderate gender differences overall (Figures 2.6). In the lower level groups (Level 1 and below), women predominate slightly, while in the higher score groups (Level 2 and 3) there are slightly more men. The country breakdown of the highest-level group shows a larger (but still moderate) gender gap among the countries with stronger economies, such as Japan (5.1 points), UK (3.7), Ireland (3.1), Netherlands (3.1), and Germany (2.7) (Figure 2.7).

57
Taking Stock: Data and Evidence on Gender Digital Equality PART ONE
Figure 2.7Gender gap in Level 3 ICT-based problem-solving skills (OECD countries)
Source: OECD Survey of Adult Skills, 2016.
The data on the advanced economies of Europe and OECD countries suggest — in the absence of global data — that the gender gap becomes greater (in favour of men) in higher-level skills. In the following section, we examine the sex-disaggregated data on programming skills and data sciences, as two examples of high-level digital skills.
2.4 / ADVANCED SKILLS: PROGRAMMING
ITU’s World ICT Development Indicator database includes one advanced digital skill — “write a computer program using a specialised programming language”. The data covers 49 countries; it is based on self-reported surveys and is sex-disaggregated. On average, only 3.5% of women in the reporting countries can write a computer program, as compared to 7.8% of men. At the country level, the share of females who used programming skills in the last year was higher than average in Brunei Darussalam (17%), Iceland (12%), Bahrain (11%), Denmark (9%), and Greece (6%), but lower than the average in most
reporting countries. Figure 2.8 presents the difference in programming skills between men and women by country. Interestingly, the percentage gap is wider among advanced economies in Scandinavia and Western Europe, such as Luxembourg (12.7), Iceland (11.9), Norway (10.9), Sweden (10.6), Denmark (10.4), and Belgium (10.2); it is much smaller in less advanced or developing countries such as Qatar (-1.0), Brunei Darussalam (0), Zimbabwe (0.3), Egypt (0,4), Iran (0.5), Romania (0.8), and Russia (0.9). Similar patterns will also be seen in the following section on STEM education, at the secondary and tertiary levels.

58
Taking Stock: Data and Evidence on Gender Digital Equality PART ONE
Figure 2.8Gender gap in programming skills by country
Source: ITU WTID Database, 2017.
2.5 / PATHWAYS TO DEVELOP DIGITAL SKILLS: STEM EDUCATION
The gender gap in digital skills is more pronounced in the high-level skills required to create ICT software, hardware, and content — and this critical skills gap is closely related to gender imbalance in employment and leadership in the ICT and tech industry. Higher education in STEM and ICT is often seen as a pathway to acquiring the high-level digital skills required for ICT, science, and technology professions. (See Chapter 12 for discussion of the role of educational institutions.) For instance, most senior software developer positions require a college or graduate degree in computing disciplines, while system engineers or robotics designers would need at least some STEM education at the tertiary level. This pathway is more than a standard college education; described as a “STEM pipeline”, it involves early education, secondary school specialisation, undergraduate major, and a master’s or Ph.D. degree.
2.5.1 / SECONDARY EDUCATION
Girls’ and women’s participation in education has made significant progress in the last two decades. According to UNESCO’s school enrolment data in 2015, global average figures show gender parity in both primary and secondary education, although the gender gap persists in some regions, including sub-Saharan Africa and Western Asia. The number of countries reporting gender parity in both primary and secondary education has almost doubled, from 36 in 2000 to 62 in 2015 (UNESCO, 2015). As illustrated in Figures 2.9 and 2.10, the available data shows that the learning gap between boys and girls is also closing in many countries (UNESCO, 2017). Still, considerable gender differences exist in students’ level of interest in STEM subjects and motivation for STEM careers. However, caution is needed when interpreting global data due to the limited data availability, particularly from developing countries, and due to the complex variation that may exist within a region or country. Also, there is a lack of globally comparable data relating to the drivers and barriers of achievement, beyond school enrolment and test scores.

59
Taking Stock: Data and Evidence on Gender Digital Equality PART ONE
Figure 2.9Percentage of grade 12 female students taking advanced math or physics courses
Source: TIMSS Advanced, 2015
2.5.1.1 / Participation and achievement
Several studies suggest that early exposure to STEM subjects is critical in students’ decision to specialise in higher education and future careers (Kermani & Aldemir, 2015; Lee, et al., 2011). In most countries, math and sciences are part of the core national curriculum for all primary and secondary students, so educational exposure to STEM subjects is more or less similar for boys and girls at the primary and lower-secondary level. The gender gap in STEM participation begins to be more noticeable in lower secondary education, when students start to make choices for
subject specialisation (UNESCO, 2017; Spearman & Watt, 2013). A survey of young women in 12 European countries shows that girls become interested in STEM between the ages of 11 and 12 (Microsoft, 2017). With a lack of sex-disaggregated data on students’ selection of specialisation courses, it is hard to confirm whether gender gaps exist at that stage. Among the very few available data, the Trends in International Mathematics and Science Study (TIMSS) Advanced 2015 shows that more boys than girls take advanced math or physics in Grade 12 (Figure 2.8); note that the data is limited to only nine countries (IEA, 2016; UNESCO, 2017).
Internationally standardised test scores show only marginal differences between girls and boys in lower secondary education. According to the Programme for International Student Assessment (PISA) data published in 2015, at age 15 girls outperform boys by almost 27 points in reading, but they slightly underperform in math and science, by 8 and 4 points (Figure 2.10). Similar patterns are found in TIMSS scores and other regional education data, according to a study by UNESCO (2017).

60
Taking Stock: Data and Evidence on Gender Digital Equality PART ONE
Figure 2.10Gender difference in student performances at grade 8 (total scores)
Source: TIMSS Advanced, 2015
Figure 2.11Number of countries with gender gaps in science and math scores in 2015)
Source:TIMMS, 2017.
Figure 2.11 shows that close to or more than half of the countries studied in TIMSS 2015 showed no gender difference in math and science performance. For Grade 8 science, a substantially larger number of countries reported girls scoring higher than boys.

61
Taking Stock: Data and Evidence on Gender Digital Equality PART ONE
Although the TIMSS 2015 data is based on less than 50 countries and covers only a few least developed countries, the participating countries are relatively diverse and regionally proportionate. It can provide a useful outline of gender gaps in student STEM performance in different social, economic, and political contexts. Math score differences by gender and country (Figure 2.12) show regional contrasts. Several European countries (Italy, Croatia, Spain,
Slovakia, Portugal, Netherlands, and Denmark) showed a conventional gender gap, with boys scoring higher in math than girls. In contrast, countries in Western Asia (Saudi Arabia, Oman, Jordan, Bahrain, and Kuwait) show girls performing better than in math boys. This pattern of country variation will be re-visited in the following section on gender and STEM in higher education.
Figure 2.12Gender differences by countries in math scores at grade 4
Source: TIMSS, 2015
2.5.1.2 / Attitudes about STEM education
Beyond the gender gaps in school enrolment or test results, several studies suggest that considerable gender differences exist in relation to students’ attitudes and perceptions. Such attitudinal or psychological differences may include an internalised belief in their ability in STEM, their interest and motivation to study STEM subjects, and an aspiration to pursue a career in STEM. Given the lack of internationally comparable data measuring these psychological factors, we can only glimpse the picture by using psychometric indicators of the PISA data, coupled with a few small-scale surveys with limited geographic coverage.
Confidence. Significantly, girls tend to be less confident than boys about STEM subjects. Several studies have found that self-concept (a belief in one’s abilities) and self-efficacy (a belief that one can do a certain task) affect successful learning and advancement (Pajares & Miller, 1994; Bandura, et al., 2001; MacPhee, et al., 2013). Notably, girls tend to have less self-confidence in math and sciences and feel more anxious than boys about their ability to solve problems in those subjects (OECD, 2015). Figure 2.13 shows that girls in OECD countries have much lower self-confidence in math and sciences than boys. Similarly, in a survey of 7,411 students in Vancouver, female students had lower self-perceived ability than males relating to STEM subjects including computer science, engineering and physics and gave lower estimates of their computer skills (Chan, et. al., 2001).

62
Taking Stock: Data and Evidence on Gender Digital Equality PART ONE
Interest. Girls are reported to be less interested than boys in STEM subjects. Studies show that girls tend to lose interest in STEM earlier than boys do, often during their adolescence and before they choose a specialisation (UNESCO, 2017). A survey of 11,500 girls in 12 European countries shows differences by age2. As shown in Figure 2.14, girls’ average interest in STEM peaked at 12 and continued to decrease until 17 and 19, when they would usually make decisions on majors in higher education (Microsoft, 2017).
2 The 12 countries are Belgium, Czech Republic, Finland, France, Germany, Italy, Ireland, Netherlands, Poland, Russia, Slovakia, and the UK.
A study in the UK found that boys and girls were almost equally interested in STEM at the age of 10 and 11 (75% of boys versus 73% of girls), but the gender gap became wider at the age of 18 (33% of boys versus 19% of girls) (Kearney, 2016).
Figure 2.13Gender difference in math self-concept
Source: OECD PISA, 2012.
Figure 2.14Changing interest in STEM by age among young European females
Source: Microsoft, 2017.

63
Taking Stock: Data and Evidence on Gender Digital Equality PART ONE
Figure 2.15Popular career choices among OECD students
Source: OECD, PISA 2006 database; OECD, 2015
Aspiration. Girls tend to have less aspiration for STEM career. Studies based on the PISA data found that, while girls tend to be more ambitious than boys, only 5% of girls in OECD countries expected a career in computing and engineering when they grew up, compared to 18% of boys who wanted to work in these fields (Sikora & Pokropek, 2011). The list of popular career choices shows a clear difference between boys
and girls: ICT-related occupations do not appear at all in the girls’ list of dream careers, while boys highly rank engineers, computer programmers, and other ICT-related professions (Figure 2.15). There was no OECD country where more girls than boys were interested in entering computing and engineering careers.
Despite the efforts by many governments to include more girls and women in STEM education, this gender gap in student’s aspiration in STEM careers seems to have persisted over at least the past decade. Initially collected in 2006, the data has barely changed in the latest survey of OECD countries. According to PISA data from 2015, similar percentages of boys (25%) and girls (23.9%) are interested in pursuing some type
of science-related career. Within the science field, however, girls are much more inclined to pursue health professions (doctors, nurses, and healthcare workers); only 0.4% of girls aspire to become ICT professionals, compared to 4.8% of boys (Figure 2.16).

64
Taking Stock: Data and Evidence on Gender Digital Equality PART ONE
Figure 2.16Expectation of science careers at age 15, by gender
Source: OECD, 2016
These data indicate that girls at the secondary level tend to have lower self-efficacy and lower interest in STEM subjects, as well as lower aspiration for STEM careers, compared to boys. While STEM education at the secondary level creates a critical foundation for further developing their high-level digital skills,
it seems that girls gradually move away from STEM studies regardless of their competence and potential. Apparently, these gender differences in attitude and motivation in STEM can affect their decision to choose a college major.
2.5.2 / TECHNICAL AND VOCATIONAL EDUCATION AND TRAINING (TVET)
Instead of following conventional academic curricula, some secondary-level students pursue vocational training to prepare early careers. While the history of vocational education is long, the term TVET (technical and vocational education and training) was internationally recognised only in 1999. TVET has received relatively little attention due to underinvestment from governments, poor institutional capacity, and low social status of TVET graduates (UNESCO, 2015b). While TVET education can also be
offered in post-secondary, tertiary, and adult life-long education, the most common approach is secondary-level training via public or private vocational schools. According to the UNESCO Institute of Statistics (UIS), globally around 10% of secondary-level students were enrolled in TVET schools in 2016, and the figure has remained almost steady since 2000. The share of female students in TVET education has hovered around 45% over the last 15 years (Figure 2.17). Regional differences exist: based on available data, participation in TVET is higher in Oceania (33.2%) and Europe (23.6%) as compared to Asia (9.3%) or Africa (5.6%).
Figure 2.17Enrolment in TVET and secondary education (in 1,000,000)
Source: UIS, 2017

65
Taking Stock: Data and Evidence on Gender Digital Equality PART ONE
The OECD data breaks out the gender gap in secondary vocational education by specialisation (OECD, 2017b). In OECD countries, most upper secondary vocational graduates earn a diploma with a specialisation in either engineering (33%) or business, administration, and law (19%). When the sex-disaggregated data is examined, however, it shows a considerable gender gap especially in
engineering, manufacturing, and construction, where women represent only 11% of the graduates (Figure 2.18); with the exception of Brazil and Estonia, the OECD countries show fewer than 20% of female students graduating with a vocational diploma in that specialisation. By contrast, in the health and welfare specialisation, 80% of the graduates are women.
Because ICT/computing has not been classified as a separate specialisation, we cannot say how many women specialise in ICT or high-level digital skills in their secondary vocational education. One notable case is Mirim Meister Women’s High School in South Korea, offering training in digital creation skills such as programming, app development, User Interface (UI) design, and online content production skills, with 99% of graduates starting their careers in the ICT sector.
2.5.3 / HIGHER EDUCATION IN STEM
Looking at the data for the past 15 years, three major trends are identified. First, despite significant progress in women’s participation in higher education, the percentage of women majoring in STEM studies has been remained low across the regions. Second, considerable gender-segregation exists even within STEM fields, as more women choose to study natural sciences rather than computer sciences and engineering. Third, notable country-level or regional
differences exist: the gender gap in STEM tends to be larger in countries with higher levels of gender equality — a counter-intuitive trend referred to as the “gender & STEM paradox” (Stoet & Geary, 2018).
2.5.3.1 / More women in higher education — but few in STEM
According to the UIS data, the global enrolment of female students in higher education has almost doubled since 2000, and there are now more women than men pursuing either bachelor’s degree (53%) or master’s degree (54%). The growing female participation in tertiary education has become a common trend across all regions. Europe showed the highest share of female in higher education (53.8%) and Asia the lowest (49.8%), as of 2016. Nevertheless, as shown in Figure 2.19, the share of women in STEM majors has remained low, averaging less than 35% of total graduates in STEM in the past decade.
Figure 2.18Share of females from upper secondary vocational programs in OECD countries, by field of education
Source: OECD, 2017.

66
Taking Stock: Data and Evidence on Gender Digital Equality PART ONE
Furthermore, regardless of majors, the percentage of women proceeding to pursue a doctoral degree (45%) is still lower than for men (55%). In low-income countries, women constituted only 27% of Ph.D. students in 2015, and this has marginally decreased over the past 15 years, according to the UIS data. As discussed in Chapter 3, this leak in the pipeline contributes to the low participation of women in research, accounting for only 29% of the world’s researchers (UNESCO, 2017).
2.5.3.2 / More women in higher education — but few in STEM
As shown in Figure 2.20, women represent the majority of students enrolled in education (70%), humanities and arts (62%), and social sciences (61%). In contrast, the share of women in STEM majors is significantly lower, at 36%. Among the STEM fields, the distribution of women’s majors is heavily skewed towards natural or life sciences (54.8%) and much lower in either computer sciences (28.9%) or engineering (27.1%).
Figure 2.19Female participation in higher education and STEM (2001–2017
Source: UNESCO Institute of Statistics, 2017
Figure 2.20Percentage of female students among higher education students by field of study (2016)
Source: UIS, 2016.Note: STEM data denote the number of graduates, not total enrolment.

67
Taking Stock: Data and Evidence on Gender Digital Equality PART ONE
The underrepresentation of women in computing and engineering seems to be prevalent across the regions. In engineering and manufacturing, women are less than two-fifths of the total graduates in 103 out of 105 countries. At the national level, women represented only 18% of the graduates in computing in U.S. (National Center for Education Statistics, 2016); they were 26% of the graduates in math and computer or information sciences in Canada (Statistics Canada, 2017) and EU countries (Eurostat, 2016); 17% of the graduates in information technology and 15.6% of engineering majors in Australia (Australian Department of Education and Training, 2017); and just 14% of the engineering graduates in Japan (Ministry of Education of Japan, 2016).
Similarly, fewer women than men graduate with computing and other ICT-related majors, in most countries. In Europe, 5.7 times more men than women graduated from ICT studies in 2015; only 1.2% of female graduates chose to major in ICT (European Commission, 2018b). The percentage of women majoring ICT is also low in OECD countries (19.8%), as well as in U.S. (18%), Canada (26%), and Australia (17%). The global trend has been downward over the past 15 years: the percentage of women enrolled in ICT majors dropped from 29.7% in 2000 to 20.2% in 2013, but began recovering in the past three years (UIS, 2017).
Inequality in education can be exacerbated by the intersectionality of factors such as ethnicity, income, and urban-rural location. However, such data are unavailable except for the U.S., where only small percentages of women of colour earned bachelor’s degrees in any STEM field: black women at 2.9%, Latinas at 3.6%, and Asian women at 4.8% (National Centre for Education Statistics, 2016; Aspray, 2016).
Considerable regional and national variation exists in categorising the field of education. For instance, UIS uses 11 categories, including ICT as a separate field, while OECD has more than 20 sub-categories but does not list ICT as a separate field of study. Eurostat also has 11 categories, with computing as a distinct field. Individual countries also may have their own categorisations; many classify ICTs as part of information sciences, information technology, communications, or other science disciplines.
2.5.3.3 / The gender and STEM paradox: More gender equality, fewer women in STEM
Gender-segregation in fields of study varies between developed and developing countries. In fact, the gender gap is often larger in more economically developed countries (Charles & Bradley, 2009). Exceptions are noted in Malaysia, Pakistan, and India, where more women than men participate in STEM education (Mellström, 2009; Shabib-ul-Hasan & Mustafa, 2014; Gupta, 2012). More recently, researchers have argued that countries that rank higher on the Global Gender Gap Index (GGI, measured by the World Economic Forum) — that is, those making greater progress toward gender equality — tend to have fewer women graduated with STEM degrees (e.g., Stoet & Geary, 2018). This phenomenon has been referred to as the gender paradox in STEM education.

68
Taking Stock: Data and Evidence on Gender Digital Equality PART ONE
How should we understand this paradox? Researchers interpret that, in countries with higher gender inequality, high-paying and more stable STEM occupations can be attractive options for women, who experience fewer economic opportunities as well as higher gender barriers. For instance, studies found that computer-related jobs are perceived as women-friendly and better careers for women than men in Malaysia and India (Lagesen, 2008; Varma, 2010).But this does not explain the persisting small share of women studying STEM and ICT majors in more developed countries. Even in the wealthier countries of OECD, the economic benefits of a STEM career are clear: graduates in engineering tend to earn, on average, 10% or more than other college graduates, while those in education and teacher training earn 15% less (OECD, 2016c).
The gender imbalance in fields of study is closely related to an individual’s future career and economic well-being as well as socio-political participation. Women’s individual choices may be influenced by socio-cultural factors such as parents, peer-pressure, gender-stereotyping of STEM careers, and lack of role models and mentoring. As discussed in Chapter 5, many of these factors function as gendered barriers that discourage women from pursuing studies and careers in the STEM field and developing higher-level ICT skills to design and create technology.
2.5.4 / ALTERNATIVE PATHWAYS FOR HIGH-LEVEL DIGITAL SKILLS
As a metaphor to describe the educational requirements to incubate STEM and ICT professionals, many educators prefer the term “pathway” to “pipeline” (Aspray, 2016) — emphasising that there can be multiple pathways to train the necessary digital skills rather than a single pipeline. Indeed, there are many different occupations in the tech industry, with a wide spectrum of qualification and skills that can be obtained via various educational and training pathways.
With the increasing relevance of digital skills in today’s world, we see more innovative approaches to provide STEM education, certainly in relation to computing skills. Traditionally, higher education in computer sciences or related STEM majors has been the conventional pathway to develop students’ skills for careers in tech industries. Responding to the soaring demands for a skilled ICT workforce, however, new approaches advocate that computing education should be provided for all, including children and youth, rather than only in university classrooms. Further, experts argue it is necessary to equip all citizens with computational thinking and necessary computing skills, as coding skills become a new literacy of the 21st century (Rushkoff, 2011; European Schoolnet, 2015, 2017)
Innovative initiatives include: introductory computing education for national curricula; informal or private coding schools; bootcamps; MOOCs; hacker and makerspaces. These alternative pathways present new possibilities to bring ICT skills training to more girls and young women, though as yet there is no evidence-based research to assess their impact. (Chapter 14 also discusses the promise and pitfalls of skills development through on-the-job training at call centres.)
2.5.4.1 / Introductory computing education
A growing consensus holds that computing education should be an essential part of national education. Advocates suggest that, just as schools teach children how electricity works or how body’s digestive system works, today’s children need to learn how computers, networks, and programming work, and what they mean to our society. Beyond this basic knowledge, “computational thinking” (CT) is also a critical competence to develop cognitive abilities (decomposition, recognition, abstraction, and algorithm) as well as integrated skills in problem-solving, collaboration, and creativity (Wing, 2006).
Many governments have implemented or plan to integrate computing education in their national curriculum; approaches vary from a mandatory national curriculum on computational thinking to optional basic coding courses. According to a study by European Schoolnet (2017), at least 20 European countries have integrated or are planning to adopt computing education in their curricula (Figure 2.23)3. Note that their policy documents use a variety of terms interchangeably, including coding, programming, computational thinking, problem-solving, and algorithmic thinking. The UK government replaced the existing ICT syllabus with computing education for students aged 5–16.
A survey by Google and Gallup (2016) reports that about 40% of U.S. school principals say their school offers computer classes in programming or coding; the non-profit College Board introduced a computer science exam to their roster of Advanced Placement tests. South Korea announced plans to teach programming and computational thinking through primary, secondary, and high schools beginning in 2018, while China has introductory computing courses at the high school level, with optional subjects such as algorithms, multimedia applications, network applications, data management, and artificial
intelligence.
3These 20 countries include Austria, Belgium, Czech Republic, Switzer-land, Germany, Estonia, Spain, Finland, France, Hungary, Croatia, Italy, Ireland, Lithuania, Malta, Poland, Portugal, Slovakia, UK England, and UK Scotland.

69
Taking Stock: Data and Evidence on Gender Digital Equality PART ONE
Figure 2.21Status of computing education in Europe (2016)
Source: UIS, 2017.
However, these movements are mostly very new, and there seems to be a lack of policy discussions or research on gender participation in introductory computing education. The gender barriers within current STEM education (Chapter 5) may persist despite the new initiatives. In the UK, an evaluation study of computing education shows that only 9% of girls-only schools offer computing at A-level, compared to 44% of boys-only schools and 25% of mixed-sex schools (Kemp, et al. 2016). Still needed are gender-sensitive computing curricula and institutional environments.
2.5.4.2 / Coding training
A growing number of initiatives aim to provide practical coding skills for youth and adults. Although they cannot offer the same depth of education as a conventional college education, such initiatives can be a cost-effective and efficient means of learning programming skills. A Stack Overflow survey of 64,000 global programmers shows that 76.5% of the respondents have a bachelor’s degree or higher, and about the half (54%) of those with college education have studied computer science or software engineering. However, 32% of the respondents said that formal education was not very important or not important at all to their career success. Along with the formal education, many also have taken alternative pathways, such as online courses (45%), on-the-job training (41%), and Hackathon (24%) (Figure 2.24).

70
Taking Stock: Data and Evidence on Gender Digital Equality PART ONE
Figure 2.22Importance of formal/alternative education for coding career
Source: Author’s elaboration, using Stack OverFlow Survey data, 2017.
Coding bootcamp is an intensive training programme offering practical programming and career development skills. The coding bootcamp learning experience is project-based, using lectures, collaborative work, and online exercises. There are four models, ranging from early education to ready-to-work (Table 2.5). Bootcamp students are, on
average, 29 years old, hold a university degree (71%), and are male (over 60%) (ITU, 2016). As women make up nearly 40 per cent of bootcamp participants, this option could contribute to narrowing not only the skills gap but also the employment gender gap in the technology industry.

71
Taking Stock: Data and Evidence on Gender Digital Equality PART ONE
Table 2.5 Four models of coding bootcamp
Source: Author’s elaboration, using Stack OverFlow Survey data, 2017.
Globally, a growing number of initiatives in coding education focus on girls and women. Several international organisations and national governments promote women’s advanced digital skills and support grassroots efforts to provide coding education for girls and women, as in Case Study 2.1. The EQUALS Global Partnership conducted research in 2016 to identify initiatives to bridge the gender digital divide. The research found 857 gender tech projects (as of May 2018), including 143 projects from 70
organisations in 56 countries that provide coding education for girls and women. Another 319 projects provide training on digital skills, while others focus on awareness (132), capacity building in computing (116), networking among women developers (106), and mentoring current and future female developers (81) (Figure 2.25).
Figure 2.23Digital Skills Initiatives for women, by project types and regions

72
Taking Stock: Data and Evidence on Gender Digital Equality PART ONE
Case Study 2.1#eSkills4Girls – A global initiative to promote digital skills for women and girlsAuthor: Birgit Frank (BMZ) and Vanessa Dreier (GIZ)
In conjunction with Germany’s G20 presidency 2017, the German Federal Ministry for Economic Cooperation and Development (BMZ) launched the initiative #eSkills4Girls to overcome the gender digital divide and promote education, skills, and employment for girls and women in a digital world, particularly in emerging and developing countries. The initiative found strong support among G20 member states as well as the private sector, civil society, and the general public. GIZ, as a federal enterprise, implements numerous activities under the initiative, to support the German Federal Government in achieving its goals in international cooperation, including collaboration between governments, private sector, academia and civil society organisations.
Project activities include:
Promoting role models of women and girls in tech. Female role models with successful tech careers are acknowledged with a study and a video, providing an inspiration for young women and girls to discover STEM subjects and professions.
Creating networks to foster learning among grassroots programs. In May 2017, BMZ brought together over 30 female tech leaders from all over Africa, at the #eSkills4Girls Africa Meetup, resulting in the #eSkills4Girls network to continue the dialogue.
Strategic partnerships with the private sector to promote local innovations. Since 2015, BMZ is supporting Africa Code Week, initiated by the German software company SAP. This continent-wide digital literacy initiative involves hundreds of schools and teachers, along with governments, businesses, and non-profits. In 2018, coding workshops in 16 African countries shared a curriculum designed for girls and young women.
An online platform to allow knowledge exchange. The #eSkills4Girls online platform showcases 32 flagship projects on digital skills, shares stories about female role models, and bundles information about studies, data, and events by G20 partners.
Implementation of #eSkills4Girls projects. BMZ has expanded its portfolio with new projects and a special focus on #eSkills4Girls in Ghana, Rwanda, Cameroon, Mozambique and South Africa. In 2019, projects will focus on digital skills trainings for women and girls, the integration of digital technologies in vocational trainings and non-formal education settings, and raising awareness for tech careers.
The EQUALS partnership – Advancing gender equality in the digital age. BMZ together with UNESCO spearheds the Skills Coalition of EQUALS, working on improving the data base on women’s digital skills, developing principles for gender-inclusive digital trainings, and creating a digital skills fund for grassroots women leaders and activists to scale-up their digital skills projects.

73
Taking Stock: Data and Evidence on Gender Digital Equality PART ONE
2.5.4.3 / MOOCs and online learning
Massive Open Online Courses (MOOCs) are a form of e-learning, characterised by large enrolments and free or low-cost access. Unlike traditional e-learning cour-ses offered by universities and businesses, students can select the courses that interest them and comple-te them at their own pace, driven by their interests, passions, and, in many cases, the desire to develop job skills or professional certifications (Glass et al., 2013; Ho et al., 2015). As early MOOC courses on Machine Learning and Artificial Intelligence drew over 150,000 students to a single course, the emergence of MOOCs in 2012 was heralded for their potential to “usher in an era of global access” for learners who were underserved by traditional educational pathways (EDUCAUSE, 2013; Brown & Adler, 2008).
However, in recent years, research has shown that, despite the potential for MOOCs to democratise ac-cess to education to anyone with an internet connec-tion, there remain wide disparities in the types of lear-ners who access and complete MOOCs. Early analyses suggested that the typical MOOC learner was a white, college-educated male, suggesting a potential rich-get-richer effect — that primarily learners with access to higher education were accessing online learning resources in the form of MOOCs (Ho et al., 2014). Due to the flexibility that MOOCs offer for learning across time, place, and context, much has been made of their promise in providing alternative pathways to educa-tion in low-resource areas, particularly for ICT domains lacking in local experts. Again, however, research has consistently found that learners from less developed parts of the world were less likely to enrol in and com-plete MOOCs (Ho et al., 2014; Kizelcec et al., 2015). Obstacles to greater MOOC uptake include access to a reliable internet connection and the digital literacy needed to access MOOCs (Christensen et al., 2013; Garrido et al., 2016), as well as differences in language and pedagogical style. Some research suggests that facilitating in-person groups of MOOC learners at telecentres might mitigate those challenges (Cutrell et al., 2015; Madaio et al., 2016; Liyanagunawardena et al., 2013).
If MOOCs represent a possible alternative pathway for women’s computer science and STEM education, are there gaps in how women around the world participa-te in and complete MOOCs? Across multiple studies, male MOOC learners outnumber female learners by nearly 2 to 1, in contrast to traditional distance courses and online universities, where female learners outnum-ber males by a similar ratio (Christensen et al., 2013; Dillahunt et al., 2014; Ho et al., 2014; Kizilcec et al., 2013; Breslow et al., 2013). However, the gender gap in MOOC participation may reflect gender gaps in wo-men’s participation in STEM courses more broadly, as discussed earlier in this chapter. In a two-year retros-pective of all MOOCs offered by Harvard and MIT on the MOOC platform edX, Ho et al. (2014) found that men outnumber women by five-to-one in CS courses and three-to-one in STEM courses, while women re-
presented 40% of learners in the humanities and social science courses offered on edX (Ho et al., 2014). Once enrolled in MOOCs, however, multiple studies indicate that, across domains, female students complete cour-ses at the same rate as male students (Ho et al. 2014; Breslow et al., 2013; Cisel, 2014). Two studies suggest that women in developing countries were more likely than men to complete a MOOC course (Jiang et al., 2016; Garrido et al., 2016).
With the high enrolment rates in MOOCs, there are equally high non-completion rates, with many learners signing up for free courses and never completing them (Ho et al., 2015). However, researchers have argued that these course completion rates may be misleading indicators of the potential impact of MOOCs. Some (Breslow et al., 2013) suggest that learners may stop participating at points that are appropriate for them individually; while others (Madaio et al., 2016) find that MOOC learners in developing countries may have different patterns of access than the course designers expected (such as downloading MOOC videos to be accessed in an offline repository), thus altering the definition of what completion looks like.
While much work has been done to develop empirical studies to understand who participates in MOOCs and how they learn, there remain gaps in obtaining comprehensive data that is broadly representative across regions and domain areas, as well as gaps in the research for understanding the factors that might influence learners’ participation and success in lear-ning with MOOCs. Moving forward, there is a need to collect more data to investigate MOOCs’ poten-tial to provide an alternative pathway for digital skill acquisition among women, particularly in developing countries contexts with limited access to high-quality formal ICT education.
2.5.4.4 / Hackerspaces and makerspaces
Hackerspaces are work spaces for people with similar interests (often in computers, machining, technology, and digital art), allowing them to collaborate and share knowledge to innovate. Hackerspaces are not rigidly defined in order to allow inclusivity, thus resulting in a variety of different hackerspaces and formats. Hackerspaces are alternatively referred as Hack Labs, Makerspaces, Fab Labs, Men’s Sheds, DIY makers, and Repair Cafes. Currently 1,407 hackerspaces are reported to be in operation, while 2,269 hackerspaces are reported globally4.
Research in 2011 showed that out of a total of 250 sur-vey respondents, only 10% were women. Fully 85% of respondents were based in North America and Europe (Moilanen, 2012). Within the hackerspace, men gene-rally engaged in software and hardware hacking, while women were most interested in software develop-ment. Some of the barriers to women’s participation in hackspaces were lack of interest in STEM, finding the
4 https://wiki.hackerspaces.org/List_of_Hacker_Spaces

74
Taking Stock: Data and Evidence on Gender Digital Equality PART ONE
hackerspaces male-dominated and thus intimidating or unpleasant, lack of clear outcome goals, and limited access to opportunities (Lewis, 2015). While men tend to dominate hacker culture, there are hackerspaces founded by women. Feminist Hackerspaces offer an environment where women are comfortable to learn, teach, work, and collaborate. These hackerspaces re-cognise the struggle of other minorities and are often trans- and queer-inclusive spaces.
As women increasingly participate in hackerspaces, a backlash has emerged; female hackers are groped, ha-rassed, and discriminated against, especially at hacker conferences and hackerspaces. Beyond verbal abuse and misogynist behaviour, some feminist hackers have also received rape and death threats (Toupin, 2014). Hackerspaces and makerspaces might still be a versatile, informal means of improving gender balance in STEM as well as coding and digital skills, as part of a multipronged strategy for creating informal structu-res to integrate girls into coding and STEM. Empirical studies are needed to explore not only the potential of hackerspace, but also possible adverse consequences for women and potential solutions. Existing studies tend to be qualitative in nature, and focus on hackers-paces in the western hemisphere. More research may point to ways for more women to safely benefit from hackerspaces.
2.6 / CONCLUSION
This chapter examined the status of gender gaps in basic, intermediate and advanced digital skills by reviewing the available sex-disaggregated data on high-level digital skills, as well as women’s participation in conventional and alternative STEM education. The industry demand for high-level ICT skills continues to increase, and many future jobs are expected in computing and engineering. However, from gender comparisons of the currently available data, women are far less equipped with programming and advanced digital skills. In developed countries, more men than women tend to have advanced skills to apply ICT skills for problem-solving or high-level tasks; globally, twice as many males as females can write a computer programme (8% vs. 4%).
To resolve these gender gaps, it is critical for more women to enter STEM education that provides a pathway to develop knowledge and skills to create and manage technologies, and to prepare for participating in the ICT industry. Nevertheless, the participation of girls and young women remains low, in STEM education and learning high-level digital skills. The analysis found only marginal gender differences in students’ STEM performance but considerable gender gaps in motivation to study STEM, self-efficacy to do well in STEM studies, and aspiration to have a career in STEM. The percentage of women studying STEM subjects has remained low, hovering around
35% over the past 15 years. Moreover, most women in STEM chose to study natural sciences (56%) rather than applied sciences such as computer science (29%) or engineering (27%). Ironically, the share of women in STEM studies, including ICT majors, is lower in countries with higher gender equality: smaller percentages of women study ICTs in many European or North American countries than in Middle Eastern and Asian countries.
Alternative pathways are emerging to cultivate digital skills with more innovative pedagogic approaches: introductory computing is increasingly included in national educational curricula, and coding bootcamp, MOOCs, and makerspaces offer alternative digital skills training particularly in the area of coding skills. While these new movements seem promising, there is still a lack of data and evidence-based research on the effectiveness of these alternative pathways for closing the gender gap.
REFERENCES
A.T. Kearney. (2016). Tough choices: The real reasons A-level students are steering clear of science and maths. London: A.T. Kearney and the Your Life Campaign. Retrieved from: https://www.atkearney.com/documents/10192/7390617/Tough+Choices.pdf/a7408b93-248c-4b97-ac1e-b66db4645471
Aspray, W. (2016). Women and underrepresented minorities in computing: A historical and social study. Basel, Switzerland: Springer.
Bandura, A., Barbaranelli, C., Caprara, G. V., & Pastorelli, C. (2001). Self-efficacy beliefs as shapers of children’s aspirations and career trajectories. Child development, 72(1), 187-206.
Bocconi, S., Chioccariello, A., Dettori, G., Ferrari, A.& Engelhardt, K. (2016). Developing computational thinking in compulsory education – Implications for policy and practice. EU Joint Research Council. Retrieved from: http://publications.jrc.ec.europa.eu/repository/bitstream/JRC104188/jrc104188_computhinkreport.pdf
Breslow, L., Pritchard, D. E., DeBoer, J., Stump, G. S., Ho, A. D., & Seaton, D. T. (2013). Studying learning in the worldwide classroom: Research into edX’s first MOOC. Research & Practice in Assessment, 8(1), 13–25.
Broadband Commission (2017). Working Group on Education: Digital skills for life and work. Retrieved from: http://unesdoc.unesco.org/images/0025/002590/259013e.pdf
Brown, J. S., & Adler, R. P. (2008). Minds on fire: Open education, the long tail, and learning 2.0. EDUCAUSE Review, 43(1), 16–32.
Chan, V., Stafford, K., Klawe, M., & Chen, G. (2001).

75
Taking Stock: Data and Evidence on Gender Digital Equality PART ONE
Gender differences in Vancouver secondary students. In: Balka E., Smith R. (eds.), Women, Work and Computerization. The International Federation for Information Processing (IFIP), Vol. 44. Boston, MA: Springer.
Charles, M., & Bradley, K. (2009). Indulging our gendered selves? Sex segregation by field of study in 44 countries. American journal of sociology, 114(4), 924-976. Retrieved from: https://www.jstor.org/stable/10.1086/595942
Christensen, G., Steinmetz, A., Alcorn, B., Bennett, A., Woods, D., & Emanuel, E. J. (2013). The MOOC phenomenon: Who takes massive open online courses and why? SSRN Electronic Journal. Retrieved from: https://doi.org/10.2139/ssrn.2350964
Cisel, M. (2014). Analysing completion rates in the first French xMOOC. EMOOCs 2014: Proceedings of the European MOOCs Stakeholders Summit, Research Track. 26-32.Cutrell, E., O’Neill, J., Bala, S., Nitish, B., Cross, A., Gupta, N., … Thies, W. (2015). Blended learning in Indian colleges with massively empowered classroom. Proceedings of the Second (2015) ACM Conference on Learning @ Scale. L@S ’15, 47–56. Retrieved from: https://doi.org/10.1145/2724660.2724666
Department of Education and Training, Australian Government (2017). Completion count by course level, by field of education, by gender, by year. Retrieved from: http://highereducationstatistics.education.gov.au/
Dillahunt, T., Wang, Z., & Teasley, S. D. (2014). Democratizing higher education: Exploring MOOC use among those who cannot afford a formal education. International Review of Research in Open and Distance Learning, 15(5), 177–196. Retrieved from: https://doi.org/10.19173/irrodl.v15i5.1841
Economist (2018). Sweden tries to increase gender equality on the web. Retrieved from: https://www.economist.com/business/2018/03/08/sweden-tries-to-increase-gender-equality-on-the-web
Educause (2013). MOOCs II. 7 things you should know about MOOCs. Washington, DC: ELI.
European Commission (2015). Digital Skills Indicator – derived from Eurostat Survey on ICT usage by individuals: Methodology Note 201. Retrieved from: https://ec.europa.eu/digital-single-market/en/news/new-comprehensive-digital-skills-indicator
European Commission (2017). The digital skills gap in Europe: Factsheet. 19 October, 2017. Retrieved from: https://ec.europa.eu/digital-single-market/en/news/digital-skills-gap-europe
European Commission (2018). DigComp 2.0: The digital competence framework for citizens. EC Joint Research Center. Retrieved from: https://ec.europa.eu/jrc/en/digcomp/digital-competence-framework
European Commission (2018b). Women in the digital age: Directorate-General of Communications Networks, Content & Technology. DOI: 10.2759/526938
European Parliament (2017) Digital skills in the EU labour market, January 2017. Retrieved from: http://www.europarl.europa.eu/RegData/etudes/IDAN/2017/595889/EPRS_IDA(2017)595889_EN.pdf
European Schoolnet (2015). Computing our future: Computer programming and coding, priorities, school curricula and initiatives across Europe. Retrieved from: http://fcl.eun.org/documents/10180/14689/Computing+our+future_final.pdf/746e36b1-e1a6-4bf1-8105-ea27c0d2bbe0
European Schoolnet (2017). European Schoolnet Perspective, Issue No. 3, July 2017. Retrieved from: http://www.eun.org/documents/411753/665824/Perspective_n3_24july2017_FINAL.pdf/66f14f1e-a825-4b38-9d75-7f57025432ba
Eurostat (2017). Tertiary education statistics, Data extracted in June 2017. Retrieved from: http://ec.europa.eu/eurostat/statistics-explained/index.php/Tertiary_education_statistics#Gender_distribution_of_participation
Garrido, M., Koepke, L., Andersen, S., Macapagal, M., & Dalvit, L. (2016). The advancing MOOCs for Development initiative: An examination of MOOC usage for professional workforce development outcomes in Colombia, the Philippines, & South Africa. Seattle: Technology & Social Change Group, University of Washington Information School., 7.
Glass, C. (2009). Who takes MOOCs? Practical Assessment, Research & Evaluation, 14(7), 1–11. https://doi.org/10.1002/ir
Glott, R., Schmidt, P. & Ghosh, R. (2010). Wikipedia survey – Overview of results. Maastricht, Netherlands: UNU-MERIT. Retrieved from: https://web.archive.org/web/20100414165445/http://wikipediasurvey.org/docs/Wikipedia_Overview_15March2010-FINAL.pdf
Google Inc. & Gallup Inc. (2016). Trends in the state of computer science in U.S. K-12 schools. Retrieved from: http://goo.gl/j291E0
Gupta, N. (2012). Women undergraduates in engineering education in India: A study of growing participation. Gender, Technology and Development, 16(2), 153-176.
Ho, A. D., Chuang, I., Reich, J., Coleman, C. A., Whitehill, J., Northcutt, C. G., … Petersen, R. (2015). HarvardX and MITx: Two years of open online courses Fall 2012-Summer 2014. SSRN Electronic Journal, (10), 1–37. Retrieved from: https://doi.org/10.2139/ssrn.2586847IEA (2016). TIMSS advanced 2015 international results in advanced mathematics and physics. Retrieved from:

76
Taking Stock: Data and Evidence on Gender Digital Equality PART ONE
http://timss2015.org/wp-content/uploads/filebase/advanced/full%20pdfs/TA15-International-Results-in-Advanced-Mathematics-and-Physics.pdf
ITU (2016). Coding bootcamps: A strategy for youth employment. Retrieved from: https://www.itu.int/en/ITU-D/Digital-Inclusion/Youth-and-Children/Documents/CodingBootcamps_E.pdf
ITU (2018). Decent jobs for Youth: Digital skills – thematic priority of the global initiative on decent jobs for youth. Retrieved from: https://www.decentjobsforyouth.org/wordpress/wp-content/uploads/2017/11/Thematic-Plan-1-Digital-Skills.pdf
Jiang, S., Schenke, K., Xu, D., & Warschauer, M. (2015). Females’ enrollment and completion in science, technology, engineering, and mathematics Massive Open Online Courses. Retrieved from: https://arxiv.org/abs/1608.05131
Jordan, K. (2014). Initial trends in enrolment and completion of massive open online courses. The International Review of Research in Open and Distributed Learning, 15(1). Retrieved from: https://doi.org/10.19173/irrodl.v15i1.1651
Kemp, P. E., Wong, B., & Berry, M. G. (2016). The Roehampton annual computing education report. London: University of Roehampton.
Kermani, H. & Aldemir, J. (2015). Preparing children for success: Integrating science, math, and technology in early childhood classroom. Journal Early Child Development and Care, 185(9). pp. 1504-1527. DOI: 10.1080/03004430.2015.1007371.
Kizilcec, R. F., Piech, C., & Schneider, E. (2013). Deconstructing disengagement: Analyzing learner subpopulations in Massive Open Online Courses. Lak ’13, 10. https://doi.org/10.1145/2460296.2460330
Kizilcec, R. F., Davis, G. M., & Cohen, G. L. (2017). Towards equal opportunities in MOOCs: Affirmation reduces gender & social-class achievement gaps in China. Proceedings of the Fourth (2017) ACM Conference on Learning @ Scale. L@S 2017, 121–130. Retrieved from: https://doi.org/10.1145/3051457.3051460
Lagesen, V. A. (2008). A cyberfeminist utopia? Perceptions of gender and computer science among Malaysian women computer science students and faculty. Science, Technology, & Human Values, 33(1), 5-27.
Lee, J., Moon, S. & Hega, R. L. (2011). Mathematics skills in early childhood: Exploring gender and ethnic patterns. Child Indicators Research, 4(3), pp. 353-368. Retrieved from: DOI: 10.1007/s12187-010-9088-9.
Lewis, J. (2015). Barriers to women’s involvement in hackspaces and makerspaces. Access as Spaces. Retrieved from: http://access-space.org/wp-content/
uploads/2015/10/barriers-to-womens-involvement-in-hackspaces-and-makerspaces.pdf
Liyanagunawardena, T. R., Parslow, P., & Williams, S. A. (2014). Dropout: MOOC participants’ perspective. Proceedings of the European MOOC Stakeholder Summit 2014, 95–100. Retrieved from: http://centaur.reading.ac.uk/36002/
MacPhee, D., Farro, S., & Canetto, S. S. (2013). Academic self-efficacy and performance of underrepresented STEM majors: Gender, ethnic, and social class patterns. Analyses of Social Issues and Public Policy, 13(1), 347-369.
Madaio, M. A., Grinter, R. E., Tech, G., Zegura, E. W., & Tech, G. (2016). Experiences with MOOCs in a West-African Technology Hub. Eighth International Conference.
Mellström, U. (2009). The intersection of gender, race and cultural boundaries, or why is computer science in Malaysia dominated by women? Social Studies of Science, 39(6), 885-907.
Microsoft (2017) Why Europe’s girls aren’t studying STEM. Microsoft Philanthropies Whitepaper. Retrieved from: https://onedrive.live.com/View.aspx?resid=89F9BC9CE672FF4!108&app=WordPdf&wdLOR=&authkey=!ANK-QohgdrHsqJg
Ministry of Education, Culture, Sports, Science and Technology of Japan (2016). Population of undergraduate students by Major: School Basic Survey 2016.
Moilanen, J. (2012). Emerging hackerspaces–peer-production generation. In IFIP International Conference on Open Source Systems (94–111). Springer.
National Center for Education Statistics (2016). Digest of Education Statistics. Retrieved from: https://nces.ed.gov/programs/digest/d16/
OECD (2015). The ABC of gender equality in education: Aptitude, Behaviour, Confidence. PISA, OECD Publishing. Retrieved from: http://dx.doi.org/10.1787/9789264229945-en
OECD (2016a). Skills for a digital world. OECD STI Committee on Digital Economy Policy. Retrieved from: http://www.oecd.org/officialdocuments/publicdisplaydocumentpdf/?cote=DSTI/ICCP/IIS(2015)10/FINAL&docLanguage=En
OECD (2016b). The survey of adult skills: Reader’s companion (second edition). OECD Skills Studies. Paris: OECD Publishing. Retrieved from: http://dx.doi.org/10.1787/9789264258075-en
OECD (2016c). Education at a glance 2016: OECD Indicators. Paris: OECD Publishing. Retrieved from: http://dx.doi.org/10.187/eag-2016-en

77
Taking Stock: Data and Evidence on Gender Digital Equality PART ONE
OECD (2017). Digital Economy Outlook 2017: ICT specialists by gender. Retrieved from: http://www.oecd.org/internet/oecd-digital-economy-outlook-2017-9789264276284-en.htm
OECD (2017b). Education at a glance 2017: OECD Indicators. Paris: OECD Publishing. Retrieved from: https://doi.org/10.1787/eag-2017-en.
Pajares, F., & Miller, M. D. (1994). Role of self-efficacy and self-concept beliefs in mathematical problem solving: A path analysis. Journal of Educational Psychology, 86(2), 193.
Pew Research (2018). Social media use continues to rise in developing countries, but plateaus across developed ones. Retrieved from: http://assets.pewresearch.org/wp-content/uploads/sites/2/2018/06/15135408/Pew-Research-Center_Global-Tech-Social-Media-Use_2018.06.19.pdf
Rushkoff, D. (2011). Program or be programmed: Ten commands for a digital age. New York, NY: Or Books.Schwab, K. (2017). The Fourth Industrial Revolution. World Economic Forum. Retrieved from: https://www.weforum.org/about/the-fourth-industrial-revolution-by-klaus-schwab
Shabib-ul-Hasan, S., & Mustafa, S. (2014). Education to profession! Challenges of being women in Pakistan. AI & society, 29(1), 131-136.
Sikora, J. & A. Pokropek (2011), Gendered career expectations of students: Perspectives from PISA 2006. OECD Education Working Papers, No. 57, Paris: OECD Publishing. Retrieved from: https://doi.org/10.1787/5kghw6891gms-en.
Spearman, J. & Watt, H. M. G. (2013). Perception shapes experience: The influence of actual and perceived classroom environment dimensions on girls’ motivations for science. Learning Environment Research, 16(217), 217-238.
Statistics Canada (2017). Postsecondary enrolments, by program type, credential type, Classification of Instructional Programs, Primary Grouping (CIP_PG), registration status and sex. Retrieved from: https://www150.statcan.gc.ca/t1/tbl1/en/tv.action?pid=3710001101
Stoet, G., & Geary, D. C. (2018). The gender-equality paradox in science, technology, engineering, and mathematics education. Psychological science, 29(4), 581-593.
Toupin, S. (2014). Feminist hackerspaces: The synthesis of feminist and hacker cultures. Journal of Peer Production, 4.
UNESCO (2015). Education for All 2000–2015: Achievement and challenges. Paris: United Nations Educational, Scientific and Cultural Organization. Retrieved from: http://unesdoc.unesco.org/images/0023/002322/232205e.pdf
UNESCO (2015b). Unleashing the potential: Transforming technical and vocational education and training. Paris, UNESCO. Retrieved from: http://unesdoc.unesco.org/images/0023/002330/233030e.pdf
UNESCO (2017). Cracking the code: Girls’ and women’s education in science, technology, engineering and mathematics (STEM). Retrieved from: http://unesdoc.unesco.org/images/0025/002534/253479E.pdf
Varma, R. (2009). Why I chose computer science? Women in India. AMCIS 2009 Proceedings, 413.
Wikipedia Foundation (2011). Wikipedia Editors Study: Results from the editor survey, April 2011. Retrieved from: https://upload.wikimedia.org/wikipedia/commons/7/76/Editor_Survey_Report_-_April_2011.pdf
Wing, J. (2006). Computational thinking. Communications of the ACM, 49(3) 33. World Economic Forum (2016). The future of jobs: Employment, Skills and Workforce Strategy for the 4th Industrial Revolution. Retrieved from: http://www3.weforum.org/docs/WEF_Future_of_Jobs.pdf

78
GENDER EQUALITY IN ICT INDUSTRY LEADERSHIPAUTHOR: ARABA SEY (UNU-CS)
3
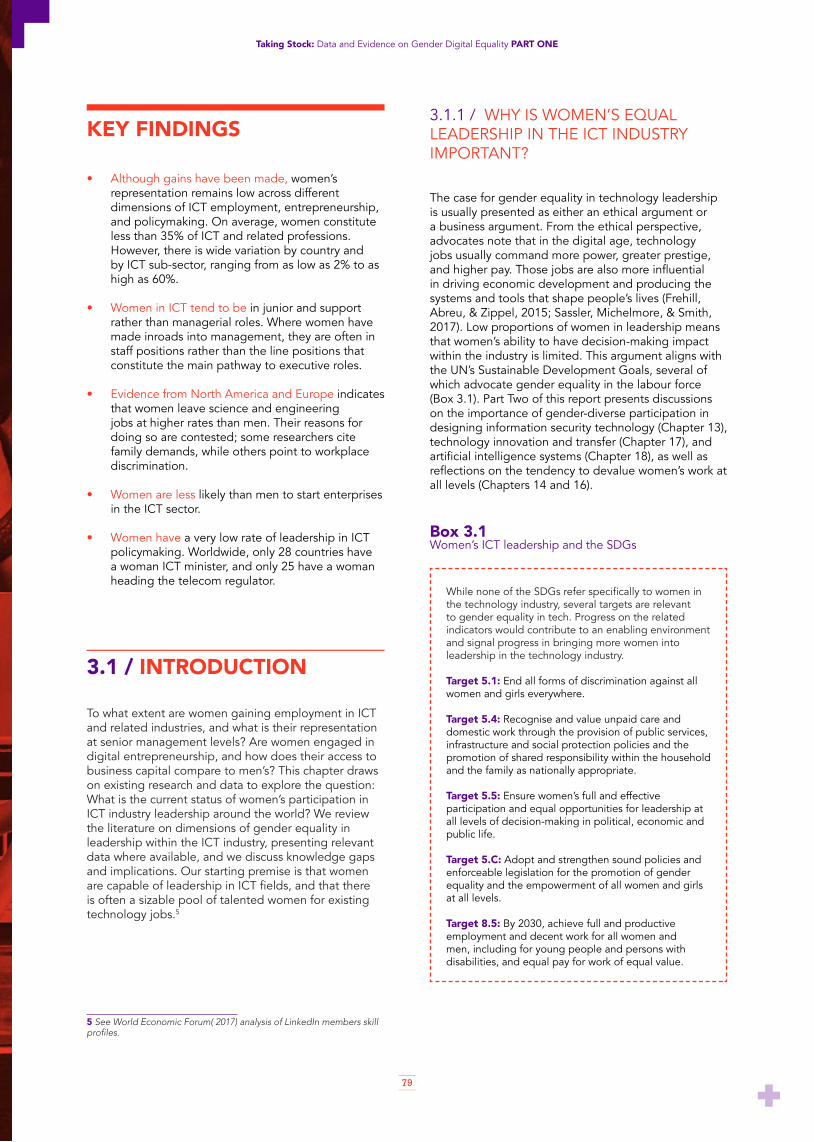
79
Taking Stock: Data and Evidence on Gender Digital Equality PART ONE
KEY FINDINGS
• Although gains have been made, women’s representation remains low across different dimensions of ICT employment, entrepreneurship, and policymaking. On average, women constitute less than 35% of ICT and related professions. However, there is wide variation by country and by ICT sub-sector, ranging from as low as 2% to as high as 60%.
• Women in ICT tend to be in junior and support rather than managerial roles. Where women have made inroads into management, they are often in staff positions rather than the line positions that constitute the main pathway to executive roles.
• Evidence from North America and Europe indicates that women leave science and engineering jobs at higher rates than men. Their reasons for doing so are contested; some researchers cite family demands, while others point to workplace discrimination.
• Women are less likely than men to start enterprises in the ICT sector.
• Women have a very low rate of leadership in ICT policymaking. Worldwide, only 28 countries have a woman ICT minister, and only 25 have a woman heading the telecom regulator.
3.1 / INTRODUCTION
To what extent are women gaining employment in ICT and related industries, and what is their representation at senior management levels? Are women engaged in digital entrepreneurship, and how does their access to business capital compare to men’s? This chapter draws on existing research and data to explore the question: What is the current status of women’s participation in ICT industry leadership around the world? We review the literature on dimensions of gender equality in leadership within the ICT industry, presenting relevant data where available, and we discuss knowledge gaps and implications. Our starting premise is that women are capable of leadership in ICT fields, and that there is often a sizable pool of talented women for existing technology jobs.5
5 See World Economic Forum( 2017) analysis of LinkedIn members skill profiles.
3.1.1 / WHY IS WOMEN’S EQUAL LEADERSHIP IN THE ICT INDUSTRY IMPORTANT?
The case for gender equality in technology leadership is usually presented as either an ethical argument or a business argument. From the ethical perspective, advocates note that in the digital age, technology jobs usually command more power, greater prestige, and higher pay. Those jobs are also more influential in driving economic development and producing the systems and tools that shape people’s lives (Frehill, Abreu, & Zippel, 2015; Sassler, Michelmore, & Smith, 2017). Low proportions of women in leadership means that women’s ability to have decision-making impact within the industry is limited. This argument aligns with the UN’s Sustainable Development Goals, several of which advocate gender equality in the labour force (Box 3.1). Part Two of this report presents discussions on the importance of gender-diverse participation in designing information security technology (Chapter 13), technology innovation and transfer (Chapter 17), and artificial intelligence systems (Chapter 18), as well as reflections on the tendency to devalue women’s work at all levels (Chapters 14 and 16).
Box 3.1 Women’s ICT leadership and the SDGs
While none of the SDGs refer specifically to women in the technology industry, several targets are relevant to gender equality in tech. Progress on the related indicators would contribute to an enabling environment and signal progress in bringing more women into leadership in the technology industry.
Target 5.1: End all forms of discrimination against all women and girls everywhere.
Target 5.4: Recognise and value unpaid care and domestic work through the provision of public services, infrastructure and social protection policies and the promotion of shared responsibility within the household and the family as nationally appropriate.
Target 5.5: Ensure women’s full and effective participation and equal opportunities for leadership at all levels of decision-making in political, economic and public life.
Target 5.C: Adopt and strengthen sound policies and enforceable legislation for the promotion of gender equality and the empowerment of all women and girls at all levels.
Target 8.5: By 2030, achieve full and productive employment and decent work for all women and men, including for young people and persons with disabilities, and equal pay for work of equal value.

80
Taking Stock: Data and Evidence on Gender Digital Equality PART ONE
More recently, arguments have shifted to targeting organisations’ self-interest by outlining business arguments for gender equality. Proponents, backed by research, argue that diversity leads to organisational benefits, such as improved financial health and returns on investment, higher staff productivity, a healthier workforce, and more creative problem-solving (Chanavat & Ramsden, 2013; Dawson, Kersley, & Natella, 2014; Gompers & Wang, 2017a; V. Hunt, Layton, & Prince, 2015; V. Hunt, Yee, Prince, & Dixon-Fyle, 2018; ILO, 2017a; Thomas, Dougherty, Strand, Nayar, & Janani, 2016; Vasilescu et al., 2015). For example, Thomas et al. (2016) found a correlation between diversity in tech company workforces and higher revenues, profits, and market value (in the U.S. and globally). They estimated that closing the global gender leadership gap could generate up to a 0.6% increase in global GDP. Companies in the U.S. and UK with the most gender diverse teams (especially at executive level) are 21% more likely to outperform other companies on profitability, according to (Hunt et al., 2018). More inclusiveness could also help to address industry skills shortages (e.g., Hewlett & Sherbin, 2014).
3.1.2 / MEASURING GENDER EQUALITY IN THE ICT INDUSTRY
Because technology now permeates every industry sector and an increasing number of job roles, the lines have blurred noticeably, making it more difficult to precisely quantify the tech workforce. (CompTIA, 2018, p. 11.)
There is no single high-tech industry; rather, new technology has transformed industries . . . and the functions of numerous occupations. . . . Occupations unknown a decade earlier have become common. . . . Classification schemes that rely on a single measure of technological expertise, as many do, may incorrectly rank industries and/or classify sectors. (U.S. Equal Employment Opportunity Commission, 2016, p. 4.)
Gaining an understanding of the true state of gender equality in the ICT industry presents several research and data collection challenges. First, there is lack of sufficiently fine-grained gender-disaggregated, consistently collected and comparable occupational data at the sector level for most countries (Data 2x, 2017; WIT Leadership Round Table Metrics Working Group, 2016). This limits researchers’ ability to compile data at the global level and to do cross-country analyses. Most organisations do not collect and/or share diversity data, either because they are not required to do so by law or because they are reluctant to do so (Donnelly, 2017; Evans & Rangarajan, 2017).
Secondly, significant definitional issues affect this type of research. The continually evolving nature of technology developments gives rise to questions such as, what falls within the ICT industry, what constitutes an ICT or ICT-related occupation, and what does it
mean to be a leader in this context. With the tentacles of digital technology reaching into diverse sectors, there are now at least three contexts in which a person could have an ICT-related occupation: 1) within the formal ICT industry; 2) within the informal ICT industry (e.g.; unregistered microenterprises, black market); and 3) within non-ICT sectors that make intensive use of technology (e.g., health sector). Different categorisations schemes — many of which collapse ICT sectors into general technology groupings — often make it necessary to use a technology as a proxy for ICT or to measure a narrow slice to represent the larger ICT category (Appendix D)6. This report is primarily concerned with gender equality in the ICT sector, particularly the formal ICT industry, where more adequate conceptualisation, research, and data collection exist. Future efforts should acknowledge and account for the informal7 and non-ICT contexts as well.
The definition of a leadership position also impacts what situations are captured. Leadership can be found within the ranks of people working in technical roles, but also within the broad category of management, which includes people in non-technical roles. Indeed, technology company executives often come from non-technical positions (WIT Leadership Round Table Metrics Working Group, 2016).
The remainder of this chapter presents gender and ICT leadership in three areas – employment, entrepreneurship, and policymaking (Box 3.2). We also review research on the factors that constrain women’s participation in the ICT industry and discuss potential remedies. Because much of the available data represent the broader science and technology industry, the analyses will often rely on technology industry data to signal the general status of women in the ICT industry.
For a comprehensive assessment of gender equality in the ICT industry, the WIT Leadership Round Table Metrics Working Group (2016, p. 3) recommends looking at both stationary metrics (e.g., female hires relative to all hires, or percentage of women at different organisational levels) and flow metrics (e.g., women promoted relative to all promotions, or attrition rates among women and men). This level of granularity — especially of flow data — is mostly unavailable through global public data sources, although individual organisations may have such data in their administrative records. We therefore focus on recruitment, retention, advancement, and work environment trends for industry in general, referring to specific data on the ICT industry where available.
6 For example, Blau, Brummund, and Liu (2013) demonstrate how changes to occupational coding systems can affect research results. Also see UNCTAD (2015).
7 This particularly applies to low- and middle-income countries where a high proportion of the population are employed in the informal sector (ILO, 2018).

81
Taking Stock: Data and Evidence on Gender Digital Equality PART ONE
Box 3.2 Aspects of gender & ICT leadership
Employment working as an employee:• Recruitment • Retention • Advancement
Entrepreneurship establishing one’s own enterprise in the industry (with or without employees):• Participation • Access to business training • Access to business capital
Policymaking working in an organisation that determines policy on technology and related issues:• Recruitment
3.2 / EMPLOYMENT – RECRUITMENT
This section covers gender-relevant recruitment trends for selected occupational skill levels, technology-related industries, and technology-related occupations, supplemented with regional or country-specific data when possible.
3.2.1 / OCCUPATION SKILL LEVELS
Since leadership in the technology industry tends to require relatively high technical and/or managerial skills, it is instructive to first examine global data on women’s employment at different skill levels. This data covers all industries and does not distinguish between ICT and non-ICT occupations. Globally, women’s participation in jobs requiring high (level 3 and 4) skill levels has consistently been slightly above 40% since 2000 (Figure 3.1).
Figure 3.1Percentage of women employees at three occupation skill levels, global
Source: ILOSTAT, ILO modelled estimates.Notes: ILO defines skill levels as follows: Level 1 (low) = Elementary occupations; Level 2 (medium) = Clerical support workers, Service and sales workers, Skilled agricultural, forestry and fishery workers, Craft and related trades workers, Plant and machine operators, and assemblers; Levels 3 and 4 (high) = Managers, professionals, and technicians. See ILO indicator description: http://www.ilo.org/ilostat-files/Documents/description_OCU_EN.pdf Robust data (Africa=53, Americas=33, Asia=51, Europe=40, Oceania=11) across all years and skill levels. Regional differences relatively stable from 2000-2017. Proportion of women is calculated by number of women workers/total number of workers per skill level.

82
Taking Stock: Data and Evidence on Gender Digital Equality PART ONE
Figure 3.2Percentage of women by occupation skill level (2017)
Source: ILOSTAT, ILO modelled estimates.
Although the data span both technology and non-technology industries, they do indicate fairly high levels of women employed in occupations that are associated with high skills, especially in Europe (51%), Oceania (50%), and the Americas (46%) (Figure 3.2). In Africa, however, progressively higher skill occupations are associated with lower proportions of women; the opposite applies in Oceania; and the numbers converge at around 35% for Asia. The picture is more mixed in Europe and the Americas, where the highest proportions of women are found at the extremes, in
Level 1 and Level 3-4 jobs. Notably, there has been very little change in these trends over the last two decades, apart from a large drop in the proportion of women in low-skill (Level 1) occupations. The reasons for this drop are unclear, as it is not associated with a corresponding increase in employment at other skill levels. One possibility is that it could be an artifact of changes in data collection methods or the number of countries reporting.
3.2.2 / ICT INDUSTRIES AND RELATED FIELDS
Most studies of gender diversity in the technology industry focus either on specific countries (usually the U.S.), geographic locations (e.g., Europe, Silicon Valley) or large global companies (e.g., Fortune 500, FTSE100, S&P100). While individual organisations show some variation8, on average, levels of participation by women are low and the pace of change is slow. Thus, although (as the previous section notes) 40% of high-skill occupations are filled by women, it appears these jobs are mostly not in the ICT industry. The proportion of women in the U.S. technology industry, for example, remained at 22% between 2005 and 2015, according to the US Government Accountability Office (2017).
8 For example, in 2016, both Pandora and Groupon had about 48% female employees (Information is Beautiful, 2018).
Even women technology workers were more likely to be employed outside the technology industry than within it. Similar findings were reported for Silicon Valley: women’s employment was 30% in leading tech firms compared to 49% in non-tech firms (U.S. Equal Employment Opportunity Commission, 2016). In Europe, women comprised 21% of the workers in the digital work force (Quirós et al., 2018).
A global study of 54 telecommunications companies found that most (75%) had female employment between 10% and 40% of their workforce, and only one had more than 50% (Molina, Lin, & Wood, 2015). This finding is consistent with ILO data, which show levels between 18% (Africa) and 35% (Asia) in 2016 (Figure 3.3). The 2016 median for each region was between 28% and 34% (Table 3.1). However, Table 3.1 also shows that the averages mask wide variations between countries.

83
Taking Stock: Data and Evidence on Gender Digital Equality PART ONE
Figure 3.3Percentage of women telecommunications industry employees
Table 3.1Percentage of women employees in telecommunications industry, by region
Source: ILOSTAT, ISIC level 2.Note: Includes self-employment. Thin data for most countries.
Source: ILOSTAT, ISIC level 2.*Percent for last known year
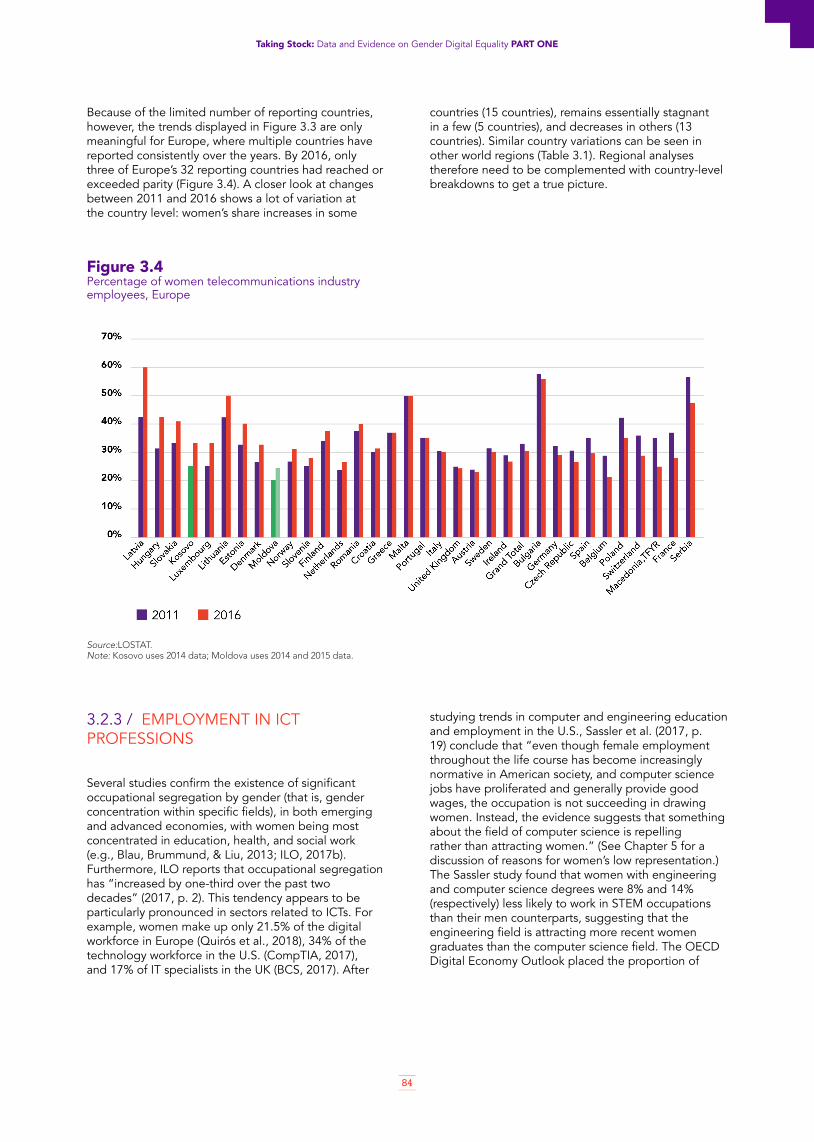
84
Taking Stock: Data and Evidence on Gender Digital Equality PART ONE
Because of the limited number of reporting countries, however, the trends displayed in Figure 3.3 are only meaningful for Europe, where multiple countries have reported consistently over the years. By 2016, only three of Europe’s 32 reporting countries had reached or exceeded parity (Figure 3.4). A closer look at changes between 2011 and 2016 shows a lot of variation at the country level: women’s share increases in some
countries (15 countries), remains essentially stagnant in a few (5 countries), and decreases in others (13 countries). Similar country variations can be seen in other world regions (Table 3.1). Regional analyses therefore need to be complemented with country-level breakdowns to get a true picture.
Figure 3.4Percentage of women telecommunications industry employees, Europe
Source:LOSTAT.Note: Kosovo uses 2014 data; Moldova uses 2014 and 2015 data.
3.2.3 / EMPLOYMENT IN ICT PROFESSIONS
Several studies confirm the existence of significant occupational segregation by gender (that is, gender concentration within specific fields), in both emerging and advanced economies, with women being most concentrated in education, health, and social work (e.g., Blau, Brummund, & Liu, 2013; ILO, 2017b). Furthermore, ILO reports that occupational segregation has “increased by one-third over the past two decades” (2017, p. 2). This tendency appears to be particularly pronounced in sectors related to ICTs. For example, women make up only 21.5% of the digital workforce in Europe (Quirós et al., 2018), 34% of the technology workforce in the U.S. (CompTIA, 2017), and 17% of IT specialists in the UK (BCS, 2017). After
studying trends in computer and engineering education and employment in the U.S., Sassler et al. (2017, p. 19) conclude that “even though female employment throughout the life course has become increasingly normative in American society, and computer science jobs have proliferated and generally provide good wages, the occupation is not succeeding in drawing women. Instead, the evidence suggests that something about the field of computer science is repelling rather than attracting women.” (See Chapter 5 for a discussion of reasons for women’s low representation.) The Sassler study found that women with engineering and computer science degrees were 8% and 14% (respectively) less likely to work in STEM occupations than their men counterparts, suggesting that the engineering field is attracting more recent women graduates than the computer science field. The OECD Digital Economy Outlook placed the proportion of

85
Taking Stock: Data and Evidence on Gender Digital Equality PART ONE
women workers who are ICT specialists at less than 2%, compared to over 5% for men (OECD, 2017).9 In the cybersecurity field, a global study of 170 countries estimated that women constitute 11% of professionals (Frost & Sullivan, 2017). (For more detail on issues related to women’s participation in the information security profession, see Part Two, Chapter 9 of this report.)
Other research, however, identifies contradictory trends, such as a decrease in occupational segregation among STEM graduates (Shauman, 2017). Furthermore, within the ICT industry, some sectors may be attracting higher proportions of women — for example, in the U.S., women’s participation is only 27% in the Computer Systems Design sector, but almost 40% in Internet Publishing and Web Search Portals.
To explore this topic, we selected ICT-related professions for which some global data exists (using ILO occupational classification): ICT Professionals; Electrical and Electronic Trades Workers; and Science and Technology Researchers. Two other relevant professions, STEM Faculty and Software Developers, are also briefly discussed.
9 ICT specialists are defined as people whose jobs include “tasks related to developing, maintaining and operating ICT systems and where ICTs are the main part of their job” (OECD, 2017, p. 183).
3.2.3.1 / ICT Professionals and Electrical and Electronic Trades
Overall, women represent less than 26% of ICT Professionals and Electrical and Electronic Trades employees (Figure 3.5). Europe, with the largest number of reporting countries, had roughly 15% to 17% women information and communication technology professionals between 2011 and 2016. The corresponding proportion of electrical and electronic trades workers in European countries was much lower — between 3% and 5% for the same period. Apart from a few spikes and drops that might be attributable to data gaps, regional trends have remained largely stable since 2011. At the country level, however, there are notable variations (Tables 3.2 and 3.3). For instance, women in Peru comprise 45% of ICT professionals and 60% of Electrical and Electronic Trades workers, compared to 14% and 2% in Mexico.
Figure 3.5Percentage of female employees in ICT-related occupations, regional (2016)
Source: LOSTAT.

86
Taking Stock: Data and Evidence on Gender Digital Equality PART ONE
Table 3.2Percentage of female ICT professionals (%)
Table 3.3Percentage of female electrical and electronic trades workers
Source: ILOSTAT (ISCO-08). *Percent for last known year
Source: ILOSTAT (ISCO-08). *Percent for last known year.

87
Taking Stock: Data and Evidence on Gender Digital Equality PART ONE
3.2.3.2 / Software developers
At present, data on software developer employment is available mainly from individual countries or private surveys by the hosts of developer communities (such as Stack Overflow). OECD’s intellectual property database also provides an avenue for investigating this topic, potentially covering a broader number of countries.
The software developer community appears particularly devoid of women, with potentially damaging consequences (Case Study 3.1). Analysis of a repository of intellectual property indicates that women comprise a very small proportion of R package developers (23%) and ICT patent holders (23%) in G20 countries (OECD STI, 2018). 10
10 R code is a free programming language and software environment for statistical computing (https://www.r-project.org/).

88
Taking Stock: Data and Evidence on Gender Digital Equality PART ONE
Case Study 3.1Women’s participation in online software developer communitiesAuthor: Michael Madaio & Araba Sey (UNU-CS)
Participation in online developer communities is becoming one of the primary ways for software developers to learn new programming languages, improve their skills, develop collaborative projects, and find new job opportunities (David & Shapiro, 2008; Ford et al., 2016; Vasilescu et al., 2015). These communities boast millions of users — over 29 million on GitHub (2018) and over one million on Stack Overflow (2018). GitHub users contribute code to about 60 million public “repositories” on the site, which are used by recruiters in hiring decisions. Professional software developers also hone their skills by asking and answering questions on coding Q&A sites like Stack Overflow. Stack Overflow developers also gain a public reputation from answering questions, further boosting their attractiveness to recruiters. Developers are also increasingly participating in coding challenges to hone their skills and signal their coding prowess to potential employers, through sites such as HackerRank, among others (Richard et al., 2015). However, despite the potential for these online developer communities to support software developers in their professional development, our analyses of open survey data (made available by GitHub, Stack Overflow, and HackerRank in 2017), indicate that gender gaps in participation may exacerbate the existing gender gaps in ICT, discussed throughout this report.
Who participates in online developer communities?While women are estimated to comprise nearly 20% of the software development workforce (Wang et al., 2018), their participation in online developer communities is only a fraction of that. In a survey of approximately 100,000 software developers using Stack Overflow, only 4% of respondents identified as female. On GitHub’s survey of 5,500 users, only 2% identified as female. HackerRank, the coding competition site, came closer to replicating the estimated gender gap in software development overall, with 16% of the 25,000 respondents identifying as female.
Among the users of Stack Overflow and HackerRank, men were nearly 15% more likely to be senior developers, nearly twice as likely to be in manager positions, and nearly four times as likely to be in executive roles. Male respondents on HackerRank were also nearly 15% more likely than women to be in hiring positions. However, women were more likely than men to be new graduates and junior developers, suggesting a newly burgeoning female software developer workforce. In addition, women on Stack Overflow were nearly twice as likely as men to fill technical roles like “data scientist” and “development operations engineer”, which were listed as the top two best-paying jobs in 2018 (GlassDoor, 2018). Thus, while women in online developer communities still face gaps in traditional leadership roles, they may be emerging as leaders in new technical developer roles.
Do women and men participate differently? On Stack Overflow, women were significantly less likely than men to have a registered account, and more likely to simply view Q&A on the site without responding or posting questions themselves. For GitHub, women were less likely than men to contribute code or “follow” other developers’ repositories. These publicly visible acts of participation are precisely the types of “signaling incentives” that have been cited as a benefit of online developer communities for hiring decisions (e.g., Lakhani & Von Hippel, 2003; Vasilescu, 2014). In fact, when developers on GitHub were asked how interested they were in contributing to open-source projects in the future, there was no noticeable difference in male and female levels of interest; but when asked how likely they were to contribute in the future, female respondents reported feeling significantly less likely than male respondents to contribute code on GitHub in the future. While online developer communities can be valuable tools for skill development and recruitment, the lower rates of female participation suggest that women may not yet be reaping the benefits of these platforms. As a result, gender gaps in online developer communities may exacerbate existing gender gaps in ICT occupations.
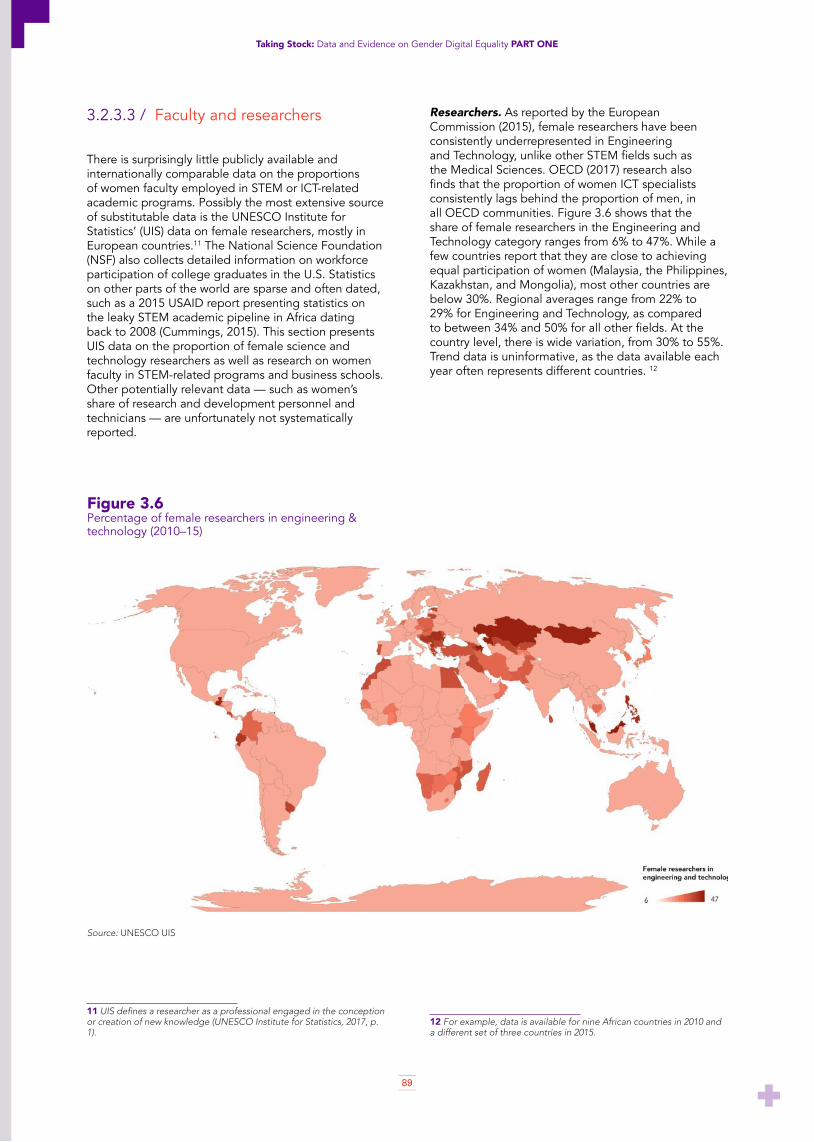
89
Taking Stock: Data and Evidence on Gender Digital Equality PART ONE
3.2.3.3 / Faculty and researchers
There is surprisingly little publicly available and internationally comparable data on the proportions of women faculty employed in STEM or ICT-related academic programs. Possibly the most extensive source of substitutable data is the UNESCO Institute for Statistics’ (UIS) data on female researchers, mostly in European countries.11 The National Science Foundation (NSF) also collects detailed information on workforce participation of college graduates in the U.S. Statistics on other parts of the world are sparse and often dated, such as a 2015 USAID report presenting statistics on the leaky STEM academic pipeline in Africa dating back to 2008 (Cummings, 2015). This section presents UIS data on the proportion of female science and technology researchers as well as research on women faculty in STEM-related programs and business schools. Other potentially relevant data — such as women’s share of research and development personnel and technicians — are unfortunately not systematically reported.
11 UIS defines a researcher as a professional engaged in the conception or creation of new knowledge (UNESCO Institute for Statistics, 2017, p. 1).
Researchers. As reported by the European Commission (2015), female researchers have been consistently underrepresented in Engineering and Technology, unlike other STEM fields such as the Medical Sciences. OECD (2017) research also finds that the proportion of women ICT specialists consistently lags behind the proportion of men, in all OECD communities. Figure 3.6 shows that the share of female researchers in the Engineering and Technology category ranges from 6% to 47%. While a few countries report that they are close to achieving equal participation of women (Malaysia, the Philippines, Kazakhstan, and Mongolia), most other countries are below 30%. Regional averages range from 22% to 29% for Engineering and Technology, as compared to between 34% and 50% for all other fields. At the country level, there is wide variation, from 30% to 55%. Trend data is uninformative, as the data available each year often represents different countries. 12
12 For example, data is available for nine African countries in 2010 and a different set of three countries in 2015.
Figure 3.6Percentage of female researchers in engineering & technology (2010–15)
Source: UNESCO UIS

90
Taking Stock: Data and Evidence on Gender Digital Equality PART ONE
STEM Faculty. Most of the studies carried out in North America and Europe show low proportions of women faculty in some STEM fields (often below 20%), particularly in fields related to engineering and computer science (e.g., Ling, 2017; Yoder, 2016). For example, workforce participation data from the 2013 National Science Foundation survey of doctorate recipients shows that, although women make up an equal proportion of United States graduates employed in science and engineering-related occupations in universities, they constitute only 34% of science and engineering occupations overall, and even fewer (17%) of computer and information scientists (https://www.nsf.gov/statistics/srvydoctoratework/).
Understanding the data from disparate research can be challenging; results may be contradictory or require nuanced interpretation. For example, Shauman (2017) found that women STEM graduates were more likely than men to enter tenure-track faculty positions within two years of degree completion, and equally likely to get such positions at research-intensive universities. However, while women were more likely than men to have jobs that require a doctorate, they were less likely to have research-oriented jobs. Furthermore, women graduates in engineering, mathematics, and computer science were less likely than other STEM graduates to work in business and industry. A controversial study by Ceci and Williams (2015) concluded that “women have substantial advantage in STEM faculty hiring, except when competing against more-accomplished men”. Another study (Way, Larremore, & Clauset, 2016) found that hiring decisions in STEM departments were affected primarily by the productivity of candidates and the prestige of the candidates’ academic institutions (although the authors also noted that subtle gender effects were probably at play).
A report by the Association of Academies and Societies of Sciences in Asia (AASSA, 2015) reviewed the state of women in science and technology in ten Asian countries, and found generally low representation of women in academic communities. In reference to Africa, Cummings (2015) laments the scarcity of robust data on women’s representation in the STEM academic pipeline, noting that this hampers researchers’ ability to provide a clear picture of the state of the academic pipeline in Africa:
The current inadequate data related to the underrepresentation of women faculty in STEAM careers undermines our capacity to provide adequate, scalable, replicable and sustainable solutions for gender inequalities. (Cummings, 2015, p. 3.)
Business School Faculty. Business schools represent an important context preparing individuals for leadership in both the corporate world and entrepreneurship. Analyses of the Global Salary Survey (a product of AACSB International, the Association to Advance Collegiate Schools of Business) indicate low proportions of women at leadership levels, shown in Table 3.4 (Brown, 2016). In 2017/18, 75% of deans and 66% of associate deans were men, and in 2015/16, just 20% of full professors were women (AACSB International, 2018).13
13 Survey of 500 business school members of AACSB covering 25 countries, but primarily the U.S.
Table 3.4Percentage of women faculty at business schools,by region
Source: Adapted from Brown (2016). Note: Based on 597 schools; no data for Africa and Oceania.

91
Taking Stock: Data and Evidence on Gender Digital Equality PART ONE
3.3 / EMPLOYMENT– RETENTION AND ADVANCEMENT
Official statistics on retention rates are not collected at the global level. Evidence from North America and Europe indicates that women leave science and engineering jobs up to twice as frequently as men (Ashcraft, McLain, & Eger, 2016; Gumpertz, Durodoye, Griffith, & Wilson, 2017; J. Hunt, 2010). Most of this research, however, examines retention rates within the broad category of science and engineering, not the ICT industry specifically. Furthermore, much of the more recent literature on retention focuses on the reasons women leave the technology industry, rather than on their rate of leaving (e.g., Annabi & Lebovitz, 2018; Hunt, 2010; Servon & Visser, n.d.; Tapia & Kvasny, 2004). In Europe, Quirós et al. (2018, p.10) assert that attrition is especially high for women aged 30-40 years: “the prime working age and . . . the period when most Europeans have their first child and/or have to take care of their small children.” Kahn and Ginther (2015) make a similar observation in their U.S. study. Research is needed to illuminate this topic, as much of what exists is limited in scale or scope and makes it difficult to compare churn rates for men and women technology workers, or across other types of industries. Reasons for attrition are contested; some researchers attribute it to family life demands, while others attribute it to workplace discrimination, including unequal pay, low access to advancement opportunities, dominant male culture, and unwelcoming environments. (This issue is further discussed in Chapter 4.)
According to the 2017 Global Gender Gap report (World Economic Forum, 2017), despite some gains since 2007, “every industry exhibits a leadership gender gap” and “the largest gaps are found in the STEM fields: Software and IT Services, Manufacturing and Energy and Mining” (p. 32).14 In the absence of global data on women managers and executives in the ICT industry, this section examines three metrics on women female leaders more generally: employment in management positions; employment in senior and middle management positions; and employment as chief executives, senior officials and legislators. It also briefly covers women in academia leadership and ICT management, drawing on scholarly and other literature.
3.3.1 / GENERAL LEADERSHIP POSITIONS
While regional trends suggest that women’s employment in leadership positions is below 40% for all countries, a few countries nevertheless report close
14 Based on an analysis of LinkedIn data.
to or above parity (Figures 3.7–3.9). Regional trends appear essentially unchanged since 2009, despite some changes in several countries. Thus, as with the indicators in the previous sections, these metrics are best examined at the country level.
Exploring the data on senior and middle management positions for the last known year, we see wide variability in all regions (Figure 3.8). In Africa, the percentage of women managers ranges from 4% (Mali) to 44% (Seychelles), with 12 reporting countries. For the two countries with multiple year data (Mauritius and Seychelles), there is a rising trend between 2011 and 2015 of about 9% for Seychelles and 6% for Mauritius. Out of 13 countries reporting from the Americas, Uruguay has the lowest proportion of women senior and middle managers (33.7%), while the Dominican Republic has the highest (47%). Yearly data for the Americas (2011–2014) shows the proportion of women rising in two countries, remaining the same in two countries, and falling in three countries. Similar variability is seen in Asia (with 15 reporting countries), where women’s employment as senior or middle managers ranges from 4% (Pakistan) to 37% (Mongolia); the proportion is increasing in three countries, decreasing in four, and remains the same in two. Likewise, in Europe, the proportion of women increases in nine countries, decreases in 21 countries, and is stagnant in two countries. The variation in Europe for the last known year ranges from 14% (Kosovo) to 48% (Russia). Finally, in Oceania, the figures range from 33% (Australia) to 42% (Samoa); the only country with yearly data (Australia) shows a slight increase from 30% in 2010.

92
Taking Stock: Data and Evidence on Gender Digital Equality PART ONE
Figure 3.7Female share of employment in managerial positions – Total management
Figure 3.8Female share of employment in managerial positions – Senior & middle management
Source: ILOSTAT
Source: ILOSTATNote: Limited data from most countries. For example, number of economies reporting for 2016: Africa 2; Americas 7; Asia 9; Europe 32; Oceania 2.

93
Taking Stock: Data and Evidence on Gender Digital Equality PART ONE
Figure 3.9Female share of employment as chief executives, senior officials and legislators
Source: ILOSTAT
3.3.2 / LEADERSHIP POSITIONS IN THE ICT INDUSTRY
Data for the ICT industry is even less available than for general management trends. The most readily available data tends to come from a few national statistics departments. Other insights can be obtained from market research conducted by private organisations (which is often not freely available), and from academic research (addressing relatively narrow contexts). This section reviews examples of these studies covering three areas: the telecommunications industry, academies of science, and board membership. The variation in management levels, job titles, and business sectors sampled by various researchers limits the comparability of studies.
Telecommunications. A GSMA study of gender diversity in 54 telecom companies (Molina et al., 2015) showed that in all regions, women were employed in much larger proportions as entry-level staff rather than in middle and senior management positions. The largest gap was in Africa and the smallest in North America (Table 3.5). As with our observations on gender diversity in general management, the trends appear to be shifting, though from such a low level that the gap remains large. For example, the Global Telecoms Business lists the 100 most powerful people in the industry; it included 14 women in 2017 — up from only six in 2016, but still representing just 14%.

94
Taking Stock: Data and Evidence on Gender Digital Equality PART ONE
Table 3.5Percentage of female telecom company employees
Table 3.6Women in senior management – Technology companies
Source: Molina, Lin & Wood, 2015, p. 13.
Source: Dawson et al., 2014, p. 15. Note: * HR, Legal, IT, External Relations
IT Sector. Examining the European landscape, Quiros et al. (2018, p. 13) report that in 2015 the IT sector was “the only sector without women occupying CEO positions in any of the corporations in STOXX 600.” Women held 9.5% of CEO positions in the Telecom Services sector; only 25% of workers in the ICT sector had women bosses, compared to 48% in non-ICT sectors. In a global study, Dawson et al. (2014, p. 3)
concluded that women were more represented in senior management of “new economy” companies, although overall women tended to be in less influential management roles. Table 3.6 shows that the proportion of women senior managers in several technology-related sectors exceeds the global average — except at CEO level.

95
Taking Stock: Data and Evidence on Gender Digital Equality PART ONE
Data from the U.S. Bureau of Labor Statistics indicates that women currently make up about 29% of Computer and Information Systems managers. Similarly, the Equal Employment Opportunity Commission (2016) found that women comprised 20% of Executives, Senior Officials, and Managers in the high-tech industry in 2014. This percentage had not changed much by 2015; the U.S. Government Accountability Office (2017) reports that women occupied 19% of senior management positions in technology sector companies, and that this has essentially been unchanged since 2007. Bell and White (2014), on the other hand, conclude that progress has been made towards having more women in top positions over the past two decades, although they are still
underrepresented. Overall, women tend to be in junior and support rather than managerial roles. Where women have made inroads into management, they are often in staff positions, rather than the line positions which constitute the main pathway to executive roles (Molina, Lin & Wood, 2015; United States Government Accountability Office, 2017; World Economic Forum, 2017). These trends appear to be repeated in the new industries developing around artificial intelligence (Case study 3.2; Parsheera, 2018).

96
Taking Stock: Data and Evidence on Gender Digital Equality PART ONE
Case Study 3.2Where are the women? Gender disparities in AI research and developmentAuthor: Mike Best & Dhaval Modi (UNU-CS)
The artificial intelligence (AI) community has a diversity problem. Kate Crawford, a Microsoft researcher and NYU professor, asserts that AI has a “white guy problem” (Crawford, 2016). She explains why this matters: “Like all technologies before it, artificial intelligence will reflect the values of its creators. So inclusivity matters. . . . Otherwise, we risk constructing machine intelligence that mirrors a narrow and privileged vision of society, with its old, familiar biases and stereotypes.”
The low level of female presence among AI researchers, developers, and thought leaders epitomises this diversity challenge. Hannah Wallach, a Microsoft-based AI researcher and founder of Women in Machine Learning (WiML), estimates that the entire field of machine learning is only 13.5% female (Weissman, 2016). To better amass evidence as to this gender
disparity, we have accumulated data on women participation in leadership among top AI companies, as well as scholarly presence among the top U.S.-based university computer science faculty.
To calculate the percentage of women in executive management at leading AI startups, we began with CB Insights’ 2018 “AI 100”, their ranking of the top 100 promising start-ups in Artificial Intelligence (https://www.cbinsights.com/research/artificial-intelligence-top-startups/). CB Insights’ 2018 “AI 100” list includes companies from the U.S., Canada, the UK, France, Spain, Japan, China, Taiwan, and Israel (https://www.cbinsights.com/research/artificial-intelligence-top-startups/). We were able to establish the gender balance among executive management for 95 of these companies. (One C-level manager is identified as non-binary and is not categorised here.) Only two companies have equal numbers of women and men in their C-level positions and none are majority female. Three in five have less than 20% women in their leadership team, and one in five have no females at all. Women overall made up 18% of these AI leaders.
Figure 3.10Women in senior management – Technology companies
Source: Dawson et al., 2014, p. 15. Note: * HR, Legal, IT, External Relations
We computed the percentage of female professors at top U.S.-based university AI programs, basedon the top 20 programs listed in the US News & World Report 2018 ranking of best artificial intelligence graduate programs (https://www.usnews.com/best-graduate-schools/top-scienceschools/artificial-intelligence-rankings). We calculated the number of faculty members (including adjuncts) from each university’s website and from laboratory staff listings
(e.g., for Stanford University), as well as from research interests as stated on faculty websites (e.g., Carnegie Mellon).We were able to obtain faculty gender information for all but two programs (UCLA and Cal Tech). Theaverage percentage of female AI faculty was 22%, ranging from 8% (University of Pennsylvania) to 43% (Harvard). No university had achieved gender parity among its AI faculty.

97
Taking Stock: Data and Evidence on Gender Digital Equality PART ONE
3.3.3 / LEADERSHIP ON BOARDS
A similar trend of low representation of women is seen with board membership (Deloitte & Alliance for Board Diversity, 2016; Institutional Shareholder Services, Inc & Regulation, 2017; Quirós et al., 2018). However, it is unclear whether the situation is worse in the ICT industry than in other areas. Some data are difficult to interpret, due in part to varying definitions and the diversity of industry sectors. Adams and Kirchmaier (2016) studied data for listed firms in 20 countries and found that firms in STEM and Finance sectors had 1.8% fewer women on boards than firms in non-STEM sectors. In cybersecurity, men are four times more likely than women to hold executive-level positions, and nine times more likely to hold managerial positions (Frost & Sullivan, 2017). Women comprise 9% and 15% respectively of directors and executive officers in Canada’s technology industry (MacDougall et al., 2017), while according to Bell (2016), Silicon Valley firms have relatively low proportions of women directors, at 14% (compared to 23% for large public companies).
Conversely, Chanavat and Ramsden (2013), evaluating multiple countries, found that technology companies had some of the most gender-diverse boards (around 20% women), but that telecommunication service companies had less diverse boards (around 15%). In Europe, however, the telecommunication service sector has the highest percentage of women on boards (at 27%) and “is also the only sector where all companies have at least one woman on their boards”(Quirós et al., 2018, p. 12). Quiros et al. (2018) also found significant improvement in the number of women board members in the IT industry — a 102% increase since 2011 — although the IT sector also had the highest percentage of all-men boards. A global study by Credit Suisse (Dawson et al., 2014) found that the telecom industry had one of the highest proportions of women on boards, while the technology industry had lower proportions (Table 3.7). Comparing women on boards in a variety of economic sectors, Deloitte (2017) found that, while in most regions the Technology, Media and Telecoms category was not among the top three performers, in Asia and the Middle East women constituted 8% and 12% (respectively) of boards in this category.
Table 3.7Percentage of women on boards, by industry
Source: Dawson et al., 2014, p. 10.
These mixed findings complicate any analysis of gender equality in board membership of ICT companies. Furthermore, board size impacts diversity as well, as the boards of larger companies tend to be more gender diverse than those of smaller and younger
companies (Bell, 2016; Brush, Greene, Balachandra, & Davis, 2014). This suggests that understanding and measuring board diversity may require more than simple headcounts.

98
Taking Stock: Data and Evidence on Gender Digital Equality PART ONE
3.3.4 / ACADEMIES OF SCIENCE
Analysis of data from the European Institute for Gender Equality (EIGE) shows that in the 28 EU member states, women comprise less than 22% of membership and less than 16% of presidents or chairs of the highest decision-making body in national academies of science (EIGE database, 2017)15. Only eight countries have women presidents or chairs. Similar trends likely pertain elsewhere; a survey by the Academy of Science of South Africa (2015) finds that, globally, women make up only about 12% of the membership of science academies. The highest proportion was at the Cuban Academy of Sciences (27%) and the lowest at the Polish and Tanzanian Academies of Sciences (4% each). Women constitute 12% of elected Fellows of The World Academy of Sciences (TWAS)16 and 32% of its Young Affiliates programme (The World Academy of Sciences, 2018). As Table 3.8 shows, the distribution of women TWAS fellows across different disciplines mirrors the tendency for women science scholars to be concentrated in the medical and social sciences.
15 Note: out of 58 positions. Most countries have just one leadership position per academy, but may have several academies.
16 A “global science academy dedicated to building science in the developing world” (TWAS website), with membership from 100 countries.
Table 3.8The World Academy of Sciences Fellows
Source: The World Academy of Sciences, https://twas.org/directory/overview

99
Taking Stock: Data and Evidence on Gender Digital Equality PART ONE
3.4 / ENTREPRENEURSHIP
While some of the issues women face in the ICT employment realm may also apply to their participation in digital entrepreneurship, other issues are unique to women entrepreneurs. Access to venture capital is one that has received considerable attention in recent months, as data reveals how little such capital is available to women entrepreneurs. However, there is still limited data on this and other relevant issues (Kuschel & Lepeley, 2016). Thus, we use indicators relating to women entrepreneurship broadly, with a few additional sources about the ICT industry. The discussion below covers women’s participation in ownership of businesses, access to business training, and access to business capital.
3.4.1 / FIRM OWNERSHIP
Globally, the gender gap in entrepreneurship has narrowed since 2014; however, women are less likely than men to start enterprises in the ICT sector (Kelley et al., 2017). Women constitute only 6% of information technology entrepreneurs in the U.S. (Gompers & Wang, 2017b); Europe has a higher proportion of women entrepreneurs in the ICT industry, at 23% (Quirós et al., 2018).
The data presented below relates to women’s participation in ownership of firms in general, in the absence of global data on women’s ownership of technology or ICT firms. (Note, however, that relatively few countries report even this data: 10% of countries in Oceania, 47% in Europe, 61% in Africa, 64% in Asia, and 65% in the Americas.) The available data shows that less than 50% of firms have at least one woman owner (Figure 3.11). Data collected by the Global Entrepreneurship Monitor (2015 dataset) shows a higher proportion of men entrepreneurs in most countries. That entrepreneurial gender gap ranges from 5% in the Philippines — where women are more likely than men to be engaged in entrepreneurial activity — to -11% in Lebanon, where men are more likely than women to be engaged in entrepreneurial activity. Women exhibit more entrepreneurial behaviour than men in six countries, of which five are in Asia.
At the country level, we see an entrepreneurship paradox similar to the education paradox mentioned in Chapter 2: the lower a country’s level of socio-economic development, the smaller the gender gap in entrepreneurship seems to be.17 However, women entrepreneurs in lower-income countries are more likely to be driven by necessity rather than opportunity motives (Kelley et al., 2017; OECD, 2012), and this can compromise the long-term sustainability and growth of their ventures. There is also insufficient data to determine whether women venture into digital entrepreneurship. Some evidence suggests that the digital economy has generated opportunities (such as airtime sales, phone repairs, data entry, community information services, and call centres) for women entrepreneurs in developing countries; see, for example, Heeks (2005) and UNCTAD (2014). However, more data is needed to determine the relative proportion of men to women in these enterprises, and whether there are differences in the conditions under which they work.
17 The reasons for this are beyond the scope of this report, but some relevant factors may be found in the entrepreneurship literature.
Figure 3.11Percentage of firms with women participating in ownership
Source: World Bank.Note: Variable data availability for different regions.

100
Taking Stock: Data and Evidence on Gender Digital Equality PART ONE
3.4.2 / ACCESS TO BUSINESS TRAINING
Most discussions of gender gaps in ICT entrepreneurship tend to approach the subject from the perspective of access to the appropriate technical training, with less attention being paid to obtaining the requisite business skills. Most ICT entrepreneurs require business knowledge to be successful in running the enterprise and, importantly, to raise business capital. Indeed, an interest in business —instead of an interest
in technology — represents an alternative route to digital entrepreneurship.
OECD data indicates that women generally have less access than men to training on how to start a business (Figure 3.12). The tendency is the same in the six non-OECD economies included in the dataset. Only in four countries (Mexico, Estonia, Australia, and Sweden) are women equal to or slightly more advantaged than men with regard to such training. The gap is highest in Luxemburg (19% more men) and lowest in Sweden (3% more women).
Figure 3.12Access to training to start a business
Source: OECD Social and Welfare Statistics, 2018 (database), http://dx.doi.org/10.1787/data-00723-en
3.4.3 / ACCESS TO BUSINESS CAPITAL
Access to capital is critical for entrepreneurs, regardless of business size. Some indication of ability to secure capital can be gleaned from data on the use of formal financial instruments by the general population. This section presents OECD data, on access to capital to start a business, as well as World Bank data, on
ownership of a bank account, saving, and borrowing from a financial institution.
Overall, women are disadvantaged in access to financial services that could facilitate access to business capital. In most OECD countries, women are less likely to have access to capital to start a business compared to men (Figure 3.13).

101
Taking Stock: Data and Evidence on Gender Digital Equality PART ONE
Figure 3.13Access to finance to start a business
Source: OECD Social and Welfare Statistics, 2018 (database), http://dx.doi.org/10.1787/data-00723-en
Levels of financial inclusion are low for both men and women in Asia, the Americas, and Africa. Even so, all regions except Oceania exhibit a gender gap in favour of men, though very narrow in some cases (Figures 3.14–3.16). The gap in account ownership ranges from 2% (Europe) to 11% (Africa). The gap in saving activity ranges from 3% (Asia) to 5% (Americas). And the gap in borrowing activity ranges from 2% (Africa) to 3% (Europe). In the two Oceania countries represented, women have equal access to bank accounts, they are
more likely to save than men, and they are more likely to have borrowed from a financial institution. Globally, a pilot survey of 28 central banks and other regulators found that 40% of account holders and borrowers are women (IMF, 2018).

102
Taking Stock: Data and Evidence on Gender Digital Equality PART ONE
Figure 3.14Percentage of adults (15+ years) with an account at a bank or other financial institution or with a mobile-money-service provider
Figure 3.15Percentage of adults (15+ years) who have saved at a financial institution
Source: World Bank, Global Findex Database (http://www.worldbank.org/globalfindex). Note: Robust data – 144 countries represented; only 2 countries from Oceania.
Source: World Bank, Global Findex Database (http://www.worldbank.org/globalfindex).Note: Robust data – 144 countries represented; only 2 countries from Oceania.

103
Taking Stock: Data and Evidence on Gender Digital Equality PART ONE
Figure 3.16Percentage of adults (15+ years) who have borrowed from a financial institution
Source: World Bank, Global Findex Database (http://www.worldbank.org/globalfindex).Note: Robust data – 144 countries represented; only 2 countries from Oceania.
3.4.4 / ACCESS TO VENTURE CAPITAL
The availability of venture capital (VC) investment provides a view on the experience of women trying to start ventures in the ICT industry, since a majority of venture capital goes into the ICT and related sectors (Ernst & Young, 2015). The U.S. (and especially the San Francisco Bay area) receives almost three-quarters of global venture capital (Ernst & Young, 2015), and a majority of this goes to the software (36%) and biotechnology (17%) sectors (NVCA, 2016).
Data on entrepreneurs’ access to venture capital is only recently becoming public. It shows that investment in businesses with women partners has increased but still remains low, and women-run companies receive a dismal proportion of venture capital. Brush et al. (2014) examined a database of 6,793 VC recipients in the U.S. between 2011 and 2013 and found that over 15% of the companies had a woman on the executive team, up from less than 5% in 1999. Moreover, the companies with a woman on the team also received more funding than in previous years. However, only 2.7% of the companies had a woman CEO, and those companies only received 3% of total VC investments (see also: Bradley, Gicheva, Hassell, & Link, 2013; and
Scott, Kapor Klein, McAlear, Martin, & Koshy, 2018). A study of 58 investment funds that ascribe to gender-lens investing found, on the positive side, that 59% of these funds had all-women partners (compared to the industry norm of 7%). However, they also noted “an inverse relationship between fund size and the proportion of women fund partners or investment committee members: the more women at the top, the less capital raised” (Biegel, Hunt, & Kuhlman, 2017, p. 6). Similarly, Quiros et al. (2018) observed that in Europe, wholly woman-owned startups received less than 5% of all VC deals in 2016 — an improvement over previous years — and that in the UK, for example, men entrepreneurs were 86% more likely to obtain VC funds than women (p. 12).
A lack of diversity can also be seen within venture capital firms, with very few woman venture capitalists. For example, a review of 160 venture capital firms in the UK found that only 13% of partners were women; 48% of investment teams had no women (Diversity VC, 2017). Likewise, Scott et al. (2018) report that women constitute just 11% of investment professionals in the U.S. This is important if, as some evidence suggests, VC firms with women partners are more likely to invest in businesses with women managers or CEOs, compared to VC firms with women in their management teams (Brush et al., 2014).

104
Taking Stock: Data and Evidence on Gender Digital Equality PART ONE
3.5 / POLICYMAKING
The dearth of gender perspectives in the technology industry could potentially be addressed by including more women in senior policymaking positions, not only in technology organisations but also in political institutions.
3.5.1 / PARTICIPATION IN NATIONAL GOVERNANCE
At the level of national governance, gender diversity is already low, as seen in the proportion of seats held by women in national parliaments (Table 3.9). All regions have less than 30% representation of women.
Table 3.9Proportion of seats held by women in national parliaments
Source: Inter-Parliamentary Union, April 2018, http://archive.ipu.org/wmn-e/arc/world010418.htm
3.5.2 / PARTICIPATION IN ICT-RELATED POLICYMAKING AGENCIES
Public information is available relating to two key types of ICT-related government agencies — ICT ministries and telecommunications regulators. Worldwide, only
28 out of 203 countries have a woman in charge of the ICT ministry (Table 3.10). Nearly 88% of ICT ministers are men (Figure 3.17). Africa and the Americas have the highest percentage of ICT ministries led by a woman (17% and 23%, respectively).

105
Taking Stock: Data and Evidence on Gender Digital Equality PART ONE
Table 3.10Proportion of female heads of policymaking agencies
Source: UNU-CS desk research, June 2018
Figure 3.17Countries with a woman in charge of the ICT ministry
Source: UNU-CS desk research, June 2018

106
Taking Stock: Data and Evidence on Gender Digital Equality PART ONE
The 28 countries with a woman ICT minister in 2018 were: Algeria, Barbados, Benin, Bolivia, Burkina Faso, Cameroon, Chad, Chile, Colombia, Cyprus, El Salvador, Estonia, Finland, Ghana, Guyana, Jordan, Monaco, Montenegro, New Zealand, Portugal, Puerto Rico, Sint Maarten, South Africa, Sudan, Switzerland, Togo, Trinidad and Tobago, and Uruguay.
Similarly, in 2018, only 25 countries had a woman heading the telecommunications regulator (Figure 3.18). The Americas and Oceania have the highest percentage of woman telecommunication regulators (23% in each region). The 25 countries with a woman as head of the telecommunications regulator were: Argentina, Australia, Chile, Denmark, El Salvador18, Finland, Guyana, Hong Kong, Hungary, Japan, Liberia, Macau, Macedonia, Namibia, Niger, Norway, Paraguay, Puerto Rico19, Samoa, Sint Maarten, Slovenia, Suriname, Uganda, Vanuatu, and Zambia.
18 The head of El Salvador’s telecommunications regulator is also the Minister of Communications and Information Technology (ICT).
19 The head of Puerto Rico’s telecommunications regulator is also the Minister of Communications and Information Technology (ICT).
Figure 3.18Countries with a woman in charge of the telecommunications regulator
Source: UNU-CS desk research, June 2018.

107
Taking Stock: Data and Evidence on Gender Digital Equality PART ONE
3.6 / CONCLUSION
This chapter reviewed data and research on women’s employment in the ICT workforce, women’s contribution to the industry as entrepreneurs, and women’s inclusion in related policymaking. The results suggest that, although gains have been made over the years, women’s representation is low across different dimensions. While more and more women are holding highly skilled jobs, few of them are in ICT-related fields; however, we see wide variation by country. Within ICT and STEM occupations, women are nearly absent from software development, in engineering and technology research, and in university teaching. There is a high rate of women leaving science and technology jobs, whether due to the lack of work-life balance frequently found in male-dominated fields or to a range of
gendered obstacles to achieving their career goals. Few women are found at any level of technology leadership, and those tend to serve in subordinate roles with little chance for advancement. Women are also less likely to become ICT entrepreneurs; they generally lack training in business startups and have very little access to venture capital. Most seriously, they have a very low rate of representation in science and technology policy making.
However, the severe lack of relevant data makes it difficult to reach an accurate assessment of the global situation. European and North American countries tend to have the most ICT-specific data; and even there, the data is variable and often requires nuanced interpretation.

108
Taking Stock: Data and Evidence on Gender Digital Equality PART ONE
REFERENCES
AACSB International. (2018). Staff compensation and demographics report: 2017-18 executive summary. Association to Advance Collegiate Schools of Business. Retrieved from: https://www.aacsb.edu/-/media/aacsb/publications/data-reports/global-salary-survey/staff%20compensation%20and%20demographics%20report%202017-18%20executive%20summary.ashx?la=en
AASSA. (2015). Women in science and technology in Asia. The Association of Academies and Societies of Sciences in Asia. Retrieved from: www.interacademies.org/File.aspx?id=28016
Adams, R. B., & Kirchmaier, T. (2016). Women on Boards in Finance and STEM Industries. American Eco-nomic Review, 106(5), 277–281. Retrieved from: https://doi.org/10.1257/aer.p20161034
Annabi, H., & Lebovitz, S. (2018). Improving the reten-tion of women in the IT workforce: An investigation of gender diversity interventions in the USA. Information Systems Journal, 0(0). Retrieved from: https://doi.org/10.1111/isj.12182
Ashcraft, C., McLain, B., & Eger, E. (2016). Women in tech: The facts (p. 76). National Center for Women & Technology (NCWIT).
BCS. (2017). Diversity in IT 2017. Swindon: BCS, The Chartered Institute for IT. Retrieved from: http://www.bcs.org/category/19217?src=hs4
Bell, D. (2016). Corporate Governance Practices and Trends: A Comparison of Large Public Companies and Silicon Valley Companies. Retrieved from: https://www.fenwick.com/FenwickDocuments/2016-Corporate-Go-vernance.pdf
Bell, D., & White, S. S. (2014). Gender Diversity in Silicon Valley: A Comparison of Silicon Valley Public Companies and Large Public Companies. Retrieved from: https://www.fenwick.com/FenwickDocuments/Gender_Diversity_2014.pdf
Biegel, S., Hunt, S. M., & Kuhlman, S. (2017). TRAC-KING VENTURE CAPITAL WITH A GENDER LENS (p. 36). Retrieved from: https://socialimpact.wharton.upenn.edu/wp-content/uploads/2017/10/ProjectSage-Report_10.25.17.pdf
Blau, F. D., Brummund, P., & Liu, A. Y.-H. (2013). Trends in Occupational Segregation by Gender 1970-2009: Adjusting for the Impact of Changes in the Occupatio-nal Coding System. Demography, 50(2), 471–494.
Boddington, P. (2017). Towards a code of ethics for artificial intelligence. Springer International Pu-blishing. Retrieved from: www.springer.com/gp/book/9783319606477
Bradley, S. R., Gicheva, D., Hassell, L., & Link, A. N. (2013). Gender differences in access to private invest-ment funding to support the development of new technologies (UNCG Economics Working Papers No. 13–9). University of North Carolina at Greensboro, De-partment of Economics. Retrieved from: https://ideas.repec.org/p/ris/uncgec/2013_009.html
Brown, J. (2016, March 22). Women as full-time business school faculty – Does world region make a difference? Retrieved from: http://aacsbblogs.typepad.com/dataandresearch/2016/03/women-as-full-time-bu-siness-school-faculty-does-world-region-make-a-diffe-rence.html
Brush, C. G., Greene, P. G., Balachandra, L., & Davis, A. (2014). Diana Report: Women entrepreneurs 2014: Bridging the gender gap in venture capital. Retrieved from: http://www.babson.edu/Academics/centers/blank-center/global-research/diana/Documents/dia-na-project-executive-summary-2014.pdf
Chanavat, A., & Ramsden, K. (2013). Mining the me-trics of board diversity. Retrieved from: https://www.thomsonreuters.com/en/press-releases/2013/avera-ge-stock-price-of-gender-diverse-corporate-boards-out-perform-those-with-no-women.html
CompTIA. (2017). 2017 IT Industry job market & salary trends analysis. Cyberstates. Retrieved from: http://www.cyberstates.org/
CompTIA. (2018). 2018 IT (Information Technology) industry trends analysis. Retrieved from: https://www.comptia.org/resources/it-industry-trends-analysis
Crawford, K. (2018). Artificial Intelligence’s white guy problem. The New York Times, January 20. Retrieved from: https://www.nytimes.com/2016/06/26/opinion/sunday/artificial-intelligences-white-guy-problem.html
Cummings, L. M. (2015). Gender Equality in science, technology, engineering, agricultural sciences and mathematics (STEAM) academic pipeline: Challenges transferring knowledge to practice. Retrieved from: ht-tps://www.usaid.gov/sites/default/files/USAID-Report-Sep-30-2015-Final.pdf
Data 2x. (2017). Ready to Measure: Phase II. Indicators available to monitor SDG gender targets, p. 21. Retrie-ved from: http://www.data2x.org/what-is-gender-data/ready-to-measure/
David, P. A., & Shapiro, J. S. (2008). Community-based production of open-source software: What do we know about the developers who participate? Information Economics and Policy, 20(4), 364–398. Retrieved from: https://doi.org/10.1016/j.infoecopol.2008.10.001
Dawson, J., Kersley, R., & Natella, S. (2014). The CS Gender 3000: Women in senior management. Credit Suisse. Retrieved from: https://publications.credit-suisse.com/tasks/render/file/index.cfm?fileid=-8128F3C0-99BC-22E6-838E2A5B1E4366DF

109
Taking Stock: Data and Evidence on Gender Digital Equality PART ONE
Deloitte. (2017). Women n the boardroom: A global perspective (5th edition). Retrieved from: https://www2.deloitte.com/za/en/pages/deloitte-africa/articles/wo-men-in-the-boardroom.html
Deloitte, & Alliance for Board Diversity. (2016). Missing pieces report: The 2016 board diversity census of wo-men and minorities on Fortune 500 Boards. Retrieved from: http://theabd.org/2016%20Board%20Diversi-ty%20Census_Deloitte_ABD_Final.PDF
Donnelly, G. (2017). Only 3% of Fortune 500 com-panies share full diversity data. Fortune, June 7. Retrieved January 27, 2018, from: http://fortune.com/2017/06/07/fortune-500-diversity/
Ernst & Young. (2015). Venture capital insights – 4Q14: Global VC investment landscape. Ernst & Young. Retrie-ved from: http://www.ey.com/Publication/vwLUAssets/Venture_Capital_Insights_4Q14_-_January_2015/$FILE/ey-venture-capital-insights-4Q14.pdf
European Commission. (2015). She figures 2015: Gen-der in research and innovation, 2.
Evans Data Corporation. (2017). Global Developer Population and Demographic Study 2017 (1).
Evans, W., & Rangarajan, S. (2017,). Hidden figures: How Silicon Valley keeps diversity data secret. Re-veal News, October 19. Retrieved from: https://www.revealnews.org/article/hidden-figures-how-silicon-va-lley-keeps-diversity-data-secret/
Ford, D., Smith, J., Guo, P. J., & Parnin, C. (2016). Para-dise unplugged: Identifying barriers for female partici-pation on stack overflow. Proceedings of the 2016 24th
ACM SIGSOFT International Symposium on Founda-tions of Software Engineering - FSE 2016, 846–857. Re-trieved from: https://doi.org/10.1145/2950290.2950331
Frehill, L., Abreu, A., & Zippel, K. (2015). Gender, scien-ce, and occupational sex segregation. In W. Pearson, L. Frehill, & C. McNeely (Eds.), Advancing women in science: An international perspective (pp. 51–92). Swit-zerland: Springer. Retrieved from: http://www.springer.com/br/book/9783319086286
Frost & Sullivan. (2017). The 2017 Global Information Security Workforce Study: Women in cybersecurity. Retrieved from: https://iamcybersafe.org/wp-content/uploads/2017/03/WomensReport.pdf
GitHub. (2018). “User search”. Retrieved 2018-07-12 (showing 29,707,507 available users).
GlassDoor (2018). Best jobs in America. Retrieved 2018-06-25 from: https://www.glassdoor.com/List/Best-Jobs-in-America-LST_KQ0,20.htm
Gompers, P. A., & Wang, S. Q. (2017a). And the chil-dren shall lead: Gender diversity and performance in venture capital (Working Paper No. 23454). National
Bureau of Economic Research. Retrieved from: https://doi.org/10.3386/w23454
Gompers, P. A., & Wang, S. Q. (2017b). Diversity in innovation (Working Paper No. 23082). National Bureau of Economic Research. Retrieved from: https://doi.org/10.3386/w23082
Gumpertz, M., Durodoye, R., Griffith, E., & Wilson, A. (2017). Retention and promotion of women and underrepresented minority faculty in science and engineering at four large land grant institutions. PLOS ONE, 12(11), e0187285. Retrieved from: https://doi.org/10.1371/journal.pone.0187285
HackerRank. (2018). 2018 Women in tech report. Retrie-ved May 29, 2018, from: https://research.hackerrank.com/women-in-tech/2018/
HackerRank (2018). HackerRank developer survey 2018. Retrieved June 6, 2018, from: https://www.kaggle.com/hackerrank/developer-survey-2018/home
Heeks, R. (2005). Developing women’s ICT-based enter-prise: Summary of an international knowledge-sharing workshop (Workshop report). Retrieved from: https://assets.publishing.service.gov.uk/media/57a08c5ced-915d622c0012c5/R8352-WorkshopKeralaReport.pdf
Hewlett, S. A., & Sherbin, L. (2014). Athena Factor 2.0: Accelerating female talent in science, engineering & te-chnology. Retrieved from: http://www.talentinnovation.org/_private/assets/Athena-2-ExecSummFINAL-CTI.pdf
Hunt, J. (2010). Why do women leave science and engi-neering? (Working Paper No. 15853). National Bureau of Economic Research. Retrieved from: https://doi.org/10.3386/w15853
Hunt, V., Layton, D., & Prince, S. (2015). Diversity matters. Retrieved from: https://www.mckinsey.com/~/media/mckinsey/business%20functions/organization/our%20insights/why%20diversity%20matters/diversi-ty%20matters.ashx
Hunt, V., Yee, L., Prince, S., & Dixon-Fyle, S. (2018). Delivering growth through diversity in the workplace. McKinsey & Company. Retrieved from: https://www.mckinsey.com/business-functions/organization/our-insi-ghts/delivering-through-diversity
ILO. (2017a). Economic impacts of reducing the gender gap. Research brief. Retrieved from: http://www.ilo.org/global/research/publications/what-works/WCMS_577685/lang--en/index.htm
ILO. (2017b). World Employment and Social Outlook: Trends for women 2017. Retrieved January 20, 2018, from: http://www.ilo.org/global/research/global-re-ports/weso/trends-for-women2017/lang--en/index.htm
ILO. (2018). Women and men in the informal eco-nomy: A statistical picture (3rd edition). Retrieved from: http://www.ilo.org/global/publications/books/

110
Taking Stock: Data and Evidence on Gender Digital Equality PART ONE
WCMS_626831/lang--en/index.htmIMF. (2018). Financial Access Survey (FAS): Gender pilot outcomes.
Information is Beautiful. (2018). Diversity in Tech: Infor-mation is Beautiful. Infographics. Retrieved January 28, 2018, from: https://informationisbeautiful.net/visualiza-tions/diversity-in-tech/
Institutional Shareholder Services, Inc, & Regulation, F. (2017, January 5). Gender parity on boards around the world. Retrieved March 5, 2018, from: https://corpgov.law.harvard.edu/2017/01/05/gender-parity-on-boards-around-the-world/
Kelley, D., Baumer, B. S., Brush, C. G., Greene, P. G., Mahnaz, M., Mahdi, M., … Dean, M. (2017). Global Entrepreneurship Monitor: Women’s entrepreneurship 2016/2017 report. Retrieved from: https://www.babson.edu/Academics/centers/blank-center/global-research/gem/Documents/GEM%202016-2017%20Womens%20Report.pdf
Kuschell, K., & Lepeley, M.-T. (2016). Women start-ups in technology: Literature review and research agenda to improve participation. International Journal of Entrepre-neurship and Small Business, 27(2/3), 333–346.
Lakhani, K. R., & Von Hippel, E. (2003). How open source software works: “Free” user-to-user assistance. Research Policy, 32(6), 923–943. Retrieved from: https://doi.org/10.1016/S0048-7333(02)00095-1
MacDougall, A., Valley, J., Adler, J., Bettel, C., Param, A., Schmidt, J., … Suppa, O. (2017). 2017 Diversity disclosure practices report: Women in leadership roles at TSX-listed companies. Retrieved from: http://www.osler.com/en/resources/governance/2017/2017-diversi-ty-disclosure-practices-report-women
Molina, M., Lin, S., & Wood, C. (2015). Connected Wo-men 2015: Accelerating the digital economy: Gender diversity in the telecommunications sector. A.T. Kearney & GSMA. Retrieved from: http://www.atkearney.tw/communications-media-technology/ideas-insights/con-nected-women-2015
NVCA. (2016, January 15). $58.8 Billion in venture capital invested across U.S. in 2015, according to the MoneyTree Report. Retrieved from: https://nvca.org/pressreleases/58-8-billion-in-venture-capital-invested-across-u-s-in-2015-according-to-the-moneytree-re-port-2/
OECD. (2017). OECD Digital Economy Outlook 2017. Paris: OECD Publishing. Retrieved from: https://www.oecd-ilibrary.org/science-and-technology/oecd-digital-economy-outlook-2017_9789264276284-en
OECD STI. (2018). Empowering women in the digital age. OECD Directorate for Science, Technology and Innovation. Retrieved from: https://www.oecd.org/so-cial/empowering-women-in-the-digital-age-brochure.pdf
Parsheera, S. (2018). A gendered perspective on Arti-ficial Intelligence. In ITU (Ed.), Machine learning for a 5G future (125–131). Santa Fe, Argentina: International Telecommunication Union. Retrieved from: https://www.itu.int/dms_pub/itu-t/opb/proc/T-PROC-KALEI-2018-PDF-E.pdf
Quirós, C. T., Morales, E. G., Pastor, R. R., Carmona, A. F., Ibáñez, M. S., & Herrera, U. M. (2018). Women in the digital age. European Commission. Retrieved from: https://ec.europa.eu/digital-single-market/en/news/increase-gender-gap-digital-sector-study-women-digi-tal-age
Richard, G. T., Kafai, Y. B., Adleberg, B., & Telhan, O. (2015). StitchFest: Diversifying a college hackathon to broaden participation and perceptions in com-puting. SIGCSE ’15: Proceedings of the 46th ACM Technical Symposium on Computer Science Educa-tion (March), 114–119. Retrieved from: https://doi.org/10.1145/2676723.2677310
Sassler, S., Michelmore, K., & Smith, K. (2017). A tale of two majors: Explaining the gender gap in STEM employment among computer science and engineering degree holders. Social Sciences, 6(3), 69. Retrieved from: https://doi.org/10.3390/socsci6030069
Servon, L. J., & Visser, M. A. (n.d.). Progress hindered: The retention and advancement of women in science, engineering and technology careers. Human Resource Management Journal, 21(3), 272–284. Retrieved from: https://doi.org/10.1111/j.1748-8583.2010.00152.x
Shauman, K. A. (2017). Gender differences in the early employment outcomes of STEM doctorates. Social Sciences, 6(1), 24. Retrieved from: https://doi.org/10.3390/socsci6010024
Stack Overflow. (2018). Stack Overflow Developer Survey 2018. Retrieved April 4, 2018, from: https://stackoverflow.com/insights/survey/2018/?utm_sour-ce=so-owned&utm_medium=social&utm_campaign=-dev-survey-2018&utm_content=social-share
Stack Overflow. (2018). “Users” Retrieved July 12, 2018 (showing 8,731,692 available users).
Tapia, A. H., & Kvasny, L. (2004). Recruitment is never enough: Retention of women and minorities in the IT workplace. In Proceedings of the 2004 SIGMIS Con-ference on Computer Personnel Research: Careers, Culture, and Ethics in a Networked Environment (84–91). New York, NY: ACM. Retrieved from: https://doi.org/10.1145/982372.982392
The World Academy of Sciences. (2018). TWAS Fe-llows. Retrieved June 5, 2018, from: https://twas.org/directory/overview

111
Taking Stock: Data and Evidence on Gender Digital Equality PART ONE
Thomas, A., Doughertty, J., Strand, S., Nayar, A., & Janani, M. (2016). Decoding diversity: The financial and economic returns to diversity in tech. Retrieved from: https://newsroom.intel.com/newsroom/wp-content/uploads/sites/11/2016/07/Diversity_report_7.7.16_web-1.pdf
UNCTAD. (2014). Empowering women entrepreneurs through information and communications technolo-gies: A practical guide (UNCTAD Current Studies on Science Technology and Innovation, No. 9). Retrieved from: https://unctad.org/en/PublicationsLibrary/dtls-tict2013d2_en.pdf
UNCTAD. (2015). Global assessment of sex-disaggre-gated ICT employment statistics: Data availability and challenges on measurement and compilation, 54.
UNESCO Institute for Statistics. (2017). Women in science (Fact Sheet No. 43; FS/2017/SCI/43). Retrieved from: http://uis.unesco.org/sites/default/files/docu-ments/fs43-women-in-science-2017-en.pdf
U.S. Equal Employment Opportunity Commission. (2016). Diversity in high tech. Retrieved from: https://www.eeoc.gov/eeoc/statistics/reports/hightech/index.cfm#_ftnref16
US Government Accountability Office. (2017). Diversity in the technology sector. Retrieved from: https://www.gao.gov/assets/690/688460.pdf
Vasilescu, B. (2014). Human aspects, gamification, and social media in collaborative software engineering. Companion Proceedings of the 36th International Conference on Software Engineering. ICSE Com-panion 2014, 646–649. Retrieved from: https://doi.org/10.1145/2591062.2591091
Vasilescu, B., Filkov, V., & Serebrenik, A. (2015). Perceptions of diversity on GitHub: A user survey. Proceedings of the Eighth International Workshop on Cooperative and Human Aspects of Software Enginee-ring, 50–56. Retrieved from: https://doi.org/10.1109/CHASE.2015.14
Vasilescu, B., Posnett, D., Ray, B., van den Brand, M. G. J., Serebrenik, A., Devanbu, P., & Filkov, V. (2015). Gender and tenure diversity in GitHub teams. In Crossings. Seoul, Korea. Retrieved from: http://delivery.acm.org.offcampus.lib.washington.edu/10.1145/2710000/2702549/p3789-vasilescu.pdf?ip=128.95.104.66&id=2702549&acc=ACTI-VE%20SERVICE&key=B63ACEF81C6334F5%2E-F43F328D6C8418D0%2E4D4702B0C3E38B35%2E-4D4702B0C3E38B35&__acm__=1518685543_74e499233266245940ed485ccf165e04
Wang, Z., Wang, Y., & Redmiles, D. (2018, May). Com-petence-confidence Gap: A threat to female develo-pers’ contribution on GitHub. In: ICSE-SEIS’18, Proce-edings of 40th International Conference on Software Engineering: Software Track (p. 10).
Weissman, C. G. (2016, August 18). The women changing the face of AI. Retrieved July 12, 2018, from: https://www.fastcompany.com/3062932/ai-is-a-male-dominated-field-but-an-important-group-of-women-is-changing-th
WIT Leadership Round Table Metrics Working Group. (2016). Diversity metrics for technology companies.
World Economic Forum. (2017). The global gender gap report 2017. Retrieved from: https://www.weforum.org/reports/the-global-gender-gap-report-2017/
Yoder, B. (2016). Engineering by the numbers. Ameri-can Society for Engineering Education. Retrieved from: https://www.asee.org/documents/papers-and-publica-tions/publications/college-profiles/16Profile-Front-Sec-tion.pdf
Zlotnick, F., Smith, A., Linksvayer, M., & Filippova, A. (2018). The open source survey. Retrieved from: URL https://github. com/github/open-source-survey

112
THE DARK SIDE OF ICT ACCESS, SKILLS, AND LEADERSHIPAUTHORS: ARABA SEY AND DON RODNEY JUNIO (UNU-CS)
4

113
Taking Stock: Data and Evidence on Gender Digital Equality PART ONE
KEY FINDINGS
• Greater female inclusion in ICT access, skills, and leadership could become associated with increased exposure to undesirable experiences, unless that inclusion is accompanied by corresponding changes in the social and institutional cultures that enable or tolerate negative behaviour.
• About 73% of women have already been exposed to or have experienced some form of cyber violence.
• Most countries have legislation against workplace-related sexual harassment. However, as of 2018, the majority (65%) of reporting countries have no sexual harassment legislation for schools and 83% have no legislation covering public spaces.
• Evidence on gender pay gaps within the technology industry is contextual and sometimes contradictory.
• A masculine-oriented work model pits work-devotion against family-devotion, and the associated tension can lead to overload among women in ICT professions.
• In theory, most countries have legal provisions to support working mothers; however, it is unclear the extent to which this legislation is helping attract and keep women in the ICT industry.
4.1 / INTRODUCTION
Promoting digital gender equality means more than women’s capabilities to access, meaningfully use, and create ICTs. Neither does it mean merely opening doors to enable women to participate on an equal footing with men, as workers, employers, or decision-makers in the digital economy. For all its advantages, the digital age comes with gender-related risks and pitfalls; some are an extension of already existing dangers, while others are a direct response to women’s increasing connectivity and visibility in male-dominated spaces. Greater female inclusion in the EQUALS Partnership action areas can become associated with increased exposure to undesirable experiences — unless that inclusion is accompanied by corresponding changes in the social and institutional cultures that currently enable or tolerate negative behaviour.Areas of concern include cyber violence against women and girls, sexual harassment in educational and employment settings, education- and work-related discrimination, and work and life balance. Other potentially relevant issues, such as internet
addiction, risky online behaviours like sexting, or human exploitation, are not covered in this report. (See Unwin (2017) for a detailed discussion of the dark side of internet access.)
4.2 / CYBER VIOLENCE AGAINST WOMEN AND GIRLS
In 2015, the Broadband Commission sounded the alarm on the emerging threat of Cyber Violence Against Women and Girls (Cyber VAWG). At present, there is no globally agreed-on definition for cyber VAWG, as the issue is evolving together with its scope (Box 4.1). Accounting for instances of technology-enabled gender-based violence is complicated, and no single measure adequately captures its complexities. Hinson et al. (2017) note, that while existing tools such as the Cyber Psychological Abuse Scale and the Revised Cyber Bullying Inventory provide tangible methods, they are limited in that they measure specific cases of technology-enabled GBV and have been tested mostly in developed-country settings. However, different stakeholders have started laying the groundwork for developing valid and reliable measures. For example, the World Bank Group and the Sexual Violence Research Initiative have engaged the Centre for Research on Women to develop a way to measure technology-facilitated gender-based violence (GBV) on a global scale.

114
Taking Stock: Data and Evidence on Gender Digital Equality PART ONE
Box 4.1 Definitions of cyber VAWG
4.2.1 / LEVELS OF CYBER VAWG
Tracking cyber VAWG is tricky because of the evolving nature of technology and the evolving kinds of cyber VAWG that can emerge. In the EU, it is estimated that one in ten women have already experienced a form of cyber violence since the age of 15 (EIGE, 2017). Global data is harder to come by, with no single international repository of data on cyber VAWG. Where data are available, the issue of under-estimation is also a concern, as cases of harassment and abuse tend to be under-reported because of the associated stigma and shame attached to being a victim, among other reasons. At present, evidence on the extent of cyber VAWG is mostly issue- and country-specific, and anecdotal rather than global in scope. (See Part II Chapter 3 for qualitative research results on online privacy and violence in Brazil, from a youth perspective.) High-profile cases of cyber VAWG, often in developed countries, have served to highlight the
problem of cyber VAWG and help to galvanise deeper investigation and action on the topic (Box 4.2).
Box 4.2 Tracking cyber VAWG
4.2.2 / PHYSICAL VIOLENCE AGAINST WOMEN
The closest indicators with global coverage that can give a sense of the issue of cyber violence are the indicators for physical violence against women — intimate-partner (IP) and other — that are tracked as part of the SDGs (Figure 4.1). The World Health Organisation (2013) estimates that one in three women throughout the world will experience physical and/or sexual violence by a partner or sexual violence by a non-partner in their lifetime. While offline and online violence are different, offline violence indicators can be used as a proxy indicator, as cyber VAWG forms
• TheBroadband Commission (2015) defines cyber VAWG as “any act of gender-based violence that results in, or is likely to result in, physical, sexual or psychological harm or suffering to women, including threats of such acts.”
• The European Institute for Gender Equality (2017) includes the following acts as some forms of cyber VAWG: cyber stalking, non-consensual pornography (or “revenge porn”), gender-based slurs and harassment, “slut-shaming”, unsolicited pornography, “sextortion”, rape and death threats, “doxing”, and electronically enabled trafficking.
• Women’s Aid takes a broader view of the problem of cyber VAWG by looking at two broad categories of cyber VAWG: (1) online abuse — the use of the internet or other electronic means to direct abusive, unwanted, and offensive behaviour at an individual or group of individuals; (2) online harassment and stalking — the use of the internet or other electronic means to stalk or harass an individual, group of individuals, or organisation (Laxton, 2014). Online violence against women is also referred to as technology-facilitated gender-based violence (GBV).
• Other threats or acts that can fall under the scope of cyber VAWG include: hate speech (publishing a libel); hacking (intercepting private communications); identity theft; online stalking (criminal harassment); and uttering threats. It can also entail persuading a target to end their life (counselling suicide or advocating genocide).
• While the terms cyber-VAWG or technology-enabled GBV provide convenient anchor terms to frame online abuse and harassment faced by women and girls, these types of dangers are dissimilar in degree and scope. Each of these problems may require specifically tailored policy responses and policy actions.
In spite of the lack of global data on cyber VAWG, the following types of cyber VAWG have been documented.
Online harassment. Amnesty International notes that Twitter is a “toxic place for women”, based on the survey conducted in the UK: 78% of women responded that women cannot share their opinions without receiving online vitriol, including death threats, rape threats, and racist threats. In the U.S., a survey found that 21% of women aged 18–29 have been sexually harassed online, double the share of men (9%) in the same age group, although overall, men (44%) are more likely to experience online harassment than women (37%)(Pew Research Center, 2017).
Nonconsensual pornography/ image-based abuse/ revenge porn. The widespread use of social media and image-capturing devices enable graphic forms of harassment. The first academic study of the subject, in Australia, revealed that one in five people are victims of revenge porn (Henry, et al., 2017). While women (22%) and men (23%) were equally likely to be victimised in general, women were more likely to be victimised by an intimate or ex-partner and were also more likely than men to have a stranger take a sexual image of them without permission. In South Korea, almost 5,200 sexual harassment cases involving spy-cam footage were reported in 2016; over 80% of the victims were women. In the UK, a Revenge Porn Hotline was launched in 2015 to respond to the severity of the issue. In most cases, the abuse aimed to control, intimidate, or gain monetary or sexual gratification from the victim.
Cyber bullying. Sex-disaggregated data on cyber bullying are sparse and limited in coverage. In the U.S., the Cyberbullying Research Center has been collecting data related to cyberbullying. A survey of a nationally-representative sample of 12-17-year-olds across the U.S. shows that 36.7% of females have been cyberbullied, higher than the rate for males (30.5%) (Hinduja & Patchin, 2016).

115
Taking Stock: Data and Evidence on Gender Digital Equality PART ONE
part of the continuum of exploitation that women and girls encounter as a result of an unequal society. In fact, the Broadband Commission (2015) notes that cyber violence is as harmful as physical violence or sexual abuse.
Figure 4.1SDG Indicators related to Violence Against Women and Girls
Even for physical VAWG, there is a lack of country coverage. Where data is available, the proportion of women and girls subjected to IP or non-IP physical, sexual, or psychological violence varies in range across different countries and regions (Figures 4.2 and 4.3).
Indicator 5.2.1Proportion of ever-partnered women
and girls aged 15 years and older subjected to physical, sexual or
psychological violence by a current or former intimate partner in the previous 12 months, by form of
violence and by age
Indicator 5.2.2Proportion of women and girls aged
15 years and older subjected to sexual violence by persons other than an intimate partner in the
previous 12 months, by age and place of occurrence
Figure 4.2Percentage of women subjected to physical and or sexual violence by a current or former intimate partner in the previous 12 months (most recent year, 2005–2016)
Source: United Nations Statistics Division

116
Taking Stock: Data and Evidence on Gender Digital Equality PART ONE
Figure 4.3Percentage of women and girls aged 15 years and older subjected to sexual violence by persons other than an intimate partner in the previous 12 months (most recent year, 2000–2014)
Source: United Nations Statistics Division
Beyond the UN data on intimate and non-intimate-partner violence, some other organisations collect data on cyber VAWG. The EU Agency for Fundamental Rights (European Union) deployed a survey in 2014 which included questions on cyber stalking and cyber harassment. In the U.S., the Pew Centre conducted a survey on online harassment in 2017. In developing countries, attempts to measure the problem are mostly spearheaded by NGOs and are donor-funded. For example, the Women’s League Bureau (2015) through the Association for Progressive Communication has carried out research and country case studies on online gender-based harassment. In Pakistan, the Digital Rights Foundation’s Hamara Internet project in 2017 included attempts to measure women’s experiences of online violence. The study revealed that 40% of women in Pakistan had faced various forms of harassment on the internet, and most complaints related to harassment on Facebook. In all these studies, the figures reported are likely to be underestimates, due to the issue of under-reporting.
4.2.3 / RESPONDING TO CYBER-VAWG
While reliable data is lacking on the incidence of cyber violence against women, international organisations track legislation that can help address this problem. The UNCTAD Global Cyberlaw Tracker maps the status of cyberlaws in 194 UNCTAD member states, focusing on the state of e-commerce legislation in the fields of e-transactions, consumer protection, data protection or privacy, and cybercrime. As of May 2018, 140 countries or 72% of the 194 member states have enacted legislation related to cybercrime, and 112 countries — 58% of countries worldwide — have enacted laws related to data privacy and protection (Table 4.1).

117
Taking Stock: Data and Evidence on Gender Digital Equality PART ONE
Table 4.1Status of cybercrime and data privacy laws worldwide (May, 2018)
Source: UNCTAD Global Cyberlaw Tracker, 2018
Europe leads the other regions in terms of enacting cybercrime legislation, with 43 countries having passed a law related to cybercrime. Only the Vatican
has no data reported. Out of the 35 countries with no cybercrime law, 15 are in Africa, 8 in Oceania, and 6 each in Asia and the Americas (Figure 4.4).
Apart from the Vatican, all countries in Europe have also adopted legislation to protect data. In other regions, several countries have no legislation related to
data protection and privacy: in Asia (11), the Americas (9), Africa (12), and Oceania (8), as of May, 2018 (Figure 4.5).
Figure 4.4Status of cybercrime legislation by region (May, 2018)
Source: UNCTAD Global Cyberlaw Tracker, 2018

118
Taking Stock: Data and Evidence on Gender Digital Equality PART ONE
Despite existing legal frameworks, reporting of cybercrime cases can be challenging for women, as social obstacles can prevent them from accessing the justice system. In Pakistan for example, reporting online harassment requires disclosing one’s phone number and identity card, which can expose victims to further harassment. Moreover, leaving the house to visit the local police office would often require the accompaniment of a male guardian, which can be problematic if the perpetrator is a relative (Toppa, 2017).
In broader terms, we can also examine data on national legislation that addresses all types of violence against women and girls. The Women, Business and the Law Report (World Bank Group, 2018) collates data on various measures of gender discrimination that affect women’s full participation in the economy, viewed
from a legal perspective. More than 50% of countries globally have enacted legislation against domestic violence. More than half of the countries with no domestic violence legislation are located in Africa, where 26 countries have yet to pass such legislation (Figure 4.6).
Figure 4.5Status of data protection and privacy legislation by region (2018)
Source: UNCTAD Global Cyberlaw Tracker, 2018

119
Taking Stock: Data and Evidence on Gender Digital Equality PART ONE
Figure 4.6Domestic violence legislation by region (2018)
Figure 4.7Countries with no coverage on the different domains of violence against women (2018)
Source: World Bank, 2018.
Source: World Bank, 2018.
Violence against women and girls comes in different forms — economic, sexual, emotional, and physical. Out of 189 countries surveyed in the World Bank report, the type of abuse with least legislation is
economic violence, followed by sexual violence, emotional violence, and finally physical violence (Figure 4.7).

120
Taking Stock: Data and Evidence on Gender Digital Equality PART ONE
4.3 / SEXUAL HARASSMENT
In recent years, several gender-related scandals in the technology industry have dominated the news headlines, pointing to a culture of gender-based discrimination and harassment that discourages women from pursuing technology careers or that makes professional life challenging for those who stay. Although sexual harassment is often discussed in the context of the workplace, other areas such as public education and the public sphere are increasingly becoming recognised as sites of harassment (National Academies of Sciences, Engineering, and Medicine, 2018; World Bank, 2018).
Increased access to ICTs unfortunately means increased potential to experience sexual harassment, not only through cyber violence but also in offline spaces such as cybercafés. Likewise, increased access to educational and professional opportunities in male-dominated STEM and related areas also increases the possibility of encountering unwelcoming or hostile masculine environments. These environments act as barriers to entry or access for some females, and as physical and psychological burdens to those who choose or need to endure them. For example, one in ten female tech job leavers in the U.S. reported having experienced unwanted sexual attention in their last job (Tech Leavers Study, 2017). A similar problem affects men, as one in twelve men in the same study had also received unwanted sexual attention.
According to National Academies of Sciences, Engineering, and Medicine (2018, p. 52), academic environments (and especially science, engineering, and medicine education environments) present several of the features that create a high risk of sexual harassment (Box 4.3). Their study found that more than 50% of science, engineering, and medicine faculty and staff had encountered sexual harassment perpetrated by faculty, staff, and students.
Box 4.3 Conditions that foster sexual harassment in academic settings
As women increasingly participate in online communities, the backlash against the changing status quo can include sexual harassment. A study by Toupin (2014) reports female hackers regularly experiencing groping, harassment, and discrimination, especially at hacker conferences and hackerspaces. Beyond verbal abuse and misogynist behaviours, some feminist hackers have also received rape and death threats.
The extent of sexual harassment experienced by women is difficult to estimate, as there is limited official data on this topic. We instead review data on the prevalence of legislation prohibiting sexual harassment. Globally, a majority of economies (more than half in each region) have enacted legislation on sexual harassment. As of 2018, only 35 out of 189 countries lack relevant legislation; the majority are in the Americas (11), followed by Africa (9), Asia (7), Oceania (6), and Europe (2) (Figure 4.8).
• Male-dominated environment, with men in positions of power and authority
• Organisational tolerance for sexually harassing behaviour (e.g., failing to take complaints seriously, failing to sanction perpetrators, or failing to protect complainants from retaliation)
• Hierarchical and dependent relationships between faculty and their trainees
• Isolating environments (e.g., labs and field sites) in which faculty and trainees spend considerable time
Source: National Academies of Sciences, Engineering, and Medicine, 2018, p. 172.

121
Taking Stock: Data and Evidence on Gender Digital Equality PART ONE
Figure 4.8Percentage of countries by region with legislation dealing with sexual harassment (2018)
Source: World Bank, 2018.
Regarding contexts of sexual harassment, there is widespread legislation on sexual harassment in the workplace. Out of the 189 countries surveyed by the World Bank, only 59 countries (31%) have yet to pass such legislation (Figure 4.9). In Europe, Africa, and the
Americas, such legislation is often designed to protect both men and women (Figure 4.10). For other contexts, the vast majority of countries have no legislation dealing with sexual harassment in schools (65%, or 123 countries) or in public spaces (83%, or 157 countries).
Figure 4.9Number of countries with no legislation on sexual harassment in the following areas (2018)
Source: World Bank, 2018.

122
Taking Stock: Data and Evidence on Gender Digital Equality PART ONE
Figure 4.10Legislation explicitly prohibiting sexual harassment in the workplace (2016)
Source: World Policy Research Center, Discrimination at work database
4.4 / DISCRIMINATION
Simply having more women students, employees, managers, or entrepreneurs in the ICT industry does not mean that gender disadvantage has been erased; the conditions under which women participate may also contribute to perpetuating inequality. Gender-based discrimination in occupational settings may be either overt or subtle, and it tends to affect women more than men. Types of gender-based discrimination include: unfairness in hiring, firing and promotions; unequal pay; unequal access to professional advancement opportunities; and unconscious biases. In this section we discuss two broad areas that affect genuine gender equality in ICT occupations: pay gaps and discriminatory work environments.
4.4.1 / GENDER PAY GAP
Unequal pay for the same work is one of the more enduring forms of gender-based discrimination in the workplace. At the global level, there has been a persistent unaccounted-for gender pay gap, although the gap is narrowing for certain professions (ILO, 2016). The Global Wage Report for 2016/17 assesses national-level gender pay gaps at between 0% and 45%, noting that the gap is almost 50% at higher levels of pay (ILO, 2016)20. Global data specific to the ICT industry are unavailable. However, ILO’s research indicates that gender pay inequality is higher in enterprises and occupations with higher average pay. Since the ICT
20 Covering 46 countries, of which 22 are in Europe; data is for 2013 or earlier.
industry falls within the group of enterprises associated with higher levels of pay (ILO, 2018; US Government Accountability Office, 2017), it could be assumed that it would also exhibit higher gender pay gaps. However, the United States Department of Commerce (2017, p. 1) reports a smaller gender pay gap in STEM occupations than in non-STEM occupations.
We examined ILO data on occupational gender wage gaps, focusing on three categories: managers; professionals; and technicians and associate professionals. The raw data is difficult to interpret, as it shows contrasting patterns depending on the region or country (Figures 4.11–4.13). There is currently no data on gender pay gap by occupation for Africa and Oceania.
In Europe, where data is available for 10 economies, a pay gap exists in favour of male workers at all three professional levels, ranging from 6.6% to 38%. The Americas show a similar trend for the six reporting economies: mostly higher wages for men (by 2% to 25%), except for managers and technicians in Belize. The seven reporting economies in Asia show male workers earning more than female workers in most cases (from 2% to 33% more); however, in some cases women earn more than their male counterparts – e.g., professionals in Thailand, managers in Pakistan, and technicians or associate professionals in Brunei. Notwithstanding ILO’s (2016) finding of higher gender pay gaps at higher levels of pay, the limited data for these three categories shows no clear hierarchy of gaps. The management category does not always have the largest pay gap; in Russia, Iceland, and Pakistan, the largest pay gap is among technicians or associate professionals.

123
Taking Stock: Data and Evidence on Gender Digital Equality PART ONE
Figure 4.11Gender wage gap by occupation (%), Europe (2014 –2016)
Source: ILOSTATS

124
Taking Stock: Data and Evidence on Gender Digital Equality PART ONE
Figure 4.12Gender wage gap by occupation (%), Asia (2014 –2016)
Figure 4.13Gender wage gap by occupation (%), Americas (2015–2016)
Source: ILOSTATS
Source: ILOSTATS

125
Taking Stock: Data and Evidence on Gender Digital Equality PART ONE
There is insufficient longitudinal data to determine trends. For the few countries with data for both 2010/2011 and 2014, the picture is mixed: the gap widens, narrows, or stays the same for some occupations in some countries, with no clear pattern. For example, in Portugal the gap for managers increases by under 1%, while for professionals it decreases by 2%, and for technicians and associate professionals it increases by about 3%. Conversely, in Malaysia, the trend shows a 7% increase for managers, 0.6% decrease for professionals, and 0.1% decrease for technicians and associate professionals.
Reasons frequently cited for the gender pay gap include gendered differences in occupation, expertise, experience, and work patterns (Ardanaz-Badia & Rawlings, 2018; Cook, Diamond, Hall, List, & Oyer, 2018; ILO, 2018). Research has shown, however, that a gender pay gap remains after controlling for such factors. A UK study found that female IT professionals earned 11% less than male IT professionals, even after accounting for number of working hours (BCS, 2017). The career review platform Glassdoor conducted an analysis of 505,000 salaries, controlling for variables such as age, education, experience, occupation, industry, location, company, and job title (Zarya, 2016). The results showed that even when workers were almost identical in every way except gender, the gender pay gap for technology workers (at 28.3%) was several times higher than the gender pay gap for all workers (5.9%). ILO (2018, p. 95) recommend more attention to identifying the “’unexplained’ part of the gender pay gap”. (See also Part II Chapter 7 of this report, which examines differences in skill endowments and returns to skills between men and women in digital and less digital-intensive industries.)
4.4.2 / DISCRIMINATORY WORK ENVIRONMENTS
Quirós et al. (2018, p. 10) report that women in the European digital workforce experienced gender discrimination more than men, and they felt less able to enforce their ideas. Likewise, Hewlett & Sherbin (2014) found that over a quarter of female science, engineering, and technology workers in their study of three high ICT countries said they felt stalled in their careers: China (23%), U.S. (27%), Brazil (29%) and India (45%). Between 20% and 32% said they were likely to quit their jobs within a year (Hewlett & Sherbin, 2014). Over 50% of female cybersecurity professionals report having experienced discrimination in the workforce (Frost & Sullivan, 2017). Subtle forms of discrimination include heavier scrutiny accorded to female than male applicants (Blair-Loy et al., 2017). Furthermore, a culture of ostensible openness, technology neutrality, and meritocracy may perversely reinforce gender discrimination, as Nafus (2012) found within the Free Libre Open Source Software community.
One of the few studies of why people leave technology jobs found that technical workers (at 40%) were more likely than non-technical workers (32%) to leave jobs in the U.S. technology industry due to unfairness (Scott, Kapor Klein, & Onovakpuri, 2017).21 Perceptions of unfairness were higher in the tech industry (42% of leavers) than in the non-tech industry (32% of leavers) and was a major reason for both men and women to leave their tech jobs. Overall, employees within the technology industry report unwanted sexual attention at almost double the rates (10%) reported by tech employees in other industries (6%). These findings suggest that the technology industry has a particularly deep problem with unfairness and inappropriate sexual behaviour.
Female technology workers typically respond to discriminatory work environments either by changing jobs or developing strategies to avoid or rationalise their participation, such as downplaying their femininity, adopting male behaviours, enduring the organisational culture, or adopting the veneer of “professionalism” as a coping mechanism (Alfrey & Twine, 2017; Annabi & Lebovitz, 2018; Servon & Visser, n.d.). For instance, when online, some female developers masquerade as males to avoid discrimination (Vasilescu et al., 2015).
Various national policies address discriminatory work environments, including constitutional provisions on gender discrimination as well as implementing legislation related to professional advancement, training and pay. Overall, most economies have some legislation in place. Europe has the strongest record of legislation protecting against discrimination across the four areas shown in Figures 4.14 to 4.17, although only a few countries in Europe include any mention of gender in their constitutions’ non-discrimination clauses (Figure 4.14). In all regions except Oceania, more than 51% of countries have legislated against each type of discrimination.
21 Scott, Kapor Klein, & Onovakpuri (2017) is the report on a nationally-representative survey of U.S. adults who have left a job in a technology-related industry or function within the last three years.

126
Taking Stock: Data and Evidence on Gender Digital Equality PART ONE
Figure 4.14National constitution mentions gender in non-discrimination clause
Figure 4.15National constitution mentions gender in non-Legislation protecting women from discrimination in promotion or demotion
Source: World BankNote: West Bank and Gaza = Palestine. Kosovo data included in Europe.
Source: World Policy Research Center, Discrimination at work database

127
Taking Stock: Data and Evidence on Gender Digital Equality PART ONE
Figure 4.16Legislation protecting women from discrimination in access to vocational training
Figure 4.17Legislation guaranteeing equal pay
Source: World Policy Research Center, Discrimination at work database
Source: World Policy Research Center, Discrimination at work database

128
Taking Stock: Data and Evidence on Gender Digital Equality PART ONE
Figure 4.18Global gender gap in mean weekly hours of work per employee, by sex and occupation
Source: Author’s computation of ILO data. Note: Computed by subtracting mean hours of work (men) from mean hours of work (women). Zero means no difference in mean hours of work. Above zero means men work more hours than women, below zero means women work more hours than men. Data might be skewed; for some job categories there is more data for men than women.
4.5 / WORK AND LIFE BALANCE
Several authors have argued that a masculine-oriented work model pits work-devotion against family-devotion, and the associated tension can lead to overload for women in technology professions (Blair-Loy & Cech, 2017; Bright Horizons, 2017; Weisgram & Diekman, 2015). The number of hours men and women work, and the prevalence and distribution of unpaid domestic and care work, serve as indicators of work and life balance.
4.5.1 / NUMBER OF HOURS OF WORK
The labour force data shows that women generally work fewer paid hours than men and spend a much larger proportion of their time than men on unpaid domestic and care work. In all six occupations represented in Figure 4.18, men consistently work more hours than women.discrimination, as Nafus (2012) found within the Free Libre Open Source Software community.
This tendency to work fewer hours could reflect women’s personal choices, and a variety of considerations may factor into their choices, such as a desire for flexible work arrangements because
of other social roles and personal values. Efforts to address gender inequality in employment that do not target these quality of life issues are unlikely to achieve maximal impact.

129
Taking Stock: Data and Evidence on Gender Digital Equality PART ONE
4.5.2 / UNPAID DOMESTIC AND CARE WORK
Data on this indicator is sparse for most regions, but it shows that compared to men, women spend a much larger proportion of their time on unpaid domestic and care work, at 10%–28% for women versus 3%–10% for men (Figures 4.19–4.22). Erosa, Fuster, Kambourov, & Rogerson (2017) provide some evidence of impact on labour force participation, arguing that an “asymmetry in household production” leads to women self-selecting out of occupations that reward long hours (p. 4). They conclude that a 10% reduction in women’s discretionary time, due to their nonmarket activities, causes a 14% reduction in their labour market participation and an 11% increase in the gender wage gap. Others such as Xie (2006) assert that having children is the most important factor preventing women from pursuing careers in science and engineering.
However, other scholars have argued that women’s primary reason for leaving technology jobs is not family-related but rather due to obstacles to achieving company and career goals (Ashcraft, McLain, & Eger, 2016; Hunt, 2010; Meiksins, Beddoes, Masters, Micah, & Shah, 2016). Sassler, Glass, Levitte, and Michelmore (2017) found no difference in the tendency for career-minded versus family-oriented women to enter computer science professions in the U.S. They also observed that being married and having children equally affected men and women’s propensity to work in computer science, leading to the conclusion that “is difficult to account for the factors associated with these employment disparities” (p. 19). Another issue is the potential quality-of-life compromises made by women in combining family and professional responsibilities. Some studies note the tension between work-devotion and family-devotion expectations, and the incidence of overload among women in technology professions (Blair-Loy & Cech, 2017; Bright Horizons, 2017; Weisgram & Diekman, 2015).
Figure 4.19Proportion of time spent on unpaid domestic and care work, Africa (2010 –2014)
Source: ILO.

130
Taking Stock: Data and Evidence on Gender Digital Equality PART ONE
Figure 4.20Proportion of time spent on unpaid domestic and care work, the Americas (2010–2015)
Figure 4.21Proportion of time spent on unpaid domestic and care work, Asia (2011–2015)
Source: ILO.
Source: ILO.

131
Taking Stock: Data and Evidence on Gender Digital Equality PART ONE
Figure 4.22Proportion of time spent on unpaid domestic and care work, Europe (2010–2015)
Source: ILO.
4.5.3 / PARENTAL LEAVE POLICIES
One major aspect of the unpaid care work that women often shoulder is child care. The extent to which organisations make it possible for women to combine motherhood with work can be a crucial factor affecting the size of the female work force. The World Policy Research Center tracks several gender policy indicators22, four of which are relevant for this discussion. The data shows that, at the policy level, most countries have some provisions to support working mothers. European countries tend to have the most generous policies, while countries in Oceania tend to have the least generous allowances (Figures 4.23–4.26). The U.S. is one of just two countries in the Americas with no legislated parental leave.
Fifty-eight per cent of European countries provide 52 weeks (one year) or more paid leave; in contrast, in Oceania and the Americas, over 70% of countries provide either no leave or less than 14 weeks (Figure 4.23). Most countries in Africa and Asia provide between 14 and 52 weeks paid maternal leave. Paid maternal leave also covers above 60% of salary in most countries (Figure 4.24). European countries are also the most generous in offering breastfeeding options: about 80% of countries (37 out of 45) allow paid breastfeeding breaks at work for six months; only seven countries have no such provisions (Figure 4.25). With the exception of Oceania (at 38%), a majority
22 Maternal and Child Health Equity (MACHEquity) research program.
of countries in the other regions (57%–74%) also support paid breastfeeding breaks. While 50% (103) of countries worldwide guarantee either paid maternal leave or breastfeeding breaks at work for at least six months, only 43 countries (mostly in Europe) guarantee both (Figure 4.26). Again, Europe fares the best in this regard, with only one country failing to provide any guarantees. Oceania and the Americas have the largest proportion of countries not guaranteeing either option (63% and 40% respectively).

132
Taking Stock: Data and Evidence on Gender Digital Equality PART ONE
Figure 4.23Paid leave available for mothers of infants (2013)
Figure 4.24Maximum wage replacement rate of paid leave for mothers of infants (2013)
Source: World Policy Research Center, MACHEquity database.
Source: World Policy Research Center, MACHEquity database.

133
Taking Stock: Data and Evidence on Gender Digital Equality PART ONE
Figure 4.25Paid leave available for mothers of infants (2013)
Figure 4.26Working mothers guaranteed options to facilitate paid breastfeeding for at least six months (2013)
Source: World Policy Research Center, MACHEquity database.
Source: World Policy Research Center, MACHEquity database.
134
Taking Stock: Data and Evidence on Gender Digital Equality PART ONE
4.6 / CONCLUSION
With violence against women widespread globally, access to ICTs increases the exposure of girls and women to cyberviolence. The response to this must include overall culture change in attitudes towards sexual harassment and all forms of gender-based violence. Similarly, as more women venture into STEM and related training and occupations, they risk exposure to sexual harassment and various forms of discrimination associated with the field. A dominant masculine-oriented work ethic also presents challenges for people interested in ICT careers but seeking greater work and life balance. However, from a gender perspective, our understanding of the dark side of ICT access, skills, and leadership is still very limited; much work needs to be done to collect relevant data and scope the issues. This is particularly challenging because of the complex issues involved and the evolving nature of ICTs and related landscapes.
REFERENCES
Alfrey, L., & Twine, F. W. (2017). Gender-fluid geek girls: Negotiating inequality regimes in the tech industry. Gender & Society, 31(1), 28–50. Retrieved from: https://doi.org/10.1177/0891243216680590
Annabi, H., & Lebovitz, S. (2018). Improving the retention of women in the IT workforce: An investigation of gender diversity interventions in the USA. Information Systems Journal (Special issue paper). Retrieved from: https://doi.org/10.1111/isj.12182
Ardanaz-Badia, A., & Rawlings, J. (2018). Understanding the gender pay gap in the UK. Office for National Statistics. Retrieved from: https://www.ons.gov.uk/employmentandlabourmarket/peopleinwork/earningsandworkinghours/articles/understandingthegenderpaygapintheuk/2018-01-17
Ashcraft, C., McLain, B., & Eger, E. (2016). Women in tech: The facts. National Center for Women & Technology (NCWIT).
BCS. (2017). Diversity in IT 2017. Swindon: BCS, The Chartered Institute for IT. Retrieved from: http://www.bcs.org/category/19217?src=hs4
Broadband Commission. (2015a). Cyber violence against women and girls, a world-wide wake-up call: A report by the UN Broadband Commission for Digital Development Working Group on Broadband and Gender. Retrieved from: http://www.unwomen.org//~/media/headquarters/attachments/sections/library/publications/2015/cyber_violence_gender%20report.pdf?v=1&d=20150924T154259
Blair-Loy, M., & Cech, E. A. (2017). Demands and devotion: Cultural meanings of work and overload among women researchers and professionals in science and technology
industries. Sociological Forum, 32(1), 5–27. Retrieved from: https://doi.org/10.1111/socf.12315
Blair-Loy, M., Rogers, L., Glaser, D., Wong, Y., Abraham, D., & Cosman, P. (2017). Gender in engineering departments: Are there gender differences in interruptions of academic job talks? Social Sciences, 6(1), 29. Retrieved from: https://doi.org/10.3390/socsci6010029
Bright Horizons. (2017). 2017 Modern Family Index. Retrieved from: https://solutionsatwork.brighthorizons.com/~/media/BH/SAW/PDFs/GeneralAndWellbeing/MFI_2017_Report_v4.ashx
Cook C., Diamond, R., Hall, J., List, J. A., & Oyer, P. (2018). The gender earnings gap in the gig economy: Evidence from: over a Million Rideshare Drivers. Retrieved from: https://web.stanford.edu/~diamondr/UberPayGap.pdf
Digital Rights Foundation. (2017). Measuring Pakistani women’s experiences of online violence: A quantitative research study on online-gender based harassment in Pakistan. Retrieved from: https://digitalrightsfoundation.pk/wp-content/uploads/2017/05/Hamara-Internet-Online-Harassment-Report.pdf
Erosa, A., Fuster, L., Kambourov, G., & Rogerson, R. (2017). Hours, occupations, and gender differences in labor market outcomes (Working Paper 23636). National Bureau of Economic Research. https://doi.org/10.3386/w23636
European Institute for Gender Equality. (2017). Cyber violence against women and girls. Retrieved from: http://eige.europa.eu/sites/default/files/documents/cyber_violence_against_women_and_girls.pdf
European Agency for Fundamental Rights (2014). Violence against women: An EU-wide survey, main results. Luxembourg: Publications Office of the European Union. Retrieved from: http://fra.europa.eu/en/publication/2014/violence-against-women-eu-wide-survey-main-results-report
Frost & Sullivan. (2017). The 2017 Global Information Security Workforce Study: Women in Cybersecurity. Retrieved from: https://iamcybersafe.org/wp-content/uploads/2017/03/WomensReport.pdf
Henry, N., Powell, A., Flynn, A. (2017). Not just revenge porn: Australian’s experiences of image-based abuse, a summary report. Melbourne: RMIT University. Retrieved from: https://www.rmit.edu.au/content/dam/rmit/documents/college-of-design-and-social-context/schools/global-urban-and-social-studies/revenge_porn_report_2017.pdf
Hewlett, S. A., & Sherbin, L. (2014). Athena Factor 2.0: Accelerating female talent in science, engineering & technology. Retrieved from: http://www.talentinnovation.org/_private/assets/Athena-2-ExecSummFINAL-CTI.pdfHinduja S., Patchin, J. (2016). 2016 cyberbullying data. Retrieved from: https://cyberbullying.org/2016-cyberbullying-data
Hinson, L., Mueller, J., O’Brien-Milne, L. (2017). Cyber violence: Disrupting the intersection of technology and gender-based violence. Retrieved from: http://blogs.

135
Taking Stock: Data and Evidence on Gender Digital Equality PART ONE
worldbank.org/voices/cyber-violence-disrupting-intersection-technology-and-gender-based-violence
Hunt, J. (2010). Why do women leave science and engineering? (Working Paper 15853). National Bureau of Economic Research. Retrieved from: https://doi.org/10.3386/w15853
ILO. (2016). Global Wage Report 2016/17. Retrieved from: http://www.ilo.org/global/research/global-reports/global-wage-report/2016/lang--en/index.htm
ILO (2018). Global Wage Report 2018/19: What lies behind gender pay gaps. Retrieved from: https://www.ilo.org/wcmsp5/groups/public/---dgreports/---dcomm/---publ/documents/publication/wcms_650553.pdf
Laxton, C. (2014). Virtual world, real fear: Women’s Aid report into online abuse, harassment and stalking. Retrieved from: https://1q7dqy2unor827bqjls0c4rn-wpengine.netdna-ssl.com/wp-content/uploads/2015/11/Women_s_Aid_Virtual_World_Real_Fear_Feb_2014-3.pdf
Meiksins, P., Beddoes, K., Masters, S., Micah, R., & Shah, Y. (2016). Women in engineering: A review of the 2016 literature. Retrieved from: https://research.swe.org/wp-content/uploads/2018/03/SWE-Lit-Review-Compilation-2017.pdf
Nafus, D. (2012). ‘Patches don’t have gender’: What is not open in open source software. New Media & Society, 14(4), 669–683. Retrieved from: https://doi.org/10.1177/1461444811422887
National Academies of Sciences, Engineering, and Medicine. (2018). Sexual harassment of women: Climate, culture, and consequences in academic sciences, engineering, and medicine. Washington, D.C.: National Academies Press. Retrieved from: https://doi.org/10.17226/24994
Pew Research (2017). Online Harassment 2017. Retrieved from: http://assets.pewresearch.org/wp-content/uploads/sites/14/2017/07/10151519/PI_2017.07.11_Online-Harassment_FINAL.pdf
Quirós, C. T., Morales, E. G., Pastor, R. R., Carmona, A. F., Ibáñez, M. S., & Herrera, U. M. (2018). Women in the digital age. European Commission. Retrieved from: https://ec.europa.eu/digital-single-market/en/news/increase-gender-gap-digital-sector-study-women-digital-age
Sassler, S., Glass, J., Levitte, Y., & Michelmore, K. M. (2017). The missing women in STEM? Assessing gender differentials in the factors associated with transition to first jobs. Social Science Research, 63, 192–208. Retrieved from: https://doi.org/10.1016/j.ssresearch.2016.09.014
Scott, A., Kapor Klein, F., & Onovakpuri, U. (2017). Tech leavers study. Kapor Center for Social Impact. Retrieved from: https://www.kaporcenter.org/wp-content/uploads/2017/08/TechLeavers2017.pdf
Servon, L. J., & Visser, M. A. (n.d.). Progress hindered: The retention and advancement of women in science,
engineering and technology careers. Human Resource Management Journal, 21(3), 272–284. Retrieved from: https://doi.org/10.1111/j.1748-8583.2010.00152.x
Toppa, S. (2017, August 9). Abuse in Pakistan: ‘I’m more scared of harassment online than offline’. The Guardian. Retrieved from: https://www.theguardian.com/global-development-professionals-network/2017/aug/09/abuse-in-pakistan-im-more-scared-of-harassment-online-than-offline
Toupin, S. (2014). Feminist hackerspaces: The synthesis of feminist and hacker cultures. Journal of Peer Production, 4.
United States Department of Commerce. (2017). Women in STEM: 2017 Update. Economics & Statistics Administration. Retrieved from: http://www.esa.doc.gov/reports/women-stem-2017-update
Unwin, T. (2017). Reclaiming information and communication technologies for development. Oxford University Press.
Vasilescu, B., Posnett, D., Ray, B., van den Brand, M. G. J., Serebrenik, A., Devanbu, P., & Filkov, V. (2015). Gender and tenure diversity in GitHub teams. In: Crossings. Seoul, Korea. Retrieved from: http://delivery.acm.org.offcam-pus.lib.washington.edu/10.1145/2710000/2702549/p3789-vasilescu.pdf?ip=128.95.104.66&i-d=2702549&acc=ACTIVE%20SERVICE&key=B63ACE-F81C6334F5%2EF43F328D6C8418D0%2E4D4702B-0C3E38B35%2E4D4702B0C3E38B35&__acm__=1518685543_74e499233266245940ed485ccf165e04
Women’s Legal and Human Rights Bureau, Inc. (2015). End violence: Women’s rights and safety online, from impunity to justice: Domestic legal remedies for cases of technology-related violence against women. Retrieved from: https://www.genderit.org/sites/default/upload/flow_domestic_legal_remedies.pdf
World Bank Group. (2018). Women, business and the law 2018. Washington, DC: World Bank. Retrieved from: https://openknowledge.worldbank.org/handle/10986/29498
World Policy Analysis Center (2017). Workplace discrimination database. Retrieved from: https://www.worldpolicycenter.org/maps-data/data-download/workplace-discrimination
Weisgram, E., & Diekman, A. (2015). Family friendly STEM: Perspectives on recruiting and retaining women in STEM fields. International Journal of Gender, Science and Technology, 8(1), 38–45.
Xie, Y. (2006). Social influences on science and engineering career decisions. In National Academy of Sciences (Ed.), Biological, social, and organizational components of success for women in academic science and engineering: Workshop Report. Washington, DC: National Academies Press. Retrieved from: http://www.ncbi.nlm.nih.gov/books/NBK23778/
Zarya, V. (2016, November 16). Female programmers make nearly 30% less than their male counterparts. Retrieved from: http://fortune.com/2016/11/16/gender-pay-gap-programmers/

136
BARRIERS TO GENDER EQUALITY AND RECOMMENDATIONSAUTHORS: ARABA SEY, JUHEE KANG, AND DON RODNEY JUNIO (UNU-CS)
5

137
Taking Stock: Data and Evidence on Gender Digital Equality PART ONE
KEY FINDINGS
• Barriers to gender digital equality are generally related to one or more of the following: 1) availability of infrastructure; 2) financial constraints; 3) ICT ability and aptitude; 4) interest and perceived relevance of ICTs; 5) safety and security; and 6) socio-cultural and institutional contexts. Most of these barriers cut across issues of access, skills, and leadership.
• There is no single strategy for eliminating gender digital inequalities. Recommendations generally call either for targeting specific symptoms (such as affordability or recruiting practices), or for reshaping deeply ingrained social norms and practices (such as gender stereotypes) that are at the root of gender inequalities.
• Strategies to increase gender equality in ICT access generally focus on: addressing accessibility and affordability barriers; providing relevant content; improving safety and security online and offline through public education, technical, and legal means; mainstreaming gender perspectives into policies and budgets; sharing good practices; investing in women’s education and basic digital skills capacity-building.
• The main proposals for closing gender gaps in advanced digital skills and STEM education range from making training more accessible for women and underrepresented groups, to addressing gender stereotyping of STEM education and building girls’ self-efficacy and confidence in STEM.
• Most proposed remedies for gender inequality in ICT leadership recommend one or several of the following: combating gender stereotypes and biases at individual, institutional, and societal levels; establishing programs and supportive structures to encourage female participation and advancement in ICT occupations; legislating
diversity obligations; and diverting resources to institutions that are more gender-diverse.
• Reasons for and solutions to gender digital inequality remain contested, contextual, and nuanced. For example, some scholars assert that having children is the most important factor preventing women from pursuing careers in science and engineering, while others argue that women’s primary reasons for leaving technology jobs are not family-related.
5.1 / INTRODUCTION
This chapter compiles literature and research that have identified barriers to gender digital equality and made recommendations for dealing with the barriers as they relate to ICT access, skills and leadership. The barriers and disadvantages inhibiting gender digital equality are diverse, multifaceted, and often embedded in longstanding social structures that privilege men over women. Most of these barriers cut across access, skills, and leadership; they may manifest in slightly different ways (Table 5.1). The six broad types of barriers identified in Table 5.1 are discussed in more detail below.

138
Taking Stock: Data and Evidence on Gender Digital Equality PART ONE
Table 5.1Sample manifestations of barriers

139
Taking Stock: Data and Evidence on Gender Digital Equality PART ONE
5.2 / BARRIERS TO ICT ACCESS5.2.1 / AVAILABILITY OF INFRASTRUCTURE
In resource-poor communities, access to ICTs is affected not just by economic conditions but also by the lack of technical infrastructure such as signal coverage. Although infrastructure availability affects all rural residents, the GSMA Gender Gap Report notes that, for both mobile ownership and mobile internet use, the gender gap is wider in rural areas than in urban areas; even where overall ownership levels are minimal, the percentage of rural women who own mobile phones is still far lower than men (GSMA, 2018). However, even in urban communities, some gender digital divides persist. For instance, the World Wide Web Foundation (2015) found that among the urban poor, women were nearly 50% less likely than men to access the internet. Van der Spuy and Aavriti (2015) have also identified infrastructure as one of the three key themes related to barriers to ICT access, in addition to cost/affordability issues and availability of relevant and appropriate content.
5.2.2 / FINANCIAL CONSTRAINTS
Studies on the gender digital divide point to affordability as one of the main (and in some cases the greatest) barriers to ICT adoption among women (Deen-Swarray et al., 2012; GSMA, 2018a; Hilbert, 2011; Milek et al., 2011). Of course, the prohibitive cost of access devices and of accessing the internet affects both men and women. Organisations such as the Alliance for Affordable Internet (A4AI, 2017) have noted that in some countries, access to the internet remains prohibitive: the cost of buying 1GB of data in Africa is equivalent to about 18% of monthly income, for example. However, when women are disadvantaged economically — as is the case if they are not gainfully employed or do not have control over their own finances — the issue of ICT affordability and ownership becomes more acute for them.
5.2.3 / ABILITY AND APTITUDE
This relates to women’s educational background, aptitude, and skills to use ICTs. Even if costs of ICT devices and services go down, women would still be at a disadvantage if they are not equipped with the basic digital skills and literacy needed to operate in the digital economy. Education levels and functional literacy have been identified as significant barriers to accessing and using technology by women in both
developed and developing countries (Antonio & Tuffley, 2014; GSMA, 2018a; Hilbert, 2011).
5.2.4 / INTEREST AND PERCEIVED RELEVANCE
Key findings of a four-country survey conducted by Intel (2012) showed that one of the main reasons why women did not access the internet is that they did not know what the internet is or how it might benefit them. The top three answers to questions about low usage levels were: (1) I’m not interested in it; (2) I’m not familiar or comfortable with the technology; and (3) I don’t need to access the internet. Women’s low interest in using ICTs could be linked to the (un)availability of content that is of relevance to their daily lives and aspirations, in accessible languages and formats (Chair, 2017; Ya’u & Aliyu, 2017). For example, Part II Chapter 2 notes that one reason why women in Africa are not online is the lack of relevant content in local languages. A possible lack of confidence in using the internet, compounded with negative perceptions of ICTs, may also be influencing how women utilise the internet. For instance, in a small case study of Turkish students, Varank (2010) showed that gender was a significant variable predicting computer attitudes.
5.2.5 / SAFETY AND SECURITY
Complacency and failure to address and solve cyber violence could significantly impede the uptake of broadband services by girls and women worldwide. (ITU Secretary-General Houlin Zhao, Combatting Online Violence Against Women & Girls: A Worldwide Wake-Up Call in 2015)
Safety issues are linked to the discussion of the dark side of ICT access; these include threats or experience of cyber VAWG, which some studies (e.g., GSMA, 2018) have shown affect women’s interest in using ICTs. Once online, intimidation and harassment may inhibit women from fully engaging with the Internet. A report by Amnesty International (2018) on violence against women on Twitter stated that the abuse experienced on the platform leads women to “self-censor what they post, limit their interactions, and even drives women off Twitter completely.” Focusing on developing countries, APC launched a report chronicling case summaries of women’s experiences of technology-related violence against women in six countries (APC, 2015).
5.2.6 / SOCIO-CULTURAL AND INSTITUTIONAL CONTEXTS
Local cultural contexts may also limit women’s access to
140
Taking Stock: Data and Evidence on Gender Digital Equality PART ONE
and use of technology. These social norms, stereotypes, and cultural constraints are harder to measure than other types of barriers, especially since evidence on how they affect women is specific to particular countries and cases. For instance, in societies where cultural norms constrain women’s ability to move around in public, female access to ICTs in some locations (such as community centres or internet cafes) is restricted (Alao et al., 2017). Likewise, where discrimination makes it difficult for women to acquire a good education and develop basic literacy, their ability to meaningfully use ICTs is also hampered (CITAD, 2017; Laizu et al., 2010). More often, these socio-cultural and institutional contexts interact with issues related to safety and security. Hassan, Unwin, and Gardezi (2017) examined the extent of mobile harassment in Pakistan, which has a complex institutional configuration that entwines patriarchy, religion, and culture. Among other things, their research shows that women are far more frequently blamed than men when they are sexually harassed; they trace this tendency to the “traditional patriarchal Islamic character of Pakistan’s society, with its strong emphasis on family honor and shame.”
5.3 / BARRIERS TO ICT SKILLS
5.3.1 / PERCEIVED ABILITY AND APTITUDE
Research indicates that girls tend to underestimate their digital abilities, and their self-assessment is often biased by several internalised perceptions. This is especially problematic for STEM and related training. For instance, an OECD (2012) report pointed out that when girls were told to “think like scientists”, they performed much worse than boys. It suggested that the gender gap in academic performance in STEM originates more from girls’ perceptions about themselves than from an actual ability gap. This tendency continues throughout the pipeline, as young women in STEM reportedly feel lower self-efficacy and higher self-doubt in their ability compared to men. In studies of U.S. computer science students, this lower self-perception has been associated with the sense of not belonging in the field (SWE 2016; Miller, 2016; Ro & Knight, 2016). The perception that girls don’t have the aptitude for computing and related studies may also come from others, such as family, friends, and teachers, and can affect the guidance girls receive when making education choices. For example, a PISA study showed that teachers may harbour conscious or unconscious stereotyped notions about girls’ and boys’ strengths and weaknesses in school subjects (OECD, 2015). OECD (2012) also reported that parents are more likely to expect their teenage sons, rather than their daughters, to work in STEM occupations, despite their equal performance.
5.3.2 / PERCEIVED ABILITY AND APTITUDE
When girls make choices about secondary school specialisation or college majors, they often do not have adequate information about options related to STEM studies. In a survey of 4,500 girls and parents in the UK and Ireland, it was found that information on STEM subjects and career paths was perceived to be more fragmented and less obvious than other disciplines, making it difficult for students, parents, and teachers to evaluate options (Accenture, 2015, 2017). Girls listed parents as the biggest influence on their subject and career choice, but 51% of the parents felt that they were ill-informed on the benefits of STEM subjects, and only 14% said they were well aware of different career opportunities in STEM for their daughters.Moreover, the existing underrepresentation of women can perpetuate future underrepresentation, as the lack of role models inhibits young women from imagining themselves as successful computer scientists or engineers (Dasgupta, 2011; Meltzoff, 2013; Murphy et al., 2007). Indeed, most parents (82%), teachers (89%), and young people (68%) agree that the STEM field lacks high-profile female role models (Accenture, 2015).
5.3.3 / SAFETY AND SECURITY
Anticipation of gender discrimination, such as harassment or promotion disadvantage, have been suggested as additional barriers dissuading girls and women from STEM study and career aspirations (Ceci et al., 2009; Moss-Racusin et al., 2012). Furthermore, as noted in Chapter 4, educational programs in science, engineering, and medicine tend to have environments that exacerbate vulnerabilities and foster gender discrimination and harassment.
5.3.4 / SOCIO-CULTURAL AND INSTITUTIONAL CONTEXTS
Criticisms have long been raised over the culture associated with STEM education — particularly the stereotyping of certain subfields as more suited to males than females, and the highly competitive environment (“swim or drown” culture) of introductory math and science courses. The result is to discourage both women and minority students (NAS, 2016). In fact, gender stereotypes about intellectual ability emerge as early as age six, when girls start to categorise more boys as “smart” and steer away from playing with the “smart” group (Bian et al., 2017). Gender career stereotyping is also strengthened by exposure to gendered toys and computer games marketed as objects for boys (Owen & Padron, 2016; Let Toys Be Toys UK, 2015). This notion persists through secondary education: for instance, nearly half of girls in the UK

141
Taking Stock: Data and Evidence on Gender Digital Equality PART ONE
and Ireland believed that STEM subjects are for “male careers” and are a better fit for boys’ brains (29%), personalities, and hobbies (27%) (Accenture, 2015). In addition, syllabus difficulty was the biggest reason behind not wanting to study STEM, with more than half of 12-year-old girls believing that STEM subjects are too difficult for them to learn.
Researchers also suggest that some STEM subfields have failed to present themselves as areas where women can pursue their values and goals. The lack of gender-sensitive curricula and gender-balanced learning environments in schools and colleges causes female students to avoid or drop out from engineering and technology studies. Some point to evidence that students perceive STEM fields as individual-centric and object-oriented, whereas women prefer more community-centric and people-oriented careers (Godwin et al., 2016; Stout et al., 2016; Wang & Degol, 2013). Others point to the masculine culture of engineering or geek culture in computer science, including “the stereotypes of socially awkward males who possess innate abilities that women allegedly lack” (SWE, 2016, p. 14; see also Cheryan et al., 2016). There is a general perception that STEM and ICT learning environments need to adapt to include participation of people with diverse values and career goals.
5.4 / BARRIERS TO ICT LEADERSHIP
Women’s severe underrepresentation in science and engineering is an extremely complex social phenomenon that defies any attempt at simplistic explanations. (Xie, 2006, p. 167.)
5.4.1 / FINANCIAL CONSTRAINTS
As discussed in Chapter 3, on ICT leadership, women entrepreneurs tend to have less access to business capital than male entrepreneurs. There is insufficient research to determine the extent to which this inhibits women from pursuing ICT entrepreneurship, especially in the informal sector. Most of the existing evidence relates to venture capital and focuses on documenting the levels of funding that goes to female enterprises. In this area, researchers attribute the extreme skew in funding for female-managed businesses to biases in VC firms, driven in large part by homophily — “the tendency of individuals to associate with similar others” (Gompers & Wang, 2017b, p. 36), evidenced in low representation of women in VC firms. Brush et al. (2014) reported that, in 2013, only 6% of VC firms in the U.S. had women partners (a decline from 10% in 1999). Gompers & Wang (2017b) showed that over the almost three decades since 1990, women have consistently constituted less than 10% of the VC labour pool in the U.S., whereas other fields like medicine
and law, starting at a similarly low level, have now reached parity. Furthermore, women venture capitalists in Information Technology stood at 5.5%, the lowest of all industries. Gompers, Mukharlyamov, Weisburst, and Xuan (2017) found that nearly 80% of VC firms had never hired a female investor. In Europe, studies estimate the percentage of female business angels between 10% and 30% (Quiros et al., 2018); a 2017 study found that women make up a minority (13%) of decision makers in U.K. venture capital firms (Diversity VC, 2017).
A few studies suggest that networking constraints limit women’s ability to gain access to business opportunities, with men having better access to relevant networks in technology and finance sectors, as well as different modes of utilising them (Alakaleek & Cooper, 2017; BarNir, 2012; Kuschel & Lepeley, 2016). There are also indications that venture capitalist assess male-led firms differently from female-led firms. A study by Lee & Huang (2018) found that female-led ventures were evaluated more highly when their proposals were given a social impact framing, though that standard was not applied in assessing male-led ventures.
5.4.2 / PERCEIVED ABILITY AND APTITUDE
A lack of adequate technical, business, or entrepreneurship training continues to be cited as reasons why there are few women in ICT leadership positions (Brush, Greene, Balachandra, & Davis, 2014). This is countered by studies demonstrating that women are acquiring relevant degrees — in IT, computer science, engineering, business management, and investment banking — at much higher rates than their representation in the workforce for these fields (Brush, Greene, Balachandra, & Davis, 2014; Gompers & Wang, 2017). Despite this, the perception that women are less capable than men in computing professions continues to exert both endogenous and exogenous influence on women’s professional choices — i.e., undervaluing by self and others. The result is evident in conscious and unconscious biases affecting hiring, performance evaluation, promotion policies, career development opportunities, and other workplace practices that shut women out or create work environments that are hostile or discouraging to women. Educational pathways to technology careers are also somewhat inflexible (Corbett & Hill, 2015), potentially ushering both males and females onto narrow career paths based on perceived technical versus non-technical capabilities.
142
Taking Stock: Data and Evidence on Gender Digital Equality PART ONE
5.4.3 / INTEREST AND PERCEIVED RELEVANCE
Beliefs about gender difference can [thus] spawn powerful self-fulfilling prophesies. (Charles and Bradley, 2009, p. 929.)
Social attitudes about gender capabilities as well as the values associated with technology occupations may inhibit women from considering careers in some science and technology fields. Despite the expansion of job opportunities generated by the digital economy, both sectoral and occupational segregation by gender have increased over the last two decades. According to ILO (2017b, pp. 10–11), “to achieve matched allocation of men and women in every sector would require a shift of one in every five men or women to different sectors.” Competing explanations for occupational segregation by gender cover a broad range: comparative advantages (based in biology); under-investment in women’s education and training; preferences and prejudices; stereotypes; organisational barriers; and differential income roles (Bettio & Verashchagina, 2009; Wang, Degol, & Ye, 2015; Weisgram & Diekman, 2015).
5.4.4 / SAFETY AND SECURITY
As discussed in Chapter 4 on the Dark Side, technology firms are seen as perpetuating particularly hostile environments, characterised by a hypermasculine culture that is unwelcoming or even threatening to women (Hewlett & Sherbin, 2014) (Box 5.1). Expectations of harassment can deter women from pursuing computing careers.
5.4.5 / SOCIO-CULTURAL AND INSTITUTIONAL CONTEXTS
Starting at an early age, we acquire implicit biases simply by living in a society where different types of people fill different roles and jobs. . . . Passive exposure to widespread beliefs registers these beliefs in our minds without our even knowing it. (Corbett & Hill, 2015, p. 38.)
The traditional scientific or engineering career . . . is predicated on the assumption that the faculty member will have an unlimited commitment to his or her academic career throughout his or her working life. Attention to other serious obligations, such as family, is taken to imply lack of dedication to one’s career. . . . The model . . . is increasingly unsuitable for both men and women who need or want to participate in other activities important to them and their communities. (National Academy of Sciences, National Academy of Engineering, and Institute of Medicine, 2007, p. 160.)The overarching contexts of social structures (e.g., social norms and pressures regarding female roles) and policy environments (e.g., unsupportive business regulations) shape the extent to which various demand and supply issues can facilitate or inhibit women’s equal participation (Box 5.2).
Michael Madaio (UNU-CS)
Several of the most influential online software developer platforms (such as GitHub and Stack Overflow) are associated with a particular type of hacker culture characterised by highly critical, often-acrimonious language that is intolerant of novices in general, but particularly so for female novices (Ford et al., 2016; Nafus, 2012). Researchers attribute women’s low participation in online software developer communities to this unwelcoming environment. In our analysis of datasets from large-scale surveys of GitHub and Stack Overflow users, we found that women were significantly more likely than men to say that a welcoming community and code of conduct were important to their participation in open-source software development. Female developers surveyed on those platforms were significantly less likely than men to consider themselves a member of those communities. On GitHub, the most widely used collaborative development platform — with over 29 million active users — men were more likely to feel that the community valued contributions from “people like them”, while women were more likely to feel that they did not have the skills and knowledge valued by others on GitHub. This may be a result of how the rest of that community treated them when they did participate, though more data is needed to understand the particular ways in which the culture of online developer communities is hostile towards women in general and female novices in particular.
Box 5.1Unwelcoming environments discourage female software developers

143
Taking Stock: Data and Evidence on Gender Digital Equality PART ONE
Barriers to gender equality in ICT leadership may be either supply- or demand-driven. Supply-side factors deal with the interest and willingness of women to participate in the ICT industry, while demand-side factors address the openness of the ICT industry to female participation. While some attribute gender inequalities to supply factors (Fernandez & Campero, 2017), others argue that demand factors play a stronger role. The truth is probably somewhere in between. Competing supply-side rationales for gender gaps include: the “critical filter hypothesis” (girls are handicapped because they are not good at mathematics); “pipeline problem” (women drop out of science training or careers); “productivity puzzle” (female scientists are less professionally productive than men); and “family life hypothesis” (women prioritise family life over careers in science (Xie, 2006). Demand-side rationales include: perceived or assumed lack of aptitude; biased recruiting and financing practices; gender-based discrimination; and unwelcoming professional environments (Meiksins, Layne, Beddoes, Masters, Roediger, & Shah, 2016).
Box 5.2Barriers to gender equality in ICT leadership
Gender stereotyping of computing as a male domain acts as a deterrent to women’s interest and motivation. These stereotypes pervade social consciousness, in sometimes subtle ways (Case Study 5.1).

144
Taking Stock: Data and Evidence on Gender Digital Equality PART ONE
Case Study 5.1“Ok Google: Is AI Gendered?”Author: Araba Sey and Lisandra Fesalbon (UNU-CS)
As artificial intelligence (AI) products such as Siri, Alexa, and Cortana become prominent fixtures in daily life, debates rage about their potential and dangers. There are high expectations that AI will engender diversity, social inclusion, fairness, and equality. However, evidence is already emerging that even AI is prone to reproducing social biases and stereotypes (Gustavsson & Czarniawska, 2004; Gustavsson, 2005). Against this backdrop, we explored some of the more overt ways in which AI might be mirroring societal biases regarding female roles. Specifically, we asked: Are AI products given gender identities — and, if yes, to what extent do these identities reinforce occupational gender stereotypes?
Methodology. We conducted internet searches using Google Play Store and Apple Store, as well as lists such as Imanuel (n.d), Pappas (2015), and Wycislik-Wilson and Ellis (2018). The search yielded 129 AI products, mostly cost-free, that are marketed on the internet:
• 98 virtual personal assistants: software and applications that respond to requests from users
• 31 text-to-speech services: software and applications that allow users to hear text read out loud
To determine gender identity, we classified the names, voices, and appearances of the AI product, based on information on product websites as well as product advertisements and demos. Names were classified based on the Worldwide Gender-Name Dictionary (Raffo, 2016). For products with a voice feature, gender of the voice was classified by downloading and listening to a demo and assigning female to higher-pitched voices and male to deeper-pitched voices. Appearance, for products with an embodied virtual agent, was determined by whether the agent resembled a female, a male, or looked neutral.
Findings. Virtual personal assistants had primarily female identities: 41% had a female name, 68% had a female voice, and 50% had a female appearance (Table 5.2). Male identities were less common. However, there was also a fair amount of neutral identities: 28% had a neutral name, 13% offered both male and female voices, and 29% were neutral in appearance.
Table 5.2Gender identities of virtual personal assistants
Text-to-speech software and applications, on the other hand, were overwhelmingly neutral (Table 5.3). Practically all had generic names and non-gendered appearances. However, most (84%) offered the option to choose gendered names and accompanying voices within the software.
These findings suggest that AI products tend to be assigned gendered identities that to some degree
replicate occupation stereotypes, especially regarding “pink-collar” jobs. Most virtual personal assistants are designed to carry out basic clerical tasks, such as answering e-mails, reading or sending messages, and planning calendar agendas. The fact that most of our sample of virtual personal assistants were female-gendered is consistent with the tendency for these types of frontline services to be associated with female workers in the offline world (Gustavsson, 2005; Piper,

145
Taking Stock: Data and Evidence on Gender Digital Equality PART ONE
Table 5.3Gender identities of text-to-speech software and applications
2016; Zdenek, 2007). Indeed, some researchers argue that both men and women prefer interacting with virtual females (LaFrance, 2016; Piper, 2016; Zdenek, 2007). However, the strong presence of products withneutral identities indicates that some developers are proactively eliminating overt gender stereotypesfrom their products. It is notable that the “older” product type, text-to-speech services, was the mostlikely to give users gender choices.
Recommendations. This is a relatively new area, with room for more exploration. Future research should
expand the scope to include more AI products of varying types, life-stages, sectors, geographic origins, and languages. Demand-side analyses would shed light on consumer preferences as well. To mitigate widely held gender stereotypes that continue to shape people’s career decisions, AI product developers could take a cue from text-to-speech products and assign their products neutral identities, or, at the very least, incorporate multiple options, allowing consumers to decide.

146
Taking Stock: Data and Evidence on Gender Digital Equality PART ONE
In addition, although the evidence is contradictory, it appears that, to a considerable extent, personal and societal expectations that a woman prioritise family over work hold some women back from pursuing academic and industry careers in ICT — or impose heavy professional and personal burdens. The “culture of overwork” (Corbett & Hill, 2015, p. 35) associated with technology firms exacerbates the situation for employees who shoulder domestic care and other such responsibilities.
Institutionalised discrimination also stunts involvement in computing careers. Unfortunately, a prevailing belief that technology firms are guided by meritocratic principles leads to women being unjustly excluded from candidate pools and advancement opportunities (Corbett & Hill, 2015; Dryden, 2013; Hewlett & Sherbin, 2014; National Academy of Sciences, National Academy of Engineering, and Institute of Medicine, 2007; Sassler, Glass, Levitte, & Michelmore, 2017). For example, practices such as assessing candidates based on their activity on particular platforms (such as GitHub) stacks the deck against women, if these platforms are themselves inhospitable towards women.
In relation to entrepreneurship, although not specific to ICT entrepreneurship, some research suggests that limited policy support can inhibit female participation. The World Bank Group (2018) reports that fewer women work or own businesses in economies that have lower levels of gender legal equality23. Furthermore, data from the Internet Inclusiveness Index (Economist Intelligence Unit, 2018) shows that, globally, only 25 countries have a national “plan addressing female-driven innovation and women-owned businesses”; those countries are located in Africa (7), Asia and the Pacific (8), Europe (8), and the Americas (2). Research by Liberda and Zajkowska (2017) concludes that innovation policies in Europe fail to actively account for gender, leading to a focus on male-dominated sectors. In sum, barriers to gender digital equality can be grouped into six broad categories (Table 5.1).
23 Note that this contrast somewhat with the conclusion of Kelley et al. (2017) conclusion (reported in Chapter 3) that there is more female entrepreneurship in countries with lower gender equality ratings.
Table 5.4Summary of barriers to gender digital equality

147
Taking Stock: Data and Evidence on Gender Digital Equality PART ONE
5.5 / RECOMMENDATIONS
Resolving digital gender inequalities will require addressing the different barriers that affect women’s engagement with ICTs, including development of digital skills and career opportunities in the ICT industry. Table 5.2 summarises the range of recommendations identified in the literature, as they relate to the barriers discussed here. Some proposed
remedies target specific manifestations or symptoms of gender digital inequality, such as affordability or recruiting practices: see Box 5.4 for UN Women’s recommendations targeted at the business sector. Others recommend reshaping deeply ingrained social norms and practices that are at the root of gender inequality: see Case Study 5.2 for a life course perspective. Specific recommendations are discussed in more detail below.
Table 5.5Recommendations for addressing barriers to gender equality in ICT access, skills, and leadership (collated from the literature)

148
Taking Stock: Data and Evidence on Gender Digital Equality PART ONE
All businesses stand to benefit from gender equality. The Women’s Empowerment Principles (WEPs) platform supports the private sector — regardless of size, sector or geography — to advance gender equality and women’s empowerment in the workplace, marketplace, and community, and to contribute to achieving the Sustainable Development Goals. The WEPs provide a gender lens through which businesses can analyze their current initiatives, benchmarks, and reporting practices, and then tailor or establish policies and practices to realise gender equality and women’s empowerment. Support for the seven Principles has gathered global momentum: more than 2,000 companies worldwide are now WEPs champions.
Women’s Empowerment Principles
Principle 1: Establish high-level corporate leadership for gender equality.
Principle 2: Treat all women and men fairly at work – respect and support human rights and nondiscrimination.
Principle 3: Ensure the health, safety, and well-being of all women and men workers.
Principle 4: Promote education, training, and professional development for women.
Principle 5: Implement enterprise development, supply chain, and marketing practices that empower women.
Principle 6: Promote equality through community initiatives and advocacy.
Principle 7: Measure and publicly report on progress to achieve gender equality.
Box 5.4The Women’s Empowerment PrinciplesPhoto credit: UN Women/Ryan Brown

149
Taking Stock: Data and Evidence on Gender Digital Equality PART ONE
Case Study 5.2Gender digital inequality from the Life Course perspectiveAuthor: Moon Choi (KAIST Graduate School of Science and Technology Policy)
The current state of gender digital inequality is the outcome of accumulated oppressions that women, who used to be girls, have faced throughout the course of their lives. For the last decade, research and discourse on gender digital inequality has advanced slowly but steadily; still, it lacks theoretical perspectives which could provide insight into the mechanisms of gender digital inequality as well as critical intervention points to reduce it. The concept of “life course” is one of the primary theoretical frameworks in the field of gerontology and human development — and it can be applied to enhance understanding gender digital inequality.
Individuals belong to a cohort based on their birth years, in historical context and time (Elder, 1998). The life course perspective emphasises the structural influences of cohort, history, culture, and location in relation to individuals’ life experiences and pathwayswhile attempting to bridge sociological and psychological constructs (Hooyman & Kiyak, 2011; Settersten, 2006). For example, a girl born in a developing country during the twenty-first century has quite different gender norms, attitudes toward technology, and choices for her education, major, career etc., compared to a woman who was born in the same country during the early half of the twentieth century, or a girl born in the same year but in a developed country. Gender socialisation means “learning gender” (Moen, 2016); members of different cohorts and societies learn gender differently, which influences how they view their lives and make decisions about their future.
Early life experiences and decisions, often constructed by society, affect future life experiences; advantages and disadvantages tend to be accumulated over the life course and maximised in old age (Dannefer, 2003). The gender digital divide needs to be understood from this life course perspective. Women’s decisions on education and career arise from early life experiences and social constructs by cohort. For example, strong gender identity and stereotypes have been reported to be associated with negative attitudes toward mathematics among female college students (Nosek, Banaji, & Greenwald, 2002), becoming a constraint on moving into careers in science and engineering (Moen, 2016). Also, after starting a family, woman often becomes the primary caregiver for children and other family members, responsibilities that may conflict with full-time employment in demanding positions, limiting career options and increasing women’s vulnerability to poverty.
The life course perspective would suggest that enacting seemingly simple solutions, such as increasing access to the internet and digital devices among girls and women, cannot work effectively without fundamental changes in prevalent gender norms and culture. Current and future cohorts of both girls and boys should not learn gender, while both women and men need to unlearn gender, especially around the potential to succeed in math, science, and other technical subjects. Older women also suffer social exclusion related to digital literacy, in that accumulated disadvantages, including those related to gender norms, tend to be maximised in old age. Furthermore, older women often serve as caregivers of young children for dual-income couples. Considering that they are the agents transmitting values to the next generation and also the most vulnerable to digital exclusion, interventions targeted to grandparents and grandchildren might be effective in reducing gender digital inequality in both the short and long term.
150
Taking Stock: Data and Evidence on Gender Digital Equality PART ONE
5.5.1 / RECOMMENDATIONS FOR ICT ACCESS
Expand digital infrastructure.This includes not only improving connectivity options through basic infrastructure (especially in rural areas), but also exploring models of service provision that are more attuned to the lifestyles and concerns of women (Alampay, 2006; Sambuli, Brandusescu, & Brudvig, 2018).
Improve affordability.There is now greater understanding and visibility of ICT affordability issues in different parts of the world, because of improved data collection and measurement tools such as ITU’s ICT Price Basket indicator. Much of A4AI’s work is focused on how to drive down cost and expand access to the internet, with a goal of bringing down the cost of 1GB of mobile broadband to equal 2% or less of average monthly income. This increased attention to affordability issues over recent years has already galvanised action on the need to bring down the cost of ICTs as a strategy to widen ICT access.
Improve basic digital literacy.There is a growing recognition that in increasingly “connected” world, digital skills matter (van Deursen and van Djik, 2010); Robinson et al., 2015). An ongoing conversation surrounds the questions of what exactly constitute digital skills, and what aspects of digital skills are particularly important to bring women online. Due to the speed of change in the technological landscape, the emergence of new ICTs continuously redefines the type of skills that are considered basic and relevant.
Promote education in general.Closing the gender digital divide should not end at equipping women and girls with basic digital and literacy skills. Promoting education in general is advisable; research shows that access to higher education narrows the gender gap in internet access (World Wide Web Foundation, 2015).
Provide relevant content.Insufficient attention has been paid to promoting the production and provision of digital content that is relevant to the lives of women (van der Spuy & Souter, 2018). This also encompasses presenting content in the (local) language that women understand (Dighe and Reddi, 2006).
Improve online safety and security.To deal with cyber-VAWG, the Broadband Commission (2015) has recommended the following best practices:
a. Sensitisation. Prevent cyber VAWG through changes in social attitudes, by means of public education and training of enforcement agency staff on cyber VAWG.
b. Safeguards. Promote safeguards for online safety and equality on the internet for women and girls through the development of technical solutions and through promotion of due diligence and duty-to-report systems, with the industry maintaining responsible internet infrastructure and customer care practices.
c. Sanctions. Develop laws, regulations, and governance mechanisms; enforce compliance through effective punitive consequences for perpetrators; and consult on cyber civil rights agenda.
Improve offline safety and security.As noted by Davaki, online violence against women and girls tends to reflect offline arrangements, including patriarchal forces which are uneasy about women’s empowerment through ICT use and Internet access, repressive groups particularly targeting women, either through intimidation or negative campaigning, state authorities that might be retaining user data legally or illegally or aggressive and sexist hate speech feeding on traditional gender stereotypes. (Davaki, 2018, p. 22.)Eliminating these offline threats will facilitate women’s access to and use of digital technologies.
Combat social norms that disadvantage women.A crucial dimension of narrowing the gender digital gap is to address the underlying economic, social, and cultural barriers that prevent women from accessing ICTs and meaningfully participating in the digital economy. The solutions to gender digital inequalities “cannot be concerned with digital policies alone”; it is also critical to attend to structural inequalities from a rights-based perspective (van der Spuy & Souter, 2018). Collaborate with stakeholders.There is a growing recognition that gender digital divides can only be closed with the concerted effort of all stakeholders, from academia to policy makers and the private sector and non-government organisations. Through the SDGs, the UN provides a rallying point for all stakeholders, with the inclusion of specific SDG targets that impact women’s access to ICTs. The Broadband Commission (2013) has also helped raise the profile of the issue of gender digital divide by calling attention to this problem and calling for gender equality in access to broadband by 2020, as part of its broadband advocacy target.
A list of recommendations from the Broadband Commission’s Working Group on the Digital Gender Divide (2017) usefully spells out a wide range of

151
Taking Stock: Data and Evidence on Gender Digital Equality PART ONE
actions that stakeholders can take (Figure 5.1). Their four recommendation areas are: (1) support the collection, tracking, and analysis of sex-disaggregated data on internet access and use; (2) integrate gender perspectives into relevant strategies, policies, plans, and budgets; (3) address barriers related to affordability, skills, and safety; and (4) support stakeholders to collaborate more effectively.
Collect and share sex-disaggregated data.Central to most recommendations on closing gender digital divides is the need for gender-disaggregated data and better measurement tools, to accurately capture women’s ICT access and use patterns (e.g., Davaki, 2018). Irregular data collection and inadequate country coverage persist, even for basic ICT access indicators. Partnerships are needed to strengthen gender-disaggregated data regimes in ICT access. These efforts need to go beyond the quantitative aspect of data collection; to meaningfully answer questions on key policy issues would require both quantitative metrics and qualitative assessments that are context-specific and sensitive to local conditions.
Figure 5.1Summary of Broadband Commission Recommendations to Close the Gender Digital Divide
Source: Broadband Commission, 2017.

152
Taking Stock: Data and Evidence on Gender Digital Equality PART ONE
5.5.2 / RECOMMENDATIONS FOR ICT SKILLS
Provide equal opportunities to develop ability and aptitude.
In general, there is a need for more accessible digital skills and STEM learning opportunities targeting girls and women, both in and out of the classroom (Microsoft, 2017; UNESCO, 2017). Along with greater exposure to STEM education, teachers and parents can help girls to build their confidence by evaluating their actual abilities in STEM studies, helping them correct their biased self-perceptions, and encouraging their performance and achievement, as well as inspiring and envisioning what they can achieve through future careers in STEM (OECD, 2015). It is also important to ensure sufficient provision of incentives, such as scholarships or awards, in areas where girls are significantly underrepresented (UNESCO, 2017).
Train teachers in gender-responsive pedagogies.Capacity building is needed to improve teachers’ ability to implement gender-responsive STEM pedagogies (Accenture, 2017; OECD, 2015; UNESCO, 2017). Teachers with good knowledge and understanding in gender-sensitive pedagogy can play a critical role in encouraging more girls to pursue STEM careers, while deconstructing gender stereotypes in STEM education. In fact, studies have found that female students show less self-doubt in their STEM abilities when instructors employ specific gender-responsive pedagogical methods, such as student-centered teaching methods and female peer-group activities in classes (Ro & Knight, 2016).
Promote interest and perceived relevance.It is widely suggested that early intervention is crucial in tackling gender imbalance in STEM education and in motivating more girls to be interested in learning STEM and advanced digital skills (Accenture, 2015; Microsoft, 2017; UNESCO, 2017). Approaches include: instituting computing education or computational thinking in primary or secondary education; and introducing innovative technologies, creativity, and hands-on experiences that speak to girls’ interest (Accenture, 2015; Microsoft, 2017).
Together with the curricula to motivate more girls to study STEM subjects and learn digital skills, it is important for girls and underrepresented social groups to have role models and mentoring. UNESCO (2017) recommends that schools should facilitate frequent contact with female role models in the STEM and ICT industry and expand access to mentoring, career counseling, and apprenticeship or internship opportunities for STEM studies and careers. Along with role models in the industry and popular media, female teachers in STEM subjects can also be good role models. Studies found that girls who attended a high school with larger numbers of female math and science
teachers were more likely to major in STEM fields (Stearns et al., 2016; Accenture, 2015).
Combat social and institutional norms that disadvantage women.It is critical to change the institutional environment to become more gender-responsive so that women have equal opportunities, feel supported, and are able to pursue their goals and objectives in the learning environment (SWE, 2016). Suggested approaches include: hiring more well-trained female teachers (UNESCO, 2017); organised, well-funded efforts to change academic culture under strong leadership (Steward, Malley, & Herzog, 2016); and schools working to eliminate stereotypes and biases in their STEM curriculum or learning environment, while emphasising the importance of STEM to all students and highlighting women’s achievement as STEM researchers and professionals (UNESCO, 2017). It is also recommended that schools expand education on media literacy, to cultivate critical thinking and gender-responsive knowledge that will help students recognise gender stereotypes in the media. For younger students, it is also recommended that parents are supported to educate themselves about STEM subjects and career perspectives, in order to counter common misconceptions about STEM (Accenture, 2017; UNESCO, 2017). Lastly, educational institutions should try to ensure a safe and inclusive STEM learning environment that is free from discriminatory social and cultural norms and harassment (UNESCO, 2017).
Develop gender-responsive national policy on digital skills.As education is central to any nation’s social policy, it is important to mainstream gender equality not only in STEM education policy but also across sectors such as education, social welfare, and labour (UNESCO, 2017). Governments should prioritise public investment in fostering gender-responsive STEM and digital skills education, while incentivising the private sector to support gender equality — particularly promoting women’s participation in STEM studies and careers (Broadband Commission, 2017).
Collaborate with stakeholders.No single entity can resolve gender digital inequality. At national level, it is recommended to create collaborative efforts involving educational systems, industry, and government, to deliver a consistent message in a sustained way across the country (Accenture, 2017; UNESCO, 2017). At the global level, it is necessary to enable global dialogue as well as a knowledge-sharing platform, to discuss and disseminate good practices and lessons learned.

153
Taking Stock: Data and Evidence on Gender Digital Equality PART ONE
Collect and share research and sex- disaggregated data.The gender equality in digital skills can only be fully understood through internationally comparable, sex-disaggregated data that capture not only such quantifiable factors as educational enrolment and performance grades, but also more qualitative and psychological issues such as self-belief and sociocultural barriers. When such data are collected and shared globally, it will facilitate much-needed research and knowledge. For example, more research is needed to identify how girls’ self-beliefs are formed, and what interpersonal and intrapersonal factors affect their self-concepts (Moeller & Marsh, 2013; OECD, 2015).
5.5.3 / RECOMMENDATIONS FOR ICT LEADERSHIP
Address social norms, stereotypes, and socio-economic constraints that hold women back and discourage girls from considering STEM careers.Equip young girls with the skills and motivation to make informed choices about work in STEM careers; promote alternative pathways to STEM careers; change the image of computing and engineering in the media; and address the unevenness of historical transformations in gender roles, by promoting male participation in female-dominated occupations (AAUW, 2017; Ashcraft, McLain, & Eger, 2016; Banchefsky & Park, 2018; Blau, Brummund, & Liu, 2013; Brush, Greene, Balachandra, & Davis, 2014; Corbett & Hill, 2015; Erosa, Fuster, Kambourov, & Rogerson, 2017; ILO, 2017a; Miller, Nolla, Eagly, & Uttal, 2018; Molina, Lin, & Wood, 2015). In the process, it is important to act in an inclusive manner so as not to alienate the male population or exacerbate backlash. For example, Lean In (2018) reports that, in the wake of the Me Too movement, male managers may increasingly be pulling away from engaging with female colleagues (mentoring, working, or socialising). Improve recruitment and advancement practices to remove conscious and unconscious bias.Promote more creative job design, expand candidate evaluation criteria, and develop external partnerships to generate a more diverse talent pipeline (Ashcraft et al., 2016; Corbett & Hill, 2015; Dryden, 2013; MacDougall et al., 2017; Molina et al., 2015; National Academy of Sciences, National Academy of Engineering, and Institute of Medicine, 2007; State Street Global Advisors, 2018; Thomas, Doughertty, Strand, Nayar, & Janani, 2016; WISE, n.d.).
Promote change in organisational culture to be more inclusive and less discriminatory.Recommended actions include: removing systemic barriers, increasing transparency of administrative processes, addressing discrimination and harassment, and forming diversity and inclusion committees.
Measures might reach as far as establishing limits on CEO pay to narrow the gender pay gap at executive levels (Acker, 2016; Cardador & Hill, 2018; Davis-Ali, 2017; Hunt, Layton, & Prince, 2015; ILO, 2016; MacDougall et al., 2017; National Academy of Sciences, National Academy of Engineering, and Institute of Medicine, 2007; WISE, n.d.). Establish professional development initiatives targeting women and other marginalised groups.Provide training, mentorship, and networking programs (Davis-Ali, 2017; Hewlett & Sherbin, 2014; Hunt et al., 2015; MacDougall et al., 2017; Molina et al., 2015; WISE, n.d.).
Foster greater work/life balance for all employees.Promote less masculine-oriented definitions of the ideal worker; enable flexible work arrangements for workers with domestic care obligations, as well as better childcare benefits and family leave options (Ecklund & Lincoln, 2016; MacDougall et al., 2017; Molina et al., 2015; WISE, n.d.).
Ensure accountability.Take measures to collect, monitor, and openly share gender-disaggregated data on recruitment and other trends; establish diversity goals; assign managerial responsibility; and share lessons and good practices (Davis-Ali, 2017; Kalev, Dobin, & Kelly, 2006; MacDougall et al., 2017; Molina et al., 2015; National Academy of Sciences, National Academy of Engineering, and Institute of Medicine, 2007; State Street Global Advisors, 2018; Thomas et al., 2016; WISE, n.d.).
Introduce regulatory measures to enforce diversity.Strategies include mandatory quotas, “comply or explain” policies, and extending diversity requirements to contractors (Chanavat & Ramsden, 2013; Institutional Shareholder Services, Inc. & Regulation, 2017; MacDougall et al., 2017; US Government Accountability Office, 2017). At the macro level, some have suggested that governments establish labour market, wage, and fiscal policies that promote decent work and protect vulnerable groups, such as correcting the tendency for low wages to be associated with female-dominated occupations (ILO, 2016).
Leverage the power of shareholders and investors to compel corporations to improve their gender diversity status.Exercise shareholder voting power, as has been done by State Street Global Advisors (2018). Develop gender lens investment products, such as the SSGA Gender Diversity Index, Thomson Reuters Diversity & Inclusion Index, EDGE Certification, Equileap Global Gender Equality 100 Leaders Net Total Return Index, Lyxor Gender Equality ETF, and Evolve Gender Diversity Index.

154
Taking Stock: Data and Evidence on Gender Digital Equality PART ONE
Foster women ICT entrepreneurs.Four broad recommendations relate specifically to women in ICT entrepreneurship:1. Address social, cultural and regulatory barriers to
economic opportunity for women (Ritter-Hayashi, Vermeulen & Knoben, 2016).
2. Promote information about entrepreneurship as a career choice (Gompers & Wang, 2017). This could also directly improve gender diversity in the ICT workforce: a study by Steiner (2017) concluded that, compared to firms without a female founder, firms with at least one female founder had double the levels of female employees, female executives, and females on engineering teams.
3. Address gender biases in venture capital decision-making processes. Improving gender inequality in ICT entrepreneurship involves increasing female numbers not only in ICT and entrepreneur ranks, but also in investment capital circles. Brush, Greene, Balachandra, & Davis (2014) report that VC firms with women on their teams are twice as likely to fund businesses with female partners. Research by Gompers, Huang, & Wang (2017) found that gender homophily was evident among female MBA students; that is, women were more likely to pair up with other women. However, they also found that, in the technology and finance fields, men were more likely to associate with people with similar educational backgrounds and industry experience, rather than people of the same gender. More research is needed on how people form business and investment partnerships in the real world.
4. Recognise the diversity of entrepreneurial activity; look beyond the current focus on venture capital-funded businesses and masculine models of entrepreneurship (Kelley et al., 2017).
Collect and share research and sex- disaggregated data.Research is needed beyond the collection of basic national gender-disaggregated data: revisit the definitions of STEM and STEM occupations in the digital age; examine the contexts in which career choices are made and the forces driving people’s decisions (AAUW, 2017; Gorbacheva, Beekhuyzen, vom Brocke, & Becker, 2018). Research should be: multi-gender (including both female and male researchers); multidisciplinary (e.g., including social science, psychology, management, economics, engineering, computing and feminist studies); and based on diverse theories and methodologies, as well as leveraging big data (AAUW, 2017; Meiksins, Layne, Beddoes, Acton, & Lewis, 2018). Of crucial importance is sharing data and research results to promote knowledge and evidence-based action.
Four caveatsPast studies have suggested that for progress to occur, women need to be proactive in obtaining more equity financing. Recommendations included learning the language of finance, becoming more financially savvy, having “big dreams,” or starting businesses in
high-technology sectors. Other prescriptions include expanding networks and learning to pitch more like men. Based on our research, it is increasingly apparent that many women entrepreneurs have followed these prescriptions, yet they have not been able to achieve proportionate increases in early-stage growth capital. (Brush et al., 2014, p. 15.)
1. Desired outcomes are not guaranteed.The above observation by Brush et al. (2014) is an important caveat to all recommendations regarding gender equality in ICT leadership. Positive outcomes are not guaranteed, and actions often bring unintended consequences (positive and negative). For example, while diversity training and evaluation activities may be relatively easy to implement, some researchers have suggested that they are less effective than other measures, such as assigning organisational responsibility for diversity or establishing networking programs (Kalev, Dobin, & Kelly, 2006; Thomas et al., 2016). Diversity initiatives are often employed as window dressing rather than being based in evidence (Kalev et al., 2006, p. 610), which can compromise their outcomes.
2. A good practice applied to the wrong problem will not have the desired results.
For example, Hunt (2010, p. 2) observes, in relation to the issue of overwork culture: “Long work hours may indeed disproportionately lead women rather than men to leave science and engineering, but long work hours may also disproportionately lead skilled women to leave other fields. . . . Thus, while it may be worthwhile for science and engineering employers to implement Hewlett et al. (2008)’s prescription of more flexible working time, if other employers implement and benefit from similar policies, any science and engineering-specific disadvantage in retaining women will persist.” In other words, if organisations in other industries also implement flexible working hours, then it may not be any easier for the science and engineering field to attract women based on offering flexible work arrangements.
3. The evidence for some solutions is currently contradictory.
For example:
• Some research indicates that local government regulation is more effective than voluntary efforts in engendering diversity (Chanavat & Ramsden, 2013; MacDougall et al., 2017). However, other research shows that diversity can be achieved in the absence of strict regulatory regimes, as in Finland and Sweden (Institutional Shareholder Services, Inc & Regulation, 2017).
• A report by UNCTAD (2017) cautions that policies to reduce occupational segregation by gender could in fact be counterproductive, depending on the economic context.
• Some argue that a social impact framing would make technology careers more attractive to females (Boucher, Fuesting, Diekman, & Murphy, 2017; Su & Rounds, 2015; Wang, Degol, & Ye,
155
Taking Stock: Data and Evidence on Gender Digital Equality PART ONE
2015). This may backfire, however, if women have already been socialised to believe that altruism is not consistent with the culture of the profession (Cheryan, Ziegler, Montoya, & Jiang, 2017; Smith-Doerr, Vardi, & Croissant, 2016).
• Blau and Kahn (2013, abstract) argue that family-friendly workplace policies such as paid leave and part-time employment options “appear to encourage part-time work and employment in lower level positions” — which could compromise women’s leadership opportunities.
4. Stakeholders should avoid the temptation to adopt simplistic, one-size-fits-all solutions.
Addressing gender equality in any context requires a multi-faceted approach and adaptation to local contexts (Cummings, 2015; Davis-Ali, 2017; Institutional Shareholder Services, Inc & Regulation, 2017; Perales & Vidal, 2015; Sassler, Michelmore, & Smith, 2017; Thomas et al., 2016; Xie, 2006).
5.6 / CONCLUSION
The factors that contribute to gender digital inequalities usually fall into the following six categories: infrastructure availability; financial constraints; ability and aptitude; interest and perceived relevance; safety and security; and socio-cultural and institutional constraints. While the reasons for gaps in access and basic skills are relatively well-established, scholars and policymakers have not reached a consensus on how and why there is a gender gap in advanced computing skills and ICT industry leadership. This is largely because the problem is complex: women’s underrepresentation is often shaped by intersections of multiple gendered barriers (personal, social, cultural, and organisational) that can be challenging to observe or capture.
Complicating things further, there are no comprehensive official statistics examining these barriers at the international or regional level. As such, while numerous reasons have been proffered for the low presence of women in technology and engineering fields, few are backed by strong empirical evidence; most of our knowledge exists as a quilt of national or small-scale surveys and case studies. Nevertheless, there is growing acknowledgment that these barriers can only be eliminated through concerted efforts involving multiple stakeholders, including academia, policy makers, the private sector, non-government organisations, and civil society. Additionally, the barriers identified in this report often interact with and influence each other. Impact will therefore be greater if stakeholders address these issues holistically rather than taking a siloed approach.
Proposed solutions include some that target symptoms of gender equality, and others that target underlying
socio-cultural environments. Scholars increasingly caution against one-size-fits-all solutions. Furthermore, it is important to act in an inclusive manner so as not to alienate the male population, overlook other disadvantaged populations, or exacerbate backlash. In light of the sometimes contradictory evidence for different solutions, data collection and monitoring are essential components to determine what solutions may be effective, and why.
REFERENCES
AAUW. (2017). A research agenda on gender in engineering and computing. American Association of University Women. Retrieved from: https://www.aauw.org/aauw_check/pdf_download/show_pdf.php?file=Research-Agenda-Gender-Engineering-Computing
Acker, J. (1990). Hierarchies, jobs, bodies: A theory of gendered organizations. Gender & Society, 4(2), 139-158. Retrieved from: https://doi.org/10.1177/089124390004002002
Alampay, E. (2006). Analysing socio-demographic differences in the access & use of ICTs in the Philippines using the capability approach. The Electronic Journal of Information Systems in Developing Countries, 27(1), 1–39. Retrieved from: https://doi.org/10.1002/j.1681-4835.2006.tb00182.x
Alao A., Lwoga T.E., & Chigona W. (2017). Telecentres use in rural communities and women empowerment: Case of Western Cape. In: Choudrie J., Islam M., Wahid F., Bass J., Priyatma J. (Eds.), Information and communication technologies for development. ICT4D 2017. IFIP Advances in Information and Communication Technology, vol. 504. Springer.
Alliance for Affordable Internet (2017). 2017 Affordability report. Retrieved from: http://1e8q3q16vyc81g8l3h3md6q5f5e.wpengine.netdna-cdn.com/wp-content/uploads/2017/02/A4AI-2017-Affordability-Report.pdf
Alakaleek, W. & Cooper, S. Y. (2018). The female entrepreneur’s financial networks: Accessing finance for the emergence of technology-based firms in Jordan. Venture Capital, 2(2), 137-157, DOI: 10.1080/13691066.2017.1345120
Ashcraft, C., McLain, B., & Eger, E. (2016). Women in tech: The facts. National Center for Women & Technology (NCWIT). Retrieved from: https://www.ncwit.org/sites/default/files/resources/ncwit_women-in-it_2016-full-report_final-web06012016.pdf
Banchefsky, S., & Park, B. (2018). Negative gender ideologies and gender-science stereotypes are more pervasive in male-dominated academic disciplines. Social Sciences, 7(2), 27. Retrieved from: https://doi.org/10.3390/socsci7020027

156
Taking Stock: Data and Evidence on Gender Digital Equality PART ONE
BarNir, A. (2012). Starting technologically innovative ventures: Reasons, human capital, and gender. Management Decision, 50(3), 399-419. Retrieved from: https://doi org.offcampus.lib.washington.edu/10.1108/00251741211216205
Bettio, F., & Verashchagina, A. (2009). Gender segregation in the labour market: Root causes, implications and policy responses in the EU. Luxembourg: Publ. Office of the European Union. Retrieved from: ec.europa.eu/social/BlobServlet?docId=4028Blau, F. D., Brummund, P., & Liu, A. Y.-H. (2013). Trends in occupational segregation by gender 1970-2009: Adjusting for the impact of changes in the occupational coding system. Demography, 50(2), 471–494. Retrieved from: http://dx.doi.org/10.1007/s13524-012-0151-7
Blau, F., & Kahn, L. (2013). Female labor supply: Why is the US falling behind? Working Paper No. w18702. Cambridge, MA: National Bureau of Economic Research. Retrieved from: https://doi.org/10.3386/w18702
Boucher, K. L., Fuesting, M. A., Diekman, A. B., & Murphy, M. C. (2017). Can I work with and help others in this field? How communal goals influence interest and participation in STEM fields. Frontiers in Psychology, 8. Retrieved from: https://doi.org/10.3389/fpsyg.2017.00901
Bradley, S. R., Gicheva, D., Hassell, L., & Link, A. N. (2013). Gender differences in access to private investment funding to support the development of new technologies. UNCG Economics Working Papers No. 13–9. University of North Carolina at Greensboro, Department of Economics. Retrieved from: https://ideas.repec.org/p/ris/uncgec/2013_009.html
Broadband Commission. (2013). Doubling digital opportunities: Enhancing the inclusion of women and girls in the information society. Broadband Commission Working Group on Broadband and Gender. Retrieved from: http://www.broadbandcommission.org/Documents/publications/bb-doubling-digital-2013.pdf
Broadband Commission. (2015). Combatting online violence against women and girls: A worldwide wake-up call (highlights). Discussion paper from the Broadband Commission Working Group on Gender. Retrieved from: http://www.broadbandcommission.org/Documents/publications/bb-wg-gender-report2015-highlights.pdf
Broadband Commission. (2017b). Recommendations for action: Bridging the gender gap in Internet and broadband access and use. Working Group on the Digital Gender Divide. Retrieved from: http://www.broadbandcommission.org/Documents/publications/WorkingGroupDigitalGenderDivide-report2017.pdf
Brush, C. G., Greene, P. G., Balachandra, L., & Davis, A. (2014). Diana Report: Women entrepreneurs 2014: Bridging the gender gap in venture capital. Retrieved from: http://www.babson.edu/Academics/centers/blank-center/global-research/diana/Documents/diana-project-executive-summary-2014.pdf
Cardador, M. T., & Hill, P. L. (2018). Career paths in
engineering firms: Gendered patterns and implications. Journal of Career Assessment, 26(1), 95–110. Retrieved from: https://doi.org/10.1177/1069072716679987
Chanavat, A., & Ramsden, K. (2013). Mining the metrics of board diversity. New York, NY: Thomson Reuters. Retrieved from: https://www.thomsonreuters.com/en/press-releases/2013/average-stock-price-of-gender-diverse-corporate-boards-outperform-those-with-no-women.html
Charles, M., & Bradley, K. (2009). Indulging our gendered selves? Sex segregation by field of study in 44 countries. American Journal of Sociology, 114(4), 924–976. Retrieved from: https://doi.org/10.1086/595942
Cheryan, S., Ziegler, S. A., Montoya, A. K., & Jiang, L. (2017). Why are some STEM fields more gender balanced than others? Psychological Bulletin, 143(1), 1–35. Retrieved from: https://doi.org/10.1037/bul0000052
Corbett, C., & Hill, C. (2015). Solving the equation: The variables for women’s success in engineering and computing. Washington DC: American Association of University Women. Retrieved from: https://www.aauw.org/research/solving-the-equation/
Cummings, L. M. (2015). Gender equality in science, technology, engineering, agricultural sciences and mathematics (STEAM) academic pipeline: Challenges transferring knowledge to practice. Washington, DC: USAID. Retrieved from: https://www.usaid.gov/sites/default/files/USAID-Report-Sep-30-2015-Final.pdf
Davaki, K. (2018). The underlying causes of the digital gender gap and possible solutions for enhanced digital inclusion of women and girls. Brussels: Policy Department for Citizens’ Rights And Constitutional Affairs. Retrieved from: http://www.europarl.europa.eu/RegData/etudes/STUD/2018/604940/IPOL_STU(2018)604940_EN.pdf
Davis-Ali, S. (2017). Advancing women technologists leaders: Strategies for cultivating confident women leaders. Anita Borg Institute. Retrieved from: http://anitab.org/wp-content/uploads/2017/04/advancing-women-technologists-leaders.pdf
Deen-Swarray, M., Gillwald, A., & Morrell, A. (2012). Lifting the veil on ICT gender indicators in Africa. Cape Town: Research ICT Africa and University of Cape Town.
Dighe, A. and Reddi, U. (2006). Women’s literacy and information and communication technologies: Lessons that experience has taught us. Burnaby, Canada: Commonwealth of Learning.
Diversity VC. (2017). Women in U.K. venture capital 2017. Retrieved from: http://www.diversity.vc/women-in-uk-vc/
Dryden, A. (2013). The ethics of unpaid labor and the OSS community. November 13. Retrieved from: https://www.ashedryden.com/blog/the-ethics-of-unpaid-labor-and-the-oss-community
Economist Intelligence Unit. (2018). The Inclusive Internet Index: Bridging digital divides. Retrieved from:

157
Taking Stock: Data and Evidence on Gender Digital Equality PART ONE
https://theinclusiveinternet.eiu.com/summary
Erosa, A., Fuster, L., Kambourov, G., & Rogerson, R. (2017). Hours, occupations, and gender differences in labor market outcomes (Working Paper No. 23636). National Bureau of Economic Research. Retrieved from: https://doi.org/10.3386/w23636
Ford, D., Smith, J., Guo, P. J., & Parnin, C. (2016). Paradise unplugged: Identifying barriers for female participation on Stack Overflow. Proceedings of the 2016 24th ACM SIGSOFT International Symposium on Foundations of Software Engineering (FSE 2016), 846–857. Retrieved from: https://doi.org/10.1145/2950290.2950331
Gompers, P. A., Huang, K., & Wang, S. Q. (2017). Homophily in entrepreneurial team formation (Working Paper No. 23459). National Bureau of Economic Research. Retrieved from: https://doi.org/10.3386/w23459
Gompers, P. A., & Wang, S. Q. (2017). Diversity in innovation (Working Paper No. 23082). National Bureau of Economic Research. Retrieved from: https://doi.org/10.3386/w23082
Gorbacheva, E., Beekhuyzen, J., vom Brocke, J. & Becker, J. (2018). Directions for research on gender imbalance in the IT profession. European Journal of Information Systems, DOI: 10.1080/0960085X.2018.1495893
GSMA. (2018). Connected women: The mobile gender gap report 2018. Retrieved from: https://www.gsma.com/mobilefordevelopment/wp-content/uploads/2018/04/GSMA_The_Mobile_Gender_Gap_Report_2018_32pp_WEBv7.pdf
Hewlett, S. A., & Sherbin, L. (2014). Athena Factor 2.0: Accelerating female talent in science, engineering & technology. Retrieved from: http://www.talentinnovation.org/_private/assets/Athena-2-ExecSummFINAL-CTI.pdf
Hilbert, M. (2011). Digital gender divide or technologically empowered women in developing countries? A typical case of lies, damned lies, and statistics. Women’s Studies International Forum, 34(6), 479–489. Retrieved from: https://doi.org/10.1016/j.wsif.2011.07.001
Hunt, V., Layton, D., & Prince, S. (2015). Diversity matters. McKinsey & Co. Retrieved from: https://www.mckinsey.com/~/media/mckinsey/business%20functions/organization/our%20insights/why%20diversity%20matters/diversity%20matters.ashx
ILO. (2016). Global wage report 2016/17. Retrieved from: http://www.ilo.org/global/research/global-reports/global-wage-report/2016/lang--en/index.htm
ILO. (2017a). Economic impacts of reducing the gender gap (Research brief). Retrieved from: http://www.ilo.org/global/research/publications/what-works/WCMS_577685/lang--en/index.htmILO. (2017b). World employment and social outlook: Trends for women 2017. Retrieved from: http://www.ilo.
org/global/research/global-reports/weso/trends-for-women2017/lang--en/index.htm
Institutional Shareholder Services, Inc. (2017). Gender parity on boards around the world. Retrieved from: https://corpgov.law.harvard.edu/2017/01/05/gender-parity-on-boards-around-the-world/
Kalev, A., Dobin, F., & Kelly, E. (2006). Best practices or best guesses? Assessing the efficacy of corporate affirmative action and diversity policies. American Sociological Review, 71, 589–617.
Kelley, D., Baumer, B. S., Brush, C. G., Greene, P. G., Mahnaz, M., Mahdi, M., … Dean, M. (2017). Global Entrepreneurship Monitor: Womens entrepreneurship 2016/2017 report. Retrieved from: https://www.babson.edu/Academics/centers/blank-center/global-research/gem/Documents/GEM%202016-2017%20Womens%20Report.pdf
Kuschel, K. & Lepeley, M-T. (2016). Women start-ups in technology: Literature review and research agenda to improve participation. International Journal of Entrepreneurship and Small Business, 27(2/3), pp.333–346. Retrieved from: https://www.researchgate.net/publication/288992443_Women_start-ups_in_technology_Literature_review_and_research_agenda_to_improve_participation
Lean In. (2018). How women & men are feeling after #MeToo. Retrieved from: https://leanin.org/sexual-harassment-backlash-survey-results/
Lee, M., & Huang, L. (2018). Gender bias, social impact framing, and evaluation of entrepreneurial ventures. Organization Science, 29(1), 1–16. Retrieved from: https://doi.org/10.1287/orsc.2017.1172
Let Toys Be Toys (2015). Who gets to play? What do toy ads on UK TV tell children about boys’ and girls’ play? Retrieved from: lettoysbetoys.org.uk
Liberda, B., & Zajkowska, O. (2017). Innovation and entrepreneurship policies and gender equity. International Journal of Contemporary Management, 16(1), 37–59. Retrieved from: https://doi.org/10.4467/24498939IJCM.17.002.7046
MacDougall, A., Valley, J., Adler, J., Bettel, C., Param, A., Schmidt, J., … Suppa, O. (2017). 2017 Diversity disclosure practices report: Women in leadership roles at TSX-listed companies. Osler. Retrieved from: http://www.osler.com/en/resources/governance/2017/2017-diversity-disclosure-practices-report-women
Meisksins, P., Layne, P., Beddoes, K., Masters, S., Roediger, M., & Shah, Y. (2016). Women in engineering: A review of the 2016 Literature. Society of Women Engineers. Retrieved from: https://research.swe.org/wp-content/uploads/2018/03/SWE-Lit-Review-Compilation-2017.pdf
Meiksins, P., Layne, P., Beddoes, K., Acton, B., & Lewis, M. (2018). Women in Engineering: A Review of the 2017 Literature. Retrieved from: https://research.swe.org/

158
Taking Stock: Data and Evidence on Gender Digital Equality PART ONE
literature-reviews/
Milek, A., Stork, C., Gillwald, A. (2011). Engendering communication: a perspective on ICT access and usage in Africa. info, 13(3), 125-141. Retrieved from: https://doi.org/10.1108/14636691111131493
Miller David I., Nolla Kyle M., Eagly Alice H., & Uttal David H. (2018). The development of children’s gender-science stereotypes: A meta-analysis of 5 decades of U.S. draw-a-scientist studies. Child Development, 89(6), 1943-1955. Retrieved from: https://doi.org/10.1111/cdev.13039
Molina, M., Lin, S., & Wood, C. (2015). Connected Women 2015: Accelerating the digital economy: Gender diversity in the telecommunications sector. A.T. Kearney. Retrieved from: https://www.atkearney.com/documents/10192/5580445/Connected+Women+2015-WDReport.pdf/d3c08b0a-fab6-431c-80c0-0d332b9e882d
Nafus, D. (2012). “Patches don’t have gender”: What is not open in open source software. New Media and Society, 14(4), 669–683. Retrieved from: https://doi.org/10.1177/1461444811422887
National Academy of Sciences, National Academy of Engineering, and Institute of Medicine. (2007). Beyond bias and barriers: Fulfilling the potential of women in academic science and engineering. Executive Summary. Washington, DC: The National Academies Press. Retrieved from: https://www.nap.edu/resource/11741/bias_and_barriers_summary.pdf
Owen, P. & Padron, M. (2016). The language of toys: Gendered language in toy advertisements. Journal of Research on Women and Gender, 6, 67-80
Perales, F., & Vidal, S. (2015). Looking inwards: Towards a geographically sensitive approach to occupational sex segregation. Regional Studies, 49(4), 582–598. Retrieved from: https://doi.org/10.1080/00343404.2013.786828
Ritter-Hayashi, D., Vermeulen, P., & Knoben, J. (2016). Gender diversity and innovation: The role of women’s economic opportunity in developing countries. Tilburg, Neth.: Tilburg University. Retrieved from: https://pure.uvt.nl/ws/portalfiles/portal/15156406/Policy_B
Robinson, L., Cotten, S.R., Ono, H., Quan-Haase, A., Mesch, G., Chen, W., Schulz, J., Hale T.M., & Stern, M.J. (2015). Digital inequalities and why they matter. Information, Communication & Society, 18(5), 569-582. DOI: 10.1080/1369118X.2015.1012532
Sambuli, N., Brandusescu, A., & Brudvig, I. (2018). Advancing womens rights online: Gaps and opportunities in policy and research. Washington, DC: The Web Foundation. Retrieved from: http://webfoundation.org/docs/2018/08/Advancing-Womens-Rights-Online_Gaps-and-Opportunities-in-Policy-and-Research.pdf
Sassler, S., Glass, J., Levitte, Y., & Michelmore, K. M. (2017). The missing women in STEM? Assessing gender differentials in the factors associated with transition to
first jobs. Social Science Research, 63, 192–208. Retrieved from: https://doi.org/10.1016/j.ssresearch.2016.09.014
Sassler, S., Michelmore, K., & Smith, K. (2017). A tale of two majors: Explaining the gender gap in STEM employment among computer science and engineering degree holders. Social Sciences, 6(3), 69-94. Retrieved from: https://doi.org/10.3390/socsci6030069
Smith-Doerr, L., Vardi, I., & Croissant, J. (2016). Doing gender and responsibility: Scientists and engineers talk about their work. Journal of Women and Minorities in Science and Engineering, 22(1), 49–68. Retrieved from: https://doi.org/10.1615/JWomenMinorScienEng.2016011513
State Street Global Advisors. (2018). Guidance on enhancing gender diversity on boards. Retrieved from: https://www.ssga.com/investment-goals/environmental-social-governance-esg/enhancing-gender-diversity-on-boards.html
Steiner, C. (2017, June 14). The 2017 US startup team gender diversity study. Retrieved from: https://fundersclub.com/blog/2017/06/14/2017-us-startup-team-gender-diversity-study/
Su, R., & Rounds, J. (2015). All STEM fields are not created equal: People and things interests explain gender disparities across STEM fields. Frontiers in Psychology, 6. Retrieved from: https://doi.org/10.3389/fpsyg.2015.00189
Thomas, A., Dougherty, J., Strand, S., Nayar, A., & Janani, M. (2016). Decoding diversity: The financial and economic returns to diversity in tech. Intel. Retrieved from: https://newsroom.intel.com/newsroom/wp-content/uploads/sites/11/2016/07/Diversity_report_7.7.16_web-1.pdf
UNCTAD. (2017). The gender dynamics of inclusion and exclusion: A macro perspective on employment. In: United Nations Conference on Trade and Development, Trade and development report 2017 (67–92). Retrieved from: https://doi.org/10.18356/1cef4f1d-en
US Government Accountability Office. (2017). Diversity in the technology sector. Retrieved from: https://www.gao.gov/assets/690/688460.pdf
Van der Spuy, A. and Aavriti, N. (2018). Mapping research in gender and digital technology. Association for Progressive Communications. Retrieved from: https://www.apc.org/sites/default/files/IDRC_Mapping_0323_0.pdf
Van der Spuy, A., & Souter, D. (2018). Women’s digital inclusion. Association for Progressive Communications. Retrieved from: https://www.apc.org/sites/default/files/WomensDigitalInclusion_BackgroundPaper.pdf
Wang, M.-T., Degol, J., & Ye, F. (2015). Math achievement is important, but task values are critical, too: Examining the intellectual and motivational factors leading to gender disparities in STEM careers. Frontiers in Psychology, 6. Retrieved from: https://doi.org/10.3389/

159
Taking Stock: Data and Evidence on Gender Digital Equality PART ONE
fpsyg.2015.00036
World Wide Web Foundation. (2015). Women’s rights online, translating access into empowerment. Retrieved from: http://webfoundation.org/docs/2015/10/womens-rights-online21102015.pdf
Weisgram, E., & Diekman, A. (2015). Family friendly STEM: Perspectives on recruiting and retaining women in STEM fields. International Journal of Gender, Science and Technology, 8(1), 38–45WISE. (n.d.). The Ten Steps. Retrieved from: https://www.wisecampaign.org.uk/consultancy/industry-led-ten-steps/10-steps
World Bank Group. (2018). Women, business and the law 2018 (Advance Edition). Washington, DC: World Bank. Retrieved from: https://openknowledge.worldbank.org/bitstream/handle/10986/29498/9781464812521.pdf
Xie, Y. (2006). Social influences on science and engineering career decisions. In: National Academy of Sciences (Ed.), Biological, social, and organizational components of success for women in academic science and engineering: Workshop report. Washington, DC: National Academies Press. Retrieved from: http://www.ncbi.nlm.nih.gov/books/NBK23778/

160
THE STATE OF SEX-DISAGGREGATED DATAAUTHORS: ARABA SEY, DON RODNEY JUNIO & JUHEE KANG (UNU-CS)
6

161
Taking Stock: Data and Evidence on Gender Digital Equality PART ONE
KEY FINDINGS
• There is a severe lack of official sex-disaggregated data on most ICT-related topics
• Most indicators are conceptually unclear, lack an agreed methodology, and are not regularly collected by most countries in any region or development category (less than 50% of countries, for most indicators).
• Africa, Asia and Oceania have the lowest availability of sex-disaggregated ICT data.
• Barriers to collection of sex-disaggregated data include: low data collection and analysis capacity of national statistics offices; diversity of potential issues and indicators; and lack of conceptual and definitional clarity.
6.1 / INTRODUCTION
There is a severe lack of official sex-disaggregated and gender data on most ICT-related topics, even though such data is essential for gender researchers to capture and analyse societal differences between men and women (G20, 2018; UNECE, 2010, p. 1). Considering the centrality of ICTs in modern society, sex-disaggregated data is critical for meaningful dialogue and policymaking on gender equality. Within
the United Nations and other global organisations, this challenge is receiving heightened attention, and some initiatives have been generated to address it. Examples of these are the UN’s Evidence and Data for Gender Equality (EDGE) project (launched in 2013), the World Bank’s Gender Data Portal (re-launched in 2016), GSMA’s (2018b) toolkit researching women’s internet access and use, and USAID’s Gender and ICT Survey Toolkit (Highet et al., 2018). The first two target gender indicators in general, while the latter two focus on ICT data.
Over the years, advances have been made in promoting collection of sex-disaggregated data on basic ICT access. The UN has developed four ICT access measures — proportion of adults with an account at a bank or other financial institution or with a mobile-money service provider; proportion of individuals using the internet; proportion of individuals who own a mobile telephone; proportion of households with access to mass media — which are included in its Minimum Set of Gender Indicators (UNSD, 2018). The Minimum Set of Gender Indicators categorise the prescribed indicators into three tiers, based on three criteria: conceptual clarity, established methodology, and regularity of data collection (Figure 6.1). This chapter assesses the ICT access, skills, and leadership indicators covered in this report in light of these UN criteria, summarising the extent of data collection in different world regions. Appendix A presents three detailed country profiles, based on the indicators covered in this report.
Figure 6.1UN Minimum Set of Gender Indicators – tier definitions
Source: UN Statistics Division, 2017.

162
Taking Stock: Data and Evidence on Gender Digital Equality PART ONE
Based on the UN data tiers and the availability of academic studies, most of the indicators relevant to gender digital equality fall into Tier 2 or 3 (Table 6.1). Notably, even some of the indicators classified by the UN as Tier 1 might be better classified as Tier 2 since, as demonstrated below, few countries are reporting those indicators. Data on African countries
is particularly lacking (Case Study 6.1). Research knowledge is mostly fair or poor, as much of the existing scholarly work takes the form of narrowly-scoped research concentrated in a few North American and European countries. The rest of this chapter focuses on the availability of official statistics.
Table 6.1State of data and knowledge on gender digital inequality

163
Taking Stock: Data and Evidence on Gender Digital Equality PART ONE
Case Study 6.1ICT, Gender and Data in Africa Author: Gloria Muhoro (African Development Bank)
Several studies in Africa identify lack of access to Information and Communication Technology (ICT) as a key element in women’s marginalisation (Africa Development Bank, 2015; World Wide Web Foundation, 2016; Intel, 2018). The International Telecommunications Union reports that the gender digital divide in Africa stood at 23% in 2016, meaning that women were 23% less likely than men to be online. The benefits of ICTs have thus been unevenly distributed, and women have been locked out of opportunities for jobs, growth, education, financial inclusion, and citizen advocacy, among others. Despite the potential of ICTs to catalyse women’s empowerment, as recognised in the UN Sustainable Development Goals (specifically goal 5B), the scarcity of gender data on this topic makes it difficult to fully justify the inclusion of gender issues in ICT policies, strategies, and initiatives, particularly in developing countries. This global problem is even more pronounced in Africa, where we have very little information about the situation of women and ICTs: their mobile phone and internet access and use, ICT employment, decision making, entrepreneurship, and ICT skills, and ICT policies. Sex-disaggregated data and gender indicators on ICTs are unavailable and unexplored.
Many African National Statistical Offices do not collect national ICT statistics with consistency and regularity, and rarely is the data disaggregated by sex. Telecommunication companies and national regulators provide most data on ICTs in these countries (not sex-disaggregated), mainly on connectivity. Development partners, private sector, and NGOs also provide some limited data. Data is unavailable on such gender digital divide indicators as content, education, entrepreneurship, employment, decision-making, skills, and policy.
The UN World Summit on the Information Society has affirmed the need for such data, prompting some initiatives. In Kenya, the Kenya National Bureau of Statistics publishes some key indicators measuring gender equality in ICTs: mobile phone, mobile money, and internet penetration rates. Still missing are data in other areas such as ICT employment, entrepreneurship, policy, leadership, and education.
Relevant data is often not disaggregated by sex. In Rwanda, the Ministry of Information Technology & Communications annual ICT sector profile lacks data on women and girls’ access and use of technology. This points to the need for gender sensitisation training beyond the national statistics offices to other government agencies and all institutions that provide and manage national data. Development partners and multilateral partnerships can assist in this area; civil society organisations, particularly gender equality
advocates, can pressure policy makers and national statistical offices to produce and publish accurate, relevant, and accessible sex-disaggregated data. Key areas include: access and usage, content, employment, ICT occupations, entrepreneurship, education, consideration of gender issues in national ICT policy, representation in decision-making, and the relative impact of ICT on women and men.
Realistically, it might take some time before sufficient progress is seen in this area. A first step would be collecting all available national ICT data in the context of citizen-generated data (despite its insufficiency or heterogeneity), as a basis for ongoing policy discussions initiated between civil society organisations and national statistical offices. In the medium-term, individual-level ICT questions (gender-identified) can be incorporated as a module into already existing national data collection mechanisms, such as census or labour force surveys.
Reliable, transparent and comprehensive data on how women and men engage with ICT is crucial for a better understanding of the digital divide and for governments and development partners to designand implement policies for inclusive ICT for development. Sweeping generalisations based onobservation and anecdotal evidence are of limited value. “Without data, there is no visibility; withoutvisibility, there is no priority.” Bridging the data gap on gender and ICTs is essential to bring the full benefits of the information society to both men and women, critical for the socio-economic development of Africa.

164
Taking Stock: Data and Evidence on Gender Digital Equality PART ONE
6.2 / AVAILABILITY OF SEX-DISAGGREGATED DATA ON ICT ACCESS
6.2.1 / OVERVIEW
Based on the ITU World Telecommunication and ICT Indicators database, most countries currently do not collect or share sex-disaggregated data on ICT access and basic digital skills. The proportion of countries with data on basic access ranges from 17% (mobile phones) to 46% (internet access). For the eight digital
literacy-related skills, the highest number of countries reporting any of the skills is 50 (i.e., 26% of countries worldwide); for certain skills, the number is as low as 17 countries. Data on financial inclusion are more readily available: the World Bank’s Global Findex contains data on between 142 and 144 countries for most indicators. Overall, European countries have the best data availability and African countries the least. Table 6.2 summarises the state of sex-disaggregated data on ICT access. (See Chapter 1 for a discussion of gender equality in ICT access.)
Table 6.2Status of conceptualisation and collection of sex-disaggregated data on ICT access

165
Taking Stock: Data and Evidence on Gender Digital Equality PART ONE
6.2.2 / REGIONAL SUMMARY
6.2.2.1 / Basic access
Over the years, advances have been made in defining relevant indicators to measure basic ICT access. The UN Inter-Agency and Expert Group on Gender Statistics has included internet and mobile phone use as part of the UN Minimum Set of Gender Indicators (Figure 6.2).
The inclusion of these indicators provides an impetus for UN member countries to systematically and regularly collect this data. However, although both
indicators are classified as Tier 1, the 2017 edition of the ITU World Telecommunication/ICT Indicators database shows that several member countries do not collect this data (Table 6.3). Even for countries where data is available, the absence of longitudinal data inhibits identification of trends. Moreover, different organisations use different methodologies to collect data (or calculate estimates in the absence of official data). As a result, different organisations show inconsistent estimates of the gender digital divide, which may impact the way policy targets are framed
(A4AI, 2018).
Figure 6.2UN Minimum Set of Gender Indicators: Internet and mobile phone use

166
Taking Stock: Data and Evidence on Gender Digital Equality PART ONE
Table 6.3Number of countries sharing sex-disaggregated data on selected basic access indicators
Source: ITU WTI Database, 2017.
Beyond ITU, no other organisations regularly collate sex-disaggregated data on basic ICT access at a global scale. However, other organisations attempt to fill the data gap by collecting data at a smaller scale. For example, data in the Mobile Gender Gap Report 2018 came from the GSMA Intelligence Consumer Survey 2017, a nationally representative survey of 23 low- and middle- income countries that covers over 73% of the adult population in those countries. This is one of the more visible demand-side data collection and aggregation efforts in recent years; however, access to that data is currently limited to what is presented in the report. Other sources of data include EUROSTAT, OECD, GSMA, and the World Values Survey.
Research institutions such as LIRNEAsia, Research ICT Africa (RIA), and Dialogo Regional sobre Sociedad de la Informacion (DIRSI) have also pioneered data collection on basic access and other aspects of ICT use in developing countries, using demand-side, nationally representative samples. (See Part II Chapter 2 for a discussion of the gender digital gap in the Global South). These initiatives, however, are limited in scale and geographical focus. More recently, researchers are exploring innovative ways to address data gaps, such as collecting data from non-traditional sources (Case Study 6.2)

167
Taking Stock: Data and Evidence on Gender Digital Equality PART ONE
Case Study 6.2Measuring Gender Digital Inequality with Web Data Author: Ridhi Kashyap (University of Oxford) and Ingmar Weber (Qatar Computing Research Institute)
Reducing gender inequalities in internet access and mobile phone ownership, along with improving digital literacy, have been recognised as important development targets within the UN Sustainable Development Goals (SDGs) framework. Tracking progress on gender digital inequalities is challenging, however, due to limited gender-disaggregated data, especially in less-developed country contexts. With support from Data2X (an initiative of the United Nations Foundation), and as a part of Data2X’s “Big Data for Gender Challenge”, we have been exploring the use of data obtained from social media advertising application programming interfaces (APIs) to generate real-time measures of gender digital inequality (http://data2x.org/big-data-challenge-awards/#digital).
As outlined in a recently published study in World Development, we leveraged Facebook’s advertisement audience estimates (available from the platform’s marketing API) to generate measures of gender gaps in internet and mobile phone access in a global perspective (Fatehkia, Kashyap, & Weber, 2018). These Facebook advertising audience estimates are publicly-accessible, allowing advertisers, or any user with a Facebook account, to query aggregate numbers of Facebook users by various geographic and demographic attributes such as age, gender, and device type. By providing aggregate data across different attributes for the platform’s over 2 billion users, the data serve as a kind of digital census of Facebook users that can be valuably repurposed for social research.
We used the Facebook data to generate a “Facebook Gender Gap Index”, an indicator of the ratio of female to male Facebook users in a given country. While the Facebook Gender Gap Index does not represent internet access per se, we found it to be highly correlated with official statistics on internet gender gaps (from the International Telecommunications Union or ITU) and mobile phone gender gaps (from the GSMA), for countries where data are available. The Facebook Gender Gap Index captured gender inequalities in internet access in less developed countries, where access to the internet is most unequal by gender.
We used these Facebook indicators to predict internet and mobile gender gaps found in official statistics, and then compared the performance of models using the Facebook indicators with two other types of models: 1) models using offline variables linked to a country’s development (e.g., GDP per capita) or to the broader gender divide (e.g., gender gaps in literacy); and 2) models combining online Facebook variables with
offline ones. For internet gender gaps, we found that models using Facebook data did better than those using offline indicators alone. As shown in Figure 6.3 panel (b), using Facebook data, we were able to significantly expand geographical coverage to of internet and mobile gender gap indicators compared to available statistics in the ITU database (as shown in Figure 1 panel (a), with the biggest gains for less developed countries. Higher values in the figure show greater levels of gender equality, with 1 indicating complete parity.
With help from our Data2X grant, our team has developed an online platform (www.digitalgendergaps.org) where we will release regularly updated measures of gender gaps in internet and mobile phone access across the world based on the approach described above. Ad audience estimates, like the ones we have described above, are available from most large web and social media platforms (e.g. Twitter, Google), and in ongoing work we are exploring the potential of applying our general approach to capture other forms of gender inequality, such as in education, digital literacy, and occupations.

168
Taking Stock: Data and Evidence on Gender Digital Equality PART ONE
Figure 6.3The internet gender gap index: proportion of female population with internet access divided by proportion of male population with internet access
Figure 6.3aModeled using ITU ground truth data
Figure 6.3bModeled using Facebook gender gap index
Source: Fatehkia, Kashyap and Weber (2018).Note: Results were computed by (a) using ITU ground truth data, and (b) using Facebook18+ user gender gap index. Higher values indicate greater gender equality.

169
Taking Stock: Data and Evidence on Gender Digital Equality PART ONE
Source: World Bank Global Findex Database, 2017.
6.2.2.2 / Use of digital financial services
The World Bank’s Global Findex covers a number of digital financial inclusion indicators across all world regions (Table 6.4). The only exception is use of mobile money; that data is mostly limited to developing countries, where mobile money is more widely used.
Table 6.4Number of countries covered in Global Findex indicators
6.3 / AVAILABILITY OF SEX-DISAGGREGATED DATA ON ICT SKILLS
6.3.1 / OVERVIEW
As with basic digital literacy, there is a lack of internationally comparable data that comprehensively measures advanced digital skills. ITU’s indicator on the proportion of a population that can write a computer programme has data for only 49 countries. OECD’s Survey on Adult Skills includes a test-based measure of ICT skills for problem-solving, but the data is limited to 36 (mostly European) OECD countries. In general, high-level digital skills are estimated via a proxy of
qualifications indicating formal education or training in ICT or STEM specialisations, mainly from the UNESCO Institute of Statistics (UIS). Data is particularly lacking on alternative pathways to advanced digital skills. Following the trend for data on ICT access, Europe has the most data coverage, followed by Asia; data from Africa is sparse. Table 6.5 summarises the state of data on ICT skills. (See Chapter 2 for discussion of gender equality in ICT skills.)

170
Taking Stock: Data and Evidence on Gender Digital Equality PART ONE
Source: World Bank Global Findex Database, 2017.
Table 6.5Status of conceptualisation and collection of sex-disaggregated data on ICT skills

171
Taking Stock: Data and Evidence on Gender Digital Equality PART ONE
6.3.2 / REGIONAL SUMMARY
6.3.2.1 / Basic digital literacy
Over the years, advances have been made in defining Despite being the main data repository for ICT data, including basic digital skills, ITU’s indicators measuring basic digital literacy suffer from lack of coverage. As seen in Table 6.6, few countries (especially in Africa and Asia) shared relevant data for the period 2014–2016.
Even among the countries that have shared data on basic ICT skills, only nine have data for all the skills ITU monitors (Table 6.7). Furthermore, the data should be interpreted with care, since data collection methodologies are unclear and the reliability of the data is therefore not certain.
Source: ITU WITD Database, 2017.
Table 6.6Number of countries covered in ITU sex-disaggregated data on basic digital skills

172
Taking Stock: Data and Evidence on Gender Digital Equality PART ONE
Source: ITU WITD Database, 2017.
Table 6.7Countries with sex-disaggregated data on all eight ITU digital skills
6.3.2.2 / Advanced skills
As discussed in Chapter 2, digital skills are often measured by self-reported surveys on the range of ICT activities performed by users. Beyond basic skills, there is a lack of internationally comparable data measuring a comprehensive set of advanced digital skills —
especially for Africa, the Americas and Oceania. For example, of the 49 countries reporting the number of people who can write a computer program, only three are in Africa, two are in Latin America, and none are in the Oceania region (Table 6.8).

173
Taking Stock: Data and Evidence on Gender Digital Equality PART ONE
Table 6.8Number of countries covered in ITU and OECD data on advanced ICT skills
6.3.2.3 / STEM Education
The UNESCO Institute of Statistics (UIS) produces annual globally-comparable data on education, collected from national ministries of education. UIS emphasises the importance of gender equality in education and STEM education, as evidenced in its recent programme on STEM and Gender Advancement (SAGA, https://en.unesco.org/saga). Most UIS data on enrolments and graduates are broken down by gender as well as field of study, including some specific STEM or ICT-related majors.
While the coverage of UIS sex-disaggregated data on school enrolment is relatively comprehensive, the number of reporting countries gradually decreases; most report on primary education (167) and least on tertiary education (123). The data coverage is even less complete for female students’ majors in higher education. Combining both 2015 and 2016 data, only 96 out of 195 countries reported the female share of students graduating with an ICT specialisation (Table 6.9). Furthermore, it is difficult to assess the data quality and accuracy for reporting countries.
Table 6.9Status of sex-disaggregated data on general and ICT education, no. of countries reporting
Source: UNESCO Institute of Statistics, 2015-2016.

174
Taking Stock: Data and Evidence on Gender Digital Equality PART ONE
Case Study 6.3Tracking data on female programmers in Argentina Authors: Romina Colman, Cecilia Vazquez, Carolina Hadad, Mariana Varela, Yanina Paparella, and Melina Masnatta (Chicas Tecnologia)
Introduction. The non-profit organisation Chicas en Tecnología has been developing a range of programmes to bridge the gender digital gap by fostering knowledge and enthusiasm of young women in science, engineering, and technology. We are also creating a database to gather information on the professional profile of the population to inform public policymaking, collaborating with stakeholders who can provide (or facilitate access to) relevant data.
Methodology. Over a four-month period we collected information on new enrolments, re-enrolments, and graduations in 73 programming courses of studies between 2010 and 2015, at 84 public and private universities and university institutes. Surveys were done to gather profiles of women working in programming in Argentina’s public organisations and major companies in the programming field. The Argentine Department of Production’s 111 Mil Plan and Aprendé Programando, both governmental initiatives, were also analyzed. Buenos Aires City and national governmental organisations provided data about the country’s universities, the university institutes and the two public programs chosen. In some cases, the educational institutions were contacted directly. A media advisory and dissemination strategy for social networks was implemented in order to encourage participation of companies and institutions. The data-tracking was carried out in association with Medallia.
Main findings
1. Although women outnumber men overall in new enrolments, the share of female enrolments in programming courses of studynever exceeded 17%. Between 2010 and 2014, five men were enrolled for every woman, and in 2015 (the year with the most female enrolments in Argentine universities), the male-to-female ratio increased to six to one.
2. The programs with the strongest presence of women were University Associate Technical Degree in Web Programming (38.5%) and University Associate Technical Degree in IT (35.3%). The programs with the lowest female presence was University Associate Technical Degree in Video-Game Development (5.5%).
3. The greatest number of females graduated in Information Systems Engineering (1,027, or 23%), followed by University Associate Degree of Systems Analyst (362, or 8%) and IT Engineering (321, or 7%).
4. A high percentage of companies refused to open data on gender distribution, but they all wanted to know the results of the survey. Among the 40% who shared data, only 13 had half their technical positions held by women. In 13 of the 78 organisations, men held more than 90% of technical positions, and four had no women in technical jobs. Most women work in Software Development profiles, and very few in Software Quality profiles.
5. There has been a significant increase in governmental strategic actions and promotion of studies in technological areas.
Challenges
• Some institutions lacked specific guidelines for public requests.
• Data had to be matched with established categories.
• Sex-disaggregated data for some years and institutions was not available, especially for new programmes.
• Different programme naming conventions, as well as variations in the graduate profile and teaching approach, make comparison difficult.
• Some documents, e.g., pdf files, were impossible to analyze as they could not be manipulated or modified. (Aprendé Programando initiative was not included in the final report, because the City Government did not provide the data in an open format.)
Recommendations
• Analyze the 111 Mil Plan activities and participants’ motivations, to discover why the enrolments are almost double that of new female enrollments in programming-related courses.
• Compare female enrolments in programming courses to those in other fields.
• Analyze sex-disaggregated data on Master and Ph.D. degrees in Argentina to compare with undergraduate enrollments.
• Find out if any governmental statistics system has sex-disaggregated data on faculty of associate and undergraduate programs.
• Introduce legislation that requires companies to open data, especially on issues related to gender distribution in roles, salaries, career development, etc.
The Chicas in Tecnología database will be open and publicly accessible: http://mujeresprogramadoras. chicasentecnologia.org/
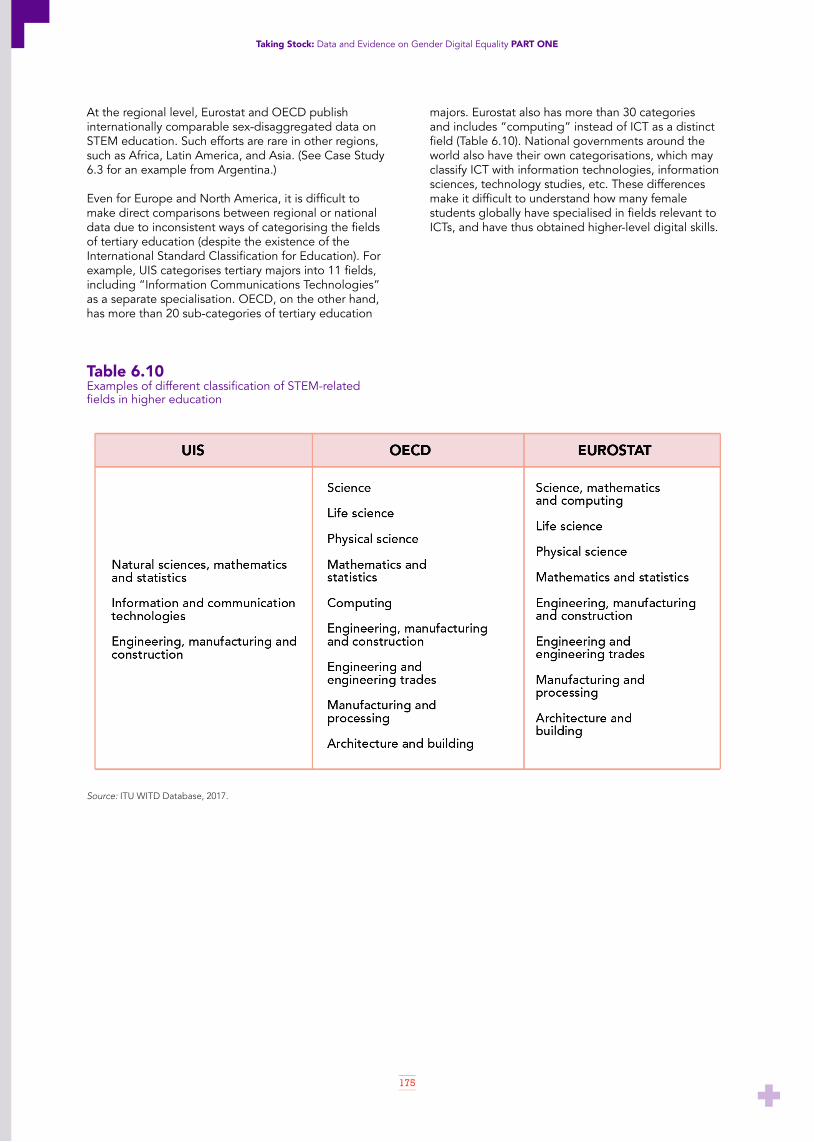
175
Taking Stock: Data and Evidence on Gender Digital Equality PART ONE
Source: ITU WITD Database, 2017.
Table 6.10Examples of different classification of STEM-related fields in higher education
At the regional level, Eurostat and OECD publish internationally comparable sex-disaggregated data on STEM education. Such efforts are rare in other regions, such as Africa, Latin America, and Asia. (See Case Study 6.3 for an example from Argentina.)
Even for Europe and North America, it is difficult to make direct comparisons between regional or national data due to inconsistent ways of categorising the fields of tertiary education (despite the existence of the International Standard Classification for Education). For example, UIS categorises tertiary majors into 11 fields, including “Information Communications Technologies” as a separate specialisation. OECD, on the other hand, has more than 20 sub-categories of tertiary education
majors. Eurostat also has more than 30 categories and includes “computing” instead of ICT as a distinct field (Table 6.10). National governments around the world also have their own categorisations, which may classify ICT with information technologies, information sciences, technology studies, etc. These differences make it difficult to understand how many female students globally have specialised in fields relevant to ICTs, and have thus obtained higher-level digital skills.

176
Taking Stock: Data and Evidence on Gender Digital Equality PART ONE
6.3.2.4 / Student performance and learning experiences
Most of the international data on ICT education focuses on enrolment or graduation levels. There is a lack of globally-comparable data on quality of education — student performance, learning experiences, motivation, aspiration, or discrimination. Assessing these measures would involve using various psychometric measures. PISA (Programme for International Student Assessment) and TIMSS (Trends in International Mathematics and Science Study) provide data on student performance and learning experiences at the secondary education level. Although the PISA is governed by the OECD, its
participant countries include non-OECD economies; in 2015, over half a million students participated, from 72 countries representing several regions (Table 6.11). TIMSS is an international assessment of mathematics and science at the fourth and eighth grades that has been conducted every four years since 1995. In 2015, 57 countries participated, with relatively higher representation for Europe and Asia while other regions had low participation.
*Surveys on student learning experiences (sex-disaggregated data).
Table 6.11Number of countries covered in PISA and TIMSS surveys*
6.4 / AVAILABILITY OF SEX-DISAGGREGATED DATA ON ICT LEADERSHIP
6.4.1 / OVERVIEW
As discussed in Chapter 3 on leadership, both practical and conceptual issues complicate collection of gender-disaggregated, industry-specific data on ICT. The primary source of global occupational data, the International Labour Organisation (ILO), includes some breakdowns by gender, sector, and occupation, its classification systems — as well as the quantities and types of data available — obscure the actual levels of gender participation in the ICT industry. Furthermore, some major countries such as the United States and Canada are generally not covered in the ILO databases. Some other global and regional organisations, such as the World Bank, UNESCO, OECD, and the Inter-Parliamentary Union, are alternative sources for some of the relevant data.
However, for several of the pertinent issues covered in this report, there are no official internationally comparable statistics. For example, while the ILO has good data coverage on female employment by skill level, this is not broken down by industry. Reports such as McKinsey’s annual Women in the Workplace tend to have limited industry breakdown at best, and usually do not have an international focus. Table 6.12 summarises the state of data availability on issues related to women in ICT leadership. (See Chapter 3 for discussion of gender equality in ICT leadership.)

177
Taking Stock: Data and Evidence on Gender Digital Equality PART ONE
Table 6.12Status of conceptualisation and collection of sex-disaggregated data on ICT leadership

178
Taking Stock: Data and Evidence on Gender Digital Equality PART ONE
6.4.2 / REGIONAL SUMMARY
6.4.2.1 / Employment
For the few ICT occupation indicators in ILO datasets, European countries tend to have the most data (Table 6.13). In North America, the U.S. and Canada track their own data quite extensively. Ffor example, the U.S. National Science Foundation and the Bureau of Labour Statistics compile detailed occupational data, often
disaggregated by sex. Reasons for data scarcity are similar to those for other topics: institutional capacity, lack of interest, definitions of ICT occupations, and lack of a common methodology. One notable effort to address this data challenge is the UC Berkeley Women in Technology initiative to encourage technology companies to adopt and collect a set of common indicators tracking women’s entry into and pathways through ICT jobs.
Table 6.13Status of sex-disaggregated, internationally comparable data on ICT employment (no. of reporting countries)

179
Taking Stock: Data and Evidence on Gender Digital Equality PART ONE
At the heart of the difficulty of tracking women’s participation in the ICT industry is the continually evolving nature of the industry, the diversity of occupations that could be classified as ICT jobs, the use of different measurement and classification approaches, and the lack of a central repository with comprehensive, internationally comparable data on this topic. Without a clearer view of the range of possible ICT occupations within and outside the ICT industry, and without common measurement and classification standards, it is difficult to come to definitive conclusions about the degree of female marginalisation in ICT employment. Furthermore, in most parts of the world it is nearly impossible to understand how gender equality in ICT leadership is changing (for better or for worse), because there is limited trend data.
6.4.2.2 / Entrepreneurship
None of the entrepreneurship-related data presented in this report is specific to the ICT industry. Even general entrepreneurship data is limited or non-existent for most countries (Table 6.14). In seeking insights on women’s ownership of ICT firms, or on their access to business and finance opportunities in ICT, at present one can only make extrapolations from data on entrepreneurship in general. The Global Entrepreneurship Monitor (GEM), which has some analyses by gender as well as by ICT industry, does not break down by gender within the ICT industry. It also does not cover all countries: the last three GEM reports included 60 or fewer countries (Global Entrepreneurship Research Association, 2016, 2017, 2018, https://www.gemconsortium.org).
Table 6.14Status of sex-disaggregated data on ICT entrepreneurship
Source: World Bank Enterprise Surveys, 2017; Global Findex, 2017.
6.4.2.3 / Policymaking
The Inter-Parliamentary Union (IPU) is one of the main repositories of regularly updated statistics on women’s participation in national governance. Almost all countries are represented in their datasets, covering the
number of seats women hold in parliamentary bodies (Table 6.15). No agency currently monitors women’s participation in ICT-related regulatory and policy making institutions.

180
Taking Stock: Data and Evidence on Gender Digital Equality PART ONE
Table 6.15Status of sex-disaggregated data on ICT policymaking
Source: Inter-Parliamentary Union (2018), ipu.org.
6.5 / AVAILABILITY OF SEX-DISAGGREGATED DATA ON THE DARK SIDE OF ICTS
6.5.1 / OVERVIEW
Globally, data is not systematically collected on most gender issues related to the dark side of the digital age. The majority of indicators identified so far are conceptually unclear, lack an established methodology, or are not regularly collected by countries. There is also limited rigorous qualitative or quantitative research on a wide range of issues and contexts, such as negative and unintended consequences of gender-based initiatives. Table 6.16 summarises the state of data on the dark side of ICT access, skills, and leadership. (See Chapter 4 for a discussion of the dark side of ICTs.)

181
Taking Stock: Data and Evidence on Gender Digital Equality PART ONE
Table 6.16Status of sex-disaggregated data on the dark side of ICTs
* In this case, the number of countries for which data is available on whether the country has legislation on the issue.** World Bank
6.5.2 / REGIONAL SUMMARY
6.5.2.1 / General discrimination and gender-based violence
The broader environment of physical (IP and non-IP) VAWG can serve as possible proxy indicators of the extent of the dark side of ICTs. In general, data on the existence of pertinent legislative protection is more available than data on the actual incidence of discrimination or violence (Table 6.17).

182
Taking Stock: Data and Evidence on Gender Digital Equality PART ONE
Table 6.17Status of sex-disaggregated data on general discrimination and sexual harassment (no. of countries reporting)
Source: World Bank; UNSTAT/UN Women. *In this case, the number of countries for which data is available on whether the country has legislation on the issue.
For non-IP violence, the most recent data available for any country is from 2014; for some countries, the most recent data is more than a decade old (from as far back as 2000; Table 6.18). For both intimate and non-IP violence indicators, only one country has reported at
least two data points over the last five years (Finland, for 2013 and 2014). Since 1995, only some 40 countries have conducted more than one survey on violence against women (UNSTAT, 2018).
Table 6.18SDG indicators related to violence against women and girls
Source:United Nations Statistics Division, 2018.
According to UNSTAT (2018), the availability of comparable data remains a challenge for several reasons: different survey methodologies and survey question formulations; uneven data collection efforts; different definitions of partner or spousal violence; lack of an internationally-agreed standard; and different categorisation of sexual violence by non-partners and forms of violence. Efforts to solve this problem include the creation of an Inter-Agency Group on Violence against Women Data, with a Technical Advisory Group (established jointly by WHO, UN Women, UNICEF, UNSD, and UNFPA), to establish a mechanism for compiling harmonised country level data (UNSTAT, 2018).
6.5.2.2 / Cyber violence against women and girls
Accounting for instances of technology-enabled gender-based violence (GBV) is complicated; currently, no single measure adequately captures its intricacies. Codifying and translating the various notions of cyber VAWG into measurable indicators remains a major challenge, as such data are not yet systematically collected and shared. While existing tools such as the Cyber Psychological Abuse Scale and the Revised Cyber Bullying Inventory provide tangible methods,

183
Taking Stock: Data and Evidence on Gender Digital Equality PART ONE
they are limited in the sense that they measure specific cases of technology-enabled GBV and have been tested mostly in developed-country settings (Hinson et al., 2017).
Stakeholders have started laying the groundwork for developing valid and reliable measures of technology-facilitated GBV. For example, the World Bank Group and the Sexual Violence Research Initiative have engaged the Centre for Research on Women to develop a way to measure technology-facilitated GBV on a global scale (Hinson et al., 2017); while the European Institute for Gender Equality (EIGE) is advancing data collection and research agendas to improve knowledge on GBV in the EU.
6.5.2.3 / Workplace discrimination and work-life issues
As with general GBV discrimination, the most comprehensive data available on workplace discrimination and work/life issues relates to the policy environment, while data on other aspects is sparse (Table 6.19). Much of the available information on topics such as average earnings and mean hours of work relate to general labour trends — not specific to the ICT or technology industry — and it is not regularly collected or shared in most countries. While a few national and regional studies touch on some of these topics (e.g., Cutean & Ivus, 2017 on Canada; EIGE, 2018; other ongoing Europe-based research), there is currently no resource systematically tracking the types and extent of gender-based discrimination or related challenges within the ICT industry at a global level.
Table 6.19Status of sex-disaggregated data on the work-related dark side of ICTs
*Number of countries for which data is available on whether the country has legislation on the issue.

184
Taking Stock: Data and Evidence on Gender Digital Equality PART ONE
6.6 / POTENTIAL OF BIG DATA
The last decade has seen an exponential increase in the amount of digital data produced and captured. “Big data” is an umbrella term used to define large amounts of data generated as a by-product of our interaction with information-sensing devices and services, including mobile phones and social media. The large quantity of data produced, coupled with new approaches to analyzing these datasets, provide opportunities to reexamine social issues such as gender digital divides (Case Study 6.2, above). A 2018 report by UN Women, Gender Equality and Big Data, outlines a range of ways big data techniques are being used globally, highlighting successes and challenges entailed in the use of big data to improve the lives of women and girls. In this regard, organisations have started offering incentives to promote innovative thinking
around the use of big data to fill gender data gaps. For example, Data 2x has awarded grants to projects that use mobile phone data to measure gender digital divides and assess financial inclusion.
The use of big data is not without risks and limitations. Issues related to privacy as well as access to key datasets are challenges that need to be addressed. In most cases, big data repositories are owned by private organisations, such as telecom operators and banks, that may be constrained in the type of data they can or are willing to share. Even when the data itself is free, the analytical tools and expertise needed to derive insights from the data could make the effort prohibitively expensive (UN Women, 2018). Another problem with using big data to understand gender issues is that it ignores women who are not online, not using mobile phones, or not generating the online trails or features that can be captured by existing methodologies. Case Study 6.4 details some limitations of gender disambiguation methodologies.

185
Taking Stock: Data and Evidence on Gender Digital Equality PART ONE
Case Study 6.4Gender in the Global Research Landscape Gender Disambiguation Methodology Authors: Sarah Huggett (Elsevier)
Analysing critical issues related to gender disparity and bias require high-quality global data sources and analytical expertise. Elsevier (2017) has implemented an evidence-based examination of gender-relevant research worldwide in our report, “Gender in the Global Research Landscape” (https://www.elsevier.com/research-intelligence/campaigns/gender-17).As a proxy for researchers, we compiled authors of relevant publications (as indexed in Scopus®, Elsevier’s indexing and abstracting database covering over 22,500 journals (https://www.elsevier.com/solutions/scopus). In addition to indexing scholarly output, Scopus indexes authors with an associated unique identifier. This identifier groups together all the documents published by an author, matching alternate spellings and variations of the author’s name and distinguishing between authors with the same name by using data elements associated with their publications.
We combined Scopus data with other data sources to identify gender and country. We gather each author’s list of papers in his or her first year of publication in Scopus, and then derive their country of origin based on the affiliations listed in their papers. (Author profiles without a first name, or with equal numbers of papers in two or more countries, are excluded from the gender disambiguation analysis.)
Genderise.io uses data from social media platforms to provide lists of first names as well as the number of people with this first name that are (self-reportedly) women or men in a given country. We use these lists to calculate the probability that each author’s first name is feminine or masculine in the author’s country of origin. An author’s name needs to have appeared at least five times in the Genderize.io data and the probability that the name associates with a specific gender needs to be at least 85% for us to assign a gender to an author.
We utilise a second data source, NamSor™ Applied Onomastics, that uses sociolinguistic characteristics to mine Big Data sources with its name recognition software. It assigns a gender probability for a given name depending on the individual’s location.
The use of Genderize.io and NamSor tends to work well for authors from Western countries or with Latin or Anglophone names. However, these methodologies are not sufficient for robustly determining the gender of names of authors of African, Arabic, or Asian descent. So, we use a third source for gender disambiguation of author names from Japan: a set of the most common masculine and feminine names from Wikipedia, also used by Larivière et al. (2013).
Gender disambiguation based on author’s first name and country of origin presents challenges, especially for names originally written in non-Roman alphabets or languages using different character sets. The issue is particularly prominent for tonal languages such as Chinese; as the tone is lost in the transliteration, it becomes impossible to distinguish between masculine and feminine names.
186
Taking Stock: Data and Evidence on Gender Digital Equality PART ONE
6.7 / CONCLUSION
There is a serious lack of official statistics on most topics related to gender equality in ICT access, skills, and leadership. This data deficiency exists for most countries and is worst for the developing world. Coverage is best for ICT access, but even here we find large gaps. Where data are available, quality, reliability, and comparability are often issues of concern. Furthermore, an absence of longitudinal data inhibits insights into trends. Factors limiting the collection and usefulness of data include low data-gathering and analysis capacity of both public and private entities in most countries, as well as a diversity of potential indicators, definitions, and data collection methodologies that constrain international comparability.
The paucity of adequate data impedes policy makers from identifying good practices, benchmarking programme effectiveness, and making evidence-based decisions. Not surprisingly, therefore, most recommendations on closing gender digital divides stress the need to collect gender-disaggregated data and improve measurement tools. Such data needs to be routinely collected, analysed, and disseminated. Both supply-side and demand-side data are important in bridging knowledge gaps about the information lives of women. Demand-side data (such as GSMA’s 2018a Global Consumer Survey and the “After Access” surveys, discussed in Part II Chapter 2) provide insights on users’ characteristics, preferences, and habits. However, collecting global demand-side data especially at a global scale is an expensive exercise that is often spearheaded by private sector players, with their own commercial motivations and proprietary interest in keeping the data they collect confidential.
In addition, in-depth research is needed to surface and illuminate issues that may be unique to women (e.g., breastfeeding at work) or that may have invisible gender-based dimensions (e.g., owning a phone versus having control over use of the phone). These types of insights will be best generated through carefully designed studies drawing on multiple research disciplines. Efforts should be directed not only towards identifying and standardising indicators that can capture diverse aspects of ICT access, but also making the data collected openly available.
REFERENCES
A4AI. (2018). Measuring the digital divide: Why we should be using a women-centered analysis. Retrieved from: http://a4ai.org/measuring-the-digital-divide-why-we-should-be-using-a-women-centered-analysis/
Africa Development Bank. (2015). Gender Equality Index. Retrieved from: https://www.afdb.org/fileadmin/uploads/afdb/Documents/Publications/African_Gender_Equality_Index_2015-EN.pdf
Cutean, A., & Ivus, M. (2017). The digital talent dividend: Shifting gears in a changing economy. Ottawa, Canada: Information & Communication Technology Council (ICTC). Retrieved from: https://www.ictc-ctic.ca/wp-content/uploads/2018/01/ICTC-Report_The-Digital-Talent-Dividend-FINAL-ENGLISH-1.30.18.pdf
EIGE. (2018). Women and men in ICT: A chance for better work-life balance. Research note to support the Bulgarian presidency. Retrieved from: https://www.mlsp.government.bg/ckfinder/userfiles/files/politiki/ravni%20vyzmojnosti/publikacii/SUMMARY_EIGE_research%20note_ENG.pdf
Elsevier. (2017). Gender in the global research landscape. Retrieved from: https://www.elsevier.com/research-intelligence/campaigns/gender-17
European Commission. (2015). She figures. Retrieved from: https://ec.europa.eu/research/swafs/pdf/pub_gender_equality/she_figures_2015-final.pdf
Fatehkia, M., Kashyap, R., & Weber, I. (2018). Using Facebook ad data to track the global digital gender gap. World Development, 107, 189-209. Retrieved from: http://dx.doi.org/10.1016/j.worlddev.2018.03.007
Global Entrepreneurship Research Association. (2016). Global entrepreneurship monitor 2015/16. Retrieved from: https://www.gemconsortium.org/report/49480
Global Entrepreneurship Research Association. (2017). Global entrepreneurship monitor 2016/17. Retrieved from: https://www.gemconsortium.org/report/49812
Global Entrepreneurship Research Association. (2018) Global entrepreneurship monitor 2017/18. Retrieved from: https://www.gemconsortium.org/report/50012
GSMA. (2018a). Connected women, methodology: The mobile gender gap report 2018. Retrieved from: https://www.gsma.com/mobilefordevelopment/wp-content/uploads/2018/04/GSMA-The-Mobile-Gender-Gap-Methodology-Report-2018_20pp_WEB.pdf
187
Taking Stock: Data and Evidence on Gender Digital Equality PART ONE
GSMA. (2018b). A toolkit for researching women’s internet access and use. Retrieved from: https://www.gsma.com/mobilefordevelopment/wp-content/uploads/2018/05/GSMA-Women-and-Internet-Research-Toolkit_WEB.pdf
Highet, C., Skelly H., Tyers, A. (2017). Gender and information communication technology survey toolkit. Washington, DC: USAID. Retrieved from: https://www.usaid.gov/sites/default/files/documents/15396/Gender_and_ICT_Toolkit.pdf
Hinson, L., Mueller, J., O’Brien-Milne, L. (2017). Cyber violence: Disrupting the intersection of technology and gender-based violence. Washington, DC: World Bank. Retrieved from: http://blogs.worldbank.org/voices/cyber-violence-disrupting-intersection-technology-and-gender-based-violence
Intel. (2018). Women and the web report. Retrieved from: https://www.intel.com/content/dam/www/public/us/en/documents/pdf/women-and-the-web.pdf
Larivière, V., Ni, C., Gingras, Y., Cronin, B., & Sugimoto, C.R. (2013). Bibliometrics: Global gender disparities in science. Nature, 504(7479), 211-213. Retrieved from: http://dx.doi.org/10.1038/504211a
McKinsey. (2014). Offline and falling behind: Barriers to internet adoption. Retrieved from: http://www.mckinsey.com/Insights/High_Tech_Telecoms_Internet/Offline_and_falling_behind_Barriers_to_Internet_adoption
New York Academy of Sciences (n.d.). 1000 girls 1000 futures. Retrieved from: https://www.nyas.org/programs/global-stem-alliance/1000-girls-1000-futures/
UNCTAD (2015). Global assessment of sex-disaggregated ICT employment statistics: Data availability and challenges on measurement and compilation. UNCTAD Technical Notes on ICT for Development, No. 4. Retrieved from: https://unctad.org/en/PublicationsLibrary/tn_unctad_ict4d04_en.pdf
UNECE (United Nations Economic Commission for Europe). (2010). Developing gender statistics: A practical tool. Retrieved from: http://www.unece.org/fileadmin/DAM/stats/publications/Developing_Gender_Statistics.pdf
UNESCO. (2017). Gender and science. Retrieved from: http://www.unesco.org/new/en/natural-sciences/priority-areas/gender-and-science/improving-measurement-of-gender-equality-in-stem/stem-and-gender-advancement-saga/
UNSD. (2017). Minimum set of gender indicators. Retrieved from: https://genderstats.un.org/#/home
United Nations Statics Division (UNSTAT). (2018). Metadata 05-02-01. Retrieved from: https://unstats.un.org/sdgs/metadata/files/Metadata-05-02-01.pdf
World Wide Web Foundation. (2016). Women’s rights online digital gender gap audit. Retrieved from: https://webfoundation.org/research/digital-gender-gap-audit/

188
Taking Stock: Data and Evidence on Gender Digital Equality PART ONE
APPENDIX A: COUNTRY PROFILESAUTHORS: LISANDRA FESALBON, DON RODNEY JUNIO & ARABA SEY, WITH BEI JU (UNU-CS)
INTRODUCTION
The digital gender divide manifests in different ways. Across different countries, varying local institutional constraints and endowments including culture, legal framework, and resources help shape the ways women and girls are disadvantaged in their access and use of digital technologies or their meaningful participation in the digital economy. In a way, no two gender digital divides look alike.
While the main report looks at the digital gender divide at the global scale, this appendix views the issues at the country level. What does gender digital inequality look like in different countries?
Three countries from three different geographical regions (Africa, the Americas, and Asia Pacific) were selected to illustrate how gender digital divides play out in various contexts. Aside from geographical diversity, one of the main considerations in selecting a country to profile was to select a country where EQUALS coalition members had indicated plans to work on the ground. In this regard, Argentina, Indonesia, and Rwanda were chosen for the case studies. These countries provide an interesting study of contrast regarding the state of gender digital inequality in different parts of the world.
Argentina is one of the few countries where public-private sector commitment to narrow the gender gap has resulted in tangible outcomes. The data bear this out: the case study of Argentina illustrates a situation where the digital gender divide is narrowing or even approaching parity on some indicators. As the head of the G20 in 2018, Argentina has prioritised gender digital equality ( https://responsiblefinanceforum.org/wp-content/uploads/2018/01/GPFI-Argentina-Priorities-Paper-2018.pdf)
Indonesia is one of the largest countries in Asia and the Pacific in terms of population and economy. It is also one of the most dynamic markets for ICTs, with mobile phone diffusion reaching 174 per 100 inhabitants. However, gender digital inequality remains substantial owing to many problems including its geographical size and the gender divide in access to education. This gender divide goes beyond ICT access, skills, and leadership issues. The issue cuts across the Indonesian society despite a strong top-down political commitment to address the problem such as by establishing a full ministry in charge of women’s empowerment.
Among the three countries profiled in this report, Rwanda ranks the highest in the Gender Gap Report of the World Economic Forum ranking 4th out of 144 countries. However, indicators relevant to ICT access and skills still show substantial gap in women’s access vis-à-vis men. Women lag substantially behind men in educational attainment which would affect women’s participation in the country’s nascent ICT sector.
By examining local data and resources where available, these country profiles provide a broad overview of gender digital inequality across a broad spectrum of cases: where substantial progress has been made in addressing gender digital divides (Argentina); where the issue persists despite a dynamic ICT market (Indonesia); and where the problem remains substantial despite having high gender equality in other areas (Rwanda). To be sure, these examples are but some of the many forms that the problem of gender digital inequality can take. However, as the data tables below show, there is insufficient official sex-disaggregated data to fully demonstrate the state of gender digital inequality in all three countries.
ARGENTINACONTEXT
From as early as 1985, with Argentina’s accession to CEDAW, the country has made continuous efforts towards achieving gender equality. Numerous policies and programs have since been implemented, including gender quotas in labour unions and the creation of the National Women’s Council. With regard to women in ICTs, there exist various academic institutions and civil society organisations that conduct research and encourage women’s participation in the field. These include the Argentine Network of Gender, Science and Technology, and the Center of Studies on Science, Development and Higher Education. These government policies and public-private collaboration have had positive results. In the 2017 Gender Gap Report of the World Economic Forum, Argentina ranked 34th out of 144 countries in gender parity. It has performed well on some measures of gender parity: ranking 1st in the area of women’s health and survival, 21st in political empowerment, and 44th in educational attainment. However, the country ranked 111th in women’s economic participation.
ACCESS
Argentina is one of the few countries in the world where the digital gender divide in basic access is relatively marginal. According to the latest available data from ITU, there are more women (80%) than men (79%) using a mobile. While more men than women use the computer and internet, the difference is only 2%.

189
Taking Stock: Data and Evidence on Gender Digital Equality PART ONE
Even in aspects of meaningful use, women’s access to and use of complex ICT services are comparable to men’s. In 2017, Argentina was one of only four countries in the world where there were more women than men owning a bank account (including mobile money accounts), according to data from the Global Findex survey. Based on the same dataset, overall, more women than men have reportedly made or received digital payments in the past year.
SKILLS
Unfortunately, the ITU database of gender-disaggregated data on digital skills has no data for Argentina. However, a report by Accenture notes that women’s digital fluency- or the extent to which they embrace and use digital technologies to become more knowledgeable, connected, and effective- is higher than that of men.
According to OECD, the share of 25-34 year-olds who had completed their upper secondary education reached 38% for both men and women in 2014. However, more women than men were expected to graduate from upper secondary education in their lifetime at 69% compared with 49% for men. Tertiary education remained limited with only 21% (2014) of 24-64 year-olds having attained a tertiary education – which was less than the OECD average of 37% but still higher than other Latin American countries like Brazil (15%) and Mexico (17%). In 2013, most first-time graduates were women at the bachelor’s (62%), masters’ (58%), and doctoral (56%) level. However, there is a high gender imbalance in fields such as education and humanities where majority of graduates are women. In the field of STEM, Argentina has more gender equality than OECD countries on average, but this is against the backdrop of an overall low share of STEM graduates (14%, which is well below the OECD average of 23%).
LEADERSHIP
On the political front, women’s participation and representation has increased steadily over the years with a female president being elected and reelected between 2007 and 2015. Argentina became a pioneer in women’s political participation by instituting a quota system in 1991 which required 30% of all candidates for elections to be women. In 2018, 40% of seats in Argentina’s national parliament were held by women, ranking 17th globally. However, more work needs to be done to ensure that women are more fully engaged in running the public sector.
In decision-making positions, specifically in the public sector at national science and technology institutions and in higher education, women’s representation is lower than men. In 2013, women made up 36% of the Science, Technology, and Productive Innovation Commission of the lower house of parliament. In the same year, the proportion of women in the Ministry
of Science, Technology and Innovation (MINCYT) for all categories of staff was at 52%. But women only accounted for one third of staff working in the management and coordination of MINCYT. In the National Scientific and Technical Research Council in 2013, there were only 2 females out of 8 board members. In higher education decision-making positions, there were only 8 female rectors among Argentina’s 53 national universities in 2014. Similarly, in the same year, there were 47 male vice-rectors and only 9 were female.
Women’s participation in the economy is low relative to men with the labour force participation rate for women at only 56% for women compared to 82% for men in 2017. Nonetheless, there are sectors where the proportion of women workers is relatively high. For example, in high-skills occupations, 49% of workers are women. However overall, women are less represented in management positions with only 31% female managers in total management positions (2013), 36% categorised as chief executive, senior officials, and legislators (2014), and 39% in senior and middle management positions (2015).
CONCLUSION
Overall, Argentina has done well in narrowing the digital gender divide in access and skills but not in leadership. The digital gender divide in basic access, and even some aspects of meaningful use where data are available, is getting narrower or even approaching parity. For STEM training, the problem is more related to the overall low level of people studying STEM subjects and pursuing higher education rather than a gender divide issue. While Argentina was the first country in the world to introduce a quota law ensuring 30% of candidates standing for election are women, women continue to face obstacles to meaningful participation in the nation’s political life, with little representation in decision making processes in the public sector. Similarly, in the private sector, there are far fewer women represented in senior management roles compared to men.

190
Taking Stock: Data and Evidence on Gender Digital Equality PART ONE
REFERENCES
Bonder, Gloria. National assessments in gender and STI: Argentina report. Women in Global Science and Technology. Retrieved from: http://wisat.org/wp-content/uploads/Argentina_GE-KS.pdf
Databases consulted:• ILOSTAT• ITU Statistics• OECD Education at a Glance country
notes: http://www.oecd.org/education/educationataglance2017-countrynotes.htm
• UNESCO UIS• World Economic Forum (2017) Global gender gap
report • Women in national parliaments, situation as of 1st
June 2018. Accessed from: http://archive.ipu.org/wmn-e/classif.htm
• World Bank Global Findex Database 2017 https://globalfindex.worldbank.org/
• World Bank Women, Business and the Law 2018
INDONESIACONTEXT
Discussions on gender issues have been a part of the development discourse in Indonesia for more than two decades now and a number of government policies have been instituted to support greater participation of women in the economic, social, and political life of the country. Indonesia ratified CEDAW more than three decades ago and the constitution recognises equality before the law. Indonesia is also one of a select few countries with a ministry dedicated to women’s empowerment. However, this top down embrace of gender policies has not resulted in gender parity. In the 2017 Global Gender Gap Report, Indonesia ranked 84th out of 144 countries. The gender divide cuts across many spheres of Indonesian society and is observable in access to and participation in the digital economy. Factors that explain the gender digital divide include low level of digital media literacy of women compared to men, lack of education, lack of opportunities, less income and subsequently less free time for women, as well as the predominantly male dominated social structure of the country.
ACCESS
Basic access to ICTs is a challenge in Indonesia owing to the physical scale, geography, and archipelagic nature of the country. The problem is compounded by the country’s large population which stood at 250 million in 2016. Mobile phones are the main means
of accessing digital content in the country. In 2017, mobile subscribers per 100 inhabitants stood at 174. Despite this, there is a gender gap in mobile phone ownership. Only 52% of women owned a mobile phone compared to 64% for men in 2016. There were also fewer women accessing the internet and using a computer.
One aspect of meaningful use where data are available is in use of digital financial services. Based on data from the World Bank Findex (2017), Indonesia is one of only four countries in the world where there are more women than men owning a bank account (including mobile money account). There are also more women than men who have made or received digital payments in the past.
SKILLS
Access to education and low digital literacy have been cited as key barriers that exacerbate the gender digital divide in Indonesia. Unfortunately, ITU does not have gender-disaggregated data on basic ICT skills for the country. Nonetheless, this problem of low digital literacy and skills is being addressed by the government through formal educational channels. The national education curriculum includes specific objectives for a subject on basic computing skills at the primary and secondary levels to improve. Women lag behind men across primary, secondary, and tertiary educational attainment. In fields related to STEM and ICT, the number of female tertiary graduates in these areas also falls behind male graduates. Of the total graduates in tertiary STEM programme in 2014, only 38% were women. In the field of ICT and engineering/manufacturing and construction, the percentage share of women graduates stood at 36% in 2014. The reverse is true in health and welfare programs where there are more women graduates than men.
In Indonesia, there is political commitment to promote the integration of ICT in education. The national policy and national plan include strategies to integrate ICTs in education at the primary and secondary levels. Outside traditional educational routes, non-government and for-profit organisations have been active in urban areas in promoting alternative pathways to ICT skills upgrading through coding boot camps, she-hacks (or hackathons exclusive to women) among others.
LEADERSHIP
The gender gap in political and economic leadership positions remain substantial. From 2009 to 2014, women made up 18% of the total members of parliament while female members of the cabinet made up 12%. In 2018, Indonesia ranked 101st out of 193 countries in terms of female representation in parliament, with 20% of seats in national parliament held by women. In the public sector, women also tend

191
Taking Stock: Data and Evidence on Gender Digital Equality PART ONE
to hold positions that are seen as “soft” such as those relating to women’s issues.
Women are similarly underrepresented in economic leadership positions. In 2015, women accounted for only 22% of total management positions. In senior and middle management positions and amongst chief executives, senior officials, and legislators, the proportion of women is even lower at 21% and 15% respectively. According to the ILO in 2017, women made up 46% of workers classified under high-skill occupations. Specific to ICT and related industries, women’s participation remains low. In 2016, female employment in ICT occupations was at just 5%. Among electrical and electronic trades workers, women made up 12% of the total workforce. The situation is slightly better in the telecommunications industry where women made up 38% of the workforce.
CONCLUSION
The state of the gender digital divide across access, skills, and leadership in Indonesia remains an ongoing concern. Incomplete data on meaningful access prevent us from drawing a holistic picture of the state of the gender digital divide beyond basic access. Top-down embrace of policies related to women empowerment has not resulted to the desired outcome of greater gender parity. Structural issues including digital literacy, access to education and economic opportunities are some of the underlying issues that are seen as contributing to the gender digital divide.
REFERENCES
Hermawati, W. & Saari, R. (2011). National assessment on gender equality and the knowledge society in Indonesia. Centre for Science and Technology Development Studies, Indonesian Institute of Sciences. http://wisat.org/wp-content/uploads/Indonesia_GE-KS_Final.pdf
Suwana, F., Lily. (2017). Empowering Indonesian women through building digital media literacy. Kasetsart Journal of Social Sciences, 38 (3), 212-217.
Databases consulted:• ILOSTAT• ITU Statistics• OECD Education at a Glance country
notes: http://www.oecd.org/education/educationataglance2017-countrynotes.htm
• UNESCO UIS• World Economic Forum (2017) Global gender gap
report • Women in national parliaments, situation as of 1st
June 2018. (2018). Accessed from: http://archive.ipu.org/wmn-e/classif.htm
• World Bank Global Findex Database 2017 https://globalfindex.worldbank.org/
• World Bank Women, Business and the Law 2018

192
Taking Stock: Data and Evidence on Gender Digital Equality PART ONE
RWANDACONTEXT
Rwanda has made efforts in recent years to attain gender equality through implementation of numerous policies and commitments at different levels of society. At the international level, Rwanda is committed to the Convention on the Elimination of All Forms of Discrimination against Women and has adopted the Beijing Platform for Action. On a national level, the Ministry of Gender and Family Promotion was established in 2003 to promote gender equality throughout the development process of the country. In 2010, the National Gender Policy was initiated which requires each government ministry to have a gender sector policy and strategic plan. At both the national and community level, the National Women’s Council (an organ under the Ministry of Gender and Family Promotion) facilitates forums and development activities for women’s empowerment. In addition, there are Faith Based Organisations at the community and family level that create dialogues for healthy gender relations. These efforts have resulted in positive outcomes leading to Rwanda ranking 4th out of 144 countries in the 2017 Global Gender Gap Report. Despite these efforts, there are still significant gender digital divides in Rwanda.
ACCESS
While the ITU does not have gender disaggregated data on access and use of ICTs in Rwanda, we can glean the state of gender digital divides in the country using data from the Integrated Household and Living Condition Survey (EICV) 4 administered by the National Institute of Statistics of Rwanda in 2015. In general, women lag behind men in basic access. In 2015, female-headed households had lower access to ICT assets such as mobile phones (51% versus 68% for male-headed households) and computers (2% versus 3%). The percentage of households whose members had access to the internet was also lower for female-headed household (8% as compared to 10% for male-headed households).
The EICV 4 data also notes that the percentage of the population aged 15 years and above that is computer literate is lower for females (7%) as compared to males (10%). In terms of meaningful access, 33% of females made or received digital payments in the past year which is much lower than male respondents (45%).Barriers to basic and meaningful ICT access include cultural norms that assign women traditional gender roles, such as responsibility for household chores and child care activities. This results in women not having enough free time to access or use ICTs. Men also have the traditional role of being the sole financial providers for the family, which contributes to women’s lack of finances for ICT access. The unequal distribution of ICT facilities in rural areas discourages women accessing these facilities due to the long
walking distances. Women have relatively lower English language skills, creating an additional barrier since English is the main language used on computers. Additionally, negative perception of ICTs, such as associating them with pornography, put off women from using ICTs.
Rwanda has proposed national ICT initiatives to improve access to ICTs, such as Multipurpose Community Centres which promote public access to computing facilities. In addition, initiatives have been set up to improve staff recruitment and advancement at village knowledge centers in rural areas.
SKILLS
Despite ranking 4th overall in the 2017 global gender gap, Rwanda ranked 113th in educational attainment, based on the same ranking. This is primarily influenced by the substantial gender gap in tertiary enrolment and overall literacy rates (65% female versus 72% male).
Based on EICV 4 data, in 2015 there was almost gender parity in basic education and more women enrolled in primary (50%) and secondary levels (53%) in Rwanda. However, there were fewer women enrolled at the tertiary level where 43% of total enrolment was female. This gender gap was especially evident in science and technology-based disciplines. There were more men than women enrolled in science programs (32% women), and engineering/manufacturing and construction programs (19%). The reverse was true for other programs such as social sciences, business, and law where 54% of enrolled students in 2015 were female, and in services-related programs, where female share of enrolled students stood at 58%.
LEADERSHIP
In terms of leadership, women are well represented in the public sector but not in the economic sphere. Rwanda currently leads the world with the highest number of women elected to parliament. As of June 2018, the lower house consisted of 61% women and the upper house 38% women. However, the proportion of women in government ministerial positions was lower than men at 40% in 2016. There were also more women governors in Rwanda as of 2016 (60% women governors) but only 17% of mayors were women.
Women are under-represented in economic leadership positions. The economy of Rwanda is primarily agriculture-based, and this is where majority (79%) of female workers over the age of 16 are found. In 2014, only 14% of total management positions were held by women. About 40% of positions in high skills occupations were held by women. Based on the 2016 National Gender Statistics Report of Rwanda, only 0.1% of female workers work in the information and

193
Taking Stock: Data and Evidence on Gender Digital Equality PART ONE
communication sector and 0.2% work in professional, scientific and technical activities (compared to 0.3 and 0.6% respectively for men). The report also shows that in 2014 there were only 28 female managers of information and communication establishments, compared to 375 male managers. The number of female managers of professional, scientific and technical establishments was less than half that of males (308 compared to 654).
CONCLUSION
The problem of basic access in Rwanda is true for both men and women but is more acute for women. In general, Rwanda has fared well in narrowing gender gaps in educational attainment especially at the primary and secondary levels. However, challenges remain at the tertiary level where there are less women enrolled in tertiary programs and especially in STEM related programs. Women are visible and well represented in the political sphere but not in economic activities. The low participation of women in ICT-related economic activities is related to the general composition of the economy – the main national industries are agriculture, forestry, and fishing. To ensure appropriate policymaking and interventions, more official statistics and rigorous research are needed on the state of female access to ICTs and participation in the digital economy.
REFERENCES
International Telecommunications Union (2017). Country profiles, Rwanda.
Masanja, V. G., Masanja, J. K., Masanja, R. K., (2016). Report of the gender equality and the knowledge society in Rwanda. Women in Global Science and Technology, Organization for Women in Science for the Developing World. Retrieved from: http://wisat.org/wp-content/uploads/National-Assessment-on-Gender-and-STI-Rwanda.pdf
Mumporeze, N., & Prieler, M. (2017). Gender digital divide in Rwanda: A qualitative analysis of socioeconomic factors. Telematics and Informatics, 34(7), 1285-1293.
The Republic of Rwanda & National Institute of Statistics of Rwanda. (2016). National gender statistics report 2016. Retrieved from: http://www.statistics.gov.rw/file/4922/download?token=VHhPzzF-
The Republic of Rwanda & National Institute of Statistics of Rwanda. (2016). Rwanda integrated household and living conditions survey (EICV), 2013/2014 thematic report - Gender. Retrieved from: http://www.statistics.gov.rw/file/4461/download?token=clOlX88O
Databases consulted:• ILOSTAT http://www.ilo.org/ilostat/ • ITU Statistics https://www.itu.int/en/ITU-D/
Statistics/Pages/stat/default.aspx • OECD Education at a Glance country
notes: http://www.oecd.org/education/educationataglance2017-countrynotes.htm
• UNESCO Institute for Statistics http://uis.unesco.org/ World Economic Forum (2017) Global gender gap report. https://www.weforum.org/reports/the-global-gender-gap-report-2017
• Inter Parliamentary Union: Women in national parliaments, situation as of 1st June 2018. (2018). Accessed from: http://archive.ipu.org/wmn-e/classif.htm
• World Bank Global Findex Database 2017 https://globalfindex.worldbank.org/
• World Bank Women, Business and the Law 2018. https://wbl.worldbank.org/

194
Taking Stock: Data and Evidence on Gender Digital Equality PART ONE
Table A.1Mobile and internet access, by country
DATA TABLEACCESS
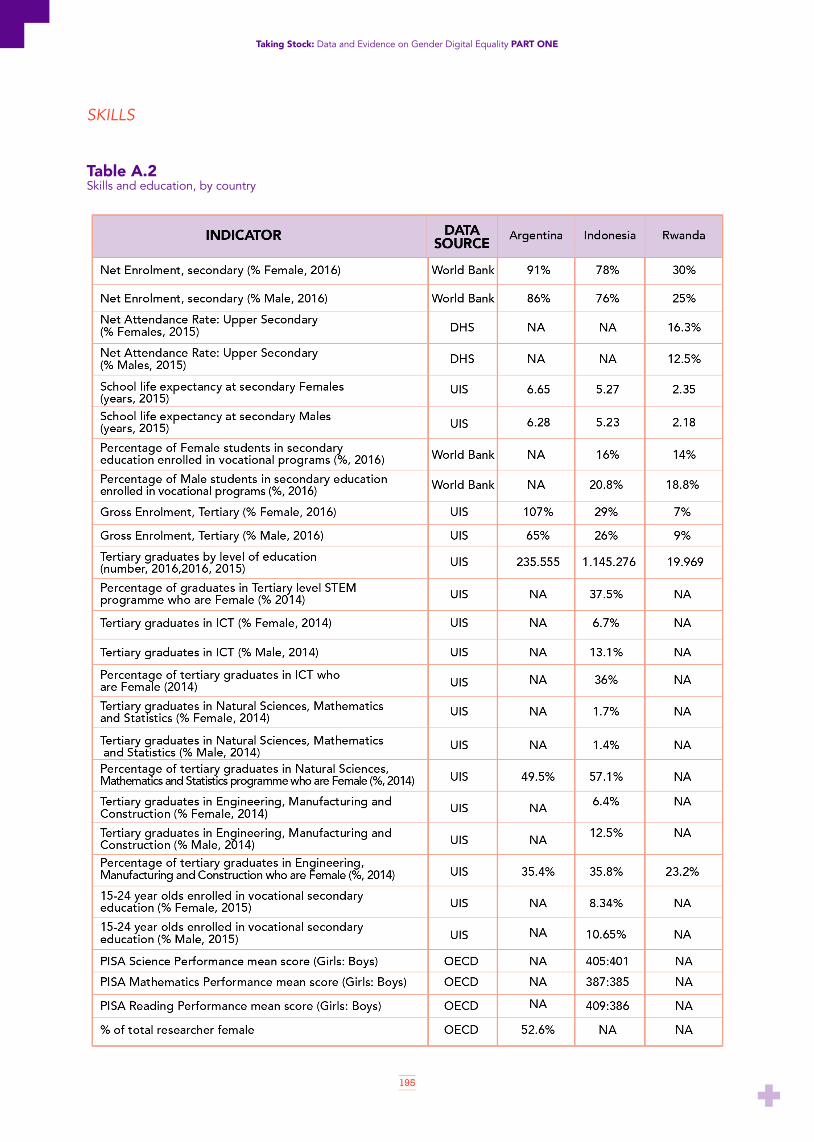
195
Taking Stock: Data and Evidence on Gender Digital Equality PART ONE
Table A.2Skills and education, by country
SKILLS

196
Taking Stock: Data and Evidence on Gender Digital Equality PART ONE
Table A.3Women in employment, entrepreneurship, and policymaking, by country
LEADERSHIP

197
Taking Stock: Data and Evidence on Gender Digital Equality PART ONE
Table B.1Africa, Americas, Oceania: Basic ICT Access Indicator, Most Recent Year (2014–2016)
APPENDIX B: BASIC ICT INDICATORS BY GENDER
Note: Red indicates less than 50% of men/women reporting ability to perform specific digital skill. Purple indicates more than 50% of men/ women reporting ability to perform specific digital skill. Data source: ITU WITD Database, 2017.

198
Taking Stock: Data and Evidence on Gender Digital Equality PART ONE
Table B.2 AsiaBasic ICT Access Indicators, Most Recent Year(2014-2016)
Note: Red indicates less than 50% of men/women reporting ability to perform specific digital skill. Purple indicates more than 50% of men/ women reporting ability to perform specific digital skill. Data source: ITU WITD Database 2017

199
Taking Stock: Data and Evidence on Gender Digital Equality PART ONE
Table B.3 EuropeBasic ICT Access Indicators, Most Recent Year (2014–2016)
Data source: ITU WITD Database, 2017.

200
Taking Stock: Data and Evidence on Gender Digital Equality PART ONE
Table C.1Individuals with ICT skills, by type of skills by gender (%): Africa, Americas, Asia
APPENDIX C: INDIVIDUALS WITH ICT SKILLS, BY TYPE OF SKILLS AND GENDER
Note: Red – less than 50% of men/women reporting ability to perform specific digital skill. Purple – more than 50% reporting ability to perform skill. Data Source: WITD Database, 2017.

201
Taking Stock: Data and Evidence on Gender Digital Equality PART ONE
Table C.2Individuals with ICT skills, by type of skills by gender (%): Europe
Note: Red – less than 50% of men/women reporting ability to perform specific digital skill. Purple – more than 50% of men/ women reporting ability to perform specific skill. Data source: WITD Database, 2017.

202
Taking Stock: Data and Evidence on Gender Digital Equality PART ONE
APPENDIX D: SAMPLE ILO SECTOR AND OCCUPATION CLASSIFICATIONS
Source: https://unstats.un.org/unsd/cr/registry/regcst.asp?Cl=27
International Standard Industrial Classification of All Economic Activities (ISIC), Rev.4
C – Manufacturing (23 subcategories including):• 26 - Manufacture of computer, electronic and optical
products• 27 - Manufacture of electrical equipment• 33 - Repair and installation of machinery and equipment• H - Transportation and storage• 49 - Land transport and transport via pipelines• 50 - Water transport• 51 - Air transport• 52 - Warehousing and support activities for transportation• 53 - Postal and courier activities
M - Professional, scientific and technical activities• 69 - Legal and accounting activities• 70 - Activities of head offices; management consultancy
activities• 71 - Architectural and engineering activities; technical
testing and analysis• 72 - Scientific research and development• 73 - Advertising and market research• 74 - Other professional, scientific and technical activities• 75 - Veterinary activities
J - Information and communication• 58 - Publishing activities• 59 - Motion picture, video and television programme
production, sound recording and music publishing activities
• 60 - Programming and broadcasting activities• 61 - Telecommunications• 62 - Computer programming, consultancy and related
activities• 63 - Information service activities
R - Arts, entertainment and recreation• 90 - Creative, arts and entertainment activities• 91 - Libraries, archives, museums and other cultural
activities• 92 - Gambling and betting activities• 93 - Sports activities and amusement and recreation
activities
S - Other service activities• 94 - Activities of membership organizations• 95 - Repair of computers and personal and household
goods• 96 - Other personal service activities
International Standard Classification of Occupations (ISCO 08), major & sub-major groups
1 Managers• 11 - Chief Executives, Senior Officials & Legislators• 12 - Administrative & Commercial Managers• 13 - Production & Specialized Services Managers• 14 - Hospitality, Retail and Other Services Managers
2 Professionals• 21 - Science and Engineering Professionals• 22 - Health Professionals• 23 - Teaching Professionals• 24 - Business and Administration Professionals• 25 - Information and Communications Technology
Professionals• 26 - Legal, Social and Cultural Professionals
3 Technicians and Associate Professionals• 31 - Science and Engineering Associate Professionals• 32 - Health Associate Professionals• 33 - Business and Administration Associate Professionals• 34 - Legal, Social, Cultural and Related Associate
Professionals• 35 - Information and Communications Technicians
4 Clerical Support Workers• 41 - General and Keyboard Clerks• 42 - Customer Services Clerks• 43 - Numerical and Material Recording Clerks
5 Services and Sales Workers• 51 - Personal Services Workers• 52 - Sales Workers• 53 - Personal Care Workers• 54 - Protective Services Workers
6 Skilled Agricultural, Forestry and Fishery Workers• 61 - Market-oriented Skilled Agricultural Workers• 62 - Market-oriented Skilled Forestry, Fishery and Hunting
Workers
7 Craft and Related Trades Workers• 72 - Metal, Machinery and Related Trades Workers• 73 - Handicraft and Printing Workers• 74 - Electrical and Electronic Trades Workers
8 Plant and Machine Operators and Assemblers• 81 - Stationary Plant and Machine Operators• 82 - Assemblers• 83- Drivers and Mobile Plant Operators
9 Elementary Occupations
10 Armed Forces Occupations

203
Taking Stock: Data and Evidence on Gender Digital Equality PART ONE

204
PART TWOCASE STUDIES

205
Taking Stock: Data and Evidence on Gender Digital Equality PART ONE
INTRODUCTION
Part Two deals thematically with three key elements in achieving goals of the EQUALS partnership: People, Skills and Pathways.
People. The emphasis on people first underlines the importance of viewing technology in its social context. Technology does not exist in a vacuum but is embedded in society: technology has social impact, and it functions in social contexts and is shaped by social factors. The People section examines how technology impacts society through inclusion or exclusion of people in various groups — on the basis of gender (in all its varieties), age, disability, and geographical location. The papers in this section cover a range of factors: gender variance in relation to technology; North vs. South differences in the gender digital gap; the participation and use of technology by female children, youth and women with disabilities; and the potential for women’s empowerment in rural areas through access to ICTs.
Skills. The skills needed for full participation in technology are wide and varied. To secure privacy and security in modern society, women need at least basic digital and security skills. At a higher level, women need to be involved in designing systems and tools for privacy and security that address their situation and needs. Papers in this section focus on key questions. Are educational institutions doing the job in closing STEM education gaps? Are differential skill levels and cognitive abilities responsible for the gender wage gap in technology? And whether all jobs in the technology industry enhance technology skills and provide advancement possibilities for women, as illustrated in the case of call centre employment.
Pathways. EQUALS is dedicated to achieving global gender equality in the processes and benefits of technology, especially in information and communication technologies and STEM. What are the ways to achieve this result? What courses of action are needed? This section examines some of the paths that have been suggested towards gender equality in technology, asking whether their promises have been fulfilled and what remains to be done to achieve them. The authors examine the empowerment of women in the technology work force, the participation of women in knowledge and technology transfer, and the prognosis for gender equality in the rapidly expanding field of Artificial Intelligence.

206
Taking Stock: Data and Evidence on Gender Digital Equality PART ONE

207
Taking Stock: Data and Evidence on Gender Digital Equality PART ONE

208
GENDER VARIANCE AND THE GENDER DIGITAL DIVIDEAUTHORS: TINA BEYENE (CALIFORNIA STATE UNIVERSITY) AND REMY FROST (UNIVERSITY OF NEW HAMPSHIRE)
1

Taking Stock: Data and Evidence on Gender Digital Equality PART TWO
209
ABSTRACT
Gender is a broad and fluid social construct that is not limited to the conventional male/female dichotomy that commonly informs gender analysis in ICT. Despite two decades of lesbian, gay, bisexual, transgender, queer, and intersex (LGBTQI) scholarship that has shown how gender and sexuality are lived along a wide spectrum — with great variation across regions, age groups, times, spiritual traditions, and cultural practices — the framing of gender and ICT overwhelmingly focuses on women, understood in binary terms. Hence, data is scant on access, inclusion, and innovation of gender and sexual minorities in the ICT sector. Despite the lack of accurate data, gender and sexual minorities innovatively employ computer language coding, gaming, social media, and mobile apps as empowerment tools, using them to raise awareness about discrimination and violence and to build social and political communities. But the spread of ICTs also raises concerns of safety for gender and sexual minorities, who face harassment and violence via technology-based surveillance tactics. Because of the extreme discrimination, violence, and surveillance they face, gender and sexual minorities have a unique set of needs for ensuring their success in employment in the ICT sector, including issues of healthcare, equitable work spaces, safety, visibility, and mentorship. This chapter reviews the intersection between gender and sexual minorities and ICTs, examining the opportunities for access and use and assessing the pitfalls involved. It ends with suggestions for further research and programming to promote gender and sexual equality in ICT.
KEY FINDINGS
• Policy and research on gender and ICT generally focus on women understood as a binary category: male/female, excluding consideration of transgender people, gender identity, and sexual preference. Consequently, most approaches to women and ICT do not capture the relationship of gender and sexual minorities to ICTs.
• The spread of internet access and social media permit gender and sexual minorities authentically to express their gender within their communities, without the stress of medically and/or socially transitioning or pressures of “coming out”. Smart phones and mobile apps facilitate fast, affordable, and culturally relevant dissemination of crucial services such as eHealth interventions to gender and sexual minorities.
• Recent moves by the largest social media platforms allowing users to customise their gender have made social media more accessible to gender and sexual minorities. However, social media platforms still sell to advertisers user
information that is coded along binary gender categories.
• Technology-driven surveillance and cyberbullying of gender and sexual minorities is increasing. These tactics are now common occurrences worldwide, leading to workplace discrimination, physical attacks, blackmail, arrest, detention, torture, sexual assault, and murder of gender and sexual minorities.
INTRODUCTION
Scholars of gender and technology have extensively examined the gender digital divide, highlighting the marginalisation of women and girls in the tech field and the potential of ICTs to empower them (Buskens & Webb, 2014; Hafkin & Huyer, 2006; Lopes & Bailur, 2018; Sørensen, Faulkner, & Room, 2011; Treinen & Van der Elstraeten, 2018). Overwhelmingly, these studies of the gender digital divide conceptualise gender as binary system of biological “male” and “female” sexes and further assume a division between masculinity and femininity that neatly aligns with maleness and femaleness (Landström, 2007). However, over the last two decades, lesbian, gay, bisexual, transgender, queer, and intersex (LGBTQI)24 scholars and activists have demonstrated the flaws of gender binarism, showing that gender and sex themselves are social constructs (Butler, 2011; Carrera, DePalma, & Lameiras, 2012; Currah & Spade, 2007; Halberstam, 1998; Rubin, 2011). They have also shown that, far from a coherent identity category, gender is complex confluence of an individual’s self-perception of their gender, the perception of their gender by others, their own expression and presentation of their gender, and the designation of gender at birth by the medical establishment (Fausto-Sterling, 2000; Halberstam, 1998; Stryker, 2008)25. Moreover, both gender and sexuality also intersect with other identity categories, such as race and class, and they vary across spiritual traditions, cultural practices, and historical periods (Anzaldúa, 2012; Connell, 2014; Driskill, Chris, Brian, & Scott, 2011; Najmabadi, 2005; Snorton, 2017; Vanita
24 Several terms — lesbian, gay, bisexual, transgender, Queer, Intersex (LGBTQI); lesbian, gay, bisexual, transgender (LGBT); lesbian, gay, bisexual, transgender, queer (LGBTQ); genderqueer; queer; and gender and sexual minorities — are often used interchangeably, although there are complex histories and theories behind each of these designations. For a full discussion of these political histories see Stryker (2008 and 2017) and Halberstam (2018).
25 For instance, for cisgender individuals, gender self-perception aligns with the gender assigned at birth, whereas for transgender individuals, gender self-perception may not align with the gender identity imposed at birth. Similarly, intersex individuals may be born exhibiting both male and female or atypical biological traits, but they are often coerced — by doctors, parents, and social expectations — to live as either male or female. Gender non-conforming people and those questioning their gender are similarly often forced to adopt a gender identity that does not reflect their understanding of themselves as gendered/non-gendered beings (Fausto-Sterling, 2000; Halberstam, 1998, 2018; Stryker, 2008).

Taking Stock: Data and Evidence on Gender Digital Equality PART TWO
210
& Kidwai, 2001). Clearly, the characterisation of the gender digital divide along binary frameworks of male/female neglects the complex ways that gender and ICTs intersect.
ICTs are a double-edged sword for gender and sexual minorities. On the one hand, ICTs can empower LGBTQI populations by enabling them “to collectivise and organise to counter stigma, discrimination and violence” (UNDP, 2016). Carmen Stitt further notes the power of computer games that feature gender-fluid characters: they can “more than allow the avatar to transform the flesh” by permitting “people to escape the restriction of the bodies”, even if such an escape is much harder in “real life” (Stitt, 2012). But the dominance of a gender-binary discourse in gender and technology studies can also lead to what Catharina Landström calls “technological determinism” (Landström, 2007), i.e., the presumption that the gendered subject is the “determining factor in the gender/technology relationship” (Landström, 2007). Rather than examining how gender and technology are co-constituted, technological determinism naturalises both gender binarism and “heteronormativity” — the view that “institutionalised heterosexuality constitutes the standard for legitimate and expected social and sexual relations” (Landström, 2007, p. 11). Indeed, common assumptions that technology is the domain of masculinity and men, and that “women relate to technology in a way that reflects heteronormative femininity,” reinforce heteronormativity as a conceptual framework (Landström, 2007, p. 12).
Drawing on the cited works, this chapter examines gender and sexual minorities as a missing dimension of the gender digital divide. Unfortunately, the binary nature of most gender and ICT data makes this examination exploratory: there is an urgent need for data collection to enable further research on this topic. The paper begins with an overview of emerging legal frameworks for the protection of gender and sexual rights, including recent policies in the United Nations, and it reviews the ongoing discrimination against sexual and gender minorities despite increased public visibility of LGBTQI issues. The paper spotlights discrimination that hampers access to ICTs, including workplace and education discrimination and technology-driven harassment. It also discusses the potential of ICTs (such as gaming and virtual reality, social media, and mobile technologies) to advance the rights of LGBTQI people. It ends with a discussion of the need for reliable data covering a broader gender spectrum and presents research and policy recommendations for the promotion of gender and sexual equality in ICT.
EMERGING LEGAL FRAMEWORKS FOR GENDER AND SEXUAL RIGHTS
Recent activism by gender and sexual minorities has led to important changes in the public policy realm, including at the United Nations, where some of its agencies have initiated positive actions on behalf of gender and sexual minorities. The most important initiative was the 2016 resolution by the Office of the United Nations High Commissioner for Human Rights (OHCHR) denouncing “violence and discrimination based on sexual orientation, and gender identity” and appointing an independent expert on discrimination and violence against sexual and gender minorities (United Nations General Assembly26, 2016). The OHCHR’s online Free and Equal Campaign, raising awareness about human rights violations affecting the LGBTI community, has to-date generated 2.3 billion social media feeds27. Many United Nations agencies have also called for an end to requiring transgender people to undergo surgery and sterilisation against their will (National Center for Transgender Equality, 2014). UN Women, along with OutRight International, has similarly advocated for the inclusion of LGBTQI voices at all levels of programmatic intervention to end gender-based violence (Mlambo-Ngcuka, 2017). Regional organisations in Africa, the Americas and Europe — including the African Commission on Human and Peoples’ Rights, the Organization of American States, the Inter-American Commission on Human Rights, the European Union, the European Parliament, and the European Court of Human Rights — have also passed measures affirming the rights of gender and sexual minorities (Office of the United Nations High Commissioner for Human Rights, 2015, p. 4).
Despite the growing visibility of LGBTQI issues and the emergence of legal protections, discrimination and violence against LGBTQI is rampant around the world (Carroll & Ramón, 2017). While the 2016 United Nations resolution is the most comprehensive United Nations stance on the human rights of gender and sexual minorities, it still faced objection from eighteen countries28. Seventy-two countries currently criminalise same-sex relationships. The movement to secure acknowledgement and enforcement of the human rights of gender and sexual minorities is, therefore, a prerequisite for their access of and full participation in ICTs. There have been some efforts on this topic
26 United Nations General Assembly. Resolution adopted by the Hu-man Rights Council on 30 June 2016. Human Rights Council Thirty-se-cond Session Agenda item 3.
http://www.un.org/en/ga/search/view_doc.asp?sym-bol=A/HRC/RES/32/2
27 Free and Equal Campaign. www.unfe.org.
28 Free and Equal Campaign can be viewed at www.unfe.org.

Taking Stock: Data and Evidence on Gender Digital Equality PART TWO
211
among the major United Nations organisations dealing with ICT. For instance, in 2015, the International Labor Organization (ILO) released a study of workplace protection for gender and sexual minorities in Brazil (ILO, 2015). In 2016, the International Telecommunication Union (ITU) together with UN Women established EQUALS: The Global Partnership for Gender Equality in the Digital Age, a global network of corporate leaders, governments, non-profit organisations, communities and individuals committed to ending the gender digital divide. (This report is a result of that partnership.) While these are promising trends, there is more work to be done by agencies such as the ILO, ITU, and the United Nations Conference on Trade and Development (UNCTAD), to begin or to expand their analysis of the gender spectrum in ICT.
GENDER AND SEXUAL DISCRIMINATION: THE LEAKY EDUCATION–WORKPLACE PIPELINE
While data is scarce on workplace discrimination against gender and sexual minorities in ICTs, general patterns of extensive workplace discrimination can reasonably be expected to hold in the ICT sector as well. For instance, the United States Commission on Civil Rights found that “discrimination against LGBT employees affects all occupations” (United States Commission on Civil Rights, November 2017). A seven-country study on wage discrimination against sexual minorities found that gay men earn 11% less than their heterosexual counterparts (Klawitter, 2015). A 2013 Europe Union survey found one in five LGBTQ individuals reporting discrimination, as did one in three transgender individuals (European Union Agency for Fundamental Rights, 2013). Similar trends are observed in the U.S. (James et al., 2016) and Brazil (International Labor Organization, 2015). In 2017, the U.S. retracted protection from workplace discrimination that had been afforded to transgender people under the Civil Rights Act (Horwitz & Hsu, 2017).
These patterns of workplace discrimination have been documented on the ground as well. The NYC Technology Salon hosted a workshop in 2015 on discrimination against gender and sexual minorities in the field of Information and Communication Technology for Development (ICT4D), bringing together employees in the ICT4D field from around the world. Participants reported frequent discrimination including cyberbullying, workplace hostility, and harassment by colleagues, including monitoring their personal social media accounts, spreading rumors and creating a hostile work and living environment (Raftree, 2015). Such vigilantism prevents LGBTQI workers from safely building
communities against threats of physical violence and aggressive policing. Violations were especially intense in parts of the world with rampant legal and cultural discrimination against LGBT people and where hostile governments control the internet.
Employment discrimination is closely related to education discrimination. In many regions of the world, transgender students are pushed out of school by harassment and discriminatory dress codes (UNDP et al., 2016). For instance, the 2015 U.S. Transgender Survey found that 77% of surveyed individuals who were out or perceived as transgender in their school-age years had left a school as a result of abuse, including verbal harassment, restriction on dressing according to their gender identity, harsher discipline and physical/sexual assault (James et al., 2016). In college or vocational school, 24% of people who were out or perceived as transgender also reported verbal, physical, or sexual harassment (James et al., 2016). Nor do advanced degrees guarantee fair treatment: in South Africa, transgender women with advanced degrees reported working in positions far below their qualifications, due to workplace discrimination on the basis of gender identity (UNDP et al., 2016). A United Nations Educational, Scientific and Cultural Organization (UNESCO) survey of students in Thailand found that more than half of LGBTQI respondents had been bullied in the previous month, and more than 30% had experienced physical abuse; similar statistics are reported in other countries (Office of the United Nations High Commissioner for Human Rights, 2015). The implication for the ICT sector is clear. There is a “leaky pipeline” for gender and sexual minorities who are forced to drop out of school, limiting their access to work in this and other professional fields. In short, “legal gender recognition [is] a precursor to gainful employment” (Office of the United Nations High Commissioner for Human Rights, 2015, p. 42). It is imperative for states, ICT sector policy makers, employers and educators to prioritise the rights of gender and sexual minorities to fair and equal education and employment.
THE RISE OF CYBER THREATS AGAINST GENDER AND SEXUAL MINORITIES
With the rise of the internet, smart phones, and social media, technology-enhanced threats against LGBTQI people have become commonplace (Clunaigh, 2013). Anti-LGBTQI groups, individuals, and states use technology-based surveillance tactics to identify people online in order to prosecute them, harm them offline, and exclude them from political and social life. Common tactics include doxing, phishing (via software such as Trojan spyware and Fin Spy software), metadata mining, and requesting users’ personal profile information from host sites or internet services (Clunaigh, 2013). Social media platforms such as

Taking Stock: Data and Evidence on Gender Digital Equality PART TWO
212
Facebook, Twitter and Skype have been transformed into tools for exposing the identities, networks, and location of non-conforming individuals to enable physical attacks, blackmail, arrest, torture, and sexual assault (Clunaigh, 2013, p. 125). Individual harassers — as well as repressive governments — also deploy these platforms as “honeypots,” the illicit practice of luring gender and sexual minorities for a supposed liaison and then exposing, extorting, and attacking them (Clunaigh, 2013). Most infamously, in the early 2000s, the Egyptian government cracked down on LGBTQI communities by luring them on dating sites (Clunaigh, 2013, p. 127).
While hostile parties use technology-enabled violations against sexual and gender minorities, LGBTQI activists deploy ICTs to combat cyber threats. Activist groups such as Tactical Technology Collective (Tactical Tech) and FrontLine Defenders have responded to the growing cybersecurity threats to LGBTQI communities by providing training to human rights workers on digital safety29. They teach strategies such as removing work-related collaborations from social media sites and deleting metadata from files (especially photographs, which can include GPS location information). These groups also provide popular security training manuals in various languages.
ICTs are also used by human rights activists to document the range and extent of non-digital human rights violations around the world. Between 2008 and 2014, the Transgender Europe and the Trans Murder Monitoring Project recorded 1612 murders of gender-variant/transgender people in 62 countries (Transgender Europe, n.d.). Transgender people also face much higher rates of intimate partner violence than other groups (UNDP et al., 2016). Open-source software programmes such as Martus and OpenEvsys allow LGBTQI groups to securely record and report violations in real time. Martus has been used in Uganda to document 78 cases of human-rights violations against transgender people; it has also helped individuals who face risk of computer confiscation by police30. OpenEvsys has been useful for the Transgender Europe project’s efforts to track transphobia31. Another possible ICT tool recommended by UNDP for adoption by gender and sexual minorities is Ushahidi, an open-source programme compatible with smart phone that is used by women’s rights activists to generate Crowdmap, a digital map that allows users to record and share threats and attacks in real time32. As UNDP notes, programmes like Martus and OpenEvsys do not require sophisticated technical know-how, making them ideal tools for community organisations (UNDP et al., 2016).
29 See the website for Frontline Defenders at https://www.frontlinede-fenders.org/en/programme/digital-protection.
30 Martus can be accessed at martus.org.
31 Transgender Europe. tgeu.org/wp-content/uploads/2013/11/Moni-toring_ Transphobic_Incidents_final.pdf; www.huridocs.org/openevsys/
32 More on ushahidi can be found at www.ushahidi.com
SEARCH ENGINE ALGORITHMS AND ARTIFICIAL INTELLIGENCE (AI): NEW FRONTIERS OF DISCRIMINATION?
In Algorithms of Oppression, Safiya Umoja Noble analyses the relationship between search engine algorithms, artificial intelligence and the proliferation of sexism and racism on the internet. Noble conducts extensive analysis of the racialised and sexualised algorithms that search engines use; she notes that “on the internet and in our everyday uses of technology, discrimination is also embedded in computer code, and increasingly, in artificial intelligence technologies that we are reliant on, by choice or not” (UNDP et al., 2016, p. 1). Her analysis of Google’s search engine results reveals an array of sexist and racist images of people of color, which “reflects a corporate logic of either willful neglect or a profit imperative that makes money from racism and sexism” (UNDP et al., 2016, p. 5).
Although Noble’s work does not directly address gender and sexual minorities, it raises important questions about how gender and sexual minorities can be victims of the poorly understood intersection of digital algorithms and big data. As noted earlier, gender and sexual minorities face widespread technology-driven discrimination and violence (Raftree, 2015). And, as discussed in the next section, there is growing evidence that even when social media platforms allow user customisation of gender, they may violate users’ preferences by selling user data to marketers that impose gender-binary categories (Bivens & Haimson, 2016).
ICTS AS EMPOWERMENT TOOLS FOR GENDER AND SEXUAL MINORITIESMOBILE TECHNOLOGIES
Mobile technologies, while they can be used to exploit and harass women, are also noted for their potential for empowering women (Women’s World Wide Web, n.d.). However, most of the literature and data on mobile devices overlooks the broader gender spectrum. Nonetheless, there are indications that mobile technologies allow gender and sexual minorities to create some relatively safe spaces, to advocate for rights and to receive important health information and services. The LGBT Technology Institute in New York City provides free cell phones and cell phone plans to homeless youth (Williams, 2016). A study in Los Angeles finds that, in addition to

Taking Stock: Data and Evidence on Gender Digital Equality PART TWO
213
connecting youth with case managers and/or social workers, these devices serve as a “relatively cheap resource which can enable youth to pursue higher level resources, such as housing and employment” (Rice, Lee, & Taitt, 2011). Homelessness is especially high among transgender youth, affecting 30% of respondents in the 2015 U.S. Transgender Survey; efforts to expand access of mobile devices for gender and sexual minorities can be life-changing or even life-saving.
Mobile technologies are also useful in the health care industry, helping facilitate fast, widespread, affordable and culturally relevant dissemination of eHealth interventions (Fleming, Hill, & Burns, 2017). For instance, cell phone apps such as TODAY! have been used by mental health workers to aid gender and sexual minorities manage depression and anxiety, by putting them in quick contact with counselors and mentors (Fleming et al., 2017). Mobile phone apps have been useful for HIV/AIDs care provision to the LGBTQI populations, a population especially vulnerable to HIV/AIDS infection (Baral et al., 2013). Some health care providers in Indonesia have adopted iMonitor+, a UNAIDS-supported mobile phone app that allows any community to find HIV care and services, report HIV medication stockouts and report incidents of health care discrimination. They report receiving real-time alerts via this app faster than with other tools used in the past33. Mobile health apps have also been used in outreach efforts to men who have sex with other men (MSM) about HIV/AIDS information and care (Macapagal, Coventry, Puckett, Phillips, & Mustanski, 2016), and they have been effective in reaching MSM who are members of other minority groups and who are often neglected in HIV/AIDS care provision (Mitchell et al., 2017).
While e-health interventions are promising, as UNDP points out, health information on the web for gender minorities remains scarce, and (when available) is mostly in English (UNDP et al., 2016). Moreover, in many parts of the world, low literacy presents a barrier for gender minorities’ use of ICTs for health services and information (UNDP et al., 2016), reflecting the far-reaching impact of gender/sexual discrimination in education and highlighting the need for a multi-pronged anti-discrimination strategy.
COMPUTER GAMES AND VIRTUAL REALITY
The internet in particular has emerged as a “preliminary, complementary, and/or alternative” site of gender transition, community development, and empowerment of these marginalised populations (Marciano, 2014). The world of internet games and virtual reality (VR) have been especially instrumental for gender non-conforming individuals (including transgender, gender non-binary, and questioning), allowing them to express different gender identities
33 To learn more, see live.imonitorplus.org.
without pressure to transition medically and/or socially (Costello, 2014). In the 1990s, role-playing games (RPGs) provided new spaces for gender non-conforming people to experiment with and authentically represent their gender expression (Costello, 2014; Cross, 2012; Griffiths, Arcelus, & Bouman, 2016; Turkle, 1997). Text-based applications particularly enable anonymity and neutrality, by eliminating vocal pitch, appearance, and other indicators of users’ genders (Turkle, 1997). These include multi-user dungeons/domains (MUDs), a multiplayer real-time virtual world that integrates role-playing games, interactive fiction, online chat and so on; and Internet Relay Chats (IRCs), a chatting system that uses rules and conventions and client/server software. Graphics-based RPGs also allow more tangible trans and non-binary expression, especially for individuals who may not be able to physically transition or who are reluctant to transition out of fear of harassment, discrimination, and/or violence (Turkle, 1997). Popular games such as Second Life or Sim World offer millions of players the option to choose a gender avatar that differs from their assigned and/or lived gender and to explore new embodiments. It is important to note that many virtual worlds still construct gender as binary, limiting users’ choices to “male” and “female” avatars. However, as scholar and gamer Katherine Angel Cross notes, RPGs such as World of Warcraft allow for “creative resistance” and self-transformation within a framework that was never intended by the game developers to accommodate such modes of expression (Cross, 2012). Indeed, after developers introduced gender-neutral pronouns in computer programming codes to avoid sexist language, LGBQI users quickly adopted the alternative pronoun sets of IRCs and MUDs and popularised them across servers (Danet, 1998).
SOCIAL MEDIA
Recent moves by the largest social media platforms to expand their gender marker options have opened up unprecedented opportunity for gender minorities. Facebook, Google+ and Pinterest now allow users to customise their gender or choose from a wide range of gender identifications. Facebook’s user registration interface now has over 50 gender identification options. Twitter and LinkedIn do not mandate new users to supply information about their gender, and many other platforms now also give users control over their preferred pronouns. These design decisions increase access and inclusion for non-binary users, and they may also be instrumental in expanding general awareness of the broader gender spectrum, potentially beyond the digital world and into the physical.
While social media companies’ foray into a wider gender spectrum opens new prospects for self- determination of gender and sexual minorities, these companies also perpetuate gender binaries by selling gender data — and doing so in ill-considered
Taking Stock: Data and Evidence on Gender Digital Equality PART TWO
214
ways. Social media platforms that have broadened gender concepts in certain platforms (such as the public-facing profile pages and news feeds) are shown to revert to a binary system in other spaces, such as advertiser sign-up pages, without users’ awareness (Bivens & Haimson, 2016). Hence, the millions of users who joined social media platforms before gender customisation options were available still inhabit the original gender-binary categories, because marketers frequently tailor advertisement along gender binary lines, which may violate users’ sense of themselves (Bivens & Haimson, 2016). For instance, Twitter and LinkedIn allow their advertising partners to algorithmically extract users’ gender-based information (Bivens & Haimson, 2016, p. 7), while Facebook forces users to make public personal information, such as legal name, profile picture, and gender. Such requirements may make it more difficult for people to freely, creatively, and comfortably express their gender. Hence, while it is important to note the potential such social media practices hold to accelerate social and political change, it is equally important to underscore “the capacity for software to misgender users under the surface” (Bivens & Haimson, 2016, p. 5) and to safeguard against such possibilities.
THE NEED FOR DATA ON ICT AND GENDER AND SEXUAL MINORITIES
Gathering data about gender and sexual minorities matters because good data demonstrates the existence of gender and sexual minorities, which many repressive governments and cultural groups deny (Williams Institute, 2014); helps destigmatise gender and sexual minorities; documents their experiences and characteristics; and informs policy and programmes (Brown, Herman, & Park, 2017). UNDP points out that data also helps attract donors to support LGBTQI rights and needs, such as HIV/AIDs-related care (UNDP et al., 2016). Various models for gathering culturally relevant data on gender and sexual minorities are beginning to emerge. While there are ethical issues involved in these data gathering efforts, these models could serve as a template for the ICT sector, which lacks actionable data.
The two-step approach is the most recommended available tool for assessing gender identity. This approach asks respondents about both their assigned sex at birth and their self-perceived gender identity at the time of the survey. The single-step approach only records transgender/cisgender status and does not record assigned sex at birth or current gender identity (UNDP et al., 2016). Some government survey tools disaggregate a range of related data: self-identification (i.e., how someone identifies their sexual
orientation); sexual behaviour; sexual attraction (the gender of individuals to whom one feels attracted); gender assignment at birth; gender identity at the time of data collection; and preferred pronoun choice. A number of countries have begun disaggregating gender identity data, including Nepal, whose census data questionnaire includes three gender categories: male, female, and third gender (UNDP & the Williams Institute, 2014). Germany, Bangladesh, Pakistan, and India also recognise third gender in official documents, such as census, passports, and birth certificates (Statistics New Zealand, 2014). The Australian Bureau of Statistics (ABS) and New Zealand’s government are also developing gender identity data collection standards that improve accessibility, interpretability, and comparability of data (Statistics New Zealand, 2014). In the U.S., numerous federal surveys now gather sex and gender-inclusive data (GenIUSS Group, 2014).
The rise of data gathering on gender identity and sexual orientation does raise conceptual and safety issues. The counting, classifying, and surveillance of gender and sexual minorities can be a double-edged sword; traditionally, data generated on this community by observers not connected to LGBTQI movements and communities has led to “results that undermine claims for transgender rights” (Currah & Spade, 2007, p. 2). Data collection tools also need to reflect accurately local and regional gender and sexuality terminology. For instance, in parts of the Middle East, transgenderism is more widely understood than homosexuality, while in parts of Africa, Latin America, North America and Europe, homosexuality — even if outlawed or ostracised — is a term in wider circulation than transgenderism (Currah & Spade, 2007). As UNDP notes, “programmes run by trans people are often more successful in reaching trans communities and meeting their needs” (Currah & Spade, 2007, p. 6). Furthermore, good data depends on the safety of informants, and gender and sexual minorities living under duress may hesitate to partake in a data collection process (UNDP et al., 2016, p. 53). Hence, useful data and protected human rights are contingent on one another.
RECOMMENDATIONS FOR PRACTITIONERS AND POLICY MAKERS
It is imperative that states, ICT sector policy makers, employers, and educators give high priority to the protection of the rights of gender and sexual minorities and their full participation in this sector. To this effect, UN Women, EQUALS, and their partners should consider the following recommendations.
• To end violence and discrimination based on sexual orientation and gender identity, integrate
Taking Stock: Data and Evidence on Gender Digital Equality PART TWO
215
gender and sexual minorities in the framing of the global gender digital divide, and promote the resulting framework via high-profile campaigns tailored for the ICT sector.
• To ensure that the gender concepts in ICT do not mischaracterise people’s self-understanding of their gender or reinforce discrimination, encourage ICT-related institutions and agencies to include gender and sexual minorities in the shaping of gender equality frameworks at all levels.
• To end technology-driven security threats, raise awareness of the threats experienced by gender and sexual minorities communities throughout the ICT sector — with employers, healthcare providers, educational institutions, and human rights activists, among others. This effort could include: integrating digital security practices into the ICT environment of specific communities at risk; supporting capacity building of groups combating cyber threats in LGBTQI communities; providing cyber safety training manuals in various languages and geared toward technology users with varying literacy levels; and encouraging social media providers to adopt cybersecurity measures to prevent their technologies being used to perpetrate crimes.
• To decrease workplace discrimination, train key ICT sector employers about the complexity of gender concepts. Encourage them to implement preferred gender pronoun use in the workplace, provide adequate health care (including gender-affirming surgery and mental health care), ensure the availability of non-discriminatory facilities, and adopt cybersecurity measures that protect the rights of LGBTQI workers.
• To expand the wellbeing of gender and sexual minorities via mobile technologies, mobile phone operators (and their associations, such as GSMA) should reach out to serve the LGBTQI community and protect their privacy.
RECOMMENDATIONS FOR RESEARCHERS
• To undertake research that provides insight into the complex interrelationship of gender and ICT, encourage the collection of disaggregated gender data by ICT-related agencies and by national and international statistical offices.
• To minimise harmful data collection and interpretation, as well as to develop culturally accurate data, include members of gender and sexual minority communities at all levels of data collection; consult best practices guidelines on data collection developed by LGBTQI groups.
• To expand under-served gender and sexual minorities’ access and use of ICTs, such as internet and mobile apps, address the unique needs of those individuals who are also members of other under-represented groups.
• To protect gender and sexual minorities as ICT users, undertake an assessment of the dangers posed by ICTs at the state, private sector and community levels and propose measures to tackle the challenges.
REFERENCES
Anzaldúa, G. (2012). Borderlands/La Frontera: The New Mestiza (4th ed.). San Francisco, CA: Aunt Lute.
Badgett, M. V. L., Hasenbush, A., & Luhur, W. E. (2017). LGBT exclusion in Indonesia and its economic effects. Williams Institute, UCLA School of Law. Retrieved from: https://williamsinstitute.law.ucla.edu/wp-content/uploads/LGBT-Exclusion-in-Indonesia-and-Its-Economic-Effects-March-2017.pdf
Baral, S. D., Poteat, T., Strömdahl, S., Wirtz, A. L., Guadamuz, T. E., & Beyrer, C. (2013). Worldwide burden of HIV in transgender women: A systematic review and meta-analysis. The Lancet infectious diseases, 13(3), 214-222. Retrieved from: http://dx.doi.org/10.1016/S1473-3099(12)70315-8
Bivens, R., and Haimson, O. L. (2016). Baking gender into social media design: How platforms shape categories for users and advertisers. Social Media+Society, 2(4), 1-12. Retrieved from: http://dx.doi.org/10.1177/2056305116672486
Brown, T. N. T., Herman, J. L. & Park, A. S. (2017). Exploring international priorities and best practices for the collection of data about gender minorities: Report of meeting. Los Angeles, CA: The Williams Institute. Retrieved from: https://williamsinstitute.law.ucla.edu/wp-content/uploads/Exploring-International-Priorities-and-Best-Practices-March-2017.pdf/
Buskens, I. & Webb, A. (2014). Women and ICT in Africa and the Middle East: Changing selves, changing societies. London: Zed Books.
Butler, J. (2011). Bodies that matter: On the discursive limits of sex. New York: Routledge.
Carroll, A., & Lucas, R. M. (2017). State-sponsored homophobia: A world survey of sexual orientation laws, criminalisation, protection and recognition. The International Lesbian, Gay, Bisexual, Trans and Intersex Association. Retrieved from: https://ilga.org/downloads/2017/ILGA_State_Sponsored_Homophobia_2017_WEB.pdf
Carrera, M. V., DePalma, R., & Lameiras, M. (2012). Sex/gender identity: Moving beyond

Taking Stock: Data and Evidence on Gender Digital Equality PART TWO
216
fixed and ‘natural’ categories. Sexualities, 15(8), 995-1016. Retrieved from: http://dx.doi.org/10.1177/1363460712459158
Clunaigh, D. O. (2014). Supporting lesbian gay bisexual transgender and intersex human rights defenders in the digital age. Feminist Africa, 18, 124-130.
Connell, R. (2014). The sociology of gender in Southern perspective. Current Sociology, 62(4), 550-567. Retrieved from: http://dx.doi.org/10.1177/0011392114524510
Costello, C. G. (2014). Sexuality in a virtual world. In: M. Stombler, D. M. Baunach, W. Simonds, E.J. Windsor & E.O. Burgess (Eds.), Sex Matters: The Sexuality and Society Reader (178-185). New York: W. W. Norton & Company.
Cross, K. A. (2012). The new laboratory of dreams: Role-playing games as resistance. Women’s Studies Quarterly, 40(3/4), 70-88. Retrieved from: http://muse.jhu.edu/article/493863
Currah, P., & Spade, D. (2007). The state we’re in: Locations of coercion and resistance in trans policy, Part I. Sexuality Research and Social Policy Journal of NSRC 4(4), 1-6. Retrieved from: http://dx.doi.org/10.1525/srsp.2007.4.4.1
Danet, B. (1998). Text as mask: Gender, play, and performance on the internet. In: S. G. Jones (Ed.), CyberSociety 2.0.: Revisiting computer-mediated communication and community. Thousand Oaks: Sage Publications Inc.
Driskill, Q. L., Chris, F., Brian, J. G., & Scott, L. M. (Eds.). (2011). Queer indigenous studies: Critical interventions in theory, politics, and literature. Tucson: University of Arizona Press.
Equals: Global Partnership (n.d.). Retrieved from: https://www.equals.org/about-us
European Union Agency for Fundamental Rights (2013). European Union lesbian, gay, bisexual and transgender survey, results at a glance. Retrieved from: http://fra.europa.eu/sites/default/files/eu-lgbt-survey-results-at-a-glance_en.pdf
Mlambo-Ngcuka, P. (2017). Violence against LGBTI Persons. Executive Director’s Blog Series. Retrieved from: http://www.unwomen.org/en/news/stories/2017/12/op-ed-ed-phumzile-16days-day14.
Fausto-Sterling, A. (2000). The five sexes, revisited. The sciences, 40(4), 18-23. Retrieved from: https://nyaspubs.onlinelibrary.wiley.com/doi/10.1002/j.2326-1951.2000.tb03504.x
Fleming, J. B., Hill, Y. N., and Burns, M. N. (2017). Usability of a culturally informed mHealth intervention for symptoms of anxiety and depression: Feedback from young sexual minority men. JMIR Human Factors
4(3), e22. Retrieved from: http://humanfactors.jmir.org/2017/3/e22/
Free and Equal Campaign (n.d.). www.unfe.org
Frontline Defenders (n.d.). Retrieved from: https://www.frontlinedefenders.org/en/programme/digital-protection
GenIUSS Group (2014). Best practices for asking questions to identify transgender and other gender minority respondents on population-based surveys. Los Angeles, CA: Williams Institute, UCLA Law School.Griffiths, M., Arcelus, J., and Bouman, W. P. (2016). Video gaming and gender dysphoria: Some case study evidence. Aloma, 34(2), 59-66. Retrieved from: www.revistaaloma.net
Hafkin, N., & Huyer, S. (Eds.). (2006). Cinderella or Cyberella: Empowering women in the knowledge society. Connecticut: Kumarian Press.
Halberstam, J. (1998). Female sexualities. Durham: Duke University Press.Halberstam, J. (2018). Trans*: A quick and quirky account of gender variability, Vol. 3. Oakland, CA: Univ of California Press.
Horwitz, S., & Spencer, S. H. (2017). Sessions ends workplace protections for transgender people under Civil Rights Act. Washington Post, October 5. Retrieved from: https://www.washingtonpost.com/local/public-safety/trump-administration-asks-court-to-toss-out-challenge-to-military-transgender-ban/2017/10/05/3819aec4-a9d5-11e7-92d1-58c702d2d975_story.html?utm_term=.afa3b194f875
International Labor Organization (2015). The Promotion of LGBT Human Rights in the Workplace. Retrieved from: http://www.ilo.org/wcmsp5/groups/public/---americas/---ro-lima/---ilo-brasilia/documents/publication/wcms_427588.pdf
James, S. E., Herman, J. L., Rankin, S., Keisling, M., Mottet, L., & Anafi, M. (2016). Executive Summary of the report of the 2015 U.S. Transgender Survey. Washington, DC: National Center for Transgender Equality. Retrieved from: www.USTransSurvey.org
Klawitter, M. (2015). Meta-analysis of the effects of sexual orientation on earnings. Industrial Relations: A Journal of Economy and Society, 54(1), 4-32. Retrieved from: http://onlinelibrary.wiley.com/doi/10.1111/irel.12075/epdf
Landström, C. (2007). Queering feminist technology studies. Feminist Theory, 8(1), 7-26. Retrieved from: http://dx.doi.org/10.1177/1464700107074193
Lopes, C. A., & Bailur, S. (2018). Gender equality and big data: Making gender data visible. New York: UN Women. Retrieved from: http://www.unwomen.org/-/media/headquarters/attachments/sections/library/

Taking Stock: Data and Evidence on Gender Digital Equality PART TWO
217
publications/2018/gender-equality-and-big-data-en.pdf?la=en&vs=3955
Macapagal, K., Coventry, R., Puckett, J. A., Phillips, G., & Mustanski, B. (2016). Geosocial networking app use among men who have sex with men in serious romantic relationships. Archives of sexual behavior, 45(6), 1513-1524. Retrieved from: http://dx.doi.org/10.1007/s10508-016-0698-2
Maizland, L. (2017). Pakistan just issued its first passport with a transgender category: It’s a milestone for trans activists. Vox, June 23. Retrieved from: https://www.vox.com/world/2017/6/23/15861620/pakistan-transgender-passport-human-rights
Marciano, A. (2014). Living in the VirtuReal: Negotiating transgender identity in cyberspace. Journal of Computer-Mediated Communication, 19: 824-838. Retrieved from: https://doi.org/10.1111/jcc4.12081
Mitchell, J. W., Torres, M.B., Joe, J., Gass, T.D.B., & Horvath, K.J. (2017). Usability of a culturally informed mHealth intervention for symptoms of anxiety and depression: Feedback from young sexual minority men. JMIR Human Factors, 4(3). doi: 10.2196/humanfactors.7392. Retrieved from: https://www.ncbi.nlm.nih.gov/pubmed/28842389
Najmabadi, A. (2005). Women with moustaches and men with beards: Gender and sexual anxieties of iranian modernity. Berkeley and Los Angeles: University of California Press.
National Center for Transgender Equality Blog (June 6, 2014). Seven UN agencies: Surgery as a condition of legal recognition is forced sterilization. Retrieved from: https://transequality.org/blog/seven-un-agencies-surgery-as-a-condition-of-legal-recognition-is-forced-sterilization
Office of the United Nations High Commissioner for Human Rights (2011). Discrimination and violence against individuals based on their sexual orientation and gender identity. Retrieved from: https://www2.ohchr.org/english/bodies/hrcouncil/docs/19session/a.hrc.19.41_english.pdf
Raftree, L. (2015). An understanding of LGBTQI rights and technology for development. Technology Salon, May 4. Retrieved from: http://technologysalon.org/an-understanding-of-lgbtqi-rights-and-technology-for-development/
Rice, E., Lee, A., & Taitt, S. (2011). Cell phone use among homeless youth: Potential for new health interventions and research. Journal of Urban Health, 88(6), 1175–1182. Retrieved from: https://www.ncbi.nlm.nih.gov/pmc/articles/PMC3232411/
Rubin, G. (2011). Blood under the bridge: Reflections on ‘Thinking Sex’. GLQ: A Journal of Lesbian and Gay Studies, 17(1), 15-48. Retrieved from: https://doi.
org/10.1215/10642684-2010-015
Snorton, C. R. (2017). Black on both sides: A racial history of trans identity. St. Paul, MN: University of Minnesota Press.
Sørensen, K H., Wendy, F., & Els, R. (2011). Technologies of inclusion: Gender in the information society. Bergen: Fagbokforlaget.
Statistics New Zealand. (2014). Gender identity: Developing a statistical standard. NY: United Nations Department of Economic and Social Affairs Statistics Division. Retrieved from: https://unstats.un.org/unsd/classifications/expertgroup/egm2015/ac289-Bk2.PDF
Stitt, C. (2012). Syndication of broadcast television programs. In: B. Batchelor (Ed.), Cult pop culture: How the fringe became mainstream. Santa Barbara, Denver, Oxford: Praeger.
Stryker, S. (2008). Transgender history. Berkeley CA: Seal Press.
Transgender Europe (n.d.). Violence and hate speech. Retrieved from: https://tgeu.org/issues/violence-hate-speech/
Treinen, S., and Van der Elstraeten, A. (2018). Gender and ICTs: Mainstreaming gender in the use of information and communication technologies (ICTs) for agriculture and rural development. Rome: FAO.
Turkle, S. (1997). Life on the screen: Identity in the age of the internet. New York, NY: Simon & Schuster. Vanita, R., and Kidwai, S. (eds.). (2001). Same-sex love in India: Readings from literature and history. Basingstoke, UK: Palgrave Macmillan.
United States Commission on Civil Rights (2017). Working for inclusion: Time for Congress to enact federal legislation to address workplace discrimination against lesbian, gay, bisexual, and transgender Americans. Retrieved from: http://www.usccr.gov/pubs/LGBT_Employment_Discrimination2017.pdf
United Nations Development Program et al. (2016). Implementing comprehensive HIV and STI programs with transgender people: Practical guidance for collaborative interventions. New York: United Nations Development Program. Retrieved from: http://www.unaids.org/sites/default/files/media_asset/UNDP-et-al_2016_transgender_practical_guidance_collaborative_interventions_en.pdf
United Nations Development Program & the Williams Institute (2014). Surveying Nepal’s sexual and gender minorities: An inclusive approach. Bangkok: UNDP. Retrieved from: https://williamsinstitute.law.ucla.edu/wp-content/uploads/Nepal-Survey-Oct-2014.pdf

Taking Stock: Data and Evidence on Gender Digital Equality PART TWO
218
United Nations General Assembly (2016). Resolution adopted by the Human Rights Council on 30 June 2016. Human Rights Council Thirty-second Session Agenda, Item 3. Retrieved from: http://www.un.org/en/ga/search/view_doc.asp?symbol=A/HRC/RES/32/2
Williams, L. C. (2016). For homeless LGBT youth, simply having a phone can be life-changing. Think Progress. Retrieved from: https://thinkprogress.org/for-homeless-lgbt-youth-simply-having-a-phone-can-be-life-changing-7ea254b96c78/
Women’s World Wide Web. ICTs: Digital tools for connecting and empowering women. Retrieved from: https://www.w4.org/en/icts-and-mobile-technologies-empowering-women/

Taking Stock: Data and Evidence on Gender Digital Equality PART TWO
219

220
TOWARDS UNDERSTANDING THE DIGITAL GENDER GAP IN THE GLOBAL SOUTH34
AUTHORS: ALISON GILLWALD (RESEARCH ICT AFRICA), HELANI GALPAYA (LIRNEASIA), AND AILEEN AGÜERO (DIRSI)35
34 The paper is a result of nationally representative ICT access and surveys carried out in 17 countries across the Global South, which identify the levels and type of digital connectivity, as well as barriers faced by persons 15 years or older. The survey was made possible by the support of the Canadian International Development Research Centre (IDRC). For more details and data, see the After Access website, at www.afteraccess.net.
35 Numerous people have contributed to gathering the data and preparing this chapter, including, Tharaka Amarashinge, Mariama Deen Swarray, Paulo Matos, Onkokame Mothobi, and Ayesha Zainudeen. Thanks to Chenai Chair and Anri van der Spuy for editorial assistance.
2

Taking Stock: Data and Evidence on Gender Digital Equality PART TWO
221
ABSTRACT
Central to the call for digital equality are claims that the internet has the potential to be a driver of accelerated progress towards the achievement of the Sustainable Development Goals (SDGs) contained in the UN’s 2030 Agenda for Sustainable Development. It is important to understand how these benefits are distributed between men and women, and why there appears to be significant unevenness in their adoption at a global and national level. Yet our ability to assess where we stand currently in relation to access and use of the internet, and to measure progress toward achieving SDG targets related to information and communication technologies (ICTs), is constrained by the dearth of reliable data. Data collection is particularly problematic in pre-paid mobile markets: supplier data does not capture the number of unique subscribers, nor does it show users’ demographic characteristics. This research aims to address these data challenges through quantitative and qualitative analysis of ICT access and use across the Global South, and by examining the barriers to online access and the limitations on optimal use. Findings are derived from the After Access 2017 household and individual survey, a nationally representative survey of ICT access and use undertaken by DIRSI, LIRNEasia and RIA, across 17 countries in the Global South36. Households were selected from the national sampling frame using simple random sampling. First, the head of the household was interviewed to obtain household indicators. Next, an individual (15 years or older) was randomly selected from each household to be interviewed about their mobile access and usage. The findings highlight the significant demand-side challenges to achieving SDG ICT goals, including cost of devices and services, low education and associated income levels, digital literacy gaps, and limited availability of local and relevant content. Modelling the data further identifies the factors behind digital inequality that may be masked by aggregated descriptive indicators, and suggests areas of policy intervention to address gender inequality.
KEY FINDINGS
The extent of mobile phone ownership and the gender gap aligns broadly — though not perfectly — with GNI per capita. The richest of the surveyed countries show the lowest gender gap. India, Pakistan and Bangladesh show the largest gender gap in mobile phone ownership and among the largest in internet use.
There are notable exceptions to this pattern. Colombia, with lower overall mobile penetration,
36 Mozambique, Nigeria, Kenya, Ghana, Rwanda, South Africa, Tanzania, Bangledesh, Cambodia, India, Pakistan, Argentina, Paraguay, Colombia, Guatemala, and Peru. Further surveys are underway in Uganda, Senegal, Sri Lanka, Nepal, and Ecuador.
has gender parity in mobile ownership; and in South Africa, with high income disparity, more women than men own mobile phones.
In Africa, education and income are the main determinants of access to the internet. Women are generally less educated, less employed and have lower incomes than men.
In Asia, disaggregating women by income or wealth illustrates the importance of understanding they are not a homogenous group (just as men are not). In Latin America, the main factors affecting the gender gap include both observable characteristics (age, occupation and household characteristics) and non-observable factors that should be taken into account, in country-specific policy interventions.
INTRODUCTION
Central to the call for digital equality are claims that the Internet has the potential to be a driver of accelerated progress towards the achievement of the Sustainable Development Goals (SDGs) and the UN’s 2030 Agenda for Sustainable Development (UNGA, 2015). Goal 5b specifically identifies the enhanced “use of enabling technology, in particular ICTs, to promote the empowerment of women”; SDG 9C is concerned with promoting universal ICT access, and SDG 17.6 with promoting global collaboration on and access to science, technology and innovation (UNGA, 2015).
However, for many of these goals we lack global data needed to establish baselines and to assess progress towards targets. A critical lack is the disaggregated data essential to assess the unevenness of internet access and use, particularly for the Global South, where inequality is greatest.
The limited empirical evidence available at the global level indicates major differences between men and women in the volume, frequency, and quality of ICT access. These digital equality gaps are greatest in the Global South. For example, the latest figures from the United Nations agency tasked with ICT issues, the International Telecommunication Union (ITU), indicate that internet penetration rates are 12% lower for women globally (an increase of one percentage point from 2013, when that rate was 11% lower) (ITU, 2017). While the gender gap37 has narrowed in most regions since 2013, it has widened in Africa, where 25% fewer women than men use the internet. In least developed countries, only one out of seven women use the internet, compared with one out of five men. The only region where a higher percentage of women use the Internet is the Americas (ITU, 2017).
37 The term “gender” is used in this paper in the conventionally restricted context of a binary male/female distinction. This usage reflects the limitations of the available data, rather than a theoretical perspective.

Taking Stock: Data and Evidence on Gender Digital Equality PART TWO
222
Critically, this research fails to assess the intersectional nature of marginalisation. The descriptive indicators used to measure the gap at the national level mask inequalities within and across groups of men and women. As the research summarised below shows, there is considerable disparity in access to the internet among women, within and across countries. Whether living in rural areas or city slums, women located at the intersection of other factors of exclusion, such as class and race (associated with marginalisation in education and employment), will experience even greater digital inequality than women overall.
Before dealing with the challenges of trying to measure digital inequality at the global level, including the “gender digital divide”, it is important to consider the relevance of equality in access and use of the internet to social and economic inclusion in the contemporary world. Claims regarding the potential benefits that ICTs offer women are not yet widely supported by evidence, and it remains important to understand why these benefits are not evenly distributed between men and women. It is equally important to understand the negative implications of ICTs for women — including, for instance, the impact of surveillance or online abuse on women’s rights (e.g., Cummings & O’Neil, 2015, p. 22; Garcia & Manikan, 2014; Buskens & Webb, 2009).
A more holistic understanding is also key to better comprehending the indirect effects of improved internet access on women’s wider communities, including impacts on those who remain unconnected. Empirical evidence supports the notion that social and welfare investments in women have positive multiplier effects on the wellbeing of their family members, broader communities, and society at large (Todaro, 2003, cited in Gillwald, 2009). Ending discrimination against women and girls is, therefore, not only a human rights issue but is also central to harnessing all available human resources for sustainable economic growth and development.
RESEARCH CHALLENGES
The limited research available, especially in the Global South, on the access disparities between men and women has contradictory implications. Some qualitative studies support stereotypes that women are more averse to technology than men, while others show that women embrace digital communication under certain circumstances (Cummings & O’Neil, 2015, p. 9) and others that men and women of similar educations and income adopt and use mobile phones similarly (Gillwald, Milek & Stork, 2011). Little quantitative data delves beyond the descriptive statistics to isolate the factors of inequality and the scale of it, especially with regard to use of Internet. However, quantitative research often raises more questions than it answers. The qualitative research on the subject, which has such an important role to
play in answering gender questions that quantitative research methods cannot, often fails to move beyond anecdotal accounts, and often raises more questions than it answers. To develop a comprehensive evidence base for policy formulation, both qualitative and quantitative methods are required.
Since gender is constructed differently across time and regional location, and because it is impossible to distinguish clearly gender effects from race, class, culture and religion, gender specialists have argued that it cannot be understood as a discrete, quantifiable indicator or even as a separate area of social science. But, as Tepe-Belfrage and Steans point out, “in order to speak to policy makers and to inform and influence discussion and decision-making it is often necessary to produce rigorous gender differentiated data which will elucidate myriad gender inequalities” (Steans & Tepe-Belfrage, 2016, p. 2).
While acknowledging the dangers of treating a binary construction such as male /female as a “coherent and stable category of analysis”, the goal of research-to-policy influence requires us to find sufficiently reflective approaches that do not rely on the crude forms of gender essentialism, often evident in policy and practice, that treat women’s and men’s attributes as universally feminine or masculine (Steans & Tepe-Belfrage, 2016, p. 2).
Besides these methodological and analytical challenges related to defining gender indicators, other issues hamper efforts to better understand and address digital inequalities. These include: the relevance of standard ICT indicators in predominantly prepaid mobile markets in the Global South, used to assess gender inequality; the relevance of existing targets to address gender access discrepancies, in the absence of baseline data; the practical challenges of rigorous and timely data collection; and challenges associated with global comparability.
The survey results described below contribute to filling some of these information gaps in the Global South. They build on previous studies that have attempted to grapple with the challenge of accurate data collection, including gender-disaggregated data, for the purpose of informing policy interventions in developing and emerging economies.
In Asia and the Pacific, LIRNEasia has surveyed access and ownership among lower income populations in several countries, tracking changes over time. The gaps are especially large in South Asian countries compared to the Southeast Asian countries studied. Significant reliance on shared phones was observed among women in South Asia, reflecting the gap in ownership. By 2011, the little internet use observed in South Asian countries was predominantly that of men (LIRNEasia, 2011; Zainudeen et al., 2010).
Similar national surveys conducted by Research ICT Africa across 17 African countries, in 2008 and again in 2012, indicated that in 11 of the countries

Taking Stock: Data and Evidence on Gender Digital Equality PART TWO
223
women generally had less access to ICTs than men (Deen-Swarray et al., 2016; Gillwald et al., 2010). While disparities between men and women in mobile phone ownership flatten out as more people come online, the authors show that gender differences then increase as the technologies and services become more sophisticated and expensive, requiring greater levels of income and education to access and operate them. This is because women are concentrated in the lower income and education levels. The data from the surveys below build on these studies and provide some insights into the diversity between and within regions in the Global South.
The findings of an ICT access and use survey undertaken by DIRSI, LIRNEasia and RIA across 17 countries in the Global South during 2017 (with the exception of Myanmar, which was undertaken during 2016) goes some way to addressing some of the problems identified above. As the survey is nationally representative, the data can be disaggregated based on sex to provide an accurate picture of gender differences in access and — importantly — in use, in prepaid mobile environments. The questionnaire has several questions that track some of the core indicators that have been collected in surveys in Africa, Asia and Latin America for over a decade. It also includes questions on income, education and expenditure that allow for data modelling to identify the real factors contributing to gender inequality, in a way that descriptive statistics cannot.
METHODOLOGY
The After Access38 Survey (2017) of household and individual ICT access and use was conducted using enumeration areas (EAs) of national census sample frames as primary sampling units. The sampling was performed in four steps for households and in five steps for individuals. The national census sampling frames were split into urban and rural EAs, and EAs were sampled for each stratum using probability proportional to size. Two listings were compiled for each EA, serving as sample frames for the simple random selections. Households were then sampled using simple random sampling. An individual 15 years or older (which could be a visitor staying for the night) was then randomly selected and interviewed from each household.
The desired level of accuracy for the survey was set to a confidence level of 95% and an absolute precision (relative margin of error) of 5%. The population proportion P was set conservatively to 0.5, which yields the largest sample size (Lwanga & Lemeshow, 1991).Two weights were constructed for households and individuals, based on the inverse selection
38 Visit ww.afteraccess.net for more reports and data.
probabilities and allowing the extrapolation of the data to national level when applied.39
COMPARATIVE ASSESSMENT ACROSS SELECTION OF COUNTRIES IN THE GLOBAL SOUTH
As Figure 2.1 shows, mobile phone penetration is broadly aligned with GNI (Gross National Income) per capita, though with some strong outliers in each region. Argentina not only has the highest GNI per capita, but its population is almost entirely urbanised and as a result has the highest mobile and internet penetration, confirming this general pattern). Colombia has the second highest GNI per capita as well as internet penetration (along with Peru). South Africa is the only African country in same bracket as Latin American countries in terms of GNI per capita; it has much higher mobile phone penetration than Colombia (similar to Peru), but 20 percentage points lower internet penetration. The African countries have higher mobile phone penetration generally than the Asian countries surveyed. Kenya and Ghana show much higher mobile phone penetration than other African countries (except South Africa); internet penetration, however, stands at only 26% — much lower than for Cambodia, with a similar GNI per capita, at 36%. Nigeria has significantly more internet access than the populous Asian countries with similar GNI per capita — India, Pakistan, and Bangladesh — which have internet coverage similar to that of the lowest income African countries surveyed.
39 For a fuller account of methodology see https://researchictafrica.net/2017/08/04/beyond-access-surveys-questionnaires-methodolo-gy-and-timeframe/

Taking Stock: Data and Evidence on Gender Digital Equality PART TWO
224
Overall, the five Latin American countries surveyed, together with South Africa, are the richest among the countries surveyed and they show the lowest gender gap (Figure 2.2). In contrast, the poorer African countries show high gender disparity in mobile and particularly internet use. However, these disparities are lower than in some higher income Asian countries, where we see some of the greatest disparities in income. The GNI per capita in India and Bangladesh is more in line with that of Ghana and Kenya, but both countries, together with Tanzania, which is also among the poorest countries surveyed, have much lower
gender disparities than the Asian countries surveyed.
Figure 2.2 shows an overall negative correlation between the level of mobile phone penetration and the gender gap in mobile ownership, with some exceptions. Although Colombia has lower mobile than other Latin American countries, it has gender parity in mobile ownership. South Africa, with GNI similar to the Latin American countries — despite having one of the highest income disparities in the world — has more women than men who own mobile phones.
Figure 2.1Mobile phone ownership, internet use, and GNI per capita
Source: After Access Survey, 2017; World Bank, 2017

Taking Stock: Data and Evidence on Gender Digital Equality PART TWO
225
Of all the countries surveyed, India, Rwanda, and Pakistan show the highest gaps between men and women in mobile phone ownership (Figure 2.2). Rwanda and Bangladesh show the highest gender gap in internet use, followed by India, Mozambique, and Nigeria, which has by far the largest population in Africa (comparable to that of Bangladesh) (Figure 2.3). These populous nations thus account for a large number of unconnected women in the Global South, with gender gaps greater than in some of the least developed countries in Africa. The highest gender variance in African mobile ownership is in Rwanda and Mozambique. The internet gender gaps in Rwanda and Mozambique are double those of other developing African countries.
Besides South Africa, of the African and Asian countries surveyed, the only country within range of the Latin American countries is Kenya, with a relatively low mobile phone gender gap of 10% and mobile phone penetration in line with the lower- and middle-income countries of Latin America. Ghana — with a similar GNI per capita in 2016 to Kenya — follows, with a gender gap of 16%. Nigeria, with a GNI per capita twice that of Kenya or Ghana, has a mobile gender gap of 18% and penetration similar to Cambodia.Cambodia has the lowest GNI per capita (and penetration rate) of the countries surveyed in Asia, roughly in line with Ghana and Kenya. Nevertheless, Cambodia’s gender gap for mobile phone ownership
is just 20%, by far the lowest of the Asian countries surveyed — 15 percentage points below Pakistan and Bangladesh, and 25 percentage points below India. With the highest GNI per capita of nearly $2000 in 2016, India has a staggering gender gap: 46% in mobile phone ownership, and 57% in internet access40.
40 Unless otherwise noted, currencies are shown in USD.
Figure 2.2Gender disparity in ownership of mobile phone
Source: After Access Survey, 2017; World Bank, 2017Note: The gender gap is the gap between male and female mobile phone owners (or internet users) as percentages of the male and female population, respectively.

Taking Stock: Data and Evidence on Gender Digital Equality PART TWO
226
Figure 2.3Gender gap in the use of internet
Source: After Access Survey, 2017.
The use of mobile phones for mobile money transactions is minimal or negligible in most of the countries surveyed, and the associated gender gap varies widely in those countries where mobile money is used (Figure 2.4). In Latin America, Paraguay stands out, with over half of both men and women using mobile money. Asia makes the least use of mobile money: even in Pakistan, the Asian country with highest mobile money use, only 13% of men and 12% of women use this service. Much has been written about the demonetisation of specific currency notes in India propelling the wide use of mobile money41, but our numbers in fact show minimal use. In Africa, especially East Africa, mobile money is widely used. Kenya’s now internationally renowned mobile money transfer service, M-Pesa, makes up an overwhelming majority of the mobile money market share in the country; over 70% of Kenyans use mobile money, with only a 4% gap between men and women.
The next sections of the paper examine different aspects of gender digital inequality in the three regions. The section on Africa highlights some intersectional aspects of exclusion, looking at gender in relation to rural/urban location and income, and then seeks to identify the factors contributing to digital gender inequality by modelling the data. The section on Asia highlights the problem of viewing women as a uniform group, showing that a basic disaggregation of rich vs poor illustrates the importance of intersectionality. Finally, the section on Latin America provides an
41 https://www.economist.com/comment/3318625
analysis of the factors contributing to the gender ICT gap, integrating the different dimensions involved in ICT use.
AFRICA
Data for the seven African countries surveyed shows substantial gender disparities in ICT access and use, mostly in favour of men. Modeling of the data shows that the primary determinants of mobile phone ownership and internet access are in fact education and income. Because women are disproportionately concentrated among the uneducated and unemployed, they generally have lower ownership of mobile phones, but as penetration levels increase overall the disparities between men and women reduce, with more women in South Africa owning mobile phones than men. In emergent internet markets, however, where penetration rates are low, the gap between men’s and women’s use of the internet is high; lower-income countries have the lowest penetration rates and the largest gender gaps. Living in urban areas is also associated with greater internet access than in rural areas (where, in some countries, women tend to be concentrated). Women living in urban areas are likely to have better access to the internet than either men or women of a similar education and income living in rural areas.
South Africa, with one of the highest GNIs in Africa, has the highest internet penetration and the lowest

Taking Stock: Data and Evidence on Gender Digital Equality PART TWO
227
Figure 2.4Gender gap in the use of mobile money
Source: After Access Survey, 2017.
gender gap of the countries surveyed. Nigeria — now considered the largest economy in Africa, and with a population four times that of South Africa — has 25% less internet penetration than South Africa, and the internet gap between men and women is the second highest of the African countries surveyed (46%, in favour of men). Kenya has the highest mobile phone penetration (approaching 90%) and a mobile gap of only 10% between men and women. It has much lower internet penetration, however, at 25% — similar to Ghana; both countries also have notably large internet gender gaps (31% and 34%). Interestingly, the internet gender gap in Tanzania is comparable to that of Kenya and Ghana, despite their more developed and dynamic economies (from an ICT perspective) — and much lower than that of the other lower-income, lower-ICT countries, Mozambique and Rwanda, which show the highest gender gap in Africa. Despite being renowned for its prioritisation of ICT and supply-side interventions, Rwanda nevertheless has a pronounced gender gap in both mobile phone ownership and internet penetration.
In South Africa, despite a considerably higher internet penetration rate (nearly 50%), the gender gap has grown, from a minimal level in 2012 to 12% (in favour of men) in 2017. In contrast, in the nearly saturated mobile phone market, the gender gap has shifted in favour of women. In the lower income categories, however, there is not much variance between the sexes, which supports the conclusion that among the poor there are no differences between men and women in terms of
affordability.
Though internet use is still relatively low in most countries, there has been an increase from 2008 to 2017. For less developed countries — Rwanda, Tanzania, and Mozambique, where internet use was less than 3% in 2008 for both sexes — internet use now ranges between about 5% and 20%. In South Africa, where internet uptake is highest for both men and women in comparison to the other countries, the use of internet among women increased at a faster pace than that of men, as lower income people, predominantly women, came online. While internet use among men in South Africa almost doubled from 2008 to 2012 and then again from 2012 to 2017, for women it more than doubled over the same periods.
BARRIERS TO INTERNET ACCESS
In Africa, the cost of devices is the primary barrier for those who are not connected, while for those who are connected the reason for low usage is the price of data services. These continue to be the biggest challenges from a policy perspective. In many countries, however, particularly in the predominantly rural populations, access to electricity is a greater challenge than access to mobile coverage.
Both men and women adopt multiple strategies to access the internet. The greater use of free public wi-fi

Taking Stock: Data and Evidence on Gender Digital Equality PART TWO
228
by women suggests greater price sensitivity. The use of free wi-fi is common in Rwanda and South Africa, which have rolled it out as part of their national access strategies. In both countries, more women than men use free public wi-fi (47.1% and 31.2% respectively).
In the African countries surveyed, men are generally more aware of the internet than women; this is consistent with the hypothesis that education is one of the major determinants of women’s access to and use of the internet. In the Southern African countries (South Africa and Mozambique), lack of awareness of what the internet is or what it can be used for no longer seems to represent a significant barrier to its use. However, lack of awareness remains the biggest challenge for the West African countries surveyed (Nigeria and Ghana) and for women in Kenya. In Ghana and Nigeria, similar percentages of men and women say they do not know what the internet is, while in Kenya the number of women who indicate this as a barrier is more than double that of men.
The gender gap in access to and use of ICTs is evident in both rural and urban locations, with more men than women having access to or using a particular ICT. The gender gap for mobile phone ownership is slightly higher in urban than in rural areas. Smartphone ownership shows a wider gender difference in rural areas (at 6.5%) than in urban areas (at 4.1%).
Knowledge of the internet is lowest among women in rural areas, where less than 35% of women indicate that they know what the internet is.
Interestingly, there is also a difference in ICT access and use among women in different locations. Women in urban areas are exposed to and use ICTs more than women in rural areas. The difference is more than double across all indicators except for mobile phone ownership.
INTERSECTING FACTORS
The disparity is not always in favour of men, especially when the disaggregation is location-specific. Table 2.2, which aggregates urban and rural data across all countries surveyed, shows that women in urban areas access and use ICTs more than men in rural areas. This indicates that the gender gap is affected by other factors such as location. Where women are at the intersection of multiple factors of inequality, they are the most disadvantaged: rural women are worse off than either urban women or rural men.
Table 2.1Main reasons cited for not using the internet
Source: After Access Survey, 2017.

Taking Stock: Data and Evidence on Gender Digital Equality PART TWO
229
Guided by the descriptive statistics discussed above, the study further analyses the data using binary regression techniques. The logistic regression models developed allow us to investigate the factors affecting ICT access and use and to establish the direction of inequalities. The study models the probability of ICT access and use by plotting the binary variables, mobile phone ownership and internet use, against selected demographic and socioeconomic variables.
For six of the countries studied, the sex of respondents shows a significant and negative correlation with mobile phone ownership. In South Africa, however, the relationship is significant and positive, indicating that women there are more likely to own a mobile phone than men, unlike in the other countries surveyed. The significance of the relationship (in either direction) implies that the sex of the person influences the probability of an individual owning a mobile phone.
As in the 2008 and 2012 studies, this study shows that higher levels of income and education are correlated with ownership of a mobile phone. Education in particular maintains a positive and significant correlation throughout. Location and age are also significant influencers of mobile phone ownership: those living in rural areas are less likely to own a mobile phone than those in urban areas, and in most countries younger people are more likely to own a mobile phone.
The analysis shows that in rural South Africa, higher income does not necessarily translate into increased mobile phone ownership, indicating the strong influence of other factors such as urban or rural location, and (related) proximity to infrastructure42. A female individual is more likely than a male to own a mobile phone, supporting the initial descriptive findings. In Kenya, however, while a woman is generally less likely than a man to own a mobile phone, in urban areas women are more likely to own a mobile phone than men.
The regression analysis shows that sex, income, education, and location are all significant determinants of whether people use the internet. Women show lower use of the internet, which supports the descriptive findings that women show lower internet use in all seven countries surveyed. People with higher levels of income and education are more likely to be online than those with lower income and education levels. Also, those in rural areas are less likely to be connected. These may be contributing factors to the gender disparities in internet use, as women are more likely to be poorer, less educated, and rural.
42 This may reflect inability to use a mobile device or lack of a good signal (in very remote areas; there is over 95% 3G coverage in South Africa).
Table 2.2Urban-rural gender comparison on ICT access and use
Source: After Access Survey, 2017.

Taking Stock: Data and Evidence on Gender Digital Equality PART TWO
230
In summary, modelling shows that the main determinants of this digital gap between men and women are education and income. These two factors are, in turn, likely to be determined by cultural and social factors, which are more likely to be captured through qualitative research. In 2017, when Research ICT Africa ran focus groups — as a pre-test for the After Access surveys and to explore gender matters arising from the 2012 survey — some of these “softer” issues also emerged.
For instance, a woman in the village, even if she wanted to use a cyber [café], she will not do that. Imagine being in the cyber at 7 pm and you are expected to be at home cooking, taking care of cows, etc. Even if you have a child abroad and you want to communicate with them, it becomes very difficult. — Peri-urban female internet user, Kenya (Chair, 2017, p. 34)
Though internet use is still relatively low in most countries in Africa, there has been a significant leap from 2008 to 2017. Women, however, still lag behind men in the use of the internet, and this is mainly as a result of their relatively low levels of education and income.
ASIA
The five Asian countries surveyed present a sobering picture of gender disparity. Two of them, India and Pakistan, account for the highest gender gap in mobile ownership among all countries surveyed, with Bangladesh not far behind (Figure 2.1). Given those
countries’ large populations, these gender gaps account for a disproportionate share of the overall Global South gender gap.
These three countries have often been considered highly “affordable” markets for mobile voice and data services for nearly a decade43. Yet, when income is disaggregated by gender, we see the affordability disparity. In India, for example, women on average earn one fourth as much as men, making mobile services significantly unaffordable to them, regardless of income decile.
Gaps in education both cause and exacerbate these income disparities: the mean number of years of education received by women in India is half that of men (Table 2.3). Even when the education gap is not significant (as in Bangladesh), a substantial income gap remains: men earn almost twice as much as women. Note that these income statistics are for women who have income, and labour force participation is lower among women than men. Therefore, both employed women and those not formally employed are less able to afford ICTs.
43 These three countries were among the first in Asia to drop below $5 total cost of mobile ownership in 2009 (including monthly rental, voice, SMS, connection, and handset costs). According to the 2017 ITU regional price database (unpublished), Bangladesh is placed 3rd in cost of 1GB of data, while India and Pakistan are placed 6th and 7th. More recent benchmarks by the Alliance for Affordable Internet show that Pakistan is close to meeting its target of 2GB of data at under 1% of GNI, currently at 1.2% of GNI.

Taking Stock: Data and Evidence on Gender Digital Equality PART TWO
231
Table 2.3Income and education statistics disaggregated by gender
Source: http://hdr.undp.org/en/composite/GDI, https://data.worldbank.org/Note: *Income of employed individuals.
Analysis of nationally representative survey data also show how education and income inequalities contribute to mobile phone non-ownership among women. A binary logistic regression model was used, where mobile adoption is modelled as the dependent variable, taking a value of 1 for adopters and 0 for non-adopters; the results give the change in the odds (directly related to the probability) of mobile adoption assignable to a unit increment of the independent variable. The model (detailed in Perampalam et al., 2016) showed that the completion of secondary and tertiary education is a significant predictor of mobile phone adoption.
For Myanmar, the completion of secondary education is associated with a 55% increase in the odds of mobile adoption, while the completion of tertiary education, though limited to a small percentage of the population, is associated with a 378% increase in the odds of adoption. Similarly, being employed is associated with an 84% increase in the odds of mobile phone adoption.
However, the same binary logistic regression model showed the complicated and intertwined nature of mobile access with gender, income, and cultural factors. The gender disparity persisted even after accounting for all the independent variables that show a statistically significant impact on mobile phone adoption (such as secondary and tertiary education, proportion of friends with mobile phones) and others that are direct or indirect indicators of wealth (such as employment status, monthly household expenditure,
TV and electricity in the household, and age). After controlling for all these contributing factors, being a woman in Myanmar still reduces the chance of mobile phone ownership by fully 42%. This finding was surprising, since women hold important status in Myanmar society, in comparison to its South Asian neighbours (see, among others, Sein, 1972; Ikeya, 2005/2006; Kawanami, 2007). Ethnographic observations detailed in Zainudeen and Galpaya (2016) showed that women are the “chief financial officers” of the family, receiving money from employed family members and allocating and managing the budget. A woman decides when her family has sufficient funds to purchase a phone. Yet, because these women have little technical knowledge and few opportunities to obtain it, they are not involved in the decision of which phone to purchase. Furthermore, when the phone is purchased, it then “travels” with the person who works or studies outside the home. So, even if a woman is working from home as well as managing the family finances, she is unlikely to have access to the phone for significant hours each day.
The gender gap lies at the intersection of other forms of marginalisation: gender, income, education, urban/rural, and cultural identity. Therefore we cannot treat men and women as homogenous social groups. When our survey data is disaggregated by income, the chasms become apparent between “rich” women (those earning above the national mean income) and “poor” women (those earning below the national mean income). When non-users were asked about

Taking Stock: Data and Evidence on Gender Digital Equality PART TWO
232
Figure 2.5Reasons for not using the internet among women, disaggregated by household income (% of non-internet users, among women aged 15–65 years)
Source: After Access Survey, 2017
the reason for not using the internet, a considerably higher percentage of poor women than rich women responded that they did not know what the internet is (Figure 2.5). Similarly, in Pakistan, nearly 30% of poor women found it challenging to afford the digital device
(phone, computer), compared to only 6% of richer women (Figure 2.5).
For women accessing the internet, gender also impacts their online experience — how much time they spend online and what content they access. As a follow-up to the Myanmar survey, in 2017 we conducted semi-structured interviews with 98 men and women who had been using the internet for at least a year. Both men and women reported that their social media accounts (mainly Facebook) were regularly hacked. In fact, not everyone even knew that Facebook required a password. Many men and women had their Facebook account (username and password) created by the shop workers who sold them their phones.
While hacking was the main challenge for men, the women worried about more varied online challenges. In particular, many women worried about a stranger downloading a photo from their Facebook feed, editing (“photoshopping”) it to impose a naked body or manipulating it in other ways and circulating it via
social media in a manner that would draw attention or shame to them, often as a precursor to extortion. The result was that women self-censored their online behaviour by limiting or avoiding the posting of photos of themselves, or by only posting photos that they believed could not be manipulated.
It is pretty rare that a full body image pictures [is posted by me]. Maybe just my head or only the upper part of my body… I have heard that it is easier to make photoshop out of full body images. — Female, 25 years, Yangon, Myanmar
A friend of mine likes to wear trendy revealing clothing, and her pictures are used by people with bad intentions. Through the messenger, they threaten her by using pictures of her. They said they will change it into pornographic picture. She got that a couple of times.

Taking Stock: Data and Evidence on Gender Digital Equality PART TWO
233
— Male, 28 years, Yangon, Myanmar
Many respondents, men and women, had multiple Facebook accounts in order to navigate multiple identities. Women did so by creating a separate account and listing their gender as male or adopting a male name, or by posting their husband’s photo as their profile picture. Other women signalled they were “unavailable” for sexual advances and harassment (by often unknown men) by posting photos of their husband and children. Others simply avoided opening an account for themselves at all, preferring to share the account of a male relative and limit their use to simply browsing the news feed. Many felt it was easier to engage in certain public online conversations while using their “male” accounts, even when they had a female account they used to connect with friends and family. More specifically, it was “easier” to engage in sensitive conversations related to religion and politics if one was seen to be a male belonging to the main ethnic group, Bamar. For example, many Kachin women and men, whose Kachin ethnicity can be often identified with their name, had an account in a non-Kachin, Bamar name. So, in fact, Kachin women are harassed online both as women and as Kachin (minority ethnicity) — highlighting that “women” is not a single, uniform category.
From a gender perspective, there are issues to be tackled on multiple fronts in order to achieve equitable and meaningful access for all. The gaps in mobile and internet access seem to be worse in the Asian countries than in Africa and Latin America. Key challenges for women in the Asian countries relate to skills (in turn related to education) and economics. The lack of skills is a particular barrier preventing them from getting online; for those who are online, it can leave them vulnerable to privacy and safety threats. Affordability, as measured by average data prices as a percentage of per capita income, is a particular barrier for “average” women, who often earn less than men, or don’t have their own incomes at all; the situation may be even more worrying if lower income deciles are analysed.
While disparities in education and income may explain a large component of the gender gap in mobile and internet access, the “pure gender effect” still plays a role in determining and conditioning women’s access, as the Myanmar case demonstrates. Deeply embedded in this effect are the social and cultural norms and attitudes that are not measured in the other explanatory variables. What this means is that there are greater and deeper concerns that need to be addressed in these societies: change is needed in the attitudes and perceptions that shape the ways in which women gain access to technology and are able to make use of it.
While attitudes and perceptions are not easy to change in the short term, a good starting point may be to focus on more tractable solutions that can help women to become (and stay) affordably connected, and to provide them with the skill set to make use of the host of services and platforms offered through mobiles and
the internet, in a safe and secure way — and perhaps even earning a living from these opportunities.
LATIN AMERICA
Women represent more than 50% of the total Latin American population 44; here, as in many parts of the world, they face a set of barriers that result in unequal conditions for them relative to their male peers. Particularly in this region, women are overrepresented in lower income quintiles, informal labour sectors, and low-payment activities. According to the International Labour Organisation (ILO, 2016), the unemployment rate for women is around twice the level as for men, they receive lower wages in all occupational segments, and they face worse labour conditions.
Although there have been significant advances towards gender equality in accessing the basic levels of education, women remain underrepresented in STEM fields (science, technology, engineering, and mathematics). These differences are more pronounced at the highest levels of academic and professional hierarchies (Castillo et al., 2014; UNESCO, 2015a).Gender disadvantages are also evident in other social and cultural contexts. Women face entrenched discriminatory social norms and persistent structural barriers: early motherhood, gender-based violence, and gendered division of household labour, among others (UNESCO, 2015b).
The ICT field is not an exception. Opportunities to access and use the internet are not evenly distributed between men and women (Gray et al., 2016), and factors such as the ones mentioned above contribute to gender differences in ICT use (Robinson et al., 2015). However, the existing literature about this topic is scarce, especially for Latin America, and a comprehensive analysis becomes more challenging when attempting to include all the different dimensions of ICT use (including mobile ownership, mobile use experience, mobile apps use, e-banking and e-commerce, internet use, and type of internet use).
In this section of the paper, we analyse the factors that determine the gender gap in ICT use, integrating these different dimensions. We first describe the components of the proposed ICT index and estimate its value for each country in the After Access Latin American sample. Then we briefly describe the quantitative methodology used to identify the factors underlying the ICT gender gap and provide the most important results. We conclude the section by explaining the ICT gender differences.
44 World Bank Indicators (2017) https://datacatalog.worldbank.org/dataset/world-development-indicators.

Taking Stock: Data and Evidence on Gender Digital Equality PART TWO
234
THE ICT INDEX FOR FIVE LATIN AMERICAN COUNTRIES
The ICT index for the Latin American region consists of two sub-indexes and eight indicators. The first sub-index is related to mobile phone use and includes the following variables: smartphone ownership, mobile use experience, mobile application use, and mobile banking and e-commerce. The indicators in this sub-index are mainly related to the more modern uses of mobile phones; for example, it includes only smartphone ownership (excluding “basic phones” lacking internet access). It also takes into account the use of a wide variety of mobile applications (nine different types).
Similarly, the second sub-index includes internet use and has the following four indicators: internet use, internet use experience, internet devices, and online activities45.
45 The ICT index is the simple average of the eight normalised indicators. The normalisation process is needed to make sure that all the indicators are in the same scale, and it follows this formula: x=x-xminxmax-xmin
Figure 2.6 shows the average values of the ICT index for each country of the Latin American After Access survey, including values by gender; this provides an approximation on the indicators described above. In particular, Argentina and Colombia have the highest average values for the index, which means that both countries have a wider variety and higher intensity of ICT use. These countries show more advanced use in terms of mobile phones (level of ownership and number of applications used), internet, and social media. On the other hand, Paraguay and Guatemala show the lowest levels of use in the region. The overall range is quite narrow, however — between 34.7% and 41.5%.
In terms of gender differences, Peru and Guatemala exhibit the largest disadvantages for women. In both countries, women’s use of mobile phones, internet, and social media is about 18% lower than their male peers, compared to Argentina, Colombia, and Paraguay which show a difference of just 5%. The main objective of this section is to identify the major factors underlying this gender inequality.46
46 The definition of the ICT gender gap used here is the same as proposed in the previous sections.
Figure 2.6The % ICT index by country and gender (average values)Figure 2.6aBy country
Source: Authors’ elaboration based on After Access Survey, 2017.
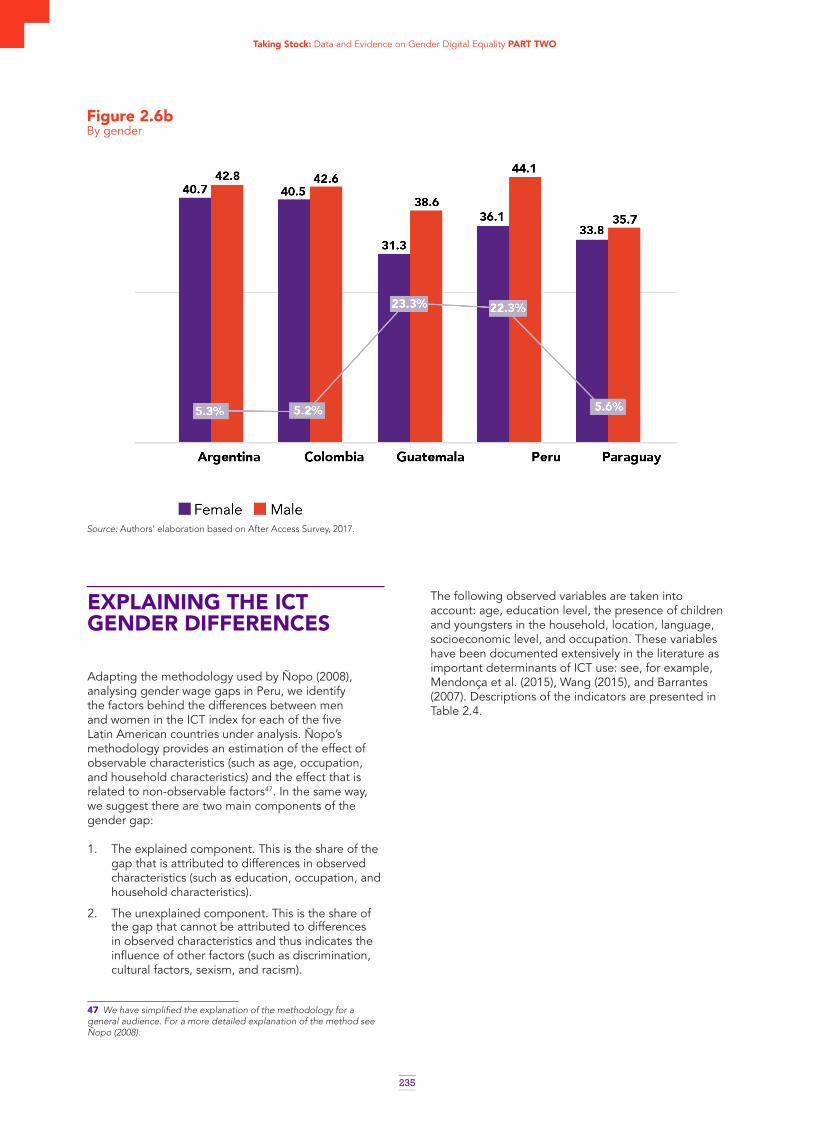
Taking Stock: Data and Evidence on Gender Digital Equality PART TWO
235
Figure 2.6bBy gender
Source: Authors’ elaboration based on After Access Survey, 2017.
EXPLAINING THE ICT GENDER DIFFERENCES
Adapting the methodology used by Ñopo (2008), analysing gender wage gaps in Peru, we identify the factors behind the differences between men and women in the ICT index for each of the five Latin American countries under analysis. Ñopo’s methodology provides an estimation of the effect of observable characteristics (such as age, occupation, and household characteristics) and the effect that is related to non-observable factors47. In the same way, we suggest there are two main components of the gender gap:
1. The explained component. This is the share of the gap that is attributed to differences in observed characteristics (such as education, occupation, and household characteristics).
2. The unexplained component. This is the share of the gap that cannot be attributed to differences in observed characteristics and thus indicates the influence of other factors (such as discrimination, cultural factors, sexism, and racism).
47 We have simplified the explanation of the methodology for a general audience. For a more detailed explanation of the method see Ñopo (2008).
The following observed variables are taken into account: age, education level, the presence of children and youngsters in the household, location, language, socioeconomic level, and occupation. These variables have been documented extensively in the literature as important determinants of ICT use: see, for example, Mendonça et al. (2015), Wang (2015), and Barrantes (2007). Descriptions of the indicators are presented in Table 2.4.

Taking Stock: Data and Evidence on Gender Digital Equality PART TWO
236
Table 2.4Determinants of ICT adoption
Source: Authors’ elaboration based on After Access Survey, 2017.
Table 2.5 shows the kind of relationship found between the ICT index and the variables described in Table 2.4. In particular, people in higher socioeconomic and education levels and those who live with children and young adults show advantages regarding mobile, internet, and social media use.
In contrast, being an older adult, speaking a local language, and living in a rural location show a negative relationship with the proposed ICT index. Regarding occupation, there are different types of relationships for each employment category, but the outstanding ones are related to “employer”, showing a positive relationship, and “non-active people” showing a negative relationship48.
These results show the strong association between the variables related to digital disadvantages (low educational levels, rural location, or ethnic issues) and those related to social disadvantages in general. As Kularski and Moller (2012) highlight, digital exclusion is caused (and reinforced) by traditional dimensions of inequality, such as socioeconomic level or race. Nevertheless, the digital divide is a complex phenomenon, and social and digital inequalities do not always move together (Bauer, 2016). An interesting example is the presence of children in the household. According to Ñopo (2010), having children could imply a significant negative effect for women in terms of wage and labour status. However, regarding technologies, younger people in the household could have an important role in the process of internet
48 The category “non-active people” refers to those who are currently not employed, not looking for work, and not studying.
adoption by other older household members (Barrantes & Cozzubo, 2017).
On the other hand, it is important to highlight that the types of relationships shown in Table 2.5 are relevant to a better understanding of how personal and household characteristics contribute to widening or narrowing the ICT gender gap. For example, being highly educated represents an advantage in terms of the ICT index; in this sense, if women are less educated than men, education would be a factor that contributes to widening the ICT gender gap.
Figure 2.7 shows the contribution of each independent variable to the ICT gender gap. Bars with positive values indicate the percentage increase in the ICT gender gap associated with inclusion of a specific factor. For instance, gendered occupations contribute to increasing the gap by 2.5%; this means that if there were no structural differences in occupation between women and men, the gap would be 7.5% in the five Latin American countries instead of around 10% — the actual average gap (illustrated in Figure 2.6b). A negative sign means that the particular factor reduces the ICT gender gap.
As indicated in Figure 2.7, education, socioeconomic level (SEC), occupation, and the presence of children in the household are factors that contribute to widening the ICT gender gap, disfavouring women. The first three factors are well documented in the literature (Castillo et al., 2014; ILO, 2016; UNESCO, 2015). Women in the region have fewer educational opportunities, belong to lower SECs, and are

Taking Stock: Data and Evidence on Gender Digital Equality PART TWO
237
Table 2.5 Preliminary analysis – Observed effects of independent variables
Source: Authors’ analysis. Note: Based on multiple regression analysis using the After Access Survey 2017. In all the cases there is a 99% statistical significance.
overrepresented in informal and low-profit labour segments. On the other hand, having children in the household is seen to have little overall impact on the gender gap, because its effect is not one-directional. Children may have an important positive role in increasing technology adoption and use by older household members (Barrantes & Cozzubo, 2017). However, since women are disadvantaged in terms of domestic division of labour, the presence of children in the household significantly increases the demand on women’s time, allowing them less free time (Beltran & Lavado, 2014) — less time for informational development. Overall, the negative effect prevails: the presence of children in the house widens the gap by 0.4%. Finally, the ICT gender gap was reduced by age and rural location and local language49.
Figure 2.8 shows the part of the ICT gender gap that remains unexplained after including the analyzed
49 Women who are older or who speak a native language and live in a rural location are generally at a greater disadvantage than men with these characteristics. This comes from a previous regression analysis (see Table 2.5). However, Figure 2.7 shows a decomposition analysis in which both factors negatively influence the ICT gender gap, and this is related to the distribution of the sample and the general population in these countries (CEPAL, 2005).
factors (age, education, children, rural, language, SEC, and occupation). This unexplained component is usually described in the literature as related to factors of culture, stereotype, and sexism, among others. Interestingly, in Argentina, Colombia, and Paraguay, the ICT gender gap is explained entirely by the analyzed factors (education, SEC level, and occupation) and the unexplained component is not statistically significant. Conversely, in Guatemala and Peru, other factors such as gender stereotypes and sexism apparently have an important effect on ICT gender disadvantages, representing more than the half of the ICT gender gap.
Highlighting these factors could help policymakers design policies for reducing the ICT gender gap most effectively in each country. For example, in Argentina, Colombia, and Paraguay the focus should be on improving the educational and labour opportunities for women, while in Peru and Guatemala, addressing gender stereotypes and sexism is critical.

Taking Stock: Data and Evidence on Gender Digital Equality PART TWO
238
Although not as stark as this in all countries, the main results show that digital inequality will not disappear even when those currently marginalised from services — disproportionately women, in most countries surveyed — become connected. From a policy perspective, it is clear that demand-side interventions that address not only affordability but also e-literacy and education, are as critical to digital inclusion as supply-side connectivity measures. Moreover, as
the Latin-American cases show, there are deeply entrenched factors such as social and cultural norms, including attitudes towards women, that need to be taken into account when analyzing women’s access and use of ICT.
Figure 2.7 Independent variable contribution to the explained ICT gender gap
Source: Author’s elaboration based on After Access Survey, 2017.

Taking Stock: Data and Evidence on Gender Digital Equality PART TWO
239
Figure 2.8Confidence Intervals for the unexplained gap by countries (full set of independent variables)
Source: After Access Survey, 2017. Authors’ own elaboration
CONCLUSION AND RECOMMENDATIONSNationally representative surveys of ICT engagement enable the disaggregation of indicators to show the disparities between men and women. In prepaid mobile markets — even with SIM card registration — this is the only way to obtain sex-disaggregated data. Supply-side data based on active SIM cards cannot identify unique subscribers or their gender; moreover, surveys show that individuals have multiple SIMS, as part of their access and affordability strategies. Similarly, descriptive indicators reported at the national level can mask digital inequalities between men and women and can fail to detect the specific factors determining the uneven take-up of ICTs, as well as inequalities that may exist among women and among men. Through a survey, sex-disaggregated data can be linked to other indicators, such as income, education, location, age — all critical for identifying points of policy intervention required to address the ICT gender gap.
In many countries, the data shows that merely by connecting those individuals currently marginalised from services — who are disproportionately women, in most countries surveyed — digital inequality will not be resolved. Demand-side interventions, that enhance not only affordability but also e-literacy and education, are as critical to digital inclusion as are supply-side connectivity improvements. Moreover, as seen in the Asian and Latin American cases, deeply entrenched factors of social and cultural norms and attitudes towards women need to be taken into account when analysing women’s access to and use of ICT.
Although further investigation is needed, it appears that ICT adoption and diffusion through commercial models is associated with high education and income levels of early adopters, showing low levels of gender variance in societies and economies that do not structurally disadvantage the participation of women. As more users come online, greater gender disparities in ICT access and use may reflect gender disparities in relation to education and income (employment); but as prices of devices and services come down and poorer people (disproportionately women) come online,

Taking Stock: Data and Evidence on Gender Digital Equality PART TWO
240
markets begin to saturate and the figures for men and women tend to equalise. Initiatives to make internet use more affordable and thus lower the income barrier for men and women would reduce the gender gap in internet access.
RECOMMENDATIONS FOR PRACTITIONERS AND POLICYMAKERS
Effectively redressing digital inequality will require transforming the structural inequalities that perpetuate economic and social exclusion and that are simply mirrored — and sometimes amplified — in the digital world. As women are concentrated among the most marginalised in society, initiatives that make internet use more affordable and accessible are likely to contribute to reducing the gender gap in internet access. While affordability remains the primary barrier to digital inclusion from a policy perspective, it is clear that demand-side interventions are as critical to digital inclusion as supply-side measures. Demand-side policy initiatives will have to extend well beyond the communications sector to redress disparities between men and women’s access to the internet. Since education and income are the primary determinants of gender inequality in ICT access and use, sustained intersectoral state co-ordination will be required, going beyond the telecom sector. Moving beyond consumer measures of digital equality to digital production, we can predict that inequality in education will become even more significant in perpetuating gender inequity, unless access to education and employment at all levels, in most developing countries, is transformed.
RECOMMENDATIONS FOR RESEARCHERS
The dominant research on ICT and gender is binary in its conceptualisation, reducing gender to the distinction of women and men. It is important to find ways of developing indicators for other gender categories, as well as ways that these can be safely examined, especially where such groups and individuals are marginalised and even victimised on the grounds of their sexuality. This research priority presents a challenge that the United Nations, as a rights-based body, needs to address, with the support of research communities. Even within the narrow confines of gender as currently defined, there is still a dearth of rigorous quantitative research on digital inequality between men and women. Such research needs to delve beyond descriptive statistics to model the available data, to understand factors of exclusion and to better inform policymakers. Further, many gender research questions cannot be answered by quantitative analysis and instead require qualitative and hybrid research approaches. Deeply entrenched factors, such as social and cultural norms and practices, are best
explored through qualitative research and theory. Effectively redressing digital inequality will require transforming the structural inequalities that perpetuate economic and social exclusion and that are mirrored, and sometimes amplified, in the digital world. Political economy research that examines relations of power and interests in relation to gender can provide insights into the nature of digital inequality and how it might be structurally addressed.
REFERENCES
After Access (2017). Household, individual and business surveys. DIRSI, LIRNEASIA, & Research ICT Africa. Retrieved from: www.afteraccess.net
Aker, J., & Mbiti, I. (2010). Mobile phones and economic development in Africa. Journal of Economic Perspectives, 24(3). Retrieved from: https://doi.org/10.1257/jep.24.3.207
Beltran, A., & Lavado, P. (2014). El impacto del uso del tiempo de las mujeres en el Perú: United Nations recurso escaso y poco valorado en la economía nacional. Lima, Peru: Instituto Nacional de Estadística e Informática (INEI). Retrieved from: http://cisepa.pucp.edu.pe/wp-content/uploads/2015/11/El-impacto-del-uso-del-tiempo-de-las-mujeres-en-el-Per%C3%BA-Un-recurso-escaso-y-poco-valorado-en-la-econom%C3%ADa-nacional.pdf
Barrantes Cáceres, R. (2007). Digital poverty: Concept and measurement with an application to Peru. Kellogg Institute Working Paper no. 337. Retrieved from: https://kellogg.nd.edu/sites/default/files/old_files/documents/337_0.pdf
Barrantes Cáceres, R., & Cozzubo Chaparro, A. (2017). Age for learning, age for teaching: The role of inter-generational, intra-household learning in Internet use by older adults in Latin America. Information, Communication & Society, 1–17. Retrieved from: https://doi.org/10.1080/1369118X.2017.1371785
Bauer, J.M. (2016). Inequality in the information society. Quello Center Working Paper. Retrieved from: http://ssrn.com/abstract=2813671 or http://dx.doi.org/10.2139/ssrn.2813671
Buskens, I. & Webb, A. (Ed.) (2009). African women and ICTs: Investigating technology, gender and empowerment: Creating new spaces with technology. London: IDRC, ZED
Castillo, R., Grazzi, M., & Tacsir, E. (2014). Women in science and technology. What does the literature say? Inter-American Development Bank Institutions for Development, Technical Note No. IDB-TN-637.
Chair, C. (2017). Internet use barriers and user strategies: Perspectives from Kenya, Nigeria, South Africa and Rwanda. Beyond Access Public Policy Paper

Taking Stock: Data and Evidence on Gender Digital Equality PART TWO
241
Series: Policy Paper 1. Retrieved from: http://www.researchictafrica.net/home.php?h=205
Cummings, C. & O’Neil, T. (2015). Do digital information and communication technologies increase the voice and influence of women and girls? A rapid review of the evidence. ODI. Retrieved from: https://www.odi.org/sites/odi.org.uk/files/odi-assets/publications-opinion-files/9622.pdf.
Deen-Swarray M., Gillwald, A., Morrell, A. & Khan, S. (2016). Lifting the veil on ICT gender indicators in Africa. Evidence for ICT Policy Action, Policy paper 13. Retrieved from: https://www.researchictafrica.net/publications/Evidence_for_ICT_Policy_Action/Policy_Paper_13_-_Lifting_the_veil_on_gender_ICT_indicators_in_Africa.pdf
Deen-Swarray, M. Gillwald, A. & Morrell, A. (2012). Lifting the veil on ICT gender indicators in Africa. Evidence for ICT policy Action: Policy paper 13. Available at: www.researchictafrica.net.
Ganesh, M.I. (2016). The new green: The landscapes of digital activism (Editorial). Arrow for Change 22(1): Sexuality, sexual and reproductive health and rights, and the internet. Retrieved from: Asian-Pacific Resource & Research Centre for Women. www.arrow.org.my/wp-content/uploads/2016/08/AFC22.1-2016.pdf
Garcia, L.S. & Manikan, F.Y. (2014). Gender violence on the internet: The Philippine experience. APC/FMA/Dutch Ministry of Foreign Affairs. Retrieved from: http://www.genderit.org/resources/gender-violence-Internet-philippine-experience
Gillwald, A. (2009). Wire Less: A decade of telecommunications reform in South Africa. Unpublished doctoral dissertation. Witwatersrand University.
Gillwald, A., Milek, A. & Stork, C. (2010). Gender assessment of ICT access and usage in Africa 2010. RIA Policy Paper, Vol 1, Paper 5. Retrieved from: https://goo.gl/8behvk
Gray, T., Gainous, J., & Wagner, K. (2016). Gender and the digital divide in Latin America. Social Science Quarterly, 98(1). Retrieved from: https://doi.org/10.1111/ssqu.12270
Ikeya, C. (2005/2006). The “traditional” high status of women in Burma: A historical reconsideration. Journal of Burma Studies, 10, 51–81.
ILO (International Labour Organization). (2016). Las mujeres en el trabajo: Tendencias de 2016.
International Telecommunication Union (ITU). (2017). ICT Facts and figures 2017. Retrieved from: https://www.itu.int/en/ITU-D/Statistics/Documents/facts/ICTFactsFigures2017.pdf
Jensen, R. (2007). The digital provide: Information (technology), market performance, and welfare in the South Indian fisheries sector. Quarterly Journal of Economics, 122 (3), 879-924.
Kawanami. (2007). The bhikkhuni ordination debate: Global aspirations, local concerns, with special emphasis on the views of the monastic community in Burma. Buddhist Studies Review, 24 (2), 226–244.
Kovacs, A. (2017). “Chupke, Chupke”: Going behind the mobile phone bans in North India. Retrieved from: https://genderingsurveillance.Internetdemocracy.in/phone_ban/
Kularski, C. M., & Moller, S. (2012). The digital divide as a continuation of traditional systems of inequality. Sociology, 5151(December), 1–23. Retrieved from: https://doi.org/10.1017/CBO9781107415324.004
LIRNEasia. (2011). Teleuse at the bottom of the pyramid 4. Dataset. Retrieved from: http://lirneasia.net/farmhouse/projects/2010-12-research-program/teleusebop4/
Lwanga, S.K.; Lemeshow, S. & World Health Organization. (1991). Sample size determination in health studies: a practical manual. Geneva: World Health Organization. Retrieved from: http://www.who.int/iris/handle/10665/40062
Mendonça, S., Crespo, N., & Simões, N. (2015). Inequality in the network society: An integrated approach to ICT access, basic skills, and complex capabilities. Telecommunications Policy, 39(3–4), 192–207. Retrieved from: https://doi.org/10.1016/j.telpol.2014.12.010
Ñopo, H. (2008). Matching as a tool to decompose wage gaps. The Review of Economics and Statistics, 90(2), 290–299.
Perampalam, S., Zainudeen, A. & Galpaya, H. (2016). Understanding gender variance in mobile ownership in Myanmar. Paper presented at CPRsouth 2016: Inclusive Innovation, 8–10 September 2016, Zanzibar. Retrieved from: http://www.cprsouth.org/wp-content/uploads/2016/09/CPRsouth-2016_PP88_Perampalam.docx
Robinson, L., Cotten, S. R., Ono, H., Quan-Haase, A., Mesch, G., Chen, W., Schulz, J., Hale T.M. & Stern, M. J. (2015). Digital inequalities and why they matter. Information, Communication & Society, 18(5), 569–582. Retrieved from: https://doi.org/10.1080/1369118X.2015.1012532
Rohman, K.I. (2012). Will telecommunications development improve the quality of life in African countries? info, 14(4): 36–51.
Roller, L. & Waverman, L. (2001). Telecommunications infrastructure and economic development: A simultaneous approach. The American Economic

Taking Stock: Data and Evidence on Gender Digital Equality PART TWO
242
Review, 91(4): 909–923.
Sein, D.M. (1972). Towards independence in Burma: The role of women. Asian Affairs 3(3). Retrieved from: https://www.tandfonline.com/doi/abs/10.1080/03068377208729635
Sridhar, K.S. & Sridhar, V. (2008). Telecommunications infrastructure and economic growth: Evidence from developing countries. Applied Econometrics and International Development, 7(2). Retrieved from: https://ssrn.com/abstract=1250082
Tepe-Belfrage, D. & Steans, S. (2016). The new materialism: Re-claiming a debate from a feminist perspective. Capital & Class, 40(2): 305-326.
UNESCO (2015a). UNESCO Science Report: Towards 2030. Paris: UNESCO.
UNESCO (2015b). CONNECTing the dots: Options for Future Action. Outcome document. Paris: UNESCO.
UNGA (United Nations General Assembly). (2015). 2030 Agenda for Sustainable Development. United Nations General Assembly resolutions. Retrieved from: http://www.un.org/en/ga/72/resolutions.shtml
Wang, R. (2015). Internet use and the building of social capital for development: A network perspective. Information Technologies & International Development, 11(2) 19–34. Retrieved from: https://itidjournal.org/index.php/itid/article/viewFile/1395/516
Zainudeen, A. & Galpaya, H. (2016). Mobile phones, internet, and gender in Myanmar. Report of a joint GSMA Connected Women-LIRNEasia study. London: GSM Association. Retrieved from: http://www.gsma.com/mobilefordevelopment/wp-content/uploads/2016/02/Mobile-phones-Internet-and-gender-in-Myanmar.pdf
Zainudeen, A., Iqbal, T. & Samarajiva, R. (2010). Who’s got the phone? Gender and the use of the telephone at the bottom of the pyramid. New Media and Society, 12(549), 66. Retrieved from: http://nms.sagepub.com/cgi/content/abstract/12/4/549
Zainudeen, A., Galpaya, H., Hurulle, G. & Perampalam, S. (2017). Mobile phones, internet, information and knowledge: Myanmar 2016. Retrieved from: http://lirneasia.net/wp-content/uploads/2017/09/Mobile-phones-Internet-information-and-knowledge-Myanmar-2016.pdf

Taking Stock: Data and Evidence on Gender Digital Equality PART TWO
243

244
TECHNOLOGIES AND YOUTH: KEY DIMENSIONS FOR INVESTIGATING GENDER DIFFERENCES IN INTERNET ACCESS AND USE AUTHORS: TATIANA JEREISSATI, MONICA BARBOVSCHI, JAVIERA MACAYA, STEFANIA LAPOLLA CANTONI50
50 Tatiana Jereissati is at the Regional Center for Studies on the Development of the Information Society of the Brazilian Network Information Center. Monica Barbovschi, Ph.D, is with the Institute of Sociology of the Romanian Academy. Javiera Macaya is at the School of Business Administration of São Paulo of the Getulio Vargas Foundation. Stefania Lapolla Cantoni works for the Regional Center for Studies on the Development of the Information Society of the Brazilian Network Information Center.
3

Taking Stock: Data and Evidence on Gender Digital Equality PART TWO
245
ABSTRACT
This chapter underscores the importance of understanding the use of the internet through a gender perspective and acknowledging gender-specific discourses on the uses of information and communication technologies (ICTs), as well as their implications in terms of opportunities and risks for the young population. The growing use of digital technologies by youth highlights the importance of understanding how these transformations affect their lives. ICT use potentially provides a multitude of opportunities, for example, by supporting children’s rights, including those pertaining to gender equality. However, internet use also replicates inequalities affecting young people, and it creates new inequalities which may not be adequately portrayed in quantitative research. Gender inequalities affect both the uptake of ICT-related opportunities by girls and boys and the nature and extent of their online risks. In this context, how can researchers identify the inequalities related to the access to and use of ICTs by the young population? How can we identify gender differences in terms of opportunities and risks online? This information is crucial to inform policymaking that aims at bridging the gender digital divide. The Regional Centre for Studies on the Development of the Information Society (Cetic.br), a department of the Brazilian Network Information Centre (NIC.br), developed a qualitative research framework that takes gender as a fundamental cross-cutting dimension for understanding the social implications of digital technologies in the lives of the young population. This research aims at investigating practices of access and use as well as activities of young people online which escape quantitative approaches. The qualitative study was implemented in the urban setting of São Paulo, Brazil, by Cetic.br in 2016. Focus groups were conducted with internet users aged 11–17, as well as mothers, fathers, and teachers, in order obtain insights into gender-specific issues on the use of ICTs by the young population. Additionally, in-depth interviews were conducted with young people selected according to their self-identified gender identity and or sexual orientation. This chapter presents preliminary results on the intersection of two important dimensions, online privacy and violence, examining how this population manages their information online and exploring the role of gender in this complex process.
KEY FINDINGS
• Girls and boys manage their privacy settings according to their intended audiences, and digital skills prove to be particularly relevant for this.
• Both boys and girls aged 11–17 believe that parents are more restrictive and controlling
of girls’ use of the internet. Many attribute this difference to gendered norms of what is appropriate or acceptable for girls. However, limited access to ICT may influence how children find and uptake opportunities.
• Girls have more concerns about their personal information online being more exposed to risky situations; they are also more likely to suffer negative consequences from this than boys.
• The non-consensual disclosure of nude photos appears to be a common practice that affects youths’ lives. This practice is gender-based: girls’ photos are disclosed by boys, without consent. The consequences of such actions are perceived as extremely problematic for girls, with consequences ranging from changing schools to depression and suicide attempts.
• Both girls and boys say they don’t know how to proceed or to whom they would turn for help in situations of non-consensual disclosure of nude photos.
INTRODUCTIONNew media have been widely embraced by young people for purposes of communication and connection to peers, as well as for self-expression online. In 2017, it was estimated that one in three adolescents under 18 were online worldwide — a fast-rising proportion of Internet users (Livingstone et al., 2016). Such rapid growth in youth’s access to the Internet, further enhanced by the spread of mobile Internet devices, has led to increased attention to young people’s uses of digital technologies.
In spite of advances in access to digital technologies worldwide (ITU, 2018), digital inequalities and exclusion, especially related to gender, remain of a particular concern51. Gender-related data on ICT are essential to map patterns in access to and use of ICT, to inform national policy and to monitor the advancement of international policy goals of equitable information and knowledge. Unfortunately, the scarcity of sex-disaggregated ICT data, especially for developing countries, may hinder the development of ICT policies that can benefit girls and women (UNCTAD, 2014). This is of particular relevance since gender can influence young people’s access to and use of technology, including how they use devices, what activities and opportunities they are encouraged to pursue by means of ICT use, and the consequent benefits (and risks) they experience. A review of recent research shows a general lack of
51 The digital gender divides have been addressed by numerous international initiatives, including the World Summit for the Information Society (WSIS, 2003, 2005), the WSIS+10 Outcome Document (ITU, 2014), and Agenda 2030 adopted by UN member states (UN, 2015; UN Women, 2015), which focus on ICTs as strategic for improving gender equality and ensuring opportunities of learning, empowerment and participation (SDG 5 - Gender Equality).

Taking Stock: Data and Evidence on Gender Digital Equality PART TWO
246
up-to-date and reliable data on children’s gender, age, or internet use. Considerably more data is collected in the Global North (albeit unevenly distributed among and within regions), although girls aged 10–14 are understudied (Livingstone et al., 2017).
The available data nonetheless point to relevant gender gaps in ICT access and use: “in homes where digital technology is provided by parents, it is more likely that girls will be given access at an older age than their male peers, that the access which they are given will be more curtailed or surveilled, and that the idea of ICT-related careers will be more associated with boys than girls” (Livingstone et al., 2017, p. 1). More wide-ranging, systematic gathering of gender-disaggregated data is needed to investigate existing digital divides in relation to affordability, digital skills, online risks, and underlying socio-economic factors (UNCTAD, 2014). Qualitative investigations are also needed to shed light on aspects that are difficult to analyze by means of quantitative methods.
This chapter presents a qualitative research framework aimed at understanding perceptions and discourses around gender-specific uses of ICT. The framework was developed by the Regional Center for Studies on the Development of the Information Society (Cetic.br)252, in partnership with FLACSO Argentina (the Latin American Faculty of Social Sciences). We also present preliminary findings of data collected in São Paulo, Brazil, addressing the issues of online privacy and violence.53
QUALITATIVE RESEARCH FRAMEWORK ON YOUTH, ICT AND GENDER: KEY DIMENSIONS
This Qualitative Research Framework aims to illustrate practices of access, use, and activities of young people online, exploring social representations, perceptions, and discourse of young people around gender-specific uses of ICT. Social representations (SRs) are collectively generated; they do not exist outside the social groups that produce them, and they have a functional role in enabling individuals
52 The Regional Center for Studies on the Development of the Information Society (Cetic.br), a department of the Brazilian Network Information Centre (NIC.br), is responsible for the production of indicators and statistics on the availability and use of the Internet in Brazil. In 2012, Cetic.br was nominated a Category II UNESCO Center, with the mission of contributing to building inclusive knowledge and information societies in Latin America and the Portuguese-speaking countries of Africa through information and communication technologies.
30 The Research framework was implemented by FLACSO Argentina, and data was collected in Buenos Aires in 2016. Despite some metho-dological differences with the Brazilian approach (e.g., differences in criteria for sample selection), data was coded following the codebook used in Brazil, allowing for comparisons between the datasets.
to make sense of the world. The framework builds on Teun van Dijk’s (2008) conceptual triangle linking “discourse – cognition – society” in the context of ideology. Specifically, the research framework addresses the following key dimensions: access, uses and opportunities; self-representation; privacy and online violence54.
The aim is to investigate how social representations are construed, validated, or challenged in young people’s discourses around use of ICT, viewed from a gender perspective. Discourses that are deeply embedded in social representations and social situations may be less prone to discursive challenges, whether from academics, government agencies, or media. This may be especially true of highly naturalised social representations, including those about children and childhood, or of hegemonic ideals about masculinity and femininity; such social representations are, accordingly, readily reproduced and resistant to change.
ACCESS, USES, AND OPPORTUNITIES
Inequalities in access to and use of ICTs still persist along socioeconomic divides. Differences in digital literacy, skills, and experience with digital technologies, and in opportunities to engage in more creative uses, mean that not all young people are able to take up opportunities equally even when these become accessible (Livingstone et al., 2017).
This dimension of the research explores several aspects of ICT access and use : the role of peers and family members, including siblings; gender-specific social representations and perceptions around access to devices and uses of the internet; gender-specific social representations around uses and activities online; and what opportunities and benefits young people feel they have, and how these connect to gender differences.
Research questions
Access. Do conditions of access to devices differ for boys and girls, and how do they differ? What do young people perceive as limiting or enabling? Do they feel supported and encouraged by family members and other adults to access devices and the internet? Do they experience restrictions and limitations, and are these related to gender? Which devices are used the most, in which locations, and do these findings differ by gender?
Uses. What activities do young people do online?
54 The research framework and dimensions for investigation were developed by the research team at Cetic.br, drawing on literature and previous studies on the uses of ICT by the young population.

Taking Stock: Data and Evidence on Gender Digital Equality PART TWO
247
What are their perceptions about how girls and boys use the internet? Are they either encouraged toward specific activities or limited by family members and adults, and, if so, does this differ by gender? Do they explore a wide range of activities, or are they directed towards gender-stereotypical uses?
Opportunities. Are children creating content online, and why? Why is it important for them, who do they perceive as the audience, and what are they communicating about themselves? What does this activity mean for them? Is there a connection to issues of gender, e.g., as power relations? Do they engage with online communities or group discussions, or otherwise search for new information or points of view? What opportunities do they feel they may have, or lack, through access to and use of ICT? Are any of those opportunities gender-related? Are they encouraged by family members and/or other adults to explore a wide range of opportunities, or are they directed toward gender-stereotyped benefits and results of internet use?
SELF-PRESENTATION ONLINE AND SELF-IMAGE: THE USE OF SOCIAL MEDIA TO CONSTRUCT AND PERFORM GENDER IDENTITIES
Although social media has been widely adopted by young people generally (Livingstone and Mason, 2015), girls face the challenge of having to express hyper-feminine and sexualised roles — projecting stereotypical, body-objectified self-concepts, as promoted by media and (often) internalised — while maintaining the image of “proper” feminine behaviour. Conversely, young boys are pressured into adopting hyper-masculine gender roles, exhibiting dominant and macho behaviour (Ringrose & Eriksson Barajas, 2011), and projecting images of emotionless, aggressive, and toxic masculinity (Holloway, 2015) in their expressions on social media.
Research suggests that gender-typification (i.e., showing interests, attitudes, and conduct that are stereotypically associated with own gender) also plays a role in online victimisation and cyber-bullying, with those not conforming to traditional roles being more victimised (Navarro, 2016). The way young people express gender-stereotypical traits on social media — or, conversely, choose to challenge stereotypical self-presentation — not only enhances (or reduces) digital inequalities but also relates to potential risks of online victimisation.
This dimension explores how young internet users conform to stereotypical gender norms online (for example, performing macho and “toxic” masculine roles) or challenge and exploit them (for example, performing hyper-sexualised gender roles while maintaining the appearance of “proper” behaviour) (Ringrose, 2010). Related practices include “policing” other young people, and being “policed”, through
social stigma (Ringrose & Barajas, 2011). Research Questions
How do boys and girls construct and perform identities online? What do they feel is appropriate to express and present online, as feminine or masculine or other identity? What kinds of profiles do they use with their family members and friends? Are their profiles gender-stereotypical or gender non-conforming? Are their standards of physical appearance/beauty reinforcing heteronormative expectations? How do their standards of physical appearance relate to issues of race and class? Are girls and/or boys encouraged to construct and perform stereotyped online gender identities or to explore online non-conformative, alternative expressions of gender?
PERCEPTIONS OF PRIVACY ONLINE, SOCIALISATION OF PRIVACY AND PERSONAL BOUNDARIES
As social networks are increasingly used by the young, concerns about breaches of privacy and misuse of personal data emerge as a specific category of risks in the research and policy agenda. How do young people deal with privacy issues around different personal networks (e.g., peers, family, teachers); how do they use different online platforms and privacy settings for different purposes (managing what information is shared with whom online); and how do they tackle issues around trust and password-sharing? These questions are closely connected with the perspective of privacy as co-constructed by various actors in one’s network (Petronio, 2002). This area, too, needs to be examined through the lens of gender: reflecting on how young girls and boys think about the meaning of privacy, both online and offline, and how they perceive gender differences, is important to understand the specific privacy issues and risks that young people face online.
This dimension explores how different socialising agents (family, school, media, peers) promote different ideas about personal boundaries and privacy and whether these messages vary according to gender. For example, are only girls specifically warned against sending nude photos, or are all children (boys and girls) being equally socialised in consent culture and the right to privacy? A related question is how these ideas and messages may be either reinforced or challenged in the content that young people choose to share of themselves online, and with whom they share it.

Taking Stock: Data and Evidence on Gender Digital Equality PART TWO
248
Research Questions
How are boys and girls socialised by various agents (family, media, school environment and groups of peers, wider community) regarding what is appropriate to share online, and with whom? How are they encouraged (or discouraged) regarding managing degrees of disclosure, setting and enforcing boundaries, and maintaining control over their privacy? (For example, are girls or boys asked to share their passwords with others in their peer group, or to share pictures on the device or on social media?) How do they manage their privacy settings and perceive online risks, and does this vary by gender?
ONLINE VIOLENCE
Young people’s exposure to online risks, the types of risks they encounter, and the connection with face-to-face risks (e.g., violence) are widely discussed and debated. EU Kids Online has formulated some key observations: not all risks result in harm (Hansson, 2010); young people have various degrees of resilience; and young people who are most vulnerable, both online and offline, are most likely to be in danger of harm55. The risks related to online violence, such as the dissemination of nude photos without consent and sexual cyber-bullying, are marked by unequal gender dynamics, with girls usually being more affected by gendered pressures towards sexual behaviour, experiencing more negative consequences and ensuing harm. The situation is often worsened by low levels of knowledge, little support, and lack of discussion of consent, by peers, schools, parents, and the media.
As of 2013, technology-mediated violence against women has been acknowledged by the UN Commission on the Status of Women and by the UN General Assembly; other relevant public policy documents have shown concerning trends regarding the prevalence of violence against women, including technology-mediated violence. Substantial effort and resources have been directed towards ensuring children’s safety online, in alignment with the protection dimension of the 1989 UN Convention on the Rights of the Child (UNCRC, 1989) — mainly concerning sexual online risks, and less in relation to opportunities for gender and sexual expression (Livingstone and Mason, 2015).
This dimension explores young people’s experiences and perceptions of online violence, including harassment, discrimination, and dissemination of nude photos without consent, whether gender-specific or
55 EU Kids Online is a multinational research network that seeks to enhance knowledge of European children’s online opportunities, risks, and safety. It uses multiple methods to map children’s and parents’ experience of the internet, in dialogue with national and European policy stakeholders. For more information see: http://www.lse.ac.uk/media-and-communications/research/research-projects/eu-kids-online.
not, as well as its consequences and implications for boys and girls respectively.
Research Questions
Have young people experienced any type of problematic situation online, including harassment, discrimination, verbal violence (including being called names), dissemination of nude photos without consent, or slandering (e.g., being ridiculed online for not conforming to norms regarding physical beauty)? Are the issues they report gender-specific? What are the impacts for those who experience such situations? Does this differ for boys and girls? Whom do they consider responsible for such problematic situations, and how could they be avoided? How can they deal with these situations when they arise?
IMPLEMENTING THE RESEARCH FRAMEWORK: THE CASE OF YOUNG INTERNET USERS IN SAO PAULO, BRAZIL
Following a pilot phase, the research framework was implemented by Cetic.br in the metropolitan area of São Paulo, Brazil, in September 201656. In this phase, the project was carried out in collaboration with Brazilian Center for Analysis and Planning (CEBRAP), and fieldwork was was conducted by the Brazilian Research Institute Ibope Inteligência. Fieldwork consisted of 16 single-sex focus groups57 conducted with internet users aged 11–12, 13–14, and 15–1758. For these age ranges, consent was sought from both minors and adults to conduct the research. Also, data collection was preceded by a series of consultations with young people and with experts on topics related to gender, internet and media, and young people, from academia, government, and civil society, in
56 The research framework was also implemented by FLACSO Argentina, and data was collected in Buenos Aires in 2016. Despite the methodological differences with the Brazilian approach (e.g., differences in criteria for sample selection), data was coded following the same codebook as used in Brazil, allowing for comparisons between the datasets.
57 Each focus group had five participants, with an average duration of 120 minutes, and was conducted by a professional moderator (same sex as the group). All the focus groups took place in a one-way mirror lab, with all discussions recorded and transcribed. All transcriptions were then coded, following a codebook for selected themes and dimensions, using NVivo software.
58 Internet users are defined as “individuals who used the Internet from any location in the last three months” (Manual for measuring ICT access and use by households and individuals, International Telecommunciations Union. Available at https://www.itu.int/dms_pub/itu-d/opb/ind/D-IND-ITCMEAS-2014-PDF-E.pdf). Other prerequisites were having used mobile phone and social networks in the three months prior to selection.

Taking Stock: Data and Evidence on Gender Digital Equality PART TWO
249
order to map out topics to be addressed. Including young people in the process of designing the research questions conforms to the prerequisite of including young people in decision making processes that affect their lives, in keeping with the UN Convention on the Rights of the Child. Finally, four (out of sixteen) focus groups were composed exclusively of black young people. In-depth interviews were conducted with young people selected according to their self-identified gender identity and/or sexual orientation, recruited with the help of a local LGBTQ organisation.
Given that children’s online experiences cannot be studied in isolation from their lives in general (Kardefelt-Winther, 2017), the sample selection criteria for the focus groups included: gender; racial and ethnic characteristics(according to the official Brazilian distribution, and following the classification established by the Brazilian Institute of Geography and Statistics); and type of school (public or private) — with additional sampling for socio-economic level (SEL)59. Information about religion was also collected, though not used as a sampling variable A thematic analysis was conducted; for this chapter, relevant quotes were translated by the authors, with attention to children’s expressions and use of language.
For the purpose of this chapter, we present preliminary findings focusing on two broad dimensions of interest: (1) perceptions of privacy online, socialisation of privacy, and personal boundaries; and (2) online violence. This will allow a brief discussion on how young people reflect about privacy, how they manage information shared online, and how they deal with the issue of consent. Additionally, we discuss the perceived gender differences related to online privacy and risks — a topic that is deeply connected to experiences of online violence reported by the interviewees.
PRELIMINARY RESULTS: BRIEF DISCUSSION OF ONLINE PRIVACY AND VIOLENCE The rise of social networking sites and their enthusiastic embrace by young people have posed new challenges regarding how they manage the information they share with different “networked publics” (Ito, 2008). As cultural assumptions and social norms around privacy, sharing, and visibility are revisited in the context of new technologies, youngsters appear to be using innovative mechanisms for dealing with these issues (Marwick & Livingstone, 2014).
59 The socio-economic criteria adopted are the Brazilian Classification Criteria that classify households according consumer goods (avoiding the more sensitive question of income). For more information on the Brazilian Economic Classification Criteria, see www.abep.org/Servicos/Download.aspx?id=11.
This is no different in Brazil: young internet users living in São Paulo claim to use SNS and their different functionalities to manage and select their intended audiences, according to which information they mean to share online and with whom. In this context, gendered norms of what is socially acceptable in terms of attitudes, appearances, and behaviours appear to be of relevance throughout this process.
When I post something, I block my entire family. Like, ‘friends except family’ … because they’ll say ‘what about those clothes you left the house wearing yesterday?’
– Girl, 15–17, private school
It is a very complicated selection process. You think of posting something, then you think of someone that will complain, so you give up.
— Girl, 11–12, public school
My [ex-boyfriend] sort of made me [share my SNS password with him]. I would delete all the messages I exchanged during the day.
— 13–14 year-old girls, private school
Privacy has been conceptualised as a process of managing the boundary between an individual and his or her social context, as well as deciding what information to share and who should have access to it (Altman, 1975; Westin, 1967). Although they often found it difficult to define in their own words when asked about the meaning of “privacy”, many young Brazilians describe it in terms of its absence, with particular mention of perceived “invasion of privacy” regarding their online activities.
Adults often undermine the agency of the young population, by scrutinising their children’s mobile phones and surveilling their activities online (Marwick & Livingstone, 2014). Moreover, Brazilian findings show that both boys and girls, from different age ranges, perceive parents as more controlling of girls’ use of the internet. Attempts to explain this often suggest that girls are “naturally” more vulnerable, in particular with regard to their safety, in a context where the boundary between online and offline interaction becomes increasingly diffuse. Nevertheless, this practice may affect the unequal uptake of opportunity by boys and girls.
My dad always takes my mobile phone, and once I found him reading my conversations and I got very angry because if he asks me what’s going on, I’ll tell him. He takes it from my hand, he won’t even let me block it.
— 13–14 year-old girls, private school
If my mom takes my mobile phone to check it and finds a photo or something, it’s okay, I’m a boy, right, boys are like that, she’ll understand, but if it’s my sister, she’s toast.
— 15–17 year-old boys, private school

Taking Stock: Data and Evidence on Gender Digital Equality PART TWO
250
My dad says that he gave my brother more freedom because I will always be daddy’s girl and he will always be more cautious with me than my brother. That it is much more likely that something dangerous happens to me than my brother.
— Girl, 11–12, private school
Although a wide variety of problematic online situations were described by young Internet users, including racial discrimination and bullying, a striking and recurrent situation was the non-consensual disclosure of nude photos by a third party, usually after having been sent to a trusted person (such as an ex-partner or friend)60. This was reported in all focus groups conducted in São Paulo, in all age ranges, and was much more prevalent among girls. Overall, the consequences of these practices were also perceived as extremely problematic for girls; they ranged from having to change schools to depression and suicide attempts.
In my school there is a girl, she sent nude photos to a boy, he posted them and she had to move to another country; the girl’s mom wanted to kill the boy and the girl wanted to kill herself and almost threw herself at the train tracks.
— 11–12 year-old girls, public school
My friend’s [nude photo] was also shared without consent. Her boyfriend printed her photos and put them on the street poles, it was horrible and the police had to be involved.
— 13–14 year-old girls, private school
In face of such situations, a common reaction in the focus groups was to blame the girls for taking and sharing photos of themselves in the first place. Seldom was the perpetrator, who disclosed the photos without consent, accounted responsible.
She is also wrong to send [nudes] (...) because if someone sends it to me and I disclose it, the fault won’t be mine, it will be hers. I think so.
— 13–14 year-old boys, public school
But, deep down, I think [the girls] want [the photo to be disclosed] because if she didn’t, she wouldn’t take the photo.
— 15–17 year-old boys, private school
I’d like to ask her something: was the girl forced to send the boy a photo [or] did she do it because she wanted to? She did it because she wanted to.
— 11–12 year-old girls, private school
A tension is reflected in the literature between the rights of youth — to sexual expression and privacy —and the need for child protection, as well as a discrepancy between how youngsters perceive these
60 The practice of “sexting” is often referred to as “sending nudes” in the Brazilian context, that is, voluntarily sharing photos or videos of one’s own body. This practice appears to be widespread in Brazil; here, it is not addressed as a problem in itself. This chapter refers to situations where such images have been shared with third parties without consent, a practice that is more prevalent with girls, often with serious consequences.
situations and what they are taught about them (Livingstone & Mason, 2015). As noted by Ringrose et al. (2013), discourses around sexting tend to reproduce moral norms of victim-blaming in cases of sexual assault (Salter et al., 2013, p. 312), instead of condemning the cultural sexism that endorses unauthorised and coercive distribution of girls’ pictures (Salter et al., 2013, p. 307). Accordingly, these discourses on sexting present girls as sexual subjects to be controlled and their sexuality as something to be surveilled and regulated (Salter et al., 2013). The preliminary findings of this project highlight the relevance of detailed research that can address the issues of privacy and violence from a gender perspective, and their implications for the young population.
MOVING FORWARD: KEY RECOMMENDATIONS
• Engage key stakeholders in the ICT and gender debate; promote awareness-raising on the topic, giving voice to children and also involving parents, educators, the media, the private sector, and researchers.
• Promote more research to obtain timely, robust data on ICT use by children, through a gender perspective, to inform policymakers; use internationally agreed research frameworks (adapted locally) to allow cross-national comparisons.
• Adopt a mixed-methods approach whenever possible, producing both quantitative and qualitative data.
• Give special attention to data gaps: themes (e.g., privacy and violence); age ranges (e.g., young girls); and geographical scope (Global South, rural areas).
• Mainstream gender in both research and policymaking related to children’s use of ICT; promote evidence-based policymaking in this field.
REFERENCES
Altman, I. (1975). The environment and social behavior: Privacy, personal space, territory, crowding. California: Brooks/Cole Pub. Co.
Byrne, J., Kardefelt-Winther, D., Livingstone, S., & Stoilova, M. (2016). Global Kids Online Research Synthesis, 2015-2016. UNICEF Office of Research–Innocenti and London School of Economics and Political Science. Retrieved from: www.unicef-irc.org/research/270/ and www.globalkidsonline.net/synthesis.

Taking Stock: Data and Evidence on Gender Digital Equality PART TWO
251
Hansson, S. O. (2010). Risk: Objective or subjective, facts or values. Journal of Risk Research, 13, 231-238, Retrieved from: http://dx.doi.org/10.1080/13669870903126226.
Holloway, K. (2015). Toxic masculinity is killing men: The roots of male trauma. Salon. Retrieved from: http://www.salon.com/2015/06/12/toxic_masculinity_is_killing_men_the_roots_of_male_trauma_partner/
Ito, M. (2008). Introduction. In: K. Varnelis (Ed.), Networked Publics. Cambridge, MA: MIT Press.
ITU (2016). Facts and figures 2016. Retrieved from: www.itu.int/en/ ITU-D/Statistics/Pages/facts/default.aspx
ITU (2018). Measuring the information society. Retrieved from: https://www.itu.int/en/ITU-D/Statistics/Documents/publications/misr2018/MISR-2018-Vol-1-E.pdf
Kardefelt-Winther, D. (2017). How does the time children spend using digital technology impact their mental well-being, social relationships and physical activity? An evidence-focused literature review. Innocenti Discussion Paper 2017-02. Innocenti, Florence: UNICEF Office of Research. Retrieved from: https://www.unicef-irc.org/publications/pdf/Children-digital-technology-wellbeing.pdf
Livingstone, S., Nandi, A., Banaji, S. & Stoilova, M. (2017). Young adolescents and digital media: Uses, risks and opportunities in low- and middle-income countries: A rapid evidence review. London, UK: Sage.
Livingstone, S. & Bulger, M. E. (2014) A global research agenda for children’s rights in the digital age. Journal of Children and Media, 8(4), 317-335. DOI: 10.1080/17482798.2014.961496
Livingstone, S., Mascheroni, G., & Staksrud, E. (2015). Developing a framework for researching children’s online risks and opportunities in Europe. EU Kids Online Network. Retrieved from: http://eprints.lse.ac.uk/64470/
Livingstone, S. & Mason, J. (2015). Sexual rights and sexual risks among youth online: A review of existing knowledge regarding children and young people’s developing sexuality in relation to new media environments. London: ENACSO (The European NGO Alliance for Child Safety Online). Retrieved from: http://www.enacso.eu/images/eNACSO_Review_on_Sexual_rights_and_sexual_risks_among_online_youth_DEF.pdf
Livingstone, S., Carr, J., Byrne, J. (2016). One in three: Internet governance and children’s rights. Innocenti Discussion Paper No. 2016-01. Florence: UNICEF Office of Research. Retrieved from: https://www.unicef-irc.org/publications/pdf/idp_2016_01.pdf
Marwick, A. & boyd, d. (2014). Networked privacy:
How teenagers negotiate context in social media. New media & society, 16(7) 1051–1067. Retrieved from: https://www.dhi.ac.uk/san/waysofbeing/data/communities-murphy-marwick-2014.pdf
Navarro, R. (2016). Gender issues and cyberbullying in children and adolescents from gender differences to gender identity measures. In: R. Navarro, S. Yubero, & E. Larrañaga (Eds.), Cyberbullying across the globe: Gender, family, and mental health (35-61). Cham (ZG): Springer.
Petronio, S. (2002). Boundaries of privacy: Dialectics of disclosure. New York: State University of New York Press.
Pruulmann-Vengerfeldt, P., & Runnel, P. (2012) Online opportunities. In: Livingstone, S., Haddon, L., & Görzig, A. (Eds.), Children, risk and safety online: Research and policy challenges in comparative perspective (45–58). Bristol: The Policy Press.
Ringrose, J. (2010). Sluts, whores, fat slags and Playboy bunnies: Teen girls’ negotiations of “sexy” on social networking sites and at school. In: C. Jackson, C. Paechter & E. Renold (eds.), Girls and education 3-16: Continuing concerns, new agendas (170-182). Basingstoke: Open University Press.
Ringrose, J., Harvey, L., Gill, R., & Livingstone, S. (2013). Teen girls, sexual double standards and ‘sexting’: Gendered value in digital image exchange. Feminist Theory, 14(3): 305–323.
Ringrose, J. & Erikson Barajas, K. (2011). Gendered risks and opportunities? Exploring teen girls’ digitized sexual identities in postfeminist media contexts. International Journal of Media and Cultural Politics, 7(2): 121-138.
Salter, Michael, Thomas Crofts and Murray Lee (2013). Beyond criminalisation and responsibilisation: ‘‘Sexting’’, gender and young people. Current Issues in Criminal Justice, 24(3): 301–316.
UNCTAD, (2014). Measuring ICT and gender: An assessment. Geneva and New York: UN. Retrieved from: www.uis.unesco. org/Communication/Documents/measuring-ict-and- gender.pdf.
Van Dijk, T.A. (2008). Discourse and context: A sociocognitive approach. Cambridge: Cambridge University Press.
Westin, A. (1967). Privacy and freedom. New York, NY:
Atheneum.

252
ACCESSIBILITY, INTERSECTIONALITY, AND UNIVERSAL DESIGN: HOW OVERLAPPING FORMS OF DISCRIMINATION LIMIT ACCESS TO TECHNOLOGY FOR WOMEN WITH DISABILITIES
AUTHORS: ALETTE R. SKJERVE, S. WEISS, S. NASEEM, ANTHONY G. GIANNOUMIS, AND K. SCOTT61
61 A. R. Skjerve is at Oslo Metropolitan University. Sabrina M. Weiss is an interdisciplinary ethicist. Sumaira Naseem is an activist, volun-teer, and researcher. G. Anthony Giannoumis is at Oslo Metropolitan University. Kimberly A. Scott is at the School of Social Transformation at Arizona State University and directs its Center for Gender Equity in Science and Technology.
4

Taking Stock: Data and Evidence on Gender Digital Equality PART TWO
253
ABSTRACTThis chapter focuses on the relationship between the digital gender gap and other forms of social disadvantage and discrimination. The United Nations (UN) Convention on the Rights of Persons with Disabilities (CRPD) recognises the relationship between gender and disability, stating that “women and girls with disabilities are subject to multiple discrimination”; it asserts that States Parties have an obligation — along with other requirements — to ensure access to information and communication technology (ICT), including the internet, to women with disabilities, on an equal basis with others. Borrowing from feminist legal scholarship, disability rights scholars have adopted the term intersectionality to describe the overlapping forms of discrimination and systematic injustice that affect women with disabilities. Since the 1990s, researchers in human-computer interaction, legal scholars, and industry practitioners have promoted ICT accessibility, striving to remove the barriers that persons with disabilities experience using ICT. Similarly, the UN has argued that under the CRPD, States Parties have an obligation to ensure that technology is usable for persons with disabilities. The UN also endorses universal design, which requires the design of ICT “to be usable by everyone to the greatest extent possible without the need for adaptation or specialised design”. Universal design serves as a useful tool in promoting both ICT access and accessibility for women with disabilities, and it provides a useful framework for understanding the overlapping forms of discrimination that women with disabilities experience in accessing and using ICT.
KEY FINDINGS
• States have an obligation to ensure access to ICT, including the internet, to women with disabilities, on an equal basis with others.
• Universal design provides a useful tool for promoting both access and accessibility in ICT for women with disabilities; it provides a framework for understanding the overlapping forms of discrimination that women with disabilities experience in accessing and using ICT.
• Disability rights scholars have adopted the term intersectionality to describe the overlapping forms of discrimination and systematic injustice that affect women with disabilities.
• Since the 1990s, researchers in human-computer interaction, legal scholars, and industry practitioners have promoted ICT accessibility to remove the barriers that persons with disabilities experience using ICT.
• Research still needs to fully develop and operationalise universal design, to allow scholars and advocates to integrate an intersectional perspective in ICT. Scholars have yet to
investigate in detail the experience of multiple socially marginalised groups in accessing and using ICTs.
• While ICT developers have made significant strides towards automatic detection of hate speech online, the implications for persons with intersectional identities have yet to be explored.
• Research on ICT accessibility has not yet fully examined the socio-economic and socio-political mechanisms that persons with disabilities experience accessing ICTs, particularly women with disabilities in the Global South. “Accessibility,” as generally understood, is accessible for a small fraction of people with disabilities.
INTRODUCTIONThe World Health Organisation (WHO) estimates that 15% of the world’s population has experience of long-term disability (WHO, 2011), finding that the prevalence of disability is higher among women than men (WHO, 2016). Moreover, moderate to severe disability affects 67% of women with disability — slightly higher than the 65.3% of men with disability — and women with disabilities experience gender discrimination in addition to any disabling barriers (WHO, 2011). Accordingly, the effort to bridge the digital gender divide must take into account the experiences of women with disabilities. The European Union as well as the United Kingdom and other countries have recognised that women face multiple forms of discrimination, and that the rights of women do not exist in isolation from their rights as persons with disabilities. Indeed, women with disabilities may experience exacerbated rights violations, occasioned by their dual identity as women and as persons with a disability. In relation to access to ICT, women with disabilities experience unique barriers to ICT that need to be tackled as a whole rather than separately.
It is beyond the scope of this article to fully investigate the relationship between digital divides, disability, and gender. Digital divides are complex and multidimensional; they may include barriers in using ICT interfaces, barriers in accessing information, and barriers in acquiring digital competencies. Technical standards for designing technology that is accessible specifically to women with disabilities have yet to be developed, either by government or by industry. The specific barriers experienced by persons with disabilities in accessing and using ICT have been well documented in the literature (Dobransky & Hargittai, 2006). Since the emergence of the disability rights movement in the United States in the 1960s, research has provided examples as well as criteria for ensuring that ICT is accessible for persons with disabilities (Toboso, 2011). For example, persons with visual impairments may experience barriers accessing websites that are not compatible with assistive technologies such as screen readers (Brown & Hollier,

Taking Stock: Data and Evidence on Gender Digital Equality PART TWO
254
2015). Screen readers convert text into audio, but when images are posted without text alternatives, screen readers are not able to interpret the images, and persons with visual impairments experience barriers accessing web content. Similarly, persons with mobility, cognitive, and psychosocial disabilities may use a variety of input devices and may need and prefer content that is simple and understandable when accessing ICT, needs that must be considered by developers (Blanck, 2014).
Some potential design considerations for ICT developers emerge clearly from the hypothetical but realistic situation of women with disabilities trying to access information on the web about domestic abuse. A woman survivor of domestic abuse may experience barriers accessing information about domestic abuse on the web based on gender, disability, and possibly other social identities (racial, ethnic, socio-economic, etc.). First, the act of accessing information about domestic abuse may put the woman in a dangerous or threatening situation, if the web developers have not provided and highlighted understandable, easy-to-access, and discreet functionalities to clear the web browser’s search history. Second, accessing information about domestic abuse may trigger feelings of doubt or self-blame, if the content developers are unaware that information on abuse can be presented in ways that promote self-esteem and perceived control. Third, imagery used on the website may contain problematic symbols that convey unintended, culturally inappropriate meanings, if the content developers have not considered the sociocultural background of the user (Rideout, et al., 2016). Fourth, the content of the website may alienate and exclude transgender women or women in a queer relationship, if developers have embedded cisgender and heteronormative design assumptions that diminish or marginalise the experiences of queer and transgender women (Shelton, 2017). Fifth, complex content and features of the website may be inaccessible for persons with cognitive disabilities, if the developers have not ensured that the website adheres to standards for web accessibility such as the Web Content Accessibility Guidelines (WCAG), which prescribe, among other things, the use of clear and understandable language and actions. Sixth, the content of the website may exclude women of a variety of cultural backgrounds due to the use of unfamiliar idioms and cultural references. Seventh, the content of the website may exacerbate issues related to low self-esteem, social stigma, and prejudice, if developers have not considered the experiences of women with cognitive and psychosocial disabilities who have survived systematic abuse (Meer & Combrinc, 2015). Finally, the content of a website may discourage a woman from seeking help if the content is intimidating and difficult to understand. The interaction between this hypothetical user and the design of the website inextricably links the woman’s gender, sociocultural background, disability, and sexual orientation; web developers must consider these design choices holistically, to render the website accessible to women with disabilities.
This chapter has three parts. It presents research on marginalisation and discrimination in the use of ICT, including ICT accessibility for persons with disabilities and the less widely understood impact of intersectionality on ICT access. It then presents relevant research on universal design in ICT and its potential impact on ICT accessibility. Finally, it reviews the existing literature and the need for further research, before presenting recommendations for researchers and policy makers.
MARGINALISATION AND DISCRIMINATION IN ICTTransnational feminism situates feminism within an international context, providing a useful basis for challenging the boundaries between nation-states and between social and cultural groups (Brenner, 2003). Transnational feminist scholars have argued that satellite and internet technologies have allowed ever greater volumes of media — especially visually-based imagery — to be promulgated around the world (Fernandes, 2013). These trends have contributed to destabilising structures of power that systematically oppress women, while also reinforcing stereotypical images of women based on their culture and traditions (Fernandes, 2013).
In a related field, research in science and technology studies have shown that efforts to combat the decline of women’s’ participation in the ICT field have had to engage with formative masculine perceptions of the field (Henwood, 2000). Over the last decades, scholars have challenged the prevailing assumption that technology is a gender-neutral domain (Ford & Wajcman, 2017). In practice, technology is defined by a culture of perceived “know-hows” vs. “know-nots”. Because a majority culture defines how individuals interact with ICT and how ICT systems are developed and structured, these development processes and user-experience designs often exclude minority groups.
The experiences of minority groups in social media provide a useful example to illustrate the unintended results of excluding minority groups from ICT development processes and user-experience design. All users, particularly minority groups, have come to expect hate speech and other types of abuse on social media, and research suggests that minority groups may view hate speech as mostly inconsequential (Skjerve et. al., 2016). However, research also suggests that minority groups are rendered invisible in online debates, precisely for fear of such repercussions or real-world consequences (Skjerve et. al., 2016). In the initial design of many social media platforms, such as Twitter, developers apparently prioritised users’ anonymity over their safety and security, a decision that has the effect of disenfranchising minority groups. One of the victims of Gamergate, an on-

Taking Stock: Data and Evidence on Gender Digital Equality PART TWO
255
going campaign of harassment that personally targets women in the video game industry, is Brianna Wu. She described, in a 2015 article, the experience of being a high-profile woman online: “You have to constantly ask yourself if your post will put you or your loved ones in danger” (Wu, 2016). Wu, who ran unsuccessfully for a seat in the U.S. Congress in 2018, continues to work in industries where one’s social media presence and online network have a direct influence on their career. Wu’s experience shows that excluding minority groups from ICT development processes and user-experience design can exacerbate the digital divides that constrain the participation of women and other minority groups in society. Research has yet to provide case studies or empirical evidence examining the overlapping forms of discrimination experienced by women with disabilities in accessing ICT, due to both disability and gender.
ICT ACCESSIBILITY
The development of ICT has produced a global digital divide due to the barriers that persons with disabilities experience accessing ICT (Goggin, 2016). The United Nations Convention on the Rights of Persons with Disabilities (CRPD) describes disability as “an evolving concept” that “results from the interaction between persons with impairments and attitudinal and environmental barriers that hinders their full and effective participation in society on an equal basis with others”. A person with an impairment, i.e., a variation in body that affects the person’s way of functioning, is not inherently disabled. While pain and other symptoms of an impairment might act as disabling factors, society’s failure to accommodate a person’s way of functioning and environmental barriers are equally factors that contribute to disability.
This reflects the shifting conceptualisation of “disability” away from an inherent deficiency on the part of an individual towards a recognition that designers typically embed assumptions of accessibility and functionality in developing social structures and built environments — assumptions that disadvantage some people (Shakespeare, 2006; Oliver & Barnes, 2012). Javier Romañach and Manual Lobato, at the 2005 Independent Living Forum in Spain, proposed the term functional diversity as an alternative to “disability”, emphasising the role of the social and material environment in co-constructing what is considered “normal” functionality. Functional diversity broadly includes a person’s individual characteristics and environmental context, as well as the micro-level interactions with ICT that mediate their lived experiences; within this layered construct, women with disabilities may experience unequal access to technology (Bøhler & Giannoumis, 2017; Sen, 1995; Toboso, 2011).
Ensuring accessibility aims to promote equality between ICT users with disabilities and those without, remediating the digital divide (Ellis & Kent, 2015;
Goggin, 2015; Jaeger, 2015). With the early adoption of the web in the U.S. and Europe in the mid-1990s, the World Wide Web Consortium (W3C) established the Web Content Accessibility Guidelines (WCAG) as an international standard that aimed to provide clear criteria and guidance for developers to create web content that is accessible for persons with disabilities. WCAG soon spread internationally, as a practical and legal solution for achieving web accessibility (Giannoumis, 2015a). By the late 1990s, interest organisations had begun to invoke disability anti-discrimination legislation to take private enterprises to court over websites and ICT features that were inaccessible for persons with disabilities (Giannoumis, 2015b).
Research on web accessibility has focused on the outcomes of web accessibility policies, such as WCAG, in specific sectors: public libraries (Yu, 2002; Stewart et al., 2005; Tatomir & Durrance, 2010; Yi, 2015); education (Johnson & Ruppert, 2002; Klein et al., 2003, Green & Huprich, 2009); transport (Lazar et al., 2010); private enterprise (De Andrés et al., 2010); financial services (Williams & Rattray, 2003); and health services (Ritchie and Blanck 2003). In addition, research has assessed web accessibility in public services, including federal and regional governments in the United Kingdom (UK) and U.S. (Jaeger, 2004a-b; Jaeger, 2008; Rubaii-Barrett & Wise, 2008; Kuzma, 2010; Olalere & Lazar 2011; Bertot et al., 2012). The sum of this research shows that many private sector service providers have yet to remove barriers to accessing web content for persons with disabilities; and, although public and private sector organisations maintain a clear social — and often legal — responsibility for ensuring web accessibility, they have yet to remove such barriers.

Taking Stock: Data and Evidence on Gender Digital Equality PART TWO
256
INTERSECTIONALITY
Intersectionality provides a useful basis for examining the overlapping forms of discrimination that women with disabilities experience in accessing ICT. Intersectionality, as both a theory and a methodology, recognises that systems of oppression intersect with each other; thus, the sum of an individual’s identity goes beyond separate components such as ethnicity, race, class, sexuality, age, ability, citizenship status, and gender (Collins & Bilge, 2016; Crenshaw, 1991). This has two main implications. First, no part of a person’s identity can be isolated: a lack queer woman cannot isolate the Black or “queer” dimension from her gender identity. Second, measures adopted to improve access for white, cisgender, and straight women will not necessarily have the same benefits for a Black queer woman simply because they share the same gender identity. The intersection of different forms of social identity and social disadvantage impacts many issues. For example, studies on health care and pain management found that health care practitioners are more likely to ignore lack women with pain complaints than Bblack men or white women (Green et al., 2003). Regarding access to ICTs, a recent study by the Bill and Melinda Gates Foundation found that African-American parents are less likely to encourage their daughters to use ICTs than their sons (Rideout et al., 2016). This research reveals that, even if the general trend shows increased levels of ICT adoption among minorities, there could still exist great disparities for girls and women of color (Rideout et al., 2016).
An intersectionality perspective recognises that women with disabilities experience discrimination as women, as disabled individuals, and as women with disabilities (Lawson, 2016; P-RR-DIWOM, 2003). Beyond gender, other factors as well — race, sexual orientation, gender-identity, cultural context etc. — interact and affect the experience of a person living with disability (Chaudry, 2016; Moodley & Graham, 2015). Such intersecting hierarchies and structures of power can compound individual disadvantages (Crenshaw, 1991). Transnational feminism considers how different types of access to technologies and accommodations, as well as differing conceptualisations of disability, affect the ability of an individual woman to engage with ICT. For example, harassment and violence against persons with disabilities often reflect an intertwined (perceived) deviance from such norms as ability and gender (Meer & Combrinic, 2015; Barnett, 2017). Isolation of disability — the notion that disability exists alone and independently — affects access to and quality of education (Nguyen & Mitchell, 2014). Likewise, a failure to consider persons with disabilities in efforts to improve healthcare and economic conditions will limit, and sometimes exclude, persons with disabilities from participation: this was illustrated in the case of microfinance loans in India meant to empower women (Chaudhry, 2016). Finally, many U.S. military veterans with physical, cognitive, and/or psychosocial
disabilities, who are increasingly women and minorities, experience barriers in accessing healthcare through the Department of Veterans’ Affairs. The use of ICT, such as smartphone apps and online chat forums, may provide a useful approach for alleviating these barriers (Fortney et al., 2011). To realise the potential of these tools, however, it will be important to understand and address the barriers that women and minorities with disabilities experience accessing and using ICT.
Antidiscrimination law and policy have provided a useful basis for incentivising, and coercing, providers of goods and services to ensure access to ICT for persons with disabilities, but these laws do not fully comprehend the barriers that persons with intersectional identities experience in accessing ICT (Blanck, 2014). The 2010 Equality Act in the UK has provided protections for persons with multiple protected characteristics, such as disability, race, gender and sexuality. However, some research has found that the Equality Act has failed to accommodate instances of discrimination that have an intersectional nature (Solanke, 2011). As discussed in the following section, the Norwegian government has taken a different approach, requiring goods and service providers to ensure universal design of ICT (BLID, 2005).
UNIVERSAL DESIGN OF ICT
Universal design typically refers to the design of products and services to be usable by all persons to the greatest extent possible (UN, 2006). The Action Plan of the Norwegian Ministry of Children and Equality, in promoting universal design, asserts: “The government wants to get away from a way of thinking in which the individual is defined as the problem and in which special measures for people with disabilities are the main solution” (BLID, 2009). In principle, universal design may provide a mechanism for recognising the overlapping forms of discrimination that persons with intersectional identities experience. However, like the United Nations, the Norwegian government fails to recognise explicitly the application of universal design to persons with intersectional identities, such as women with disabilities; in this regard, the Norwegian legislation is vulnerable to the same criticism as the UK’s Equality Act.
While ICT accessibility is typically associated with the removal of barriers, making ICT products usable by persons with disabilities, scholars have recently begun to adopt broader conceptualisations, which relate more closely to the concept of universal design (Giannoumis, 2016). Persson et al. (2014) define accessibility as “the extent to which products, systems, services, environments and facilities are able to be used by a population with the widest

Taking Stock: Data and Evidence on Gender Digital Equality PART TWO
257
range of characteristics and capabilities (e.g. physical, cognitive, financial, social and cultural, etc.), to achieve a specified goal in a specified context”. Similarly, Petrie et al. (2015) pose a unified definition of web accessibility, arguing that web accessibility means that “all people, particularly disabled and older people, can use websites in a range of contexts of use, including mainstream and assistive technologies; to achieve this, websites need to be designed and developed to support usability across these contexts”.
The scope of the definitions provided by Petrie et al. (2015) and Persson et al. (2014) are similar to the definition of universal design proposed in the CRPD. According to the CRPD, universal design “means the design of products, environments, programmes and services to be usable by all people, to the greatest extent possible, without the need for adaptation or specialised design”. (We note that the caveat “to the greatest extent possible” echoes other limit-setting legal provisions, such as the phrase “undue burden” that appears in disability anti-discrimination legislation in the United States.)
While universal design may provide a useful basis for identifying and removing barriers that persons with intersectional identities, such as women with disabilities, experience in accessing and using ICT, the concept has not been fully analyzed and operationalised in a way that would allow scholars and advocates to integrate an intersectional perspective into the design and development of ICT. For example, research on universal design shows that persons with disabilities generally experience barriers in accessing information on the web. Other research shows that persons with disabilities are not seen as autonomous sexual beings (Shakespeare, Gillespie-Sells, & Davies, 1996). This suggests that a woman with a disability may experience overlapping barriers in attempting to access maternal health information on the web. The challenge remains for web content to be developed with consideration of the barriers that the individual may experience, based on the intersection of disability and gender.
GAPS IN THE LITERATURE
Research has yet to examine fully ICT accessibility and universal design. Existing studies need to be built upon, in four important directions.
First, while research on ICT accessibility has typically focused on the usability of web content for persons with specific impairments (e.g., the blind and partially sighted, or deaf and hard of hearing), scholars have yet to investigate extensively the experiences of persons belonging to multiple socially marginalised groups in accessing and using ICT (Skjerve, et al., 2016). In addition, while research has begun to explore the relationship between gender and disability in
accessing and using ICT, few programmes exist that target access to ICT for women with disabilities (Adams & Kreps, 2006a, 2006b).
Second, while ICT developers have made significant strides towards the automatic detection of hate speech online, the implications of such technology for persons with intersectional identities have yet to be explored (Djuric et al., 2015; Gitari et al., 2015; Badjatiya, 2017).
Third, research on ICT accessibility has not yet fully examined the socio-economic and socio-political mechanisms that persons with disabilities experience accessing ICT, particularly women with disabilities in the Global South (Abascal et al., 2016). “Accessibility,” as generally understood, is accessible for only a small fraction of people with disabilities. Fourth, research in universal design, similarly, has yet to provide a useful theoretical framework or model that captures the experiences of persons with intersectional identities, such as women with disabilities (Lid, 2014).
RECOMMENDATIONS FOR RESEARCH AND PRACTICEResearch
Future research could usefully collect data on the experiences of women with disabilities, focusing especially on ICT barriers that are created at the intersection of such discriminating structures as racism, transphobia, sexism, homophobia, and xenophobia.
Universal Design has yet to establish its theoretical anchoring. Future research could bring interdisciplinary application of models and methods used in other fields, to inform further research and development within the field of Universal Design of ICT.
Researchers could usefully examine the experiences of women with disabilities across the gender diversity spectrum, in accessing and using ICT. Similarly, an intersectional perspective can better illuminate such highly salient topics as online privacy, child online protection, and cybersecurity.
Finally, future research could usefully employ culturally responsive computing (CRC) (Scott et al., 2015) to enrich computing education by focusing on an individual user’s cultural and social contexts. This includes presenting content in a rich and culturally-embedded way rather than attempting to “sanitise” it, as well as framing technology use in innovative ways to invite broader active participation, rather than requiring users to separate themselves from their multiple identities.

Taking Stock: Data and Evidence on Gender Digital Equality PART TWO
258
Laws, Policies, and Technical Standards
National and international law and policies require systematic reform to incorporate an intersectional understanding of accessibility in technical guidelines, accessibility regulations, and antidiscrimination laws.
In order to ensure access to ICT for all persons, governments must recognise, under law, the experiences of persons with intersectional identities that are subject to multiple forms of discrimination (Solanke, 2011). Laws and policies offering legal protections only for single forms of discrimination may not provide a clear enough standard to ensure access to ICT for women with disabilities. To ensure ICT access to everyone, laws, policies, and standards must include requirements for ensuring the universal design of ICT, while recognising human diversity and the overlapping forms of discrimination and inaccessibility that exist at the intersection of different forms of social disadvantage.
REFERENCES
Abascal, J., Barbosa, S. D., Nicolle, C., & Zaphiris, P. (2015). Rethinking universal accessibility: A broader approach considering the digital gap. Universal Access in the Information Society, 15(2), 179-182. Retrieved from: doi:10.1007/s10209-015-0416-1
Adam, A., & Kreps, D. (2006). Enabling or disabling technologies? A critical approach to web accessibility. Information Technology & People, 19(3), 203-218.
Adam, A., & Kreps, D. (2006). Web accessibility: A digital divide for disabled people? In: Social inclusion: Societal and organizational implications for information systems (pp. 217-228). Springer.
Badjatiya, P., Gupta, S., Gupta, M., & Varma, V. (2017). Deep learning for hate speech detection in tweets. Proceedings of the 26th International Conference on World Wide Web Companion (WWW 17 Companion). Retrieved from: doi:10.1145/3041021.3054223
Barnett, J. P. (2017). Intersectional harassment and deviant embodiment among autistic adults: (Dis)ability, gender and sexuality. Culture, Health & Sexuality, 19(11), 1210-1224. Retrieved from: doi:10.1080/13691058.2017.1309070
Brenner, J. (2003). Transnational feminism and the struggle for global justice. New Politics, 9(2), 78.
Brown, J., & Hollier, S. (2015). The challenges of Web accessibility: The technical and social aspects of a truly universal Web. First Monday, 20(9).
Bertot, J. C., Jaeger, P. T., & Hansen, D. (2012). The impact of polices on government social media
usage: Issues, challenges, and recommendations. Government Information Quarterly, 29(1), 30-40. Retrieved from: doi:10.1016/j.giq.2011.04.004
Blanck, P. (2014). eQuality: The struggle for web accessibility by persons with cognitive disabilities. New York: Cambridge University Press.
BLID (2005). Act on Equality and Anti-Discrimination Ombud and the Equality and Anti-Discrimination Tribunal (Anti-Discrimination Act). [Lov om Likestillings- og diskrimineringsombudet og Likestillings- og diskrimineringsnemnda (diskrimineringsombudsloven)].
BLID (2009). Norway universally designed by 2025: The Norwegian government’s action plan for universal design and increased accessibility 2009-2013, p. 9. Retrieved from: https://www.regjeringen.no/globalassets/upload/bld/nedsatt-funksjonsevne/norway-universally-designed-by-2025-web.pdf
Bøhler, K.K., Giannoumis, G. A. (2017) 12 Technologies for Active Citizenship and the Agency of Objects. In: R. Halvorsen, B. Hvinden, J. Beadle-Brown, M. Biggeri, J. Tøssebro, A. Waldschmidt (Eds.), Understanding the lived experiences of persons with disabilities in nine countries: Active citizenship and disability in Europe, Volume 2 (12).
Chaudhry, V. (2016). Living at the edge: Disability, gender, and neoliberal debtscapes of microfinance in India. Affilia, 31(2), 177-191. Retrieved from: doi:10.1177/0886109915622525
Collins, P. H., & Bilge, S. (2016). Intersectionality. Cambridge, UK & Malden, MA: Polity Press.
Council of Europe (COE). (2003). Discrimination against women with disabilities: Report. Strasbourg: Council of Europe Publishing. Retrieved from: https://rm.coe.int/16805a2a17
Crenshaw, K. (1991). Mapping the margins: Intersectionality, identity politics, and violence against women of color. Stanford Law Review, 43(6), 1241. Retrieved from: doi:10.2307/1229039
De Andrés, J., Lorca, P., & Martínez, A. B. (2010). Factors influencing web accessibility of big listed firms: An international study. Online Information Review, 34(1), 75-97. Retrieved from: doi:10.1108/14684521011024137
Dobransky, K., & Hargittai, E. (2006). The disability divide in internet access and use. Information, Communication & Society, 9(3), 313-334.
Djuric, N., Zhou, J., Morris, R., Grbovic, M., Radosavljevic, V., & Bhamidipati, N. (2015). Hate speech detection with comment embeddings. Proceedings of the 24th International Conference on World Wide Web (WWW 15 Companion). Retrieved from: doi:10.1145/2740908.2742760

Taking Stock: Data and Evidence on Gender Digital Equality PART TWO
259
Ellis, K., & Kent, M. (2015). Disability and the internet in 2015: Where to now? First Monday, 20(9). Doi: dx.doi.org/10.5210/fm.v20i9.6163
Fernandes, L. (2013). Transnational feminism in the United States: Knowledge, ethics, and power. New York: New York University Press.
Ford, H., & Wajcman, J. (2017). ‘Anyone can edit’, not everyone does: Wikipedia’s infrastructure and the gender gap. Social Studies of Science, 47(4), 511-527. doi:10.1177/0306312717692172
Fortney, J. C., Burgess, J. F., Bosworth, H. B., Booth, B. M., & Kaboli, P. J. (2011). A re-conceptualization of access for 21st century healthcare. Journal of General Internal Medicine, 26(S2), 639-647. doi:10.1007/s11606-011-1806-6
Giannoumis, G. A. (2015a). Auditing Web accessibility: The role of interest organizations in promoting compliance through certification. First Monday, 20(9). doi:10.5210/fm.v20i9.6167
Giannoumis, G. A. (2015b) Transnational convergence of public procurement policy: A ‘bottom-up’ analysis of policy networks and the international harmonisation of accessibility standards for information and communication technology. International Review of Law, Computers & Technology, 29(2-3), 183-206. doi: 10.1080/13600869.2015.1055662
Giannoumis, G. A. (2016). Framing the universal design of information and communication technology: An interdisciplinary model for research and practice. Studies in health technology and informatics, 229, 492.
Gitari, N. D., Zhang, Z., Damien, H., & Long, J. (2015). A Lexicon-based approach for hate speech detection. International Journal of Multimedia and Ubiquitous Engineering, 10(4), 215-230. doi:10.14257/ijmue.2015.10.4.21
Goggin, G. (2015). Disability and mobile Internet. First Monday, 20(9). doi:10.5210/fm.v20i9.6171
Goggin, G. (2016). Disability and digital inequalities: Rethinking digital divides with disability theory. In: M. Ragnedda & G. W. Muschert (Eds.), Theorizing Digital Divides (pp. 69-80).
Green, C. R., Anderson, K. O., Baker, T. A., & Vallerand, A. H. (2003). The unequal burden of pain: Confronting racial and ethnic disparities in pain. Pain Medicine, 4(3), 277-294. doi:10.1046/j.1526-4637.2003.03034.x
Green, R. A., & Huprich, J. (2009). Web accessibility and accessibility instruction. Journal of Access Services 6(1-2): 116-136. Doi: 10.1080/15367960802247825
Henwood, F. (2000). From the woman question in technology to the technology question in feminism.
Rethinking Gender Equality in IT Education, 7(2), 209-227. doi:10.1177/135050680000700209
Jaeger, P. (2004). Beyond Section 508: The spectrum of legal requirements for accessible e-government Web sites in the United States. Journal of Government Information, 30(4), 518-533. doi:10.1016/s1352-0237(04)00057-7
Jaeger, P. T. (2008). User-centered policy evaluations of Section 508 of the Rehabilitation Act. Journal of Disability Policy Studies, 19(1), 24-33. doi:10.1177/1044207308315274
Jaeger, P. T. (2015). Disability, human rights, and social justice: The ongoing struggle for online accessibility and equality. First Monday, 20(9). doi:10.5210/fm.v20i9.6164
Johnson, A., & Ruppert, S. (2002). An evaluation of accessibility in online learning management systems. Library Hi Tech 20(4): 441-451. doi: 10.1108/07378830210452640
Klein, D., Myhill, W., Hansen, L., Asby, G., Michaelson, S., & Blanck, P. (2003) Electronic doors to education: Study of high school Website accessibility in Iowa. Behavioral Sciences and the Law, 21(27-50) doi: 10.1002/bsl.521
Kuzma, J. M. (2010). Accessibility design issues with UK e-government sites. Government Information Quarterly, 27(2), 141-146. doi:10.1016/j.giq.2009.10.004
Lawson, A. (2016). European Union non-discrimination law and intersectionality: Investigating the triangle of racial, gender and disability discrimination. Routledge.
Lazar, J., Jaeger, P. T., Adams, A., Angelozzi, A., Manohar, J., Marciniak, J., . . . Walsh, J. (2010). Up in the air: Are airlines following the new DOT rules on equal pricing for people with disabilities when websites are inaccessible? Government Information Quarterly, 27(4), 329-336. doi:10.1016/j.giq.2010.04.005
Lid, I. M. (2014). Universal design and disability: An interdisciplinary perspective. Disability and rehabilitation, 36(16), 1344-1349.
Meer, T., & Combrinck, H. (2015). Invisible intersections: Understanding the complex stigmatisation of women with intellectual disabilities in their vulnerability to gender-based violence. Agenda, Empowering women for gender equity, 29(2), 14-23. doi:10.1080/10130950.2015.1039307
Moodley, J., & Graham, L. (2015). The importance of intersectionality in disability and gender studies. Agenda, Empowering women for gender equity, 29(2), 24-33. doi:10.1080/10130950.2015.1041802
Nguyen, X., & Mitchell, C. (2014). Inclusion in Vietnam: An intersectionality perspective on girls with

Taking Stock: Data and Evidence on Gender Digital Equality PART TWO
260
disabilities and education. Childhood, 21(3), 324-338. doi:10.1177/0907568214524459
Olalere, A., & Lazar, J. (2011). Accessibility of U.S. federal government home pages: Section 508 compliance and site accessibility statements. Government Information Quarterly, 28(3), 303-309. doi:10.1016/j.giq.2011.02.002
Oliver, M. & Barnes, C. (2012). The new politics of disablement. Houndmills, Basingstoke: Palgrave Macmillan.
Persson, H., Åhman, H., Yngling, A. A., & Gulliksen, J. (2015). Universal design, inclusive design, accessible design, design for all: Different concepts—one goal? On the concept of accessibility—historical, methodological and philosophical aspects. Universal Access in Information Society, 14(4), 505-526. doi:10.1007/s10209-014-0358-z
Petrie, H., Savva, A., & Power, C. (2015). Towards a unified definition of web accessibility. Proceedings of the 12th Web for All Conference on W4A 15. doi:10.1145/2745555.2746653
Rideout, V. J., Scott, K. A., & Clark, K. A. (2016). The digital lives of African American tweens, teens, and parents: Innovating and learning with technology. Center for Gender Equity in Science and Technology (CGEST). Retrieved from https://cgest.asu.edu/sites/default/files/digital_lives_report_0.pdf
Ritchie, H., & Blanck, P. (2003). The promise of the Internet for disability: A study of on-line services and web site accessibility at Centers for Independent Living. Behavioral Sciences & the Law, 21(1), 5-26. doi:10.1002/bsl.520
Romañach, J., and Lobato, M. (2005). Functional Diversity, a new term in the struggle for dignity in the diversity of the human being. Independent Living Forum In Spain. Retrieved from: http://www.enil.eu/wp-content/uploads/2012/07/Functional-diversity-a-new-term-in-the-struggle-for-dignity-in-the-diversity-of-the-human-being_2005.pdf.
Rubaii-Barrett, N., & Wise, L. R. (2008). Disability access and e-government: An empirical analysis of state practices. Journal of Disability Policy Studies, 19(1), 52-64. doi:10.1177/1044207307311533
Sen, A. (1995). Gender inequality and theories of justice. Women, Culture, and Development, 259-273. doi:10.1093/0198289642.003.0011
Scott, K. A., Sheridan, K. M., & Clark, K. (2014). Culturally responsive computing: A theory revisited. Learning, Media and Technology, 40(4), 412-436. doi:10.1080/17439884.2014.924966
Shelton, S. Z. (2017). A queer theorist’s critique of online domestic violence advocacy: Critically responding to the National Coalition Against
Domestic Violence web site. Journal of Homosexuality, 1-24. doi:10.1080/00918369.2017.1374060
Skjerve, R., Giannoumis, G. A. & Naseem, S. (2016). An intersectional perspective on web accessibility. In: P. Langdon, J. Lazar, A. Heylighen & H. Dong (Eds.), Designing around people (13-22). doi:10.1007/978-3-319-29498-8_2
Shakespeare, T., Gillespie-Sells, K., & Davies, D. (1996). The sexual politics of disability: Untold desires. Cassell.
Solanke, I. (2011). Infusing the silos in the Equality Act 2010 with synergy. Industrial Law Journal, 40(4), 336-358. doi:10.1093/indlaw/dwr024
Stewart, R., Narendra, V., & Schmetzke, A. (2005). Accessibility and usability of online library databases. Library Hi Tech, 23(2), 265-286. doi:10.1108/07378830510605205
Tatomir, J., & Durrance, J. C. (2010). Overcoming the information gap: Measuring the accessibility of library databases to adaptive technology users. Library Hi Tech, 28(4), 577-594. doi:10.1108/07378831011096240
Toboso, M. (2011). Rethinking disability in Amartya Sen’s approach: ICT and equality of opportunity. Ethics and Information Technology, 13(2), 107-118. doi: 10.1007/s10676-010-9254-2
United Nations. (2006). Convention on the Rights of Persons with Disabilities and Optional Protocol.
Web Accessibility Initiative (2011). Web Content Accessibility Guidelines (WCAG) 2.0. Retrieved from https://www.w3.org/TR/WCAG20/
Williams, R., & Rattray, R. (2003). An assessment of Web accessibility of UK accountancy firms. Managerial Auditing Journal, 18(9), 710-716. doi:10.1108/02686900310500460
World Health Organization (2011). World report on disability. Retrieved from: http://www.who.int/disabilities/world_report/2011/report/en/
World Health Organization (2016). Global Health Estimates 2015: Burden of disease by cause, age, sex, by country and by region, 2000-2015. Retrieved from: http://www.who.int/healthinfo/global_burden_disease/estimates/en/
Wu, B. (2015). Doxxed: Impact of online threats on women including private details being exposed and “swatting”; US law protects against violence and threats. Index on Censorship, 44(3), 46-49. doi:10.1177/0306422015605714
Yi, Y. J. (2015). Compliance of Section 508 in public library systems with the largest percentage of underserved populations. Government Information Quarterly, 32(1), 75-81. doi:10.1016/j.giq.2014.11.005

Taking Stock: Data and Evidence on Gender Digital Equality PART TWO
261
Yu, H. (2002). Web accessibility and the law: Recommendations for implementation. Library Hi Tech, 20(4), 406-419. doi:10.1108/07378830210452613

262
ICT IN A CHANGING CLIMATE: A PATH TO GENDER-TRANSFORMATIVE FOOD SECURITY
5
AUTHOR: SOPHIA HUYER, PH.D., WOMEN IN GLOBAL SCIENCE AND TECHNOLOGY (WISAT) AND CGIAR CLIMATE CHANGE, AGRICULTURE AND FOOD SECURITY PROGRAMME (CCAFS)

Taking Stock: Data and Evidence on Gender Digital Equality PART TWO
263
ABSTRACT
Women play a critical role in food security in the developing world, but their agricultural activities are often characterised by gaps in information and resource access, with deficiencies in several areas: land, labour, credit, information, extension, and technology. Increasing stresses on food security, brought about by a changing climate, call for the active contributions of women in agriculture. This will require equal participation in decision making, equal access to agricultural resources and services, institutions that address their concerns, and technologies and information that are useful to them. ICTs are so far not providing them with the information, services, and knowledge they need and want. Sufficient evidence and experience exist, however, to develop agricultural information strategies for food security that support women and promote gender equality. This chapter provides a review of women’s access to and use of climate and agriculture information; it provides examples of successful strategies for reaching women, with suggestions for further research and programming to promote gender equality along with climate information..
KEY FINDINGS
• ICT and information services have the potential to promote gender equality and empowerment of rural women, if they contribute to needs and priorities of both women and men in rural areas and increase their resilience to cope with climate change. Currently, however, information is not reaching women farmers adequately.
• ICT can play an important role in facilitating support to women in the critical areas defined by FAO for supporting women’s activities in food security: livelihood support, reducing women’s workloads, ensuring protection from gender-based violence, and equitable access to resources and services.
• “Mixed” approaches may provide the most successful approaches to reach women with agriculture and climate information, in view of women’s low resource access and the widespread gender norms that inhibit women’s information access. Intermediary organisations, such as farmer associations and women’s organisations, also serve as important avenues for women’s information access.
GENDER AND FOOD SECURITY IN A CHANGING CLIMATE
ICTs have the potential to promote gender equality and empowerment of rural women in developing countries, while increasing food security, by decreasing workloads, increasing decision-making power, diversifying agricultural production, enhancing ability to respond to climate and weather variability, and improving livelihoods. Although ICT4D has a significant track record in development, the technology has not yet provided rural women in developing countries with the information, services, and knowledge they need and want — even as climate change has increased their need for innovative solutions. The problem lies in designing the transmission of information that women need in ways they can access readily. When this does happen, women have shown their readiness and eagerness to use and benefit from information through technology. Women play a critical role in food security in the developing world. Their participation in the agricultural labour force in sub-Saharan Africa ranges from 60% to 80%; in least developed countries (LDCs), 80% of women list agriculture as their major employment sector. These percentages will increase in many countries, as rural women play a growing role in smallholder agriculture as a result of male out-migration to urban centres for employment (Doss, 2011; FAO, 2011; UN, 2015). However, women’s agricultural activities are often characterised by gaps in information and resource access, with deficiencies in critical areas: land, labour, credit, information, extension, and technology (Huyer, 2016). The Food and Agriculture Organisation (FAO) has calculated that, if women farmers were to have the same access to resources and services as male farmers, their production would increase by 10–14%, with a resulting massive decrease — of up to 150 million — in the global population that experience hunger (2011). Women’s vital contribution to food production, subsistence farming, and the agricultural labour force in the developing world means that strategies to promote gender equality and women’s empowerment in ICT in agricultural development must be a priority for global food security. Such efforts are also central to a global development agenda based on human rights and the Sustainable Development Goals (SDGs).
Globally, rural women fare worse than either rural men, urban women, or urban men, on every gender and development indicator for which data are available; they show lower levels of health, education, employment, and decision-making power. They face higher levels of poverty and violence. Women and girls also face a higher risk of undernourishment — about 60% of people living in hunger are female (UN, 2010; UN, 2015; FAO, 2017). They are more affected by environmental deterioration and hazards, as they depend on, and have responsibility for, natural

Taking Stock: Data and Evidence on Gender Digital Equality PART TWO
264
resources. In 2010, an estimated 66% of households in sub-Saharan Africa, 55% in South and Southeast Asia, and 31% in Latin America relied on collected fuelwood for cooking, with women being primarily responsible for fuelwood collection. Rural women are at especially high risk of negative impacts from climate change, as their household responsibilities entail natural resource-based activities, including subsistence agriculture and fetching water and fuelwood. Increasing rates of male out-migration from rural areas means that women also take on additional work in agricultural production. For these reasons, environmental stress in farming systems (such as those imposed by climate change) intensifies women’s workloads while decreasing the assets of poor households (Jost et al., 2016; Agwu & Okhimamwe, 2009).
Despite global gains in food production and reduction in poverty, the world faces a crisis: some 795 million people still suffer from hunger, and more than two billion experience either micronutrient deficiencies or some form of over-nourishment. Increasing pressures on natural resources due to population growth and resource extraction are exacerbated by climate change, natural disasters, and other shocks, which threaten the sustainability of food systems at large (FAO, 2017). Other major challenges include increasing urbanisation and demand for food, erratic food prices, conflict, population displacement, and continuing economic inequality. A transformation of rural development is required, if agriculture in the developing world is to cope (IFAD, 2016). Given women’s role throughout food production, nutrition, environmental management, and social well-being, gender equality needs to be integral to this transformation.
Different social groups of course have varying socio-economic status, political participation, and access to resources, affecting their ability to cope with and respond to the effects of climate change. However, reflecting widespread social, political and economic inequalities, women are almost invariably at a greater disadvantage than men in the same social group, with less access to land, fewer resources and entitlements, more limited access to information and services, and less participation in decision-making (FAO, 2017). The gendered division of labour additionally means they work longer days than men, and new activities requiring additional labour are often allocated to already burdened women (Grassi et al., 2015; Beuchelt & Badtue, 2013). The latest IPCC assessment on social vulnerability makes clear that climate change will exacerbate these existing gender inequalities (IPCC, 2014).
At the same time, women’s contributions to resilience building and peace processes are often overlooked; they are rarely represented in leadership and decision-making institutions, from local to national levels. As a result of these inequalities, women have less opportunity to influence policies, programmes, and decisions that affect their lives. The effects of climate variability, shocks, and extreme weather events
are likely to increase the existing inequalities and vulnerabilities faced by women (Dankelman, 2010; Kakota et al., 2015; IPCC, 2014).
But women are also active agents for community and household resilience and in developing responses to the impacts of climate change (Denton, 2002; Dankelman, 2010). Rural women’s local knowledge in areas of environment, soils, water, and production are valuable resources for reduction and adaptation strategies. Engaging women in technology design and management decisions can improve community outcomes, as shown in Honduras, where women have re-designed eco-stoves and developed improved agroforestry management systems (Hottle, 2015). Women identified changes in Fiji’s coral reef, such as bleaching, changes in spawning periods of certain fish, and algal blooms. Women in Micronesia were able to identify locations for new wells based on their knowledge of local water tables (Lane & McNaught, 2009).
Food security in a changing climate requires the active participation of women, that will entail: equal participation in decision making and equal access to agricultural resources and services; institutions that address their concerns; and technologies and information that are useful to them. ICT and information services have the potential to promote gender equality and empowerment of rural women, if these technologies and services contribute to the needs and priorities of women and men in rural areas and increase their resilience to cope with effects of climate change. However, information currently is not reaching women farmers adequately. ICTs are not providing them with the information, services, and knowledge they need and want. Sufficient evidence and experience are already available to inform new agricultural information strategies for food security that at the same time support women and promote gender equality.
CLIMATE AND FOOD SECURITY INFORMATION IS NOT REACHING WOMEN
Access to ICTs — including ownership, control, and use — generally remains much lower for women than men in developing countries (ITU, 2016). Reasons for this include: lack of financial resources to secure the use of ICTs; lower levels of technological and language literacy among women and girls; norms that discourage women and girls from using technology; and lack of control over and ownership of technology (see Huyer & Hafkin, 2006). The resulting patterns of unequal access to climate information and advisory services determine which individuals can make use of such services to manage climate risk and strengthen their resilience at the farm level. The farmers who

Taking Stock: Data and Evidence on Gender Digital Equality PART TWO
265
tend to be most vulnerable to climate change stresses are resource-poor, female, and lower caste — individuals who are marginalised by their communities’ sociocultural norms (Tall et al., 2014).
Reflecting the digital gender divide, as well as the general failure to recognise the full range of women’s activities in agriculture (see FAO, 2017), women are consistently less considered in the design of agricultural information and extension services. A World Bank study investigated whether and how ICT can support women-managed agro-enterprises in Kenya and Zambia, concluding that women and men differ in their access to, use of, and need for ICT tools. It found high unmet demand for extension information among women farmers that ICT could help to fill (World Bank, 2015), since women’s household responsibilities may prevent them from accessing radio programmes or extension sessions (Archer, 2003; Meinzen-Dick et al., 2010).
Agricultural extension and support services tend to be biased toward male farmers, particularly in cultures where women are responsible for household food production and men are responsible for commercial crops (World Bank, IFAD, & FAO, 2009; Meinzen-Dick et al., 2010). For example, in Ghana, women’s lower use of fertiliser is related to their lack of access to agricultural extension (Emmanuel et al., 2016); in the developing world in general, information on nitrogen use has not been reaching women (Farnworth et al., 2017). In India, women-headed households with land are 25% less likely to receive an extension visit; and there is a gender gap in bank account ownership in most developing countries -- in Bangladesh, Pakistan, and Turkey the gap is nearly 30 percentage points (Demirgüç-Kunt et al., 2018). In one region in Kenya, whereas both husbands and wives had contact with extension officers during field visits, the husbands had more access to information on crop and livestock production and more access to other extension services than their wives (Ngigi et al., 2017).
A range of barriers constrain women’s access to climate information related to agriculture: limited access to resources; gender norms relating to women’s status, roles, and capabilities; and limited participation in household and community decision making. For example, although group communication processes have proven to be effective at enabling farmers to understand and act on climate-related information, culture-specific gender norms and power relations often inhibit women’s attendance at community meetings (Roncoli et al., 2011). In South Asia, women farmers were unable to use advisories to inform their decision making due to inability to read the advisories, lack of time to watch radio or television, or low participation in community activities and meetings where the advisories were disseminated or discussed. The latter factor in turn reflects a number of obstacles: lack of time to attend meetings, childcare requirements, lack of transportation, or gender norms that prohibit women to participate in discussions attended by male farmers (Venkatasubramian et
al., 2014; Roncoli et al., 2011). Women’s information networks are often smaller than men’s, and women tend not to have access to formal organisations, depending instead on informal networks such as family members, neighbours, and other traditional sources of information (Manfre & Nordehn, 2013). While women in rural farming communities largely depend on these informal sources for information, men are able to access information from agricultural extension services, NGOs, and community meetings (Kristjanson et al., 2015; Cramer et al., 2016; Perez et al., 2015).
Women also have fewer opportunities for learning about and taking up new productive and commercial opportunities (Sebstad & Manfre, 2011). In Southeast Asia, women and men played different roles in domestic labour, shaping their participation in agricultural production (Duong et al., 2017). Women were responsible for most meal preparation and daily care of children. With fewer domestic responsibilities, men had more time to engage in income streams outside of agriculture that are less weather-dependent and that generate higher levels of income, while women earned their income mainly through agriculture. Men also made most farm-related decisions, such as crop selection and application for loans. As a result, there were also gender differences in the effects of weather events: more women than men experienced major damage to their crops from natural disasters, such as prolonged rainy seasons, flooding, and temperature extremes. Contributing factors were differences in access to both information and resources to prevent weather-related damage, such as changing crop management strategies, investing in livestock vaccinations, stocking seed and animal feed, and buying new agricultural tools or equipment (Duong et al., 2017).
Women’s different agricultural tasks and household responsibilities mean that they may require different information than men (Jost et al., 2016). Women farmers in Senegal, for example, need forecasts of rainfall cessation (rather than onset) and of dry periods, because they work their lands at different times than men (Tall et al., 2014b). In southern Mali, men are responsible for cultivating rain-fed staple grains, while women have more control over hand-irrigated garden crops. With little decision-making authority over rain-fed cereals, women have little interest in or ability to act on forecasts relevant to those crops (Carr et al., 2016). A failure to provide for women’s priorities and needs may be one reason for their lower rates of access to formalised information channels: data collected in Uganda found that, although women are responsible for post-harvest handling of food, just over one-half of them received information related to these practices, reflecting lack of access to extension and other sources of information (Kristjanson et al., 2015). On the other hand, when the available information is valuable to women, they will pay the cost. In Rwanda, it was found that women lagged only slightly behind men in mobile use, and in emergency assistance for livestock, women

Taking Stock: Data and Evidence on Gender Digital Equality PART TWO
266
slightly predominated: they reported contacting veterinarians for livestock assistance on a regular basis. This assistance allowed them to save money on travel and to keep the livestock healthy in order to breed them successfully. Small livestock is often an area where women have decision-making power and can benefit from the proceeds, so they find it worthwhile to bear the cost of mobile phone use to improve results. (Martin & Abbott, 2011.)
In general, however, content addressing women’s specific interests and priorities represents a large gap (Huyer, 2006; GSMA, 2012), particularly in the agricultural sector. Women seek out a wide range of information to support their household and farming activities, such as information on nutrition, reproductive health, education, and entrepreneurship, but much information is not readily available to them (Cramer et al., 2016; GSMA, 2012; Pshenichnaya, 2011; Caine et al., 2015).
DESIGNING CLIMATE INFORMATION FOR GENDER EMPOWERMENT
Ensuring that women have access to information and knowledge that they value and can use effectively represents an important step towards gender equality and women’s empowerment (see Hafkin & Huyer, 2006). Research demonstrates that when women have access to information on agricultural technologies, along with the resources to implement it, they in fact implement the knowledge they have gained (Duong et al., 2016; Jost et al., 2016); the resilience of households, communities, and food systems are increased as a result (World Bank, FAO, & IFAD, 2009). Climate change, extreme weather events, and natural disasters make it even more important for farmers to have timely and accurate information on adaptive practices, inputs, and technologies, enabling them to take steps to minimise or prevent losses in agricultural production. Farmers need accurate climate information to help them cope with extreme weather events and variable rainfall patterns, including early warning systems, improved forecasting, and historical climate pattern information, as well as an extended range of options for adapting to changes in weather (Coffey et al., 2015).
FAO has identified four critical strategies to support women farmers in increasing food security: (1) practical measures to work towards greater equality, including livelihood support for women and girls; (2) reducing women’s workloads; (3) ensuring protection from gender-based violence; and (4) equitable access to resources and services (FAO, 2016). ICT can play an important role in facilitating support to women in all four areas, by improving access to markets for livelihoods, easing work burdens through increased
efficiency and information, increasing women’s agricultural production, facilitating access to resources and services, and supporting women’s leadership in their communities (Huyer, 2012). In Congo, a group of women farmers used computers to access and exchange agricultural information over email and internet. They were able to source high-quality seeds from other countries and expand their information, networking, and market base. The increased income and status resulting from these benefits in turn increased their influence in the household and the community (APC, 2010). In Lesotho, cell phone use and reselling of airtime by women’s farming cooperatives increased their income and public profile, enabling members to participate in agricultural shows, trainings, and conferences through national programmes to encourage small-scale farmers (Vincent et al., 2009). Gender-specific information services take different forms. In relation to climate information, for example, efforts to involve rural women in the design of the services — adapting communication channels to take into account their concerns, responsibilities, travel and mobility, and schedules — can reduce the barriers women face in accessing these services (Tall et al., 2014a; Poulsen et al., 2015). Agricultural information can be incorporated into spaces and processes that are already part of women’s routines and social networks, such as boreholes or women’s groups (Tall et al., 2014a; Venkatasubramanian et al., 2014) — with transformative results. Social networks and community organisations, such as local women’s organisations or health clinics, can play a crucial role in promoting women’s access to information (Mooko, 2002). In Vietnam, intermediary organisations such as farmer associations and women’s organisations played a central role in enabling women to access information on water-conserving agricultural production and to realise their personal goals (Farnworth et al., 2017). A survey in Uganda found that women preferred to receive climate information (in descending order of importance) via megaphones, letters, village leaders, farmers groups, school children, religious and social gatherings, and print media. They felt that information in these forms was useful since it was presented in the local language and was location-specific (McOmber et al., 2013).
In India, access to mobile-phone-based agricultural information has reduced knowledge gaps between large and small farmers as well as between women and men. The “listening rate” of women farmers was equivalent to that of men farmers; 70% of women farmers felt that the “agro advisories” had increased their knowledge about farming practices, increasing their yields as a result. At least 48% of the women farmers surveyed responded that the information helped them to reduce costs through more efficient input management, and 56% felt that the information helped them to reduce crop losses from rainfall. In one region, 83% of women farmers reported having taken action based on the information they received through

Taking Stock: Data and Evidence on Gender Digital Equality PART TWO
267
this service. Interestingly, women also felt that the information increased their participation in household decision making with their husbands (Mittal, 2016).
Another successful case of providing information to women is Shamba Shape-up in Kenya, a television programme on small-scale agriculture on the model of popular house makeover shows.A survey found that most viewers of the show reported that the programme helped them improve the profitability of their enterprises and had a positive effect on their families’ food security. It is estimated that 428,566 households made changes in their farming practices and/or reported increased income or food production as a result of watching the programme. The programme focused mainly on maize and dairy; survey results were sex-disaggregated. While both male and female maize farmers benefited from the changes they made on their farms, men benefited slightly more, increasing their consumed output by 58% compared to an increase for women of 23%. Similarly, output for sale doubled for men and increased by 83% for women. In dairy, although men farmers had greater returns than women, women dairy farmers experienced greater proportional returns: their production increased by 59%, compared to improvement for men of 41% (Africa Enterprise Challenge Fund & University of Reading, 2014).
Radio continues to be an effective transformation tool in many rural areas. In a village in Kenya, Kamba women were able to hear women like themselves on Radio Mang’elete, providing market information, notification of social events, discussion forums, and entertainment in the forms of radio vignettes and plays. They were able to interact with community leaders and programme hosts online to suggest programming and offer content, providing them an opportunity to speak out publicly and demand answers from local leaders. As a result, they experienced increased agency and positive self-perception while gaining recognition of their input from the larger community (Sterling & Huyer, 2009). Dimitra community listening clubs in Congo and Niger represent a gender-responsive participatory approach to information dissemination and gender empowerment. They facilitate dissemination and exchange of information on local issues such as agricultural practices, climate change, food and nutrition security, women’s unequal workload, and access to water, land, sanitation, and health. Community members can request information on topics of interest. Information is disseminated using both new technologies (internet, on-line database, etc.) and more “traditional” means of communication (newsletter, brochures, and community radio). The experience of male-female interaction in a community forum allows the public airing and debate of many issues and has provided a platform for examination of gender roles. In one example, men in a rural community began to take on childcare duties, when their wives had responsibilities outside of the household (DIMITRA, 2013).
A more traditional approach to information dissemination, using training sessions, proved successful in serving women rice farmers in Vietnam, improving livelihoods and empowering participants. Their knowledge increased in almost all aspects of rice production: by obtaining better yields from the seeds they planted and using lower rates of inputs (such as seeds, fertiliser, and pesticides), they lowered their production costs. They enjoyed increased income from related farming activities, such as raising piglets using rice bran as feed. Women experienced increased participation in household decision-making related to farming decisions beyond animal rearing, on rice varietal choice, crop management, and post-harvest management. Further, women’s decision-making authority increased on household finances, regarding “how much money to spend on food” and expenditures on children’s education, as well as allocation of remittances received.
Three quarters of the women participants felt that their social position in the household and community improved. Most (84%) said that they were more highly respected by their husbands, children, and other family members because they contributed to higher rice yields and higher income. Men observed that after the training, women were able to discuss crop varieties and management practices (choice, timing, and amount of fertiliser) and that the trainings benefited the family; as a result, they encouraged their wives to attend agriculture training workshops. Fully 87% of participants experienced increased confidence in discussing rice technologies with their families, and 66% were more confident in interacting with agricultural extension services (Chi et al., 2015).
Successful approaches to reach women in the developing world with climate information most often consist of “mixed” approaches; unavailable resources as well as gender norms often inhibit women from interacting with formal and organised information channels and networks or from accessing certain communications technologies. Mixed modes or channels of communication can overcome the barriers faced by women at various points in the information dissemination process, taking advantage of existing communications networks and channels. For example, traditional local social networks can transmit information from mobile phones, producing a significant increase in the quality and speed of information delivery (Caine et al., 2015). Intermediaries (or “infomediaries”) who are respected community members can pass on the information they receive on their mobiles to other members of the community. An example of this is the Community Knowledge Worker project in Uganda (World Bank, 2012). Similarly, mAgri initiatives have used farmer co-operatives to spread information to farmers through their existing social networks (Caine et al., 2015). Cherotich et al. (2012) suggest that a combination of extension agents, radio, and local administration is most effective for disseminating climate information and support services to vulnerable people in marginal areas.

Taking Stock: Data and Evidence on Gender Digital Equality PART TWO
268
Finally, the potential for women farmers to use and benefit from the newest technologies needs to be researched and supported. Technological approaches including drones, big data, smart farms, geo-intelligence, and bioinformatics will play an ever-increasing role in food production in the developing world.
Unfortunately, the representation of women in STEM fields is low in general, and particularly low in fields related to ICT, natural resources management, and agriculture. Women are not well-represented as researchers, agricultural extension agents, skilled workers, professionals, or decision-makers (Huyer, 2015; Akeredolu, 2008; World Bank & IFPRI, 2010). Remedying these glaring gaps must be an urgent priority: increasing the enrolment of women and girls in these subjects, employing non-formal educational approaches on the ground, promoting the employment and retention of women in these fields, and ensuring their representation in decision-making in these fields at all levels.
CONCLUSION AND RECOMMENDATIONS
ICT and information services have the potential to promote gender equality and empowerment of rural women while increasing food security, through decreased workloads, increased decision-making power, diversified agricultural production, ability to respond to climate and weather variability, and improved livelihoods. But these gains are possible only if information and knowledge are well designed to respond to women’s situations, access to resources, and priorities. Information providers need to work with women’s community organisations to develop communication channels that are adaptive to the obstacles women face. This will require a range of options and approaches, including: consultation with women to determine their information needs and priorities; mixed ICT approaches that combine different media with different intermediary groups or community structures; and tailored approaches based in local community contexts and realities.
Few ICT and agricultural technology providers have recognised the potential market represented by rural women as a group, with some exceptions (see Wilkes & van Dijk, 2017). GSMA found that in Madagascar both women and men were willing to pay for recorded information on gender and health, on dedicated voice information lines (GSMA, 2015). Targeting rural women in developing countries as information and technology consumers is an area with substantial potential requiring more research.
Experience and evidence suggest several promising avenues for promoting gender equality62: • Consult with women and women’s organisations
in the development of ICT-enabled agricultural information, to ascertain their information needs and priorities.
• Assess climate information needs of women and men farmers separately, with further disaggregation — by male- or female-headed household, age, and socioeconomic status — or other factors that may shape roles, constraints, and information needs.
• Assess gender barriers in accessing ICT and information.
• Select or develop ICT services and channels in consultation with women’s and community organisations.
• Consider providing a range of useful and affordable information services tailored to women’s expressed interests, including nutrition, health, weather, and livelihood, in order to increase the value of these services to women.
• Assess the value of climate information services to women in terms of rate of access, use, and perceived benefits from use.
• Promote the participation of women and girls in STEM-related subjects, workforce, and decision-making at all levels.
• Work with the private sector to recognise the potential of women as a market for agricultural technologies, including ICT.
• Assess the value of climate information services to women in terms of rate of access, use, and perceived benefits from use.
• Assess impacts of key factors and strategies promoting women’s empowerment in the use of climate information, including choice of content and channel.
REFERENCES
Africa Enterprise Challenge Fund & University of Reading. (2014). Assessing the impacts of Shamba Shape Up. Nairobi: Africa Enterprise Challenge Fund. Retrieved from: https://cgspace.cgiar.org/rest/bitstreams/64998/retrieve
Agwu, J. & Okhimamwe, M. (2009). Gender and climate change in Nigeria. Lagos: Heinrich Böll Stiftung (HBS).
Akeredolu, M. (2008). Women in leadership positions in the Malian Ministry of Agriculture: Constraints and challenges. South African Journal of Agricultural
62 The first seven recommendations are based on Huyer et al. (2017).

Taking Stock: Data and Evidence on Gender Digital Equality PART TWO
269
Extension, 37, 208, 27–44. Archer, E. R. 2003. Identifying underserved end-user groups in the provision of climate information. Bulletin of the American Meteorological Society 84, 1525-32.
Association for Progressive Communications (APC) (2010). Gen ARDIS 2002-2010: Small grants that made big changes for women in agriculture.
Beuchelt, T. D., & Badstue, L. (2013). Gender, nutrition- and climate-smart food production: Opportunities and trade-offs. Food Security, 5(5), 709–721. Retrieved from: https://doi.org/10.1007/s12571-013-0290-8
Caine Dorward, P., Clarkson, G., Evans, N., Canales, C., Stern, D. & Stern, R. A. (2015). Mobile applications for weather and climate information: Their use and potential for smallholder farmers. Working Paper 150. Retrieved from: https://doi.org/10.2139/ssrn.701181
Carr, E. R., Fleming, G., & Kalala, T. (2016). Understanding women’s needs for weather and climate information in agrarian settings: The case of Ngetou Maleck, Senegal. Weather, Climate, and Society, 8(3), 247–264. Retrieved from: https://doi.org/10.1175/WCAS-D-15-0075.1
Cherotich, V. K., Saidu, O., & Bebe, B. O. (2012). Access to climate change information and support services by the vulnerable groups in semi-arid Kenya for adaptive capacity development. African Crop Science Journal, 20(s2), 169–180.
Chi, T. T. N., Paris, T., Anh, T. T. T., Duy, L., & Loan, D. T. (2015). Enhancing the roles of women in rice farming as an adaptation strategy to climate change risks: A case study in submergence villages in Hau Giang province, South Vietnam. Technical Report. Hanoi, Viet Nam: Cuu Long Rice Research Institute (CLRRI).
Coffey, K., Menghestab, H., Halperin, M., Wamukoya, G., Hansen, J., Kinyangi, J., & Tesfaye Fantaye, K. (2015). Expanding the contribution of early warning to climate-resilient agricultural development in Africa. Working Paper No. 115. Copenhagen, Denmark: CGIAR Research Programme on Climate Change, Agriculture and Food Security (CCAFS). Retrieved from: https://cgspace.cgiar.org/handle/10568/66596
Cramer, L., Mutie, I., & Thornton, P. K. (2016). Connecting women, connecting men: How communities and organizations interact to strengthen adaptive capacity and food security in the face of climate change. Gender, Technology and Development, 20(2). Retrieved from: https://doi.org/10.1177/0971852416639771
Dankelman, I. (2010). Introduction: Exploring gender, environment, and climate change. In: I. Dankelman (Ed.), Gender and climate change: An Introduction. London: Routledge.
Denton, F. (2002). Climate change vulnerability, impacts, and adaptation: Why does gender matter?
Gender and Development, 10(2), 10–20.
Dimitra Project. (2013). Dimitra community listeners’ clubs and poverty reduction, a forum to share results. Dimitra Newsletter 24. Rome: FAO.
Doss, C. (2011). If women hold up half the sky, how much of the world’s food do they produce? Rome: FAO.
Duong, T. M., Smith, A., Le, T. T., Simelton, E., & Coulier, M. (2017). Gender-differences in agro-climate information services. Copenhagen, Denmark: CGIAR Research Programme on Climate Change, Agriculture and Food Security (CCAFS).
Emmanuel, D., Owusu-Sekyere, E., Owusu, V., & Jordaan, H. (2016). Impact of agricultural extension service on adoption of chemical fertilizer: Implications for rice productivity and development in Ghana. NJAS - Wageningen Journal of Life Sciences, 79, 41–49. Retrieved from: https://doi.org/10.1016/j.njas.2016.10.002
Food and Agriculture Organization, (FAO). (2011). The state of food and agriculture 2010-2011: Women in agriculture - closing the gender gap for development. Rome: FAO.
FAO. (2017). The future of food and agriculture – Trends and challenges. Rome: FAO. Retrieved from: https://doi.org/ISBN 978-92-5-109551-5
FAO. (2016). Gender, food security and nutrition in protracted crises. Rome: FAO.
Farnworth, C. R., Hà, T. T., Sander, B. O., Wollenberg, E., Haan, N. C. De, Mcguire, S., … Mcguire, S. (2017). Incorporating gender into low-emission development: A case study from Vietnam. Gender, Technology and Development, 8524(November), 5–30. Retrieved from: https://doi.org/10.1080/09718524.2017.1385314
Grassi, F., Landberg, J., & Huyer, S. (2015). Running out of time: The reduction of women’s work burden in agricultural production. Rome: FAO.
GSMA mWomen Programme. (2012). Striving and surviving: Exploring the lives of women at the base of the pyramid. Retrieved from: http://www.mwomen.org/Research/striving-surviving-exploring-the-lives-of-women-at-the-base-of-the-pyramid
Hafkin, N., & Huyer, S. (Eds). (2006). Cinderella or Cyberella: Empowering women in the knowledge society. Connecticut: Kumarian Press.
Hottle, R. (2015). Women-led agroforestry and clean cookstoves in Honduras: Field evaluation of farmer-led gender-transformative strategies for low emissions agriculture (No. 125). Copenhagen, Denmark: CGIAR Climate Change, Agriculture and Food Security Programme. Retrieved from: https://cgspace.cgiar.org/rest/bitstreams/64369/retrieve

Taking Stock: Data and Evidence on Gender Digital Equality PART TWO
270
Huyer, S., Hansen, J., Rose, A., Vaughan, C., & Huysen, T. Van. (2017). What we know about gender and rural climate services preliminary findings and guidance. Copenhagen, Denmark: CGIAR Research Programme on Climate Change, Agriculture and Food Security (CCAFS).
Huyer, S. (2016). Closing the gender gap in agriculture. Gender, Technology and Development, 20(2). Retrieved from: https://doi.org/10.1177/0971852416643872
Huyer, S. (2015). Is the gender gap narrowing in science and engineering? UNESCO Science Report. Paris: UNESCO.
Huyer, S. (2012). Gender mainstreaming in ICT for agriculture. Retrieved from: http://www.itu.int/ITU-D/sis/newslog/2012/11/16/
Huyer, S. & Hafkin, N. (2006). Introduction. In: N. Hafkin & S. Huyer (Eds.), Cinderella or Cyberella: Empowering women in the knowledge society. Connecticut: Kumarian Press.
IFAD. (2011). Women and rural development. Retrieved from: http://www.ifad.org/pub/factsheet/women/women_e.pdf.
IFAD. (2016). Rural Development Report 2016: Fostering inclusive rural transformation. Rome: IFAD. Retrieved from: https://www.ifad.org/documents/30600024/30604583/RDR_WEB.pdf/c734d0c4-fbb1-4507-9b4b-6c432c6f38c3
IFAD, World Bank, & FAO. (2009). Gender in agriculture sourcebook. Washington, DC: World Bank.
IPCC. (2014). Summary for policy makers. In: Intergovernmental Panel on Climate Change, Climate change 2014: Impacts, adaptation and vulnerability: Contributions of the Working Group II to the Fifth Assessment Report (1–32). Cambridge, UK, and New York: Cambridge University Press. Retrieved from: https://doi.org/10.1017/CBO9781107415379
International Telecommunications Union (ITU). (2016). Facts and Figures 2016. Geneva: ITU Retrieved from: http://www.itu.int/en/ITU-D/Statistics/Documents/facts/ICTFactsFigures2016.pdf.
Jost, C., Kyazze, F., Naab, J., Neelormi, S., Kinyangi, J., Zougmore, R., et al. (2016). Understanding gender dimensions of agriculture and climate change in smallholder farming communities. Climate and Development, 8(2), 1–12. Retrieved from: https://doi.org/10.1080/17565529.2015.1050978
Kakota, T., Nyariki, D., Mkwambisi, D., & Kogi-Makau, W. (2011). Gender vulnerability to climate variability and household food insecurity. Climate and Development, 3(4), 298–309. Retrieved from: https://doi.org/10.1080/17565529.2011.627419
Kristjanson, P., Bernier, Q., Bryan, E., Ringler, C., & Meinzen-Dick, R. A. E. (2015). Uganda: Insights from Rakai. Gendered Perceptions of Climate (3), 18–21. Retrieved from: https://www.ifpri.org/publication/gender-and-climate-change-adaptation-uganda-insights-rakai
Lane, R., & McNaught, R. (2009). Building gendered approaches to adaptation in the Pacific. Gender and Development, 17(1), 67–80. https://doi.org/10.1080/13552070802696920
Manfre, C., & Nordehn, C. (2013). Exploring the promise of information and communication technologies for women farmers in Kenya. Washington DC: USAID.
Martin, B. L., & Abbott, E. (2011). Mobile phones and rural livelihoods: Diffusion, uses, and perceived impacts among farmers in Rural Uganda. Information Technology for International Development, 7(4), 17–34.
McOmber, C., Panikowski, A., McKune, S., Bartels, W., & Russo S. (2013). Investigating climate information services through a gendered lens. CCAFS Working Paper no. 42. Retrieved from: http://hdl.handle.net/10568/27887
Meinzen-Dick, R. Quisumbing, A., Behrman, J., Biermayr-Jenzano, P., Wilde, V., Noordeloos, M., Ragasa, C. & Beintema, N. (2011). Engendering Agricultural Research, Development, and Extension. Research monograph. Washington, DC: IFPRI.
Mittal, S. (2016). Role of Mobile Phone-enabled Climate Information Services in Gender-inclusive Agriculture. Gender, Technology and Development, 20(2).
Mooko, N. P. (2002). The use and awareness of women’s groups as sources of information in three small villages in Botswana. South African Journal of Libraries and Information Science, 68(2), 104. Retrieved from: http://search.ebscohost.com/login.aspx?direct=true&db=a9h&AN=9911812&site=ehost-live&scope=site
Ngigi, M. W., Mueller, U., & Birner, R. (2017). Gender differences in climate change adaptation strategies and participation in group-based approaches: An intra-household analysis from rural Kenya. Ecological Economics, 138, 99–108. Retrieved from: https://doi.org/10.1016/j.ecolecon.2017.03.019
Perez, C., Jones, E. M., Kristjanson, P., Cramer, L., Thornton, P. K., Forch, W., & Barahona, C. (2015). How resilient are farming households and communities to a changing climate in Africa? A gender-based perspective. Global Environmental Change, 34, 95–107. Retrieved from: https://doi.org/10.1016/j.gloenvcha.2015.06.003
Poulsen, E., Sakho, M., McKune, S., Russo, S., & Ndiaye, O. (2015). Exploring synergies between

Taking Stock: Data and Evidence on Gender Digital Equality PART TWO
271
health and climate services: Assessing the feasibility of providing climate information to women farmers through health posts in Kaffrine, Senegal. CCAFS Working Paper no. 131. Retrieved from: http://hdl.handle.net/10568/6814
Pshenichnaya, N. (2011). Bridging the gender gap in agriculture: Can agricultural VAS address the issue? Retrieved from: http://www.gsma.com/mobilefordevelopment/bridging-the- gender-gap-in-agriculture-can-technology-address-the-issue
Roncoli, C., Jost, C., Kirchen, P., Sanon, M., & Al, E. (2011). From accessing to assessing forecasts: An end-to-end study of participatory climate forecast dissemination in Burkina Faso (West Africa). Climatic Change, 92, 433–460.
Sebstad, J., & C. Manfre. (2011). Behavior change perspectives on gender and value chain development: A framework for analysis and implementation. FIELD Report 12. Washington DC: FHI 360. Retrieved from: https://www.microlinks. org/sites/microlinks/files/resource/files/FIELD%20 Report%20No%2012_Gender%20and%20Behavior%20 Change%20Framework.pdf.
Sterling, R., & Huyer, S. (2010). 89.1 FM: The Place for Development: Power shifts and participatory spaces in ICTD. The Journal of Community Informatics. Retrieved from: http://www.ci-journal.net/index.php/ciej/article/view/637/461
Tall, A., Hansen, J., Jay, A., Campbell, B., Kinyangi, J., Aggarwal, P. K., & Zougmoré, R. (2014a). Scaling up climate services for farmers: Mission Possible. Learning from good practice in Africa and South Asia (Report No. 13). Copenhagen, Denmark: CGIAR Climate Change, Agriculture and Food Security Programme. Retrieved from: https://doi.org/CCAFS Report No. 13
Tall, A., Kristjanson, P., Chaudhury, M., & Mckune, S. (2014b). Who gets the information? Gender, power and equity considerations in the design of climate services for farmers. Copenhagen, Denmark: CGIAR Climate Change, Agriculture and Food Security Programme.
UNDP. (2010). Gender, climate change and community-based adaptation. New York.
United Nations. (2010). The World’s Women 2010. New York: United Nations.
United Nations. (2015). The World’s Women 2015. New York: United Nations, Department of Economic and Social Affairs, Statistics Division.
Venkatasubramanian, K., Tall, A., Hansen, J., & Aggarwal, P. (2014). Assessment of India’s integrated agro-meteorological advisory service from a farmer perspective. Copenhagen, Denmark. Retrieved from: https://doi.org/10.2139/ssrn.701181Vincent, K., Cull, T., & Freeland, N. (2009,
February 1). Ever Upwardly Mobile: How do Cell Phones Benefit Vulnerable People? Lessons from Farming Cooperatives in Lesotho. The Digital and Development Network. Retrieved from: http://www.comminit.com/ict-4-development/content/ever-upwardly-mobile-how-do-cell-phones-benefit-vulnerable-people-lessons-farming-cooper.
World Bank. (2015). Supporting Women’s Agro-enterprises in Africa with ICT: A Feasibility Study in Zambia and Kenya. Retrieved from: http://documents.worldbank.org/curated/en/2015/02/23989243/supporting-womens- agro-enterprises-africa-ict-feasibility-study-zambia- kenya.

Taking Stock: Data and Evidence on Gender Digital Equality PART TWO
272

Taking Stock: Data and Evidence on Gender Digital Equality PART TWO
273

274
THE ROLE OF EDUCATIONAL INSTITUTIONS IN CLOSING STEM EDUCATION GAPS
6
AUTHOR: MMAKI JANTIJIES(UNIVERSITY OF THE WESTERN CAPE)

Taking Stock: Data and Evidence on Gender Digital Equality PART TWO
275
ABSTRACTSeveral recent developments support the enrolment of women in STEM fields within educational institutions, including: educational institutions’ adoption of policy frameworks advocating for increased STEM female participation; incentives for funding female STEM students; and criteria ensuring gender-sensitive institutional admissions. Curriculum design also has a role in increasing the representation of skilled females in STEM (Reyes, 2011), including viewing the humanities as representing critical skillsets relevant for STEM curriculum (Savaria & Monteiro, 2017). Such approaches also require complementary governance frameworks supporting female representation in STEM fields. Furthermore, organisations increasingly recognise the critical role of humanities in equipping the future STEM field workforce; the importance of human-centred skill sets has been recognised in the inclusion of arts skills into the STEM acronym, as STEAM. Today’s workplace requirements include creative problem-solving skills as well as human-centred approaches to STEM challenges, prompting a discussion of the role of arts subjects within the field (Bequette & Bequette, 2013; Land, 2013). This chapter evaluates the role of higher learning institutions in improving female representation in STEM, by reviewing studies conducted globally in the period 2011–2017. It documents the lack of female representation in STEM fields and the role of new policy frameworks and practices in diversifying STEM student populations and workforces. The paper reviews lessons learnt from various countries’ experiences and provide key recommendations for educational institutions to reduce the female student enrolment and human resources gap.
KEY FINDINGS
• The lack of female role models in STEM has been cited as a major factor in the low uptake of STEM programmes and courses by young girls in both elementary and higher educational institutions.
• The lack of a diverse academic and research STEM workforce in educational institutions, particularly in management roles, leads to perceptions of STEM as a male-dominated domain. Academic institutions thus find it difficult to attract and retain women both as students and as employees in STEM.
• Educational institutions have sought ways to improve the participation of women in STEM fields through student funding incentives, gender-sensitive institutional admission criteria, and gender-sensitive curriculum designs. These policies all have a role in increasing the representation of skilled women in STEM.
INTRODUCTIONThe first industrial revolution introduced the use of mechanical power, complementing or replacing manual human labour to enable efficiency across industries; similarly, the second revolutionary industrial development, in the twentieth century, brought the use of electricity and wired communication. A third epoch of industrial change brought large-scale digitisation and advances in computing; in recent decades, further advances have produced a digital and cyber revolution that was designated as “the fourth Industrial Revolution” at the 2016 World Economic Forum (Schwab, 2016). This revolution will place major emphasis on skillsets in technology and engineering fields, including in areas such as robotics and artificial intelligence. Indeed, the fields of science, technology, engineering, and mathematics (STEM) prominently provide opportunities for young graduates to make significant contributions towards both economic growth and scientific research.
STEM skills are widely considered an essential skillset, particularly in the Global South, which suffers from a shortage of engineers, doctors, programmers, etc. However, many organisations have come to appreciate the importance of arts and human-centred skills in these fields. The acronym STEM has thus evolved further to include arts, to form the new name, STEAM. Various studies have shown the importance of problem-solving inquiry skills such as novelty and ingenuity in addressing societal challenges, as well as compassion and related human-centred attributes; STEM academic programmes often neglect these key skills (Bequette & Bequette, 2013; Land, 2013; Saddiqui & Marcus, 2017). Addressing these human-centred skills can support the emphasis on equality of opportunity for female students. This chapter will examine these and other ways in which tertiary institutions play a role in improving female representation in STEM fields.
Institutions of higher learning have always played a vital role in encouraging the participation of women in the STEM fields, as key gateways to STEM employment. The higher education sector still struggles to achieve proportionate or even substantial representation of the female workforce. As a kind of snowball effect, with a disproportionately small number of women employed in STEM fields, their impact is limited as role models to women students. Similarly, higher education generally fails to challenge the dominant gender-stereotypical cultures and non-diverse workplace environments in STEM (Cheryan et al., 2016).
This chapter presents the following research question for evaluation: “What role can higher learning institutions play in improving the participation of females in STEM fields?”

Taking Stock: Data and Evidence on Gender Digital Equality PART TWO
276
THE ROLE OF INSTITUTIONS OF HIGHER LEARNING IN INCREASING STEM FEMALE PARTICIPATION
A range of factors contribute to strongly or disproportionately gendered STEM representation in higher learning institutions, including the following. Standard STEM academic programmes. Traditional STEM offerings tend to focus narrowly on STEM majors and electives, with no attention to cultivating creativity and human-centred approaches in problem inquiry (Taylor & Taylor, 2017). While methods such as design thinking and co-design (Bequette & Bequette, 2012; Boy, 2013) are finding their way into some engineering and computing curriculums, STEM programmes’ slowness in adapting means that fewer female students take STEM courses.
Cheryan, Ziegler and Montoya (2017) examined the relative prevalence of female students in the U.S. in biology, chemistry, and mathematics courses, in comparison to their numbers in engineering, computer science, and physical sciences courses. In addition to a dominating masculine culture, they point to a lack of practical opportunities for women in those fields, deterring women from enrolling as well as contributing to women leaving these programmes. Pipeline factors. In countries where women’s uptake of STEM academic programmes is especially low, the decline can be seen at the high-school level, when girls’ interest in participating in mathematics and science subjects starts to decrease (Ellis et al., 2016; Shabangu, 2015; UNESCO, 2016a). Increased participation in higher learning institutions is unlikely, if learners have not acquired prerequisite skills at lower educational levels. The absence of primary female interaction in schools with the STEM subject field can also further affect the uptake of these programmes in higher learning institutions (Cheryan et al., 2016). While many higher learning institutions have created bridging opportunities to enable such learners to further their studies, continued focus is needed on basic education in mathematics and science. Additionally, in the OECD countries and the U.S., the cost of higher education puts it out of reach for many (Malsen, 2017).
Role models and stereotyping. In the UK, the Higher Education Statistics Agency (2016/2017) found that only 25% of professors are women, and only a fraction of them hold senior academic positions in STEM fields. Similar patterns hold in countries such as South Africa and the U.S., indicating a near-absence of women role models for students in STEM. More generally, gender stereotyping throughout society and the media has been identified as a contributing factor affecting the uptake of STEM studies in higher education (Wang and Degol, 2017).
Gendered content and programmes. School textbooks typically depict males dominating the science environment, while providing historical examples of men predominantly making significant contributions to the STEM field.
Lack of skilled teachers. To achieve SDG4, quality education, UNESCO has estimated the need for over 69 million teachers (UNESCO, 2016b). This need is particularly concentrated in mathematics and science-related subjects. Universities and vocational training institutions have a role to play in producing teachers with skills to meet the twenty-first century STEM demands, especially in countries where few women are engaged in STEM higher-learning institutions.
High gender equality and low uptake. Women may be underrepresented in STEM fields even in countries with high gender equality. Nordic countries that rank high in terms of gender equality were shown to have some of the lowest numbers of STEM female graduates in the world (Sossamon, 2018). Access to opportunities does not always mean guaranteed uptake of STEM subjects by young women. The lack of female representation in such resource-rich economies calls for further investigation into such factors as STEM role modelling, pipelining, and academic and workplace cultures in contributing to the lack of gender representation.
A UNESCO report on the levels of women’s employment in STEM in Asia-Pacific countries found wide disparities: Japan at 15% and Korea at 18% of the STEM workforce, as compared to Kazakstan at 52% and Thailand at 53% (UNESCO, 2016a). Khazakstan and Thailand showed the highest participation of women in both higher learning institutions and the labour force. In the U.S., 14% of engineers are women, compared to 45% of mathematicians and 47% of employees in life sciences (UNESCO, 2016a). The fact that gender-sensitive policies do not always translate into increased participation of women in STEM fields can also be seen in the low participation levels in developed G20 countries compared to those in gender-conservative countries such as Algeria, Turkey, and the United Arab Emirates. The role of higher learning institutions is fundamental to educating the labour force in STEM fields as well as producing researchers and entrepreneurs. Gender awareness needs to be incorporated as a critical factor in national science and technology programmes. In addition, efforts need to be focused at the local level to attain the SDGs (Miroux, 2011).

Taking Stock: Data and Evidence on Gender Digital Equality PART TWO
277
IMPACT OF STATE POLICY ON HIGHER EDUCATION
Policies affecting STEM in higher-learning institutions differ markedly from one country to another. In OECD countries, including Korea and Japan, STEM policies are aimed at broadly increasing the workforce to fill the demands of mature industries. In the BRIC nations (Brazil, Russia, India, and China), STEM policies are aimed at generally improving the education system, mindful of related socio-welfare issues, alongside the specific need to grow STEM industries. Countries which have prioritised the STEM sectors, as well as increased participation of women and youth in these fields, show significant progress as a result of targeted strategies of implementation and funding (Marginson et al., 2013).
Education and employment. Women represent 28% of personnel in science research and development globally (UNESCO, 2018). Tunisia has the highest representation of females in STEM research, at 55% of the workforce, followed by South Africa at 48%. South Africa increased from 43.7% in 2015 by prioritising women’s empowerment across all relevant ministries; national STEM research centers — the South African National Research Foundation and the National Department of Science and Technology —prioritise women and girls for educational scholarships and employment opportunities. The African Union Agenda 2063 places focus on prioritising STEM education, with women as key STEM beneficiaries, both in education and business. Rwanda has also experienced a steady increase in women’s participation in both primary and higher STEM education, owing to Rwanda Vision 2020, a governmental development programme that identifies women as the key beneficiaries of such funding increases.
Language inclusion. Several studies show that language can become a barrier in expanding STEM education and access to related opportunities. Inclusive language policies can therefore enhance STEM participation. Kenya supports the use of the mother tongue in primary education; China and Sweden have programmes designed for minority speakers; and Netherlands and Norway have programmes targeted to immigrant children.
Stoet and Geary (2018) used national data on secondary and tertiary education to evaluate the secondary school performance of females in STEM-related subject areas, and to evaluate gender representation among graduates and identify factors behind disparities between countries. They cited two key factors affecting female retention in STEM education: individual performance in the STEM subject areas, and the potential economic benefits associated with sought-after STEM skills. The study suggested that the greater the potential benefits, the more likely women would be to pursue STEM
education, even in conservative countries. The study found notably high STEM graduate representation of women in Algeria, at 41%, in contrast to Finland and other countries highly ranked in the Global Gender Gap Index (Figure 6.1).
INCREASING FEMALE REPRESENTATION IN STEM EDUCATION
Higher learning institutions can encourage participation of women through various approaches, such as gender-sensitive funding and gender-focused academic programmes. National policies can motivate the schools to support girls to enter higher learning institutions. This section evaluates some of these efforts.
Mentoring and teacher programmes. The 2009 “Educate to Innovate” policy in the U.S. led funding programmes to focus on increasing STEM participation and representation. For example, the commitment to increase public-private partnership to fund STEM programmes enabled higher learning institutions to train over 10,000 STEM teachers (Burke & McNeill, 2011). Another initiative was the Bringing Up Girls in Science programme, funded by the U.S. National Science Foundation — an after-school science curriculum for girls that also linked school learners with university female mentors. A follow-up study found that the participants subsequently had a greater understanding and exposure to STEM fields (Wood et al., 2011).
Programmes such as the MIT Women’s Initiative (MIT, 2018) present examples of partnerships between schools and higher learning institutions aimed at improving STEM participation. The MIT initiative assists teachers to create content tailored towards attracting young girls to STEM and helping them understand concepts in mathematics and science. Participants conduct a series of intriguing experiments and hear from university students about their experiences, giving them a better understanding of the work required for STEM participation.
Internationally, such initiatives have grown significantly. Developers in Vogue (Ghana) teaches young girls software development skills and links them to related work opportunities. Girl Hype (South Africa) is an entrepreneurship and coding academy giving women digital work skills. Feminist Approaches to Technology (India) educates young girls in using technology to empower themselves, to explore, and to develop leadership skills. Levers in Heels (Africa) introduces girl students to women in academia and STEM professions, and showcases research about women in STEM. WomenEng, a women-in-
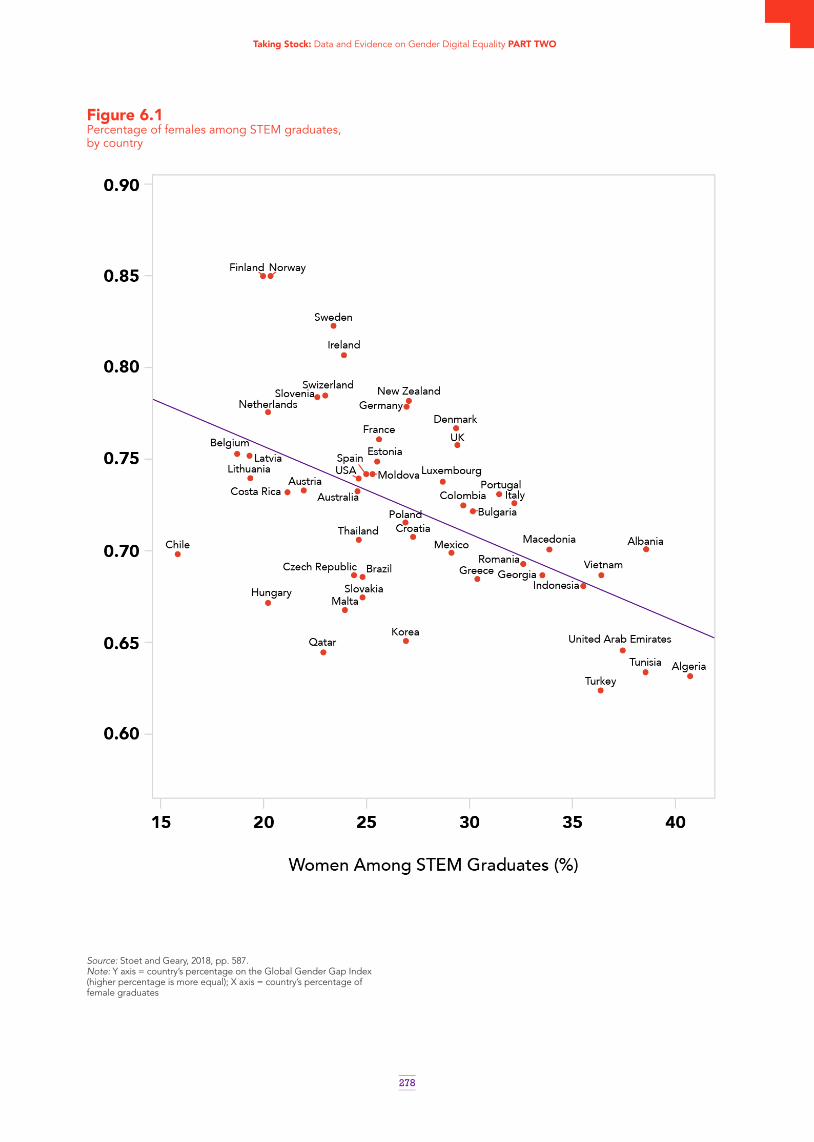
Taking Stock: Data and Evidence on Gender Digital Equality PART TWO
278
Figure 6.1Percentage of females among STEM graduates, by country
Source: Stoet and Geary, 2018, pp. 587.Note: Y axis = country’s percentage on the Global Gender Gap Index (higher percentage is more equal); X axis = country’s percentage of female graduates

Taking Stock: Data and Evidence on Gender Digital Equality PART TWO
279
engineering organisation, provides engineering education programmes in Malawi, Mexico, Brazil, South Africa, and Kenya. The programmes are geared towards providing fellowships for young women in the engineering field, giving them theoretical instruction, practical experiences, and mentoring to pursue an engineering career.
Creating a community of female academics. Universities in the U.S. have created initiatives, such as Empowering Women in Science (Cornell) and Engineering Women (University of Minnesota), that showcase professional women in STEM research and facilitate seminars on positions and compensation in STEM (Sportelli, 2016). Cornell now observes an equal uptake of engineering programmes by male and female students as a result of intensive outreach63. Such programmes provide a network, enabling women students to become aware of opportunities in STEM and fostering relationships between senior and junior females in STEM fields. This approach also promotes the retention of young women in STEM through mentoring opportunities.
In Kenya, the Women for Science Working Group developed out of The Network of African Science Academies; it aims to enable a network of women in STEM fields, cultivating collaboration and sharing experiences among women in related research and academic institutions, with the aim of influencing priority areas of research. The network’s publications showcase the contribution of African women in STEM fields. A growing number of awards recognise the contribution of women in STEM fields. The United Nations “Equals in Tech” Awards includes a skills and research category to recognise women in the STEM field; the African Union Kwame Nkrumah Awards for Scientific Excellence includes a category recognising women in STEM fields.
Funding. There has been a global increase in academic funding earmarked for outstanding women in STEM, such as the Graca Machel scholarship for women from the South African Development Community (SADC) region, the Anita Borg Global Scholarship, and L’Oréal-UNESCO Fellowships for Women in Science. Such initiatives enable talented females to pursue studies in STEM fields in prestigious academic institutions while growing their research expertise.
A South African example combines government policy with government and private sector funding. Ranked eighteenth on the World Economic Forum Global Gender Index, South Africa adopted targeted policies to increase representation of women in the STEM fields. Through a public-private partnership between the South African National Research Foundation (NRF) and the First Rand Foundation of the private banking sector, funding is earmarked to enable over 40 women in South Africa’s higher learning institutions to focus on their research and ultimately to increase the number of female professors, particularly in the STEM field.
63 https://i100rocks.com/news/025520-cornell-engineering-women/
CONCLUSIONS AND FURTHER WORK
Institutions of higher learning play a critical role, both in training women as STEM employees and entrepreneurs and in conducting research in STEM. The lack of female academics in STEM fields means that girl students have few role models. Teaching and learning resources are rarely gender-sensitive, and examples from text books lack diverse gender representation. Language barriers can also place barriers in the teaching and learning process when female students are not first-language speakers of the language of instruction.
Exposure to STEM fields at an early age is a critical factor in the uptake of STEM courses. Programmes that encourage suitable teaching and learning environments for women in STEM have encouraged increased female representation across the field. Institutional initiatives can be further strengthened by national and regional policies as well as funding support. Further studies in this area might provide longitudinal findings on the success of initiatives from primary level through tertiary education to women’s employment in STEM fields. Contextual and localised Massive Open Online Courses (MOOCs) as well as open educational resources can also introduce girls to basic STEM skills (ideally through accessible open platforms), enabling young women in almost any context to access educational resources of high value.
REFERENCES
Bequette, J.W. & Bequette, M.B. (2012). A place for art and design education in the STEM conversation. Art Education, 65(2), pp.40-47.
Boy, G.A. (2013). From STEM to STEM: Toward a human-centred education, creativity and learning thinking. In: Proceedings of the 31st European Conference on Cognitive Ergonomics, p. 3. ACM.
Burke, L.M. & McNeill, J.B. (2011). Educate to innovate: How the Obama plan for STEM education falls short. Backgrounder, 2504, 1-8.
Cheryan, S., Ziegler, S.A., Montoya, A.K. & Jiang, L. (2017). Why are some STEM fields more gender balanced than others? Psychological Bulletin, 143(1), 1.
Ellis, J., Fosdick, B.K. & Rasmussen, C. (2016). Women 1.5 times more likely to leave STEM pipeline after calculus compared to men: Lack of mathematical confidence a potential culprit. PloS One, 11(7), p.e0157447.
HESA. Higher Education Staff Statistics: UK (2016/17). Retrieved from: https://www.hesa.ac.uk/news/18-01-

Taking Stock: Data and Evidence on Gender Digital Equality PART TWO
280
2018/sfr248-higher-education-staff-statistics
Land, M.H. (2013). Full STEM ahead: The benefits of integrating the arts into STEM. Procedia Computer Science, 20, 547-552.
Malsen, G. (2017). Most university students in OECD now pay tuition fees. Retrieved from: www.universityworldnews.com/article.php?story=20170916062250661
Marginson, S., Tytler, R., Freeman, B. & Roberts, K. (2013). STEM: Country comparisons: International comparisons of science, technology, engineering and mathematics (STEM) education. Melbourne: Australian Council of Learned Academies.
Mejia, Z. (2018). More women entered STEM over the past 40 years than any other field, new data shows. CNBC. Retrieved from: https://www.cnbc.com/2018/03/07/more-women-entered-stem-over-the-past-40-years-than-any-other-field.html
MIT. MIT women’s initiative: Inspiring ideas for girls. Retrieved from: web.mit.edu/wi/
Miroux, A. (2011). Mainstreaming a gender perspective in science, technology, and innovation policy. Interactive expert panel: Key policy initiatives and capacity building mainstreaming – Focus on science and technology. United Nations Commission on the Status of Women, 55th Session.
Reyes, M.E. (2011). Unique challenges for women of color in STEM transferring from community colleges to universities. Harvard Educational Review, 81(2), 241-263.
Saddiqui, S. & Marcus, M. (2017). STEM and project-based learning: Equipping young women with 21st century skills. World Academy of Science, Engineering and Technology, International Journal of Educational and Pedagogical Sciences, 4(12).
Savaria, M. & Monteiro, K. (2017). A critical discourse analysis of engineering course syllabi and recommendations for increasing engagement among women in STEM. Journal of STEM Education: Innovations and Research, 18(1).
Sassler, S., Michelmore, K. & Smith, K. (2017). A tale of two majors: Explaining the gender gap in STEM employment among computer science and engineering degree holders. Social Sciences, 6(3), 69.
Schwab, K. (2016). The Fourth Industrial Revolution: What it means, how to respond. Retrieved from: https://www.weforum.org/agenda/2016/01/the-fourth-industrial-revolution-what-it-means-and-how-to-respond/
Shabangu, M. (2015). The status of women in the South African economy. Retrieved from: https://www.gov.za/sites/www.gov.za/files/Status_of_women_in_SA_
economy.pdf
Sossamon, J. (2018). In countries with higher gender equality, women are less likely to get STEM degrees. Retrieved from: https://www.weforum.org/agenda/2018/02/does-gender-equality-result-in-fewer-female-stem-grads/
Sportelli, N. (2016). The 13 most important STEM colleges for women. Forbes. Retrieved from: https://www.forbes.com/sites/nataliesportelli/2016/03/29/13-best-value-stem-colleges-for-women/#7de6d9ce7686.
Stoet, G. & Geary, D.C. (2018). The gender-equality paradox in science, technology, engineering, and mathematics education. Psychological Science, 29(4), 581-593.
Taylor, E. & Taylor, P.C. (2017). Breaking down enlightenment silos: From STEM to STEAM education, and beyond. In: Bryan, L.A. & Tobin, K.G. (Eds.), Thirteen Questions: Reframing Education’s Conversation: Science (455-472). New York: Peter Lang Publishing.
Wang, M.T. & Degol, J.L. (2017). Gender gap in science, technology, engineering, and mathematics (STEM): Current knowledge, implications for practice, policy, and future directions. Educational Psychology Review, 29 (1), 119-140.
UNESCO. (2016a). Closing the gender gap in STEM. UNECSO Asia Pacific education thematic brief.UNESCO. (2016b). The World Needs Almost 69 Million New Teachers to Reach the 2030 Education Goals. Retrieved from: http://uis.unesco.org/en/topic/teachers

Taking Stock: Data and Evidence on Gender Digital Equality PART TWO
281

282
THE GENDER WAGE GAP IN THE DIGITAL ERA: THE ROLE OF SKILLS
7
AUTHORS: MARIAGRAZIA SQUICCIARINI, ROBERT GRUNDKE, AND LUCA MARCOLIN (OECD DIRECTORATE FOR SCIENCE, TECHNOLOGY AND INNOVATION (STI), ECONOMIC ANALYSIS AND STATISTICS DIVISION (EAS))

Taking Stock: Data and Evidence on Gender Digital Equality PART TWO
283
ABSTRACT
As the digital revolution contributes to changing the nature and content of jobs, the demand for skills also changes. This chapter addresses whether women are equipped with the skills needed to navigate the digital economy. It analyses data from 31 countries to compare the returns to skills for men and women in terms of wages, and how these returns vary between digital-intensive and other industries. If labour markets value different skills differently, with greater rewards to specific skills needed in the digital era, wage differences should highlight high-demand skills and show the degrees of wage variation in digital-intensive in comparison to other industries. Results show that the digital transformation may be contributing to widening the gender wage gap: digital-intensive sectors display greater gender wage disparities than less digital-intensive sectors, even after accounting for specific features of workers and places of employment.
KEY FINDINGS
• Variations in workers’ skills, both cognitive and non-cognitive, explain only part of the gender wage gap, in 31 countries.
• Men on average are more likely than women to have the task-based skills that are most demanded in digital-intensive industries: managing and communication, self-organisation, and advanced numeracy skills.
• Men generally obtain higher returns than women for the same high-demand skills in digitally intensive sectors, but not in less digitally intensive industries.
• Women are more likely than men to have specific information and communication technology (ICT) task-based skills, and they are better rewarded for them, in both digital-intensive and less digital-intensive sectors.
A NARROWING GENDER WAGE GAP?
Significant progress has been made in recent years to reduce gender inequality along many dimensions. Young girls in OECD countries now out-perform boys at school and represent the majority of tertiary graduates (OECD, 2017a, 2017b). Gender gaps in employment also appear to have narrowed, although
a 12-percentage point difference in labour market participation still exists, on average, across OECD countries. Importantly, gender inequality features among the top policy priorities of G20 and G7 countries; in 2014, G20 countries adopted as a key goal narrowing the gender gap in labour force participation by 25% by 202564.
Despite all this, there is still a long way to go to attain gender equality. In higher education, girls are not well represented in the scientific and technical disciplines, areas currently commanding high wages. In OECD countries, the gender wage gap still averages 14.3% across all sectors (OECD, 2017b). Women are scarce in senior management, public leadership, and entrepreneurship roles, accounting for only 4.8% of CEOs in 2016. It is likely that similar, if not greater, gender wage gaps exist in non-OECD countries.
The ongoing digital transformation is already affecting the life and work of women. On the one hand, the transformation can offer women new opportunities for economic empowerment, through new forms of work created by e-businesses, workspace platforms, and flexible working arrangements, for example. On the other hand, digital technologies may increase the gender divide, if women lack the needed skills or if flexible work arrangements mean low quality jobs.
This chapter points to specific policies which can ensure that women are equipped with the skills needed to thrive in the digital era. To what extent do skill differences between men and women contribute to the gender wage gap? What types of skills are in high demand in the digital era, and how do various industries reward them?65 Econometric analysis allows us to explore the factors determining individual wages, in digital-intensive versus less digital-intensive sectors, with a focus on workers’ skills. Data comes from the Programme for the International Assessment of Adult Skills (PIAAC) dataset, described below.
Skills are found to explain part — but not all — of the gender wage gap; differences emerge in the way digital-intensive and less digital-intensive sectors reward workers’ skills. On average, men are more likely to have the skills most in demand in digital-intensive industries: managing and communication, self-organisation, and advanced numeracy skills, and are likely to obtain higher returns than women with the same skills in digitally-intensive sectors66. Women are more likely than men to have ICT task-based skills, and they are rewarded relatively more for them, in both digital-intensive and less digital-intensive sectors, than men with similar skills.
64 http://www.g20.utoronto.ca/2014/2014-1116-communique.html
65 These skills need not perfectly coincide with “digital skills” as defined in different contexts (e.g., OECD, 2016; Carretero et al., 2017).
66 Self-organisation here relates to workers’ ability to plan or decide the tasks to be carried out, the style and speed of work, and the possibility to plan working hours. Management and communication task-based skills relate to negotiating with people, planning the activities of others, and to instructing, advising, persuading or influencing others.

Taking Stock: Data and Evidence on Gender Digital Equality PART TWO
284
Many factors, observable and unobservable, contribute to shape the gender wage gap, as reviewed in Blau and Kahn (2017). These can include: schooling, work experience, psycho-emotional characteristics, sector of employment, family responsibilities, and job characteristics, as well as cultural norms and discrimination. Gender may affect the specific tasks carried out on the job: women may be less able to commit to tasks requiring flexibility in working hours, or travelling on short notice (Goldin, 2014). This chapter finally takes note of how digital technologies are affecting some components of work.
THE GENDER WAGE GAP IN THE DIGITAL ERA: THE ROLE OF SKILLS
The last century saw narrowing differences between men and women in terms of labour force participation, paid hours of work, and hours devoted to household production, as well as in type of occupation, educational attainment, and choice of college majors (Goldin et al., 2006). Gender wage gaps also narrowed, to varying extent among different countries (OECD, 2017b). Examining the relationship between workers’ wages and their competencies and skill use at work, we can assess the contribution of workers’ skills to the gender wage gap. A novel OECD index shows the digital penetration of industries (Calvino, Criscuolo, Marcolin, & Squicciarini, 2018), allowing us to compare the wage gender gap and its determinants in digital-intensive as compared to less digital-intensive industries, while controlling for features such as workers’ education and age and size of firm.
We rely on measures of the cognitive, non-cognitive, and social skills of workers for 31 countries, as extracted from the OECD Survey of Adult Skills (Programme for International Assessment of Adult Competencies, or PIAAC) (Grundke, Kalamova, Keslair, Jamet, & Squicciarini, 2017). PIAAC surveyed 154,293 individuals aged 16–65, between 2012 and 2015, in 31 countries (all but three OECD countries). In each country, the sample was chosen to be representative of the population (albeit with different sampling schemes). We combine the skills results with PIAAC-based information on labour market participation and the socio-economic background of workers67. The analysis assumes that work is composed of a set of tasks which workers are required to carry out on the job, and for which they are rewarded. This is in line with studies arguing that human capital needs are highly specific to the particular tasks carried out, and less determined by the occupation, industry, or firm (Gathman & Schoenberg, 2010; Gibbons & Waldman, 2004; Poletaev & Robinson, 2008)68.
67 OECD (2018c).
68 Several studies take a task perspective in assessing the returns to working in a given occupation, and how technological change affects them (e.g., Acemoglu & Autor, 2011; Acemoglu & Handel, 2013).
Cognitive and socio-emotional skills are both considered in the analysis. Studies point to the role of social skills and personality traits in determining earnings (Heckman, Stixrud, & Urzua, 2006; Heckman & Kautz, 2012), and combinations of social and cognitive skills are seen to be especially rewarded (Deming & Kahn, 2017; Weinberger, 2014) — particularly in jobs that are more ICT-intensive (Deming, 2017).
AN EMPIRICAL ASSESSMENT OF THE RETURNS TO SKILLS IN DIGITAL-INTENSIVE AND LESS DIGITAL-INTENSIVE SECTORS
To understand how the digital transformation affects the demand for different types of skills — cognitive, non-cognitive, and social — we examine how workers’ skills are rewarded and whether rewards vary according to the digital intensity of the sector. Valued skills in short supply should command higher returns. Higher returns in digital-intensive industries, accordingly, should point to the skills that are in relatively high demand in jobs that are more exposed to the digital transformation, and that may represent needed complements to the deployment of digital technologies at the workplace69.
The analysis is carried out on data from the OECD Survey of Adult Skills (PIAAC), covering 31 countries. PIAAC provides a wealth of information about workers’ skills, the tasks they perform on the job, and their workplace, making it possible to estimate the role of skills in determining wages with greater accuracy than in the past. Workers’ cognitive skills (literacy, numeracy, and problem solving in technology-rich environments) are assessed through administered tests, limiting the risk of mismeasurement. By relying on the six task-based skill indicators identified in Grundke et al. (2017), it is possible to see how non-cognitive and social skills are rewarded in both digital and less digital-intensive industries.
Digital-intensive and less digital-intensive industries are identified on the basis of an OECD taxonomy (Calvino et al., 2018) that uses selected indicators to assess the degree of digital transformation of particular sectors. The authors have collected and cleaned data on several of these indicators of digital transformation, specifically targeting technological, market, and human capital components. The technological component is proxied by the sector’s intensity in ICT investment, including purchases of intermediate ICT goods and services as well as robots. The human capital component is proxied by the share
69 For a full description of the approach, see Grundke et al. (2018).

Taking Stock: Data and Evidence on Gender Digital Equality PART TWO
285
of ICT specialists in the workforce. Digital marketing is proxied by the share of e-commerce. Sectors are ranked along each dimension, and the rankings are then aggregated to yield a single taxonomy of sectors by digital intensity70. (Sectors are defined according to the UN classification, published as the International Standard Industrial Classification (ISIC), Revision 4.)
We control for many characteristics relating to wage or skill levels (e.g. years of education, age, gender, as well as country, industry, and occupation. The analysis isolates variation of skills and wages within the same type of job and aims for an unbiased comparison between men’s and women’s earnings. Differences in the occupational composition of digital and less digital-intensive industries should not influence the findings on return to workers’ skills in different industries.
Digital-intensive industries appear to pay better than less-digital intensive industries for workers with higher levels of managing and communication, self-
70 The dichotomy between digital and less digital-intensive sectors is an artefact used for analytical purposes. In reality, there is a distribution of digital intensity levels, both between and within sectors; moreover, specific employers may be more (or less) digitally intensive than their sector.
organisation, and advanced numeracy skills71. These results may reflect characteristics of tasks in those industries: the need to operate in a more independent or decentralised fashion; to communicate across disciplinary boundaries and in diverse and decentralised teams; to perform more non-routine tasks; to be better matched with the tasks to be carried out; or to deal with continuously changing settings, for which self-organisation, management, and communication skills are important.Do women possess the skills that are more in demand in the digital era? Do rewards for these skills differ between men and women? These questions are key to understanding whether the gender divide may widen with the ongoing digital transformation.
71 See Grundke et al. (2018) and OECD (2018c).

Taking Stock: Data and Evidence on Gender Digital Equality PART TWO
286
Figure 7.1Difference in standardised skill scores between men and women (conditional on covariates), 31 countries, 2012 or 2015
Source: OECD (2018c), based on PIAAC data. Note: Differences in standardised skill scores between men and women are conditional on the covariates from the wage regressions. The skill measures are taken from Grundke et al. (2017). For each skill variable, OLS regressions of workers’ skill endowment on the covariates from the wage regressions are estimated on the pooled set of 31 countries. For each of these regressions, the bars show the coefficients of the “male” variable, which takes value 1 if the individual is male and 0 if female. Striped bars signal that differences between men and women are not statistically significant at the 5% level. Bars above the x-axis represent the skills that men scored higher on; bars below the x-axis show skills that women scored higher on.
Figure 7.1 shows that men are generally more likely to possess the skills that command wage premiums in digital-intensive industries. Independent of age, education, occupation, country, industry, or size of firm, and whether full- or part-time, men overall have higher numeracy and advanced numeracy skills as well as higher task-based skills related to self-organisation, management, and communication72.
72 See also OECD (2018c).
These results are worrisome, especially because the digital transformation will ultimately affect all industries, including those that are less digital-intensive. Women’s lower scores in the skills needed in the digital age may thus lead to increasing wage inequality between men and women. Additional results show that the gender wage gap is indeed higher in digital-intensive than in less digital-intensive industries (Figure 7.2). This is partly due to the different skills possessed by men and women: the

Taking Stock: Data and Evidence on Gender Digital Equality PART TWO
287
Figure 7.2Gender wage gap by country and industry (conditional difference in hourly wages for men and women, in %), 31 countries, 2012 or 2015
Source: OECD (2018c), based on PIAAC data.Note: The figure shows the differences in hourly wages for men and women (in percentages) for employees in more and less digital-intensive industries. The estimates are based on OLS wage regressions, using data from the OECD Survey of Adult Skills (PIAAC), and control for the same covariates as in Figure 7.1 as well as for skills.
same graph displays larger gaps when not controlling for skills (results omitted here). (For more discussion, see OECD (2018c).) To address this effect of the digital transformation on gender-based income inequalities, governments need to ensure that women have opportunities to gain advanced numeracy skills and to develop management, communication, and self-organisation skills.
Nevertheless, women do not lag behind men across the whole spectrum of skills needed in the digital era. Women generally score better in literacy skills as well as in ICT, accountancy, and selling skills73. While women have higher ICT skills than men (and they conduct more ICT-related tasks than men in the same occupation), this may not be reflected in higher earnings. This study does not find higher returns to ICT skills in digital as compared to less digital-intensive industries, even though ICT skills are obviously important in the digital era. However, when we control for cognitive and task-based skills as well as country, industry, and occupation, we see
73 ICT skills relate to the use of programming languages, emails, word processing software, and spreadsheets, as well as processing transactions through the internet.
ICT skills commanding the highest wage returns74. Possibly women’s advantage in ICT skills may help to reduce gender-based wage inequality over time. Policy makers may therefore want to focus efforts on increasing ICT skills to reduce the gender wage gap.
Skill sets explain only part of the gender gap. When we control for cognitive, non-cognitive, and social skills, the gender wage gap is greater than can be explained by the difference in workers’ skills75. In addition, the gap is considerably larger in digital-intensive industries than in less digital-intensive ones. Contributing factors may include women’s longer out-of-work spells (e.g., for child-bearing), household duties, and gender-based roles and division of labour (Blau & Kahn 2017; Goldin, 2014). In addition to possible measurement issues, other factors in the wage gap may include gender discrimination. If digital-intensive industries reward men more than women for certain skills, more than is the case in less digital-intensive industries, the gender wage gap will be higher in digital-intensive industries even for workers with similar skills.
74 See Grundke et al. (2018) and OECD (2018c).
75 See OECD (2018c).

Taking Stock: Data and Evidence on Gender Digital Equality PART TWO
288
Figure 7.3Labour market returns to skills by gender across 31 countries, 2012 or 2015Figure 7.3aDigital-intensive industries
Figure 7.3 shows the skill returns for men and women in digital vs. less digital-intensive industries. Men obtain significantly higher returns than women for advanced numeracy and management and communication skills in digitally intensive industries (Figure 7.3a). The differences are not statistically significant in less digital-intensive industries (Figure 7.3b). However, for one of the key skills in the digital era — ICT skills — women obtain higher returns than men, in both digital-intensive and less digital-intensive industries. The analysis controlled for observable characteristics of the individual (age, education, part-time status) and for country, industry, occupation, and size of firm.
Factors that may contribute to the gender difference in earnings include: network effects among male colleagues; better wage bargaining outcomes
stemming from the greater self-confidence of men (found, for instance, by Niederle & Vesterlund 2007); and proportionally higher bonuses associated with advanced numeracy and management and communication skills. Also, broader productivity effects may be a factor, if companies that are more productive require (and better reward) the skill sets more associated with men. Finally, if digital-intensive industries are more dynamic, they may require more competitive behaviours and stronger negotiation skills than less digital-intensive industries; this may hurt women, as studies have shown that women are less oriented to negotiating and competing than men and are more risk averse. For reviews, see Bertrand (2011) and Croson and Gneezy (2009).

Taking Stock: Data and Evidence on Gender Digital Equality PART TWO
289
Figure 7.3bLess digital-intensive industries
Source: OECD (2018c), based on PIAAC data. Note: Results are based on OLS wage regressions pooling data for 31 countries. Digital-intensive industries are defined following Calvino et al. (2018). Skill measures are based on PIAAC and are taken from Grundke et al. (2017). The estimates by gender are obtained by including an interaction term of the skill variable and a variable taking value 1 if the individual is male and 0 if female. Wage regressions control for the same covariates as in the baseline analysis. The figure shows the percentage changes in wages determined by an increase in skills by one standard deviation. Striped diamonds and bars indicate results that are not statistically significant at the 5% level.
CONCLUSIONS AND POLICY IMPLICATIONSThe digital transformation is deeply transforming economies and societies, including disrupting labour markets: some occupations are disappearing and others are changing in nature, as is the demand profile for skills. The speed, scale, and scope of the ongoing transformation far outmatches the lengthy timeframe for building the human capital required, and the associated need to adapt education and training systems. Governments need to act promptly to ensure that workers, especially women, are not left behind due to lack of relevant skills.
The digital transformation is changing the demand for skills in both OECD and non-OECD countries. A wide range of skills appears to be required for firms and individuals to perform successfully in the digital era: foundational skills such as literacy and numeracy; and skills that are transferable across jobs, including technical and socio-emotional skills (including self-organisation, management, and communication). However, skill sets differ as between men and women, and different skills are rewarded in different ways for men and women, in digital and less digital-intensive industries.

Taking Stock: Data and Evidence on Gender Digital Equality PART TWO
290
LEARNING MATTERS: SHARING THE COST AND BENEFITS OF LIFE-LONG LEARNING
Making the digital transformation more gender-inclusive entails extending education and training to all, and especially to girls and women, both at a young age and later in life. Narrowing the gender wage gap further requires giving girls a solid educational foundation, especially in numeracy, to address early gender gaps. Education and training may need to become more flexible and adaptive: the digital transformation enhances opportunities to learn outside of working or school hours, and digital tools can help mitigate or overcome societal barriers and norms. As the digital transformation accentuates the need to continue learning throughout life, policy makers need to (re)design life-long learning systems: providing sound initial education, and fostering synergies among all stakeholders — individuals, governments, and the private sector — to further enhance human capital, especially of women76. The private sector of course benefits directly from a trained workforce and also provides training for workers.
TECHNOLOGY FOR LEARNING
Recent years have seen significant progress in women’s education. In OECD countries, more women now achieve tertiary education than men (OECD, 2017a); across the 31 countries considered, the proportion of women engaging in on-the-job training is higher, on average, than that of men (OECD, 2018a). However, when workers’ characteristics are taken into account (e.g., age, education, part-time contracts, industry, and occupation), men are found to receive 5% longer training than women. In many non-OECD countries, women’s access to education still lags behind men’s. Digital technologies can support more equitable access to education and training by lowering the direct cost of accessing educational material, or by allowing distance learning on a flexible schedule — important for women having to combine education and household duties. Governments should ensure that access to technologies such as mobile phones and broadband is universal and equitable. This may require investments in infrastructure deployment, especially in remote areas, or financial schemes to lower the costs of accessing such technologies, especially for low-income individuals.
FOCUS ON THE ‘RIGHT’ (SETS OF) SKILLS
76 Under the “SkillsFuture” programme in Singapore, employers provide input about the skills they believe will be required by workers in the near future (3–5 years). Students and workers are then given a government subsidy through their learning accounts; they receive a skill certification at the end of the training.
The gender wage gap is related in part to the type of skills possessed by workers. Digital technologies display different degrees of complementarity and substitutability of skill sets. Interestingly, women perform ICT-related tasks slightly more frequently than men; moreover, they are rewarded significantly more for those tasks and skills. Policies to promote ICT skills for women can help to narrow the gender wage gap.
Advanced numeracy (STEM) skills are among the most demanded skills in digital-intensive sectors, and these skills are associated more with male than female workers, even within narrowly defined industries and occupations. Policies to enhance female workers’ advanced numeracy skills will therefore be important to address the gender wage gap. As skill set differences are influenced by educational choices, and the decision to pursue fields such as ICT and STEM (OECD, 2017b), educational policies are important: encouraging girls’ enrolment in STEM studies at young ages; creating single-sex classes where women feel freer of stereotypes (Booth, Cardona-Sosa, & Nolen, 2014; Dustmann, Ku, & Kwak, 2017); facilitating women’s access to STEM-related apprenticeships; and addressing gender biases in education curricula, parental preferences, and social norms (OECD, 2018c)77. These policies are relevant to both OECD and non-OECD countries; of course, equal access to education is an essential first step. The private and non-governmental sectors can also be involved in this effort, influencing the public debate and leading by example.
PROMOTE WOMEN’S PARTICIPATION IN LABOUR MARKETS
The skills mix needed to succeed in digital-intensive sectors includes non-technical skills such as management, communication, and self-organisational skills. Women may be hindered from developing these skills by constrained access to the labour market. This problem can be addressed directly through training programmes, and indirectly by fostering women’s labour market participation. Digital technologies can facilitate women participation in the labour market by offering new work opportunities (e.g., through e-commerce and digital platforms) and by making work more flexible78. Flexible working arrangements, powered by technology, can enable individuals living in remote areas and those with costly commutes to enter the labour market or extend their working
77 For example, U.S. schools participating to the Building, Recruiting and Inclusion for Diversity (BRAID) initiative commit to several actions, including increasing the number of female instructors, providing teachers with better computer science teaching skills, or promote female role-models in STEM.
78 Platforms are likely to affect participation of women to the labour market, by decreasing the entry cost and possibly limiting the role of cultural norms. So far, however, platform work has been difficult to measure. When possible (albeit with approximation), “gig” workers were found to display lower returns to skill than employees or other self-employed individuals, independently on gender (OECD, 2018c).

Taking Stock: Data and Evidence on Gender Digital Equality PART TWO
291
hours. Flexible arrangements can also be valuable for individuals constrained by family duties — preponderantly women — and can thus enhance female participation in the labour market. This has the potential to help women build their confidence, experience, human capital, and networks, and thus to reduce the gender wage gap over time. However, flexible work arrangements may translate into low-quality jobs (OECD, 2017b); they may also entail longer working hours and little separation between work and personal life. Policies should ensure that “more flexible” also means “better”. Ideally, women’s increased labour market participation would need to be accompanied by greater gender equality in household and family-related duties.
IMPROVE THE (GENDER) FAIRNESS OF THE SYSTEM
Women’s lower labour market participation can reflect the uneven burden of family duties. Government policies can expand the public provision of child care services; they can also support a redistribution of family duties, for instance through paid paternal leave. Within the workplace, affirmative action and even quotas can be considered to address discrimination, especially in filling leadership positions. Improving the (gender) fairness of the economic system may at times require imposing a minimum number of women in governing boards, parliaments, or policy cabinets. However, softer approaches — such as voluntary target setting and disclosure of existing gender outcomes, often initiated within the private sector itself — may be effective while avoiding triggering confrontational attitudes (OECD, 2017a). Policy measures have little hope of success where gender discrimination is ingrained in culture and society. Social norms influence women’s participation in the labour market, as well as the way they may own and manage economic resources — including technology. While the role of such norms in shaping the gender gaps resists empirical analysis, they certainly contribute to the “residual” gender wage gap that remains when other determinants have been accounted for.The socio-economic change fostered by the digital transformation can influence cultural norms, challenge traditional ideas on the role of women in society, and help women form new or different aspirations. These changes can be supported by information campaigns to raise awareness on gender discrimination, promote more gender-balanced narratives, and dispel stereotypes.
A HOLISTIC POLICY APPROACH TO THE GENDER GAP
Closing the gender gap in skills and wages requires cross-cutting approaches that involve most, if not
all, aspects of public policy and that include specific gender-related objectives (OECD, 2018b). Digital strategies will be especially important in this regard, to shape the interplay between digital technologies and workers’ jobs and skills.
REFERENCES
Acemoglu, D., & Autor, D. (2011). Skills, tasks and technologies: Implications for employment and earnings. In: D. Card & O. Ashenfelter (Eds.), Handbook of labour economics (1043-1171). San Diego and Amsterdam: Elsevier.
Autor, D. H., & Handel, M. J. (2013). Putting tasks to the test: Human capital, job tasks, and wages. Journal of Labor Economics, 31(S1), S59-S96. Retrieved from: https://doi.org/10.1086/669332
Blau, F. D., & Kahn, L. M. (2017). The gender wage gap: Extent, trends, and explanations. Journal of Economic Literature, 55(3), 789-865. Retrieved from: http://dx.doi.org/10.1257/jel.20160995
Booth, A., Cardona-Sosa, L., & Nolen, P. (2014). Gender differences in risk aversion: Do single-sex environments affect their development? Journal of economic behavior & organization, 99, 126-154. Retrieved from: https://doi.org/10.1016/j.jebo.2013.12.017
Calvino, F., Criscuolo, C., Marcolin, L., & Squicciarini, M. (2018). A taxonomy of digital sectors. Science, Technology and Industry Working Paper. Paris: OECD Publishing. Retrieved from: https://doi.org/10.1787/f404736a-en
Carretero, S., Vuorikari, R., & Punie, Y. (2017). DigComp 2.1: The Digital Competence Framework for Citizens with eight proficiency levels and examples of use. EUR 28558 EN. Retrieved from: http://doi.org/10.2760/38842
Croson, R. & U. Gneezy (2009). Gender Differences in Preferences. Journal of Economic Literature, 47(2), 448–74. Retrieved from: https://doi.org/10.1257/jel.47.2.448
David, H. (2015). Why are there still so many jobs? The history and future of workplace automation. Journal of Economic Perspectives, 29(3), 3-30. Retrieved from: http://dx.doi.org/10.1257/jep.29.3.3
Deming, D. J. (2017). The growing importance of social skills in the labor market. The Quarterly Journal of Economics, 132(4), 1593-1640. Retrieved from: https://doi.org/10.1093/qje/qjx022
Deming, D. J., & Kahn, L. B (2017). Firm Heterogeneity in Skill Demands. NBER Working Paper No. 23328. Washington, DC: National Bureau of Economic

Taking Stock: Data and Evidence on Gender Digital Equality PART TWO
292
Research, Inc.
Dustmann, C., Ku, H., & Kwak, D. W. (2018). Why are single-sex schools successful? Labour Economics, 54, 79-99.
Gathmann, C., & Schönberg, U. (2010). How general is human capital? A task-based approach. Journal of Labor Economics, 28(1), 1-49. Retrieved from: https://doi.org/10.1086/649786
Gibbons, R., & Waldman, M. (2004). Task-specific human capital. American Economic Review, 94(2), 203-207.
Goldin, C. (2014). A grand gender convergence: Its last chapter. American Economic Review, 104(4), 1091-1119. Retrieved from: http://dx.doi.org/10.1257/aer.104.4.1091
Grundke, R., Kalamova, M., Keslair, F., Jamet, S., & Squicciarini, M. (2017). Skills and Global Value Chains: A Characterisation. OECD Science, Technology and Industry Working Papers. Paris: OECD Publishing. Retrieved from: http://dx.doi.org/10.1787/cdb5de9b-en
Grundke, R., Marcolin, L., & Squicciarini, M. (2018). Which skills for the digital era?: Returns to skills analysis. OECD Science, Technology and Industry Working Papers. Paris: OECD Publishing. Retrieved from: http://dx.doi.org/10.1787/9a9479b5-en
Heckman, J. J., & Kautz, T. (2012). Hard evidence on soft skills. Labour economics, 19(4), 451-464. Retrieved from: https://doi.org/10.1016/j.labeco.2012.05.014
Heckman, J. J., Stixrud, J., & Urzua, S. (2006). The effects of cognitive and noncognitive abilities on labor market outcomes and social behavior. Journal of Labor economics, 24(3), 411-482. Retrieved from: http://dx.doi.org/10.1086/504455
Marianne, B. (2011). New perspectives on gender. In: O. Ashenfelter & D. Card (Eds.), Handbook of labor economics (1543–90). Amsterdam and Boston: Elsevier. Retrieved from: http://dx.doi.org/10.1016/S0169-7218(11)02415-4
Niederle, M., & Vesterlund, L. (2007). Do women shy away from competition? Do men compete too much? The quarterly journal of economics, 122(3), 1067-1101. Retrieved from: https://doi.org/10.1162/qjec.122.3.1067
OECD (2016). New Skills for the Digital Economy. OECD Digital Economy Paper No. 258. Paris: OECD Publishing. Retrieved from: https://doi.org/10.1787/5jlwnkm2fc9x-en
OECD (2017a). Education at a glance 2017: OECD indicators. Paris: OECD Publishing. Retrieved from: http://dx.doi.org/10.1787/eag-2017-en OECD (2017b). The pursuit of gender equality: An
uphill battle. Paris: OECD Publishing. Retrieved from: http://dx.doi.org/10.1787/9789264281318-en
OECD (2018a). Towards the implementation of the G20 Roadmap for digitalisation: Skills, business dynamics and competition. Paris: OECD Publishing. OECD (2018b). Toolkit for gender equality in governance: Implementing the 2015 OECD recommendation on gender equality in public life. Paris: OECD Publishing.
OECD (2018c). Bridging the digital gender divide: Include, upskill, innovate. Paris: OECD Publishing. Retrieved from: http://www.oecd.org/going-digital/bridging-the-digital-gender-divide.pdf
Poletaev, M., & Robinson, C. (2008). Human capital specificity: Evidence from the Dictionary of Occupational Titles and Displaced Worker Surveys, 1984–2000. Journal of Labor Economics, 26(3), 387-420. Retrieved from: http://dx.doi.org/10.1086/588180
Weinberger, C. J. (2014). The increasing complementarity between cognitive and social skills. Review of Economics and Statistics, 96(4), 849-861. Retrieved from: https://doi.org/10.1162/REST_a_00449

Taking Stock: Data and Evidence on Gender Digital Equality PART TWO
293

294
SKILLS DEVELOPMENT AND YOUNG WOMEN’S WORK IN THE CALL CENTRE INDUSTRY IN SOUTH AFRICA
8
AUTHORS: SISA NGABAZA (WOMEN’S AND GENDER STUDIES, UNIVERSITY OF THE WESTERN CAPE)79
79 The author acknowledges support from the National Research Foundation (Grant no. 99220) in South Africa.

Taking Stock: Data and Evidence on Gender Digital Equality PART TWO
295
ABSTRACT
The call centre industry continues to grow as a major business outsourcing avenue. National and international organisations are increasingly using call centres for marketing as well as for outsourcing customer services, often based in developing countries. The South African government supports such business outsourcing through prioritising call centres for investments and as job creation for its young people. A quarterly labour force survey (QLFS), released by Statistics South Africa in the last quarter of 2017, shows a national unemployment rate of 26.7%, with a high youth unemployment rate of 29.7% among 15- to 24-year olds. Such high youth unemployment rates make call centres especially attractive in South Africa. Empirical findings from this sector show that 75% of the employees in South African call centres are young women who have just finished school and female college students. An exploration of skills development in the call centre industry is therefore also an exploration of skills development for young women, who are the majority of workers. This chapter presents findings from qualitative focus group discussions and individual interviews conducted with young women who work as agents in call centres in Cape Town and Johannesburg. We conducted four focus group discussions of six to eight participants and 20 semi-structured individual interviews, with women aged 19–34 years working as agents in various call centres. All interview participants were recruited through convenience and snowball sampling. Focus groups and interview data was analysed through a qualitative thematic analysis.
KEY FINDINGS
• Training for key competencies varied from organisation to organisation, from a few days to several weeks. Training took different forms: brief teaching sessions followed by tests; memorising scripts to answer possible questions; basic keyboard skills, including word processing and speed typing; communication skills of pronunciation, phone etiquette, and voice demeanour.
• Some participants indicated that training consisted of hands-on experience on the shop floor, with minimal prior training. This included informal side-by-side coaching, or “buddying up” to understudy their fellow workers.
• Agents might be put under pressure designed to test their level of resistance.
• Much emphasis was put on the development of “people skills”; respondents considered call centres highly focused on developing people skills, more than any technical or digital skills, no matter what technological systems were adopted in training. They questioned call centres’ capability to promote technical skills development.
• Skills developed in call centres were specific to work in call centres rather than transferable to other work.
• Few leadership positions were available, and there was a lack of personal growth.
INTRODUCTION
Numerous business organisations have begun to use call-centres in developing countries, through both onshoring and outsourcing services, taking advantage of their cheap labour and favourable labour attrition rates. Call centres operate on information communication technology (ICT) platforms that enable easy global access. Key destinations for global outsourcing call centres are India, the Philippines, and, of late, South Africa and Kenya. The South African Government prioritises call centres for investments and job creation (Banks & Roodt, 2011). As such, the industry has grown tremendously over the years, becoming a key source of employment for young people. A quarterly labour force survey (QLFS), released by Statistics South Africa in the last quarter of 2017, shows a national unemployment rate of 26.7%, and 29.7% for youth aged 15–24. Given high youth unemployment levels, it is not surprising that the government supports call centres to address the issue.
This chapter draws on a project that explored young women’s work in call centres in the cities of Cape Town and Johannesburg in South Africa. Focus groups and individual interviews were conducted with young women who work in call centres, to explore the dynamics of skills development in this largely digitalised industry. The chapter evaluates the skills development of the young women workers, considering the link between the training and skills acquired on the job and advancement prospects for workers, in view of evolving information and communication technological systems. It begins by looking at the nature of call centre work in South Africa, followed by an exploration of women’s work in call centres. The chapter then presents the voices of young women, capturing the experience of skills development of these young workers.

Taking Stock: Data and Evidence on Gender Digital Equality PART TWO
296
LOCATING SOUTH AFRICAN CALL CENTRES IN THE GLOBAL ECONOMY
The call centre industry in South Africa has grown immensely since the ‘80s, becoming a thriving domestic industry and a key employer of young people who would otherwise be unemployed. Banks and Roodt (2011) describe the industry as growing largely through business-owned centres, which incorporate call centres as part of their own business processes. They emphasise that call centres have “moved from occupying a relatively small niche to being a significant part of the global economy” (Banks & Roodt, 2011, p. 3). South African call centres are an integral part of the global market system based on neoliberal capitalism.
Neoliberalisation favors opening up international markets through easing trade and labour regulations. Firms can benefit from access to external labour and capital markets for outsourcing services, capitalising on cheap labour as well as on flexible ways to build capital. Raewyn Connell sees neoliberalism as “the agenda of economic and social transformation’’ which dominates “global politics” and is systematically implemented in “institutions under neoliberal control” (Connell, 2014, pp. 5-6). The globalised economy entails outsourcing ancillary services, such as tele-marketing and service provision, to emerging markets (Panday & Rogerson, 2014). Of concern to feminist scholars is that these outsourced services mostly depend on women’s cheap labour.
In South Africa, call centres emerged in the late ‘80s, growing rapidly in the ‘90s due to improved technology and lower communication costs (Benner, 2006; Holman; Batt & Holtgrewe, 2007; Panday & Rogerson, 2014). The industry has grown steadily since then and now serves both local and international markets. Research shows that more than two-thirds of call centre employees in South Africa are young people under age 35 (Cohen, 2013; Panday & Rogerson, 2014); approximately 75% of these young people are women (Benner, Lewis, & Omar, 2007). This employment pattern is also a common global trend (Belt, 2002; Bonds, 2006; Darsun & Bayram, 2014). Any investigation into call centre work is also an investigation into women’s work, the concern of this chapter.
UNDERSTANDING THE CALL CENTRE INDUSTRY IN SOUTH AFRICA
The South African government policy prioritising the call centre industry is focused on attracting international investors, a strategy that is emphasised in the recent Business Process Enabling South Africa (BPESA) Key Indicator Report (2016). The government Minister of Trade and Industry, Rob Davies, notes that South Africa was named the offshoring destination of the year at the Global Sourcing Association (GSA) awards in London in 2016, an award the country had also received in 2014 and 2012 (BPESA, 2016). Figure 8.1, from the BPESA report, illustrates some of South Africa’s key strengths as a potential business outsourcing destination.
This strategic positioning of South Africa is widely documented (DTI, 2013; Hall, 2011). In line with neoliberal free market approaches, and to reduce unemployment, the South African Government is focused on strategies to develop a “sustainable skills” pool for its growing Business Processing Outsourcing (BPO) market (BPESA, 2016). Key strategies considered include the following (adapted from BPESA, 2016, p.9): • extending BPO skills through development of
industry-specific academies
• facilitating participation of government educational institutions in the BPO agenda
• addressing critical skills gaps
• building competence of team leaders and managers
• developing English and foreign language skills• harnessing technology for skills development
It is still unclear how the South African government will translate this commitment into action, and what advantages and disadvantages it will entail for women working in this sector.

Taking Stock: Data and Evidence on Gender Digital Equality PART TWO
297
Figure 8.1South Africa – strengths in business outsourcing
Source: BPESA, 2016, p. 6.
WOMEN’S WORK IN CALL CENTRES AND SOCIO-ECONOMIC TRENDS
South Africa serves as an ideal destination for BPO, particularly in the service sector. The growth of the service sector has seen a huge pool of women entering the global labour market (Gillard, Howcroft, Mitev, & Richardson, 2007; Eisenstein, 2009; Darsun & Bayram, 2014; Howcroft & Richardson, 2008), and the call centre industry is largely dependent on women’s labour for both offshore and onshore services (Bonds, 2006). This global practice highlights the importance on women’s labour as significant for global markets and international competition (Moghadom, 2000). Scholars have viewed women’s predominance in the call centre labour force in widely differing ways. On the positive side, some see the growth of the service sector resulting in substantial increases in the number of women in the labour force, especially in emerging markets. Labour force participation is seen as affording women economic independence, providing a basis for resisting patriarchy (Diane Wolf, cited in Eisenstein, 2009, p. 149); some endorse call centre jobs as decent work (Cohen,
2013). Other scholars argue that call centre work is service labour and thus likely to perpetuate the feminisation of labour (Standing, 1999; Howcroft & Robinson, 2008; Blin, 2010). Some scholars go further, accusing the governments of developing countries of being complicit in “offering up” their workforce as capable and affordable to a capitalist world largely driven by neoliberal market competition (Lacity & Wilcocks, 2013). Service provision jobs are criticised for centralising gendered notions of femininity, to justify women’s participation in the labour force. These stereotypes are seen as contributing to the “devaluing” and “deskilling” of women’s work, while promoting occupational segregation and polarisation (Bonds, 2006, p. 32). Such occupational segregation reinforces inequality in the labour force, since women in the call centres occupy the lower end of the employment spectrum.
The fact that women are the majority of workers in call centres also has clear economic implications: profit margins remain protected, or even increase, due to the devaluation of women’s labour, which is always coupled with a reduction in labour costs (Gillard, et al. 2007). Furthermore, evidence shows that digital environments, such as that of the call centre industry, have the potential to “erode labour protection standards” (Gillwald, Mothobi & Schoentgen, 2017,

Taking Stock: Data and Evidence on Gender Digital Equality PART TWO
298
p. 2), especially because high levels of unionisation would deter investment. Eased labour protection standards can render women workers vulnerable to exploitation.
SKILLS DEVELOPMENT IN THE CALL CENTRE INDUSTRY
Scholarship on skills development in call centres is very limited. Evidence from sites that advertise call centre work shows that the industry does not routinely seek applicants with prior call centre skills, but rather offer their own training (see www.jobin.co.za). Recruitment efforts target marginalised, less-skilled young people, particularly women, who are either school leavers or college students (Benner, Lewis, & Omar, 2007). Call centres are highly routinised; the work requires little skills variety (Coetzee & Harry, 2015), and worker development is precluded by the flat organisational structure (Choi, S., Cheong & Feinberg, 2012). This research explores the implications of skills development for young women workers in South Africa, building on the body of scholarship on women’s work in call centres in the Global South, particularly in the African context.
Figure 8.2 presents key skills-development approaches for managers in call centres in South Africa, as shown in the 2016 BPESA report. It shows that South African call centres pay significant attention to skills development, taking particular interest in upskilling staff.
METHODOLOGY
This chapter is based on a research project that investigated the participation of young women in the call centre industry in the cities of Cape Town and Johannesburg in South Africa, using surveys, focus group discussions, and individual interviews. Surveys noted demographic information on the participants as well as socio-economic and work-related factors. This paper draws particularly on the focus group discussions and individual interviews, to explore the impact of the call centre industry on skills development among these young women. Four focus group discussions of six to eight participants, as well as 20 semi-structured individual interviews, were conducted with young women aged 19–34 who currently worked as agents in different call centres. Participants included college students, school leavers, and other women. All interview participants were sampled through convenience and snowball sampling, and interview sessions took place in various settings where the participants would feel comfortable: at
Figure 8.2Skills development in call centres in South Africa
Source: BPESA, 2016, p. 28.

Taking Stock: Data and Evidence on Gender Digital Equality PART TWO
299
their work place during breaks; at their homes or colleagues’ homes; and at their colleges. Participation was voluntary, and all participants were informed that they could leave the study at any time without penalty. Focus group and interview data was analysed through a qualitative thematic analysis.
FINDINGS
The young women interviewed in this study included both part-time and full-time workers at call centres, which served British, American, and South African companies focusing on finance, telecoms, retail, data collection, and gaming. The interview questions concentrated on their experiences as workers, with particular reference to skills development. This section presents participants’ perspectives and insights on skills acquisition for both job competency and career development.
SKILLS TRAINING FOR JOB COMPETENCY
Participants indicated that training took different forms that varied by organisation, with the initial training ranging from a few weeks to several months.
You get theory for like maybe 2 weeks, and then you are on the floor for another week.
The training was 3 months, and… you would need communication, interpersonal skills, be computer literate, patience, and I mean a lot of it, and then good listening skills. You just get basic training on how to do the job: how to answer the phone, how to understand accents, how to operate their system and all that stuff. Their training is actually self-training, so you read stuff off the pc, then when you are done with that, they test you based on that and if you fail, they terminate your contract based on that.There is a script that they give you that you memorise.
The training included teaching sessions followed by tests, that determined either progression to the floor or termination of contract. Agents also memorised scripts to master the questions they would have to answer on the shop floor. They were trained in basic keyboard skills, which included word processing and speed typing. They received training in communication skills: how to pronounce certain words, phone etiquette, and voice demeanour. Most of these skills have been labelled “effeminate” (Bonds, 2006) — and, scholars note, they are critical to these and similar industries that capitalise on women’s biological and social characteristics to drive profits.
One participant touched on the issue of gendered recruitment when she emphasised how prospective employers considered it necessary to listen to her voice as part of training:
. . . so that my potential employers could hear the sound of my voice, whether my speech is slurred or…This is because call centres often want a voice that is pleasing and softer in terms of sound. Men are often linked to having voices that are rough and edgy, so maybe most men who apply do not get the job because of the sound of their voice, but I cannot be sure.
A number of participants felt that initial training sessions did not assist much in equipping them for their work, and that the most useful training occurred when they got to the shop floor.
INFORMAL TRAINING: ‘WE LEARN ON THE FLOOR’
Some participants indicated that key readiness for tasks was developed only through hands-on experience on the shop floor. They spoke about side-by-side coaching, which they termed “buddying up”, where they were assigned to understudy fellow workers or to be assisted by more experienced colleagues.
The first three days, you buddy up with someone else, you listen to their calls, you are with them as they take calls, you get to listen to the type of queries the clients raise, and you note how they are able to answer and then after that you go on your own.
You also have someone else buddying up with you. . . . It’s the older people that come and listen in so if you’re struggling and you need to ask something you can quickly ask to put the client on mute and in the meantime, you quickly find out the information that you require and then give it to the client. Then after that buddying up you’re on your own.
They found this mode of training interesting and quite effective. Shop floor skills development was informal, however, and such informal processes do not secure skills recognition for career development, since they are not documented.
Training also involved putting agents under pressure to test their level of resistance, as one agent explained:
They suss up who can deal with high pressure situations and who can’t — a lot of trainees leave at this point and do not return.
High pressure training was also linked to training towards achieving set targets that measure the worker’s competency for the job.

Taking Stock: Data and Evidence on Gender Digital Equality PART TWO
300
The women workers admitted that all these forms of training and exposure provided them with some new skills. This chapter examines the nature of the skills acquired on the job and their value for career development.
THERE IS COMPANY GROWTH AND NO PERSONAL GROWTH: SKILLS TRAINING AND CAREER DEVELOPMENT
While some participants felt that the initial training improved their skills in some ways, others dismissed it as routine training that did not add to their skills. Respondents put emphasis on acquiring what are often called “people skills” (White & Roos, 2005), and agents believed they “picked up” these skills on the job.
I wouldn’t say training empowered me with any skills but the work environment did. Having to deal with people, having to solve peoples’ problems and having to think on your feet. It is the experience and not necessarily the training that matters. Training is just theory, information on the product the company offers and that is all. In most cases you forget those things, it’s doing the work and you being active that gives you the training and experience that you take with you out of the call centre business, to other companies or to other aspects of your life where you will implement them.
I learnt to listen more attentively and work within very demanding circumstances. This job has also taught me to be very patient with the customers and use the different communication skills to connect with the customers.
So, what I am saying is that it’s is not all bad, there is positivity in it. It will give you the opportunity and equip you for the future job that you want to do, it will give you soft skills, leadership skills, how to approach other situations as well.
Agents felt that call centre jobs developed soft skills and people skills more than technical or digital skills. While they appreciated developing people skills for personal growth, some questioned the importance of these skills for career growth.
Call centres are great, you meet people, acquire people skills, improve your communication skills, you improve yourself, you get promoted if you are lucky, to do the same thing anywhere —but the sad thing is that there is nowhere else you can fit with those skills. You have to work call centres or look for a job as a receptionist somewhere else! You can’t take those skills anywhere.
The only skill you take across is moving to another call centre to do the same thing, agent or team leader.
I have only learnt to withstand pressure and to be confident and nothing else.
Agents also described the challenges of getting promoted, due to the limited availability of leadership positions as well as the intense competition for the limited positions of growth.
You find people ”playing game of thrones” [back stabbing each other] to climb ladders that do not exist — there is company growth and no personal growth there.
I have been working here for four years now, and there are very limited positions to grow within the workplace. For years I have been doing the same thing on a daily basis, but there have been no promotions.
The ceiling is low, you rise and get stuck there, who wants to be a 50-year-old answering phones? Call centres kill your mind.
I see this job as limiting, people working in call centres always work at call centres, and they tend to not change jobs. One of my colleagues has been working with this company for six years, doing the same stuff every day and is still in the same position.
Call centres do not promote growth or any type of growth in terms of career prospects. The job is repetitive because every day I do the same thing and this can be quite frustrating if you want to express your talents and creativity.
Participants repeatedly discussed the lack of career growth, with some characterising the nature of call centre work as exploitative. In this view, they saw some centres capitalising on workers’ vulnerability, arising from a lack of alternative employment.
I would say that call centres are exploitative. They use the basic work loss that we have here in South Africa. . . . It’s cheaper over here to employ people than it is overseas . . . and someone did mention that you are easily replaceable in a call centre.
You are told straight out if you are not happy, it’s fine, leave, there is someone that wants that job that you don’t want. You are easily replaceable, you are not important. You are just a number in a lot of numbers they can easily get rid of.
Although not a common observation, one participant also raised what she saw as the gendered nature of promotion in her organisation.
I have learned a lot of skills such as communication skills, persuasiveness, conflict management, computer skills, and skills on sales. . . . But the thing is, even though I have learned all these skills at this job, I am still in the same position I started off with. I have never been promoted. They mostly promote guys. When we ask why it’s only guys that get promoted, they say

Taking Stock: Data and Evidence on Gender Digital Equality PART TWO
301
it’s because they perform and that’s why they earn it. Surely there must be at least one girl who performs in this job.
DISCUSSION
Call centres largely provide service through use of digital technologies. Firms engaged in outsourcing have absorbed large numbers of young people, especially women, into various occupations (Belt, 2002; Taylor & Bain, 2005; Singh & Pandey, 2005). Call centres are not gender-neutral, as the industry is significantly driven by women’s labour (Russell, 2008). The feedback of workers in the surveys and interviews cited above indicates that call centres do not focus on developing skills that lead to career development. The skills acquired by working in the industry do not add significant value to women’s advancement in the labour market, keeping them on the lower rungs of the employment ladder (Ngabaza, 2017; Webster, 2004). Similarly, this study shows that the minimal skills developed in call centres are not intended to empower the women employees but rather to maintain profit margins. The absence of unions represents a business policy, as high levels of unionisation might drive away possible investors (Benner et al., 2007) — further compromising labour protection standards (Gillard, et al., 2007; Gillwald, et al., 2017).
Examining the intersection of skills development with the gendered dynamics of employment can provide a more complete understanding of the implications of skills development for women call centre workers. Research shows that ICT-driven work can reach marginalised and vulnerable communities (World Bank, 2016); indeed, call centres in South Africa mainly employ young women from such communities. Since ICTs are not gender-neutral but are “embedded in a range of social economic and political contexts” (Bonds, 2006, p. 31), it is important to interrogate the gender dynamics to understand what the skills development process implies for workers.
The recruitment process focuses on “feminine” skills: basic keyboard skills, phone etiquette, word processing, and voice demeanour. Workplace skills development focuses on effective service provision, not career growth. Workers develop their skills informally, coached by colleagues or memorising scripts. Scholars note, in similar contexts, that such informally obtained skills are not recognised as skills or considered in promotion prospects (Webster, 2004). While some participants valued the interpersonal skills they had acquired, they felt that these were of limited value to their career progression, and that they had not gained technical skills that could lead to further employment in the information sector.
The key competencies developed in the “skilling” of call centre agents have been linked to essentialist feminine skills. Young women in call centres remain the core drivers of this digital industry, in a global context that promotes economic growth without career development. Some study participants indicated that the focus of call centres was on organisational and economic growth, at the expense of skills development that might enhance their personal and career growth; some said they were reduced to a “lot of numbers” and were easily replaceable. Such contexts perpetuate gender inequality (Scholarios & Taylor, 2010).
While call centres have been instrumental in job creation in South Africa, where unemployment is a major issue, gender inequalities cannot be overlooked in assessing projects promoting economic growth and job creation opportunities. Moghadam (2000) has shown how global neoliberal trade regimes and competition have capitalised on women’s labour. More than a decade later, the same process is replicated in call centres, which embody the “feminisation of production in the new information economy” (Bonds, 2006, p. 32). Young women are marginalised for corporate profits in this digitally-anchored industry; their labour is a source of global economic growth, as companies compete for the best outsourcing destinations in new emerging markets. Many of the young women participants were aware of this exploitation, emphasising that call centre work was “part-time work” while focusing on building other skills for their careers. However, they were also aware of the strain of juggling call centre work and other areas of personal development, especially for those who were still studying. In spite of being based in information technologies, call centres remain limited in equipping their workers — especially the young women who represent the majority — with valuable skills for career growth.

Taking Stock: Data and Evidence on Gender Digital Equality PART TWO
302
REFERENCES
Belt, V. (2002). A Female Ghetto? Women’s Careers in Telephone Call Centres. HRM Journal, 12(4), 56-66.
Banks, D., & Roodt, G. (2011). The efficiency and quality dilemma: What drives South African call centre management performance indicators? SA Journal of Human Resource Management, 9(1), 1-17.
Benner, C. (2006). “South Africa on call”: Information technology and labour market restructuring in South African call centres. Regional Studies, 40: 1025-1040.
Benner, C., Lewis, C.& Omar, R. (2007). The South African call centre industry: A study of strategy, human resource practices, and performance. The Global Centre Industry Project.
Blin, M. (2010). Globalization, women and the labour market in Southern Africa. In M. Ruiters (Ed.). Gender instruments in Africa (114-129). South Africa: IGD.
Bonds, A. (2006). Calling on femininity? Gender, call centres, and restructuring in the rural American West. ACME: An International Journal for Critical Geographies, 5(1), 28-49.
Braun, V. & Clarke, V. (2006). Using thematic analysis in psychology. Qualitative Research in Psychology, 3 (2), 77-101.
BPESA (2016). South Africa Business Process Services Key Indicator Report. Retrieved from: http://www.bpesa.org.za/wp-content/uploads/2017/06/Key-Indicator-Report-2016-low-res-1.pdf
Choi, S., Cheong, K. J. & Feinberg, R. A. (2012). Moderating effects of supervisor support, monetary rewards, and career paths on the relationship between job burnout and turnover intentions in the context of call centers. Managing Service Quality, 22(5), 492-516.
Cohen, M. (2013). South Africa ideal for call centres, accent “sounds British”. Mail & Guardian, December 2. Retrieved from: http://mg.co.za/print/2013-12-02-south-africa-ripe-for-callcenter-expansion
Coetzee, M. & Harry, N. (2015). Gender and hardiness as predictors of career adaptability: An exploratory study among Black call centre agents. South African Journal of Psychology, 45(1), 81-92.
Connell, R. (2014). Global tides: Market and gender dynamics on a world scale. Social Currents, 1(1), 5-12.
Darsun, G. & Bayram, H.B. (2014). Women labour in call centres: Understanding characteristics of work. Journal of Global Analysis, 4(1), 35-51.
Gillard, H., Howcroft, D., Mitev, N., Richardson,H. & Ferneley, E. (2007). Shaping the global economy: Gender, ICTs and development research. In: Proceedings of the 9th International Conference on Social Implications of Computers in Developing Countries (28-30).
Gillwald, A., Mothobi, O., & Schoentgen, A. (2017). What is the state of microwork in Africa? A view from seven countries. #afteraccess Policy Paper Series, No. 2. Retrieved from: www.researchICTafrica.net
Eisenstein, H. (2009). Feminism seduced: How global elites use women’s labour and ideas to exploit the world. Boulder, CO: Paradigm Publishers.
Holman, D., Batt, R., & Holtgrewe, U. (2007). The global call center report: International perspectives on management and employment. Ithaca, NY: Authors.
Howcroft, D. & Richardson, H. (2008). Gender matters in the global outsourcing of work. New Technology, Work and Employment, 23, 44-60.
Lacity, M. & Willcocks, L.P. (2013). Outsourcing business processes for innovation. MIT Sloan Management Review, 54 (3), 63-69.
Moghadam, V.M. (2000). Gender and the global economy. In: M. M. Ferree, J. Lorber & B. Hess (Eds.). Revisioning gender (129-152). Altamira press.
Ngabaza, S. (2017). Young women in South African call centres: A case of women’s empowerment or a repackaging of the conventional global factory? In: International Conference on Social Implications of Computers in Developing Countries (135-143). Springer, Cham.
Pandy, W.R. & Rogerson, C. M. (2014). South Africa’s call centre industry: The emerging challenges of a growing destination in the global South. Mediterranean Journal of Social Sciences, 5(8), 208-217.
Russell, B. (2008). Call centres: A decade of research. International Journal of Management Reviews, 10(11), 1468-2370.
Scholarios, D., & Taylor, P. (2010). Gender, choice and constraint in call centre employment. New Technology, Work and Employment, 25(2), 101-116.
Singh, P., & Pandey, A. (2005). Women in call centres. Economic and Political Weekly, 684-688.
Standing, G. (1999). Global feminization through flexible labour: A theme revisited. World Development, 27(3), 583-602.
Stats SA. (2018). Quarterly Labour Force Survey (QLFS), Fourth Quarter of 2017. Retrieved from: http://www.statssa.gov.za/?p=10884

Taking Stock: Data and Evidence on Gender Digital Equality PART TWO
303
Taylor, P. & Bain, P. (2005). “India calling to the far away towns”: The call centre labour process and globalization. Work Employment & Society, 19(2), 261–282.
Thompson, G. (2013). Call centre special: Africa fights for its share of a global market. Retrieved from: http://www.balancingact-africa.com/news/en/issue-no- 169/topstory/call-centre-special/en
Webster, J. (2004). Digitising inequality: The cul-de-sac of women’s work in European services. New Technology, Work and Employment, 19(3), 160-176.
White, C. & Roos, V. (2005). Core competencies of a call centre agent. SA Journal of Human Resource Management, 3(2), 41-47.
World Bank. (2016). World Development Report 2016: Digital Dividends. Washington, DC: World Bank.
304
A GENDER PERSPECTIVE ON SECURITY AND PRIVACY IN THE DIGITAL AGE
9
AUTHORS: ASHLEY FRASER AND ELIZABETH A. QUAGLIA (ROYAL HOLLOWAY, UNIVERSITY OF LONDON)

Taking Stock: Data and Evidence on Gender Digital Equality PART TWO
305
ABSTRACTThis chapter explores the fundamental notions of digital security and privacy from a gender perspective. In a world that is increasingly relying on digital technologies, learning how to be safe when online is of paramount importance. Studies show that, as much as digital technologies represent an undeniable opportunity for growth and change, they also offer a larger platform for abuse. The Association for Progressive Communication has pointed out that cyberstalking, online harassment, image manipulation, and privacy violations have compromised women and girls’ safety both online and off-line, in many countries (APC, 2015). This disturbing behaviour extends to geo-tracking and surveillance, in some extreme cases. Equipping women with adequate digital knowledge and skills to ensure a more secure and private online experience can help to limit this kind of abuse. Going further, however, we advocate women’s involvement in fundamentally rethinking security research and design in terms of gender. Security technology (including cryptography) is not gender-neutral; to date, it has been proposed and designed by a specific, non-diverse community, which has shaped its development. Specific trust assumptions, security models, and the technical language of security — using such terms as attacks and adversaries — that underpin contemporary security research appear to be male-driven and male-oriented. However, there is growing awareness that security solutions need to be designed in, and for, a specific context, and that they need to take incorporate diverse, context-sensitive design principles. This goal requires reducing the gender gap in digital literacy, ensuring that women have the necessary skills to experience technology in a private and secure way (for instance, with better understanding of password use, encryption functionality, and data integrity). Women’s greater involvement in the design of security and cryptographic solutions is key to safer integration of digital technologies in our lives.
KEY FINDINGS
• Technology unfortunately provides a wider platform for abuse towards women. The solution requires both individual digital skills to enhance personal security and privacy, and women’s participation in design and development of security and privacy technologies.
• In the field of Information Security, women are largely underrepresented: globally, women account for just 11% of the cyber security workforce, mainly in non-managerial positions.
• Security technology is gendered; cryptography incorporates gendered assumptions relating to sources of threat, potential “trusted” allies, and resource availability. More diverse design principles need to be developed.
INTRODUCTION
This chapter details how the lack of knowledge of online security and privacy can have a deeply negative effect on technology users, especially women. A straightforward solution to this problem is to equip women with the necessary skills, so the chapter then examines women’s involvement in the area of information security. Finally, we note that this imbalance in skills has led to a lack of diversity in the design and development of security solutions, and in particular of even basic cryptographic concepts. In view of the fundamental role of digital security in the adoption of technology in our lives, reducing the gender gap in this field is of paramount importance.
SECURITY AND PRIVACY CONCERNS FOR WOMEN IN THE DIGITAL AGE
Technology is generally considered a fundamental driver of development and social change, not only in economic aspects but also for human development, abilities, and freedom (Deneulin & Shahani, 2009). Digital technology, in particular, has great potential to promote the advancement of women’s economic opportunities as well as the equality of women and men. However, digital technology cannot be considered a mechanism in itself for promoting development and equality, but rather a contribution to that process, by highlighting, extending, and magnifying communicative and sharing capabilities (Sey, 2011).
Indeed, the digital age has proven, in some respects, to be liberating for women; access to technologies and the internet can be very empowering. Judy Wajcman, in TechnoFeminism (Wajcman, 2004), surveys feminist theories regarding the interplay between gender and technology. In the utopian views of cyberfeminists, technology will allow us to break free from the gender-based roles and restrictions that define us in the real world, because, in the digital world, women can be whoever they want. (Wajcman, 2004, pp. 56-77).

Taking Stock: Data and Evidence on Gender Digital Equality PART TWO
306
Society is immersing itself in the digital world. At the end of 2015, it was estimated that there were 3.2 billion people online (Internet Society, 2016); similarly, in 2016, it was estimated that 47% of the world’s population is online (World Wide Web Foundation, 2016). To varying extent, women are accessing the internet, ranging from 76.3% in Europe, to 18.6% in Africa (Statista, 2017a); (ITU, 2017). (For some countries, these statistics are unavailable.) In social media access, 52% of Facebook users in the U.S. are female, as are 44% of Facebook users worldwide (Statista, 2018a).
Mobile phone usage is also growing. In the U.S., 94% of women own a mobile phone and 75% own a smartphone (Pew Research Center, 2018). These numbers are significantly lower in the Global South: in low- and middle-income countries (LMICs), the percentage of women owning a mobile phone was 41% in 2015 (GSMA, 2015). Pay-as-you-go mobile phones have been important in enabling women in LMICs to get connected (Wajcman, 2004, p. 120). In 2017, 36% of women were using, or had previously used, online dating sites or apps (Statista, 2017b).
What security and privacy concerns does such connectivity entail? The advent of mobile technology has enabled significant economic and social changes, especially in LMICs. Innovations include branchless and mobile banking, farming apps, and health-related applications (including home-based care, medical advice, counseling for HIV/AIDS patients, and anti-counterfeit checking of pharmaceuticals).
However, mobile technology can reveal tensions and complex relations between technological mobility and social—especially gender-based—restrictions. The generalisation that technology increases economic and social advances is too simplistic. An ethnographic study in India, conducted by Jo Tacchi, shows that in some households men control technology (phones in particular), believing that technology has a corrupting influence on women. However, when the power structure changes in a household (due to a death, for example), the constraints and restrictions on technology also shift (Tacchi, 2014). The use of mobile technology to control or track a daughter’s movements, described in the same study, can be seen as either oppressive or protective, depending on the participant.
Social control can be exerted through simple calls and text messages, or it can be amplified through apps such as Phone Tracker and Find My Friends, which allow a user to follow a spouse or partner, for example. This can allow abusive partners to exert more control — particularly troubling when we consider that 35% of women worldwide have experienced physical or sexual violence (World Health Organisation, 2017).
Security and privacy may be even more at risk in the online world. American women are more likely than men to seek healthcare advice online (eMarketer, 2013). Women in the UK are reportedly seeking illegal
abortions online, even though abortion in the UK is legal and publicly funded (New Scientist, 2017). Whether or not this indicates a problem in accessing abortion services, there is certainly some danger in seeking out medical help online. Illegal healthcare creates a security issue, placing women in danger, particularly with regard to reproductive health and abortion services; they may receive incorrect medical information or be given medications that, at best, do not work or, at worst, are dangerous.
The problems and dangers that may be encountered by women seeking health and human services on the internet include: difficulties in ascertaining the credentials and identity of service providers; accessing inaccurate information; reliance on untested methods; difficulties in online assessment; exposure to disinhibited communication; development of inappropriate online relationships; and lack of standards or regulation regarding online human service practice. In addition there is the possibility of victimisation through loss of privacy, cyberstalking, and identity theft (Finn & Banach, 2000).
Overall, use of these new technologies may expose users to an unprecedented level of threats, such as control, abuse, and theft of sensitive data, reflecting the lack of certain security properties (Quaglia & Heath, 2017). One solution is to equip women with digital knowledge and skills to ensure a more secure and private online experience, as well as greater agency in navigating information security.
This highlights the need for progress in increasing both the digital skillset required for personal security and privacy (for which training and schools are being developed), as well as women’s participation in the design and development of security and privacy technologies. (We note that there is also the dual need to restrict and punish the abusers and perpetrators of online crime). This often comes in the form of calls for better and more balanced laws to prevent cyber-crime, online harassment, however this will not be the focus of our study). We focus on the need to increase women’s participation in InfoSec, since this has received less attention in the literature so far.
WOMEN IN INFORMATION SECURITY
Globally, women only account for 11% of the cyber security workforce, and they are likely to hold non-managerial and entry-level positions. Men are much more likely than women to hold a C-level or executive management position. The prevalence of women in information security professions varies by region, ranging from 5% of the workforce in the Middle East to 14% in the U.S., but women are underrepresented globally (Executive Women’s Forum, 2017).

Taking Stock: Data and Evidence on Gender Digital Equality PART TWO
307
Accordingly, decision making in information security is disproportionately carried out by men.
One reason for this gender gap is that women are less likely to interact with STEM subjects (i.e., science, technology, engineering, and mathematics). STEM background appears critical: 61% of women entering the information security workforce have a degree in a STEM subject, as do 74% of men (Executive Women’s Forum, 2017). However, girls’ uptake of STEM subjects in schools is low. For 16-year-olds in the UK, only 35% of girls choose to study a STEM subject, compared to 94% of boys (Wise, 2017). Jane Frankland points out that large numbers of women were engaged in STEM subjects throughout WWII, followed by a sudden drop-off. One factor, Frankland argues, may be media portrayal of STEM subjects as masculine areas of study; she cites examples of movies and popular media showing males interested in information security (Frankland, 2017, pp. 143-4). Another factor is misconceptions about gender, and gender bias. Gender bias can appear in many forms, from unequal pay to more subtle issues, such as asking women to perform different duties than men, influenced by gender norms (TechRepublic, 2015). Biases against women in the workplace include assumptions such as that a woman will leave to have children, or that she will not want to travel (Frankland, 2017).
Globally, 39% of women in information security do not come from a STEM background (Executive Women’s Forum, 2017), compared to 30% of information security professionals overall (Alta Associates, 2017). Since women are more likely to enter the information security profession from a non-technical background, Frankland points to the importance of non-traditional (i.e., non-STEM) routes into cybersecurity; she prefers to refer to STEAM (science, technology, engineering, arts, and mathematics) (Frankland, 2017, pp. 87-88). Women are more likely to have interdisciplinary skills, and employers should consider the benefits this can bring to a workforce (Executive Women’s Forum, 2017).
Programs that target information security initiatives at girls can help to raise awareness as well as increase digital skills. Girls Who Code operates across the U.S. and the UK (Girls who code, n.d.). IBM run the Women in Security Excelling Initiative (WISE), launching a 2016 programme called Cyber Day 4 Girls to teach girls in the U.S. and Canada cyber security awareness (IBM, 2016). Google launched a website in 2014, “Made with Code”, that includes coding projects aimed at girls (Time, 2014). Government initiatives also exist, such as CyberFirst (CyberFirst, n.d.), run by the National Cyber Security Centre in the UK, that provides courses and competitions that aim to nurture talent. In the U.S., GenCyber is a free summer camp for students and teachers (GenCyber, n.d.). Many initiatives around the world relate to STEM participation more broadly (Mashable, 2016), as demonstrated in the EQUALS mapping initiative (https://www.equals.org/actionmap).
In order to address gender bias, employers must first be aware of possible bias and take positive action to prevent women being discriminated against. For example, since women are often disadvantaged for having children (Frankland, 2017, pp. 4-8), Google increased maternity leave for new mothers. By reducing the number of new mothers leaving the company, this step was also cost-efficient, saving costs of recruitment and training (Quartz, 2016).
While women’s input to technological progress has been overlooked in the past (Wajcman, 2004, p. 13), their role in the history of technology is now being presented in popular media. Notably, the 2016 movie Hidden Figures documented the little-known role of African American female mathematicians in the U.S. space programme in the 1960s. Women’s issues are widely covered, and campaigns against stereotypes of women in industry are reported in the media (BBC News, 2015). Women in different industries fight against gender inequality, using social media to highlight issues; the MeToo (Wikipedia, n.d.) and TimesUp (Wikipedia, n.d.) campaigns showed the power of online action.
GENDERED SECURITY
Radical feminists see all technology as intrinsically patriarchal, that is, as part of a system controlled by men to further male goals. These arguments are explored in (Wajcman, 2004, pp. 10-31). This argument can also apply to digital security and privacy: as part of the technology, security and privacy can also be considered to be gendered.
Cryptography focuses on enabling secure communication over an insecure channel, such as the internet. This is typically done by means of cryptographic primitives — basic algoriths, such as encryption and digital signature schemes — designed and tested by cryptographers.
In order to test that a system is secure, researchers adopt rigorous and precise definitions of security, modelling properties such as confidentiality, integrity, and anonymity. Each definition is carefully designed to capture a particular security property, under detailed assumptions about resources, required trust, network availability, and even the notion of identity.
As noted in Quaglia and Heath (2017), the assumptions regarding available resources (e.g., technology used and network access), as well as notions of identity and trust, can strongly influence the cryptographic solution design. In our experience, most assumptions are developed and tested exclusively in the (male) global north. Cryptography is not a neutral terrain. Even its language can embody masculine themes, as in expressions such as penetration testing (in the secure testing domain), and man-in-the-middle attack

Taking Stock: Data and Evidence on Gender Digital Equality PART TWO
308
(a classic attack against cryptographic protocols). More significantly, perhaps, cryptographic models make assumptions that may not be relevant to gender-specific threats.
The model of cryptographic threat incorporates the notion of attacker/adversary, which is often assumed to refer to a distant and unseen third party with malicious intentions. As discussed in Part 1, the malicious intentions towards women’s security and privacy often originate from the domestic environment, and the assumption of a distant adversary appears irrelevant. Similarly, the trust assumptions made in these models often assume the existence of a trusted institution, such as a bank, a company, or the government, which can be fully relied on and considered benign. In countries where important institutions are male-dominated or male-oriented, such assumptions of trust could be detrimental to the security of women. Finally, even assumptions regarding resources can be considered biased: if a cryptographic solution is proved to be secure under specific resource requirements (e.g., power and network availability, computing capacity), when such requirements are not met security cannot be guaranteed. Given that women around the world tend to have limited access to resources, this basic assumption cannot be considered gender-neutral. These and related considerations need further research, to serve women’s unique and urgent security and privacy concerns.
CONCLUDING REMARKS
This issue has not been raised before in the context of cryptography, as the analysis of security in general has been heavily influenced by gender. Feminist security studies have proposed a more people-centered notion of security, in which people contribute to and become part of the definition of security. Quaglia and Heath (2017) describe a growing awareness that technology needs to be designed for a cultural and societal context. Seminal work by Hall, Heath, and Coles-Kemp (2015) describes how visualising security with the use of LEGO bricks enables participants to question traditional notions of security (such as the one user/one password paradigm).
Rethinking security through a gender lens is a necessary step to ensure women’s greater involvement in the design of security and, in particular, cryptographic solutions, enabling a successful integration of digital technologies in our everyday lives. There are some limitations to our considerations so far: for instance, we have not extensively covered issues of security and privacy globally, and we have not addressed intersectionality. This paper should represent a starting point for further detailed studies and research.
REFERENCES
Association for Progressive Communications (APC). (2015). Cases on women’s experiences of technology-related VAW and their access justice. Retrieved from: https://www.apc.org/en/pubs/cases-women%E2%80%99s-experiences-technology-related-vaw-a
Alta Associates. (2017). 2017 Global Information Security Workforce Study. Frost & Sullivan. Retrieved from: https://iamcybersafe.org/wp-content/uploads/2017/06/europe-gisws-report.pdf
ARS Technica. (2017). Google fires engineer who “crossed the line” with diversity memo. Retrieved from: https://arstechnica.com/tech-policy/2017/08/google-fires-engineer-who-crossed-the-line-with-diversity-memo/
BBC News. (2015). “Too hot to be an engineer”: Women mark Ada Lovelace Day. Retrieved from: http://www.bbc.co.uk/news/technology-34359936
CyberFirst. (n.d.). Retrieved from: https://www.cyberfirst.ncsc.gov.uk/
Deneulin, S., with Shahani, L. (2009). An introduction to the human development and capability approach: Freedom and agency. London: Earthscan.
eMarketer. (2013). Women more likely to seek healthcare advice online. Retrieved from: https://www.emarketer.com/Article/Women-More-Likely-Seek-Healthcare-Advice-Online/1009683
Frost, A., & Sullivan, W. (2017). The 2017 Global Information Security Workforce Study: Women in Cybersecurity. Retrieved from: https://iamcybersafe.org/wp-content/uploads/2017/03/WomensReport.pdf
Finn, J., & Banach, M. (2000). Victimization online: The downside of seeking human services for women on the Internet. CyberPsychology & Behavior, 3(5), 785-796. Retrieved from: http://dx.doi.org/10.1089/10949310050191764
Frankland, J. (2017). In security: Why a failure to attract and retain women in cybersecurity is making us all less safe. Rethink Press.
GenCyber. (n.d.). Retrieved from: https://www.gen-cyber.com/
Girls who code. (n.d.). Retrieved from: https://girlswhocode.com/
GSMA. (2015). Connected Women 2015: Bridging the gender gap: Mobile access and usage in low and middle-income countries.
Hall, P., Heath, C., & Coles-Kemp, L. (2015). Critical visualization: A case for rethinking how we visualize

Taking Stock: Data and Evidence on Gender Digital Equality PART TWO
309
risk and security. Journal of cybersecurity, 1(1), 93-108. Retrieved from: http://dx.doi.org/10.1093/cybsec/tyv004
IBM. (2016). Retrieved from: https://www.ibm.com/blogs/citizen-ibm/2016/10/ricciuto_girls_cyber_security/
Intel. (2012). Women and the Web. Intel Corporation.
Internet Society. (2016). Internet Society Global Internet Report 2016. Internet Society. Retrieved from: https://www.internetsociety.org/globalinternetreport/2016/?gclid=CjwKCAiAz-7UBRBAEiwAVrz-9RJtClvBj3WNdmj1ZJK7fB_fflqgVKCK3uwG0XmALw9IoIHGTx5QdRoCS7kQAvD_BwE
ITU (2017). Retrieved from: https://www.itu.int/en/ITU-D/Statistics/Documents/facts/ICTFactsFigures2017.pdf
Jordan-Young, R. (2010). Brainstorm: The flaws in the science of sex-differences. Harvard University Press.
Mashable. (2016). These STEM initiatives are inspiring women and girls around the globe. Retrieved from: https://mashable.com/2016/01/22/women-in-stem-global/#dXPQa6LTUuqK
New Scientist. (2017). Hundreds of UK women are seeking illegal abortions online. Retrieved from: https://www.newscientist.com/article/2148066-hundreds-of-uk-women-are-seeking-illegal-abortions-online/
Pew Research Center. (2018). Mobile Fact Sheet. Retrieved from: http://www.pewinternet.org/fact-sheet/mobile/
Quaglia, E., & Heath, C. (In press). New directions in secure branchless banking.
Quartz. (2016). When Google increased paid maternity leave, the rate at which new mothers quit dropped 50%. Retrieved from: https://qz.com/604723/when-google-increased-paid-maternity-leave-the-rate-at-which-new-mothers-quit-dropped-50/
Research @ MSU. (2016). Prostitution has gone online – and pimps are thriving. Retrieved from: http://research.msu.edu/prostitution-has-gone-online-and-pimps-are-thriving/
Sey, A. (2011). We use it different, different: Making sense of trends in mobile phones use in Ghana. New Media & Society, 13(3), 375-390. Retrieved from: http://dx.doi.org/10.1177/1461444810393907
Statista. (2017a). Internet usage rate worldwide in 2017, by gender and region. Retrieved from: https://www.statista.com/statistics/491387/gender-distribution-of-internet-users-region/
Statista. (2017b). Share of internet users in the United States who have used online dating sites or apps as of April 2017, by gender. Retrieved from: https://www.statista.com/statistics/706497/us-adults-online-dating-site-app-gender/
Statista. (2018a). Distribution of Facebook users in the United States as of January 2018, by gender. Retrieved from: https://www.statista.com/statistics/266879/facebook-users-in-the-us-by-gender/
Statista. (2018b). Distribution of global Facebook users as of January 2018, by gender. Retrieved from: https://www.statista.com/statistics/699241/distribution-of-users-on-facebook-worldwide-gender/
Statista. (n.d.). Distribution of computer and video gamers in the United States from 2006 to 2017, by gender. Retrieved from: https://www.statista.com/statistics/232383/gender-split-of-us-computer-and-video-gamers/
Tacchi, J. (2014). Being meaningfully mobile: Mobile phones and development. In: Servaes, J. (ed.). Technological determinism and social change (105-124). Lanham, MD: Lexington Books.
TechRepublic. (2015). 10 examples of gender bias you may encounter in the workplace. Retrieved from: https://www.techrepublic.com/blog/10-things/10-examples-of-gender-bias-you-may-encounter-in-the-workplace/
The Guardian. (2014). 52% of gamers are women – but the industry doesn’t know it. Retrieved from: https://www.theguardian.com/commentisfree/2014/sep/18/52-percent-people-playing-games-women-industry-doesnt-know
Time. (2014). Google invests $50 million to close the tech gender gap. Retrieved from: http://time.com/2901899/google-made-with-code-girls-in-tech/
Wajcman, J. (2004). TechnoFeminism. Cambridge: Polity Press.
Wikipedia. (n.d.). Me Too movement. Retrieved from: https://en.wikipedia.org/wiki/Me_Too_movement
Wikipedia. (n.d.). Time’s Up (movement). Retrieved from: https://en.wikipedia.org/wiki/Time%27s_Up_(movement)
Wired. (2017). The Actual Science of James Damore’s Google Memo. Retrieved from: https://www.wired.com/story/the-pernicious-science-of-james-damores-google-memo/
Wise. (2017). The STEM Education Pipeline 2017. Retrieved from: https://www.wisecampaign.org.uk/resources/2017/11/from-classroom-to-boardroom-the-stem-pipeline-2017

Taking Stock: Data and Evidence on Gender Digital Equality PART TWO
310
World Health Organisation. (2017). Violence Against Women. Retrieved from: http://www.who.int/mediacentre/factsheets/fs239/en/
World Wide Web Foundation. (2016). Digging into data on the gender digital divide. Retrieved from: https://webfoundation.org/2016/10/digging-into-data-on-the-gender-digital-divide/

Taking Stock: Data and Evidence on Gender Digital Equality PART TWO
311

312
INVESTIGATING EMPOWERING NARRATIVES AROUND WOMEN, WORK, AND TECHNOLOGY
10
AUTHORS: NAGLA RIZK, STEFANIE FELSBERGER, AND NANCY SALEM (ACCESS TO KNOWLEDGE FOR DEVELOPMENT CENTER)

Taking Stock: Data and Evidence on Gender Digital Equality PART TWO
313
ABSTRACT
Despite many efforts, women’s participation in STEM fields and representation in the tech workforce remains low in many places, made more difficult by gender prejudice in education as well as work. Women’s work in technology-related fields has been historically and structurally devalued. With a focus on women’s work in information and communications technology (ICT), this chapter reviews feminist literature on women and technology and discusses gaps in the current narrative of the empowering potential of technology. We explore two areas of existing research: literature on women’s work in ICT, especially intersectional and global literature; and a specific literature that reframes data production as labour, with reference to the influence of feminist literature on these arguments. We provide some recommendations for incorporating this perspective in research agendas on women in ICT and STEM.
KEY FINDINGS
• A more diverse literature on women and work in ICT and STEM should incorporate a more global analysis that takes into account women’s experiences of work in these sectors.
• Early writings on the impacts of technology assumed gender-neutral effects, as if technology is created outside social constructs and limitations. The potential benefits of ICT need to be viewed in the context of women’s lived experiences of these technologies.
• Historically, when women have been engaged in fields using technology, those fields of employment are defined as low-skilled and low-prestige (e.g., textile production). Similarly today, although women are actively involved in digital technology production, their contribution is undervalued and the fields where they work become less attractive.
• Online activities create valuable data and might be understood as work that should be compensated. Nevertheless, this work is often undervalued, invisible, and regarded as unskilled.
INTRODUCTION
There has been a push to make the field of digital technologies a safer and a more inclusive workplace for women over the last decade. Nevertheless, women across the globe continue to face discrimination both online and offline, as do other marginalised groups
and individuals. Women’s participation in STEM fields remains quantitatively low, with women facing prejudice in education and work. Representation in the workforce in STEM and other technology-heavy areas is especially lacking. This is consistent with a history of women’s work often being structurally devalued, with women being viewed as less valuable workers (Seguino, 2000; Elson & Pearson, 1982).
This chapter focuses on women, technology, and women’s work in technology. We examine the gendered ways in which women’s engagement with technology is portrayed and we investigate the view (known as technological determinism) that technology is automatically bringing about progress and benefits for women. We address how women’s work has historically been undervalued, whether it was housework, textile manufacturing, or women’s crucial contribution to programming — which was disregarded as “clerical” work. Women’s work has often not been acknowledged as “work”, or their skillful contribution has been ignored as low-skilled. We draw from a range of literature: on housework, care work, and affective labour; on the feminisation of labuor; and on deskilling. Our chapter also joins the conversation on how to close the digital gender gap, which generally focuses on promoting skill development and self-confidence in women and girls. We argue that a wider effort is also needed, to reexamine how women’s skills and contributions to technology have traditionally been undervalued.
The chapter has three sections. Section one discusses technological determinism — the view that technology drives progress — contrasting its assumptions with women’s global experiences with technologies. Section two explores narratives on two areas of women’s work relevant to the digital era: women producing ICTs, and women producing data and content. Finally, we make recommendations on the current research agenda, including expansion to include, as a default, a diversity of experiences from the Global South.

Taking Stock: Data and Evidence on Gender Digital Equality PART TWO
314
TECHNOLOGICAL DETERMINISM AND WOMENSince the 1850s, technology and its potential for positive change have captured the minds of scholars as well as politicians. When the first transatlantic cable was installed, it was hoped to connect “all the nations of the earth” and make it impossible for “old prejudices and hostilities” to exist (boyd, 2014, p. 156). The birth of the internet was heralded with similar hopes and dreams, as a new place that “allegedly freed users from the limitations of their bodies, particularly the limitations stemming from their race, class, and sex” (Chun, 2006, p. 2).
THE LITERATURE
Guillermo Gómez-Peña (1997), an early critic of that utopian rhetoric, describes how American digital artists viewed “the net” or “cyberspace” in the 1990s: they “spoke of a politically neutral/race-less/gender-less and classless ‘territory’ which provided us all with ‘equal access,’ and unlimited possibilities of participation, interaction and belonging” (Gómez-Peña, 1997). In reality, he observes, this “territory” had a “digital border”, and on the other side “there lived all the techno-illiterate artists, along with most women, Chicanos, Afro-Americans and Native Americans in the U.S. and Canada, not to mention the artists living in so called ‘Third World’ countries” (Gómez-Peña, 1997).
Even at the beginning of the internet age, therefore, despite many people’s attempts to make the web as inclusive as possible, its empowering potential was already limited and exclusive. Nevertheless, such utopian claims still influence the discourse around access and use of ICTs (boyd, 2014, p. 158). According to danah boyd, technological determinism is the belief that “technologies possess intrinsic powers that affect all people in all situations the same way” (boyd, 2014, p. 15). The larger literature on technological determinism investigates the relationship between technologies and societies and theorises how societies respond to technologies. The core tenets of technological determinism hold that technology is created outside social constructs and limitations, and that technology drives (socio-economic) change.
Lelia Green (2001, p. 3) argues that early representatives of this view perceived technology “as being outside society, . . . as neutral. It was as if technological progress and development were inevitable.” The assumption is that technology is created in a vacuum; technology itself determines how society uses it. Indeed, it is seen as society’s role to “adapt to (and benefit from) technological change” (Green, 2001, p. 2). Technological determinism still
pervades today’s discourses about technologies and their progressive potential for society (Wyatt, 2008).
A crucial, early piece of literature argued the opposite: that technology is imbued with its creators’ biases. This was Langdon Winner’s 1980 article, “Do Artifacts Have Politics?” He used the case of city planning in New York City to argue that the urban planner’s privileged and advantaged position led him to design a city less accessible to marginalised groups, including bridges under which public buses were unable to pass. Winner’s article contributed to the larger debate around technologies (i.e., “artifacts”) and whether social, political, economic, and cultural biases influence technology production and innovation.
Relevant for this chapter is the determinist argument that technology drives progress for all of society, including women. Donald MacKenzie and Judy Wajcman (1999 [1985]) contend that social circumstance, rather than technology itself, determine its adoption, use, and consequences. Lelia Green builds on these insights, arguing that armed forces, bureaucracies, and corporate power mainly determine technological progress. Development of technology “represents the priorities of the elites which sponsor it, rather than representing the society as a whole” (Green, 2001, p. 10).
Many observers highlight the overall positive potential for women in ICT. Debra Howcroft and Helen Richardson (2017) argue that women’s work in Information Technology Enabled Services (ITES) is often an opportunity to reduce inequities and provide economic autonomy. They outline three reasons for this optimism: this work can offer financial independence; ICT-enabled work is not always bound by time or location, which allows women flexibility for their care responsibilities; and the common association of the “information age” with teamwork rather than competition could translate to more women in executive positions (Howcroft & Richardson, 2017). The potential benefits nevertheless need to be viewed in the context of women’s lived experiences of technology, which are much more complex than technological determinism suggests.
RE-FRAMING WOMEN’S GENDERED EXPERIENCE OF THE FIELD OF TECHNOLOGY
Although women have long been living and working with technologies, their engagement with technology has often been framed as non-technical. Judy Wajcman’s influential book, Feminism Confronts Technology, investigates this bias around technology in the Global North, arguing that technological competence as commonly understood is interwoven with masculinity (Wajcman, 1991). Activities such as knitting, sewing, or gardening are assumed not to require technological competence (as holds true

Taking Stock: Data and Evidence on Gender Digital Equality PART TWO
315
for many other traditionally female skills). Moreover, when women gain knowledge of other technologies (cars, microwaves, washing machines), this use knowledge is not seen as technological competence — unlike the maintenance of these technologies, which is usually handled by men (Wacjman, 1991). Women’s engagement with technology is reframed as housework or regarded as requiring little expertise. The very definition of “working with or in technology” is imbued with gender.
Wacjman further argues that the process of displacing formerly “leading-edge” technology in favor of newer technology occurs precisely through feminisation and democratisation of that technology — e.g., as more and more women use microwave ovens. Thus, even when women adopt new technologies or ICT skills, these become less valuable in the process (Wajcman, 1991). A similar process is identified by Jennifer Light. She explains how the complex work of inventing a programming language for ENIAC, America’s first computer — work that is highly regarded today, as the “complex artful work of computer nerds” — was disregarded at the time as mere “feminised clerical labour” (Light, 1990, p. 455) and thus rendered invisible in popular perception.
Marie Hicks investigates the experience of women workers in computing in Britain in the 1950s–1970s. Hicks finds that stereotypes were used in advertisements and the media, downgrading women’s labour, which reinforced perceptions of their skilled, complex tasks as relatively unskilled and low-cost (Hicks, 2010, p. 6). She notes that these jobs of programming and data processing were later institutionalised as the field of computing professionals. “Both in image and reality, it was nearly impossible for women workers, in the aggregate, to shake the expectation that they were low- cost, high-turnover, and low-skill” (Hicks, 2010, p. 11).
Historically and today, women’s engagement with technology is routinely portrayed as requiring little technological expertise; women working in jobs requiring technical skill and qualifications are portrayed as unskilled and therefore low-cost labour. This phenomenon affects fields traditionally regarded as technological, such as STEM or ICT, and fields that have been redefined as technological by feminist theorists, such as sewing (with machines), agriculture, or housework.
In the global manufacturing industry, Elson and Pearson (1982) note that women are seen as naturally docile, disciplined, and predisposed to repetitious tasks. They argue that what is defined as “unskilled” work is often the work that is seen as socially appropriate for women, such as sewing. “Women do not do ‘unskilled’ jobs because they are the bearers of inferior labour; rather, the jobs they do are ‘unskilled’ because women enter them already determined as inferior bearers of labour” (Elson & Pearson, 1982, p. 94). Such feminised labour has continued to be associated with lower wages and flexibility in work
hours and employment. Analyzing economic growth in Asia, Stephanie Seguino (2000) argues that wage differentials reflect levels of discrimination against women. Martha Chen (2008) concludes, in her analysis of global poverty reduction programmes, that women are over-represented in lower-quality employment.
David Hesmondhalgh and Sarah Baker (2015) identify similar dynamics. They explore job segregation as a relative concept, with certain occupations being strongly associated with either women or men: while women mostly work in coordination, men occupy more prestigious, more creative, and more “technical” positions. Occupations become “feminised” with a growing concentration of women working in them (though not necessarily the majority). This process is linked to inequality in three critical ways: feminised occupations tend to pay less; job segregation hinders women in pursuing masculine occupations for which they are qualified; and it makes it more difficult for women to find an occupation that matches their talents (Hesmondhalgh & Baker, 2015). Overall, women in feminised industries tend to work less, be paid less, and report less job satisfaction.
Efforts to promote girls’ and women’s skill development need to go hand in hand with a broader reassessment of how women’s skills are commonly valued and regarded.
EXPERIENCES OF WOMEN’S WORK WITH DIGITAL TECHNOLOGYIn this section, we consider the experiences of women both in producing physical ICTs and software and in providing the intangible services that create content and data. Several characteristics of feminised labour remain relevant, with striking variations that call for context-specific analysis. We also question narratives about technologies that are based on the specific histories of the Global North: the overly positive portrayals of the potential of ICT often ignores how this technology is produced.
Melissa Gregg (2008) and Wendy Chun (2006) argue that the freedom of working in the global information economy offered to some women masks dangerous work that other women undertake in producing software and hardware — often, Asian and Asian American immigrant women workers. We therefore use a broader definition of work in or with ICT and STEM that incorporates this contradiction. We follow Christian Fuchs and Marisol Sandoval in defining digital workers as those involved in the production, circulation, and use of digital media (Fuchs and Sandoval 2014). Fuchs illustrates the diffusion of the digital production process, encompassing mineral extraction, manufacturing and assemblage, and software engineering, but also including the work of

Taking Stock: Data and Evidence on Gender Digital Equality PART TWO
316
cell centers and internet “prosumers” (Fuchs 2013). In this way, digital labour is understood as a process that is geographically situated and contingent on local and global power structures.
WOMEN IN ICT PRODUCTION AND PROGRAMMING
The examples below provide a global perspective on narratives about women and technology. To quote Ulf Mellström, this section seeks to question “the notion that an all-encompassing masculine culture of science and engineering transcends time and space” (2009, p. 903). We show that, contrary to narratives in the Global North, women are in fact very actively involved in technology production.
Masculine and hyper-masculine spaces in technology are well documented. Fox and Tang chronicle women’s toxic experiences of online gaming (2016), and Marie Hicks has written about brogramming culture in Silicon Valley (2013). The view of technology as a masculine field conceals not only women’s contributions but also global realities. Nevertheless, this assumption is often cited to explain why women may not choose to pursue computer science, in the Global North and in other contexts.
Other authors point to different experiences in the Global South, where computer science spaces are not considered masculine, but where working conditions still may be less than ideal (Gupta, 2015; Mellstrom, 2009; Lagesen, 2008; Wajcman & Anh Pham Lobb, 2007; Saloma-Akpedonu, 2005). Namrata Gupta questions the universality of the Western experience of gender and technology, arguing that the local context has a large role in shaping the relationship between gender and technology. In India, the large number of women in tech is due to its “women-friendly” image, based on gendered assumptions regarding the field — including that it is “safe” for women (Gupta, 2015).
While opportunities for women have increased, Gupta argues that women’s presence should not be interpreted as a “radical revolution in gender relations in society”; sexist assumptions and gendered job segregation continue (Gupta, 2015, p. 661). Hiring in these sectors still carries assumptions of care work and domestic responsibilities, and careerism is frowned upon. Further, women in the tech sector are concentrated in routine jobs that require technical skills but not expertise (Mitter & Sen, 2000, cited in Gupta, 2015). Other research suggests that women’s professional lives working in tech fields tend to be short, ending abruptly after marriage (Toyama et al., 2018).
Perceptions of gender and computing in Malaysia also contradict the masculine image described in Western contexts. Vivian Anette Lagesen explores perceptions of Malaysian women computer science students,
describing a “coproduction of gender and computer science that appears different, more complex, and less stereotypical than implicated by the main body of Western research” (Lagesen, 2008, p. 22). Computing was not considered masculine, although gendered assumptions of the nature of women still prescribed specific activities. Software engineering and programming were seen as “theoretical”, suited to women, in contrast to electronics and mechanical engineering which were considered “physical” and better suited for men (Lagesen, 2008).
Also in Malaysia, Ulf Mellström (2009) similarly questions notions of a global masculine culture around science and engineering, favoring an intersectional approach that considers race, class, and age as well as the conceptualisation of masculinity and femininity across cultures. Mallström argues that in the Malaysian context, class and race inequalities may be as pertinent as gender. Women make up higher percentages of both students and professionals in computer science and IT; and, in contrast to many other places, several women are found in executive positions (Mellström 2009). Gender assumptions here as well posit indoor work as suitable for women. Nonetheless, women are also found in different types of work: “On the one hand, there is low-skilled technology employment, consistent with the image of the ‘nimble-fingered’ docile female worker, and on the other there is the female professional IT worker and academic” (Mellström, 2009, p. 896). He traces the current feminisation of labour to deliberate recruiting of rural women for work in the early electronics industrial sector. The history of women’s integration into the sector continues into their present low status. Czarina Saloma-Akpedonu’s research on gender in the ICT industry in the Philippines points to the importance of the history of the field. As the sector developed it included systems analysis as part of software development, which required a business background. Accordingly, Saloma-Akpedonu argues, women’s presence in certain ICT fields did not result in the devaluation of their labour. In this instance, the soft skills that are associated with women were not devalued, as the ICT field in the Philippines valued these skills as a core part of the industry.
In Vietnam, very differently, gender segregation in the software workforce has been shown to be significant, with systemic undervaluation of women’s work. In production, women are concentrated in the testing phase, while men work in the specification and design phases — despite the strong link and overlap between the two phases. Indeed, women testers often “need to write another software programme to test a software programme” (Wajcman & Ahn Pham Lobb, 2007, p. 21). No gendered gaps in qualifications or experience were noted. This reinforces Wajcman’s earlier argument that perceived skills can be based on ideologies and social constructs of gender, rather than on actual technical capacities (Wajcman, 1991). Wajcman and Anh Pham Lobb’s study notes the contrast with Saloma- Akpedonu’s work on the

Taking Stock: Data and Evidence on Gender Digital Equality PART TWO
317
Philippines, arguing that that analysis is based on a differential skill set between women and men.
Melissa Gregg analyses “creative” information jobs in Australia and finds that most are advertised as flexible, with the opportunity to balance work and home responsibilities. She argues that they disguise both a long history of women’s unrecognised labour in the home, and the flexible labour that “other” women around the world contribute (Gregg, 2008). Brooke Erin Duffy and Becca Schwartz explore the feminisation of social media employment, where advertisements construct features of sociability, emotional management, and flexibility. “This catalogue of traits presents an archetype of a worker who is sociable, emotive, and flexible — features we attribute to the social media profession’s ostensible feminisation” (Duffy & Schwartz, 2017, p. 7, emphasis in original).
Rosalind Gill surveys the new media sector in six countries in Europe. She argues that despite its image as “cool, non-hierarchical and egalitarian”, gendered inequality persists (Gill, 2002, p. 70). Women tend to work on fewer projects, becoming de facto part-time workers who are more likely to work from home. These findings echo many of the traits of feminised work as undervalued. Other experiences elsewhere echo feminisation to different degrees and in different ways.
The literature challenges a Western-centric view and emphasises that gendered assumptions of work play out differently under varying contexts. Invariably, undervalued work leads to pay gaps, lack of retention, and low advancement in careers for women. Even when working conditions do not reflect these disadvantages, gendered assumptions can be inhibiting for those who do not “fit in”. Mellström (2009, p. 902) concludes that both “gender and technology studies need to pay more attention to culturally situated analyses that bring local gender discourses into the picture”. Recommendations moving forward must consider specific context and be prepared to accept a wide range of realities, gender constructs, and experiences. Overall, research needs to move towards considering technologies as fluid and historically situated.
ONLINE ACTIVITIES AS WORK
It has become a widely shared insight that the business model of many large internet-based companies, such as Google or Facebook, is to either sell (and resell) user data or to monetise it through data analysis (Jarrett, 2016; Fuchs, 2013; Lessig, 2002; Fisher, 2016; Gurumurthy & Chami, 2016; Abreu, 2014; Jarrett & Wittkower, 2016). With the recent buzz around machine learning and artificial intelligence, data has become one of the most valued commodities in the digital economy (Ibarra et al., 2018). Researchers have begun analyzing this phenomenon from a labour perspective, investigating different ways to
conceptualise the relationships between companies, people, their online activities, and the resulting data.
Christian Fuchs’s extensive work (2008; 2011; 2014a; 2014b) has been extremely influential, constituting what Jarrett and Wittkower (2016) have called an “‘economic turn’ in Internet research”. Building on Dallas Smythe’s (1977; 1981) discussion of the “audience commodity” in media studies, Fuchs argues that in the business model of selling data to advertisers, the key product, or commodity, is data produced — that is, created — by users. “Commodities have producers who create them, otherwise they cannot exist. So, if the commodity of internet platforms is user data, then the process of creating this data must be considered to be value-generating labour” (Fuchs, 2013, pp. 19-20).
Fuchs builds on feminist literature on domestic and affective labour, comparing this data production to housework (Fuchs, 2013). Feminist theory has been seminal in arguing that housework is in fact labour (Mies, 1986). Fuchs uses those insights to draw comparisons with digital labour: both have “no wages”; they predominantly take place “during spare time”; they have no labour unions and are “difficult to perceive as being labour”; and, much like housework, which is coerced by affective relationships within the family, the monopolised status of social media platforms subtly coerces people to participate (Fuchs, 2013, p. 20). This literature again illustrates that women’s engagement with technology is not regarded as such.
Kylie Jarrett points out that using the framework of work might imply that the online “labourer” is someone “who is directly and knowingly employed by the exhibitor” (Jarrett 2016, p. 2). Today’s internet users experience their online activities as pleasure and not work. Conversely, she observes, “even the repetitive, physical, menial chores of housework are often driven by, or serve as expressions of, the immaterial values of care-work. This work also produces immaterial products such as health, dispositions or esteem” (Jarrett, 2016, p. 3). Both domestic and online labour, and women’s work in technology sectors overall, are often undervalued and unpaid, while their contributions to the economic system are crucial (Jarrett, 2016). In the field of economics, Ibarra et al. examine the consequences of the online “culture of ‘free’” — where users neither pay for the services they receive nor are paid for the contributions they make. They point to the consequences: “the lack of targeting of incentives undermines market principles of evaluation, skews distribution of financial returns from the data economy and stops users from developing themselves into ‘first-class digital citizens’” (Ibarra et al., 2018, p. 1). They seek to balance the potential of the digital economy, as a source of innovation and benefits, with people’s concerns over privacy and fears of being replaced by automation. Their solution is that data should be considered labour, and they call for a “fair
Taking Stock: Data and Evidence on Gender Digital Equality PART TWO
318
and vibrant market for data labour” (Ibarra et al., 2018, p. 3). That argument goes against most social science analysis, which criticise the commodification of data and the exploitation of invisible work. Moreover, details are lacking on the frameworks that need to be in place to ensure such a data labour market would be fair. This could prove especially difficult, keeping in mind the needs of groups marginalised based on gender, race, or class, and the contrasting situation of countries in the Global North and South.
Anita Gurumurthy and Nandini Chami have provided an attempt to answer these important questions, asking, “How must feminism take on the challenge of a datafied world?” They point out how people’s online “immaterial labour” — often, acts of caring and expressions of connection — are captured in behavioural data sets and then monetised by companies. But they add that this “datafication”, and the connectivity it produces in the sharing economy, obfuscates the production of technology and data, which often takes place in the Global South (Gurumurthy & Chami, 2016). In order to counteract the skewed power dynamics between data producers and users, they support the solution of a “data commons”, but they warn that “it must correspond to the hope and outrage of the most marginalised women and gender minorities, bringing data to the service of a new civic intelligence that privileges their autonomy and self-determination in all spheres of life” (Gurumurthy & Chami, 2016).
If online activities can be understood as work, this work is often immaterial, undervalued, invisible, and regarded as unskilled. More research on the gendered dimensions of data production as work is needed, to point to collective models for using data that do not devalue its producers.
CONCLUSION AND RECOMMENDATIONS
While technology can hold positive consequences for some women, for other women — especially women of color, women in the Global South, and other marginalised women — this experience is different. Similarly, in the Global North, technology is constructed as a masculine domain, while in much of the Global South, women predominantly work in technology but often in harsh conditions of technology production. Nevertheless, in many (or most) countries, women’s work in and with technologies is rendered invisible and regarded as unskilled, or their technical skills are explained away through gendered perceptions. Finally, research framing a broader definition of work conceptualises online activities as labour.
It is crucial to provide further and more detailed research on the experiences of women (and other marginalised groups) outside the Global North, to avoid further deepening existing gender gaps. While asking how women and marginalised groups can be introduced to ICT, we also need to investigate the ways in which their valuable contributions to ICT, technology, and the digital economy are often rendered invisible or overlooked.
Three recommendations are central to make the current research agenda more inclusive.
1. Further detailed research is needed on documenting the experiences of women working with technology in different contexts. Studies should pay close attention to intersectional approaches accounting for gender, class, race, and age.
3. More case studies on experiences from the Global South should be undertaken, for a better understanding of how women’s work with technology becomes defined as feminised labour.
4. Research on online data-producing activities should be guided by principles of intersectional feminist approaches, to identify which groups are more at risk and which groups have the means to protect their rights or participate in market-based approaches.
5. Research should not only focus on trying to increase women’s access to technology but on understanding and highlighting women’s existing contributions to technology, in their many shapes and forms.
REFERENCES
Abreu, A. (2014). Quantify everything: A dream of a feminist data future. Model View Culture, February 24. Retrieved from: https://modelviewculture.com/pieces/quantify-everything-a-dream-of-a-feminist-data-future
boyd, d. (2014). It’s complicated: The social lives of networked teens. New Haven, CT: Yale University Press.
Chen, M. (2009). Informality and social protection: Theories and realities. IDS Bulletin, 39(2), 18-27. Retrieved from: https://doi.org/10.1111/j.1759-5436.2008.tb00441.x
Chun, W.H.K. (2006). Control and freedom: Power and paranoia in the age of fiber optics. Cambridge, MA and London, UK: MIT Press.
Duffy, B.E. & Schwartz, B. (2017). Digital “women’s work?”: Job recruitment ads and the feminization of social media employment. New Media and Society (November), 1-18.

Taking Stock: Data and Evidence on Gender Digital Equality PART TWO
319
Elson, D. & Ruth P. (1982). “Nimble fingers make cheap workers”: An analysis of women’s employment in third world export manufacturing. Feminist Review, 7, 87-107. Retrieved from: https://doi.org/10.2307/1394761
Fisher, E. (2016). How less alienation creates more exploitation? Audience labour on social network sites. In: Fuchs, C., & Mosco, V. (Eds.), Marx in the Age of Digital Capitalism (180-200). Leiden and Boston: Brill.
Fox, J. & Tang, W.Y. (2016). Women’s experiences with general and sexual harassment in online video games: Rumination, organizational responsiveness, withdrawal, and coping strategies. New Media and Society, 18(8), 1290-1307. Retrieved from: https://doi.org/10.1177/1461444816635778
Fuchs, C. (2008). Internet and society: Social theory in the information age. London: Routledge.
Fuchs, C. (2011). Web 2.0, prosumption and surveillance. Surveillance & Society, 8(3), 288–309. Retrieved from: http://ojs.library.queensu.ca/index.php/surveillance-and-society/article/view/4165
Fuchs, C. (2013). Theorizing and analyzing digital labor: From global value chains to modes of production. The Political Economy of Communication, 2(1), 3-27.
Fuchs, C., & Sandoval, M. (2014). Digital workers of the world unite! A framework for critically theorizing and analyzing digital labor. TripleC, 12(2), 486-563.
Fuchs, C. (2014a). Social media: A critical introduction. London: Sage.
Fuchs, C. (2014b). Digital Labour and Karl Marx. New York: Routledge.
Gómez-Peña, G. (1997). The virtual barrio @ the other frontier. Haus der Kulturen. Retrieved from: http://archiv.hkw.de/forum/forum1/doc/text/e-gompen.html
Green, L. (2001). Technoculture: From alphabet to cybersex. Crows Nest: Allen & Unwin.
Gregg, M. (2008). The normalization of flexible female labor in the information economy. Feminist Media Studies, 8(3), 285-299.
Gurumurthy, A. & Chami, N. (2016). Data: The new four-letter word for feminism. GenderIT.Org, May 31. Retrieved from: https://www.genderit.org/articles/data-new-four-letter-word-feminism
Gupta, N. (2015). Rethinking the relationship between gender and technology: A study of the Indian example. Work, Employment and Society, 29(4), 661-627.
Hesmondhalgh, D. & Baker, S. (2015). Sex, gender and work segregation in the cultural industries. The Sociological Review, 63(S1), 23–36.
Hicks, M. (2010). Only the clothes changed: Women operators in british computing and advertising, 1950-1970. IEEE Annals of the History of Computing, 32(2), 11. Retrieved from: https://doi.org/10.1109/MAHC.2010.55
Hicks, M. (2013). De-brogramming the history of computing. IEEE Annals of the History of Computing 35(1), 88. Retrieved from: https://doi.org/10.1109/MAHC.2013.3
Howcroft, D. & Richardson, H. (2017). A gendered analysis of IT-enabled service work in the global economy. In: Peterson, H. (Ed.), Gender in transnational knowledge work (11-30). Switzerland: Springer.
Ibarra, I.A., Goff, L., Hernandez, D.J., Lanier, J., & Weyl, E.G. (2018). Should we treat data as labor? Moving beyond “free”. American Economic Association Papers & Proceedings 1(1), 1-5.
Jarrett, K. (2016). Feminism, labour and digital media: The digital housewife. New York and London: Routledge.
Jarrett, K., & Wittkower, D.E. (2016). Economies of the Internet. First Monday, 21(10). Retrieved from: http://firstmonday.org/ojs/index.php/fm/article/view/6939/5624#author
Lagesen, V.A. (2008). A cyberfeminist utopia? Perceptions of gender and computer science among Malaysian women computer science students and faculty. Science, Technology, and Human Values, 33(1), 5-27. Lessig, L. (2002). Privacy as property. Social Research, 11(1), 247-269.
Light, J.S. (1990). When computers were women. Technology and Culture, 40(3), 455-483. Retrieved from: http://www.jstor.org/stable/25147356
MacKenzie, D. & Wajcman, J. (Eds.). (1999). The social shaping of technology: How the refrigerator got its hum. Buckingham, UK: Open University Press.
Mellström, U. (2009). The intersection of gender, race and cultural boundaries, or why is computer science in Malaysia dominated by women? Social Studies of Science, 39(6), 885-907.
Mies, M. (1986). Patriarchy and accumulation on a world scale. London: Zed Books.
Qiu, J. (2009). Working-class network society: Communication technology and the information have-less in urban China. Cambridge, MA and London, UK: The MIT Press.
Rosalind G. (2002). Cool, creative and egalitarian? Exploring gender in project-based new media work in Europe. Information, Communication and Society, 5(1), 70-89.

Taking Stock: Data and Evidence on Gender Digital Equality PART TWO
320
Saloma-Akpedonu, C. (2005). Female spaces in the Philippines’ ICT industry. In: Ng, C. & Mitter, S. (Eds.), Gender and the digital economy: Perspectives from the developing world (29-53). New Delhi: Sage Publications.
Seguino, S. (2000). Accounting for Asian economic growth: Adding gender to the equation. Feminist Economics, 3(1), 27-58.
Smythe, D. W. (1977). Communications: Blindspot of western Marxism. Canadian Journal of Political and Social Theory, 1(3), 1–27.
Smythe, D. W. (1981). Dependency road: Communications, capitalism, consciousness, and Canada. Norwood, NJ: Ablex.
Wajcman, J. & Lobb. L.A.P. (2007). The Gender Relations of Software Work in Vietnam. Gender, Technology and Development, 11(1), 1-26. DOI: 10.1177/097185240601100101
Wajcman, J. (1991). Feminism confronts technology. University Park: The Pennsylvania State University Press.
Wajcman, J. (2008). The feminization of work in the information age. In: Johnson, D.G. & Wetmore, J.M. (Eds.), Technology and society: Building our sociotechnical future (459-475). Cambridge: MIT Press.
Winner, L. (1980). Do artifacts have politics? Daedalus, 109(1), 121-136.
Wyatt, S. (2008). Technological determinism is dead: Long live technological determinism. In: Hackett, E.J., Amsterdmaska, O., Lynch, M, & Wajcman, J. (Eds.), The handbook of science and technology studies (165-180). Cambridge and London: MIT Press.

Taking Stock: Data and Evidence on Gender Digital Equality PART TWO
321
322
A GENDER PERSPECTIVE ON TECHNOLOGY TRANSFER AND WEALTH CREATION
11
AUTHOR: DR LILIAN VOLCAN (UNIVERSITY OF OXFORD, INTERNATIONAL GENDER STUDIES CENTER)

Taking Stock: Data and Evidence on Gender Digital Equality PART TWO
323
ABSTRACT
More than 40% of the world’s population now has access to the internet, with new users coming online every day, while today the poorest households are more likely to have access to mobile phones than to toilets or clean water. In spite of these advances in technology, many are left behind from the wealth creation spurred by new technologies in the innovation economy. A new wave of innovation has the potential to give women a unique opportunity to reap the advantages of wealth creation from the digitised economy, to leverage women’s potential for technical innovation and to create new female ecosystems linking science, start-ups, and industry. Alternatively — as seen in the gender digital divide more broadly — this new wave of innovation could leave female inventors behind. “Technology transfer” refers to the process of developing and commercialising innovations, as typically reflected in intellectual property rights, patents, and copyrights. Supporting girls’ digital literacy through the entire educational spectrum of science, technology, engineering, and mathematics (STEM), including participation in research and development and ultimately technology transfer, is a long-term investment that could potentially result in an exponential increase of wealth creation for women. This chapter examines the current patent shortage among women, and explores how social innovation and support from NGOs and global development organisations can work to make tech-transfer more gender inclusive. We need to be as ambitious in support of gender equity in technology transfer as in STEM education and workforce development.
KEY FINDINGS
• Women with STEM degrees are only slightly more likely to patent an innovation than women who lack them.
• The most significant determinant in the gender gap in technology transfer is women’s underrepresentation in patent-intensive fields (especially electrical and mechanical engineering), and in patent-intensive jobs (especially development and design).
• The lack of gender-disaggregated data for technology transfer (such as patents and copyrights) reflects the absence of any global organisation to track trends in gender balance in tech transfer.
• Virtually all indicators related to gender balance in the World Intellectual Property Organisation Patent Cooperation Treaty (PCT) or patent system show some degree of progress toward gender parity in recent decades.
• Based on current rates of progress, gender balance in patenting would not occur until 2070.
INTRODUCTION
Technology transfer (tech-transfer, or TT) represents the successful transformation of good research into good business, according to Alunni (2019), as well as the formal and informal movement of know-how, skills, technical knowledge, or technology from one organisational setting to another (Roessner, 2000). Both sources point to the importance of tech-transfer in aligning stakeholders to support researchers/inventors in the daunting project of moving a protected idea (i.e., intellectual property) successfully into the market. TT has become central in university research, and it presents challenges and opportunities — both for individual inventors and for efforts to address old and new problems.
A successful TT process needs four essential elements: 1) strong research to generate a sound IP portfolio; 2) a dedicated supportive Technology Transfer Office (TTO), as a meeting point of science and business; 3) a team of highly skilled Technology Transfer Managers (TTMs) who understand the languages of science and business; and 4) an entrepreneurial ecosystem capable of absorbing innovation and providing ancillary services (Sharma, Kumar, & Lalande, 2006). Additionally, these resources must be available at the right level and must be managed efficiently. Experts of the field proclaim that human progress is manifested and occurs through use of technology and that without technological progress there would be no economic development. However, as Jacobsen (2011) observes, while human progress cannot occur without technological innovation and diffusion, it is unlikely that technology affects all groups and genders equally.
WHY IS TECHNOLOGY TRANSFER IMPORTANT FOR GENDER INEQUALITY?
As technological innovation and diffusion accelerate, little attention has been paid to the potential social impact of equality for technology transfer and wealth creation. One of the main challenges in the complex process of commercialising intellectual property (IP), according to EUIPO, is that the great majority of ideas (whether protected or not) never make it to the marketplace (Campinos, 2018). Experts on feminism and technology point to the scant proportion of women obtaining patents globally, which is even less than the already small proportion of women in the field of STEM (Rosser, 2009).
The question of gender in technology transfer can thus be usefully addressed on two levels: How does technology transfer work in practice? And how are women either involved in or excluded from

Taking Stock: Data and Evidence on Gender Digital Equality PART TWO
324
the process? Literature on technology transfer and innovation can shed light on how prominent centres of research (as well as leading intellectual property bodies) attract women innovators and how existing mechanisms affect women’s involvement or exclusion in technology transfer.
Some researchers point to a lack of diversity in the process of developing new technologies, and to the lack of commitment by prominent research centers to attract women inventors. Only 15% of patents are filed by women (Jensen, Kovacs, & Sorenson, 2018). Others point to gaps in relevant skills and impact funding at the early stages of proof-of-concept, prototyping, and demonstration (Alunni, 2019).
Missing in the literature is a critical analysis of technology transfer in terms of gender. While feminists have questioned the implications of the low percentage of women in STEM for our understanding of gender in innovation (Schiebinger, 2008), there is less work on the gendered implications of current technology transfer implementation (Phan & Siegel, 2006), although the issue of implicit bias in technology transfer has long been recognised. Writing over 30 years ago, radical feminists and ecofeminists initiated a critique of the inherently patriarchal nature of technology, and of technoscience more generally, questioning “best practices” that themselves may be flawed (Oakley, 1974; Cockburn, 1983; Corea et al., 1985; Kramarae et al., 1988; Wajcman (1991) as cited by Bray, 2007).
KEY CONCEPTS: HOW DO TT AND GENDER INTERCONNECT?
The development of technology draws upon many fields of knowledge — scientific, engineering, mathematical, linguistic, and historical — to achieve some practical result (Pacey, 1992). Technology transfer is not a novel concept: it can be defined as an emerging process going back to the mechanical age (Bessant & Rush, 1995). Nevertheless, it would take many centuries after the first patent legislation in Venice in 1474 (Penrose & Zamora, 1974) for European and U.S. universities to begin to bring new inventions to society. With the enactment of the Bayh Dole Act in 1980, U.S. universities started to patent and license scientific discoveries. Since then, technology transfer has evolved to become a political and corporate mantra, promising significant change based on both better and more technology (Slaughter & Leslie, 1997).
The goal of technology transfer is to take sound scientific ideas to the market successfully (Bercovitz & Feldman, 2006). It is important to understand how technology transfer works in practice, to help women inventors protect their scientific ideas and increase their participation in the process.
Two complementary aspects are critical in increasing the role of women in the development of new technologies. First, university policies need to attract, support, and reward women inventors. Second, the barriers need to be addressed that may prevent female inventors from commercialising their scientific ideas or inhibit their professional advancement. If female inventors are accorded unbiased support to protect and prototype their scientific ideas, technology transfer will play a part in increasing gender equality.
Young (2007, p. 545) posits that “technology transfer does not just happen”. Transferring knowledge and innovation from a public research organisation to the private sector for commercial application and public benefit requires a formal mechanism — a technology transfer office (TTO) — to help inventors protect and license intellectual property. In order to promote inclusive innovation, this mechanism must be unbiased and committed to support men and women inventors equally, in each stage of the process (Siegel, Veugelers, & Wright, 2007).
The rapidly changing landscape of innovation requires a major effort to equip female participants (scientists, engineers, researchers) with the necessary resources (such as TTOs, incubators, accelerators, and service providers) to ensure their success. Moreover, women need not only training and qualifications to shape the right skills, but also accessible mechanisms for funding in the crucial proof-of-concept and demonstration phases (Etzkowitz & Goktepe-Hulten, 2009). The traditional activities of technology transfer offices (TTOs) include identifying promising research results from the university setting and transferring them to market agents. A TTO depends on access to an active university and researchers, industrial absorptive capacity, and investors. TTOs serve effectively, bridging these three factors, only when they are able to provide the missing pieces in the technology transfer process. A passive TTO may fail in the mission to promote technology transfer.
Advanced TTOs are mainly attached to more entrepreneurial universities in high-income countries; they offer effective support to researchers, inventors, and entrepreneurs by taking a proactive role to help them to cross the “valleys of death” in the process of starting a new venture. World-class TTOs normally offer ten standard support services: invention disclosure, invention assessment, idea protection, proof of concept, IP commercialisation, start-up formation, licensing to existing business partners, legal support, commercialisation after licensing, and licensing revenue distribution (Debackere & Veugelers, 2005). This expensive and time-consuming process has become a high priority on university policy agendas, as the key to effective technology transfer mechanisms.

Taking Stock: Data and Evidence on Gender Digital Equality PART TWO
325
IS TECHNOLOGY TRANSFER GENDER-NEUTRAL?
For many people, technology transfer has no implication for gender, suggesting that TT is therefore gender-neutral. In fact, gender-based disparities have been found in many areas of technology transfer, though the mechanisms are often still little known.
Successful women professionals, in science, technology, and allied fields, tend to refer to meritocratic ideologies rather than structural factors to explain inequality (Cech & Blair-Loy, 2010). Business education experts are likely to invoke deficiencies in women’s human capital or motivation, even though systematic structural obstacles (such as glass ceilings) are widely considered the main cause of gender inequality in science and technology (Tan, 2008).
One source of structural bias lies in unequal access to university support. In emerging science and technology-related areas, women’s participation, advancement, and recognition often seem to suffer from the same discriminatory gender patterns identified elsewhere in academia (Etzkowitz, Kemelgor, and Uzzi, 2000). The Women Inventors Committee of the Association of University Technology Managers’ (AUTM) states that the professionals working across continents to facilitate technology transfer all share one common challenge: a lack of women’s participation in several aspects of the process (WIC, 2018). The Association attributes this gap to the lack of university commitment to educate female university scientists about the impediments and barriers women face when attempting to become inventors and entrepreneurs. The report suggests action steps toward the goal of including more women scientists and engineers in successful technology transfer and business creation.
In the university environment, there are no explicit rules that position men and women inventors differently. The slow progress toward gender equality nevertheless reflects obvious discrimination and invisible barriers built into male-gendered systems (Ranga & Etzkowitz, 2010). For example, discrimination against women scientists, researchers, innovators or entrepreneurs occurs when — by default — men are over-ascribed for performing traditional female roles and women are under-credited for performing traditional male roles. Ranga and Etzkowitz also observe that most efforts for gender equality tend to focus on women’s recruitment rather than retention and advancement, reflecting false expectations that upward movement would take care of itself once entry was assured. It comes as no surprise that disproportionate numbers of women remain in low-level positions in academia, even after many years of contributions. Handelsman et al. (2005) suggest that universities are failing to take advantage of an available resource, noting that the presence of women scientists in a particular field determines the proportion of women in faculty positions, and that
this ratio lags far behind the proportion of Ph.D.s granted to women. They identify, as reasons for this disparity, the impediments to recruitment, retention, and advancement of outstanding women scientists. Similarly, AUTM suggests that many of these barriers reflect unconscious bias by all involved in the system, including the women faculty members themselves; the Association seeks to educate female inventors and relevant institutions to address these goals. It further recommends empowering more women to take leadership roles in all stages of transferring new discoveries to the market (WIC, 2018).
Several mechanisms have enhanced women’s involvement in TT. In 2011, MIT instituted an awards programme called ADVANCE, at a funding level of $19 million, to support efforts by institutions and individuals to empower women to participate fully in science and technology. The Institute cited an “increasing recognition that the lack of women’s full participation at the senior level of academe is often a systemic consequence of academic culture” (Rosser, 2003, p. 6). This programme led to a common statement by nine U.S. research universities, recognising that institutional barriers have prevented women scientists and engineers from having a level playing field in their professions; the signatories were the California Institute of Technology; MIT; Harvard, Princeton, Stanford, and Yale universities; and the universities of Michigan, Pennsylvania, and California, Berkeley.
Many of the studies of technology transfer processes and implications focus mainly on the prominent research centres in high-income countries (such as Harvard and MIT in the U.S., Oxford and Cambridge in the UK, and institutes in Japan, South Korea, Israel, and others). Research is badly needed to examine the global implications of boosting women’s participation in wealth creation through research discoveries and knowledge transfer to industry.
A second source of gender bias arises from the structural constraints of the IP filing system, including how patents are obtained and maintained over time. Jensen, Kovács, and Sorenson (2018) analysed a recent IP filing bulk data release with the histories of 2.7 million patents issued in the U.S. between 2001 and 2014. Their analysis reveals how patent claims can be altered during the process of filing, depending on the gender of the inventors. Overall, women inventors’ patents were more likely to be rejected than those filed by teams of men; even when applications were granted, women’s patents progressed poorly and fewer were maintained, because they received fewer citations by other inventors and from patent examiners (Jensen, Kovács, & Sorenson, 2018). This helps explain why, although women earn roughly 50% of the doctoral degrees in science and engineering in the U.S., when it comes to patenting their inventions, they trail far behind men: only 10% of patent-holders are women. Even in the life sciences, where women earn more than half of new Ph.D.s, only 15% of inventors listed on patents are women.

Taking Stock: Data and Evidence on Gender Digital Equality PART TWO
326
Rosser (2009) argues that, if women scientists and engineers face difficulties in obtaining patents, then woman are not equal participants in the newest areas and of science and technology; they are unable to serve as leaders in their fields, and they lose opportunities to profit both financially and through professional advancement. Of course, commercialisation of science can be extremely lucrative, if the patent results in a product that is developed and brought to market successfully.Research is therefore in order to find ways to mask the applicant’s identity and gender. One potential solution would be to make the IP filing process more anonymous, for example by listing only the inventors’ initials; further exchanges between the applicants and the examiners could be restricted to a platform that ensures anonymity.
Creating an equal playing field in the patent process will not only benefit women. Technical progress is one of the primary drivers of economic growth, and it is boosted when inventors can lay legal claim to their innovations and profit from them, and when others can build on an existing patent. Increasing fairness in the patent system, and thus bringing more good inventions to realisation, has the potential to create wealth and promote economic development.
A third source of bias is embedded in the financial environment. Registering and protecting scientific ideas as intellectual property (IP) is an essential step toward marketing an invention, but it is only the beginning of the process. Regardless of their potential, many scientific ideas — up to 95% in the U.S. — never progress beyond this protection or patenting stage. Proof of concept (POC) is usually the next step toward marketing, allowing the inventor, as well as potential investors, to identify marketable value in a timely fashion. Funding for POC helps inventors to prototype the idea and show prospective clients a real version of the product, before commercialisation (Upton, 2010).
As useful as POC and prototyping can be, investors tend to be reluctant to fund prototyping ventures (Portilla, Evans, Eng, & Fadem, 2010) — a factor that also affects female inventors. In general, even though POC is vital to a successful tech-transfer process (Alunni, 2019), it is the least attractive phase to private finance, despite the small amounts required per project. Providing POC is therefore a difficult task for most technology transfer offices, especially on behalf of female inventors. Hill, Leitch, and Harrison (2006) show that women get a small fraction of the venture capital allocated to men; despite heightened attention to the problem, the newest data suggests the problem could be getting worse. Indeed, Bosse and Taylor (2012) suggest that a “glass ceiling” prevents women entrepreneurs and small business owners from accessing the financial capital they need, to start a new firm or fuel the growth of an existing small firm.
Moreover, embryonic scientific ideas usually need further development before they can be fully
protected as intellectual property in any form (by patents, copyright, etc.). This early process normally has costs, and although the amounts are not large, they may prevent women from advancing the idea to the POC phase. Universities and other innovation agencies could provide impact acceleration funds to support this essential step for women inventors. Significant research has been carried out through the U.S. government’s Small Business Innovation Research (SBIR) and Small Business Technology Transfer (STTR) programmes. All federal research and development (R&D) grants to technology ventures for the decade 2001–2011 were tracked by grantees’ demographic classification, to assess demographic patterns in successfully obtaining follow-on R&D grants. The study analysed 52,126 initial (Phase I) awards, granted by 11 federal agencies through SBIR/STTR, which might or might not be followed up with a Phase II award. Results showed a positive association between agency workforce diversity and Phase II funding for women Phase I grantees; however, minority and women technology entrepreneurs were less likely to receive Phase II funding than their non-minority and male counterparts. A preliminary conclusion indicates that the agencies that value workforce ethnic diversity were more likely to grant women technology entrepreneurs Phase II funding. Mollick and Robb (2016) observe that women with higher levels of education may increase their likelihood of obtaining funding, but they also argue that, in the initial “bootstrap” phase, utilising social capital may improve women’s chances.
Indeed, researchers and TTOs in high-income countries are already trying to address the problem of finance to advance more women’s scientific ideas to the market. In 1999, the Oxford University Innovation TTO set up early-stage funds for POC applications using a gender-unbiased funding mechanism, called the Oxford University Challenge Seed Fund (UCSF). It has provided funds of over £8.2 million across 150 projects from 200 applications — successfully using this unbiased mechanism to award similar levels of funding for projects led by male and female applicants (Alunni, 2019).
The advantages from such gender-friendly funding mechanisms go beyond generating value from tech-transfer; the potential benefits also include diversity for excellence, follow-up grants, industry-sponsored research, and an enhanced reputation, as well as broader educational experience through working relationships with female-led start-ups and SMEs (Cronin, Prakash & Mehta, 2015). Social inclusiveness becomes especially relevant for TTOs with a longer investment time horizon, to align with university vision and to promote growth through equal participation opportunities for male and female scientists.

Taking Stock: Data and Evidence on Gender Digital Equality PART TWO
327
CAN TT BENEFIT WOMEN?
Despite the role women play in job creation, economic growth, and society revitalisation, especially in economies undergoing fundamental transformations, women in entrepreneurship have not received adequate attention in academic research (Tan, 2007). As a result, our understanding of women’s opportunities in non-traditional industries is limited.
Broader innovation depends on a concerted effort to share skills, knowledge, technologies, and facilities, through gender-unbiased mechanisms, ensuring that novel ideas become accessible to a wider range of users in the form of new products, processes, applications, materials, and services. Research findings, skills, expertise, and technology must be transformed into repeatable processes, products, and programmes to fuel wealth creation and benefit consumers (Grosse, 1996).
A new wave of technical innovation will bring huge opportunities to women in global industry. Some refer to Industry 4.0, or “deep tech”, or (in Japan) Society 5.0. All envision a merging of physical and digital technologies that will fundamentally change most, if not all, industrial sectors. As suggested by Heeks (2008), the next innovation wave presents a unique opportunity for women in industry: to leverage women’s science and technology potential and to create new gender-friendly ecosystems comprising science, start-ups, and industry. For this next wave of innovation, women’s scientific strengths will be a huge asset.
Two social innovation projects illustrate this potential.
A civil engineer and her business partner from the Gaza Strip found a way to turn ash into bricks. These bricks are eco-friendly and affordable, and they use less cement than regular bricks. The innovation helped solve a local problem for thousands of people after losing their homes.
The GlamOre digital platform was created by graduate students at Oxford University, out of the belief that talent is equally distributed but opportunity is not. The platform gives women opportunities to work for international companies, by sourcing data projects for some of the world’s largest commodity companies. GlamOre is a pioneer in the field of impact sourcing — the practice of hiring people from the bottom of the pyramid to enter digital work, with the help of established professionals.
Innovations such as artificial intelligence, biotech, and two-dimensional materials all require cutting-edge science, based on “all-hands-on-deck” diversity. We need to be as ambitious in technology transfer as in teaching and research. This is in line with the increasing emphasis on supporting creativity, as part of the United Nations agenda for “smart, sustainable and inclusive growth” (Cooke & De Propris, 2011).
Gender biases in the technology transfer process have not received adequate attention by ancillary institutions, prompting proposals to create a Global Female Innovation Council (GFIC). The council would operate as a Global Technology Transfer Office, providing assistance to female inventors who are interested in presenting scientific ideas for IP filing or commercialisation. In addition, it would serve as a safe and confidential channel for advancing innovative ideas, without fear of IP theft — a major deterrent for new inventors.
To generate global wealth with strong female participation, it is necessary to foster education and inclusiveness across countries and continents. Innovation more than ever requires female talent, motivation, and new skills to generate valuable ideas to tackle global problems. Untapped female resources should be channelled in all ways possible between science and business to reach optimum social benefit (Ong, 2005).
RECOMMENDATIONS FOR POLICY MAKERS
Supporting gender inclusion in technology transfer cannot be achieved by the sole effort of universities (Rampersad, Plewa, & Troshani, 2012). Other stakeholders, such as venture capitalists, business angels, alumni, industrialists, and other professionals, should be engaged to identify and nurture gender inclusion in technology development.
A handful prominent universities have developed initiatives to attract women and reward institutions working to increase women’s involvement. However, most universities in both developed and developing countries still lack a well thought-out support programme (AUTM, 2018). More broadly, STEM fields in education need to become more inclusive of women.
There is a need to create more gender-diverse networks to pool talents, knowledge, money, and ideas. Professional women can be encouraged to develop networks around tech-transfer management, as a high-value profession for female scientists. Addressing the gender gap in decision-making positions may require a new generation of female technology transfer managers (TTMs) with business school background. These new leaders may help to build consensus to establish a Global Female Innovation Council (GFIC) and to build trust in women’s potential role in technology transfer.
To get more women involved in the process of technology transfer at every level — from idea generation, through research and discovery, to patenting and licensing to new or established companies — these ideas should be considered:

Taking Stock: Data and Evidence on Gender Digital Equality PART TWO
328
• Women in tech can be socialised in TT via classroom learning, e-learning tutorials, and training workshops, reinforced with internships and mentoring to help them build working relationships and career prospects.
• Women’s qualifications can include socialisation into different cultures (academic or business) and learning through experience.
• Women participating in the technology transfer process need a fuller understanding of the challenges in the IP filing process; they may need to campaign for better support to neutralise existing barriers.
• Universities should encourage and support promising female innovators to share their ideas, and help to mitigate the risk involved — particularly if they are radically innovative and have the potential to scale internationally.
o Initiatives to encourage idea-sharing include informative campaigns, summer workshops, mentorship, and networking.
o Trainings can use open data to allow those giving and receiving training to share information on policies and procedures and suggest improvements.
• An idea conceived at the first EUIPO workshop on technology transfer (2018) is to create a clearinghouse, specifically to identify and track female talent.
• Dedicated government policies are needed to encourage unbiased financing schemes to incubate female-driven technologies before venture capital firms and other investors become interested.
o Provide impact finance to support ideas presented in scientific papers or early IP filings, to facilitate women’s engagement in the TT process.
o Universities and other innovation agencies could provide impact acceleration funds to support prototype development by women inventors.
o Conduct research on the constraints that disproportionately affect women in attracting private sector funding for the POC process.o Focus on start-ups and small and medium enterprises (SMEs), strengthening the tech-transfer scientific ecosystem where the greatest potential for female breakthrough innovation lies.
REFERENCES
Alunni. (2018). Proof of Concept funding (POC) in technology transfer: The successful case of Oxford University Innovation (OUI). Perugia, Italy: Universita’ degli Studi.
AUTM Women Inventors Committee. (2018). Retrieved from: https://autm.net/autm-info/leadership/committees/women-inventors-committee/
Bercovitz, J., & Feldman, M. (2006). Entrepreneurial universities and technology transfer: A conceptual framework for understanding knowledge-based economic development. The Journal of Technology Transfer, 31(1), 175-188.
Best, K., Sinell, A., Heidingsfelder, M. L., & Schraudner, M. (2016). The gender dimension in knowledge and technology transfer. European Journal of Innovation Management, 19(1), 2-25.
Bessant, J., & Rush, H. (1995). Building bridges for innovation: The role of consultants in technology transfer. Research policy, 24(1), 97-114.
Bosse, D. A., & Taylor III, P. L. (2012). The second glass ceiling impedes women entrepreneurs. Journal of Applied Management and Entrepreneurship, 17(1), 52.
Bray, F. (2007). Gender and technology. Annual Review of Anthropology, 36, 37-53.
Campinos, A. (2018). Speech at the 1st EUIPO Tech-transfer Workshop. Alicante, Spain.
Cech, E. A., & Blair-Loy, M. (2010). Perceiving glass ceilings? Meritocratic versus structural explanations of gender inequality among women in science and technology. Social Problems, 57(3), 371-397.
Cooke, P., & De Propris, L. (2011). A policy agenda for EU smart growth: The role of creative and cultural industries. Policy Studies, 32(4), 365-375.
Cronin, A. A., Prakash, A., & Mehta, P. K. (2015). Conclusions and way forward. In: Gender issues in water and sanitation programmes: Lessons from India, 287.
Debackere, K., & Veugelers, R. (2005). The role of academic technology transfer organizations in improving industry science links. Research Policy, 34(3), 321-342.
Etzkowitz, H., & Goktepe-Hulten, D. (2009). Maybe they can? University technology transfer offices as regional growth engines. International Journal of Technology Transfer and Commercialisation, 9(1-2), 166-181.

Taking Stock: Data and Evidence on Gender Digital Equality PART TWO
329
Etzkowitz, H., Kemelgor, C., & Uzzi, B. (2000). Athena unbound: The advancement of women in science and technology. Cambridge University Press.
Grosse, R. (1996). International technology transfer in services. Journal of International Business Studies, 27(4), 781-800.
Handelsman, J., Cantor, N., Carnes, M., Denton, D., Fine, E., Grosz, B., & Sheridan, J. (2005). More women in science. Science, 309(5738), 1190-1191.
Heeks, R. (2008). ICT4D 2.0: The next phase of applying ICT for international development. Computer, 41(6).
Hill, F. M., Leitch, C. M., & Harrison, R. T. (2006). “Desperately seeking finance?” The demand for finance by women-owned and-led businesses. Venture Capital, 8(02), 159-182.
ISIS Innovation Report. (2010). “Tech-transfer”: definition by Cooksey. Oxford University challenge seed fund 10 year report 1999-2009 (p.1). Oxford: Oxford University.
Jacobsen, J. P. (2011). The role of technological change in increasing gender equity with a focus on information and communications technology. ACSPL Working Paper Series, 1(1), 2.
Jensen, K., Kovacs, B., & Sorenson, O. (2018). Why do women inventors win fewer patents? Yale Insights. Retrieved from: https://insights.som.yale.edu/insights/why-do-women-inventors-win-fewer-patents
Mollick, E., & Robb, A. (2016). Democratizing innovation and capital access: The role of crowdfunding. California management review, 58(2), 72-87.
Penrose, E. T., & Zamora, C. (1974). La economía del sistema internacional de patentes. Economía y Demografía.
Phan, P. H., & Siegel, D. S. (2006). The effectiveness of university technology transfer. Foundations and Trends® in Entrepreneurship, 2(2), 77-144.
Portilla, L. M., Evans, G., Eng, B., & Fadem, T. J. (2010). Advancing translational research collaborations.
Ranga, M., & Etzkowitz, H. (2010). Athena in the world of techne: The gender dimension of technology, innovation and entrepreneurship. Journal of technology management and innovation, 5(1), 1-12.
Roessner, D., Bond, J., Okubo, S., & Planting, M. (2013). The economic impact of licensed commercialized inventions originating in university research. Research Policy, 42(1), 23-34.
Rosser, S. V. (2009). The gender gap in patenting: Is technology transfer a feminist issue? NWSA Journal, 65-84.
Rosser, S. V. (2003). Attracting and retaining women in science and engineering. Academe, 89(4), 24.
Schiebinger, L. (2008). Gendered innovations in science and engineering. Retrieved from: https://repository.library.georgetown.edu/handle/10822/548381
Siegel, D. S., Veugelers, R., & Wright, M. (2007). Technology transfer offices and commercialization of university intellectual property: Performance and policy implications. Oxford review of economic policy, 23(4), 640-660.
Shane, S. A. (2004). Academic entrepreneurship: University spinoffs and wealth creation. Northampton, MA: Edward Elgar Publishing.
Sharma, M., Kumar, U., & Lalande, L. (2006). Role of university technology transfer offices in university technology commercialization: Case study of the Carleton University foundry program. Journal of Services Research, 6.
Slaughter, S., & Leslie, L. L. (1997). Academic capitalism: Politics, policies, and the entrepreneurial university. Baltimore, MD: Johns Hopkins University.
Pacey, A. (1992). The maze of ingenuity: Ideas and idealism in the development of technology. MIT Press.
Tan, J. (2008). Breaking the “bamboo curtain” and the “glass ceiling”: the experience of women entrepreneurs in high-tech industries in an emerging market. Journal of Business Ethics, 80(3), 547-564.
Upton, S. (2010). Four key uses of prototyping. MoldMaking Technology. Retrieved from: https://www.moldmakingtechnology.com/articles/why-is-prototyping-important
Wolff, L., & MacKinnon, S. (2002). What is the digital divide. TechKnowLogia, July-September, 7-10. Retrieved from: https://www.nowpublishers.com/article/Details/ENT-006
Young, T. A., Krattiger, A., Mahoney, R. T., Nelsen, L., Thomson, J. A., Bennett, A. B., ... & Kowalski, S. P. (2007). Establishing a technology transfer office. Intellectual property management in health and agricultural innovation: A handbook of best practices, Vol. 2, 545-558.

330
“HELLO SIRI, HOW DOES THE PATRIARCHY INFLUENCE YOU?” — UNDERSTANDING ARTIFICIAL INTELLIGENCE AND GENDER INEQUALITY
12
AUTHORS: DHANARAJ THAKUR, ANA BRANDUSESCU, AND NNENNA NWAKANMA (WEB FOUNDATION)

Taking Stock: Data and Evidence on Gender Digital Equality PART TWO
331
ABSTRACTAs artificial intelligence (AI) systems become more widespread, we see increasing attempts to understand the social, economic, and political implications of these technologies. One significant gap in this work is a critical analysis of AI in terms of gender. This chapter examines the gendered implications of AI, especially in the Global South (focusing on low- and middle-income countries in Latin America and the Caribbean, Africa, and Asia). We identify the ways in which AI shapes gender relationships — and vice versa — by exploring examples of AI applications from various disciplinary fields. Where examples do not yet exist, we focus on anticipating and preventing the negative impacts of potentially biased AI applications. At a minimum, we need to ensure that AI does not exacerbate existing gender inequalities. We therefore propose steps that industry, civil society, and policy-makers can take to achieve this goal.
KEY FINDINGS
• AI development is likely to encode patterns of bias and discrimination against women, unless intentionally directed otherwise.
• Far from being neutral, AI-based applications are gendered from their creation — by the inherent bias of their creators, or through bias in the data they rely on.
• AI can actually exacerbate existing gender inequalities; the lack of women working in the field contributes to inequality and bias.
o The training data used for machine learning may under-represent women and lead to skewed results.
o Advertising may reward the targeting of men more than women; ride-sharing algorithms may pay men more than women.
o AI systems typically replicate the way their designers view language (usually from a male perspective).
• AI can also directly impact women by infringing on their rights and liberties.
o Machine learning tools are being used to create very realistic but computer-generated pornographic media, using images of women without their consent.
o The demand for more data (for training machine learning models) may ignore the need for informed consent. Such data can also be used to target women’s groups or individual women.
INTRODUCTION
Artificial Intelligence (AI) as a discipline has been around for decades, but it nevertheless offers tremendous opportunities for social and economic change. As AI systems become more widespread, there has been a concomitant interest in discerning the social, economic, and political implications of these technologies. We can consider AI’s implications on two interrelated levels: first, how such technologies are developed; and second, the kind of impacts AI can have on society.
Drawing on research in the United States and other high-income countries, some have pointed to the lack of diversity in the development of AI applications as well as specific evidence of gender, racial, and other biases (Bryson & Narayanan, 2016; Buolamwini & Gebru, 2018; Caliskan-Islam et al., 2016; Crawford, 2016). More broadly, researchers, civil society groups, and governments in high-income countries are trying to address the socio-economic implications of AI: for example, they point to due process and ethical concerns in the use of AI by government agencies and the approach to developing AI supported systems in the private sector (Campolo, Sanfilippo, Whittaker, & Crawford, 2017).
One significant gap in this work is a critical, gendered analysis of AI. While feminists have questioned the implications of AI for gender for some time now (Halberstam, 1991; Haraway, 1985), there is less work on the gendered implications of recent applications of AI. This is particularly important given the proposed and actual use-cases of AI across sectors. This chapter attempts to help fill this gap by examining the gendered implications of AI with an emphasis on countries in the Global South, where there is currently only limited research on this topic (e.g., Web Foundation, 2017a; IDRC, 2018)80.
Given the potentially broad gendered impacts of AI, it is important to take an interdisciplinary approach. We first examine research from fields including gender studies, innovation studies, sociology, law, and information and communications technology for development (ICT4D), drawing on literature that critiques ICT4D researchers and practitioners from a gender perspective. We identify the ways in which AI shapes gender relationships, and vice versa, based on examples in the literature as well as on examples of AI applications reported from a few countries in the Global South. In cases where real-world examples do not yet exist, our arguments focus on preventing the potentially negative impacts of biased AI applications. There is a responsibility to ensure that, at a minimum, AI does not exacerbate existing gender inequalities. We therefore propose steps that industry, civil society, and policy-makers can take to achieve this goal.
80 The Global South is defined here as low and middle-income countries in Latin America and the Caribbean, Africa, and Asia.

Taking Stock: Data and Evidence on Gender Digital Equality PART TWO
332
In the next section we discuss what we mean by AI and gender and how patriarchy mediates the relationship between the two. We then review possible impacts, by first reviewing the potential for AI to reduce gender inequalities, and then addressing the ways in which it might exacerbate such inequalities. Finally, we conclude with policy and other recommendations.
KEY CONCEPTS – HOW DO GENDER AND AI INTERSECT?Like most social science researchers on this topic, we take a broad view of AI. Nilsson (2009) posits that AI is about making machines intelligent — or designing them to have the ability to develop the right
decisions in a given environment, with foresight. As Stone et al. (2016) note, there is a broad spectrum of systems, differentiated by scale, speed, and degree of autonomy. Another way to classify AI is in terms of the scope of the tasks undertaken, including machine learning and deep learning (Figure 12.1).
AI is not simply a novel technology with interesting applications. It can be defined as an emerging technology, particularly as a field in the Global South. Emerging technologies embody a process that updates existing techniques, tools, professions, organisational structures, and industries with new capabilities and rearranges them in new ways. Crucially, however, these technologies co-evolve with existing inequalities (Cozzens & Thakur, 2014). In fact, some inequalities are sustained over time and even worsen — such as the gender wage gap (WEF, 2018) — as reinforcing an entrenched form of power.
Figure 12.1Relationship between AI, machine learning, and deep learning
Source: Web Foundation, 2017a.

Taking Stock: Data and Evidence on Gender Digital Equality PART TWO
333
In this chapter, we view gender as a range of characteristics defined by society to differentiate men from women81. Based on this gender differentiation, a patriarchal system creates and maintains social and economic structures that reserve most power to men in society, institutionalising gender inequality. As emerging technologies, such as AI, evolve, we argue that they will replicate existing patterns of bias and discrimination against women, unless intentionally directed otherwise.
Many people assume that technology has no clear link to gender, and that the application of technologies such as AI will therefore be gender-neutral. Far from being neutral, however, AI-based applications are gendered from the context of their creation. One example is the almost universal use of female voices, by default, for such AI-powered digital assistants as Google Assistant, Apple’s Siri, and Microsoft’s Cortana (Adrienne, 2016). The few existing examples in the Global South are also feminised: in Lagos, Nigeria, lara.ng82 provides public transportation information using a chatbot with a female identity; and when Micromax in India launched the mobile voice assistant AISHA in 2012, it also had a female identity. (We note the explicit sexual reference in the TV ad: a man in a swimming pool tells a bikini-clad AISHA, “I can sleep with you, but I can’t marry you.” To which she responds, “that’s OK, I can find you a girl in the matrimonials”83.) A range of less obvious, but more consequential, gender implications is discussed in the following sections.
The discourse around AI is also shaped by gender. For example, in Western countries, much of the male-dominated focus around the impact of AI is on job losses (Crawford, 2016). In some African countries it is often about how to improve socio-economic outcomes (Brandusescu, Ortiz, & Thakur, 2017), but for marginalised groups (including women) it will focus on issues of bias and discrimination (Buolamwini & Gebru, 2018). This chapter examines how emerging technology, such as AI, can serve to reinforce gender inequality, and what measures are needed to mitigate these trends.
THE PROMISES AND POTENTIAL FOR AI AND GENDER EQUALITYOne area of concern is the gender imbalance in technology fields such as AI, where men dominate
81 This socially dictated, binary definition of gender as female and male unfortunately precludes other types of gender in this analysis. This simplified view also excludes analysis based on intersectionality, such as women and men of different income groups, race, ethnicities, class, caste, etc.
82 See https://lara.ng/. Accessed March 2018.
83 https://www.youtube.com/watch?v=lHQMJ-1KV00. Accessed March 2018.
in both the Global North (EU, 2018) and Global South (WEF, 2018; Brandusescu et al., 2017). Some developers believe that AI can improve some forms of human decision-making that are distorted by, for example, discrimination against women that perpetuates gender gaps in the workplace. For example, Google has used AI to identify reasons for higher female staff turnover in its workforce (Bohnet, 2016, p. 105). Other developers focus on reducing discrimination in the recruitment process, including in technology firms (Shah, 2016). These tools examine the wording of job postings and use internal staff surveys to identify prejudices against women. Other machine learning tools examine salary comparisons between men and women, as well as perceived differences in workplace opportunities and benefits, to highlight gender gaps (Captain, 2015).
Some have expressed optimism about these applications of AI (for example, Singh, 2017). But technological solutions by themselves cannot resolve issues that reflect an underlying power dynamic of gender inequality. This caveat is often repeated (but not always heeded) in the field of information and communications technology for development (ICT4D). Hafkin and Huyer (2006) argue that, in relation to ICT4D and gender, the focus should be on ways to improve women’s lives with the aid of technology; we cannot assume that technology is a necessary or effective means to achieve this end. Most simply, to what extent can technology support women’s self-determination and agency (Web Foundation, 2015)?
It is especially important to examine patterns in ICT4D, as a related discipline, because of the potential applications of AI in the Global South. Within a few years, we expect that ICT4D researchers and practitioners will routinely focus on AI in their work (in the form of AI for Development, or AI4D). In Africa, much of the focus is already on solutions to address local and national development challenges, such as improving health outcomes, public transportation, agricultural productivity, and access to financial services (Brandusescu et al., 2017). In the Global South more generally, potential developmental impacts of AI include creating new business opportunities for small and medium enterprises, preventing disease, deploying emergency services more efficiently, reducing illegal wildlife poaching, and improving mechanisms for public consultation and decision-making (IDRC, 2018; Web Foundation, 2017a).
As Buskens and Webb (2009) note, these uses of technologies can help individual women transform their situations, but they do not address social systems of inequity. Truly comprehensive AI-based interventions, that aim to solve development challenges while improving outcomes for women more broadly, must begin by considering the inherent gender inequalities that underpin the social and political context in which these technologies will be used. A starting point for this mission is to understand how AI, if it is not strategically deployed, can in fact exacerbate existing gender inequalities.

Taking Stock: Data and Evidence on Gender Digital Equality PART TWO
334
HOW AI CHALLENGES GENDER EQUALITY
One of the major challenges is the low level of women’s participation in the field of AI. The resulting lack of diversity in design can produce AI applications that (a) fail to meet the needs of all, and (b) magnify existing inequalities, through uneven access and use of the application. For countries in the Global South this means not only that local AI applications are mainly designed and produced by men (Brandusescu et al., 2017; Web Foundation, 2017a), but also that — given the global dominance of U.S.-based technology companies — the imported AI applications (from firms such as Google) are most likely produced by “affluent white men” (Crawford, 2016).
One of the consequences of this exclusion of women is various forms of discrimination (Buolamwini & Gebru, 2018). The fact that, in almost all the cases described below, these forms of discrimination are not overt further complicates the discussion.
It is useful to distinguish between overt and implicit discrimination. In some countries, overt and legally sanctioned discrimination against women does exist. For example, a World Bank study that examined 189 countries found that in 37 countries it was harder for a woman to legally apply for a passport than a man, and 104 countries had restrictions on the kinds of jobs women can take (World Bank, 2018). Implicit forms of bias and discrimination against women are much more difficult to document, but their effect can be pervasive. They are built into interpersonal relationships as well as within institutional structures (rules and norms), and they are prevalent almost everywhere. Nevertheless, many in the field argue that such discrimination does not exist — or, if it does, it is not intentional. It is important to understand that systemic and institutional bias can operate regardless of individuals’ intention; the important feature of bias is its impact, not its motivation.
In reviewing evidence of AI-based bias and discrimination, we find three distinct categories:
• technical — how AI applications are designed and constructed
• economic contexts — realities that influence outcomes
• social norms and language — interactions that lead to discriminatory outcomes
IMPLICIT SOURCES OF DISCRIMINATION: TECHNICAL
The issue of implicit bias and discrimination in computer systems has long been recognised. Over 20 years ago, Friedman and Nissenbaum (1996) noted that this concern was not new; the most serious types of discrimination were systematic (not random), leading to unfair outcomes. Technical discrimination is based on the structural constraints of a system. For example, since AI is meant to mimic the appearance of human intelligence, it is therefore based on how its designers think, and their outlook on the world (Adam, 2006). Machine learning algorithms rely on training data in order to develop “appropriate” solutions. In a review of different kinds of facial recognition algorithms, Buolamwini and Gebru (2018) found that those algorithms were more likely to accurately identify “lighter-skinned” people, especially men, and were much less likely to identify “darker-skinned” persons, particularly women. They argue that part of the problem is the lack of demographic diversity and representation in the many of the datasets used to train these algorithms84. Discrimination in this case, though unintended, may be a reflection of datasets that lack representation of certain groups of people.
Disconcertingly, as Lohr (2018) notes, these kinds of facial recognition systems are already being used in multiple sectors across several countries. This points to the challenges that people in the Global South (particularly women) will face, as new datasets are collated — still encoding these existing inequalities. For example, men are much more likely to use the internet than women in these countries (ITU, 2017; Web Foundation, 2015); therefore, collating photos using online sources may offer far greater representation of men.
IMPLICIT SOURCES OF DISCRIMINATION: ECONOMIC CONTEXTS
A second source of discrimination is the economic environment in which the AI application is meant to operate, even where no explicit rules underly the discriminatory treatment of women. In one study, experiments were conducted using the Times of India website to identify differences in how Google ads were presented to users. The authors found that women users were less likely than men to see advertisements for high-paying jobs, for no discernible reason (Datta, Tschantz, & Datta, 2015). In a related study, Lambrecht and Tucker (2018) found that algorithms designed to show online ads to both men and women (in over 191 countries) ended up showing the ads to more men than women, even though women were in fact more likely than men to click on
84 See also “AI, Ain’t I A Woman?” https://www.youtube.com/watch?v=QxuyfWoVV98 Accessed July 2018.

Taking Stock: Data and Evidence on Gender Digital Equality PART TWO
335
the advertisements. The underlying problem was not algorithmic discrimination. Instead, it was a business model that, ironically, placed a premium on targeting women (young women in particular); as a result, it was less expensive and more economical to show the ad to men.
In many countries, the companies deploying AI applications operate in a non-competitive context, and in some cases amount to a near-monopoly. In such contexts, algorithms increasingly act as gatekeepers of knowledge, essentially determining what kinds of information and news people receive (Tufekci, 2015). Survey data from six African countries found that on average 86% of those who use the internet regularly (at least a few times per month) also regularly use social media as a source of news85. With few choices for the consumer, these monopolistic platforms and their algorithms can have a significant impact on sources of information for many people, and may have significant implications for gender equality. Whether or not these gatekeeper algorithms intentionally diffuse discriminatory content against women (although this happens), the lack of gender awareness or gender-critical content can propagate distortions, replicating patriarchal norms and undermining women’s agency.
IMPLICIT SOURCES OF DISCRIMINATION: SOCIAL NORMS AND LANGUAGE
Prevailing social norms and language usage tend to replicate the pre-existing biases that humans inevitably have. Feminists have long argued that language is a means by which women’s inferior position is enforced (Adam, 2006). AI systems typically replicate the way their designers view language (i.e., from a male perspective), both in how these systems are designed to interact with humans and in their subsequent “learning” based on the analysis of written texts (Caliskan-Islam et al., 2016). As Sonnad (2017) notes, tools such as Google Translate often interpret gender-neutral pronouns to default to the male form in English.
While that may be the result of a flawed dataset (i.e., the gender bias embedded in written texts), machine learning systems may also learn to use discriminatory language when interacting with users on-line. Microsoft’s short-lived AI chatbot, Tay, after a few hours of interaction with users on Twitter started to tweet racist comments and engage in harassment of women (Neff & Nagy, 2016). (Like many other AI entities, Tay was given the personality of a young woman.)
85 See the Afrobarometer Survey (R7 2016/2018) - http://afrobarometer.org/ (Accessed March 2018). The eight countries are Benin, Côte d´Ivoire, Kenya, Malawi, Mali, Uganda, Zambia, and Zimbabwe. Chi-square test is significant at the 99% level.
EXPLICIT SOURCES OF DISCRIMINATION: RIGHTS
AI applications can have impacts on women’s rights and liberties. Online (and offline) gender-based violence is a problem for women globally (Gurumurthy & Menon, 2009; Web Foundation, 2015)86. A related problem is the use of increasingly accessible machine-learning tools to create realistic, computer-generated pornographic media that uses images of identifiable women without their consent. This practice initially gained notoriety in the U.S., and there are also cases of such videos in India (Sharma, 2018).
The increased demand for AI-based solutions drives the need to build bigger and more comprehensive data sets. Ominously, the effect of collecting this data from a range of disparate sources is to solidify existing patterns of control; women and other groups who lack the privilege or means to opt out are the focus of that control (Shephard, 2016). While many countries need better data protection frameworks, the problem is more acute in the Global South (Web Foundation, 2017b). As a result of the increased demand, most recently from AI developers, harvesting personal data has become more and more lucrative; an increasing number of (unregulated) data brokers compile and sell data profiles of individuals to various organisations (O’Neil, 2017). Such data can be used to target women’s groups or individual women, as well as marginalised groups, without their consent. In addition, there is the potential for accessing these user profiles for political or sexual harassment or other kinds of online abuse.
Privacy is relevant also in the use of an AI application, as in the case of AI chatbots. One example, to be further researched, is SophieBot87, developed by, and primarily targeted at, Kenyans. This is a free AI chatbot that works on several messaging platforms and provides information on sexual and reproductive health. It is important to assess the extent to which it harvests and utilises user data, an aspect that was not made clear in our interaction with the chatbot.
RECOMMENDATIONS The challenges examined here are immense, but strategic interventions by both policy-makers and AI researchers can make a difference. We present five key recommendations.
Policy formulation. Policies for AI need to recognise that no technology, including AI, is gender-neutral (Alozie & Akpan-Obong, 2017; Nass et al., 1997; Wajcman, 1991). Developing gender-responsive AI
86 Also see https://www.genderit.org/onlinevaw/ Accessed March 2018.
87 See http://sophiebot.ml/ Accessed March 2018.

Taking Stock: Data and Evidence on Gender Digital Equality PART TWO
336
policy is important to ensure that the impacts of AI on both women and men are critically assessed. A comprehensive gender-responsive AI policy (as with any technology policy) would create a broad understanding of how gender-based inequalities are maintained in society. Awareness can start with conversations about the roles of men and women in society and the kinds of inequalities women face, particularly through indirect and systemic forms of discrimination. The government can initiate these discussions in the public sector through consultations, workshops, and internal gender audits88. Multi-stakeholder partnerships. Governments should coordinate with industry groups and others to generate accurate and timely data on the participation of women in the field (Campolo et al., 2017). Governments should also work with industry and other partners to fund women-owned firms working on AI, and to incentivise firms generally to have more diverse staff at all levels (Web Foundation, 2018). Other public-private investments can support interdisciplinary research on career development in the field of AI (including gender inequalities), and sponsor STEM training and development programmes targeting women and girls. It is also important to promote networking and mentoring support for women and girls through outreach. In Nigeria, for example, the Meet-Up for Women in Machine Learning and Data Science operates in Lagos and Abuja89, providing spaces to promote participation of women in AI. Improving the research agenda and design process. The design challenge for AI represents an opportunity in “AI for development”, one that is driven by actors in the Global South, who will also lead in identifying and implementing solutions to local challenges including gender inequality (Escobar, 2011). Design decisions are critically important to avoid repeating the pattern seen in ICT4D, for example, as a field that has often excluded gender (Hafkin & Huyer, 2006). AI developers should start by asking how their solution serves to maintain gender inequality — or even make it worse. Developers need to employ a “discrimination-conscious by-design” approach (Hajian, Bonchi, & Castillo, 2016). The members of the AI scientific community in a particular country should collaborate on developing such an approach (and by building on research networks in the Global South and elsewhere). Participatory design requires the inclusion of diverse groups (including diverse groups of women) throughout the design process.
Address direct potential harm from AI. Data and privacy protection can be critical for women’s safety, online and offline. Having clear and understandable terms of service and privacy policy is important
88 On gender audits in public sector agencies, see for example http://webfoundation.org/docs/2018/03/Using-USAFs-to-Close-the-Gender-Digital-Divide-in-Africa.pdf p. 16. Accessed July 2018.
89 https://www.meetup.com/Lagos-Women-in-Machine-Learning-Data-Science/ and https://www.meetup.com/Abuja-Women-in-Machine-Learning-and-Data-Science/ Accessed March 2018.
for all services, including AI-based applications. These safeguards will also require adequate data protection laws, which are currently lacking in many countries in the Global South. In addition, in most of those countries, much of the personal data comes through mobile internet. Government through telecommunications and consumer protection regulators should work with mobile network operators to promote transparency in data collection and ensure they adhere to data protection rules. Another way of reducing potential harm is improving the quality of training datasets. Where possible, using open data — freely accessible and shareable data, in a machine-readable format (such as a CSV file)90 (Brandusescu et al., 2017). Transparent reporting is needed on how the training data was created, and the methods of aggregation and classification used (Campolo et al., 2017).
Grievance redress mechanism. The typical route for recourse in situations of harm is via the courts. As in the examples mentioned above, there are several possible scenarios where a woman may want to bring legal action against a party because of gender-based discrimination. However, most legal systems require evidence of intent to discriminate, in order to rule against the discriminating party, and as we already noted, many of the effects of AI-based discrimination are unintentional (Barocas & Selbst, 2016). Recognising the limitations of their legal systems in providing recourse for these types of discrimination, governments will have to develop alternatives for women and others in these situations. This can include for example, mandatory bias audits for consequential decision-making algorithms.
CONCLUSIONS
Emerging technologies such as AI will co-evolve with existing inequalities, particularly for countries in the Global South. How might AI improve or worsen gender equality? Most of the evidence suggests that AI applications are indirectly or directly exacerbating existing gender inequalities. Even where there is no harm or discrimination created by the application itself, its interaction with the wider environment leads to disproportionately negative impacts on women.
This points to the importance of acting now, for policy-makers, practitioners, and researchers. A starting point is to discard the notion that AI is gender-neutral, and rather to acknowledge and incorporate analysis on gender throughout the AI policy process. Research is necessary to build an evidence base on the relationships between diffusion of AI and gender and other inequalities. The various examples highlighted throughout the chapter point to a broad range of research needs, both for those working in the field of AI and those studying its impacts.
90 See also http://opendefinition.org/od/2.1/en/ Accessed March 2018.

Taking Stock: Data and Evidence on Gender Digital Equality PART TWO
337
While recognising the impact that AI is already having globally, and more specifically in the Global South, we have put forward recommendations in five key areas. Much of this impact can be negative, as our examples illustrate. However, problems linked to gender inequalities may be overlooked in societies where dominant narratives focus on those in power, namely men. Policy-makers and researchers everywhere must recognise, and be prepared to articulate, that no country can achieve its national development goals as long as gender inequality persists.
REFERENCES
Adam, A. (2006). Artificial knowing: Gender and the thinking machine. London & New York: Routledge.
Adrienne, L. (2016). Why do so many digital assistants have feminine names? The Atlantic, March 30. Retrieved from: https://www.theatlantic.com/technology/archive/2016/03/why-do-so-many-digital-assistants-have-feminine-names/475884/
Alozie, N. O., & Akpan-Obong, P. (2017). The digital gender divide: Confronting obstacles to women’s development in Africa. Development Policy Review, 35(2), 137-160. Retrieved from: http://dx.doi.org/10.1111/dpr.12204
Barocas, S., & Selbst, A. D. (2016). Big data’s disparate impact. California Law Review, 104(3), 671. Retrieved from: http://dx.doi.org/10.15779/Z38BG31
Bohnet, I. (2016). What works: Gender equality by design. Cambridge, MA; London, UK: Belknap Press of Harvard University Press.
boyd, d., Levy, K., & Marwick, A. (2014). The networked nature of algorithmic discrimination. In: Data and discrimination: Collected essays. Washington, DC: Open Technology Institute.
Brandusescu, A., Ortiz, J., & Thakur, D. (2017). Artificial Intelligence: Starting the policy dialogue in Africa. Washington, DC: World Wide Web Foundation.
Buolamwini, J., & Gebru, T. (2018). Gender shades: Intersectional accuracy disparities in commercial gender classification. In: Conference on fairness, accountability and transparency (77–91).
Buskens, I., & Webb, A. (Eds.). (2009). African women and ICTs: Investigating technology gender and empowerment. London & New York: Zed Books.
Caliskan-Islam, A., Bryson, J. J., & Narayanan, A. (2016). Semantics derived automatically from language corpora necessarily contain human biases. ArXiv Preprint: ArXiv:1608.07187, 1-14.
Campolo, A., Sanfilippo, M., Whittaker, M., & Crawford, K. (2017). AI Now 2017 Report. New York: AI
Now Institute, New York University.
Captain, S. (2015, October 10). How Artificial Intelligence is finding gender bias at work. Fast Company. Retrieved from: https://www.fastcompany.com/3052053/how-artificial-intelligence-is-finding-gender-bias-at-work
Cozzens, S., & Thakur, D. (Eds.). (2014). Innovation and inequality: Emerging technologies in an unequal world. UK: Edward Elgar Publishing Ltd.
Crawford, K. (2016). Artificial intelligence’s white guy problem. The New York Times.
Datta, A., Tschantz, M. C., & Datta, A. (2015). Automated experiments on ad privacy settings. Proceedings on Privacy Enhancing Technologies, 2015(1), 92–112. Retrieved from: http://dx.doi.org/10.1515/popets-2015-0007
Design Justice Network. (2017). Design justice in action (Design Justice Zine #3). Retrieved from: http://designjusticenetwork.org/s/DJ_2017_Issue3.pdf
Escobar, A. (2011). Encountering development: The making and unmaking of the Third World. Princeton: Princeton University Press.
European Union (2018). Women in the digital age. Brussels: European Commission, Directorate-General of Communications Networks, Content and Technology.
Friedman, B., & Nissenbaum, H. (1996). Bias in computer systems. ACM Transactions on Information Systems (TOIS), 14(3), 330–347. Retrieved from: http://dx.doi.org/10.1145/230538.230561
Gurumurthy, A., & Menon, N. (2009). Violence against women via cyberspace. Economic and Political Weekly, 44(40), 19–21.
Hafkin, N., & Huyer, S. (Eds.). (2006). Cinderella or Cyberella? Empowering women in the knowledge society. Connecticut: Kumarian Press.
Hajian, S., Bonchi, F., & Castillo, C. (2016). Algorithmic bias: From discrimination discovery to fairness-aware data mining. In: Proceedings of the 22nd ACM SIGKDD international conference on knowledge discovery and data mining (2125–2126). ACM.
Halberstam, J. (1991). Automating gender: Postmodern feminism in the age of the intelligent machine. Feminist Studies, 17(3), 439–460. Retrieved from: http://dx.doi.org/10.2307/3178281
Haraway, D. J. (1985). A manifesto for cyborgs: Science, technology, and socialist feminism in the 1980s. San Francisco, CA: Center for Social Research and Education.

Taking Stock: Data and Evidence on Gender Digital Equality PART TWO
338
IDRC. (2018) Artificial intelligence and human development: Toward a research agenda. Ottawa, Canada: International Development Research Centre.
ITU. (2017). ICT Facts and Figures 2017. Geneva: International Telecommunications Union. Retrieved from: https://www.itu.int/en/ITUD/Statistics/Documents/facts/ICTFactsFigures2017.pdf
Lambrecht, A., & Tucker, C. E. (2018). Algorithmic bias? An empirical study into apparent gender-based discrimination in the display of STEM career ads. Retrieved from: https://ssrn.com/abstract=2852260Lohr, S. (2018). Facial recognition is accurate, if you’re a white guy. The New York Times, February 9. Retrieved from: https://www.nytimes.com/2018/02/09/technology/facial-recognition-race-artificial-intelligence.html
Nass, C., Moon, Y., & Green, N. (1997). Are machines gender neutral? Gender-stereotypic responses to computers with voices. Journal of Applied Social Psychology, 27(10), 864-876. Retrieved from: http://dx.doi.org/10.1111/j.1559-1816.1997.tb00275.x
Neff, G., & Nagy, P. (2016). Automation, algorithms, and politics: Talking to bots – symbiotic agency and the case of Tay. International Journal of Communication, 10, 4915-4931.
Nilsson, N. J. (2009). The quest for artificial intelligence. New York: Cambridge University Press.
O’Neil, C. (2017). Weapons of math destruction: How big data increases inequality and threatens democracy. New York: Broadway Books.
Shah, B. (2016, April 19). Can AI help gender diversity help AI. Retrieved from: https://motherboard.vice.com/en_us/article/d7y3zq/can-ai-help-gender-diversity-help-ai
Sharma, S. (2018, February 14). Desi Deepfakes are already a thing: Brace yourself for AI-powered disinfo. Retrieved from: https://factordaily.com/deepfakes-india/
Shephard, N. (2016). Big Data and Sexual Surveillance (APC Issue Papers). South Africa: Association for Progressive Communications. Retrieved from: https://www.genderit.org/resources/big-data-and-sexual-surveillance
Singh, H. (2017). Can Artificial Intelligence usher an era of gender parity. HuffPost, September 7. Retrieved from: https://www.huffingtonpost.com/entry/can-artificial-intelligence-usher-an-era-of-gender_us_59b0da10e4b0bef3378cddc4
Sonnad, N. (2017). Google Translate’s gender bias pairs “he” with “hardworking” and “she” with lazy, and other examples. Quartz, November 29. Retrieved from: https://qz.com/1141122/google-translates-gender-bias-pairs-he-with-hardworking-and-she-with-
lazy-and-other-examples/
Stone, P., Brooks, R., Brynjolfsson, E., Calo, R., Etzioni, O., Hager, G., … Kraus, S. (2016). Artificial intelligence and life in 2030. In: One hundred year study on Artificial Intelligence: Report of the 2015-2016 study panel. Stanford, CA: Stanford University. Retrieved from: https://ai100.stanford.edu/sites/default/files/ai_100_report_0831fnl.pdf
Tufekci, Z. (2015). Algorithmic harms beyond Facebook and Google: Emergent challenges of computational agency. Colorado Technology Law Journal, 13(2), 203-217.
Wajcman, J. (1991). Feminism confronts technology. Cambridge: Polity Press.
Web Foundation. (2015). Women’s rights online: Translating access into empowerment. World Wide Web Foundation. Retrieved from: http://webfoundation.org/docs/2015/10/womens-rights-online21102015.pdf
Web Foundation. (2017a). Artificial Intelligence in low and middle-income countries. Washington, DC: World Wide Web Foundation. Retrieved from: https://webfoundation.org/docs/2017/07/AI_Report_WF.pdf
Web Foundation. (2017b). Personal Data: An overview of low and middle-income countries. Washington, DC: World Wide Web Foundation. Retrieved from: https://webfoundation.org/docs/2017/07/AI_Report_WF.pdf
Web Foundation (2018). Artificial Intelligence: Open questions about gender inclusion. Policy Brief - W20 Argentina. Washington, DC: World Wide Web Foundation. Retrieved from: http://webfoundation.org/docs/2018/06/AI-Gender.pdf
World Bank. (2018). Women, Business and the Law. Washington, DC: World Bank. Retrieved from: http://documents.worldbank.org/curated/en/926401524803880673/pdf/125804-PUB-REPLACEMENT-PUBLIC.pdf
WEF (2017). The global gender gap report 2017. Geneva: World Economic Forum. Retrieved from: http://www3.weforum.org/docs/WEF_GGGR_2017.pdf

Taking Stock: Data and Evidence on Gender Digital Equality PART TWO
339

340
Taking Stock: Data and Evidence on Gender Digital Equality PART ONE