
Environmental tuning of the genetic control of seed ...
214
Environmental tuning of the genetic control of seed performance A systems genetics approach Elise Serin
-
Upload
khangminh22 -
Category
Documents
-
view
0 -
download
0
Transcript of Environmental tuning of the genetic control of seed ...
Environmental tuning of the
genetic control of seed
performance
A systems genetics approach
Elise Serin

Thesis committee
Promotor
Prof. Dr R.G.H. Immink
Special Professor Physiology of Flower Bulbs
Wageningen University & Research
Co-promotors
Dr H.W.M Hilhorst
Associate Professor, Laboratory of Plant Physiology
Wageningen University & Research
Dr J.W.Ligterink
Program Scientist crop innovation
Keygene, Wageningen
Other members
Prof. Dr G.C. Angenent, Wageningen University & Research
Prof. Dr C. Mariani, Radboud University Nijmegen
Prof. Dr J.J.B. Keurentjes, Wageningen University & Research
Dr R.V.L. Joosen, Rijk Zwaan, de Lier, NL
This research was conducted under the auspices of the Graduate School of Experimental
Plant Sciences.
Environmental tuning of the genetic
control of seed performance
A systems genetics approach
Elise Anna Renée Serin
Thesis
submitted in fulfillment of the requirements for the degree of doctor
at Wageningen University
by the authority of the Rector Magnificus,
Prof. Dr A.P.J. Mol,
in the presence of the
Thesis Committee appointed by the Academic Board
to be defended in public
on Monday 8 October 2018
at 11 a.m. in the Aula.

Elise A.R. Serin
Environmental tuning of the genetic control of seed performance: a systems genetics approach,
214 pages.
PhD thesis, Wageningen University, Wageningen, the Netherlands (2018)
With references, with summary in English
ISBN: 978-94-6343-334-1 DOI: https://doi.org/10.18174/458202

TABLE OF CONTENTS
Chapter 1 General introduction 7
Chapter 2 Construction of a high-density genetic map from RNA-Seq
data for an Arabidopsis Bay-0× Shahdara RIL population.
21
Chapter 3 Quantitative trait loci associated with G x E for seed
performance
41
Chapter 4 Maternal environment and genetic background shape the
dry seed metabolome in Arabidopsis
69
Chapter 5 Environmental and genetic effects on gene expression in
Arabidopsis seeds
103
Chapter 6 Learning from co-expression networks: possibilities and
challenges
125
Chapter 7 General discussion 153
References 171
Summary 201
Acknowledgements 205
About the author 210
Education statement 212


Chapter 1
General Introduction
| Chapter 1
Seed quality
Over the coming decades, major predicted changes in the climate conditions will
result in changes in plant growth and development as well as seed quality which is
acquired during seed development on the mother plant (Walck et al. 2011). Such
changes will have an impact on plant’s life history traits but also consequences for
seed companies whose main business is to provide high quality seeds to the
growers.
In this thesis, I aimed to extent the understanding of interactions between the
maternal environment and genetic factors that regulate seed performance. For this
purpose, I used a combination of genetic and ~omics approaches. A detailed
description of the biological and technical aspects related to this aim and approach
are now being further detailed.
Seed quality is a generic term which definition is a rule-of-thumb determined by the
end-user (Ligterink et al. 2012). For instance, quality requirements will differ
depending on the if the seeds are intended to be used for consumption or
propagation purposes. In agriculture, seed high genetic purity, the absence of seed-
borne diseases, low post-harvest dormancy and high storability are often used as
quality criteria. Seed performance is also used as a surrogate of seed quality that
refers to the germination potential of the seed in terms of rate, speed and
uniformity of seed germination. Another key aspect of seed performance is seed
vigour which is the ability of the seed to germinate under a wide range of
environmental conditions (Dickson 1980; Finch-Savage and Bassel 2016).
Seed quality essentially relies on the inherent properties of the seed acquired during
seed development on the mother plant. Seed development is characterized by two
main phases; embryogenesis and maturation (Harada 1997; Goldberg et al. 1994).
During embryogenesis, the zygote undergoes a series of cell divisions and
differentiations. Seed maturation marks the arrest of embryogenesis. Seed
maturation is an important phase of seed development. The embryo stops it growth
and start accumulating storage products that will be mobilized upon imbibition to
support the high energy demanding early phases of seed germination and seedling
establishment (Weitbrecht et al. 2011). Seed maturation is also characterized by the
acquisition of important seed properties such as dormancy and desiccation
tolerance (Goldberg et al. 1994). The dry and dormant state of the seeds provides
them an advantage to sustain extended periods of unfavourable conditions and
optimize their germination time (Bentsink 2008). Genetic and molecular studies
have provided large insights into the regulatory mechanisms associated with seed
maturation (Holdsworth et al. 2008; Bentsink and Koornneef 2008; Gutierrez et al.
2007). Important regulators of seed maturation include the LAFL (LEC1, ABI3, FUS3
8
General introduction |
and LEC2) which can be used to modify seed quality (Fatihi et al. 2016). The
hormonal balance between abscisic acid (ABA) and gibberellins (GA) also plays an
important role in the control of dormancy and seed germination. ABA is a positive
regulator of dormancy while GA counteracts the effect of ABA to release dormancy
and to promote germination (Holdsworth et al. 2008). Insights into seed maturation
processes have also been gained from omics studies. The different phases of seed
development are characterized by specific metabolic signatures (Fait et al. 2006;
Angelovici et al. 2010). A high number of changes in gene expression has also been
observed during seed development and seed after-ripening (Bassel et al. 2011; Le et
al. 2010; Carrera et al. 2008). Further understanding of the control of seed
maturation, dormancy and germination is essential to further improve seed quality
traits.
Environmental regulation of seed performance
Seed germination is a critical stage in respect to its role in supporting plant fitness.
Inopportune environmental conditions can prevent seedling establishment if the
timing of germination is not appropriate. Therefore, the sensing and integration of
environmental cues by the mother plant as well as the developing seed plays an
important role in adjusting the timing of germination (Springthorpe and Penfield
2015). Seed dormancy is a well-known mechanism that contributes to the
adaptation of plants to their environment by regulating the timing of germination
(Donohue et al. 2005b). The level of seed primary dormancy is largely modulated by
genetic and environmental factors (Bentsink et al. 2010; He et al. 2014). The
maturation environment of the seed, also called maternal environment, can
modulate dormancy and germination in a genotype-dependent manner (He et al.
2014) resulting in genotype-by-environment interactions, further explained. For a
wide range of species, as well as Arabidopsis, warmer maternal environments often
result in lower seed dormancy as compared to lower temperatures (Fenner 1991;
He et al. 2014). The maternal environment also affected other seed traits. For
instance, in several studies, high light resulted in an increased seed size (Fenner
1991; He et al. 2014). The nutrient availability, such as nitrate and phosphate, to the
mother plant also affect the offspring performance (Galloway 2001; He et al. 2014).
It is not well understood how environmental cues are sensed are integrated. Several
studies showed the implication of the flowering pathway in integrating
environmental cues transmitted to the developing seeds (Penfield and MacGregor
2017). Additionally, phytochromes can also act as important mediators of
environmental cues (Donohue et al. 2008). Several other studies indicated that the
effect of the maternal environment can be mediated via seed provisioning
9
| Chapter 1
(Zas et al. 2013), the maternal tissues such as the seed coat (MacGregor et al. 2015;
Chen et al. 2014b) as well as the accumulation of compounds such as storage
proteins, metabolites and transcripts (Rosental et al. 2016; He et al. 2016; de Souza
Vidigal et al. 2016).
The successful execution of the germination program does also depend on
environmental conditions encountered by the seed shed from the mother plant.
Light, low temperatures and nitrate are known environmental factors that elicit
germination (Holdsworth et al. 2008). Primary dormancy can be alleviated by
stratification which consists in imbibing seed in cold and dark prior to germination or
by dry natural storage, a process termed ‘after-ripening’ (Bewley 1997).
Unfavourable germination conditions can suspend the germination process and can
also induce secondary dormancy (Finch-Savage and Footitt 2017). Germination at
high temperature can induce thermo-inhibition that is the inability of the seeds to
germinate under high temperature (Hills et al. 2003). Germination in ABA also
results in the reversible arrest of germination by preventing water uptake to the
embryo (Lopez-Molina et al. 2001). Water availability is essential for seeds to
commit germination. Water availability and thus intake becomes limiting under
osmotic stress conditions which can be induced by the presence of NaCl, mannitol
or Polyethylene glycol in the germination environment (Edwards et al. 2016; Joosen
et al. 2012).
Genotype-by-environment interactions
Plants are sessile organisms and must therefore adopt mechanisms enabling them
to face fluctuations in their direct environment. One major mechanism to cope with
rapid changes is the plant phenotypic plasticity. Phenotypic plasticity which is
defined as the ability of plants to produce a range of phenotypes under diverse
environmental conditions (Nicotra et al. 2010). The reaction norm, which can be
seen as a response to stress, is used as a measure of plasticity and describes the
phenotypic expression of a given genotype across a range - or generally two - of
environments. Another mechanism of adaptation to environmental fluctuations is
genotype-by-environment (G x E) interactions. G x E is the result of differences in
plasticity observed across genotypes (El-Soda et al. 2014). Two genotypes can show
plasticity, without G x E. This is the case when the reaction norm of these two
genotypes is the same. Both plasticity and G x E play an important role in phenotypic
diversity and can be used to determine the maximal potential of a given genotype.
G x E suggests that the phenotypic variation observed is caused by the effect of the
environment on the gene(s) controlling the trait. The mapping of quantitative trait in
different environments is a common approach used to identify the genetic basis of
10
General introduction |
G x E. Knowledge of the molecular basis of G x E can provide insights into underlying
mechanisms of plant adaptation (Josephs 2018). Traits providing a fitness advantage
in a specific environment might be deleterious in another one and thereby fitness
trade-offs can be identified (El-Soda et al. 2014). G x E is of eminent importance in
breeding. Multiple-environment testing of the genotypes is needed to identify
genotypes suitable for multiple environments (van Eeuwijk et al. 2010).
The genetic basis of such interactions is not well-known. Determining the genetic
and molecular mechanisms that give rise to genotype-by-environment interactions
is important with many implications in the field of evolutionary ecology (Josephs
2018) and agriculture (breeding) (El-Soda et al. 2014).
Linkage mapping
Genetic traits can be classified as mono-genic, oligo-genic or complex depending on
whether these traits are controlled by one, several or multiple genetic factors.
Where the genetic factors responsible for regulating mono-genic and oligo-genic
traits can be determined with traditional mutant screens, this doesn’t work for
complex traits because they are quantitative which means that they are affected by
many genes with possibly small effects and often subjected to environmental
variation. Therefore, quantitative trait locus (QTL) analysis using linkage mapping is
the common tool for determining the genetic factors controlling complex traits.
Linkage mapping is a powerful tool to provide insights into the genetic architecture
of segregating genetic traits in many types of mainly bi-parental populations. The
power of the QTL mapping relies on three major factors: The complexity of the
segregating trait under study, the type and size of the mapping population and the
availability of a dense and reliable genetic map (Glazier et al. 2002; Keurentjes et al.
2011). With the advances in high-throughput molecular techniques, such as DNA
microarrays and next generation sequencing technologies, it has become feasible to
identify a large number of markers distributed across the genome and to genotype
these markers for a large sample of individuals, facilitating QTL mapping approaches
in many species (Schmidt et al. 2017; Gupta et al. 2008). Recombinant inbred line
(RIL) populations are widely used for QTL analyses. This type of population is derived
from the F1 of two contrasting parental lines by single seed descend. At the end of
several generations (F6-F8), each final recombinant inbred line has a different
genotype which consists of a mosaic of parental inherited chromosomal fragments,
as a result of meiotic recombination events. The high level of homozygosity of these
lines makes them ‘immortal’ and the population suitable to measure multiple traits
under different conditions, with no need to genotype them anew. In combination
with the high degree of mapping resolution, this type of populations is widely used
11
| Chapter 1
for QTL mapping. Such populations have been used to investigate natural variation
in seed traits such as seed dormancy (Bentsink et al. 2010), longevity (Nguyen et al.
2012) and germination (Joosen et al. 2012).
Other populations that can be used for QTL mapping are F2, double haploid or
backcross populations. Genome-wide association studies (GWAS) are also
performed to identify genetic factors based on the historical linkage disequilibrium
observed in a panel of genetically diverse accessions (Atwell et al. 2010). Many of
such mapping populations have been developed using the plant science pioneer
plant model Arabidopsis thaliana (Alonso-Blanco and Mendez-Vigo 2014).
In this thesis, I used an Arabidopsis thaliana Bayreuth-0 (Bay-0) x Shahdara (Sha)
core collection of 165 RILs developed by (Loudet et al. 2002). Bay-0 and Sha were
originally selected for their known geographical, ecological and genetic distance
(Loudet et al. 2002). Bay-0 originates from the low lands and has been collected in
Germany, whereas Sha was collected in Central-Asia from the mountains in
Tajikistan. The RIL population has been used to identify QTLs for many traits, such as
flowering (Botto and Coluccio 2007), root and shoot mass (Bouteille et al. 2012),
stress tolerance (Jimenez-Gomez et al. 2010) and seed germination (Joosen et al.
2012).
From G x E to QTL x E
Genotype-by-environment interactions occur when the response to the
environment differs across genotypes. To understand the underlying genetics, G x E
studies have shifted towards QTL x E, where genotype-by-environment interactions
are explained by differences in the expression of the QTLs in relation to the
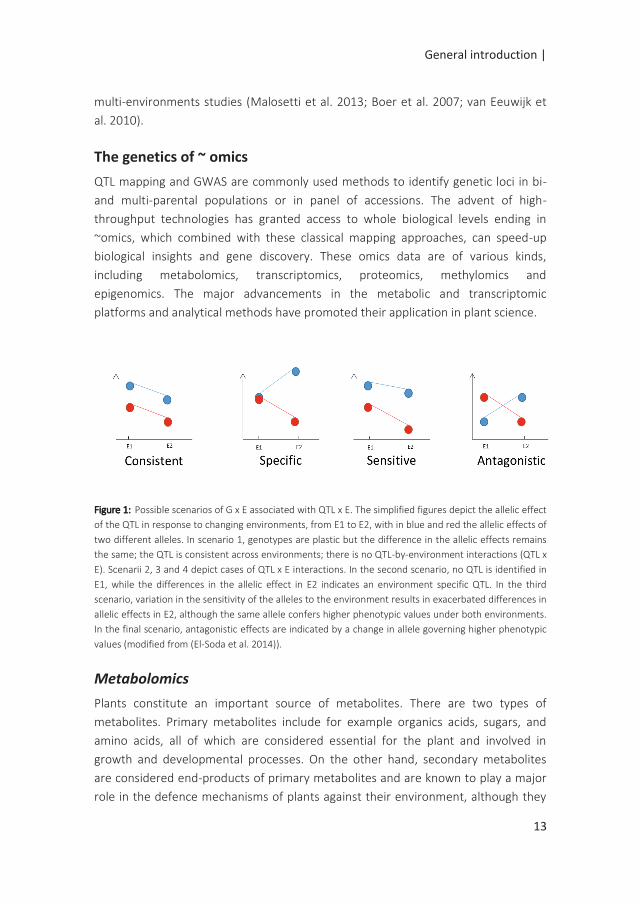
environmental conditions (Boer et al. 2007; van Eeuwijk et al. 2010). Scenarios
illustrating such QTL-by-environment interactions are shown in Figure 1.
For the expression of the phenotype, the contribution of genotype-by-environment
interactions can be estimated using a simple model. This model includes the
expression of a genotype i in an environment j as Pij = µ + Gi + Ej + G x Eij + Ɛij where
Pij is the expression of the phenotype, µ is the general mean, Gi is the main
genotypic effect, Ej is the effect of the environment, G x Eij the genotype-by-
environment interaction term and Ɛij the random effects. In QTL studies, the
growing interest for investigating the genetic basis of G x E has challenged the
development of new QTL mapping approaches. The estimation of the genetic effects
can be improved by including multiple environments and also multiple traits in a
single QTL analysis. Several mixed models have been suggested that maximize the
information gained from genotype-by-environment interactions for multi-traits and
12
General introduction |
multi-environments studies (Malosetti et al. 2013; Boer et al. 2007; van Eeuwijk et
al. 2010).
The genetics of ~ omics
QTL mapping and GWAS are commonly used methods to identify genetic loci in bi-
and multi-parental populations or in panel of accessions. The advent of high-
throughput technologies has granted access to whole biological levels ending in
~omics, which combined with these classical mapping approaches, can speed-up
biological insights and gene discovery. These omics data are of various kinds,
including metabolomics, transcriptomics, proteomics, methylomics and
epigenomics. The major advancements in the metabolic and transcriptomic
platforms and analytical methods have promoted their application in plant science.
Figure 1: Possible scenarios of G x E associated with QTL x E. The simplified figures depict the allelic effect
of the QTL in response to changing environments, from E1 to E2, with in blue and red the allelic effects of
two different alleles. In scenario 1, genotypes are plastic but the difference in the allelic effects remains
the same; the QTL is consistent across environments; there is no QTL-by-environment interactions (QTL x
E). Scenarii 2, 3 and 4 depict cases of QTL x E interactions. In the second scenario, no QTL is identified in
E1, while the differences in the allelic effect in E2 indicates an environment specific QTL. In the third
scenario, variation in the sensitivity of the alleles to the environment results in exacerbated differences in
allelic effects in E2, although the same allele confers higher phenotypic values under both environments.
In the final scenario, antagonistic effects are indicated by a change in allele governing higher phenotypic
values (modified from (El-Soda et al. 2014)).
Metabolomics
Plants constitute an important source of metabolites. There are two types of
metabolites. Primary metabolites include for example organics acids, sugars, and
amino acids, all of which are considered essential for the plant and involved in
growth and developmental processes. On the other hand, secondary metabolites
are considered end-products of primary metabolites and are known to play a major
role in the defence mechanisms of plants against their environment, although they
13
| Chapter 1
have a broader functional range. Currently, several methods are available to detect
these metabolites, which opened the door towards comprehensive metabolomics
(Carreno-Quintero et al. 2013). Gas chromatography time-of-flight mass
spectrometry (GC-TOF-MS) is a powerful tool to study primary metabolites (Lisec et
al. 2006). In addition, the possibility of conducting untargeted metabolomics has
enabled the simultaneous study of a wide range of metabolites, providing a global
view of metabolic changes. The variation in the composition, but also abundance of
metabolites is often observed in plants during development, in response to stress,
across different organs as well as across genotypes (Kooke and Keurentjes 2012). In
seeds, comprehensive metabolic studies have revealed large metabolic changes
(Fait et al. 2006). The qualitative and quantitative variation of these metabolites has
led to the investigation of the underlying genetic basis. The idea of combining
classical QTL analysis with ~omics data was first introduced in 2001 and was termed
‘genetical genomics’ (Jansen and Nap 2001). In this approach, the quantitative
variation of metabolites measured in a segregating mapping population is
considered as an ‘endo’- or ‘molecular phenotype’ which is used as a variable for the
QTL analysis. The QTL analysis will result in the identification of genomic regions
associated with variation for specific metabolites (metabolite QTLs, mQTLs). The co-
localization of mQTL might indicate the co-regulation of the metabolic compounds
caused by an underlying causal gene(s) (Keurentjes et al. 2006). For Arabidopsis,
genes involved in many biosynthetic pathways have been identified (Kanehisa and
Goto 2000). Mapping QTLs for metabolites enables to uncover the dynamics of their
regulation under different conditions.
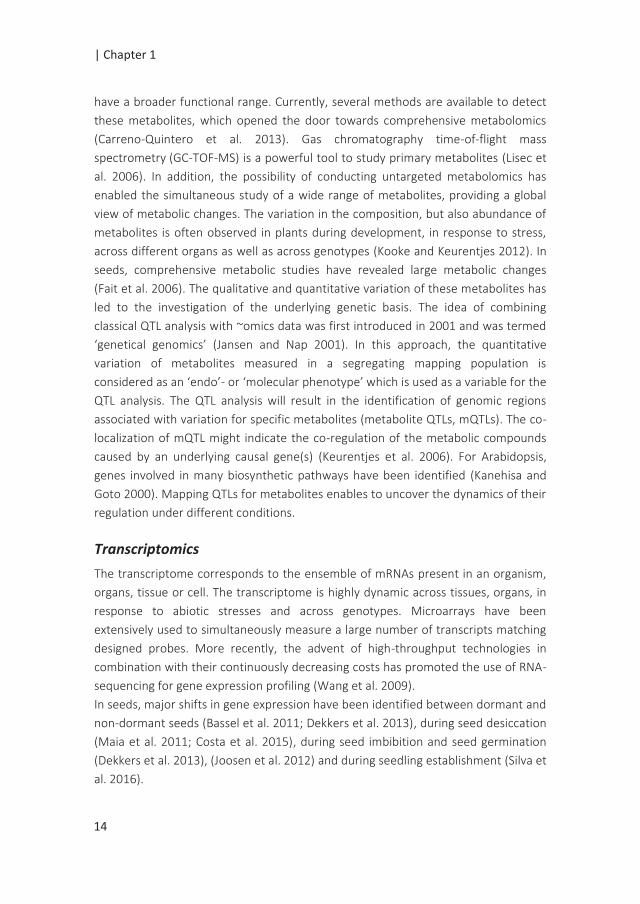
Transcriptomics
The transcriptome corresponds to the ensemble of mRNAs present in an organism,
organs, tissue or cell. The transcriptome is highly dynamic across tissues, organs, in
response to abiotic stresses and across genotypes. Microarrays have been
extensively used to simultaneously measure a large number of transcripts matching
designed probes. More recently, the advent of high-throughput technologies in
combination with their continuously decreasing costs has promoted the use of RNA-
sequencing for gene expression profiling (Wang et al. 2009).
In seeds, major shifts in gene expression have been identified between dormant and
non-dormant seeds (Bassel et al. 2011; Dekkers et al. 2013), during seed desiccation
(Maia et al. 2011; Costa et al. 2015), during seed imbibition and seed germination
(Dekkers et al. 2013), (Joosen et al. 2012) and during seedling establishment (Silva et
al. 2016).
14
General introduction |
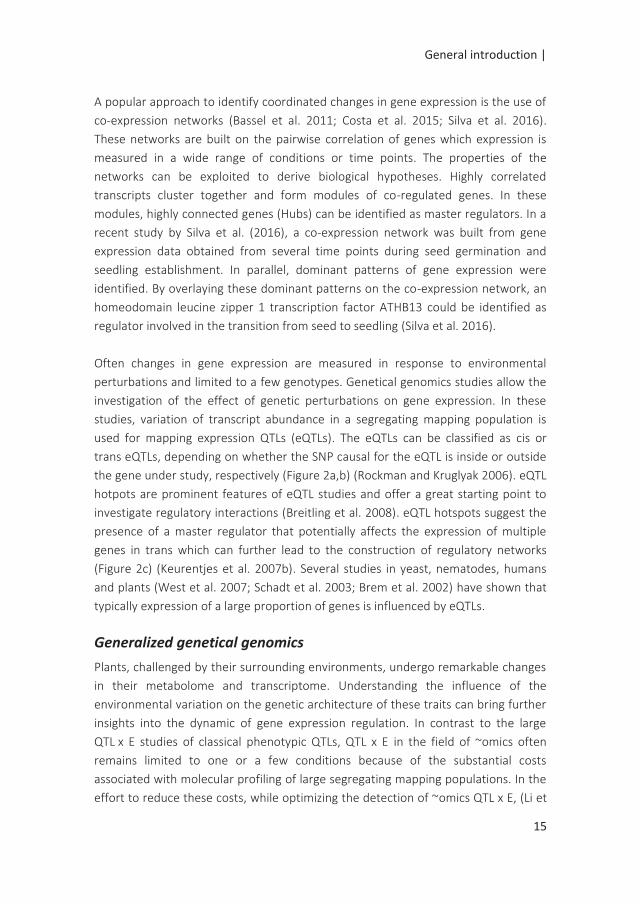
A popular approach to identify coordinated changes in gene expression is the use of
co-expression networks (Bassel et al. 2011; Costa et al. 2015; Silva et al. 2016).
These networks are built on the pairwise correlation of genes which expression is
measured in a wide range of conditions or time points. The properties of the
networks can be exploited to derive biological hypotheses. Highly correlated
transcripts cluster together and form modules of co-regulated genes. In these
modules, highly connected genes (Hubs) can be identified as master regulators. In a
recent study by Silva et al. (2016), a co-expression network was built from gene
expression data obtained from several time points during seed germination and
seedling establishment. In parallel, dominant patterns of gene expression were
identified. By overlaying these dominant patterns on the co-expression network, an
homeodomain leucine zipper 1 transcription factor ATHB13 could be identified as
regulator involved in the transition from seed to seedling (Silva et al. 2016).
Often changes in gene expression are measured in response to environmental
perturbations and limited to a few genotypes. Genetical genomics studies allow the
investigation of the effect of genetic perturbations on gene expression. In these
studies, variation of transcript abundance in a segregating mapping population is
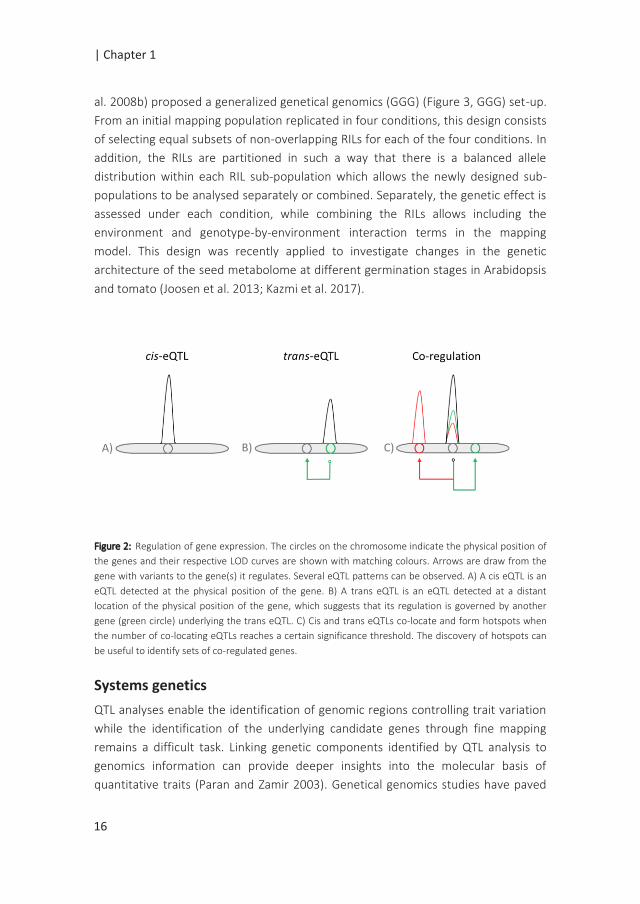
used for mapping expression QTLs (eQTLs). The eQTLs can be classified as cis or
trans eQTLs, depending on whether the SNP causal for the eQTL is inside or outside
the gene under study, respectively (Figure 2a,b) (Rockman and Kruglyak 2006). eQTL
hotpots are prominent features of eQTL studies and offer a great starting point to
investigate regulatory interactions (Breitling et al. 2008). eQTL hotspots suggest the
presence of a master regulator that potentially affects the expression of multiple
genes in trans which can further lead to the construction of regulatory networks
(Figure 2c) (Keurentjes et al. 2007b). Several studies in yeast, nematodes, humans
and plants (West et al. 2007; Schadt et al. 2003; Brem et al. 2002) have shown that
typically expression of a large proportion of genes is influenced by eQTLs.
Generalized genetical genomics
Plants, challenged by their surrounding environments, undergo remarkable changes
in their metabolome and transcriptome. Understanding the influence of the
environmental variation on the genetic architecture of these traits can bring further
insights into the dynamic of gene expression regulation. In contrast to the large
QTL x E studies of classical phenotypic QTLs, QTL x E in the field of ~omics often
remains limited to one or a few conditions because of the substantial costs
associated with molecular profiling of large segregating mapping populations. In the
effort to reduce these costs, while optimizing the detection of ~omics QTL x E, (Li et
15
| Chapter 1
al. 2008b) proposed a generalized genetical genomics (GGG) (Figure 3, GGG) set-up.
From an initial mapping population replicated in four conditions, this design consists
of selecting equal subsets of non-overlapping RILs for each of the four conditions. In
addition, the RILs are partitioned in such a way that there is a balanced allele
distribution within each RIL sub-population which allows the newly designed sub-
populations to be analysed separately or combined. Separately, the genetic effect is
assessed under each condition, while combining the RILs allows including the
environment and genotype-by-environment interaction terms in the mapping
model. This design was recently applied to investigate changes in the genetic
architecture of the seed metabolome at different germination stages in Arabidopsis
and tomato (Joosen et al. 2013; Kazmi et al. 2017).
Figure 2: Regulation of gene expression. The circles on the chromosome indicate the physical position of
the genes and their respective LOD curves are shown with matching colours. Arrows are draw from the
gene with variants to the gene(s) it regulates. Several eQTL patterns can be observed. A) A cis eQTL is an
eQTL detected at the physical position of the gene. B) A trans eQTL is an eQTL detected at a distant
location of the physical position of the gene, which suggests that its regulation is governed by another
gene (green circle) underlying the trans eQTL. C) Cis and trans eQTLs co-locate and form hotspots when
the number of co-locating eQTLs reaches a certain significance threshold. The discovery of hotspots can
be useful to identify sets of co-regulated genes.
Systems genetics
QTL analyses enable the identification of genomic regions controlling trait variation
while the identification of the underlying candidate genes through fine mapping
remains a difficult task. Linking genetic components identified by QTL analysis to
genomics information can provide deeper insights into the molecular basis of
quantitative traits (Paran and Zamir 2003). Genetical genomics studies have paved
16
General introduction |
the way for systems genetics approaches (Hansen et al. 2008). The combination of
phenotypic and molecular data generated in similar genetically and environmentally
disturbed systems can provide a global and integrative view of the genetic
architecture of complex traits (Civelek and Lusis 2014; Ligterink et al. 2012).
The relation between the different phenotypic and ~omics data can be examined
using several approaches (Civelek and Lusis 2014), which include correlation analysis
of the different traits (Carreno-Quintero et al. 2012) or the identification of genetic
markers that affect several traits (co-locating QTLs) (Wentzell et al. 2007). Handling
such large data sets makes it difficult to prioritize important links between
phenotypes and molecular data, which thus requires the use of appropriate
visualization methods. In this respect, correlation and co-expression network
analysis provides a useful approach to display, organize, integrate and eventually
identify biologically meaningful entities for further in-depth investigations
(Langfelder and Horvath 2008).
Arabidopsis thaliana
In many ways, Arabidopsis thaliana is an ideal organism for dissecting complex traits.
This small flowering plant belongs to the Brassicacea family. It’s genome was the
first plant genome sequenced in 2000 (Analysis of the genome sequence of the
flowering plant Arabidopsis thaliana 2000). It has a diploid genome which is
distributed over five chromosomes spanning 120 Mb and counting approximately
30.000 protein-coding genes. Arabidopsis thaliana offers unique possibilities for
genetic studies due to its wide distribution of natural habitat, the great genetic
variation and because it is predominantly a self-pollinating plant (Koornneef et al.
2004; Alonso-Blanco et al. 2016). In addition to its broad natural variation,
Arabidopsis is also very suitable for linkage mapping. The self-fertilizing nature of the
plant facilitates the construction and maintenance of different types of genetic
material such as recombinant inbred lines (RILs) (Alonso-Blanco and Koornneef
2003), heterozygous inbred families (HIFs) (Tuinstra et al. 1997) and near-isogenic
lines (NILs) (Keurentjes et al. 2007a). In addition to that, the relatively high
recombination rate makes it possible to map QTLs to a relatively fine scale with a
relative small population as compared to other species (Glazier et al. 2002). Another
advantage of using Arabidopsis is that a large number of plants can be grown and
replicated under uniform conditions. In combination to this, the plant has a short life
cycle (approximately 3 months) which generally ends in a large seed output. These
criteria have motivated the use of this plant as a model system in plant science
(Koornneef and Meinke 2010). Since its adoption as a model plant, extensive studies
17
| Chapter 1
using Arabidopsis have generated a wealth of molecular tools and resources to
dissect complex traits in Arabidopsis and other species. In the present thesis,
another advantage of using Arabidopsis is the availability of, the GERMINATOR, a
high-throughput phenotyping method to score germination (Joosen et al. 2010).
This method is based on image analysis and relies on the colour contrast between
the seed coat and the protruding radicle which marks seed germination (Bewley
1997). The data provided by image analysis are used as input for a curve-fitting
module which returns quantitative parameters that describe the germination
behaviour of a seed batch. These parameters include the t10 and t50, the time
needed to reach 10% and 50% of seed germination, respectively; Gmax, the
maximum germination percentage and the AUC, the integration of the area under
the germination curve (Joosen et al. 2010). This method has been used previously to
investigate the genetic basis of seed performance in large populations (Joosen et al.
2012; Vidigal et al. 2016).
18

General introduction |
Scope of the thesis
The research presented in this thesis aimed at understanding to what extent the
seed maternal environment influences the genetic control of seed performance. In a
systems genetics approach, I investigated environmentally and genetically induced
changes at the metabolome and transcriptome levels. This work lays the foundation
in view of ultimately integrating the different biological scales to provide a system
understanding of the control of seed performance.
Chapter 1 introduces the definition and the importance of seed quality and
performance. Particular emphasis is given to the environmental regulation of seed
performance. Natural variation represents a valuable resource to explore the
genetic basis of complex traits. I highlight the potential of genetical genomics to
elucidate changes in seeds at the molecular level to ultimately, in a systems genetics
approach, get better insights into the control and regulation of seed performance.
The general approach I used is summarized in Figure 3 and detailed below.
In Chapter 2, I show that the QTL mapping resolution can be improved by high-
density genetic maps. Polymorphic markers were derived from RNA-seq data
generated from the RILs (Chapter5). As a result I provided a new high-density
genetic map for the Arabidopsis RIL Bay-0 x Sha RIL population that is subsequently
used for the mapping analyses in the following chapters.
Chapter 3 sheds light into the interplay of genetic and environmental factors
determining seed performance. The identified QTLs showed significant QTL x E
interactions with both germination and maternal environment contributing to the
explained phenotypic variance. The combined analysis of HIFs and expression data
was used to narrow down an environment specific QTL and to suggest potential
candidate genes.
In Chapter 4, I investigated the changes occurring in the seed metabolome of the
RILs in response to changes in the maternal environment. This study shows that
correlation networks combined to QTL mapping analyses can bring substantial
insights into genetically coordinated metabolic changes reflecting metabolic
investment strategies in response to stress.
Chapter 5 provides a preview on the dynamics of the genetic basis of gene
expression. Using the generalized genetical genomics design, RNA-seq was
performed on the dry seed of RILs grown under different conditions. Differential
gene expression analysis and eQTL mapping revealed large genotype-by-
environment interactions. Comparison of the eQTL features under each condition
indicated a highly environment-dependant genetic control of gene expression.
Co-expression networks are an attractive approach to integrate and visualize large
data sets.
19
| Chapter 1
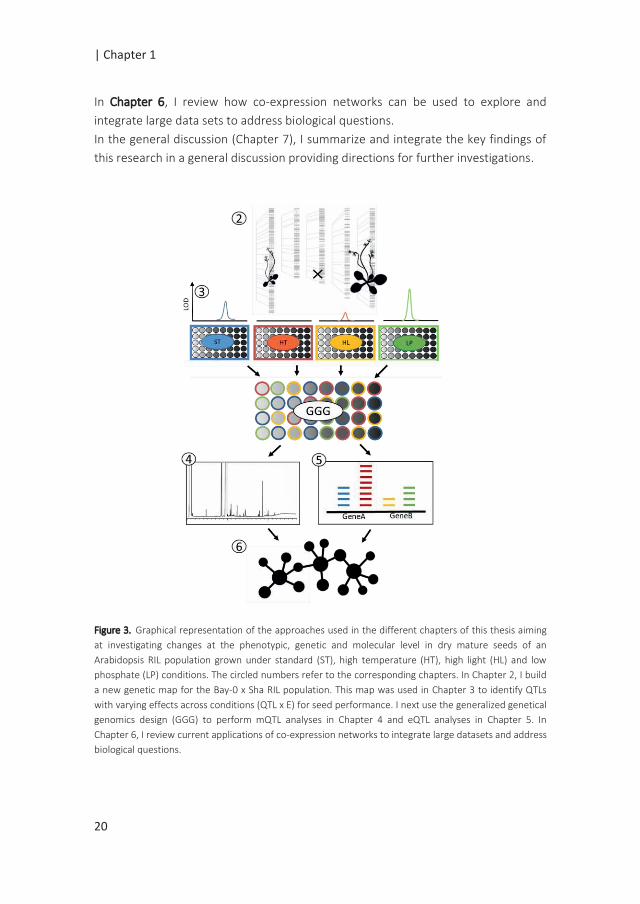
In Chapter 6, I review how co-expression networks can be used to explore and
integrate large data sets to address biological questions.
In the general discussion (Chapter 7), I summarize and integrate the key findings of
this research in a general discussion providing directions for further investigations.
Figure 3. Graphical representation of the approaches used in the different chapters of this thesis aiming
at investigating changes at the phenotypic, genetic and molecular level in dry mature seeds of an
Arabidopsis RIL population grown under standard (ST), high temperature (HT), high light (HL) and low
phosphate (LP) conditions. The circled numbers refer to the corresponding chapters. In Chapter 2, I build
a new genetic map for the Bay-0 x Sha RIL population. This map was used in Chapter 3 to identify QTLs
with varying effects across conditions (QTL x E) for seed performance. I next use the generalized genetical
genomics design (GGG) to perform mQTL analyses in Chapter 4 and eQTL analyses in Chapter 5. In
Chapter 6, I review current applications of co-expression networks to integrate large datasets and address
biological questions.
20
Chapter 2
Construction of a high-density genetic map from
RNA-Seq data for an Arabidopsis Bay-0× Shahdara RIL
population
Elise A. R. Serin*, Basten L. Snoek*, Harm Nijveen, Leo A. J. Willems, Jose M.
Jiménez-Gómez, Henk W. M. Hilhorst and Wilco Ligterink
*These authors contributed equally to this work
Published in Frontiers in Genetics,
2017; Dec 5, 8:201. doi: 10.3389/fgene.2017.00201
| Chapter 2
Abstract
High-density genetic maps are essential for high resolution mapping of quantitative
traits. Here, we present a new genetic map for an Arabidopsis Bayreuth × Shahdara
recombinant inbred line (RIL) population, built on RNA-seq data. RNA-seq analysis
on 160 RILs of this population identified 30,049 single-nucleotide polymorphisms
(SNPs) covering the whole genome. Based on a 100-kbp window SNP binning
method, 1059 bin-markers were identified, physically anchored on the genome. The
total length of the RNA-seq genetic map spans 471.70 centimorgans (cM) with an
average marker distance of 0.45 cM and a maximum marker distance of 4.81 cM.
This high resolution genotyping revealed new recombination breakpoints in the
population. To highlight the advantages of such high-density map, we compared it
to two publicly available genetic maps for the same population, comprising 69 PCR-
based markers and 497 gene expression markers derived from microarray data,
respectively. In this study, we show that SNP markers can effectively be derived
from RNA-seq data. The new RNA-seq map closes many existing gaps in marker
coverage, saturating the previously available genetic maps. Quantitative trait locus
(QTL) analysis for published phenotypes using the available genetic maps showed
increased QTL mapping resolution and reduced QTL confidence interval using the
RNA-seq map. The new high-density map is a valuable resource that facilitates the
identification of candidate genes and map-based cloning approaches.
Keywords: Arabidopsis, Genetic map, Genotyping-by-sequencing, QTL mapping, RIL
population, Resolution, RNA-seq
22
A new genetic map from RNA-seq data |
Introduction
Quantitative Trait Locus (QTL) analysis has successfully identified a large number of
genetic loci that contribute to the regulation of quantitative phenotypes. The advent
of -omics data has extended the range of usual mapping traits to molecular
phenotypes offering new approaches for bridging the gap between genes and their
function (Keurentjes et al. 2008). The idea that variation in gene expression can be
treated as a quantitative trait, gave rise to the concept of genetical genomics
(Jansen and Nap 2001). In combination with a genetic map, quantitative variation in
gene expression measured in a segregating population enables the identification of
expression QTLs (eQTLs). Many eQTL studies have contributed to our understanding
of the genetic architecture of regulatory variation of intricate traits in Arabidopsis
(West et al. 2007; Keurentjes et al. 2007b; Lowry et al. 2013; Cubillos et al. 2014;
Terpstra et al. 2010; Snoek et al. 2012) (for review see (Joosen et al. 2009)), poplar
(Drost et al. 2015), tomato (Ranjan et al. 2016), as well as in other organisms (Li et
al. 2006; Li et al. 2010; Vinuela et al. 2010; Rockman et al. 2010; Aylor et al. 2011;
King et al. 2014; Sterken et al. 2017; Snoek et al. 2017b).
In essence, the success of QTL mapping is determined by the mapping resolution
which mainly depends on the size of the population (and thus the number of
recombination events), the complexity of the phenotype and the number of
available markers. High-density genetic maps are thus instrumental for accurate
mapping of QTLs. Traditional methods used to obtain molecular markers were
mainly PCR based (SSR, AFLP, RFLP). New methods to derive molecular markers have
recently emerged, together with the advancement of high-throughput technologies.
Particularly, single nucleotide polymorphisms (SNPs), represent a rich source of
potential markers due to their abundance (Alonso-Blanco et al. 2016). Differences in
gene expression measured with microarrays as a result of probe hybridization
sensitivity to underlying sequence polymorphisms have been used to derive SNP-
based markers (West et al. 2006; Zych et al. 2015; Zych et al. 2017). More recently,
next generation sequencing technologies for transcriptome analysis (RNA-seq) have
provided unprecedented opportunities for quantitative genetics in plants (Jimenez-
Gomez 2011). Becoming a standard for gene expression profiling, RNA-seq has also
proven to be an efficient and cost-effective method to identify genome-wide SNPs
(Piskol et al. 2013; Markelz et al. 2017). In the context of genetical genomics, RNA-
seq on a segregating population can simultaneously provide the molecular
phenotype and the sequence information for molecular markers that subsequently
provide genotyping information for the population.
23
| Chapter 2
Segregating bi-parental populations such as recombinant inbred line (RIL)
populations are powerful tools for QTL analysis (Koornneef et al. 2004). These
immortal populations capture frequent recombination events in a relatively small
sized population, thereby conveniently reducing the costs for genotyping. In this
study, we utilized an Arabidopsis thaliana Bayreuth x Shahdara population that has
been used extensively for genetic (Loudet et al. 2002; Jimenez-Gomez et al. 2010)
and eQTL studies (West et al. 2007; Keurentjes et al. 2007b). The original genetic
map for this population consists of 69 markers segregating in 420 F6 RILs (Loudet et
al. 2002). Further genotyping efforts on a subset of these RILs have introduced
markers derived from gene expression data with microarrays, saturating the original
map (West et al. 2006; Zych et al. 2015; Salathia et al. 2007). Here, we present the
construction of a high-resolution genetic map from RNA-seq data of 160 RILs. We
validate and show the improvements of this new map by performing a QTL analysis
with publicly available phenotypic data (Joosen et al. 2012).
Materials and Methods
Plant growth and sample preparation
Seeds from the Arabidopsis thaliana accessions Bayreuth (Bay-0) and Shahdara (Sha)
and a Bay-0 x Sha RIL population consisting of 165 lines were used. This population
was initially developed by Loudet et al. (2002). As part of a larger experiment aiming
to investigate genotype x environment interactions, the parental lines and the RILs
were grown under standard and controlled mild stress conditions. In the standard
condition, plants were grown under long day (16h light / 8h dark) at 70% RH and
22°C / 18°C (day/night) under artificial light (150 μmol m-2 s-1). The plants were
watered with a standard nutritive solution (see supplemental table 1 in He et al.
(2014)) three times a week by flooding cycles. The same conditions were used for
the stress environments, except for the varying parameter as indicated hereafter:
high temperature (25°C day / 23°C night), high light (300 μmol m-2 s-1) and low
phosphate (12.5 μM phosphate instead of 0.5 mM in the standard nutritive
solution).
The RILs and the parental lines were first grown with three to four plants per
environment in a single climate cell under the control conditions mentioned above.
When most of the plants flowered, the main stems of all plants were removed to
increase the numbers of side branches and thereby seed production, and to ensure
that all seeds would complete their development under the specific conditions.
Subsequently the plants were transferred to different climate cells to continue their
growth under the specific stress conditions. At the time all plants in a given
24
A new genetic map from RNA-seq data |
condition produced a sufficient amount of fully matured seeds; the seeds were bulk
harvested from the 3-4 plants per line. After drying, a fraction of the freshly
harvested seeds were stored at -80°C in sealed 2 ml tubes until RNA-seq library
preparation.
RNA isolation and sequencing
RNA was isolated from 4-5 mg of fresh harvested dry seeds that were stored at -
80°C. Each of the parents was measured in triplicate per condition i.e. 4x3 = 12
replicates per parent. RNA was extracted from the seeds of 160 RILs selected in
conformity to the generalized genetical genomics strategy (GGG, Li et al. (2008b)
and Table S1). RNA was isolated using the NucleoSpin RNA plant isolation kit
(Macherey-Nagel 740949) but adding Plant RNA isolation Aid (Life technologies)
according to the manufacturer’s protocol and instructions.
RNA-seq reads processing
Strand specific RNA-seq libraries were prepared from each RNA sample using the
TruSeq RNA kit from Illumina according to manufacturer’s instructions. Poly-A
selected mRNA was sequenced using the Illumina HiSeq2500 sequencer, producing
strand-specific single-end reads of 100 nucleotides. Reads were trimmed using
Trimmomatic (version 0.33, Bolger et al. (2014)) to remove low quality nucleotides.
Trimmed reads were subsequently mapped to the Arabidopsis thaliana TAIR10
reference genome (Lamesch et al. 2012) using the HISAT2 software (version 2.0.1,
(Kim et al. 2015)) with the “transcriptome mapping only” option. SNPs were called
using the mpileup function of samtools (version 0.1.19, Li et al. (2009b)) and
bcftools.
SNP identification and RIL genotyping
Variant call format (VCF) files were generated for each of the samples. Since not all
SNPs are found in all genotypes, all vcf files were merged to generate a list with all
variants present in at least one sample. From this unique list, information regarding
the position in base pairs and the chromosome location of each SNP was retrieved
and filtered for being consistent across the sequencing data of the parental lines. In
order to get a more reliable genotypic score, cancelling out any SNPs miscalls, and to
reduce the overall number of markers, SNPs were grouped into bins. 1059 equal size
artificial bins of 100 kbp were created along the whole genome. The scoring of the
genotype was obtained based on the SNP information within each bin. For regions at
the transition between two genotypic blocks, the bin score was rounded up and
25
| Chapter 2
assigned to the closest genotypic score. The quality of the genotype scoring of the
bins was assessed by correlation analysis.
Nomenclature
The bins are ordered based on the genome sequence, thus the unit distance is not
expressed in centimorgans (cM) but in bins of 100 kbp. Each bin is used as a marker
and the midpoint position of the 100 kbp bin is used as the marker position. Markers
were named RSM for RNA-seq markers, followed by the chromosome number of
their location and their physical position in mega base pairs (Mbp). As an example
RSM_1_0.05 corresponds to the marker at 0.05 Mbp on chromosome 1.
Genetic map construction
The genetic distances in centimorgans of the 1059 markers for 160 RILs were
estimated in order to describe and compare the new genetic map to previous maps.
The genetic distances were estimated using the “est.map” function with “kosambi”
distance from the R/qtl package (Broman et al. 2003)(Arends et al. 2010). The
correct order of the markers was verified by pairwise marker linkage analysis using
the “est.rf” function. The recombination rate was determined based on the linear
relation between the genetic and the physical positions of the marker. The
segregation pattern was tested for all markers to identify markers that show
significant distortion at the 5% level, after a Bonferroni correction for multiple
testing. The statistical programming language R (version 3.3.2) (Team 2008) was
used for all analyses. The genetic map and genotypic data are available in table S2.
QTL comparison
To test the effect of increased marker coverage on QTL mapping, we re-mapped 510
published phenotypic traits using the RNA-seq (1059 markers), the pheno2geno
(497 markers) (Zych et al. 2015) and the original map (69 markers) (Loudet et al.
2002). In order to compare the mapping resolution, the genetic distances were re-
estimated for each map using 145 RILs common to the three studies (Supplemental
table 1). The scanone function in R/qtl was used with the default settings for the QTL
mapping. LOD score peaks were called by chromosome for each trait, resulting in a
total of 2550 (510*5) peak LOD scores. The LOD threshold for the genome-wide
significance at the level of 5% was determined after 1000 permutations using each
map. The LOD thresholds obtained were 2.36, 2.64 and 2.76 using the original,
pheno2geno and RNA-seq map, respectively. The increased LOD thresholds for the
Pheno2geno and the RNA-seq map can be explained by the larger number of
26
A new genetic map from RNA-seq data |
markers which will result in a larger multiple testing corrections. We used a stringent
LOD threshold of 3 to identify and compare significant QTLs for all maps. The LOD
score comparison was performed in a similar way as described in Zych et al. (2015).
To be more confident about the comparison, QTLs were considered to have a higher
or lower LOD score if the difference between the compared LOD scores was larger
or equal to 0.5. The mapping resolution of the RNA-seq map was investigated by
comparing the confidence intervals (CIs) of QTLs for the RNA-seq and the original
map. LOD-1 CIs were determined for all significant QTLs (LOD >3) for both maps. The
genomic positions of the lower and upper limit of each CI were estimated from the
equation of the linear relation between genetic and physical position of the markers.
Subsequently, the CI width was determined for each QTL in Mbp. The analyses and
figures were generated using Microsoft Excel, R/qtl and the R ggplot2 package.
The cross object containing all data for the 510 phenotypes in the 160 RILs for the
QTL analysis is available in supplemental table 3. The QTL results for the comparison
of the LOD scores and confidence intervals are provided in supplemental table 4 and
5. QTL profiles of the re-mapped 510 traits are available for interactive analysis in
AraQTL (www.bioinformatics/araqtl.org, Nijveen et al. (2017)).
Results
Genotyping the RIL population using a SNP binning approach
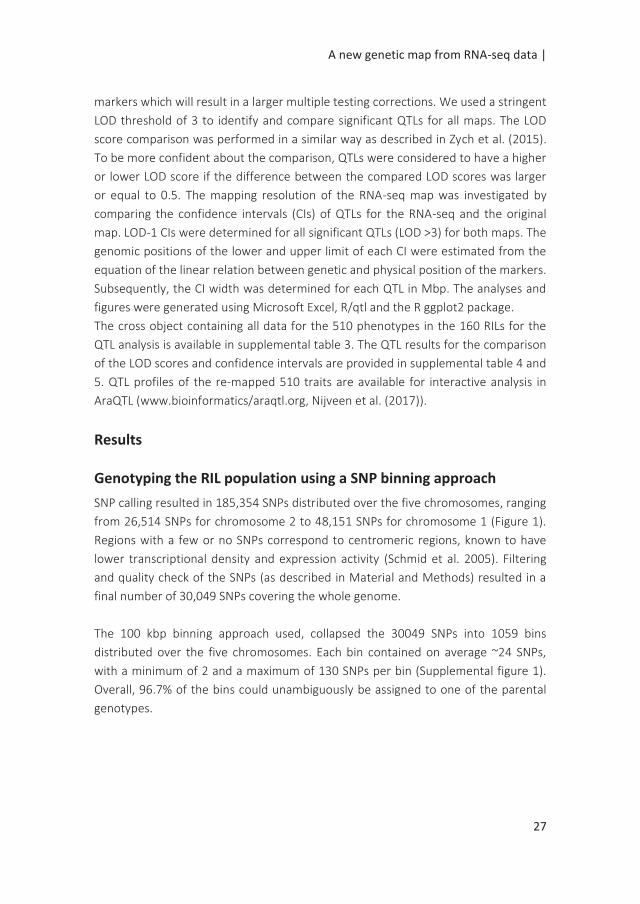
SNP calling resulted in 185,354 SNPs distributed over the five chromosomes, ranging
from 26,514 SNPs for chromosome 2 to 48,151 SNPs for chromosome 1 (Figure 1).
Regions with a few or no SNPs correspond to centromeric regions, known to have
lower transcriptional density and expression activity (Schmid et al. 2005). Filtering
and quality check of the SNPs (as described in Material and Methods) resulted in a
final number of 30,049 SNPs covering the whole genome.
The 100 kbp binning approach used, collapsed the 30049 SNPs into 1059 bins
distributed over the five chromosomes. Each bin contained on average ~24 SNPs,
with a minimum of 2 and a maximum of 130 SNPs per bin (Supplemental figure 1).
Overall, 96.7% of the bins could unambiguously be assigned to one of the parental
genotypes.
27
| Chapter 2
Figure 1. Raw SNP distribution from all genotyped RILs. A. Total SNP count and B. coverage counts of each
SNP at each physical position on the chromosome in mega base pairs (Mbp) are displayed for each of the
five chromosomes of Arabidopsis thaliana as well as the mitochondrial (Mt) and plastid (Pt) genomes.
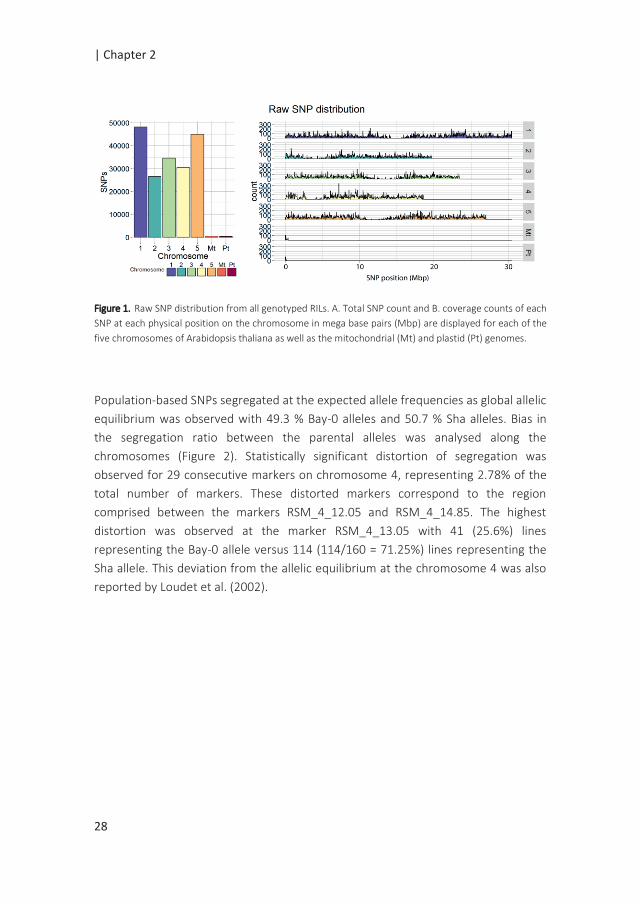
Population-based SNPs segregated at the expected allele frequencies as global allelic
equilibrium was observed with 49.3 % Bay-0 alleles and 50.7 % Sha alleles. Bias in
the segregation ratio between the parental alleles was analysed along the
chromosomes (Figure 2). Statistically significant distortion of segregation was
observed for 29 consecutive markers on chromosome 4, representing 2.78% of the
total number of markers. These distorted markers correspond to the region
comprised between the markers RSM_4_12.05 and RSM_4_14.85. The highest
distortion was observed at the marker RSM_4_13.05 with 41 (25.6%) lines
representing the Bay-0 allele versus 114 (114/160 = 71.25%) lines representing the
Sha allele. This deviation from the allelic equilibrium at the chromosome 4 was also
reported by Loudet et al. (2002).
28
A new genetic map from RNA-seq data |
Figure 2. Allele distribution for the 1059 markers along the five chromosomes. Blue and red colors
indicated the Bay-0 and the Sha allele percentages, respectively. The black horizontal bar indicates the
region on chromosome 4 with 29 markers showing significant segregation distortion (p-value < 0.05 after
Bonferroni correction).
RNA-seq genotyping identifies new introgressions
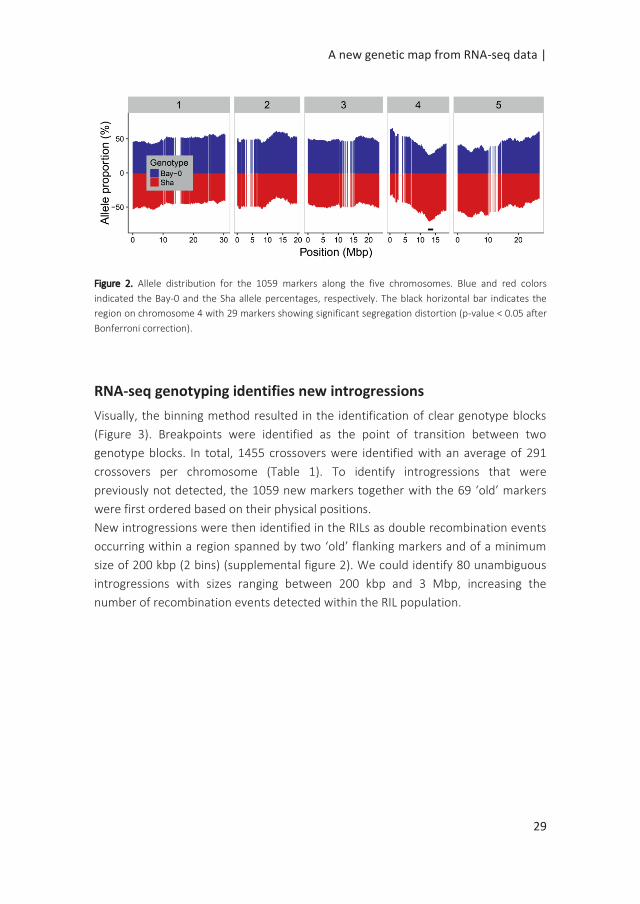
Visually, the binning method resulted in the identification of clear genotype blocks
(Figure 3). Breakpoints were identified as the point of transition between two
genotype blocks. In total, 1455 crossovers were identified with an average of 291
crossovers per chromosome (Table 1). To identify introgressions that were
previously not detected, the 1059 new markers together with the 69 ‘old’ markers
were first ordered based on their physical positions.
New introgressions were then identified in the RILs as double recombination events
occurring within a region spanned by two ‘old’ flanking markers and of a minimum
size of 200 kbp (2 bins) (supplemental figure 2). We could identify 80 unambiguous
introgressions with sizes ranging between 200 kbp and 3 Mbp, increasing the
number of recombination events detected within the RIL population.
29
| Chapter 2
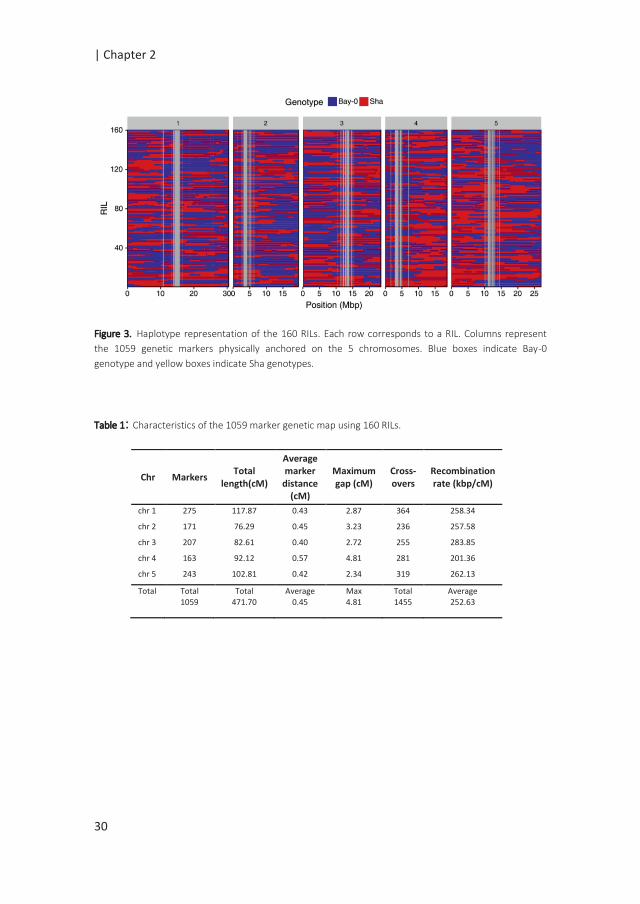
Figure 3. Haplotype representation of the 160 RILs. Each row corresponds to a RIL. Columns represent
the 1059 genetic markers physically anchored on the 5 chromosomes. Blue boxes indicate Bay-0
genotype and yellow boxes indicate Sha genotypes.
Table 1: Characteristics of the 1059 marker genetic map using 160 RILs.
Chr Markers Total
length(cM)
Average marker
distance (cM)
Maximum gap (cM)
Cross-overs
Recombination rate (kbp/cM)
chr 1 275 117.87 0.43 2.87 364 258.34
chr 2 171 76.29 0.45 3.23 236 257.58
chr 3 207 82.61 0.40 2.72 255 283.85
chr 4 163 92.12 0.57 4.81 281 201.36
chr 5 243 102.81 0.42 2.34 319 262.13
Total Total 1059
Total 471.70
Average 0.45
Max 4.81
Total 1455
Average 252.63
30
A new genetic map from RNA-seq data |
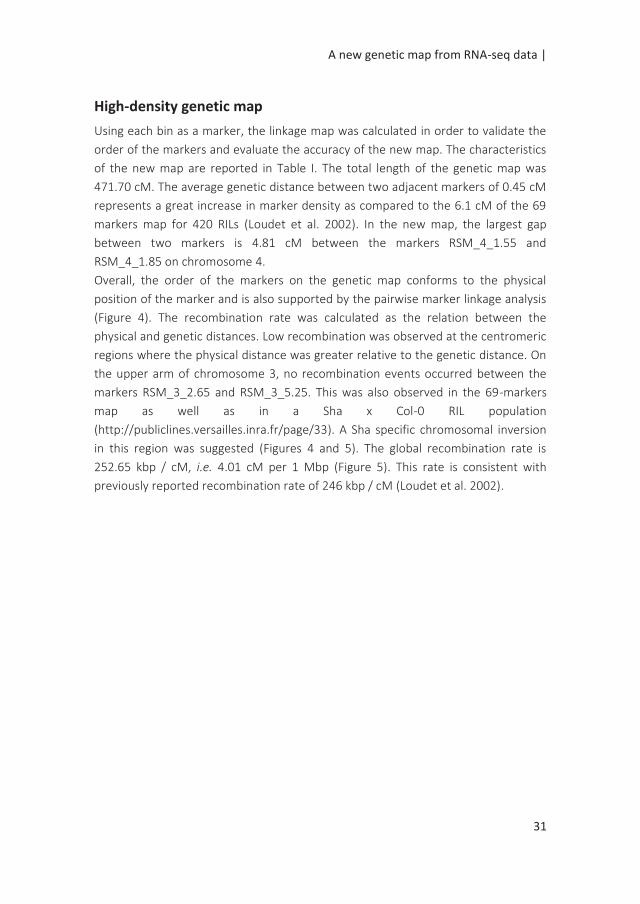
High-density genetic map
Using each bin as a marker, the linkage map was calculated in order to validate the
order of the markers and evaluate the accuracy of the new map. The characteristics
of the new map are reported in Table I. The total length of the genetic map was
471.70 cM. The average genetic distance between two adjacent markers of 0.45 cM
represents a great increase in marker density as compared to the 6.1 cM of the 69
markers map for 420 RILs (Loudet et al. 2002). In the new map, the largest gap
between two markers is 4.81 cM between the markers RSM_4_1.55 and
RSM_4_1.85 on chromosome 4.
Overall, the order of the markers on the genetic map conforms to the physical
position of the marker and is also supported by the pairwise marker linkage analysis
(Figure 4). The recombination rate was calculated as the relation between the
physical and genetic distances. Low recombination was observed at the centromeric
regions where the physical distance was greater relative to the genetic distance. On
the upper arm of chromosome 3, no recombination events occurred between the
markers RSM_3_2.65 and RSM_3_5.25. This was also observed in the 69-markers
map as well as in a Sha x Col-0 RIL population
(http://publiclines.versailles.inra.fr/page/33). A Sha specific chromosomal inversion
in this region was suggested (Figures 4 and 5). The global recombination rate is
252.65 kbp / cM, i.e. 4.01 cM per 1 Mbp (Figure 5). This rate is consistent with
previously reported recombination rate of 246 kbp / cM (Loudet et al. 2002).
31

| Chapter 2
Figure 4. Pairwise marker linkage analysis. The estimated recombination fraction and LOD scores for all
pairs of markers are shown in the upper-left and lower-right triangle, respectively. High correlation
between markers indicates marker linkage (yellow) while the blue colour shows low correlation values
indicating unlinked markers. The grid delineates the five chromosomes. The red dotted frame indicates
the region at the top of chromosome 3 with the probable occurrence of an inversion.
Figure 5. Relation between the genetic length in centimorgans (cM) and the physical length in Mbp for
the 1059 markers along the five chromosome using 160 RILs of the Bay-0 x Sha RIL population. The red
dotted frame indicates the region on the upper arm of chromosome 3 without recombination events.
32
A new genetic map from RNA-seq data |
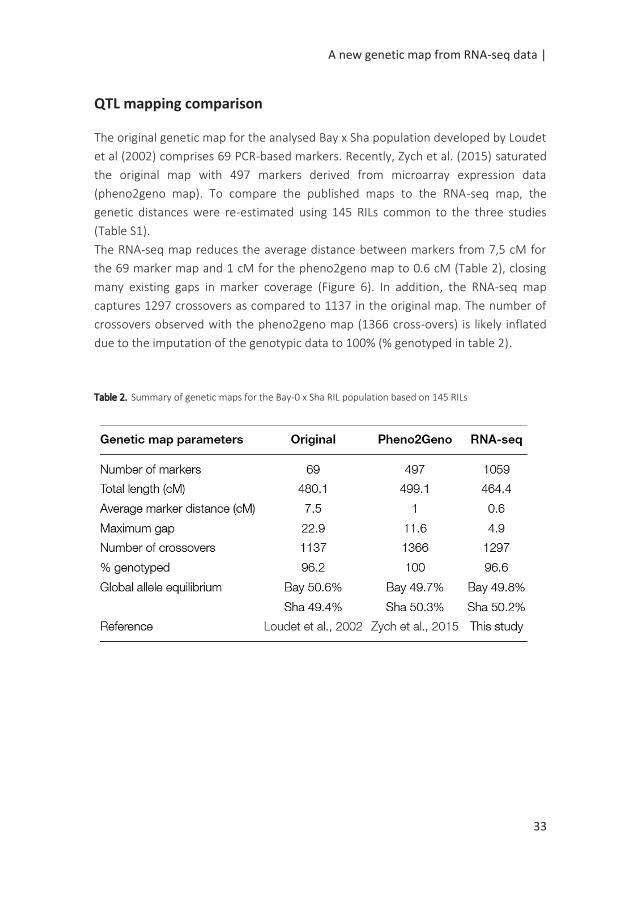
QTL mapping comparison
The original genetic map for the analysed Bay x Sha population developed by Loudet
et al (2002) comprises 69 PCR-based markers. Recently, Zych et al. (2015) saturated
the original map with 497 markers derived from microarray expression data
(pheno2geno map). To compare the published maps to the RNA-seq map, the
genetic distances were re-estimated using 145 RILs common to the three studies
(Table S1).
The RNA-seq map reduces the average distance between markers from 7,5 cM for
the 69 marker map and 1 cM for the pheno2geno map to 0.6 cM (Table 2), closing
many existing gaps in marker coverage (Figure 6). In addition, the RNA-seq map
captures 1297 crossovers as compared to 1137 in the original map. The number of
crossovers observed with the pheno2geno map (1366 cross-overs) is likely inflated
due to the imputation of the genotypic data to 100% (% genotyped in table 2).
Table 2. Summary of genetic maps for the Bay-0 x Sha RIL population based on 145 RILs
33
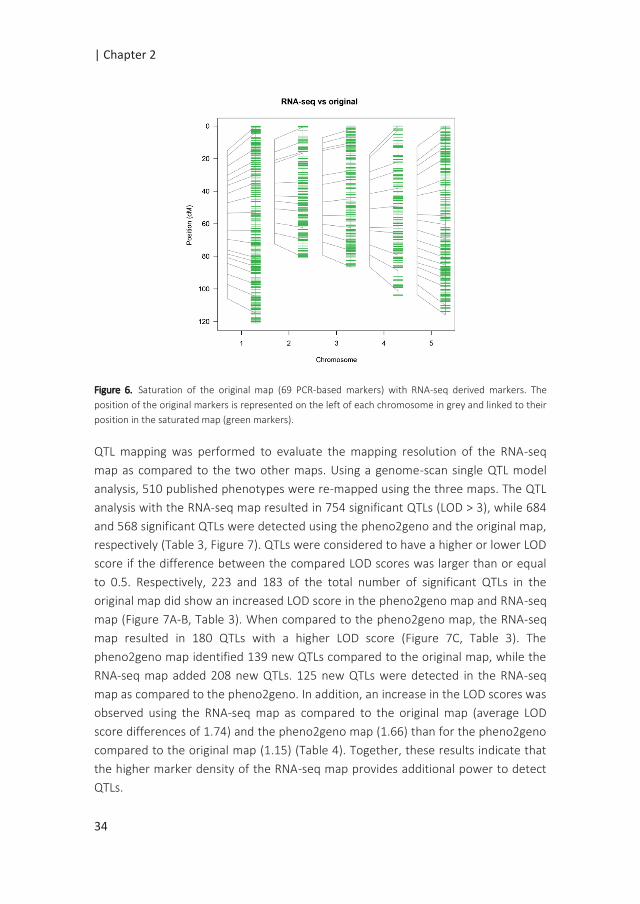
| Chapter 2
Figure 6. Saturation of the original map (69 PCR-based markers) with RNA-seq derived markers. The
position of the original markers is represented on the left of each chromosome in grey and linked to their
position in the saturated map (green markers).
QTL mapping was performed to evaluate the mapping resolution of the RNA-seq
map as compared to the two other maps. Using a genome-scan single QTL model
analysis, 510 published phenotypes were re-mapped using the three maps. The QTL
analysis with the RNA-seq map resulted in 754 significant QTLs (LOD > 3), while 684
and 568 significant QTLs were detected using the pheno2geno and the original map,
respectively (Table 3, Figure 7). QTLs were considered to have a higher or lower LOD
score if the difference between the compared LOD scores was larger than or equal
to 0.5. Respectively, 223 and 183 of the total number of significant QTLs in the
original map did show an increased LOD score in the pheno2geno map and RNA-seq
map (Figure 7A-B, Table 3). When compared to the pheno2geno map, the RNA-seq
map resulted in 180 QTLs with a higher LOD score (Figure 7C, Table 3). The
pheno2geno map identified 139 new QTLs compared to the original map, while the
RNA-seq map added 208 new QTLs. 125 new QTLs were detected in the RNA-seq
map as compared to the pheno2geno. In addition, an increase in the LOD scores was
observed using the RNA-seq map as compared to the original map (average LOD
score differences of 1.74) and the pheno2geno map (1.66) than for the pheno2geno
compared to the original map (1.15) (Table 4). Together, these results indicate that
the higher marker density of the RNA-seq map provides additional power to detect
QTLs.
34
A new genetic map from RNA-seq data |
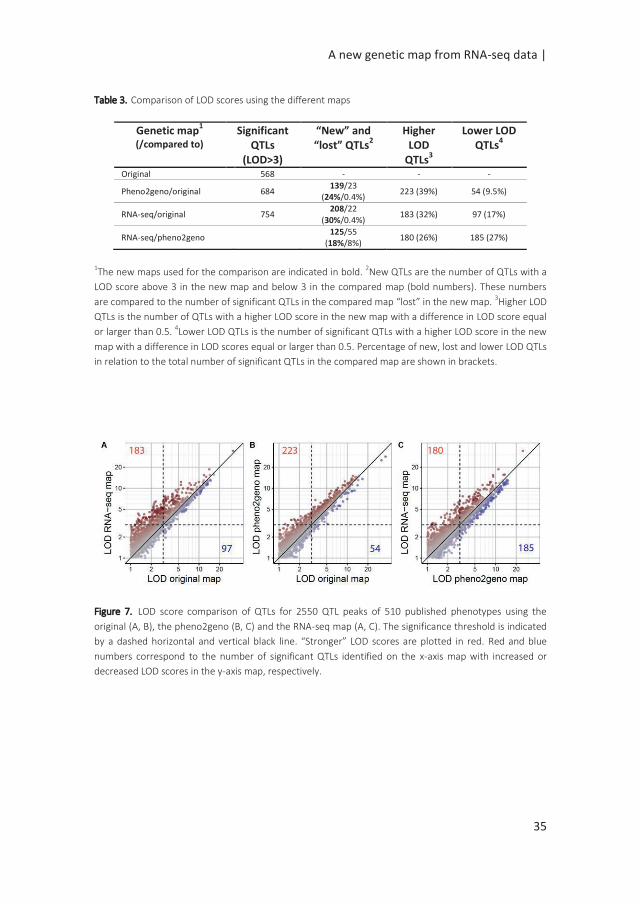
Table 3. Comparison of LOD scores using the different maps
Genetic map1
(/compared to)
Significant QTLs
(LOD>3)
“New” and “lost” QTLs
2 Higher
LOD QTLs
3
Lower LOD QTLs
4
Original 568 - - -
Pheno2geno/original 684 139/23
(24%/0.4%) 223 (39%) 54 (9.5%)
RNA-seq/original 754 208/22
(30%/0.4%) 183 (32%) 97 (17%)
RNA-seq/pheno2geno 125/55
(18%/8%) 180 (26%) 185 (27%)
1The new maps used for the comparison are indicated in bold. 2New QTLs are the number of QTLs with a
LOD score above 3 in the new map and below 3 in the compared map (bold numbers). These numbers
are compared to the number of significant QTLs in the compared map “lost” in the new map. 3Higher LOD
QTLs is the number of QTLs with a higher LOD score in the new map with a difference in LOD score equal
or larger than 0.5. 4Lower LOD QTLs is the number of significant QTLs with a higher LOD score in the new
map with a difference in LOD scores equal or larger than 0.5. Percentage of new, lost and lower LOD QTLs
in relation to the total number of significant QTLs in the compared map are shown in brackets.
Figure 7. LOD score comparison of QTLs for 2550 QTL peaks of 510 published phenotypes using the
original (A, B), the pheno2geno (B, C) and the RNA-seq map (A, C). The significance threshold is indicated
by a dashed horizontal and vertical black line. “Stronger” LOD scores are plotted in red. Red and blue
numbers correspond to the number of significant QTLs identified on the x-axis map with increased or
decreased LOD scores in the y-axis map, respectively.
35
| Chapter 2
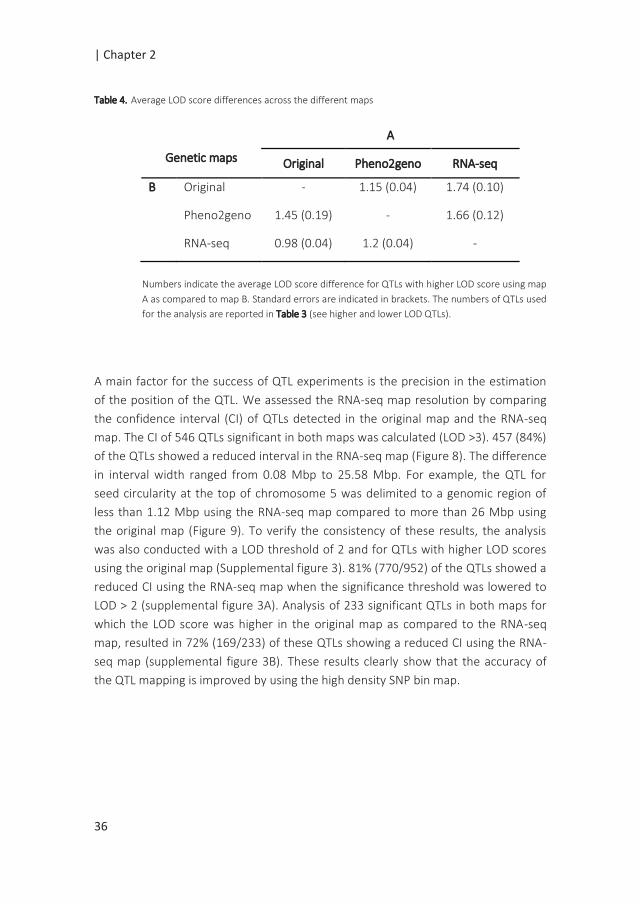
Table 4. Average LOD score differences across the different maps
A
Genetic maps Original Pheno2geno RNA-seq
B Original - 1.15 (0.04) 1.74 (0.10)
Pheno2geno 1.45 (0.19) - 1.66 (0.12)
RNA-seq 0.98 (0.04) 1.2 (0.04) -
Numbers indicate the average LOD score difference for QTLs with higher LOD score using map
A as compared to map B. Standard errors are indicated in brackets. The numbers of QTLs used
for the analysis are reported in Table 3 (see higher and lower LOD QTLs).
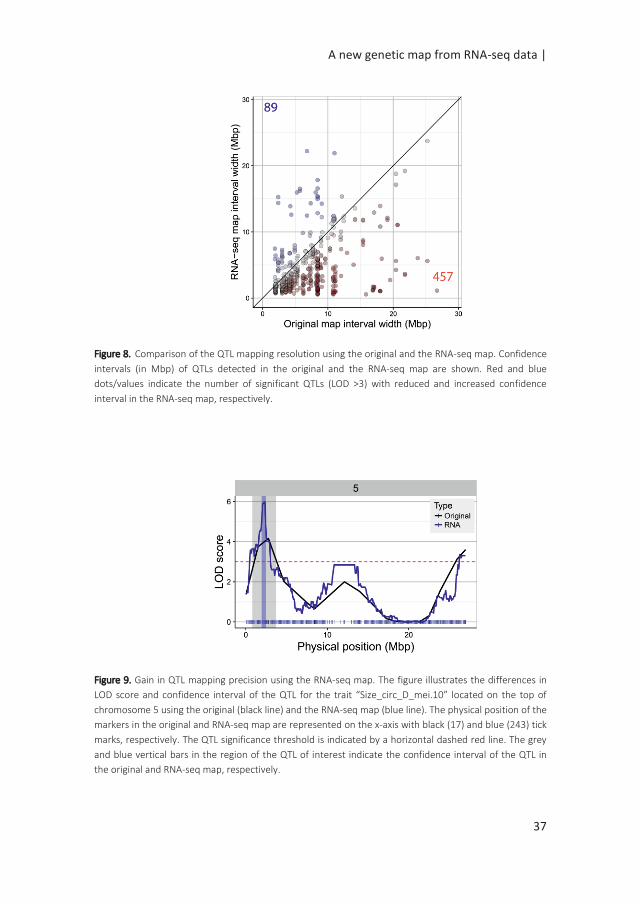
A main factor for the success of QTL experiments is the precision in the estimation
of the position of the QTL. We assessed the RNA-seq map resolution by comparing
the confidence interval (CI) of QTLs detected in the original map and the RNA-seq
map. The CI of 546 QTLs significant in both maps was calculated (LOD >3). 457 (84%)
of the QTLs showed a reduced interval in the RNA-seq map (Figure 8). The difference
in interval width ranged from 0.08 Mbp to 25.58 Mbp. For example, the QTL for
seed circularity at the top of chromosome 5 was delimited to a genomic region of
less than 1.12 Mbp using the RNA-seq map compared to more than 26 Mbp using
the original map (Figure 9). To verify the consistency of these results, the analysis
was also conducted with a LOD threshold of 2 and for QTLs with higher LOD scores
using the original map (Supplemental figure 3). 81% (770/952) of the QTLs showed a
reduced CI using the RNA-seq map when the significance threshold was lowered to
LOD > 2 (supplemental figure 3A). Analysis of 233 significant QTLs in both maps for
which the LOD score was higher in the original map as compared to the RNA-seq
map, resulted in 72% (169/233) of these QTLs showing a reduced CI using the RNA-
seq map (supplemental figure 3B). These results clearly show that the accuracy of
the QTL mapping is improved by using the high density SNP bin map.
36
A new genetic map from RNA-seq data |
Figure 8. Comparison of the QTL mapping resolution using the original and the RNA-seq map. Confidence
intervals (in Mbp) of QTLs detected in the original and the RNA-seq map are shown. Red and blue
dots/values indicate the number of significant QTLs (LOD >3) with reduced and increased confidence
interval in the RNA-seq map, respectively.
Figure 9. Gain in QTL mapping precision using the RNA-seq map. The figure illustrates the differences in
LOD score and confidence interval of the QTL for the trait “Size_circ_D_mei.10” located on the top of
chromosome 5 using the original (black line) and the RNA-seq map (blue line). The physical position of the
markers in the original and RNA-seq map are represented on the x-axis with black (17) and blue (243) tick
marks, respectively. The QTL significance threshold is indicated by a horizontal dashed red line. The grey
and blue vertical bars in the region of the QTL of interest indicate the confidence interval of the QTL in
the original and RNA-seq map, respectively.
37
| Chapter 2
Discussion
High-density genetic map
In this study we showed that RNA-seq data can effectively be used for SNP calling,
RIL genotyping and the development of a high-density genetic linkage map. The
used binning approach resulted in 1059 high-quality multi-SNP based markers,
providing a dense and equal coverage of markers physically anchored to the
genome. The high marker density enabled more precise identification of
recombination breakpoints and revealed unknown recombination breakpoints
within the RIL population (Table 2). As a result, the mapping resolution is no longer
limited by the number of markers but rather depends on the number of
recombination events captured by the mapping population. This means that the
advantages of high-density genetic maps in respect to mapping resolution will be
considerably improved in combination with larger and/or more advanced designed
populations (Balasubramanian et al. 2009; Kover et al. 2009; Liu et al. 2016). In
comparison to the available genetic maps, the RNA-seq map could substantially
increase QTLs linkage, eventually resulting in the identification of new QTLs (Table
3). Although, the pheno2geno map showed a larger number of QTLs with higher
LOD scores compared to the original map (Table 3), the RNA-seq map considerably
increased the LOD scores of significant QTLs compared to both the original and the
pheno2geno map (Table 4). Although we focussed in this study on the highest QTL
per chromosome and per trait, we expect the RNA-seq map to also increase the
overall number of QTLs after a more comprehensive analysis.
Gain in QTL mapping resolution
The detection power and resolution of QTL mapping is significantly improved by high
density genetic maps as compared to traditional markers (Yu et al. 2011). With the
RNA-seq map, a major improvement was observed in the reduction of the LOD-1
confidence intervals for 74% of the investigated QTLs. As a QTL CI in general
encompasses a large number of genes, reduced confidence intervals is of great
benefit to narrow down the number of candidate genes for further investigation. In
genetical genomics experiments, eQTLs can be identified as being either cis- or
trans-regulated. Commonly, the distinction of both is made based on the distance,
in cM or Mbp, between the gene and the eQTL peak or from the confidence interval
of the eQTL (West et al. 2007; Keurentjes et al. 2007b; Lowry et al. 2013; Cubillos et
al. 2014; Terpstra et al. 2010; Snoek et al. 2012; Drost et al. 2015; Ranjan et al. 2016;
Li et al. 2006; Li et al. 2010; Vinuela et al. 2010; Rockman et al. 2010; Aylor et al.
38
A new genetic map from RNA-seq data |
2011; King et al. 2014; Sterken et al. 2017; Snoek et al. 2017b). Therefore, gain in
mapping precision is also likely to contribute to a more accurate identification of cis-
versus trans-eQTLs.
Advantages and limitations of using RNA-seq data
The use of RNA-seq presents several advantages over other methods. Our results
show that RNA-seq data is a convenient and cost-effective source of SNP discovery ,
especially when a population is anyhow subjected to an eQTL analysis with the help
of RNA-seq. RNA-seq can also overcome shortcomings identified from expression
arrays based studies: while the effect of a SNP on the probe has enabled the
identification of new sequence polymorphisms, weakened hybridization on
microarrays based on expression studies can also cause the detection of false cis-
eQTLs (Alberts et al. 2007; Chen et al. 2009). Furthermore, RNA-seq has the
potential to study more complex levels of the genetic control of gene expression, for
instance by quantification of alternative splicing (Filichkin et al. 2010; Yoo et al.
2016).
SNPs that are found with RNA-seq are inherently restricted to expressed exons, thus
dependent on the developmental stage of the sequenced material and the
experimental conditions. This restriction can also cause regions with low gene
density or lowly expressed genes to be under represented. However, these
disadvantages will often not affect the mapping due to the high number of
intermediate to highly expressed genes in any tissue and the SNPs present in those
genes. Although our approach finds variants that affect protein-coding sequences, it
is largely blind to SNPs in promoters, introns and intergenic regions. Since exons are
under high purifying selection pressure, they are evolutionary more conserved than
intronic and intergenic regions and therefore harbour less polymorphisms. However,
SNPs that are causal for phenotypic variation will often be found in or close to genes
and therefore, SNPs in large non-genic regions will hardly result in improvements of
quantitative traits mapping (Li et al. 2012). In view of the abundance and saturation
of SNPs that were discovered in this study, this does not cause a disadvantage, but
might limit SNP detection for crosses from nearly identical parents.
39
| Chapter 2
Conclusion
This study demonstrates that RNA-seq data can effectively be used for SNP
discovery and the development of high-density genetic linkage maps. Here we
provide a new SNP based saturated genetic map for a Bay x Sha RIL population. This
saturated genetic map resulted in higher precision QTL mapping with more QTLs
and considerably reducing the QTL confidence intervals. Such improvements are of
great benefit for the accurate mapping of more complex traits and the identification
of causal genes.
The Supplementary material for this chapter can be found online at:
https://www.frontiersin.org/articles/10.3389/fgene.2017.00201/full#supplementary
-material
40
Chapter 3
Quantitative trait loci associated with G x E
for seed performance
Elise A. R. Serin, Basten L. Snoek, Harm Nijveen, Leo A. J. Willems, Henk W. M.
Hilhorst and Wilco Ligterink
In preparation
| Chapter 3
Abstract
High quality seeds are required to meet optimal conditions for plant survival. A
seed’s innate quality is determined during seed development, tightly controlled
by the mother plant’s genetic make-up and affected by the environment. The
interaction between genotype and environment results in substantial
phenotypic variation in seed performance. Using natural variation, we aimed to
unravel the effect of the seed production environment on the genetic
architecture of seed quality traits. An Arabidopsis thaliana Bay-0 x Shahdara
recombinant inbred line population was grown in four different seed
production environments: standard, high temperature, high light and low
phosphate conditions. The seeds harvested were used for an extensive
germination phenotyping assay under standard and mild stress conditions.
Quantitative trait loci (QTL) analyses identified many environmental sensitive
QTLs (QTL x E).Variation in the QTL effects was largely determined by the
germination conditions and the effect of the maternal environment was
observed at the individual germination QTL level. Using heterogeneous inbred
families, we confirmed one QTL strongly affected by high temperature
maternal environment and suggested potential candidate genes. Together, our
findings highlight the extensive environmental modulation of the genetic
influence on seed performance. These data provide a system view of the seed’s
complex genetic architecture underlying genotype-by-environment
interactions.
Keywords: Arabidopsis thaliana, maternal environment, QTL x E, seed
performance
42
QTL x E for seed performance |
Introduction
Seed performance can be defined as the timing and level of seed germination,
critical in the early stages of the plant’s life cycle as it ultimately determines the
survival of the species (Postmaa 2016). Seed performance relies on the quality
of the seeds defined by the seed physical and physiological attributes. These
attributes are acquired during seed development on the mother plant.
Essential seed quality characteristics are the ability of the seed to germinate
fast and uniformly under a wide range of conditions (vigour), to possess high
genetic purity, to be stored for a long period of time without losing viability and
the capability to establish a healthy seedling (Dickson 1980). The timing of
germination is also controlled by seed dormancy which allows the seed to
overcome unfavourable periods for seedling establishment (Bentsink and
Koornneef 2008). Through this mechanism, germination can be put on hold for
long periods of time (Finch-Savage and Footitt 2015). Primary dormancy can be
released by a period of dry storage termed after-ripening. A quick release of
dormancy can be accomplished by stratification which is a dark and cold
treatment applied to imbibed seeds prior to germination. Another determinant
of the success of germination is the post-dispersal environments of non-
dormant seeds. Unfavourable germination conditions can reduce, delay or
prevent seed germination (Joosen et al. 2012).
Plants are sessile organisms constantly challenged by fluctuations in their
environment and need therefore to adjust their phenotype and/or evolve
adaptive mechanisms (Walck et al. 2011). Seed set is a crucial phase in plant’s
life cycle, yet particularly sensitive to environmental stresses (Springthorpe and
Penfield 2015; Bac-Molenaar et al. 2015). Both at the vegetative and
reproductive stage, the mother plant as well as the developing zygote process
these environmental cues (Penfield and MacGregor 2017). Environmental
factors such as temperature (Kendall and Penfield 2012; Penfield et al. 2005;
Fenner 1991; Huang et al. 2014), light quality and intensity (Vayda et al. 2018;
He et al. 2014; Contreras 2008), photoperiod (Munir et al. 2001) and nutrient
availability (He et al. 2014; Hacisalihoglu et al. 2018) have been shown to affect
many plant and seed traits. Several studies suggested that the maternal
environment provides a mean to adjust the timing of germination (Donohue
2009; He et al. 2014; Leverett et al. 2016; Edwards et al. 2016). As example,
high temperature during seed development resulted in reduced seed
dormancy (Fenner 1991), while seed maturation under cold conditions can
induce strong dormancy (Chiang et al. 2011; Donohue 2009).
43
| Chapter 3
The existing natural variation has resulted in many studies investigating the
genetic basis of dormancy in Arabidopsis (Bentsink et al. 2010; Silady et al.
2011) and seed germination in Arabidopsis (Joosen et al. 2012; Laserna et al.
2008; Meng et al. 2008; Ren et al. 2010; Vallejo et al. 2010) as well as in other
crops (Basnet et al. 2015; Kazmi et al. 2012). Genetic variation was also
observed for the effect of the maternal environment in panels of different
genotypes (Munir et al. 2001) and the detection of significant genotype-by-
environment interactions (He et al. 2014; Nicotra et al. 2010; El-Soda et al.
2014). A few studies have brought insight in G x E at the QTL level, showing that
the maternal environment could interact with the QTLs (Postma and Agren
2015; Kerdaffrec and Nordborg 2017). The focus of these studies was mainly on
seed dormancy in view of the trait’s ecological implications (Donohue 2009).
Additional knowledge on seed vigour would provide a more comprehensive
understanding of seed performance and its plasticity (Finch-Savage and Bassel
2016; Nicotra et al. 2010; El-Soda et al. 2014).
The genetic and environmental components of seed performance can be
determined by replicating genotypes under uniform environments. In classical
linkage analysis, the natural variation comprised in recombinant inbred
populations is a powerful tool to detect quantitative trait loci (QTLs) (Koornneef
et al. 2004). In addition, tools to maximize the information about the
environment in large multi-trait and multi-environment experiments can bring
substantial insight into QTL x E (Malosetti et al. 2013; Joosen et al. 2012; Boer
et al. 2007).
In this study, we used the Arabidopsis recombinant inbred line (RIL) population
derived from two Arabidopsis ecotypes: Bayreuth (Bay-0) and Shahdara (Sha)
(Loudet et al. 2002). The different natural habitat of these two ecotypes
confers those differences in stress sensitivity making the derived Bay-0 x Sha
RIL population suitable to investigate the genetic basis of stress responses. The
parental lines and the RIL population were grown under standard and different
mild stress conditions, from flowering until seed harvested. The conditions
tested were high temperature, high light and low phosphate which were shown
to significantly affect plant and seed traits (He et al. 2014). The harvested seeds
were phenotyped for germination characteristics under a wide range of
conditions.
Many of the germination QTLs identified showed QTL x E which was consistent
with the large G x E effect observed at the phenotypic level. We used
heterogeneous inbred families (HIFs) and RNA-seq expression data to narrow
44
QTL x E for seed performance |
down the region of an interesting environment specific QTL and suggest
potential candidate genes.
Material and methods
Plant and growth conditions
In this study, we used the 165 lines of the Arabidopsis Bayreuth (Bay-0) x
Shahdara (Sha) recombinant inbred line core collection (Loudet et al. 2002).
These RILs, as well as the parental lines, were sown on imbibed filter paper
placed in individual petri dishes and stratified (4 days at 4°C in the dark). The
sowing of the seeds differed in time based on an estimated flowering time of
the RILs from previous experiments (Joosen et al. 2012) in an attempt to
synchronize flowering. The seeds were then left to germinate in incubators
with continuous light at 22°C. At radicle protrusion, 16 seeds per line were
transferred to Rockwool blocks, with one seed per block. The plants were
further grown in a controlled climate cell with a day/night cycle of 16h/8h at
22°C/18° with a light intensity of 150 μmol m–2 s–1 and 70% relative humidity
The blocks were placed on an ebb and flow table that dispensed standard
nutrient solution (Supplemental Table S1) to the plants three times a week.
When all plants reached flowering, their stems and branches were cut short in
order to ensure the complete development of the seeds under each controlled
mild stress condition. 3 to 4 plants per line were transferred to different
climate cells. The controlled stresses applied were high temperature (HT)
(25°C/23°C), high light (HL) (300 μmol m–2 s–1) and low phosphate nutritive
solution (LP) (12,5 mM). The plants were allowed to grow under the different
conditions until seed harvest. At the time all plants in a given condition
produced a sufficient amount of fully matured seeds, seeds were bulk
harvested from 3-4 plants per line. A fraction of the fresh harvested seeds was
dried and stored at -80°C in sealed 2 ml tubes, while the remaining seeds were
stored in paper bags placed in a cupboard at ambient room temperature for
after-ripening.
45

| Chapter 3
Phenotyping
Seed phenotyping was performed as described previously in He et al. (2014).
Seed size was determined by taking pictures of approximately 500 seeds on
white filter paper using a Nikon D80 camera. Pictures were analysed using
ImageJ. The same seeds were carefully transferred into weighing cup and
weighed with an AD-4 Autobalance (PerkinElmer, Inc.). Single seed weight was
determined by dividing the total weight by the number of seeds.
Germination experiments were performed using the GERMINATOR set-up
described in Joosen et al. (2010). Seeds were sown on two layers of blue filter
paper (Anchor paper company, St Paul, MN, USA; www.seedpaper.com) with
48 ml of demi-water. Up to 6 seed batches were sown on the same filter paper.
Automatic scoring of seed germination was performed using a mounted
camera system. Pictures were taken one to three times a day for 5 up to 10
days after sowing, until green cotyledons became visible.
The curve fitting module of the GERMINATOR was used to analyse the general
cumulative germination data. Gmax was measured as the total seed
germination percentage. The time needed to reach 10 or 50 % of total
germination (t10, t50) were calculated when more than 10% of germination
was reached. The calculation of the area under the germination curve (AUC)
was extended to 300 hours in order to capture the phenotypic variation under
all germination conditions. The germination tests were performed using
approximately 50 seeds per experiment. Two independent experiments were
performed to obtain replicated phenotypic values.
The germination potential of the fresh harvested seeds (Gmax fresh) and
release of primary dormancy were determined by performing weekly
germination experiments. Seeds were considered fully after-ripened if the
percentage of germination reached more than 90% in two consecutive
germination experiments. Fully after-ripened seeds were transferred to sealed
Eppendorf tubes and stored at -80°C to prevent loss of viability during storage.
The DSDS50 was calculated as the number of days of seed dry storage required
to reach 50% germination (Bentsink et al. 2010).
The vigour of the seeds was assessed on fully after-ripened seeds by
germinating the seeds in twelve different germination conditions. These
germination experiments to test seed vigour were started when more than
80% of the lines were fully after-ripened, as described above. Seeds were
germinated in demineralized water in standard germination condition.
Germination experiments in sub-optimal conditions were conducted at high
46
QTL x E for seed performance |
(32°C) and low (10°C) temperatures, under osmotic stress (-0.6 MPa mannitol;
Sigma Aldrich); under salt stress (100 mM NaCl; Sigma Aldrich) and in ABA (0.25
µM ABA, Duchefa Biochemie). Germination experiments in these conditions
were performed with and without stratification. Stratification consisted of
storage of the sowed imbibed seeds in the dark for 4 days at 4°C prior to
germination. Since the stratification effect can induce variation in stress
sensitivity, we adjusted the concentrations for the NaCl and ABA treatments to
125 mM NaCl and 0.5 µM ABA for the experiments with stratification. NaCl,
mannitol and ABA stress treatments were performed by adding solutions of the
indicated concentrations to the filter paper instead of demi-water prior to
stratification.
Seed longevity was assessed by a controlled seed deterioration test. Dry seeds
were incubated at 40°C at 85% relative humidity in a closed tank in the
presence of a saturated ZnSO4 solution. After five days, seeds were removed
and germinated in standard conditions as described above.
Data analysis
Previous studies showed no difference in the QTL mapping performed using
transformed and non-transformed germination data (Joosen et al. 2012).
Therefore, due to the large number of traits, all analyses were performed on
untransformed data. Boxplots were generated with the standard R boxplot
function. Spearman correlation coefficients between traits were calculated and
displayed in heatmaps using R.
ANOVA analyses
ANOVA analysis was performed for phenotypic mean comparison of the seed
traits measured in the RILs grown under the four maternal environments. Post-
hoc Tukey test was then used at the confidence level of 0.95 to determine
pairwise group significant differences.
Genotype-by-environment interactions
For each germination environment, the extent of the effect of the genotype,
maternal environment and genotype-by-environment interaction on the
phenotypic variation was determined using the linear model:
Y = µ + G + ME + (G x ME) + ɛ
Where Y is the individual performance, µ is the general mean, G is the effect of
the genotype, ME is the fixed effect of the maternal environment, G x ME is the
47
| Chapter 3
genotype by maternal environment interaction and ɛ the residual error. The
relative contribution of the variance components to the total phenotypic
variation was determined as the ratio of the sum of squares of each
component to the total sum of squares.
Mapping plasticity QTLs
Trait plasticity was determined as the response to germination in sub-optimal
conditions as (germination in standard + stratification) – (germination in stress
+ stratification) or (germination in standard – germination in stress). For these
traits, we mapped plasticity QTLs. The QTL mapping was performed on these
values by fitting the following model:
Y = µ + G + (G x ME) + (G x GE) + (G x S) + (G x ME x GE) + (G x ME x S) + (G x GE
x S) + (G x ME x GE x S) + ɛ
Where Y is the performance at each marker, µ the phenotypic mean, G is the
effect of the genotype, ME is the effect of the maternal environment, GE is the
effect of the germination environment, (ME x GE) is the interaction between
the maternal and the germination environment, S is the effect of the
stratification treatment and ɛ is the residual error. Terms in brackets
correspond to interactions between the components of the model.
Heritability
For each trait in each maternal environment (ME), the broad-sense heritability
(H2) was calculated from estimated variances as H2 = σ2G / (σ
2G+ σ
2E) where
σ2G is the genetic variance and σ2E is the environmental variance. The
variance component analysis was analysed using a two-step mixed model
approach (REML) from the preliminary single environment analysis in Genstat
(18th Edition). Genotype and replicate were set as random effects in the
model.
QTL analysis
The mapping was performed using a genetic map for the Bay-0 x Sha
population derived from RNA-seq data (Serin et al. 2017). Briefly, the
genotyping of 160 RILs resulted in the identification of 1059 polymorphic
markers between the two parental lines. In total, the map spans 471 cM. To
reduce the computational time and model complexity of the multiple
environments QTL x E analysis, the number of markers was reduced to 221
markers (Supplemental Table S1).
48
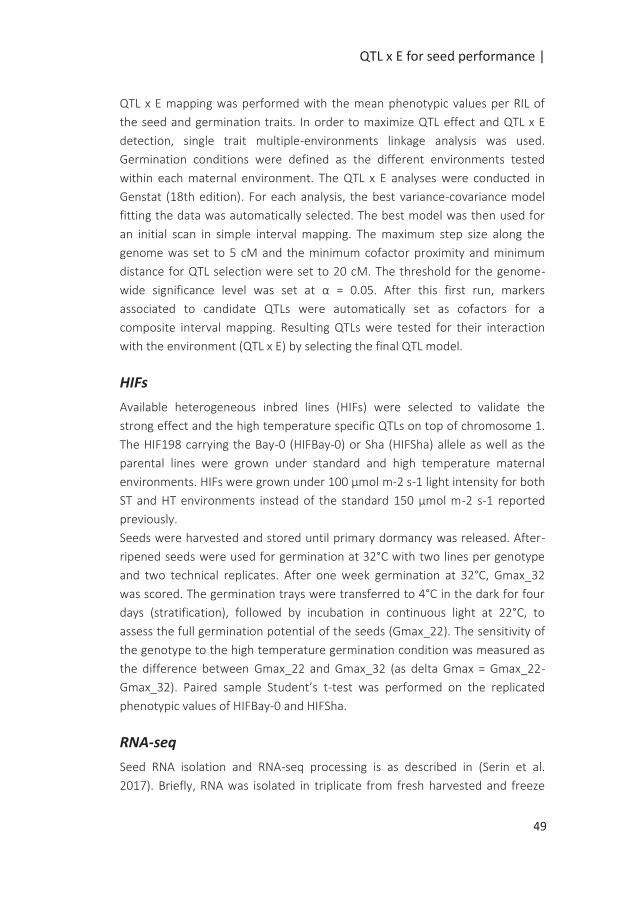
QTL x E for seed performance |
QTL x E mapping was performed with the mean phenotypic values per RIL of
the seed and germination traits. In order to maximize QTL effect and QTL x E
detection, single trait multiple-environments linkage analysis was used.
Germination conditions were defined as the different environments tested
within each maternal environment. The QTL x E analyses were conducted in
Genstat (18th edition). For each analysis, the best variance-covariance model
fitting the data was automatically selected. The best model was then used for
an initial scan in simple interval mapping. The maximum step size along the
genome was set to 5 cM and the minimum cofactor proximity and minimum
distance for QTL selection were set to 20 cM. The threshold for the genome-
wide significance level was set at α = 0.05. After this first run, markers
associated to candidate QTLs were automatically set as cofactors for a
composite interval mapping. Resulting QTLs were tested for their interaction
with the environment (QTL x E) by selecting the final QTL model.
HIFs
Available heterogeneous inbred lines (HIFs) were selected to validate the
strong effect and the high temperature specific QTLs on top of chromosome 1.
The HIF198 carrying the Bay-0 (HIFBay-0) or Sha (HIFSha) allele as well as the
parental lines were grown under standard and high temperature maternal
environments. HIFs were grown under 100 µmol m-2 s-1 light intensity for both
ST and HT environments instead of the standard 150 µmol m-2 s-1 reported
previously.
Seeds were harvested and stored until primary dormancy was released. After-
ripened seeds were used for germination at 32°C with two lines per genotype
and two technical replicates. After one week germination at 32°C, Gmax_32
was scored. The germination trays were transferred to 4°C in the dark for four
days (stratification), followed by incubation in continuous light at 22°C, to
assess the full germination potential of the seeds (Gmax_22). The sensitivity of
the genotype to the high temperature germination condition was measured as
the difference between Gmax_22 and Gmax_32 (as delta Gmax = Gmax_22-
Gmax_32). Paired sample Student’s t-test was performed on the replicated
phenotypic values of HIFBay-0 and HIFSha.
RNA-seq
Seed RNA isolation and RNA-seq processing is as described in (Serin et al.
2017). Briefly, RNA was isolated in triplicate from fresh harvested and freeze
49
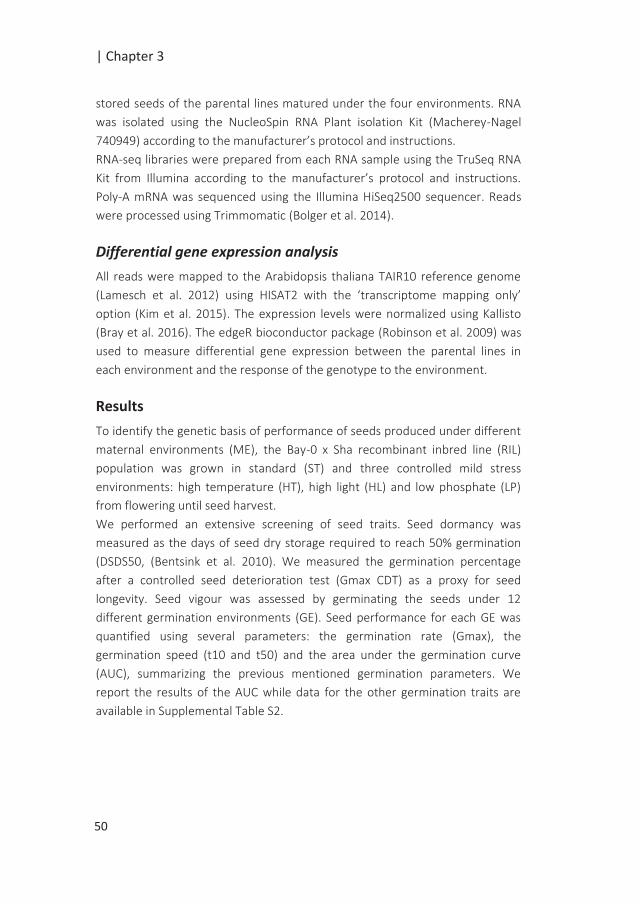
| Chapter 3
stored seeds of the parental lines matured under the four environments. RNA
was isolated using the NucleoSpin RNA Plant isolation Kit (Macherey-Nagel
740949) according to the manufacturer’s protocol and instructions.
RNA-seq libraries were prepared from each RNA sample using the TruSeq RNA
Kit from Illumina according to the manufacturer’s protocol and instructions.
Poly-A mRNA was sequenced using the Illumina HiSeq2500 sequencer. Reads
were processed using Trimmomatic (Bolger et al. 2014).
Differential gene expression analysis
All reads were mapped to the Arabidopsis thaliana TAIR10 reference genome
(Lamesch et al. 2012) using HISAT2 with the ‘transcriptome mapping only’
option (Kim et al. 2015). The expression levels were normalized using Kallisto
(Bray et al. 2016). The edgeR bioconductor package (Robinson et al. 2009) was
used to measure differential gene expression between the parental lines in
each environment and the response of the genotype to the environment.
Results
To identify the genetic basis of performance of seeds produced under different
maternal environments (ME), the Bay-0 x Sha recombinant inbred line (RIL)
population was grown in standard (ST) and three controlled mild stress
environments: high temperature (HT), high light (HL) and low phosphate (LP)
from flowering until seed harvest.
We performed an extensive screening of seed traits. Seed dormancy was
measured as the days of seed dry storage required to reach 50% germination
(DSDS50, (Bentsink et al. 2010). We measured the germination percentage
after a controlled seed deterioration test (Gmax CDT) as a proxy for seed
longevity. Seed vigour was assessed by germinating the seeds under 12
different germination environments (GE). Seed performance for each GE was
quantified using several parameters: the germination rate (Gmax), the
germination speed (t10 and t50) and the area under the germination curve
(AUC), summarizing the previous mentioned germination parameters. We
report the results of the AUC while data for the other germination traits are
available in Supplemental Table S2.
50

QTL x E for seed performance |
Phenotypic variation of seed traits
Overall, large phenotypic variation was observed for the RILs as a result of
differences between the parental lines. Under all maternal environments, Sha
had a higher level of dormancy indicated by a lower percentage of germination
for fresh harvested seeds (Figure 1A) and higher DSDS50 values (Figure 1B) as
compared to Bay-0. Sha had smaller imbibed seed size as compared to Bay-0
(Figure 1F), while Bay-0 was more sensitive to the deterioration treatment as
compared to Sha (Figure 1C). In general, seed maturation under the different
environments resulted in significant phenotypic differences for seed and
germination traits. Maturation under HT resulted in significantly smaller seeds
with a lower dormancy levels (Figure 1 A, B, E), while HL increased dormancy as
compared to the ST maternal environment (Figure 1 A, B). The HL maternal
environment resulted in an increase in dry seed size, dry seed weight and
imbibed seed size (Figure 1 D, E, F) as well as significantly higher Gmax CDT
indicating a higher tolerance of the RILs to controlled deterioration treatment
(Figure 1C). The LP maternal environment resulted in increased dormancy
(Figure 1B) and significantly smaller dry seeds (Figure 1 E).
Large phenotypic variation was observed for the parental lines and the RILs for
the seed germination phenotypes (Figure 2). For most of the traits, the Bay-0
parent had lower phenotypic values as compared to Sha, indicating higher seed
vigour for the Sha parent. This was in line with the higher stress sensitivity
reported for Bay-0 as compared to Sha (Joosen et al. 2012; Vallejo et al. 2010).
Since the seeds used in the experiments were fully after-ripened, we found, as
expected, that most of the lines (> 80%) did germinate at a high percentage in
water (‘standard’ germination condition), while germination in sub-optimal
conditions resulted in larger phenotypic variation. Under some conditions,
transgression was observed, where substantial parts of the segregating
progenies were performing worse or better than both of the parental lines
(Figure 2).
51
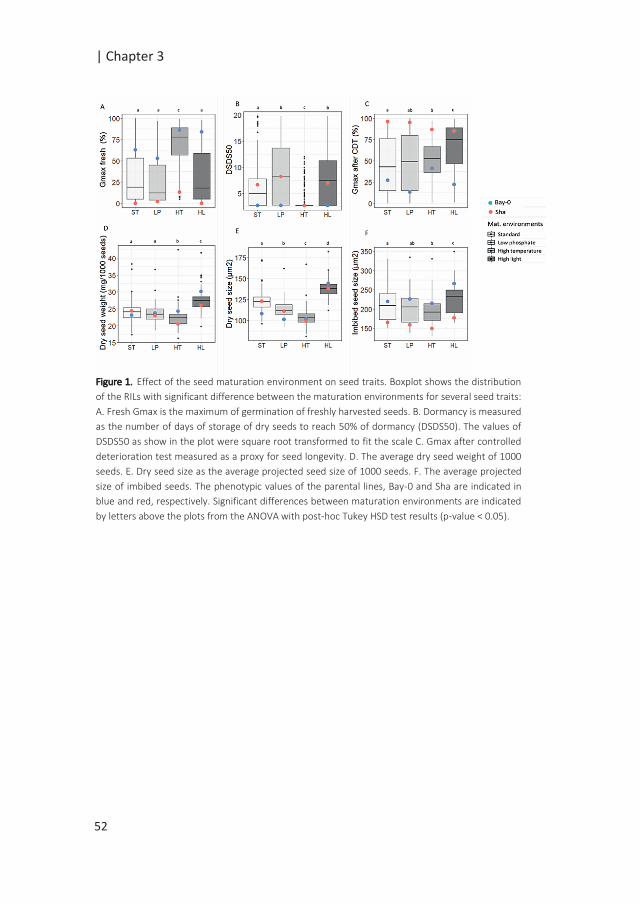
| Chapter 3
Figure 1. Effect of the seed maturation environment on seed traits. Boxplot shows the distribution
of the RILs with significant difference between the maturation environments for several seed traits:
A. Fresh Gmax is the maximum of germination of freshly harvested seeds. B. Dormancy is measured
as the number of days of storage of dry seeds to reach 50% of dormancy (DSDS50). The values of
DSDS50 as show in the plot were square root transformed to fit the scale C. Gmax after controlled
deterioration test measured as a proxy for seed longevity. D. The average dry seed weight of 1000
seeds. E. Dry seed size as the average projected seed size of 1000 seeds. F. The average projected
size of imbibed seeds. The phenotypic values of the parental lines, Bay-0 and Sha are indicated in
blue and red, respectively. Significant differences between maturation environments are indicated
by letters above the plots from the ANOVA with post-hoc Tukey HSD test results (p-value < 0.05).
52
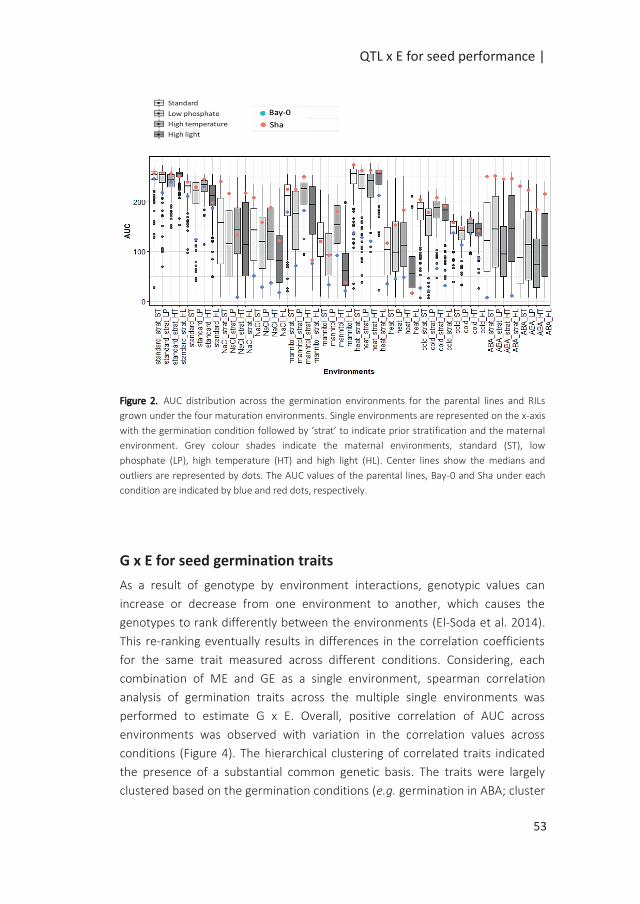
QTL x E for seed performance |
Figure 2. AUC distribution across the germination environments for the parental lines and RILs
grown under the four maturation environments. Single environments are represented on the x-axis
with the germination condition followed by ‘strat’ to indicate prior stratification and the maternal
environment. Grey colour shades indicate the maternal environments, standard (ST), low
phosphate (LP), high temperature (HT) and high light (HL). Center lines show the medians and
outliers are represented by dots. The AUC values of the parental lines, Bay-0 and Sha under each
condition are indicated by blue and red dots, respectively.
G x E for seed germination traits
As a result of genotype by environment interactions, genotypic values can
increase or decrease from one environment to another, which causes the
genotypes to rank differently between the environments (El-Soda et al. 2014).
This re-ranking eventually results in differences in the correlation coefficients
for the same trait measured across different conditions. Considering, each
combination of ME and GE as a single environment, spearman correlation
analysis of germination traits across the multiple single environments was
performed to estimate G x E. Overall, positive correlation of AUC across
environments was observed with variation in the correlation values across
conditions (Figure 4). The hierarchical clustering of correlated traits indicated
the presence of a substantial common genetic basis. The traits were largely
clustered based on the germination conditions (e.g. germination in ABA; cluster
53
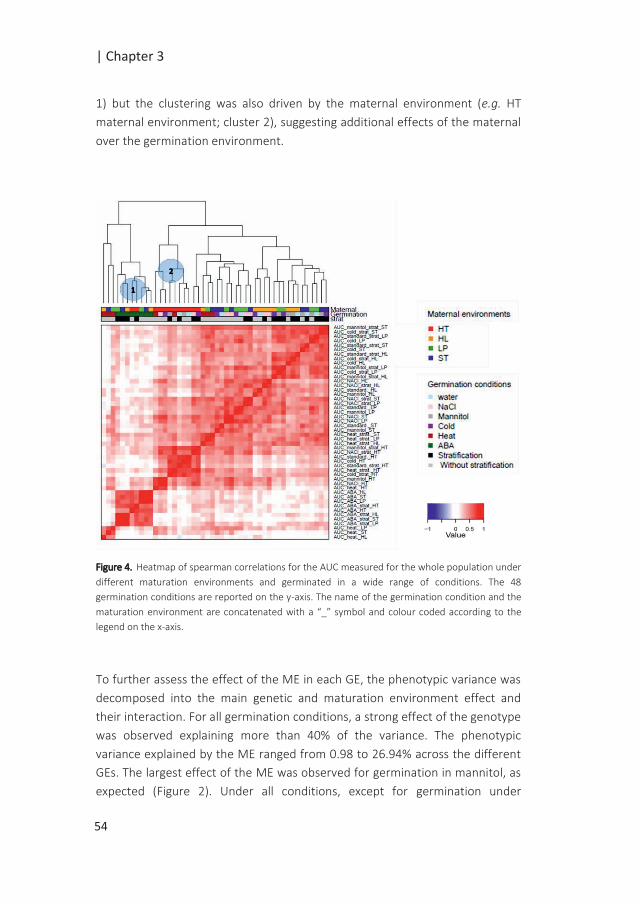
| Chapter 3
1) but the clustering was also driven by the maternal environment (e.g. HT
maternal environment; cluster 2), suggesting additional effects of the maternal
over the germination environment.
Figure 4. Heatmap of spearman correlations for the AUC measured for the whole population under
different maturation environments and germinated in a wide range of conditions. The 48
germination conditions are reported on the y-axis. The name of the germination condition and the
maturation environment are concatenated with a “_” symbol and colour coded according to the
legend on the x-axis.
To further assess the effect of the ME in each GE, the phenotypic variance was
decomposed into the main genetic and maturation environment effect and
their interaction. For all germination conditions, a strong effect of the genotype
was observed explaining more than 40% of the variance. The phenotypic
variance explained by the ME ranged from 0.98 to 26.94% across the different
GEs. The largest effect of the ME was observed for germination in mannitol, as
expected (Figure 2). Under all conditions, except for germination under
54
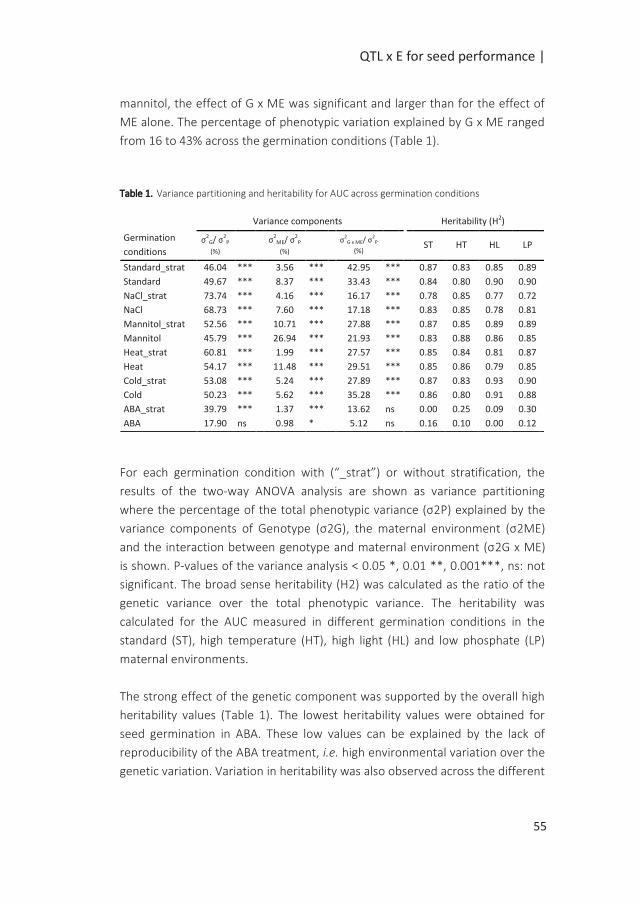
QTL x E for seed performance |
mannitol, the effect of G x ME was significant and larger than for the effect of
ME alone. The percentage of phenotypic variation explained by G x ME ranged
from 16 to 43% across the germination conditions (Table 1).
Table 1. Variance partitioning and heritability for AUC across germination conditions
For each germination condition with (“_strat”) or without stratification, the
results of the two-way ANOVA analysis are shown as variance partitioning
where the percentage of the total phenotypic variance (σ2P) explained by the
variance components of Genotype (σ2G), the maternal environment (σ2ME)
and the interaction between genotype and maternal environment (σ2G x ME)
is shown. P-values of the variance analysis < 0.05 *, 0.01 **, 0.001***, ns: not
significant. The broad sense heritability (H2) was calculated as the ratio of the
genetic variance over the total phenotypic variance. The heritability was
calculated for the AUC measured in different germination conditions in the
standard (ST), high temperature (HT), high light (HL) and low phosphate (LP)
maternal environments.
The strong effect of the genetic component was supported by the overall high
heritability values (Table 1). The lowest heritability values were obtained for
seed germination in ABA. These low values can be explained by the lack of
reproducibility of the ABA treatment, i.e. high environmental variation over the
genetic variation. Variation in heritability was also observed across the different
Variance components Heritability (H2)
Germination
conditions σ
2G/ σ
2P
(%)
σ
2ME/ σ
2P
(%)
σ
2G x ME/ σ
2P
(%)
ST HT HL LP
Standard_strat 46.04 ***
3.56 ***
42.95 ***
0.87 0.83 0.85 0.89
Standard 49.67 ***
8.37 ***
33.43 ***
0.84 0.80 0.90 0.90
NaCl_strat 73.74 ***
4.16 ***
16.17 ***
0.78 0.85 0.77 0.72
NaCl 68.73 ***
7.60 ***
17.18 ***
0.83 0.85 0.78 0.81
Mannitol_strat 52.56 ***
10.71 ***
27.88 ***
0.87 0.85 0.89 0.89
Mannitol 45.79 ***
26.94 ***
21.93 ***
0.83 0.88 0.86 0.85
Heat_strat 60.81 ***
1.99 ***
27.57 ***
0.85 0.84 0.81 0.87
Heat 54.17 ***
11.48 ***
29.51 ***
0.85 0.86 0.79 0.85
Cold_strat 53.08 ***
5.24 ***
27.89 ***
0.87 0.83 0.93 0.90
Cold 50.23 ***
5.62 ***
35.28 ***
0.86 0.80 0.91 0.88
ABA_strat 39.79 ***
1.37 ***
13.62 ns
0.00 0.25 0.09 0.30
ABA 17.90 ns
0.98 *
5.12 ns
0.16 0.10 0.00 0.12
55
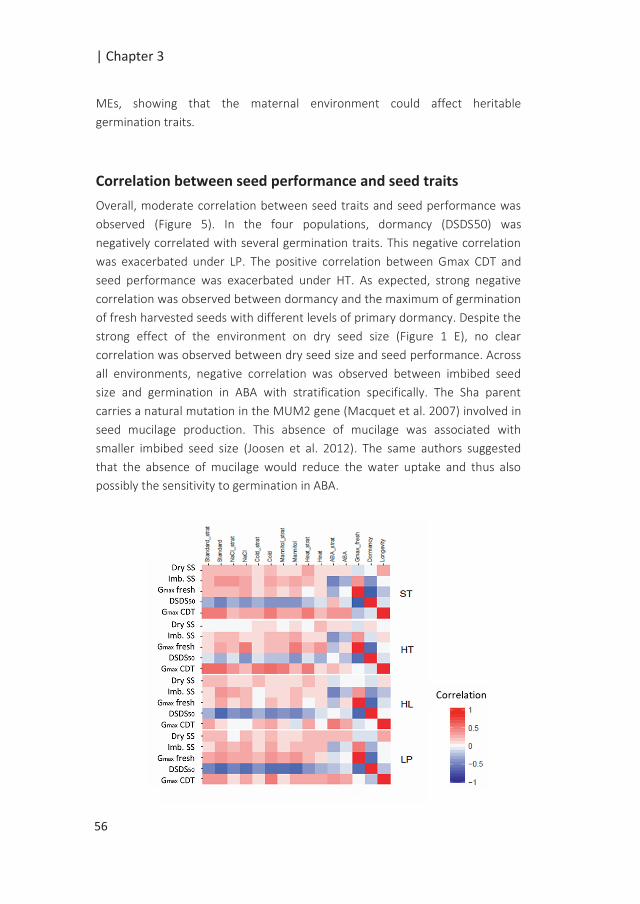
| Chapter 3
MEs, showing that the maternal environment could affect heritable
germination traits.
Correlation between seed performance and seed traits
Overall, moderate correlation between seed traits and seed performance was
observed (Figure 5). In the four populations, dormancy (DSDS50) was
negatively correlated with several germination traits. This negative correlation
was exacerbated under LP. The positive correlation between Gmax CDT and
seed performance was exacerbated under HT. As expected, strong negative
correlation was observed between dormancy and the maximum of germination
of fresh harvested seeds with different levels of primary dormancy. Despite the
strong effect of the environment on dry seed size (Figure 1 E), no clear
correlation was observed between dry seed size and seed performance. Across
all environments, negative correlation was observed between imbibed seed
size and germination in ABA with stratification specifically. The Sha parent
carries a natural mutation in the MUM2 gene (Macquet et al. 2007) involved in
seed mucilage production. This absence of mucilage was associated with
smaller imbibed seed size (Joosen et al. 2012). The same authors suggested
that the absence of mucilage would reduce the water uptake and thus also
possibly the sensitivity to germination in ABA.
56
QTL x E for seed performance |
QTL mapping with QTL x E
Two QTL mapping approaches were used to explore QTL-by-environment
interactions (QTL x E) for seed germination phenotypes. Single trait multiple-
environments linkage analysis was performed on the mean phenotypic values
of the AUC across germination conditions, for each maternal environment
(phenotypic QTLs). In the second approach, QTL mapping on the response
values measured as the difference between seed performance under stress as
compared to its appropriate control. In addition, the plasticity traits were used
in the model to identify QTL associated with the genotype main effect as well
as the interaction of the genotype at the marker with the germination (G x GE),
maternal (G x ME), stratification (G x S) and other possible interactions.
The single trait multiple-environments mapping for the seed germination traits
revealed a large number of QTLs distributed over the five chromosomes (Figure
6). The QTLs identified were clustered in distinct regions of the chromosomes,
resulting in 15 main QTL clusters. The direction of the QTLs within these QTL
clusters was largely consistent across the environments and QTLs with both
Bay-0 and Sha as high value allele were identified. Variation in the number of
QTLs and the percentages of explained variances of the individual QTLs within
these clusters across ME was a first indication for QTL x E. Furthermore,
differences observed across the QTL clusters, indicated varying degree of
sensitivity of the genetic variants to the environment along the genome.
Germination QTLs with certain environment specificity were identified. In HT, a
large number of QTLs were identified on top of chromosome 1 and
chromosome 3, while QTLs at the bottom of chromosome 1 and top
chromosome 5 seem to be specific to LP (Figure 6).
◄Figure 5: Heatmap of spearman correlation coefficients of seed and germination traits (AUC)
under different germination conditions for the RILs grown in standard (ST), high temperature (HT),
high light (HL) and low phosphate (LP). Dry SS: dry seed size; imb. SS: imbibed seed size; DSDS50 is
a measure of dormancy and Gmax CDT is the percentage of germination after controlled
deterioration test and is a proxy of seed longevity
57
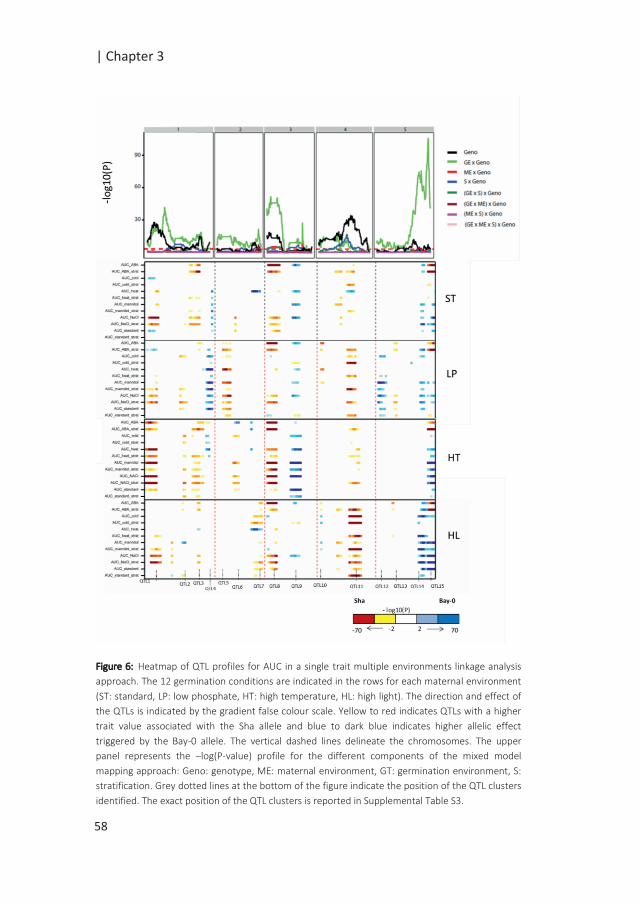
| Chapter 3
Figure 6: Heatmap of QTL profiles for AUC in a single trait multiple environments linkage analysis
approach. The 12 germination conditions are indicated in the rows for each maternal environment
(ST: standard, LP: low phosphate, HT: high temperature, HL: high light). The direction and effect of
the QTLs is indicated by the gradient false colour scale. Yellow to red indicates QTLs with a higher
trait value associated with the Sha allele and blue to dark blue indicates higher allelic effect
triggered by the Bay-0 allele. The vertical dashed lines delineate the chromosomes. The upper
panel represents the –log(P-value) profile for the different components of the mixed model
mapping approach: Geno: genotype, ME: maternal environment, GT: germination environment, S:
stratification. Grey dotted lines at the bottom of the figure indicate the position of the QTL clusters
identified. The exact position of the QTL clusters is reported in Supplemental Table S3.
58
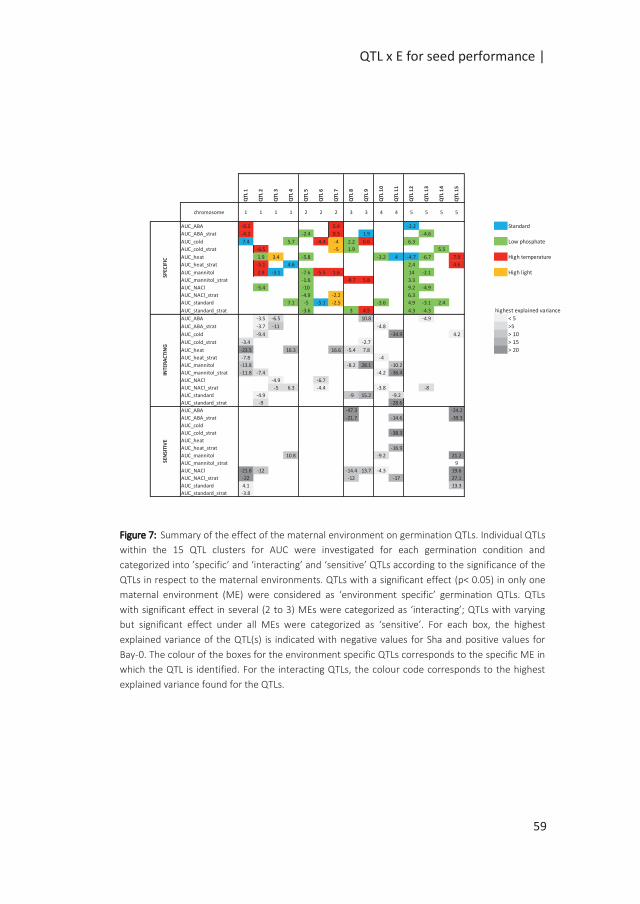
QTL x E for seed performance |
Figure 7: Summary of the effect of the maternal environment on germination QTLs. Individual QTLs
within the 15 QTL clusters for AUC were investigated for each germination condition and
categorized into ’specific’ and ‘interacting’ and ‘sensitive’ QTLs according to the significance of the
QTLs in respect to the maternal environments. QTLs with a significant effect (p< 0.05) in only one
maternal environment (ME) were considered as ‘environment specific’ germination QTLs. QTLs
with significant effect in several (2 to 3) MEs were categorized as ‘interacting’; QTLs with varying
but significant effect under all MEs were categorized as ‘sensitive’. For each box, the highest
explained variance of the QTL(s) is indicated with negative values for Sha and positive values for
Bay-0. The colour of the boxes for the environment specific QTLs corresponds to the specific ME in
which the QTL is identified. For the interacting QTLs, the colour code corresponds to the highest
explained variance found for the QTLs.
QTL
1
QTL
2
QTL
3
QTL
4
QTL
5
QTL
6
QTL
7
QTL
8
QTL
9
QTL
10
QTL
11
QTL
12
QTL
13
QTL
14
QTL
15
chromosome 1 1 1 1 2 2 2 3 3 4 4 5 5 5 5
AUC_ABA -9.2 5.4 -2.2 StandardAUC_ABA_strat -4.2 -2.4 8.3 1.9 -4.6
AUC_cold 7.4 5.7 -4.4 -4 2.2 6.6 6.3 Low phosphateAUC_cold_strat -6.5 -5 1.9 5.5
AUC_heat 1.9 3.4 -5.8 -3.2 4 -4.7 -6.7 7.9 High temperatureAUC_heat_strat -5.1 4.6 2.4 4.6
AUC_mannitol 2.9 -3.1 -7.6 -5.5 1.6 14 -2.1 High lightAUC_mannitol_strat -1.6 -8.7 5.8 3.3
AUC_NACl -5.4 -10 9.2 -4.9
AUC_NACl_strat -4.9 -2.2 6.3
AUC_standard 7.1 -5 -5.1 -2.5 -3.6 4.9 -3.1 2.4
AUC_standard_strat -3.6 3 4.5 4.3 -4.3 highest explained variance
AUC_ABA -3.5 -6.5 10.8 -4.9 < 5
AUC_ABA_strat -3.7 -11 -4.8 >5
AUC_cold -9.4 -34.9 4.2 > 10
AUC_cold_strat -3.4 -2.7 > 15
AUC_heat -23.5 16.3 16.6 -5.4 7.8 > 20AUC_heat_strat -7.8 -4
AUC_mannitol -13.8 -8.2 28.1 -10.2
AUC_mannitol_strat -11.8 -7.4 -4.2 -36.4
AUC_NACl -4.9 -6.7
AUC_NACl_strat -5 6.3 -4.4 -3.8 -8
AUC_standard -4.9 -9 15.2 -9.2
AUC_standard_strat -9 -28.6
AUC_ABA -47.3 -24.2
AUC_ABA_strat -21.7 -14.6 -39.3
AUC_cold
AUC_cold_strat -38.3
AUC_heat
AUC_heat_strat -16.9
AUC_mannitol 10.8 -9.2 21.2
AUC_mannitol_strat 9
AUC_NACl -21.8 -12 -14.4 13.7 -4.3 19.6
AUC_NACl_strat -22 -12 -17 27.1
AUC_standard 4.1 13.3
AUC_standard_strat -3.8
SPEC
IFIC
IN
TER
AC
TIN
GSE
NSI
TIV
E
59

| Chapter 3
Effect of the maternal environment on germination QTLs
To further understand the nature of the effect of the maternal environment on
the germination QTLs identified, an overview of QTL clusters with significant
QTL x E for AUC is shown in Figure 7. For each germination condition, the QTLs
were classified in three classes according to the significance of the QTL effect
(p< 0.05) in the different MEs. The QTLs were ‘environment specific’ when the
QTL was detected in only one of the four MEs, ‘interacting’ when the QTL
effect was significant in several MEs and ‘sensitive’ when the QTL effects were
variable but significant across all MEs. A large number of germination QTLs
were specific to one ME. Most of these QTLs display low explained variance
compared to the ‘interacting’ and ‘sensitive’ QTLs. For the ‘sensitive’ QTLs, the
explained variance of the QTL could vary between 5 and 24, showing the large
effect of the ME on individual germination QTLs.
Plasticity QTLs
Another approach to investigate the sensitivity of the QTLs to the environment
consisted of mapping QTLs for plasticity. The plasticity of a genotype
corresponds to the reaction norm which is the response of a given genotype
under varying environments. Here, the plasticity was measured as the
difference between seed performance in stress conditions and the respective
standard (for instance AUC for germination under ABA with stratification was
subtracted from AUC for germination in water with stratification). Plasticity QTL
results are available in AraQTL(Nijveen et al. 2017). Furthermore, QTL x E was
assessed by obtaining QTL profiles for the different components explaining the
variation (ANOVA). The QTLs for the different components largely
corresponded to the QTL clusters previously identified (upper panel Figure 6).
In particular, strong linkage was observed for the genotype and genotype x
germination components (upper panel Figure 6). The low linkage for the effect
of the maternal environment can be explained by the nature of the plasticity
calculation. In the situation where genetic variation for the maternal
environment is observed under both standard and stress conditions, calculating
the difference between the two germination environments cancels out this
variation.
60

QTL x E for seed performance |
Confirmation of an environment specific QTL
Several germination QTLs with large explained variances were detected on top
of chromosome 1 specifically for the HT population (QTL 1) (Figure 6). In
addition, a HT specific dormancy QTL co-located with these germination QTLs
(Supplemental Table S4). The Sha allele at the position of QTL 1 conferred
higher tolerance to germination in sub-optimal germination conditions and
lower seed dormancy. For germination at 32°C (AUC_heat), the QTL explained
up to 23.5% of the phenotypic variance. To validate this QTL, the parental lines
and the HIF198 carrying the parental alleles, HIFBay-0 or HIFSha at the top of
chromosome 1, were grown in similar ST and HT maternal environments.
Harvested seeds were stored for a few months and germinated at 32°C. To
assess the full potential of seed germination, once the germination plateau was
reached under germination at 32°C, the seeds were stratified and transferred
to 22°C. The difference between the final Gmax and the Gmax under 32°C for
the different lines, delta Gmax, is shown in Figure 8. For the seeds grown under
ST, the lower delta Gmax for Bay-0 and high delta Gmax for Sha (indicating no
germination), likely reflected the degree of primary dormancy of the seeds.
Nonetheless, germination at 32°C of the HIFs carrying either parental allele
showed significant differences when grown under HT (Figure 8).
◄Figure 8. Confirmation of an
environment specific QTL with a
HIF approach. Analysis of
HIF198 (top of chromosome 1)
carrying the Bay (HIFBay) or the
Sha (HIFSha) allele. Error bars
represent the standard error of
2 and 4 replicates for the
parental and HIF lines,
respectively. The delta Gmax is
shown as the difference of full
germination potential and
germination at 32°C, as
described in the main text.
A higher delta Gmax indicates thus a higher sensitivity of the line to germination at 32°C. T-test was
performed between the HIFs carrying the Bay-0 or Sha allele grown under standard (ST) and high
temperature (HT). * indicates a significant difference by Student t-test (p-value < 0.05).
*
61

| Chapter 3
Mining candidate genes using expression data
The identification of environment specific QTLs suggests the sensitivity of the
alleles to the environment. We used gene expression data obtained by RNA-seq
on fresh dry seeds of the parental lines, Bay-0 and Sha, grown in the different
maternal environments (Serin et al. 2017) Chapter 5), to shortlist candidate
genes based on their differential expression.
Overall, the transcriptome of the seeds showed distinct profiles as a result of
the difference in their genetic background and the maturation environments
(Chapter 5). We focused on the high temperature specific QTL identified on top
of chromosome 1 confirmed by the HIF approach (Figure 8). The genomic
region defined by the HIF (1.45 – 3.45 Mb) included 578 genes. These genes
were stringently filtered for being significantly (p-value after FDR correction <
0.0001) and specifically differentially expressed between Bay-0 and Sha under
high temperature and not under the other conditions. The filtering step
reduced the initial list to 10 potential candidate genes (Table 2).
Among these genes, the highest fold change was observed for At1g09570
encoding phytochrome A. The known role of phytochromes in the temperature
regulation of seed germination strengthens its significance as a candidate gene
(Dechaine et al. 2009; Heschel et al. 2007; Donohue et al. 2008; Donohue et al.
2012). The difference in expression is explained by the increased expression of
PHYA in Bay-0 in response to HT maternal environment as compared to Sha
(Figure 9).
◄Figure 9: Genotype and
environment dependent
gene expression variation.
Gene expression levels are
shown for Phytochrome A
in the dry seeds of the
parental lines, Bay-0 and
Sha, matured under
standard (ST), high
temperature (HT), high light
(HL) and low phosphate (LP)
environments. Significant
differential gene expression
between the parental lines
is indicated by (*) for FDR <
0.0001.
*
62
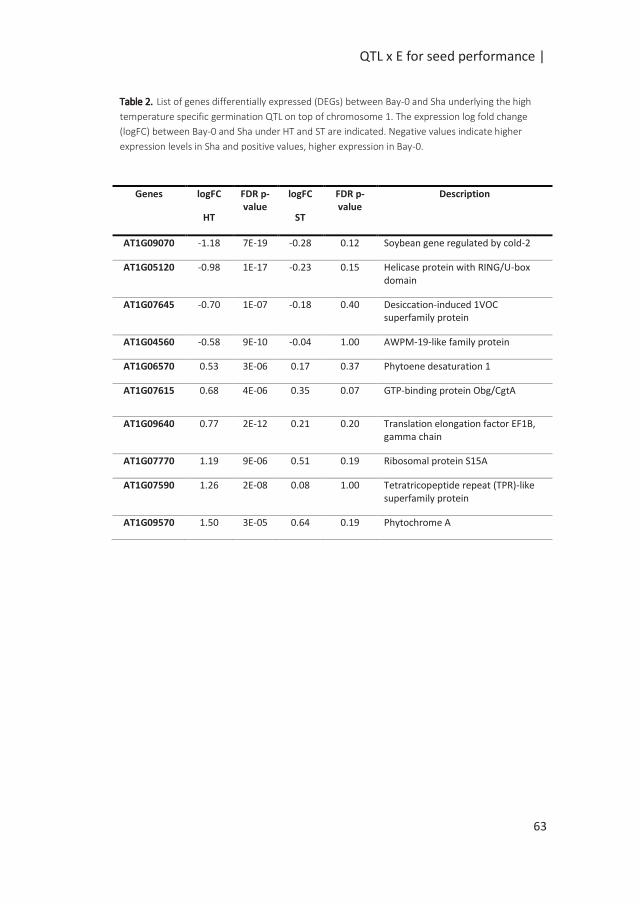
QTL x E for seed performance |
Table 2. List of genes differentially expressed (DEGs) between Bay-0 and Sha underlying the high
temperature specific germination QTL on top of chromosome 1. The expression log fold change
(logFC) between Bay-0 and Sha under HT and ST are indicated. Negative values indicate higher
expression levels in Sha and positive values, higher expression in Bay-0.
Genes logFC
HT
FDR p-value
logFC
ST
FDR p-value
Description
AT1G09070 -1.18 7E-19 -0.28 0.12 Soybean gene regulated by cold-2
AT1G05120 -0.98 1E-17 -0.23 0.15 Helicase protein with RING/U-box domain
AT1G07645 -0.70 1E-07 -0.18 0.40 Desiccation-induced 1VOC superfamily protein
AT1G04560 -0.58 9E-10 -0.04 1.00 AWPM-19-like family protein
AT1G06570 0.53 3E-06 0.17 0.37 Phytoene desaturation 1
AT1G07615 0.68 4E-06 0.35 0.07 GTP-binding protein Obg/CgtA
AT1G09640 0.77 2E-12 0.21 0.20 Translation elongation factor EF1B, gamma chain
AT1G07770 1.19 9E-06 0.51 0.19 Ribosomal protein S15A
AT1G07590 1.26 2E-08 0.08 1.00 Tetratricopeptide repeat (TPR)-like superfamily protein
AT1G09570 1.50 3E-05 0.64 0.19 Phytochrome A
63
| Chapter 3
Discussion
It is established that the environment experienced during seed development
affects seed traits such as dormancy and germination (Penfield and MacGregor
2017). The genotype-dependent response to these effects has further led to
the investigation of the interaction between maternal environment and
genotype and its effect on seed phenotypes (He et al. 2014; Burghardt et al.
2016; Munir et al. 2001; Edwards et al. 2016). Only a few studies have
harnessed natural variation to identify the extent and effect of the maternal
environment at the genetic level. Postma and Agren (2015) and Kerdaffrec and
Nordborg (2017) identified changes in the effect of QTLs associated to seed
dormancy in Arabidopsis populations grown in native field experiments.
However, various factors, such as photoperiod and temperature vary
simultaneously in the field and therefore experiments under controlled
conditions in which individual factors are investigated separately are needed to
disentangle these effects. In this study, we grew an Arabidopsis recombinant
inbred line (RIL) population under four controlled conditions from flowering
until seed harvest. Extensive phenotyping and QTL mapping for the seeds
produced under the different conditions revealed the effect of the maternal
environment at the phenotypic and genetic level. We further used HIFs and
gene expression of the parental lines to narrow down the number of candidate
causal genes for an environment sensitive QTL.
Overall, considerable phenotypic variation was observed between the parental
lines as well as in the RIL population in response to both the germination and
maternal environments. The effect of the maternal and germination
environments on seed traits was in line with previous studies. Temperature is a
key determinant in the timing and duration of key developmental phases
including flowering. Plant morphology and reproductive development are also
strongly influenced by temperature (Wigge 2013; Quint et al. 2016). Warmer
temperature leads to earlier flowering and subsequently earlier seed set
(Balasubramanian et al. 2006; Springthorpe and Penfield 2015). In line with
other studies, high temperature maturation environment promoted
germination by reducing dormancy levels (Figure 1) (Kendall and Penfield 2012;
Huang et al. 2014). The temperature regulation of seed germination is largely
influenced by the key hormones, ABA and GA. Kendall et al. (2011) reported
that low temperatures during seed development increased abscisic acid (ABA)
content and reduced gibberellic acid (GA) levels.
64
QTL x E for seed performance |
Larger seed size and seed weight was observed under HL as found by (He et al.
2014; Contreras 2008) in different genotypic backgrounds. In several studies,
seed size has been associated with seedling vigor and faster germination
(Fenner 1991). The low correlation between seed weight and seed
performance found in this study shows that this relation is not always verified
(Figure 5). We observed that the RILs that matured under HL showed lower
AUC under several germination conditions (NaCl, Mannitol and heat). These
lower AUC for larger seeds could also be explained by a higher water
requirement of these seeds to complete germination compared to smaller
seeds for which water absorption can occur faster. These hypotheses are in line
with the observation of (Galloway 2001) who found that an increase in
resources in the maternal environment, such as high light, decreases the
fraction of seeds with early germination. The low phosphate environment also
affected seed traits, such as AUC in mannitol (Figure 2), which resulted in LP
sensitive QTLs at the top of chromosome 5 (Figure 6). Phosphorus (P) is an
essential nutrient that is required for all major developmental processes and
reproduction in plants. P can be stored in the plant or mobilised throughout
the plant to provide the energy blocks for further reactions, as in the form of
ATP. Common responses to P deficiency include delayed plant maturity,
reduced leaf size and reduced root growth, which can limit nutrient uptake.
Under P starvation conditions, the allocation of P might thus occur at the
expense of P storage in seeds, although studies have reported that yield rather
than seed quality is affected under resource limiting environments
(Hacisalihoglu et al. 2018). Besides the effect on the mean phenotypic values,
the effect of the maternal environment also resulted in differences in the
response of the RILs, indicating genotype-by-environment (G x E) interactions
(Figure 4, Table 1). Such interactions were largely reported in other studies
(Munir et al. 2001; Kerdaffrec and Nordborg 2017; He et al. 2014) and
supported in this study by the analysis of variance, which estimated that overall
approximately 40% of the seed germination variation in the RILs was due to G x
E (Table 1). Together, these results show that the maternal environment can
effectively modulate the expression of genetic variation. In general, increased
variance of AUC values was observed for germination in sub-optimal conditions
(Figure 2). These variances reflect differences in the timing of germination of
individual seeds in a seed batch. In nature, varying timing of seed germination
can be seen as a strategy to ensure the success of seed germination; while in
agriculture, seed companies put major efforts to deliver uniformly germinating
seed batches.
65
| Chapter 3
The quantitative genetic study identified a large number of QTLs detected
across multiple environments. Most of these QTLs could be grouped into 15
main QTL clusters. Several studies previously identified common QTLs
controlling germination under standard and stress conditions (Foolad et al.
2007; Joosen et al. 2012), suggesting partly shared physiological regulation of
seed germination under these conditions. The observed QTL clusters largely
corresponded to the major germination QTLs identified in a previous study in
the same population (Joosen et al. 2012). The high level of consistency
between the previous and present study indicates the reliability of the
identified QTLs.
The significant QTL x E corroborated the G x E observed at the phenotypic level.
The effect of the environment was mostly observed as a change in allele
sensitivity of the QTLs, which is the most common type of interaction for QLT x
E (El-Soda et al. 2014). For marker-assisted selection, such QTLs present the
advantage of enhancing germination under several conditions. Six QTLs clusters
(QTL4, QTL7, QTL9, QTL12, QTL14 and QTL15) were identified with a higher
effect provided by the allele of the generally slow and or lower germinating
parent, Bay-0. This indicated that alleles promoting germination can also be
queried in the parent of apparent opposite phenotype. The presence of QTLs in
the direction of both parental alleles is also likely to explain transgressive
phenotypes in the RIL populations (Figure 2). Several QTL clusters showed
certain specificity to the maternal environments (Figure 6). For instance, QTL 1
was identified for several germination conditions under HT, QTL11 and QTL15
were found mainly in HL, while QTL4, QTL5, and QTL12 showed higher
sensitivity to the LP maternal environment. The maternal and germination
conditions showed a significant effect on the magnitude change of the QTL
effects. Common germination QTLs across maternal environments showed
higher LOD scores. ME specific QTLs had generally lower LOD scores. The
absence of the germination QTL under the other maternal environments could
be due to not reaching the significance threshold (Figure 7).
Despite the use of RILs and a dense genetic map, the identified QTLs had large
confidence intervals encompassing a high number of genes. Further strategies
need thus to be employed to narrow down these genomic regions and
establish a manageable list of potential causal genes. When readily available,
heterogeneous inbred lines (HIFs) provide a fast method to validate QTLs
(Tuinstra et al. 1997; Joosen et al. 2012). Using this approach, we showed that
the effect of the maternal environment on QTLs can be reproduced under
66
QTL x E for seed performance |
controlled conditions, as shown for high temperature ME (Figure 8). The HIFs
allowed narrowing down the QTL region although further efforts are necessary
to identify the causal gene. With the advent of high-throughput technologies,
another popular approach to the identify candidate genes is to combine QTL
mapping and gene expression analysis (Wayne and McIntyre 2002;
Kloosterman 2010; Albert et al. 2016). In the recent years, RNA-seq has
become widely used for transcriptome studies (Wang et al. 2009) presenting
many advantages over other methods, such as the large and dynamic range of
expression level quantification. In this study, we used RNA-seq data obtained
from the mature dry seeds of the parental lines grown under the different
maternal environments. The transcriptome of the seeds was largely modulated
by the genotypic background and the environment (Figure 9) (He et al. 2016;
Chiang et al. 2011). The effect of the maternal environment is likely influenced
by gene expression changes and thus we investigated differentially expressed
genes between the parental lines matured under high temperature, within the
confidence interval validated by the HIF. Using this approach, we drastically
reduced the list of candidate genes to 10 genes. Among these genes, we
identified At1g07430 encoding for phytochrome A (PHYA). Phytochromes play
a known role in regulation of seed germination (Heschel et al. 2007) and can
also act as mediator of the environmental cues experienced by the seed during
seed maturation (Botto 1996; Dechaine et al. 2009). PHYA is involved in the
regulation of germination and dormancy via the ABA/GA hormonal balance
(Finch-Savage and Footitt 2017; Cadman et al. 2006), although the effects of
PHYA have been shown to vary across genotypes and conditions (Donohue et
al. 2008; Donohue et al. 2012; Dechaine et al. 2009). The negative regulation of
PHYA on GA levels (Jordan et al. 1995) could be a plausible explanation to link
the higher expression of PHYA and the lower seed performance in Bay-0 in HT
associated with this QTL. Another study in Arabidopsis showed that an increase
in phyA signalling augmented the ABA-mediated inhibition of root growth
(Chen et al. 2014a).
Although PHYA is an interesting candidate for the causal gene for this QTL,
other genes within the QTL interval are also still candidates. Here we used a
stringent threshold (p< 0.0001) to establish a manageable list of candidate
genes. In addition, differential expression is not a prerequisite of causality. A
QTL in the same region was also identified for germination in ABA and salt in
the Ler x Sha population (Ren et al. 2010). The cloning of the QTL led to the
identification of RAS 1 (At1g09950). RAS1 has a premature stop codon in Sha
67
| Chapter 3
which causes a truncated RAS1 protein and improved tolerance to germination
in salt conditions (Ren et al. 2010). In our study, analysis of the HIFs showed the
HT specificity of the QTL, thus it is likely that besides RAS1, which didn’t show
HT specific expression, other genes control seed germination at the position of
this QTL.
In conclusion, we showed that the maternal environment prominently affects
seed germination. The extent of QTL x E observed as a result of genetic
interaction with the maternal and germination environments, strengthen the
need of multi-environment studies to reveal the genetic mechanisms
underlying phenotypic plasticity. Such studies are particularly relevant in a
context of climate change (Walck et al. 2011; Huang et al. 2018) to understand
plant adaptation. The combined effect of the maternal and germination
environment may as well provide a mean to life history evolution (Donohue
2009). From a breeding perspective, the maternal environment should be
taken into consideration in order to better predict and fully exploit seed
performance potential under either a targeted or wide range of environments.
List of supplemental data
Supplemental Tables below can be found at:
http://www.wageningenseedlab.nl/thesis/earserin/SI/chapter3
Supplemental Table S1: Element concentrations in the standard nutrient
solution.
Supplemental Table S2: List of 221 SNP markers used for the QTL x E analysis.
Supplemental Table S3: Average phenotypic values for all seed and germination
traits measured in the parents and recombinant inbred lines grown under
standard, high temperature, high light and low phosphate.
Supplemental Table S4: output files that summarize the results of the QTL x E
analyses for the germination traits.
Supplemental Table S5: output files that summarize the results of the QTL x E
analysis for the seed traits.
68
Chapter 4
Maternal environment and genetic background
shape the dry seed metabolome in Arabidopsis
Elise A. R. Serin, Basten L. Snoek, Harm Nijveen, Leo A. J. Willems, Henk
W. M. Hilhorst and Wilco Ligterink
In preparation
| Chapter 4
Abstract
Seed set is a crucial event in a plant’s life cycle that ultimately determines the
plant’s fitness. The environment experienced by the mother plant and embryo
during seed development is shaping the seed metabolome in a genotype-
dependent manner. In seeds, several loci controlling metabolite variation have
been identified although only a few studies have investigated the underlying
genetic architecture in response to changes in the seed production
environment. In the present study, we used an Arabidopsis RIL population
grown under different environments to investigate the effect and genetic basis
of genotype-by-environment interactions (G x E) on the seed primary
metabolism and associated seed germination characteristics. The primary
metabolites of the dry seeds of the parental lines and the RILs produced under
four contrasting environments were investigated using an untargeted GC-TOF-
MS metabolomics approach in a generalized genetical genomics design. A large
set of metabolites were affected by G x E. The combined use of network-based
metabolite correlation analysis and mQTL analysis indicated an environment-
dependent genetic regulation of the dry seed primary metabolome. Overall, 2
known and 2 novel hotspots of metabolic regulation were identified. Although,
limited co-locating phenotypic and metabolic QTLs were observed, we found
that different sets of metabolites across the environments correlated with seed
performance traits, showing that the seed maternal environment can modulate
the relation between metabolites and phenotypes.
Keywords: Genetical metabolomics, maternal environment, network analysis,
primary metabolism, seeds.
70
G x E shape the dry seed metabolome|
Introduction
Intrinsic seed properties, such as the ability to germinate, are acquired during
seed development on the mother plant. Throughout seed development, a sink-
source connection between the mother plant and the seeds exists. This
connection allows the plant to allocate available resources to support seed
growth and the synthesis of seed storage compounds (Ruuska 2002; Baud et al.
2008). Primary metabolites such as sugars and organic and amino acids are key
compounds of the metabolic shifts that occur during seed maturation,
desiccation and germination (Fait et al. 2006; Angelovici et al. 2010; Galili et al.
2014). Tricarboxylic acid contents decrease during seed maturation while seed
desiccation is characterized by an increase in free amino acids (Fait et al. 2006),
(Angelovici et al. 2009). At the end of desiccation, fully mature seeds enter a
quiescent state nearly devoid of metabolic activity. Upon imbibition, metabolic
activity resumes, mobilizing stored metabolites to provide the basis for seed
germination; an energy demanding process. As a result, the compounds stored
in dry mature seeds reflect the process of seed maturation and can be linked to
seed performance (Rosental et al. 2014; Rosental et al. 2016).
Throughout their life cycle, plants experience fluctuating conditions, requiring
coordinated changes at the transcriptome, proteome and metabolome levels
to adjust the biochemical pathways to facilitate their physiological response.
During seed set, changes in the maturation environment of the seed
substantially affect seed performance in Arabidopsis (He et al. 2014)(Chapter 3)
which is reflected by the metabolome level in a genotype dependent manner
(He et al. 2016). Seeds that matured under high light conditions had a higher
accumulation of galactinol, which has been shown to positively correlate with
Arabidopsis seed longevity (He et al. 2016; de Souza Vidigal et al. 2016). In
contrast, low temperature and low nitrate maturation environments resulted in
a decrease of nitrogen-metabolism compounds such as GABA, asparagine and
allantoine (He et al. 2016). Although fundamental molecular mechanisms of
seed maturation have been described (Holdsworth et al. 2008; Gutierrez et al.
2007), more work is needed to understand how environmental factors interact
with these processes. Increasing our understanding of the genetic and
molecular mechanisms controlling seed metabolome variation in response to
stress will provide valuable insights in this direction.
The advancement of tools in metabolomics and genomics has enabled
untargeted and large scale exploration of metabolome composition and
variation (Kooke and Keurentjes 2012). In particular, GC-MS based methods
71
| Chapter 4
have largely contributed to the profiling of primary metabolites (Lisec et al.
2006). The extensive diversity in metabolites and their high interconnectivity
has led to large metabolite variation revealing the large plasticity and
complexity of metabolic networks (Obata and Fernie 2012; Sulpice et al. 2013).
Identifying the factors controlling these intricate networks remains an
important challenge.
Quantitative trait locus (QTL) analysis is a powerful tool to identify genes
responsible for variation in a segregating population. For molecular traits, such
as transcript levels, genetical genomics was proposed (Jansen and Nap 2001)
and successfully applied (Cubillos et al. 2012; Lowry et al. 2013; Keurentjes et
al. 2007b). Since metabolite levels can also be treated as quantitative traits,
quantitative trait mapping of metabolite variation enables the identification of
metabolic QTLs (mQTLs) (Keurentjes et al. 2006). This “genetical
metabolomics” approach has been successfully employed to dissect the genetic
basis of metabolism in plant systems (Keurentjes et al. 2006; Knoch et al. 2017;
Toubiana et al. 2012; Carreno-Quintero et al. 2012; Wen et al. 2015).
Commonly, the effect of environmental perturbations on the genetic basis of
metabolome variation has been resolved by comparing mQTLs of the same
population exposed to contrasting conditions (Kliebenstein et al. 2002;
Rosental et al. 2016; Wu et al. 2018). Although this kind of approach provides
full power for the genetic analysis, often only a few conditions are tested due
to practical reasons, consequently limiting insights into the extent of
metabolome genetic regulation in response to environmental variation.
Recently, the generalized genetical genomics (GGG) design (Li et al. 2008b) was
introduced to investigate mQTL x E for metabolome variation at different
stages of the seed germination process (Joosen et al. 2013). In this study,
several mQTLs controlling seed metabolism were identified.
To extent our understanding on the genetic control of the seed metabolome,
we queried the effect of the maturation environment on the genetic
architecture of the seed metabolome in an Arabidopsis thaliana Bayreuth-0
(Bay-0) x Shahdara (Sha) recombinant inbred line (RIL) population (Loudet et al.
2002). A core population of 165 RILs and the parental lines were grown in four
contrasting environments, including standard, high light, high temperature and
low phosphate from flowering until seed harvest. Metabolic profiling of dry
harvested seeds of the RILs and the parental lines was performed by GC-TOF-
MS in a GGG design. Using metabolite correlation network and mQTL analyses,
we shed light on key genetic features of maternal environment induced
changes in dry seed metabolome regulation.
72
G x E shape the dry seed metabolome|
Material and Method
Plant Material
Seeds from an Arabidopsis thaliana Bayreuth (Bay-0) x Shahdara (Sha)
recombinant inbred line (RIL) population (Loudet et al. 2002) were used in this
experiment. Plants were grown on 4x4 cm Rockwool blocks (MM40/40, Grodan
B.V.) in a fully randomized set up. In the standard condition, plants were grown
under long day (16h light / 8h dark) at 70% RH and 22°C / 18°C (day/night)
under artificial light (150 μmol m-2 s-1). The plants were watered with a
standard nutritive solution (see Supplemental table 1 in (He et al. 2014)) three
times a week by flooding cycles. When all lines reached flowering, the main
stem of all plants was cut short to synchronize the developmental stage of the
plants prior to stress exposure and to collect only seeds developed under the
different conditions. Three to four plants per RIL were transferred to different
climate cells with controlled environmental conditions. The same conditions as
standard were used for the stress environments, except for the varying
parameter as indicated hereafter: high temperature (25°C day / 23°C night),
high light (300 μmol m-2 s-1) and low phosphate (12.5 μM phosphate instead
of 0.5 mM in the standard nutritive solution). Fully mature seeds from 3-4
plants per RIL were bulk harvested. A fraction of fresh harvested seeds was
stored at -80°C one week after harvest. The remaining seeds were stored at
room temperature and ambient relative humidity for after-ripening. Fully after-
ripened seeds were used to perform germination experiments (Chapter 3).
Metabolites profiling based on GC-TOF-MS
Prior to the measurements, the RILs were selected following the Generalized
Genetical Genomics design as used in (Joosen et al. 2013). This resulted in a
total of 160 RILs in sub-populations of 41, 40, 39 and 40 RILs for ST, HT, HL and
LP conditions respectively. Metabolite abundance was measured in triplicate
for the parental lines from all four conditions. Metabolites for GC-TOF-MS were
extracted according to the following procedure.
Metabolite extraction
Primary metabolites were extracted as described by Roessner (2000) with
minor modifications. In brief, 10 mg seeds for each RIL were taken from freshly
harvested seeds which were store in -80°C. Extraction was done in 2mL
Eppendorf Safe-lock tubes. Samples were frozen in liquid nitrogen and
73
| Chapter 4
homogenized with 2 iron balls (1.25mm) using a dismembrator (Retch MM200)
at 1500 rpm. A solution of 350µL MeOH/CHCl3 (4:3) was added to the samples
followed by 75µL filtered water (MilliQ, Millipore) containing 0.133mg/mL
Ribitol as internal standard. After 10 minutes sonication 100µL MilliQ was
added, followed by mixing and centrifugation. After centrifugation the
water/methanol phase was transferred to a new clean Eppendorf tube and the
remaining extract was extracted again with 250µL MeOH/CHCl3 (1:1). After 10
minutes incubation on ice, 100µL MilliQ was added. After centrifugation the
water/methanol phase was taken again and combined with the previously
collected phase and mixed. Hundred µL of this mix was dried overnight in a
speedvac (35°C, Savant SPD121) in a vial with insert (06090357, Grace). The
next day the vials were crimp capped with magnetic caps (8618261, Grace) in
the presence of argon. The GC-TOF/MS procedure was previously described by
Carreno-Quintero et al. (2012). Detector voltage was set at 1900 V.
Data processing
Raw data was processed using the ChromaTOF software to produce netCDF
files. A signal to noise ratio of 2 was used. Further processing was done by
Metalign sofware (Lommen 2009). First a baseline correction was done with a
peak slope factor (x noise) set to 1 and a peak threshold factor (x noise) of 2. All
mass signals below 25 were discarded. Different chromatograms were aligned
with a maximum shift of 75 scans. This resulted in 66665 mass signals. These
mass signals were further processed using Metalign output transformer
(METOT, Plant Research International, Wageningen). Mass signals that were
present in less than three RILs were discarded. Mass signals that were below
background were randomized between 50% and 100%. This resulted in 39418
mass signals. From these mass signals centrotypes were constructed by using
the MSClust software (Tikunov et al. 2012) with the following parameters:
correlation threshold 0.8 with 0.02 margin and PD reduction 0.9 with 0.01
margin. Criterion was stopped at 3 masses. This resulted in 172 unique
centrotypes from which we could identify 71 by comparing the mass spectra in
the NIST software (NIST Mass Spectral Search Program version 2.0) to an in-
house constructed library and to the Golm library (http://gmd.mpimp-
golm.mpg.de/). This identification is based on spectral similarities and
comparing the retention indices calculated by using a third polynomial function
on the alkanes that were added to the samples (Strehmel et al. 2008).
74

G x E shape the dry seed metabolome|
Statistical analyses
Log10 transformation allows scaling of the variation and making the
metabolites comparable. Therefore, all metabolites were log10 transformed
before further analysis in order to improve normality (Ursem et al. 2008). Two-
way ANOVA was performed on the parental lines, Bay-0 and Sha, grown in each
environment. False discovery rate (FDR) correction was applied for multiple
testing. FDR < 0.05 was used as a threshold for corrected p-values. Analyses
were performed in Metaboanalyst 3.0 (Xia and Wishart 2016).
Principal component analysis was performed on the log10 scaled and centred
metabolic values of the RILs and parental lines. Analysing the samples by the
batches used for the GC-TOF-MS measurements did not reveal any batch
effects.
Correlation analyses
Correlation analysis was conducted for the 71 annotated metabolites in each
RIL sub-population, separately; as well as on the combined RIL for the 172
metabolites (Supplemental Table 7). Spearman metabolite correlation was
obtained using the rcorr R package.
RV coefficient analysis
RV coefficients were used to calculate the degree of similarity between
metabolite correlation matrices. The CoeffRV function of the FactoMineR
Rpackage (Husson et al. 2008) was used to statistically compare the correlation
matrices for each condition. The RV coefficient varies between 0 and 1, with
lower values indicating matrix dissimilarities. The associated p-values provided
statistical support to the analysis.
Correlation network construction and analysis
The correlation p-values were converted into q-values, a measure of
significance in terms of the false discovery rate (FDR). FDR < 0.05 was applied
to identify statistically significant correlations which were used as input for the
network. Correlation networks were visualized with Cytoscape v.3.3.0 (Shannon
et al. 2003). Significance of the network clustering coefficient was evaluated by
comparing the clustering coefficient of the network to the clustering
coefficients of 10.000 random networks. Highly clustered metabolites were
identified using the walktrap community detection algorithm (igraph, R
package). Network properties were calculated using the NetworkAnalyser tool
75
| Chapter 4
in Cytoscape. Pathway enrichment analysis was performed for the metabolites
of the metabolic clusters using Metaboanalyst 3.0 with the default parameters
(Xia and Wishart 2016). Pathways with p-value < 0.01 were considered
significantly enriched.
mQTL analysis
A high-density genetic map derived from the same population was used for
QTL analysis (Serin et al. 2017). The QTL analysis was performed as described in
(Joosen et al. 2013). The approach consists of using two models to identify
genetic determinants of genetic (G) and genetic x environment (G x E) control
of metabolite variation. The single marker model, Y = G + Ɛ was used to
determine the genetic component on the metabolic profiles of the RILs in the
sub-populations. In this model, the phenotypic variance Y is explained by the
genetic (G) and residual (e) variations. The full marker model was used on the
combined sub-populations for Y = G + E + G x E + Ɛ to determine the effect of
the genetic background and the interaction between genetic background and
the maternal environment on the mQTL profiles. Log10 transformed data were
used for the mapping. Thousand permutations were used to estimate the
significance threshold at an alpha level of 0.05 for each separate mapping.
mQTL analyses were performed with Rqtl v3.3.1 (Broman et al. 2003; Arends et
al. 2010).
mQTL hotspot identification
mQTL hotspots were identified using the permutation procedure as described
and implemented by Breitling et al. (2008). The genotypic data were
permutated between the RILs while conserving their mutual correlation.
Metabolic data of the RILs remained unchanged. For each of the 1000
permutations, the number of mQTLs per marker with a LOD score higher than 3
was counted. The maximum number of mQTLs co-locating by chance was
determined for each marker across the permutation sets. The distribution of
the maximum values enabled the identification of mQTL counts at 95% of the
distribution which was used as a threshold for the identification of significant
mQTL hotspots. As a result 15, 19, 13, 14, 11 and 11 mQTLs at the same
markers for the ST, HT, HL, LP, G and G x E models respectively, were used as
significance thresholds.
76
G x E shape the dry seed metabolome|
Results and discussion
In this study, the metabolite profiles of the parental lines and 160 recombinant
inbred lines (RILs) of the Bay-0 x Sha population were measured in freshly
harvested dry seeds matured under different maternal environments. The RIL
population was grown, from flowering until seed harvest, in standard
conditions and either kept under these conditions or further exposed to high
temperature (HT), high light (HL) or low phosphate (LP) conditions.
In order to determine the metabolic status of the seeds, GC-TOF-MS analysis
was performed on the parental and RILs in a generalized genetical genomics
set-up (GGG, see material and methods). This design provides RIL sub-
populations of equal genetic variation and size for each of the maternal
environments studied (Supplemental Figure 1). The samples were analysed in a
random order interspaced by controls consisting of pooled samples. In total,
172 primary metabolites were detected. Normalized metabolite data for the
parental lines and RILs under the different environments are provided in
Supplemental Table 1. Among those, 71 metabolites could unambiguously be
identified using in-house available libraries of known metabolites based on
their centrotypes and retention times. Most of these metabolites could be
classified as organic acids, sugars or amino-acids (Supplemental Table 2).
Natural variation in primary metabolites
Large quantitative differences in metabolite abundance were observed in the
seeds of the parental lines, Bay-0 and Sha, matured under the different
environments (Figure 1). For the Sha parent grown under different
environments, higher levels of sugars (fructose, mannose) were observed
compared to Bay-0. In contrast, the Bay-0 parent showed higher levels of
amino acids in comparison to Sha. For the parental lines measured in triplicate,
variance analysis showed that 113 of the 172 metabolites were significantly
(FDR < 0.05) affected by the genotype and 105 were significantly affected by
the maternal environment. For 49 metabolites, a significant effect of the
genotype, environment and genotype x environment interactions was
observed, while 36 metabolites were not affected by any of the genetic or
environmental factors (Supplemental Table 2). Metabolite levels in the
different RIL subsets showed large variation as well as transgressive
segregation, where the metabolite levels were higher or lower than the
parental lines (Supplemental Table 2).
77

| Chapter 4
Principal component analysis (PCA) was conducted on the data of the 71
identified metabolite levels of the RILs to further explore the effect of the
maternal environment (Figure 2). Together, the first two principal components
(PCs) explained 34.79% of the total variance. A clear separation of the HT sub-
population from the other sub-populations was observed based on PC1. Among
the main variables contributing to this component were tricarboxylic acid (TCA)
cycle intermediates such as succinate, fumarate, amino acids such as GABA,
alanine and glycine, as well as other organic acids (Supplemental Table 3).
Similar results were obtained when all 172 metabolites were analysed
(Supplemental Figure 2). PCA was also performed on the sub-populations
separately (Supplemental Figure 3).
78
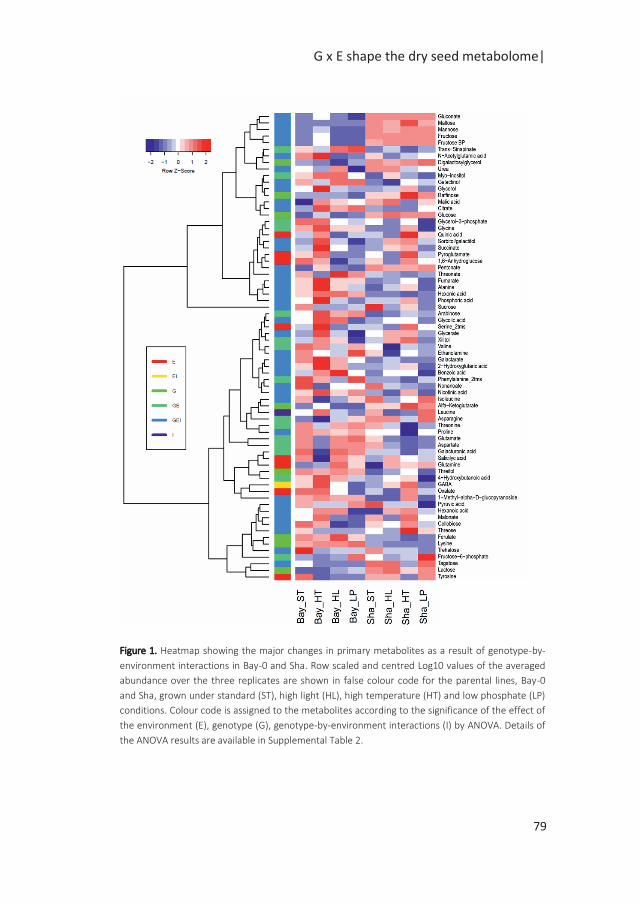
G x E shape the dry seed metabolome|
Figure 1. Heatmap showing the major changes in primary metabolites as a result of genotype-by-
environment interactions in Bay-0 and Sha. Row scaled and centred Log10 values of the averaged
abundance over the three replicates are shown in false colour code for the parental lines, Bay-0
and Sha, grown under standard (ST), high light (HL), high temperature (HT) and low phosphate (LP)
conditions. Colour code is assigned to the metabolites according to the significance of the effect of
the environment (E), genotype (G), genotype-by-environment interactions (I) by ANOVA. Details of
the ANOVA results are available in Supplemental Table 2.
79
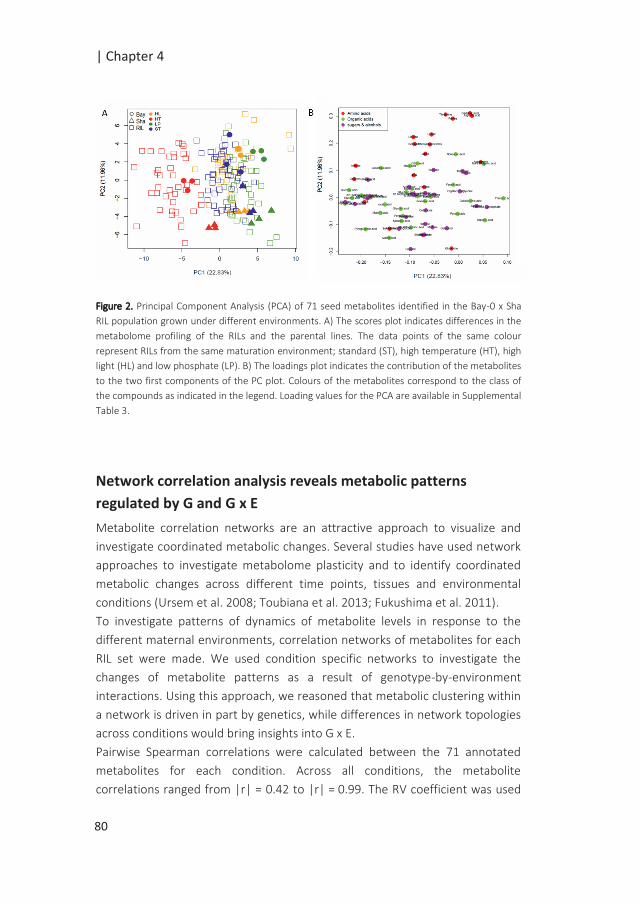
| Chapter 4
Figure 2. Principal Component Analysis (PCA) of 71 seed metabolites identified in the Bay-0 x Sha
RIL population grown under different environments. A) The scores plot indicates differences in the
metabolome profiling of the RILs and the parental lines. The data points of the same colour
represent RILs from the same maturation environment; standard (ST), high temperature (HT), high
light (HL) and low phosphate (LP). B) The loadings plot indicates the contribution of the metabolites
to the two first components of the PC plot. Colours of the metabolites correspond to the class of
the compounds as indicated in the legend. Loading values for the PCA are available in Supplemental
Table 3.
Network correlation analysis reveals metabolic patterns
regulated by G and G x E
Metabolite correlation networks are an attractive approach to visualize and
investigate coordinated metabolic changes. Several studies have used network
approaches to investigate metabolome plasticity and to identify coordinated
metabolic changes across different time points, tissues and environmental
conditions (Ursem et al. 2008; Toubiana et al. 2013; Fukushima et al. 2011).
To investigate patterns of dynamics of metabolite levels in response to the
different maternal environments, correlation networks of metabolites for each
RIL set were made. We used condition specific networks to investigate the
changes of metabolite patterns as a result of genotype-by-environment
interactions. Using this approach, we reasoned that metabolic clustering within
a network is driven in part by genetics, while differences in network topologies
across conditions would bring insights into G x E.
Pairwise Spearman correlations were calculated between the 71 annotated
metabolites for each condition. Across all conditions, the metabolite
correlations ranged from |r| = 0.42 to |r| = 0.99. The RV coefficient was used
80
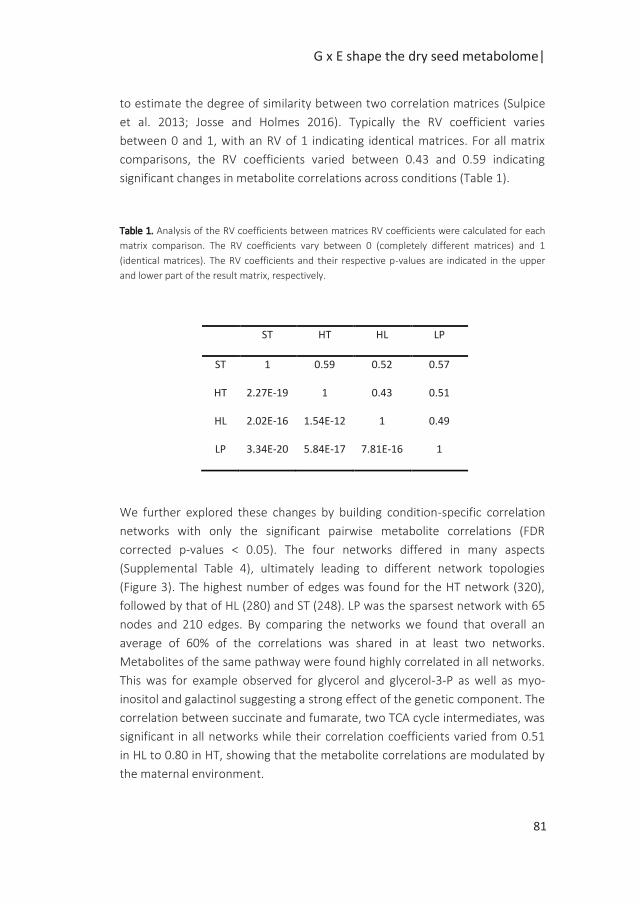
G x E shape the dry seed metabolome|
to estimate the degree of similarity between two correlation matrices (Sulpice
et al. 2013; Josse and Holmes 2016). Typically the RV coefficient varies
between 0 and 1, with an RV of 1 indicating identical matrices. For all matrix
comparisons, the RV coefficients varied between 0.43 and 0.59 indicating
significant changes in metabolite correlations across conditions (Table 1).
Table 1. Analysis of the RV coefficients between matrices RV coefficients were calculated for each
matrix comparison. The RV coefficients vary between 0 (completely different matrices) and 1
(identical matrices). The RV coefficients and their respective p-values are indicated in the upper
and lower part of the result matrix, respectively.
We further explored these changes by building condition-specific correlation
networks with only the significant pairwise metabolite correlations (FDR
corrected p-values < 0.05). The four networks differed in many aspects
(Supplemental Table 4), ultimately leading to different network topologies
(Figure 3). The highest number of edges was found for the HT network (320),
followed by that of HL (280) and ST (248). LP was the sparsest network with 65
nodes and 210 edges. By comparing the networks we found that overall an
average of 60% of the correlations was shared in at least two networks.
Metabolites of the same pathway were found highly correlated in all networks.
This was for example observed for glycerol and glycerol-3-P as well as myo-
inositol and galactinol suggesting a strong effect of the genetic component. The
correlation between succinate and fumarate, two TCA cycle intermediates, was
significant in all networks while their correlation coefficients varied from 0.51
in HL to 0.80 in HT, showing that the metabolite correlations are modulated by
the maternal environment.
ST HT HL LP
ST 1 0.59 0.52 0.57
HT 2.27E-19 1 0.43 0.51
HL 2.02E-16 1.54E-12 1 0.49
LP 3.34E-20 5.84E-17 7.81E-16 1
81
| Chapter 4
To further investigate metabolic changes, cluster analysis was performed on
the different networks. Non-random metabolite clustering was observed in the
different networks (not shown). The metabolic clusters were shown to be
environment specific and enriched for specific metabolic pathways
(Supplemental Table 5).
The cluster of amino acids was rather consistent across all maternal
environments. In the HT network, the largest cluster was enriched for
metabolites related to the tricarboxylic acid (TCA) cycle (succinate, citrate,
fumarate and malate) and glyoxylate pathway metabolites (GABA, 4-
Hydroxybutanoate, alanine)(Supplemental File 1, Supplemental Table 4). The
clustering of these metabolites was also observed when considering pairwise
correlations between all 172 metabolites (Supplemental Figure 3). The TCA
cycle plays a pivotal role in metabolism as a central hub providing the energy
necessary to sustain biochemical processes (Sweetlove et al. 2010). The amine
compounds GABA, glycine and alanine were found in the same cluster. GABA is
a key compound of the GABA shunt that bypasses two steps of the TCA cycle.
The close clustering of alanine and GABA, suggests that alanine might be
catabolized by GABA transaminase using pyruvate as a co-substrate. In the
same cluster, other sugars and organic acids such as fructose, myo-inositol and
glycerol were identified, suggesting a close link between the TCA cycle and
other pathways of the carbon metabolism. Clustering of these metabolites in
response to high temperatures has been observed before (Caldana et al. 2011).
In the HL network, one of two largest cluster identified comprised mostly
carbohydrates, such as arabinose, fructose, glucose and mannose. Myo-inositol
was also found in this cluster, as opposed to its clustering with TCA cycle
intermediates under HT.
82

G x E shape the dry seed metabolome|
Figure 3. Condition specific correlation networks for A) standard condition (ST), B) high
temperature (HT), C) high light (HL) and D) low phosphate (LP). Only significant spearman
correlations with FDR corrected p-value < 0.05 were used to build the networks. In the networks,
each metabolite is represented as a node and linked to other metabolites by edges; node colours
refer to the class of the metabolites with amino acids in red, organic acids in green and sugars in
purple. Diamond and triangle shaped nodes indicate membership of the first and second largest
detected cluster, respectively. Darker node colour indicates larger node connectivity. Some
metabolite names are abbreviated. Ala: alanine, Asn: asparagine, Asp: aspartate, Gln: glutamine,
Ile: isoleucine, Leu: leucine, Lys: lysine, Phe: phenylalanine, Pro: proline, Ser: serine, Thr: threonine,
Tyr: tyrosine, Val: valine, Eta: ethanolamine. The cytoscape file of these networks is provided as
Supplemental File 1.
Genetic basis of the dry seed metabolome
To identify the loci involved in dry seed metabolome variation, mapping of
QTLs associated with primary metabolites (mQTLs) in the RIL sub-populations in
the aforementioned conditions was performed. For this, two models were
used. The single environment, single marker model includes the genetic
variation within each sub-population with Y = G + ɛ. The full environment single
marker model Y = G + E+ G x E + ɛ was used for the combined set of RILs to
83
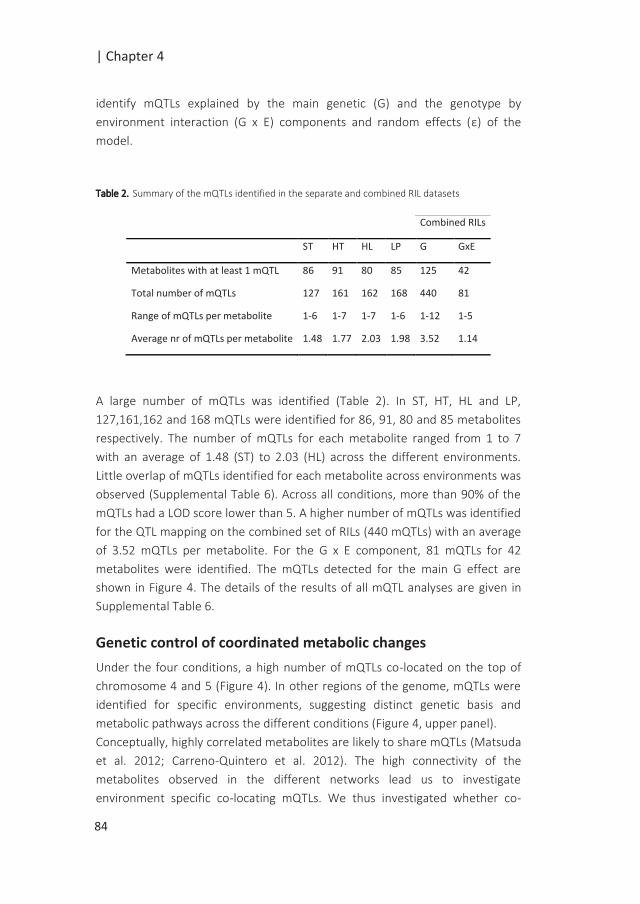
| Chapter 4
identify mQTLs explained by the main genetic (G) and the genotype by
environment interaction (G x E) components and random effects (ɛ) of the
model.
Table 2. Summary of the mQTLs identified in the separate and combined RIL datasets
A large number of mQTLs was identified (Table 2). In ST, HT, HL and LP,
127,161,162 and 168 mQTLs were identified for 86, 91, 80 and 85 metabolites
respectively. The number of mQTLs for each metabolite ranged from 1 to 7
with an average of 1.48 (ST) to 2.03 (HL) across the different environments.
Little overlap of mQTLs identified for each metabolite across environments was
observed (Supplemental Table 6). Across all conditions, more than 90% of the
mQTLs had a LOD score lower than 5. A higher number of mQTLs was identified
for the QTL mapping on the combined set of RILs (440 mQTLs) with an average
of 3.52 mQTLs per metabolite. For the G x E component, 81 mQTLs for 42
metabolites were identified. The mQTLs detected for the main G effect are
shown in Figure 4. The details of the results of all mQTL analyses are given in
Supplemental Table 6.
Genetic control of coordinated metabolic changes
Under the four conditions, a high number of mQTLs co-located on the top of
chromosome 4 and 5 (Figure 4). In other regions of the genome, mQTLs were
identified for specific environments, suggesting distinct genetic basis and
metabolic pathways across the different conditions (Figure 4, upper panel).
Conceptually, highly correlated metabolites are likely to share mQTLs (Matsuda
et al. 2012; Carreno-Quintero et al. 2012). The high connectivity of the
metabolites observed in the different networks lead us to investigate
environment specific co-locating mQTLs. We thus investigated whether co-
Combined RILs
ST HT HL LP G GxE
Metabolites with at least 1 mQTL 86 91 80 85 125 42
Total number of mQTLs 127 161 162 168 440 81
Range of mQTLs per metabolite 1-6 1-7 1-7 1-6 1-12 1-5
Average nr of mQTLs per metabolite 1.48 1.77 2.03 1.98 3.52 1.14
84
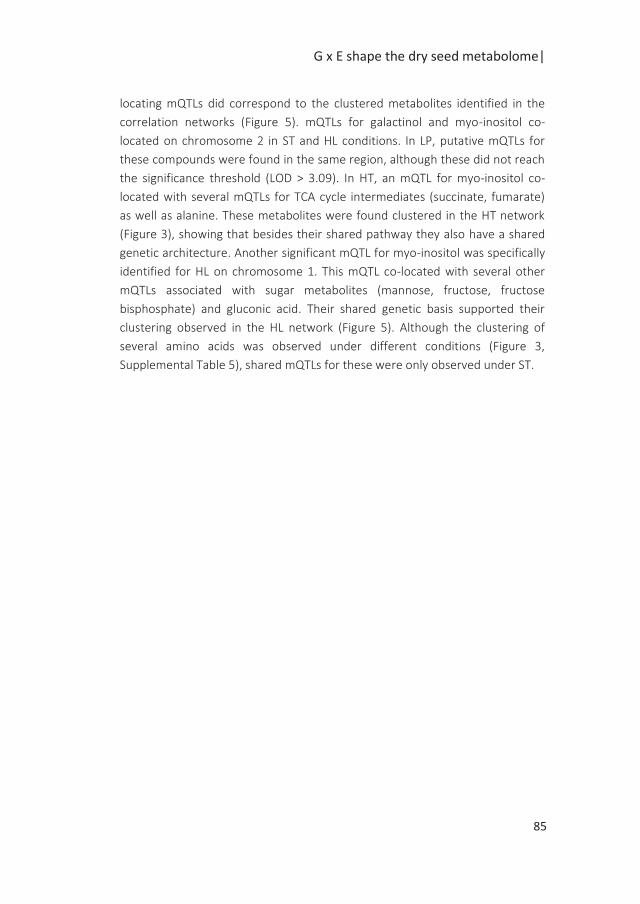
G x E shape the dry seed metabolome|
locating mQTLs did correspond to the clustered metabolites identified in the
correlation networks (Figure 5). mQTLs for galactinol and myo-inositol co-
located on chromosome 2 in ST and HL conditions. In LP, putative mQTLs for
these compounds were found in the same region, although these did not reach
the significance threshold (LOD > 3.09). In HT, an mQTL for myo-inositol co-
located with several mQTLs for TCA cycle intermediates (succinate, fumarate)
as well as alanine. These metabolites were found clustered in the HT network
(Figure 3), showing that besides their shared pathway they also have a shared
genetic architecture. Another significant mQTL for myo-inositol was specifically
identified for HL on chromosome 1. This mQTL co-located with several other
mQTLs associated with sugar metabolites (mannose, fructose, fructose
bisphosphate) and gluconic acid. Their shared genetic basis supported their
clustering observed in the HL network (Figure 5). Although the clustering of
several amino acids was observed under different conditions (Figure 3,
Supplemental Table 5), shared mQTLs for these were only observed under ST.
85
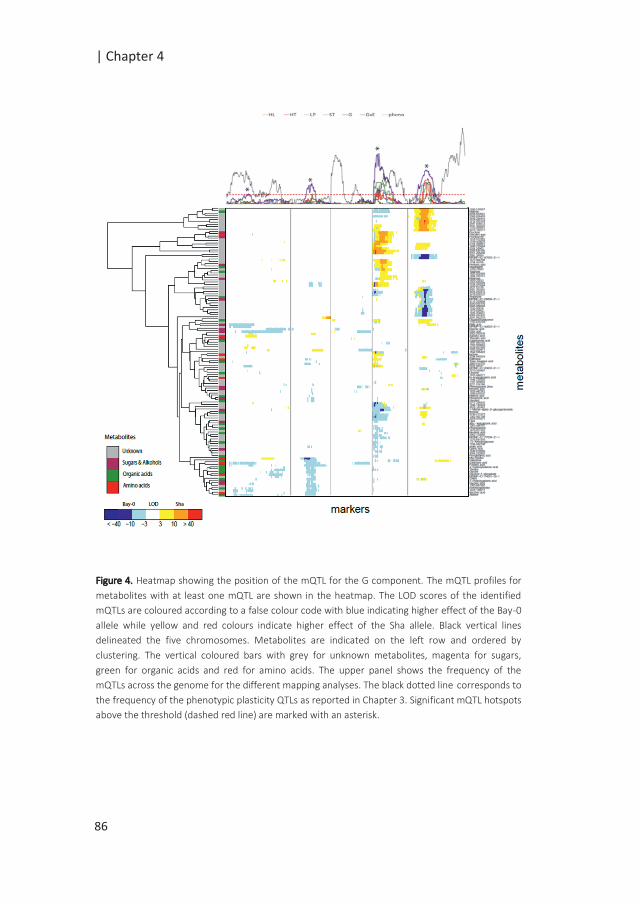
| Chapter 4
Figure 4. Heatmap showing the position of the mQTL for the G component. The mQTL profiles for
metabolites with at least one mQTL are shown in the heatmap. The LOD scores of the identified
mQTLs are coloured according to a false colour code with blue indicating higher effect of the Bay-0
allele while yellow and red colours indicate higher effect of the Sha allele. Black vertical lines
delineated the five chromosomes. Metabolites are indicated on the left row and ordered by
clustering. The vertical coloured bars with grey for unknown metabolites, magenta for sugars,
green for organic acids and red for amino acids. The upper panel shows the frequency of the
mQTLs across the genome for the different mapping analyses. The black dotted line corresponds to
the frequency of the phenotypic plasticity QTLs as reported in Chapter 3. Significant mQTL hotspots
above the threshold (dashed red line) are marked with an asterisk.
86
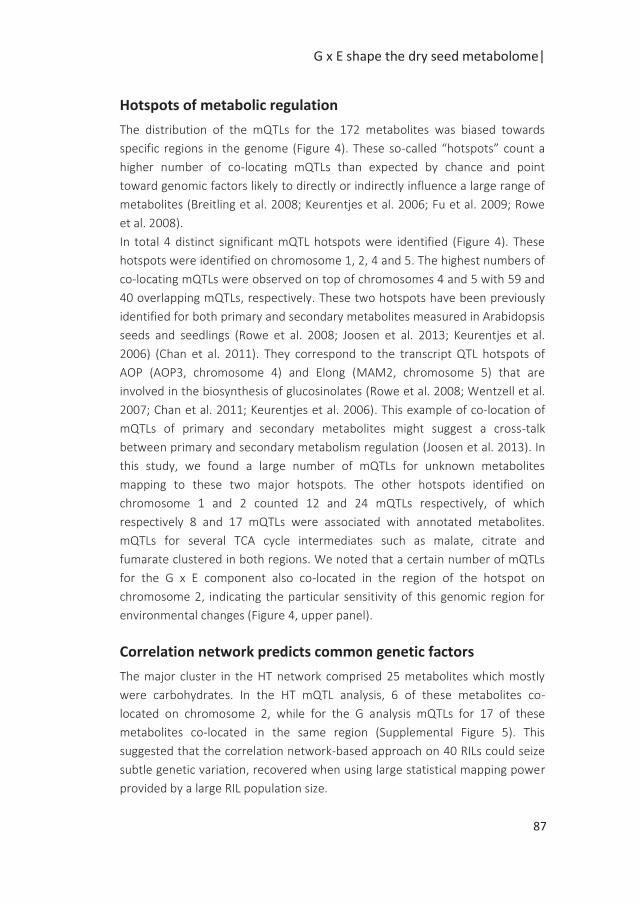
G x E shape the dry seed metabolome|
Hotspots of metabolic regulation
The distribution of the mQTLs for the 172 metabolites was biased towards
specific regions in the genome (Figure 4). These so-called “hotspots” count a
higher number of co-locating mQTLs than expected by chance and point
toward genomic factors likely to directly or indirectly influence a large range of
metabolites (Breitling et al. 2008; Keurentjes et al. 2006; Fu et al. 2009; Rowe
et al. 2008).
In total 4 distinct significant mQTL hotspots were identified (Figure 4). These
hotspots were identified on chromosome 1, 2, 4 and 5. The highest numbers of
co-locating mQTLs were observed on top of chromosomes 4 and 5 with 59 and
40 overlapping mQTLs, respectively. These two hotspots have been previously
identified for both primary and secondary metabolites measured in Arabidopsis
seeds and seedlings (Rowe et al. 2008; Joosen et al. 2013; Keurentjes et al.
2006) (Chan et al. 2011). They correspond to the transcript QTL hotspots of
AOP (AOP3, chromosome 4) and Elong (MAM2, chromosome 5) that are
involved in the biosynthesis of glucosinolates (Rowe et al. 2008; Wentzell et al.
2007; Chan et al. 2011; Keurentjes et al. 2006). This example of co-location of
mQTLs of primary and secondary metabolites might suggest a cross-talk
between primary and secondary metabolism regulation (Joosen et al. 2013). In
this study, we found a large number of mQTLs for unknown metabolites
mapping to these two major hotspots. The other hotspots identified on
chromosome 1 and 2 counted 12 and 24 mQTLs respectively, of which
respectively 8 and 17 mQTLs were associated with annotated metabolites.
mQTLs for several TCA cycle intermediates such as malate, citrate and
fumarate clustered in both regions. We noted that a certain number of mQTLs
for the G x E component also co-located in the region of the hotspot on
chromosome 2, indicating the particular sensitivity of this genomic region for
environmental changes (Figure 4, upper panel).
Correlation network predicts common genetic factors
The major cluster in the HT network comprised 25 metabolites which mostly
were carbohydrates. In the HT mQTL analysis, 6 of these metabolites co-
located on chromosome 2, while for the G analysis mQTLs for 17 of these
metabolites co-located in the same region (Supplemental Figure 5). This
suggested that the correlation network-based approach on 40 RILs could seize
subtle genetic variation, recovered when using large statistical mapping power
provided by a large RIL population size.
87
| Chapter 4
Several lines of evidence indicate that the G mQTL hotspot on chromosome 2
was driven by the HT RIL dataset. The main G effect QTL analysis excluding the
RIL set grown under HT failed to identify this mQTL hotspot. The PCA of the
metabolite profiling of the RILs also indicated the remarkable effect of the HT
maternal environment on the dry seed metabolome (Figure 2). This was best
captured by the first two components of the PCA. QTL mapping using the
projected scores for PC1 identified a PC1-QTL coinciding with the position of
the mQTL hotspot on chromosome 2 (Supplemental Figure 6). Together, these
results indicate that correlation network analysis, even in a context of limited
resolution (40 RILs) could help to predict common genetic factors prior to QTL
analysis.
Several studies have used network properties to enhance our knowledge of the
landscape of metabolic regulation. For instance, other than abundance of the
metabolites, variables for mQTL mapping can also be derived from the known
inter-relation of the metabolites in a pathway. The mapping is then performed
using metabolic ratio or the sum of the metabolites belonging to a same
pathway (Kliebenstein et al. 2001; Wentzell et al. 2007; Angelovici et al. 2013).
Since, the pathway structure causes metabolites to correlate; using this
correlation can facilitate the linkage of metabolic shifts to the impact of the
different biochemical pathways (Weckwerth et al. 2004; Steuer et al. 2003). In
a recent study, (Angelovici et al. 2017) used network topological properties to
derive new metabolic variables. Their approach resulted in the identification of
new loci associated with the free amino acid pathways in seeds, showing that
network properties can complement classical variables for the identification of
genetic variants.
88
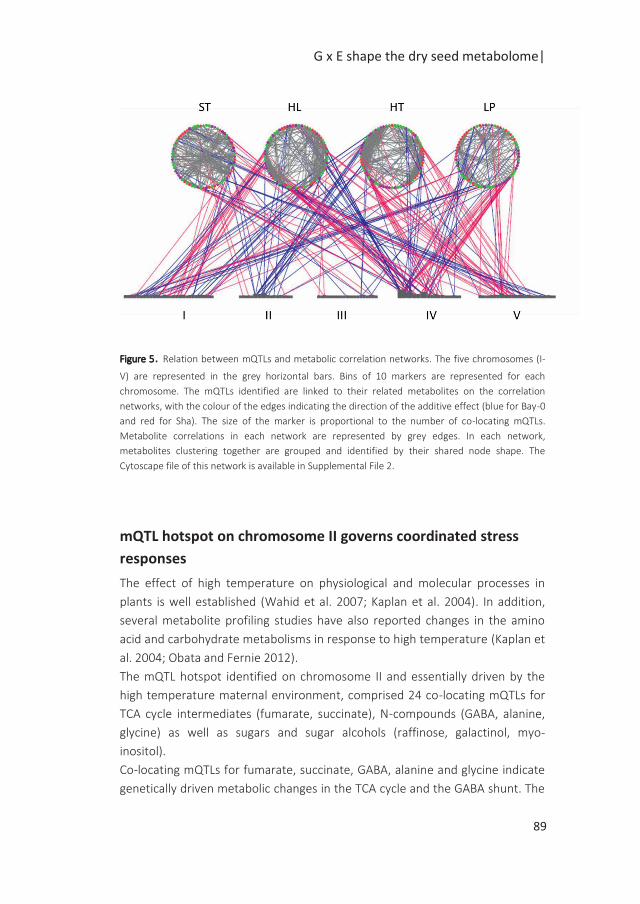
G x E shape the dry seed metabolome|
Figure 5. Relation between mQTLs and metabolic correlation networks. The five chromosomes (I-
V) are represented in the grey horizontal bars. Bins of 10 markers are represented for each
chromosome. The mQTLs identified are linked to their related metabolites on the correlation
networks, with the colour of the edges indicating the direction of the additive effect (blue for Bay-0
and red for Sha). The size of the marker is proportional to the number of co-locating mQTLs.
Metabolite correlations in each network are represented by grey edges. In each network,
metabolites clustering together are grouped and identified by their shared node shape. The
Cytoscape file of this network is available in Supplemental File 2.
mQTL hotspot on chromosome II governs coordinated stress
responses
The effect of high temperature on physiological and molecular processes in
plants is well established (Wahid et al. 2007; Kaplan et al. 2004). In addition,
several metabolite profiling studies have also reported changes in the amino
acid and carbohydrate metabolisms in response to high temperature (Kaplan et
al. 2004; Obata and Fernie 2012).
The mQTL hotspot identified on chromosome II and essentially driven by the
high temperature maternal environment, comprised 24 co-locating mQTLs for
TCA cycle intermediates (fumarate, succinate), N-compounds (GABA, alanine,
glycine) as well as sugars and sugar alcohols (raffinose, galactinol, myo-
inositol).
Co-locating mQTLs for fumarate, succinate, GABA, alanine and glycine indicate
genetically driven metabolic changes in the TCA cycle and the GABA shunt. The
89
| Chapter 4
TCA cycle plays a central role in energy metabolism (Araujo et al. 2012). Under
normal conditions, the TCA cycle is used to release stored energy from glucose,
fatty acids or amino acids into chemical energy to support other metabolic
activities. The GABA shunt bypasses two steps of the TCA cycle; the conversion
of 2-oxoglutarate to succyl-coA and subsequently succinate. Instead, 2-
oxoglutarate is converted into glutamate and subsequently to GABA. Through
the action of a transaminase, GABA is converted into succinate semi-aldehyde
which re-enters the TCA cycle in the form of succinate. The accumulation of
GABA in response to abiotic stresses has been reported in several studies
(Kinnersley and Turano 2000). Although its physiological role remains unclear,
GABA has been associated with many physiological responses including stress
signalling (Bouche and Fromm 2004). Moreover, a recent study has shown that
stress altered function of the TCA cycle can be alleviated by the GABA shunt
(Fait et al. 2008). This alternative metabolic route might represent an adaptive
mechanism to maintain the metabolic balance under stress conditions.
The co-location of mQTLs for myo-inositol, galactinol and raffinose also
suggested coordinated metabolic changes in the regulation of the raffinose
family oligosaccharides (RFOs) pathway. In the first step of this pathway, myo-
inositol is converted in galactinol and through subsequent steps to raffinose
and stacchyose. Several functional roles for these oligosaccharides have been
reported. RFOs can act as osmo-protectants of cellular structures to protect the
embryo during seed development and in particular seed desiccation (Taji
2002). RFOs are also involved in stress defence mechanisms (reviewed by
(ElSayed et al. 2014) by protecting plants from reactive oxygen species (ROS)
produced under stress.
For most of these co-locating mQTLs, higher metabolite levels were governed
by the Bay-0 allele (Figure 4). Bay-0 and Sha display contrasting sensitivity
responses. Sha appears more stress tolerant, while Bay-0 is more sensitive to
stresses during seed germination (Chapter 3, (Joosen et al. 2012; Vallejo et al.
2010). Higher temperature is associated with physiological changes such as
reduction in plant growth, increased growth rate, earlier flowering and earlier
seed set (Springthorpe and Penfield 2015; Wahid et al. 2007). Higher
temperature also result in increased respiration and metabolic rate (Wahid et
al. 2007). The increase of the TCA cycle intermediates suggests that Bay-0 shift
the pool of metabolites towards higher carbohydrate levels and higher energy
metabolism to adjust growth and developmental processes to higher
temperatures. Under stress conditions elevated cellular metabolic rate can lead
to an excessive production of ROS, which are normal products of plant cellular
90
G x E shape the dry seed metabolome|
metabolism. ROS can serve as signalling molecules, but also cause oxidative
damages, which likely depends on the equilibrium between ROS production
and ROS scavenging. The enhanced biosynthesis of RFOs, known osmo-
protectant molecules, can prevent such oxidative damages.
MIPS2 as a potential candidate for causing the mQTL hotspot on
chromosome 2
The mQTL with the highest LOD score (-16.51) under the hotspot on
chromosome 2 was observed for myo-inositol. Myo-inositol is a versatile
compound which endorses various roles in plants such as in phytic acid
biosynthesis, cell wall biosynthesis and the production of stress-related
proteins (Meng et al. 2009), reviewed by Valluru and Van den Ende (2011).
Genes underlying the mQTL hotspot were scrutinized for their direct link with
the above mentioned metabolic pathways. One of the most likely candidates
underlying this hotspot is myo-inositol-1-phosphate synthase 2 (MIPS2,
At2g22240) which catalyses the conversion of D-glucose 6-phosphate to 1L-
myo-inositol-1-phosphate. MIPS2 is found highly expressed in seeds and in
particular during late seed maturation (Supplemental Figure 7). Myo-inositol
mQTL co-located with an eQTL for MIPS2 (Nijveen et al. 2017)
(http://www.bioinformatics.nl/AraQTL/). Further investigations are needed to
measure the impact of MIPS2 on myo-inositol and other metabolite levels, in
particular in response to stress conditions.
Maternal environment modulates the metabolite-phenotype
relation
In view of the extensive changes occurring at the metabolic level, the question
remains whether these changes can explain phenotypic differences. In several
studies, the shared genetic basis between metabolic and phenotypic QTLs has
been observed (Carreno-Quintero et al. 2012), (Kazmi et al. 2017). Comparison
of the mQTL and phQTL distributions was performed with all traits measured
for germination in Chapter 3.
Overall, the main mQTL hotspots showed limited overlap with the major
hotspots for phQTLs (Figure 4, upper panel). An example of a co-locating mQTL
and phQTL was observed on top of chromosome 1. The mQTL hotspot on that
chromosome comprising TCA cycle intermediates mQTLs, with higher effect
triggered by Bay-0, co-located with a large number of phQTLs. Many of these
phQTLs were specific for the population grown under high temperature for
91
| Chapter 4
several germination conditions (Chapter 3). Higher germination (AUC value)
was observed for the Sha allele, suggesting that the higher amounts of TCA
cycle intermediates in Bay-0 would negatively affect seed performance. This
negative correlation between TCA cycle intermediates and seed performance
was also observed for seeds matured under low and high light seed maturation
conditions in Arabidopsis (He et al. 2016). On the other hand, low temperature
maturation environment altered TCA cycle activity with a significant decrease
of fumarate and succinate contents and showed a positive correlation with
seed performance traits (He et al. 2016).
Correlation between seed performance and metabolites
The limited overlap between mQTLs and phQTLs lead us to also investigate the
relation between metabolic changes and seed performance (AUC under
different conditions) by correlation analysis. Overall, intermediate Spearman
correlations were observed between metabolite and seed performance
(Supplemental Table 8). Nonetheless, we found different sets of metabolites
significantly correlated with seed performance traits across the four conditions.
Under HT, negative correlations were observed between metabolites of the HT
cluster (glycerate, glycine, glycerol-3-P) and several seed performance traits.
Under HL, significant positive correlations were observed between metabolites
of the cluster HL (mainly sugars) and seed performance in particular with
germination under cold or heat with stratification. This observation is in line
with the aforementioned properties of sugars and inositol compounds to act as
osmolytes and provide stress protection to ensure germination. In ST,
galactinol, myo-inositol and glycerol-3-phosphate were negatively correlated
with seed performance. Galactinol synthase (GolS) is considered to be a key
regulator of the biosynthesis of Raffinose family oligosaccharides (RFOs) and
the accumulation of RFOs has been reported to play a role in protection against
abiotic stresses. A recent study showed that the expression of AtGOLS1,
encoding a galactinol synthase, decreases when conditions are favourable for
seed germination, indicating a negative regulation of seed germination by
AtGOLS1 (Jang et al. 2018). Under ST, malate, citrate and sugars (mannose and
glucose) and key compounds of the TCA cycle were positively correlated with
seed performance supporting the role of the TCA cycle in the control of the
energetic status of the seeds as well as the link with seed performance.
Together, these results show that the maternal environment can modulate
seed metabolism and its link to seed phenotypes.
92
G x E shape the dry seed metabolome|
Conclusion
In this study, we used untargeted GC-TOF-MS metabolite profiling of an
Arabidopsis RIL population to explore the effect of genotype and maturation
environment on the dry seed metabolism and the implication for seed
germination. Our results show that changes in the maturation environment
markedly affect the dry seed metabolome in a genotype-dependent manner.
The topological relationships among the metabolites extracted from the
condition specific networks, combined with mQTL analyses showed that
coordinated metabolic changes are environment specific and genetically
controlled. A major mQTL hotspot on chromosome 2 was identified and
provided insights into the adaptive metabolic responses to stress conditions.
The role of MIPS2, identified as a potential candidate underlying this mQTL
hotspot, needs to be further investigated. Together, these approaches bring
new insights into the understanding of the genetic regulation of dry seed
metabolome under stress conditions and its effect on seed performance.
93
| Chapter 4
List of supplemental data
If not found below, supporting information can be downloaded from:
http://www.wageningenseedlab.nl/thesis/earserin/SI/chapter4
Supplemental Table 1: Raw data for metabolites measured in the dry seeds of
parents and RILs grown under the different maternal environments.
Supplemental Table 2: ANOVA and summary statistics for the metabolite data
of parents and RILs.
Supplemental Table 3: Loadings for the principal component analysis on the 71
annotated metabolites from the combined RILs.
Supplemental Table 4: Condition specific metabolite correlation network
properties.
Supplemental Table 5: Pathway enrichment analysis for the two largest clusters
identified in the condition specific correlation networks.
Supplemental Table 6: Results of the mQTL analyses in a GGG design.
Supplemental Table 7: Spearman correlation r and associated p-values for all
pairwise correlations between all 172 metabolites from each condition.
Supplemental Table 8: List of significant correlations between seed
performance phenotypes and metabolites for the different conditions.
Supplemental Figure 1: Allele distribution across markers for the RILs in the
GGG design.
Supplemental Figure 2: PCA with score and loading plots for all 172 metabolites
from the combined RILs.
Supplemental Figure 3: PCA of the 71 annotated metabolites measured in the
RILs grown under the different maternal environments.
Supplemental Figure 4: Metabolite correlations for all 172 detected metabolites
under high temperature.
Supplemental Figure 5: Link between mQTL hotspot on chromosome 2 and the
HT correlation network.
Supplemental Figure 6: Heatmap for the mapping of the principal components.
Supplemental Figure 7: Expression profile of MIPS2 at several developmental
stages using the eFP browser from the Bio Analytic Resource for Plant Biology.
Supplemental File 1: Cytoscape files for the condition specific correlation
networks.
94
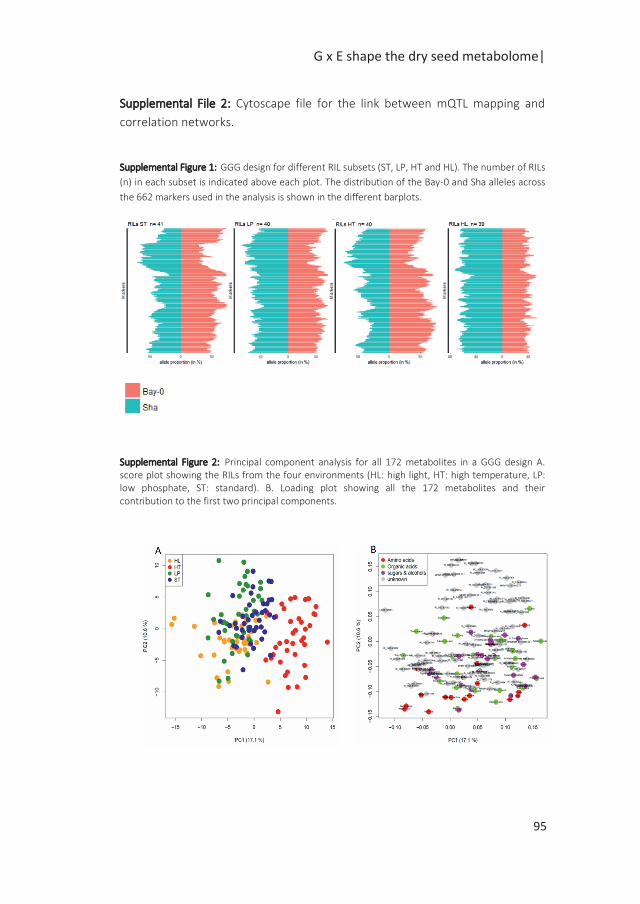
G x E shape the dry seed metabolome|
Supplemental File 2: Cytoscape file for the link between mQTL mapping and
correlation networks.
Supplemental Figure 1: GGG design for different RIL subsets (ST, LP, HT and HL). The number of RILs
(n) in each subset is indicated above each plot. The distribution of the Bay-0 and Sha alleles across
the 662 markers used in the analysis is shown in the different barplots.
Supplemental Figure 2: Principal component analysis for all 172 metabolites in a GGG design A. score plot showing the RILs from the four environments (HL: high light, HT: high temperature, LP: low phosphate, ST: standard). B. Loading plot showing all the 172 metabolites and their contribution to the first two principal components.
95
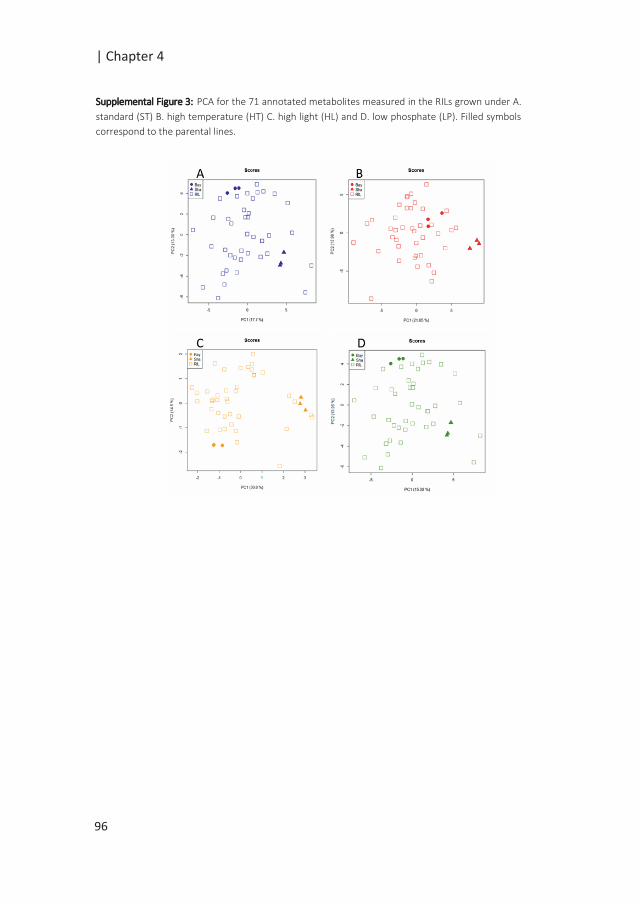
| Chapter 4
Supplemental Figure 3: PCA for the 71 annotated metabolites measured in the RILs grown under A.
standard (ST) B. high temperature (HT) C. high light (HL) and D. low phosphate (LP). Filled symbols
correspond to the parental lines.
96

G x E shape the dry seed metabolome|
Supplemental Figure 4: Metabolite correlations for all 172 detected metabolites under high
temperature. The heatmap shows the pairwise spearman correlations between all 172 metabolites
measured in the HT-RILs. Hierarchical clustering was performed based on the distance dissimilarity
matrix. The colour code indicates low (blue) to high (red) correlation values. The two frames
indicate clusters of highly correlated sugars and organic acids (green) and amino acids (dark red) as
observed in the HT network for the 71 annotated metabolites.
97
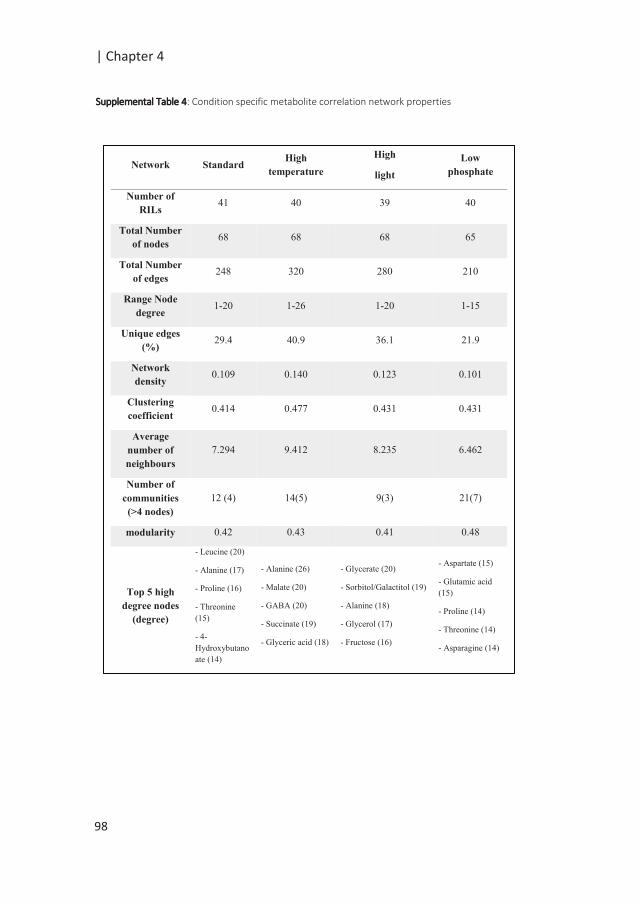
| Chapter 4
Supplemental Table 4: Condition specific metabolite correlation network properties
Network Standard High
temperature
High
light
Low
phosphate
Number of
RILs 41 40 39 40
Total Number
of nodes 68 68 68 65
Total Number
of edges 248 320 280 210
Range Node
degree 1-20 1-26 1-20 1-15
Unique edges
(%) 29.4 40.9 36.1 21.9
Network
density 0.109 0.140 0.123 0.101
Clustering
coefficient 0.414 0.477 0.431 0.431
Average
number of
neighbours
7.294 9.412 8.235 6.462
Number of
communities
(>4 nodes)
12 (4) 14(5) 9(3) 21(7)
modularity 0.42 0.43 0.41 0.48
Top 5 high
degree nodes
(degree)
- Leucine (20)
- Alanine (17)
- Proline (16)
- Threonine
(15)
- 4-
Hydroxybutano
ate (14)
- Alanine (26)
- Malate (20)
- GABA (20)
- Succinate (19)
- Glyceric acid (18)
- Glycerate (20)
- Sorbitol/Galactitol (19)
- Alanine (18)
- Glycerol (17)
- Fructose (16)
- Aspartate (15)
- Glutamic acid
(15)
- Proline (14)
- Threonine (14)
- Asparagine (14)
98

G x E shape the dry seed metabolome|
Supplemental Table 5. Significantly enriched pathways for metabolic clusters of condition specific
correlation networks. Pathway enrichment analysis was performed for the two largest clusters
found in each network. Cluster 1 corresponds to diamond shaped metabolites and cluster 2
corresponds to triangle nodes as depicted in Figure 4. Only clusters with significantly enriched
pathways (p-value < 0.01) are shown. Pathways are ranked based on the p-value and n is the
number of metabolites in the cluster compared to the total number of metabolites from the
pathway, N.
Network Cluster pathway name n N p < 0.01
Cluster 1 Glycerolipid metabolism 2 13 0.007996
Aminoacyl-tRNA biosynthesis 9 67 9.90E-10
Arginine and proline metabolism 5 38 1.85E-05
Valine, leucine and isoleucine biosynthesis 4 26 8.27E-05
Alanine, aspartate and glutamate metabolism 3 22 0.001109
Valine, leucine and isoleucine degradation 3 34 0.004015
Lysine biosynthesis 2 10 0.004046
Nitrogen metabolism 2 15 0.009174
Aminoacyl-tRNA biosynthesis 12 67 2.41E-10
Alanine, aspartate and glutamate metabolism 5 22 3.09E-05
Arginine and proline metabolism 5 38 4.82E-04
Valine, leucine and isoleucine biosynthesis 4 26 0.001056
Galactose metabolism 4 26 0.001056
Nitrogen metabolism 3 15 0.002236
Citrate cycle (TCA cycle) 4 20 1.13E-04
Glyoxylate and dicarboxylate metabolism 3 17 0.001381
Alanine, aspartate and glutamate metabolism 3 22 0.002993
Alanine, aspartate and glutamate metabolism 5 22 8.94E-06
Citrate cycle (TCA cycle) 4 20 1.42E-04
Arginine and proline metabolism 4 38 0.001819
Carbon fixation in photosynthetic organisms 3 21 0.003064
Glycine, serine and threonine metabolism 3 30 0.008596
cluster 2 Galactose metabolism 3 26 0.001084
Aminoacyl-tRNA biosynthesis 12 67 2.11E-12
Alanine, aspartate and glutamate metabolism 5 22 6.66E-06
Arginine and proline metabolism 5 38 1.11E-04
Valine, leucine and isoleucine biosynthesis 4 26 3.30E-04
Nitrogen metabolism 3 15 9.40E-04
Carbon fixation in photosynthetic organisms 3 21 0.002607
Glycine, serine and threonine metabolism 3 30 0.007354
Lysine biosynthesis 2 10 0.007772
Cyanoamino acid metabolism 2 11 0.009421
cluster 2
LOW
PH
OP
SHA
TEH
IGH
TEM
PER
ATU
RE
HIG
H L
IGH
T
STA
ND
AR
D
cluster 1
cluster 1
cluster 1
cluster 2
99
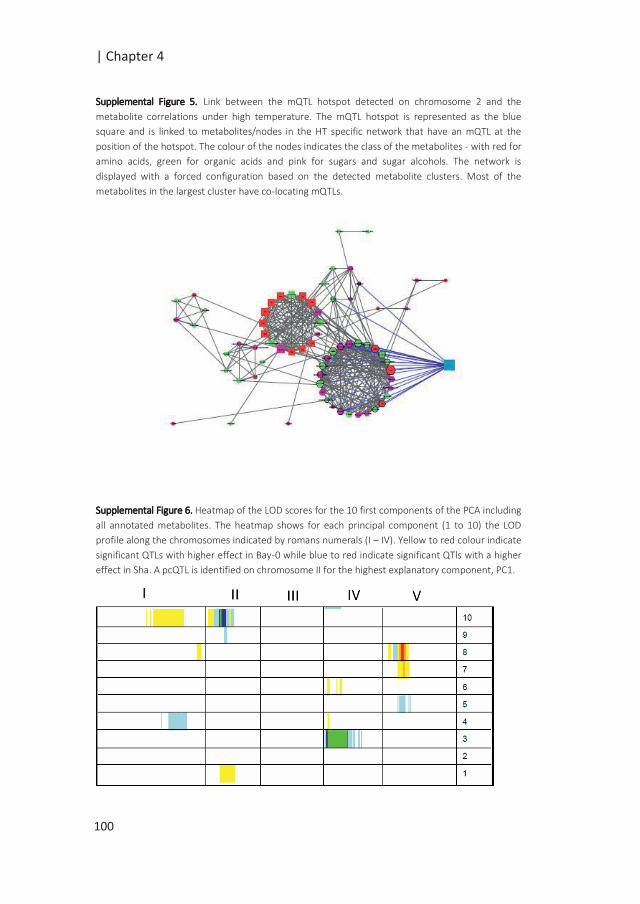
| Chapter 4
Supplemental Figure 5. Link between the mQTL hotspot detected on chromosome 2 and the
metabolite correlations under high temperature. The mQTL hotspot is represented as the blue
square and is linked to metabolites/nodes in the HT specific network that have an mQTL at the
position of the hotspot. The colour of the nodes indicates the class of the metabolites - with red for
amino acids, green for organic acids and pink for sugars and sugar alcohols. The network is
displayed with a forced configuration based on the detected metabolite clusters. Most of the
metabolites in the largest cluster have co-locating mQTLs.
Supplemental Figure 6. Heatmap of the LOD scores for the 10 first components of the PCA including
all annotated metabolites. The heatmap shows for each principal component (1 to 10) the LOD
profile along the chromosomes indicated by romans numerals (I – IV). Yellow to red colour indicate
significant QTLs with higher effect in Bay-0 while blue to red indicate significant QTls with a higher
effect in Sha. A pcQTL is identified on chromosome II for the highest explanatory component, PC1.
100
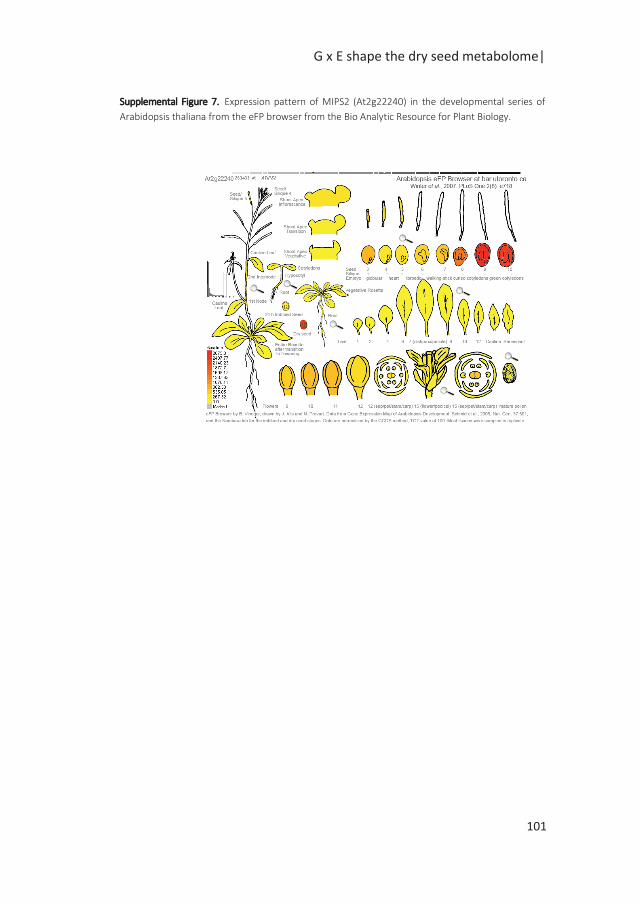
G x E shape the dry seed metabolome|
Supplemental Figure 7. Expression pattern of MIPS2 (At2g22240) in the developmental series of
Arabidopsis thaliana from the eFP browser from the Bio Analytic Resource for Plant Biology.
101

102
Chapter 5
Environmental and genetic effects on gene
expression in Arabidopsis seeds
Elise A. R. Serin*, Basten L. Snoek*, Harm Nijveen, Leo A. J. Willems,
Henk W. M. Hilhorst and Wilco Ligterink
* These authors contributed equally to this work
| Chapter 5
Abstract
Gene expression is largely influenced by environmental and genetic factors.
The environment experienced during seed development results in
transcriptomic changes in a genotype-dependent manner. A deeper
investigation of the genetic basis of these changes and the extent of genotype
by environment interactions is needed for a comprehensive understanding of
seed quality and its control. In this study, an Arabidopsis Bay-0 x Sha RIL
population, consisting of 165 lines, was grown under four different
environments; standard, high temperature, high light and low phosphate from
flowering until seed harvest. RNA-seq was performed on the dry seeds of the
parental and 160 recombinant inbred lines produced under the different
environments using a generalized genetical genomics set-up.
A large number of genotype-by-environment interactions (G x E) were
identified in the parental lines which were reflected in the RILs. Overall, a large
number of eQTLs was identified. Their profile substantially differed between
conditions, indicating eQTL x E interactions. Consistent with previous studies,
local eQTLs largely overlapped between environments while distant eQTLs
were highly variable across environments. The eQTL distribution along the
genome showed environment-specific genetic hotspots of transcript regulation
enriched for different specific biological processes.
With this study, we show that transcriptional changes found in dry seeds are
largely caused by genotype-by-environment interactions. These datasets
represent a valuable resource for further research towards understanding the
dynamics and mechanisms of gene expression regulation in seeds in response
to environmental changes and their link with seed performance.
Keywords: Arabidopsis thaliana, eQTL, G x E, maternal environment, RNA-seq,
seed performance
104
G and E effects on gene expression |
Introduction
During seed development, seeds accumulate various macro-molecules, such as
proteins and mRNAs. These molecules contribute to seed developmental
processes such as seed maturation, desiccation tolerance and dormancy, while
others can remain stored in dry seeds for a role during germination. The role of
these stored mRNAs in germination has been highlighted by studies showing
that germination can take place in the absence of de novo transcription (Rajjou
et al. 2004; Kimura and Nambara 2010). This suggests that the early initiation
of molecular and physiological processes essentially relies on the activity of
stored proteins, enzymes as well as on the translation of these stored mRNAs
(Rajjou et al. 2004; Kimura and Nambara 2010). Genome-wide profiling of
these mRNAs in Arabidopsis seeds identified more than 10 000 stored mRNAs
associated with several biological processes (Dekkers et al. 2013; Nakabayashi
et al. 2005; Belmonte et al. 2013). A recent study showed that this pool of
stored mRNAs is modulated by the seed production environment in a
genotype-dependent manner (He et al. 2016).
Genome wide expression analyses in Arabidopsis seeds have brought large
insights into the dynamics of the transcriptome during seed development
(Ruuska 2002; Belmonte et al. 2013), dormancy (Bassel et al. 2011), desiccation
tolerance (Costa et al. 2015), germination (Dekkers et al. 2013) and seedling
establishment (Silva et al. 2016). Naturally occurring genetic variation for seed
traits has been largely studied in Arabidopsis. The genetic basis of such
variation can be explored using quantitative trait locus (QTL) analysis. Gene
expression can be treated as a quantitative trait and thus combining QTL
analysis with large scale expression profiling can provide insights into the
genetic determinants of gene expression (Jansen and Nap 2001). This genetical
genomics approach has revealed the genetic architecture of gene expression
variation in plants as well as in other organisms (Joosen et al. 2009; Li et al.
2006; Brem et al. 2002; Schadt et al. 2003). Several eQTL studies have also
investigated changes in the eQTL landscape in response to perturbations such
as across different populations (Cubillos et al. 2012), in time (Vinuela et al.
2010), in response to abiotic stresses (Snoek et al. 2017b; Cubillos et al. 2014;
Lowry et al. 2013) and across different tissues (Drost et al. 2015).
A promising application of eQTL analysis is the insights into regulatory
mechanisms that can be gained from the identification of two types of eQTLs
regarding their mapping position (Kliebenstein 2009; Rockman and Kruglyak
2006). These are often reported as cis and trans-eQTLs in the literature. We
105
| Chapter 5
prefer to refer to local versus distant eQTLs since their categorization is based
on genomic distances between the position of the eQTL and the physical
position of the genes which leave an uncertainty regarding their true nature.
Local eQTLs correspond to eQTLs that map at the physical position of the gene
investigated. In this case, the local regulation of gene expression can be
explained by a sequence polymorphism in the gene itself or in physically
neighbouring regions (Rockman and Kruglyak 2006). On the other hand, distant
eQTLs map at other positions on the same or on another chromosome. In this
case, the distant regulation occurs as a result of a gene’s polymorphic variant
affecting the expression of one or several other genes (Rockman and Kruglyak
2006). The non-random accumulation of eQTLs in genomic regions leads to the
identification of eQTL hotspots. Often observed in eQTL studies, these hotspots
may suggest the large pleiotropic effect of an underlying polymorphic variant
(Breitling et al. 2008). These hotspots provide a good starting point to identify
groups of co-regulated genes with shared biological functions. For Arabidopsis,
the extensive knowledge on gene function and pathways (Lamesch et al. 2012;
Kanehisa and Goto 2000) provides valuable input to drive such investigations.
The elucidation of the genetic control of genotype-by-environment interactions
(G x E) is crucial to understand the regulation of gene expression and ultimately
seed performance. In this study, we used an Arabidopsis thaliana recombinant
inbred line (RIL) population of 165 lines grown under standard, high
temperature, high light and low phosphate environments to provide a genome-
wide view of the plasticity of gene expression regulation. We used a
generalized genetical genomics (GGG) design to investigate the effect of
genetic and multi-environment perturbations on gene expression in a cost-
efficient manner (Li et al. 2008b). In such a design, complementary and equal
subsets of lines are drawn from the initial population while maintaining a
balanced allele distribution in each subset. Subsequently different treatments
and/or developmental stages can be used for the different subsets. In contrast
to previous eQTL studies in plants using microarrays (Cubillos et al. 2014; Snoek
et al. 2012) we use for the first time RNA-seq on dry seeds matured under
different conditions to perform eQTL analysis in a GGG design. We showed that
the dry seed eQTL landscape is largely influenced by the maternal
environment, resulting in several environment-specific eQTL hotspots. In
addition, we provide a glimpse on the potential of these datasets to enhance
gene discovery in relation to seed performance.
106
G and E effects on gene expression |
Material and Methods
Plant Material
Plants from the Arabidopsis thaliana Bay-0 x Sha recombinant inbred line
population (165 RILs) (Loudet et al. 2002) were grown in standard (ST)
conditions, namely long day (16h light / 8h dark) and 22°C/18°C (day / night)
under artificial light (150 µm m-2 s-1) in a climate chamber until flowering.
Once all plants flowered, the stems were cut short to ensure complete seed
development under the four environments. Four plants per RIL as well as the
parental lines were transferred to high light (HL)(300 µm m-2 s-1) and high
temperature (HT)(25°C/23°C) conditions in different climate cells. RILs grown
under standard and low phosphate (LP)(12.5 µM) conditions remained in the
same climate cell, with an adjustment of the nutritive solution for RILs grown in
the LP condition on a separate flooding table. Once sufficient amounts of fully
matured seeds were produced under each environment, fresh dry seeds were
bulk harvested from 3-4 plants, dried and stored at -80°C until RNA-seq library
preparation.
Sample preparation
The population was divided in four sub-populations optimized for the
distribution of the parental alleles as previously described (Serin et al. 2017).
Four mg of fresh dry seeds of the parental lines and the RILs grown under the
different environments in a GGG design were used to extract total RNA. RNA
was isolated using the NucleoSpin RNA plant isolation kit (Macherey-Nagel
740949) adding Plant RNA isolation Aid (Life technologies) according to the
manufacturer’s protocol and instructions. RNA from three replicates was
isolated for the parental lines, Bay-0 and Sha, grown under the different
conditions.
RNA-seq analysis
The processing of the RNA-seq is described in (Serin et al. 2017). Strand-specific
RNA-seq libraries were prepared from each RNA sample using the TruSeq RNA
kit from Illumina according to manufacturer’s instructions. Poly-A-selected
mRNA was sequenced using the Illumina HiSeq2500 sequencer, producing
strand-specific single-end reads of 100 nucleotides. Reads were trimmed using
107
| Chapter 5
Trimmomatic (version 0.33, (Bolger et al. 2014) to remove low quality
nucleotides. Trimmed reads were subsequently mapped to the Arabidopsis
thaliana TAIR10 reference genome (Lamesch et al. 2012) using the HISAT2
software (version 2.0.1, (Kim et al. 2015) with the “transcriptome mapping
only” option.
Differential gene expression analysis
The quantification of the transcripts was done using ‘Kallisto’ (Bray et al. 2016).
The Bioconductor package ‘edgeR’ (Robinson et al. 2009) was used to perform
the differential gene expression analysis at the isoform level. Transcripts were
considered differentially expressed for an FDR corrected p-value < 0.05.
ANOVA analysis
ANOVA was performed for each transcript measured in the parental lines using
the model:
Pij = Gi + Ej + GEij + Ɛij
where Pij is the transcript abundance level, Gi is the effect of the genotype i , Ej
is the effect of the maternal environment j and GEij the interaction between
genotype and environment and Ɛij, the residuals. The sum square of the
variance for each component was calculated as a percentage of the total sum
of the variances explained by the different terms of the model. Only transcripts
for which the summed explained variance for the G, E and G x E components
exceeded 50% and with a significant effect (p-value < 0.05) of at least one
component were selected for the ternary plot representation (Figure 1B).\
eQTL mapping
For eQTL mapping, we used the 1059 bin based markers derived from the eQTL
data as described in (Serin et al. 2017). The eQTL analysis was performed on
the combined environments to identify genetic (G) main effect eQTLs. eQTL
mapping was also done for the separate environments corresponding to
approximately 40 RILs each. The QTL mapping was conducted in R using a
single marker analysis. The permutation LOD score at 0.05 FDR (LOD = 4.1) was
set as the significance threshold for the eQTL significance for all datasets. The
eQTL data were stored in AraQTL to facilitate the exploration of the eQTL data
(Nijveen et al. 2017),http://www.bioinformatics.nl/AraQTL/).
108
G and E effects on gene expression |
Definition of local and distant eQTL peaks
For each gene with at least one significant eQTL, peak detection was
performed. The position and marker associated with the highest LOD scores
were considered as the peak location for the eQTL. The physical position of the
genes were obtained from the TAIR10 database (Lamesch et al. 2012) and
compared to the peak location of the eQTLs. A 1Mb cut-off distance was set
between the eQTL peak and the physical position of the gene to distinguish
between local versus distant eQTLs. eQTLs within this cut-off distance were
classified as ‘local’ (cis-eQTLs) while eQTLs outside this range were considered
as ‘distant’ (trans-eQTLs). We noted that the peak detection procedure we
used sometimes resulted in several local eQTLs per genes. This might be due to
the detection of two close peaks, which might also be a single QTL. We
concede that this might lead to a slight over-estimation of the reported
number of both local and distant eQTLs.
GO enrichment analysis
Gene ontology enrichment analysis was performed using the BiNGO plugin
(Maere et al. 2005) in Cytoscape (Shannon et al. 2003). Using the Arabidopsis
Genemodel TAIR10 as a reference (Lamesch et al. 2012), hypergeometric
testing was performed with a Benjamini & Hochberg False Discovery Rate (FDR)
correction at a significance level of 0.01.
Results and discussion
To investigate the effect of the seed maternal environment on the seed
transcriptome, an Arabidopsis Bay-0 x Sha RIL population was grown under
different environments. Gene expression data were obtained using RNA-seq for
fresh dry seeds of the parental lines and 160 RILs grown under the different
environments in a generalized genetical genomics design (Li et al. 2008b; Serin
et al. 2017)(Supplemental Table 1). The RIL set up used for the transcriptomics
was the same as previously used for the metabolomics analysis (Chapter 4).
The main goal of the analysis was to identify genes that change expression in
response to seed maternal environments in the parental lines and to map
changes in the eQTL landscape across environments and ultimately connect
these to differences in seed performance.
109
| Chapter 5
Gene expression variation
Gene expression was quantified in the RILs grown under the different
environments to explore changes in gene expression in response to genetic and
environmental perturbations. Overall 35.386 transcripts were identified,
representing 27.416 unique gene models.
In order to get more insights into stress specific responses, we examined the
genes differentially expressed between the seeds from the parental lines
grown under each environment and within each accession between the
different environments (Supplemental Table 2). A large number of transcripts
was found differentially expressed (FDR< 0.05) in Bay-0 in response to stress as
compared to control conditions. The largest number of differentially expressed
genes (DEGs) was observed in response to high temperature (HT) (4402) and
the lowest for low phosphate (LP) (144). Only a few genes were differentially
expressed in Sha in response to stress, ranging from 18 to 10 for the different
environments. Large differences in terms of DEGs were observed between the
seeds of the parental lines grown under the different conditions ranging from
5443 (LP) to 7799 (HT), showing that the genetic background has a huge effect
on transcript levels. Similar numbers of genes were found up and down
regulated for each condition.
To better understand the effect of the genetic background and transcriptional
response to environmental variation an ANOVA was performed for each
transcript measured in the parental lines. Transcripts with more than 90% of
missing data were removed prior the analysis, resulting in 25971 filtered
transcripts. Overall a large number of transcripts (13,861/25,971 ≈ 50%) was
significantly (p< 0.05) affected by the environment (Figure 1 A). As expected, a
large fraction of the transcripts showing both G and E effects did also show G x
E effects (≈ 58%). The strong effect of the environment was supported by the
overall large proportion of gene expression variance influenced by the
environment (50%) (Figure 1 B).
110
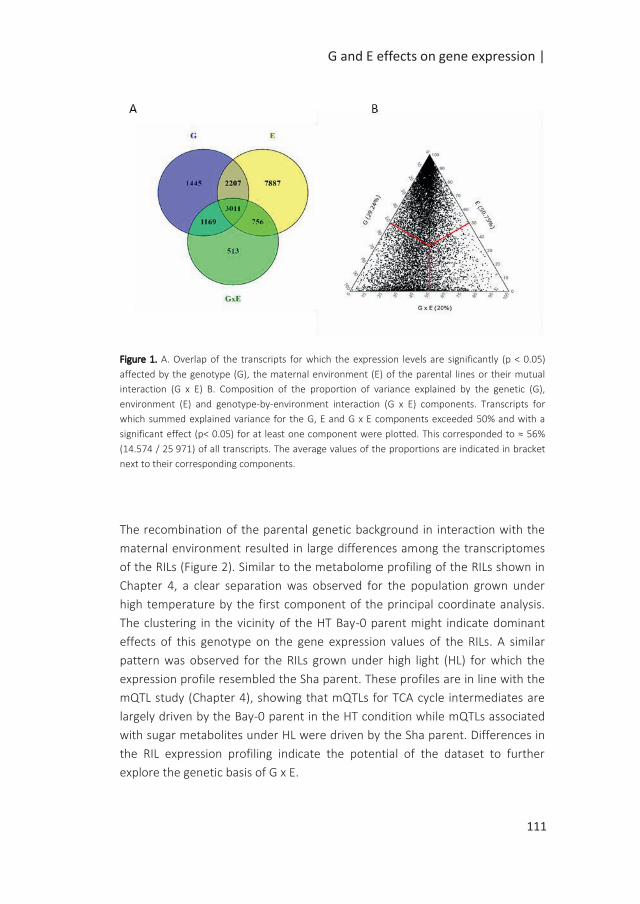
G and E effects on gene expression |
Figure 1. A. Overlap of the transcripts for which the expression levels are significantly (p < 0.05)
affected by the genotype (G), the maternal environment (E) of the parental lines or their mutual
interaction (G x E) B. Composition of the proportion of variance explained by the genetic (G),
environment (E) and genotype-by-environment interaction (G x E) components. Transcripts for
which summed explained variance for the G, E and G x E components exceeded 50% and with a
significant effect (p< 0.05) for at least one component were plotted. This corresponded to ≈ 56%
(14.574 / 25 971) of all transcripts. The average values of the proportions are indicated in bracket
next to their corresponding components.
The recombination of the parental genetic background in interaction with the
maternal environment resulted in large differences among the transcriptomes
of the RILs (Figure 2). Similar to the metabolome profiling of the RILs shown in
Chapter 4, a clear separation was observed for the population grown under
high temperature by the first component of the principal coordinate analysis.
The clustering in the vicinity of the HT Bay-0 parent might indicate dominant
effects of this genotype on the gene expression values of the RILs. A similar
pattern was observed for the RILs grown under high light (HL) for which the
expression profile resembled the Sha parent. These profiles are in line with the
mQTL study (Chapter 4), showing that mQTLs for TCA cycle intermediates are
largely driven by the Bay-0 parent in the HT condition while mQTLs associated
with sugar metabolites under HL were driven by the Sha parent. Differences in
the RIL expression profiling indicate the potential of the dataset to further
explore the genetic basis of G x E.
111
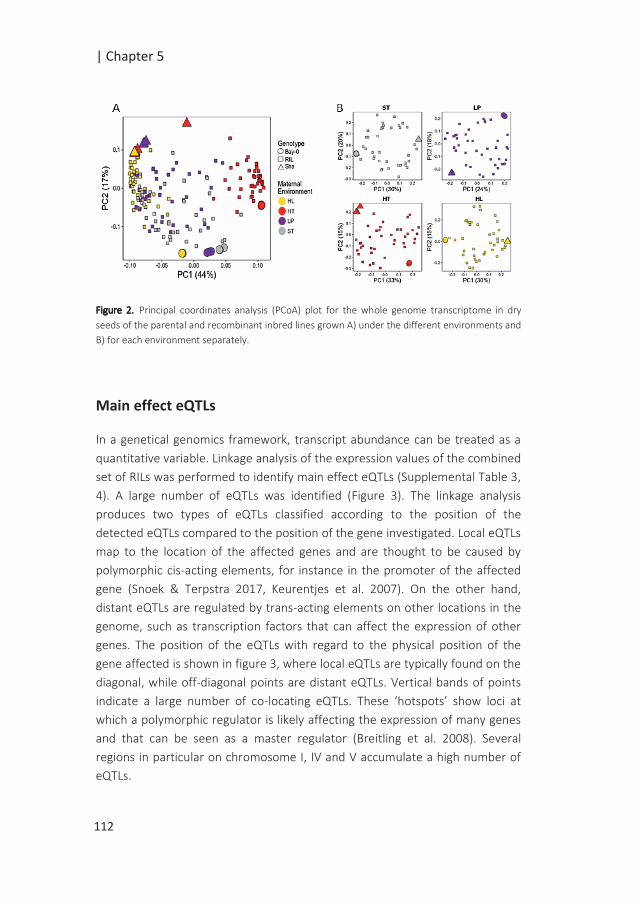
| Chapter 5
Figure 2. Principal coordinates analysis (PCoA) plot for the whole genome transcriptome in dry
seeds of the parental and recombinant inbred lines grown A) under the different environments and
B) for each environment separately.
Main effect eQTLs
In a genetical genomics framework, transcript abundance can be treated as a
quantitative variable. Linkage analysis of the expression values of the combined
set of RILs was performed to identify main effect eQTLs (Supplemental Table 3,
4). A large number of eQTLs was identified (Figure 3). The linkage analysis
produces two types of eQTLs classified according to the position of the
detected eQTLs compared to the position of the gene investigated. Local eQTLs
map to the location of the affected genes and are thought to be caused by
polymorphic cis-acting elements, for instance in the promoter of the affected
gene (Snoek & Terpstra 2017, Keurentjes et al. 2007). On the other hand,
distant eQTLs are regulated by trans-acting elements on other locations in the
genome, such as transcription factors that can affect the expression of other
genes. The position of the eQTLs with regard to the physical position of the
gene affected is shown in figure 3, where local eQTLs are typically found on the
diagonal, while off-diagonal points are distant eQTLs. Vertical bands of points
indicate a large number of co-locating eQTLs. These ‘hotspots’ show loci at
which a polymorphic regulator is likely affecting the expression of many genes
and that can be seen as a master regulator (Breitling et al. 2008). Several
regions in particular on chromosome I, IV and V accumulate a high number of
eQTLs.
A B
112
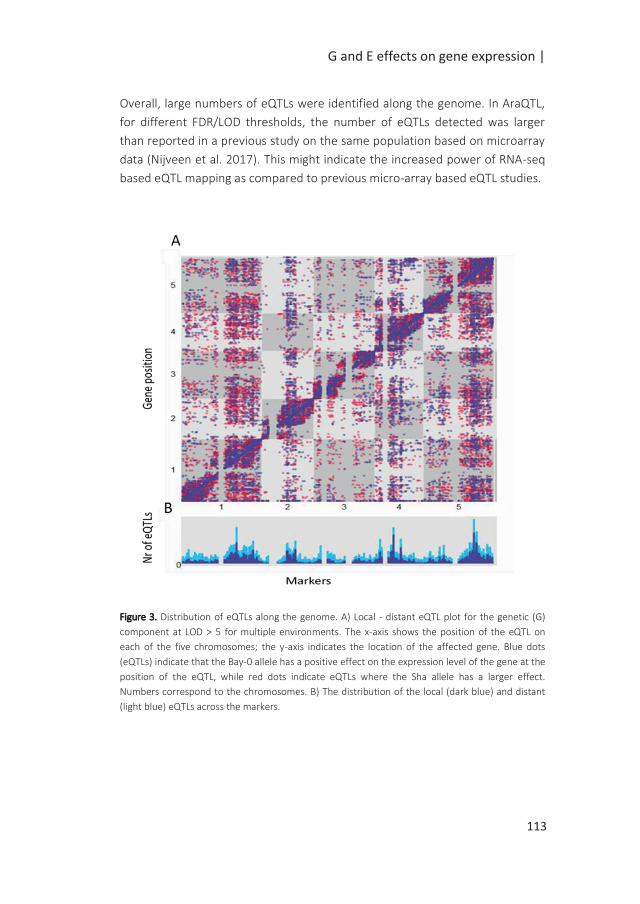
G and E effects on gene expression |
Overall, large numbers of eQTLs were identified along the genome. In AraQTL,
for different FDR/LOD thresholds, the number of eQTLs detected was larger
than reported in a previous study on the same population based on microarray
data (Nijveen et al. 2017). This might indicate the increased power of RNA-seq
based eQTL mapping as compared to previous micro-array based eQTL studies.
Figure 3. Distribution of eQTLs along the genome. A) Local - distant eQTL plot for the genetic (G)
component at LOD > 5 for multiple environments. The x-axis shows the position of the eQTL on
each of the five chromosomes; the y-axis indicates the location of the affected gene. Blue dots
(eQTLs) indicate that the Bay-0 allele has a positive effect on the expression level of the gene at the
position of the eQTL, while red dots indicate eQTLs where the Sha allele has a larger effect.
Numbers correspond to the chromosomes. B) The distribution of the local (dark blue) and distant
(light blue) eQTLs across the markers.
113
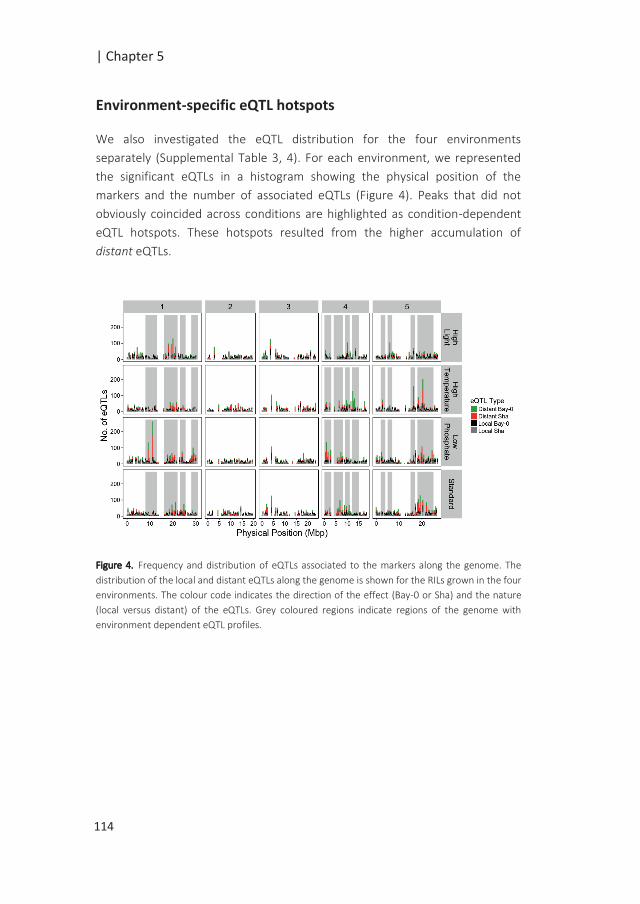
| Chapter 5
Environment-specific eQTL hotspots
We also investigated the eQTL distribution for the four environments
separately (Supplemental Table 3, 4). For each environment, we represented
the significant eQTLs in a histogram showing the physical position of the
markers and the number of associated eQTLs (Figure 4). Peaks that did not
obviously coincided across conditions are highlighted as condition-dependent
eQTL hotspots. These hotspots resulted from the higher accumulation of
distant eQTLs.
Figure 4. Frequency and distribution of eQTLs associated to the markers along the genome. The
distribution of the local and distant eQTLs along the genome is shown for the RILs grown in the four
environments. The colour code indicates the direction of the effect (Bay-0 or Sha) and the nature
(local versus distant) of the eQTLs. Grey coloured regions indicate regions of the genome with
environment dependent eQTL profiles.
114
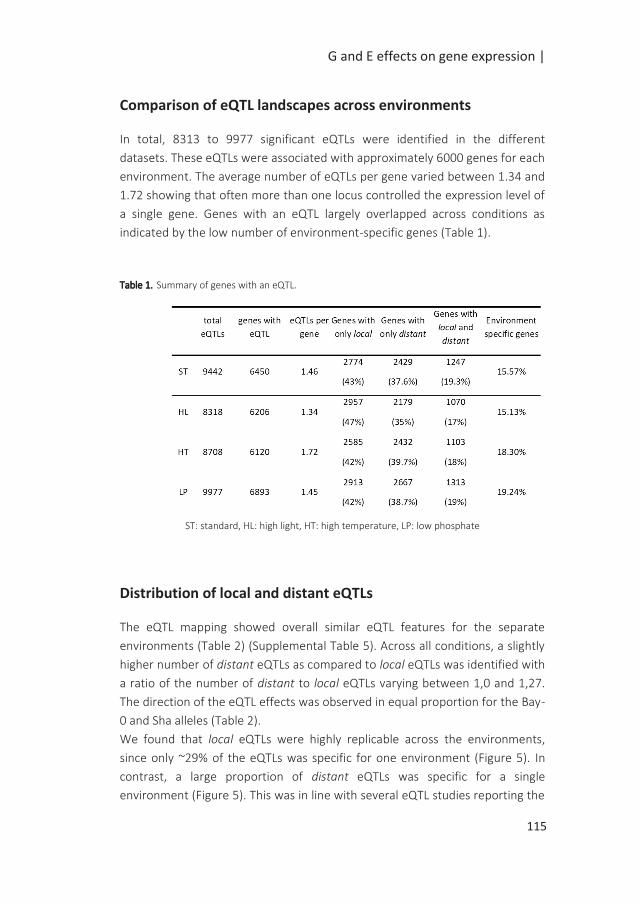
G and E effects on gene expression |
Comparison of eQTL landscapes across environments
In total, 8313 to 9977 significant eQTLs were identified in the different
datasets. These eQTLs were associated with approximately 6000 genes for each
environment. The average number of eQTLs per gene varied between 1.34 and
1.72 showing that often more than one locus controlled the expression level of
a single gene. Genes with an eQTL largely overlapped across conditions as
indicated by the low number of environment-specific genes (Table 1).
Table 1. Summary of genes with an eQTL.
ST: standard, HL: high light, HT: high temperature, LP: low phosphate
Distribution of local and distant eQTLs
The eQTL mapping showed overall similar eQTL features for the separate
environments (Table 2) (Supplemental Table 5). Across all conditions, a slightly
higher number of distant eQTLs as compared to local eQTLs was identified with
a ratio of the number of distant to local eQTLs varying between 1,0 and 1,27.
The direction of the eQTL effects was observed in equal proportion for the Bay-
0 and Sha alleles (Table 2).
We found that local eQTLs were highly replicable across the environments,
since only ~29% of the eQTLs was specific for one environment (Figure 5). In
contrast, a large proportion of distant eQTLs was specific for a single
environment (Figure 5). This was in line with several eQTL studies reporting the
115
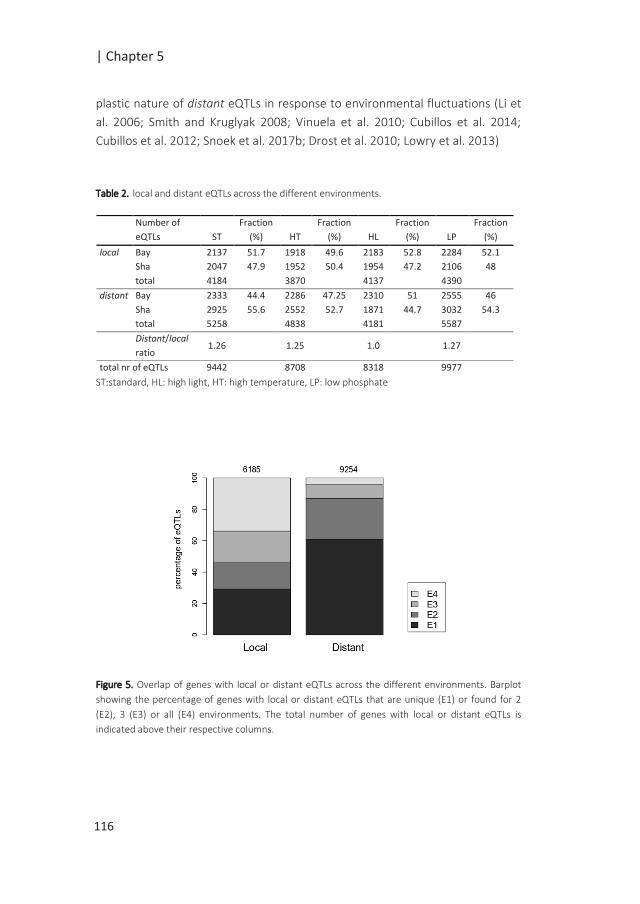
| Chapter 5
plastic nature of distant eQTLs in response to environmental fluctuations (Li et
al. 2006; Smith and Kruglyak 2008; Vinuela et al. 2010; Cubillos et al. 2014;
Cubillos et al. 2012; Snoek et al. 2017b; Drost et al. 2010; Lowry et al. 2013)
Table 2. local and distant eQTLs across the different environments.
ST:standard, HL: high light, HT: high temperature, LP: low phosphate
Figure 5. Overlap of genes with local or distant eQTLs across the different environments. Barplot
showing the percentage of genes with local or distant eQTLs that are unique (E1) or found for 2
(E2), 3 (E3) or all (E4) environments. The total number of genes with local or distant eQTLs is
indicated above their respective columns.
Number of
eQTLs ST
Fraction
(%) HT
Fraction
(%) HL
Fraction
(%) LP
Fraction
(%)
local Bay 2137 51.7 1918 49.6 2183 52.8 2284 52.1
Sha 2047 47.9 1952 50.4 1954 47.2 2106 48
total 4184 3870 4137 4390
distant Bay 2333 44.4 2286 47.25 2310 51 2555 46
Sha 2925 55.6 2552 52.7 1871 44.7 3032 54.3
total 5258 4838 4181 5587
Distant/local
ratio 1.26 1.25 1.0 1.27
total nr of eQTLs 9442 8708 8318 9977
116
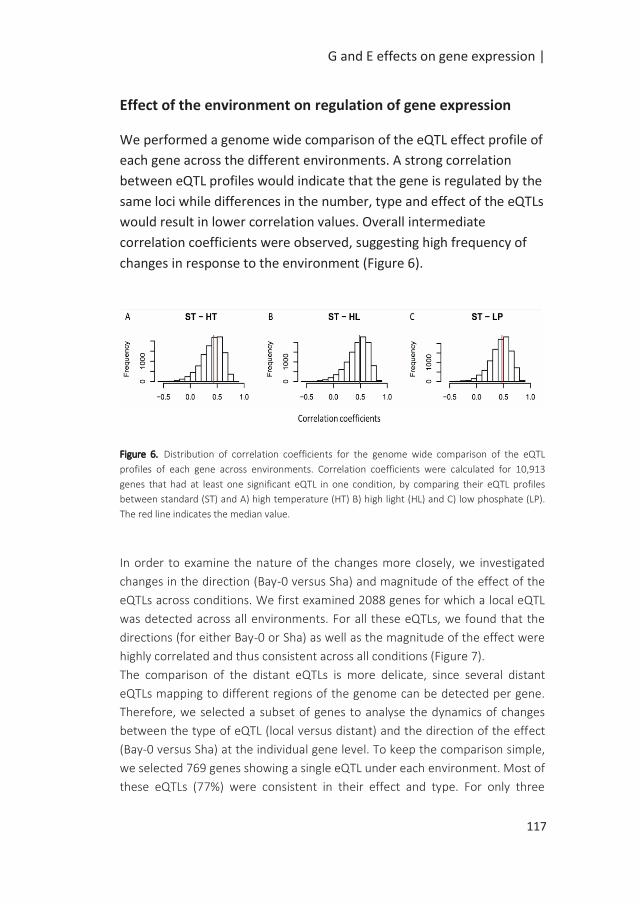
G and E effects on gene expression |
Effect of the environment on regulation of gene expression
We performed a genome wide comparison of the eQTL effect profile of
each gene across the different environments. A strong correlation
between eQTL profiles would indicate that the gene is regulated by the
same loci while differences in the number, type and effect of the eQTLs
would result in lower correlation values. Overall intermediate
correlation coefficients were observed, suggesting high frequency of
changes in response to the environment (Figure 6).
Figure 6. Distribution of correlation coefficients for the genome wide comparison of the eQTL
profiles of each gene across environments. Correlation coefficients were calculated for 10,913
genes that had at least one significant eQTL in one condition, by comparing their eQTL profiles
between standard (ST) and A) high temperature (HT) B) high light (HL) and C) low phosphate (LP).
The red line indicates the median value.
In order to examine the nature of the changes more closely, we investigated
changes in the direction (Bay-0 versus Sha) and magnitude of the effect of the
eQTLs across conditions. We first examined 2088 genes for which a local eQTL
was detected across all environments. For all these eQTLs, we found that the
directions (for either Bay-0 or Sha) as well as the magnitude of the effect were
highly correlated and thus consistent across all conditions (Figure 7).
The comparison of the distant eQTLs is more delicate, since several distant
eQTLs mapping to different regions of the genome can be detected per gene.
Therefore, we selected a subset of genes to analyse the dynamics of changes
between the type of eQTL (local versus distant) and the direction of the effect
(Bay-0 versus Sha) at the individual gene level. To keep the comparison simple,
we selected 769 genes showing a single eQTL under each environment. Most of
these eQTLs (77%) were consistent in their effect and type. For only three
117
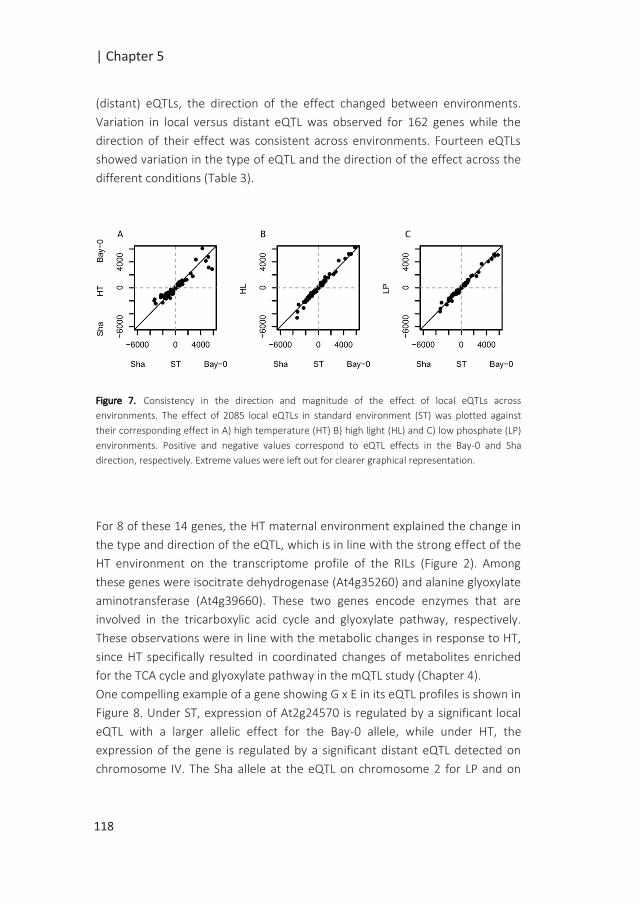
| Chapter 5
(distant) eQTLs, the direction of the effect changed between environments.
Variation in local versus distant eQTL was observed for 162 genes while the
direction of their effect was consistent across environments. Fourteen eQTLs
showed variation in the type of eQTL and the direction of the effect across the
different conditions (Table 3).
Figure 7. Consistency in the direction and magnitude of the effect of local eQTLs across
environments. The effect of 2085 local eQTLs in standard environment (ST) was plotted against
their corresponding effect in A) high temperature (HT) B) high light (HL) and C) low phosphate (LP)
environments. Positive and negative values correspond to eQTL effects in the Bay-0 and Sha
direction, respectively. Extreme values were left out for clearer graphical representation.
For 8 of these 14 genes, the HT maternal environment explained the change in
the type and direction of the eQTL, which is in line with the strong effect of the
HT environment on the transcriptome profile of the RILs (Figure 2). Among
these genes were isocitrate dehydrogenase (At4g35260) and alanine glyoxylate
aminotransferase (At4g39660). These two genes encode enzymes that are
involved in the tricarboxylic acid cycle and glyoxylate pathway, respectively.
These observations were in line with the metabolic changes in response to HT,
since HT specifically resulted in coordinated changes of metabolites enriched
for the TCA cycle and glyoxylate pathway in the mQTL study (Chapter 4).
One compelling example of a gene showing G x E in its eQTL profiles is shown in
Figure 8. Under ST, expression of At2g24570 is regulated by a significant local
eQTL with a larger allelic effect for the Bay-0 allele, while under HT, the
expression of the gene is regulated by a significant distant eQTL detected on
chromosome IV. The Sha allele at the eQTL on chromosome 2 for LP and on
118
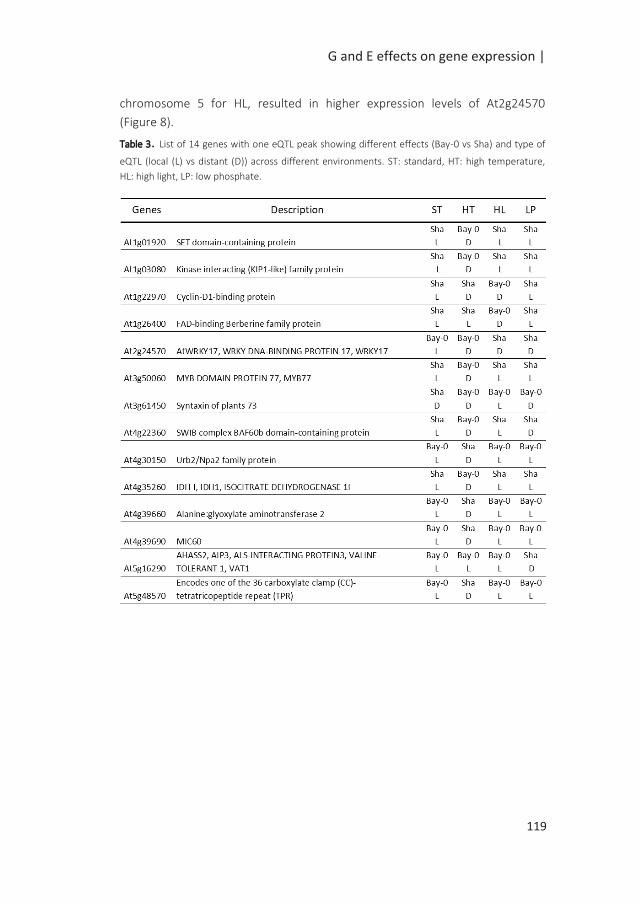
G and E effects on gene expression |
chromosome 5 for HL, resulted in higher expression levels of At2g24570
(Figure 8).
Table 3. List of 14 genes with one eQTL peak showing different effects (Bay-0 vs Sha) and type of
eQTL (local (L) vs distant (D)) across different environments. ST: standard, HT: high temperature,
HL: high light, LP: low phosphate.
119
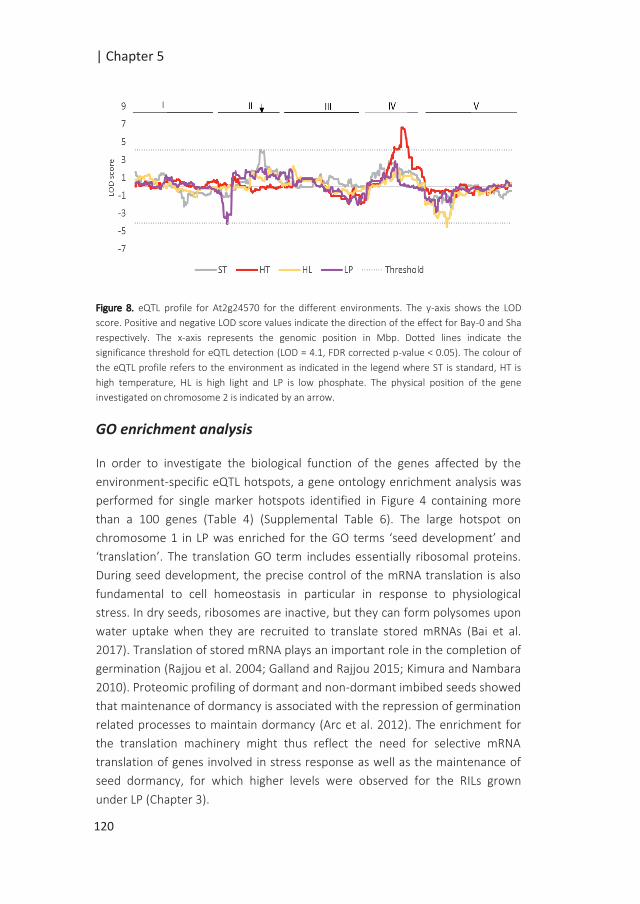
| Chapter 5
Figure 8. eQTL profile for At2g24570 for the different environments. The y-axis shows the LOD
score. Positive and negative LOD score values indicate the direction of the effect for Bay-0 and Sha
respectively. The x-axis represents the genomic position in Mbp. Dotted lines indicate the
significance threshold for eQTL detection (LOD = 4.1, FDR corrected p-value < 0.05). The colour of
the eQTL profile refers to the environment as indicated in the legend where ST is standard, HT is
high temperature, HL is high light and LP is low phosphate. The physical position of the gene
investigated on chromosome 2 is indicated by an arrow.
GO enrichment analysis
In order to investigate the biological function of the genes affected by the
environment-specific eQTL hotspots, a gene ontology enrichment analysis was
performed for single marker hotspots identified in Figure 4 containing more
than a 100 genes (Table 4) (Supplemental Table 6). The large hotspot on
chromosome 1 in LP was enriched for the GO terms ‘seed development’ and
‘translation’. The translation GO term includes essentially ribosomal proteins.
During seed development, the precise control of the mRNA translation is also
fundamental to cell homeostasis in particular in response to physiological
stress. In dry seeds, ribosomes are inactive, but they can form polysomes upon
water uptake when they are recruited to translate stored mRNAs (Bai et al.
2017). Translation of stored mRNA plays an important role in the completion of
germination (Rajjou et al. 2004; Galland and Rajjou 2015; Kimura and Nambara
2010). Proteomic profiling of dormant and non-dormant imbibed seeds showed
that maintenance of dormancy is associated with the repression of germination
related processes to maintain dormancy (Arc et al. 2012). The enrichment for
the translation machinery might thus reflect the need for selective mRNA
translation of genes involved in stress response as well as the maintenance of
seed dormancy, for which higher levels were observed for the RILs grown
under LP (Chapter 3).
120
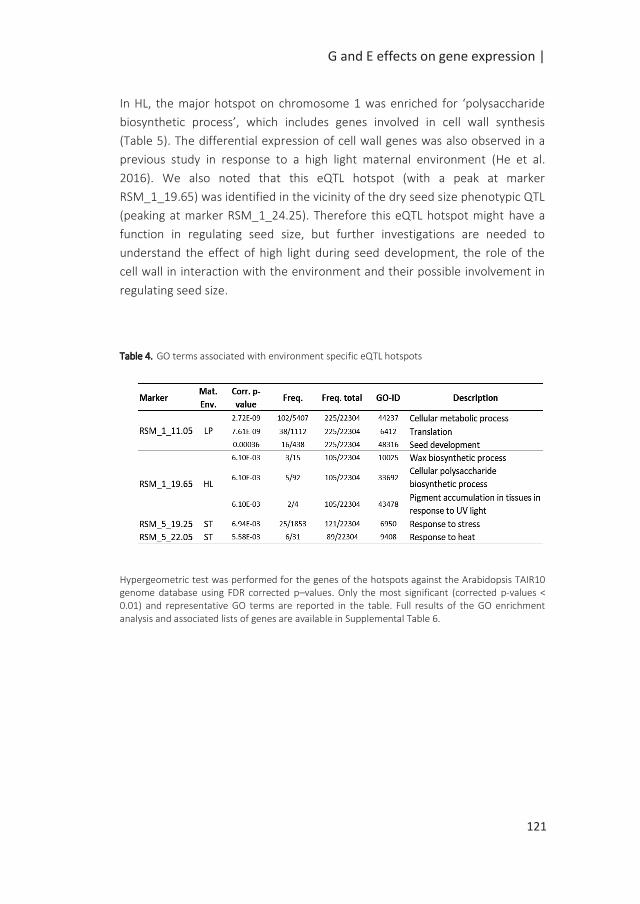
G and E effects on gene expression |
In HL, the major hotspot on chromosome 1 was enriched for ‘polysaccharide
biosynthetic process’, which includes genes involved in cell wall synthesis
(Table 5). The differential expression of cell wall genes was also observed in a
previous study in response to a high light maternal environment (He et al.
2016). We also noted that this eQTL hotspot (with a peak at marker
RSM_1_19.65) was identified in the vicinity of the dry seed size phenotypic QTL
(peaking at marker RSM_1_24.25). Therefore this eQTL hotspot might have a
function in regulating seed size, but further investigations are needed to
understand the effect of high light during seed development, the role of the
cell wall in interaction with the environment and their possible involvement in
regulating seed size.
Table 4. GO terms associated with environment specific eQTL hotspots
Hypergeometric test was performed for the genes of the hotspots against the Arabidopsis TAIR10 genome database using FDR corrected p–values. Only the most significant (corrected p-values < 0.01) and representative GO terms are reported in the table. Full results of the GO enrichment analysis and associated lists of genes are available in Supplemental Table 6.
121

| Chapter 5
Table 5. Description of the genes associated with the ‘Cellular polysaccharide biosynthetic process’
GO term for the HL specific eQTL hotspot on chromosome 1.
a Bay-0 and Sha indicate the direction of the eQTL effect (higher expression value at the
position of the eQTL for the Bay-0 or Sha parental allele). Distant and local refer to the type of
eQTL identified under HL for the corresponding gene.
122
G and E effects on gene expression |
Conclusion and future prospects
In this study, we investigated changes in the genetic control of gene expression
measured in dry seeds of an Arabidopsis thaliana Bay-0 x Sha RIL population
grown in different maternal environments. A high number of genes were found
differentially expressed between the parental lines and in response to the
different environments. This led us to investigate changes in the genetic
architecture of gene expression.
Large numbers of eQTLs were identified for each environment. Interestingly,
genes with eQTLs largely overlapped across conditions, indicating that the
environment essentially changes the regulation of a defined set of genes rather
than triggering the expression of new genes (Table 1). This was also observed
for other organisms such as C.elegans (Snoek et al. 2017a). A slightly higher
number of distant eQTLs over local eQTLs were identified in all environments.
Furthermore, consistent with other studies, we found that local eQTLs were
consistent across environments, while distant eQTLs showed a high degree of
environment specificity which is likely due to their versatile nature (Snoek et al.
2017a; Cubillos et al. 2014).
These variable distant eQTLs led to the identification of several environment-
specific eQTL hotspots which we found enriched for specific biological
processes. For a high light specific hotspot, we found a subset of genes
enriched for cell wall synthesis. Although the role of these genes in mediating
high light cues in seeds remains to be investigated, this example shows that
without prior knowledge on the trait investigated, eQTL studies can be used to
enhance gene discovery for complex traits.
In this study, the threshold applied for eQTL significance (FDR < 0.05, LOD =
4.1) resulted in eQTL hotspots of around a hundred co-locating eQTLs. To
further investigate these hotspots, one might consider relaxing this threshold
to increase the number of genes (Keurentjes et al. 2007b) or to expand this
number of genes by including genes with eQTLs peaking at neighbouring
marker bins. Such approach could lead to the identification of master
regulators within eQTL hotspots (Wu et al. 2008). For this purpose, gene co-
expression networks can be used to prioritize candidate genes as it was shown
in several studies (van Muijen et al. 2016; Basnet et al. 2016; Drost et al. 2010)
and partly reviewed in Chapter 6.
123
| Chapter 5
These data complement previous phenotypic (Chapter 3) and metabolic
(Chapter 4) datasets derived from the same plant material using the same GGG
set-up. Similar effects of the maternal environment, in particular for HT, on the
metabolome and transcriptome (Chapter 4 and Figure 2, Table 3) indicated that
these eQTL data are a valuable source for further investigations in a systems
genetics approach, to the extent to which transcriptomic changes can explain
metabolic and ultimately phenotypic differences.
List of supplemental data
Supporting information can be downloaded from:
http://www.wageningenseedlab.nl/thesis/earserin/SI/chapter5
Supplemental Table 1: Gene expression data for the parental and recombinant
inbred lines in a generalized genetical genomics set-up
Supplemental Table 2: Lists of differentially expressed genes in the parental
lines
Supplemental Table 3: eQTL LOD scores for the separate and combined
environments
Supplemental Table 4: eQTL effects for the separate and combined
environments
Supplemental Table 5: Summary of all local and distant eQTLs
Supplemental Table 6: GO enrichment for the environment specific eQTL
hotspots (> 100 genes)
124

Chapter 6
Learning from co-expression networks:
possibilities and challenges
Elise A. R. Serin, Harm Nijveen, Henk W. M. Hilhorst and Wilco Ligterink
Published in Frontiers in Plant Science
2016, Apr 8;7:444. doi: 10.3389/fpls.2016.00444.
| Chapter 6
Abstract
Plants are fascinating and complex organisms. A comprehensive understanding
of the organization, function and evolution of plant genes is essential to
disentangle important biological processes and to advance crop engineering
and breeding strategies. The ultimate aim in deciphering complex biological
processes is the discovery of causal genes and regulatory mechanisms
controlling these processes. The recent surge of omics data has opened the
door to a system-wide understanding of the flow of biological information
underlying complex traits. However, dealing with the corresponding large data
sets represents a challenging endeavor that calls for the development of
powerful bioinformatics methods. A popular approach is the construction and
analysis of gene networks. Such networks are often used for genome-wide
representation of the complex functional organization of biological systems.
Network based on similarity in gene expression are called (gene) co-expression
networks. One of the major applications of gene co-expression networks is the
functional annotation of unknown genes. Constructing co-expression networks
is generally straightforward. In contrast, the resulting network of connected
genes can become very complex, which limits its biological interpretation.
Several strategies can be employed to enhance the interpretation of the
networks. A strategy in coherence with the biological question addressed
needs to be established to infer reliable networks. Additional benefits can be
gained from network-based strategies using prior knowledge and data
integration to further enhance the elucidation of gene regulatory relationships.
As a result, biological networks provide many more applications beyond the
simple visualization of co-expressed genes. In this study we review the different
approaches for co-expression network inference in plants. We analyse
integrative genomics strategies used in recent studies that successfully
identified candidate genes taking advantage of gene co-expression networks.
Additionally, we discuss promising bioinformatics approaches that predict
networks for specific purposes.
Keywords: co-expression, gene expression, gene networks, gene prioritization,
transcriptomics
126
Learning from co-expression networks|
Introduction
In plants, the age of systems biology has accelerated the investigation of
complex molecular mechanisms underlying intricate developmental and
physiological processes. Since plants are anchored to their environment, they
cannot escape from stresses by simply moving away. Instead, plants have
developed a wide range of mechanisms to cope with environmental
fluctuations. This plasticity generally involves changes at the level of DNA, RNA,
protein and metabolites, resulting in complex phenotypes governed by multiple
genes. Advanced genetic and molecular tools have led to tremendous progress
in revealing the genetic architecture but also the regulatory mechanisms of
complex traits (Mochida and Shinozaki 2011). The development of molecular
profiling techniques nowadays enables the high-throughput and affordable
acquisition of large omics data sets, such as for transcriptomics, proteomics
and metabolomics.
While substantial efforts are being made to generate large omics data sets,
there is a growing need to develop platforms to integrate these data and derive
models describing biological interactions in plants. In this context, networks
have rapidly become an attractive approach to manage, display and
contextualize these large data sets in order to obtain a system level and
molecular understanding of biological key processes (Costa et al. 2015)(Silva et
al. 2016; Barabasi and Oltvai 2004; Usadel et al. 2009).
Biological networks are generally classified by the nature of the compounds
and interactions involved. These networks can be derived from various
molecular data resulting in, e.g., gene expression networks (correlation or co-
expression networks), protein-protein interaction (PPI) networks, metabolic
networks and signaling networks. Graphically, networks are represented as an
ensemble of components (nodes or vertices) and interactions depicted by links
(edges) connecting pairs of nodes. Such interaction maps provide an attractive
framework to study the organizational structure of complex systems and have
found many applications in plants (Jiménez-Gómez 2014).
The fast development of transcriptomic technologies, as compared to other
analytical platforms, has supported a range of studies on genetic and
environmental perturbations at the transcriptome level in many organisms. Co-
expression networks have grown in popularity in the last years as they enable
the integration of large transcriptional data sets (Li et al. 2015)(Liseron-Monfils
127
| Chapter 6
and Ware 2015). Co-expression network analysis allows the simultaneous
identification, clustering and exploration of thousands of genes with similar
expression patterns across multiple conditions (co-expressed genes). The main
procedure for co-expression network inference is explained in Box 1 and
illustrated in Figure 1. Briefly, a similarity score (i.e., correlation coefficient) is
calculated from the pairwise comparison of the gene expression patterns for
each possible pair of genes. Above a certain threshold, genes and gene pairs
form a list of nodes and corresponding edges from which the network is
constructed. As a rule, the guilt-by-association principle is applied stating that
genes sharing the same function or that are involved in the same regulatory
pathway will tend to present similar expression profiles and hence form
clusters or modules in the network (Wolfe et al. 2005). Thus, within the same
module, genes of known function can be used to predict the function of co-
expressed unknown genes (Rhee and Mutwil 2014).
128
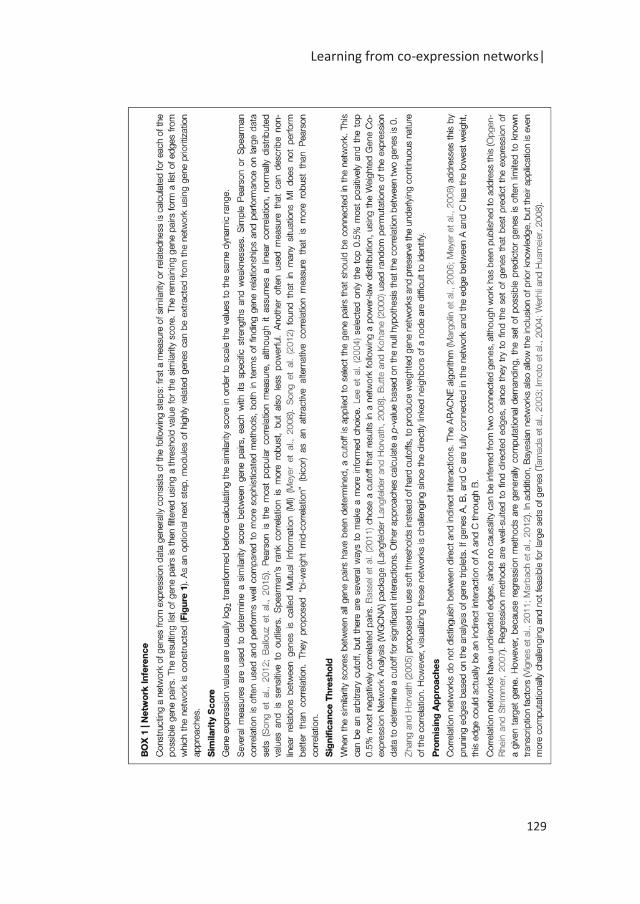
Learning from co-expression networks|
129

| Chapter 6
The two main applications for co-expression network analysis are to find novel
genes involved in the biological process under investigation and to suggest the
biological process a gene is involved in. Intuitively, reliable networks are
needed to infer meaningful gene function predictions. Such networks heavily
depend on a combination of decisions taken throughout the network inference
process. From the quality, type and availability of the input data, the
correlation coefficient and inference algorithm used, to the prior knowledge,
the experimental and computational resources, any negligence can result in
unreliable networks and subsequent misleading biological interpretations.
Caveats and opportunities of co-expression network analyses have been
discussed previously (Usadel et al. 2009). When handling large data sets, co-
expression networks can become very complex which limits their biological
interpretation (Usadel et al. 2009). In addition, in contrast to regulatory
networks, and because of their static representation, co-expression networks
do not provide per se information on the nature of the regulatory relationship
of connected genes (Stuart et al. 2003). Careful application of network analysis
tools and strategies is thus important to maximize the information extraction,
to disentangle reliable network connections and to infer true biological
meaning.
130
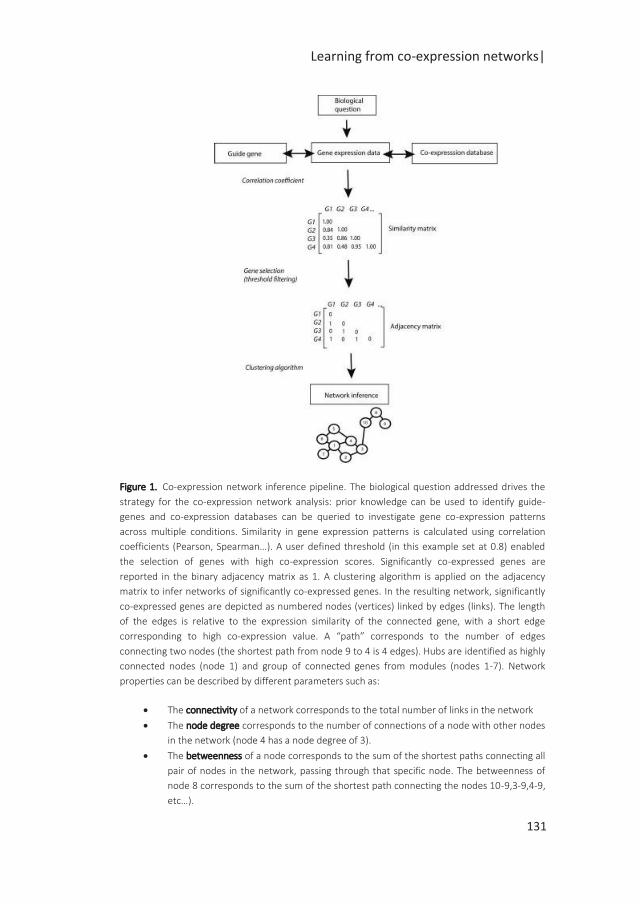
Learning from co-expression networks|
Figure 1. Co-expression network inference pipeline. The biological question addressed drives the
strategy for the co-expression network analysis: prior knowledge can be used to identify guide-
genes and co-expression databases can be queried to investigate gene co-expression patterns
across multiple conditions. Similarity in gene expression patterns is calculated using correlation
coefficients (Pearson, Spearman…). A user defined threshold (in this example set at 0.8) enabled
the selection of genes with high co-expression scores. Significantly co-expressed genes are
reported in the binary adjacency matrix as 1. A clustering algorithm is applied on the adjacency
matrix to infer networks of significantly co-expressed genes. In the resulting network, significantly
co-expressed genes are depicted as numbered nodes (vertices) linked by edges (links). The length
of the edges is relative to the expression similarity of the connected gene, with a short edge
corresponding to high co-expression value. A “path” corresponds to the number of edges
connecting two nodes (the shortest path from node 9 to 4 is 4 edges). Hubs are identified as highly
connected nodes (node 1) and group of connected genes from modules (nodes 1-7). Network
properties can be described by different parameters such as:
The connectivity of a network corresponds to the total number of links in the network
The node degree corresponds to the number of connections of a node with other nodes
in the network (node 4 has a node degree of 3).
The betweenness of a node corresponds to the sum of the shortest paths connecting all
pair of nodes in the network, passing through that specific node. The betweenness of
node 8 corresponds to the sum of the shortest path connecting the nodes 10-9,3-9,4-9,
etc…).
131
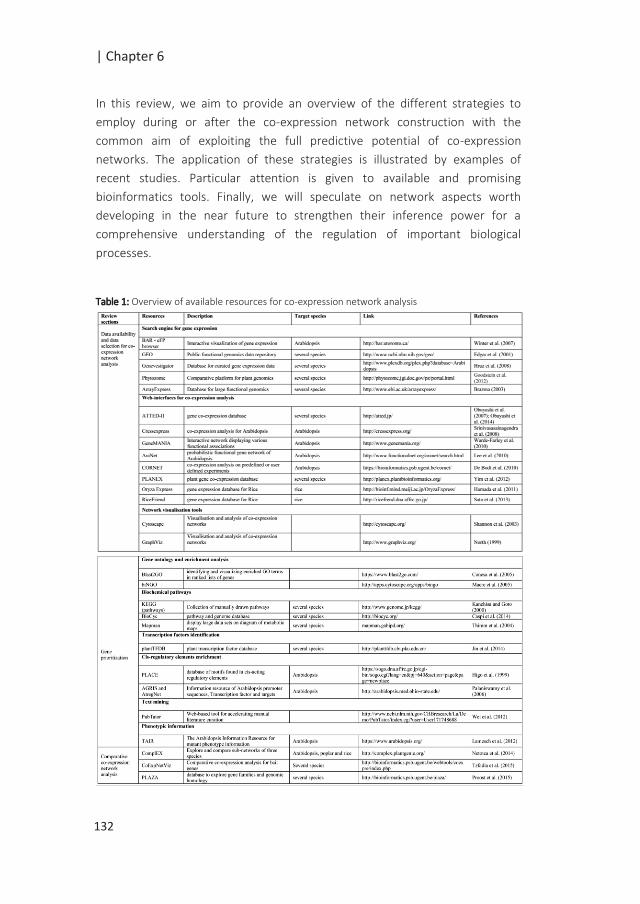
| Chapter 6
In this review, we aim to provide an overview of the different strategies to
employ during or after the co-expression network construction with the
common aim of exploiting the full predictive potential of co-expression
networks. The application of these strategies is illustrated by examples of
recent studies. Particular attention is given to available and promising
bioinformatics tools. Finally, we will speculate on network aspects worth
developing in the near future to strengthen their inference power for a
comprehensive understanding of the regulation of important biological
processes.
Table 1: Overview of available resources for co-expression network analysis
132
Learning from co-expression networks|
Data availability for co-expression network analyses
In the post-genomic era, the reduction of costs for large scale and high-
throughput measurement technologies, such as for transcriptomics, has to the
extensive collection of gene expression profiles capturing changes in gene
expression during development, between different treatments or tissues, etc.
DNA-microarrays are widely used to measure simultaneously the expression
level of a large number of genes in species with a genome sequence available.
In addition, the sequenced genomes of model plants (e.g., Arabidopsis,
medicago, and poplar) and economically important crops (e.g., tomato, potato,
tobacco, rice, and soybean) strongly improve our understanding of
transcriptional dynamics.
The compendia of generated data led to the development of publicly available
gene expression databases (Table 1). These databases still largely contain
microarray data and many of them are related to the model plant Arabidopsis.
In recent years, RNA-sequencing, using next- generation high-throughput
sequencing technologies (RNA-seq) has proven to be a powerful tool for whole
transcriptome profiling with enhanced sensitivity for the discovery of new
transcripts and enhanced specificity such as for the examination of allele-
specific expression. The power of these sequencing technologies has enabled
co-expression network analysis in species without a sequenced genome and, as
a result, has opened the way for new applications (see Section Comparative Co-
expression Network Analysis). RNA-seq based co-expression network
construction is still in its infancy (Iancu et al. 2012; Ballouz et al. 2015) but the
foreseen predominance of next generation sequencing tools in the coming
years will certainly enrich existing databases for the benefit of network studies.
Microarrays are still commonly used for transcriptome analysis because they
are relatively cheap and their analysis is highly standardized. Comprehensive
microarray gene expression sets are available in public repositories such as the
Gene Expression Omnibus (GEO, (Edgar et al. 2001), Genevestigator (Hruz et al.
2008) or Array Express (Parkinson 2004). Other tools, such as the online bio-
analytical resource for plant biology (BAR, (Winter et al. 2007), provide
interactive interfaces for the exploratory visualization of gene expression
variation.
Co-expression networks allow the simultaneous investigation of multiple gene
co-expression patterns across a wide range of conditions. As a result, publicly
available transcriptome data sets represent valuable resources for such
133
| Chapter 6
analysis. It has been reported that nearly one in four studies uses public data to
address a biological problem without generating new raw data. The reuse of
such data strengthens the need for reliable expression studies. A correct
experimental design, the proper execution of the wet lab experiments and
thorough annotation of the data are essential prerequisites for successful
subsequent reuse (Brazma 2003).
Several gene co-expression databases are available to help researchers in their
investigations (reviewed in (Brady and Provart 2009) and (Usadel et al. 2009)
(Table I)). These databases provide user-friendly interfaces to facilitate access
to the data and most of them also offer integrated data processing tools.
ATTED-II (Obayashi et al., 2007, 2014) allows condition specific searches for co-
expressed genes in several plant species. For Arabidopsis, CressExpress
(Srinivasasainagendra et al. 2008) in addition allows selection of data sets
based on a quality score to filter out “bad” microarrays. GeneMANIA (Warde-
Farley et al. 2010) uses a large set of functional data of various types (predicted
interactions, correlations, physical interactions and shared protein domains) to
display all predicted interactions for a query gene list in an interactive network.
The probabilistic functional gene network AraNet (Lee et al. 2015b) provides a
measure to assess the connectivity of the query genes used in regard to the
generated network. Additionally, AraNet integrates enrichment analysis tools
for network components for gene ontology terms and biochemical pathways
(Mapman, BioCyc and KEGG) (see section “Gene prioritization”). A popular
platform for network inference is Cytoscape (Shannon et al. 2003). This open
source program with its many plugins and apps allows the integration,
visualization and analyses of network data (Saito et al. 2012).
Data selection for co-expression network analyses
Publicly available gene expression databases can be queried using two main
approaches. These approaches are reported in the literature as “non-targeted”
(or “global”) and “targeted” (or “guided-gene”) approaches (Aoki et al. 2007).
The use of one or the other approach is largely determined by the biological
question addressed and the available knowledge.
The non-targeted approach provides a global overview of co-expression
patterns of multiple genes across many conditions. This approach is also
termed knowledge-independent or condition-independent, as no a priori
information is used to construct the network. As an example, Mao et al. (2009)
134
Learning from co-expression networks|
built an Arabidopsis gene co-expression network using gene expression data
from 1094 non-redundant Affymetrix ATH1 arrays from the AtGenExpress
consortium. This data set represented nine categories of experimental
conditions, such as environmental stresses, hormonal treatments and
developmental stages. The resulting network consisted of 6206 nodes and
512,936 edges. These “global” networks are generally used to describe the
overall set of connections predicted to occur between gene pairs. Separated
modules of functionally related genes can be identified and enable further
gene prioritization (see Section Gene Prioritization).
In these global networks, also designated as condition- independent, weak
interactions or interactions only occurring under specific conditions are easily
missed. This can be circumvented by specifically selecting data from
experiments that are relevant to the biological question addressed (Saito et al.
2008; Usadel et al. 2009). The resulting condition-dependent networks provide
insights on specific biological processes (Atias et al. 2009). Illustratively, by
selecting 138 samples from publicly available gene expression data sets
exclusively from mature imbibed Arabidopsis seeds, Bassel et al. (2011)
established a seed specific network. This SeedNet enabled the identification of
modules associated with seed traits such as germination and dormancy. Childs
et al. (2011) reported the improved predictive power for gene functional
annotation of such condition-dependent networks. One of the limits of this
approach is that the elucidation of system wide properties, such as intersecting
biological pathways and genes exhibiting pleiotropic effects, might be
overlooked.
An alternative approach allows to mimic condition-dependent data set
selection, while using the full potential of gene expression data sets. This
approach consists of pre-clustering the samples prior to network construction.
In this case, a clustering algorithm is directly applied to the normalized
expression matrix (genes × conditions) to partition the input samples into a
defined number of groups based on their overall expression similarity. Co-
expression networks are then built from each of the clusters obtained. Using
this technique, Feltus et al. (2013) have shown that such an unsupervised pre-
clustering approach improved capturing of co-expressed genes and the
representation of unique biological terms in the derived network modules.
When experimental data have elucidated key components of specific pathways,
a guide-gene approach can help to identify novel members of the same
135
| Chapter 6
pathway in a more targeted manner (Itkin et al. 2013). These known genes,
also called bait or seed genes, are used as input genes to build a seeded co-
expression network. For example, Yang et al. (2011) used this approach to
identify new candidate genes involved in cell-wall biosynthesis. They first
established a list of 121 genes known to be involved in cell-wall biosynthesis
and by querying available data sets with these seed genes, the initial list was
extended to 694 potential candidate genes.
Strategies combining guide-gene queries and condition-dependent approaches
may empower the predictive power of co-expression networks. For instance, Li
et al. (2009a) implemented a pipeline based on QUBIC, a QUalitative
BIClustering algorithm, to select the conditions under which seed genes of the
plant cell-wall biosynthesis pathway in Arabidopsis were found to be co-
expressed among a total set of 351 conditions. These conditions were then
used to generate networks of co-expressed gene modules.
Gene prioritization
Once a co-expression network is obtained, biological relevant information can
be mined by gene prioritization. This process consists of integrating diverse
data sources to allow the ranking of the nodes in the network and to identify
groups of functionally related genes, down to important putative regulatory
genes. A panel of databases and tools are available to facilitate the integration
of gene information in the network (Table 1).
In nature, a variety of biological networks have displayed evidence of scale-free
behaviour (Barabasi and Oltvai 2004; Albert 2005; Atias et al. 2009). Such
networks are characterized by a distribution of nodes following a power law
distribution. Graphically, this type of network displays a relatively large number
of low-connected nodes and a few nodes with a high connectivity, the so called
“hubs.” Even though, the assumption of a power law distribution is stated in
numerous studies, statistical analyses have also refuted this approach (Khanin
and Wit 2006; Lima-Mendez and van Helden 2009).
The network topology encodes preliminary evidences for the understanding of
the underpinning biological organization and reveals biological relevant
information on the functional importance of individual nodes (Atias et al.
2009). Parameters derived from network local properties such as clustering
coefficient, node degree (number of connected nodes), betweenness and
136
Learning from co-expression networks|
centrality are commonly used for node ranking (Pavlopoulos et al. 2011). Nodes
with a higher rank, i.e. with a high degree of connection and a high clustering
coefficient, are identified as major hubs and are also likely associated to
essential genes in the network (Provero 2002; Carlson et al. 2006). The
phenomenon, describing the link between connectivity and essentiality, is
termed the ‘lethality-centrality rule’ (Jeong et al. 2001). Several studies have
associated the non-trivial topological features of scale free networks to an
essential buffering system for biological networks robustness and
environmental responses (Levy and Siegal 2008; Fu et al. 2009; Lachowiec et al.
2015).
Groups of highly connected genes in a network tend to form modules.
Extracting modules from the network is thus a commonly used approach to
generate manageable graph subunits for further study (Aoki et al. 2007; Mao et
al. 2009). For this purpose, several clustering algorithms are available. These
algorithms can be categorized into hierarchical and non-hierarchical
algorithms. Hierarchical clustering algorithms identify clusters by iteratively
assigning nodes to clusters. In a first step, weights are assigned to the network
vertices, using for instance the calculated correlation coefficient. Clusters are
then built from high weight vertices and progressively expanded by including
neighboring vertices. The number of final clusters varies, for instance
depending on a chosen threshold. A variety of hierarchical clustering methods
are available including Weighted Gene Correlation Network Analysis (WGCNA)
(Langfelder and Horvath 2008), Markov Cluster Algorithm (MCL) (Enright et al.
2002; Mao et al. 2009), Normalization Engine for Matching Organizations
(NeMo) (Rivera et al. 2010) and Improved Principal Component Analysis (IPCA)
(Li et al. 2008a; Fukushima et al. 2012). Mutwil et al. (2010) suggested a novel
Heuristic Cluster Chiseling Algorithm (HCCA). For each node in the network, this
algorithm generates node vicinity networks by collecting all nodes within n
steps away from the seed node. Non-hierarchical approaches, such as K-mean
clustering (Stuart et al. 2003), identify a certain number of modules given the
input cluster criteria instead.
The performance of the different clustering algorithms can be assessed by
evaluating the functional coherence of the predicted modules and inform, in
return, the user on the best clustering algorithm to use (Lysenko et al. 2011).
MORPH, an algorithm developed by (Tzfadia et al. 2012), combines a guide-
gene approach with data set selection and clustering to enable finding the best
137
| Chapter 6
combination of gene expression data and network clustering to optimally
associate candidate genes with a given target pathway.
Modules are often used as the starting point for more detailed studies as they
considerably reduce the global network complexity. A panel of tools can be
employed to further mine these modules (Table 1). These tools enable the
functional annotation of nodes and modules and to unravel the nature of the
gene-gene relationships.
Enrichment analysis for the genes within a module is the most widely used
technique to associate modules with particular functions. Under the ‘guilt-by-
association’ rule, these functional modules provide a powerful framework for
the identification of new genes relevant to biological processes and their
functional annotation in the absence of strong a priori knowledge. These
enrichment analyses mostly rely on annotation databases (Table I). The most
popular ones are the gene ontology (GO) database (Ashburner et al. 2000) and
manually curated databases for metabolite pathways such as the Kyoto
Encyclopedia for Genes and Genomes (KEGG) (Kanehisa and Goto 2000),
Mapman (Thimm et al. 2004), or BioCyc (Caspi et al. 2014).
Phenotypic data can also be used with the a priori expectation that clustered
genes collaborate to control the same phenotypic trait. For example, Mutwil et
al. (2010) successfully associated an individual cluster with a specific biological
function using phenotypic data and tissue-dependent expression profiles for
each gene in the cluster. Similarly, Ficklin et al. (2010) used phenotypic
information of rice mutant lines to identify clusters of genes enriched for
mutant phenotypic terms such as “sterile” or “dwarf”. In another study, Lee et
al. (2010) showed that genes whose disruption is associated with embryonic
lethality and pigmentation were significantly more interlinked in the AraNet
network than expected by chance, corroborating the aforementioned
centrality-essentiality theory.
Other available data can help to unravel the nature of the links connecting
genes in the network. Co-expression networks are undirected networks as the
edges between two genes do not indicate the direction of the interaction.
Additionally, the co-expression link between two connected genes might also
indicate an indirect interaction. To further unravel the gene regulatory
dynamics in such modules, known gene-gene interactions can be displayed on
138
Learning from co-expression networks|
the network and help to identify gene regulatory relationships (Ulitsky and
Shamir 2009).
One of the common approaches to identify regulatory relationships is to focus
on known transcription factors and their known targets in the network. As
transcription factors regulate the expression of many genes in the genome, one
might also expect to find them as highly connected nodes in the network or
connected to hub genes. The range of interactions of a transcription factor is
defined by its binding capacity to specific cis-regulatory elements (motifs)
identified in the promoter region of its target genes. Consequently, the search
for such motifs in the nodes located in the vicinity of identified transcription
factors can be a complementary source to functionally annotate genes and
infer potential gene regulatory relationships (Vandepoele et al. 2009).
In their approach, Ma et al. (2013) used a bottom-up approach by first creating
sub networks of genes based on motif enrichment for specific cis-regulatory
elements and then identifying co-expression modules in those sub-networks.
Gene interaction information can also be retrieved from other data sources.
The development and application of genome-wide methods for detecting
protein-protein interactions, such as yeast two-hybrid (Bruckner et al. 2009) or
affinity purification methods coupled to mass spectrometry (Morris et al. 2014)
have increased available interactome data. The InterProScan (Quevillon et al.
2005) or STRING (Szklarczyk et al. 2014) databases can be investigated to
retrieve known physical interactions, both structurally resolved and
experimentally validated. Knowledge on genetic interactions enables further
inferring of functional relationships between genes and pathways. Besides data
storage in databases, information on gene function and interactions can also be
found embedded in textual data (Hakala et al. 2015). Text mining methods
applied to literature resources, such as PubMed articles, help to extract
additional information using manual curation efforts (Szakonyi et al. 2015) or
semi-automated tools such as PubTator (Wei et al. 2012).
Previously mentioned data mining approaches essentially rely on available
knowledge. Ample knowledge is available for Arabidopsis, but for other less
well-studied plant species, the lack of knowledge regarding gene annotation
and interactions severely limits network analysis using gene prioritization.
Comparing networks from different species can provide an additional source of
knowledge for gene functional annotation and gene connectivity using gene
139

| Chapter 6
orthologs information and network alignment (see Section Comparative Co-
Expression Network Analysis). As an example, Lee et al. (2015a) used conserved
functional gene associations from networks inferred for Arabidopsis, worm,
human and yeast as an additional source of data for the RiceNet, which was
initially limited to rice-specific data sets.
The availability of these complementary data has opened the way to integrated
approaches for function prediction studies. Multiple independent lines of
evidence provide confidence for network functional gene associations.
Kourmpetis et al. (2011) employed the Bayesian Markov Random Fields (BMRF)
model to integrate protein sequence information, gene expression and protein-
protein interaction data in their function prediction approach in Arabidopsis.
They demonstrated that the model for network integration had the best
performance when all of these data sources were used. One of the best
examples of data integration is provided by GeneMANIA. This prediction server
relies on a Gaussian Markov Random Fields-based method for protein function
prediction combining multiple networks (Warde-Farley et al. 2010). Together
with computational methods, these tools, mobilizing and integrating prior
knowledge and network features, have contributed to the establishment of
diverse strategies to prioritize candidate genes for further experimentation
(Table 2).
140
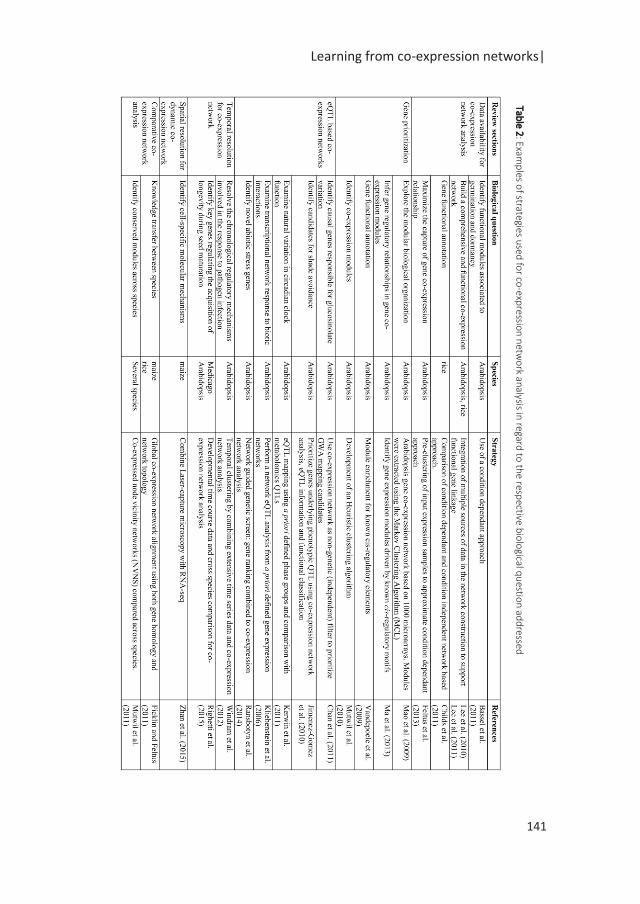
Learning from co-expression networks|
Table 2: Exam
ples o
f strategies used
for co
-expressio
n n
etwo
rk analysis in
regard to
the resp
ective bio
logical q
uestio
n ad
dressed
141
| Chapter 6
Co-expression network applications
eQTL Based Co-Expression Networks
Advances in “genetical genomics” have greatly benefited the elucidation of the
genetic loci controlling transcription and the inference of regulatory
mechanisms underlying complex phenotypic traits. The concept of ‘genetical
genomics’ was first introduced by Jansen and Nap in 2001 (Jansen and Nap
2001), marking a new turn in genetic studies. The basic idea of this approach is
to join classical genetic linkage analysis (Quantitative trait Loci (QTL) analysis)
with gene expression studies (Keurentjes et al. 2007b). The variation in gene
expression is regarded as a quantitative trait for which the genetic basis
(expression QTL, eQTLs) is investigated in mapping populations, such as
recombinant inbred line (RIL) populations. In plants, “genetical genomics” has
proven to be a successful strategy to dissect complex traits in a number of
studies (for reviews see (Joosen et al. 2009; Kliebenstein 2009; Ligterink et al.
2012)).
Detected eQTLs for a specific gene can be classified into “local” or “distant”
eQTLs depending on whether they co-localize with the physical position of the
studied gene or are located elsewhere in the genome, respectively (Rockman
and Kruglyak 2006). eQTLs can also be classified as cis- or trans-acting based on
the location of the associated causal polymorphism in the gene under study or
elsewhere in the genome, respectively. Consequently, distant eQTLs are always
trans-acting, while local eQTLs can be cis-acting, if the associated causal
polymorphism resides in the gene under study, or trans eQTLs when they are
caused by a closely linked allelic variation in a trans-acting factor. Allele specific
expression analysis can specifically determine whether a local eQTL is trans or
cis-acting (for review see (Kliebenstein 2009)).
A common feature of global eQTL studies is the identification of trans eQTL
hotspots (West et al. 2007; Keurentjes et al. 2007b). These eQTL hotspots
correspond to a high number of co-locating trans eQTLs in one region of the
genome, indicating a hotspot for transcriptional regulation (Kliebenstein 2009).
Due to their analogy to high degree nodes in a network, cis eQTLs located in
these hotspots are sought as candidate master regulators affecting the
expression of genes with a trans eQTL in that same region (West et al. 2007). A
regulatory relationship can be inferred by correlating gene expression profiles
between the cis eQTL candidate regulators and their potential downstream
142
Learning from co-expression networks|
trans regulated genes. An iterative group analysis can be used to detect
significant associations (Breitling et al. 2004; Keurentjes et al. 2007b; Wang et
al. 2014). Keurentjes et al. (2007b) established a regulatory network for genes
involved in the transition of flowering based on eQTL data. The GIGANTEA (GI)
protein, known to be involved in the circadian clock controlled flowering time
pathway, was identified as a regulator. Phenotypic QTLs associated with
flowering and the circadian clock were also identified at the genetic locus of GI.
Similarly, Wang et al. (2014) identified eight regulatory groups and their target
genes for heading time in rice RILs. One regulatory group centered on Ghd7, an
important regulator in heading time and yield potential in rice, was identified
with a cis eQTL connected to nine genes with trans eQTLs. The network was
validated by inspecting the transcript abundance of downstream-regulated
targets and supported by co-localizing phenotypic QTLs for yield and heading
time. These studies illustrate the usefulness of eQTL based co-expression
analysis to guide the identification of candidate genes controlling quantitative
traits. Other studies combined eQTL with co-expression analysis to identify
regulator candidates underlying eQTLs (Terpstra et al. 2010; Flassig et al. 2013).
Interestingly, eQTL studies have also reported noteworthy properties of eQTLs
in regard to their regulatory and evolutionary significance. Cis eQTLs were
found to be highly inheritable with a larger genetic effect when compared to
trans eQTLs (West et al. 2007; Petretto et al. 2006; Kloosterman et al. 2012).
Cis eQTLs were also found to be more consistent across different genetic
backgrounds (Cubillos et al. 2012) and more robust to environmental
perturbations (Cubillos et al. 2014), while genes with trans eQTLs were more
frequently reported as tissue or organ specific (Drost et al. 2010; Kloosterman
et al. 2012).
QTLs tend to cover large regions of the genome, typically spanning hundreds of
genes, and finding the actual gene that causes the observed trait variation is a
formidable task. The capacity of gene co-expression networks to handle
genome-wide data and filter out genes based on their correlation coefficients
offers an attractive approach to prioritize genes. This strategy was successfully
applied in the identification of EARLY FLOWERING 3 (ELF3), and its implication
in shade avoidance response (Jimenez-Gomez et al. 2010). In this study, a
network was built for each of the 363 candidate genes underlying the main
phenotypic QTL for shade avoidance, connecting each candidate gene to co-
expressed genes across 1.388 (selected) experiments. The eQTLs available for
143
| Chapter 6
the investigated RIL population allowed pruning of the networks to keep only
the co-expressed genes with a cis eQTL, which is indicative of a regulatory
relationship (Hansen et al. 2008). In a similar approach, Chan et al. (2011) used
co-expression analysis to prioritize candidate genes resulting from a genome
wide association study (GWAS). Alternatively, co-expression networks can be
used prior to eQTL analysis (Kliebenstein et al. 2006; Kerwin et al. 2011).
Kliebenstein et al. (2006) implemented an a priori network eQTL approach by
calculating the mean expression value of the genes within each pre-determined
network and using this as a quantitative trait in a subsequent QTL analysis.
One main advantage of eQTL analysis is that regulatory insights can be gained
without prior knowledge. Information on the nature of the inferred interaction
in such an approach, combined with co-expression network analysis, can
substantially accelerate understanding of molecular regulatory interactions
(Figure 2). However, the link between phenotype and transcript variation is not
always straightforward as changes are also likely to occur at the protein or
metabolite levels. The additional integration of other omics data available as
QTLs for protein (pQTL) or metabolite (mQTL) variation (Wentzell et al. 2007;
Kerwin et al. 2011) can bridge the gap between genotype and phenotype,
providing an in-depth understanding of causal mechanisms. As an example,
Kerwin et al. (2011) identified overlapping eQTLs and mQTLs for circadian time
and glucosinolate variation in Arabidopsis. Specifically, AOP2, a 2-oxoglutarate-
dependent dioxygenase, was identified as a potential regulator. Altered AOP2
function resulted in changes in expression of clock output genes, suggesting a
causal relationship between changes in clock function and metabolite content.
High resolution co-expression networks
Co-expression networks offer a conceptual framework to study gene
interactions. However, their static representation does not capture all possible
gene relationships as these do not operate simultaneously due to spatial and
temporal variation in gene expression.
Temporal Resolution for Dynamic Co-Expression Networks
In response to developmental or environmental stimuli, plants undergo global
transcriptional reprogramming. Monitoring transcriptional changes over time
can provide more insight into the cascade of biological processes involved in
the signal perception, transduction and final response. Using time series data
144
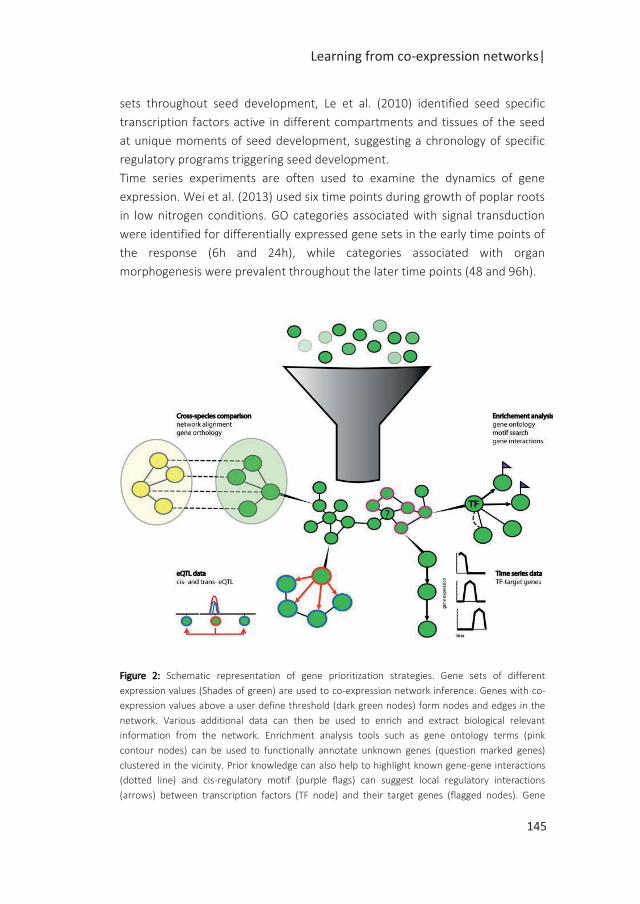
Learning from co-expression networks|
sets throughout seed development, Le et al. (2010) identified seed specific
transcription factors active in different compartments and tissues of the seed
at unique moments of seed development, suggesting a chronology of specific
regulatory programs triggering seed development.
Time series experiments are often used to examine the dynamics of gene
expression. Wei et al. (2013) used six time points during growth of poplar roots
in low nitrogen conditions. GO categories associated with signal transduction
were identified for differentially expressed gene sets in the early time points of
the response (6h and 24h), while categories associated with organ
morphogenesis were prevalent throughout the later time points (48 and 96h).
Figure 2: Schematic representation of gene prioritization strategies. Gene sets of different
expression values (Shades of green) are used to co-expression network inference. Genes with co-
expression values above a user define threshold (dark green nodes) form nodes and edges in the
network. Various additional data can then be used to enrich and extract biological relevant
information from the network. Enrichment analysis tools such as gene ontology terms (pink
contour nodes) can be used to functionally annotate unknown genes (question marked genes)
clustered in the vicinity. Prior knowledge can also help to highlight known gene-gene interactions
(dotted line) and cis-regulatory motif (purple flags) can suggest local regulatory interactions
(arrows) between transcription factors (TF node) and their target genes (flagged nodes). Gene
145
| Chapter 6
regulatory relationships can also be extracted from time series data. Algorithms can extract causal
regulatory relationship between genes with a cis-eQTL (orange contour node) and genes with
trans-eQTLs (blue contour node). Additionnal information can be gained from comparisons with
networks of other species (yellow node) by onthology and network alignment (dotted lines).
By reducing the time scale to minutes, Krouk et al. (2010) observed that within
three minutes following nitrate addition in Arabidopsis, functional categories
such as ribosomal proteins were over-represented, suggesting the rapid
activation of key elements of the translation machinery to synthesize proteins
required for nitrogen acquisition.
Combining time series and co-expression network analysis can unveil gene
interactions associated with the dynamics of transcriptional programs. Global
expression patterns can be obtained from the expression similarity calculated
across samples collected at different time points. This approach is well suited
to find modules of simultaneous expressed genes and gene interactions but is
not well suited for time lagged regulations since all genes influencing the
expression of downstream target genes are not necessarily captured within a
same time point (experiment). This results in complex relationships between
co-regulated genes, including co-expression, time shifted and inverted
relationships (Zhang et al. 2005): an activated transcription factor gene first has
to be transcribed and the resulting mRNA translated before it in turn can
activate its downstream targets. The delay further depends on the dynamics of
the regulation, and for instance the presence of network motifs like feed
forward or negative feedback loops (Alon 2007).
Windram et al. (2012) dissected the infection response of Arabidopsis to
Botrytis cinerea using 48 time points with 2h intervals. To capture the
chronological establishment of the associated transcriptional events and to
predict their regulation, the differentially expressed genes were first clustered
based on the similarity of gene expression patterns over time or based on the
timing of differential expression of each gene. Regulatory predictions were
made using a discrete-time causal structure identification algorithm. The
expression means of the clusters and Botrytis cinerea growth information were
used to build a regulatory network. In this network, a NAC transcription factor
identified in one cluster connected to two downstream clusters enriched for
the NAC binding motif in their promoter sequence, suggesting a regulatory
relationship.
This example shows that causality information of time series on a fine temporal
scale can provide valuable information on the directionality of gene
146
Learning from co-expression networks|
interactions. Several algorithms have been proposed to perform time delayed
correlation analysis in time series data (De Smet and Marchal 2010). For
instance, Lavenus et al. (2015) proposed a time delay correlation algorithm
(TDCor) that includes minimal prior knowledge on the nature of the genes, with
transcription factors categorized as repressor, activator, regulator or non-
regulator, to build a network of plausible interactions from time series data.
Krouk et al. (2010) used a noise reduction state-space modeling algorithm to
build a dynamic linear model defining the rate of change in expression between
time points t and t + 1. This model was then used to predict the influence of
transcription factors on the genes they regulated (influential rate). The authors
reasoned that the observed low influential rate of the transcription factors
could be due to the functional redundancy that is often observed in biological
networks and is consistent with a proposed global buffering system
counteracting stresses and evolutionary forces (Fu et al. 2009). Polanski et al.
(2014) suggested a module identification procedure based on the Wigwams
algorithm capable of mining multiple time series for condition dependent co-
expression across a subset of time series. Using such an approach, the
reconstruction of co-expression networks can be directed to time specific
modules of co-regulated genes.
Together, these studies suggest that new regulatory insights can be gained
from integration of co-expression networks with data from time series, for the
identification of “subtle” gene clusters, showing condition dependent
regulation. Time series are valuable for further disentangling of real co-
regulatory gene relationships from co-expression links. For application in more
studies, new challenges have to be addressed such as the judicious selection of
time points (Vashishtha et al. 2015), the development of performant inference
algorithms, the reliable detection of direct and indirect gene interactions and
most importantly the connection with their real biological meaning (reviewed
by (Bar-Joseph et al. 2012). We believe that this approach will offer new venues
for deeper insights into the fine-tuned regulation and predictive analysis of
gene expression behavior in future studies.
Spatial Resolution for Dynamic Co-Expression Networks
Plants are multicellular organisms whose vegetative and reproductive organs
are composed of complex tissues and cell types. Cell differentiation is a
fundamental process required to acquire cell identity and consequently ensure
the correct execution of essential structural and biological functions. Genome-
wide transcriptome and gene network analyses have mostly been conducted
147
| Chapter 6
on whole plant organs, severely limiting the identification of more specific
regulatory interactions occurring at the tissue or single cell level. The
development of new highly selective methods has enabled the collection of
expression profiles at unprecedented resolution (Nelson et al. 2008; Tang et al.
2011; Belmonte et al. 2013) offering new insights into the various biological
levels of transcription regulation. As an example, laser capture microdissection
(LCM) enables isolation of specific tissues at cell level while fluorescent
activated cell sorting (FACS) allows separation of specific cell types expressing
green fluorescent protein (GFP) under control of cell specific promoters.
These techniques were used to get insight into single cell transcriptomic data
for well-studied and specialized organs such as roots or pollen (Becker et al.
2014; Slane et al. 2014; Aya et al. 2011; Efroni et al. 2015).
A fluorescent cell sorting technique was used to obtain a high-resolution map
of spatiotemporal expression profiles of Arabidopsis roots (Brady et al. 2007).
In this study, transcriptome analysis of root transverse sections revealed 51
dominant root radial expression patterns among which 17 showed enrichment
in a single cell type, whereas 34 expression patterns were found across 2–5 cell
types to 5 cell types (Brady et al 2007). In the same study, the longitudinal root
section expression profiling to analyse different developmental stages in root
cell-type formation, enabled the identification of specific expression patterns.
Transcriptional changes may also occur in response to environmental shifts.
Interestingly, a close link was observed between development and stress
responses at the cell-type specific level in the Arabidopsis root showing
developmental plasticity (Gifford et al. 2008) while adding a layer of
complexity, i.e. environment specific effects, to an already intricate system.
Together, these results highlight the spatiotemporal transcriptional complexity
down to the cellular level and suggest cell-specific transcriptional programs.
Integrating tissue- or cell-type specific high-resolution datasets by co-
expression network analysis is a promising approach for the regulatory
dissection of specific biological functions. Illustratively, Zhan et al. (2015)
combined LCM and RNA-seq to isolate and profile filial and maternal cell types
of maize kernels at eight days after pollination. From the resulting gene co-
expression network, 18 endosperm-associated co-expression modules were
identified among which 10 were found to be highly compartment- or cell-type-
specific. The comparison of these spatial co-expression modules with
temporally upregulated gene data sets showed that genes within co-expression
modules are regulated both in time and space. Collectively, these results
148
Learning from co-expression networks|
support the effectiveness of co-expression networks analysis to uncover the
temporal and spatial organization of specific differentiation processes.
On-going developments to further improve single-cell RNA-seq analysis
(Buettner et al. 2015) should strongly benefit the establishment and
interpretation of specialized co-expression networks in the coming years.
Furthermore, the advancement of computational tools able to manage the
increasing amount of data as well as the development of robust and efficient
algorithms to analyse large-scale data will be needed to tackle the increasing
complexity added to gene regulatory networks.
Comparative co-expression network analysis
Classic research in evolutionary developmental biology (“evo-devo”) has
focused on comparative analysis with the help of mutant analysis, heterologous
mutant complementation, comparative gene expression studies and
phylogenetic analysis. These analyses mostly rely on gene and protein
sequence information; however the increasing number of gene expression data
in many different species is opening up new perspectives. Cross-species
comparison of co-expression networks is a promising approach to understand
the interplay between regulatory function and evolution (Movahedi et al. 2012;
Hansen et al. 2014).
There are several advantages of cross-species network comparisons. Networks
of well-studied plants such as Arabidopsis can enrich sparse networks, such as
for crops, reducing the need of extensive functional genomic and phenomic
resources. Cross-species comparison can accelerate the functional annotation
of genes and the discovery of gene-gene interactions, consequently hastening
the gene prioritization process for targeted mutational studies.
There is evidence that networks are shaped by major evolutionary features,
such as by neo- or sub-functionalization following whole genome duplications
(Conant and Wolfe 2006; De Smet and Van de Peer 2012). These adaptive
processes may result in an evolutionary functional gene network partitioning
associated with a rewiring in the gene regulatory circuitry (Conant and Wolfe
2006). In this context, co-expression network comparison can be used to
identify functionally conserved network patterns and to study their evolution.
Different methods have been proposed to compare co-expression networks.
Leal et al. (2014) compared gene co-expression networks obtained for several
plant species in response to different pathogens using a multivariate analysis.
Each network was characterized by eight graph variables which were then
149
| Chapter 6
summarized in a principal component analysis. Clustered networks identified in
the principal component analysis plot suggested similar pathogen specific
responses across species.
An obvious method to align networks and to get better insight into the degree
of network conservation is to link orthologous genes between different species.
The effectiveness of such comparative analysis essentially relies on the
consistency of the orthologous information as well as the quality of the
underlying co-expression networks. Orthologous gene information can be
obtained through various methods (Kuzniar et al. 2008). Simple approaches use
best Blast hits or reciprocal hit blast (RHB) for closely related species (Yang et
al. 2011). More advanced tools such as the OrthoMCL clustering algorithm (Li
et al. 2003) or OrthoFinder (Emms and Kelly 2015) enable differentiation of
true orthologous from paralogous genes. Zarrineh et al. (2011) proposed a
cross-species co-clustering approach (COMODO). Network comparisons can be
done at the global scale or focused on specific gene modules. In a global
approach, Ficklin and Feltus (2011) used an alignment algorithm, IsoRank, that
incorporates both gene homology and network topology to compare networks
in rice and maize. They identified aligned modules enriched for similar
functional terms, suggesting their potential evolutionary conservation.
In another study, Obertello et al. (2015) used orthologous information from
OrthoMCL and BlastP, to align genes between Arabidopsis and rice co-
expression networks. The authors observed that integrating rice data in an
Arabidopsis network did not improve the available interaction knowledge,
while Arabidopsis could substantially enrich rice network interactions. This
study illustrates the usability of network comparisons to promote translational
discoveries. It shows that well-known networks, such as those from model
plants like Arabidopsis, can enrich more sparse networks of crops, such as rice,
although Lee et al. (2011) demonstrated a higher accuracy for a rice network,
RiceNet, derived from data of diverse species (with 15.5% of true positive
linkages) than for a rice network derived solely from orthology with AraNet, the
Arabidopsis network (with 6.5% true positive linkages).
In a more targeted approach, Yang et al. (2011) investigated conserved co-
expression of cell-wall associated genes between Arabidopsis and poplar. An
initial list of known cell-wall related genes was used to build a co-expression
network with 22 clusters. The orthologous clusters of co-expressed genes
identified in poplar did not all correlate in gene expression pattern with the
clusters in Arabidopsis (gene expression pattern correlated for 9 of 22 clusters).
Additionally, conserved co-expression clusters referred to plant essential
150
Learning from co-expression networks|
biological functions, such as cell-wall formation. More comprehensively,
Movahedi et al. (2011) implemented an expression context conservation score
(ECC) to quantitatively estimate the degree of conservation of expression
similarity between orthologous genes and their co-expression partners. The
overall ECC scores revealed that for 4.630 orthologs in rice-Arabidopsis gene
pairs, 77% had a conserved expression context. In another study, Netotea et al.
(2014) performed an extensive examination of network properties, like node
degree distribution and gene centrality, to compare co-expression networks of
Arabidopsis, poplar and rice. They analyzed the degree of conservation of gene
co-expression links and neighborhood (connected genes) among all orthologs
in the three networks and showed that genes with high centrality, typically
hubs, were significantly conserved while local regulatory motifs were relatively
less well conserved across species.
Additionally, they noted that sequence similarity did not always predict gene
regulation conservation. Beyond simple gene sequence comparison, the
integration of co-expression networks to cross-species data provides a new
dimension in evolutionary studies, revealing conservation and divergence in the
regulation of genes.
At the moment, several integrative platforms are available to enquire, display
and compare co-expression networks. Examples of these are PLANEX (Yim et al.
2012) , ComPLex (Netotea (Netotea et al. 2014), CoExpNetViz (Tzfadia et al.
2015), PLAZA (Proost et al. 2015) and the “NetworkComparer” pipeline on the
PlaNet platform (Mutwil et al. 2011) that integrates genomics, transcriptomics,
phenomics and ontology analyses to compare seven plant species.
Conclusion and perspectives
Co-expression networks are a powerful approach to accelerate the elucidation
of molecular mechanisms underlying important biological processes.
Importantly, network based strategies are largely determined by the biological
question addressed and the prior knowledge available.
We anticipate that the increase in available experimental data, driven by new
molecular techniques, will enrich existing databases. In addition, the shift from
microarrays to next generation high-throughput sequencing technologies will
provide further insights into genome scale functional networks of many
species. Together with the increased sensitivity of high-resolution technologies
enabling the acquisition of cell-specific transcriptome profiles, novel biological
insights can be gained. The extensive accumulation of data will require further
151

| Chapter 6
efforts for their storage, accessibility and processing. One of the common
strategies for all co-expression network studies is the integration of disparate
data sources for the biological interpretation of networks. As a result, the
development of integrative web interfaces such as CressInt (Chen et al. 2015)
are needed to facilitate the integration of available genomics data.
Furthermore, the development of computational tools, such as machine
learning based algorithms, although computationally intense, will support the
optimal integration and exploitation of prioritization strategies (Radivojac et al.
2013). In such a scenario, the collaboration of bio-informaticians and biologists
is highly desirable and will become increasingly important.
To fully describe the link between genotype and phenotype and to understand
the underlying gene regulation, coordination of networks at different molecular
levels (gene, protein, metabolite) is needed (Gaudinier et al. 2015).
Additionally, genetically anchored gene expression profiles (eQTLs) have
proven to be powerful tools to reveal causal regulatory variants. The genetical
genomics approach provides a multifactorial design to study the simultaneous
effect of gene perturbations. (Kliebenstein 2012) demonstrated that shallow
sequencing depth in transcriptomics experiments enables capturing most of
their genomic information. The result of their study suggested that 10% of the
transcripts would detain more than 80% of the information present in a variety
of transcriptomics experiments. In another study, Li et al. (2008b) introduced
the generalized genetical genomics design to optimally study genetic by
environment interactions. These findings suggest that there is room for
improvement in the design of transcript sequencing for large-scale factorial
analysis in which the size of the population studied or the number of conditions
to be tested can be increased in a cost-effective manner.
Co-expression networks are an attractive framework for gene interaction
analysis and offer a diverse range of applications, from the gene functional
annotation to the comparison of co-expression networks across species.
Improved and enriched co-expression network analyses will further empower
the predictive power of networks and their translational application by
circumventing the need of additional extensive functional genomic and
phenomic resources. This approach will further contribute to the elucidation of
important biological processes and provide a valuable predictive tool for
contemporary molecular breeding and crop engineering strategies.
152

Chapter 7
General discussion
|Chapter 7
Introduction
In the coming years as a result of climate change, plants will experience shifts
in developmental phase transitions with consequences for their life history
strategies. Fundamental knowledge of the factors and mechanisms influencing
these shifts can help to understand the importance of these changes in a
biological, agricultural and ecological context. Environmental factors influence
vegetative aspects of plant development as well as the transition to
reproductive development, namely flowering. Beyond flowering,
environmental factors can be experienced by the developing offspring and as a
result, influence the intrinsic properties of the seeds produced. At the stage of
seed dispersal or harvest, the quality of the seeds is instrumental for the
reproductive success of the plant or for seed companies to obtain a marketable
product.
Seed quality is a generic term, since it describes many seed characteristics,
including seed size, seed weight, as well as the seed performance traits
associated with the rate, percentage, uniformity and vigour of germination. In
nature, the timing of germination is critical for the success of seedling
establishment. One of the well-known mechanisms controlling the timing of
germination is seed dormancy. Seed dormancy is influenced by genetic loci as
well as environmental factors (Bentsink et al. 2010; He et al. 2014; Donohue et
al. 2005a). The response to the environmental cues during seed development,
also termed ‘maternal environment’, has been described for several seed traits
including dormancy and germination in Arabidopsis (He et al. 2014; Donohue et
al. 2005a). These effects also differ across genotypes, suggesting genotype-by-
environment interactions (G x E). In spite of the potential phenotypic plasticity
induced by maternal environments and the large genetic variation reported for
seed traits (Bentsink et al. 2010; Joosen et al. 2012), only a few studies have
investigated the influence of the maternal environment on the genetic basis of
seed quality traits (Postma and Agren 2015; Kerdaffrec and Nordborg 2017).
The advent of high-throughput of post-genomics technologies can provide in-
depth insights in the plastic, genetic and molecular bases of the process of seed
germination.
The work presented in this thesis aimed to extend studies on the effect of
maternal environments by providing insights into the genetic basis of seed
performance at the phenotypic, metabolic and transcriptome levels and the
changes induced by different seed maturation environments. For this purpose,
I used an Arabidopsis thaliana Bay-0 x Sha recombinant inbred line population
154
General discussion |
of 165 lines which was grown under controlled standard (ST), high temperature
(HT), high light (HL) and low phosphate (LP) conditions from flowering until
seed harvest. A classical quantitative trait locus (QTL) mapping approach was
used to investigate changes in the genetic architecture of phenotypic and
molecular traits in response to the maternal environment. I generated a new
saturated genetic map (Chapter 2) which was subsequently used to identify a
large number of QTLs displaying significant QTL-by-environment interactions
for seed quality traits (Chapter 3). In Chapter 4 and 5, in a genetical ~omics
approach, I showed that the maternal environment triggers profound changes
in the genetic basis of the dry seed metabolome and transcriptome. This
thesis’s research lays the foundation for seed systems genetics studies towards
the future integration of the separate studied biological strata. In this respect,
networks represent an attractive approach to reduce data complexity and
reflect on the underlying molecular mechanisms (Chapter 6). In this last
chapter, I discuss the importance and implications of the maternal
environment in an evolutionary, ecological and breeding context. I further
elaborate on tools and methods that are beneficial for gene discovery and the
understanding of the regulation of complex traits.
Plasticity of seed performance
The adaptive significance of maternal environments
Changes in the environmental conditions are expected to be more common as
a result of climate change. Organisms can respond to these fluctuations in
several ways such as shifting their distribution, adaptation to new
environments or acclimating via plasticity. Phenotypic plasticity is the result of
the expression of a genotype in response to environmental variation, and
enables plants to cope with fast changing environments. Such plasticity brings
the opportunity for individuals to reach phenotypic optima in novel
environments and is thereby likely to contribute to genetic adaptation of a
species in the long term (Donohue et al. 2005). As for many organisms, early
life history stages of plants are the most sensitive to environmental cues. In the
plant life cycle, seed germination is a critical phase determining the success of
the establishment of the next generation. Plasticity for seed germination has
been largely investigated in the immediate environment, i.e. within one
generation (Joosen et al. 2012). Environmental cues experienced by the
environment of the parental plants can also alter seed traits. Arguably, the
155
|Chapter 7
influence of the maternal environment is often referred to as a form of trans-
generational plasticity (Vayda et al. 2018). However, in this set-up, the
maternal environment is concomitant with the environment experienced by
the mother plant and the developing seed itself. The maternal environment is
often viewed as a key for promoting offspring performance against adverse
environmental cues. However, upon seed dispersal, germination frequently
occurs under a wide range of conditions (Bewley 1997; Baskin and Baskin 2014)
and thus differences between the maternal and offspring environments may
result in unpredictable phenotypic performance (Leverett et al. 2016), Chapter
3) questioning the adaptive significance of the maternal environment. Two
types of strategies might explain the response to the maternal environment.
Early seed germination response in adverse environments can be seen as a
competitive advantage that allows the young plant to outgrow potential
competitors or overcome temporary unfavourable germination conditions. On
the other hand, a reduced germination rate can be viewed as a strategy aiming
to delay the timing of germination by promoting prolonged primary dormancy,
germination arrest or facilitated induction of secondary dormancy. In Chapter
3, I investigated germination performance, measured as the area under the
germination curve (AUC), as a response to both maternal and germination
environments. Under most adverse germination conditions, an increased
variation in the AUC values was observed across the lines, suggesting non-
uniformity of germination in the seed batch. In nature, non-uniformity of
germination can be seen as a bet-hedging strategy to scatter germination in
time thereby providing a mean to better cope with uncertain and fluctuating
germination environments (Springthorpe and Penfield 2015). The ecological
importance of non-uniform germination contrasts with the quest for uniformity
of germination and seedling establishment in the selection process of high
quality seeds for agricultural practices.
In this thesis, I investigated the effect of the maternal environment
experienced by the mother plant and developing seeds from flowering until
seed harvest. However, the sensing and signalling of environmental cues at the
vegetative stage, i.e. before flowering, also determines seed quality
characteristics, such as seed dormancy (Springthorpe and Penfield 2015).
Flowering marks an important transition from the vegetative to the
reproductive stage. The major regulator of flowering, FLOWERING LOCUS C
(FLC) operates in one of the best characterized molecular pathways with known
pleiotropic effects. Several studies have reported relations between the
flowering-FLC pathway and the control of seed germination (Blair et al. 2017;
156
General discussion |
Huo et al. 2016; Chiang et al. 2009). A recent study brought mechanistic
insights on how FLC affects seed dormancy in response to high temperature
(Chen and Penfield 2018). It would be interesting to further investigate how
regulatory mechanisms, e.g. associated with flowering, integrate
environmental cues and interact with regulatory mechanisms acting during
seed development and maturation.
Implications for breeding
The fact that performance of seeds in response to the maternal environment
affects final seed quality is of eminent importance for breeding purposes
(Chapter 3). In seed companies, large variation in quality of seed lots is
expected, since the production sites are often located in different countries
around the world. One way to alleviate such hindrances could be to establish a
growing protocol based on the predicted environmental effects in such a way
that the effect of the environment is stabilized across generations.
Alternatively, knowing about the effects of a given growing environment could
also be exploited to manipulate seed production environments to predict and
improve seed quality.
Since it is not always possible to control greenhouse conditions or even use
greenhouses, so far major efforts to improve seed quality have been carried
out using post-harvest treatments. The downside of such treatments, such as
seed priming, is the often drastic reduction of storage time of the seeds
(Hussain et al. 2015). In addition, such treatments remain expensive, crop
specific and subjected to trial and error for the optimization of protocols.
Including the genetic components of seed quality in breeding programs might
thus provide an upstream solution to improve seed quality. In Chapter 3, I
found that the maternal environment largely interacts with the genetic basis of
seed performance. One of the most striking examples was observed for a high
temperature specific QTL identified on the top of chromosome 1 and validated
using a heterogeneous inbred families (HIFs) approach. From a breeder’s
perspective, selecting varieties that show a stable response to different
maternal cues can ensure certain stability in the quality of the seed produced.
Alternatively, genotypes could be selected for their predicted performance in
terms of seed quality traits for targeted growing environments. The large
variation in the effect of seed performance QTLs under the different maternal
environments emphasizes the need to consider maternal environments in
genetic studies. In general, knowing the potential consequences of maternal
157
|Chapter 7
environments might help in the development of tools to accurately predict
crop performance.
Closing in on complex traits
Complex traits are influenced by the natural variation within multiple genes in
interaction with the environment. The study of natural variation continues to
reveal new biology (Weigel 2012). In parallel, the recent advances in
sequencing technologies and high-throughput phenotyping facilities for
phenomics, transcriptomics, proteomics and metabolomics have enabled plant
biologists to elucidate genetic and molecular mechanisms of complex traits
(Keurentjes et al. 2008). Below I discuss in more detail the methods and tools
that can help to identify causal variants of complex traits.
QTL mapping
Many tools for quantitative genetics have been developed aiming at studying
the genetic architecture of quantitative traits. Quantitative trait locus (QTL)
analysis remains among the most popular approaches. The success of QTL
mapping relies on the power and the resolution of the QTL analysis, mainly
determined by the type and size of a population as well as on the availability of
a dense genetic map (Chapter 2). In this thesis, I used an Arabidopsis Bay-0 x
Sha core population of 165 recombinant inbred lines (RILs) to investigate the
genetic basis of seed performance. RILs have proven useful for QTL analyses.
The number of generations created to obtain the RILs, results not only in
almost completely homozygous lines, but also in the accumulation of
crossovers. RILs provide thus material for high resolution QTL mapping,
although QTLs often still include a large number of genes (Chapter 2, Chapter
3). A limitation of QTL analyses in bi-parental populations is that only the
genetic variation present between the two parents and that segregates in the
derived population can be investigated. Several strategies exist to increase the
genetic variation under study. One approach is the generation and
investigation of artificial populations with multiple parents, the so-called Multi-
parent Advanced Generation Inter-Cross (MAGIC) populations (Cavanagh et al.
2008; Kover et al. 2009). In contrast, genome-wide association studies (GWAS)
use historical recombination events in a large panel of natural accessions to
identify marker-trait associations. GWAS can overcome the limitations of
traditional bi-parental populations and dissect complex traits with high
158
General discussion |
mapping resolution at the SNP level (Atwell et al. 2010). Therefore, several
studies combine QTL and GWAS approaches to validate their results and
identify potential causal genes (Mammadov et al. 2015).The GWA approach
has been used to investigate the genetic basis of seed traits in Arabidopsis as
well as in other species (Yan et al. 2017). In Chapter 3, the QTL x E approaches
resulted in a high number of QTL showing certain sensitivity to the maternal
and germination environments. Kerdaffrec and Nordborg (2017) investigated
the genetic basis of dormancy under two different environments using GWA
approach. The power of GWAS relies on the allele frequency in the population
and in a GWA x E set-up, a main limitation is that low frequency in the
population of QTL alleles with substantial G x E might not be captured (Korte
and Farlow 2013; Asimit and Zeggini 2010; El-Soda et al. 2014). The high
plasticity of seed traits in particular in response to maternal environments
makes such genetic studies particularly challenging.
The advancement in sequencing technologies has provided many possibilities
to explore genetic variation. Single nucleotide polymorphisms (SNPs) are
commonly identified from genomic data as costs of available technologies are
constantly decreasing. In Chapter 2, I showed that RNA-seq, commonly used
for the quantitative measurement of gene expression, can also be used to
identify SNPs. The discovery of SNPs using RNA-seq data is useful for several
reasons. First, by targeting the transcriptome, RNA-seq reduces the search of
causal variants of complex and/ or unsequenced genomes. Furthermore, the
SNPs identified are located in genic regions. These regions are the most likely
to be involved in the regulation of complex traits. Lastly, RNA-seq provides a
representation of the transcriptome that can be useful for other analyses as
shown in Chapter 5 where I used the same RNA-seq data to identify expression
QTLs (eQTLs). In Chapter 2, the SNPs identified from the RNA-seq data were
used to saturate the initial map of the Bay-0 x Sha population. The comparison
of different available genetic maps showed that increasing the numbers of
markers provided higher mapping resolution by reducing the size of the QTL
intervals. The ability to derive exponential numbers of markers, through
sequence data, shows that the availability of genotypic data no longer
represents a limiting factor for QTL studies, thus shifting efforts to enhance QTL
mapping towards the use of efficient mapping population designs exploiting
large genetic variation, such as the previous mentioned multi-parental
populations (Wijnen and Keurentjes 2014). A major challenge in multiple
environment studies remains that a large number of plants need to be
159
|Chapter 7
accurately phenotyped in order to have the statistical power to identify
marker-trait associations. The success of these methods thus also requires
advanced methods that provide high-throughput phenotyping, which is
currently recognized as a major bottleneck in genetic studies.
Phenotypes
Another major aspect for the success of QTL approaches relies on the input
data, capturing essential stages of phenotypic variation. In Chapter 3, I used a
high-throughput phenotyping method, the GERMINATOR (Joosen et al. 2010),
that enables fast and standardized scoring of germination for a large number of
seed batches. I also generated omics data to investigate changes at the
metabolome (Chapter 4) and transcriptome levels (Chapter 5) in dry mature
seeds coming from plants grown under different maternal environments. The
large number of mQTLs and eQTLs identified showed that molecular traits can
effectively be used for the molecular dissection of complex traits (Chapter 4, 5).
These new, also called intermediate, phenotypes increase the chance of finding
marker-trait associations, while providing substantial biological insights.
For practical reasons, namely the study at the population level and, thus, the
large number of lines to phenotype, I made the choice of investigating omics
changes in dry mature seeds. Dry mature seeds are the end product of seed
development, thus providing suitable biological material to investigate and
compare changes at the genetic and molecular levels in response to
environmental variation. Apart from these considerations, the choice for dry
mature seeds was supported by the hypothesis that dry seeds are packaged
with all components needed to initiate germination. At the end of seed
development seeds enter a dry and quiescent enzymatic and metabolic state,
accumulating all components (proteins, enzymes, mRNA, metabolites, etc.)
that will support the start of the germination machinery. As a result, I expected
that differences in seed performance could be related to the seed content at
the dry mature state. However, metabolic and transcriptional shifts are also
observed during the course of seed imbibition, germination and seedling
establishment (Silva et al. 2017; Joosen et al. 2013; Rosental et al. 2014).
Therefore, it can be argued that insights into molecular changes occurring at
later stages might be more closely related to differences in seed germination.
In a broader prospect, the development of tools and methods that enable high-
throughput and high-dimensional acquisition and modelling of phenotypic data
160
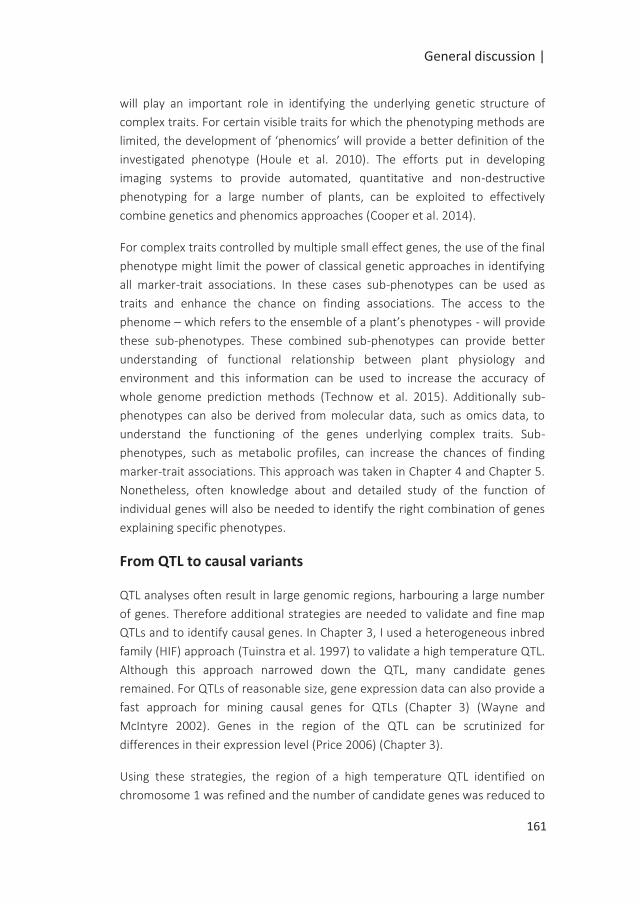
General discussion |
will play an important role in identifying the underlying genetic structure of
complex traits. For certain visible traits for which the phenotyping methods are
limited, the development of ‘phenomics’ will provide a better definition of the
investigated phenotype (Houle et al. 2010). The efforts put in developing
imaging systems to provide automated, quantitative and non-destructive
phenotyping for a large number of plants, can be exploited to effectively
combine genetics and phenomics approaches (Cooper et al. 2014).
For complex traits controlled by multiple small effect genes, the use of the final
phenotype might limit the power of classical genetic approaches in identifying
all marker-trait associations. In these cases sub-phenotypes can be used as
traits and enhance the chance on finding associations. The access to the
phenome – which refers to the ensemble of a plant’s phenotypes - will provide
these sub-phenotypes. These combined sub-phenotypes can provide better
understanding of functional relationship between plant physiology and
environment and this information can be used to increase the accuracy of
whole genome prediction methods (Technow et al. 2015). Additionally sub-
phenotypes can also be derived from molecular data, such as omics data, to
understand the functioning of the genes underlying complex traits. Sub-
phenotypes, such as metabolic profiles, can increase the chances of finding
marker-trait associations. This approach was taken in Chapter 4 and Chapter 5.
Nonetheless, often knowledge about and detailed study of the function of
individual genes will also be needed to identify the right combination of genes
explaining specific phenotypes.
From QTL to causal variants
QTL analyses often result in large genomic regions, harbouring a large number
of genes. Therefore additional strategies are needed to validate and fine map
QTLs and to identify causal genes. In Chapter 3, I used a heterogeneous inbred
family (HIF) approach (Tuinstra et al. 1997) to validate a high temperature QTL.
Although this approach narrowed down the QTL, many candidate genes
remained. For QTLs of reasonable size, gene expression data can also provide a
fast approach for mining causal genes for QTLs (Chapter 3) (Wayne and
McIntyre 2002). Genes in the region of the QTL can be scrutinized for
differences in their expression level (Price 2006) (Chapter 3).
Using these strategies, the region of a high temperature QTL identified on
chromosome 1 was refined and the number of candidate genes was reduced to
161
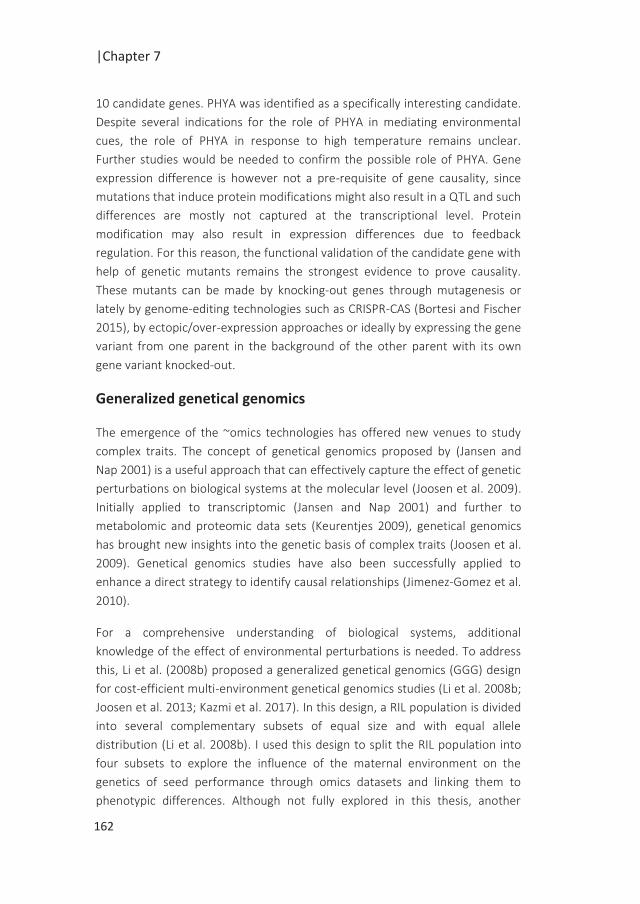
|Chapter 7
10 candidate genes. PHYA was identified as a specifically interesting candidate.
Despite several indications for the role of PHYA in mediating environmental
cues, the role of PHYA in response to high temperature remains unclear.
Further studies would be needed to confirm the possible role of PHYA. Gene
expression difference is however not a pre-requisite of gene causality, since
mutations that induce protein modifications might also result in a QTL and such
differences are mostly not captured at the transcriptional level. Protein
modification may also result in expression differences due to feedback
regulation. For this reason, the functional validation of the candidate gene with
help of genetic mutants remains the strongest evidence to prove causality.
These mutants can be made by knocking-out genes through mutagenesis or
lately by genome-editing technologies such as CRISPR-CAS (Bortesi and Fischer
2015), by ectopic/over-expression approaches or ideally by expressing the gene
variant from one parent in the background of the other parent with its own
gene variant knocked-out.
Generalized genetical genomics
The emergence of the ~omics technologies has offered new venues to study
complex traits. The concept of genetical genomics proposed by (Jansen and
Nap 2001) is a useful approach that can effectively capture the effect of genetic
perturbations on biological systems at the molecular level (Joosen et al. 2009).
Initially applied to transcriptomic (Jansen and Nap 2001) and further to
metabolomic and proteomic data sets (Keurentjes 2009), genetical genomics
has brought new insights into the genetic basis of complex traits (Joosen et al.
2009). Genetical genomics studies have also been successfully applied to
enhance a direct strategy to identify causal relationships (Jimenez-Gomez et al.
2010).
For a comprehensive understanding of biological systems, additional
knowledge of the effect of environmental perturbations is needed. To address
this, Li et al. (2008b) proposed a generalized genetical genomics (GGG) design
for cost-efficient multi-environment genetical genomics studies (Li et al. 2008b;
Joosen et al. 2013; Kazmi et al. 2017). In this design, a RIL population is divided
into several complementary subsets of equal size and with equal allele
distribution (Li et al. 2008b). I used this design to split the RIL population into
four subsets to explore the influence of the maternal environment on the
genetics of seed performance through omics datasets and linking them to
phenotypic differences. Although not fully explored in this thesis, another
162
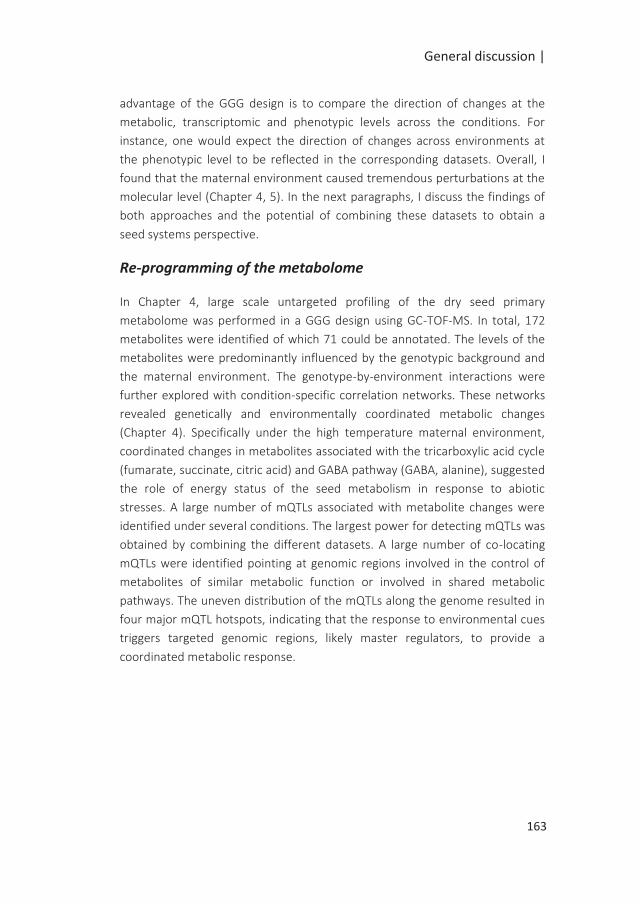
General discussion |
advantage of the GGG design is to compare the direction of changes at the
metabolic, transcriptomic and phenotypic levels across the conditions. For
instance, one would expect the direction of changes across environments at
the phenotypic level to be reflected in the corresponding datasets. Overall, I
found that the maternal environment caused tremendous perturbations at the
molecular level (Chapter 4, 5). In the next paragraphs, I discuss the findings of
both approaches and the potential of combining these datasets to obtain a
seed systems perspective.
Re-programming of the metabolome
In Chapter 4, large scale untargeted profiling of the dry seed primary
metabolome was performed in a GGG design using GC-TOF-MS. In total, 172
metabolites were identified of which 71 could be annotated. The levels of the
metabolites were predominantly influenced by the genotypic background and
the maternal environment. The genotype-by-environment interactions were
further explored with condition-specific correlation networks. These networks
revealed genetically and environmentally coordinated metabolic changes
(Chapter 4). Specifically under the high temperature maternal environment,
coordinated changes in metabolites associated with the tricarboxylic acid cycle
(fumarate, succinate, citric acid) and GABA pathway (GABA, alanine), suggested
the role of energy status of the seed metabolism in response to abiotic
stresses. A large number of mQTLs associated with metabolite changes were
identified under several conditions. The largest power for detecting mQTLs was
obtained by combining the different datasets. A large number of co-locating
mQTLs were identified pointing at genomic regions involved in the control of
metabolites of similar metabolic function or involved in shared metabolic
pathways. The uneven distribution of the mQTLs along the genome resulted in
four major mQTL hotspots, indicating that the response to environmental cues
triggers targeted genomic regions, likely master regulators, to provide a
coordinated metabolic response.
163
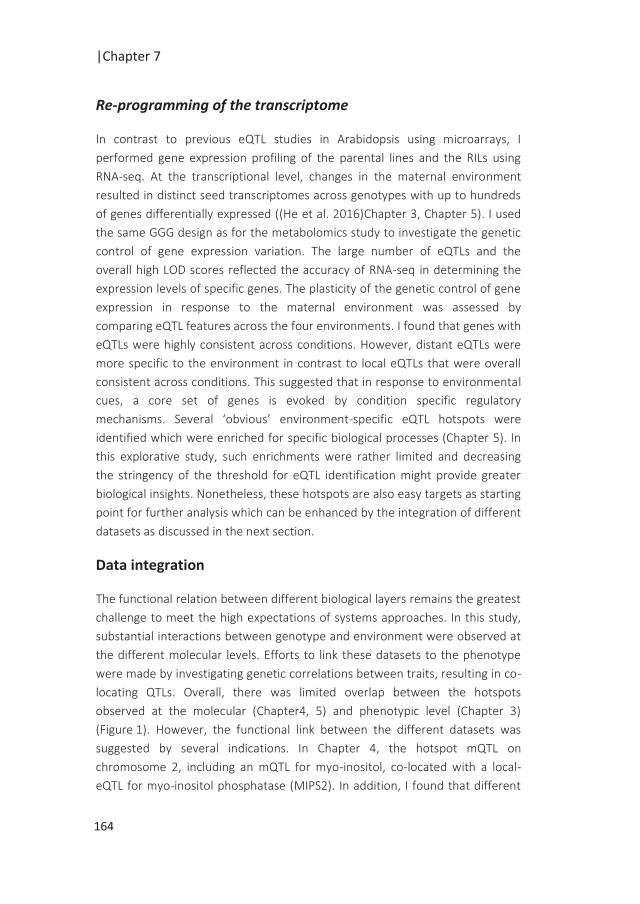
|Chapter 7
Re-programming of the transcriptome
In contrast to previous eQTL studies in Arabidopsis using microarrays, I
performed gene expression profiling of the parental lines and the RILs using
RNA-seq. At the transcriptional level, changes in the maternal environment
resulted in distinct seed transcriptomes across genotypes with up to hundreds
of genes differentially expressed ((He et al. 2016)Chapter 3, Chapter 5). I used
the same GGG design as for the metabolomics study to investigate the genetic
control of gene expression variation. The large number of eQTLs and the
overall high LOD scores reflected the accuracy of RNA-seq in determining the
expression levels of specific genes. The plasticity of the genetic control of gene
expression in response to the maternal environment was assessed by
comparing eQTL features across the four environments. I found that genes with
eQTLs were highly consistent across conditions. However, distant eQTLs were
more specific to the environment in contrast to local eQTLs that were overall
consistent across conditions. This suggested that in response to environmental
cues, a core set of genes is evoked by condition specific regulatory
mechanisms. Several ‘obvious’ environment-specific eQTL hotspots were
identified which were enriched for specific biological processes (Chapter 5). In
this explorative study, such enrichments were rather limited and decreasing
the stringency of the threshold for eQTL identification might provide greater
biological insights. Nonetheless, these hotspots are also easy targets as starting
point for further analysis which can be enhanced by the integration of different
datasets as discussed in the next section.
Data integration
The functional relation between different biological layers remains the greatest
challenge to meet the high expectations of systems approaches. In this study,
substantial interactions between genotype and environment were observed at
the different molecular levels. Efforts to link these datasets to the phenotype
were made by investigating genetic correlations between traits, resulting in co-
locating QTLs. Overall, there was limited overlap between the hotspots
observed at the molecular (Chapter4, 5) and phenotypic level (Chapter 3)
(Figure 1). However, the functional link between the different datasets was
suggested by several indications. In Chapter 4, the hotspot mQTL on
chromosome 2, including an mQTL for myo-inositol, co-located with a local-
eQTL for myo-inositol phosphatase (MIPS2). In addition, I found that different
164
General discussion |
sets of metabolites were significantly correlated with seed phenotypic traits in
response the different maternal environments. In Chapter 5, changes in eQTL
profiles under HT were observed for genes involved in the TCA cycle, which
coincided with a metabolic shift for the same pathway under the same
conditions (Chapter 4). Data mining remains an arduous task and therefore
there is an evident need for tools to assist this endeavour. During my PhD, the
AraQTL workbench was developed which provides a user-friendly interface for
the navigation through the integrated datasets (Nijveen et al. 2017). The
development of statistical methods will enhance the integration of large-scale
biological data sets into relevant biological networks that will eventually lead to
new biological insights (Chapter 6).
An instrumental tool for these gene discovery approaches is the availability of
prior information. In Chapters 3, 4 and 5, available gene annotation was used
to identify candidate genes from transcriptomic to metabolomics and allowed
the identification of over-represented gene ontology terms and metabolic
pathways. In this direction, further efforts to increase metabolite annotation
will contribute to a better representation of underlying metabolic networks.
Years of research on Arabidopsis have provided comprehensive gene
annotation information that can be investigated by identifying correlation
across the omics data types. This will certainly uncover many more links
between the different biological levels (Figure 1). In the last decades, the
unprecedented growth in type, size and complexity of the biological datasets
has brought along new challenges for data integration. Adjustments to this
data overload require the development of advanced data integration methods,
to tackle the complexity and high dimensionality of the multi-level and multi-
environment datasets (Chapter 6). Multivariate analyses are now accessible
and open the way towards omics data integration (Rohart et al. 2017).
165
|Chapter 7
Figure 1. Heatmap representing the frequency of QTLs identified along the genome for the
different biological levels and under the different conditions, ST: standard, HT: high temperature,
HL: high light, LP: low phosphate. The five vertical blocks represent the five Arabidopsis
chromosomes. The three horizontal blocks represent eQTLs, mQTLs and phenotypic QTLs
respectively.
Further considerations
Transcript and metabolite accumulation, investigated in this thesis, are not the
only regulatory levels affecting the phenotype of an individual. The vast field of
omics can be further explored and the combined use of structural genomic,
proteomic, translatomics and epigenetic analyses is expected to be required to
gain a full understanding of causes of phenotypic variation. To gain a better
understanding of the mechanisms responsible for seed performance, the
different regulatory levels that lead to the phenotype need to be assessed by
integrating these ‘omics’ approaches.
Fine-tuning environmental cues
The response to the maternal environment can be spatially and temporally
resolved. In this study, we investigated the effect of the maternal environment
in dry mature seeds, reflecting changes that occurred during seed development
in response to environmental cues. It would be interesting to dissect these
effects, by applying the stress at different stages of seed development, to
identify the most sensitive stages or to investigate changes in the metabolome
and transcriptome during seed development. Additionally, since seeds are
composed of several tissues, including maternal tissues, identifying the
sensitivity of the separate tissues to environmental cues would provide deeper
insight into the nature of the response. This approach can also be done at the
cellular level. A recent study used reporter constructs and a digital single-cell
atlas of the Arabidopsis embryonic radicle to investigate the spatial distribution
of hormone responsive components in response to temperature variation
(Topham et al. 2017).
166
General discussion |
Leveraging the power of RNA-seq data
To take a step further in the understanding of the molecular regulation of
complex traits, it would be interesting to further exploit the potential of the
generated RNA-seq data. The sensitivity of the RNA-seq technology for gene
expression quantification provides the advantage to distinguish known as well
as new splicing forms and thus provide insights into the effect of the maternal
environment on alternative splicing events. The splicing machinery contributes
to the re-arrangement of introns and exons creating the opportunity for the
mRNA transcripts to be translated into different proteins. In Arabidopsis,
alternative splicing is widespread with 42% up to 61% of intron containing
genes exhibiting alternative splice isoforms (Filichkin et al. 2010; Reddy et al.
2013; Laloum et al. 2018). These splicing events represent an important post-
transcriptional regulatory mechanism in response to different environmental
conditions (Laloum et al. 2018). In seeds, several splicing forms for genes
involved in developmental processes have been reported. For instance, the two
variants of PIF6 expressed during seed development showed opposite effects
on the regulation of seed dormancy (Penfield et al. 2010). I expect that changes
in splicing machinery would also occur in seeds in a genotype-by-environment
fashion.
Another application of RNA-seq is the study of allele-specific expression (ASE).
ASE uses fully heterozygous F1 background to assess the differential transcript
abundance in an allelic specific manner. In an eQTL approach, the local or
distant type of regulation of the eQTL is estimated based on genomic distance
of the detected eQTL with the physical position of the gene, while ASE can
reveal true cis eQTLs. Several studies have reported little overlap between ASE
and local eQTLs, suggesting that local eQTLs might actually often be local trans-
acting eQTLs (Hasin-Brumshtein et al. 2014). The differences between the two
types of eQTL approaches might thus facilitate sorting local eQTLs into true cis
and trans eQTLs. During my PhD study, RNA-seq data for F1 Sha x Bay-0 seed
embryos were generated and further efforts are needed to compare the ASE
and eQTL results.
RNA-seq can also be used to study long non coding RNAs (lncRNAs). These
lncRNAs have gained attention in the last years as a potential new layer of
biological regulation. This class of transcripts has been suggested to play a role
as regulator of transcriptional control in response to stress (Nejat and Mantri
2018). This was recently demonstrated by a study showing that the regulation
167
|Chapter 7
of seed dormancy by FLC in response to temperature occurs through the action
the FLC antisense lncRNA COOLAIR (Chen and Penfield 2018). Further
investigations will contribute to our understanding of the range of actions of
these lncRNAs.
Post-transcriptional regulation
Some seed mRNAs produced during seed development are stored in the dry
seed. Upon seed imbibition, the stored mRNAs undergo translation. The
importance of these mRNA has been demonstrated by the indispensable
commitment of translation, while transcription can be inhibited without
affecting germination (Rajjou et al. 2004). Since gene expression can be
regulated at the point of mRNA translation, it would also be interesting to
investigate the dynamics of the ‘translational status’ of the transcriptome in
response to the different maternal environments. Translatomics studies exploit
genome-wide polysome occupancy on the mRNA as an indicator of mRNA
translation. In seeds, extensive translational dynamics has been observed
during seed imbibition and seed germination in Arabidopsis (Bai et al. 2017)
indicating another layer of regulation in respect to seed performance. Further
insights could be gained from proteomics studies and in this respect it would
be interesting to investigate changes at the proteome level. However,
proteomic studies remain scarce because of the limited output and technical
limitations as compared to the metabolomic and transcriptomic approaches.
Using big data approaches, methods are being developed to predict protein
structure (Soeding 2017). Protein structure often determines its function. Thus,
the information derived from predicted protein structure could in turn be used
for proteomic QTL mapping and complete the picture together with eQTL,
mQTL and in the future maybe translatomics QTL data.
168
General discussion |
Epigenetic regulation
The role of epigenetics in the regulation of phenotypic plasticity is attractive,
since epigenetic modifications are more versatile than DNA sequence variation
and thus also reversible (Kooke et al. 2015). It is known that epigenetic
regulation proceeds during the seed life span (Wollmann and Berger 2012). In
plants, more than 130 gene encoding proteins involved in epigenetic regulation
have been identified (Pikaard and Mittelsten Scheid 2014). In this study, many
of these genes (~50%) were found differentially expressed in the dry seeds of
the parental lines, Bay-0 and Sha, grown in the different environments. This
indicates that epigenetic regulation is also likely to take place in mediating
environmental cues. It would thus be interesting to pursue investigations in the
direction of the effect of environmental signals perceived during seed
maturation on epigenetic mechanisms.
From model to crop
An instrumental tool for gene discovery approaches is the availability of prior
information which facilitates the validation of the findings. In chapter 3, 4 and
5, gene annotation enabled the identification of candidate genes and allowed
the identification of over-represented gene ontology terms and metabolic
pathways. In this direction, further efforts on increasing metabolite annotation
will contribute to a better representation of underlying metabolic networks.
Years of research on Arabidopsis have provided comprehensive gene
annotation information which can be queried through several databases, such
as TAIR. This provides a clear advantage for using Arabidopsis as a model for
proof-of-concept approaches. Nonetheless, the increasing availability of
sequenced genomes and other resources for other species will enlarge their
toolbox. Genetical ~omics approaches have most often been applied to model
species for which the availability of molecular and genetic data facilitates the
approach and the validation of the findings (Rowe et al. 2008; Keurentjes et al.
2006; Morreel et al. 2006; Keurentjes et al. 2007b; Terpstra et al. 2010).
However, this approach is not limited to model species and has also been
applied in several economically important species as, among others (Joosen et
al. 2009), melon (Galpaz et al. 2018) and lettuce (Harper et al. 2012).
Undeniably, the increasing power of next generation sequencing will unlock
genomic sequence information for a large number of species and increase
regulatory insights gained from identification of local and distant eQTLs.
169
|Chapter 7
Making sense of the data at the system level remains however largely driven by
prior knowledge and thus validation of the findings through physiological and
wet lab experiments remains essential.
Concluding remarks
In this thesis, I showed that the maternal environment plays an important role
in modulating the genetic basis of seed performance. The combination of
genetic and omics approaches provided insight into changes at the molecular
level. The different datasets generated provide a basis for many opportunities
for further research. The influence of the maternal environment is largely
acknowledged, although limited studies have identified the mechanisms
mediating these effects. The integration of the data generated in this thesis will
provide deeper insights of the molecular networks underlying seed phenotypic
plasticity. The last section of the discussion suggests also lines of research as
follow-up of this work to ultimately lead to a comprehensive understanding of
molecular mechanisms, the function of the genes and their biological role in
the control of seed quality aspects.
170

References
| References
Albert E, Gricourt J, Bertin N, Bonnefoi J, Pateyron S, Tamby JP, Bitton F, Causse M (2016) Genotype by watering regime interaction in cultivated tomato: lessons from linkage mapping and gene expression. TAG Theoretical and applied genetics Theoretische und angewandte Genetik 129 (2):395-418. doi:10.1007/s00122-015-2635-5
Albert R (2005) Scale-free networks in cell biology. Journal of Cell Science 118:4947-4957. doi:10.1242/jcs.02714
Alberts R, Terpstra P, Li Y, Breitling R, Nap JP, Jansen RC (2007) Sequence polymorphisms cause many false cis eQTLs. PloS one 2 (7):e622. doi:10.1371/journal.pone.0000622
Alon U (2007) Network motifs: theory and experimental approaches. Nat Rev Genet 8 (6):450-461. doi:10.1038/nrg2102
Alonso-Blanco C, Andrade J, Becker C, Bemm F, Bergelson J, Borgwardt KM, Cao J, Chae E, Dezwaan TM, Ding W, Ecker JR, Exposito-Alonso M, Farlow A, Fitz J, Gan X, Grimm DG, Hancock AM, Henz SR, Holm S, Horton M, Jarsulic M, Kerstetter RA, Korte A, Korte P, Lanz C, Lee C-R, Meng D, Michael TP, Mott R, Muliyati NW, Nägele T, Nagler M, Nizhynska V, Nordborg M, Novikova PY, Picó FX, Platzer A, Rabanal FA, Rodriguez A, Rowan BA, Salomé PA, Schmid KJ, Schmitz RJ, Seren Ü, Sperone FG, Sudkamp M, Svardal H, Tanzer MM, Todd D, Volchenboum SL, Wang C, Wang G, Wang X, Weckwerth W, Weigel D, Zhou X (2016) 1,135 Genomes Reveal the Global Pattern of Polymorphism in Arabidopsis thaliana. Cell 166 (2):481-491. doi:10.1016/j.cell.2016.05.063
Alonso-Blanco C, Koornneef M (2003) Naturally occuring variation in Arabidopsis: an underexploited resource for plant genetics. Trends in plant science 5 (1)
Alonso-Blanco C, Mendez-Vigo B (2014) Genetic architecture of naturally occurring quantitative traits in plants: an updated synthesis. Curr Opin Plant Biol 18:37-43. doi:10.1016/j.pbi.2014.01.002
Analysis of the genome sequence of the flowering plant Arabidopsis thaliana (2000). 408 (6814):796-815
Angelovici R, Batushansky A, Deason N, Gonzalez-Jorge S, Gore MA, Fait A, DellaPenna D (2017) Network-Guided GWAS Improves Identification of Genes Affecting Free Amino Acids. Plant physiology 173 (1):872-886. doi:10.1104/pp.16.01287
Angelovici R, Fait A, Zhu X, Szymanski J, Feldmesser E, Fernie AR, Galili G (2009) Deciphering transcriptional and metabolic networks associated with lysine metabolism during Arabidopsis seed development. Plant physiology 151 (4):2058-2072. doi:10.1104/pp.109.145631
Angelovici R, Galili G, Fernie AR, Fait A (2010) Seed desiccation: a bridge between maturation and germination. Trends in plant science 15 (4):211-218. doi:10.1016/j.tplants.2010.01.003
Angelovici R, Lipka AE, Deason N, Gonzalez-Jorge S, Lin H, Cepela J, Buell R, Gore MA, Dellapenna D (2013) Genome-wide analysis of branched-chain amino acid levels in Arabidopsis seeds. The Plant cell 25 (12):4827-4843. doi:10.1105/tpc.113.119370
Aoki K, Ogata Y, Shibata D (2007) Approaches for extracting practical information from gene co-expression networks in plant biology. Plant & cell physiology 48 (3):381-390. doi:10.1093/pcp/pcm013
172
References |
Araujo WL, Nunes-Nesi A, Nikoloski Z, Sweetlove LJ, Fernie AR (2012) Metabolic control and regulation of the tricarboxylic acid cycle in photosynthetic and heterotrophic plant tissues. Plant, cell & environment 35 (1):1-21. doi:10.1111/j.1365-3040.2011.02332.x
Arc E, Chibani K, Grappin P, Jullien M, Godin B, Cueff G, Valot B, Balliau T, Job D, Rajjou L (2012) Cold stratification and exogenous nitrates entail similar functional proteome adjustments during Arabidopsis seed dormancy release. Journal of proteome research 11 (11):5418-5432. doi:10.1021/pr3006815
Arends D, Prins P, Jansen RC, Broman KW (2010) R/qtl: high-throughput multiple QTL mapping. Bioinformatics 26 (23):2990-2992. doi:10.1093/bioinformatics/btq565
Ashburner M, Ball CA, Blake JA, Bolstein D, Butler H, Cherry JM, David AP, Dolinski K, Dwight SS, Eppig JT, Harris MA, Hill DP, Issel-Tarver L, Kasarskis A, Lewis S, Matese JC, Richardson JE, Ringwald M, Rubin GM, Sherlock G (2000) Gene ontology: tool for unification of biology. Nature genetics 25
Asimit J, Zeggini E (2010) Rare variant association analysis methods for complex traits. Annual review of genetics 44:293-308. doi:10.1146/annurev-genet-102209-163421
Atias O, Chor B, Chamovitz DA (2009) Large-scale analysis of Arabidopsis transcription reveals a basal co-regulation network. BMC Syst Biol 3:86. doi:10.1186/1752-0509-3-86
Atwell S, Huang YS, Vilhjalmsson BJ, Willems G, Horton M, Li Y, Meng D, Platt A, Tarone AM, Hu TT, Jiang R, Muliyati NW, Zhang X, Amer MA, Baxter I, Brachi B, Chory J, Dean C, Debieu M, de Meaux J, Ecker JR, Faure N, Kniskern JM, Jones JD, Michael T, Nemri A, Roux F, Salt DE, Tang C, Todesco M, Traw MB, Weigel D, Marjoram P, Borevitz JO, Bergelson J, Nordborg M (2010) Genome-wide association study of 107 phenotypes in Arabidopsis thaliana inbred lines. Nature 465 (7298):627-631. doi:10.1038/nature08800
Aya K, Suzuki G, Suwabe K, Hobo T, Takahashi H, Shiono K, Yano K, Tsutsumi N, Nakazono M, Nagamura Y, Matsuoka M, Watanabe M (2011) Comprehensive Network Analysis of Anther-Expressed Genes in Rice by the Combination of 33 Laser Microdissection and 143 Spatiotemporal Microarrays. PloS one 6 (10):e26162. doi:10.1371/journal.pone.0026162
Aylor DL, Valdar W, Foulds-Mathes W, Buus RJ, Verdugo RA, Baric RS, Ferris MT, Frelinger JA, Heise M, Frieman MB, Gralinski LE, Bell TA, Didion JD, Hua K, Nehrenberg DL, Powell CL, Steigerwalt J, Xie Y, Kelada SN, Collins FS, Yang IV, Schwartz DA, Branstetter LA, Chesler EJ, Miller DR, Spence J, Liu EY, McMillan L, Sarkar A, Wang J, Wang W, Zhang Q, Broman KW, Korstanje R, Durrant C, Mott R, Iraqi FA, Pomp D, Threadgill D, de Villena FP, Churchill GA (2011) Genetic analysis of complex traits in the emerging Collaborative Cross. Genome research 21 (8):1213-1222. doi:10.1101/gr.111310.110
Bac-Molenaar JA, Fradin EF, Becker FF, Rienstra JA, van der Schoot J, Vreugdenhil D, Keurentjes JJ (2015) Genome-Wide Association Mapping of Fertility Reduction upon Heat Stress Reveals Developmental Stage-Specific QTLs in Arabidopsis thaliana. The Plant cell 27 (7):1857-1874. doi:10.1105/tpc.15.00248
Bai B, Peviani A, van der Horst S, Gamm M, Snel B, Bentsink L, Hanson J (2017) Extensive translational regulation during seed germination revealed by
173
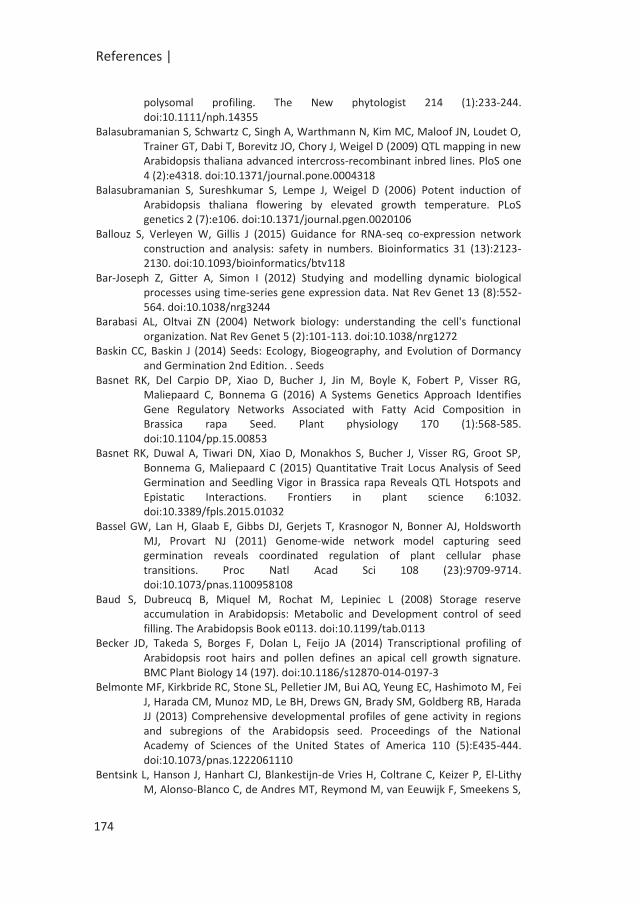
References |
polysomal profiling. The New phytologist 214 (1):233-244. doi:10.1111/nph.14355
Balasubramanian S, Schwartz C, Singh A, Warthmann N, Kim MC, Maloof JN, Loudet O, Trainer GT, Dabi T, Borevitz JO, Chory J, Weigel D (2009) QTL mapping in new Arabidopsis thaliana advanced intercross-recombinant inbred lines. PloS one 4 (2):e4318. doi:10.1371/journal.pone.0004318
Balasubramanian S, Sureshkumar S, Lempe J, Weigel D (2006) Potent induction of Arabidopsis thaliana flowering by elevated growth temperature. PLoS genetics 2 (7):e106. doi:10.1371/journal.pgen.0020106
Ballouz S, Verleyen W, Gillis J (2015) Guidance for RNA-seq co-expression network construction and analysis: safety in numbers. Bioinformatics 31 (13):2123-2130. doi:10.1093/bioinformatics/btv118
Bar-Joseph Z, Gitter A, Simon I (2012) Studying and modelling dynamic biological processes using time-series gene expression data. Nat Rev Genet 13 (8):552-564. doi:10.1038/nrg3244
Barabasi AL, Oltvai ZN (2004) Network biology: understanding the cell's functional organization. Nat Rev Genet 5 (2):101-113. doi:10.1038/nrg1272
Baskin CC, Baskin J (2014) Seeds: Ecology, Biogeography, and Evolution of Dormancy and Germination 2nd Edition. . Seeds
Basnet RK, Del Carpio DP, Xiao D, Bucher J, Jin M, Boyle K, Fobert P, Visser RG, Maliepaard C, Bonnema G (2016) A Systems Genetics Approach Identifies Gene Regulatory Networks Associated with Fatty Acid Composition in Brassica rapa Seed. Plant physiology 170 (1):568-585. doi:10.1104/pp.15.00853
Basnet RK, Duwal A, Tiwari DN, Xiao D, Monakhos S, Bucher J, Visser RG, Groot SP, Bonnema G, Maliepaard C (2015) Quantitative Trait Locus Analysis of Seed Germination and Seedling Vigor in Brassica rapa Reveals QTL Hotspots and Epistatic Interactions. Frontiers in plant science 6:1032. doi:10.3389/fpls.2015.01032
Bassel GW, Lan H, Glaab E, Gibbs DJ, Gerjets T, Krasnogor N, Bonner AJ, Holdsworth MJ, Provart NJ (2011) Genome-wide network model capturing seed germination reveals coordinated regulation of plant cellular phase transitions. Proc Natl Acad Sci 108 (23):9709-9714. doi:10.1073/pnas.1100958108
Baud S, Dubreucq B, Miquel M, Rochat M, Lepiniec L (2008) Storage reserve accumulation in Arabidopsis: Metabolic and Development control of seed filling. The Arabidopsis Book e0113. doi:10.1199/tab.0113
Becker JD, Takeda S, Borges F, Dolan L, Feijo JA (2014) Transcriptional profiling of Arabidopsis root hairs and pollen defines an apical cell growth signature. BMC Plant Biology 14 (197). doi:10.1186/s12870-014-0197-3
Belmonte MF, Kirkbride RC, Stone SL, Pelletier JM, Bui AQ, Yeung EC, Hashimoto M, Fei J, Harada CM, Munoz MD, Le BH, Drews GN, Brady SM, Goldberg RB, Harada JJ (2013) Comprehensive developmental profiles of gene activity in regions and subregions of the Arabidopsis seed. Proceedings of the National Academy of Sciences of the United States of America 110 (5):E435-444. doi:10.1073/pnas.1222061110
Bentsink L, Hanson J, Hanhart CJ, Blankestijn-de Vries H, Coltrane C, Keizer P, El-Lithy M, Alonso-Blanco C, de Andres MT, Reymond M, van Eeuwijk F, Smeekens S,
174
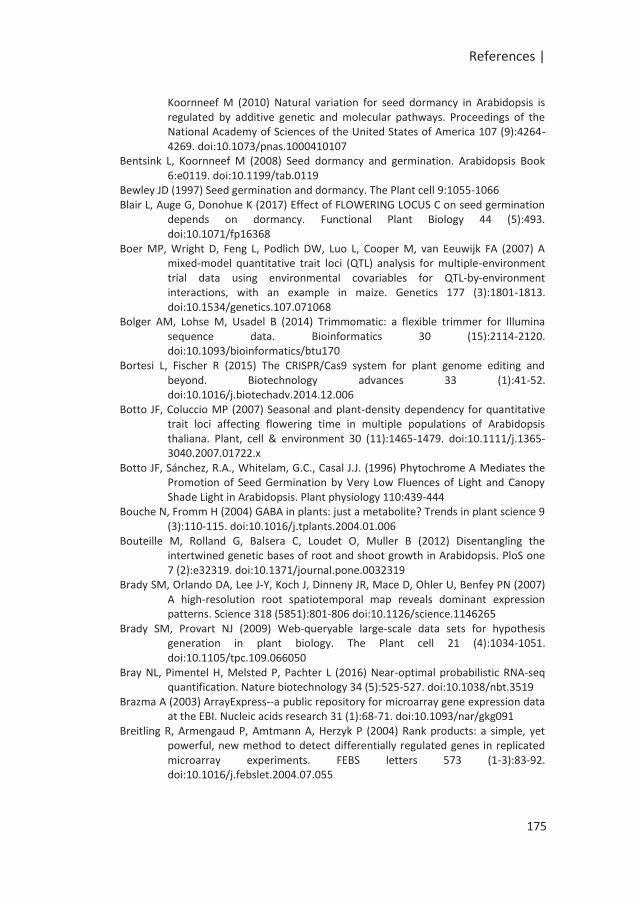
References |
Koornneef M (2010) Natural variation for seed dormancy in Arabidopsis is regulated by additive genetic and molecular pathways. Proceedings of the National Academy of Sciences of the United States of America 107 (9):4264-4269. doi:10.1073/pnas.1000410107
Bentsink L, Koornneef M (2008) Seed dormancy and germination. Arabidopsis Book 6:e0119. doi:10.1199/tab.0119
Bewley JD (1997) Seed germination and dormancy. The Plant cell 9:1055-1066 Blair L, Auge G, Donohue K (2017) Effect of FLOWERING LOCUS C on seed germination
depends on dormancy. Functional Plant Biology 44 (5):493. doi:10.1071/fp16368
Boer MP, Wright D, Feng L, Podlich DW, Luo L, Cooper M, van Eeuwijk FA (2007) A mixed-model quantitative trait loci (QTL) analysis for multiple-environment trial data using environmental covariables for QTL-by-environment interactions, with an example in maize. Genetics 177 (3):1801-1813. doi:10.1534/genetics.107.071068
Bolger AM, Lohse M, Usadel B (2014) Trimmomatic: a flexible trimmer for Illumina sequence data. Bioinformatics 30 (15):2114-2120. doi:10.1093/bioinformatics/btu170
Bortesi L, Fischer R (2015) The CRISPR/Cas9 system for plant genome editing and beyond. Biotechnology advances 33 (1):41-52. doi:10.1016/j.biotechadv.2014.12.006
Botto JF, Coluccio MP (2007) Seasonal and plant-density dependency for quantitative trait loci affecting flowering time in multiple populations of Arabidopsis thaliana. Plant, cell & environment 30 (11):1465-1479. doi:10.1111/j.1365-3040.2007.01722.x
Botto JF, Sánchez, R.A., Whitelam, G.C., Casal J.J. (1996) Phytochrome A Mediates the Promotion of Seed Germination by Very Low Fluences of Light and Canopy Shade Light in Arabidopsis. Plant physiology 110:439-444
Bouche N, Fromm H (2004) GABA in plants: just a metabolite? Trends in plant science 9 (3):110-115. doi:10.1016/j.tplants.2004.01.006
Bouteille M, Rolland G, Balsera C, Loudet O, Muller B (2012) Disentangling the intertwined genetic bases of root and shoot growth in Arabidopsis. PloS one 7 (2):e32319. doi:10.1371/journal.pone.0032319
Brady SM, Orlando DA, Lee J-Y, Koch J, Dinneny JR, Mace D, Ohler U, Benfey PN (2007) A high-resolution root spatiotemporal map reveals dominant expression patterns. Science 318 (5851):801-806 doi:10.1126/science.1146265
Brady SM, Provart NJ (2009) Web-queryable large-scale data sets for hypothesis generation in plant biology. The Plant cell 21 (4):1034-1051. doi:10.1105/tpc.109.066050
Bray NL, Pimentel H, Melsted P, Pachter L (2016) Near-optimal probabilistic RNA-seq quantification. Nature biotechnology 34 (5):525-527. doi:10.1038/nbt.3519
Brazma A (2003) ArrayExpress--a public repository for microarray gene expression data at the EBI. Nucleic acids research 31 (1):68-71. doi:10.1093/nar/gkg091
Breitling R, Armengaud P, Amtmann A, Herzyk P (2004) Rank products: a simple, yet powerful, new method to detect differentially regulated genes in replicated microarray experiments. FEBS letters 573 (1-3):83-92. doi:10.1016/j.febslet.2004.07.055
175
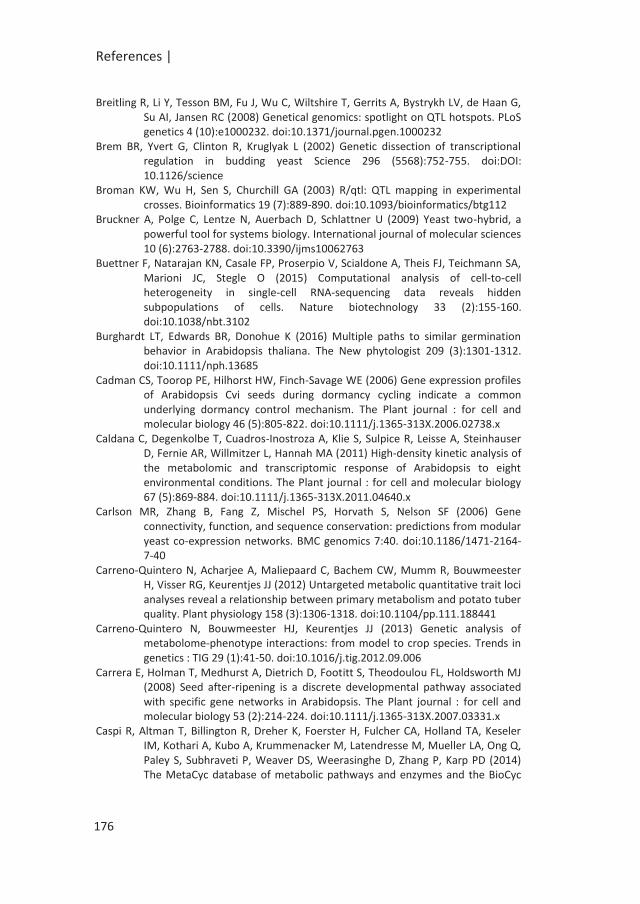
References |
Breitling R, Li Y, Tesson BM, Fu J, Wu C, Wiltshire T, Gerrits A, Bystrykh LV, de Haan G, Su AI, Jansen RC (2008) Genetical genomics: spotlight on QTL hotspots. PLoS genetics 4 (10):e1000232. doi:10.1371/journal.pgen.1000232
Brem BR, Yvert G, Clinton R, Kruglyak L (2002) Genetic dissection of transcriptional regulation in budding yeast Science 296 (5568):752-755. doi:DOI: 10.1126/science
Broman KW, Wu H, Sen S, Churchill GA (2003) R/qtl: QTL mapping in experimental crosses. Bioinformatics 19 (7):889-890. doi:10.1093/bioinformatics/btg112
Bruckner A, Polge C, Lentze N, Auerbach D, Schlattner U (2009) Yeast two-hybrid, a powerful tool for systems biology. International journal of molecular sciences 10 (6):2763-2788. doi:10.3390/ijms10062763
Buettner F, Natarajan KN, Casale FP, Proserpio V, Scialdone A, Theis FJ, Teichmann SA, Marioni JC, Stegle O (2015) Computational analysis of cell-to-cell heterogeneity in single-cell RNA-sequencing data reveals hidden subpopulations of cells. Nature biotechnology 33 (2):155-160. doi:10.1038/nbt.3102
Burghardt LT, Edwards BR, Donohue K (2016) Multiple paths to similar germination behavior in Arabidopsis thaliana. The New phytologist 209 (3):1301-1312. doi:10.1111/nph.13685
Cadman CS, Toorop PE, Hilhorst HW, Finch-Savage WE (2006) Gene expression profiles of Arabidopsis Cvi seeds during dormancy cycling indicate a common underlying dormancy control mechanism. The Plant journal : for cell and molecular biology 46 (5):805-822. doi:10.1111/j.1365-313X.2006.02738.x
Caldana C, Degenkolbe T, Cuadros-Inostroza A, Klie S, Sulpice R, Leisse A, Steinhauser D, Fernie AR, Willmitzer L, Hannah MA (2011) High-density kinetic analysis of the metabolomic and transcriptomic response of Arabidopsis to eight environmental conditions. The Plant journal : for cell and molecular biology 67 (5):869-884. doi:10.1111/j.1365-313X.2011.04640.x
Carlson MR, Zhang B, Fang Z, Mischel PS, Horvath S, Nelson SF (2006) Gene connectivity, function, and sequence conservation: predictions from modular yeast co-expression networks. BMC genomics 7:40. doi:10.1186/1471-2164-7-40
Carreno-Quintero N, Acharjee A, Maliepaard C, Bachem CW, Mumm R, Bouwmeester H, Visser RG, Keurentjes JJ (2012) Untargeted metabolic quantitative trait loci analyses reveal a relationship between primary metabolism and potato tuber quality. Plant physiology 158 (3):1306-1318. doi:10.1104/pp.111.188441
Carreno-Quintero N, Bouwmeester HJ, Keurentjes JJ (2013) Genetic analysis of metabolome-phenotype interactions: from model to crop species. Trends in genetics : TIG 29 (1):41-50. doi:10.1016/j.tig.2012.09.006
Carrera E, Holman T, Medhurst A, Dietrich D, Footitt S, Theodoulou FL, Holdsworth MJ (2008) Seed after-ripening is a discrete developmental pathway associated with specific gene networks in Arabidopsis. The Plant journal : for cell and molecular biology 53 (2):214-224. doi:10.1111/j.1365-313X.2007.03331.x
Caspi R, Altman T, Billington R, Dreher K, Foerster H, Fulcher CA, Holland TA, Keseler IM, Kothari A, Kubo A, Krummenacker M, Latendresse M, Mueller LA, Ong Q, Paley S, Subhraveti P, Weaver DS, Weerasinghe D, Zhang P, Karp PD (2014) The MetaCyc database of metabolic pathways and enzymes and the BioCyc
176
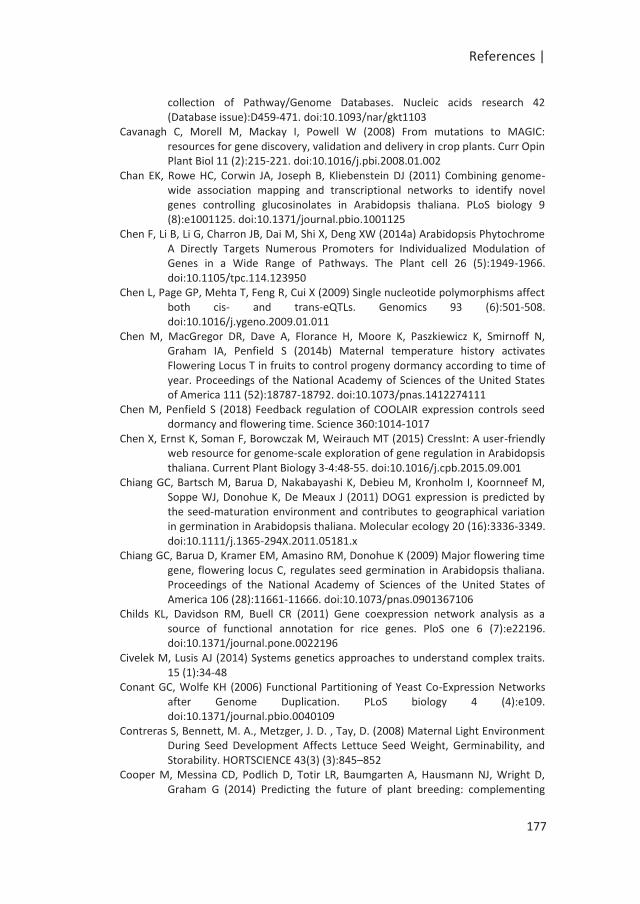
References |
collection of Pathway/Genome Databases. Nucleic acids research 42 (Database issue):D459-471. doi:10.1093/nar/gkt1103
Cavanagh C, Morell M, Mackay I, Powell W (2008) From mutations to MAGIC: resources for gene discovery, validation and delivery in crop plants. Curr Opin Plant Biol 11 (2):215-221. doi:10.1016/j.pbi.2008.01.002
Chan EK, Rowe HC, Corwin JA, Joseph B, Kliebenstein DJ (2011) Combining genome-wide association mapping and transcriptional networks to identify novel genes controlling glucosinolates in Arabidopsis thaliana. PLoS biology 9 (8):e1001125. doi:10.1371/journal.pbio.1001125
Chen F, Li B, Li G, Charron JB, Dai M, Shi X, Deng XW (2014a) Arabidopsis Phytochrome A Directly Targets Numerous Promoters for Individualized Modulation of Genes in a Wide Range of Pathways. The Plant cell 26 (5):1949-1966. doi:10.1105/tpc.114.123950
Chen L, Page GP, Mehta T, Feng R, Cui X (2009) Single nucleotide polymorphisms affect both cis- and trans-eQTLs. Genomics 93 (6):501-508. doi:10.1016/j.ygeno.2009.01.011
Chen M, MacGregor DR, Dave A, Florance H, Moore K, Paszkiewicz K, Smirnoff N, Graham IA, Penfield S (2014b) Maternal temperature history activates Flowering Locus T in fruits to control progeny dormancy according to time of year. Proceedings of the National Academy of Sciences of the United States of America 111 (52):18787-18792. doi:10.1073/pnas.1412274111
Chen M, Penfield S (2018) Feedback regulation of COOLAIR expression controls seed dormancy and flowering time. Science 360:1014-1017
Chen X, Ernst K, Soman F, Borowczak M, Weirauch MT (2015) CressInt: A user-friendly web resource for genome-scale exploration of gene regulation in Arabidopsis thaliana. Current Plant Biology 3-4:48-55. doi:10.1016/j.cpb.2015.09.001
Chiang GC, Bartsch M, Barua D, Nakabayashi K, Debieu M, Kronholm I, Koornneef M, Soppe WJ, Donohue K, De Meaux J (2011) DOG1 expression is predicted by the seed-maturation environment and contributes to geographical variation in germination in Arabidopsis thaliana. Molecular ecology 20 (16):3336-3349. doi:10.1111/j.1365-294X.2011.05181.x
Chiang GC, Barua D, Kramer EM, Amasino RM, Donohue K (2009) Major flowering time gene, flowering locus C, regulates seed germination in Arabidopsis thaliana. Proceedings of the National Academy of Sciences of the United States of America 106 (28):11661-11666. doi:10.1073/pnas.0901367106
Childs KL, Davidson RM, Buell CR (2011) Gene coexpression network analysis as a source of functional annotation for rice genes. PloS one 6 (7):e22196. doi:10.1371/journal.pone.0022196
Civelek M, Lusis AJ (2014) Systems genetics approaches to understand complex traits. 15 (1):34-48
Conant GC, Wolfe KH (2006) Functional Partitioning of Yeast Co-Expression Networks after Genome Duplication. PLoS biology 4 (4):e109. doi:10.1371/journal.pbio.0040109
Contreras S, Bennett, M. A., Metzger, J. D. , Tay, D. (2008) Maternal Light Environment During Seed Development Affects Lettuce Seed Weight, Germinability, and Storability. HORTSCIENCE 43(3) (3):845–852
Cooper M, Messina CD, Podlich D, Totir LR, Baumgarten A, Hausmann NJ, Wright D, Graham G (2014) Predicting the future of plant breeding: complementing
177
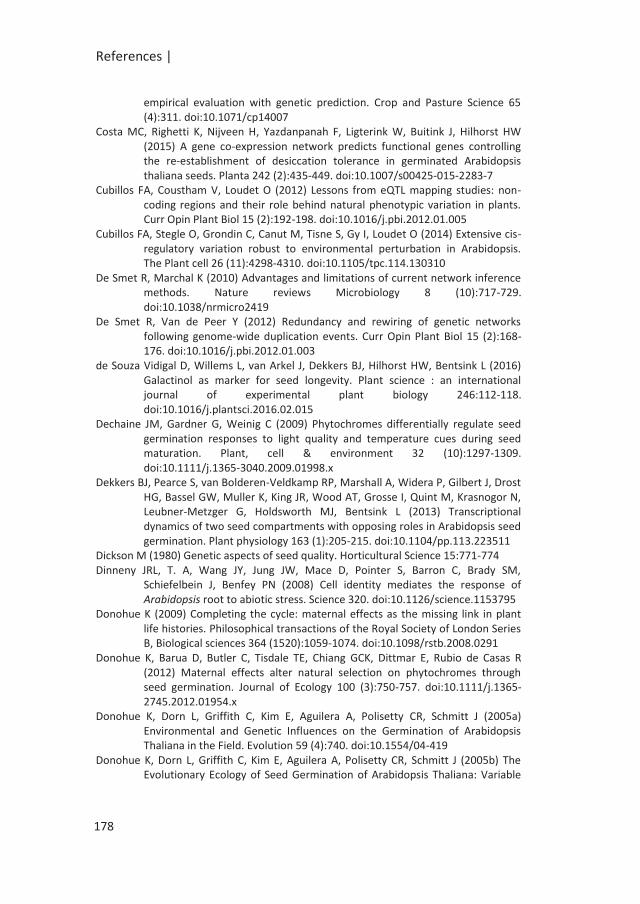
References |
empirical evaluation with genetic prediction. Crop and Pasture Science 65 (4):311. doi:10.1071/cp14007
Costa MC, Righetti K, Nijveen H, Yazdanpanah F, Ligterink W, Buitink J, Hilhorst HW (2015) A gene co-expression network predicts functional genes controlling the re-establishment of desiccation tolerance in germinated Arabidopsis thaliana seeds. Planta 242 (2):435-449. doi:10.1007/s00425-015-2283-7
Cubillos FA, Coustham V, Loudet O (2012) Lessons from eQTL mapping studies: non-coding regions and their role behind natural phenotypic variation in plants. Curr Opin Plant Biol 15 (2):192-198. doi:10.1016/j.pbi.2012.01.005
Cubillos FA, Stegle O, Grondin C, Canut M, Tisne S, Gy I, Loudet O (2014) Extensive cis-regulatory variation robust to environmental perturbation in Arabidopsis. The Plant cell 26 (11):4298-4310. doi:10.1105/tpc.114.130310
De Smet R, Marchal K (2010) Advantages and limitations of current network inference methods. Nature reviews Microbiology 8 (10):717-729. doi:10.1038/nrmicro2419
De Smet R, Van de Peer Y (2012) Redundancy and rewiring of genetic networks following genome-wide duplication events. Curr Opin Plant Biol 15 (2):168-176. doi:10.1016/j.pbi.2012.01.003
de Souza Vidigal D, Willems L, van Arkel J, Dekkers BJ, Hilhorst HW, Bentsink L (2016) Galactinol as marker for seed longevity. Plant science : an international journal of experimental plant biology 246:112-118. doi:10.1016/j.plantsci.2016.02.015
Dechaine JM, Gardner G, Weinig C (2009) Phytochromes differentially regulate seed germination responses to light quality and temperature cues during seed maturation. Plant, cell & environment 32 (10):1297-1309. doi:10.1111/j.1365-3040.2009.01998.x
Dekkers BJ, Pearce S, van Bolderen-Veldkamp RP, Marshall A, Widera P, Gilbert J, Drost HG, Bassel GW, Muller K, King JR, Wood AT, Grosse I, Quint M, Krasnogor N, Leubner-Metzger G, Holdsworth MJ, Bentsink L (2013) Transcriptional dynamics of two seed compartments with opposing roles in Arabidopsis seed germination. Plant physiology 163 (1):205-215. doi:10.1104/pp.113.223511
Dickson M (1980) Genetic aspects of seed quality. Horticultural Science 15:771-774 Dinneny JRL, T. A, Wang JY, Jung JW, Mace D, Pointer S, Barron C, Brady SM,
Schiefelbein J, Benfey PN (2008) Cell identity mediates the response of Arabidopsis root to abiotic stress. Science 320. doi:10.1126/science.1153795
Donohue K (2009) Completing the cycle: maternal effects as the missing link in plant life histories. Philosophical transactions of the Royal Society of London Series B, Biological sciences 364 (1520):1059-1074. doi:10.1098/rstb.2008.0291
Donohue K, Barua D, Butler C, Tisdale TE, Chiang GCK, Dittmar E, Rubio de Casas R (2012) Maternal effects alter natural selection on phytochromes through seed germination. Journal of Ecology 100 (3):750-757. doi:10.1111/j.1365-2745.2012.01954.x
Donohue K, Dorn L, Griffith C, Kim E, Aguilera A, Polisetty CR, Schmitt J (2005a) Environmental and Genetic Influences on the Germination of Arabidopsis Thaliana in the Field. Evolution 59 (4):740. doi:10.1554/04-419
Donohue K, Dorn L, Griffith C, Kim E, Aguilera A, Polisetty CR, Schmitt J (2005b) The Evolutionary Ecology of Seed Germination of Arabidopsis Thaliana: Variable
178
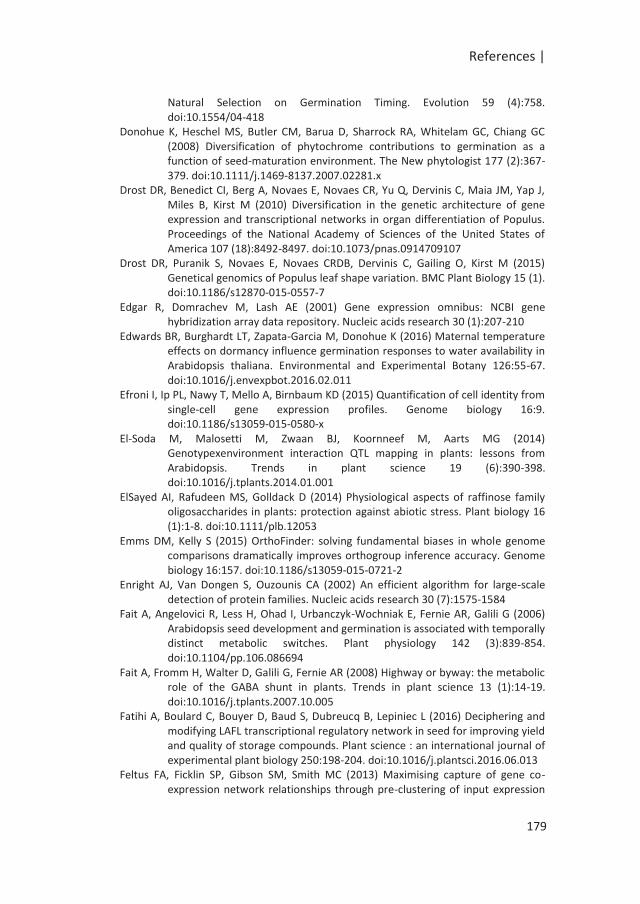
References |
Natural Selection on Germination Timing. Evolution 59 (4):758. doi:10.1554/04-418
Donohue K, Heschel MS, Butler CM, Barua D, Sharrock RA, Whitelam GC, Chiang GC (2008) Diversification of phytochrome contributions to germination as a function of seed-maturation environment. The New phytologist 177 (2):367-379. doi:10.1111/j.1469-8137.2007.02281.x
Drost DR, Benedict CI, Berg A, Novaes E, Novaes CR, Yu Q, Dervinis C, Maia JM, Yap J, Miles B, Kirst M (2010) Diversification in the genetic architecture of gene expression and transcriptional networks in organ differentiation of Populus. Proceedings of the National Academy of Sciences of the United States of America 107 (18):8492-8497. doi:10.1073/pnas.0914709107
Drost DR, Puranik S, Novaes E, Novaes CRDB, Dervinis C, Gailing O, Kirst M (2015) Genetical genomics of Populus leaf shape variation. BMC Plant Biology 15 (1). doi:10.1186/s12870-015-0557-7
Edgar R, Domrachev M, Lash AE (2001) Gene expression omnibus: NCBI gene hybridization array data repository. Nucleic acids research 30 (1):207-210
Edwards BR, Burghardt LT, Zapata-Garcia M, Donohue K (2016) Maternal temperature effects on dormancy influence germination responses to water availability in Arabidopsis thaliana. Environmental and Experimental Botany 126:55-67. doi:10.1016/j.envexpbot.2016.02.011
Efroni I, Ip PL, Nawy T, Mello A, Birnbaum KD (2015) Quantification of cell identity from single-cell gene expression profiles. Genome biology 16:9. doi:10.1186/s13059-015-0580-x
El-Soda M, Malosetti M, Zwaan BJ, Koornneef M, Aarts MG (2014) Genotypexenvironment interaction QTL mapping in plants: lessons from Arabidopsis. Trends in plant science 19 (6):390-398. doi:10.1016/j.tplants.2014.01.001
ElSayed AI, Rafudeen MS, Golldack D (2014) Physiological aspects of raffinose family oligosaccharides in plants: protection against abiotic stress. Plant biology 16 (1):1-8. doi:10.1111/plb.12053
Emms DM, Kelly S (2015) OrthoFinder: solving fundamental biases in whole genome comparisons dramatically improves orthogroup inference accuracy. Genome biology 16:157. doi:10.1186/s13059-015-0721-2
Enright AJ, Van Dongen S, Ouzounis CA (2002) An efficient algorithm for large-scale detection of protein families. Nucleic acids research 30 (7):1575-1584
Fait A, Angelovici R, Less H, Ohad I, Urbanczyk-Wochniak E, Fernie AR, Galili G (2006) Arabidopsis seed development and germination is associated with temporally distinct metabolic switches. Plant physiology 142 (3):839-854. doi:10.1104/pp.106.086694
Fait A, Fromm H, Walter D, Galili G, Fernie AR (2008) Highway or byway: the metabolic role of the GABA shunt in plants. Trends in plant science 13 (1):14-19. doi:10.1016/j.tplants.2007.10.005
Fatihi A, Boulard C, Bouyer D, Baud S, Dubreucq B, Lepiniec L (2016) Deciphering and modifying LAFL transcriptional regulatory network in seed for improving yield and quality of storage compounds. Plant science : an international journal of experimental plant biology 250:198-204. doi:10.1016/j.plantsci.2016.06.013
Feltus FA, Ficklin SP, Gibson SM, Smith MC (2013) Maximising capture of gene co-expression network relationships through pre-clustering of input expression
179

References |
samples: an Arabidopsis case study. BMC Systems Biology:7:44. doi:10.1189/1752-0509-7-44
Fenner M (1991) The effects of the parent environment on seed germinability. Seed Science Research 1 (02). doi:10.1017/s0960258500000696
Ficklin SP, Feltus FA (2011) Gene Coexpression Network Alignment and Conservation of Gene Modules between Two Grass Species: Maize and Rice. Plant physiology 156 (3):1244-1256. doi:10.1104/pp.111.173047
Ficklin SP, Luo F, Feltus FA (2010) The association of multiple interacting genes with specific phenotypes in rice using gene coexpression networks. Plant physiology 154 (1):13-24. doi:10.1104/pp.110.159459
Filichkin SA, Priest HD, Givan SA, Shen R, Bryant DW, Fox SE, Wong WK, Mockler TC (2010) Genome-wide mapping of alternative splicing in Arabidopsis thaliana. Genome research 20 (1):45-58. doi:10.1101/gr.093302.109
Finch-Savage WE, Bassel GW (2016) Seed vigour and crop establishment: extending performance beyond adaptation. Journal of experimental botany 67 (3):567-591. doi:10.1093/jxb/erv490
Finch-Savage WE, Footitt S (2015) Regulation of Seed Dormancy Cycling in Seasonal Field Environments.35-47. doi:10.1007/978-3-319-14451-1_2
Finch-Savage WE, Footitt S (2017) Seed dormancy cycling and the regulation of dormancy mechanisms to time germination in variable field environments. Journal of experimental botany 68 (4):843-856. doi:10.1093/jxb/erw477
Flassig RJ, Heise S, Sundmacher K, Klamt S (2013) An effective framework for reconstructing gene regulatory networks from genetical genomics data. Bioinformatics 29 (2):246-254. doi:10.1093/bioinformatics/bts679
Foolad MR, Subbiah P, Zhang L (2007) Common QTL affect the rate of tomato seed germination under different stress and nonstress conditions. International journal of plant genomics 2007:97386. doi:10.1155/2007/97386
Fu J, Keurentjes JJ, Bouwmeester H, America T, Verstappen FW, Ward JL, Beale MH, de Vos RC, Dijkstra M, Scheltema RA, Johannes F, Koornneef M, Vreugdenhil D, Breitling R, Jansen RC (2009) System-wide molecular evidence for phenotypic buffering in Arabidopsis. Nature genetics 41 (2):166-167. doi:10.1038/ng.308
Fukushima A, Kusano M, Redestig H, Arita M, Saito K (2011) Metabolomic correlation-network modules in Arabidopsis based on a graph-clustering approach. BMC Systems Biology 5:1
Fukushima A, Nishizawa T, Hayakumo M, Hikosaka S, Saito K, Goto E, Kusano M (2012) Exploring tomato gene functions based on coexpression modules using graph clustering and differential coexpression approaches. Plant physiology 158 (4):1487-1502. doi:10.1104/pp.111.188367
Galili G, Avin-Wittenberg T, Angelovici R, Fernie AR (2014) The role of photosynthesis and amino acid metabolism in the energy status during seed development. Frontiers in plant science 5:447. doi:10.3389/fpls.2014.00447
Galland M, Rajjou L (2015) Regulation of mRNA translation controls seed germination and is critical for seedling vigor. Frontiers in plant science 6:284. doi:10.3389/fpls.2015.00284
Galloway LF (2001) The effect of maternal and paternal environments on seed characters in the herbaceous plant campanula americana (campanulaceae). American Journal of Botany 88 (5):832–840
180
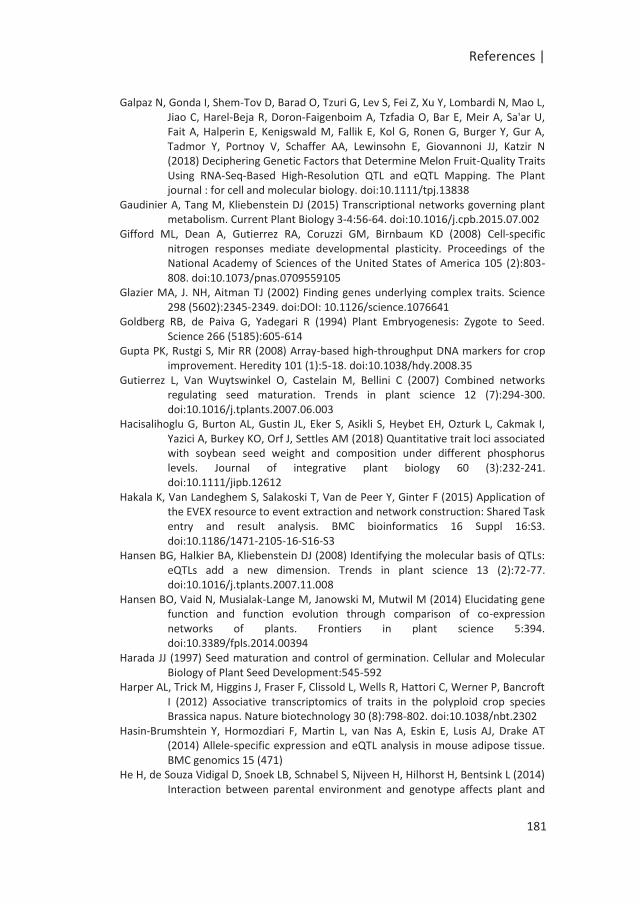
References |
Galpaz N, Gonda I, Shem-Tov D, Barad O, Tzuri G, Lev S, Fei Z, Xu Y, Lombardi N, Mao L, Jiao C, Harel-Beja R, Doron-Faigenboim A, Tzfadia O, Bar E, Meir A, Sa'ar U, Fait A, Halperin E, Kenigswald M, Fallik E, Kol G, Ronen G, Burger Y, Gur A, Tadmor Y, Portnoy V, Schaffer AA, Lewinsohn E, Giovannoni JJ, Katzir N (2018) Deciphering Genetic Factors that Determine Melon Fruit-Quality Traits Using RNA-Seq-Based High-Resolution QTL and eQTL Mapping. The Plant journal : for cell and molecular biology. doi:10.1111/tpj.13838
Gaudinier A, Tang M, Kliebenstein DJ (2015) Transcriptional networks governing plant metabolism. Current Plant Biology 3-4:56-64. doi:10.1016/j.cpb.2015.07.002
Gifford ML, Dean A, Gutierrez RA, Coruzzi GM, Birnbaum KD (2008) Cell-specific nitrogen responses mediate developmental plasticity. Proceedings of the National Academy of Sciences of the United States of America 105 (2):803-808. doi:10.1073/pnas.0709559105
Glazier MA, J. NH, Aitman TJ (2002) Finding genes underlying complex traits. Science 298 (5602):2345-2349. doi:DOI: 10.1126/science.1076641
Goldberg RB, de Paiva G, Yadegari R (1994) Plant Embryogenesis: Zygote to Seed. Science 266 (5185):605-614
Gupta PK, Rustgi S, Mir RR (2008) Array-based high-throughput DNA markers for crop improvement. Heredity 101 (1):5-18. doi:10.1038/hdy.2008.35
Gutierrez L, Van Wuytswinkel O, Castelain M, Bellini C (2007) Combined networks regulating seed maturation. Trends in plant science 12 (7):294-300. doi:10.1016/j.tplants.2007.06.003
Hacisalihoglu G, Burton AL, Gustin JL, Eker S, Asikli S, Heybet EH, Ozturk L, Cakmak I, Yazici A, Burkey KO, Orf J, Settles AM (2018) Quantitative trait loci associated with soybean seed weight and composition under different phosphorus levels. Journal of integrative plant biology 60 (3):232-241. doi:10.1111/jipb.12612
Hakala K, Van Landeghem S, Salakoski T, Van de Peer Y, Ginter F (2015) Application of the EVEX resource to event extraction and network construction: Shared Task entry and result analysis. BMC bioinformatics 16 Suppl 16:S3. doi:10.1186/1471-2105-16-S16-S3
Hansen BG, Halkier BA, Kliebenstein DJ (2008) Identifying the molecular basis of QTLs: eQTLs add a new dimension. Trends in plant science 13 (2):72-77. doi:10.1016/j.tplants.2007.11.008
Hansen BO, Vaid N, Musialak-Lange M, Janowski M, Mutwil M (2014) Elucidating gene function and function evolution through comparison of co-expression networks of plants. Frontiers in plant science 5:394. doi:10.3389/fpls.2014.00394
Harada JJ (1997) Seed maturation and control of germination. Cellular and Molecular Biology of Plant Seed Development:545-592
Harper AL, Trick M, Higgins J, Fraser F, Clissold L, Wells R, Hattori C, Werner P, Bancroft I (2012) Associative transcriptomics of traits in the polyploid crop species Brassica napus. Nature biotechnology 30 (8):798-802. doi:10.1038/nbt.2302
Hasin-Brumshtein Y, Hormozdiari F, Martin L, van Nas A, Eskin E, Lusis AJ, Drake AT (2014) Allele-specific expression and eQTL analysis in mouse adipose tissue. BMC genomics 15 (471)
He H, de Souza Vidigal D, Snoek LB, Schnabel S, Nijveen H, Hilhorst H, Bentsink L (2014) Interaction between parental environment and genotype affects plant and
181
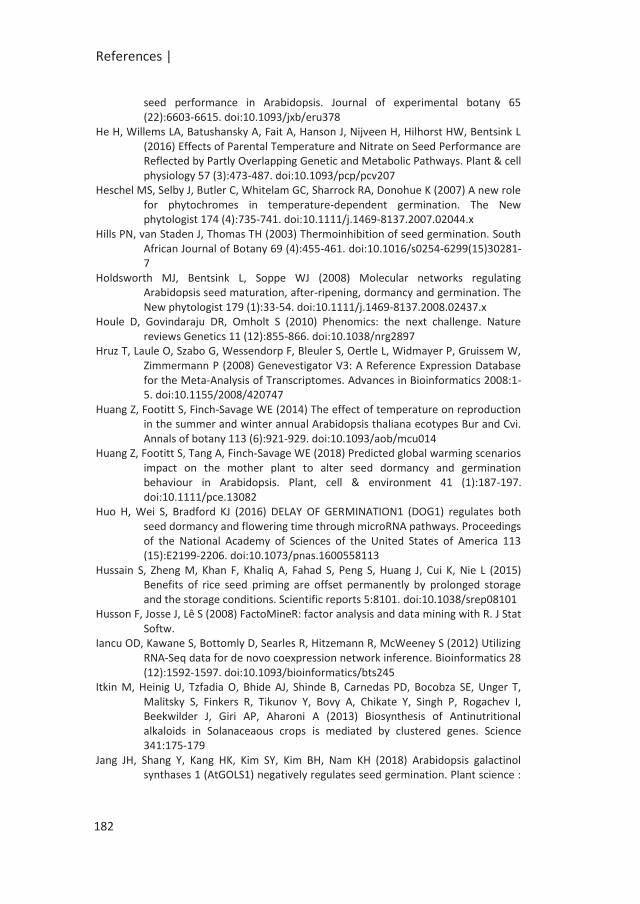
References |
seed performance in Arabidopsis. Journal of experimental botany 65 (22):6603-6615. doi:10.1093/jxb/eru378
He H, Willems LA, Batushansky A, Fait A, Hanson J, Nijveen H, Hilhorst HW, Bentsink L (2016) Effects of Parental Temperature and Nitrate on Seed Performance are Reflected by Partly Overlapping Genetic and Metabolic Pathways. Plant & cell physiology 57 (3):473-487. doi:10.1093/pcp/pcv207
Heschel MS, Selby J, Butler C, Whitelam GC, Sharrock RA, Donohue K (2007) A new role for phytochromes in temperature-dependent germination. The New phytologist 174 (4):735-741. doi:10.1111/j.1469-8137.2007.02044.x
Hills PN, van Staden J, Thomas TH (2003) Thermoinhibition of seed germination. South African Journal of Botany 69 (4):455-461. doi:10.1016/s0254-6299(15)30281-7
Holdsworth MJ, Bentsink L, Soppe WJ (2008) Molecular networks regulating Arabidopsis seed maturation, after-ripening, dormancy and germination. The New phytologist 179 (1):33-54. doi:10.1111/j.1469-8137.2008.02437.x
Houle D, Govindaraju DR, Omholt S (2010) Phenomics: the next challenge. Nature reviews Genetics 11 (12):855-866. doi:10.1038/nrg2897
Hruz T, Laule O, Szabo G, Wessendorp F, Bleuler S, Oertle L, Widmayer P, Gruissem W, Zimmermann P (2008) Genevestigator V3: A Reference Expression Database for the Meta-Analysis of Transcriptomes. Advances in Bioinformatics 2008:1-5. doi:10.1155/2008/420747
Huang Z, Footitt S, Finch-Savage WE (2014) The effect of temperature on reproduction in the summer and winter annual Arabidopsis thaliana ecotypes Bur and Cvi. Annals of botany 113 (6):921-929. doi:10.1093/aob/mcu014
Huang Z, Footitt S, Tang A, Finch-Savage WE (2018) Predicted global warming scenarios impact on the mother plant to alter seed dormancy and germination behaviour in Arabidopsis. Plant, cell & environment 41 (1):187-197. doi:10.1111/pce.13082
Huo H, Wei S, Bradford KJ (2016) DELAY OF GERMINATION1 (DOG1) regulates both seed dormancy and flowering time through microRNA pathways. Proceedings of the National Academy of Sciences of the United States of America 113 (15):E2199-2206. doi:10.1073/pnas.1600558113
Hussain S, Zheng M, Khan F, Khaliq A, Fahad S, Peng S, Huang J, Cui K, Nie L (2015) Benefits of rice seed priming are offset permanently by prolonged storage and the storage conditions. Scientific reports 5:8101. doi:10.1038/srep08101
Husson F, Josse J, Lê S (2008) FactoMineR: factor analysis and data mining with R. J Stat Softw.
Iancu OD, Kawane S, Bottomly D, Searles R, Hitzemann R, McWeeney S (2012) Utilizing RNA-Seq data for de novo coexpression network inference. Bioinformatics 28 (12):1592-1597. doi:10.1093/bioinformatics/bts245
Itkin M, Heinig U, Tzfadia O, Bhide AJ, Shinde B, Carnedas PD, Bocobza SE, Unger T, Malitsky S, Finkers R, Tikunov Y, Bovy A, Chikate Y, Singh P, Rogachev I, Beekwilder J, Giri AP, Aharoni A (2013) Biosynthesis of Antinutritional alkaloids in Solanaceaous crops is mediated by clustered genes. Science 341:175-179
Jang JH, Shang Y, Kang HK, Kim SY, Kim BH, Nam KH (2018) Arabidopsis galactinol synthases 1 (AtGOLS1) negatively regulates seed germination. Plant science :
182
References |
an international journal of experimental plant biology 267:94-101. doi:10.1016/j.plantsci.2017.11.010
Jansen RC, Nap J-P (2001) Genetical genomics: the added value from segregation. Trends in genetics : TIG 11 (7):388-391
Jeong H, Mason SP, Barabasi AL, Oltvai ZN (2001) Lethality and centrality in protein networks. Nature 441
Jimenez-Gomez JM (2011) Next generation quantitative genetics in plants. Frontiers in plant science 2:77. doi:10.3389/fpls.2011.00077
Jiménez-Gómez JM (2014) Network types and their application in natural variation studies in plants. Curr Opin Plant Biol 18 (0):80-86. doi:http://dx.doi.org/10.1016/j.pbi.2014.02.010
Jimenez-Gomez JM, Wallace AD, Maloof JN (2010) Network analysis identifies ELF3 as a QTL for the shade avoidance response in Arabidopsis. PLoS genetics 6 (9):e1001100. doi:10.1371/journal.pgen.1001100
Joosen RV, Arends D, Li Y, Willems LA, Keurentjes JJ, Ligterink W, Jansen RC, Hilhorst HW (2013) Identifying genotype-by-environment interactions in the metabolism of germinating arabidopsis seeds using generalized genetical genomics. Plant physiology 162 (2):553-566. doi:10.1104/pp.113.216176
Joosen RV, Arends D, Willems LA, Ligterink W, Jansen RC, Hilhorst HW (2012) Visualizing the genetic landscape of Arabidopsis seed performance. Plant physiology 158 (2):570-589. doi:10.1104/pp.111.186676
Joosen RV, Kodde J, Willems LA, Ligterink W, van der Plas LH, Hilhorst HW (2010) GERMINATOR: a software package for high-throughput scoring and curve fitting of Arabidopsis seed germination. The Plant journal : for cell and molecular biology 62 (1):148-159. doi:10.1111/j.1365-313X.2009.04116.x
Joosen RV, W L, H.W H, J.J K (2009) Advances in Genetical Genomics of Plants. Current Genomics 10(8):540–549. doi:10.2174/138920209789503914
Jordan ET, Hatfield PM, Hondred D, Talon M, J.A.D Z, Viestra R (1995) Phytochrome A Overexpression in Transgenic Tobacco. Plant physiology 107:797-805
Josephs EB (2018) Determining the evolutionary forces shaping G x E. The New phytologist 219 (1):31-36. doi:10.1111/nph.15103
Josse J, Holmes S (2016) Measuring multivariate association and beyond. Statistics surveys 10:132-167. doi:10.1214/16-SS116
Kanehisa M, Goto S (2000) KEGG: Kyoto Encyclopedia of Genes and Genomes. Nucleic acids research 28 (1):27-30
Kaplan F, Kopka J, Haskell DW, Zhao W, Schiller KC, Gatzke N, Sung DY, Guy CL (2004) Exploring the temperature-stress metabolome of Arabidopsis. Plant physiology 136 (4):4159-4168. doi:10.1104/pp.104.052142
Kazmi RH, Khan N, Willems LA, AW VANH, Ligterink W, Hilhorst HW (2012) Complex genetics controls natural variation among seed quality phenotypes in a recombinant inbred population of an interspecific cross between Solanum lycopersicum x Solanum pimpinellifolium. Plant, cell & environment 35 (5):929-951. doi:10.1111/j.1365-3040.2011.02463.x
Kazmi RH, Willems LAJ, Joosen RVL, Khan N, Ligterink W, Hilhorst HWM (2017) Metabolomic analysis of tomato seed germination. Metabolomics : Official journal of the Metabolomic Society 13 (12):145. doi:10.1007/s11306-017-1284-x
183
References |
Kendall S, Penfield S (2012) Maternal and zygotic temperature signalling in the control of seed dormancy and germination. Seed Science Research 22 (S1):S23-S29. doi:10.1017/s0960258511000390
Kendall SL, Hellwege A, Marriot P, Whalley C, Graham IA, Penfield S (2011) Induction of dormancy in Arabidopsis summer annuals requires parallel regulation of DOG1 and hormone metabolism by low temperature and CBF transcription factors. The Plant cell 23 (7):2568-2580. doi:10.1105/tpc.111.087643
Kerdaffrec E, Nordborg M (2017) The maternal environment interacts with genetic variation in regulating seed dormancy in Swedish Arabidopsis thaliana. PloS one 12 (12):e0190242. doi:10.1371/journal.pone.0190242
Kerwin RE, Jimenez-Gomez JM, Fulop D, Harmer SL, Maloof JN, Kliebenstein DJ (2011) Network quantitative trait loci mapping of circadian clock outputs identifies metabolic pathway-to-clock linkages in Arabidopsis. The Plant cell 23 (2):471-485. doi:10.1105/tpc.110.082065
Keurentjes JJ (2009) Genetical metabolomics: closing in on phenotypes. Curr Opin Plant Biol 12 (2):223-230. doi:10.1016/j.pbi.2008.12.003
Keurentjes JJ, Bentsink L, Alonso-Blanco C, Hanhart CJ, Blankestijn-De Vries H, Effgen S, Vreugdenhil D, Koornneef M (2007a) Development of a near-isogenic line population of Arabidopsis thaliana and comparison of mapping power with a recombinant inbred line population. Genetics 175 (2):891-905. doi:10.1534/genetics.106.066423
Keurentjes JJ, Fu J, de Vos CH, Lommen A, Hall RD, Bino RJ, van der Plas LH, Jansen RC, Vreugdenhil D, Koornneef M (2006) The genetics of plant metabolism. Nature genetics 38 (7):842-849. doi:10.1038/ng1815
Keurentjes JJ, Fu J, Terpstra IR, Garcia JM, van den Ackerveken G, Snoek LB, Peeters AJ, Vreugdenhil D, Koornneef M, Jansen RC (2007b) Regulatory network construction in Arabidopsis by using genome-wide gene expression quantitative trait loci. Proceedings of the National Academy of Sciences of the United States of America 104 (5):1708-1713. doi:10.1073/pnas.0610429104
Keurentjes JJ, Koornneef M, Vreugdenhil D (2008) Quantitative genetics in the age of omics. Curr Opin Plant Biol 11 (2):123-128. doi:10.1016/j.pbi.2008.01.006
Keurentjes JJB, Willems G, van Eeuwijk F, Nordborg M, Koornneef M (2011) A comparison of population types used for QTL mapping in Arabidopsis thaliana. Plant Genetic Resources 9 (02):185-188. doi:10.1017/s1479262111000086
Khanin R, Wit E (2006) How scale-free networks are biological networks. Journal of Computational Biology 13 (3):810-818
Kim D, Langmead B, Salzberg SL (2015) HISAT: a fast spliced aligner with low memory requirements. Nature methods 12 (4):357-360. doi:10.1038/nmeth.3317
Kimura M, Nambara E (2010) Stored and neosynthesized mRNA in Arabidopsis seeds: effects of cycloheximide and controlled deterioration treatment on the resumption of transcription during imbibition. Plant molecular biology 73 (1-2):119-129. doi:10.1007/s11103-010-9603-x
King EG, Sanderson BJ, McNeil CL, Long AD, Macdonald SJ (2014) Genetic dissection of the Drosophila melanogaster female head transcriptome reveals widespread allelic heterogeneity. PLoS genetics 10 (5):e1004322. doi:10.1371/journal.pgen.1004322
184
References |
Kinnersley AM, Turano FJ (2000) Gamma Aminobutyric Acid (GABA) and Plant Responses to Stress. Critical Reviews in Plant Sciences 19 (6):479-509. doi:10.1080/07352680091139277
Kliebenstein D (2009) Quantitative genomics: analyzing intraspecific variation using global gene expression polymorphisms or eQTLs. Annual review of plant biology 60:93-114. doi:10.1146/annurev.arplant.043008.092114
Kliebenstein D, Figuth A, Mitchell-Olds T (2002) Genetic architecture of plastic methyl jasmonate responses in Arabidopsis thaliana. Genetics Society of America 161:1685-1696
Kliebenstein D, Gershenzon J, Mitchell-Olds T (2001) Comparative Quantitative Trait Loci Mapping of Aliphatic, Indolic and Benzylic Glucosinolate Production in Arabidopsis thaliana Leaves and Seeds. 159:359–370
Kliebenstein DJ (2012) Exploring the shallow end; estimating information content in transcriptomics studies. Frontiers in plant science 3:213. doi:10.3389/fpls.2012.00213
Kliebenstein DJ, West MA, van Leeuwen H, Loudet O, Doerge RW, St Clair DA (2006) Identification of QTLs controlling gene expression networks defined a priori. BMC bioinformatics 7:308. doi:10.1186/1471-2105-7-308
Kloosterman B, Anithakumari AM, Chibon PY, Oortwijn M, van der Linden GC, Visser RG, Bachem CW (2012) Organ specificity and transcriptional control of metabolic routes revealed by expression QTL profiling of source--sink tissues in a segregating potato population. BMC Plant Biol 12:17. doi:10.1186/1471-2229-12-17
Kloosterman B, Oortwijn, M., uitdeWilligen, Jan., America, T., de Vos, R, Visser, R.G.F.,Bachem, C. W.B. (2010) From QTL to candidate gene: Genetical genomics of simple and complex traits in potato using a pooling strategy. BMC genomics 11 (158)
Knoch D, Riewe D, Meyer RC, Boudichevskaia A, Schmidt R, Altmann T (2017) Genetic dissection of metabolite variation in Arabidopsis seeds: evidence for mQTL hotspots and a master regulatory locus of seed metabolism. Journal of experimental botany 68 (7):1655-1667. doi:10.1093/jxb/erx049
Kooke R, Johannes F, Wardenaar R, Becker F, Etcheverry M, Colot V, Vreugdenhil D, Keurentjes JJ (2015) Epigenetic basis of morphological variation and phenotypic plasticity in Arabidopsis thaliana. The Plant cell 27 (2):337-348. doi:10.1105/tpc.114.133025
Kooke R, Keurentjes JJ (2012) Multi-dimensional regulation of metabolic networks shaping plant development and performance. Journal of experimental botany 63 (9):3353-3365. doi:10.1093/jxb/err373
Koornneef M, Alonso-Blanco C, Vreugdenhil D (2004) Naturally occurring genetic variation in Arabidopsis thaliana. Annual review of plant biology 55:141-172. doi:10.1146/annurev.arplant.55.031903.141605
Koornneef M, Meinke D (2010) The development of Arabidopsis as a model plant. The Plant journal : for cell and molecular biology 61 (6):909-921. doi:10.1111/j.1365-313X.2009.04086.x
Korte A, Farlow A (2013) The advantages and limitations of trait analysis with GWAS: a review. Plant Methods 9 (1):29
Kourmpetis YA, van Dijk AD, van Ham RC, ter Braak CJ (2011) Genome-wide computational function prediction of Arabidopsis proteins by integration of
185
References |
multiple data sources. Plant physiology 155 (1):271-281. doi:10.1104/pp.110.162164
Kover PX, Valdar W, Trakalo J, Scarcelli N, Ehrenreich IM, Purugganan MD, Durrant C, Mott R (2009) A Multiparent Advanced Generation Inter-Cross to fine-map quantitative traits in Arabidopsis thaliana. PLoS genetics 5 (7):e1000551. doi:10.1371/journal.pgen.1000551
Krouk G, Mirowski P, LeCun Y, Shasha DE, Coruzzi GM (2010) Predictive network modeling of the high-resolution dynamic plant transcriptome in response to nitrate. Genome biology 11 (12):R123. doi:10.1186/gb-2010-11-12-r123
Kuzniar A, van Ham RC, Pongor S, Leunissen JA (2008) The quest for orthologs: finding the corresponding gene across genomes. Trends in genetics : TIG 24 (11):539-551. doi:10.1016/j.tig.2008.08.009
Lachowiec J, Queitsch C, Kliebenstein DJ (2015) Molecular mechanisms governing differential robustness of development and environmental responses in plants. Annals of botany. doi:10.1093/aob/mcv151
Laloum T, Martin G, Duque P (2018) Alternative Splicing Control of Abiotic Stress Responses. Trends in plant science 23 (2):140-150. doi:10.1016/j.tplants.2017.09.019
Lamesch P, Berardini TZ, Li D, Swarbreck D, Wilks C, Sasidharan R, Muller R, Dreher K, Alexander DL, Garcia-Hernandez M, Karthikeyan AS, Lee CH, Nelson WD, Ploetz L, Singh S, Wensel A, Huala E (2012) The Arabidopsis Information Resource (TAIR): improved gene annotation and new tools. Nucleic acids research 40 (Database issue):D1202-1210. doi:10.1093/nar/gkr1090
Langfelder P, Horvath S (2008) WGCNA: an R package for weighted correlation network analysis. BMC bioinformatics 9:559. doi:10.1186/1471-2105-9-559
Laserna MP, Sanchez RA, Botto JF (2008) Light-related loci controlling seed germination in Ler x Cvi and Bay-0 x Sha recombinant inbred-line populations of Arabidopsis thaliana. Annals of botany 102 (4):631-642. doi:10.1093/aob/mcn138
Lavenus J, Goh T, Guyomarc'h S, Hill K, Lucas M, Voss U, Kenobi K, Wilson MH, Farcot E, Hagen G, Guilfoyle TJ, Fukaki H, Laplaze L, Bennett MJ (2015) Inference of the Arabidopsis lateral root gene regulatory network suggests a bifurcation mechanism that defines primordia flanking and central zones. The Plant cell 27 (5):1368-1388. doi:10.1105/tpc.114.132993
Le BH, Cheng C, Bui AQ, Wagmaister JA, Henry KF, Pelletier J, Kwong L, Belmonte M, Kirkbride R, Horvath S, Drews GN, Fischer RL, Okamuro JK, Harada JJ, Goldberg RB (2010) Global analysis of gene activity during Arabidopsis seed development and identification of seed-specific transcription factors. Proceedings of the National Academy of Sciences of the United States of America 107 (18):8063-8070. doi:10.1073/pnas.1003530107
Leal LG, Lopez C, Lopez-Kleine L (2014) Construction and comparison of gene co-expression networks shows complex plant immune responses. PeerJ 2:e610. doi:10.7717/peerj.610
Lee I, Ambaru B, Thakkar P, Marcotte EM, Rhee SY (2010) Rational association of genes with traits using a genome-scale gene network for Arabidopsis thaliana. Nature biotechnology 28 (2):149-156. doi:10.1038/nbt.1603
Lee I, Seo Y-S, Coltrane D, Hwang S, Oh T, Marcotte EM, Ronald PC (2011) Genetic dissection of the biotic stress response using a genome-scale gene network
186
References |
for rice. Proceedings of the National Academy of Sciences of the United States of America 108 (45):18548-18553. doi:10.1073/pnas.1110384108
Lee T, Oh T, Yang S, Shin J, Hwang S, Kim CY, Kim H, Shim H, Shim JE, Ronald PC, Lee I (2015a) RiceNet v2: an improved network prioritization server for rice genes. Nucleic acids research 43 (W1):W122-127. doi:10.1093/nar/gkv253
Lee T, Yang S, Kim E, Ko Y, Hwang S, Shin J, Shim JE, Shim H, Kim H, Kim C, Lee I (2015b) AraNet v2: an improved database of co-functional gene networks for the study of Arabidopsis thaliana and 27 other nonmodel plant species. Nucleic acids research 43 (Database issue):D996-1002. doi:10.1093/nar/gku1053
Leverett LD, Auge GA, Bali A, Donohue K (2016) Contrasting germination responses to vegetative canopies experienced in pre- vs. post-dispersal environments. Annals of botany 118 (6):1175-1186. doi:10.1093/aob/mcw166
Levy SF, Siegal ML (2008) Network hubs buffer environmental variation in Saccharomyces cerevisiae. PLoS biology 6 (11):e264. doi:10.1371/journal.pbio.0060264
Li G, Ma Q, Tang H, Paterson AH, Xu Y (2009a) QUBIC: a qualitative biclustering algorithm for analyses of gene expression data. Nucleic acids research 37 (15):e101-e101. doi:10.1093/nar/gkp491
Li H, Handsaker B, Wysoker A, Fennell T, Ruan J, Homer N, Marth G, Abecasis G, Durbin R, Genome Project Data Processing S (2009b) The Sequence Alignment/Map format and SAMtools. Bioinformatics 25 (16):2078-2079. doi:10.1093/bioinformatics/btp352
Li L, Stoeckert CJ, Roos DS (2003) OrthoMCL: identification of ortholog groups for eukaryotic genomes. Genome research 13 (9):2178-2189. doi:10.1101/gr.1224503
Li M, Chen JE, Wang JX, Hu B, Chen G (2008a) Modifying the DPClus algorithm for identifying protein complexes based on new topological structures. BMC bioinformatics 9:398. doi:10.1186/1471-2105-9-398
Li S, Lu Q, Cui Y (2010) A systems biology approach for identifying novel pathway regulators in eQTL mapping. Journal of biopharmaceutical statistics 20 (2):373-400. doi:10.1080/10543400903572803
Li X, Zhu C, Yeh CT, Wu W, Takacs EM, Petsch KA, Tian F, Bai G, Buckler ES, Muehlbauer GJ, Timmermans MC, Scanlon MJ, Schnable PS, Yu J (2012) Genic and nongenic contributions to natural variation of quantitative traits in maize. Genome research 22 (12):2436-2444. doi:10.1101/gr.140277.112
Li Y, Alvarez OA, Gutteling EW, Tijsterman M, Fu J, Riksen JA, Hazendonk E, Prins P, Plasterk RH, Jansen RC, Breitling R, Kammenga JE (2006) Mapping determinants of gene expression plasticity by genetical genomics in C. elegans. PLoS genetics 2 (12):e222. doi:10.1371/journal.pgen.0020222
Li Y, Breitling R, Jansen RC (2008b) Generalizing genetical genomics: getting added value from environmental perturbation. Trends in genetics : TIG 24 (10):518-524. doi:10.1016/j.tig.2008.08.001
Li Y, Pearl SA, Jackson SA (2015) Gene Networks in Plant Biology: Approaches in Reconstruction and Analysis. Trends in plant science 20 (10):664-675. doi:10.1016/j.tplants.2015.06.013
Ligterink W, Joosen RVL, Hilhorst HWM (2012) Unravelling the complex trait of seed quality: using natural variation through a combination of physiology, genetics
187
References |
and -omics technologies. Seed Science Research 22 (S1):S45-S52. doi:10.1017/s0960258511000328
Lima-Mendez G, van Helden J (2009) The powerful law of the power law and other myths in network biology. Mol Biosyst 5 (12):1482-1493. doi:10.1039/b908681a
Lisec J, Schauer N, Kopka J, Willmitzer L, Fernie AR (2006) Gas chromatography mass spectrometry-based metabolite profiling in plants. Nature protocols 1 (1):387-396. doi:10.1038/nprot.2006.59
Liseron-Monfils C, Ware D (2015) Revealing gene regulation and associations through biological networks. Current Plant Biology 3-4:30-39. doi:10.1016/j.cpb.2015.11.001
Liu C, Zhou Q, Dong L, Wang H, Liu F, Weng J, Li X, Xie C (2016) Genetic architecture of the maize kernel row number revealed by combining QTL mapping using a high-density genetic map and bulked segregant RNA sequencing. BMC genomics 17 (1):915. doi:10.1186/s12864-016-3240-y
Lommen A (2009) MetAlign: Interface-driven, versatile metabolomics tool for hyphenated full-scan Mass spectrometry data preprocessing. Analytical Chemistry 81 (8):3079-3086
Lopez-Molina L, Mongrand S, Chua NH (2001) A postgermination developmental arrest checkpoint is mediated by abscisic acid and requires the ABI5 transcription factor in Arabidopsis. Proceedings of the National Academy of Sciences of the United States of America 98 (8):4782-4787. doi:10.1073/pnas.081594298
Loudet O, Chaillou S, Camilleri C, Bouchez D, Daniel-Vedele F (2002) Bay-0 x Shahdara recombinant inbred line population: a powerful tool for the genetic dissection of complex traits in Arabidopsis. TAG Theoretical and applied genetics Theoretische und angewandte Genetik 104 (6-7):1173-1184. doi:10.1007/s00122-001-0825-9
Lowry DB, Logan TL, Santuari L, Hardtke CS, Richards JH, DeRose-Wilson LJ, McKay JK, Sen S, Juenger TE (2013) Expression quantitative trait locus mapping across water availability environments reveals contrasting associations with genomic features in Arabidopsis. The Plant cell 25 (9):3266-3279. doi:10.1105/tpc.113.115352
Lysenko A, Defoin-Platel M, Hassani-Pak K, Taubert J, Hodgman C, Rawlings CJ, Saqi M (2011) Assessing the functional coherence of modules found in multiple-evidence networks from Arabidopsis. BMC bioinformatics 12:203. doi:10.1186/1471-2105-12-203
Ma S, Shah S, Bohnert HJ, Snyder M, Dinesh-Kumar SP (2013) Incorporating motif analysis into gene co-expression network reveals novel modular expression pattern and new signaling pathways. PLoS genetics 9 (10). doi:10.1371/journal.pgen.1003840
MacGregor DR, Kendall SL, Florance H, Fedi F, Moore K, Paszkiewicz K, Smirnoff N, Penfield S (2015) Seed production temperature regulation of primary dormancy occurs through control of seed coat phenylpropanoid metabolism. The New phytologist 205 (2):642-652. doi:10.1111/nph.13090
Macquet A, Ralet MC, Kronenberger J, Marion-Poll A, North HM (2007) In situ, chemical and macromolecular study of the composition of Arabidopsis thaliana seed coat mucilage. Plant & cell physiology 48 (7):984-999. doi:10.1093/pcp/pcm068
188

References |
Maere S, Heymans K, Kuiper M (2005) BiNGO: a Cytoscape plugin to assess overrepresentation of gene ontology categories in biological networks. Bioinformatics 21 (16):3448-3449. doi:10.1093/bioinformatics/bti551
Maia J, Dekkers BJ, Provart NJ, Ligterink W, Hilhorst HW (2011) The re-establishment of desiccation tolerance in germinated Arabidopsis thaliana seeds and its associated transcriptome. PloS one 6 (12):e29123. doi:10.1371/journal.pone.0029123
Malosetti M, Ribaut JM, van Eeuwijk FA (2013) The statistical analysis of multi-environment data: modeling genotype-by-environment interaction and its genetic basis. Frontiers in physiology 4:44. doi:10.3389/fphys.2013.00044
Mammadov J, Sun X, Gao Y, Ochsenfeld C, Bakker E, Ren R, Flora J, Wang X, Kumpatla S, Meyer D, Thompson S (2015) Combining powers of linkage and association mapping for precise dissection of QTL controlling resistance to gray leaf spot disease in maize (Zea mays L.). BMC genomics 16:916. doi:10.1186/s12864-015-2171-3
Mao L, Van Hemert JL, Dash S, Dickerson JA (2009) Arabidopsis gene co-expression network and its functional modules. BMC bioinformatics 10:346. doi:10.1186/1471-2105-10-346
Markelz RJC, Covington MF, Brock MT, Devisetty UK, Kliebenstein DJ, Weinig C, Maloof JN (2017) Using RNA-seq for Genomic Scaffold Placement, Correcting Assemblies, and Genetic Map Creation in a Common Brassica rapa Mapping Population. G3. doi:10.1534/g3.117.043000
Matsuda F, Okazaki Y, Oikawa A, Kusano M, Nakabayashi R, Kikuchi J, Yonemaru J, Ebana K, Yano M, Saito K (2012) Dissection of genotype-phenotype associations in rice grains using metabolome quantitative trait loci analysis. The Plant journal : for cell and molecular biology 70 (4):624-636. doi:10.1111/j.1365-313X.2012.04903.x
Meng PH, Macquet A, Loudet O, Marion-Poll A, North HM (2008) Analysis of natural allelic variation controlling Arabidopsis thaliana seed germinability in response to cold and dark: identification of three major quantitative trait loci. Molecular plant 1 (1):145-154. doi:10.1093/mp/ssm014
Meng PH, Raynaud C, Tcherkez G, Blanchet S, Massoud K, Domenichini S, Henry Y, Soubigou-Taconnat L, Lelarge-Trouverie C, Saindrenan P, Renou JP, Bergounioux C (2009) Crosstalks between myo-inositol metabolism, programmed cell death and basal immunity in Arabidopsis. PloS one 4 (10):e7364. doi:10.1371/journal.pone.0007364
Mochida K, Shinozaki K (2011) Advances in omics and bioinformatics tools for systems analyses of plant functions. Plant & cell physiology 52 (12):2017-2038. doi:10.1093/pcp/pcr153
Morreel K, Goeminne G, Storme V, Sterck L, Ralph J, Coppieters W, Breyne P, Steenackers M, Georges M, Messens E, Boerjan W (2006) Genetical metabolomics of flavonoid biosynthesis in Populus: a case study. The Plant journal : for cell and molecular biology 47 (2):224-237. doi:10.1111/j.1365-313X.2006.02786.x
Morris JH, Knudsen GM, Verschueren E, Johnson JR, Cimermancic P, Greninger AL, Pico AR (2014) Affinity purification-mass spectrometry and network analysis to understand protein-protein interactions. Nature protocols 9 (11):2539-2554. doi:10.1038/nprot.2014.164
189
References |
Movahedi S, Van Bel M, Heyndrickx KS, Vandepoele K (2012) Comparative co-expression analysis in plant biology. Plant, cell & environment 35 (10):1787-1798. doi:10.1111/j.1365-3040.2012.02517.x
Movahedi S, Van de Peer Y, Vandepoele K (2011) Comparative network analysis reveals that tissue specificity and gene function are important factors influencing the mode of expression evolution in Arabidopsis and rice. Plant physiology 156 (3):1316-1330. doi:10.1104/pp.111.177865
Munir J, Dorn L, Donohue K, Schmitt J (2001) The effect of maternal photoperiod on seasonal dormancy in Arabidopsis thaliana (Brassicaceae). American Journal of Botany 88 (7):1240–1249
Mutwil M, Klie S, Tohge T, Giorgi FM, Wilkins O, Campbell MM, Fernie AR, Usadel B, Nikoloski Z, Persson S (2011) PlaNet: combined sequence and expression comparisons across plant networks derived from seven species. The Plant cell 23 (3):895-910. doi:10.1105/tpc.111.083667
Mutwil M, Usadel B, Schutte M, Loraine A, Ebenhoh O, Persson S (2010) Assembly of an interactive correlation network for the Arabidopsis genome using a novel heuristic clustering algorithm. Plant physiology 152 (1):29-43. doi:10.1104/pp.109.145318
Nakabayashi K, Okamoto M, Koshiba T, Kamiya Y, Nambara E (2005) Genome-wide profiling of stored mRNA in Arabidopsis thaliana seed germination: epigenetic and genetic regulation of transcription in seed. The Plant journal : for cell and molecular biology 41 (5):697-709. doi:10.1111/j.1365-313X.2005.02337.x
Nejat N, Mantri N (2018) Emerging roles of long non-coding RNAs in plant response to biotic and abiotic stresses. Critical reviews in biotechnology 38 (1):93-105. doi:10.1080/07388551.2017.1312270
Nelson T, Gandotra N, Tausta SL (2008) Plant cell types: reporting and sampling with new technologies. Curr Opin Plant Biol 11 (5):567-573. doi:10.1016/j.pbi.2008.06.006
Netotea S, Sundell D, Street NR, Hvidsten TR (2014) ComPlEx: conservation and divergence of co-expression networks in A. thaliana, Populus and O. sativa. BMC genomics 15:106. doi:10.1186/1471-2164-15-106
Nguyen TP, Keizer P, van Eeuwijk F, Smeekens S, Bentsink L (2012) Natural variation for seed longevity and seed dormancy are negatively correlated in Arabidopsis. Plant physiology 160 (4):2083-2092. doi:10.1104/pp.112.206649
Nicotra AB, Atkin OK, Bonser SP, Davidson AM, Finnegan EJ, Mathesius U, Poot P, Purugganan MD, Richards CL, Valladares F, van Kleunen M (2010) Plant phenotypic plasticity in a changing climate. Trends in plant science 15 (12):684-692. doi:10.1016/j.tplants.2010.09.008
Nijveen H, Ligterink W, Keurentjes JJB, Loudet O, Long J, Sterken MG, Prins P, Hilhorst HW, de Ridder D, Kammenga JE, Snoek BL (2017) AraQTL - workbench and archive for systems genetics in Arabidopsis thaliana. The Plant Journal 89 (6):1225-1235. doi:10.1111/tpj.13457
Obata T, Fernie AR (2012) The use of metabolomics to dissect plant responses to abiotic stresses. Cellular and molecular life sciences : CMLS 69 (19):3225-3243. doi:10.1007/s00018-012-1091-5
190
References |
Obertello M, Shrivastava S, Katari MS, Coruzzi GM (2015) Cross-Species Network Analysis Uncovers Conserved Nitrogen-Regulated Network Modules in Rice. Plant physiology 168 (4):1830-1843. doi:10.1104/pp.114.255877
Paran I, Zamir D (2003) Quantitative traits in plants. Trends in Genetics 19 (6):303-306 Parkinson H (2004) ArrayExpress--a public repository for microarray gene expression
data at the EBI. Nucleic acids research 33 (Database issue):D553-D555. doi:10.1093/nar/gki056
Pavlopoulos GA, Secrier M, Moschopoulos CN, Soldatos TG, Kossida S, Aerts J, Schneider R, Bagos PG (2011) Using graph theory to analyze biological networks. BioData mining 4:10. doi:10.1186/1756-0381-4-10
Penfield S, Josse EM, Halliday KJ (2010) A role for an alternative splice variant of PIF6 in the control of Arabidopsis primary seed dormancy. Plant molecular biology 73 (1-2):89-95. doi:10.1007/s11103-009-9571-1
Penfield S, Josse EM, Kannangara R, Gilday AD, Halliday KJ, Graham IA (2005) Cold and light control seed germination through the bHLH transcription factor SPATULA. Current biology : CB 15 (22):1998-2006. doi:10.1016/j.cub.2005.11.010
Penfield S, MacGregor DR (2017) Effects of environmental variation during seed production on seed dormancy and germination. Journal of experimental botany 68 (4):819-825. doi:10.1093/jxb/erw436
Petretto E, Mangion J, Dickens NJ, Cook SA, Kumaran MK, Lu H, Fischer J, Maatz H, Kren V, Pravenec M, Hubner N, Aitman TJ (2006) Heritability and tissue specificity of expression quantitative trait loci. PLoS genetics 2 (10):e172. doi:10.1371/journal.pgen.0020172
Pikaard CS, Mittelsten Scheid O (2014) Epigenetic regulation in plants. Cold Spring Harbor perspectives in biology 6 (12):a019315. doi:10.1101/cshperspect.a019315
Piskol R, Ramaswami G, Li JB (2013) Reliable identification of genomic variants from RNA-seq data. American journal of human genetics 93 (4):641-651. doi:10.1016/j.ajhg.2013.08.008
Polanski K, Rhodes J, Hill C, Zhang P, Jenkins DJ, Kiddle SJ, Jironkin A, Beynon J, Buchanan-Wollaston V, Ott S, Denby KJ (2014) Wigwams: identifying gene modules co-regulated across multiple biological conditions. Bioinformatics 30 (7):962-970. doi:10.1093/bioinformatics/btt728
Postma FM, Agren J (2015) Maternal environment affects the genetic basis of seed dormancy in Arabidopsis thaliana. Molecular ecology 24 (4):785-797. doi:10.1111/mec.13061
Postmaa FM, Ågrena, Jon. (2016) Early life stages contribute strongly to local adaptation in Arabidopsis thaliana. PNAS 113 (27)
Price AH (2006) Believe it or not, QTLs are accurate! Trends in plant science 11 (5):213-216. doi:10.1016/j.tplants.2006.03.006
Proost S, Van Bel M, Vaneechoutte D, Van de Peer Y, Inze D, Mueller-Roeber B, Vandepoele K (2015) PLAZA 3.0: an access point for plant comparative genomics. Nucleic acids research 43 (Database issue):D974-981. doi:10.1093/nar/gku986
Provero P (2002) Gene networks from DNA microarray data: centrality and lethality. arXiv preprint cond-mat/0207345
191
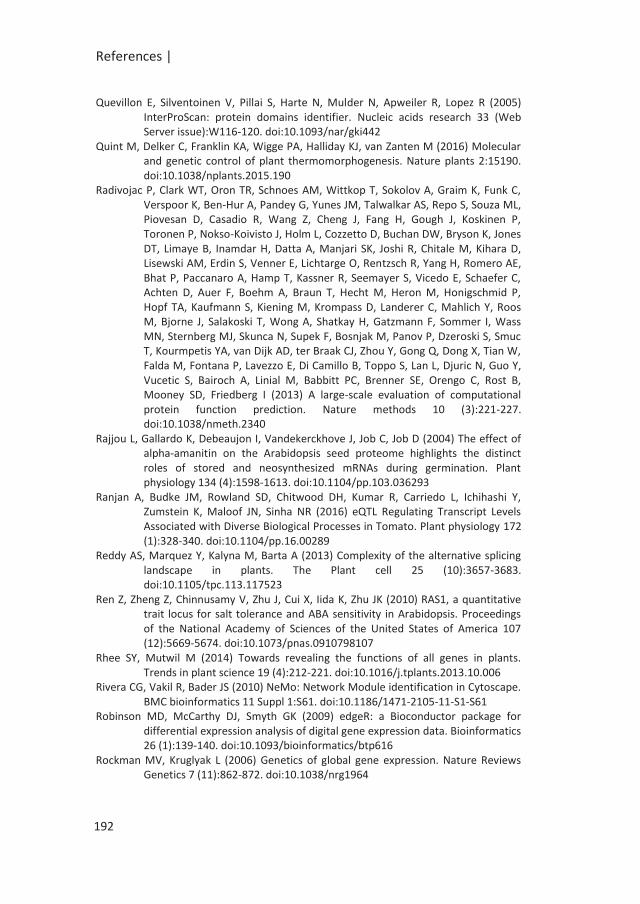
References |
Quevillon E, Silventoinen V, Pillai S, Harte N, Mulder N, Apweiler R, Lopez R (2005) InterProScan: protein domains identifier. Nucleic acids research 33 (Web Server issue):W116-120. doi:10.1093/nar/gki442
Quint M, Delker C, Franklin KA, Wigge PA, Halliday KJ, van Zanten M (2016) Molecular and genetic control of plant thermomorphogenesis. Nature plants 2:15190. doi:10.1038/nplants.2015.190
Radivojac P, Clark WT, Oron TR, Schnoes AM, Wittkop T, Sokolov A, Graim K, Funk C, Verspoor K, Ben-Hur A, Pandey G, Yunes JM, Talwalkar AS, Repo S, Souza ML, Piovesan D, Casadio R, Wang Z, Cheng J, Fang H, Gough J, Koskinen P, Toronen P, Nokso-Koivisto J, Holm L, Cozzetto D, Buchan DW, Bryson K, Jones DT, Limaye B, Inamdar H, Datta A, Manjari SK, Joshi R, Chitale M, Kihara D, Lisewski AM, Erdin S, Venner E, Lichtarge O, Rentzsch R, Yang H, Romero AE, Bhat P, Paccanaro A, Hamp T, Kassner R, Seemayer S, Vicedo E, Schaefer C, Achten D, Auer F, Boehm A, Braun T, Hecht M, Heron M, Honigschmid P, Hopf TA, Kaufmann S, Kiening M, Krompass D, Landerer C, Mahlich Y, Roos M, Bjorne J, Salakoski T, Wong A, Shatkay H, Gatzmann F, Sommer I, Wass MN, Sternberg MJ, Skunca N, Supek F, Bosnjak M, Panov P, Dzeroski S, Smuc T, Kourmpetis YA, van Dijk AD, ter Braak CJ, Zhou Y, Gong Q, Dong X, Tian W, Falda M, Fontana P, Lavezzo E, Di Camillo B, Toppo S, Lan L, Djuric N, Guo Y, Vucetic S, Bairoch A, Linial M, Babbitt PC, Brenner SE, Orengo C, Rost B, Mooney SD, Friedberg I (2013) A large-scale evaluation of computational protein function prediction. Nature methods 10 (3):221-227. doi:10.1038/nmeth.2340
Rajjou L, Gallardo K, Debeaujon I, Vandekerckhove J, Job C, Job D (2004) The effect of alpha-amanitin on the Arabidopsis seed proteome highlights the distinct roles of stored and neosynthesized mRNAs during germination. Plant physiology 134 (4):1598-1613. doi:10.1104/pp.103.036293
Ranjan A, Budke JM, Rowland SD, Chitwood DH, Kumar R, Carriedo L, Ichihashi Y, Zumstein K, Maloof JN, Sinha NR (2016) eQTL Regulating Transcript Levels Associated with Diverse Biological Processes in Tomato. Plant physiology 172 (1):328-340. doi:10.1104/pp.16.00289
Reddy AS, Marquez Y, Kalyna M, Barta A (2013) Complexity of the alternative splicing landscape in plants. The Plant cell 25 (10):3657-3683. doi:10.1105/tpc.113.117523
Ren Z, Zheng Z, Chinnusamy V, Zhu J, Cui X, Iida K, Zhu JK (2010) RAS1, a quantitative trait locus for salt tolerance and ABA sensitivity in Arabidopsis. Proceedings of the National Academy of Sciences of the United States of America 107 (12):5669-5674. doi:10.1073/pnas.0910798107
Rhee SY, Mutwil M (2014) Towards revealing the functions of all genes in plants. Trends in plant science 19 (4):212-221. doi:10.1016/j.tplants.2013.10.006
Rivera CG, Vakil R, Bader JS (2010) NeMo: Network Module identification in Cytoscape. BMC bioinformatics 11 Suppl 1:S61. doi:10.1186/1471-2105-11-S1-S61
Robinson MD, McCarthy DJ, Smyth GK (2009) edgeR: a Bioconductor package for differential expression analysis of digital gene expression data. Bioinformatics 26 (1):139-140. doi:10.1093/bioinformatics/btp616
Rockman MV, Kruglyak L (2006) Genetics of global gene expression. Nature Reviews Genetics 7 (11):862-872. doi:10.1038/nrg1964
192
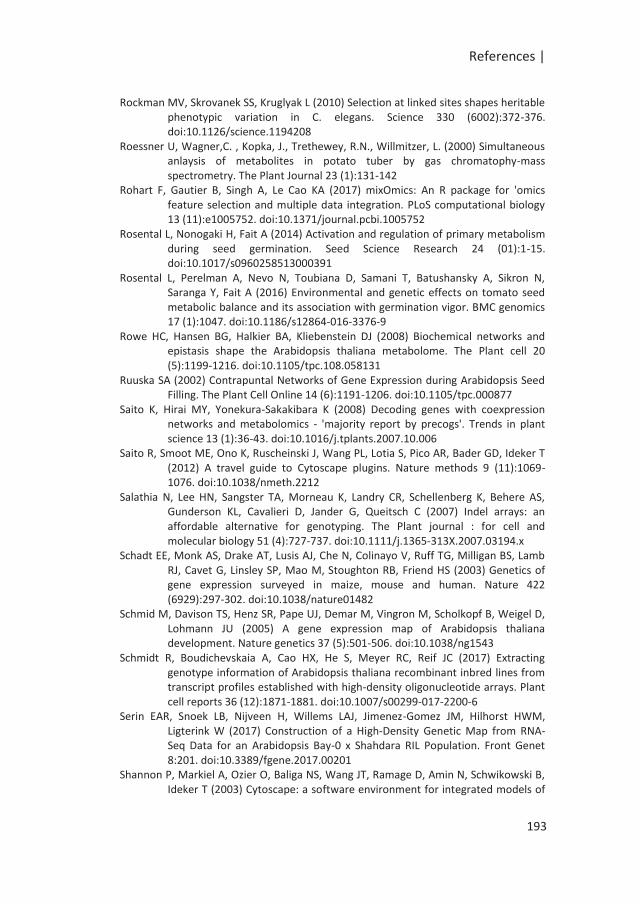
References |
Rockman MV, Skrovanek SS, Kruglyak L (2010) Selection at linked sites shapes heritable phenotypic variation in C. elegans. Science 330 (6002):372-376. doi:10.1126/science.1194208
Roessner U, Wagner,C. , Kopka, J., Trethewey, R.N., Willmitzer, L. (2000) Simultaneous anlaysis of metabolites in potato tuber by gas chromatophy-mass spectrometry. The Plant Journal 23 (1):131-142
Rohart F, Gautier B, Singh A, Le Cao KA (2017) mixOmics: An R package for 'omics feature selection and multiple data integration. PLoS computational biology 13 (11):e1005752. doi:10.1371/journal.pcbi.1005752
Rosental L, Nonogaki H, Fait A (2014) Activation and regulation of primary metabolism during seed germination. Seed Science Research 24 (01):1-15. doi:10.1017/s0960258513000391
Rosental L, Perelman A, Nevo N, Toubiana D, Samani T, Batushansky A, Sikron N, Saranga Y, Fait A (2016) Environmental and genetic effects on tomato seed metabolic balance and its association with germination vigor. BMC genomics 17 (1):1047. doi:10.1186/s12864-016-3376-9
Rowe HC, Hansen BG, Halkier BA, Kliebenstein DJ (2008) Biochemical networks and epistasis shape the Arabidopsis thaliana metabolome. The Plant cell 20 (5):1199-1216. doi:10.1105/tpc.108.058131
Ruuska SA (2002) Contrapuntal Networks of Gene Expression during Arabidopsis Seed Filling. The Plant Cell Online 14 (6):1191-1206. doi:10.1105/tpc.000877
Saito K, Hirai MY, Yonekura-Sakakibara K (2008) Decoding genes with coexpression networks and metabolomics - 'majority report by precogs'. Trends in plant science 13 (1):36-43. doi:10.1016/j.tplants.2007.10.006
Saito R, Smoot ME, Ono K, Ruscheinski J, Wang PL, Lotia S, Pico AR, Bader GD, Ideker T (2012) A travel guide to Cytoscape plugins. Nature methods 9 (11):1069-1076. doi:10.1038/nmeth.2212
Salathia N, Lee HN, Sangster TA, Morneau K, Landry CR, Schellenberg K, Behere AS, Gunderson KL, Cavalieri D, Jander G, Queitsch C (2007) Indel arrays: an affordable alternative for genotyping. The Plant journal : for cell and molecular biology 51 (4):727-737. doi:10.1111/j.1365-313X.2007.03194.x
Schadt EE, Monk AS, Drake AT, Lusis AJ, Che N, Colinayo V, Ruff TG, Milligan BS, Lamb RJ, Cavet G, Linsley SP, Mao M, Stoughton RB, Friend HS (2003) Genetics of gene expression surveyed in maize, mouse and human. Nature 422 (6929):297-302. doi:10.1038/nature01482
Schmid M, Davison TS, Henz SR, Pape UJ, Demar M, Vingron M, Scholkopf B, Weigel D, Lohmann JU (2005) A gene expression map of Arabidopsis thaliana development. Nature genetics 37 (5):501-506. doi:10.1038/ng1543
Schmidt R, Boudichevskaia A, Cao HX, He S, Meyer RC, Reif JC (2017) Extracting genotype information of Arabidopsis thaliana recombinant inbred lines from transcript profiles established with high-density oligonucleotide arrays. Plant cell reports 36 (12):1871-1881. doi:10.1007/s00299-017-2200-6
Serin EAR, Snoek LB, Nijveen H, Willems LAJ, Jimenez-Gomez JM, Hilhorst HWM, Ligterink W (2017) Construction of a High-Density Genetic Map from RNA-Seq Data for an Arabidopsis Bay-0 x Shahdara RIL Population. Front Genet 8:201. doi:10.3389/fgene.2017.00201
Shannon P, Markiel A, Ozier O, Baliga NS, Wang JT, Ramage D, Amin N, Schwikowski B, Ideker T (2003) Cytoscape: a software environment for integrated models of
193
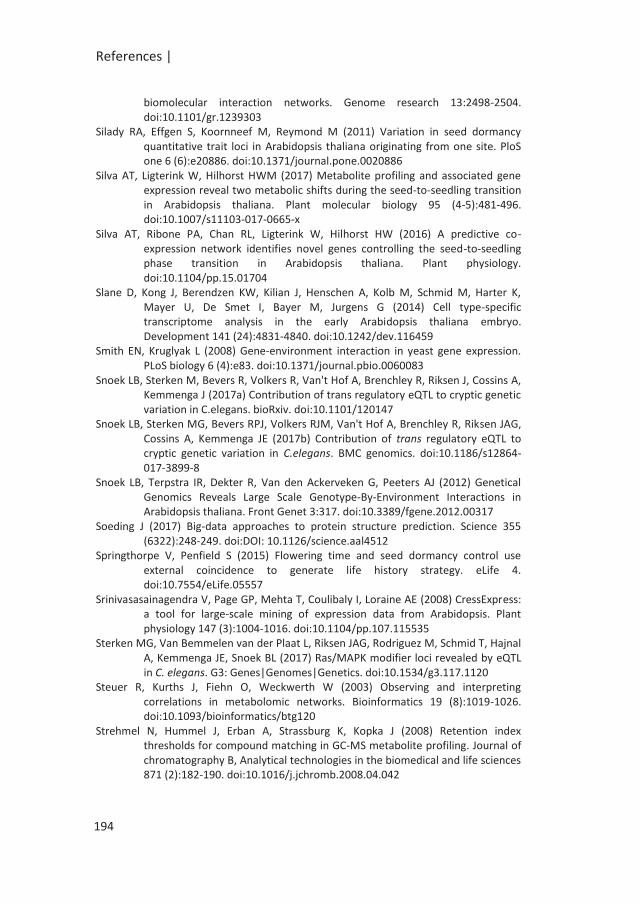
References |
biomolecular interaction networks. Genome research 13:2498-2504. doi:10.1101/gr.1239303
Silady RA, Effgen S, Koornneef M, Reymond M (2011) Variation in seed dormancy quantitative trait loci in Arabidopsis thaliana originating from one site. PloS one 6 (6):e20886. doi:10.1371/journal.pone.0020886
Silva AT, Ligterink W, Hilhorst HWM (2017) Metabolite profiling and associated gene expression reveal two metabolic shifts during the seed-to-seedling transition in Arabidopsis thaliana. Plant molecular biology 95 (4-5):481-496. doi:10.1007/s11103-017-0665-x
Silva AT, Ribone PA, Chan RL, Ligterink W, Hilhorst HW (2016) A predictive co-expression network identifies novel genes controlling the seed-to-seedling phase transition in Arabidopsis thaliana. Plant physiology. doi:10.1104/pp.15.01704
Slane D, Kong J, Berendzen KW, Kilian J, Henschen A, Kolb M, Schmid M, Harter K, Mayer U, De Smet I, Bayer M, Jurgens G (2014) Cell type-specific transcriptome analysis in the early Arabidopsis thaliana embryo. Development 141 (24):4831-4840. doi:10.1242/dev.116459
Smith EN, Kruglyak L (2008) Gene-environment interaction in yeast gene expression. PLoS biology 6 (4):e83. doi:10.1371/journal.pbio.0060083
Snoek LB, Sterken M, Bevers R, Volkers R, Van't Hof A, Brenchley R, Riksen J, Cossins A, Kemmenga J (2017a) Contribution of trans regulatory eQTL to cryptic genetic variation in C.elegans. bioRxiv. doi:10.1101/120147
Snoek LB, Sterken MG, Bevers RPJ, Volkers RJM, Van't Hof A, Brenchley R, Riksen JAG, Cossins A, Kemmenga JE (2017b) Contribution of trans regulatory eQTL to cryptic genetic variation in C.elegans. BMC genomics. doi:10.1186/s12864-017-3899-8
Snoek LB, Terpstra IR, Dekter R, Van den Ackerveken G, Peeters AJ (2012) Genetical Genomics Reveals Large Scale Genotype-By-Environment Interactions in Arabidopsis thaliana. Front Genet 3:317. doi:10.3389/fgene.2012.00317
Soeding J (2017) Big-data approaches to protein structure prediction. Science 355 (6322):248-249. doi:DOI: 10.1126/science.aal4512
Springthorpe V, Penfield S (2015) Flowering time and seed dormancy control use external coincidence to generate life history strategy. eLife 4. doi:10.7554/eLife.05557
Srinivasasainagendra V, Page GP, Mehta T, Coulibaly I, Loraine AE (2008) CressExpress: a tool for large-scale mining of expression data from Arabidopsis. Plant physiology 147 (3):1004-1016. doi:10.1104/pp.107.115535
Sterken MG, Van Bemmelen van der Plaat L, Riksen JAG, Rodriguez M, Schmid T, Hajnal A, Kemmenga JE, Snoek BL (2017) Ras/MAPK modifier loci revealed by eQTL in C. elegans. G3: Genes|Genomes|Genetics. doi:10.1534/g3.117.1120
Steuer R, Kurths J, Fiehn O, Weckwerth W (2003) Observing and interpreting correlations in metabolomic networks. Bioinformatics 19 (8):1019-1026. doi:10.1093/bioinformatics/btg120
Strehmel N, Hummel J, Erban A, Strassburg K, Kopka J (2008) Retention index thresholds for compound matching in GC-MS metabolite profiling. Journal of chromatography B, Analytical technologies in the biomedical and life sciences 871 (2):182-190. doi:10.1016/j.jchromb.2008.04.042
194
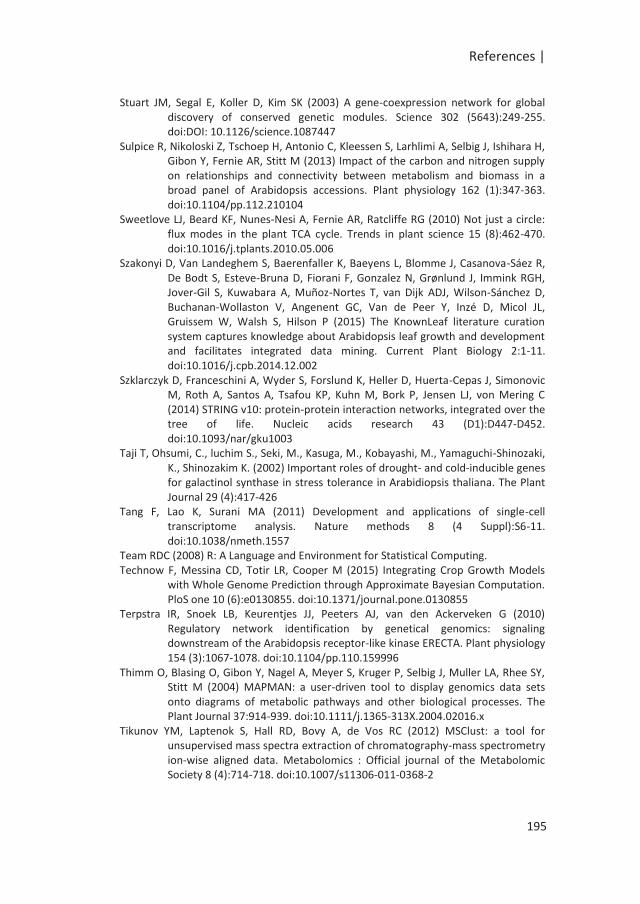
References |
Stuart JM, Segal E, Koller D, Kim SK (2003) A gene-coexpression network for global discovery of conserved genetic modules. Science 302 (5643):249-255. doi:DOI: 10.1126/science.1087447
Sulpice R, Nikoloski Z, Tschoep H, Antonio C, Kleessen S, Larhlimi A, Selbig J, Ishihara H, Gibon Y, Fernie AR, Stitt M (2013) Impact of the carbon and nitrogen supply on relationships and connectivity between metabolism and biomass in a broad panel of Arabidopsis accessions. Plant physiology 162 (1):347-363. doi:10.1104/pp.112.210104
Sweetlove LJ, Beard KF, Nunes-Nesi A, Fernie AR, Ratcliffe RG (2010) Not just a circle: flux modes in the plant TCA cycle. Trends in plant science 15 (8):462-470. doi:10.1016/j.tplants.2010.05.006
Szakonyi D, Van Landeghem S, Baerenfaller K, Baeyens L, Blomme J, Casanova-Sáez R, De Bodt S, Esteve-Bruna D, Fiorani F, Gonzalez N, Grønlund J, Immink RGH, Jover-Gil S, Kuwabara A, Muñoz-Nortes T, van Dijk ADJ, Wilson-Sánchez D, Buchanan-Wollaston V, Angenent GC, Van de Peer Y, Inzé D, Micol JL, Gruissem W, Walsh S, Hilson P (2015) The KnownLeaf literature curation system captures knowledge about Arabidopsis leaf growth and development and facilitates integrated data mining. Current Plant Biology 2:1-11. doi:10.1016/j.cpb.2014.12.002
Szklarczyk D, Franceschini A, Wyder S, Forslund K, Heller D, Huerta-Cepas J, Simonovic M, Roth A, Santos A, Tsafou KP, Kuhn M, Bork P, Jensen LJ, von Mering C (2014) STRING v10: protein-protein interaction networks, integrated over the tree of life. Nucleic acids research 43 (D1):D447-D452. doi:10.1093/nar/gku1003
Taji T, Ohsumi, C., luchim S., Seki, M., Kasuga, M., Kobayashi, M., Yamaguchi-Shinozaki, K., Shinozakim K. (2002) Important roles of drought- and cold-inducible genes for galactinol synthase in stress tolerance in Arabidiopsis thaliana. The Plant Journal 29 (4):417-426
Tang F, Lao K, Surani MA (2011) Development and applications of single-cell transcriptome analysis. Nature methods 8 (4 Suppl):S6-11. doi:10.1038/nmeth.1557
Team RDC (2008) R: A Language and Environment for Statistical Computing. Technow F, Messina CD, Totir LR, Cooper M (2015) Integrating Crop Growth Models
with Whole Genome Prediction through Approximate Bayesian Computation. PloS one 10 (6):e0130855. doi:10.1371/journal.pone.0130855
Terpstra IR, Snoek LB, Keurentjes JJ, Peeters AJ, van den Ackerveken G (2010) Regulatory network identification by genetical genomics: signaling downstream of the Arabidopsis receptor-like kinase ERECTA. Plant physiology 154 (3):1067-1078. doi:10.1104/pp.110.159996
Thimm O, Blasing O, Gibon Y, Nagel A, Meyer S, Kruger P, Selbig J, Muller LA, Rhee SY, Stitt M (2004) MAPMAN: a user-driven tool to display genomics data sets onto diagrams of metabolic pathways and other biological processes. The Plant Journal 37:914-939. doi:10.1111/j.1365-313X.2004.02016.x
Tikunov YM, Laptenok S, Hall RD, Bovy A, de Vos RC (2012) MSClust: a tool for unsupervised mass spectra extraction of chromatography-mass spectrometry ion-wise aligned data. Metabolomics : Official journal of the Metabolomic Society 8 (4):714-718. doi:10.1007/s11306-011-0368-2
195
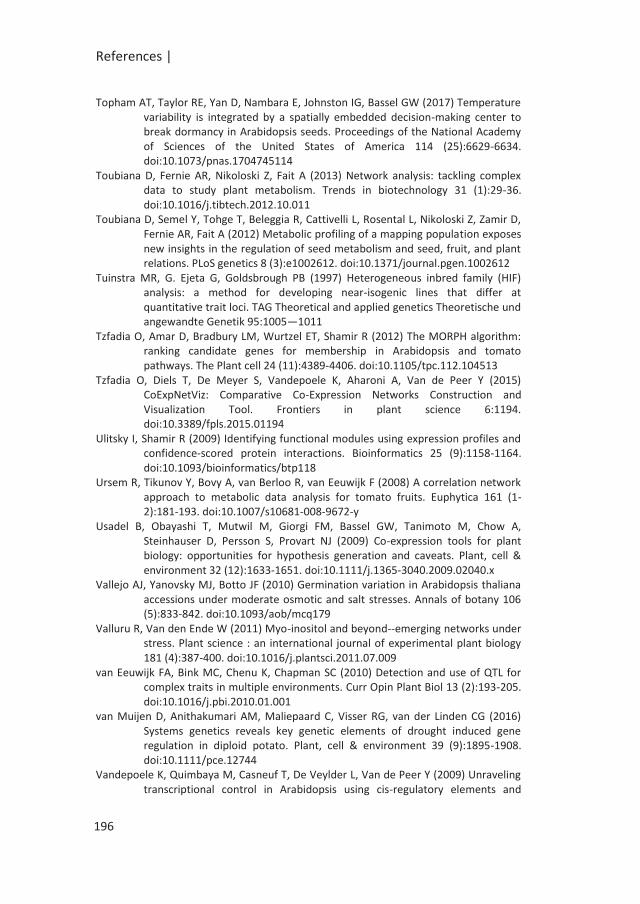
References |
Topham AT, Taylor RE, Yan D, Nambara E, Johnston IG, Bassel GW (2017) Temperature variability is integrated by a spatially embedded decision-making center to break dormancy in Arabidopsis seeds. Proceedings of the National Academy of Sciences of the United States of America 114 (25):6629-6634. doi:10.1073/pnas.1704745114
Toubiana D, Fernie AR, Nikoloski Z, Fait A (2013) Network analysis: tackling complex data to study plant metabolism. Trends in biotechnology 31 (1):29-36. doi:10.1016/j.tibtech.2012.10.011
Toubiana D, Semel Y, Tohge T, Beleggia R, Cattivelli L, Rosental L, Nikoloski Z, Zamir D, Fernie AR, Fait A (2012) Metabolic profiling of a mapping population exposes new insights in the regulation of seed metabolism and seed, fruit, and plant relations. PLoS genetics 8 (3):e1002612. doi:10.1371/journal.pgen.1002612
Tuinstra MR, G. Ejeta G, Goldsbrough PB (1997) Heterogeneous inbred family (HIF) analysis: a method for developing near-isogenic lines that differ at quantitative trait loci. TAG Theoretical and applied genetics Theoretische und angewandte Genetik 95:1005—1011
Tzfadia O, Amar D, Bradbury LM, Wurtzel ET, Shamir R (2012) The MORPH algorithm: ranking candidate genes for membership in Arabidopsis and tomato pathways. The Plant cell 24 (11):4389-4406. doi:10.1105/tpc.112.104513
Tzfadia O, Diels T, De Meyer S, Vandepoele K, Aharoni A, Van de Peer Y (2015) CoExpNetViz: Comparative Co-Expression Networks Construction and Visualization Tool. Frontiers in plant science 6:1194. doi:10.3389/fpls.2015.01194
Ulitsky I, Shamir R (2009) Identifying functional modules using expression profiles and confidence-scored protein interactions. Bioinformatics 25 (9):1158-1164. doi:10.1093/bioinformatics/btp118
Ursem R, Tikunov Y, Bovy A, van Berloo R, van Eeuwijk F (2008) A correlation network approach to metabolic data analysis for tomato fruits. Euphytica 161 (1-2):181-193. doi:10.1007/s10681-008-9672-y
Usadel B, Obayashi T, Mutwil M, Giorgi FM, Bassel GW, Tanimoto M, Chow A, Steinhauser D, Persson S, Provart NJ (2009) Co-expression tools for plant biology: opportunities for hypothesis generation and caveats. Plant, cell & environment 32 (12):1633-1651. doi:10.1111/j.1365-3040.2009.02040.x
Vallejo AJ, Yanovsky MJ, Botto JF (2010) Germination variation in Arabidopsis thaliana accessions under moderate osmotic and salt stresses. Annals of botany 106 (5):833-842. doi:10.1093/aob/mcq179
Valluru R, Van den Ende W (2011) Myo-inositol and beyond--emerging networks under stress. Plant science : an international journal of experimental plant biology 181 (4):387-400. doi:10.1016/j.plantsci.2011.07.009
van Eeuwijk FA, Bink MC, Chenu K, Chapman SC (2010) Detection and use of QTL for complex traits in multiple environments. Curr Opin Plant Biol 13 (2):193-205. doi:10.1016/j.pbi.2010.01.001
van Muijen D, Anithakumari AM, Maliepaard C, Visser RG, van der Linden CG (2016) Systems genetics reveals key genetic elements of drought induced gene regulation in diploid potato. Plant, cell & environment 39 (9):1895-1908. doi:10.1111/pce.12744
Vandepoele K, Quimbaya M, Casneuf T, De Veylder L, Van de Peer Y (2009) Unraveling transcriptional control in Arabidopsis using cis-regulatory elements and
196
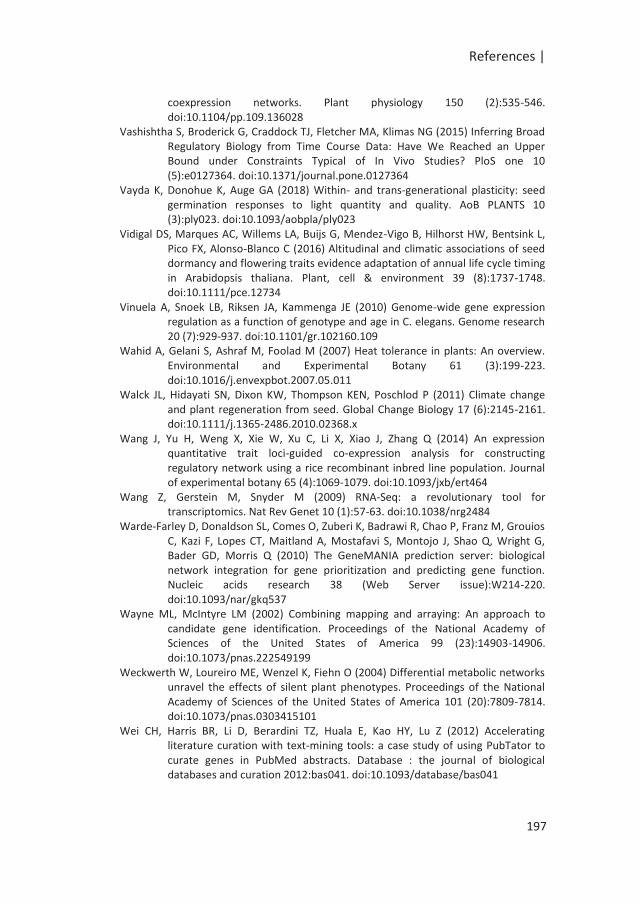
References |
coexpression networks. Plant physiology 150 (2):535-546. doi:10.1104/pp.109.136028
Vashishtha S, Broderick G, Craddock TJ, Fletcher MA, Klimas NG (2015) Inferring Broad Regulatory Biology from Time Course Data: Have We Reached an Upper Bound under Constraints Typical of In Vivo Studies? PloS one 10 (5):e0127364. doi:10.1371/journal.pone.0127364
Vayda K, Donohue K, Auge GA (2018) Within- and trans-generational plasticity: seed germination responses to light quantity and quality. AoB PLANTS 10 (3):ply023. doi:10.1093/aobpla/ply023
Vidigal DS, Marques AC, Willems LA, Buijs G, Mendez-Vigo B, Hilhorst HW, Bentsink L, Pico FX, Alonso-Blanco C (2016) Altitudinal and climatic associations of seed dormancy and flowering traits evidence adaptation of annual life cycle timing in Arabidopsis thaliana. Plant, cell & environment 39 (8):1737-1748. doi:10.1111/pce.12734
Vinuela A, Snoek LB, Riksen JA, Kammenga JE (2010) Genome-wide gene expression regulation as a function of genotype and age in C. elegans. Genome research 20 (7):929-937. doi:10.1101/gr.102160.109
Wahid A, Gelani S, Ashraf M, Foolad M (2007) Heat tolerance in plants: An overview. Environmental and Experimental Botany 61 (3):199-223. doi:10.1016/j.envexpbot.2007.05.011
Walck JL, Hidayati SN, Dixon KW, Thompson KEN, Poschlod P (2011) Climate change and plant regeneration from seed. Global Change Biology 17 (6):2145-2161. doi:10.1111/j.1365-2486.2010.02368.x
Wang J, Yu H, Weng X, Xie W, Xu C, Li X, Xiao J, Zhang Q (2014) An expression quantitative trait loci-guided co-expression analysis for constructing regulatory network using a rice recombinant inbred line population. Journal of experimental botany 65 (4):1069-1079. doi:10.1093/jxb/ert464
Wang Z, Gerstein M, Snyder M (2009) RNA-Seq: a revolutionary tool for transcriptomics. Nat Rev Genet 10 (1):57-63. doi:10.1038/nrg2484
Warde-Farley D, Donaldson SL, Comes O, Zuberi K, Badrawi R, Chao P, Franz M, Grouios C, Kazi F, Lopes CT, Maitland A, Mostafavi S, Montojo J, Shao Q, Wright G, Bader GD, Morris Q (2010) The GeneMANIA prediction server: biological network integration for gene prioritization and predicting gene function. Nucleic acids research 38 (Web Server issue):W214-220. doi:10.1093/nar/gkq537
Wayne ML, McIntyre LM (2002) Combining mapping and arraying: An approach to candidate gene identification. Proceedings of the National Academy of Sciences of the United States of America 99 (23):14903-14906. doi:10.1073/pnas.222549199
Weckwerth W, Loureiro ME, Wenzel K, Fiehn O (2004) Differential metabolic networks unravel the effects of silent plant phenotypes. Proceedings of the National Academy of Sciences of the United States of America 101 (20):7809-7814. doi:10.1073/pnas.0303415101
Wei CH, Harris BR, Li D, Berardini TZ, Huala E, Kao HY, Lu Z (2012) Accelerating literature curation with text-mining tools: a case study of using PubTator to curate genes in PubMed abstracts. Database : the journal of biological databases and curation 2012:bas041. doi:10.1093/database/bas041
197
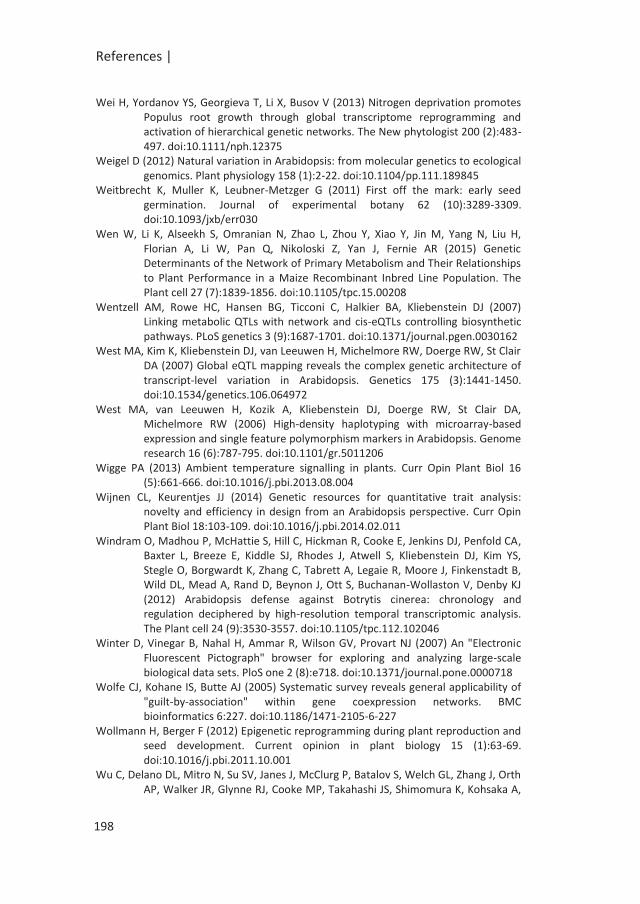
References |
Wei H, Yordanov YS, Georgieva T, Li X, Busov V (2013) Nitrogen deprivation promotes Populus root growth through global transcriptome reprogramming and activation of hierarchical genetic networks. The New phytologist 200 (2):483-497. doi:10.1111/nph.12375
Weigel D (2012) Natural variation in Arabidopsis: from molecular genetics to ecological genomics. Plant physiology 158 (1):2-22. doi:10.1104/pp.111.189845
Weitbrecht K, Muller K, Leubner-Metzger G (2011) First off the mark: early seed germination. Journal of experimental botany 62 (10):3289-3309. doi:10.1093/jxb/err030
Wen W, Li K, Alseekh S, Omranian N, Zhao L, Zhou Y, Xiao Y, Jin M, Yang N, Liu H, Florian A, Li W, Pan Q, Nikoloski Z, Yan J, Fernie AR (2015) Genetic Determinants of the Network of Primary Metabolism and Their Relationships to Plant Performance in a Maize Recombinant Inbred Line Population. The Plant cell 27 (7):1839-1856. doi:10.1105/tpc.15.00208
Wentzell AM, Rowe HC, Hansen BG, Ticconi C, Halkier BA, Kliebenstein DJ (2007) Linking metabolic QTLs with network and cis-eQTLs controlling biosynthetic pathways. PLoS genetics 3 (9):1687-1701. doi:10.1371/journal.pgen.0030162
West MA, Kim K, Kliebenstein DJ, van Leeuwen H, Michelmore RW, Doerge RW, St Clair DA (2007) Global eQTL mapping reveals the complex genetic architecture of transcript-level variation in Arabidopsis. Genetics 175 (3):1441-1450. doi:10.1534/genetics.106.064972
West MA, van Leeuwen H, Kozik A, Kliebenstein DJ, Doerge RW, St Clair DA, Michelmore RW (2006) High-density haplotyping with microarray-based expression and single feature polymorphism markers in Arabidopsis. Genome research 16 (6):787-795. doi:10.1101/gr.5011206
Wigge PA (2013) Ambient temperature signalling in plants. Curr Opin Plant Biol 16 (5):661-666. doi:10.1016/j.pbi.2013.08.004
Wijnen CL, Keurentjes JJ (2014) Genetic resources for quantitative trait analysis: novelty and efficiency in design from an Arabidopsis perspective. Curr Opin Plant Biol 18:103-109. doi:10.1016/j.pbi.2014.02.011
Windram O, Madhou P, McHattie S, Hill C, Hickman R, Cooke E, Jenkins DJ, Penfold CA, Baxter L, Breeze E, Kiddle SJ, Rhodes J, Atwell S, Kliebenstein DJ, Kim YS, Stegle O, Borgwardt K, Zhang C, Tabrett A, Legaie R, Moore J, Finkenstadt B, Wild DL, Mead A, Rand D, Beynon J, Ott S, Buchanan-Wollaston V, Denby KJ (2012) Arabidopsis defense against Botrytis cinerea: chronology and regulation deciphered by high-resolution temporal transcriptomic analysis. The Plant cell 24 (9):3530-3557. doi:10.1105/tpc.112.102046
Winter D, Vinegar B, Nahal H, Ammar R, Wilson GV, Provart NJ (2007) An "Electronic Fluorescent Pictograph" browser for exploring and analyzing large-scale biological data sets. PloS one 2 (8):e718. doi:10.1371/journal.pone.0000718
Wolfe CJ, Kohane IS, Butte AJ (2005) Systematic survey reveals general applicability of "guilt-by-association" within gene coexpression networks. BMC bioinformatics 6:227. doi:10.1186/1471-2105-6-227
Wollmann H, Berger F (2012) Epigenetic reprogramming during plant reproduction and seed development. Current opinion in plant biology 15 (1):63-69. doi:10.1016/j.pbi.2011.10.001
Wu C, Delano DL, Mitro N, Su SV, Janes J, McClurg P, Batalov S, Welch GL, Zhang J, Orth AP, Walker JR, Glynne RJ, Cooke MP, Takahashi JS, Shimomura K, Kohsaka A,
198
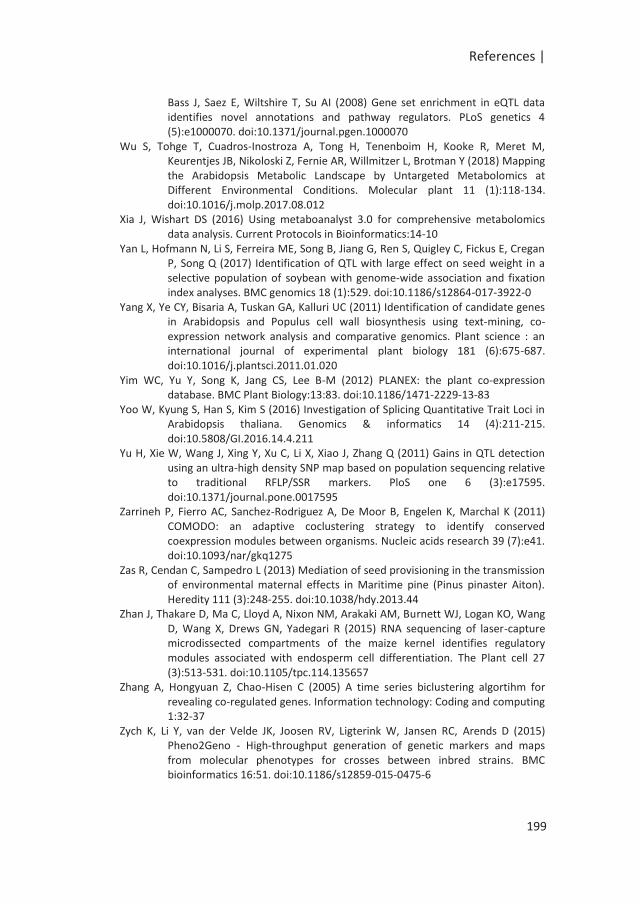
References |
Bass J, Saez E, Wiltshire T, Su AI (2008) Gene set enrichment in eQTL data identifies novel annotations and pathway regulators. PLoS genetics 4 (5):e1000070. doi:10.1371/journal.pgen.1000070
Wu S, Tohge T, Cuadros-Inostroza A, Tong H, Tenenboim H, Kooke R, Meret M, Keurentjes JB, Nikoloski Z, Fernie AR, Willmitzer L, Brotman Y (2018) Mapping the Arabidopsis Metabolic Landscape by Untargeted Metabolomics at Different Environmental Conditions. Molecular plant 11 (1):118-134. doi:10.1016/j.molp.2017.08.012
Xia J, Wishart DS (2016) Using metaboanalyst 3.0 for comprehensive metabolomics data analysis. Current Protocols in Bioinformatics:14-10
Yan L, Hofmann N, Li S, Ferreira ME, Song B, Jiang G, Ren S, Quigley C, Fickus E, Cregan P, Song Q (2017) Identification of QTL with large effect on seed weight in a selective population of soybean with genome-wide association and fixation index analyses. BMC genomics 18 (1):529. doi:10.1186/s12864-017-3922-0
Yang X, Ye CY, Bisaria A, Tuskan GA, Kalluri UC (2011) Identification of candidate genes in Arabidopsis and Populus cell wall biosynthesis using text-mining, co-expression network analysis and comparative genomics. Plant science : an international journal of experimental plant biology 181 (6):675-687. doi:10.1016/j.plantsci.2011.01.020
Yim WC, Yu Y, Song K, Jang CS, Lee B-M (2012) PLANEX: the plant co-expression database. BMC Plant Biology:13:83. doi:10.1186/1471-2229-13-83
Yoo W, Kyung S, Han S, Kim S (2016) Investigation of Splicing Quantitative Trait Loci in Arabidopsis thaliana. Genomics & informatics 14 (4):211-215. doi:10.5808/GI.2016.14.4.211
Yu H, Xie W, Wang J, Xing Y, Xu C, Li X, Xiao J, Zhang Q (2011) Gains in QTL detection using an ultra-high density SNP map based on population sequencing relative to traditional RFLP/SSR markers. PloS one 6 (3):e17595. doi:10.1371/journal.pone.0017595
Zarrineh P, Fierro AC, Sanchez-Rodriguez A, De Moor B, Engelen K, Marchal K (2011) COMODO: an adaptive coclustering strategy to identify conserved coexpression modules between organisms. Nucleic acids research 39 (7):e41. doi:10.1093/nar/gkq1275
Zas R, Cendan C, Sampedro L (2013) Mediation of seed provisioning in the transmission of environmental maternal effects in Maritime pine (Pinus pinaster Aiton). Heredity 111 (3):248-255. doi:10.1038/hdy.2013.44
Zhan J, Thakare D, Ma C, Lloyd A, Nixon NM, Arakaki AM, Burnett WJ, Logan KO, Wang D, Wang X, Drews GN, Yadegari R (2015) RNA sequencing of laser-capture microdissected compartments of the maize kernel identifies regulatory modules associated with endosperm cell differentiation. The Plant cell 27 (3):513-531. doi:10.1105/tpc.114.135657
Zhang A, Hongyuan Z, Chao-Hisen C (2005) A time series biclustering algortihm for revealing co-regulated genes. Information technology: Coding and computing 1:32-37
Zych K, Li Y, van der Velde JK, Joosen RV, Ligterink W, Jansen RC, Arends D (2015) Pheno2Geno - High-throughput generation of genetic markers and maps from molecular phenotypes for crosses between inbred strains. BMC bioinformatics 16:51. doi:10.1186/s12859-015-0475-6
199

References |
Zych K, Snoek BL, Elvin M, Rodriguez M, Van der Velde KJ, Arends D, Westra H-J, Swertz MA, Poulin G, Kammenga JE, Breitling R, Jansen RC, Li Y (2017) reGenotyper: Detecting mislabeled samples in genetic data. PloS one 12 (2):e0171324. doi:10.1371/journal.pone.017132
200

Summary
| Summary
Seed traits are largely influenced by the maternal environment and differences
across genotypes in the response to the maternal environment suggest
significant genotype-by-environment interactions. Genetic variation for such a
response has been reported, however only a few studies have investigated the
genetic basis of seed traits in response to the maternal environment. This
thesis aimed at providing an overview of changes occurring at the phenotypic
and molecular level in response to different maternal environments. This
plasticity was investigated at the genetic level in a quantitative trait locus (QTL)
x environment (E) approach. The results obtained, the tools developed and
insights gained in this thesis are briefly summarized below.
In Chapter 1, I provide a general introduction to this thesis and review current
knowledge on seed quality and resources available to get a better
understanding of the molecular networks controlling seed quality traits with an
emphasis on the influence of the maternal environment.
In Chapter 2 we used RNA-seq data from the parental lines and recombinant
inbred lines (RILs) of an Arabidopsis Bay-0 x Sha population to identify
sequence polymorphisms. The filtering and binning of the detected single-
nucleotide polymorphisms (SNPs) resulted in 1059 genetic markers. These
markers were used to establish a new genetic map for the population. The new
saturated genetic map was compared to two previous genetic maps and it
showed an increased mapping resolution. We showed that RNA-seq data can
effectively be used to derive new markers and at the same time for eQTL
analysis (Chapter 5). This new map was then used in Chapter 3, 4 and 5 to
investigate the genetic basis of dry seed phenotypic, metabolic and
transcriptomic changes in response to different maternal environments.
In Chapter 3 the performance of seeds from the parental lines and RILs grown
under four different maternal environments (standard (ST), high temperature
(HT), high light (HL) and low phosphate (LP)) was assessed under several
germination conditions. Significant interactions were observed between
genotype, maternal and germination conditions. We identified a large number
of QTLs which displayed significant QTL-by-environment interactions. Overall,
this study showed that the maternal environment plays an important role in
the genetic control of seed performance. We further used heterogeneous
inbred families (HIFs) to validate a QTL specific for the high temperature
maternal environment. In addition, we used expression data for the parental
202
Summary |
lines to mine for potential candidate genes in the region of the QTL.
Phytochrome A (PHYA) was found specifically differentially expressed between
Bay-0 and Sha under high temperature. Its known role in the control of
germination and in mediating environmental cues highlighted it as an
interesting candidate for this QTL. Using this approach we showed that
expression data can be used to efficiently narrow down the number of
candidate causal genes for QTLs.
In the following chapters, we investigated changes in the dry seed metabolome
and transcriptome in response to the maternal environment.
In Chapter 4 we explored the dry seed primary metabolome of the parental and
RILs in a generalized genetical genomics (GGG) design. G x E interactions were
investigated using correlation network analysis which revealed condition
specific and coordinated metabolic changes. These genetically driven changes
were linked to mQTLs. A novel mQTL hotspot was found on chromosome 2.
This hotspot indicated a high level of genetic control over carbohydrate
metabolism, with changes in the raffinose oligosaccharides families and TCA
cycle intermediates in the dry seed metabolism in response to stress. We
identified MYO-INOSITOL PHOSPHATASE 2 (MIPS2) as a strong candidate causal
gene for the QTL hotspot involved in myo-inositol synthesis. Overall, the main
mQTL hotspots identified showed limited overlap with the clusters of
phenotypic QTLs identified in Chapter 3. However, the maternal environment
resulted in differences in correlation between phenotypes and metabolites,
suggesting a relation between seed metabolome changes and phenotypic
expression in response to the maternal environment.
Using the same GGG design as in Chapter 4, the transcriptome profiling of the
mature dry seeds of parental lines and RILs was performed by RNA-seq. The
further analysis of this RNA-seq data is described in Chapter 5. Significant G x E
interaction was observed for the transcripts in the parental lines. eQTL analysis
was performed on each RIL subsets defined by the GGG design. The eQTL
features were compared across conditions and we found that local eQTLs were
largely consistent, whereas distant eQTLs were more versatile across
conditions. We noted that the eQTLs, in general, were identified for the same
set of genes across conditions. In addition we found that many eQTL hotspots
were specific for a certain condition. GO enrichment analysis for the set of
203
| Summary
genes with an distant eQTL within these hotspots revealed over-represented
biological processes, which could be linked to seed phenotypic differences.
In Chapter 6, I provide a survey of the literature and discuss the use of co-
expression networks as tool to complement genomics studies and for faster
discovery of genetic variants. The application of this method is promising for
the integration and visualization of high-dimensional datasets as the one
generated in this thesis.
Finally, in Chapter 7, I integrate and discuss the findings of this research with a
particular emphasis on the influence of the maternal environment, the
mechanisms and implications. I also discuss new possibilities for research as
well as the use of additional data to get a more comprehensive understanding
of molecular mechanisms underlying seed traits plasticity in the future.
204

Acknowledgements

| Acknowledgements
Environment matters and I would like to emphasize it one more time in this last
part of my thesis. I had a great time during my PhD and I would like to thank
everyone that was part of my life and created such a positive working
environment for the achievement of this thesis.
First I would like to thank Harro, Richard, Wilco and Henk for giving me the
opportunity to do the PhD in the plant physiology group. I am so grateful I was
surrounded by great scientists eager to share their knowledge and passion for
science. Harro, thank you for your input during the PhD meetings. I will also
remember your great enthusiasm joining all PPH activities even the wildest
ones (Survival in Ede). Richard, thank you for your help and availability until the
last day, I really needed it. Henk and Wilco, thank you for your supervision and
your support from day1 until the submission of the thesis. I really appreciated
the trust and freedom you gave to me during the PhD. Most of all I appreciated
your optimism and innate cheerfulness that buffered some of the most
stressful periods. Thank you also Joost for your external supervision. You gave
me great pieces of advice that helped me to keep focus and finish the PhD.
In the first years of my PhD, I have generated a large amount of data and this
would not have been possible without your help, Leo, Juriaan...and the
Germinator! I really enjoyed working with you. Thank you for your patience,
efficiency and the countless hours spent on sowing seeds. Frank you helped me
a lot with the ‘automated phenotyping’ and I appreciated your input in
particular when you would check the experiment while I was away ‘for my
peace of mind’. Bas, thank you for showing me how to do crosses, although I
did not have as green fingers as you do and this resulted in more hours
dissecting seeds under binoculars.
Another important part of the work happened behind the computer, analysing
the large data sets. For this part of the work, I have to thank you, Martin, for
your help using Genstat. Thank you Harm for your availability (fixing R bugs,
helping me out with ‘the black screen’) but also for exploring with me all
possible ways to perform differential gene expression analysis. Basten, you are
a forward thinker and your enthusiasm for science is without border. It was a
real pleasure to work with you. You helped me to come with new ideas to set-
up the chapters but also brought a different look on my data, seeing light
where I often saw darkness. I am now sure the data are in good hands and that
both of you will make the most out of them.
206

Acknowledgements |
I would also like to thank the external committee, Bert Compaan, Eric
Coppoolse, Corine de Groot, Minako Kaneda and Ronny Joosen for the
constructive discussions during the meetings.
Many thanks to the seed lab in particular, for the great working environment. I
really enjoyed our meetings and discussions.
To all the PPH staff members, Rina, Margarett , Henk, Wilco, Richard, Leonie,
Dick, Robert, Sander, Iris, Carolien, and the technicians Jacqueline, Diaan, Lidiya,
Francel, Marielle, Leo, Juriaan, Andrea thank you for creating a nice working
atmosphere in PPH and sharing your knowledge.
Thank you also to all former and ‘new’ PPH colleagues and friends, Bing, Emilie,
Deborah, Hanzi (gossip queen), Julio, Krystina, Rik, Johanna, Karen, Maria-
Cecilia, Giovanni (R-struggle buddy), Halford, Nasr, Bea, Esmer (“croquette-
hammer”), Shuang, Nikita, Mark L., Mark H., Melissa, Natalia M., Carmen, Alice,
Mahdere, Yuan-Yuan, Bo, Jimmy, Yanting, Nafiseh, Arman, Umid(jon), Yanxia, Xi,
Yunmeng, Sangsoek, Manus, Nelly, Farzaneh, Rumyana, Francesca, Phuong, Bas,
Thierry, Paulo, Anderson, Wei, Jun (your passport!), Desalegn, Chris, Ezequiel,
Thiago.
Thank you all for sharing so much fun during the PPH activities, ‘multi-culti’
parties, bowling, Christmas dinners and Friday afternoon beer sessions, but
also Dutch and Spanish lunches, baby-showers as well as birthdays and other
parties; I cherished all these moments that created lifetime memories (even
the PPH-trip ;-). It was nice to get to know you all and I hope we will keep in
touch in the future!
Bing and Emilie, the reason I asked you to be my paranymphs is because you
are such great friends and I recognized myself a bit in both of you. Bing you are
the craziest guy I know and I am lucky I met you in the first days I moved to
Wageningen. I discovered the ‘International club’ in my first weeks thanks to
you… and so I took you to a famous ‘chicken’ festival in return. Emilie, the
second half of my PhD brought us closer together and we became for some
reason the French PPH team ;-) MERCI for everything you have done for me.
You were always there when I needed a shoulder to cry on but more often
someone to make me laugh.
Maria-Cecilia thank you for the great moments we shared at the University, you
taught me a lot about co-expression networks and even a few words of
Spanish; but also outside, with picnics, dinners, drinks… which then required
extra hours sculpting our bodies with ‘crazy’ Marcel and Meira. I wish you a
207

| Acknowledgements
successful career and I am sure our paths will cross again in this small world
and even smaller country (NL). Bea, you are a big-hearted person. I admire your
kindness and attitude towards life, living life like there’s no tomorrow. Thank
you for everything you have done for me, especially changing my mind off work
with great talks and the trip to Alicante. I would not know how this all would
have ended, without you offering spontaneously your help for printing my
thesis. Many, many thanks again.
Thank you also to the ‘fine dining’ girls, Gonda, Renake and Mariana. You are all
such strong women following their dreams and I admire you for that. I wish you
a lot of ‘success’ in science and in your personal lives. Thank you for all nice
moments spent together in the ‘silent’ room and outside. Gonda and Sam, I will
remember for long our trip in Canada (‘no wayyy !’) and in the USA (even with
only two drink tickets ;-).
A big thank you to all my ‘outside-work’ friends. Doro your kindness made me
feel directly at home when I arrived in Wageningen. Daisy and Abe(pedia) you
are such good housemates and friends. Thank you for all the shared dinner and
endless discussions about science and life, re-inventing the world always with a
glass of wine and/or a few beers. Natalia, thank you also for your nice words
and wise advice in the last bits of my PhD. Keep sharing smiles and spreading
love around you. Thank you to all my friends for all free time activities, Ramon,
Valeria, Claudio and Lidia, Aurélie, Laura, Florian, Agi (it all started with a blind
‘interview’), the N9 team – Gatien, Rik, Rio and Ebel, friends that came to visit
me from France and all the others !
I would also like to thank all my new colleagues for their support, in particular
when it became obviously challenging for me to combine work and submitting
the thesis.
The completion of this thesis would not have been possible without the endless
support of my amazing family. Mama et Hervé, Papa et Brigitte, Nora et Yohann
sans oublier Léonard, merci de tout cœur pour votre présence malgré la
distance et de toujours avoir eu les mots qu’il faut pour me re-booster par
téléphone ou lors de nos retrouvailles.
Finally, if a PhD is the ultimate test of a relationship, I am glad I went through it
with you: Szymon you are ‘the best thing that happened to me’ these last
208

Acknowledgements |
years. Your unconditional support, patience and love brought out the best in
me and made me feel strong. Thank you for everything! I can’t wait to spend
many more years at your side.
To all of you, THANK YOU for making me enjoy every moment of my PhD!
Merci, bedankt, dziekuję, danke, gracias…
209
| About the author
About the author
Elise Anna Renee SERIN was born on 29th July 1989 in Angers, France. She
started her BSc studies in the field of biology, ecology and population genetics
in 2007 at the University of Orléans, France. A summer internship at the
University of Agriculture in Florence, Italy, revealed her interest in molecular
biology and genetic diversity in plants. She decided that same year to join the
Jagiellonian University in Kraków, Poland and completed a first year of master
in plant biotechnologies. Back to France, she pursued a master in Integrative
Plant Biology in Angers and in Rennes with a specialization in quantitative
genetics. She did her master thesis at the INRA in Orléans where she
investigated the genetic architecture of wood property traits in Poplar using
quantitative trait loci mapping approaches. She graduated in 2013 and started
a PhD the same year at the Wageningen University, the Netherlands. During
her PhD at the laboratory of plant physiology, she explored the influence of the
maturation environment on seed performance using genetical genomics
approaches on the model plant Arabidopsis. The results of her PhD are
described in this thesis.
210

About the author|
Publications
Serin , E. A. R., Nijveen, H., Hilhorst, H. W., & Ligterink, W. (2016). Learning from
co-expression networks: possibilities and challenges. Frontiers in plant
science, 7, 444.
Serin, E. A. R., Snoek, L. B., Nijveen, H., Willems, L. A., Jiménez-Gómez, J. M.,
Hilhorst, H. W., & Ligterink, W. (2017). Construction of a High-Density Genetic
Map from RNA-Seq Data for an Arabidopsis Bay-0× Shahdara RIL
Population. Frontiers in genetics, 8, 201
211

Education Statement
212

Education statement |
213

The research presented in this thesis was conducted at the laboratory of Plant
Physiology, Wageningen University.
The research was financially supported by The Dutch Technology Foundation
(TTW), which is part of the Netherlands Organization for Scientific Research
(NWO), and which is partly funded by the Ministry of Economic Affairs.
Financial support from the Wageningen University for printing this thesis is
gratefully acknowledged.
Cover design: Elise A.R. Serin
Printed by: Proefschriftmaken.nl
214