Environmental Statistics and Accounting in Egypt - Joy Hecht
68
Environmental Statistics and Accounting in Egypt: Challenges and Opportunities Study carried out for the USAID DATA Project Ministry of Planning Egyptian Arabic Republic Dr. Joy E. Hecht Consultant on Environmental Economics and Policy Tel: 1-202-494-1162 Email: [email protected] URL: users.rcn.com/jhecht/professional August, 2004
-
Upload
khangminh22 -
Category
Documents
-
view
1 -
download
0
Transcript of Environmental Statistics and Accounting in Egypt - Joy Hecht

Environmental Statistics and
Accounting in Egypt: Challenges and Opportunities
Study carried out for the USAID DATA Project Ministry of Planning
Egyptian Arabic Republic
Dr. Joy E. Hecht Consultant on Environmental Economics and Policy
Tel: 1-202-494-1162 Email: [email protected]
URL: users.rcn.com/jhecht/professional
August, 2004
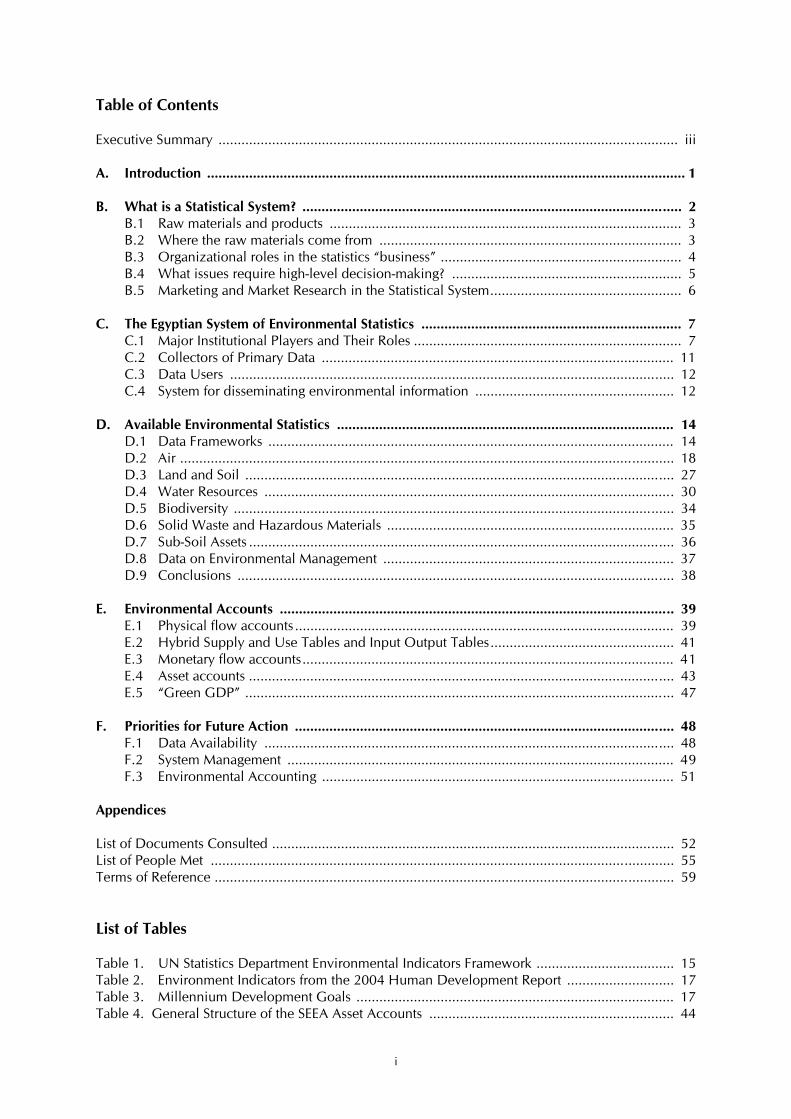
Table of Contents Executive Summary ........................................................................................................................ iii A. Introduction ............................................................................................................................. 1 B. What is a Statistical System? ................................................................................................... 2 B.1 Raw materials and products ............................................................................................ 3 B.2 Where the raw materials come from ............................................................................... 3 B.3 Organizational roles in the statistics “business” ............................................................... 4 B.4 What issues require high-level decision-making? ............................................................ 5 B.5 Marketing and Market Research in the Statistical System.................................................. 6 C. The Egyptian System of Environmental Statistics .................................................................... 7 C.1 Major Institutional Players and Their Roles ...................................................................... 7 C.2 Collectors of Primary Data ............................................................................................ 11 C.3 Data Users .................................................................................................................... 12 C.4 System for disseminating environmental information .................................................... 12 D. Available Environmental Statistics ........................................................................................ 14 D.1 Data Frameworks .......................................................................................................... 14 D.2 Air ................................................................................................................................. 18 D.3 Land and Soil ................................................................................................................ 27 D.4 Water Resources ........................................................................................................... 30 D.5 Biodiversity ................................................................................................................... 34 D.6 Solid Waste and Hazardous Materials ........................................................................... 35 D.7 Sub-Soil Assets ............................................................................................................... 36 D.8 Data on Environmental Management ............................................................................ 37 D.9 Conclusions .................................................................................................................. 38 E. Environmental Accounts ....................................................................................................... 39 E.1 Physical flow accounts ................................................................................................... 39 E.2 Hybrid Supply and Use Tables and Input Output Tables................................................ 41 E.3 Monetary flow accounts................................................................................................. 41 E.4 Asset accounts ............................................................................................................... 43 E.5 “Green GDP” ................................................................................................................ 47 F. Priorities for Future Action ................................................................................................... 48 F.1 Data Availability ........................................................................................................... 48 F.2 System Management ..................................................................................................... 49 F.3 Environmental Accounting ............................................................................................ 51 Appendices List of Documents Consulted ......................................................................................................... 52 List of People Met ......................................................................................................................... 55 Terms of Reference ........................................................................................................................ 59 List of Tables Table 1. UN Statistics Department Environmental Indicators Framework .................................... 15 Table 2. Environment Indicators from the 2004 Human Development Report ............................ 17 Table 3. Millennium Development Goals ................................................................................... 17 Table 4. General Structure of the SEEA Asset Accounts ................................................................ 44
i
List of Figures Figure 1 Components of a statistical system .................................................................................. 3 List of Acronyms BOD biological oxygen demand CAIP Cairo Air Improvement Project (USAID) CAPMAS Central Agency for Public Mobilization and Statistics CEDARE Center for Environment & Development for the Arab Region and Europe COD chemical oxygen demand DO dissolved oxygen EIA environmental impact assessment EIMP Environmental Information and Monitoring Program (DANIDA) EEAA Egyptian Environmental Affairs Agency EEPP Egypt Environmental Policy Program (USAID) EPAP Egyptian Pollution Abatement Project EPEA environmental protection expenditure accounts GHG greenhouse gases GIS geographic information system GOSD General Organization for Sewerage and Drainage (Greater Cairo) IDSC Integrated Decision Support Center IO input-output IPIS Industrial Pollution Information System (EEAA) IUCN International Union for the Conservation of Nature LIFE Livelihood and Income from the Environment (USAID) MALR Ministry of Agriculture and Land Reclamation MDG Millennium Development Goals MLD Ministry of Local Development MOHP Ministry of Health and Population MWRI Ministry of Water Resources and Irrigation NEAP National Environmental Action Plan OEP Office of Energy Policy PM particulate matter PM10 particulate matter at least 10 microns in diameter PSR pressure-state-response (framework for environmental indicators) RSSTI Red Sea Sustainable Tourism Initiative SEEA System of Integrated Economic and Environmental Accounting SNA System of National Accounts SOE State of the Environment SUT supply and use table TSP total suspended particulates TSS total suspended solids UNDP United Nations Development Program UNSD United Nations Statistics Department USEPA United States Environmental Protection Agency VOCs volatile organic compounds
ii
Executive Summary This report covers two distinct but closely related issues. The first is the Egyptian system of environmental statistics. The study considers what we mean by a statistical system, and uses that framework to describe the existing Egyptian environmental statistics system. It considers the institutions that are part of the system, the data the system could aim to include, what it does include, where the gaps are, and what the priorities may be in filling those gaps. The Egyptian environmental statistics system is a loose network of government agencies, donors, and businesses that between them collect, process, produce, and use statistics on air and water quality, solid waste, irrigation, sewerage, soil and agriculture, protected areas, biodiversity, and other subjects. Most data begin and remain within government agencies; public access to both summary reports and the underlying data is rather limited, as is data sharing among ministries. Data on air and water quality are fairly comprehensive, but the system has gaps regarding pollutant emissions, solid waste, and other subjects. There is no overall coordination of the system. Each agency sets its own policies and collects its own data, and no one agency has the authority to require all members of the system to collaborate. Collaboration in several areas could strengthen the system; among them are data sharing among ministries and with the public, documentation of available data, and integration of data systems covering the same topics or clear documentation of explaining why they differ. The second issue addressed in this study is the potential for building environmental accounts in Egypt. “Environmental accounts” build on the national income accounts to address the role of the environment in the economy, the impacts of economic growth on the environment, and the impact of environmental policy on the economy. The introduction of a system of environmental accounts was found to be less urgent than basic improvements in the statistical system. Notwithstanding this, it may be of interest to investigate the development of asset accounts for water and for Red Sea biodiversity, to strengthen analysis of anticipated water shortages and of the links between coral reef conservation and tourist revenues. The report recommends action in three areas: Data Availability: 1. Government actors within the environmental statistics system should identify and vigorously
pursue opportunities to use administrative and regulatory data to construct analytical databases. EEAA, in collaboration with CAPMAS, should take the lead on working with other ministries to identify such opportunities.
2. EEAA, in collaboration with CAPMAS, the Ministry of Industry, and donor agencies, should
consider launching a survey of smaller and medium-sized plants to identify production technology, input use, and resulting emissions, at a detailed sectoral level. Such data could be used to develop Egyptian emissions coefficients, which would provide a reliable basis for estimating national and regional pollutant loads. Such a system would be of considerable interest to other countries as well; possible collaboration with the World Bank Industrial Pollution Projection System should be investigated.
3. CAPMAS, in collaboration with EEAA and the National Accounts Unit of the Ministry of
Planning, and with outside technical assistance as needed, should investigate the possibility of modifying the questionnaires used for the census of industry and the household expenditure survey, to gather data on environmental protection expenditures.
iii
Environmental Statistics System Management: 1. Key players in the environmental statistics system, in collaboration with the USAID DATA
Project, should expand the work begun in this report into a comprehensive publicly-accessible system of environmental metadata. This documentation should be disseminated on the web and updated regularly. Such information will provide government agencies and the public with an understanding of what data exist on the environment and how they can be obtained and used, which in turn should strengthen the use of environmental statistics nationwide.
Environmental Accounting 1. MWRI and MALR should collaborate to explore the possibility of building water accounts, with
which they could address economic implications of the water shortages that are expected to become a problem in the next twenty years.
2. EEAA and the Ministry of Tourism, in collaboration with the Red Sea Governorate and the Red
Sea component of the upcoming USAID LIFE program, should explore the development of resource accounts to understand role of biodiversity the economy, with particular emphasis on the Red Sea coral reefs.
iv
A. Introduction This report covers two distinct but closely related issues. The first is the Egyptian system of environmental statistics. The study considers what we mean by a statistical system, and describes the existing Egyptian environmental statistics using that framework. It considers the institutions that are part of the system, the data it could aim to include, what it does include, where the institutional and statistical gaps are, and what the priorities may be in filling those gaps. The second issue addressed in this study is the potential for building environmental accounts in Egypt. “Environmental accounts” build on the national income accounts to address the role of the environment in the economy, the impacts of economic growth on the environment, and the impact of environmental policy on the economy. The terms of reference for this consultancy focus primarily on the environmental accounts, the inclusion of both the statistical system and the accounts in a single assignment being considered too ambitious. However, because reviewing many aspects of the statistical system is a prerequisite to assessing the possibility of building environmental accounts, it has not been realistic to consider only the accounts. Moreover, as soon as work began, it became clear that strengthening the statistical system is of higher priority than building environmental accounts, suggesting that a study focused only on accounting might miss the key problems facing Egypt in this arena. For both of these reasons, this report considers both statistics and accounting. As a result, it may address each of these topics in somewhat less depth than a report devoted to only one of them. However, it may be hoped that the outcome will be more useful than considering only one in greater depth.
- 1 -
B. What is a statistical system? We can think of a statistical system as a business. On the supply side, it produces a product – useful information – based on inputs – raw data – with a complicated production system that must ensure quality and timeliness at each step along the way. On the demand side there are many different users with differing needs, from detailed real-time data to lengthy historical time series. The users need accurate information about the information products so that they can use them correctly. The system – the business – may also need to market its products to ensure that the users know they are available and make the best possible use of them. There are, of course, significant differences between a private business and a statistical system, and producing effectively-used statistics is not as straightforward as business management. The production of many kinds of statistics is a natural monopoly; the activity is more efficient and the society as a whole is better off if specific data sets are the responsibility of a single entity rather than many entities competing with each other. For example, two competing censuses of population would generate only confusion, not a better product than a single census. Statistical data also have many characteristics of public goods. The society as a whole benefits from use of many kinds of statistics, and it is not possible to exclude individuals from consuming those benefits. For example, the use of an updated census of population to define voting districts is necessary for a democracy to function properly. In addition, while it is possible to exclude individuals from using statistics (as opposed to excluding them from benefiting from their use by others), the marginal cost of additional users is often zero or very low, while the benefits of additional users are high, so restricting access is not in the public interest (although it may be in the interest of the institution producing the data by giving it leverage over other ministries). A statistical system differs from a business in another key way. The production of many kinds of basic information is considered to be a responsibility of government rather than of private individuals. Statistical surveys are more valuable if every one has to respond to them. Only the government has the legal authority to require citizens to provide information; a private data collector can ask for information or pay for it, but either tactic will skew the results. Moreover the costs of major data collection efforts are so high that in some cases they must be justified, at least initially, by the social benefits they provide rather than by the possibility of selling the output; therefore the effort must be undertaken by the public sector. From an institutional perspective, the statistical system also differs from a business. Statistical data are typically produced by many different institutions, rather than by an integrated company that can ensure that the output of one part of its factory meets the input needs of another part. Because the government agencies producing the data have a degree of autonomy and decide which data to produce based on their own needs rather than on the needs of other government users or the public, ensuring compatibility among the data products in the system is a significant management challenge. Figure 1 shows a general picture of the components of a statistical system. A number of different organizations and roles are involved; data collectors, data processors, producers of reports and bulletins, and disseminators of information. The data collectors gather raw data from various sources, so that they can serve as the input to the production processes. The outputs are disseminated to the users, who may include a wide range of individuals and organizations. The system as a whole is coordinated by the core players; those with a primary mandate in the field, key data collectors, and those with cross-cutting responsibility for information in the country.
- 2 -

Figure 1. Components of a statistical system
Components of a statistical system
Core players: Primary mandate for the subject and for information systems in general.
Key players in setting statistical system policies.
B.1 Raw materials and products The raw material of the statistical system is data, gathered from several sources in the society. The data are subjected to a variety of processing techniques, leading to manufacture of a wide range of different products. Some products require relatively little processing; those are the raw data be used for operational purposes and research. Other products require conversion of raw data into summaries, time series trends, and other aggregate presentations that are published in documents and on the web. Users of such data are very varied. Data on education, for example, might be used by the education ministry to design policy or allocate students to elementary schools, by universities to design strategies to attract students, by employers to determine where they can find qualified workers, by social action groups to analyze whether different races have equal access to education and so on. Summary tables might be used directly, or they might be an input into sophisticated analyses whose results then influence decisions. Some of the data may be further processed into indicators used to track how well the country is doing, or how it compares with other countries. Thus a single data system can produce a wide range of products targeting many different users. B.2 Where the raw materials come from The raw materials of the statistical system are of several types. Some data are gathered in routine national survey or census activities whose direct purpose is to build data. A census of population or of manufacturers is of this type, conducted every five or ten years with the specific intent of creating valid ongoing time series data. Such data collection is often carried out by a public institution with a
Collect primary data
Process data
Produce dataproducts
Raw data
Disseminate data products:
base data, summaries, analyses, metadata
Data
Users User groups:
Advise on how data are
collected, processed,
disseminated
- 3 -
specific mandate to collect information, such as Egypt’s Central Agency for Public Mobilization and Statistics (CAPMAS). In some cases another national ministry has authority for national censuses and surveys in its area of expertise; thus the Ministry of Agriculture and Land Reclamation (MALR) conducts the census of agriculture, and the Ministry of Tourism gathers information about visitors to the country. Other raw data are collected because they are needed for routine operational activities. Data are collected in hospitals to manage patients’ health; water quality and flow data are collected by the Ministry of Water Resources and Irrigation (MWRI) to manage the irrigation system. While these data are collected for administrative or management purposes, they are often also compiled into databases to use them for policy analysis or to track trends as well. Similarly, raw data are collected to meet regulatory or enforcement obligations. Egyptian Environmental Affairs Agency (EEAA) inspectors gather data on factory emissions into water and air in order to enforce the environmental standards set by Law 4 of 1994; the Cairo General Organization for Sewage and Drainage (GOSD) inspects industrial effluent into the sewer network to ensure that factories are complying with discharge limits. These data can also be used to build analytical databases for policy use. Many data are gathered in narrower one-time surveys in order to answer specific questions for management or policy purposes. While the resulting databases are not as valuable as routine time series surveys or censuses, data collected for one purpose may often be useful for others not anticipated by those gathering the information. These databases are also products of the statistical system. They need to be identified and made available to a range of users just as the bigger databases are, in order to make best use of the statistical system. Such single-purpose surveys are much more likely to be carried out privately, by researchers, business associations, or others with the means to collect data. Because they can be privately owned, public access to them can be more difficult to obtain than for the large public databases. However, such data sources can provide a wealth of useful information. B.3 Organizational roles in the statistics “business” The institutions active within a statistical system play a number of distinct roles. There is not a one-to-one correspondence between agencies and roles; often one institution plays several roles. Collecting primary data is the responsibility both of statistical organizations like CAPMAS and of
specialized ministries and agencies, and includes survey work, administrative and regulatory database management, and collection of special purpose data.
Data must be processed to put them in a form in which they can be used. Most data collectors
also do some processing, while other organizations only process data collected by others. Data must be disseminated if they are to be used, on paper, on CDs and tapes, or through the
web. Designing data dissemination paths is part of the marketing system of the statistics business. Like marketing and sales in a private company, how this is done can mean the difference between a statistics system whose products are used widely and accurately and one whose products are not used.
Data cannot be disseminated by themselves; they must be accompanied by metadata –
documentation that includes descriptions of how the figures were collected and what they mean, the questionnaires used for surveys, the laboratory methods for physical samples, how aggregates were calculated, how observations in society were classified into variable values, and so on. Producing this kind of documentation is time-consuming meticulous work, but without it the data will not be used accurately.
- 4 -
In many countries “value added” data processors obtain public data, usually for a price, and do additional processing to create products sold to businesses and other organizations. Some firms of this type already operate in Egypt. If public data become more timely and more readily available, it is likely that this type of economic activity will grow, since it provides services of considerable value to the business community.
Users of statistical data have many needs; they run government programs, manage treatment
plants, evaluate public policies, track the economy, make business decisions, take care of hospital patients, carry out epidemiological research, decide which crops to plant, design advertising campaigns, even write school papers. All of these are valid uses of the information; they are the reason why the society as a whole, through its public sector, invests in the statistical system.
Any business needs a few high-level managers who set policy and strategy for the company as a
whole, insure that its parts are well integrated with each other, oversee all of the operations, and identify priorities for future investment and growth. The statistical “business” is no different. Because it is made up of a loose network of largely autonomous institutions, however, it is often not at all clear who has the authority to take charge, what control they can have over the actions of the other institutions, and which decisions should be made system-wide rather than by the individual components of the system.
Determining who manages the system, how, and designing a system to ensure that the autonomous components of the system will collaborate with the management, is a key element of the development of “statistical policy.” If high-level management is effective, and all parts of the system respect the process by which certain system-wide decisions are made, then the managers may be able to help the institutions within the system resolve more detailed problems about data sharing and compatibility. Without the high-level management, there may not be any way to ensure the integration of the system as a whole.
B.4 What issues require high-level decision-making? The managers of a national statistical system will have to take the lead in balancing three key issues: Privacy policy. Individuals and private organizations will not collaborate with census-takers and
other data-collectors if they do not have some guarantee of privacy. The legal authority that allows public agencies to collect data must come with legal controls specifying which data must not be released, to protect individual privacy or business trade secrets.
• National security. Some data must be protected for reasons of national security. At a minimum
this is likely to include information about military technology and force levels. What else it includes is a matter of national policy. Historically many countries have tried to protect a great deal of information in the name of national security, but the trend is for this to be scaled back. The development of new data-gathering technologies has eliminated the national capacity restrict access to data in the name of security. Now that anyone can buy satellite images, for example, restricting access to maps and spatial data is pointless.
• Data access. To achieve the goals of the statistical system, the data must be accessible. This
overarching need is the flip side of the two previous considerations; while privacy and security provide reasons for limiting data access, the fundamental purpose of the system is to permit it. System managers will have to balance these considerations against each other, to determine how best to maximize the good that can be gotten from the data while minimizing the threats to privacy or security.
- 5 -
In data collection agencies worldwide it is often argued that access to data should be limited, because the users will not know how to interpret the information and will use it incorrectly. Government statisticians who have invested their lives to build serious databases do not want to see the information “misused,” as they perceive it, by people who do not know what it means. While data can and often are misused – anyone who doubts it should read the popular paperback How to Lie with Statistics1 – this possibility does not justify limiting access to data. Data are most often misused because they are not properly documented, so users do not actually know how they can be interpreted. This problem is solved through thorough data documentation, not by limiting access. Beyond that, the data producing institution is not responsible for the use made of its products any more than a clothing manufacturer is responsible if a customer wears a jacket as a dress. The system managers will help sort out the roles played by the different institutions in the system. When agencies have overlapping mandates, the managers may facilitate discussion among them to resolve conflicts or eliminate duplication. They will help ensure technical compatibility among data on related subjects and ensure that differences between related systems are clearly documented. The system managers may also play an advisory role on the design of data dissemination systems, transparent policies on data pricing, and clear policies regarding when permission is required to access information. The system managers, in collaboration with the other institutions in the system, will have to decide how broadly they want to define their authority. We have been talking about statistical data, but the principles that apply to statistics also apply to libraries, government documents, satellite images, and other sources of information. In time many of the policies and management systems developed for one kind of data may be applied others as well. B.5 Marketing and Market Research in the Statistical System In the corporate world, firms conduct surveys or organize focus groups to develop new product ideas and assess whether consumers are likely to be interested in them. In the statistics world, market research takes the form of bringing together groups that include both producers and potential users of data, so they know each other and understands each others’ needs and constraints. They include data suppliers, processors, disseminators, and users of all kinds. The users provide input at all stages of the “business,” from the design of data collection forms to the development of data documentation to the elaboration of summary reports to the mechanics of data distribution to the justification of pricing policies.
1 Darrell Huff, 1993, How to Lie with Statatistics. (New York, W. W. Norton)
- 6 -

C. The Egyptian System of Environmental Statistics The previous chapter considered the concept of a statistical system in general. This chapter applies that concept to the Egypt environmental statistics system. This system is one piece within the larger national statistics system. Therefore some of the high-level management issues regarding data access and dissemination may be resolved by others outside of the agencies specifically responsible for environmental information. The broad questions of how the overall Egyptian statistical system is or should be designed go beyond the focus of this study; they are the subject of another report being prepared concurrently with this one.2
This chapter considers the institutions that make up the environmental statistics system, the roles they play, and how effectively the system is working. The next chapter discusses the data themselves, identifying strengths and gaps in the data collected and in the systems for making them available to users. C.1 Major Institutional Players and Their Roles Three Egyptian institutions are playing or could play cross-cutting roles in the Egyptian environmental statistics system; the Egyptian Environmental Affairs Authority (EEAA), CAPMAS, and the Integrated Decision Support Center (IDSC). Egyptian Environmental Affairs Agency EEAA, an arm of the Ministry of Environment, has basic responsibility for managing environmental statistics for the country. Law 4 of 1994, which created the agency, gives it the following duties (among others):
Gather national and international information on the environmental situation and the changes affecting it on a periodical basis in cooperation with the information centres of other agencies, publish such information and evaluate and utilize it in environmental management and planning. Participate in the preparation and implementation of the national programme for environmental monitoring and make use of the data provided thereby. Compile and publish periodic reports on the main environmental indicators. Prepare an annual report on the environmental situation to be submitted to the President of the Republic and the Cabinet, a copy of which shall be deposited at the People's Assembly.
This mandate gives EEAA a central role in compiling data collected by other agencies, processing them, and disseminating them. No other agency has this explicit responsibility for environmental data. EEAA has been able to compile some of the key environmental data produced by other ministries. They are using the public data of other ministries, such as the Office of Energy Planning’s work on energy use and greenhouse gas emissions. More importantly, they use some data that are not public, such as information on solid waste management from the Ministry of Local Development and the governorates. However they have not been able to negotiate arrangements with some other
2 Forthcoming study on Egyptian statistical policy by Donald Eldridge, Consultant to the DATA Project, Ministry of Planning.
- 7 -
key data producers, notably MWRI and MOHP, to receive their environmental monitoring data. While EEAA is mandated to compile such data, they do not have the authority to compel other ministries to share them. EEAA is disseminating a great deal of information about the environment and about Egyptian environmental management issues through its website, http://www.eeaa.gov.eg. They are using the web to streamline many activities, including environmental impact assessment, management of hazardous materials, identification of donor projects, development of cleaner production technologies, and many other activities and information sources. The development of their website has clearly been a priority within EEAA, and it is an excellent source of information about their activities. They agency has also invested considerable resources in environmental quality monitoring, with the support of several donor projects. This has led to the development of a number of well-structured databases on specific environmental quality issues, notably air and coastal water quality. Information systems development has also been a clear focus of attention within EEAA, and they have well-designed systems to manage data on solid waste, environmental impact assessments, industrial inspections, and other activities within their mandate. A broader perspective on environmental monitoring could strengthen this system. This would involve broad strategic thinking about the information needed to effectively manage Egypt’s environment, and a systematic effort to ensure that those data are being collected, disseminated, and used. EEAA is well aware of the data being produced in other ministries, and of their inability to access some of them. They do not have a clear sense of which data are not being produced at all, or of any substantive policy need for additional raw materials. If an overall information system plan exists, we did not hear about it. The focus of EEAA’s work seems to be at a more detailed level, with more emphasis on developing the software for data management than on ensuring that the data themselves are available and are used. EEAA’s dissemination of statistical data is also modest in scope. The only information readily available to the public is the series of monthly reports on air and coastal water quality, disseminated on the Agency’s website.3 The Agency prepares reports on greenhouse gas emissions, industrial inspections, and other environmental issues, but they are for internal use and are available to other government agencies or outsiders only upon special request. Some raw data are also made available upon request; for example, we were told that researchers could access the raw data on air and water quality if they demonstrated that they would use them for legitimate purposes. The reason for requiring that each request be individually approved was, according to EEAA staff, to minimize the chance of the information being misused. Aside from the air and water quality monitoring reports, we did not see any documentation of the data being collected. We requested and received lists of the variables stored in the databases on solid waste, industrial inspections, and environmental impact assessments (EIAs), but these included little or no descriptive information beyond the variable names, and were not intended to serve as data documentation for people outside the information systems group in EEAA. EEAA has contracted with the Center for Environment and Development for the Arab Region and Europe (CEDARE) to prepare the 2004 state of the environment report. In the past these reports have been made available to the cabinet of ministers, but so far none has been published. Several reasons have been suggested for why these reports have not been made public – that the data on which they were based were not good enough, that EEAA and CEDARE could not access the data needed to prepare the reports, that they do not reflect well on the country – but we do not know which of these reasons is accurate. Both CEDARE and EEAA expressed hope that the 2004 report,
3 Available at http://www.eeaa.gov.eg/eimp/airreports.html (air) and http://www.eeaa.gov.eg/eimp/ cwreports.html (water).
- 8 -
which has been circulated in draft, will be approved by the new Minister of Environment and published by the end of the summer. CAPMAS CAPMAS is Egypt’s national statistical agency, with basic responsibility for primary data collection and dissemination. They are the agency with legal authority to compel citizens and businesses to provide information for public use, and they conduct the census of population, the census of manufacturing, and many other basic data collection activities. They also have the authority to issue permits to other governmental and private agencies to collect primary data.4
Presidential Decree No. 2915 of 1964, which created CAPMAS in its current form, gives the agency several key responsibilities in the national statistical system:
Article 9: CAPMAS shall develop an annual program for statistical publications, bulletins, indicators and data required for the sectors of the state through coordination with the authorities concerned. CAPMAS itself may take up issuing all publications, indicators and statistical data produced by the state's authorities or part of them. In such case, publication process shall be deducted from the budget of the agency concerned. Article 10: Any ministry, authority or agency or any individual, individuals in the government, public sector or private sector may - through any of the publication media or mass media - not publish any publications, results or statistical data or information from any source except from the reality of statistics of CAPMAS. The statistics that are not included in the programs of CAPMAS may not be published without an approval of CAPMAS.
In practice, CAPMAS plays some, but not all of these roles. They do a lot of census and survey work, and provide the base data used for other purposes, such as the construction of the national income accounts. They have an annual program of statistical publications and bulletins. However their data dissemination system is not strong. Among prospective users of data, one of the major complaints is that CAPMAS data are issued too late to be of use, or are not available at all. Routine statistical publications are available to other government agencies but not to the public. Moreover, despite their authority to disseminate the data of other ministries, they do not have the authority to compel those ministries to share information. Like EEAA, they must negotiate with other ministries for access to information, and frequently CAPMAS is not in a strong enough position to succeed in those negotiations. CAPMAS is involved, along with a number of other government agencies (IDSC, Ministry of Local Development, Ministry of Housing, and so on) with an elaborate hierarchical network of data collectors throughout Egypt. This network was initially conceived as a way to create jobs for educated young people at the local level. One person in each satellite community – the lowest level in the hierarchy of settlements and local governments in the country – has been hired to collect information about his or her community. The data collectors are all high school graduates, and many have completed university. They are responsible for gathering information about their villages as needed by the government agencies involved with this system. Nationwide some thirty-two thousand people are part of this data collection network, including individuals at all levels in the hierarchy of settlements and local governments. They have provided data to donors and to IDSC, and are apparently a source of information needed by the Ministries of Housing, Local Development, and perhaps others. They collect social and demographic information about
4 For additional discussion of CAPMAS’s role in the Egyptian statistical system, please see the reports produced concurrently with this one by two other consultants to the DATA Project, Frank Cajthaml and Donald Eldridge.
- 9 -

households, but do not collect physical measurements about the environment.5 This network might play a role in future development of environmental statistics. CAPMAS created an environmental statistics department in 2003. Because it is new, the department does not yet have strong connections in EEAA and the ministries collecting environmental data, and they do not have access to most of the environmental information.6 The DATA Project works closely with CAPMAS, and this consultancy was used in part to help the new department build its ties to other ministries. Mrs. Nadia Idrees, Director of Environmental Statistics, accompanied Dr. Hecht to most of her meetings, as did some of the other department staff. The department staff is working to define its role in the environmental statistics arena and to identify needs for survey work and for an environmental statistics bulletin. If the bulletin is available to the public, it should play a useful role in data dissemination. If additional surveys are developed in the environmental arena, as suggested in the recommendations in this report, CAPMAS may be involved in conducting them. This report also recommends development of a comprehensive system of environmental metadata. If this is pursued, CAPMAS could be a key player in surveying projects and agencies to locate data sources. Integrated Decision Support Center (IDSC) IDSC exists to provide information and decision support to the Office of the Prime Minister. They also have a broader role as an information center for the country as a whole. They have built a website through which they hope to provide a wide range of statistical information about the country, called the Egypt Information Portal.7 Based on a cursory review of the information on the site, it appears to be too general to meet most serious statistical needs. IDSC expects to expand this portal over time. As statistical information becomes available on the websites of other ministries, they also expect to link to those sites to lead users to more data. IDSC is also seeking a role as a creator of metadata about Egyptian statistics and as a clearinghouse for information. They have built a National Data Directory, in which they hope to document databases in and about Egypt.8 Like their information portal, it is in the early stages of development. Although it has a place-holder for environmental statistics, right now there is almost nothing there. Neither the statistics themselves nor the information about available data includes specific details about exactly where data come from, how they have been calculated, or how the user can access them.9 IDSC is currently developing metadata about the databases maintained by the MWRI, which are to go up on their site as soon as they have received ministerial approval. The willingness of MWRI to make their metadata public and to rely on IDSC to publish it suggests that IDSC could come to be a major player in accessing information about sources of Egyptian statistics in the future. Unfortunately we could not access the MWRI metadata during this consultancy to assess their completeness; MWRI staff said that IDSC had to authorize us to see them in advance of their inclusion on the website, and we were not able to contact the appropriate IDSC staff about the matter.
5 For additional information about this network, please see the report produced by Frank Cajthaml for the DATA Project. 6 Interestingly, they have been able to obtain the Ministry of Health and Population reports that EEAA has trouble accessing; it is not clear how they accessed those documents. 7 http://www.eip.gov.eg/sources/international_dalel.asp. 8 http://unstats.un.org/unsd/environment/indicators.htm. 9 For a detailed discussion of the IDSC website, see the report produced by Frank Cajthaml, on a DATA Project consultancy carried out concurrently with this one.
- 10 -
If the additional work on environmental metadata recommended in this report is implemented, IDSC may play a major role in the effort. Their existing relationship with MWRI may be helpful in encouraging other ministries to join the effort, and their website and data documentation expertise will be essential. This is discussed further in the final chapter of this report. C.2 Collectors of Primary Data Many government ministries and donor projects collect data related to the environment. Some of the key players in the data collection arena are described below. This is by no means a comprehensive list; it will be expanded if additional work is pursued on the development of environmental metadata. The next chapter of this report presents more detailed information about specific databases whenever we have it. Ministry of Water and Irrigation: Collects data on flows of water in the Nile, the networks of canals flowing off the river, the networks of drainage systems into which water runs off the fields, and groundwater. MWRI also maintains a network of water quality monitoring stations throughout the country. The Ministry is major player in the collection of primary data on the environment. Ministry of Agriculture and Land Reclamation: Conducts the census of agriculture, which provides data about each crop cultivated. If anyone has data on use of agrochemicals, it will be this ministry. They should also have spatial information on arable land, soil characteristics, and other land-related data. They have collaborated with MWRI on the development of spatial data systems. Ministry of Health and Population: Maintains ambient data on air and surface water quality. Tests drinking water and should have data on its quality. Maintains health statistics, some of which can be used to address environmental health issues. Ministry of Local Development (MLD): Responsible for solid waste management. They obtain data on trash collection from the governorates, and pass some of the information on to EEAA, although we could not determine exactly where those data come from or on what they are based. They also are involved with the network of thirty-two thousand data collectors, from which they obtain data on village characteristics such as access to sanitation and drinking water; these are managed in a GIS within MLD. Ministry of Housing: The Ministry is responsible for sanitation and drinking water. They maintain information on access to sanitation and drinking water at the local level, though we were not able to determine the exact nature or source of those data. Ministry of Petroleum and Natural Gas: Data on types of fuel used by sector, stocks of oil and natural gas, extractions, and other data on energy sources. In the past, some of these data were readily made available to the Office of Energy Policy (OEP) for analytical use and publication of reports, including “Energy in Egypt,” an annual statistical survey of the sector. Since OEP was moved from the Ministry of Petroleum to the Ministry of Planning, they have had trouble accessing data on energy sources. Ministry of Electricity: Data on electricity generation and use and thus on energy use. These are made available to OEP for use in its analytical work and inclusion in “Energy in Egypt.” Cairo General Organization for Sewage and Drainage (GOSD): GOSD manages the sewage collection and treatment system for Greater Cairo. They collect operational data on their system, data on the quality of industrial discharges into the system, and data on the quality of treated water discharged from the sewage treatment plants into the Nile. They produce reports on these data for internal use, though some of the information also has broader environmental implications.
- 11 -
C.3 Data users Identifying the users of environmental data is difficult, but essential to ensure that the statistical system meets its needs. When data are made available only to a restricted set of users, as is the case with most Egyptian data, the users are identified as those who receive the reports. Thus EEAA, MWRI, GOSD, and other agencies reported that their reports are produced for their managers and technical staff, their ministers, and the Cabinet of Ministers, and they identify these people as the users of their information. When the data are public, as in the case of the EIMP environmental quality monitoring data, the data producing agencies often report that they are used by “everyone.” They do not track who downloads their data, so in fact they do not know who uses the information or for what purpose. This is quite easy to find out, however, especially when data are distributed through the web. By requiring those who download reports to identify themselves and indicate how they will use the information, EEAA or other ministries will have some understanding of the demand for their data. Such information could also be used to identify those who should participate in data user groups, which should be formed to advise on additional data needs. The formation of data user groups may be an effective way to fill the most difficult gap, the identification of unmet information needs. By bringing together data producers, those already known to use the available data, and those whom we might expect should be interested in the data, discussion can be initiated that helps ensure that each group understands the others’ needs and constraints, and the products produced will be more likely to meet the consumers’ needs. For the Egyptian environmental statistics system, user groups (probably more than one, focusing on different subject areas within the statistical system) should include: Ministries that produce data Government agencies playing a cross-cutting role in the system, i.e. EEAA, CAPMAS, and IDSC Consulting firms working on environmental issues Non-profit organizations working on environmental issues Trade associations working in relevant fields Donor agencies Academic researchers
C.4 System for disseminating environmental information An environmental statistics system should include an effectively implemented strategy for dissemination of statistics, based on an understanding of the users and their information needs. For the most part this does not exist in Egypt. The only information regularly made public includes summary reports of the air and coastal water measurements carried out by EEAA’s Environmental Information and Monitoring Program (EIMP). This system was set up by DANIDA and has been continued by EEAA with the end of foreign funding. Beyond this, the default approach in all of the ministries contacted is that the data are for internal use within the ministry, or for carefully arranged exchange with other ministries, but are not for public use. The EEPP-Air paper “Air Quality Information Dissemination Plan” is the only attempt to think strategically about data dissemination that we identified. It identifies how specific data products would be used. Its focus is on air quality early warning, so it calls for: A daily air quality index used by individuals to modify their own behavior, to reduce either their
exposure or their contribution to air pollution. Daily weather and pollution data used to anticipate possible “black cloud” incidents, so that
EEAA and the Ministry of Environment can coordinate with the MALR to prevent them.
- 12 -
It then recommends how the data used to create these indicators should be accessed: The wealth of air pollution studies produced by CAIP, EEPP, and other projects should be made
available on the web so that any interested stakeholders can make use of them. Monthly air quality reports should be produced and put on the web for public access.
An information dissemination system – or several plans, in different areas – for the broader environmental statistics system will address similar questions, but with regard to a much broader range of information needs. It will be the outcome of discussions between data suppliers and users. Such plans must identify information products needed, how they are likely to be used, and the dissemination methods needed to ensure that they are used. They must also identify needs for interagency collaboration and data sharing. Whenever there is not a compelling security argument for doing otherwise, the full databases should be made available on line for use by the public, in the most detailed format that will protect the identities of individual survey respondents.
- 13 -

D. Available Environmental Statistics This chapter describes the environmental statistics that could be identified within the relatively short time frame of this mission. The information presented here comes from a variety of sources, including personal visits to many ministries and agencies (listed in Appendix B), other documents consulted during the mission, and prior work in Egypt by the author of this report while consulting to EEPP on environmental indicators. This list is by no means complete. We were not able to visit all ministries that might have comprehensive data pertaining to the environment, often because the importance of certain agencies or types of data did not become apparent until it was too late in the mission to pursue them. Moreover in the ministries we did visit, we surely have not identified all of the available information sources. In particular, more information on agricultural pollution and land use/ land cover is surely available from the Ministry of Agriculture, and more information on sanitation and drinking water supply should be available from the Ministry of Housing. Other data are certainly available from EEAA, MWRI, and MOPH. Additional data on industrial pollution may be available from the Ministries of Industry and Interior. We have not been able to systematically determine the extent of collaboration on spatial data, particularly whether standardized base maps of Egypt are shared among all developers of geographic information systems.10
Nevertheless, this compilation provides a good point of departure for a more systematic effort to identify and document sources of environmental information in Egypt. One of the key recommendations of this study is that the key organizations involved with environmental statistics work together with the DATA Project over the next year to carry out that identification and documentation, to produce comprehensive metadata on environmental information sources. Additional information from readers of this study about other data sources will be welcomed by the DATA Project. D.1 Data Frameworks Actors within the Egyptian environmental statistics system have not agreed on which data should be part of their system, or on a general framework for organizing statistics. Such a framework would be useful, because it would define the universe of information to consider in allocating roles within the statistical system and make it easier to identify gaps in the system. For this reason, before reviewing the specific data sources, we will consider several data or indicator frameworks suggested by other organizations, to see whether any of them would be useful in describing the environmental statistics system. UN Statistics Division Framework This framework for environmental indicators was developed through the UN Statistics Division in the 1990s, and is summarized in Table 1.11 Like many indicator frameworks, it is based on the pressure-state-response (PSR) framework. The PSR framework differentiates pressures that affect environmental quality, the state of the environment (before the pressure, once it has occurred, and after society responds to changes in state due to the pressure), and societal responses to changes in environmental quality. This is useful because it makes clear the differences between ambient quality of air, water, or other media, on the one hand, and the human pollution, population growth, or other activities that can affect environmental quality, on the other hand. 10 A consultant will be coming to Cairo through the DATA Project early in the fall to consider this issue in particular. 11 Details on this framework may be found on the web at http://unstats.un.org/unsd/environment/ indicators.htm.
- 14 -

Table 1. UN Statistics Department Environmental Indicators Framework
FDES Information categories Agenda 21 Issues (clusters)
A. Socioeconomic activities, events
B. Impacts and effects C. Responses to impacts
D. Inventories, stocks, background conditions
ECONOMIC ISSUES
Real GDP per capita growth rate Production and consumption patterns Investment share in GDP
EDP/EVA per capita Capital accumulation (environmentally adjusted)
Environmental protection expenditure as % of GDP Environmental taxes and subsidies as % of government revenue
Produced capital stock
SOCIAL/ DEMO- GRAPHIC ISSUES
Population growth rate Population density Urban/rural migration rate Calorie supply per capita
% of urban population exposed to concentrations of SO2, particulates, ozone, CO and Pb Infant mortality rate Incidence of environmentally related diseases
Population living in absolute poverty Adult literacy rate Combined primary and secondary school enrollment ratio Life expectancy at birth Females per 100 males in secondary school
AIR/ CLIMATE
Emissions of CO2, SO2 and NOx
Consumption of ozone depleting substances
Ambient concentrations of CO, SO2, NOx O3 and TSP in urban areas Air quality index
Expenditure on air pollution abatement Reduction in consumption of substances and emissions
Weather and climate conditions
LAND/SOIL
Land use change Livestock per km2 of arid and semi-arid lands Use of fertilizers Use of agricultural pesticides
Area affected by soil erosion Land affected by desertification Area affected by salinization and water logging
Protected area as % of total land area
Arable land per capita
WATER Fresh water resources, Marine water resources
Industrial, agricultural and municipal discharges directly into freshwater bodies Annual withdrawals of ground and surface water Domestic consumption of water per capita Industrial, agricultural water use per GDP Industrial, agricultural and municipal discharges directly into marine water bodies Discharges of oil into coastal waters
Concentration of lead, cadmium, mercury and pesticides in fresh water bodies Concentration of fecal coliform in fresh water bodies Acidification of fresh water bodies BOD and COD in fresh water bodies Water quality index by fresh water bodies Deviation in stock from maximum sustainable yield of marine species Loading of N and P in coastal waters
Waste water treatment, total and by type of treatment (% of population served) Access to safe drinking water (% of population served)
Groundwater reserves
- 15 -

OTHER NATURAL RESOURCES Biological resources, Mineral (incl. energy) resources
Annual roundwood production Fuelwood consumption per capita Catches of marine species Annual energy consumption per capita Extraction of other mineral resources
Deforestation rate Threatened, extinct species Depletion of mineral resources (% of proven reserves) Lifetime of proven reserves
Reforestation rate Protected forest area as % of total land area
Forest inventory Ecosystems inventory Fauna and flora inventory Fish stocks Proven mineral reserves Proven energy reserves
WASTE
Municipal waste disposal Generation of hazardous waste Imports and exports of hazardous wastes
Area of land contaminated by toxic waste
Expenditure on waste collection and treatment Waste recycling
HUMAN SETTLE-MENTS
Rate of growth of urban population % of population in urban areas Motor vehicles in use per 1000 habitants
Area and population in marginal settlements Shelter index % of population with sanitary services
Expenditure on low-cost housing
Stock of shelter and infrastructure
NATURAL DISASTERS
Frequency of natural disasters
Cost and number of injuries and fatalities related to natural disasters
Expenditure on disaster prevention and mitigation
Human settlements vulnerable to natural disasters
Source: http://unstats.un.org/unsd/environment/indicators.htm This is a comprehensive framework, which could be adapted for use in Egypt by eliminating measures that are not relevant and modifying some others. It is familiar to EEAA, and has been considered in work on environmental statistics and indicators. There is no evidence, however, that it has actively been used to guide statistics or indicator development in the country. Human development report - environment components The Human Development Report is published annually by the United Nations. It includes a text discussion of the issue of focus in that year’s volume – for 2004 it is cultural freedom and diversity – and data reporting national progress on a set of indicators covering economic, social, cultural, and environmental issues. The environmental indicators from the 2004 report, along with Egypt’s performance on each of them, are shown in Table 2. A quick look at this list quickly shows that it is focused largely on international environment issues, rather than the issues that will be of domestic concern in Egypt. Most of the indicators address energy issues, and thus the country’s contribution to global warming. The traditional fuel consumption measure may also shed some light on level of development in relation to energy use. Whether the country is a signatory to the various international conventions clearly focuses on international rather than domestic concerns. These indicators are therefore not likely to provide a useful framework for an Egyptian system of environmental statistics.
- 16 -
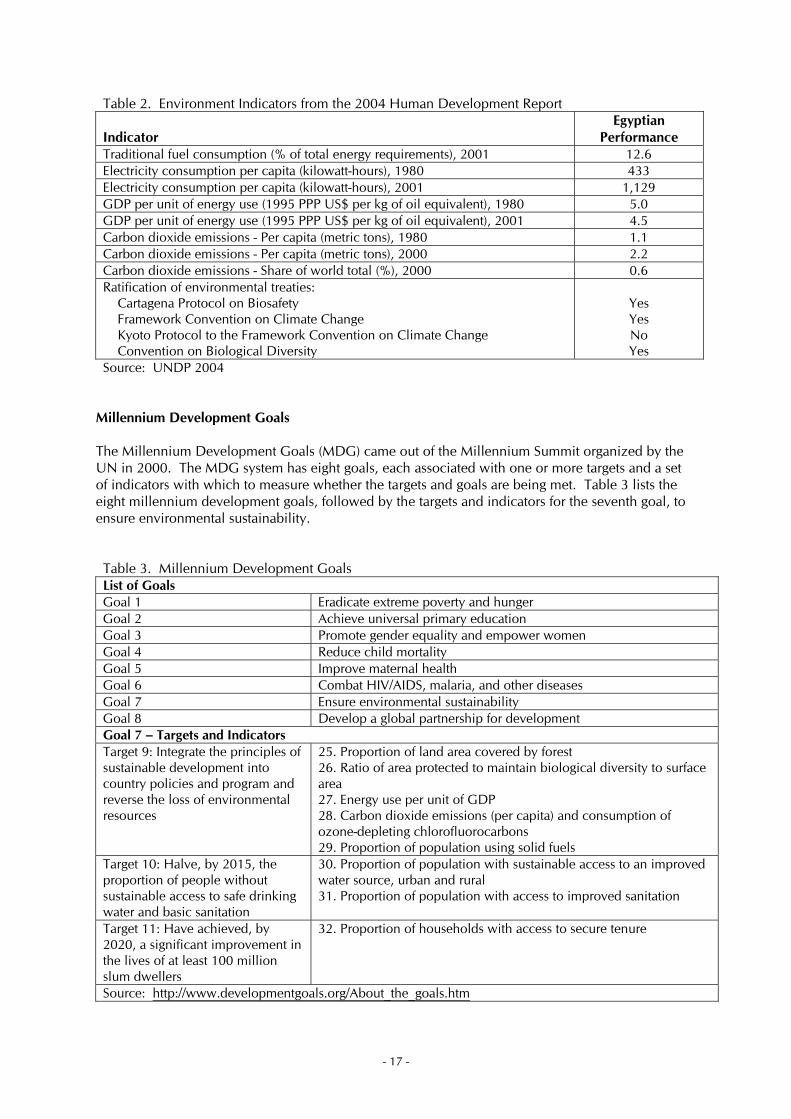
Table 2. Environment Indicators from the 2004 Human Development Report Indicator
Egyptian Performance
Traditional fuel consumption (% of total energy requirements), 2001 12.6 Electricity consumption per capita (kilowatt-hours), 1980 433 Electricity consumption per capita (kilowatt-hours), 2001 1,129 GDP per unit of energy use (1995 PPP US$ per kg of oil equivalent), 1980 5.0 GDP per unit of energy use (1995 PPP US$ per kg of oil equivalent), 2001 4.5 Carbon dioxide emissions - Per capita (metric tons), 1980 1.1 Carbon dioxide emissions - Per capita (metric tons), 2000 2.2 Carbon dioxide emissions - Share of world total (%), 2000 0.6 Ratification of environmental treaties: Cartagena Protocol on Biosafety Framework Convention on Climate Change Kyoto Protocol to the Framework Convention on Climate Change Convention on Biological Diversity
Yes Yes No Yes
Source: UNDP 2004 Millennium Development Goals The Millennium Development Goals (MDG) came out of the Millennium Summit organized by the UN in 2000. The MDG system has eight goals, each associated with one or more targets and a set of indicators with which to measure whether the targets and goals are being met. Table 3 lists the eight millennium development goals, followed by the targets and indicators for the seventh goal, to ensure environmental sustainability. Table 3. Millennium Development Goals List of Goals Goal 1 Eradicate extreme poverty and hunger Goal 2 Achieve universal primary education Goal 3 Promote gender equality and empower women Goal 4 Reduce child mortality Goal 5 Improve maternal health Goal 6 Combat HIV/AIDS, malaria, and other diseases Goal 7 Ensure environmental sustainability Goal 8 Develop a global partnership for development Goal 7 – Targets and Indicators Target 9: Integrate the principles of sustainable development into country policies and program and reverse the loss of environmental resources
25. Proportion of land area covered by forest 26. Ratio of area protected to maintain biological diversity to surface area 27. Energy use per unit of GDP 28. Carbon dioxide emissions (per capita) and consumption of ozone-depleting chlorofluorocarbons 29. Proportion of population using solid fuels
Target 10: Halve, by 2015, the proportion of people without sustainable access to safe drinking water and basic sanitation
30. Proportion of population with sustainable access to an improved water source, urban and rural 31. Proportion of population with access to improved sanitation
Target 11: Have achieved, by 2020, a significant improvement in the lives of at least 100 million slum dwellers
32. Proportion of households with access to secure tenure
Source: http://www.developmentgoals.org/About_the_goals.htm
- 17 -
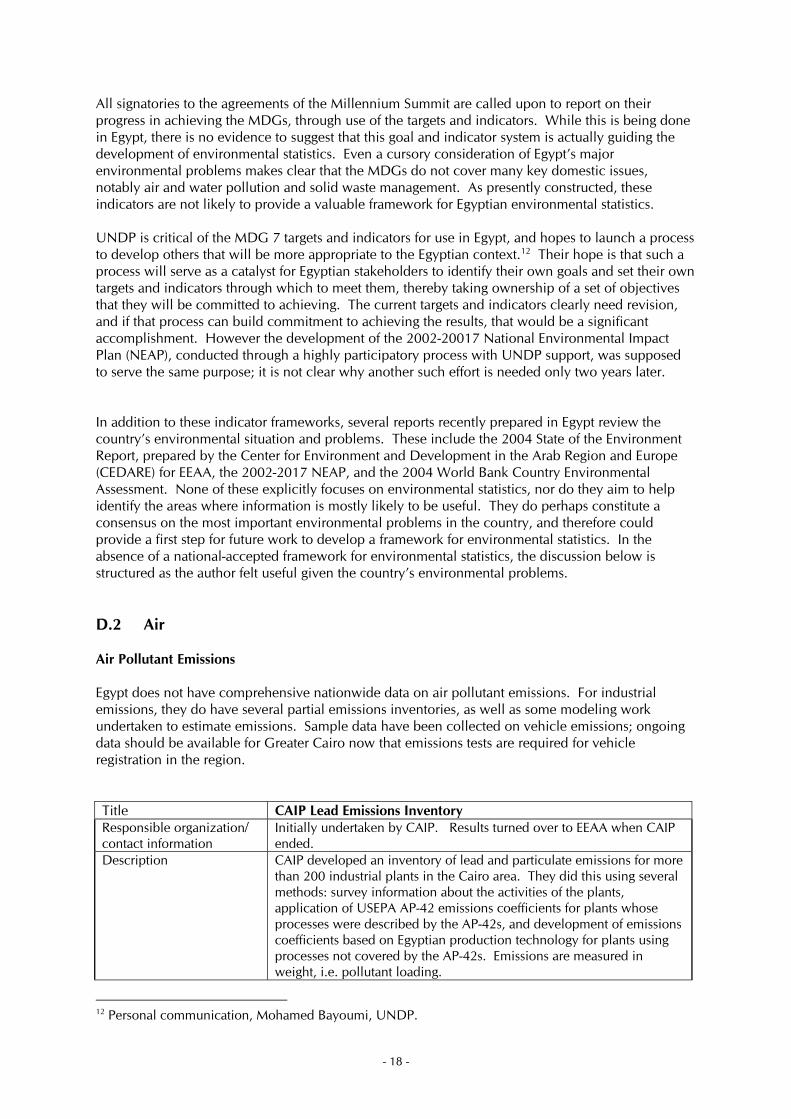
All signatories to the agreements of the Millennium Summit are called upon to report on their progress in achieving the MDGs, through use of the targets and indicators. While this is being done in Egypt, there is no evidence to suggest that this goal and indicator system is actually guiding the development of environmental statistics. Even a cursory consideration of Egypt’s major environmental problems makes clear that the MDGs do not cover many key domestic issues, notably air and water pollution and solid waste management. As presently constructed, these indicators are not likely to provide a valuable framework for Egyptian environmental statistics. UNDP is critical of the MDG 7 targets and indicators for use in Egypt, and hopes to launch a process to develop others that will be more appropriate to the Egyptian context.12 Their hope is that such a process will serve as a catalyst for Egyptian stakeholders to identify their own goals and set their own targets and indicators through which to meet them, thereby taking ownership of a set of objectives that they will be committed to achieving. The current targets and indicators clearly need revision, and if that process can build commitment to achieving the results, that would be a significant accomplishment. However the development of the 2002-20017 National Environmental Impact Plan (NEAP), conducted through a highly participatory process with UNDP support, was supposed to serve the same purpose; it is not clear why another such effort is needed only two years later. In addition to these indicator frameworks, several reports recently prepared in Egypt review the country’s environmental situation and problems. These include the 2004 State of the Environment Report, prepared by the Center for Environment and Development in the Arab Region and Europe (CEDARE) for EEAA, the 2002-2017 NEAP, and the 2004 World Bank Country Environmental Assessment. None of these explicitly focuses on environmental statistics, nor do they aim to help identify the areas where information is mostly likely to be useful. They do perhaps constitute a consensus on the most important environmental problems in the country, and therefore could provide a first step for future work to develop a framework for environmental statistics. In the absence of a national-accepted framework for environmental statistics, the discussion below is structured as the author felt useful given the country’s environmental problems. D.2 Air Air Pollutant Emissions Egypt does not have comprehensive nationwide data on air pollutant emissions. For industrial emissions, they do have several partial emissions inventories, as well as some modeling work undertaken to estimate emissions. Sample data have been collected on vehicle emissions; ongoing data should be available for Greater Cairo now that emissions tests are required for vehicle registration in the region. Title CAIP Lead Emissions Inventory Responsible organization/ contact information
Initially undertaken by CAIP. Results turned over to EEAA when CAIP ended.
Description CAIP developed an inventory of lead and particulate emissions for more than 200 industrial plants in the Cairo area. They did this using several methods: survey information about the activities of the plants, application of USEPA AP-42 emissions coefficients for plants whose processes were described by the AP-42s, and development of emissions coefficients based on Egyptian production technology for plants using processes not covered by the AP-42s. Emissions are measured in weight, i.e. pollutant loading.
12 Personal communication, Mohamed Bayoumi, UNDP.
- 18 -

Timing/Frequency One-time data collection effort conducted in 1999. How data are accessed The full database was transferred to EEAA when the CAIP project ended.
The inventory is described in the “1999 Baseline Lead Emissions Inventory for the Greater Cairo Area,” produced by CAIP in September 2000.
Title CAIP Ambient Air Pollution Source Attribution Study Responsible organization/ contact information
This study was undertaken by CAIP. The database was turned over to EEAA when CAIP ended.
Description CAIP undertook an analysis of ambient air pollution to identify sources of pollution in Greater Cairo. They focused on the sources of particulate matter (PM) and volatile organic compounds (VOCs). Ambient air quality was measured at six sites.
Timing/Frequency Periods of 24-hour monitoring; every day from February 21 to March 3, 1999 and every other day from October 27 to November 27, 1999. This monitoring was used to describe ambient air quality. The analysis of sources was undertaken one time.
How data are accessed The study is described in the CAIP report “1999 Source Attribution Study: Final Report,” by Douglas Lowenthal, Alan Gertler, and Mahmoud Abu-Allaban. Published in May 2001, it describes methodology and results.
Title EEPP-Air – Greater Cairo Emissions Model Responsible organization/ contact information
The study was carried out by EEPP-Air. Results, including the spreadsheets explaining the methodology, were turned over to EEAA when EEPP-Air ended.
Description The study used the World Bank Industrial Pollution Projection System (IPPS) to estimate air pollutants from six sectors of Egyptian industry. There were no actual measurements; this is a modeling exercise.
Timing/Frequency One-time study How data are accessed Some description of methods and results available in EEPP Air Quality
Program, March 2004, “Ambient Air Quality Status Report: Technical Support document for Development of the National Air Quality Strategy Framework”
Title EEAA – EPAP – South Cairo Air Pollutant Emissions Inventory Responsible organization/ contact information
Hanan El Hadary Project Manager, Egyptian Pollution Abatement Project EEAA Tel: 202-525-6442/6452 x 8603/7605
Description Pollutant emissions from industry in southern Cairo, pollutant dispersal maps, estimated costs of health impacts and costs of pollution abatement. The emissions were estimated using a number of different methods, including actual measurement of pollutant concentrations, use of emission coefficients from other sources, estimation of Egyptian emission coefficients.
Timing/Frequency One-time study How data are accessed The reports are available from the EPAP office at EEAA. Data about
individual plants are confidential, so some reports cannot be released.
- 19 -
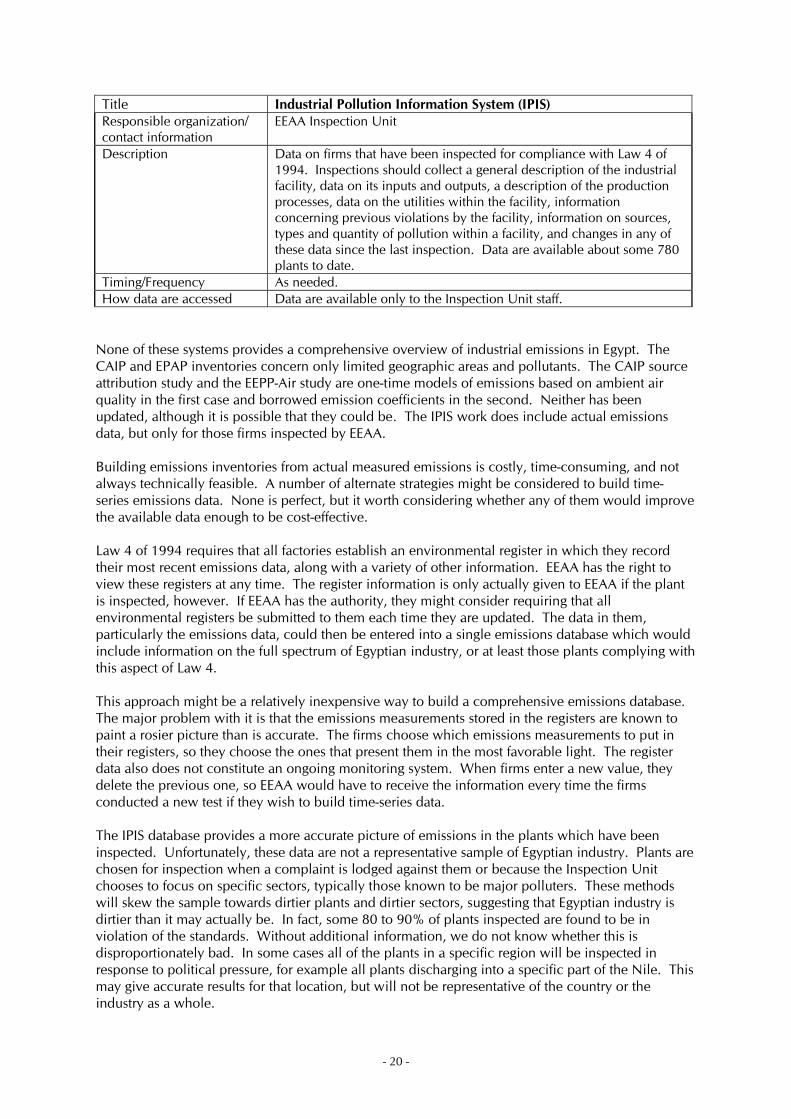
Title Industrial Pollution Information System (IPIS) Responsible organization/ contact information
EEAA Inspection Unit
Description Data on firms that have been inspected for compliance with Law 4 of 1994. Inspections should collect a general description of the industrial facility, data on its inputs and outputs, a description of the production processes, data on the utilities within the facility, information concerning previous violations by the facility, information on sources, types and quantity of pollution within a facility, and changes in any of these data since the last inspection. Data are available about some 780 plants to date.
Timing/Frequency As needed. How data are accessed Data are available only to the Inspection Unit staff.
None of these systems provides a comprehensive overview of industrial emissions in Egypt. The CAIP and EPAP inventories concern only limited geographic areas and pollutants. The CAIP source attribution study and the EEPP-Air study are one-time models of emissions based on ambient air quality in the first case and borrowed emission coefficients in the second. Neither has been updated, although it is possible that they could be. The IPIS work does include actual emissions data, but only for those firms inspected by EEAA. Building emissions inventories from actual measured emissions is costly, time-consuming, and not always technically feasible. A number of alternate strategies might be considered to build time-series emissions data. None is perfect, but it worth considering whether any of them would improve the available data enough to be cost-effective. Law 4 of 1994 requires that all factories establish an environmental register in which they record their most recent emissions data, along with a variety of other information. EEAA has the right to view these registers at any time. The register information is only actually given to EEAA if the plant is inspected, however. If EEAA has the authority, they might consider requiring that all environmental registers be submitted to them each time they are updated. The data in them, particularly the emissions data, could then be entered into a single emissions database which would include information on the full spectrum of Egyptian industry, or at least those plants complying with this aspect of Law 4. This approach might be a relatively inexpensive way to build a comprehensive emissions database. The major problem with it is that the emissions measurements stored in the registers are known to paint a rosier picture than is accurate. The firms choose which emissions measurements to put in their registers, so they choose the ones that present them in the most favorable light. The register data also does not constitute an ongoing monitoring system. When firms enter a new value, they delete the previous one, so EEAA would have to receive the information every time the firms conducted a new test if they wish to build time-series data. The IPIS database provides a more accurate picture of emissions in the plants which have been inspected. Unfortunately, these data are not a representative sample of Egyptian industry. Plants are chosen for inspection when a complaint is lodged against them or because the Inspection Unit chooses to focus on specific sectors, typically those known to be major polluters. These methods will skew the sample towards dirtier plants and dirtier sectors, suggesting that Egyptian industry is dirtier than it may actually be. In fact, some 80 to 90% of plants inspected are found to be in violation of the standards. Without additional information, we do not know whether this is disproportionately bad. In some cases all of the plants in a specific region will be inspected in response to political pressure, for example all plants discharging into a specific part of the Nile. This may give accurate results for that location, but will not be representative of the country or the industry as a whole.
- 20 -
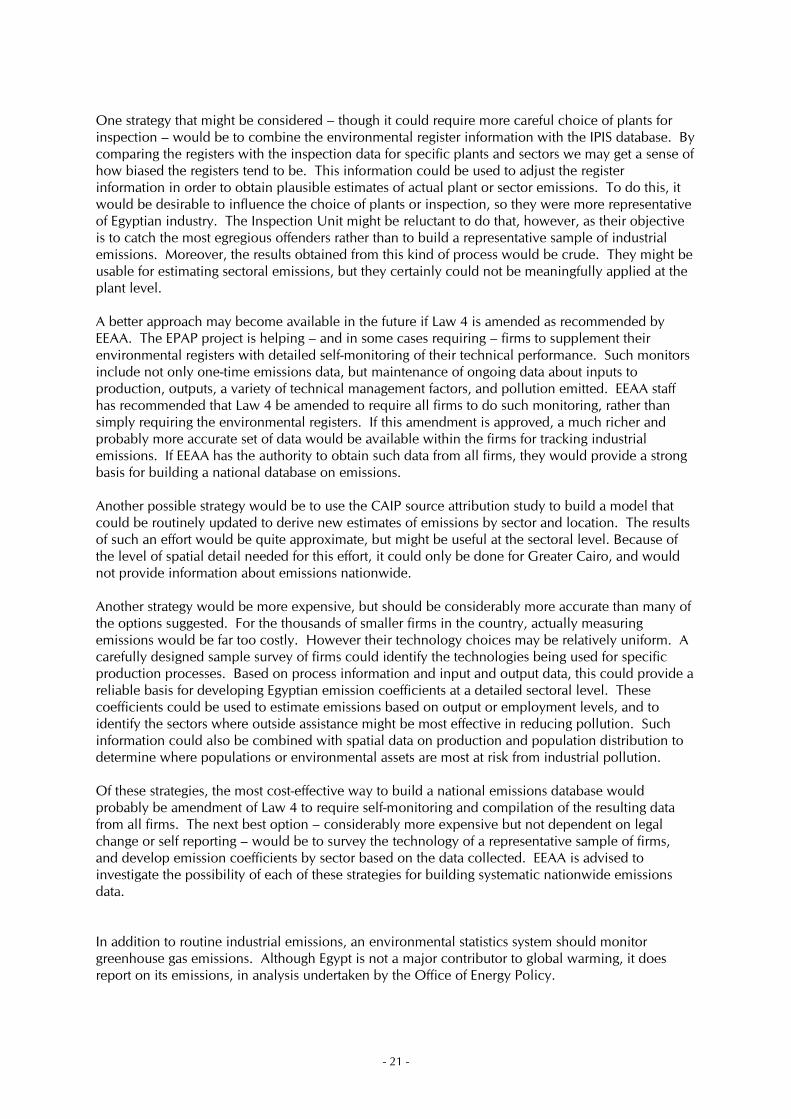
One strategy that might be considered – though it could require more careful choice of plants for inspection – would be to combine the environmental register information with the IPIS database. By comparing the registers with the inspection data for specific plants and sectors we may get a sense of how biased the registers tend to be. This information could be used to adjust the register information in order to obtain plausible estimates of actual plant or sector emissions. To do this, it would be desirable to influence the choice of plants or inspection, so they were more representative of Egyptian industry. The Inspection Unit might be reluctant to do that, however, as their objective is to catch the most egregious offenders rather than to build a representative sample of industrial emissions. Moreover, the results obtained from this kind of process would be crude. They might be usable for estimating sectoral emissions, but they certainly could not be meaningfully applied at the plant level. A better approach may become available in the future if Law 4 is amended as recommended by EEAA. The EPAP project is helping – and in some cases requiring – firms to supplement their environmental registers with detailed self-monitoring of their technical performance. Such monitors include not only one-time emissions data, but maintenance of ongoing data about inputs to production, outputs, a variety of technical management factors, and pollution emitted. EEAA staff has recommended that Law 4 be amended to require all firms to do such monitoring, rather than simply requiring the environmental registers. If this amendment is approved, a much richer and probably more accurate set of data would be available within the firms for tracking industrial emissions. If EEAA has the authority to obtain such data from all firms, they would provide a strong basis for building a national database on emissions. Another possible strategy would be to use the CAIP source attribution study to build a model that could be routinely updated to derive new estimates of emissions by sector and location. The results of such an effort would be quite approximate, but might be useful at the sectoral level. Because of the level of spatial detail needed for this effort, it could only be done for Greater Cairo, and would not provide information about emissions nationwide. Another strategy would be more expensive, but should be considerably more accurate than many of the options suggested. For the thousands of smaller firms in the country, actually measuring emissions would be far too costly. However their technology choices may be relatively uniform. A carefully designed sample survey of firms could identify the technologies being used for specific production processes. Based on process information and input and output data, this could provide a reliable basis for developing Egyptian emission coefficients at a detailed sectoral level. These coefficients could be used to estimate emissions based on output or employment levels, and to identify the sectors where outside assistance might be most effective in reducing pollution. Such information could also be combined with spatial data on production and population distribution to determine where populations or environmental assets are most at risk from industrial pollution. Of these strategies, the most cost-effective way to build a national emissions database would probably be amendment of Law 4 to require self-monitoring and compilation of the resulting data from all firms. The next best option – considerably more expensive but not dependent on legal change or self reporting – would be to survey the technology of a representative sample of firms, and develop emission coefficients by sector based on the data collected. EEAA is advised to investigate the possibility of each of these strategies for building systematic nationwide emissions data. In addition to routine industrial emissions, an environmental statistics system should monitor greenhouse gas emissions. Although Egypt is not a major contributor to global warming, it does report on its emissions, in analysis undertaken by the Office of Energy Policy.
- 21 -
Title Greenhouse Gas Emissions from Energy Consumption Responsible organization/ contact information
Office of Energy Planning Economist Adel Mahmoud Ibrahim General Director, Economic, Social and Environmental Impact Studies Tel 202-264-9544; fax 202-403-7623; [email protected]; [email protected]
Description Emissions of CO2, methane, nitrous oxide, nitrogen oxide, non-methane VOCs, CO, and SO2 from energy sources, all converted to tons of CO2-equivalent. These are calculated values based on energy consumption data and IPCC GHG emissions coefficients and conversion factors. The IPCC methodology has been used. Emissions are estimated for six sectors; agriculture, industry, transport, petroleum, electricity, and residential/ commercial. The underlying data on energy production and consumption are from Ministry of Petroleum and Ministry of Energy.
Timing/Frequency Annual How data are accessed The methodology, underlying calculations, and results are described in
Organization for Energy Planning, “Greenhouse Gases (GHG) Emissions from the Energy Sector in Egypt 2001/2002” Final Report. Summary results of this work are also published annually by OEP in “Energy in Egypt,” which is distributed for free on request.
Title Total Greenhouse Gas Emissions Responsible organization/ contact information
EEAA
Description EEAA estimates non-energy GHG emissions based on empirical information about economic standard coefficients provided by the Intergovernmental Panel on Climate Change (IPCC). Their emissions from energy production and consumption presumably come from the OEP analysis. They have estimated emissions from waste management, GHG sinks in forests and other cultivated areas; following IPCC guidelines they do not estimate emissions from bunker fuels (the fuels burned on ships and airplanes in international waters or airspace). EEAA has established institutional mechanisms for annual updates of emissions from solid waste, and biennial updates of forest sinks and emissions from agriculture and industry (aside from energy combustion). The solid waste updates calculate the releases that should result from additional trash generated each year, rather than those from trash stockpiled in dumps, so they show the annual change in emissions rather than the actual total of emissions from the sector.
Timing/Frequency Annual for energy, biennial for others. How data are accessed EEAA reports annually to the IPCC on GHGs. It is not clear whether
their estimates are available outside the agency. Since Egypt does not have to meet a GHG emission quota under the Kyoto Protocol, refining the country’s work on GHG emissions is of low priority in terms of national needs. An air pollution emissions inventory should track mobile as well as stationary sources of pollution. The data used to estimate GHG emissions from energy consumption shed some light on vehicle emissions of other pollutants. Some additional data are available on this subject from a CAIP study conducted in 1999.
- 22 -
Title CAIP Vehicle Emissions Survey Responsible organization/ contact information
This study undertaken by CAIP. The database was turned over to EEAA when CAIP ended.
Description CAIP built a vehicle emissions database from on-road testing of vehicle emissions carried out jointly by EEAA and the Ministry of Interior. Vehicles were tested for emissions of hydrocarbons and carbon monoxide, and for the opacity of their emissions. Vehicles were randomly pulled over to the side of the road by traffic enforcers. An EEAA inspector explained what was going on, provided information about the legal authority to do this. Machines were used on the road to measure emissions from the vehicles. Data were also collected about the vehicles; make, model, age, number of miles on the vehicle, and so on. After the test was completed he explained why emissions tune-ups are a good idea and where to get them. The sample only included trucks under 4 meters, and according to the CAIP report there some observed bias towards flagging down private vehicles driven by men more than by women. Certain mini-buses could not be tested with the equipment used, and there was no exhaust system integrity check to determine whether emissions were escaping the exhaust system altogether. Inspectors were stationed at 18 locations around Greater Cairo. A total of 25,259 vehicles were tested, of which 22,083 were gasoline powered and 3,176 diesel powered.
Timing/Frequency This was a one-time study begun in February 1999.
How data are accessed EEAA was to maintain data and continue gathering additional data after the initial 25,259 vehicles with which CAIP was involved. The CAIP report, which describes the testing program, form completed (thus data collected), technology used, and provides many summary tables and graphs, is available on their final-report CD. It is not clear who manages the data or how they can be accessed.
Emissions tests are now required in order to register motor vehicles in the Greater Cairo region. This testing process should be creating a regulatory database that could be used to build valuable information for analyzing the contribution of vehicles to air pollution in the region. Ambient Air Quality Ambient data on Egypt’s air quality are among the best environmental data in the country, thanks in part to major investments by USAID and DANIDA in environmental monitoring systems. Access to some of the information is also surprisingly simple; summaries of the DANIDA-funded national air quality data are presented on the web in monthly reports. Coordination among the monitoring systems in place leaves something to be desired, but the available information provides a strong basis for moving ahead in this area. Title EIMP Air quality monitoring system Responsible organization/ contact information
EEAA. This system was built with DANIDA support through the Environmental Information Monitoring Program. With the end of DANIDA funding, EEAA has taken full responsibility for the system.
Description The EIMP monitoring system tracks concentrations of SO2, NOx, PM-10, ozone, carbon monoxide, meteorological conditions, black smoke, TSP, VOC, dustfall, and several other parameters at 42 monitoring stations across the country. Most stations measure three to five of the parameters. Some stations carry out automated continuous monitoring, while others take samples the data. The system includes 14 monitoring stations in Cairo, 8 in Alexandria, 7 in the Delta, 3 in the Canal zone, 10 in Upper Egypt and Sinai.
- 23 -

Because of focus on human health, the monitoring system does not include stations in areas that are not settled. Monitoring stations have been placed so as to get a distribution of the pollution in different types of neighborhoods – industrial, residential, streets, rural, and mixed. The Cairo University Center for Environmental Hazards Management operates the monitoring stations in Cairo, the Canal area, Sinai, and Upper Egypt. The Alexandria University Institute for Graduate Study and Research manages those in Alexandria and the Delta. The monitoring stations came on line between 1997 and 1999. (This is based on information from a 2000 report, the most recent available in English; perhaps other stations have come on line since then.)
Timing/Frequency Depends on the station and the parameter. Some measurements are continuous. For those that are sampled, the available reports do not indicate the frequency of measurement.
How data are accessed Monthly and annual EIMP air quality reports are available on line at the EEAA website. They provide data on average pollutant levels, minima and maxima, 24-hour summaries, and other summary data. Up to 2000 they were available in English and Arabic; since then they have been available only in Arabic. The raw data may be requested from EEAA for research purposes. According to EEAA staff, if the need is considered legitimate they will make the data available.
Title CAIP Greater Cairo Air Quality Monitoring Responsible organization/ contact information
EEAA. This system was built with USAID support through the Cairo Air Improvement Project. With the end of USAID funding, EEAA has taken responsibility for the system.
Description The system monitors ambient air quality at 36 stations across Greater Cairo. All 36 sites measure concentrations of PM-10; 26 sites measure PM-2.5 as well. Five measure meteorological conditions as well as particulates. Lead information is obtained from the particulates collected. The monitoring network began operation on October 1, 1998. The stations are located in the area bordered by Qaha in the north, Tebbin South in the south, 10th of Ramadhan City in the east and 6th of October City in the west. 34 of the stations are placed so as to get a distribution of different kinds of neighborhoods; residential, industrial, high-traffic, background, and mixed. The other two stations were placed within 250 meters downwind of lead smelters to capture their emissions. Four sites are collocated with EIMP monitoring stations. When CAIP was in operation, project staff collected the data themselves. Since CAIP ended this responsibility has been transferred to EEAA staff. The CAIP data are managed separately from the EIMP data. The database management applications are separate, the databases are separate, and different EEAA employees manage CAIP and EIMP data. This is probably due both to the two systems collecting data on somewhat different variables and to institutional history in which CAIP and EIMP staff were separate when the two activities were still donor-funded.
Timing/Frequency Data are collected over a full 24-hour period every six days, all 36 monitoring stations on the same day.
How data are accessed The reports produced by the CAIP project, including a variety of reports using these data, were widely distributed at the end of the CAIP project on a pair of CDs, one for CAIP and one for the EEPP-Air follow-on activity. Since EEPP-Air ended, it is not clear how to access CAIP reports or data. They are not on the EEAA website; however EEAA staff
- 24 -

said that once the transfer of data collection responsibility to EEAA staff is operating smoothly the results will go on the web.
Title Ministry of Health Ambient Air Quality Monitoring System Responsible organization/ contact information
Ministry of Health and Population Central Department of Environmental Affairs Center for Environmental Monitoring and Work Environment
Description The MOHP monitors the concentration of SO2, smoke, TSP, PM10, lead from a network of about monitoring stations nationwide. Not all stations monitor all parameters; according to the available information 32 track TSP, 42 track smoke, and 40 track SO2. The report shows only the number of governorates in which the other two parameters are measured, not the number of stations.
Timing/Frequency The annual report does not indicate the frequency of measurement; however data on the number of annual observations suggest that these range from daily for some parameters at some stations to bi-weekly for others.
How data are accessed MOHP publishes an annual report on the monitoring results showing the average concentration each year for each pollutant, minimum, maximum, mean, standard deviations. It includes data from 1998 to 2002, but does not indicate for how long the monitoring system has been in place. The report is in Arabic. CAPMAS has obtained these reports, but many people at EEAA pointed out that MOHP would not share this information with them.
Egypt’s ambient air quality data are better than those in other areas, partly because the coverage is good enough to get a general perspective on the problems and partly because at least some of the data are relatively accessible. In these respects the air quality data should serve as a model to many other data sectors and ministries for how to manage statistical information. The most obvious additional need in the air quality arena is for better integration of the three monitoring systems. The MOHP data should be accessible to EEAA and to the public. Moreover, insofar as the systems monitor the same parameters, analytical work should be based on all three data sets; the availability of a denser monitoring network can only make the resulting analyses, both by the ministries and by outside users, more interesting. Users of the EIMP data carrying out studies on air pollution for EEAA13 have pointed out that the network of monitoring stations is not dense enough to use the ambient measures for many purposes. The CAIP network is much denser within Cairo, but it does not cover most of the parameters that EIMP covers. For many purposes, therefore, additional single-purpose monitoring is needed to obtain sufficiently detailed information. While a denser network would certainly be interesting, it will not be possible to meet all analytical needs with a national system; for some purposes additional data collection will always be needed. Given that the air quality monitoring networks are better than many other environmental data collection system, densifying the monitoring network may not be a high priority in improving environmental data. In addition to tracking the impact of emissions on air quality, some data track the impact of air quality on human health and exposure to pollutants. Since the major objective of cleaning up the air is to protect human health, such data get to the heart of why pollution causes problems.
13 Personal communication, Yasser Sherif of Environics, an environmental consulting firm.
- 25 -
Title 10% Sample survey of hospital outpatients Responsible organization/ contact information
Dr. Thana’a Ibrahim, Director National Center for Information on Health and Population Ministry of Public Health
Description The database tracks medical information about a 10% sample of all outpatients at general and district hospitals throughout Egypt, but not specialized (or private?) hospitals. The data include disease information classified according to the International Distribution of Diseases and Health (ICD10) coding system, and presumably other associated personal information. It does not include the address of the patient, but does include which medical facility they visited. (With address information it could easily be used to look at residence-related environmental health issues; location of medical facility would be a rough proxy for this.) The data are is reported by the hospitals and centralized within NCIHP.
Timing/Frequency Ongoing How data are accessed Annual reports and other publications including summaries by disease,
age, governorate, gender, etc., are available on the MOHP website. In Arabic.
Title EEPP-Air epidemiological study of blood lead levels in Shoubra Responsible organization/ contact information
This study was carried out by EEPP-Air in around 2003. At the completion of the project, all of its data and studies were turned over to EEAA.
Description The study collected data on a number of human impacts of lead pollution: - Blood lead levels in 299 people within 500 meters of closed Awadallah Secondary Lead Smelter - Lead levels in household dust in same area - Lead levels in drinking water in those households - Lead levels in fingernail samples of 62 people - Lead levels in breast milk of 17 people Blood samples were taken from veins. Household dust was taken from swipes in TV room or room where household spends most time. Measurements were taken by field workers hired for the study. The sample included 134 children under 7, 88 women, 77 men, all from 82 homes.
Timing/Frequency This was a one-time study apparently carried out in 2003. How data are accessed The study has been written up in “Screening Epidemiological Study:
Blood Lead Levels in the Vicinity of the Awadallah Smelter,” a publication of EEPP-Air, June 2004. English. It includes selected data and tables in Appendix 3, as well as summary tables in the text.
Expenditures on Air Quality Improvement Knowing how much we are spending to improve the environment and how much we benefit from those expenditures is crucial if we are to understand the economic implications of improving our environment. Egyptian data on expenditures are spotty. Various donors are providing loans and grants for industrial investments to reduce pollution; data are available on these projects. They have also been available in the past (and may still be) on the investments on environmental protection in public enterprises. It would appear that no data are available on the operating expenditures for environmental protection, nor on most investments that are not funded by foreign donors. Data also are not systematically available on household expenditures, government expenditures, and so on.
- 26 -

Since these data are a key element in the construction of environmental accounts, they are discussed further in the environmental accounting section of this report. Title EPAP Investments Responsible organization/ contact information
Hanan El Hadary Project Manager, Egyptian Pollution Abatement Project [email protected] Tel: 202-525-6442/6452 x 8603/7605 Mobile: 010-124-0814
Description Amount of grants and loans provided to companies to support investments in technology to reduce emissions. Funds provided by World Bank and European Investment Bank.
Timing/Frequency As awards are made to plants. How data are accessed Not routinely available; presumably available on request.
Title KfW Support for Industrial Environment Investments Responsible organization/ contact information
Mohamed Bayoumi GEF Programme Officer, UNDP Tel: 202-736-7496, 736-9525 Fax: 202-736-3702, 738-2981 [email protected]
Description Amount of grants and loans provided to companies to support investments in technology to reduce emissions.
Timing/Frequency As awards are made to plants. How data are accessed Available on request.
Title Environmental Expenditures of Public Enterprises Responsible organization/ contact information
This report was produced by the Environmental Improvement Unit of the Ministry of Public Works. Since the Ministry of Public Works does not exist any more, it is not clear where this unit went or whether the report is still produced. Former contact for this report was Alaa Thabet, Director of the Environmental Improvement Unit, tel: 518-6601, fax 703-4175.
Description The report included data on the amount invested in discrete environmental improvement projects in public enterprises and the sources of the funding.
Timing/Frequency Report was produced annually. How data are accessed Printed report; not clear who could access it.
D.3 Land and Soil Data on land and soil are not always as simple to categorize as emissions to air and water. They include solid waste generation, disposal of hazardous materials, leakage from underground storage tanks, and agrochemical residues in the soil. There is no single source of data on solid waste in Egypt. The solid waste management system in the country is changing, with a growing trend for governorates or municipalities to contract with private companies to collect and manage municipal wastes. Where those contracts are already in operation, particularly in Alexandria, which is viewed as a model of best practice, data are apparently available on the quantity of waste and how it is disposed of. In much of the country,
- 27 -
however, informal collection systems are still in place, and much trash is still tossed into streets or surface water. The national household expenditure survey conducted by CAPMAS asks how waste is disposed of, but not the quantity. EEAA has built a software application for managing solid waste information, but additional work will be required to develop the data on this subject. Title EEAA Solid Waste Information System Responsible organization/ contact information
Amin Khayal – handles software General Director of Solid Waste Management Mobile 010-646-5736 [email protected]
Description Administrative information at the governorate level about solid waste management. Quantity of solid waste generated at the governorate level. This may be only the quantity of waste disposed of into official sanitary landfills – not the quantity dumped on the desert or the streets. Governorates provide the data to the EEAA computer center, which deals with entering it but does not get involved with what the data mean.
Timing/Frequency Frequency of measurement could not be identified. How data are accessed The data are used to produce internal reports used by EEAA.
Agriculture can be a major source of soil degradation, due to overcultivation or to the use of agrochemicals. The census of agriculture is a significant source of data on agricultural output. Title Census of Agriculture Responsible organization/ contact information
Ministry of Agriculture and Land Reclamation
Description Extensive data for each crop on area, yield, and production, by governorate and regional for the country. Data on costs of production by crop for agricultural operations, including fertilization and pest control, and production inputs, including fertilizer and insecticides. It does not include quantity of agrochemicals used.
Timing/Frequency Annual census How data are accessed Published in annual volumes. Some summary data available on the
MALR website, http://www.agri.gov.eg/database/census1.htm The MALR certainly has detail on other issues related to the impact of agriculture on soil, groundwater, and surface water. It was not possible to identify most of this information in a systematic way during this consultancy. The cells below pertain to data tables found on the MALR website. They are quite out of date and they provide only summary information. However they presumably reflect the existence of more current and more comprehensive data within MALR. Title Pesticide Use in Cotton Cultivation Responsible organization/ contact information
Ministry of Agriculture and Land Reclamation
Description Table on MALR website covers pesticide use, including treated area in thousands of feddans, quantity of pesticides used in thousands of ton, area treated for cotton worm in thousands of feddans, and area treated against pink in thousands of feddans. This is apparently only covers use of pesticides in cotton cultivation, not in other crops.
Timing/Frequency Annual data 1982-1998. The table does not indicate whether the data are available through the present.
How data are accessed Table on MALR website, http://www.agri.gov.eg/database/mobed.htm
- 28 -
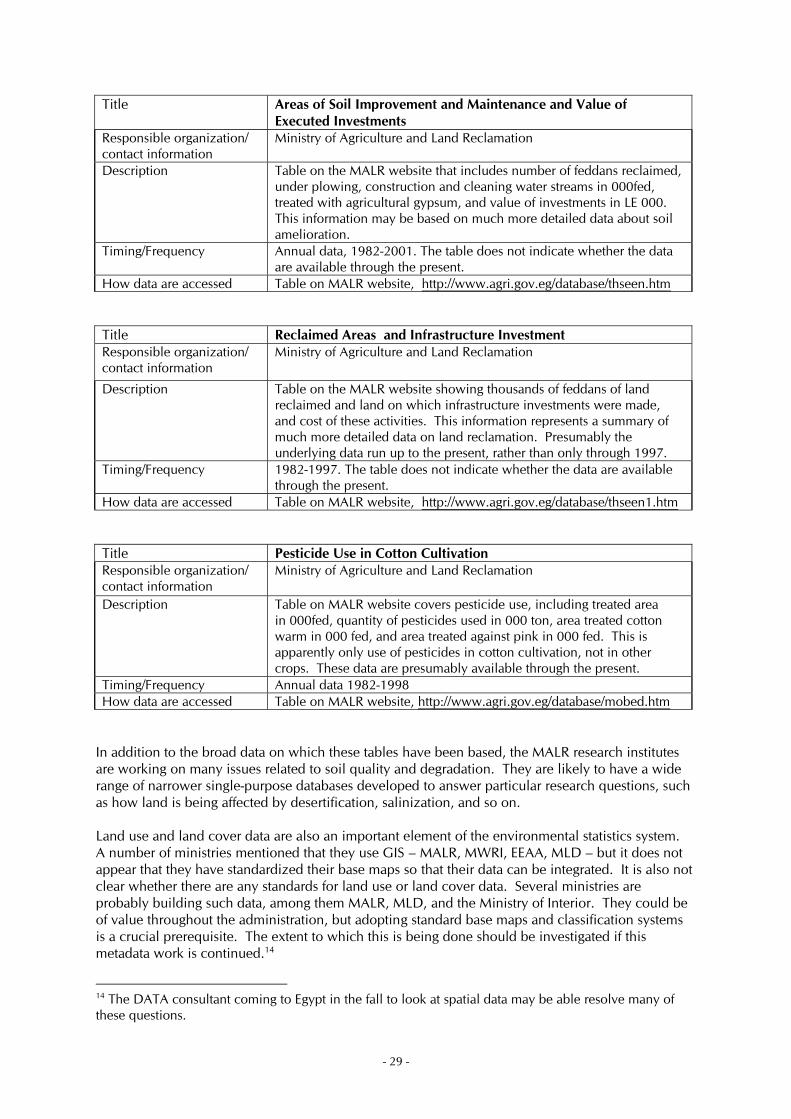
Title Areas of Soil Improvement and Maintenance and Value of Executed Investments
Responsible organization/ contact information
Ministry of Agriculture and Land Reclamation
Description Table on the MALR website that includes number of feddans reclaimed, under plowing, construction and cleaning water streams in 000fed, treated with agricultural gypsum, and value of investments in LE 000. This information may be based on much more detailed data about soil amelioration.
Timing/Frequency Annual data, 1982-2001. The table does not indicate whether the data are available through the present.
How data are accessed Table on MALR website, http://www.agri.gov.eg/database/thseen.htm Title Reclaimed Areas and Infrastructure Investment Responsible organization/ contact information
Ministry of Agriculture and Land Reclamation
Description Table on the MALR website showing thousands of feddans of land reclaimed and land on which infrastructure investments were made, and cost of these activities. This information represents a summary of much more detailed data on land reclamation. Presumably the underlying data run up to the present, rather than only through 1997.
Timing/Frequency 1982-1997. The table does not indicate whether the data are available through the present.
How data are accessed Table on MALR website, http://www.agri.gov.eg/database/thseen1.htm Title Pesticide Use in Cotton Cultivation Responsible organization/ contact information
Ministry of Agriculture and Land Reclamation
Description Table on MALR website covers pesticide use, including treated area in 000fed, quantity of pesticides used in 000 ton, area treated cotton warm in 000 fed, and area treated against pink in 000 fed. This is apparently only use of pesticides in cotton cultivation, not in other crops. These data are presumably available through the present.
Timing/Frequency Annual data 1982-1998 How data are accessed Table on MALR website, http://www.agri.gov.eg/database/mobed.htm
In addition to the broad data on which these tables have been based, the MALR research institutes are working on many issues related to soil quality and degradation. They are likely to have a wide range of narrower single-purpose databases developed to answer particular research questions, such as how land is being affected by desertification, salinization, and so on. Land use and land cover data are also an important element of the environmental statistics system. A number of ministries mentioned that they use GIS – MALR, MWRI, EEAA, MLD – but it does not appear that they have standardized their base maps so that their data can be integrated. It is also not clear whether there are any standards for land use or land cover data. Several ministries are probably building such data, among them MALR, MLD, and the Ministry of Interior. They could be of value throughout the administration, but adopting standard base maps and classification systems is a crucial prerequisite. The extent to which this is being done should be investigated if this metadata work is continued.14
14 The DATA consultant coming to Egypt in the fall to look at spatial data may be able resolve many of these questions.
- 29 -
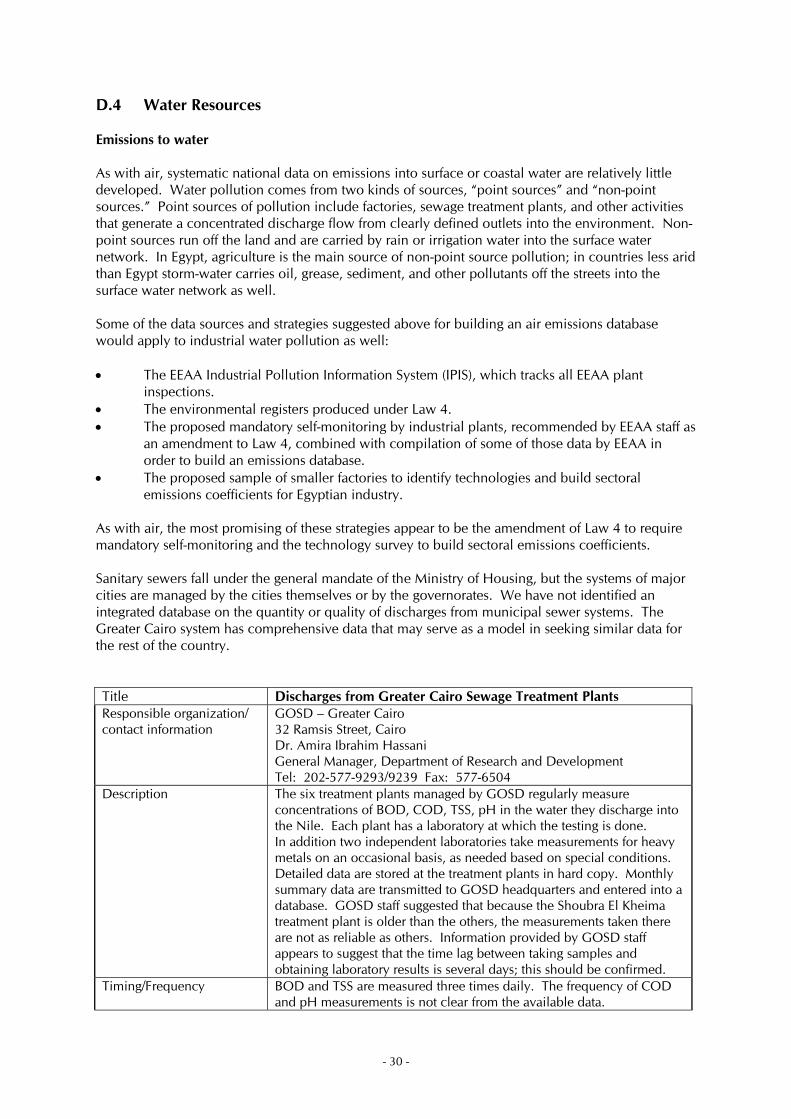
D.4 Water Resources Emissions to water As with air, systematic national data on emissions into surface or coastal water are relatively little developed. Water pollution comes from two kinds of sources, “point sources” and “non-point sources.” Point sources of pollution include factories, sewage treatment plants, and other activities that generate a concentrated discharge flow from clearly defined outlets into the environment. Non-point sources run off the land and are carried by rain or irrigation water into the surface water network. In Egypt, agriculture is the main source of non-point source pollution; in countries less arid than Egypt storm-water carries oil, grease, sediment, and other pollutants off the streets into the surface water network as well. Some of the data sources and strategies suggested above for building an air emissions database would apply to industrial water pollution as well: • The EEAA Industrial Pollution Information System (IPIS), which tracks all EEAA plant
inspections. • The environmental registers produced under Law 4. • The proposed mandatory self-monitoring by industrial plants, recommended by EEAA staff as
an amendment to Law 4, combined with compilation of some of those data by EEAA in order to build an emissions database.
• The proposed sample of smaller factories to identify technologies and build sectoral emissions coefficients for Egyptian industry.
As with air, the most promising of these strategies appear to be the amendment of Law 4 to require mandatory self-monitoring and the technology survey to build sectoral emissions coefficients. Sanitary sewers fall under the general mandate of the Ministry of Housing, but the systems of major cities are managed by the cities themselves or by the governorates. We have not identified an integrated database on the quantity or quality of discharges from municipal sewer systems. The Greater Cairo system has comprehensive data that may serve as a model in seeking similar data for the rest of the country. Title Discharges from Greater Cairo Sewage Treatment Plants Responsible organization/ contact information
GOSD – Greater Cairo 32 Ramsis Street, Cairo Dr. Amira Ibrahim Hassani General Manager, Department of Research and Development Tel: 202-577-9293/9239 Fax: 577-6504
Description The six treatment plants managed by GOSD regularly measure concentrations of BOD, COD, TSS, pH in the water they discharge into the Nile. Each plant has a laboratory at which the testing is done. In addition two independent laboratories take measurements for heavy metals on an occasional basis, as needed based on special conditions. Detailed data are stored at the treatment plants in hard copy. Monthly summary data are transmitted to GOSD headquarters and entered into a database. GOSD staff suggested that because the Shoubra El Kheima treatment plant is older than the others, the measurements taken there are not as reliable as others. Information provided by GOSD staff appears to suggest that the time lag between taking samples and obtaining laboratory results is several days; this should be confirmed.
Timing/Frequency BOD and TSS are measured three times daily. The frequency of COD and pH measurements is not clear from the available data.
- 30 -
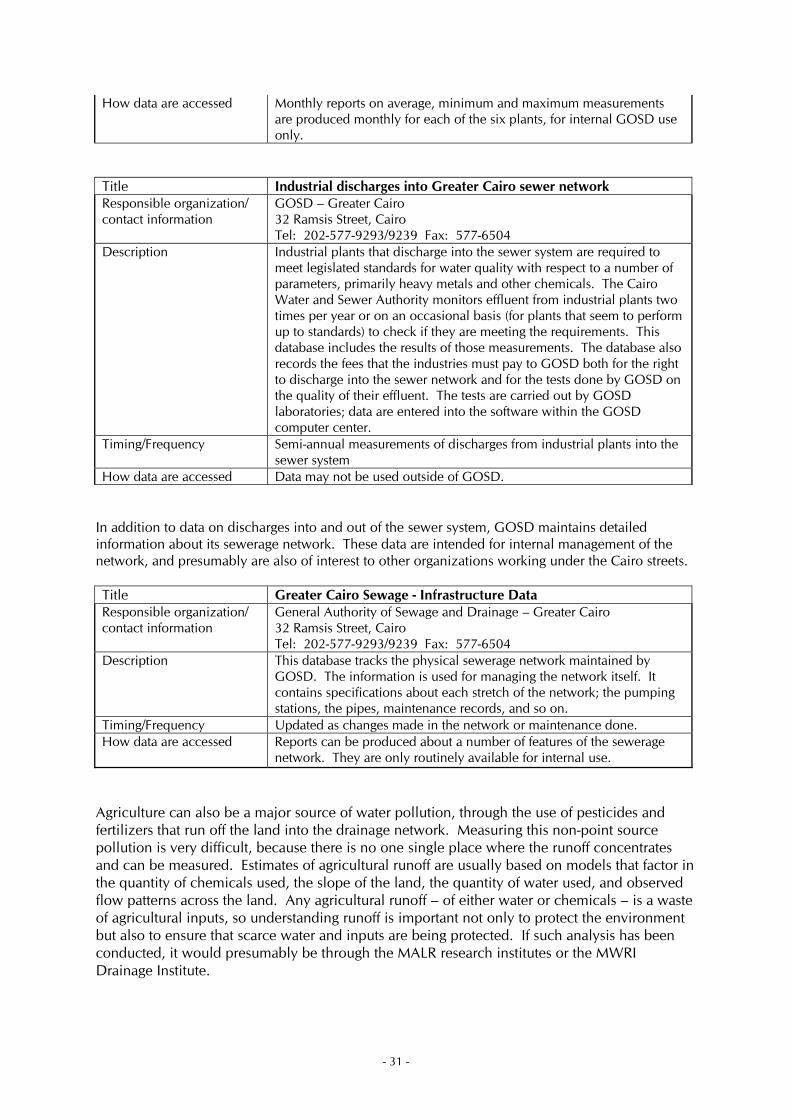
How data are accessed Monthly reports on average, minimum and maximum measurements are produced monthly for each of the six plants, for internal GOSD use only.
Title Industrial discharges into Greater Cairo sewer network Responsible organization/ contact information
GOSD – Greater Cairo 32 Ramsis Street, Cairo Tel: 202-577-9293/9239 Fax: 577-6504
Description Industrial plants that discharge into the sewer system are required to meet legislated standards for water quality with respect to a number of parameters, primarily heavy metals and other chemicals. The Cairo Water and Sewer Authority monitors effluent from industrial plants two times per year or on an occasional basis (for plants that seem to perform up to standards) to check if they are meeting the requirements. This database includes the results of those measurements. The database also records the fees that the industries must pay to GOSD both for the right to discharge into the sewer network and for the tests done by GOSD on the quality of their effluent. The tests are carried out by GOSD laboratories; data are entered into the software within the GOSD computer center.
Timing/Frequency Semi-annual measurements of discharges from industrial plants into the sewer system
How data are accessed Data may not be used outside of GOSD. In addition to data on discharges into and out of the sewer system, GOSD maintains detailed information about its sewerage network. These data are intended for internal management of the network, and presumably are also of interest to other organizations working under the Cairo streets. Title Greater Cairo Sewage - Infrastructure Data Responsible organization/ contact information
General Authority of Sewage and Drainage – Greater Cairo 32 Ramsis Street, Cairo Tel: 202-577-9293/9239 Fax: 577-6504
Description This database tracks the physical sewerage network maintained by GOSD. The information is used for managing the network itself. It contains specifications about each stretch of the network; the pumping stations, the pipes, maintenance records, and so on.
Timing/Frequency Updated as changes made in the network or maintenance done. How data are accessed Reports can be produced about a number of features of the sewerage
network. They are only routinely available for internal use. Agriculture can also be a major source of water pollution, through the use of pesticides and fertilizers that run off the land into the drainage network. Measuring this non-point source pollution is very difficult, because there is no one single place where the runoff concentrates and can be measured. Estimates of agricultural runoff are usually based on models that factor in the quantity of chemicals used, the slope of the land, the quantity of water used, and observed flow patterns across the land. Any agricultural runoff – of either water or chemicals – is a waste of agricultural inputs, so understanding runoff is important not only to protect the environment but also to ensure that scarce water and inputs are being protected. If such analysis has been conducted, it would presumably be through the MALR research institutes or the MWRI Drainage Institute.
- 31 -
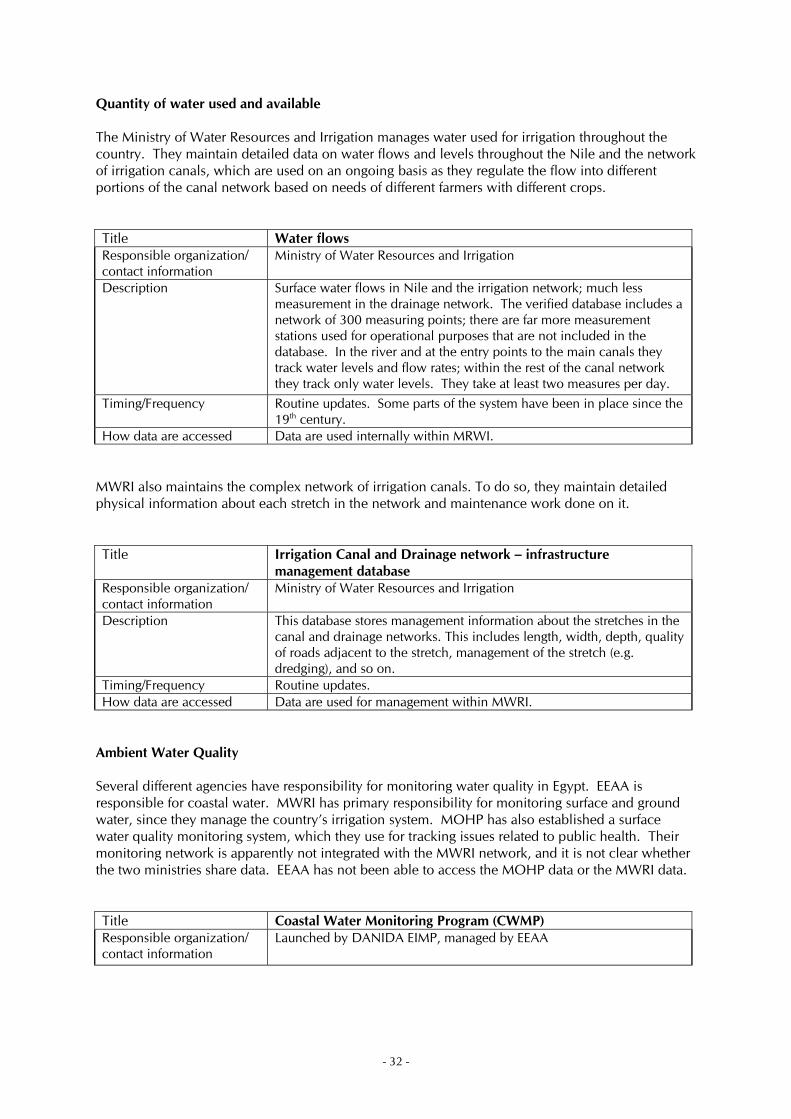
Quantity of water used and available The Ministry of Water Resources and Irrigation manages water used for irrigation throughout the country. They maintain detailed data on water flows and levels throughout the Nile and the network of irrigation canals, which are used on an ongoing basis as they regulate the flow into different portions of the canal network based on needs of different farmers with different crops. Title Water flows Responsible organization/ contact information
Ministry of Water Resources and Irrigation
Description Surface water flows in Nile and the irrigation network; much less measurement in the drainage network. The verified database includes a network of 300 measuring points; there are far more measurement stations used for operational purposes that are not included in the database. In the river and at the entry points to the main canals they track water levels and flow rates; within the rest of the canal network they track only water levels. They take at least two measures per day.
Timing/Frequency Routine updates. Some parts of the system have been in place since the 19th century.
How data are accessed Data are used internally within MRWI. MWRI also maintains the complex network of irrigation canals. To do so, they maintain detailed physical information about each stretch in the network and maintenance work done on it. Title Irrigation Canal and Drainage network – infrastructure
management database Responsible organization/ contact information
Ministry of Water Resources and Irrigation
Description This database stores management information about the stretches in the canal and drainage networks. This includes length, width, depth, quality of roads adjacent to the stretch, management of the stretch (e.g. dredging), and so on.
Timing/Frequency Routine updates. How data are accessed Data are used for management within MWRI.
Ambient Water Quality Several different agencies have responsibility for monitoring water quality in Egypt. EEAA is responsible for coastal water. MWRI has primary responsibility for monitoring surface and ground water, since they manage the country’s irrigation system. MOHP has also established a surface water quality monitoring system, which they use for tracking issues related to public health. Their monitoring network is apparently not integrated with the MWRI network, and it is not clear whether the two ministries share data. EEAA has not been able to access the MOHP data or the MWRI data. Title Coastal Water Monitoring Program (CWMP) Responsible organization/ contact information
Launched by DANIDA EIMP, managed by EEAA
- 32 -
Description This system carries out water quality monitoring along the Mediterranean and Red Sea coasts of Egypt. Parameters measured include: Visual observations (weather condition, oil pollution, sewage impact, etc), Hydrographical conditions (water temperature, DO, salinity and pH) Bacteriological parameters (total coliform, E. coli and fecal streptococci bacteria) Eutrophication parameters (chlorophyll-a, total suspended matter, transparency, total nitrogen, nitrate, nitrite, ammonium, reactive and total phosphate and reactive silicate) There are 39 stations in the network, 13 in the Gulf of Suez, 15 on the Red Sea, and 11 in the Gulf of Aqaba.
Timing/Frequency Six times a year on a bimonthly basis How data are accessed Data from the CWMA are published in monthly and annual reports by
EEAA. They include line graphs showing the actual monitored values at each station.
Title National Water Quality and Availability Management (NAWQAM) Responsible organization/ contact information
MWRI – National Water Research Center Data are collected, processed, and analyzed by the different research institutes – Nile, Drainage, and Groundwater, then transferred to the integrated database at the NWRC.
Description Quality of surface and ground water across the country. The system tracks several sets of measures: Package of salinity measures – salinity, sodium, chloride, sulfate, bicarbonate Nutrients – nitrogen, phosphate Heavy metals – 7 or 8 metals measured – iron, manganese, cadmium, copper, etc Microbial package – e coli, fecal coliform, etc. Color, smell, turbidity, pH Some monitoring stations continuously measure turbidity, O2, salinity, and temperature, in strategic places, collocated with other measurement stations. There are 300 stations for Nile and drainage water, 250 for ground water (according to NAWQAM Bulleting 3, January 2003, there were 232 surface and 195 ground). Measurements monthly, semi-annually or annually, several dozen parameters. There are far more measurement stations than that in the separate system, but only those have been integrated.
Timing/Frequency Groundwater measured one per year, Nile measured twice a year, drainage system measured monthly. Databases on Nile water quality, drainage water quality, and groundwater quality have been monitored since 1980, though the structure and coverage has evolved since then. The current data structure goes back to 1992. They were recently merged into a single integrated database. The separate data systems have been available for a long time; the single database is only a few years old.
How data are accessed Not available to the public. Available outside the Ministry of Water Resources and Irrigation by intergovernmental or special arrangements.
Title MOHP Water Quality Database Responsible organization/ contact information
Ministry of Health and Population Central Department of Environmental Affairs Center for Environmental Monitoring and Work Environment
- 33 -
Description This system measures concentrations of BOD, COD, DO, and TDS at about 135 monitoring stations along the Nile.
Timing/Frequency Cannot be determined from available report. How data are accessed MOHP produces an annual report that provides averages of the key
parameters at different places along the river. It is not publicly available.
Information on water quality must also include tracking the extent of access to safe drinking water and to waste water treatment. These are key indicators in many monitoring systems on environment and development. Summary data on these measures are available within MLD and the Ministry of Housing, and are widely published in many reviews of Egypt’s environmental situation. The source of this information is not clear. At the governorate and local levels, the detail must be available from those responsible for managing drinking water and sanitation networks. The Household Expenditure Survey conducted by CAPMAS asks how each household is connected to the water and sewer networks. These are survey data, however, not a census, and these data are not used for operational purposes. The household census being conducted through the network of thirty two thousand data collectors asks similar questions about access to water and sewer. However this census has only been conducted in 1.6 million households to date, so it is not the source of national data. The source and accuracy of information on this issue, as well as regional and local disaggregations of the data, should be pursued in future work on data availability. D.5 Biodiversity and Nature Conservation Basic data on Egypt’s protected areas are available from the EEAA protected areas unit. Data on biodiversity are probably also available from EEAA; however we have not been able to track them down during this consultancy. The International Union for the Conservation of Nature (IUCN) publishes global data on threatened species, which are readily available on the web. Title Protected Areas Responsible organization/ contact information
EEAA Dr. Moustafa Fouda Tel: 202-527-1391 [email protected]
Description Protected areas; location, size, biodiversity, etc. Timing/Frequency Data are updated if new protected areas are created.
How data are accessed Available from EEAA. Some information on protected areas is published.
Title Threatened species in Egypt Responsible organization/ contact information
IUCN/ The World Conservation Union Species Survival Commission www.redlist.org
Description For each species identified on the Red List, the database includes identification of the species, justification for its listing, who provided the information, distribution of the species, habitat type in which the species lives, prognosis for species population, and other information. IUCN/The World Conservation Network compiles data from scientists around the world about threatened species worldwide.
Timing/Frequency IUCN/The World Conservation Network compiles data from scientists around the world about threatened species worldwide.
How data are accessed Information about the Red List is available on the web through www.redlist.org.
- 34 -
Other data on biodiversity and protected areas are certainly available within Egypt and outside of the country. Data on coral reefs in particular should be available through the USAID Red Sea Sustainable Tourism Initiative (RSSTI) and the Red Sea component of USAID’s upcoming Livelihood and Income from the Environment (LIFE) program. D.6 Sub-soil Assets Sub-soil assets – petroleum, natural gas, and minerals – are key natural resource inputs into the economy. Depletion of these assets is a major concern in economic management. Tracking their use is therefore crucial for economic planning and development. Most of the data available in Egypt on sub-soil assets pertain to energy. They originate with the Ministry of Petroleum, and are disseminated by the Office of Energy Policy, in the Ministry of Planning. Title Stocks and flows of oil and natural gas Responsible organization/ contact information
Ministry of Petroleum
Description Reserves of oil and natural gas. The data made available to Office of Energy Policy for inclusion in their annual reports combine crude oil and condensates into a single figure, rather than distinguishing between them. Condensates are used to lighten crude oil; they are not part of the crude itself. Since 2001, the Ministry of Petroleum has been providing OEP with data on crude plus condensates, rather then crude and condensates separately. This change in statistical practices makes the time serious from earlier data inconsistent. This is true for data on flows as well as stocks.
Timing/Frequency Annual data. How data are accessed Summary data tables are published in “Energy in Egypt”,” an annual
publication of the Office of Energy Planning. This report is available through 2001/2002.
Title Primary energy production (and secondary petroleum products) Responsible organization/ contact information
Ministry of Petroleum
Description Production of crude oil, natural gas, condensates, liquid petroleum gas, hydropower, and coal. In the 2002 data condensates are distinguished from crude oil; in subsequent years (according to OEP) the Ministry of Petroleum will not release separate figures for condensates and crude. This is apparently to hide the fact that crude oil production is dropping. Production data distinguish among various petroleum products – LPG, gasoline/naphtha, kerosene/turbine gas, gas oil/diesel, fuel oil, and others. These are measured in tons rather than MTOE.
Timing/Frequency Annual data. How data are accessed Summary data tables are published in “Energy in Egypt”,” an annual
publication of the Office of Energy Planning. This report is available through 2001/2002.
Title Energy consumption Responsible organization/ contact information
Ministry of Petroleum
- 35 -
Description Consumption of primary energy by six sectors (industry, transport, agriculture, residential/commercial, electricity, and petroleum) for crude oil, natural gas, hydropower, and coal. Includes consumption for energy purposes and for non-energy purposes (lubricants, asphalt, and other products). Consumption of electricity by industry, agriculture, residential/commercial and government/utilities. Final consumption of energy by industry, transportation, residential/ commercial, agriculture, and government/public utilities.
Timing/Frequency Annual data How data are accessed Summary data tables are published in “Energy in Egypt”,” an annual
publication of the Office of Energy Planning. This report is available through 2001/2002.
Title Electricity Generation Responsible organization/ contact information
Ministry of Electricity
Description Installed capacity for electricity generation for hydro, thermal, and wind, peak loads, total electricity generation, and generation in private power plants. Share of thermal generation (capacity and actual generation) from petroleum vs. natural gas. Energy inputs for electricity generation, transformation losses, transmission and distribution losses, quantity purchased from private generation stations.
Timing/Frequency Annual data How data are accessed Summary data tables are published in “Energy in Egypt”,” an annual
publication of the Office of Energy Planning. This report is available through 2001/2002.
D.7 Hazardous Materials Discharged to Land Many different Egyptian ministries play a role in regulating the use and disposal of hazardous chemicals. Coordinating this process is the responsibility of EEAA. The agency has done a lot to inform industry about how the management system works, and which industries regulate which chemicals. They have done less to develop consistent information on how much is being generated by pollutant or industrial sector.
Title Unified list of hazardous chemicals and ministries responsible for regulating their use
Responsible organization/ contact information
EEAA – EHSIMS Project 30, Misr Helwan Agriculture Road El-Maadi - Cairo - Egypt Postal Code: 11728 Tel: (002)(02)5256452 Fax: (002)(02)5256479 Email: [email protected]
Description EEAA has established a National Hazardous Substances Information and Management System to initiate the management system for hazardous substances in Egypt. This management system provides basic guidelines and information to ensure safe handling of hazardous substances. This system includes all hazardous substances imported and locally produced. This system also enable
- 36 -
coordination within the competent ministries and authorities in implementing the management system for hazardous substances via a database and a unified permitting form and full capability for tracing hazardous substances since their entry to Egypt through to their final use. The EHSIMS system includes a unified list of all hazardous substances that are regulated in Egypt, and the ministries responsible for regulating them. Unified lists of hazardous substances include: List (A) List of banned chemicals. List (B) List of hazardous substances subject to permitting procedure. List (C) List of non-restricted substances. Each list contains the following: 1- Chemical name. 2- CAS number. 3- Classification. 4- Risk and safety phrase. 5- Customs code. 6- The ministry it follows.
Timing/Frequency Unified chemical list established once. How data are accessed Description of the information system as a whole:
http://www.eeaa.gov.eg/English/main/env_manag.aspUnified lists of chemicals: http://www.ehsims.org/main/hs_services_unified.asp
D.8 Data on Environmental Management EEAA has developed several databases that pertain to environmental management in general. Although these do not include statistical data about the environment, they may be useful to people working in the field. Title Donor Project Database Responsible organization/ contact information
EEAA
Description Searchable database on the EEAA website that provides summary information about donor projects working with EEAA. Includes projects that ended several years ago. Data about each project include name, start date, duration, description , tel, tax, Egyptian manager, donor manager, email, URL
Timing/Frequency Not clear how long the database has been maintained or when updates are done.
How data are accessed http://www.eeaa.gov.eg/English/info/projects_search.asp Title Environmental Impact Assessment Consultants Responsible organization/ contact information
EEAA
Description Data about the proposed project – identification, technical characteristics, pollutants to be emitted. Two forms must be filled out to prepare the EIAs; these are on the web at http://www.eeaa.gov.eg/ English/main/eia.asp. Presumably the database includes the information submitted on these forms.
- 37 -
The EIA database also includes information about the consulting firms and individual consultants who prepare EIAs, including identification and contact information for the consultant, professional background, consulting experience, equipment they have for technical measurements, and similar consultant qualification data.
Timing/Frequency For each EIA. How data are accessed This database appears to be used internally by EEAA.
D.9 Conclusions Much additional work is needed to comprehensively identify and document the environmental data available in Egypt. This chapter has flagged a number of areas where data should exist but additional work is needed to track them down, among them vehicle emissions, pesticide use, land use and land cover, sanitary and drinking water connections. It has also identified areas where existing data are inadequate, particularly pollutant emissions and solid waste. Through out the environmental statistics system, the documentation of available data is weak. Additional work is needed in all of these areas to develop information about available statistics and so make the system a more effective support for improving the Egyptian environment.
- 38 -
E. Environmental Accounting The environmental accounts are satellite accounts to the 1993 System of National Accounts (SNA). They are based on the structure of the SNA, but they add additional information and disaggregate existing data differently from the SNA, in order to highlight the role of the environment in all aspects of the economy. They are made of up several discrete components, each of which is considered in this chapter. Since readers of this report are probably not familiar with the structure of the environmental accounts, the discussion that follows includes some description of each component prior to considering what would be involved in constructing it in Egypt. The methodology for building environmental accounts has been under development through the United Nations, Eurostat, and other national and international organizations for the past ten years. The final draft report was issued in 2003, and should be published by the United Nations this year. The methods it proposes, referred to as the System of Integrated Economic and Environmental Accounting (SEEA), have been tested in many developed and developing countries, and represent a consensus among those who have been working on these issues. The forthcoming statistical manual can be downloaded from the web at http://unstats.un.org/unsd/envAccounting/ seea.htm. For a simpler introduction to environmental accounting, see Hecht (2004). E.1 Physical flow accounts Physical flow accounts track material flows between the environment and the economy, measured in tons or other physical units. The environmental accounting framework identifies four kinds of flows in the environment-economy system: Products are goods and services produced in the economy. They exist only in the economic
sphere, where they are produced and consumed. They are tracked in the conventional income accounts.
Natural resources, which include minerals, energy, soil, water, and biological material, are created in the environmental sphere. Their creation does not involve economic activity, but they are input into the economic sphere in the production process. The movement of resources from the environmental to the economic sphere is a key issue in physical flow accounts.
Ecosystem inputs are less tangible components of the environmental sphere than natural resources. They include such items as gases in the atmosphere that are essential for combustion, and clean air and water to support life. (Water falls into three of these categories, being a natural resource used in the economy, an ecosystem input on which life depends, and a product when sold bottled. It poses particularly difficult problems for accounting.) Ecosystem inputs are inputs into production and may be degraded by production or by disposal of the wastes from final consumption.
Residuals are wastes from production or consumption. Although the difference between
residuals and products is sometimes obvious—no one would mistake steel for the smoke coming out of the steel mill’s chimneys—this is not always the case. When unwanted material, such as chicken factory-farm waste, is sold as fertilizer, it is considered to be a secondary product that stays in the economic sphere. When it is given away for the same use, it is considered to be a residual, but it remains in the economic sphere. When it is discarded, it is considered to be a residual that flows from the economic to the environmental sphere.
The physical flow accounts cover the last three of these types of flows, since the first is covered by the economic accounts.
- 39 -
Resource flow accounts: Some data on flows of natural resources from the environment to the economy are available in Egypt. The Ministry of Petroleum has physical data on consumption of crude petroleum resources, natural gas, secondary petroleum products, and electricity, by six major economic sectors. A problem would arise in the use of some of these data for accounting purposes, however. The Ministry data include “transportation” as a single sector, identifying consumption of diesel, gasoline, and natural gas to power all vehicles. In the accounts, however, it matters who owns the vehicles. “Transport” in the accounts refers to the economic sector that sells transportation services to other industrial sectors (trucking, rail shipping, etc.) or to households (taxis, buses, passenger trains). Such services are intermediate consumption by industry and final consumption by households. Household use of personal cars is classified with household final consumption, not with the transportation sector. Use by industry of its own trucks or other vehicles is classified with the industry that owns the vehicles, in a category called “own transport.” Reclassifying the Ministry data on fuel use for transportation to fit the structures of the national accounts is likely to be inexact at best. The intermediate consumption tables in the national accounts system identify fuel and electricity as distinct items for intermediate consumption. These tables are structured by 9-digit ISIC code, although available data are not always that detailed. These are monetary values, however, not physical values; they tell how much has been spent on fuel and electricity rather than how much was consumed. Estimating physical consumption from the value consumption might be possible, but it would be highly inexact. Resource flow accounts also include uses of minerals, water, forest products, fish, and other natural resources. The national accounts do not include information on any of these resources; the intermediate consumption data include only “basic raw materials,” which does not permit us to identify the types of products being used in enough detail to track other natural resources. However some of the information may be available from other sources: MALR has done research to determine the quantity of water needed for different kinds of crops,
which would be useful for physical flow accounts. The MWRI water balance indicates the total amount of water flowing to and from major
economic sectors including agriculture, industry, residential/commercial, and municipal sewer systems. It is possible that they have more detailed information underlying this, with which to track water use in greater detail
Forest products used in Egypt would largely be imported, so some data on these might be
available from the trade statistics. However, while these probably include more detailed product classifications than the accounts data, they are not likely to include the detailed ISIC code data to track which sectors are consuming the imported goods.
Ministry of Petroleum data cover household use of fuel and electricity. The household
consumption survey may provide some information on household consumption of other natural resource products, depending on the detail of the product classifications it uses.
Ecosystem inputs: Although air, water, and other ecosystem inputs are essential to human survival, they are very difficult to account for. This portion of the sample accounts developed in the SEEA includes only air, oxygen for combustion, and nitrogen. Countries with considerable experience with environmental accounts have held off on venturing into this area, and Egypt would do well to do the same. Residuals: Discharges to the environment by each economic sector are a key part of the environmental accounts. As discussed in the previous chapter, these data are not available in Egypt. Many components of the accounts depend on information about the discharges of pollutants into the air and water and the production of solid waste by industry sector, agriculture, households, and
- 40 -

government. While selected data exist, as discussed in the previous chapter, this information is not comprehensive enough to begin building accounts on the flow of residuals. E.2 Hybrid Supply and Use Tables and Input Output Tables The SEEA integrates the physical flow accounts, particularly the natural resource and residuals data, with monetary data, to build hybrid supply and use tables (SUT) and input output (IO) tables. The hybrid SUTs add columns and rows to conventional monetary SUTs to show the input of natural resources into each sector of the economy and the output of emissions from each sector. They do not include additional data beyond the physical flow accounts. Rather, they are a tool for presenting the data in a format that clearly shows how much each industrial sector contributes either to resource use (and possibly depletion) or to pollution. They may also be used to calculate and present environmental theme indicators, which are composite measures showing how economic activity contributes to global warning, eutrophication of surface water from excess nutrient, acid rain, or other environmental problems. Since Egyptian data on resource use are limited and data on residuals are almost non-existent, it is not possible to built hybrid SUTs at present. Input output analysis is a powerful tool for showing how one change in production or consumption flows through the entire economy, through changes in intermediate consumption and employment, which in turn cause changes in the sectors producing intermediate goods or producing the final consumption goods purchased by employees. Physical data on resource use and residuals can be added to the IO tables as additional rows or columns. As coefficients are calculated to show the economic changes due to a single change in production or consumption, they may also be calculated to show the environmental impacts. This allows us to analyze how a single economic change will have repercussions not only for the economy, but for the environment as well. Again, however, because Egypt is not currently able to build natural resource or residual accounts, this analysis will not be feasible at present. E.3 Monetary flow accounts Public debate on environmental protection usually focuses around one fundamental issue: can we afford it? Knowing the costs and benefits of environmental protection is essential. A key issue in accounting for environmental protection is the distinction between the expenditures already incurred to prevent harm to the environment, the costs imposed on humans by harm to the environment, and the expenditures that would be incurred to prevent environmental harm from imposing costs on people. Expenditures Incurred to Prevent Pollution Expenditures to prevent environmental harm are marketed; disaggregating them from conventional accounts is one task of the environmental protection expenditure accounts (EPEAs). EPEAs usually focus on expenditures to prevent pollution by industry, households, and government and, to a more limited extent, expenditures to manage natural resources, particularly in the public sector. The challenge in building EPEAs is to identify which expenditures should be considered environment-related and which should not. When pollution prevention is first introduced, it often takes the form of “end-of-pipe” technologies that are easy to differentiate from productive technology. As new, clean plants are built, however, production systems are designed to avoid generating the pollution in the first place, making it hard to determine what the environmental expenditure is. Moreover many products used for pollution control serve other purposes as well; hardware, clean fuels, cleaning supplies, and so on. Resource management also raises classification questions; for example, should all agriculture be considered an environmental activity, or only sustainable agriculture?
- 41 -
In the SEEA, expenditures are classified as “environmental” if they are undertaken primarily to protect the environment; activities that happen to benefit the environment but are undertaken for other reasons are not considered environmental. This creates some anomalies. For example, investments in energy efficiency that are made for the financial payoff are not considered environmental even though they reduce emissions, whereas the same investments made in response to government requirements to reduce emissions would be classified as environmental even if they pay off financially. When a product is modified t o make it cleaner – unleaded gasoline, for example – only the additional cost imposed by the modification is considered an environmental expense. This kind of detailed data is not readily available in Egypt. The census of industry, on which the intermediate consumption tables of the national accounts are based, requests information on expenditures and investments, but does not require enough detail to determine whether those expenditures are for environmental purposes. The same is the case for household expenditure data, which are not detailed enough to determine how much is spent on specific environmental protection activities such as vehicle tune-ups, unleaded gasoline, or privatized trash collection contracts. The industrial investment data described in the previous chapter pertain only to selected firms, and are not comprehensive enough to build EPEAs. Costs Imposed by Environmental Degradation EPEAs disaggregate the marketed costs imposed by environmental harm. For households, these include health-care costs, forgone wages due to illness, cleaning materials for home and clothing, and expenditure on bottled water or to boil water in the home. For industry, they include the cost of purchasing treated water for use in industrial processes because the water taken in from the environment is not clean enough to use directly, or the cost of filtering air in their factories, if dust and pollution in their environment could hurt their production processes. The accounts do not capture harm that is not marketed, such as the pain and suffering due to illness or lost recreation opportunities due to water pollution. As with expenditures to prevent pollution, data on the expenditures necessitated by environmental degradation cannot readily be disaggregated from available expenditure statistics. The World Bank conducted a study that estimated the costs imposed by environmental harm (World Bank, 2002). Their approach organized costs by environmental medium, and for each looked at costs imposed through health impacts and costs imposed through natural resource degradation. This approach could be applied systematically on an annual basis in order to develop annual estimates of the economic impacts of environmental harm. Modifying the Industrial Census and Household Expenditure Questionnaires The questionnaires used to collect those industrial and household expenditure data in Egypt could be modified to obtain more actual data on environmental expenditures. This would provide an empirical basis for measuring both pollution prevention expenditures and the monetary costs imposed by environmental degradation. If Egypt were interested in exploring this possibility, the US Pollution Abatement and Control Expenditure survey, which was carried out annually from 1973 to 1994 and then again one time in 1999 offers an interesting sample survey design. It is available on the web at http://www.census.gov/econ/www/mu1100.html. The survey instructions sent to respondents include detailed explanations of which expenditures are to be included and which are not, in an effort to ensure that the information collected is consistent. A simplified version of some of these questions could be included in the Egyptian forms if additional expenditure information were desired.
- 42 -
Costs of Additional Environmental Protection Estimating the costs of additional environmental protection is essential for analysis of the tradeoffs involved in strengthening environmental protection. Some of these costs have been estimated for Egypt by the World Bank (World Bank, 2002). These costs are not part of the SEEA, however. National accounts, the SEEA included, track what is happening, not what would happen under alternate policy scenarios. Some of the EPEA data identified in the environmental accounts would be used to estimate the costs of additional environmental protection, but they cannot simply be extrapolated for that purpose. Estimates of the full economic impact of improved environmental protection are made using input output analysis or general equilibrium models. While these analytical tools use the accounts data, they go far beyond them to derive their results. Environmental Protection Industry On the supply side of the monetary flow accounts, EPEAs focus on specific sectors that provide technology or services to reduce pollution, known as the environment industry. This includes firms that sell goods and services needed specifically for environmental protection; the manufacturers of catalytic converters, filtration systems, and laboratory equipment for testing discharges; the consulting firms conducting environmental audits and preparing environmental impact assessments. They are identified by ISIC code; the SEEA includes a precise list of which codes are considered to be part of the environment industry. If the Egyptian accounting data are detailed enough, then they can be identified directly, though many countries have had to conduct special surveys to determine the output of the environment industry. Tracking this industry is important, because it shows some of the economic benefits created by investments in environmental protection, through jobs created and additional value-added in the economy. It also shows how much of that value added is domestic rather than imported. Government Expenditures, Revenues, and Subsidies The EPEAs also include government expenditures on environmental protection and resource management and taxes and subsidies related to the environment; carbon taxes, fines levied for non-compliance with environmental laws, subsidies for private investments in pollution control equipment, and so on. At some level there must be detailed government accounts through which to obtain this information; however it is not clear whether the data are actually available in a form that permits identifying these expenditures and revenues. E.4 Asset accounts Structure of the Accounts The SEEA asset accounts are accumulation accounts, showing a balance sheet with opening values of the asset stocks, changes over the year, and a balance sheet with closing values. Changes in the assets over the year include both new investments and environmental changes, such as growth of forests or degradation of coral reefs. The SEEA asset accounts build on the SNA accumulation accounts, changing them in two significant ways: First, as in other areas, the SEEA suggests building both physical and monetary asset accounts.
Physical data on the extent of natural resources are a key input into estimates of the value of those resources, so most countries working in this area have begun with physical asset accounts. Monetary accounts are useful, because they can be linked to other economic accounts; however, valuing natural resources is quite difficult.
Second, the SEEA includes assets that would not be part of the SNA because they cannot be
owned, such as non-cultivated fisheries.
- 43 -
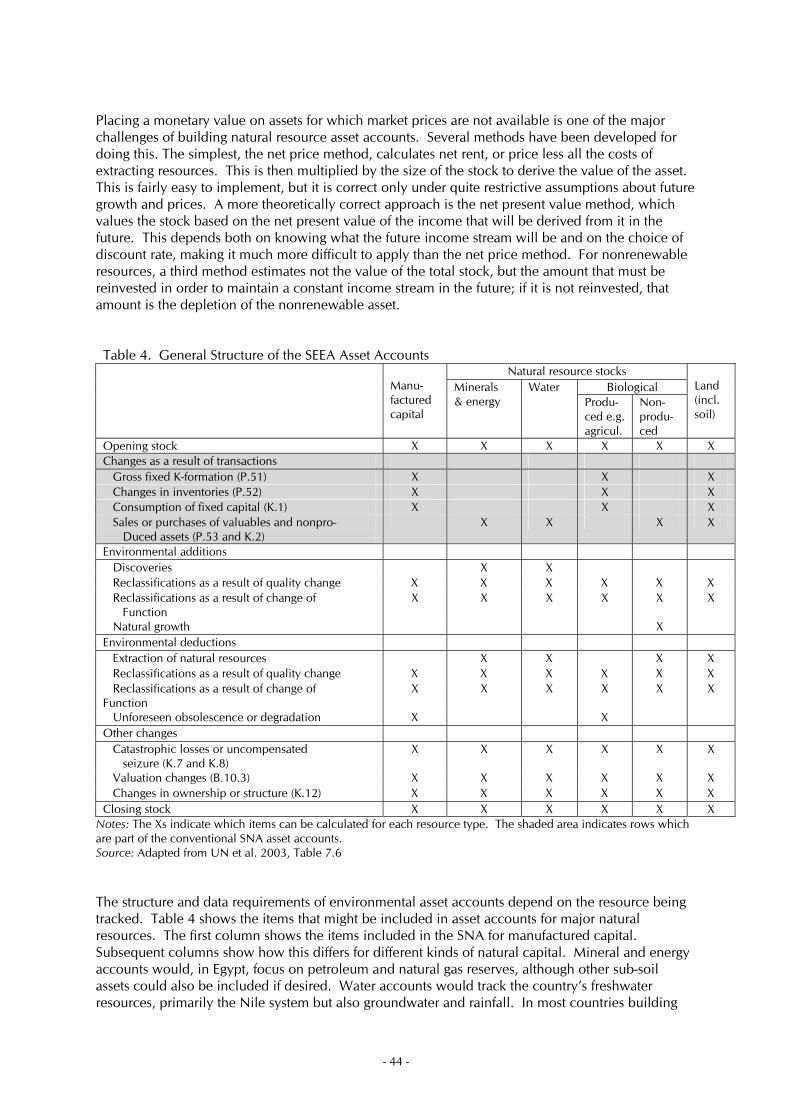
Placing a monetary value on assets for which market prices are not available is one of the major challenges of building natural resource asset accounts. Several methods have been developed for doing this. The simplest, the net price method, calculates net rent, or price less all the costs of extracting resources. This is then multiplied by the size of the stock to derive the value of the asset. This is fairly easy to implement, but it is correct only under quite restrictive assumptions about future growth and prices. A more theoretically correct approach is the net present value method, which values the stock based on the net present value of the income that will be derived from it in the future. This depends both on knowing what the future income stream will be and on the choice of discount rate, making it much more difficult to apply than the net price method. For nonrenewable resources, a third method estimates not the value of the total stock, but the amount that must be reinvested in order to maintain a constant income stream in the future; if it is not reinvested, that amount is the depletion of the nonrenewable asset. Table 4. General Structure of the SEEA Asset Accounts
Natural resource stocks Biological
Manu- factured capital
Minerals & energy
Water Produ-ced e.g. agricul.
Non-produ-ced
Land (incl. soil)
Opening stock X X X X X X Changes as a result of transactions Gross fixed K-formation (P.51) X X X Changes in inventories (P.52) X X X Consumption of fixed capital (K.1) X X X Sales or purchases of valuables and nonpro- Duced assets (P.53 and K.2)
X X X X
Environmental additions Discoveries X X Reclassifications as a result of quality change X X X X X X Reclassifications as a result of change of Function
X X X X X X
Natural growth X Environmental deductions Extraction of natural resources X X X X Reclassifications as a result of quality change X X X X X X Reclassifications as a result of change of Function
X X X X X X
Unforeseen obsolescence or degradation X X Other changes Catastrophic losses or uncompensated seizure (K.7 and K.8)
X X X X X X
Valuation changes (B.10.3) X X X X X X Changes in ownership or structure (K.12) X X X X X X Closing stock X X X X X X
Notes: The Xs indicate which items can be calculated for each resource type. The shaded area indicates rows which are part of the conventional SNA asset accounts. Source: Adapted from UN et al. 2003, Table 7.6 The structure and data requirements of environmental asset accounts depend on the resource being tracked. Table 4 shows the items that might be included in asset accounts for major natural resources. The first column shows the items included in the SNA for manufactured capital. Subsequent columns show how this differs for different kinds of natural capital. Mineral and energy accounts would, in Egypt, focus on petroleum and natural gas reserves, although other sub-soil assets could also be included if desired. Water accounts would track the country’s freshwater resources, primarily the Nile system but also groundwater and rainfall. In most countries building
- 44 -
environmental accounts, produced biological assets primarily focus on plantation forestry and fish farming; in Egypt it could include agriculture. Elsewhere in the world non-produced biological assets include primary and secondary forests; in Egypt they could cover the Red Sea and Mediterranean fisheries, and more ambitiously, the Red Sea coral reefs. Land accounts could be of interest if they focused on specific areas where there are attempts to manage land use to achieve multiple objectives. In the Cairo area this would focus on the new cities development and efforts to keep urban growth to encroach on agricultural land. Along the Red Sea coast it would focus on attempts to protect habitat and ensure that the growth of tourism does not destroy coral reefs. A few of the row headers in Table 4 warrant explanation. Changes as a result of transactions – the shaded area - are changes covered in the 1993 SNA. (The codes on those row headers, e.g. P.51, K.1, are those used in the SNA to identify specific items.) Gross fixed capital formation is the technical term for new investments; this is meaningful only for man-made (i.e. produced) assets. Consumption of fixed capital is the technical term for depreciation, which is also only meaningful for man-made assets. Environmental additions and deductions are changes in the stocks that are not covered by the 1993 SNA. Reclassifications due to quality change would include changes in resources due to environmental degradation, new uses for resources, extractions, and new discoveries; for water accounts, this would capture changes in Nile water quality. The lumpiness of new discoveries, particularly for subsoil assets, means that they can cause sudden dramatic shifts in stock figures. Under other changes, valuation changes are particularly important in monetary accounts. These pertain to changes in the value of the stock due to world price changes. Given the fluctuations in commodity prices, these can have overwhelming impacts on monetary asset accounts. Sub-soil asset accounts The data needed to build sub-soil asset accounts should be available within the Ministry of Petroleum. The construction of the accounts would provide value added beyond the uses of these data within the Ministry, by addressing several related concerns of importance to Egypt. One is the concern about sustainability in the energy sector and the energy sector’s role in sustainability of the economy as a whole. A second is the fear that we will run out of specific resources that are crucial to the well-being of the economy. A third, slightly different concern pertains to whether society as a whole is capturing the rents from mineral extraction or whether they are remaining in private hands. This is an important issue, because many people believe that fundamentally natural resources belong to the society as a whole, and although those who extract them are entitled to a normal return on their investment, any rents above and beyond that return should belong to the society rather than to individuals. Although the accounts do not provide simple solutions for these issues, they do organize the data with which to analyze them. They help track the rate at which minerals are discovered and used, shedding some light on the depletion issues though not fully resolving them. They provide a framework for estimating rent and determining the extent to which it is captured by the government for public use. As minerals are extracted, the stock of assets available to the economy from this source diminishes. The accounts also contribute to assessment of whether the economy is investing enough to sustain income, although they do not show whether mineral incomes in particular are being reinvested. The data in the accounts also allow the calculation of rents from extraction of subsoil assets, as well as the share of those rents that can be used to achieve social aims rather than private ones. The Ministry of Petroleum is likely to have the data needed to build asset accounts, although they are not public and obtaining data information for them has not been possible. Given their reluctance to share information about their data, they are likely to be equally unlikely to want to build petroleum and natural gas asset accounts for public use. If the major value added of the asset accounts is that they would let decision-makers and the public assess policies for managing energy resources, the same might be accomplished simply by ensuring public access to the existing data in
- 45 -
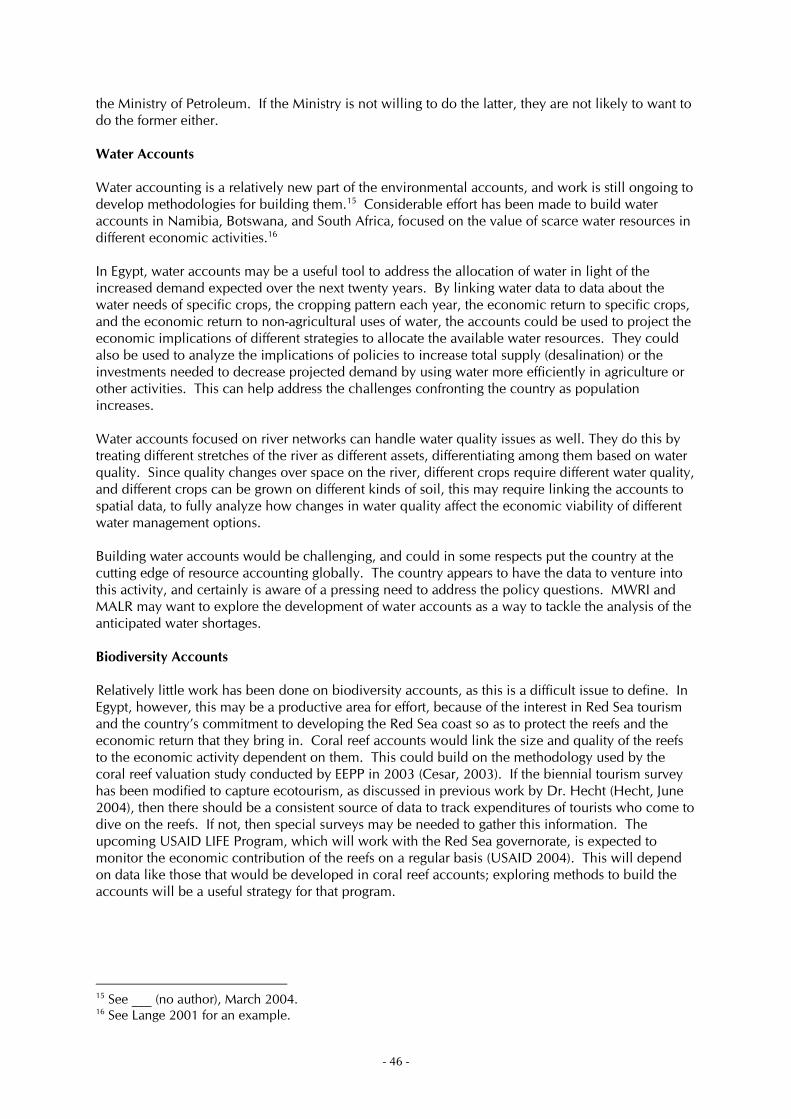
the Ministry of Petroleum. If the Ministry is not willing to do the latter, they are not likely to want to do the former either. Water Accounts Water accounting is a relatively new part of the environmental accounts, and work is still ongoing to develop methodologies for building them.15 Considerable effort has been made to build water accounts in Namibia, Botswana, and South Africa, focused on the value of scarce water resources in different economic activities.16 In Egypt, water accounts may be a useful tool to address the allocation of water in light of the increased demand expected over the next twenty years. By linking water data to data about the water needs of specific crops, the cropping pattern each year, the economic return to specific crops, and the economic return to non-agricultural uses of water, the accounts could be used to project the economic implications of different strategies to allocate the available water resources. They could also be used to analyze the implications of policies to increase total supply (desalination) or the investments needed to decrease projected demand by using water more efficiently in agriculture or other activities. This can help address the challenges confronting the country as population increases. Water accounts focused on river networks can handle water quality issues as well. They do this by treating different stretches of the river as different assets, differentiating among them based on water quality. Since quality changes over space on the river, different crops require different water quality, and different crops can be grown on different kinds of soil, this may require linking the accounts to spatial data, to fully analyze how changes in water quality affect the economic viability of different water management options. Building water accounts would be challenging, and could in some respects put the country at the cutting edge of resource accounting globally. The country appears to have the data to venture into this activity, and certainly is aware of a pressing need to address the policy questions. MWRI and MALR may want to explore the development of water accounts as a way to tackle the analysis of the anticipated water shortages. Biodiversity Accounts Relatively little work has been done on biodiversity accounts, as this is a difficult issue to define. In Egypt, however, this may be a productive area for effort, because of the interest in Red Sea tourism and the country’s commitment to developing the Red Sea coast so as to protect the reefs and the economic return that they bring in. Coral reef accounts would link the size and quality of the reefs to the economic activity dependent on them. This could build on the methodology used by the coral reef valuation study conducted by EEPP in 2003 (Cesar, 2003). If the biennial tourism survey has been modified to capture ecotourism, as discussed in previous work by Dr. Hecht (Hecht, June 2004), then there should be a consistent source of data to track expenditures of tourists who come to dive on the reefs. If not, then special surveys may be needed to gather this information. The upcoming USAID LIFE Program, which will work with the Red Sea governorate, is expected to monitor the economic contribution of the reefs on a regular basis (USAID 2004). This will depend on data like those that would be developed in coral reef accounts; exploring methods to build the accounts will be a useful strategy for that program. 15 See ___ (no author), March 2004. 16 See Lange 2001 for an example.
- 46 -
E.5 “Green GDP” The development of environmental accounts was initially motivated by the desire to calculate a measure of sustainable income, or what GDP and other macroeconomic indicators would be if they incorporated harm to the environment caused by economic growth. Although there has been a great deal of work in this area over the past thirty years, the SEEA does not actually recommend such calculations. There is agreement on the need to incorporate the depreciation of natural assets using methods that parallel those for the depreciation of produced assets. This would lead to changes in the calculation of Net Domestic Product and of savings. There is no consensus, however, on methods for making other modifications to the macroeconomic indicators. The interpretation of most “green” macroeconomic indicators is simply not clear. For this reason most environmental accounting systems do not calculate them, emphasizing instead the construction of the accounts that might underlie such calculations. Egypt is recommended to follow the same practice if it develops environmental accounts.
- 47 -
F. Priorities for future work This review of the Egyptian environmental statistics system and the potential for developing environmental accounts suggests several major conclusions and recommendations. F.1 Data Availability Several key kinds of data are lacking in the Egyptian environmental statistics system. There are no systematic data on emissions into air or water from industrial, vehicle, municipal, or agricultural sources. Emissions data are a key tool for environmental policy-making. They make it possible to identify major sources of pollution and track whether their performance is improving. This in turn can be used to determine where additional pollution control efforts should be targeted, and when legal action should be taken to enforce compliance with environmental law. Moreover, emissions data are essential to determine the environmental implications of economic growth and the economic implication of environmental protection policies. Understanding how much is now being spent to protect the environment and how much additional environmental protection would cost is also a key element of policy development, as is an understanding of the benefits of environmental protection. Cost is the major deterrent to effective environmental protection, but often it is exaggerated. Better data in this area would therefore be useful for many policy purposes. Not all new data development will require comprehensive primary data development. In some cases it may be a matter of making better use of administrative and enforcement databases, so that they can serve more than one purpose. For example, the environmental registers and the inspection data might be usable to build publicly usable data on current pollution levels, if the appropriate steps are taken to protect firms’ privacy. It may be possible to make better use of medical records to produce databases with which to analyze environmental health problems. Administrative data on solid waste management can probably be used to create valuable databases for analytical and policy use. Data from vehicle inspections in Cairo can be used to build analytical data on mobile source pollution. With careful consideration it should be possible to identify many other administrative data systems that can be better used to inform environmental policy. Recommendations 1. Government actors within the environmental statistics system should look for opportunities to
use administrative and regulatory data to construct analytical databases, and pursue them vigorously. EEAA, in collaboration with CAPMAS, should take the lead on working with other ministries to identify such opportunities.
2. EEAA, in collaboration with CAPMAS, the Ministry of Industry, and donor agencies, should
consider launching a survey of smaller and medium-sized plants to identify production technology, input use, and resulting emissions, at a detailed sectoral level. Such data could be used to develop Egyptian emissions coefficients, which would provide a reliable basis for estimating national and regional pollutant loads. Such a system would be of considerable interest to other countries as well; possible collaboration with the World Bank Industrial Pollution Projection System should be investigated.
3. CAPMAS, in collaboration with EEAA and the National Accounts Unit of the Ministry of
Planning, and with outside technical assistance as needed, should investigate the possibility of modifying the questionnaires used for the census of industry and the household expenditure survey, to gather data on environmental protection expenditures.
- 48 -
F.2 System Management Egypt’s environmental statistics system does quite well in many areas. It falls seriously short in data access, however. The attitude on the part of most ministries, that their data are produced for their own use or to use as a negotiating chip in seeking information from other organizations, does not allow the statistical system to meet the social objectives which justify spending public funds on it. Over time Egypt must move away from the current attitudes and towards a system in which all data are publicly available unless concerns of privacy or national security preclude it. The past ten years have seen improvement in access to data, and it may become better yet. Building better and more public metadata – information about what information exists – may be a good next step towards improving data access and use. This possibility was discussed at the workshop conducted on August 2, attended by many key actors in the environmental statistics system. Participants in the workshop agreed that fully and publicly documenting the existing data would move the statistics system ahead in agreeing on gaps and needs for improved data sharing, and in enabling potential users to determine what may interest them and how to access it. With good metadata available, data producers will be less reluctant to see their statistics analyzed by others, and may therefore be more willing to share the underlying data. The details of how such metadata might be developed are considered below. Recommendation Key players in the environmental statistics system, in collaboration with the USAID DATA Project, should expand the work begun in this report into a comprehensive publicly-accessible system of environmental metadata. This documentation should be disseminated on the web and updated regularly. Such information will provide government agencies and the public with an understanding of what data exist on the environment and how they can be obtained and used, which in turn should strengthen the use of environmental statistics nationwide. Building this metadata should involve the following steps (not necessarily consecutively): 1. Continue identifying data sources as begun in this report. Wide dissemination of this report,
especially to agencies that were not visited during the initial consultancy, should help in showing the kind of information that is of interest and identifying additional data sources. In seeking data sources, particular attention should be given to identifying more one-time databases. There are probably many of them available in ministries, donor projects, research centers or universities; including them in the metadata would greatly strengthen the utility of the system. The database on donor-funded projects in EEAA offers a good point of departure for tracking down such data sources; all of the projects in this system should be contacted to identify data they may have developed. The CAPMAS Environment Department may play a key role in carrying this out.
2. Approach the key institutional players in the environmental statistics arena to solicit their
collaboration in an effort to build reliable and publicly accessible metadata. These will include EEAA, CAPMAS, IDSC, MWRI, MOHP, MLR, MALR, Ministry of Housing, and other ministries. The participation of EEAA and the Ministry of Environment is essential for the system to go forward. IDSC participation is essential, but does not seem likely to be a problem since metadata development and dissemination is part of their mandate. CAPMAS participation will also be essential; identifying a meaningful role for their environment department will be crucial. The participation of MWRI, as a major data supplier, is also important. Since they are already working with IDSC on metadata, it seems reasonable to expect that they would join a broader metadata effort. If EEAA, IDSC, CAPMAS, and MWRI are all on board, the system would enough critical mass to bring in the other major suppliers of data related to the environment.
- 49 -

3. Once the key players are on board, put together a working group to take responsibility for the metadata development, which should include data users from the private sector, academia, donor agencies, and NGOs as well as the public agencies mentioned above.
4. The working group, with outside technical assistance if needed, should develop the structure of
the metadata to be gathered. This means designing a form to be filled in for each data source that will provide standard information about the contents of the database, how it was collected, who is responsible for it, how it can be obtained, and so on. Depending on the scope of information to be included in the metadata system, several forms may be needed. For example, the information needed to describe the census of agriculture may be different from the information needed to describe measurements of blood lead levels, which may in turn be different from what is needed to describe satellite images or analytical reports.
5. Once the forms have been designed and agreed upon, the working group should send them to
all known data sources so they can complete the forms with accurate details about their databases.
6. The working group should also devote some attention to identifying administrative data sources
that can be used to build databases that will be of interest for environmental policy purposes. This will take detailed discussions with a wide range of ministries, public agencies, and perhaps trade associations or other private organizations, to determine whether they have information that could be made available for wider use, and if so how that could be done without compromising privacy.
7. The working group must decide which institutions will play which roles in disseminating the
metadata. IDSC, CAPMAS, and EEAA are likely to be the major players in this area. 8. Programmers will have to be involved in designing the metadata system itself. This is likely to
be a database about the available information, with carefully designed keywords so that users can search for the information likely to be of use to them.
9. The institutions chosen to disseminate the metadata will have to determine how they will do
this. The web is the most efficient way of doing this; a system should be put in place to allow users to search the metadatabase itself to identify the information of interest to them. The searchers should return the full documentation on the information sources, which will have been compiled through development of the metadata system. Wherever possible – i.e. whenever the data or summary reports are on the web – these searches should also return links to the websites from which the information in question can be downloaded. When the information itself is not on line, searches should return specific information about how it can be obtained, including names of individuals to contact, telephone numbers, email addresses, and so on.
10. Some users will not be able to access them metadata through the web. For them, it will be
necessary to produce a written catalog of environmental data to supplement the on-line version. The design of this catalog must be made so as to make it as easy as possible to update, as well as inexpensive to disseminate.
11. Metadata are a living thing. New databases will be created all the time, new ones will become
available, existing ones may change structure, contact information will change, web addresses will change, and so on. Keeping the information in the metadatabase up to date is crucial, and will require an ongoing investment of staff time and financial resources. This should be made as simple as possible, in order to ensure that it is done. The website through which the metadata are accessed should include a module through which the public (and particularly the holders of databases) can submit updates, corrections, and especially information about additional databases to include in the system. Such updates would of course be reviewed by those
- 50 -
managing the metadata system before actually being incorporated, but this could make it easier to keep the system up to date.
F.3 Environmental Accounting While the development of a comprehensive system of environmental accounts is not an urgent priority, the recommendations for data improvement suggested above will make it easier for the National Accounts Unit to begin work on environmental accounts in upcoming years. Systematic data on pollutant emissions are a key element in the construction of physical flow accounts and hybrid input-output tables, both key components of the SEEA. The inclusion of questions on environmental expenditures in the census of industry and the household expenditure survey would be valuable in constructing environmental protection expenditure accounts. In addition, work on asset accounts for water and coral reefs could be valuable in addressing specific resource management problems. Recommendations 1. MWRI and MALR should collaborate to explore the possibility of building water accounts, with
which they could address economic implications of the water shortages that are expected to become a problem in the next twenty years.
2. EEAA and the Ministry of Tourism, in collaboration with the Red Sea Governorate and the Red
Sea component of the upcoming USAID LIFE program, should explore the development of resource accounts to understand role of biodiversity the economy, with particular emphasis on the Red Sea coral reefs.
- 51 -
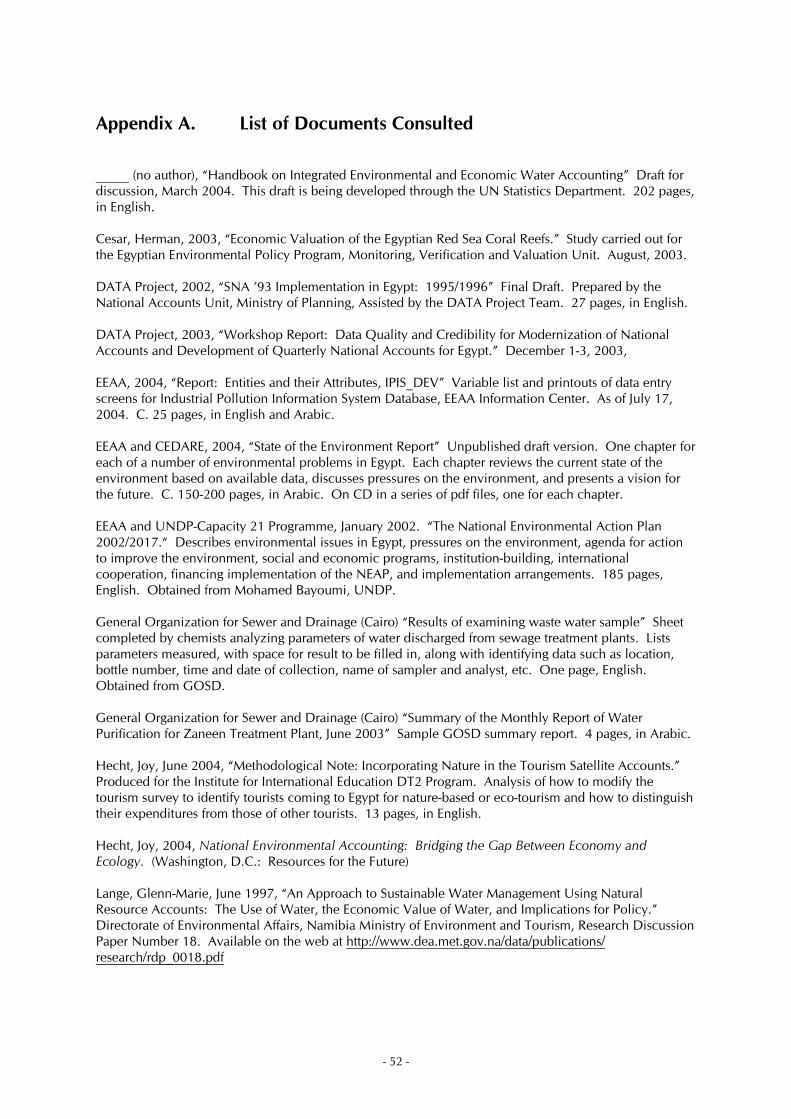
Appendix A. List of Documents Consulted _____ (no author), “Handbook on Integrated Environmental and Economic Water Accounting” Draft for discussion, March 2004. This draft is being developed through the UN Statistics Department. 202 pages, in English. Cesar, Herman, 2003, “Economic Valuation of the Egyptian Red Sea Coral Reefs.” Study carried out for the Egyptian Environmental Policy Program, Monitoring, Verification and Valuation Unit. August, 2003. DATA Project, 2002, “SNA ’93 Implementation in Egypt: 1995/1996” Final Draft. Prepared by the National Accounts Unit, Ministry of Planning, Assisted by the DATA Project Team. 27 pages, in English. DATA Project, 2003, “Workshop Report: Data Quality and Credibility for Modernization of National Accounts and Development of Quarterly National Accounts for Egypt.” December 1-3, 2003, EEAA, 2004, “Report: Entities and their Attributes, IPIS_DEV” Variable list and printouts of data entry screens for Industrial Pollution Information System Database, EEAA Information Center. As of July 17, 2004. C. 25 pages, in English and Arabic. EEAA and CEDARE, 2004, “State of the Environment Report” Unpublished draft version. One chapter for each of a number of environmental problems in Egypt. Each chapter reviews the current state of the environment based on available data, discusses pressures on the environment, and presents a vision for the future. C. 150-200 pages, in Arabic. On CD in a series of pdf files, one for each chapter. EEAA and UNDP-Capacity 21 Programme, January 2002. “The National Environmental Action Plan 2002/2017.“ Describes environmental issues in Egypt, pressures on the environment, agenda for action to improve the environment, social and economic programs, institution-building, international cooperation, financing implementation of the NEAP, and implementation arrangements. 185 pages, English. Obtained from Mohamed Bayoumi, UNDP. General Organization for Sewer and Drainage (Cairo) “Results of examining waste water sample” Sheet completed by chemists analyzing parameters of water discharged from sewage treatment plants. Lists parameters measured, with space for result to be filled in, along with identifying data such as location, bottle number, time and date of collection, name of sampler and analyst, etc. One page, English. Obtained from GOSD. General Organization for Sewer and Drainage (Cairo) “Summary of the Monthly Report of Water Purification for Zaneen Treatment Plant, June 2003” Sample GOSD summary report. 4 pages, in Arabic. Hecht, Joy, June 2004, “Methodological Note: Incorporating Nature in the Tourism Satellite Accounts.” Produced for the Institute for International Education DT2 Program. Analysis of how to modify the tourism survey to identify tourists coming to Egypt for nature-based or eco-tourism and how to distinguish their expenditures from those of other tourists. 13 pages, in English. Hecht, Joy, 2004, National Environmental Accounting: Bridging the Gap Between Economy and Ecology. (Washington, D.C.: Resources for the Future) Lange, Glenn-Marie, June 1997, “An Approach to Sustainable Water Management Using Natural Resource Accounts: The Use of Water, the Economic Value of Water, and Implications for Policy.” Directorate of Environmental Affairs, Namibia Ministry of Environment and Tourism, Research Discussion Paper Number 18. Available on the web at http://www.dea.met.gov.na/data/publications/ research/rdp_0018.pdf
- 52 -
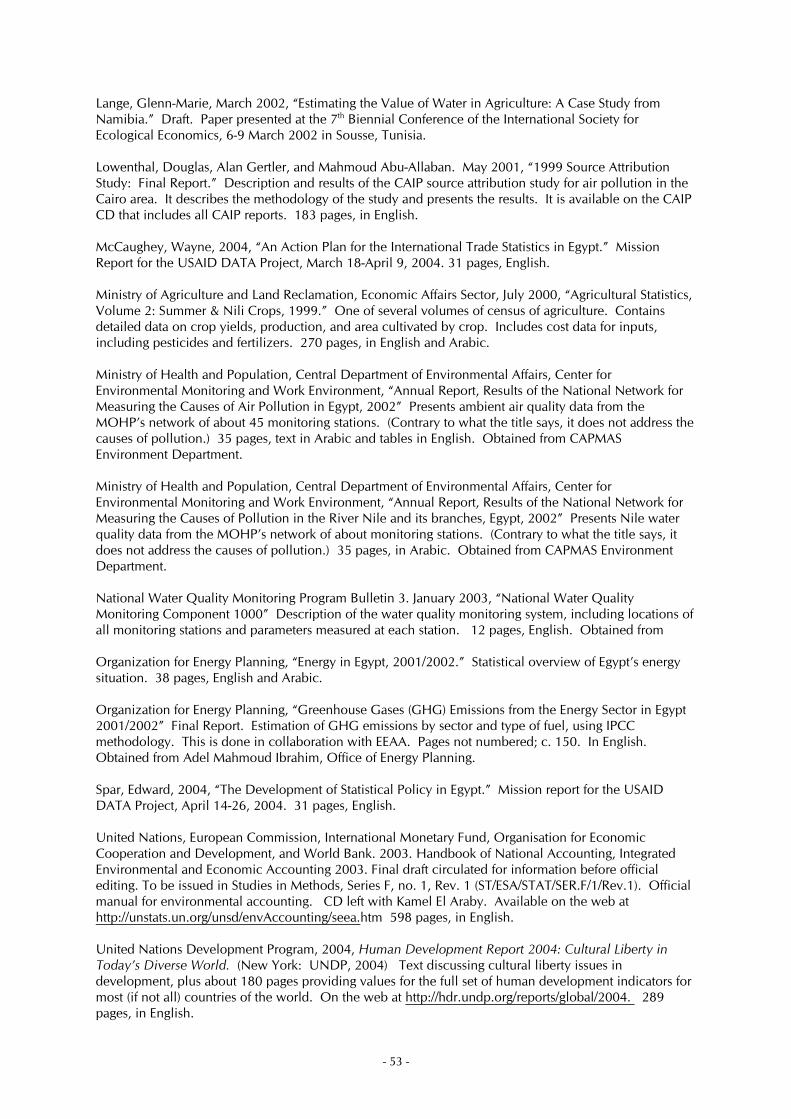
Lange, Glenn-Marie, March 2002, “Estimating the Value of Water in Agriculture: A Case Study from Namibia.” Draft. Paper presented at the 7th Biennial Conference of the International Society for Ecological Economics, 6-9 March 2002 in Sousse, Tunisia. Lowenthal, Douglas, Alan Gertler, and Mahmoud Abu-Allaban. May 2001, “1999 Source Attribution Study: Final Report.” Description and results of the CAIP source attribution study for air pollution in the Cairo area. It describes the methodology of the study and presents the results. It is available on the CAIP CD that includes all CAIP reports. 183 pages, in English. McCaughey, Wayne, 2004, “An Action Plan for the International Trade Statistics in Egypt.” Mission Report for the USAID DATA Project, March 18-April 9, 2004. 31 pages, English. Ministry of Agriculture and Land Reclamation, Economic Affairs Sector, July 2000, “Agricultural Statistics, Volume 2: Summer & Nili Crops, 1999.” One of several volumes of census of agriculture. Contains detailed data on crop yields, production, and area cultivated by crop. Includes cost data for inputs, including pesticides and fertilizers. 270 pages, in English and Arabic. Ministry of Health and Population, Central Department of Environmental Affairs, Center for Environmental Monitoring and Work Environment, “Annual Report, Results of the National Network for Measuring the Causes of Air Pollution in Egypt, 2002” Presents ambient air quality data from the MOHP’s network of about 45 monitoring stations. (Contrary to what the title says, it does not address the causes of pollution.) 35 pages, text in Arabic and tables in English. Obtained from CAPMAS Environment Department. Ministry of Health and Population, Central Department of Environmental Affairs, Center for Environmental Monitoring and Work Environment, “Annual Report, Results of the National Network for Measuring the Causes of Pollution in the River Nile and its branches, Egypt, 2002” Presents Nile water quality data from the MOHP’s network of about monitoring stations. (Contrary to what the title says, it does not address the causes of pollution.) 35 pages, in Arabic. Obtained from CAPMAS Environment Department. National Water Quality Monitoring Program Bulletin 3. January 2003, “National Water Quality Monitoring Component 1000” Description of the water quality monitoring system, including locations of all monitoring stations and parameters measured at each station. 12 pages, English. Obtained from Organization for Energy Planning, “Energy in Egypt, 2001/2002.” Statistical overview of Egypt’s energy situation. 38 pages, English and Arabic. Organization for Energy Planning, “Greenhouse Gases (GHG) Emissions from the Energy Sector in Egypt 2001/2002” Final Report. Estimation of GHG emissions by sector and type of fuel, using IPCC methodology. This is done in collaboration with EEAA. Pages not numbered; c. 150. In English. Obtained from Adel Mahmoud Ibrahim, Office of Energy Planning. Spar, Edward, 2004, “The Development of Statistical Policy in Egypt.” Mission report for the USAID DATA Project, April 14-26, 2004. 31 pages, English. United Nations, European Commission, International Monetary Fund, Organisation for Economic Cooperation and Development, and World Bank. 2003. Handbook of National Accounting, Integrated Environmental and Economic Accounting 2003. Final draft circulated for information before official editing. To be issued in Studies in Methods, Series F, no. 1, Rev. 1 (ST/ESA/STAT/SER.F/1/Rev.1). Official manual for environmental accounting. CD left with Kamel El Araby. Available on the web at http://unstats.un.org/unsd/envAccounting/seea.htm 598 pages, in English. United Nations Development Program, 2004, Human Development Report 2004: Cultural Liberty in Today’s Diverse World. (New York: UNDP, 2004) Text discussing cultural liberty issues in development, plus about 180 pages providing values for the full set of human development indicators for most (if not all) countries of the world. On the web at http://hdr.undp.org/reports/global/2004. 289 pages, in English.
- 53 -

USAID, 2004, “STATEMENT OF WORK: Sustainable Economic Growth in the Red Sea Governorate” Attachment 2 to the Request for Proposals for the LIFE Program. 21 pages, in English. USAID, Cairo Air Improvement Project, 2004 CD containing all of the final and many of the intermediate reports from CAIP (not containing the actual air quality monitoring data, however.) USAID, Cairo Air Improvement Project, August 2000, “Data Analysis Report for the On-Road Testing (ORT) Program.” Describes the testing program, form completed (thus data collected), technology used, and provides many summary tables and graphs with results. 47 pages, in English. On the CAIP CD produced at the end of the project. USAID, Egypt Environmental Policy Program, 2004 CD containing all of the final and many of the intermediate reports from EEPP. USAID EEPP Air Quality Program, March 2004, “Ambient Air Quality Status Report: Technical Support document for Development of the National Air Quality Strategy Framework”- Greater Cairo Emissions Inventory – descriptions of how they estimated emissions from various sectors. Apparently EEAA Industrial Unit has the spreadsheet that shows the original calculations. Report is on the EEPP CD. 109 pages, in English. USAID EEPP Air Quality Program, June 2004, “Air Quality Information Dissemination Plan.” Strategy for disseminating air quality information to the public. Primary focus in on the daily air quality index that EEPP agreed to disseminate. On the EEPP CD. 33 pages, in English. Wafa, Heba, Dr. Mohamed Hassan Khalil, Dr. Michael Smith, Mr. Mohamed Gabr, Dr. Alaa Abou Zied, Dr. Mustafa Ragab, Dr. Paolo Ricci, 2004, “Benefits of Improved Health from Cleaner Air in Greater Cairo: Health Risk Assessment and Economic Valuation.” Draft. Technical Support Document for the Development of the National Air Quality Strategy Framework, EEPP-Air. On the EEPP CD. 121 pages, in English. World Bank, 2002, “Cost Assessment of Environmental Degradation in Egypt.” June 28, 2002. Presentation of a study and methodology for estimating the costs imposed by environmental degradation and comparing them with the costs of cleaning the environment. Produced as part of a World Bank/METAP/Swiss Cooperation program entitled Cost Assessment of Environmental Degradation in the Mashreq and Maghreb Countries: From Theory to Practice. 38 pages, in English. World Bank, 2004 “Arab Republic of Egypt, Country Environmental Analysis.” Draft. Water and Environment Department, Middle East and North Africa Region. June 21, 2004. Overview of the state of Egypt’s environment, detailed discussion of air, water, solid waste, coastal zone management, environmental policies and institutions, environmental expenditures, conclusions and recommendations. 161 pages, English.
- 54 -
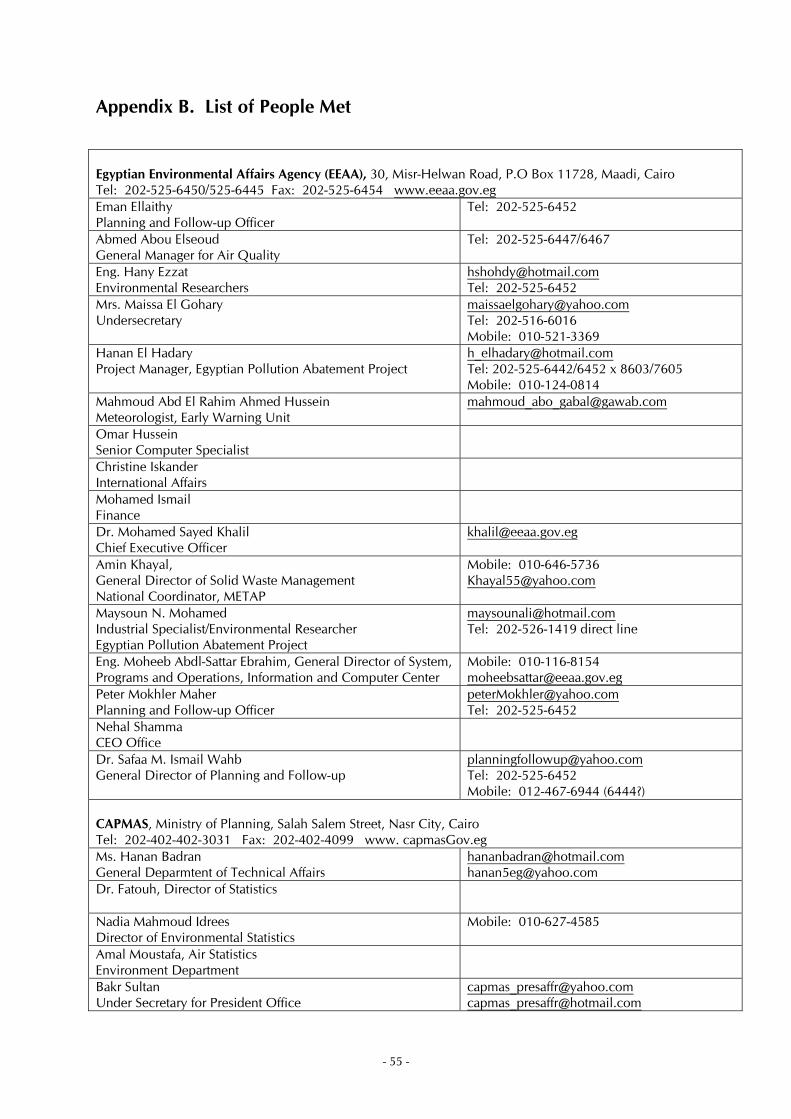
Appendix B. List of People Met Egyptian Environmental Affairs Agency (EEAA), 30, Misr-Helwan Road, P.O Box 11728, Maadi, Cairo Tel: 202-525-6450/525-6445 Fax: 202-525-6454 www.eeaa.gov.eg Eman Ellaithy Planning and Follow-up Officer
Tel: 202-525-6452
Abmed Abou Elseoud General Manager for Air Quality
Tel: 202-525-6447/6467
Eng. Hany Ezzat Environmental Researchers
[email protected]: 202-525-6452
Mrs. Maissa El Gohary Undersecretary
[email protected]: 202-516-6016 Mobile: 010-521-3369
Hanan El Hadary Project Manager, Egyptian Pollution Abatement Project
[email protected]: 202-525-6442/6452 x 8603/7605 Mobile: 010-124-0814
Mahmoud Abd El Rahim Ahmed Hussein Meteorologist, Early Warning Unit
Omar Hussein Senior Computer Specialist
Christine Iskander International Affairs
Mohamed Ismail Finance
Dr. Mohamed Sayed Khalil Chief Executive Officer
Amin Khayal, General Director of Solid Waste Management National Coordinator, METAP
Mobile: 010-646-5736 [email protected]
Maysoun N. Mohamed Industrial Specialist/Environmental Researcher Egyptian Pollution Abatement Project
[email protected]: 202-526-1419 direct line
Eng. Moheeb Abdl-Sattar Ebrahim, General Director of System, Programs and Operations, Information and Computer Center
Mobile: 010-116-8154 [email protected]
Peter Mokhler Maher Planning and Follow-up Officer
[email protected]: 202-525-6452
Nehal Shamma CEO Office
Dr. Safaa M. Ismail Wahb General Director of Planning and Follow-up
[email protected]: 202-525-6452 Mobile: 012-467-6944 (6444?)
CAPMAS, Ministry of Planning, Salah Salem Street, Nasr City, Cairo Tel: 202-402-402-3031 Fax: 202-402-4099 www. capmasGov.eg Ms. Hanan Badran General Deparmtent of Technical Affairs
[email protected]@yahoo.com
Dr. Fatouh, Director of Statistics
Nadia Mahmoud Idrees Director of Environmental Statistics
Mobile: 010-627-4585
Amal Moustafa, Air Statistics Environment Department
Bakr Sultan Under Secretary for President Office
[email protected][email protected]
- 55 -
Tarik Fouad Hassan, Solid Waste Statistics Division Head, Technical Affairs Department
Information and Decision Support Center, 1, Magless El Shaab Street, Cairo Tel: 202-792-9292 Fax: 202-792-9222 www.idsc.gov.eg [email protected] Neveen Ahmed [email protected]
Tel: 202-366-8504 Mobile: 012-349-0950
Amr Agmawi Head of Business Development and Marketing
Organization for Energy Planning, Ministry of Planning, P.O. Box 4604, 32 Mahmoud Khairy Street, Nasr City Code 11717 Cairo Tel: 202-402-7706 Fax: 202-403-7623 Dr. Hani A. Alnakeeb Chairman
Eng. Ahmed Abd-Rabou Coordinator, Technical Office Energy Utilization Department
Abdel Mahmoud Ibrahim, Senior Economist General Director of economic, Social and Environmental Impact Studies General Administration for Energy Planning
[email protected]@hotmail.comTel: 202-264-9544
National Accounts Central Department, Ministry of Planning 1 First May Buildings, Nasr Street, Six Section, Nasr City, Cairo Tel: 202-260-1687/97 Safaa Eweda Under Secretary
[email protected]: 010-578-7108
Ministry of Water Resources and Irrigation, Corniche El-Nil Imbaba, Giza P.O. Box 12666 Dr. Ragab Abdel Azim Tel: 202-544-9414
Mobile: 012-740-5203 Dr. Mohamed A.Abdel Khalik Director, Water Quality Management Unit
[email protected], [email protected]: 202-544-9469, 545-4036/7 Fax: 545-4035 Mobile: 010-164-9884
Eng. Gamil Mahmoud, IWMU Tel: 202-544-9554 Fax: 202-544-9530 Eng. Maher Khodary Mohamed Head of Irrigation
Dr. Mohamed Rami Mahmoud Associate Professor in NWRC, Director of Main Information Center
[email protected]: 202-544-9480 Fax: 202-544-9481
Eng. Gamal El Shafei Soil, Water and Environment Research Institute, Ministry of Agriculture Dr. Helmy Eid Agrometeorologist and Climate Change Expert
[email protected]: 202-257-3650 Mobile: 010-152-8017
Ministry of Local Development, … Samir Gharib Under Secretary, Supervisor of the Technical Office (Responsible for Environment)
[email protected]: 202-749-6795 Fax: 749-7788 Mobile: 010-116-9254
Gen. Ahmed Maher Under Secretary for the Minister’s Office Affairs
Tel: 202-7497571, 761-6383
- 56 -
Cairo General Organization for Sewage and Drainage (GOSD), 32 Ramsis Street, Cairo Tel: 202-577-9293/9239 Fax: 577-6504 Eng. Abdel Kadr M. Hamdy General Manager
Mobile: 012-313-6618
Dr. Amira Ibrahim Hassani General Manager, Department of Research and Development
Tel: 202-574-1104
Eng. Moustafa Bhayat Manager, Ele. Mech.
Tel: 202-577-6326
Eng. Dahlia Erian-Mesiha Programmer, Computer Center
Eng. Obeid Faheem Environmental Driector
Tel: 202-575-0258
Accountant Mervat Faried Computer Center
Accountant Wael Fouad Database Administrator, Computer Center
Eng. Magdy Mabrouk Manager, Information Center
Tel: 202-579-2075, 577-8884
Eng. Mohamed Ahmed A. Rahman Chairman
National Information Center on Health and Population, Ministry of Health, 3 Maglis Al-Sha’ab Street, and Qasr Al-Aini Street, Cairo Tel and Fax: 202-794-7984 Dr. Thanaa Ibrahim Head of the Center
Donor Agencies Walid M. Abdel-Rehim Senior Expert, Cairo Office
KfW 4d, El Gezira Street Zamalek 11211-Cairo
Tel: 202-736-7496, 736-9525 Fax: 202-736-3702, 738-2981
Mohamed Bayoumi GEF Programme Officer
UNDP 1191 Corniche El Nil World Trade Center Boulac, Cairo P.O. Box 982 Post Code 11599
Tel: 202-578-4840 to 4846 Fax: 202-678-4847 Direct Line: 202-394-9033
Amani Gamel Al-Din USAID 202-522-7000 Sylvia Attala USAID 202-522-7000 Nadine El-Hakim USAID 202-522-7000 [email protected] Glenn Rogers Economist, Economic Growth Office
USAID Tel: 202-522-6693 Fax: 202-736-2692 Mobile: 012-313-8741
Dr. Wadie Fahim Mankarious Retired, Water Resources Management Specialist
USAID Mobile: 012-354-8853
Private Organizations Ahmed Abdel Rehim Senior Programme Specialist Hossam Allam, MSc Senior Information Systems Specialist
Environmental Information Unit Center for Environment & Development for the Arab Region and Europe
Tel: 202-451-3921 to 3924 Fax: 202-451-3918
[email protected]@cedare.orgwww.cedare.org.eg
- 57 -
(CEDARE) 2, El-Hegaz Street CEDARE Building P.O Box 1057 Heliopolis Bahary, Cairo
Yasser Sherif General Manager
Environics 6, Dokki Street 12th floor Giza 12311
Tel: 202-749-5686 202-749-5696 202-760-1595 Fax: 202-336-0599
Ahmed Kamal Federation of Egyptian Industry
Dr. Robert Latowsky Managing Director
Infonex Corp. 4 Salah El-Din Street, suite 505 Masr El-Gedida, Cairo
Tel: 202-290-2953 Fax: 202-41901714
Mr. Rafat Radwan, Director Information Decision Support Center (IDSC)
Tel: 202-792-9292 – 792-9000 Fax: 202-792-9222 - 794-1222
[email protected] www.idsc.gov.eg
DATA Project, USAID/Ministry of Planning, Salah Salem Street, Nasr City, Cairo Tel: 202-260-1687 Fax: 202-260-1679 www.data-egypt.org Kamel El Araby National Accounts Coordinator
Mobile: 012-234-2590
George Atalla
Salma El Bahrawy Training and Outreach Specialist
[email protected]: 010-145-8417
Dr. Kamal Selim Statistical Advisor for Economic Surveys
[email protected] Mobile: 010-519-6232
Frank Szumilo Project Director
Nasr Tantawi Project Coordinator
Mobile: 010-578-0888
Moiz Zainuddin Statistical methodology Advisor
[email protected]: 010-122-0610
- 58 -
Appendix C. Terms of Reference June 7, 2004
Statement of Work STRATEGIC OPTIONS FOR USE OF ENVIRONMENTAL DATA IN NATIONAL ACCOUNTS
INTRODUCTION The Environmental Data component of DATA seeks to identify the policy requirements that are necessary and sufficient for incorporating environmental factors in national accounts and for enabling data producers to disseminate environmental statistics for critical policy issues facing Egypt. The contractor will identify policy issues related to data acquisition and data standards necessary for this successful data integration. The contractor will identify key actors and engage them in an initial process aimed at achieving broad based support and effort at carrying out the steps necessary for this successful integration. This activity will be a performance-based acquisition funded through the DATA activity being implemented by Booz Allen Hamilton. An expert in the field of environmental data will be contracted to carry out the activity. BACKGROUND A. The Data Access and Transmission Activity Project (DATA) Since July 2000, the DATA Project (http://www.data-egypt.org/) has concentrated its efforts in two areas: implementation of the United Nations’ 1993 System of National Accounts and assistance in gaining membership for Egypt in the IMF Special Data Dissemination Standards program. In addition, the DATA Project assists data providers such as the Central Agency for Public Mobilization and Statistics (CAPMAS) in improving data quality, reducing data processing time, and developing surveys needed to fill the data gaps identified in the national accounts estimates. Since April 2003, DATA has been working with the government of Egypt on the design and implementation of sound national statistical policy. A brief write up on the DATA Project is placed in Appendix I.
B. Environmental Data and National Accounts International work on environment statistics has a comparatively brief history, dating back only three decades. Because environment statistics is a relatively new field, there are frequent changes in methodologies, measurement techniques, and other procedures. Meanwhile, the rapid emergence of new concerns and environmental threats is expanding the field’s boundaries. Statisticians must therefore deal with a constantly changing set of demands, while incorporating new and often more complex procedures into their normal routine. Countries that have just begun to develop their own programs of environment statistics will encounter both advantages and disadvantages relative to those that have gone ahead of them. The former can draw on the experience of their predecessors by adopting classifications, methodologies, and techniques that have already been tested elsewhere. However, the dynamic nature of environment statistics means that the start-up is a more complicated undertaking today than it was only a decade ago. Environmental accounting – the modification of the national income accounts to take into account the economic role of the environment – has grown in importance over the past ten years. However, many countries have not yet implemented such accounts, and there is considerable controversy about whether and how to do so. Environmental accounts are being implemented with an array of goals in mind. One of the most ambitious is that they will help steer the economy onto a sustainable path or provide macroeconomic indicators that reflect the role of the environment in the economy. A more modest goal is that the accounts and the data underlying them will make it easier to analyze sectoral and macroeconomic issues, so as to design policies that reflect a more comprehensive understanding of the
- 59 -

relationship between the economy and the environment. A further aim for the accounts is that the process of building them will serve as a catalyst for organizing data in new ways, reconciling discrepancies in underlying data, and investing in new data collection. OBJECTIVES This activity is designed to propose preliminary options for a strategy to incorporate environmental data into the national income accounts and contribute to the development of a sound system of environmental statistics, particularly for water resources and pollution abatement. The strategy should include any required improvement of the data sets available or needed to build environmental accounts, policies required to facilitate the acquisition and use of the data, and institutional capacity to sustain the process. SOW PERFORMANCE REQUIREMENTS Two reports will be provided to the USAID Mission by the end of the 30 day consultancy. By the end of the first week the consultant will present a detailed work plan, any suggestions for revising this SOW, and an initial outline of the two deliverables.
The first report will be an initial assessment of relevant data sets currently available, providing information on what they cover, who produces them, how readily they may be used, and similar issues. This assessment is intended to be useful both for the specific development of environmental accounts and for the broader strengthening of Egyptian environment statistics. The second report will be an options paper for the development of environmental accounts, discussing specific issues and approaches related to the implementation of such a process in Egypt. The recommendations should be linked to the System of Integrated Environmental and Economic Accounts 2003 (SEEA). The development of the plan of action should be participatory in nature, including broad stakeholder input to the drafting phase. It is expected that relevant issues and ideas will be vetted with stakeholders in a workshop to be held following the initial assessment. Both reports will be provided to the Mission on paper in digital format (Microsoft Word) during the final briefing prior to departure.
Tasks
1. Meet with officials from CAPMAS, the Ministry of Planning, EEAA, the Ministry of Water and Irrigation, and other government agencies to identify the appropriate agency to take primary responsibility for building environmental accounts.
2. Meet with relevant private sector and donor projects to identify priorities and current roles in
providing relevant data and policy analysis. In addition to USAID projects, an initial list of contacts should include the following:
Canadian Project - Egyptian Environmental Information System UK DFID – Support to Environmental Assessment and Management CEDARE - Egypt’s State of the Environment Report (Center for Environment and Development for the Arab Region and Europe)
3. Identify priority areas within the SEEA on which to focus an initial Egyptian system of
environmental accounts. The establishment of priorities will be based on key environmental problems in Egypt, the need to understand the importance of key resources to the economy, the state of the economic accounts and how it is possible to build on them to address environmental issues, the availability of data, and similar considerations. The input of a broad set of stakeholders will be sought for the identification of accounting priorities.
- 60 -
4. Carry out an initial inventory of data sources for the development of Egyptian environmental accounts, building on similar work undertaken in the past few years through other USAID projects so as not to duplicate efforts. Wherever possible meet with the suppliers of major datasets to get a full understanding of how the data are produced, what they cover, and how they may be accessed for the development of the accounts (and by the public). Identify memoranda of understanding with data-producing agencies that will be needed for the environmental accounts to be built.
5. Outline a schedule for the development of an initial set of environmental accounts and
associated policy studies, highlighting what might be implemented by various stakeholders before the end of the DATA Project in 2005.
B. Deliverables 1 A preliminary assessment of environmental statistics in Egypt, including identification of the types and location of data existent, the structural barriers to the exchange or availability of such data, how they are used at present, the methodology for collection and how their collection is funded. Also needed is the identification of those ministries and organizations that are involved with environmental activities. This will provide a basis for subsequent work to strengthen the Egyptian environment statistics system. 2. An options paper for the development of a strategic plan for the implementation of a first set of Egyptian Integrated economic and environmental accounts that addresses the institutional framework for the accounts, priorities for the content of the accounts, data availability and access to data, schedule for the work, and the roles of different agencies in carrying it out including the identification of the ministry or agency that will lead the work on the Integrated Economic and Environmental Accounts.
C. Resource Requirements An expert in environmental statistics (economist, statistician, or physical scientist with at least ten to fifteen years overall applied experience in relevant areas. Demonstrated experience in the fields of property rights and/or water resources or environmental information in a developing country context. Experience in Egypt or Arabic-speaking countries would be a benefit. Appendix I to the Terms of Reference DATA ACCESS AND TRANSMISSION ACTIVITY
OBJECTIVES The Data Access and Transmission Activity (DATA) is a U.S. Agency for International Development (USAID) project that assists the Government of Egypt in its efforts to:
• Establish national statistical policy to guide information management • Develop and disseminate leading, coincident and lagging economic indicators • Improve, extend, and coordinate outreach of statistical services • Institutionalize a system of National Accounts based on international standards • Achieve compliance with the International Monetary Fund requirements for Special Data
Dissemination Standards (SDDS) The goal of DATA is to promote broad-based, sustainable development that increases employment opportunities for Egyptians and improves the quality of their lives. To this end, the activity will help improve the quality, periodicity, timeliness, and availability of estimates of economic activity in Egypt,
- 61 -
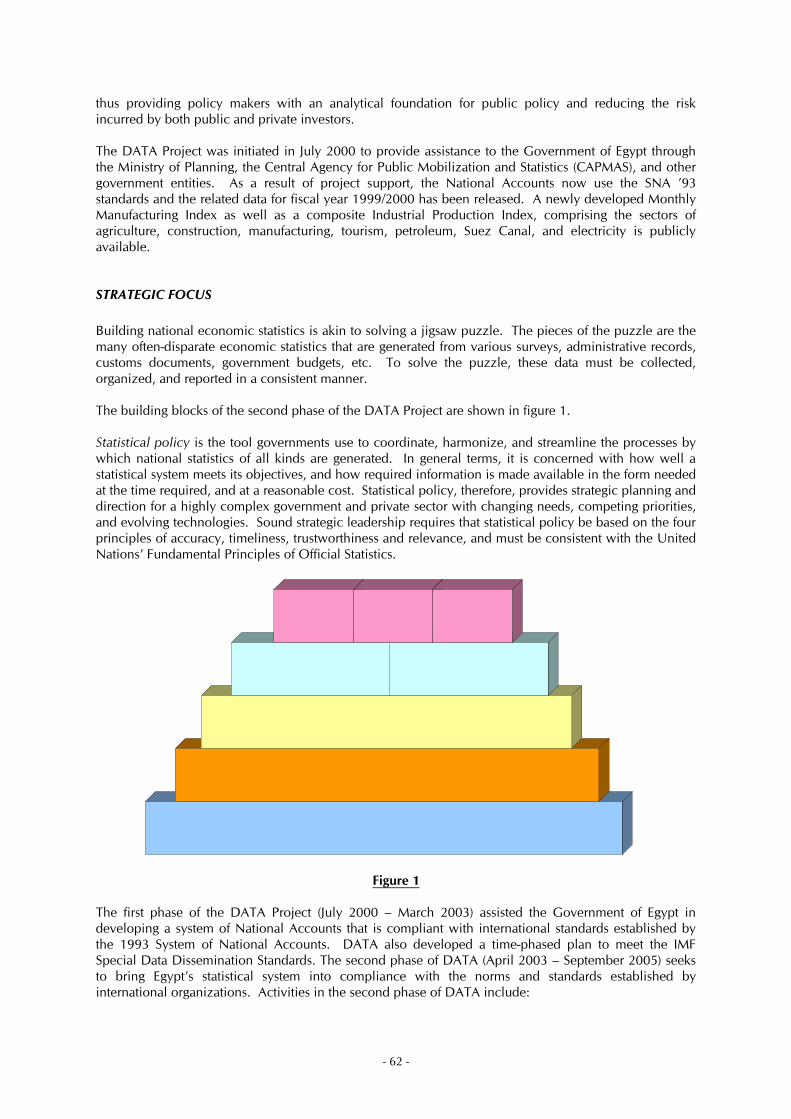
thus providing policy makers with an analytical foundation for public policy and reducing the risk incurred by both public and private investors. The DATA Project was initiated in July 2000 to provide assistance to the Government of Egypt through the Ministry of Planning, the Central Agency for Public Mobilization and Statistics (CAPMAS), and other government entities. As a result of project support, the National Accounts now use the SNA ’93 standards and the related data for fiscal year 1999/2000 has been released. A newly developed Monthly Manufacturing Index as well as a composite Industrial Production Index, comprising the sectors of agriculture, construction, manufacturing, tourism, petroleum, Suez Canal, and electricity is publicly available.
STRATEGIC FOCUS Building national economic statistics is akin to solving a jigsaw puzzle. The pieces of the puzzle are the many often-disparate economic statistics that are generated from various surveys, administrative records, customs documents, government budgets, etc. To solve the puzzle, these data must be collected, organized, and reported in a consistent manner. The building blocks of the second phase of the DATA Project are shown in figure 1. Statistical policy is the tool governments use to coordinate, harmonize, and streamline the processes by which national statistics of all kinds are generated. In general terms, it is concerned with how well a statistical system meets its objectives, and how required information is made available in the form needed at the time required, and at a reasonable cost. Statistical policy, therefore, provides strategic planning and direction for a highly complex government and private sector with changing needs, competing priorities, and evolving technologies. Sound strategic leadership requires that statistical policy be based on the four principles of accuracy, timeliness, trustworthiness and relevance, and must be consistent with the United Nations’ Fundamental Principles of Official Statistics.
Figure 1 The first phase of the DATA Project (July 2000 – March 2003) assisted the Government of Egypt in developing a system of National Accounts that is compliant with international standards established by the 1993 System of National Accounts. DATA also developed a time-phased plan to meet the IMF Special Data Dissemination Standards. The second phase of DATA (April 2003 – September 2005) seeks to bring Egypt’s statistical system into compliance with the norms and standards established by international organizations. Activities in the second phase of DATA include:
- 62 -
• Reaching out to all data users, and specifically to the private sector, to ensure that economic statistics respond to investors’ needs
• Implementing modern scientific procedures and methods for collecting statistics, including protecting the confidentiality of respondents
• Developing and disseminating economic indicators that enable decision makers to predict and analyze economic developments in key sectors of the economy
• Training government staff in the required skills to carry out their new tasks • Implementing effective information technology for government agencies to collect, tabulate,
and disseminate higher quality economic data • Strengthening the compilation of National Accounts statistics • Subscribing to the IMF Special Data Dissemination Standards for assurance regarding the
quality, timeliness, accuracy and relevance of economic data
The Government of Egypt has committed itself to expanding the availability and quality of information about economic trends and developments in the country. USAID has designed DATA to support Egypt’s reforms, and has highlighted the need for sound economic and financial information.
- 63 -