ENVIRONMENTAL STATEMENT IN FORM-V CLUSTER NO. – 11
36
ENVIRONMENTAL STATEMENT IN FORM-V (Under Rule-14, Environmental protection Rules, 1986) (2015-2016) FOR CLUSTER NO. – 11 (GROUP OF MINES) Kenda Area and Bankola Area Eastern Coalfields Limited Prepared at Regional Institute – I Central Mine Planning & Design Institute Ltd. (A Subsidiary of Coal India Ltd.) G. T. Road (West End) Asansol - 713 304 CMPDI ISO 9001:2008 Company
-
Upload
khangminh22 -
Category
Documents
-
view
0 -
download
0
Transcript of ENVIRONMENTAL STATEMENT IN FORM-V CLUSTER NO. – 11

ENVIRONMENTAL STATEMENT
IN
FORM-V (Under Rule-14, Environmental protection Rules, 1986)
(2015-2016)
FOR
CLUSTER NO. – 11 (GROUP OF MINES)
Kenda Area and Bankola Area
Eastern Coalfields Limited
Prepared at
Regional Institute – I
Central Mine Planning & Design Institute Ltd. (A Subsidiary of Coal India Ltd.)
G. T. Road (West End) Asansol - 713 304
CMPDI
ISO 9001:2008 Company
Environmental Statement (Form-V) for Cluster No. – 11 (Group of Mines) 2015-16
1
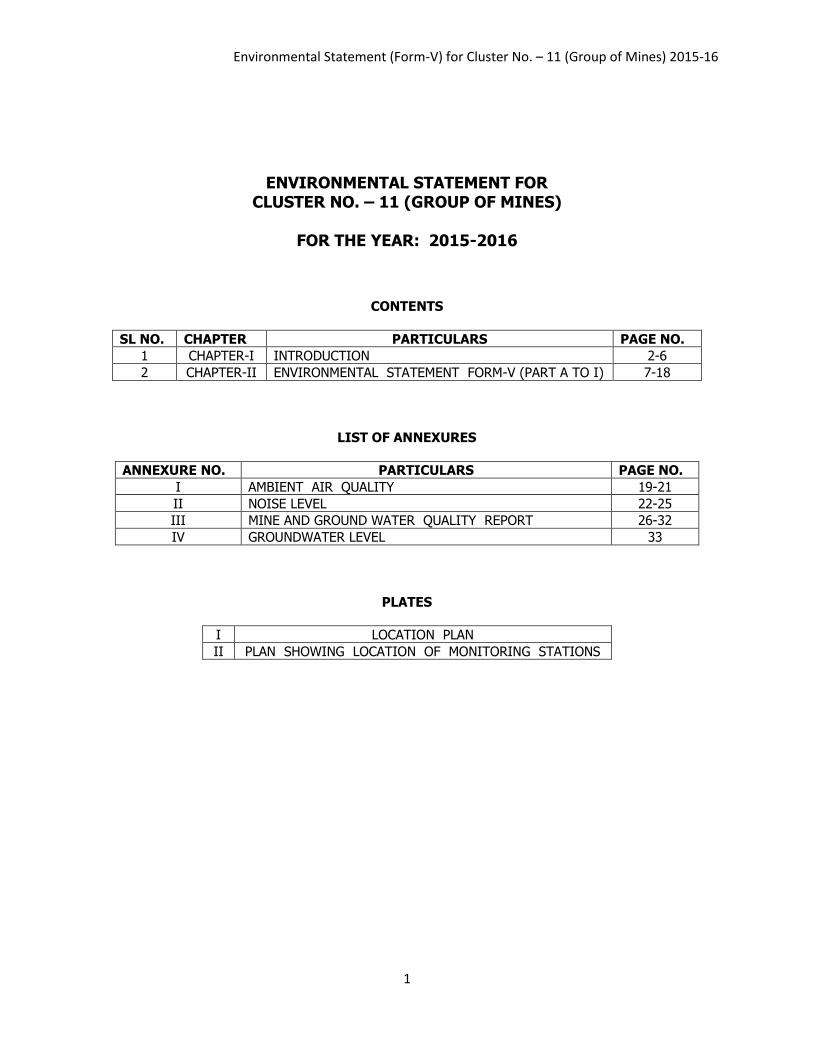
ENVIRONMENTAL STATEMENT FOR CLUSTER NO. – 11 (GROUP OF MINES)
FOR THE YEAR: 2015-2016
CONTENTS
SL NO. CHAPTER PARTICULARS PAGE NO.
1 CHAPTER-I INTRODUCTION 2-6
2 CHAPTER-II ENVIRONMENTAL STATEMENT FORM-V (PART A TO I) 7-18
LIST OF ANNEXURES
ANNEXURE NO. PARTICULARS PAGE NO.
I AMBIENT AIR QUALITY 19-21
II NOISE LEVEL 22-25
III MINE AND GROUND WATER QUALITY REPORT 26-32
IV GROUNDWATER LEVEL 33
PLATES
I LOCATION PLAN
II PLAN SHOWING LOCATION OF MONITORING STATIONS

Environmental Statement (Form-V) for Cluster No. – 11 (Group of Mines) 2015-16
2
CHAPTER – I
INTRODUCTION 1.1 GENESIS:
The Gazette Notification vide G.S.R No. 329 (E) dated 13th March, 1992 and subsequently renamed to ‘Environmental Statement’ vide Ministry of Environment & Forests (MOEF), Govt. of India gazette notification No. G.S.R No. 386 (E) Dtd.22nd April’93 reads as follows. “Every person carrying on an industry, operation or process requiring consent under section 25 of the Water Act, 1974 or under section 21 of the Air Act, 1981 or both or authorisation under the Hazardous Waste Rules, 1989 issued under the Environmental Protection Act, 1986 shall submit an Environmental Audit Report for the year ending 31st March in Form V to the concerned State Pollution Control Board on or before the 30th day of September every year.” In compliance with the above, the work of Environmental Statement for Cluster No. 11 was entrusted to CMPDI by GM (Environment), Eastern Coalfields Limited.
1.2 PROJECT DESCRIPTION:
Overview of Cluster No. 11: The cluster consists of 11 (eleven) underground mines, 3 (three) of which already have EC.
5 (five) opencast patches/mines have been identified within their leaseholds. The mines are administratively under Kenda and Bankola Areas of ECL. The mines of Cluster-11 are located in the east central part of Raniganj Coalfields and north of the Damodar River in the Burdwan District of West Bengal and are having lease boundaries adjacent to one another. The Cluster is located within Latitudes 230 38’ N & 230 41’ N and Longitudes 860 46’ E & 860 51’ E lying 100m to 140m above MSL. The cluster was awarded EC vide letter no. J-11015/245/2011-IA-II.(M) dated 21st July, 2015 with following cluster mine details:
S. No
Name of Mine Mine UG/OC ML Area (Ha)
Normative/ Peak Capacity (MTY)
Life (Years)
1 Krishnanagar 1 UG 772 0.24 0.30 >25
2 Haripur Group of Mines UG+OC
853
1.99 2.27 >25
A Haripur 2 UG 0.60 0.78 >25
B Chora Block Incline 3 UG
0.99 0.99 >25 C Chora 7,9 & 10 Pit
4
UG
D Bonbahal OC Patch (25 Ha) 5 OC 0.40 0.50 3
E Shankarpur / CL Jambad OC Patch/ mine (52 Ha)
6 OC Exhausted and being
backfilled
3 New Kenda Group of Mines 7 UG+OC
742
3.71 4.79 >25
A New Kenda UG 0.11 0.14 >25
B W Kenda OC Patch / Mine ( 49 Ha) OC 0.60 0.75 2
C New Kenda OC Mine (240 Ha) OC 3.00 3.90 8
4 Bahula Group of Mines 8
676
0.42 0.55 >25
A Lower Kenda UG 0.13 0.17 >25
B Bahula UG 0.24 0.31 >25
C CL Jambad UG 0.05 0.07 >25
Environmental Statement (Form-V) for Cluster No. – 11 (Group of Mines) 2015-16
3
S. No
Name of Mine Mine UG/OC ML Area (Ha)
Normative/ Peak Capacity (MTY)
Life (Years)
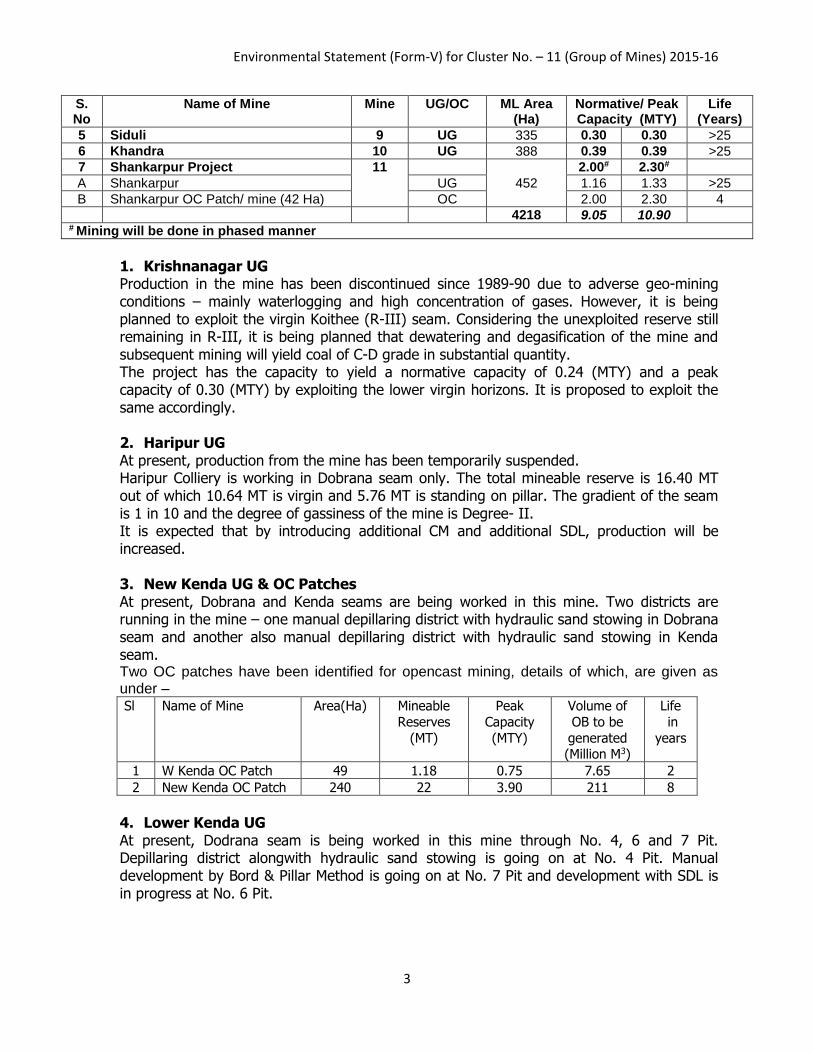
5 Siduli 9 UG 335 0.30 0.30 >25
6 Khandra 10 UG 388 0.39 0.39 >25
7 Shankarpur Project 11
452
2.00# 2.30#
A Shankarpur UG 1.16 1.33 >25
B Shankarpur OC Patch/ mine (42 Ha) OC 2.00 2.30 4
4218 9.05 10.90 # Mining will be done in phased manner
1. Krishnanagar UG Production in the mine has been discontinued since 1989-90 due to adverse geo-mining conditions – mainly waterlogging and high concentration of gases. However, it is being planned to exploit the virgin Koithee (R-III) seam. Considering the unexploited reserve still remaining in R-III, it is being planned that dewatering and degasification of the mine and subsequent mining will yield coal of C-D grade in substantial quantity. The project has the capacity to yield a normative capacity of 0.24 (MTY) and a peak capacity of 0.30 (MTY) by exploiting the lower virgin horizons. It is proposed to exploit the same accordingly. 2. Haripur UG At present, production from the mine has been temporarily suspended. Haripur Colliery is working in Dobrana seam only. The total mineable reserve is 16.40 MT out of which 10.64 MT is virgin and 5.76 MT is standing on pillar. The gradient of the seam is 1 in 10 and the degree of gassiness of the mine is Degree- II. It is expected that by introducing additional CM and additional SDL, production will be increased. 3. New Kenda UG & OC Patches At present, Dobrana and Kenda seams are being worked in this mine. Two districts are running in the mine – one manual depillaring district with hydraulic sand stowing in Dobrana seam and another also manual depillaring district with hydraulic sand stowing in Kenda seam.
Two OC patches have been identified for opencast mining, details of which, are given as under – Sl
N
Name of Mine Area(Ha) Mineable
Reserves
(MT)
Peak
Capacity
(MTY)
Volume of
OB to be
generated (Million M3)
Life
in
years
1 W Kenda OC Patch 49 1.18 0.75 7.65 2
2 New Kenda OC Patch 240 22 3.90 211 8
4. Lower Kenda UG At present, Dodrana seam is being worked in this mine through No. 4, 6 and 7 Pit. Depillaring district alongwith hydraulic sand stowing is going on at No. 4 Pit. Manual development by Bord & Pillar Method is going on at No. 7 Pit and development with SDL is in progress at No. 6 Pit.

Environmental Statement (Form-V) for Cluster No. – 11 (Group of Mines) 2015-16
4
5. Chora 7, 9 & 10 pits UG At present, Chora seam is being worked in this mine. Two districts are running in the mine – one development district (S2, top section) with SDL over standing bottom section and another depillaring district (S3, bottom section) with sand stowing in the bottom section working with LHD. 6. Chora Block Incline UG & OC Patches At present, Chora seam is being worked in this mine. The seam is already developed by Bord & Pillar Method upto a height of 3 m along floor almost upto the mine boundary. The pillars in this section are going to be extracted upto a height of 3.60 m along floor by splitting and sand stowing. The remaining top section will be developed upto 3 m over sand and will be splitted upto a height of 3.60 m over sand and will be filled up with sand stowing. At present, two districts are running in the mine – one development district with two SDLs over sand and another manual depillaring district with sand stowing. Water spraying is going on in both the district. Two OC patches have been identified for opencast mining, details of which, are given as under –
Sl
No
Name of Mine Area
(Ha)
Mineable
Reserves (MT)
Peak capacity
(MTY)
Volume of OB to
be generated (Million M3)
Life in
years
1 Bonbahal OC Patch (25ha) 25 1.1 0.50 6.27 3
2 Shankarpur/CL Jambad OC Patch Exhausted and being backfilled
7. Bahula UG At present, Kenda seam and Bonbahal seam are being worked in this mine. In Bonbahal seam at RJ Unit one SDL district through No. 1 Pit is being depillared by splitting as final operation method with hydraulic sand stowing. In Kenda seam at PJ Unit one manual district through No. 6 Pit is being depillared by splitting as final operation method with hydraulic sand stowing. In Kenda seam at NJ Unit two SDL districts through No. 3 Pit is being depillared by splitting in bottom section and slicing in top section with hydraulic sand stowing. 8. C L Jambad UG At present, Jambad seam is being worked in this mine. The seam is already developed by Bord & Pillar Method and now one manual district is being depillared by splitting with hydraulic sand stowing. 9. Siduli UG The mine block has been taken within the faults F3-F3, F4-F4, F10-F10 and Chora block on the North-Western side. The existing constituent within the above block are Siduli colliery comprising J.K.unit and Siduli unit, Nags Kajora unit of Khandra mine. R-IX seam has been worked in Nags Kajora unit where the seam has incropped and has been abandoned. R-VIII seam has been extensively worked in the J.K.unit (R-VIII seam exhausted) and Siduli unit of Siduli colliery and Nags Kajora unit of Khandra colliery (R-VIII seam near exhaustion). R-VIII seam is exhausted in Pure Seetalpur unit, Khas jambad unit and Seetalpur unit.

Environmental Statement (Form-V) for Cluster No. – 11 (Group of Mines) 2015-16
5
10. Khandra UG
It is proposed to drive 4 parallel headings with necessary inter connections to act as main
trunk roadways of average size of 4.50m (width) x 2.70 m (height) mainly supported by
roof bolts. Holes in the roofs will be done by ordinary coal-drills. The galleries will be
supported, wherever necessary, by a combination of steel-supports and rope-dowels.
Solid blasting will be done at faces and blasted coal will be loaded on to coal tubs by SDLs,
and then, coal will be transported to pit bottom by series of rope haulages.
Upper Kajora seam (R-IX) at Nag’s Kajora Colliery (NKJ) has been exhausted. To deploy
surplus manpower and utilize existing infrastructure facilities available at NKJ Colliery, it is
essential to exploit virgin RVII seam to obtain replacement production for R-IX Seam. It is
also envisaged to increase production in R-VIII Seam by adding a district with a view to
utilizing full capacity of winding system to meet the demand of superior grade coal.
11. Shankarpur UG & OC
Shankarpur Colliery comprises of two units- Shankarpur unit (5 & 6 pits) and Sheetalpur
Unit (3 & 4 pits). All the pits are sunk upto R-VIII seam. Two inclines have also been driven
upto R-VII seam. Reserve of R-VIII seam is exhausted.
3 & 4 Pit Unit- Production is envisaged from one manual depillaring with stowing district in
R-VII seam.
Incline unit- Production is envisaged from one SDL development district in R-VII seam.
Inclines 1 & 2 are proposed to be extended to access R-VIIA seam.
Pit No. 5 will be deepened by 95m upto R-VIIA seam to act as the main return airway of the
mine.
Production is envisaged from R-VII seam by working two B & P development districts with
SDLs and one manual development district.
R-VIIA seam will be developed after development of R-VII seam.
A OC patch measuring 42 Ha has been identified for opencast mining, details of which, are given as under –
Sl
No
Name of Mine Area
(Ha)
Mineable
Reserves (MT)
Volume of OB to
be generated (Million M3)
Life in
years
1 Shankarpur OC
Patch/mine 42 7.85 34 4
1.3 ENVIRONMENTAL SCENARIO:
The Environmental monitoring was carried out fortnightly as per guidelines of Ministry of Environment and Forests (MOEF) by CMPDI, RI-I starting from 2nd fortnight of May, 2015. Accordingly, ambient air quality was monitored at 8 locations (2 permanent locations, 3 pre-monsoon and 3 post-monsoon locations). Effluent quality was monitored at 11 locations. Noise level was monitored at 9 locations. Groundwater level is measured at 6 locations in each quarter. Location of the monitoring stations of air, noise & water are shown in Plate- II.

Environmental Statement (Form-V) for Cluster No. – 11 (Group of Mines) 2015-16
6
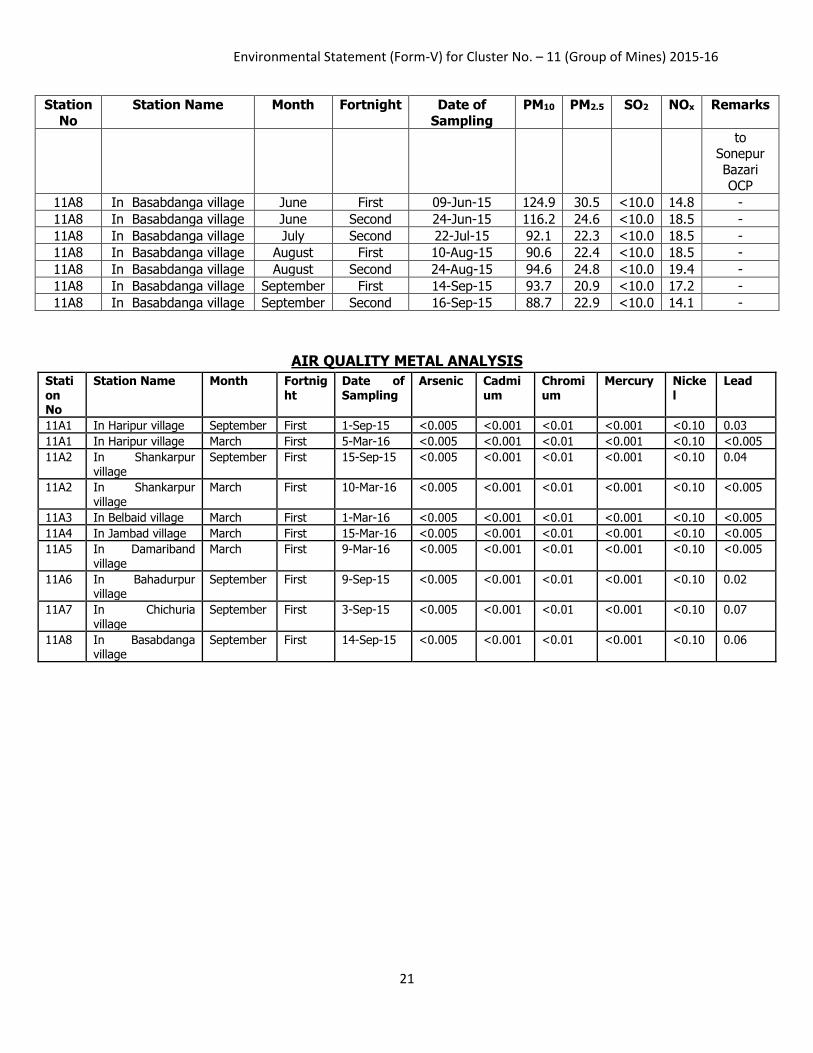
The environmental monitoring results for 21 fortnights ending March’2016 are appended as Annexure- I, II, III and IV. The environmental monitoring results for the year 2015-16 can be concluded as given below:
AMBIENT AIR QUALITY The PM10 concentration was found in the range of 62.4 to 194 µg/m3. It has exceeded limit on 19 occasions as per NAAQS, 2009 while the concentration values are within the limit as per GSR 742 (E) dated 25.09.2000. The PM2.5 concentration was found in the range of 16.5 to 81.8 µg/m3. It has exceeded limits on 10 occasions as per NAAQS, 2009.The SO2 concentration remained below 10.0 µg/m3 and NOX concentration was in the range of 9.2 to 23.0 µg/m3. WATER QUALITY
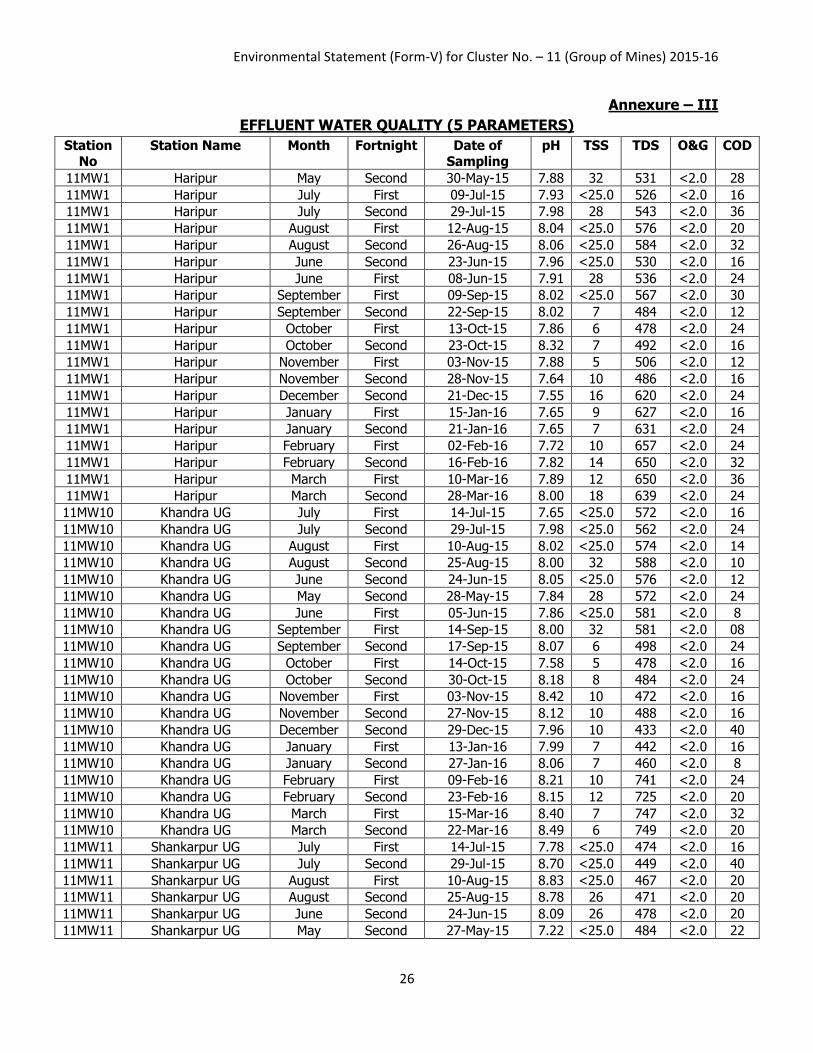
The analysis results reveal that most of the parameters of effluent water are below permissible limits prescribed by Ministry of Environment & Forests (MOEF) as General Standards for Class-‘A’ effluent (Effluent discharged into inland surface water) and below permissible limits prescribed in IS:10500-2012 standards for groundwater quality.
NOISE LEVEL The noise level was found in the range of 54.0 to 71.2 dB (A). The noise level recorded
is below permissible limit prescribed by Ministry of Environment and Forest (MOEF).
ENVIRONMENTAL STANDARDS:
(I) Environmental standard for Raniganj Coalfield vide MOEF, Govt. of India, Gazette
Notification No.GSR 742 (E) dated 25.09.2000 for 24 hourly samples at 500 meters from
dust generating point:
Station
Category
Pollutant Concentration (µg/m3)
TSPM PM10 SO2 NOx
Industrial 700.0 300.0 120.0 120.0
Residential 200.0 100.0 80.0 80.0
Station
Category
Limits for noise (Leq) dB(A)
Day Time (6am-10pm)
Night Time (10pm-6am)
Industrial 75.0 70.0
Residential 55.0 45.0
(II) National Ambient Air Quality Standards (NAAQS) for residential, industrial and rural
areas for 24 hourly samples:
Pollutant PM10 PM2.5 SO2 NOX
Concentration (µg/m3) 100.0 60.0 80.0 80.0
Limits for noise (Leq) dB(A)
Day Time (6am-9pm) Night Time (9pm-6am)
55.0 45.0

Environmental Statement (Form-V) for Cluster No. – 11 (Group of Mines) 2015-16
7
CHAPTER - II ENVIRONMENTAL STATEMENT FORM– V
Environmental statement for the financial year ending March, 2016
PART – A
SL. NO. HEADING PARTICULARS
(I) NAME AND ADDRESS OF THE PROJECT
i Krishnanagar UG Agent, Haripur Colliery, Post-Haripur, Burdwan, W.B.
ii Haripur UG
iii New Kenda UG & OC Patches Agent, New Kenda Colliery, Post-Kenda, Burdwan, W.B.
iv Lower Kenda UG Agent, Lower Kenda Colliery, Post-Bahula, Burdwan, W.B.
v Chora 7, 9 & 10 pits UG Agent, Chora OCP, Post-Bahula, Burdwan, W.B.
vi Chora Block Incline UG & OC Patches
vii Bahula UG Agent, Lower Kenda Colliery, Post-Bahula, Burdwan, W.B.
viii C L Jambad UG Agent, Siduli UG, Post-Bahula, Burdwan, W.B.
ix Siduli UG
x Khandra UG Agent, Khandra Colliery, Post-Ukhra, Burdwan, W.B.
xi Shankarpur UG & OC Office of the Agent, Shankarpur Colliery, Post-Ukhra,
Burdwan, W.B.
(II) INDUSTRY CATEGORY All mines in the cluster falls in red category
(III) PRODUCTION CAPACITY 10.90 MTY
(IV) YEAR OF ESTABLISHMENT All the mines within the cluster are taken over mines from pre-
nationalisation period.
(V) DATE OF THE LAST
ENVIRONMENTAL STATEMENT
SUBMITTED
The Environment Statement is being submitted for the first
time for the financial year 2015 – 16 after the grant of EC on
21st July, 2015.
PART – B
WATER AND RAW MATERIAL CONSUMPTION (I) WATER CONSUMPTION (Cu.m/day)
WATER CONSUMPTION (m3/day)
1. Krishnanagar UG Sl.
No.
Particulars 2014-15 2015-16
A. MINING
Nil Nil
i Dust suppression
ii Fire fighting
iii Others (service building etc.)
B. COOLING
(in radiators of trucks/HEMM)
C. DOMESTIC
i Colony
TOTAL

Environmental Statement (Form-V) for Cluster No. – 11 (Group of Mines) 2015-16
8
2. Haripur UG Sl. No.
Particulars 2014-15 2015-16
A. MINING
Nil Nil
i Dust suppression
ii Fire fighting
iii Others (service building etc.)
B. COOLING (in radiators of trucks/HEMM)
C. DOMESTIC
i Colony
TOTAL
3. New Kenda UG & OC Patches
Sl. No.
Particulars 2014-15 2015-16
A. MINING
i Dust suppression*
ii Fire fighting - -
iii Others (service building etc.) 20 20
B. COOLING
(in radiators of trucks/HEMM)
0 0
C. DOMESTIC
i Colony 1740 1740
TOTAL 1760 1760
4. Lower Kenda UG and Bahula UG
Sl.
No.
Particulars 2014-15 2015-16
A. MINING
i Dust suppression*
ii Fire fighting - -
iii Others (service building etc.) 15 15
B. COOLING
(in radiators of trucks/HEMM)
0 0
C. DOMESTIC
i Colony 1071 1071
TOTAL 1086 1086
5. Chora 7, 9 & 10 pits UG
Sl.
No.
Particulars 2014-15 2015-16
A. MINING
i Dust suppression*
ii Fire fighting - -
iii Others (service building etc.) 12 12
B. COOLING
(in radiators of trucks/HEMM)
0 0
C. DOMESTIC
i Colony 1008 1008
TOTAL 1020 1020

Environmental Statement (Form-V) for Cluster No. – 11 (Group of Mines) 2015-16
9
6. Chora Block Incline UG & Bonbahal OC Patch Sl. No.
Particulars 2014-15 2015-16
A. MINING
i Dust suppression*
ii Fire fighting - -
iii Others (service building etc.) 15 15
B. COOLING (in radiators of trucks/HEMM)
0 0
C. DOMESTIC
i Colony 2430 2430
TOTAL 2445 2445
7. C L Jambad UG and Siduli UG
Sl. No.
Particulars 2014-15 2015-16
A. MINING
i Dust suppression*
ii Fire fighting - -
iii Others (service building etc.) 20 20
B. COOLING
(in radiators of trucks/HEMM)
0 0
C. DOMESTIC
i Colony 1371 1371
TOTAL 1391 1391
*Note: 3 nos. of mobile sprinklers having capacity 12 KL cater to the need of dust
suppression in whole Kenda Area.
8. Khandra UG Sl. No.
Particulars 2014-15 2015-16
A. MINING
i Dust suppression 381 400
ii Fire fighting 0 0
iii Others (service building etc.) 0 3
B. COOLING
(in radiators of trucks/HEMM)
0 0
C. DOMESTIC
i Colony 821 860
TOTAL 1202 1263
9. Shankarpur UG & OC
Sl.
No.
Particulars 2014-15 2015-16
A. MINING
i Dust suppression 144 147
ii Fire fighting 0 0
iii Others (service building etc.) 308 314
B. COOLING
(in radiators of trucks/HEMM)
0 0
C. DOMESTIC
i Colony 302 307
TOTAL 754 768
Environmental Statement (Form-V) for Cluster No. – 11 (Group of Mines) 2015-16
10
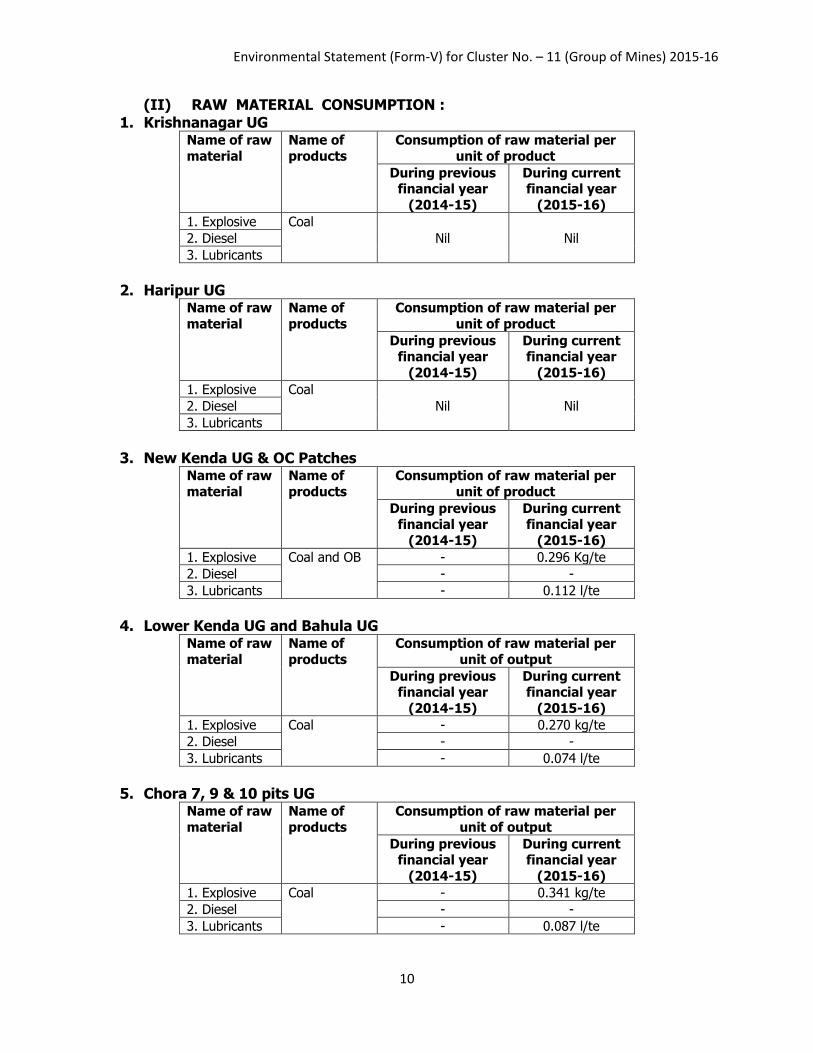
(II) RAW MATERIAL CONSUMPTION : 1. Krishnanagar UG
Name of raw
material
Name of
products
Consumption of raw material per
unit of product
During previous financial year
(2014-15)
During current financial year
(2015-16)
1. Explosive Coal
Nil Nil 2. Diesel
3. Lubricants
2. Haripur UG
Name of raw
material
Name of
products
Consumption of raw material per
unit of product
During previous financial year
(2014-15)
During current financial year
(2015-16)
1. Explosive Coal
Nil Nil 2. Diesel
3. Lubricants
3. New Kenda UG & OC Patches
Name of raw
material
Name of
products
Consumption of raw material per
unit of product
During previous financial year
(2014-15)
During current financial year
(2015-16)
1. Explosive Coal and OB - 0.296 Kg/te
2. Diesel - -
3. Lubricants - 0.112 l/te
4. Lower Kenda UG and Bahula UG
Name of raw
material
Name of
products
Consumption of raw material per
unit of output
During previous financial year
(2014-15)
During current financial year
(2015-16)
1. Explosive Coal - 0.270 kg/te
2. Diesel - -
3. Lubricants - 0.074 l/te
5. Chora 7, 9 & 10 pits UG
Name of raw
material
Name of
products
Consumption of raw material per
unit of output
During previous financial year
(2014-15)
During current financial year
(2015-16)
1. Explosive Coal - 0.341 kg/te
2. Diesel - -
3. Lubricants - 0.087 l/te

Environmental Statement (Form-V) for Cluster No. – 11 (Group of Mines) 2015-16
11
6. Chora Block Incline UG &Bonbahal OC Patch Name of raw material
Name of products
Consumption of raw material per unit of output
During previous
financial year (2014-15)
During current
financial year (2015-16)
1. Explosive Coal and OB - 0.701kg/te
2. Diesel - 0.240 l/te
3. Lubricants - 0.116 l/te
7. C L Jambad UG and Siduli UG
Name of raw material
Name of products
Consumption of raw material per unit of output
During previous
financial year (2014-15)
During current
financial year (2015-16)
1. Explosive Coal - 0.436kg/te
2. Diesel - -
3. Lubricants - 0.140 l/te
8. Khandra UG
Name of raw material
Name of products
Consumption of raw material per unit of output
During previous
financial year (2014-15)
During current
financial year (2015-16)
1. Explosive Coal 0.400kg/te 0.426kg/te
2. Diesel 0.046 l/te 0.044 l/te
3. Lubricants* 80 litres 60 litres
*Consumption figure for the whole year
9. Shankarpur UG & OC
Name of raw
material
Name of
products
Consumption of raw material per
unit of output
During previous financial year
(2014-15)
During current financial year
(2015-16)
1. Explosive Coal 0.675kg/te 0.616kg/te
2. Diesel 0.088 l/te 0.096 l/te
3. Lubricants 0.094 litres 0.114 litres

Environmental Statement (Form-V) for Cluster No. – 11 (Group of Mines) 2015-16
12
PART – C POLLUTION GENERATED
Pollution Quantity of pollution generated Percentage variation from prescribed standards
with reasons
WATER Mine water discharged Analysis results are given in Annexure-III.
The analysis results reveal that most of the parameters are below permissible limits prescribed by MOEF as
General Standards for class ‘A’ effluent (Effluent
discharged into inland surface water).
AIR The main air pollutant are PM10 and PM2.5
The air quality results are appended as Annexure-I.
Ambient air quality results show that the values of SO2 and
NOx are well within the prescribed standards. The values of PM10 have exceeded the limit on 19 occasions and the
values of PM2.5 have exceeded the limit on 10 occasions as
per NAAQS, 2009.
PART – D HAZARDOUS WASTE
(As specified under Hazardous Waste (Management and Handling) Rules, 1989)
1. Krishnanagar UG Hazardous waste Total quantity
During Previous
financial year
(2014-15)
During current
financial year
(2015-16)
Disposal
method
A) From process
i)Used oil
ii)Lead-Acid Batteries a. Automobile batteries
b. Cap-lamp batteries iii) Used Cotton waste
iv) Metal Scrap
Nil Nil
2. Haripur UG
Hazardous waste Total quantity
During Previous financial year
(2014-15)
During current financial year
(2015-16)
Disposal method
A) From process i)Used oil
ii)Lead-Acid Batteries
a. Automobile batteries b. Cap-lamp batteries
iii) Used Cotton waste iv) Metal Scrap
Nil Nil

Environmental Statement (Form-V) for Cluster No. – 11 (Group of Mines) 2015-16
13
3. New Kenda UG & OC Patches Hazardous waste Total quantity
During Previous financial year
(2014-15)
During current financial year
(2015-16)
Disposal method
A) From process
i)Used oil
ii)Lead-Acid Batteries a. Automobile batteries
b. Cap-lamp batteries iii) Used Cotton waste
iv) Metal Scrap
-
-
Nil
Nil -
-
4. Lower Kenda UG and Bahula UG
Hazardous waste Total quantity
During Previous
financial year (2014-15)
During current
financial year (2015-16)
Disposal
method
A) From process i)Used oil
ii)Lead-Acid Batteries
a. Automobile batteries b. Cap-lamp batteries
iii) Used Cotton waste iv) Metal Scrap
-
-
Nil Nos Nil Nos
Nil Kg Nil Kg
5. Chora 7, 9 & 10 pits UG
Hazardous waste Total quantity
During Previous
financial year
(2014-15)
During current
financial year
(2015-16)
Disposal
method
A) From process
i)Used oil ii)Lead-Acid Batteries
a. Automobile batteries
b. Cap-lamp batteries iii) Used Cotton waste
iv) Metal Scrap
-
-
7Nos
425Nos Nil Kg
Nil Kg
6. Chora Block Incline UG & Bonbahal OC Patch
Hazardous waste Total quantity
During Previous financial year
(2014-15)
During current financial year
(2015-16)
Disposal method
A) From process i)Used oil
ii)Lead-Acid Batteries a. Automobile batteries
b. Cap-lamp batteries
iii) Used Cotton waste iv) Metal Scrap
-
-
NilNos
325 Nos
Nil Kg Nil Kg

Environmental Statement (Form-V) for Cluster No. – 11 (Group of Mines) 2015-16
14
7. C L Jambad UG and Siduli UG Hazardous waste Total quantity
During Previous financial year
(2014-15)
During current financial year
(2015-16)
Disposal method
A) From process
i)Used oil
ii)Lead-Acid Batteries a. Automobile batteries
b. Cap-lamp batteries iii) Used Cotton waste
iv) Metal Scrap
-
-
1Nos
573Nos Nil Kg
Nil Kg
8. Khandra UG
Hazardous waste Total quantity
During Previous
financial year (2014-15)
During current
financial year (2015-16)
Disposal
method
A) From process i)Used oil
ii)Lead-Acid Batteries
a. Automobile batteries b. Cap-lamp batteries
iii) Used Cotton waste iv) Metal Scrap
4830 litres
Nil Nos 275 Nos
83Kg NilKg
5540 litres
Nil Nos 270 Nos
85Kg NilKg
9. Shankarpur UG & OC
Hazardous waste Total quantity
During Previous
financial year
(2014-15)
During current
financial year
(2015-16)
Disposal
method
A) From process
i)Used oil ii)Lead-Acid Batteries
a. Automobile batteries
b. Cap-lamp batteries iii) Used Cotton waste
iv) Metal Scrap
4602litres
Nil Nos
245 Nos 3Kg
NilKg
6280litres
2Nos
300Nos 10Kg
NilKg
Approximate values may be given where actual values are not available. Note: a) The detail of used oil is to be given to concerned Pollution Control Board in Form-13 as per time mentioned in HW (M & H), Amendment Rules, 2003. b) The detail of disposal of Lead Acid batteries is to be given to concerned State Pollution Control Board in Form-VIII as per time mentioned in Batteries (M&H) Rules, 2001.
Environmental Statement (Form-V) for Cluster No. – 11 (Group of Mines) 2015-16
15
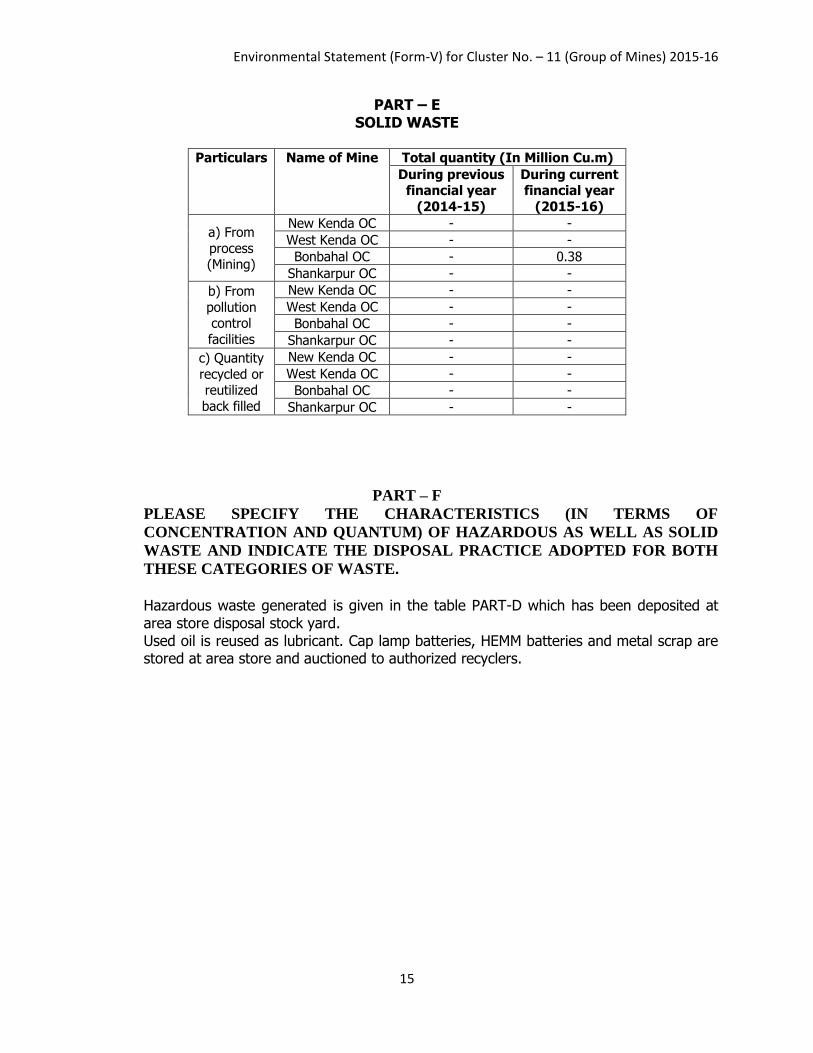
PART – E SOLID WASTE
Particulars Name of Mine Total quantity (In Million Cu.m)
During previous financial year
(2014-15)
During current financial year
(2015-16)
a) From
process (Mining)
New Kenda OC - -
West Kenda OC - -
Bonbahal OC - 0.38
Shankarpur OC - -
b) From
pollution control
facilities
New Kenda OC - -
West Kenda OC - -
Bonbahal OC - -
Shankarpur OC - -
c) Quantity
recycled or reutilized
back filled
New Kenda OC - -
West Kenda OC - -
Bonbahal OC - -
Shankarpur OC - -
PART – F
PLEASE SPECIFY THE CHARACTERISTICS (IN TERMS OF
CONCENTRATION AND QUANTUM) OF HAZARDOUS AS WELL AS SOLID
WASTE AND INDICATE THE DISPOSAL PRACTICE ADOPTED FOR BOTH
THESE CATEGORIES OF WASTE.
Hazardous waste generated is given in the table PART-D which has been deposited at area store disposal stock yard. Used oil is reused as lubricant. Cap lamp batteries, HEMM batteries and metal scrap are stored at area store and auctioned to authorized recyclers.

Environmental Statement (Form-V) for Cluster No. – 11 (Group of Mines) 2015-16
16
PART – G IMPACT OF POLLUTION CONTROL MEASURES ON CONSERVATION OF NATURAL RESOURCES AND CONSEQUENTLY ON COST OF PRODUCTION. In order to carry out mining in an eco-friendly manner following pollution control measures have been implemented.
1. AIR POLLUTION CONTROL MEASURES: a) Total plantation carried out since start of the project till date with area planted, year of
plantation, species planted and survival rate. During 2014-15 Name of Mine Area
planted
No of
saplings
planted
Species selected Survival
rate
Cost*
Krishnanagar UG - - - - -
Haripur UG - - - - -
New Kenda UG & OC Patches
- - - - -
Lower Kenda UG and
Bahula UG
- - - - -
Chora 7, 9 & 10 pits UG - - - - -
Chora Block Incline UG
&Bonbahal OC Patch
- - - - -
C L Jambad UG and Siduli UG
- - - - -
Khandra UG - - - - -
Shankarpur UG & OC - - - - -
*Please provide cost if available
During 2015-16 Name of Mine Area planted
(Ha)
No of saplings
planted
Species selected Survival
rate
Cost* (INR)
Krishnanagar UG - - - - -
Haripur UG - - - - -
New Kenda UG & OC Patches
- - - - -
Lower Kenda UG and
Bahula UG
5 12500 Kadam, peepal,
jamun, amla etc.
85 % -
Chora 7, 9 & 10 pits UG - - - - -
Chora Block Incline UG
&Bonbahal OC Patch
- - - - -
C L Jambad UG and Siduli UG
- - - - -
Khandra UG - - - - -
Shankarpur UG & OC 10 25000 Local species 50 % 20.00 Lakh
*Please provide cost if available b) 3 nos. of water tankers of 12 KL capacity are used for dust suppression in and around
coal transport route in Kenda Area. Apart from this, fixed water sprinklers are installed at Bahula Railway Siding.
c) Wet coal transport, road maintenance is being done. d) Trucks carrying coal to the railway sidings are covered with tarpaulin to avoid spillage.
Environmental Statement (Form-V) for Cluster No. – 11 (Group of Mines) 2015-16
17
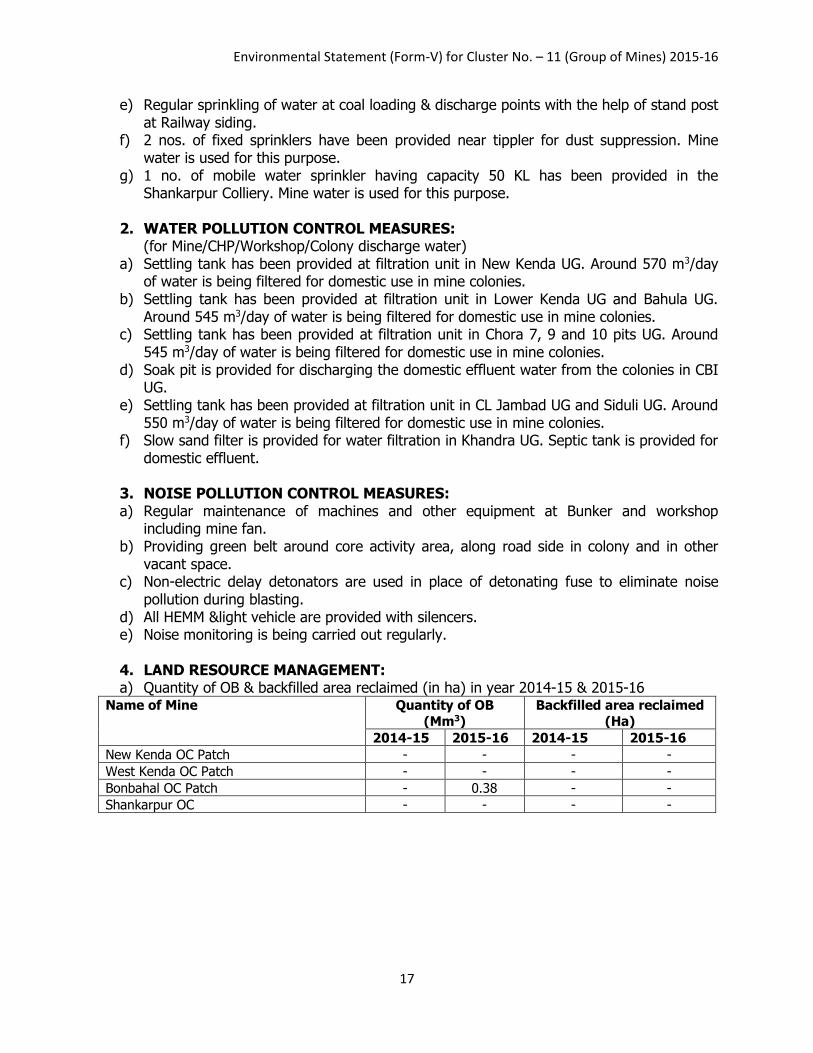
e) Regular sprinkling of water at coal loading & discharge points with the help of stand post at Railway siding.
f) 2 nos. of fixed sprinklers have been provided near tippler for dust suppression. Mine water is used for this purpose.
g) 1 no. of mobile water sprinkler having capacity 50 KL has been provided in the Shankarpur Colliery. Mine water is used for this purpose.
2. WATER POLLUTION CONTROL MEASURES:
(for Mine/CHP/Workshop/Colony discharge water) a) Settling tank has been provided at filtration unit in New Kenda UG. Around 570 m3/day
of water is being filtered for domestic use in mine colonies. b) Settling tank has been provided at filtration unit in Lower Kenda UG and Bahula UG.
Around 545 m3/day of water is being filtered for domestic use in mine colonies. c) Settling tank has been provided at filtration unit in Chora 7, 9 and 10 pits UG. Around
545 m3/day of water is being filtered for domestic use in mine colonies. d) Soak pit is provided for discharging the domestic effluent water from the colonies in CBI
UG. e) Settling tank has been provided at filtration unit in CL Jambad UG and Siduli UG. Around
550 m3/day of water is being filtered for domestic use in mine colonies. f) Slow sand filter is provided for water filtration in Khandra UG. Septic tank is provided for
domestic effluent.
3. NOISE POLLUTION CONTROL MEASURES: a) Regular maintenance of machines and other equipment at Bunker and workshop
including mine fan. b) Providing green belt around core activity area, along road side in colony and in other
vacant space. c) Non-electric delay detonators are used in place of detonating fuse to eliminate noise
pollution during blasting. d) All HEMM &light vehicle are provided with silencers. e) Noise monitoring is being carried out regularly.
4. LAND RESOURCE MANAGEMENT: a) Quantity of OB & backfilled area reclaimed (in ha) in year 2014-15 & 2015-16
Name of Mine Quantity of OB
(Mm3)
Backfilled area reclaimed
(Ha)
2014-15 2015-16 2014-15 2015-16
New Kenda OC Patch - - - -
West Kenda OC Patch - - - -
Bonbahal OC Patch - 0.38 - -
Shankarpur OC - - - -

Environmental Statement (Form-V) for Cluster No. – 11 (Group of Mines) 2015-16
18
PART – H ADDITIONAL INVESTMENT PROPOSAL FOR ENVIRONMENTAL PROTECTION INCLUDING ABATEMENT OF POLLUTION.
a) Proposed plantation to be carried out in next five years (Total no of saplings, Area to be planted, estimated cost) i. Krishnanagar UG
Plantation will be carried out as per proposed plan in future. ii. Haripur UG
Plantation will be carried out as per proposed plan in future. iii. New Kenda UG & OC Patches
Plantation will be carried out as per proposed plan in future over subsided lands and OB dump.
iv. Lower Kenda UG and Bahula UG Plantation will be carried out as per proposed plan in future over subsided lands.
v. Chora 7, 9 & 10 pits UG Plantation will be carried out as per proposed plan in future over subsided lands.
vi. Chora Block Incline UG &Bonbahal OC Patch Plantation will be carried out as per proposed plan in future over subsided lands and OB dump.
vii. C L Jambad UG and Siduli UG Plantation will be carried out as per proposed plan in future over subsided lands.
viii. Khandra UG Plantation will be carried out as per proposed plan in future over subsided lands.
ix. Shankarpur UG & OC For the year 2016 – 17, an area of 18.40 Ha has been earmarked for plantation over subsided lands and OB dump.
b) The Environmental monitoring of the cluster will be continued fortnightly as per the guidelines of Ministry of Environment, Forests & Climate Change (MoEF& CC).
PART – I ANY OTHER PARTICULAR IN RESPECTOF ENVIRONMENTAL PROTECTION AND ABATMENT OF POLLUTION. The Environmental Monitoring is carried out fortnightly for the project by CMPDI, RI-I as per the guideline of Ministry of Environment and Forest (MOEF) and based on the result thereof; colliery takes necessary action if needed.

Environmental Statement (Form-V) for Cluster No. – 11 (Group of Mines) 2015-16
19
Annexure – I
AMBIENT AIR QUALITY
Station No
Station Name Month Fortnight Date of Sampling
PM10 PM2.5 SO2 NOx Remarks
11A1 In Haripur village May Second 25-May-15 116.9 24.2 <10.0 16.8 Proximity
to Chora 10 pit
11A1 In Haripur village June First 08-Jun-15 118.4 24.4 <10.0 14.7 -
11A1 In Haripur village June Second 23-Jun-15 106.4 24.3 <10.0 16.3 -
11A1 In Haripur village July Second 29-Jul-15 86.9 22.4 <10.0 19.3 -
11A1 In Haripur village August First 12-Aug-15 80.3 22.6 <10.0 19.3 -
11A1 In Haripur village August Second 26-Aug-15 84.7 20.9 <10.0 18.8 -
11A1 In Haripur village September First 11-Sep-15 82.4 24.2 <10.0 17.5 -
11A1 In Haripur village September Second 22-Sep-15 79.6 26.3 <10.0 17.5 -
11A1 In Haripur village October First 05-Oct-15 80.9 25.4 <10.0 19.3 -
11A1 In Haripur village October Second 30-Oct-15 82.1 26.4 <10.0 20.1 -
11A1 In Haripur village November First 02-Nov-15 88.4 30.4 <10.0 19.5 -
11A1 In Haripur village November Second 19-Nov-15 87.4 29.1 <10.0 18.3 -
11A1 In Haripur village December First 09-Dec-15 83.1 29.1 <10.0 16.2 -
11A1 In Haripur village December Second 16-Dec-15 82.7 30.4 <10.0 17.4 -
11A1 In Haripur village January First 05-Jan-16 80.1 26.9 <10.0 16.2 -
11A1 In Haripur village January Second 21-Jan-16 79.6 25.3 <10.0 16.7 -
11A1 In Haripur village February First 09-Feb-16 119.5 69.7 <10.0 17.4 -
11A1 In Haripur village February Second 19-Feb-16 124.7 36.9 <10.0 19.6 -
11A1 In Haripur village March First 05-Mar-16 126.3 42.3 <10.0 16.3 -
11A1 In Haripur village March Second 18-Mar-16 128.1 46.7 <10.0 14.2 -
11A2 In Shankarpur village May Second 25-May-15 96.4 22.7 <10.0 14.7 -
11A2 In Shankarpur village June First 08-Jun-15 94.3 22.9 <10.0 16.2 -
11A2 In Shankarpur village June Second 23-Jun-15 90.7 22.8 <10.0 14.9 -
11A2 In Shankarpur village July Second 24-Jul-15 84.1 20.9 <10.0 15.6 -
11A2 In Shankarpur village August First 12-Aug-15 79.2 20.9 <10.0 14.2 -
11A2 In Shankarpur village August Second 17-Aug-15 82.6 22.1 <10.0 14.9 -
11A2 In Shankarpur village September First 15-Sep-15 78.9 22.4 <10.0 16.0 -
11A2 In Shankarpur village September Second 18-Sep-15 80.7 24.6 <10.0 14.1 -
11A2 In Shankarpur village October First 13-Oct-15 82.6 26.8 <10.0 16.5 -
11A2 In Shankarpur village October Second 29-Oct-15 86.3 28.3 <10.0 17.5 -
11A2 In Shankarpur village November First 12-Nov-15 84.6 28.1 <10.0 16.2 -
11A2 In Shankarpur village November Second 30-Nov-15 86.8 28.7 <10.0 17.4 -
11A2 In Shankarpur village December First 07-Dec-15 81.2 28.4 <10.0 19.7 -
11A2 In Shankarpur village December Second 23-Dec-15 84.1 26.9 <10.0 18.0 -
11A2 In Shankarpur village January First 12-Jan-16 94.3 32.1 <10.0 19.4 -
11A2 In Shankarpur village January Second 27-Jan-16 92.3 30.6 <10.0 18.1 -
11A2 In Shankarpur village February First 15-Feb-16 190.6 81.2 <10.0 17.3 -
11A2 In Shankarpur village February Second 29-Feb-16 191.6 80.2 <10.0 18.2 -
11A2 In Shankarpur village March First 10-Mar-16 190.6 79.2 <10.0 16.4 -
11A2 In Shankarpur village March Second 28-Mar-16 92.2 32.4 <10.0 17.9 -
11A3 In Belbaid village October First 06-Oct-15 78.9 24.3 <10.0 12.1 -
11A3 In Belbaid village October Second 23-Oct-15 80.4 26.7 <10.0 14.0 -
11A3 In Belbaid village November First 03-Nov-15 78.3 24. <10.0 12.5 -
11A3 In Belbaid village November Second 16-Nov-15 77.4 23.2 <10.0 14.1 -

Environmental Statement (Form-V) for Cluster No. – 11 (Group of Mines) 2015-16
20
Station
No
Station Name Month Fortnight Date of
Sampling
PM10 PM2.5 SO2 NOx Remarks
11A3 In Belbaid village December First 14-Dec-15 80.2 28.1 <10.0 17.2 -
11A3 In Belbaid village December Second 21-Dec-15 79.6 26.2 <10.0 16.3 -
11A3 In Belbaid village January First 13-Jan-16 96.7 34.6 <10.0 20.1 -
11A3 In Belbaid village January Second 28-Jan-16 94.4 32.4 <10.0 19.6 -
11A3 In Belbaid village February First 02-Feb-16 192.8 80.4 <10.0 18.6 -
11A3 In Belbaid village February Second 16-Feb-16 194.1 79.7 <10.0 20.1 -
11A3 In Belbaid village March First 01-Mar-16 192.7 78.4 <10.0 18.5 -
11A3 In Belbaid village March Second 22-Mar-16 94.7 31.9 <10.0 17.4 -
11A4 In Jambad village October First 14-Oct-15 72.4 20.2 <10.0 18.3 -
11A4 In Jambad village October Second 27-Oct-15 74.2 22.4 <10.0 16.9 -
11A4 In Jambad village November First 06-Nov-15 90.7 29.4 <10.0 18.6 -
11A4 In Jambad village November Second 27-Nov-15 89.7 28.4 <10.0 17.6 -
11A4 In Jambad village December First 03-Dec-15 84.7 29.4 <10.0 15.0 -
11A4 In Jambad village December Second 17-Dec-15 82.3 30.6 <10.0 16.2 -
11A4 In Jambad village January First 15-Jan-16 92.3 32.2 <10.0 19.7 -
11A4 In Jambad village January Second 29-Jan-16 94.1 30.6 <10.0 18.2 -
11A4 In Jambad village February First 05-Feb-16 182.7 81.8 <10.0 19.7 -
11A4 In Jambad village February Second 23-Feb-16 190.4 80.1 <10.0 20.4 -
11A4 In Jambad village March First 15-Mar-16 188.4 79.9 <10.0 22.6 -
11A4 In Jambad village March Second 29-Mar-16 90.1 30.3 <10.0 20.6 -
11A5 In Damariband village October First 12-Oct-15 90.4 29.3 <10.0 15.6 -
11A5 In Damariband village October Second 30-Oct-15 89.6 28.4 <10.0 16.2 -
11A5 In Damariband village November First 04-Nov-15 88.3 28.2 <10.0 14.5 -
11A5 In Damariband village November Second 20-Nov-15 86.2 26.7 <10.0 15.1 -
11A5 In Damariband village December First 01-Dec-15 82.5 29.1 <10.0 18.9 -
11A5 In Damariband village December Second 29-Dec-15 84.4 28.2 <10.0 17.9 -
11A5 In Damariband village January First 13-Jan-16 80.1 28.4 <10.0 16. -
11A5 In Damariband village January Second 20-Jan-16 82.7 27.1 <10.0 16.4 -
11A5 In Damariband village February First 08-Feb-16 87.2 29.1 <10.0 17.5 -
11A5 In Damariband village February Second 29-Feb-16 88.9 38.6 <10.0 18.7 -
11A5 In Damariband village March First 09-Mar-16 98.3 38.1 <10.0 19.3 -
11A5 In Damariband village March Second 28-Mar-16 80.4 30.1 <10.0 21.3 -
11A6 In Bahadurpur village May Second 28-May-15 89.2 24.2 <10.0 12.3 -
11A6 In Bahadurpur village June First 11-Jun-15 86.3 20.6 <10.0 10.4 -
11A6 In Bahadurpur village June Second 26-Jun-15 80.3 20.9 <10.0 12.7 -
11A6 In Bahadurpur village July Second 29-Jul-15 74.6 18.8 <10.0 12.6 -
11A6 In Bahadurpur village August First 03-Aug-15 68.6 18.1 <10.0 14.6 -
11A6 In Bahadurpur village August Second 28-Aug-15 70.7 19.2 <10.0 15.2 -
11A6 In Bahadurpur village September First 09-Sep-15 67.3 18.7 <10.0 13.4 -
11A6 In Bahadurpur village September Second 17-Sep-15 72.4 22.4 <10.0 11.5 -
11A7 In Chichuria village May Second 28-May-15 92.4 23.1 <10.0 10.1 -
11A7 In Chichuria village June First 11-Jun-15 78.4 19.2 <10.0 9.2 -
11A7 In Chichuria village June Second 26-Jun-15 72.3 17.5 <10.0 10.4 -
11A7 In Chichuria village July Second 27-Jul-15 64.2 17.7 <10.0 18.2 -
11A7 In Chichuria village August First 13-Aug-15 64.7 17.4 <10.0 10.8 -
11A7 In Chichuria village August Second 21-Aug-15 66.4 18.5 <10.0 9.3 -
11A7 In Chichuria village September First 03-Sep-15 62.4 16.5 <10.0 12.0 -
11A7 In Chichuria village September Second 21-Sep-15 68.4 18.9 <10.0 16.2 -
11A8 In Basabdanga village May Second 26-May-15 130.2 32.7 <10.0 16.7 Proximity
Environmental Statement (Form-V) for Cluster No. – 11 (Group of Mines) 2015-16
21
Station
No
Station Name Month Fortnight Date of
Sampling
PM10 PM2.5 SO2 NOx Remarks
to Sonepur
Bazari OCP
11A8 In Basabdanga village June First 09-Jun-15 124.9 30.5 <10.0 14.8 -
11A8 In Basabdanga village June Second 24-Jun-15 116.2 24.6 <10.0 18.5 -
11A8 In Basabdanga village July Second 22-Jul-15 92.1 22.3 <10.0 18.5 -
11A8 In Basabdanga village August First 10-Aug-15 90.6 22.4 <10.0 18.5 -
11A8 In Basabdanga village August Second 24-Aug-15 94.6 24.8 <10.0 19.4 -
11A8 In Basabdanga village September First 14-Sep-15 93.7 20.9 <10.0 17.2 -
11A8 In Basabdanga village September Second 16-Sep-15 88.7 22.9 <10.0 14.1 -
AIR QUALITY METAL ANALYSIS
Station No
Station Name Month Fortnight
Date of Sampling
Arsenic Cadmium
Chromium
Mercury Nickel
Lead
11A1 In Haripur village September First 1-Sep-15 <0.005 <0.001 <0.01 <0.001 <0.10 0.03
11A1 In Haripur village March First 5-Mar-16 <0.005 <0.001 <0.01 <0.001 <0.10 <0.005
11A2 In Shankarpur village
September First 15-Sep-15 <0.005 <0.001 <0.01 <0.001 <0.10 0.04
11A2 In Shankarpur village
March First 10-Mar-16 <0.005 <0.001 <0.01 <0.001 <0.10 <0.005
11A3 In Belbaid village March First 1-Mar-16 <0.005 <0.001 <0.01 <0.001 <0.10 <0.005
11A4 In Jambad village March First 15-Mar-16 <0.005 <0.001 <0.01 <0.001 <0.10 <0.005
11A5 In Damariband village
March First 9-Mar-16 <0.005 <0.001 <0.01 <0.001 <0.10 <0.005
11A6 In Bahadurpur village
September First 9-Sep-15 <0.005 <0.001 <0.01 <0.001 <0.10 0.02
11A7 In Chichuria village
September First 3-Sep-15 <0.005 <0.001 <0.01 <0.001 <0.10 0.07
11A8 In Basabdanga village
September First 14-Sep-15 <0.005 <0.001 <0.01 <0.001 <0.10 0.06

Environmental Statement (Form-V) for Cluster No. – 11 (Group of Mines) 2015-16
22
Annexure – II
NOISE LEVEL
Station No
Station Name Month Fortnight Date of Sampling
Noise Level dB(A)
11N1 Pit-top Haripur UG June Second 23-Jun-15 63.9
11N1 Pit-top Haripur UG May Second 28-May-15 64.2
11N1 Pit-top Haripur UG June First 08-Jun-15 62.8
11N1 Pit-top Haripur UG July First 09-Jul-15 61.4
11N1 Pit-top Haripur UG August First 12-Aug-15 67.5
11N1 Pit-top Haripur UG August Second 21-Aug-15 62.3
11N1 Pit-top Haripur UG September First 09-Sep-15 64.5
11N1 Pit-top Haripur UG September Second 23-Sep-15 65.1
11N1 Pit-top Haripur UG October First 13-Oct-15 64.2
11N1 Pit-top Haripur UG October Second 27-Oct-15 70.3
11N1 Pit-top Haripur UG November First 03-Nov-15 67.2
11N1 Pit-top Haripur UG November Second 27-Nov-15 70.0
11N1 Pit-top Haripur UG December First 01-Dec-15 61
11N1 Pit-top Haripur UG December Second 31-Dec-15 67
11N1 Pit-top Haripur UG January First 06-Jan-16 68
11N1 Pit-top Haripur UG January Second 20-Jan-16 62
11N1 Pit-top Haripur UG February First 09-Feb-16 54
11N1 Pit-top Haripur UG February Second 20-Feb-16 69
11N1 Pit-top Haripur UG March First 09-Mar-16 62
11N1 Pit-top Haripur UG March Second 22-Mar-16 67
11N2 Pit-top Lower Kenda UG June Second 23-Jun-15 59.1
11N2 Pit-top Lower Kenda UG May Second 28-May-15 58.7
11N2 Pit-top Lower Kenda UG June First 08-Jun-15 57.2
11N2 Pit-top Lower Kenda UG July First 09-Jul-15 57.4
11N2 Pit-top Lower Kenda UG August First 12-Aug-15 69.3
11N2 Pit-top Lower Kenda UG August Second 21-Aug-15 69.7
11N2 Pit-top Lower Kenda UG September First 09-Sep-15 66.7
11N2 Pit-top Lower Kenda UG September Second 18-Sep-15 67.9
11N2 Pit-top Lower Kenda UG October First 01-Oct-15 66.7
11N2 Pit-top Lower Kenda UG October Second 27-Oct-15 68.5
11N2 Pit-top Lower Kenda UG November First 03-Nov-15 66.5
11N2 Pit-top Lower Kenda UG November Second 27-Nov-15 64.3
11N2 Pit-top Lower Kenda UG December First 01-Dec-15 60
11N2 Pit-top Lower Kenda UG December Second 31-Dec-15 64
11N2 Pit-top Lower Kenda UG January First 11-Jan-16 67
11N2 Pit-top Lower Kenda UG January Second 20-Jan-16 66
11N2 Pit-top Lower Kenda UG February First 09-Feb-16 61
11N2 Pit-top Lower Kenda UG February Second 20-Feb-16 62
11N2 Pit-top Lower Kenda UG March First 09-Mar-16 64
11N2 Pit-top Lower Kenda UG March Second 22-Mar-16 64
11N3 Pit-top Chora Block Incline UG June Second 24-Jun-15 59.8
11N3 Pit-top Chora Block Incline UG May Second 26-May-15 60.2
11N3 Pit-top Chora Block Incline UG June First 10-Jun-15 62.4
11N3 Pit-top Chora Block Incline UG July First 14-Jul-15 58.7
11N3 Pit-top Chora Block Incline UG August First 12-Aug-15 65.5
11N3 Pit-top Chora Block Incline UG August Second 21-Aug-15 65.1

Environmental Statement (Form-V) for Cluster No. – 11 (Group of Mines) 2015-16
23
Station
No
Station Name Month Fortnight Date of
Sampling
Noise Level
dB(A)
11N3 Pit-top Chora Block Incline UG September First 01-Sep-15 61.3
11N3 Pit-top Chora Block Incline UG September Second 23-Sep-15 62.4
11N3 Pit-top Chora Block Incline UG October First 12-Oct-15 64.9
11N3 Pit-top Chora Block Incline UG October Second 27-Oct-15 66.4
11N3 Pit-top Chora Block Incline UG November First 03-Nov-15 66.8
11N3 Pit-top Chora Block Incline UG November Second 27-Nov-15 67.1
11N3 Pit-top Chora Block Incline UG December First 01-Dec-15 66
11N3 Pit-top Chora Block Incline UG December Second 31-Dec-15 67
11N3 Pit-top Chora Block Incline UG January First 11-Jan-16 64
11N3 Pit-top Chora Block Incline UG January Second 20-Jan-16 61
11N3 Pit-top Chora Block Incline UG February First 15-Feb-16 69
11N3 Pit-top Chora Block Incline UG February Second 20-Feb-16 63
11N3 Pit-top Chora Block Incline UG March First 09-Mar-16 69
11N3 Pit-top Chora Block Incline UG March Second 22-Mar-16 54
11N4 Pit-top Chora 7, 9 & 10 Pits
UG
June Second 26-Jun-15 62.1
11N4 Pit-top Chora 7, 9 & 10 Pits
UG
May Second 25-May-15 66.2
11N4 Pit-top Chora 7, 9 & 10 Pits June First 10-Jun-15 64.7
11N4 Pit-top Chora 7, 9 & 10 Pits July First 14-Jul-15 59.3
11N4 Pit-top Chora 7, 9 & 10 Pits August First 12-Aug-15 58.4
11N4 Pit-top Chora 7, 9 & 10 Pits August Second 24-Aug-15 60.8
11N4 Pit-top Chora 7, 9 & 10 Pits September First 01-Sep-15 65.2
11N4 Pit-top Chora 7, 9 & 10 Pits September Second 29-Sep-15 64.3
11N4 Pit-top Chora 7, 9 & 10 Pits October First 15-Oct-15 66.3
11N4 Pit-top Chora 7, 9 & 10 Pits October Second 27-Oct-15 67.1
11N4 Pit-top Chora 7, 9 & 10 Pits November First 03-Nov-15 67.6
11N4 Pit-top Chora 7, 9 & 10 Pits November Second 27-Nov-15 69.7
11N4 Pit-top Chora 7, 9 & 10 Pits December First 01-Dec-15 68
11N4 Pit-top Chora 7, 9 & 10 Pits December Second 31-Dec-15 66
11N4 Pit-top Chora 7, 9 & 10 Pits January First 11-Jan-16 62
11N4 Pit-top Chora 7, 9 & 10 Pits January Second 20-Jan-16 60
11N4 Pit-top Chora 7, 9 & 10 Pits February First 15-Feb-16 62
11N4 Pit-top Chora 7, 9 & 10 Pits February Second 16-Feb-16 59
11N4 Pit-top Chora 7, 9 & 10 Pits March First 09-Mar-16 58
11N4 Pit-top Chora 7, 9 & 10 Pits March Second 22-Mar-16 58
11N5 Pit-top Bahula UG June Second 24-Jun-15 58.2
11N5 Pit-top Bahula UG May Second 25-May-15 60.7
11N5 Pit-top Bahula UG June First 12-Jun-15 62.4
11N5 Pit-top Bahula UG August First 10-Aug-15 63.5
11N5 Pit-top Bahula UG July First 08-Jul-15 59.8
11N5 Pit-top Bahula UG August Second 21-Aug-15 65.7
11N5 Pit-top Bahula UG September First 14-Sep-15 63.1
11N5 Pit-top Bahula UG September Second 25-Sep-15 64.7
11N5 Pit-top Bahula UG October First 06-Oct-15 66.1
11N5 Pit-top Bahula UG October Second 29-Oct-15 68.7
11N5 Pit-top Bahula UG November First 06-Nov-15 70.5
11N5 Pit-top Bahula UG November Second 20-Nov-15 68.4
11N5 Pit-top Bahula UG December First 09-Dec-15 62

Environmental Statement (Form-V) for Cluster No. – 11 (Group of Mines) 2015-16
24
Station
No
Station Name Month Fortnight Date of
Sampling
Noise Level
dB(A)
11N5 Pit-top Bahula UG December Second 31-Dec-15 62
11N5 Pit-top Bahula UG January First 11-Jan-16 65
11N5 Pit-top Bahula UG January Second 20-Jan-16 66
11N5 Pit-top Bahula UG February First 15-Feb-16 70
11N5 Pit-top Bahula UG February Second 16-Feb-16 54
11N5 Pit-top Bahula UG March First 01-Mar-16 67
11N5 Pit-top Bahula UG March Second 28-Mar-16 69
11N6 Pit-top C L Jambad UG June Second 26-Jun-15 59.8
11N6 Pit-top C L Jambad UG May Second 26-May-15 62.2
11N6 Pit-top C L Jambad UG June First 12-Jun-15 60.1
11N6 Pit-top C L Jambad UG August First 10-Aug-15 64.9
11N6 Pit-top C L Jambad UG July First 09-Jul-15 63.5
11N6 Pit-top C L Jambad UG August Second 21-Aug-15 59.3
11N6 Pit-top C L Jambad UG September First 14-Sep-15 62.5
11N6 Pit-top C L Jambad UG September Second 29-Sep-15 60.3
11N6 Pit-top C L Jambad UG October First 15-Oct-15 60.9
11N6 Pit-top C L Jambad UG October Second 29-Oct-15 64.6
11N6 Pit-top C L Jambad UG November First 06-Nov-15 68.2
11N6 Pit-top C L Jambad UG November Second 20-Nov-15 65.8
11N6 Pit-top C L Jambad UG December First 09-Dec-15 66
11N6 Pit-top C L Jambad UG December Second 30-Dec-15 64
11N6 Pit-top C L Jambad UG January First 11-Jan-16 63
11N6 Pit-top C L Jambad UG January Second 21-Jan-16 67
11N6 Pit-top C L Jambad UG February First 08-Feb-16 58
11N6 Pit-top C L Jambad UG February Second 16-Feb-16 67
11N6 Pit-top C L Jambad UG March First 01-Mar-16 62
11N6 Pit-top C L Jambad UG March Second 28-Mar-16 70
11N7 Pit-top Siduli UG June Second 23-Jun-15 60.9
11N7 Pit-top Siduli UG May Second 28-May-15 62.1
11N7 Pit-top Siduli UG June First 11-Jun-15 64.2
11N7 Pit-top Siduli UG August First 10-Aug-15 68.4
11N7 Pit-top Siduli UG July First 09-Jul-15 59.8
11N7 Pit-top Siduli UG August Second 24-Aug-15 64.1
11N7 Pit-top Siduli UG September First 01-Sep-15 63.8
11N7 Pit-top Siduli UG September Second 28-Sep-15 64.7
11N7 Pit-top Siduli UG October First 05-Oct-15 62.7
11N7 Pit-top Siduli UG October Second 29-Oct-15 65.2
11N7 Pit-top Siduli UG November First 06-Nov-15 66.1
11N7 Pit-top Siduli UG November Second 20-Nov-15 67.2
11N7 Pit-top Siduli UG December First 09-Dec-15 67
11N7 Pit-top Siduli UG December Second 30-Dec-15 63
11N7 Pit-top Siduli UG January First 12-Jan-16 66
11N7 Pit-top Siduli UG January Second 21-Jan-16 69
11N7 Pit-top Siduli UG February First 02-Feb-16 57
11N7 Pit-top Siduli UG February Second 29-Feb-16 64
11N7 Pit-top Siduli UG March First 01-Mar-16 68
11N7 Pit-top Siduli UG March Second 28-Mar-16 62
11N8 Pit-top Khandra UG June Second 24-Jun-15 58.9
11N8 Pit-top Khandra UG May Second 28-May-15 64.6

Environmental Statement (Form-V) for Cluster No. – 11 (Group of Mines) 2015-16
25
Station
No
Station Name Month Fortnight Date of
Sampling
Noise Level
dB(A)
11N8 Pit-top Khandra UG June First 11-Jun-15 62.7
11N8 Pit-top Khandra UG August First 10-Aug-15 64.5
11N8 Pit-top Khandra UG July First 14-Jul-15 60.3
11N8 Pit-top Khandra UG August Second 24-Aug-15 58.9
11N8 Pit-top Khandra UG September First 01-Sep-15 60.7
11N8 Pit-top Khandra UG September Second 29-Sep-15 62.6
11N8 Pit-top Khandra UG October First 14-Oct-15 64.3
11N8 Pit-top Khandra UG October Second 29-Oct-15 63.9
11N8 Pit-top Khandra UG November First 06-Nov-15 65.4
11N8 Pit-top Khandra UG November Second 20-Nov-15 64.1
11N8 Pit-top Khandra UG December First 09-Dec-15 64
11N8 Pit-top Khandra UG December Second 30-Dec-15 69
11N8 Pit-top Khandra UG January First 12-Jan-16 69
11N8 Pit-top Khandra UG January Second 21-Jan-16 61
11N8 Pit-top Khandra UG February First 06-Feb-16 63
11N8 Pit-top Khandra UG February Second 29-Feb-16 63
11N8 Pit-top Khandra UG March First 05-Mar-16 61
11N8 Pit-top Khandra UG March Second 18-Mar-16 54
11N9 Pit-top Shankarpur UG June Second 26-Jun-15 62.1
11N9 Pit-top Shankarpur UG May Second 26-May-15 58.7
11N9 Pit-top Shankarpur UG June First 09-Jun-15 59.2
11N9 Pit-top Shankarpur UG August First 10-Aug-15 63.0
11N9 Pit-top Shankarpur UG July First 09-Jun-15 60.0
11N9 Pit-top Shankarpur UG August Second 24-Aug-15 63.8
11N9 Pit-top Shankarpur UG September First 01-Sep-15 64.3
11N9 Pit-top Shankarpur UG September Second 16-Sep-15 66.2
11N9 Pit-top Shankarpur UG October First 13-Oct-15 67.9
11N9 Pit-top Shankarpur UG October Second 29-Oct-15 70.6
11N9 Pit-top Shankarpur UG November First 04-Nov-15 69.8
11N9 Pit-top Shankarpur UG November Second 20-Nov-15 71.2
11N9 Pit-top Shankarpur UG December First 09-Dec-15 70
11N9 Pit-top Shankarpur UG December Second 30-Dec-15 70
11N9 Pit-top Shankarpur UG January First 12-Jan-16 70
11N9 Pit-top Shankarpur UG January Second 21-Jan-16 70
11N9 Pit-top Shankarpur UG February First 08-Feb-16 69
11N9 Pit-top Shankarpur UG February Second 29-Feb-16 67
11N9 Pit-top Shankarpur UG March First 05-Mar-16 59
11N9 Pit-top Shankarpur UG March Second 18-Mar-16 59
Environmental Statement (Form-V) for Cluster No. – 11 (Group of Mines) 2015-16
26
Annexure – III
EFFLUENT WATER QUALITY (5 PARAMETERS)
Station No
Station Name Month Fortnight Date of Sampling
pH TSS TDS O&G COD
11MW1 Haripur May Second 30-May-15 7.88 32 531 <2.0 28
11MW1 Haripur July First 09-Jul-15 7.93 <25.0 526 <2.0 16
11MW1 Haripur July Second 29-Jul-15 7.98 28 543 <2.0 36
11MW1 Haripur August First 12-Aug-15 8.04 <25.0 576 <2.0 20
11MW1 Haripur August Second 26-Aug-15 8.06 <25.0 584 <2.0 32
11MW1 Haripur June Second 23-Jun-15 7.96 <25.0 530 <2.0 16
11MW1 Haripur June First 08-Jun-15 7.91 28 536 <2.0 24
11MW1 Haripur September First 09-Sep-15 8.02 <25.0 567 <2.0 30
11MW1 Haripur September Second 22-Sep-15 8.02 7 484 <2.0 12
11MW1 Haripur October First 13-Oct-15 7.86 6 478 <2.0 24
11MW1 Haripur October Second 23-Oct-15 8.32 7 492 <2.0 16
11MW1 Haripur November First 03-Nov-15 7.88 5 506 <2.0 12
11MW1 Haripur November Second 28-Nov-15 7.64 10 486 <2.0 16
11MW1 Haripur December Second 21-Dec-15 7.55 16 620 <2.0 24
11MW1 Haripur January First 15-Jan-16 7.65 9 627 <2.0 16
11MW1 Haripur January Second 21-Jan-16 7.65 7 631 <2.0 24
11MW1 Haripur February First 02-Feb-16 7.72 10 657 <2.0 24
11MW1 Haripur February Second 16-Feb-16 7.82 14 650 <2.0 32
11MW1 Haripur March First 10-Mar-16 7.89 12 650 <2.0 36
11MW1 Haripur March Second 28-Mar-16 8.00 18 639 <2.0 24
11MW10 Khandra UG July First 14-Jul-15 7.65 <25.0 572 <2.0 16
11MW10 Khandra UG July Second 29-Jul-15 7.98 <25.0 562 <2.0 24
11MW10 Khandra UG August First 10-Aug-15 8.02 <25.0 574 <2.0 14
11MW10 Khandra UG August Second 25-Aug-15 8.00 32 588 <2.0 10
11MW10 Khandra UG June Second 24-Jun-15 8.05 <25.0 576 <2.0 12
11MW10 Khandra UG May Second 28-May-15 7.84 28 572 <2.0 24
11MW10 Khandra UG June First 05-Jun-15 7.86 <25.0 581 <2.0 8
11MW10 Khandra UG September First 14-Sep-15 8.00 32 581 <2.0 08
11MW10 Khandra UG September Second 17-Sep-15 8.07 6 498 <2.0 24
11MW10 Khandra UG October First 14-Oct-15 7.58 5 478 <2.0 16
11MW10 Khandra UG October Second 30-Oct-15 8.18 8 484 <2.0 24
11MW10 Khandra UG November First 03-Nov-15 8.42 10 472 <2.0 16
11MW10 Khandra UG November Second 27-Nov-15 8.12 10 488 <2.0 16
11MW10 Khandra UG December Second 29-Dec-15 7.96 10 433 <2.0 40
11MW10 Khandra UG January First 13-Jan-16 7.99 7 442 <2.0 16
11MW10 Khandra UG January Second 27-Jan-16 8.06 7 460 <2.0 8
11MW10 Khandra UG February First 09-Feb-16 8.21 10 741 <2.0 24
11MW10 Khandra UG February Second 23-Feb-16 8.15 12 725 <2.0 20
11MW10 Khandra UG March First 15-Mar-16 8.40 7 747 <2.0 32
11MW10 Khandra UG March Second 22-Mar-16 8.49 6 749 <2.0 20
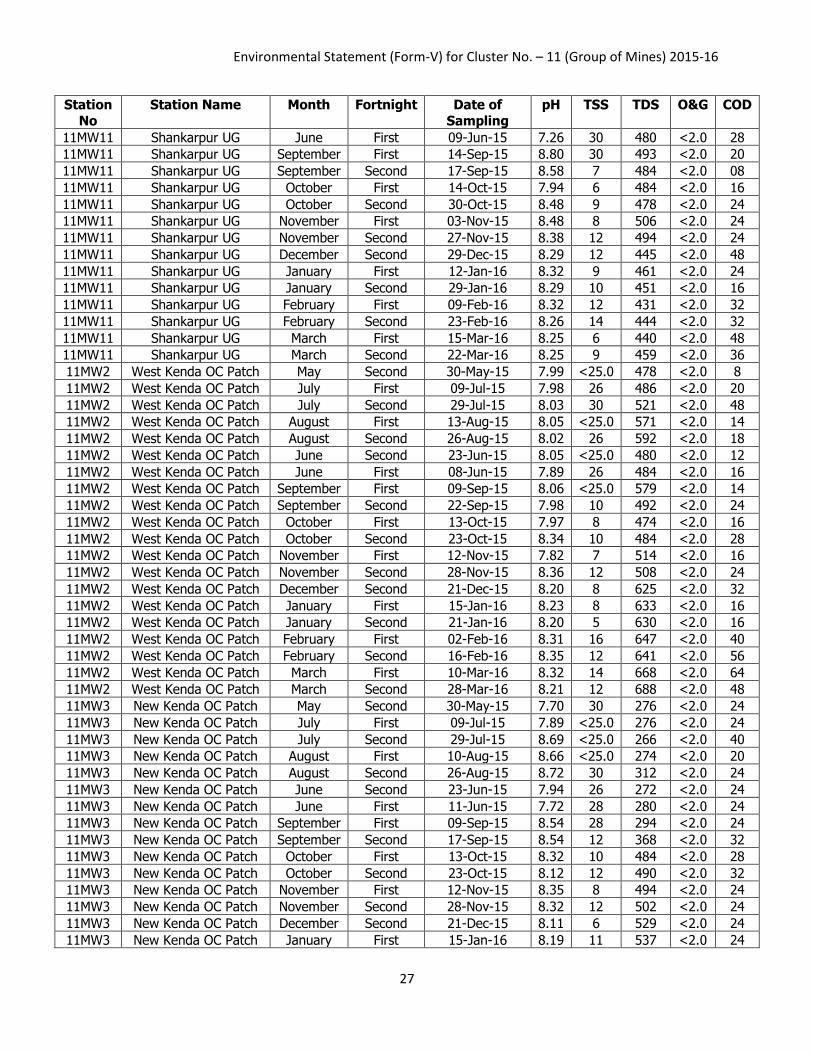
11MW11 Shankarpur UG July First 14-Jul-15 7.78 <25.0 474 <2.0 16
11MW11 Shankarpur UG July Second 29-Jul-15 8.70 <25.0 449 <2.0 40
11MW11 Shankarpur UG August First 10-Aug-15 8.83 <25.0 467 <2.0 20
11MW11 Shankarpur UG August Second 25-Aug-15 8.78 26 471 <2.0 20
11MW11 Shankarpur UG June Second 24-Jun-15 8.09 26 478 <2.0 20
11MW11 Shankarpur UG May Second 27-May-15 7.22 <25.0 484 <2.0 22
Environmental Statement (Form-V) for Cluster No. – 11 (Group of Mines) 2015-16
27
Station
No
Station Name Month Fortnight Date of
Sampling
pH TSS TDS O&G COD
11MW11 Shankarpur UG June First 09-Jun-15 7.26 30 480 <2.0 28
11MW11 Shankarpur UG September First 14-Sep-15 8.80 30 493 <2.0 20
11MW11 Shankarpur UG September Second 17-Sep-15 8.58 7 484 <2.0 08
11MW11 Shankarpur UG October First 14-Oct-15 7.94 6 484 <2.0 16
11MW11 Shankarpur UG October Second 30-Oct-15 8.48 9 478 <2.0 24
11MW11 Shankarpur UG November First 03-Nov-15 8.48 8 506 <2.0 24
11MW11 Shankarpur UG November Second 27-Nov-15 8.38 12 494 <2.0 24
11MW11 Shankarpur UG December Second 29-Dec-15 8.29 12 445 <2.0 48
11MW11 Shankarpur UG January First 12-Jan-16 8.32 9 461 <2.0 24
11MW11 Shankarpur UG January Second 29-Jan-16 8.29 10 451 <2.0 16
11MW11 Shankarpur UG February First 09-Feb-16 8.32 12 431 <2.0 32
11MW11 Shankarpur UG February Second 23-Feb-16 8.26 14 444 <2.0 32
11MW11 Shankarpur UG March First 15-Mar-16 8.25 6 440 <2.0 48
11MW11 Shankarpur UG March Second 22-Mar-16 8.25 9 459 <2.0 36
11MW2 West Kenda OC Patch May Second 30-May-15 7.99 <25.0 478 <2.0 8
11MW2 West Kenda OC Patch July First 09-Jul-15 7.98 26 486 <2.0 20
11MW2 West Kenda OC Patch July Second 29-Jul-15 8.03 30 521 <2.0 48
11MW2 West Kenda OC Patch August First 13-Aug-15 8.05 <25.0 571 <2.0 14
11MW2 West Kenda OC Patch August Second 26-Aug-15 8.02 26 592 <2.0 18
11MW2 West Kenda OC Patch June Second 23-Jun-15 8.05 <25.0 480 <2.0 12
11MW2 West Kenda OC Patch June First 08-Jun-15 7.89 26 484 <2.0 16
11MW2 West Kenda OC Patch September First 09-Sep-15 8.06 <25.0 579 <2.0 14
11MW2 West Kenda OC Patch September Second 22-Sep-15 7.98 10 492 <2.0 24
11MW2 West Kenda OC Patch October First 13-Oct-15 7.97 8 474 <2.0 16
11MW2 West Kenda OC Patch October Second 23-Oct-15 8.34 10 484 <2.0 28
11MW2 West Kenda OC Patch November First 12-Nov-15 7.82 7 514 <2.0 16
11MW2 West Kenda OC Patch November Second 28-Nov-15 8.36 12 508 <2.0 24
11MW2 West Kenda OC Patch December Second 21-Dec-15 8.20 8 625 <2.0 32
11MW2 West Kenda OC Patch January First 15-Jan-16 8.23 8 633 <2.0 16
11MW2 West Kenda OC Patch January Second 21-Jan-16 8.20 5 630 <2.0 16
11MW2 West Kenda OC Patch February First 02-Feb-16 8.31 16 647 <2.0 40
11MW2 West Kenda OC Patch February Second 16-Feb-16 8.35 12 641 <2.0 56
11MW2 West Kenda OC Patch March First 10-Mar-16 8.32 14 668 <2.0 64
11MW2 West Kenda OC Patch March Second 28-Mar-16 8.21 12 688 <2.0 48
11MW3 New Kenda OC Patch May Second 30-May-15 7.70 30 276 <2.0 24
11MW3 New Kenda OC Patch July First 09-Jul-15 7.89 <25.0 276 <2.0 24
11MW3 New Kenda OC Patch July Second 29-Jul-15 8.69 <25.0 266 <2.0 40
11MW3 New Kenda OC Patch August First 10-Aug-15 8.66 <25.0 274 <2.0 20
11MW3 New Kenda OC Patch August Second 26-Aug-15 8.72 30 312 <2.0 24
11MW3 New Kenda OC Patch June Second 23-Jun-15 7.94 26 272 <2.0 24
11MW3 New Kenda OC Patch June First 11-Jun-15 7.72 28 280 <2.0 24
11MW3 New Kenda OC Patch September First 09-Sep-15 8.54 28 294 <2.0 24
11MW3 New Kenda OC Patch September Second 17-Sep-15 8.54 12 368 <2.0 32
11MW3 New Kenda OC Patch October First 13-Oct-15 8.32 10 484 <2.0 28
11MW3 New Kenda OC Patch October Second 23-Oct-15 8.12 12 490 <2.0 32
11MW3 New Kenda OC Patch November First 12-Nov-15 8.35 8 494 <2.0 24
11MW3 New Kenda OC Patch November Second 28-Nov-15 8.32 12 502 <2.0 24
11MW3 New Kenda OC Patch December Second 21-Dec-15 8.11 6 529 <2.0 24
11MW3 New Kenda OC Patch January First 15-Jan-16 8.19 11 537 <2.0 24

Environmental Statement (Form-V) for Cluster No. – 11 (Group of Mines) 2015-16
28
Station
No
Station Name Month Fortnight Date of
Sampling
pH TSS TDS O&G COD
11MW3 New Kenda OC Patch January Second 21-Jan-16 8.12 10 525 <2.0 24
11MW3 New Kenda OC Patch February First 02-Feb-16 8.12 14 551 <2.0 48
11MW3 New Kenda OC Patch February Second 16-Feb-16 8.11 13 525 <2.0 40
11MW3 New Kenda OC Patch March First 10-Mar-16 8.26 8 550 <2.0 40
11MW3 New Kenda OC Patch March Second 28-Mar-16 8.40 14 530 <2.0 48
11MW4 Lower Kenda May Second 28-May-15 7.43 28 414 <2.0 32
11MW4 Lower Kenda July First 09-Jul-15 7.52 26 416 <2.0 16
11MW4 Lower Kenda July Second 27-Jul-15 8.74 <25.0 388 <2.0 24
11MW4 Lower Kenda August First 03-Aug-15 8.77 <25.0 380 <2.0 30
11MW4 Lower Kenda August Second 26-Aug-15 8.84 <25.0 364 <2.0 34
11MW4 Lower Kenda June Second 24-Jun-15 8.03 30 410 <2.0 28
11MW4 Lower Kenda June First 11-Jun-15 7.48 32 418 <2.0 28
11MW4 Lower Kenda September First 09-Sep-15 8.72 30 372 <2.0 30
11MW4 Lower Kenda September Second 17-Sep-15 8.68 9 412 <2.0 20
11MW4 Lower Kenda October First 06-Oct-15 8.46 12 510 <2.0 24
11MW4 Lower Kenda October Second 23-Oct-15 8.34 11 498 <2.0 24
11MW4 Lower Kenda November First 03-Nov-15 7.86 6 478 <2.0 16
11MW4 Lower Kenda November Second 28-Nov-15 8.48 8 516 <2.0 16
11MW4 Lower Kenda December Second 23-Dec-15 8.38 7 471 <2.0 32
11MW4 Lower Kenda January First 15-Jan-16 8.41 7 479 <2.0 16
11MW4 Lower Kenda January Second 21-Jan-16 8.49 8 495 <2.0 16
11MW4 Lower Kenda February First 02-Feb-16 8.36 16 480 <2.0 24
11MW4 Lower Kenda February Second 16-Feb-16 8.32 8 452 <2.0 28
11MW4 Lower Kenda March First 10-Mar-16 8.50 9 500 <2.0 28
11MW4 Lower Kenda March Second 29-Mar-16 8.59 16 523 <2.0 24
11MW5 Chora Block Incline July First 09-Jul-15 7.64 <25.0 448 <2.0 16
11MW5 Chora Block Incline July Second 27-Jul-15 8.82 <25.0 422 <2.0 32
11MW5 Chora Block Incline August First 10-Aug-15 8.85 26 449 <2.0 22
11MW5 Chora Block Incline August Second 26-Aug-15 8.92 28 462 <2.0 20
11MW5 Chora Block Incline June Second 24-Jun-15 7.98 28 444 <2.0 24
11MW5 Chora Block Incline May Second 30-May-15 7.40 <25.0 448 <2.0 24
11MW5 Chora Block Incline June First 11-Jun-15 7.54 26 456 <2.0 24
11MW5 Chora Block Incline September First 09-Sep-15 8.78 32 470 <2.0 28
11MW5 Chora Block Incline September Second 17-Sep-15 8.62 10 438 <2.0 28
11MW5 Chora Block Incline October First 06-Oct-15 8.62 14 512 <2.0 32
11MW5 Chora Block Incline October Second 29-Oct-15 8.52 8 482 <2.0 20
11MW5 Chora Block Incline November First 06-Nov-15 7.84 8 512 <2.0 16
11MW5 Chora Block Incline November Second 26-Nov-15 7.48 10 478 <2.0 20
11MW5 Chora Block Incline December Second 23-Dec-15 7.38 9 507 <2.0 16
11MW5 Chora Block Incline January First 15-Jan-16 7.35 13 519 <2.0 32
11MW5 Chora Block Incline January Second 27-Jan-16 7.36 11 512 <2.0 16
11MW5 Chora Block Incline February First 08-Feb-16 7.48 8 592 <2.0 24
11MW5 Chora Block Incline February Second 16-Feb-16 7.48 7 559 <2.0 32
11MW5 Chora Block Incline March First 09-Mar-16 7.71 7 620 <2.0 24
11MW5 Chora Block Incline March Second 29-Mar-16 7.91 18 635 <2.0 40
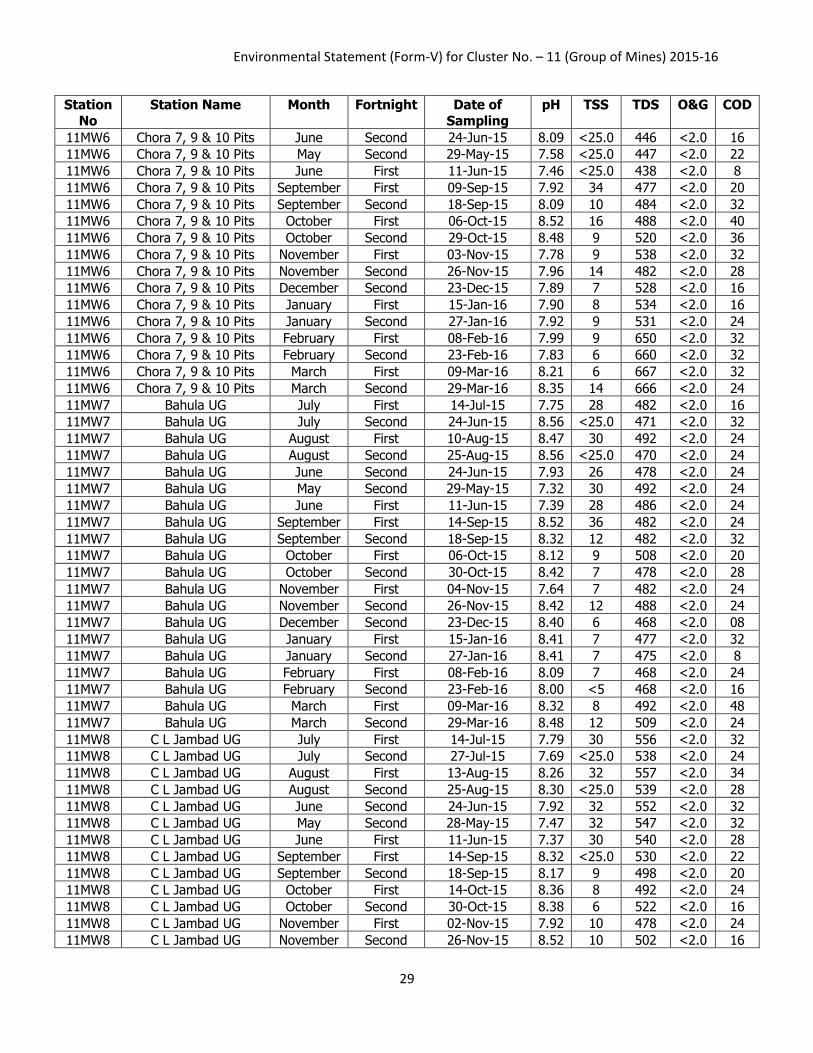
11MW6 Chora 7, 9 & 10 Pits July First 14-Jul-15 7.86 <25.0 452 <2.0 24
11MW6 Chora 7, 9 & 10 Pits July Second 24-Jun-15 7.87 <25.0 430 <2.0 16
11MW6 Chora 7, 9 & 10 Pits August First 10-Aug-15 7.94 28 472 <2.0 16
11MW6 Chora 7, 9 & 10 Pits August Second 26-Aug-15 8.00 26 466 <2.0 20
Environmental Statement (Form-V) for Cluster No. – 11 (Group of Mines) 2015-16
29
Station
No
Station Name Month Fortnight Date of
Sampling
pH TSS TDS O&G COD
11MW6 Chora 7, 9 & 10 Pits June Second 24-Jun-15 8.09 <25.0 446 <2.0 16
11MW6 Chora 7, 9 & 10 Pits May Second 29-May-15 7.58 <25.0 447 <2.0 22
11MW6 Chora 7, 9 & 10 Pits June First 11-Jun-15 7.46 <25.0 438 <2.0 8
11MW6 Chora 7, 9 & 10 Pits September First 09-Sep-15 7.92 34 477 <2.0 20
11MW6 Chora 7, 9 & 10 Pits September Second 18-Sep-15 8.09 10 484 <2.0 32
11MW6 Chora 7, 9 & 10 Pits October First 06-Oct-15 8.52 16 488 <2.0 40
11MW6 Chora 7, 9 & 10 Pits October Second 29-Oct-15 8.48 9 520 <2.0 36
11MW6 Chora 7, 9 & 10 Pits November First 03-Nov-15 7.78 9 538 <2.0 32
11MW6 Chora 7, 9 & 10 Pits November Second 26-Nov-15 7.96 14 482 <2.0 28
11MW6 Chora 7, 9 & 10 Pits December Second 23-Dec-15 7.89 7 528 <2.0 16
11MW6 Chora 7, 9 & 10 Pits January First 15-Jan-16 7.90 8 534 <2.0 16
11MW6 Chora 7, 9 & 10 Pits January Second 27-Jan-16 7.92 9 531 <2.0 24
11MW6 Chora 7, 9 & 10 Pits February First 08-Feb-16 7.99 9 650 <2.0 32
11MW6 Chora 7, 9 & 10 Pits February Second 23-Feb-16 7.83 6 660 <2.0 32
11MW6 Chora 7, 9 & 10 Pits March First 09-Mar-16 8.21 6 667 <2.0 32
11MW6 Chora 7, 9 & 10 Pits March Second 29-Mar-16 8.35 14 666 <2.0 24
11MW7 Bahula UG July First 14-Jul-15 7.75 28 482 <2.0 16
11MW7 Bahula UG July Second 24-Jun-15 8.56 <25.0 471 <2.0 32
11MW7 Bahula UG August First 10-Aug-15 8.47 30 492 <2.0 24
11MW7 Bahula UG August Second 25-Aug-15 8.56 <25.0 470 <2.0 24
11MW7 Bahula UG June Second 24-Jun-15 7.93 26 478 <2.0 24
11MW7 Bahula UG May Second 29-May-15 7.32 30 492 <2.0 24
11MW7 Bahula UG June First 11-Jun-15 7.39 28 486 <2.0 24
11MW7 Bahula UG September First 14-Sep-15 8.52 36 482 <2.0 24
11MW7 Bahula UG September Second 18-Sep-15 8.32 12 482 <2.0 32
11MW7 Bahula UG October First 06-Oct-15 8.12 9 508 <2.0 20
11MW7 Bahula UG October Second 30-Oct-15 8.42 7 478 <2.0 28
11MW7 Bahula UG November First 04-Nov-15 7.64 7 482 <2.0 24
11MW7 Bahula UG November Second 26-Nov-15 8.42 12 488 <2.0 24
11MW7 Bahula UG December Second 23-Dec-15 8.40 6 468 <2.0 08
11MW7 Bahula UG January First 15-Jan-16 8.41 7 477 <2.0 32
11MW7 Bahula UG January Second 27-Jan-16 8.41 7 475 <2.0 8
11MW7 Bahula UG February First 08-Feb-16 8.09 7 468 <2.0 24
11MW7 Bahula UG February Second 23-Feb-16 8.00 <5 468 <2.0 16
11MW7 Bahula UG March First 09-Mar-16 8.32 8 492 <2.0 48
11MW7 Bahula UG March Second 29-Mar-16 8.48 12 509 <2.0 24
11MW8 C L Jambad UG July First 14-Jul-15 7.79 30 556 <2.0 32
11MW8 C L Jambad UG July Second 27-Jul-15 7.69 <25.0 538 <2.0 24
11MW8 C L Jambad UG August First 13-Aug-15 8.26 32 557 <2.0 34
11MW8 C L Jambad UG August Second 25-Aug-15 8.30 <25.0 539 <2.0 28
11MW8 C L Jambad UG June Second 24-Jun-15 7.92 32 552 <2.0 32
11MW8 C L Jambad UG May Second 28-May-15 7.47 32 547 <2.0 32
11MW8 C L Jambad UG June First 11-Jun-15 7.37 30 540 <2.0 28
11MW8 C L Jambad UG September First 14-Sep-15 8.32 <25.0 530 <2.0 22
11MW8 C L Jambad UG September Second 18-Sep-15 8.17 9 498 <2.0 20
11MW8 C L Jambad UG October First 14-Oct-15 8.36 8 492 <2.0 24
11MW8 C L Jambad UG October Second 30-Oct-15 8.38 6 522 <2.0 16
11MW8 C L Jambad UG November First 02-Nov-15 7.92 10 478 <2.0 24
11MW8 C L Jambad UG November Second 26-Nov-15 8.52 10 502 <2.0 16

Environmental Statement (Form-V) for Cluster No. – 11 (Group of Mines) 2015-16
30
Station
No
Station Name Month Fortnight Date of
Sampling
pH TSS TDS O&G COD
11MW8 C L Jambad UG December Second 23-Dec-15 8.52 9 636 <2.0 24
11MW8 C L Jambad UG January First 15-Jan-16 8.53 6 648 <2.0 24
11MW8 C L Jambad UG January Second 27-Jan-16 8.53 6 652 <2.0 8
11MW8 C L Jambad UG February First 09-Feb-16 8.12 <5.0 721 <2.0 16
11MW8 C L Jambad UG February Second 23-Feb-16 8.16 16 722 <2.0 28
11MW8 C L Jambad UG March First 09-Mar-16 8.01 9 728 <2.0 36
11MW8 C L Jambad UG March Second 22-Mar-16 8.19 8 750 <2.0 16
11MW9 Siduli UG July First 14-Jul-15 7.68 32 372 <2.0 24
11MW9 Siduli UG July Second 29-Jul-15 8.20 <25.0 355 <2.0 08
11MW9 Siduli UG August First 13-Aug-15 8.24 <25.0 354 <2.0 24
11MW9 Siduli UG August Second 25-Aug-15 8.36 <25.0 350 <2.0 20
11MW9 Siduli UG June Second 24-Jun-15 8.12 34 374 <2.0 24
11MW9 Siduli UG May Second 27-May-15 7.02 34 370 <2.0 16
11MW9 Siduli UG June First 11-Jun-15 7.03 36 366 <2.0 20
11MW9 Siduli UG September First 14-Sep-15 8.26 28 364 <2.0 24
11MW9 Siduli UG September Second 18-Sep-15 8.12 8 432 <2.0 16
11MW9 Siduli UG October First 14-Oct-15 7.98 10 482 <2.0 32
11MW9 Siduli UG October Second 30-Oct-15 8.36 <5 494 <2.0 16
11MW9 Siduli UG November First 02-Nov-15 8.36 11 488 <2.0 28
11MW9 Siduli UG November Second 27-Nov-15 8.54 6 518 <2.0 08
11MW9 Siduli UG December Second 29-Dec-15 8.50 8 448 <2.0 24
11MW9 Siduli UG January First 13-Jan-16 8.47 7 455 <2.0 08
11MW9 Siduli UG January Second 27-Jan-16 8.55 6 469 <2.0 16
11MW9 Siduli UG February First 09-Feb-16 8.24 8 739 <2.0 16
11MW9 Siduli UG February Second 23-Feb-16 8.16 18 726 <2.0 24
11MW9 Siduli UG March First 15-Mar-16 8.24 8 739 <2.0 24
11MW9 Siduli UG March Second 22-Mar-16 8.29 7 767 <2.0 12
Effluent Water Quality Standards (MoEF Schedule – VI Standards)
Parameters pH TSS TDS Oil & Grease COD
Limit 5.5-9.0 100 Not Specified 10 250

Environmental Statement (Form-V) for Cluster No. – 11 (Group of Mines) 2015-16
31
Annexure – III
EFFLUENT QUALITY (29 PARAMETERS) Cluster 11 11 11 11 11 11 11 11 11 11 11 Effluent
Water (MOEF
Schedule-VI Standard)
Station No 11MW1 11MW2 11MW3 11MW4 11MW5 11MW6 11MW7 11MW8 11MW9 11MW10 11MW11
Station Name
Haripur West Kenda OC Patch
New Kenda OC Patch
Lower Kenda
Chora Block Incline
Chora 7, 9 & 10 Pits
Bahula UG
C L Jambad UG
Siduli UG
Khandra UG
Shankarpur UG
Month December
December
December
December
December
December
December
December
December
December
December
Fortnight First First First First First First First First First First First
Date of Sampling
14-Dec-15
14-Dec-15
07-Dec-15
07-Dec-15
14-Dec-15
14-Dec-15
09-Dec-15
09-Dec-15
14-Dec-15
14-Dec-15
03-Dec-15
Colour 3 4 5 3 3 3 3 3 4 3 3 Unobjectionable
Odour Unobjectionable
Unobjectionable
Unobjectionable
Unobjectionable
Unobjectionable
Unobjectionable
Unobjectionable
Unobjectionable
Unobjectionable
Unobjectionable
Unobjectionable
Unobjectionable
TSS 7 10 12 10 14 7 16 5 12 8 10 100.0
pH 8.12 8.04 8.00 8.13 8.09 8.11 8.24 8.09 8.17 8.0 8.21 5.5-9.0
Temperature(Deg C)
21.78 22.00 22.03 21.94 21.88 21.72 21.91 22.0 22.4 22.1 21.98 Shall not exceed 50C above the receiving
water temp
Oil & Grease
<2.0 <2.0 <2.0 <2.0 <2.0 <2.0 <2.0 <2.0 <2.0 <2.0 <2.0 10.0
Total Residual Chlorine
0.03 0.03 <0.02 <0.02 0.03 0.03 <0.02 <0.02 <0.02 <0.02 0.02 1.0
Ammonical Nitrogen
0.45 0.47 0.42 0.58 0.48 0.62 0.56 0.54 0.48 0.59 0.47 50.0
Total Kjeldahi Nitrogen
1.64 1.52 1.26 1.32 1.38 1.42 1.58 1.72 1.67 1.53 1.42 100.0
Free Amonia
<0.4 <0.4 <0.4 <0.4 <0.4 <0.4 <0.4 <0.4 <0.4 <0.4 <0.4 5.0
BOD 3 5 4 4 5 5 4 4 5 3 5 30.0
COD 16 24 32 24 24 16 24 16 16 24 32 250.0
Arsenic <0.005 <0.005 <0.005 <0.005 <0.005 <0.005 <0.005 <0.005 <0.005 <0.005 <0.005 0.2
Lead <0.005 <0.005 <0.005 <0.005 <0.005 <0.005 <0.005 <0.005 <0.005 <0.005 <0.005 0.1
Hexavalent Chromium
0.04 0.03 0.02 0.03 0.04 0.03 0.02 0.03 0.02 0.02 0.03 0.1
Total Chromium
0.06 0.04 0.04 0.05 0.06 0.04 0.03 0.05 0.04 0.04 0.04 2.0
Copper 0.04 0.03 0.03 0.03 0.04 0.03 0.03 0.04 0.03 0.03 0.03 3.0
Zinc 0.03 0.05 0.04 0.05 0.03 0.05 0.04 0.03 0.06 0.06 0.05 5.0
Selenium <0.005 <0.005 <0.005 <0.005 <0.005 <0.005 <0.005 <0.005 <0.005 <0.005 <0.005 0.05
Nickel <0.10 <0.10 <0.10 <0.10 <0.10 <0.10 <0.10 <0.10 <0.10 <0.10 <0.10 3.0
Fluoride 0.59 0.71 0.67 0.78 0.55 0.72 0.80 0.63 0.54 0.75 0.46 2.0
Dissolved Phosphate
1.72 1.64 1.72 1.58 1.52 1.64 1.69 1.79 1.32 1.28 1.24 5.0
Sulphide 0.006 0.005 0.006 0.005 0.008 0.007 0.009 0.007 0.005 <0.005 0.008 2.0
Phenolics <0.001 <0.001 <0.001 <0.001 <0.001 <0.001 <0.001 <0.001 <0.001 <0.001 <0.001 1.0
Manganese 0.24 0.22 0.24 0.26 0.22 0.24 0.20 0.22 0.26 0.24 0.20 2.0
Iron 0.16 0.14 0.12 0.10 0.12 0.10 0.14 0.16 0.16 0.14 0.12 3.0
Nitrate Nitrogen
2.9 2.7 3.6 3.4 3.2 3.9 3.7 2.9 2.9 2.8 3.1 10.0
Cadmium <0.001 <0.001 <0.001 <0.001 <0.001 <0.001 <0.001 <0.001 <0.001 <0.001 <0.001 0.003
Total Dissolved
Solids
598 615 521 469 500 528 408 636 448 433 438 Not Specified

Environmental Statement (Form-V) for Cluster No. – 11 (Group of Mines) 2015-16
32
Annexure – III
GROUNDWATER QUALITY
Cluster No 11 11 11 11 11 11 Indian Drinking
Water Standard
(IS-10500)
Station No 11GW1 11GW2 11GW3 11GW4 11GW5 11GW6
Station Name
Dugwell at Moira
Kalimandir & backside of Manager's
office
Dugwell at Bahadurpur Panchayet
office
Dugwell at Singaran village of
Belbad OCP
Dugwell at Chichuria Dangal
Colony of S.B.Project
Dugwell at Shankarpur
village
Dugwell at Ananda
Ashram at Khandra village
Month May'15 May'15 May'15 May'15 May'15 May'15
Fortnight Second Second Second Second Second Second
Date of sampling
27-May-15 30-May-15 30-May-15 28-May-15 29-May-15 27-May-15
Colour,Hazen unit
Max
4 3 2 4 5 3 5
Odour Unobjectionable
Unobjectionable
Unobjectionable
Unobjectionable
Unobjectionable
Unobjectionable
Unobjectionable
Taste Agreeable Agreeable Agreeable Agreeable Agreeable Agreeable Agreeable
Turbidity,NTU Max
3.1 2.9 3.2 4.0 3.9 4.0 5
pH 7.66 7.61 8.14 6.55 7.65 7.50 6.5-8.5
Total Hardness
132 196 148 52 380 140 300.0
Iron <0.06 <0.06 <0.06 <0.06 <0.06 <0.06 0.30
Chlorides 146 43 28 25 92 40 250.0
Res Free chlorine
<0.02 <0.02 <0.02 <0.02 <0.02 <0.02 0.20
Dissolved Solids
708 260 241 104.4 533 198 500.0
Calcium 30.4 62.4 38.40 14.7 115.2 41.6 75.0
Copper <0.03 <0.03 <0.03 <0.03 <0.03 <0.03 0.05
Manganese
<0.02 <0.02 <0.02 <0.02 <0.02 <0.02 0.10
Sulphate 68 74 69 58 47 57 200.0
Nitrate 9.30 8.86 10.19 12.40 9.75 11.52 45.0
Fluoride 0.62 0.48 0.38 0.57 0.78 0.54 1.0
Selenium <0.005 <0.005 <0.005 <0.005 <0.005 <0.005
Arsenic <0.005 <0.005 <0.005 <0.005 <0.005 <0.005 0.05
Lead <0.005 <0.005 <0.005 <0.005 <0.005 <0.005 0.05
Zinc <0.01 <0.01 <0.01 <0.01 0.06 <0.01 5.00
Hex Chromium
<0.01 <0.01 <0.01 <0.01 <0.01 <0.01 0.05
Boron <0.01 <0.01 <0.01 <0.01 <0.01 <0.01 1.00
Coliforms (MPN)
Nil Nil Nil Nil Nil Nil Nil
Phenolics <0.001 <0.001 <0.001 <0.001 <0.001 <0.001 0.001
Alkalinity 236 208 288 112 172 208 200.0

Environmental Statement (Form-V) for Cluster No. – 11 (Group of Mines) 2015-16
33
Annexure – IV
GROUNDWATER LEVEL
Station No
Station Name Month Fortnight Date of Sampling
Ground Water Level
BGL (mtr)
11GWL1 Dugwell at Moira Kalimandir & backside of Manager's office
November Second 19-Nov-15 2.00
11GWL1 Dugwell at Moira Kalimandir & backside of Manager's office
January First 11-Jan-16 1.80
11GWL1 Dugwell at Moira Kalimandir & backside of
Manager's office
May Second 29-May-15 1.85
11GWL1 Dugwell at Moira Kalimandir & backside of Manager's office
August First 04-Aug-15 0.65
11GWL2 Dugwell at Bahadurpur Panchayet office November Second 18-Nov-15 6.55
11GWL2 Dugwell at Bahadurpur Panchayet office January Second 30-Jan-16 8.20
11GWL2 Dugwell at Bahadurpur Panchayet office May Second 29-May-15 9.30
11GWL2 Dugwell at Bahadurpur Panchayet office August First 11-Aug-15 4.40
11GWL3 Dugwell at Singaran village of Belbad OCP November Second 18-Nov-15 6.35
11GWL3 Dugwell at Singaran village of Belbad OCP January First 14-Jan-16 7.40
11GWL3 Dugwell at Singaran village of Belbad OCP May Second 29-May-15 8.75
11GWL3 Dugwell at Singaran village of Belbad OCP August First 11-Aug-15 2.80
11GWL4 Dugwell at Chichuria Dangal Colony of S.B.
Project
November Second 21-Nov-15 6.40
11GWL4 Dugwell at Chichuria Dangal Colony of S.B.
Project
January Second 30-Jan-16 3.35
11GWL4 Dugwell at Chichuria Dangal Colony of S.B. Project
May Second 20-May-15 5.15
11GWL4 Dugwell at Chichuria Dangal Colony of S.B.
Project
August Second 24-Aug-15 4.15
11GWL5 Dugwell at Shankarpur village November Second 19-Nov-15 5.80
11GWL5 Dugwell at Shankarpur village January First 11-Jan-16 6.40
11GWL5 Dugwell at Shankarpur village May Second 20-May-15 10.40
11GWL5 Dugwell at Shankarpur village August First 05-Aug-15 2.05
11GWL6 Dugwell at Ananda Ashram at Khandra village November Second 19-Nov-15 7.15
11GWL6 Dugwell at Ananda Ashram at Khandra village January Second 18-Jan-16 7.16
11GWL6 Dugwell at Ananda Ashram at Khandra village May Second 20-May-15 8.25
11GWL6 Dugwell at Ananda Ashram at Khandra village August First 04-Aug-15 0.45

Plate – 1
West Bengal
Burdwan District
Map Showing Location of Cluster -11
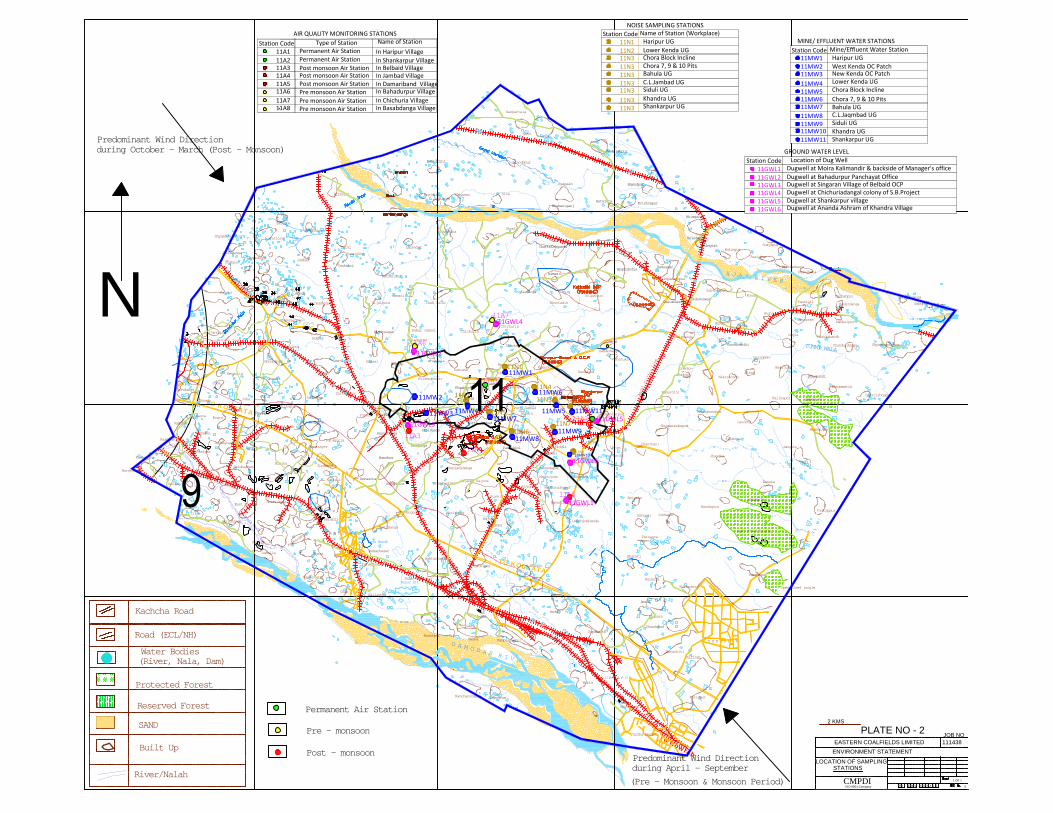
TO KOLKATA
TO KOLKATA
N
A
n
d
a
l
S
a
i
t
h
i
a
L
i
n
e
E
.
R
.
A
n
d
a
l
L
o
o
p
D A M O D A R R I V E R
A J A Y R I V E R
Bhimgara
RS
Pandaveswar
TUMNI NALA
RS
Raniganj
RS
Andal
RS
Waria
RS
Jamuria
RS
Ikra
RS
Toposi
RS
Sonachora
RS
Kajora
RS
Siduli
RS
Ukhra
N
u
n
i
a
K
h
a
l
S
i
n
g
a
r
a
n
N
a
l
a
Napur Bil
Suka Bandh
Raja Bandh
To Howrah
E.Rly.Toposi-Baraboni Chord
87°25'87°20'87°15'87°10'87°05'87°00'
Damoda
R A N I G A N J
Prembazar
Lalbazar
Patharchur
Sankhari
Kumardiha
Parui
D U R G A P U R
Waria
Debogram
Ramchandrapur
Ramprasadpur
Pabra
Baska
Madanpur
Fatakduar
Searsol
Mahabir
Narainkuri
Egara
K
a
n
k
a
r
d
a
n
g
a
Amkula
Damalia
Amritnagar
East Nimcha
Harabhanga
Tirat
Chelad
Belebathan
Jamari
Chalbalpur
Jaykaynagar
Bogra
Chapui
Saora
Ratibati
Kashinathpur
Kumardiha
Katagoria
Ranisayer
Bijpur
Mithapur
Satgram
Berala
Balanpur
Mondalpur
Banali
Joba
Kendulia
Joba
Chanda
Shivdanga
Kaithi
Sripur
Baijantipur
Akhalpur
Damodarpur
Sekpur
Ikra
Sarthakpur
Hormadanga
Nandi
Jambad
Sattore
Taltore
Layekdanga
Shibpur
Jhiladanga
Shyamsunderpur
Mayabazar
Srikrishnapur
Shyamsundarpur
Chandardanga
Benebandi
Palashdanga
Madhaipur
Haderdanga
Madhabpur
Pansiuli
Khorkedanga
Parulbona
Babupur
Barajora
Samuldihi
Jamalpur
Binodepur
NabasanBrajdihi
Kankartala
Rasa
Hazaratpur
Lauberia
Sira
Bhabaniganj
PalpainMamudpur
Krishnapur
Suryapur
Rasidpur
Ratanpur
Isgara
Beledanga
Bhimgara
Pratappur
Kamalpur
D U R G A P U R
Bhiringi
Benachiti
Dhandabad
Kansara
Kurladanga
Amrai
Kurunia
Bharati
Patsaora
Sarpi
Banguri
Amlauka
Ichhapur
Banshgora
Bansia
Madhaiganj
Jamgora
Jhanjra
Chanchani
Shyamsundarpur
Tilaboni
Kalikapur
Laudoha
Nabaghanapur
Kumardihi
Kajora
Goenka-
Nakrakonda
Joalbhanga
Sannabandhi
Palasbon
Sirsa
Balijuri
Laskarbandh
Gogla
Banagram
Nutandanga
Gogla
Danya
Mahal
Konda
Baidyanathpur
Gobindapur
Ramnagar
Konda
Chora
Pure Jambad
Haripur
Khaskenda
North Jambad
Basabdanga
Bhaluka
Hansdiha
Dahuka
Chichuria
Chichuria
Dobrana
Kumarkhela
Haripur
Chora
Nutan Madanpur
Baktarnagar
Andal
Palasban
Babuisol
Gopalmath
Andal
BhadurLachipur
Ballavpur
Kumarbazar
Madhusudanpur
Damariband
Mahira
Dakshinkhanda
Mukundapur
Madhujore
Gajadar Kajora
Khas Kajora
Pure Kajora
Kajora
Shankarpur
Bahula
Ukhra
Khandra
Siduli
Siduli
Parashkol
Harishpur
Beniadidanga
Dhandardihi
Mangalpur
Kuldanga
New Konda
Shaldanga
Belbaid
Kunustoria
Toposi
Banshra
Amrasota
Jot Janki
Bijaynagar
Dhasal
Dhasal
Krishnanagar
Bahadurpur
Chakdola
Nimsa
Sonpur Bazari
Kumar Jamsol
Jamsol
Hijalgora Chak Tulsi
Jawdanga
Khottadih
Bilpahari
Angargodia
Kendra
Chattrishganda
Shymla
Bhuri
Bagdiha
Birkulti
9
11E
A
S
T
E
R
N
R
A
I
L
W
A
Y
M
a
i
n
UKHARA PF
UKHARA PF
Nimcha
L
i
n
e
(
E
l
e
c
t
r
i
f
i
e
d
)
Narandhaura
Chak
Faridpur
Pursha Market
Dalurband
Open Mixed jungle
Open Mixed jungle
Jirdanga
NH-2
Jhatidanga
Rangamatia
Kachcha Road
Protected Forest
Reserved Forest
SAND
Built Up
Road (ECL/NH)
Water Bodies
(River, Nala, Dam)
River/Nalah
EASTERN COALFIELDS LIMITED
LOCATION OF SAMPLING
JOB NO
CMPDIISO 9001 Company
R I NE V XXX X 21
1 OF 1
0
STATIONS
ENVIRONMENT STATEMENT
111438
2 KMS
PLATE NO - 2
Permanent Air Station
Pre - monsoon
Post - monsoon
Predominant Wind Direction
during October - March (Post - Monsoon)
Predominant Wind Direction
during April - September
(Pre - Monsoon & Monsoon Period)
11A3
11A4
11A5
11A6
11A7
11A8
11A1
11A2
Station Code Type of Station Name of StationAIR QUALITY MONITORING STATIONS
11A1 Permanent Air Station In Haripur Village11A2
Post monsoon Air StationIn Shankarpur Village
11A3 In Belbaid Village11A4 In Jambad Village11A5
Pre monsoon Air StationIn Damariband Village
11A6 In Bahadurpur Village11A7 In Chichuria Village
Post monsoon Air StationPost monsoon Air Station
Pre monsoon Air StationPre monsoon Air Station
Station Code Name of Station (Workplace)NOISE SAMPLING STATIONS
11N1 Haripur UG11N2 Lower Kenda UG11N3 Chora Block Incline
Station Code Mine/Effluent Water StationMINE/ EFFLUENT WATER STATIONS
11MW1 Haripur UG11MW2 West Kenda OC Patch
Station Code Location of Dug WellGROUND WATER LEVEL
11GWL1 Dugwell at Moira Kalimandir & backside of Manager's office11GWL2 Dugwell at Bahadurpur Panchayat Office11GWL311GWL411GWL5 Dugwell at Shankarpur village
Dugwell at Singaran Village of Belbaid OCPDugwell at Chichuriadangal colony of S.B.Project
Permanent Air Station
11A8 In Basabdanga Village
11N311N311N311N311N311N3
Chora 7, 9 & 10 PitsBahula UGC.L.Jambad UGSiduli UGKhandra UGShankarpur UG
11MW311MW411MW511MW611MW711MW811MW911MW1011MW11
New Kenda OC PatchLower Kenda UGChora Block InclineChora 7, 9 & 10 PitsBahula UGC.L.Jaqmbad UGSiduli UGKhandra UGShankarpur UG
11GWL6 Dugwell at Ananda Ashram of Khandra Village
11N1
11N2 11N3
11N4
11N5
11N611N7
11N8
11N9
11MW1
11MW2
11MW3 11MW4 11MW5
11MW6
11MW7
11MW811MW9
11MW11
11MW10
11GWL1
11GWL2
11GWL3
11GWL4
11GWL5
11GWL6