Leadership in the Niger Delta Region of Nigeria - Digital ...
Upload
khangminh22Category
view
2download
0
Oloro & al./ Appl. J. Envir. Eng. Sci. 6 N°2(2020) 125-134
125
Environmental Impact Assessment of Drilling Fluid in Niger Delta
J.O. Oloro(a)
, D.E Akpotu(b)
(a) Chemical and Petroleum Engineering, Faculty of Engineering, Delta State University, Nigeria.
(b) Drilling Laboratory of Chemical and Petroleum Engineering, Faculty of Engineering, Delta State
University, Nigeria.
Corresponding author. E-mail : [email protected]
Received 24 Apr 2020, Revised 29 May 2020, Accepted 14 Jun 2020
Abstract
Objectives of this study are to carry out an environmental impact assessment of drilling fluid with
emphasis on a case study of Oben Oil field, RIG 201.This field is located in Niger Delta of Nigeria. In
carrying out this study,soil samples and water from Oben oil field were analysed to determine
concentrations of heavy metals Physio-chemical characteristics were also examined and the results
were compared with the Department of Petroleum Resources (D.P.R) guidelines and World Health
Organization (W.H.O) standard. The results of the test showed that the values of the wastewater were
greater than the values of the treated water because it has undergone treatment and can be discharged
into the environment. Therefore, the waste water was above the acceptable recommended limit. Also,
the values of the soil sample around the drill site had a very high concentration of heavy metals
compared to that of the control sample. The study showed that the existence of high concentration of
contaminants in the spent drilling fluid from the reserve pit and as a result of the analysis carried out it
is then recommended that the waste resulting from drilling operations should be properly treated
before disposal into the environment.Objectives of this study are to carry out an environmental impact
assessment of drilling fluid with emphasis on a case study of Oben Oil field, RIG 201.This field is
located in Niger Delta of Nigeria .
Keywords: Disposal; Metals; Pit; Waste Soil; Drilling Mud.
1. Introduction
Drilling fluids are used generally in the upstream oil and gas industry and are complex mixtures
including of solids and liquids, as well as base oils and brines [1]. Drilling fluid, therefore, is generally
a combination of water, clay, weighing materials and a variety of chemicals to adjust the properties of
the fluids to meet the requirement of each well. The fluid has several roles throughout the drilling

Oloro & al./ Appl. J. Envir. Eng. Sci. 6 N°2(2020) 125-134
126
process including removing cuttings, cooling and lubricating the drill bit and carrying various
chemicals down the borehole [2]. Therefore, the key to making the rotary drilling system work is to
circulate drilling fluid (or drilling mud) consciously down the hole through drilling pipe and out
through the annulus back to the surface. The fluid is washed by passing over a shale shaker, where
unwanted solids are removed and the resultant cleaning fluid is then re-injected into the well [3].
Drilling operations are basically classified into offshore drilling and onshore drilling. Some
environmental difficulties have been connected with drilling fluid. A variety of wastes are generated in
drilling oil and gas wells including drill cuttings and used drilling fluids. The skill of mud mixing and
treatment is generally recognized as a major source of pollution from various pollutants such as
barium, mercury, and cadmium, diesel (from lubricants, spotting fluids and oil-based mud cuttings),
arsenic and formaldehyde (from biocides). However, the board environmental problems confronted by
the oil and gas exploration and production industry are revealed at both local and international levels.
The disruption of the ecological balance through drilling operation occurs through surface discharge of
pollutants from various activities affecting the environment. Environmental management of drill sites
is a serious problem to combat drilling pollution both at onshore and offshore [4]. Therefore, discharge
of untreated drilling effluents into seas, rivers or land constitutes a serious health hazard and is
detrimental to agriculture and fishes, also water can get contaminated. However, the most important
concern relates to the degradation of land, air, and water around the drill sites. Therefore, there is need
to conduct a comprehensive risk assessment when deciding the type of drilling fluid method to use
considering its effect on the environment. Drilling waste can have a different potential impact
depending on where it is discharged [5-6].
The actions involved in crude oil exploration and production normally have one impact or the other on
the environment. However, the highest effect arises from discharge of wastes into the environment in
concentrations that were not naturally found such environment. The wastes produced during petroleum
production can be generally classified into liquid (i.e. produced water and oil) and solid (i.e. drilling
mud and cuttings) [7-9].
Many of the additives used as the drilling mud are supposed to be toxic and be regulated. Drill mud
and cuttings may be oil-based or water-based in nature and are associated with changing
concentrations of hydrocarbons and heavy metals [10].
Drill cuttings have been observed to contain a wide range of organic and inorganic traces especially
when oil-based mud is used [11-13], Used up drilling fluids and cuttings account for about 2% of the
entire waste volume while other associated wastes like produced formation water contribute over 90%
of the total waste volume.
One of the immediate physical environments that suffer the direct impact of drilling wastes disposal is
onshore and offshore. The onshore environment includes the swampy, freshwater and the dry land
environments all of which have their peculiar features and ecological characteristics. Although,
drilling mud used for drilling onshore oil wells are disposed of in reserve pits. However, due to a large
number of drill wastes, most of the mud and cuttings can get into the adjacent soil and water bodies

Oloro & al./ Appl. J. Envir. Eng. Sci. 6 N°2(2020) 125-134
127
during precipitation and run-off. The heavy metal and hydrocarbon contents of the onshore drilling
wastes are capable of polluting the environment with subsequent effects on human health. Though,
this depends on the type, nature, and concentrations of heavy metals and hydrocarbons [14-15].
Drilling fluids become contaminated and must be replaced because of down-hole condition; therefore,
the fluids are displaced periodically. The most common practice is either dewatering of reserve pit
contents and subsequent backfilling with pits or land farming the reserve pit contents into the soil
around the drilling location. Therefore, it is important to examine whether it is possible to prevent
and/or avoid degradation of the environment where such despoliation had occurred.
Objectives of this study are to carry out an environmental impact assessment of drilling fluid with
emphasis on a case study of Oben Oil field, RIG 201.The aim is to determine effective measures to be
taken to avert the impact of drilling fluid on the environment. This work will reveal the impact of
indiscriminate discharge of drilling fluid by oil companies operating upstream and further discourage
them from such practices. The work is restricted or designed for the study of the effect of drilling fluid
in the environment (Onshore field) and to make certain recommendation that will reduce or stop the
undiscriminating discharge of untreated drilling waste.
2. Materials and Methods
2.1 Sample and Sampling Method
The samples used in this study is from a drilling rig site at Oben, Sapele, Delta State about 78
kilometers along Benin Road with coordinates of latitude 50 31
’ 0
’N and 5
0 45
’ 0
’E.
Two soil samples were collected. One of the soil samples was collected few meters from the reserve
pit (waste pit) at a depth of 3ft (drill site sample) and the other sample (control sample) was collected
at another location. The samples were kept in a container and were labeled sample A and sample B
respectively. Also, water from the reserve pit (waste pit) was collected and treated water from the
treatment plant which can be discharged into the environment was labeled wastewater and treated
water respectively. Both soil and water samples were collected at the rig site during the actual drilling
operation for analysis in order to evaluate their toxicity and possible environmental impacts.The
parameters analyzed were pH, salinity, electrical conductivity, Total Dissolved Solids (TDS) and
heavy metals such as iron, copper, lead, chromium, zinc, etc.
The equipment listed in Table 1 was used for the study.
Oloro & al./ Appl. J. Envir. Eng. Sci. 6 N°2(2020) 125-134
128
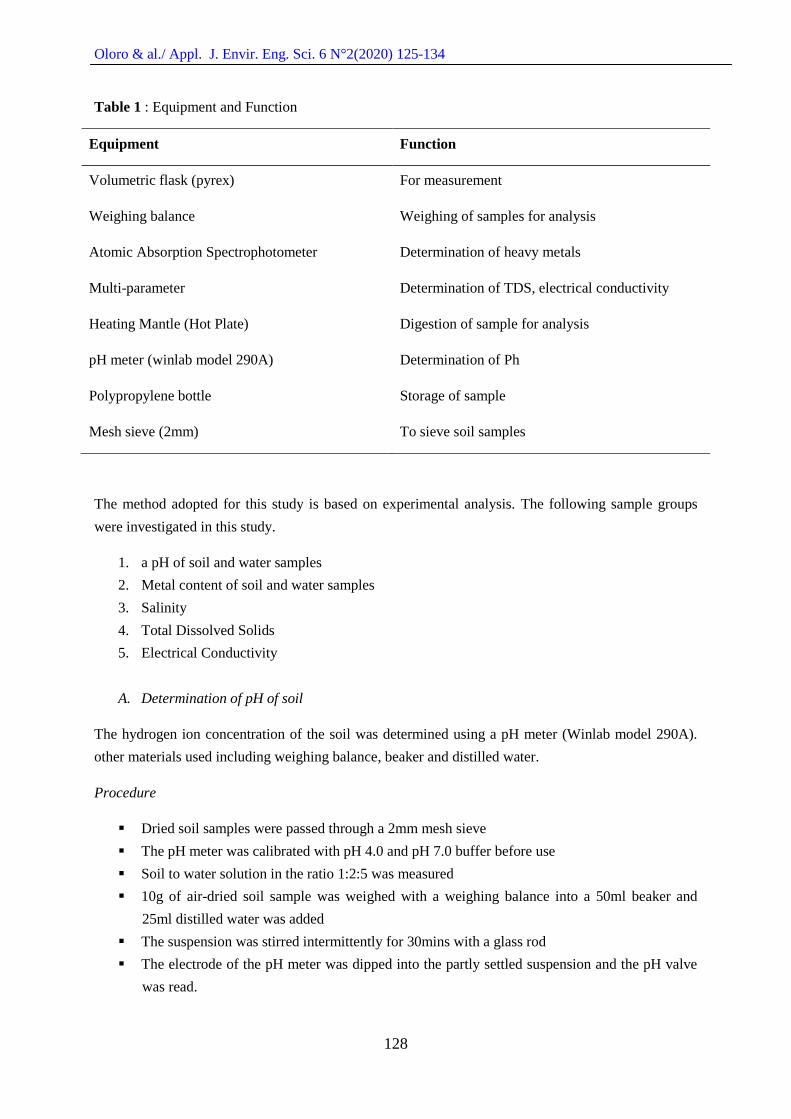
Table 1 : Equipment and Function
Equipment Function
Volumetric flask (pyrex) For measurement
Weighing balance Weighing of samples for analysis
Atomic Absorption Spectrophotometer Determination of heavy metals
Multi-parameter Determination of TDS, electrical conductivity
Heating Mantle (Hot Plate) Digestion of sample for analysis
pH meter (winlab model 290A) Determination of Ph
Polypropylene bottle Storage of sample
Mesh sieve (2mm) To sieve soil samples
The method adopted for this study is based on experimental analysis. The following sample groups
were investigated in this study.
1. a pH of soil and water samples
2. Metal content of soil and water samples
3. Salinity
4. Total Dissolved Solids
5. Electrical Conductivity
A. Determination of pH of soil
The hydrogen ion concentration of the soil was determined using a pH meter (Winlab model 290A).
other materials used including weighing balance, beaker and distilled water.
Procedure
Dried soil samples were passed through a 2mm mesh sieve
The pH meter was calibrated with pH 4.0 and pH 7.0 buffer before use
Soil to water solution in the ratio 1:2:5 was measured
10g of air-dried soil sample was weighed with a weighing balance into a 50ml beaker and
25ml distilled water was added
The suspension was stirred intermittently for 30mins with a glass rod
The electrode of the pH meter was dipped into the partly settled suspension and the pH valve
was read.
Oloro & al./ Appl. J. Envir. Eng. Sci. 6 N°2(2020) 125-134
129
B. Determination of pH of water
For the water samples, the electrodes were dipped into the samples directly and reading taken.
C. Determination of Heavy Metals in soil
Equipment and Materials used
Atomic Absorption Spectrophotometer, weighing balance, conical flask, filter paper.
Procedure
The soil sample which had been dried at room temperature was sieved with 2mm mesh sieve.
2.5g of the soil was weighed with a weighing balance into 300cm3 conical flask.
1ml of concentrated HCLO4, 3ml conc. HNO3 and 1ml conc. HF was added and heated under
a fume hood until dense white fumes appeared.
It was allowed to cool.
40ml distilled water was added and the solution was completely filtered with a filter paper into
a 100ml volumetric flask.
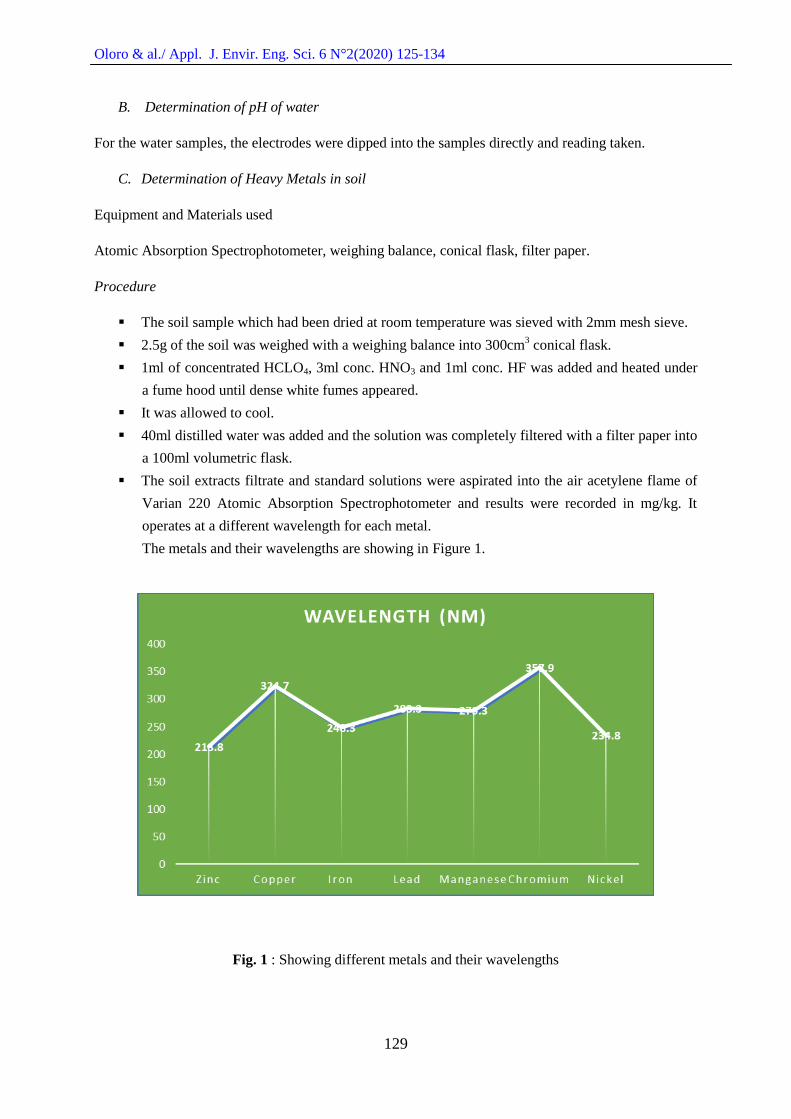
The soil extracts filtrate and standard solutions were aspirated into the air acetylene flame of
Varian 220 Atomic Absorption Spectrophotometer and results were recorded in mg/kg. It
operates at a different wavelength for each metal.
The metals and their wavelengths are showing in Figure 1.
Fig. 1 : Showing different metals and their wavelengths
Oloro & al./ Appl. J. Envir. Eng. Sci. 6 N°2(2020) 125-134
130
D. Determination of heavy metals in water
Equipment and materials used
Atomic Absorption Spectrophotometer, hot plate, beaker, polypropylene bottle.
Procedures
100ml of a well-mixed water sample was measured into 150ml beaker.
5.0ml of conc. HNO3 was added.
The solution was heated on a hot plate to near dryness using a low to medium heat.
The beaker was returned on the hot plate and the temperature of the hot plate increased from
medium to high.
Heating continued and HNO3 was added until light-colored residue was obtained.
1-2ml of conc. HNO3 was added to the residue.
The residue was filtered into 100ml volumetric flask to remove silicate and other insoluble
materials and made up with distilled water.
The solution was stored in 125ml polypropylene bottle and trace metals were tested using
Atomic Absorption Spectrophotometer.
E. Determination of Salinity as Chloride (cl)
100ml of the sample was measured into a 250ml conical flask.
1ml of K2CrO4 was added.
Titrate with 0.01N AgNO3.
The color changes from yellow to reddish-brown at end-point.
F. Determination of calcium
50ml of the sample was measured into 150ml conical flask.
1ml of KOH was added.
4 drops of calcon indicator were also added.
Titrate with 0.01N ehtylenediaminetetraacetic acid (EDTA).
The color changes from wine to blue at an endpoint.
G. Determination of total dissolved solids and electrical conductivity
The total dissolved solids and electrical conductivity were determined using a multi-parameter
3. Results and discussion
This section covers the result obtained in the experiment that was carried out. The results obtained in
the experiment were compared with both the Department of Petroleum Resources (DPR) 1991
guidelines and World Health Organization Standards (Burke C.J and J.A. Veil J.A, 1995) [13].
The results of water analysis are shown in Table 2
Oloro & al./ Appl. J. Envir. Eng. Sci. 6 N°2(2020) 125-134
131
Table 2 : Showing results for heavy metals in water
Parameters (mg/l) Treated Water Waste Water DPR/WHO Standard
Iron 0.03 0.6 0.3
Nickel BDL 0.11
Manganese BDL 0.07 0.05
Chromium BDL BDL 0.05
Zinc 0.08 0.36 3
Copper 0.02 1.9 1.0
Lead BDL 0.05 0.5
BDL means Below Detection Limit <0.001
From Table 3, the values obtained from the analysis of the wastewater are higher compared to that of
the treated water. It indicates that the treated water has undergone treatment and can, therefore, be
discharged into the environment because it is within the acceptable limit of DPR guidelines and WHO
standard. The wastewater on the other hand is not within an acceptable limit.
The concentration of iron in the wastewater (0.6mg/l) is higher than the treated water (0.03mg/l) and
also higher than the recommended 0.3mg/l [16]. Nickel has no comparison in the DPR guideline.
Although, the concentration of the wastewater is also higher than the treated water. Manganese
concentration is higher in wastewater (0.07mg/l) than treated water (<0.001mg/l) and fall short in the
recommended DPR/WHO standard. Chromium is within the acceptable limits recommended by
DPR/WHO for both treated water and wastewater. The value of zinc and copper is also higher for
wastewater when compared to the treated water and they are both below acceptable limit. Lead within
acceptable limit [17]. The concentration of pH for the wastewater was found to be 5.48. The pH value
falls short in meeting the recommended 6.5-8.5 for the wastewater. Therefore it is acidic.
The entire dissolved solids in the wastewater (4700mg/l) is greater compared to the treated water
(441mg/l). 4700mg/l is not within the commended 500mg/l – 1500mg/l by WHO. The wastewater
(3518mg/l) has a higher salt content when compared with that of the treated water (654.5mg/l). The
calcium content in the wastewater (75.62mg/l) is slightly within acceptable limit (75mg/l) of DPR
guidelines and WHO [18-23].
Oloro & al./ Appl. J. Envir. Eng. Sci. 6 N°2(2020) 125-134
132
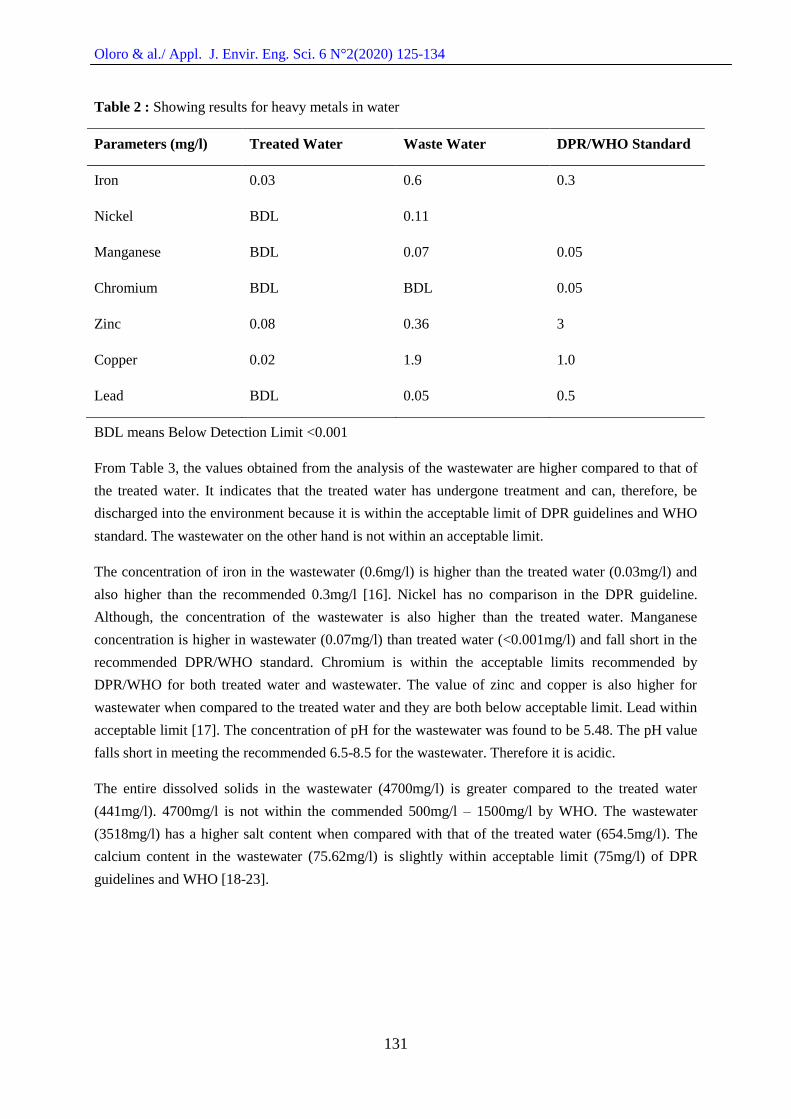
Figure 2 : Heavy metals in soil
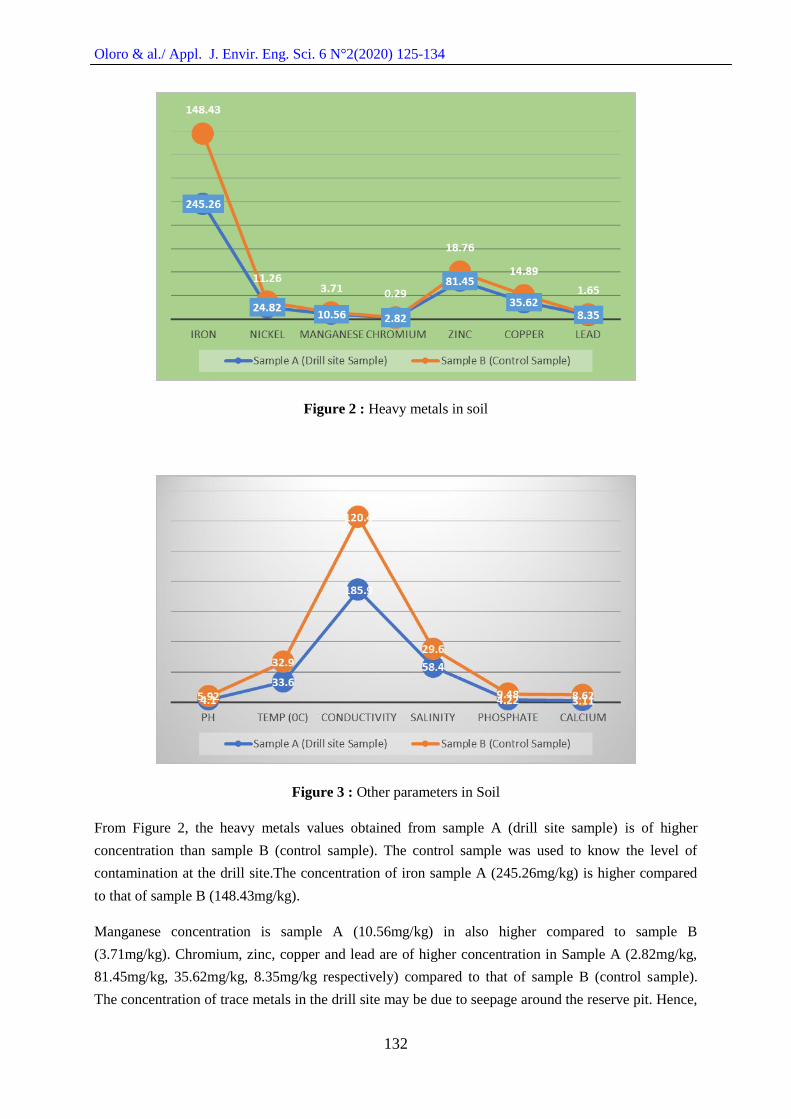
Figure 3 : Other parameters in Soil
From Figure 2, the heavy metals values obtained from sample A (drill site sample) is of higher
concentration than sample B (control sample). The control sample was used to know the level of
contamination at the drill site.The concentration of iron sample A (245.26mg/kg) is higher compared
to that of sample B (148.43mg/kg).
Manganese concentration is sample A (10.56mg/kg) in also higher compared to sample B
(3.71mg/kg). Chromium, zinc, copper and lead are of higher concentration in Sample A (2.82mg/kg,
81.45mg/kg, 35.62mg/kg, 8.35mg/kg respectively) compared to that of sample B (control sample).
The concentration of trace metals in the drill site may be due to seepage around the reserve pit. Hence,
Oloro & al./ Appl. J. Envir. Eng. Sci. 6 N°2(2020) 125-134
133
a very high concentration on the area around the drill site. Although, the pH of both samples are below
the recommended 6.5-8.5 DPR and WHO [17]. Therefore, both samples are acidic as shown in Figure
3.
4. Conclusion
In the experiment carried out, the following conclusions were made. The study revealed the presence
of high concentration of contaminants in the spent drilling fluid from the reserve pit (waste pit). The
detailed trace metal investigation helps to establish the degree of toxicity before discharge into the
environment because when these metals are above stipulated regulatory limits, they must impact on
the environment.
It was observed that the concentration of waste pit sample was higher and has to be treated before
discharge into the environment. The high metal content of the soil samples around the reserve pit may
have resulted due to seepage from the reserve pit or move by rainfall and deposited on soil, also
contaminating the underground water. Although, some of the heavy metals were within acceptable
limits and some other parameters were still very high. Hence continuous discharge of spent drilling
fluid and dewatering of pits without adequate treatment will further damage the environment. As a
result of the analysis carried out at Oben oil field (Rig 201) it is therefore recommended that waste
(spent drilling fluid and cuttings) resulting from drilling operations should be properly treated before
disposal into the environment. Other recommendation includes;
1. Companies should practice an effective drilling fluid waste management plan.
2. The sludge left at the end of the drilling process should be backfilled with the excavated material
on-site and permanently buried.
3. Companies should adhere strictly to the guiding rules and regulations in order to prevent
environmental degradation from drilling operations.
Nomenclature
CMC – Carboxylic acid
HClO4 – Hydrogen Iodide
HNO3 – Nitric Acid
HF – Hydrogen Flouride
K2CrO4 – Potassium Chromate
AgNO2 – Silver Nitrate
KOH – Potassium Hydroxide
EDTA – Ethylenediaminetetraacetic acid
Oloro & al./ Appl. J. Envir. Eng. Sci. 6 N°2(2020) 125-134
134
References
1. S. Alison, and S.G. Karen, Institute of Occupational Medicine. August (2011).
2. B. Jenasen, J.E. Paulsan, O.I. Prebensen, H. Balzer, IADC/SPE Drilling Conference, 2-4 March, Dallas,
Texas, (2004).
3. S. M.D Ahammad,. N.V.R Nagalakshmi,. R. S Srigowri, G.Vasanth and S.K. Uma, Journal of
Advanced J Chemical Engineering, Department of Petroleum Engineering, GIET College of
Engineering, Rajahmundry, Andhra Pradesh, India, April 07,( 2017).
4. S.N.A Adaobi, and O.I. Omowunmi, American Journal of Engineering Research (AJER), 5(12) (2016)46-57.
5. S. I Onwukwe,. and M. S Nwakaudu, Inter. J. of Environmental Science and Development, 3(3)(2012).
6. 5. M. D Ahammad Sharif, N.V.R.Nagalakshmi, S.Srigowri Reddy , G.Vasanth and K.Uma Sankar ,
Adv Chem
7. B.Torgeir,K.Jarle,S.Steinar, Marine environmental Research, 92 (2013)154-169.
https://doi.org/10.1016/j.marenvres.2013.09.012
8. Eng (2017), 7:1 DOI: 10.4172/2090-4568.1000166.
9. 6. N.Stanley, T.Kiran , E.Paul, H.Colin, International Journal of Economy, Energy and Environment,
1(3) (2016)64-73,doi: 10.11648/j.ijeee.20160103.13.
10. B.HU , X.JIA , J.HU , D.XU , F.XIA , Y.LI . Environmental Research and Public Health, 14 (9) (2017)
1042,
11. 7. Y. Kumapayi, K. Bello, O. Adekomaya, A. Akintola, J. Dala, I. Mohammed, and O. Olafuyi, Pet.
Technol. Dev. J., 2 (2014)60-74.
12. B.Torgeir, K. Jarle, and S. Steinar, Marine Environmental Research, 92(2013)154-169.
13. M. Naeimavi, F.Khazali , M.Abdideh and S.Zohreh , The Open Petroleum Engineering Journal,
11(2018) 107-117.DOI: 10.2174/1874834101811010107.
14. J. M.Neff, S. Mckelvie, .and R.C.J.Ayers, Environmental Impacts of Synthetic Based , (2000).
15. B.S.Kinigoma, J. Appl. Sci. Environ. Mgt. 2001.
16. S. H.Q. Muhammad, A. Iftikhar, R.A.Sajid ,Pol. J. Environ. Stud., 28 (2) (2019) 785- 793, DOI:
10.15244/pjoes/85301.
17. DPR. Environmental guidelines and standards of the petroleum industry Nigeria, Ministry of
Petroleum Resources, Lagos. (1991)35-76.
18. D.F. Ogeleka and L.E. Tudararo-Aherobo , Bull. Env. Pharmacol. Life Sci., 2 (8) (2013)113-117
19. J. M. Neff, Composition, Environmental Fates and Biological Effects of Water-based
Drilling muds and cuttings discharged to the marine environment, 2005.
20. National Research Council. Drilling Discharges in the Marine Environment (1983).
21. G. M. Adewole, T. M. Adewale, E. and Ufuoma, Environmental aspect of oil and water-based drilling
mud and cuttings from Dibi and Ewan offshore well in the Nigeria Delta, (2010).
22. S. Madduri, et al. An Environmental Assessment of Oil and Gas Exploration (2003).
23. C. J. Burke, and J.A. Veil, Potential Environmental Benefits from Regulatory Considerations
of Synthetic Drilling mud, (1995).
Copyright © 2022 FDOKUMEN