Environmental Equity of Nations: a Reflection in the Scenario of Climate Change
22
Environmental Equity of Nations: a Reflection in the Scenario of Climate Change José Roberto Kassai School of Economics, Business Administration and Accountancy University of São Paulo (USP) Av. Prof. Luciano Gualberto, 908 / FEA-3 - Room 207 - Cidade Universitária - Sao Paulo - Brazil - CEP: 05508-900. Phone: 55 11 3091 5820 – extension 123 or 168 / Fax: 55 11 3813 0120. e-mail: [email protected] Rafael Feltran-Barbieri Environmental Program (PROCAM/USP). University of São Paulo (USP). Rua do Anfiteatro 181 Colmeia Favo 14 – Cidade Universitária – São Paulo – Brazil – CEP: 05508-900 Phone: 55 11 3091 3235/Fax 55 11 3091 34 96 email:[email protected] Francisco Carlos B. dos Santos Nuclear Energy Research Institute (IPEN) University of São Paulo (USP) Av Prof. Lineu Prestes, 2242 – Cidade Universitária – São Paulo – Brazil – CEP: 05508-900 Phone: 55 11 3133 9084/ Fax: 55 11 3133 9068 email: [email protected] Luiz Nelson Guedes de Carvalho School of Economics, Business Administration and Accountancy University of São Paulo (USP) Av. Prof. Luciano Gualberto, 908 / FEA-3 - Room 207 - Cidade Universitária - Sao Paulo - Brazil - CEP: 05508-900. Phone: 55 11 3091 5820 – extension 123 or 168 / Fax: 55 11 3813 0120. e-mail: [email protected] Yara Consuelo Cintra School of Economics, Business Administration and Accountancy University of São Paulo (USP) Av. Prof. Luciano Gualberto, 908 / FEA-3 - Room 207 - Cidade Universitária - Sao Paulo - Brazil - CEP: 05508-900. Phone: 55 11 3091 5820 – extension 123 or 168 / Fax: 55 11 3813 0120. e-mail: [email protected] Alexandre Foschine Yoko Civilization Research Institute (YCRI) Rua Paracatu, 1004 – Parque Imperial – Sao Paulo - Brazil - CEP: 04.302.022. Phone: 55 11 5594.1112 – e-mail: [email protected] Environmental Equity of Nations This exploratory multidisciplinary study aims to produce the Environmental Balance Sheet of Nations (EBSN) for the nations selected and a consolidated figure for the planet, based on the climate change and global warming scenarios appointed by the United Nations (UN) Intergovernmental Panel on Climate Change (IPCC). These scenarios cover a wide range of the main driving forces of future emissions, from demographic to technological and economic developments. The study considers the estimated forest resources and carbon emissions and captures for each country until 2020 and 2050, as forecasted in IPCC Special Reports on Emission Scenarios (SRES). A seven-country sample was selected, including BRIC countries (Brazil, Russia, India and China) and one developed country from each of the American, European and Asian continents (USA, Germany and Japan). Each country’s balance sheets were assessed in equivalent gross domestic product (GDP) units, adjusted by energy consumption per capita in tons of oil equivalent (TOE), as well as in megatons of carbon (MtonC), and converted to American dollars (US$) by the carbon credit prices suggested by the UN. The resulting environmental equity (EE) is a proposal to value the green GDP. The EBSN can complement other non-monetary frameworks, offering monetary figures, in an attempt to offer better comparability, transparency and governance. The research findings show that the citizens of the most developed countries, which presented higher energy consumption and higher GDP per capita at the start of this century, have been consuming resources not only from other nations, but also from future generations. The consolidated EBSN at 2050 appoints a deficit or bankruptcy situation, showing negative book value – liabilities in excess of assets – of US$2.3 thousand per year for each of the current 6.6 billion inhabitants and an environmental liability equivalent to a quarter of global GDP. Contents – 1. introduction – 2. Global Warming and the main relevant events – 3. Methodology and Research – 4. Results and Discussion – 5. Conclusions – 6. References
-
Upload
independent -
Category
Documents
-
view
3 -
download
0
Transcript of Environmental Equity of Nations: a Reflection in the Scenario of Climate Change
Environmental Equity of Nations: a Reflection in the Scenario of Climate Change
José Roberto Kassai
School of Economics, Business Administration and Accountancy University of São Paulo (USP) Av. Prof. Luciano Gualberto, 908 / FEA-3 - Room 207 - Cidade Universitária - Sao Paulo - Brazil - CEP: 05508-900.
Phone: 55 11 3091 5820 – extension 123 or 168 / Fax: 55 11 3813 0120. e-mail: [email protected]
Rafael Feltran-Barbieri Environmental Program (PROCAM/USP). University of São Paulo (USP).
Rua do Anfiteatro 181 Colmeia Favo 14 – Cidade Universitária – São Paulo – Brazil – CEP: 05508-900 Phone: 55 11 3091 3235/Fax 55 11 3091 34 96 email:[email protected]
Francisco Carlos B. dos Santos
Nuclear Energy Research Institute (IPEN) University of São Paulo (USP) Av Prof. Lineu Prestes, 2242 – Cidade Universitária – São Paulo – Brazil – CEP: 05508-900
Phone: 55 11 3133 9084/ Fax: 55 11 3133 9068 email: [email protected]
Luiz Nelson Guedes de Carvalho School of Economics, Business Administration and Accountancy University of São Paulo (USP)
Av. Prof. Luciano Gualberto, 908 / FEA-3 - Room 207 - Cidade Universitária - Sao Paulo - Brazil - CEP: 05508-900. Phone: 55 11 3091 5820 – extension 123 or 168 / Fax: 55 11 3813 0120. e-mail: [email protected]
Yara Consuelo Cintra
School of Economics, Business Administration and Accountancy University of São Paulo (USP) Av. Prof. Luciano Gualberto, 908 / FEA-3 - Room 207 - Cidade Universitária - Sao Paulo - Brazil - CEP: 05508-900.
Phone: 55 11 3091 5820 – extension 123 or 168 / Fax: 55 11 3813 0120. e-mail: [email protected]
Alexandre Foschine Yoko Civilization Research Institute (YCRI)
Rua Paracatu, 1004 – Parque Imperial – Sao Paulo - Brazil - CEP: 04.302.022. Phone: 55 11 5594.1112 – e-mail: [email protected]
Environmental Equity of Nations
This exploratory multidisciplinary study aims to produce the Environmental Balance Sheet of Nations (EBSN) for the nations selected and a consolidated figure for the planet, based on the climate change and global warming scenarios appointed by the United Nations (UN) Intergovernmental Panel on Climate Change (IPCC). These scenarios cover a wide range of the main driving forces of future emissions, from demographic to technological and economic developments. The study considers the estimated forest resources and carbon emissions and captures for each country until 2020 and 2050, as forecasted in IPCC Special Reports on Emission Scenarios (SRES). A seven-country sample was selected, including BRIC countries (Brazil, Russia, India and China) and one developed country from each of the American, European and Asian continents (USA, Germany and Japan). Each country’s balance sheets were assessed in equivalent gross domestic product (GDP) units, adjusted by energy consumption per capita in tons of oil equivalent (TOE), as well as in megatons of carbon (MtonC), and converted to American dollars (US$) by the carbon credit prices suggested by the UN. The resulting environmental equity (EE) is a proposal to value the green GDP. The EBSN can complement other non-monetary frameworks, offering monetary figures, in an attempt to offer better comparability, transparency and governance. The research findings show that the citizens of the most developed countries, which presented higher energy consumption and higher GDP per capita at the start of this century, have been consuming resources not only from other nations, but also from future generations. The consolidated EBSN at 2050 appoints a deficit or bankruptcy situation, showing negative book value – liabilities in excess of assets – of US$2.3 thousand per year for each of the current 6.6 billion inhabitants and an environmental liability equivalent to a quarter of global GDP. Contents – 1. introduction – 2. Global Warming and the main relevant events – 3. Methodology and Research – 4. Results and Discussion – 5. Conclusions – 6. References
2
1. Introduction: Research Problem, Objective, Hypothesis, Methodology and Justification Thousands of years were needed for humanity to reach its first billion of inhabitants, which occurred exactly in 1802, according to data by the United Nations - UN (www.un.org). The past two centuries were marked by an exponential growth, attributed to increased food production and improved health and basic sanitation conditions. It is estimated that the world population will reach nine billion in few decades, with an additional billion of in habitants every 15 years.
This population needs to eat, dress, live, move, warm itself and, maintained the current level of non-renewable energy consumption, it will continue producing greenhouse gases (GHG), which will consequently contribute to global warming. The International Energy Agency estimates that, in 2050, the global population’s energy needs will be 110% higher than in 2004, with a 30% growth in oil use (IEA, 2007).
GHG (Greenhouse gas) are substances that absorb part of the infrared radiation, mainly issued by the earth surface, and turn their escape into space more difficult. This impedes excessive heat loss into space, keeping the planet warm. The greenhouse effect is a natural phenomenon which has been happening since the formation of Earth and is necessary to maintain life on the planet. Mean temperature on Earth would be 33ºC lower, making life impossible on the planet, at least as we know it. The increase of these gases in the atmosphere has increased the potential of this natural phenomenon, causing a temperature increase – the phenomenon called climate change.
Markovitch (2006, p.13), the University of São Paulo former rector, in his book “Para mudar o Futuro - mudanças climáticas, políticas públicas e estratégias empresariais” [To change the Future – climate change, public policies and business strategies] says that some conclusions are frightening, and highlights researchers’ and experts’ inquiries:
“...does global warming affect human health and food supplies? To what extent does the use of fossil fuels aggravate the concentration of greenhouse gases? What are the alternatives to stabilize this concentration level? What is the probability that sea levels will rise and which are the most vulnerable areas? How do local, regional or national decisions result in global climate changes? How can the impacts of unsustainable consumption habits on nature be reduced? How can climate change decrease potable water supplies?”
The reflections on this subject have raised a few questions on whether the children and grandchildren of
this current generation would have to pay for this bill and if collective measures would be taken in order to minimize this environmental liability (Yasaka, 1997). Both questions were scrutinized in this research and both hypotheses seem applicable: future generations will have to pay the deficit of this bill and nations will take measures to achieve sustainable development, which is the case of the Kyoto protocol, for instance.
The Kyoto protocol is an international treaty that obliges signatory developed countries to reduce emissions of the six GHG (carbon dioxide-CO2, methane-CH4, nitrous oxide-N20, perfluorcarbons-PFCs, hydrofluorcarbons-HFCs, sulphur hexafluoride-SF6), decreasing the levels of 1990 by at least 5.2%. Negotiated in Kyoto – Japan – in 1997, it was opened for signing on March 16th 1998, ratified on March 16th 1999, and came into effect on March 16th 2005. Countries are supposed to comply as from 2008 through actual reductions or alternative means, such as investments in clean development mechanisms (CDM) and carbon credits.
The Clean Development Mechanism (CDM) is one of the flexibility mechanisms created by the Kyoto Protocol to help the greenhouse gas emission reduction or carbon capture (carbon sequestration) process by the countries as stated in its Attachment I. The goal of CDM is to assist the Parties in Attachment I to comply with their quantified commitments to limit and reduce greenhouse gas emissions and to assist Parties non listed in Attachment I of the United Nations Framework Convention on Climate Change (UNFCCC) to achieve sustainable development through the implementation of the respective project activity and ultimately contribute to the final goal of the convention.
The research problem of this study is to identify the amount citizens from all nations would have to pay, converting qualitative into monetary or accounting information. The study aims to elaborate the balance
2
3 sheet of individual nations for the sample selected and a consolidated version of the planet. In order to achieve this, intermediary objectives are to compile multidisciplinary information and to propose the classification of assets, liabilities and equity, according to those countries’ natural resources and respective carbon sequestration capacities.
The countries chosen for the research database represent the BRIC (Brazil, Russia, India, China) and developed countries from America, Europe and Asia continents (USA, Germany and Japan). The sample represents 32% of emerged area on the planet, 50% of the world population and 68% of global gross domestic product (GDP). It involves the main economic blocks, such as the European Union (EU), the South Cone Market (MERCOSUR), the Asia-Pacific Economic Cooperation (APEC), the North American Free Trade Agreement (NAFTA) and the Free Trade Area of the Americas (FTAA). It remarkably contains the five so-called “monster countries” (Kennan, 1994), which are the countries with continental territories, gigantic populations and important missions for the future of humanity.
The future scenarios are those established by the Intergovernmental Panel on Climate Change (IPCC) of
the United Nations (UM), more specifically the forecasts in the Special Reports on Emission Scenarios (SRES) A1B1 and A2B2, with the refinement proposed in this research, related to the simulation of other variables in carbon sequestering, such as: type of forests, deforestation and technology use.
The basic equation of accounting (assets minus liabilities equals equity) will direct the measurement of the variables involved, as it translates the balance principle between debits and credits, between origins and applications, between causes and effects. Instead of analytic records in ledgers, the inquired balance sheet method will be used (Kassai, 2004), a technique that permits the elaboration of financial statements in situations of scarce and imprecise information, similar to what frequently happens in micro and small companies.
What would these countries’ balance sheets be like? And the consolidated balance sheet for the planet? What is the classification of the country with the highest CO2 emission levels nowadays? What about each citizen’s per capita situation? These questions guide this research. The initial hypothesis is that the most developed countries tend to present deficit accounts and negative equity, which means liabilities in excess of assets.
As for the methodological aspects, this is a descriptive and exploratory research, obtaining information from official databases, bibliographic reviews and definitions of some constructs to reach the objective, which is the accounting treatment of these accounts.
This research is justified by the importance of the questions involved and, despite the pessimistic hypothesis, the elaborated financial statements may permit improved analyses and interpretations about the future of nations. In the same way as they are used in business meetings, they can contribute to the decision-making process by each citizen or by the manager of the planet. In line with Marcovitch’s opinion (2006, 26) “with one single goal: to change the future and permit the survival of the human species, giving new force to the concept that man also lives in the world, not only in his house, city or country.” 2. Global Warming and the main relevant events Although atmospheric studies in the 1960’s already revealed a significant increase in global temperature, the fact that this warming is provoked by human action only recently became a consensus. The conservative line argued until the start of the 21st century that the climate variations in the last two centuries were extreme repetitions of natural oscillations in glacial processes and the available technology did not permit assertions to the contrary. But the argument was destroyed in its foundations: ice cylinders more than three thousand meters long were taken from the poles through precise perforations. The bubbles of air preserved during the formation of ice layers during thousands of years were analyzed for their concentration of greenhouse gases, revealing the atmospheric composition of each age (Ramathan & Carmichael, 2008).
Thousands of “ice-core” studies through the exploration of these cylinders evidenced no significant change in GHG concentrations until 1750. However, the increase after this date was abrupt (Alley, 2000;
3
4 Osborn & Britta, 2006). Carbon Dioxide (CO2) concentrations increased from 280 ppm (particles per million) in 1750 to 430 ppm in 2005, while methane (CH4) and nitrous gases (N0x) jumped from 715 ppb (particles per billion) and 270 ppb to 1774 and 320 in the same period (Howweling et al., 2008; Osterberg et al., 2008). The double recognition that these gases actually worsen the greenhouse effect and that the sudden increase in their concentrations can only be explained by industrial activities practically put an end to the disagreement.
The strengthening came from the Union of Concerned Scientist – Citizen and Scientist for Environmental
Solutions (UCS, 2008), represented by twenty Nobel Prize winners and nineteen other winners of the National Medal of Science. After analyzing the reports on climate change discussed at the end of the century, the scientists not only confirmed the preoccupying picture, but also accused the Bush US government of politically manipulating regulatory bodies to protect pollution sources. The influence of the UCS did not sensitize the US federal government, which maintains its veto against the Kyoto Protocol, but it promoted the mobilization of 17 states and more than 400 North-American cities, including New York, Los Angeles and Chicago, making them set their own emission decrease goals, many of which are much more radical than the Kyoto levels. The UCS convincing power is summarized in the following figures: The mean temperature on the planet has risen by 0.6 degrees Celsius in the 20th century. Warming in the 20th century is greater than in any other ages during the past 400-600 years. Seven of the ten warmest years in the 20th century occurred in the 1990’s. Glacial mountains are disappearing around the world, as well as the Permafrost, which is the soil type
found in the Arctic region. It is constituted by permanently frozen soil, ice and rocks. The layer of ice and snow, with a depth of up to 300 meters in some places during winter, melts in spring and decreases to between 0.5 and 2 meters, turning the surface into a swamp, as the water is not absorbed by the frozen soil.
Floating ice in the Arctic has lost 40% of its thickness in the past four decades. The sea level is increasing three times faster in the last 100 years. A growing number of studies show changing varieties and behaviors in plants and animals. Marine currents are changing directions. The sea level can rise by 4.9 meters.
The fourth edition of the IPCC report (2007) differed from the other versions by the methods it adopted
in climate analyses. In this edition, computers with great processing capacity were used, which permitted simulating a larger number of variables more precisely. The largest Brazilian computers used by the scientific community remain below or close to the processing capacity of one terabyte, as opposed to the Americans and Japanese, which are close to fifty terabyte.
As soon as the relentless connection between global warming and human activities became clear, the
business world’s economic rationality and commercial instinct found new activity niches. Profit and environmental reputation started to go hand in hand. The most complete and respected financial report about the economic impacts of global warming, the “Stern Review Report” (Stern, 2006), was ordered by the British Treasury in 2006 and rapidly became the guidebook of the European political agenda for public and private investments and, at the same time, turned into the most judicious manual of the emerging “Climate Change Economics”. The Stern Report presents an economically optimistic picture when considering the extent of the damage climate catastrophes can provoke. As a new political and economic field of opportunities, profit from an environmental reputation is expected to be the new global order, provided that three changes are followed: (1) carbon pricing, (2) energy efficiency technology and (3) change in consumption behavior.
Convincing the British Chancellor and other global policy makers, guaranteeing industries’ adherence
and conquering scientific critics depended on demonstrating, through sophisticated econometric models, that the balance between the benefits and costs of these changes, brought to present value for 2050, is approximately US$ 5 trillion, i.e. 10% of global GDP in 2007. These calculations include mitigating the loss of global per capita well-being caused by pollution, which can reflect in a purchasing power decrease by up to 20%, replacing government support to maintain polluting energy matrices, corresponding to US$ 500 million per year nowadays, and annually investing US$ 30 billion in developing countries, until 2050, to install less polluting technologies. Investments could be made through the government or private initiative,
4
5 to the extent that they would represent a competitive advantage for companies’ image (Lash & Wellington, 2008), use of environmental services (Hepburn, 2007) and future contracts (Eigeraam et al., 2007).
Nevertheless, the financial market anticipated the recommendations of the Stern Review Report. The
Chicago Climate Exchange (CCX), founded in 2003, makes available two main types of actions: carbon quota, through the CDM under the Kyoto protocol, and carbon sequestration through reforesting and forest maintenance projects, independently of the protocol. In the first case, public or private companies that reduce their emissions below maximum levels sell their “right to pollute” or their “avoided carbon quota” to companies that choose or are not technologically able to comply with their goals. In the second case, public or private projects sell carbon quota sequestered through biomass, accounted for by the maintenance of forest reserves or reforestation. Companies owning these stocks “compensate” for their pollution as if they were protecting or planting trees which, in order to grow, consume carbon from the atmosphere (CCX, 2008).
Recently, traditional economic institutions, such as the International Monetary Fund (IMF) and the
International Reconstruction and Development Bank (IRDB), joined forces to announce a set of measures to change agricultural funding rules, acknowledging the severity and inexorability of funding problems for food production, deforestation and the emergency of global warming, launching the equalization of these issues as their newest and lasting target (IMF, 2008).
The historical evolution of the main relevant events related to global warming, starts with the discovery
of carbon dioxide by Joseph Black in 1753. Most recent event considered in this study is the UN’s proclamation of 2008 as the “International Year of Planet Earth (IYPE)”, using the slogan: “Earth Sciences for Humanity”:
• 1908: Henry Ford starts mass production of cars. Karl Benz had obtained the patent on the invention of internal combustion engine in 1885.
• 1924: Alfred James Lotka (1880-1949), chemist, demographist, ecologist and mathematician, born in Lemberg, now Ukraine, affirmed that industrial activities would double carbon dioxide emissions in 500 years.
• 1955: Gilbert Norman Plass (1921-2004), Canadian physicist living in the USA, was a pioneer in studies in which he concluded that the increase in CO2 intercepts infrared radiation released into space, causing a temperature increase (greenhouse effect).
• 1957: Keeling Curve: 1957 was considered the “International Geophysical Year” and the North-American chemist and oceanographist Charles David Keeling (1928-2005) was invited to start the first global measurement of CO2 levels at Mount Mauna Loa – Hawaii. He had discovered carbon levels at around 315 ppm and was surprised by the increased measures in subsequent years: 1958 (315.7ppm), 1959 (316.65ppm), 1960 (317.58ppm) and so on until 2004 (378.41ppm). According to the IPCC, levels in 2005 had reached 430ppm.
• 1967: Edward Norton Lorenz (1917-2008), North-American meteorologist and mathematician, graduated from the Massachusetts Institute of Technology (MIT), developed a non-linear, three-dimensional and deterministic system called the “Lorenz Attractor” and applied the “butterfly effect” to “Chaos Theory”. He performed the first computer simulation about the global temperature increase, calculating a rise by 0.50 degrees Celsius when the atmosphere reached a carbon dioxide concentration twice as high as in the pre-industrial age.
• 1972: United Nations Conference on the Human Environment, known as “Stockholm 72”, where representatives from developed countries defended a decrease in global growth to mitigate the harmful effects of pollution, while underdeveloped countries defended economic growth and their right to pollute.
• 1979: First World Climate Conference, held in Geneva/Switzerland, acknowledges the problems caused by global warming.
• 1982: First scientific shallow “Ice Core” studies in the high-impact journals “Science” and “Nature”.
• 1987: World Commission on Environment and Development, known as the “Brundtland Report” or “Our Common Future”, which officially coined the term “sustainable development” to consider decent work opportunities and environmental responsibility.
5
6
• 1988: Foundation of the Intergovernmental Panel on Climate Change (IPCC) by the World Meteorological Organization and the United Nations Environment Program. It consists of three groups that address: (I) the scientific aspects of climate change, (II) the socioeconomic and natural systems, and (III) the limitations of greenhouse gases and other actions needed.
• 1990: First IPCC Report, known as Assessment Report (AR-I), evidences the responsibility of human activities in global warming.
• 1992: Rio Declaration on Environment and Development at Rio de Janeiro Summit, known as “RIO 92” or “Earth Summit”, when the “Agenda 21” and the United Nations Framework Convention on Climate Change (UNFCCC) were signed. Regarding number of participants, governors and products, this event held in Brazil, was much more important than “Stockholm 72”.
• 1995: Second IPCC report (AR-II), demonstrating the impacts of global warming on countries. Start of annual COP (Conference of the Parties – 1) in the context of the UNFCCC, held in Berlin.
• 1997: Signing of the Kyoto Protocol, on the occasion of COP-3, when developed nations committed to reduce their emissions for levels between 2008 and 2012 to be equal to the levels observed in 1990 and regulated on Clean Development Mechanisms (CDM) and carbon credits.
• 1999: In view of Brazil’s adherence to the Kyoto Protocol, the Interministerial Commission on Global Climate Change (CIMGC) was created through a decree first issued on 07/07/99 and altered by another decree on 01/10/06. This Commission was created to articulate government actions deriving from the United Nations Framework Convention on Climate Change and its subsidiary instruments Brazil is part of.
• 2001: Third IPCC Report (AR-III), which proposes economic measures to mitigate the effects of climate change.
• 2002: World Summit on Sustainable Development, known as Rio+10, to assess the implementation of the “Agenda 21”.
• 2003: Creation of the Chicago Climate Exchange (CCE), to trade stocks related to carbon credit via Kyoto, and carbon sequestration via compensation mechanisms.
• 2005: The Kyoto Protocol comes into effect, on the occasion of COP-6, on 05/16/05. Brazil signed the agreement on 04/29/98 and ratified it on 08/23/02. President George W. Bush alleged that the commitments of this agreement would interfere negatively in the North-American economy and, therefore, the USA still have not entered this international agreement, despite isolated measures taken by one third of its states and more than 400 North-American cities.
• 2006: “Stern Review Report”, ordered by the British government and elaborated by Nicolas Stern and a large team. For the first time, important economists joined with eminent scientists to denounce the risks of an ecological hecatomb. It was evidenced that the cost of climate change is equivalent to an annual 5% loss of GDP, while the annual costs of reductions calculated by the IPCC amount to 1% of GDP. The term “econometrics of sustainable development” emerges and a window of alternatives is opened for projects in the development of each country.
• 2007: Fourth IPCC Report (AR-IV) and granting of the Nobel Peace Prize to the IPCC, shared with the former vice-president of the US Al Gore, for his campaign and documentary “An Inconvenient Truth” about the physical, economic and social impacts provoked by global climate change.
• 2008: IMF and IRDB Conference jointly launches a new agricultural funding model, with a view to fighting against hunger, decreasing deforestation and mitigating global warming, contributing billions of dollars to emerging nations.
• 2009: International Year of Planet Earth (IYPE), proclaimed by the United Nations (UN), runs from 2007 till 2009, with 2008 as the main year. Goal number 1 is to “ensure greater and more effective use by society of the knowledge accumulated by the world’s 400,000 Earth scientists”. The slogan is “Earth Science For Society”.
3. Methodology and Research Following maturing process and multidisciplinary discussions, the following model was obtained for the measurement and monetary assessment of the variables involved in climate change, which is studied here.
The present research was developed as follows:
6

7 1) Verification of each country’s residual carbon balance in MtonC and American dollars in the established scenarios; 2) Conversion of each country’s Gross Domestic Product Purchasing Power Parity (PPP GDP) into per capita units equivalent to the number of inhabitants and mean energy consumption in ton of oil equivalent – TOE. The PPP GDP is the most adequate form for international comparisons, as all countries have the same reference base: the prices of the same goods and services in the United States, multiplied by the quantities of goods and services produced in each country. As the same prices are used for all countries, the PPP GDP represents the actual variation in the countries’ economic activity, independently of variations in their exchange policy; 3) Closing of countries’ financial statements using the inquired balance sheet technique.
Residual carbon balances are determined in function of each country’s inventory of carbon from forests and soil, of the avoided part minus estimated emissions for the 2020 and 2050 scenarios, measured in MtonC and converted into dollars in function of the value suggested by the IPCC. Each country’s GDP, purchasing power parity, is converted by an equivalent unit related to each nation’s mean energy consumption, measured in ton of oil equivalent (TOE), so as to equalize regional differences in terms of each country’s geographical characteristics and comfort level, of which a possible change is supposed in a scenario of climate change. To close the balance sheets, an accounting technique will be used that simplifies the bookkeeping process, given the degree of imprecision and difficulty to process the information. The technique is based on the basic principle of accounting and balance between cause and effect: assets minus liabilities equals equity.
For the sake of this study, assets will be assessed by the “equivalent” per capita GDP in American
dollars; liabilities will correspond to each citizen’s environmental obligation in carbon reduction targets; and equity will be correlated with each citizen or country’s surplus (or deficitary) residual balance towards all nations, as illustrated below.
Fig.1 – Environmental Balance Sheet of Nation – Model Constructs
3.1 - Determination of residual carbon balance in each country in MtonC and conversion into US dollar To determine the residual balances and balance between carbon emission and capturing, specialized literature was consulted, crossing information with a view to compound and specific data that are not readily available. The obtained data were distributed in four similar tables, two of which consider the absence of deforestation and two fixed deforestation rates in the countries, all formulated in megatons of carbon (MtonC). These tables were replicated ones, converting the units into American dollars (US$), considering that the IPCC suggests a mean cost of carbon capturing, with current technologies of US$ 45/tonC. The tables are attached at the end of this paper.
Each of the four basic tables – 1 to 4 – and their replicas in money – numbered from 5 to 8 - contain 9 columns with the following items: country, inventory of potential forest carbon, accumulated emission of carbon in IPCC’s scenario A1B1, accumulated emission of carbon in scenario A2B2, carbon capturing by
7

8 forest and soil biomass, industrial carbon capturing through high technology, industrial carbon capturing through low technology, accumulated carbon balance (best relative scenario), accumulated carbon balance (worst relative scenario).
Tables 5 to 8 show the conversion of figures in tons of carbon (tonC) to American dollars (US$), as
suggested by Metz et al (2005) in the IPC “Special Report on Carbon Dioxide Capture and Storage”. This report estimates “carbon capturing” costs, varying between 39 and 51 dollars/ton of carbon. These figures are considered to be the cost needed for each ton of carbon emitted by industrial production to be captured and stored in the underground, instead of being spilt into the atmosphere. Costs vary according to a series of variables, particularly the industrial activity sector, production volume, energy matrix used and type of carbon capturing (gross deposit in underground cracks, deposits through processing in carbon derivates, gross deposit in marine cracks or dissolution, all of which are technologies available nowadays). In this study, US$ 45/tonC was used, the simple average of the ends estimated in the report mentioned above. The authors chose this amount due to the lack of more precise instruments for a better weighing of the cost. Details on how specific data in each column were obtained are presented below. Tables 1 to 4: 1. Column COUNTRY: countries analyzed in this article 2. Column FOREST AND SOIL CARBON INVENTORY: Inventory is considered to be all carbon
contained in the biomass and in organic compounds in the soil. In this sense, forests are deposits of “avoided carbon” in the atmosphere. Literature commonly uses inventory data as suggested by the Human Development Report 2007/2008 (UN, 2007), whose method consists in the use of a single mean inventory index for all biomes, in function of the vegetable coverage area per country. In this study, however, a method was chosen that is considered more precise, using the specific inventory levels of each of the different biomes (savanna, tropical forests, temperate forests and boreal forests), suggested by the IPCC (2000), multiplied by the residual areas of the respective biomes present in each country under analysis, taken from FAO (2007). In the situation “with deforestation” – tables 3, 4, 7 and 8 - deforestation rates for each country were in line with FAO (2007) projections, assuming fixed rates year by year. In these cases, accumulated carbon inventories decrease proportionally in 2020 and 2050 in comparison with rates in the “ without deforestation” situation - tables 1,2,5 and 6.
3. Column ACCUMULATED CARBON EMISSION SITUATION (IPCC SRES A1B1): Accumulated emission refers to all carbon launched into the atmosphere, in a specific period, originating from industrial activities, vehicles, thermal energy production and forest burns (in case of deforestation). This column presents figures, estimated by the authors, of accumulated carbon emissions between 2006 and 2020 and between 2006 and 2050, using each country’s emission in 2006 (NEAA, 2007) and UNSD (2007) as a reference, and figures presented by the IPCC (2000) for 2020 and 2050, in scenario A1B1, which forecasts the continued growth of fossil fuel use, low substitution by renewable energy sources and global population growth. Fixed mean annual rates were considered for each country.
4. Column ACCUMULATED CARBON EMISSION SITUATION (IPCC SRES A2B2): This column shows figures, estimated by the authors, for accumulated carbon emissions between 2006 and 2020 and between 2006 and 2050, using each country’s emission in 2006 (NEAA, 2007) and UNSD (2007) as a reference, and figures presented by the IPCC (2000) for 2020 and 2050, in scenario A2B2, which forecasts decreasing annual rates of fossil fuel use, high substitution by renewable energy sources and global population growth. To estimate accumulated levels for the period, fixed mean annual rates were considered for each country.
5. Column CARBON CAPTURING BY FOREST AND SOIL BIOMASS: Capture is considered to be the amount of carbon the forest and soil withdraw from the atmosphere through photosynthesis and other biogeochemical processes. The accumulated amount captured between 2006 and 2020 and between 2006 and 2050 was estimated, using annual capturing rates specific for the biomes (IPCC, 2000) in fucntion of the area each of them occupies in the analyzed countries (FAO, 2007). For the two tables showing scenarios without deforestation, annual capturing rates were fixed and constant. For the two tables with deforestation, annual capturing rates were considered fixed, identical to each country’s deforestation rates taken from FAO (2007).
6. Column AVOIDED INDUSTRIAL CARBON, USING LOW TECHNOLOGY (IPCC SRES A1B1). Avoided industrial carbon is the amount of carbon industries do not spill into the atmosphere (BP, 2007). The amount depends on the number of industries, but mainly on the technological level for
8
9
the efficient use of the energy matrix, changing to non-fossil sources, which saves emissions. In this column, the accumulated amount of avoided carbon was considered between 2006 and 2020 and between 2006 and 2050, in the industrial capacity scenario of low-efficiency, A1B1, suggested by the IPCC (2000), with fixed annual rates.
7. Column AVOIDED INDUSTRIAL CARBON, USING HIGH TECHNOLOGY (IPCC SRES A1B1) Like column 6, applied to the industrial capacity scenario with high energy efficiency technology A2B2, suggested by the IPCC (2000), with fixed annual rates.
8. Column ACCUMULATED CARBON BALANCE (worst relative scenario). Carbon balances per country are presented in each table, given by inventory + capture – emission, considering scenario A1B1 for emission and industrial capture.
9. Column ACCUMULATED CARBON BALANCE (best relative scenario/worst relative scenario). Carbon balances per country are presented, given by inventory + capture – emission, considering scenario A1B1 for emission and industrial capture.
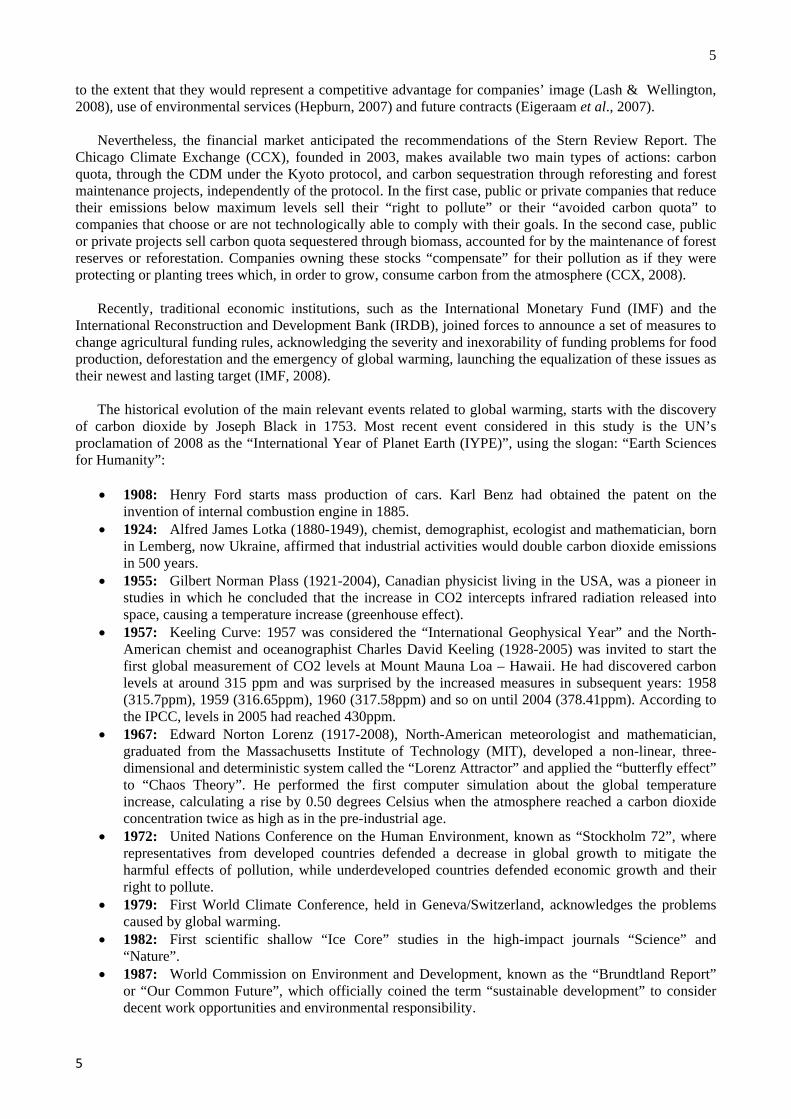
The table below summarizes the eight tables (1 to 8) attached, permitting a better understanding of the
calculations elaborated in the main scenarios.
Fig. 2 – Carbon Emissions and Captures Balance at 2020 and 2050
The chart above shows a summary of the four main accumulated balance simulations for carbon emissions and captures, for the period until 2020 and until 2050, taking into account the worst and best case scenarios, that is, with deforestation and low technology and without deforestation and high technology, for each of the countries under study individually, as a group and for the entire planet.
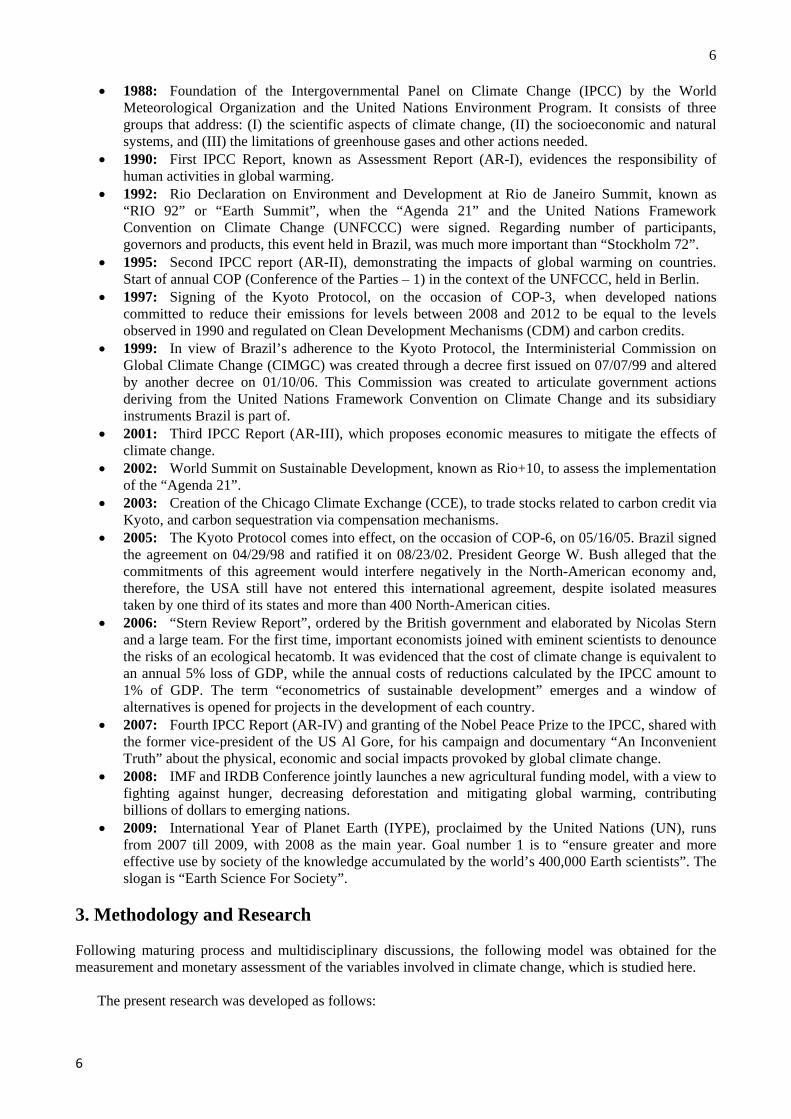
The graphs below illustrate the situation in these countries and the world. It is observed that only two
countries present “positive” accumulated balances and the planet deficit is appointed in both scenarios. When comparing 2020 with 2050, the optimistic and pessimistic projections, it is evidenced that “time” is the relevant variable in these simulations, and this permits inferring that, independently of the degree of precision of the study variables, the critical scenario for the future is a reality.
Fig. 3 – Balance of Carbon Emissions and Captures – 2020 Scenario in MTonc
9
10
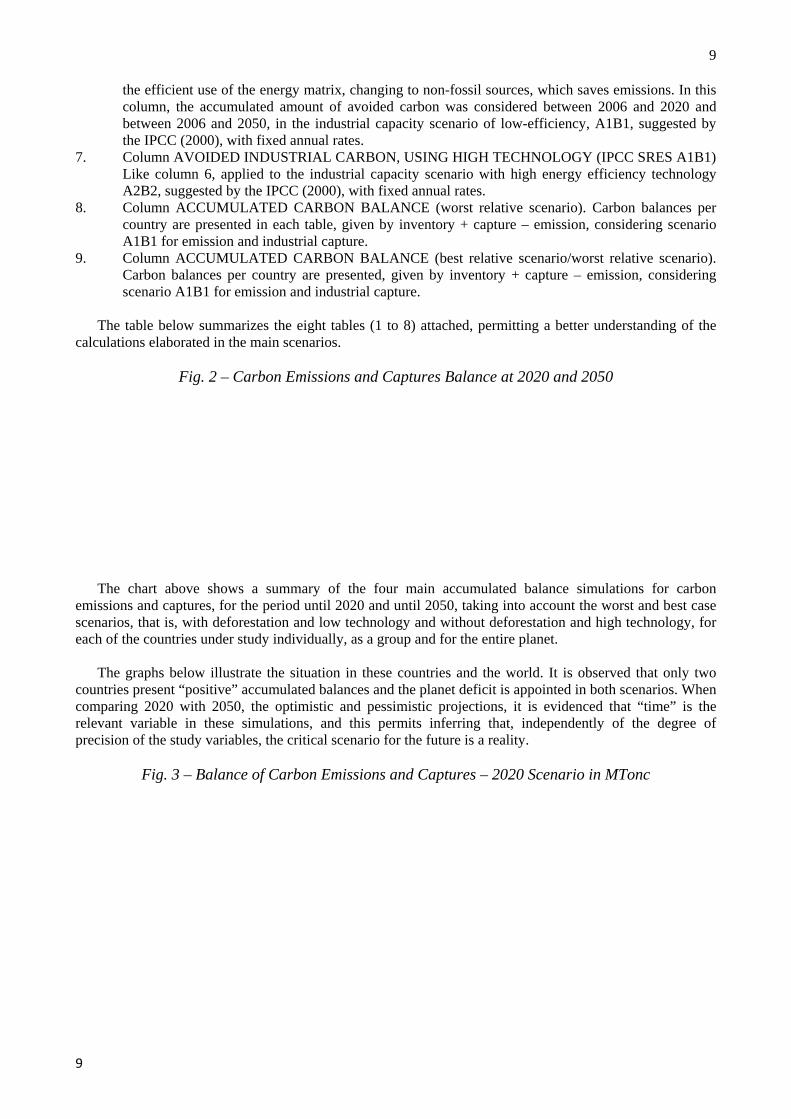
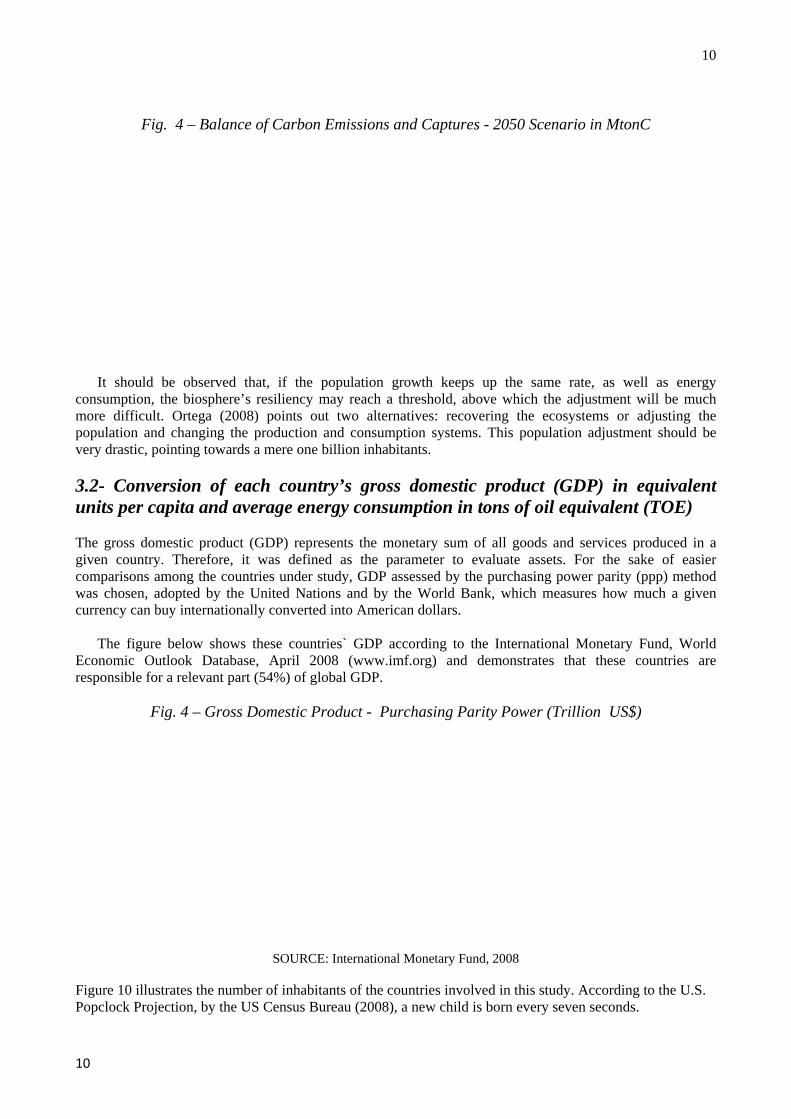
Fig. 4 – Balance of Carbon Emissions and Captures - 2050 Scenario in MtonC
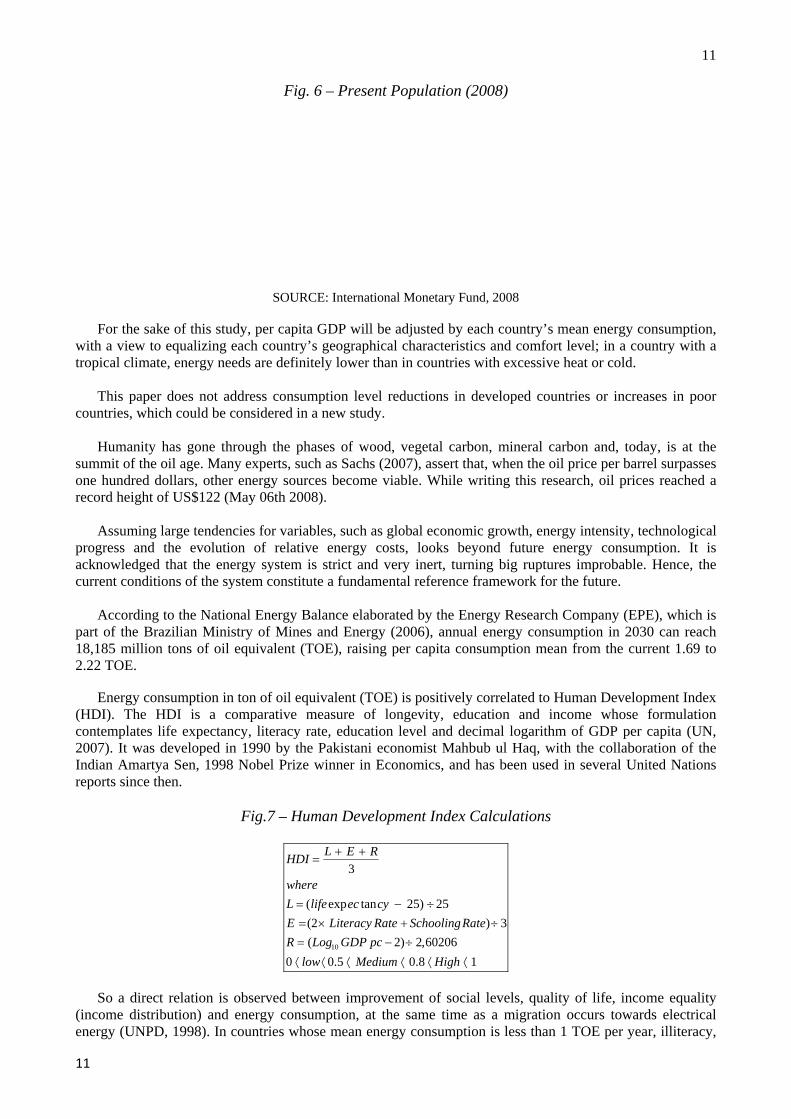
It should be observed that, if the population growth keeps up the same rate, as well as energy consumption, the biosphere’s resiliency may reach a threshold, above which the adjustment will be much more difficult. Ortega (2008) points out two alternatives: recovering the ecosystems or adjusting the population and changing the production and consumption systems. This population adjustment should be very drastic, pointing towards a mere one billion inhabitants. 3.2- Conversion of each country’s gross domestic product (GDP) in equivalent units per capita and average energy consumption in tons of oil equivalent (TOE) The gross domestic product (GDP) represents the monetary sum of all goods and services produced in a given country. Therefore, it was defined as the parameter to evaluate assets. For the sake of easier comparisons among the countries under study, GDP assessed by the purchasing power parity (ppp) method was chosen, adopted by the United Nations and by the World Bank, which measures how much a given currency can buy internationally converted into American dollars.
The figure below shows these countries` GDP according to the International Monetary Fund, World Economic Outlook Database, April 2008 (www.imf.org) and demonstrates that these countries are responsible for a relevant part (54%) of global GDP.
Fig. 4 – Gross Domestic Product - Purchasing Parity Power (Trillion US$)
SOURCE: International Monetary Fund, 2008
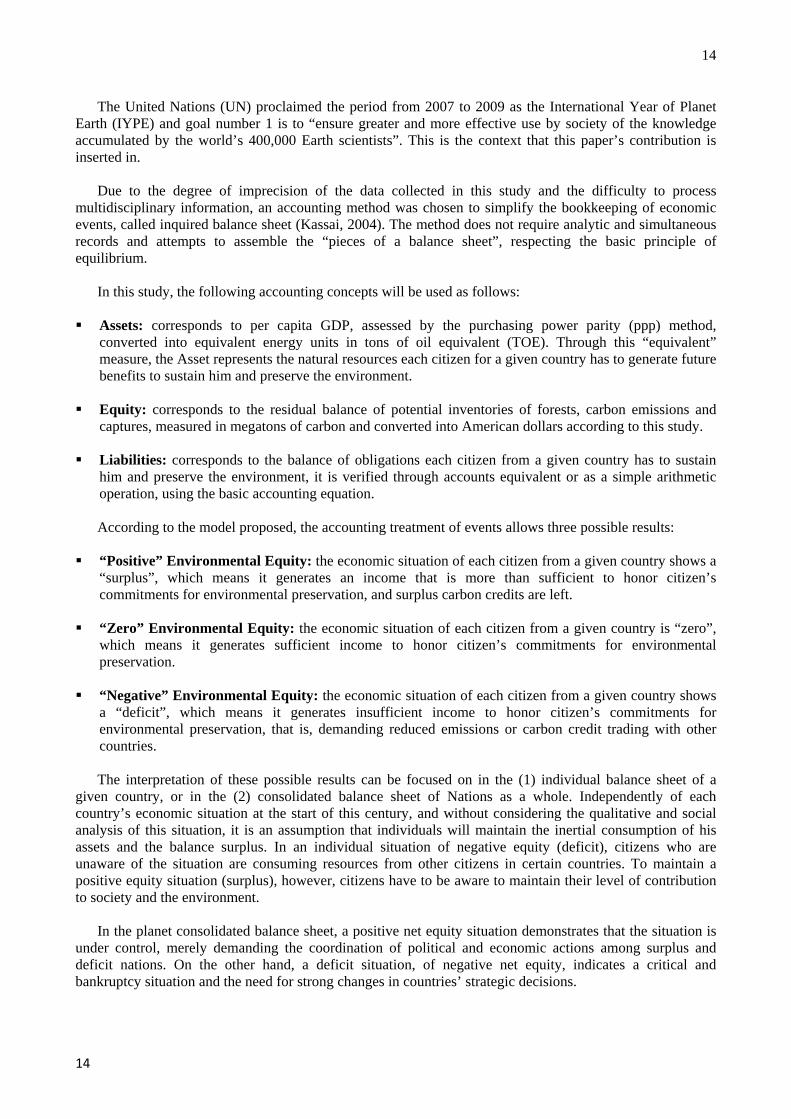
Figure 10 illustrates the number of inhabitants of the countries involved in this study. According to the U.S. Popclock Projection, by the US Census Bureau (2008), a new child is born every seven seconds.
10
11
Fig. 6 – Present Population (2008)
SOURCE: International Monetary Fund, 2008
For the sake of this study, per capita GDP will be adjusted by each country’s mean energy consumption,
with a view to equalizing each country’s geographical characteristics and comfort level; in a country with a tropical climate, energy needs are definitely lower than in countries with excessive heat or cold.
This paper does not address consumption level reductions in developed countries or increases in poor countries, which could be considered in a new study.
Humanity has gone through the phases of wood, vegetal carbon, mineral carbon and, today, is at the
summit of the oil age. Many experts, such as Sachs (2007), assert that, when the oil price per barrel surpasses one hundred dollars, other energy sources become viable. While writing this research, oil prices reached a record height of US$122 (May 06th 2008).
Assuming large tendencies for variables, such as global economic growth, energy intensity, technological
progress and the evolution of relative energy costs, looks beyond future energy consumption. It is acknowledged that the energy system is strict and very inert, turning big ruptures improbable. Hence, the current conditions of the system constitute a fundamental reference framework for the future.
According to the National Energy Balance elaborated by the Energy Research Company (EPE), which is
part of the Brazilian Ministry of Mines and Energy (2006), annual energy consumption in 2030 can reach 18,185 million tons of oil equivalent (TOE), raising per capita consumption mean from the current 1.69 to 2.22 TOE.
Energy consumption in ton of oil equivalent (TOE) is positively correlated to Human Development Index
(HDI). The HDI is a comparative measure of longevity, education and income whose formulation contemplates life expectancy, literacy rate, education level and decimal logarithm of GDP per capita (UN, 2007). It was developed in 1990 by the Pakistani economist Mahbub ul Haq, with the collaboration of the Indian Amartya Sen, 1998 Nobel Prize winner in Economics, and has been used in several United Nations reports since then.
Fig.7 – Human Development Index Calculations
HDI = L + E + R
3whereL = (lifeexpec tancy − 25) ÷ 25E =(2× Literacy Rate + SchoolingRate)÷ 3R = (Log10 GDP pc − 2)÷ 2,602060 ⟨ low ⟨0.5 ⟨ Medium ⟨ 0.8 ⟨High ⟨ 1
So a direct relation is observed between improvement of social levels, quality of life, income equality
(income distribution) and energy consumption, at the same time as a migration occurs towards electrical energy (UNPD, 1998). In countries whose mean energy consumption is less than 1 TOE per year, illiteracy,
11

12 child mortality and fertility rates are high, while life expectancy and the HDI are low. Thus, despite the emerging need to reduce energy consumption or to replace it by other non-polluting sources, it is vital to raise the barrier of 1 TOE in poor countries (Goldemberg, 2007).
One TOE corresponds to 10,000,000 Kcal and can be converted into daily consumption mean as follows,
based on a global consumption mean of 1.69 TOE:
Fig. 8 – Mean Global Energy Consumption
DayperKcal
daysKcalToenConsumptioGlobalMean 301.46
365000.000.1069.1
=×
=
Considering a basic meal of about 2,000 Kcal and the energy spent during all daily activities, such as
bathing, illumination, cooking, TV, internet, warming, refrigeration, transport etc., the daily consumption mean is obtained. While the daily consumption mean in Brazil is 29,800 Kcal, the USA exceeds 230,000 Kcal, Italy is 93,187 Kcal (Ministry for the Environmental Italy, 2007), against only 4,000 Kcal in countries like Bangladesh, as shown in the graph below.
Fig. 9 – Countries’ mean daily energy consumption per capita (thousand Kcal)
SOURCE: adapted from Brazilian Ministry of Mines and Energy, 2006
Hence, for the sake of this study, and for a better assessment of each country’s assets as the set of self-
sustainable resources, the per capita GDP is adjusted by an equivalent energy consumption unit - TOE, through the following formula:
Fig. 10 – GDP per capita adjusted
Energyequivalent percapitaGDP =AnnualGDP ppp percapita
Mean Annual EnergyConsumption(inToe)
And, according to the Energy and Development Dossier (Goldemberg, 2007) and comparisons with different other sources, containing estimates of countries’ mean energy consumption, the authors made the following adjustments in the countries’ per capita GDP ppp, evidenced in the graph below.
Fig. 11 – GDP PPP per capita per Energy equivalent (TOE)
12

13
SOURCE: Goldemberg, 2007
With these adjustments proposed, per capita GDP expresses not only purchasing power parity (ppp), but
also energy consumption parity, which permits verifying the object of this study in the assessment of environmental assets, as it associates energy consumption with climate changes. 3.3. Closing of the countries’ balance sheets through the Inquired Balance Sheet technique With respect to the environmental challenges of the 21st century, especially global warming, subject of this study, accounting is still behind other areas of knowledge, such as geosciences, for instance. The movement towards the harmonization and internationalization of accounting standards signals good perspectives and is a first step to establish global environmental accounting standards. Environmental liabilities, as a mere instrument for complaints from third parties, is still the main focus, but the alignment with Social Accounting for intangible assets moves towards the acknowledgement of global warming issues (Crowther, 2000).
National accounting systems (NAS) are still incomplete for the assessment of natural resources and they use measures, such as GDP, that do not recognize either the quality or the degradation of natural resources (resiliency and depreciation). To correct this deficiency, the UN has established a new accounting tool that can contribute to monitor the exhaustion of natural resources and environmental degradation, called “System of Integrated Environmental and Economic Accounting” (SEEA). It suggests a “hybrid” system with accounts that register physical measures (materials, energy, emissions), environmental management events, environmental goods, and the economy’s impacts on the environment (exhaustion, defense, degradation), and proposes the monetary assessment of these physical measures (Lange, 2007). This initiative is important as it encourages the development of environmental or “social and environmental” accounting, the latter term considered in a broader and multidisciplinary way.
In comparison with other branches of natural sciences, accountancy is more similar with an
administrative technique. However, over the centuries, it has preserved some basic and important principles, such as: the law of balance earlier mentioned and accountability. Balance is pictured in the fundamental accounting equation: assets minus liabilities equals equity (Luca Pacioli, 1445-1517) and is based on the debit and credit, changes in financial position, supply and demand, risk and return principle, or on cause and effect laws. The other basic principle is accountability (Carvalho, 1991; Nakagawa, 1991; Nakagawa, 2003), an ethical concept that refers to the obligation to account for one’s spending and social responsibility (Schedler, 1999).
This study aims to contribute to the emerging issue of climate change, expanding the meanings of
environmental liabilities and suggesting environmental equity, relating them with the preservation of the whole natural equity. It is a form of accountability to humanity and, therefore, accountancy would not be limited by standardizing, auditing aspects and audit courts, but by each citizen’s conscience. These values are implicit in the concepts of balance and accountability.
13
14
The United Nations (UN) proclaimed the period from 2007 to 2009 as the International Year of Planet
Earth (IYPE) and goal number 1 is to “ensure greater and more effective use by society of the knowledge accumulated by the world’s 400,000 Earth scientists”. This is the context that this paper’s contribution is inserted in.
Due to the degree of imprecision of the data collected in this study and the difficulty to process
multidisciplinary information, an accounting method was chosen to simplify the bookkeeping of economic events, called inquired balance sheet (Kassai, 2004). The method does not require analytic and simultaneous records and attempts to assemble the “pieces of a balance sheet”, respecting the basic principle of equilibrium.
In this study, the following accounting concepts will be used as follows:
Assets: corresponds to per capita GDP, assessed by the purchasing power parity (ppp) method,
converted into equivalent energy units in tons of oil equivalent (TOE). Through this “equivalent” measure, the Asset represents the natural resources each citizen for a given country has to generate future benefits to sustain him and preserve the environment.
Equity: corresponds to the residual balance of potential inventories of forests, carbon emissions and
captures, measured in megatons of carbon and converted into American dollars according to this study. Liabilities: corresponds to the balance of obligations each citizen from a given country has to sustain
him and preserve the environment, it is verified through accounts equivalent or as a simple arithmetic operation, using the basic accounting equation.
According to the model proposed, the accounting treatment of events allows three possible results:
“Positive” Environmental Equity: the economic situation of each citizen from a given country shows a
“surplus”, which means it generates an income that is more than sufficient to honor citizen’s commitments for environmental preservation, and surplus carbon credits are left.
“Zero” Environmental Equity: the economic situation of each citizen from a given country is “zero”,
which means it generates sufficient income to honor citizen’s commitments for environmental preservation.
“Negative” Environmental Equity: the economic situation of each citizen from a given country shows
a “deficit”, which means it generates insufficient income to honor citizen’s commitments for environmental preservation, that is, demanding reduced emissions or carbon credit trading with other countries.
The interpretation of these possible results can be focused on in the (1) individual balance sheet of a
given country, or in the (2) consolidated balance sheet of Nations as a whole. Independently of each country’s economic situation at the start of this century, and without considering the qualitative and social analysis of this situation, it is an assumption that individuals will maintain the inertial consumption of his assets and the balance surplus. In an individual situation of negative equity (deficit), citizens who are unaware of the situation are consuming resources from other citizens in certain countries. To maintain a positive equity situation (surplus), however, citizens have to be aware to maintain their level of contribution to society and the environment.
In the planet consolidated balance sheet, a positive net equity situation demonstrates that the situation is
under control, merely demanding the coordination of political and economic actions among surplus and deficit nations. On the other hand, a deficit situation, of negative net equity, indicates a critical and bankruptcy situation and the need for strong changes in countries’ strategic decisions.
14
15
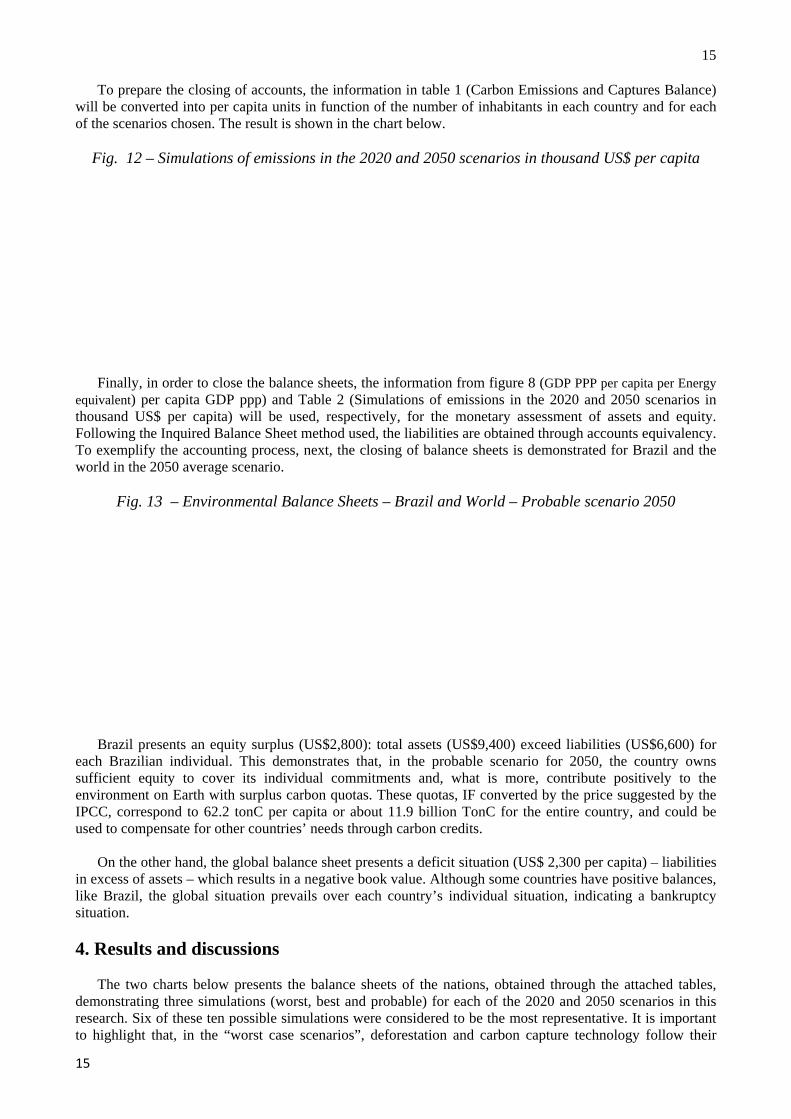
To prepare the closing of accounts, the information in table 1 (Carbon Emissions and Captures Balance) will be converted into per capita units in function of the number of inhabitants in each country and for each of the scenarios chosen. The result is shown in the chart below.
Fig. 12 – Simulations of emissions in the 2020 and 2050 scenarios in thousand US$ per capita
Finally, in order to close the balance sheets, the information from figure 8 (GDP PPP per capita per Energy equivalent) per capita GDP ppp) and Table 2 (Simulations of emissions in the 2020 and 2050 scenarios in thousand US$ per capita) will be used, respectively, for the monetary assessment of assets and equity. Following the Inquired Balance Sheet method used, the liabilities are obtained through accounts equivalency. To exemplify the accounting process, next, the closing of balance sheets is demonstrated for Brazil and the world in the 2050 average scenario.
Fig. 13 – Environmental Balance Sheets – Brazil and World – Probable scenario 2050
Brazil presents an equity surplus (US$2,800): total assets (US$9,400) exceed liabilities (US$6,600) for each Brazilian individual. This demonstrates that, in the probable scenario for 2050, the country owns sufficient equity to cover its individual commitments and, what is more, contribute positively to the environment on Earth with surplus carbon quotas. These quotas, IF converted by the price suggested by the IPCC, correspond to 62.2 tonC per capita or about 11.9 billion TonC for the entire country, and could be used to compensate for other countries’ needs through carbon credits.
On the other hand, the global balance sheet presents a deficit situation (US$ 2,300 per capita) – liabilities
in excess of assets – which results in a negative book value. Although some countries have positive balances, like Brazil, the global situation prevails over each country’s individual situation, indicating a bankruptcy situation. 4. Results and discussions
The two charts below presents the balance sheets of the nations, obtained through the attached tables, demonstrating three simulations (worst, best and probable) for each of the 2020 and 2050 scenarios in this research. Six of these ten possible simulations were considered to be the most representative. It is important to highlight that, in the “worst case scenarios”, deforestation and carbon capture technology follow their
15
16 current trend, considering fixed annual deforestation rates as observed in 2005. The “best case scenarios”, on the other hand, consider no deforestation and capture technology with annually growing efficiency levels, estimated by the IPCC report (Metz et al., 2005).
Fig. 14 – Balance Sheets of Nations – 2020 Scenarios
Asset Liability Equity Asset Liability Equity Asset Liability EquityGermany 8.4 10.9 -2.5 8.4 10.1 -1.7 8.4 10.5 -2.1Brazil 9.4 8.5 0.9 9.4 7.8 1.6 9.4 8.2 1.2China 8.9 10.0 -1.1 8.9 9.6 -0.7 8.9 9.8 -0.9USA 5.5 9.9 -4.4 5.5 8.4 -2.9 5.5 9.1 -3.6India 9.0 9.2 -0.2 9.0 9.1 -0.1 9,0 9.2 -0.2Japan 8.6 11,0 -2.4 8.6 10.2 -1.6 8.6 10.6 -2.0 Russia 4.6 4.7 -0.1 4.6 3.1 1.5 4.6 3.9 0.7Total 6.9 7.9 -1.0 6.9 7.4 -0.5 6.9 7.7 -0.8World 6.2 7.0 -0.8 6.2 6.6 -0.4 6.2 6.8 -0.6
Environmental Balance Sheet of Nation per capita - Cenários 2020Country Worst Best Average
Fig. 15 – Balance Sheets of Nations – 2050 Scenarios
Asset Liability Equity Asset Liability Equity Asset Liability EquityGermany 8.4 16.2 -7.8 8.4 9.5 -1.1 8.4 12.9 -4.5Brazil 9.4 8.9 0.5 9.4 4.2 5.2 9.4 6.6 2.8China 8.9 12.9 -4.0 8.9 9.8 -0.9 8.9 11.4 -2.5USA 5.5 20.7 -15.2 5.5 8.1 -2.6 5.5 14.4 -8.9India 9.0 9.8 -0.8 9.0 9.1 -0.1 9 9.4 -0.4Japan 8.6 16.1 -7.5 8.6 10.2 -1.6 8.6 13.2 -4.6Russia 4.6 11.2 -6.6 8.8 0 8.8 4.6 3.5 1.1Total 6.9 10.9 -4.0 6.9 6.9 0 6.9 8.9 -2.0World 6.2 10.7 -4.5 6.2 6.3 -0.1 6.2 8.5 -2.3
Environmental Balance Sheet of Nation per capita - Cenários 2050Country Worst Best Average
Based on the simulations in the above charts, next, two graphs illustrate the “probable” scenarios for 2020 and 2050, considered here as the arrhythmic means of the worst and best case scenarios.
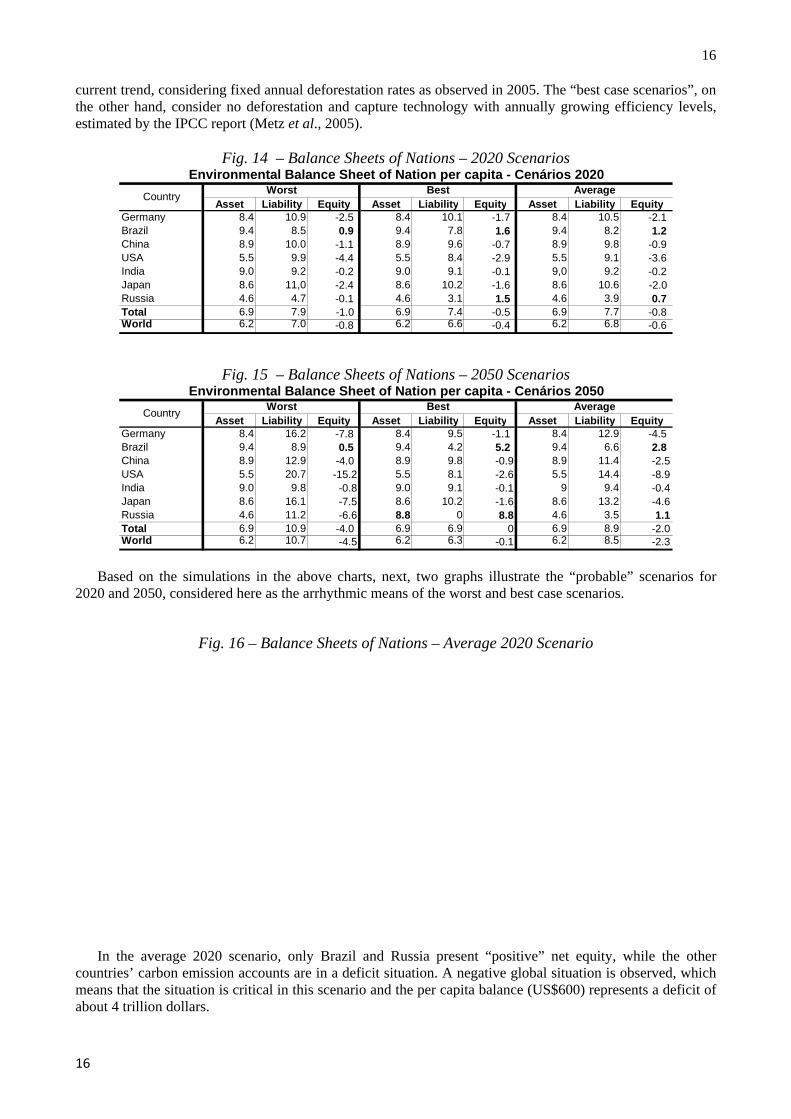
Fig. 16 – Balance Sheets of Nations – Average 2020 Scenario
In the average 2020 scenario, only Brazil and Russia present “positive” net equity, while the other countries’ carbon emission accounts are in a deficit situation. A negative global situation is observed, which means that the situation is critical in this scenario and the per capita balance (US$600) represents a deficit of about 4 trillion dollars.
16
17
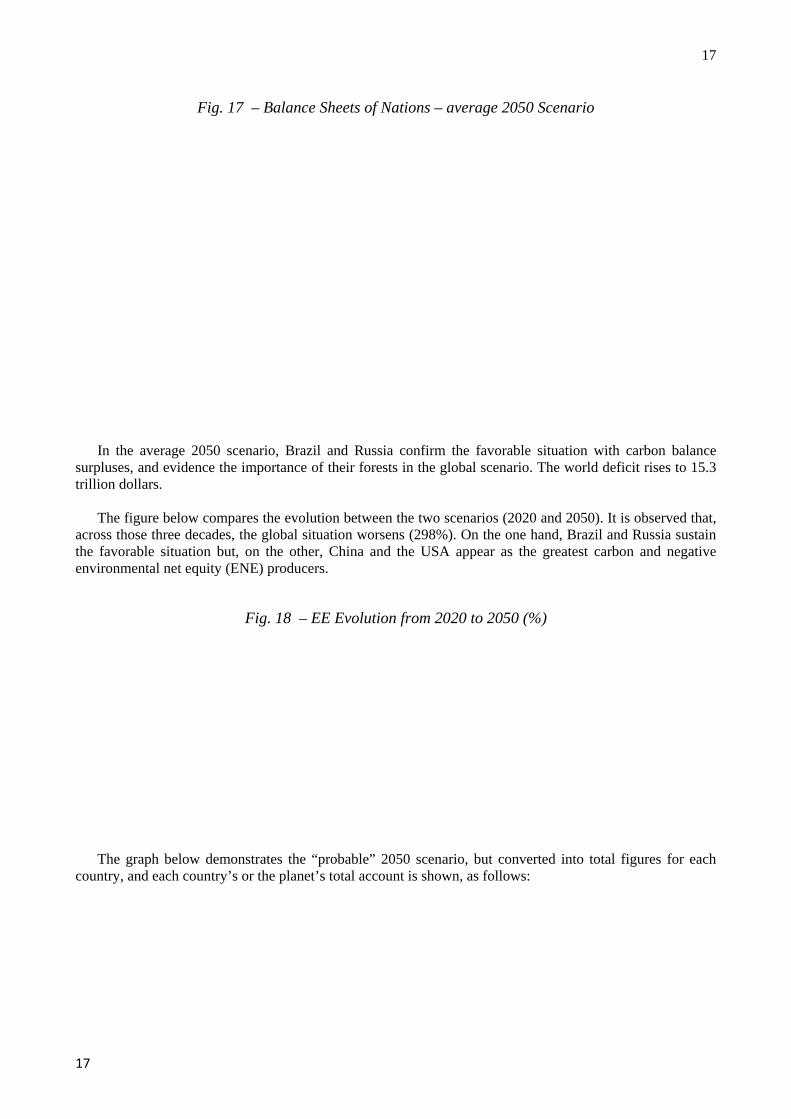
Fig. 17 – Balance Sheets of Nations – average 2050 Scenario
In the average 2050 scenario, Brazil and Russia confirm the favorable situation with carbon balance surpluses, and evidence the importance of their forests in the global scenario. The world deficit rises to 15.3 trillion dollars.
The figure below compares the evolution between the two scenarios (2020 and 2050). It is observed that,
across those three decades, the global situation worsens (298%). On the one hand, Brazil and Russia sustain the favorable situation but, on the other, China and the USA appear as the greatest carbon and negative environmental net equity (ENE) producers.
Fig. 18 – EE Evolution from 2020 to 2050 (%)
The graph below demonstrates the “probable” 2050 scenario, but converted into total figures for each country, and each country’s or the planet’s total account is shown, as follows:
17
18
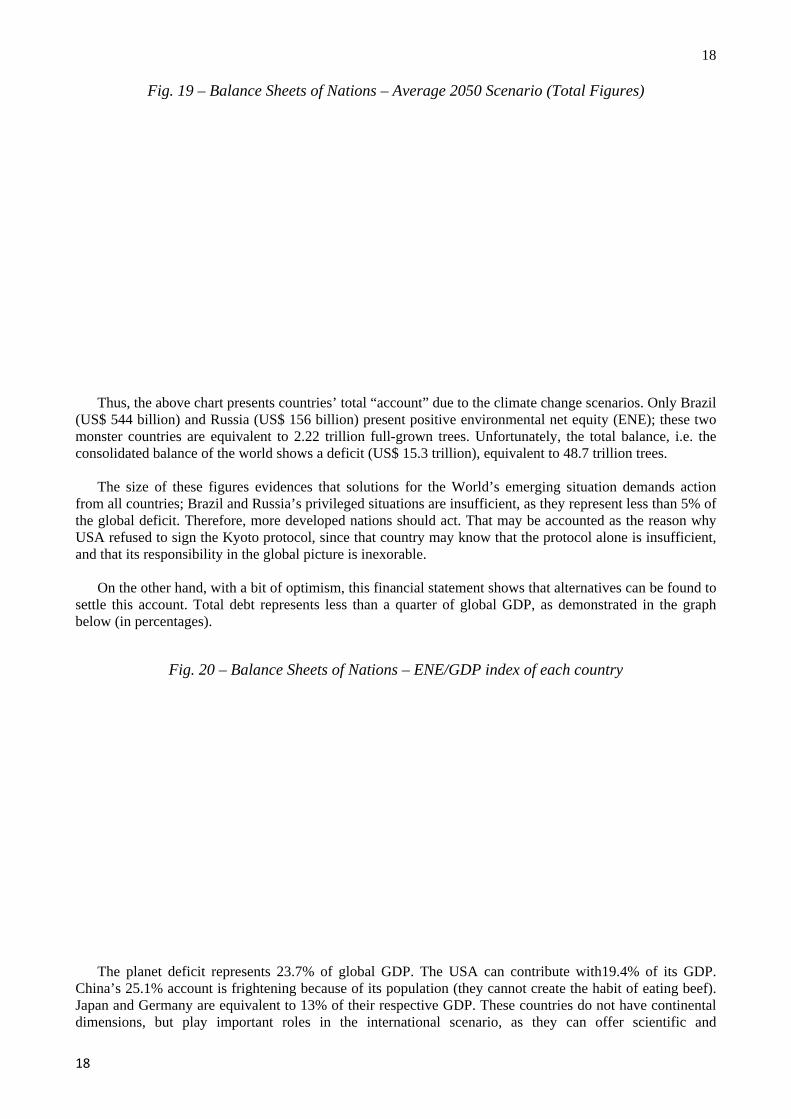
Fig. 19 – Balance Sheets of Nations – Average 2050 Scenario (Total Figures)
Thus, the above chart presents countries’ total “account” due to the climate change scenarios. Only Brazil (US$ 544 billion) and Russia (US$ 156 billion) present positive environmental net equity (ENE); these two monster countries are equivalent to 2.22 trillion full-grown trees. Unfortunately, the total balance, i.e. the consolidated balance of the world shows a deficit (US$ 15.3 trillion), equivalent to 48.7 trillion trees.
The size of these figures evidences that solutions for the World’s emerging situation demands action
from all countries; Brazil and Russia’s privileged situations are insufficient, as they represent less than 5% of the global deficit. Therefore, more developed nations should act. That may be accounted as the reason why USA refused to sign the Kyoto protocol, since that country may know that the protocol alone is insufficient, and that its responsibility in the global picture is inexorable.
On the other hand, with a bit of optimism, this financial statement shows that alternatives can be found to
settle this account. Total debt represents less than a quarter of global GDP, as demonstrated in the graph below (in percentages).
Fig. 20 – Balance Sheets of Nations – ENE/GDP index of each country
The planet deficit represents 23.7% of global GDP. The USA can contribute with19.4% of its GDP. China’s 25.1% account is frightening because of its population (they cannot create the habit of eating beef). Japan and Germany are equivalent to 13% of their respective GDP. These countries do not have continental dimensions, but play important roles in the international scenario, as they can offer scientific and
18
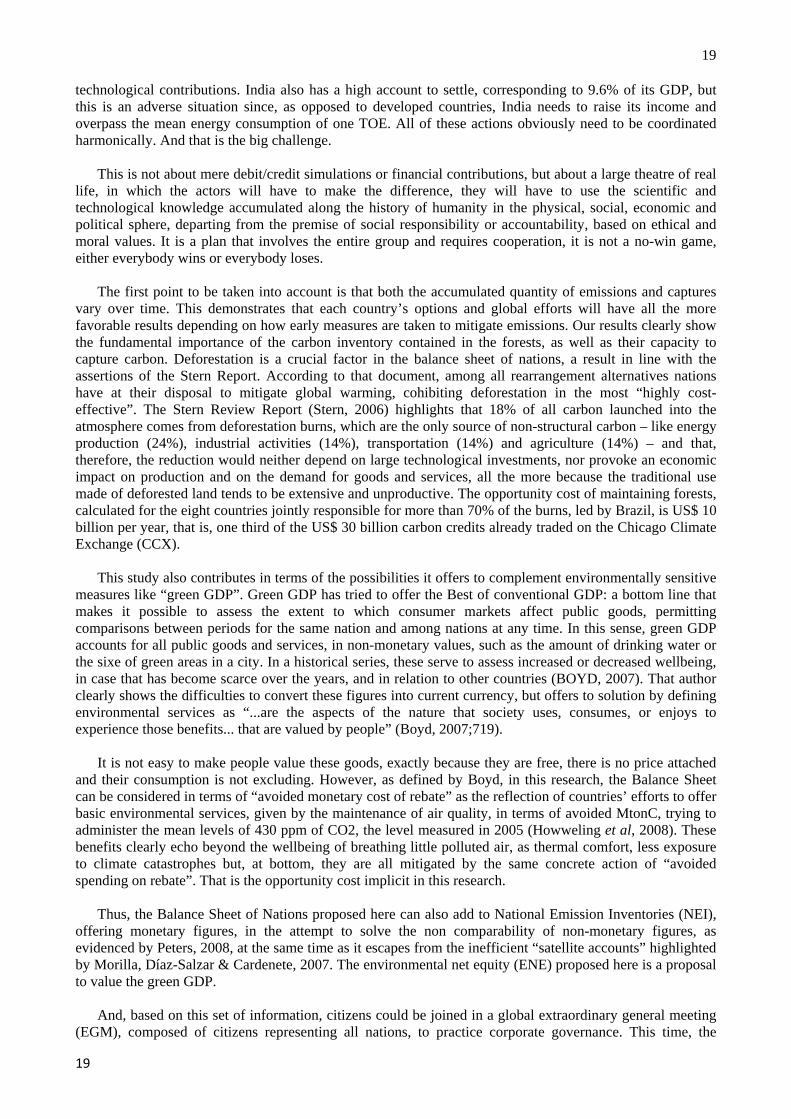
19 technological contributions. India also has a high account to settle, corresponding to 9.6% of its GDP, but this is an adverse situation since, as opposed to developed countries, India needs to raise its income and overpass the mean energy consumption of one TOE. All of these actions obviously need to be coordinated harmonically. And that is the big challenge.
This is not about mere debit/credit simulations or financial contributions, but about a large theatre of real
life, in which the actors will have to make the difference, they will have to use the scientific and technological knowledge accumulated along the history of humanity in the physical, social, economic and political sphere, departing from the premise of social responsibility or accountability, based on ethical and moral values. It is a plan that involves the entire group and requires cooperation, it is not a no-win game, either everybody wins or everybody loses.
The first point to be taken into account is that both the accumulated quantity of emissions and captures
vary over time. This demonstrates that each country’s options and global efforts will have all the more favorable results depending on how early measures are taken to mitigate emissions. Our results clearly show the fundamental importance of the carbon inventory contained in the forests, as well as their capacity to capture carbon. Deforestation is a crucial factor in the balance sheet of nations, a result in line with the assertions of the Stern Report. According to that document, among all rearrangement alternatives nations have at their disposal to mitigate global warming, cohibiting deforestation in the most “highly cost-effective”. The Stern Review Report (Stern, 2006) highlights that 18% of all carbon launched into the atmosphere comes from deforestation burns, which are the only source of non-structural carbon – like energy production (24%), industrial activities (14%), transportation (14%) and agriculture (14%) – and that, therefore, the reduction would neither depend on large technological investments, nor provoke an economic impact on production and on the demand for goods and services, all the more because the traditional use made of deforested land tends to be extensive and unproductive. The opportunity cost of maintaining forests, calculated for the eight countries jointly responsible for more than 70% of the burns, led by Brazil, is US$ 10 billion per year, that is, one third of the US$ 30 billion carbon credits already traded on the Chicago Climate Exchange (CCX).
This study also contributes in terms of the possibilities it offers to complement environmentally sensitive
measures like “green GDP”. Green GDP has tried to offer the Best of conventional GDP: a bottom line that makes it possible to assess the extent to which consumer markets affect public goods, permitting comparisons between periods for the same nation and among nations at any time. In this sense, green GDP accounts for all public goods and services, in non-monetary values, such as the amount of drinking water or the sixe of green areas in a city. In a historical series, these serve to assess increased or decreased wellbeing, in case that has become scarce over the years, and in relation to other countries (BOYD, 2007). That author clearly shows the difficulties to convert these figures into current currency, but offers to solution by defining environmental services as “...are the aspects of the nature that society uses, consumes, or enjoys to experience those benefits... that are valued by people” (Boyd, 2007;719).
It is not easy to make people value these goods, exactly because they are free, there is no price attached
and their consumption is not excluding. However, as defined by Boyd, in this research, the Balance Sheet can be considered in terms of “avoided monetary cost of rebate” as the reflection of countries’ efforts to offer basic environmental services, given by the maintenance of air quality, in terms of avoided MtonC, trying to administer the mean levels of 430 ppm of CO2, the level measured in 2005 (Howweling et al, 2008). These benefits clearly echo beyond the wellbeing of breathing little polluted air, as thermal comfort, less exposure to climate catastrophes but, at bottom, they are all mitigated by the same concrete action of “avoided spending on rebate”. That is the opportunity cost implicit in this research.
Thus, the Balance Sheet of Nations proposed here can also add to National Emission Inventories (NEI),
offering monetary figures, in the attempt to solve the non comparability of non-monetary figures, as evidenced by Peters, 2008, at the same time as it escapes from the inefficient “satellite accounts” highlighted by Morilla, Díaz-Salzar & Cardenete, 2007. The environmental net equity (ENE) proposed here is a proposal to value the green GDP.
And, based on this set of information, citizens could be joined in a global extraordinary general meeting
(EGM), composed of citizens representing all nations, to practice corporate governance. This time, the
19
20 strategy would be the management of the planet, with each citizen or country acting as a business unit, with strong correlations among their results, and the future of the next generations would depend on the decisions made as from today. 5. Conclusions
Accountancy evidences the importance of its role in the context of Earth sciences. Monetary valuation broadens horizons and possibilities to discuss alternatives for climate change issues. The measurement method suggested here permits monetary valuation as countries’ opportunity cost of saving atmospheric carbon and can complement the information of NEI, in the UNFCC, of “satellite accounts”, of GDP and their accounting treatment.
Countries like Brazil and Russia will play an important role. In the first place because, as seen,
preserving forests and savannas constitutes the best cost-benefit relation in the recycling of global atmospheric carbon (STERN, 2006), besides preserving biodiversity. In the second place because, if they know how to make the best of this trump, they can receive large amounts of foreign investments through Clean Development Mechanisms (CDM) and compensation.
Independently of technological projections on carbon captures and avoided carbon, deforestation is
expected to be the main cause countries will have to fight to achieve a better balance of their environmental net equity, for a double reason: deforestation emits carbon in the short term, when the deforestation occurs, and reduces the carbon inventory to the same extent in the medium and long term. Therefore, in monetary terms, increased expenses on non-avoided carbon can be affirmed in the short term, and decreased environmental net equity in the medium and long term. On the other hand, the authors agree with the Stern Review Report (2006), where the opportunity cost of containing deforestation is the lowest of structural alternatives, which reaffirms forest maintenance as a trump to sustain the ENE.
In view of the results demonstrated here, it is concluded that the questions presented in the
methodological aspects of this research have been satisfactorily answered. The goal was reached by proposing the accounting model to elaborate the balance sheet of nations; with assets assessed by the “equivalent” per capita GDP, net equity by the residual carbon balance and liabilities as a global environmental obligation. The environmental liability concept received a broader approach and the term “environmental net equity” was suggested, which covers the effects not only of the social aspects of environmental liabilities, but also the future benefits of natural and forest equity. As initially suspected, the baseline hypothesis was confirmed, i.e. a negative global net equity or “liability at risk”; like in a corporate report, this economic situation represents a deficit and a possible bankruptcy in the future, but which can be avoided if corrective measures are taken as from today, measures to contain consumption without awareness and to reduce emissions, with a view to resiliency.
The USA lead the ranking of negative environmental net equity, with liabilities at risk corresponding to
U$$8,900 per capita or a total amount for the country at around 2.72 trillion dollars, approximately 19% of the planet deficit, revealing its importance in the context of joint and global actions. As to the global per capita balance (a deficit), if socialized, each of the current 6.6 billion inhabitants would have annual environmental liabilities of about US$2,300, to be deducted from their income or negotiated through carbon credit compensations, and also subject to a global coordination between developed and low-income countries, mainly countries whose per capita GDP is lower than this debt. This debt has already been accounted for, its due date is either 2020 or 2050, and there is a risk of some extra-judicial charge at any time, by nature itself. Despite the pessimistic scenario, the balance sheet of nations has shown that the Planet’s global deficit represents 23.7% of global GDP, which means that there is room for corrective actions. That is the meaning of this financial report with global dimensions: it means accountability to humanity, subject to the conscience of each citizen on the planet and his/her ethical or moral values. It is not a “no-win” game, either everybody wins or everybody loses.
Likewise, the justification of this research was observed not only by the relevance of climate change
issues, intensely studied and discussed around the world nowadays, but mainly, as the authors believe, by the opportunity offered by the multidisciplinary interactions needed to compile the proposed model. It means
20
21 accountancy contributing to natural sciences and integrating with Earth sciences, a curricular proposal for environmental accounting or, as the authors prefer, social-environmental accounting.
The limitations mentioned in the study will encourage further research, such as (1) the expansion of the sample countries, by including countries from Africa and Australia for example; (2) addition of new variables in the accounting model and use of financial modeling for valuation purposes; (3) simulation exercises and sensitivity analyses in different scenarios, or even constant updating according to the advancement of IPCC reports, with suggestions for periodical follow-up; (4) realization of meetings with specialized citizens from different áreas in ordany general meetings, simulated to discuss new actions that need to be taken; (5) proposal of this model for the valuation of green GDP; (6) study of a global environmental insurance proposal based on the Balance Sheet of Nations; etc. These studies can increase multidisciplinary interaction among different areas of human knowledge or, as the UN proclaims, the knowledge accumulated from “Earth Sciences” at the service of society. References Alley R.B. (2000), Ice-core evidence of abrupt climate change, Proceedings of the National Academy of Sciences, V. 97, [1331-1334] Boyd N. (2007), Nonmarket benefits of nature: what should be counted in green GDP, Ecological Economics, V. 61, N.4, [716-729] Brundtland G H (1987). Our Common Future, Oxford University Press, Oxford Carvalho L.N. (1991), Contabilidade e Ecologia: uma exigência que se impõe, Revista Brasileira de Contabilidade, N. 75, [20-25] Cleveland J. C. (2007) Tools and methods for integrated analysis and assessment of sustainable development in Encyclopedia of Earth., D.C.: Environmental Information Coalition, National Council for Science and the Environment, Washington [3-45] Crowther, D. (2000), Social and Environmental Accounting, Financial Times Management Press, London CSD-Commission of Sustainable Development. (1996), Indicators of Sustainable development: framework and methodologies, United Nations, Roma Eigenraam M., Strapazzon L., Landsell N., Beverly C. and Stoneham G. (2007), Designing frameworks to deliver unknown information to support market-based instruments, Agricultural Economics V. 37, [261-269] Goldemberg J.(2007), Energia e Meio Ambiente no Brasil. Instituto de Estudos Avançados, N. 59, [7-20] Hepburn C (2007), Carbon trading: a review of the Kyoto mechanisms, Annual Review of Environment and Resources I, V. 32, [375-393] Howweling S., van der Werf G.R., Goldewijk K.K., Rockmann T. and Aben I. (2008) Early anthropogenic CH4 emissions and the variation of CH4 and 13CH4 over the last millennium, Global Biogeochemical Cycles, V. 22, [1-9] International Monetary Fund (2008), World Economic Outlook Database, April 2008 (www.imf.org) Kahn H. and Hiener A J, (1968), O ano 2000, Publisher, São Paulo KASSAI J. R. (2004), Balanço perguntado: uma técnica para elaborar relatórios contábeis de pequenas empresas. Anais do XXI Congresso Brasileiro de Custos, Porto Seguro/BA, 25 a 30 de julho de 2004. Lange G-M (2007), Environmental Accounting: introducing the SEEA-2003, Ecological Economics, V.61, N.4, [589-591], Special Issue Environmental Accounting Lash J. and Wellington F.(2008), Competitive advantage on a warming planet. Harvard Business Review, V. 85, N.3, [94-96] Markovitch J. (2006), Para mudar o futuro: mudanças climáticas, políticas públicas e estratégias empresariais, Edusp, São Paulo Meadows H., Randers J. and Behrens W. (1972), The Limits to Growth”, a Report to The Club of Rome, Editora, cidade Empresa de Pesquisa Energética (EPE). (2006), Balanço Energético Nacional Ministry for the Environmental Land and Sea (2007), Italian Energy Efficiency and Renwable Energy, Italian National Study Report Morilla C.R., Díaz-Salazar G.L. and Cardenete M.A. (2007), Economic and environmental efficiency using a social accounting matrix, Ecological Economics, V. 60, N.4 , [774-786] Nakagawa M. (1991), Gestão estratégica de custos, Atlas, São Paulo ___________ (2003), No Iraque a busca da essência em contabilidade (região da Mesopotânia), FEA/USP, São Paulo Ortega D. (2008), O Mundo como Sistema, Ed. Unicamp, Campinas Osborn T.J. and Briffa K.R. (2006), The spatial extend of 20th-century warmth in the context of the past 1200 years, Science, V. 311 [841-844]
21
22 Osterberg E., Mayewski P., Krevtz K., Fisher D., Handley M., Sneed S., Zdanowics C. Zheng J., Demuth M., Waskiewics M. and Burgeois S. Ice core record of rising lead pollution in the north Pacific atmosphere, Geophysical Research Letters V.35, N. 5, [1-11] Peters G.P. (2008), From production-based to consumption-based national emission inventories, Ecological Economics V. 65, N.1, [13-23] Ramanathan U. and Carmichael G. (2008), Reducing uncertainty about carbon dioxide as a climate driver, Nature N.419, [188-190] Sachs I. (2007) A revolução energética do século XXI, Instituto de Estudos Avançados N.59, [1-19]. Schedler A. (1999) Conceptualizing Accountability in The Self-Restraining State: Power and Accountability in New Democracies, Lynne Rienner Plublisher, London, [13-28] Stern L.B (2006) Stern Review on the economics of climate change available on http://www.hm-treasury.gov.uk/stern_review_final_report.htm Union of Concerned Scientist UCS (2008) Citizens and Scientists for Environmental Solutions – available at www.ucsusa.orgUnited Nations Development Program – UNDP. Relação IDH e consumo de energia em TEP, 1998. YASAKA, Tomei. Saigo no ama no iwatobiraki: Okada Kotama no daiyokoku, 1997.
22