Environmental Effects Assessment of Oil and Gas ... - HARVEST
122
Environmental Effects Assessment of Oil and Gas Development on a Grassland Ecosystem A Thesis Submitted to the College of Graduate Studies and Research in Partial Fulfillment of the Requirements for the Degree of Master of Science in the Department of Geography and Planning, University of Saskatchewan, Saskatoon By Lawrence Christopher Nasen © Copyright Lawrence C. Nasen, December 2009 All rights reserved
-
Upload
khangminh22 -
Category
Documents
-
view
0 -
download
0
Transcript of Environmental Effects Assessment of Oil and Gas ... - HARVEST

Environmental Effects Assessment of Oil and Gas
Development on a Grassland Ecosystem
A Thesis Submitted to the
College of Graduate Studies and Research
in Partial Fulfillment of the Requirements for the
Degree of Master of Science
in the Department of Geography and Planning,
University of Saskatchewan,
Saskatoon
By
Lawrence Christopher Nasen
© Copyright Lawrence C. Nasen, December 2009
All rights reserved
i
PERMISSION TO USE
In presenting this thesis in partial fulfillment of the requirements for a Postgraduate degree from
the University of Saskatchewan, I agree that the Libraries of this University may make it freely
available for inspection. I further agree that permission for copying of this thesis in any manner,
in whole or in part, for scholarly purpose may be granted by the professor or professors who
supervised my thesis work, or in their absence, by the Head of the Department or the Dean of the
College in which my thesis work was done. It is understood that any copying or publication or
use of this thesis or part thereof for financial gain shall not be allowed without my written
permission. It is also understood that due recognition shall be given to me and to the University
of Saskatchewan in any scholarly use which may be made of any materials in my thesis.
Requests for permission to copy or to make use of material in this thesis in whole or part should
be addressed to:
Head of the Department of Geography and Planning
University of Saskatchewan
Saskatoon, Saskatchewan, S7N 5A5

ii
ABSTRACT
The northern Great Plains of Saskatchewan is one of the most significantly modified
landscapes in Canada. While the majority of anthropogenic disturbance to Saskatchewan‘s
grasslands is the result of agricultural practices, oil and gas activity are of increasing concern to
grassland conservation efforts. Although such developments require formal regulatory approval
(Environmental Impact Assessment), follow-up and monitoring of the effects of oil and gas
development on grasslands is not common practice. In the absence of empirical based follow-up
and monitoring, the actual environmental effects of petroleum and natural gas (PNG)
development on grassland ecology and the spatial extent of development are largely unknown.
This thesis examines the spatial and temporal extent of PNG development and its effects on
grassland ecology within a PFRA (Prairie Farm Rehabilitation Administration) pasture in
southwest Saskatchewan. The extent of the changes to infrastructure and the actual impacts from
development within the study area were documented from 1955 to 2006. The actual impacts of
oil and gas activity on grassland ecology were determined by analyzing ground cover
characteristics, soil properties, and community composition at lease sites and compared to
reference pasture sites. Associated with construction practices, lease sites had low herbaceous,
Lycopodiaceae, litter, organic horizon (Ah) thickness, and soil compaction values. Lease sites
were also found to have low desirable species diversity, range health values, and greater
undesirable species presence. Impacts from development were amplified at active, highly
productive lease sites. The impacts associated with PNG development were also found to persist
for more than 50 years, and extend 20m – 25m beyond the physical footprint of infrastructure.
This research will contribute to monitoring and mitigation measures for oil and gas development
within Saskatchewan and Canadian grasslands.

iii
ACKNOWLEDGEMENTS
I am tremendously grateful for the encouragement, support, and patience provided to me by
my supervisor Dr. Bram Noble. My sincere thanks go to my research committee, Dr. O.W.
Archibold and Dr. Jill Johnstone, whose guidance and suggestions improved the content of this
thesis. I would also like to thank Dr. Eric Lamb for his contributions as an external examiner.
Funding, field equipment, and site access were provided by the Prairie Farm Rehabilitation
Administration (PFRA-AAFC). Special thanks to everyone in the Range and Biodiversity
Division of the PFRA, especially Brant Kirychuk for the opportunity to conduct the research and
Bret Ward who provided logistical support and encouragement during my program. Special
consideration is also given to Swift Current-Webb community pasture manager Kelly Ashdown
and Tara Mulhern Davidson for their knowledge and insight. Funding was also provided from
the Department of Geography and Planning at the University of Saskatchewan.
I am especially thankful to my family, Theresa, Ray, and James, whose continuous love,
support, optimism, and encouragement have helped me more than they know. The thesis is
dedicated to the memories of my grandparents, Maureen and John Lomax, and Marry and Kurt
Nasen.
Special thanks to the faculty, staff, and fellow graduate students in the Department of
Geography and Planning, Biology, and Toxicology, and all the people I met throughout
Saskatchewan who made my time here so enjoyable.
iv
TABLE OF CONTENTS
Permission To Use
Abstract i
Acknowledgements ii
Table of Contents iii
List of Tables vi
List of Figures viii
List of Acronyms ix
1.0 INTRODUCTION 1
1.1 Purpose and Objectives 4
1.2 Thesis Organization 6
2.0 OIL AND GAS DEVELOPMENT IN SASKATCHEWAN AND POST-DECISION EFFECTS
ASSESSMENT 7
2.1 Introduction 7
2.2 The Great Plains of Saskatchewan, Canada 7
2.3 Oil and Gas Development in Saskatchewan 11
2.4 Oil and Gas Regulatory Processes and Environmental Impact Assessment 13
2.5 Post-decision Effects Assessment of Oil and Gas Development on Grasslands 15
2.5.1 Follow-up practice 16
2.6 Conclusion 20
3.0 RESEARCH METHODS AND ANALYTICAL TOOLS 22
3.1 Introduction 22
3.2 Study Area: Swift Current-Webb Community Pasture 23
3.2.1 PFRA objectives and land management 27
3.3 Data Collection and Analysis 28
3.3.1 Aerial photo and secondary source data 29
3.3.2 Field data collection and analysis 30
3.3.2.1 Sampling site selection 30
3.3.2.2 Field sampling design 31
3.3.2.3 Field data collection 33
3.3.2.4 Pre-analysis data screening and transformations 35
3.3.2.5 Multi-Response Permutation Procedure (MRPP) 37
3.3.2.6 Non-Metric Multidimensional Scaling (NMDS) 38
3.3.2.7 Indicator species analysis 40
3.3.2.8 Calculating spatial extent of ecological effects 40

v
4.0 RESULTS 42
4.1 Introduction 42
4.2 Spatial and Temporal Development of Oil and Gas in the Swift Current-Webb Community Pasture 42
4.2.1 Physical footprint of oil and gas infrastructure 43
4.3 The Effects of Oil and Gas Lease Sites on Grassland Ecology 51
4.3.1 Comparing lease sites to off-lease sites 51
4.3.2 Relationship between well drill year and lease class, and the impacts to grassland ecology 54
4.3.3 Well production and abiotic and biotic conditions 60
4.3.4 Abiotic and biotic conditions at increasing distance from the well head 64
4.3.5 Spatial extent of oil and gas well sites impacts on grassland ecology 72
5.0 DISCUSSION AND CONCLUSIONS 75
5.1 Introduction 75
5.2 Spatial and Temporal Development of PNG Activity in Southwest Saskatchewan 75
5.3 Impacts of PNG Lease Sites on Mixed Grassland Ecosystems 78
5.4 The Role of PNG Productivity, Infrastructure Type, and Year Drilled 81
5.5 Spatial Extent of the PNG Impacts to Grassland Ecosystems 83
5.6 Implications for EIA Follow-up Programs and Grassland Management 86
5.7 Conclusion 88
LITERATURE CITED 92
APPENDIX 98
vi
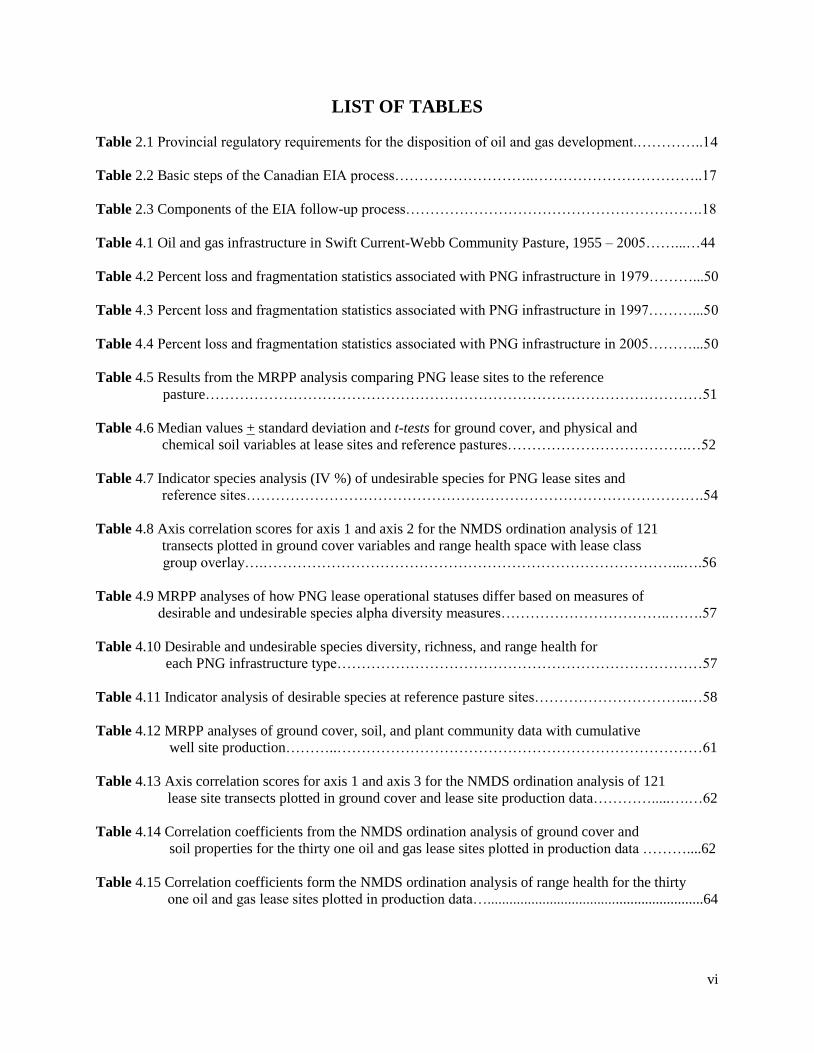
LIST OF TABLES
Table 2.1 Provincial regulatory requirements for the disposition of oil and gas development.…………..14
Table 2.2 Basic steps of the Canadian EIA process………………………..……………………………..17
Table 2.3 Components of the EIA follow-up process…………………………………………………….18
Table 4.1 Oil and gas infrastructure in Swift Current-Webb Community Pasture, 1955 – 2005……...…44
Table 4.2 Percent loss and fragmentation statistics associated with PNG infrastructure in 1979………...50
Table 4.3 Percent loss and fragmentation statistics associated with PNG infrastructure in 1997………...50
Table 4.4 Percent loss and fragmentation statistics associated with PNG infrastructure in 2005………...50
Table 4.5 Results from the MRPP analysis comparing PNG lease sites to the reference
pasture…………………………………………………………………………………………51
Table 4.6 Median values + standard deviation and t-tests for ground cover, and physical and
chemical soil variables at lease sites and reference pastures……………………………….…52
Table 4.7 Indicator species analysis (IV %) of undesirable species for PNG lease sites and
reference sites………………………………………………………………………………….54
Table 4.8 Axis correlation scores for axis 1 and axis 2 for the NMDS ordination analysis of 121
transects plotted in ground cover variables and range health space with lease class
group overlay….…………………………………………………………………………...….56
Table 4.9 MRPP analyses of how PNG lease operational statuses differ based on measures of
desirable and undesirable species alpha diversity measures……………………………..…….57
Table 4.10 Desirable and undesirable species diversity, richness, and range health for
each PNG infrastructure type…………………………………………………………………57
Table 4.11 Indicator analysis of desirable species at reference pasture sites…………………………..…58
Table 4.12 MRPP analyses of ground cover, soil, and plant community data with cumulative
well site production………..…………………………………………………………………61
Table 4.13 Axis correlation scores for axis 1 and axis 3 for the NMDS ordination analysis of 121
lease site transects plotted in ground cover and lease site production data………….....….…62
Table 4.14 Correlation coefficients from the NMDS ordination analysis of ground cover and
soil properties for the thirty one oil and gas lease sites plotted in production data ………....62
Table 4.15 Correlation coefficients form the NMDS ordination analysis of range health for the thirty
one oil and gas lease sites plotted in production data…...........................................................64

vii
Table 4.16 Correlation coefficients for the NMDS ordination analysis of desirable species richness,
and diversity of the thirty one oil and gas lease sites…...........................................................64
Table 4.17 Correlation coefficients from the NMDS ordination analysis of ground cover and
soil properties for the 496 quadrats from each of the thirty one PNG lease sites with
a ground cover, and soil overlay……………………………………………………………...67
Table A.1 Desirable and undesirable grasses, grass-likes, forbs and woody forbs observed……...…....100
Table A.2 Oil and gas lease sites surveyed within Swift Current-Webb Community pasture
based on date, topology, and soil taxonomy………………………………………………....103
Table A.3 Results of indicator analysis of desirable species comparing lease to reference pasture
sites...........................................................................................................................................104
Table A.4 Results of indicator analysis of undesirable species comparing lease sites by class………....105
Table A.5 Results of indicator analysis of desirable species comparing lease sites by class…………....106
Table A.6 Kruskal-Wallis analysis of variance of the lease classes based on ground cover and
soil properties.………………………………………………………………………………..106
Table A.7 Pasture area occupied by the extent of impacts for PNG lease sites, PFRA roads,
trails, and lease access roads in 1979………….......................................................................108
Table A.8 Pasture area occupied by the extent of impacts for PNG lease sites, PFRA roads,
trails, and lease access roads in 1997……………..……………………………………….....108
Table A.9 Pasture area occupied by the extent of impacts for PNG lease sites, PFRA roads,
trails, and lease access roads in 2005……….......................................................................…109
viii
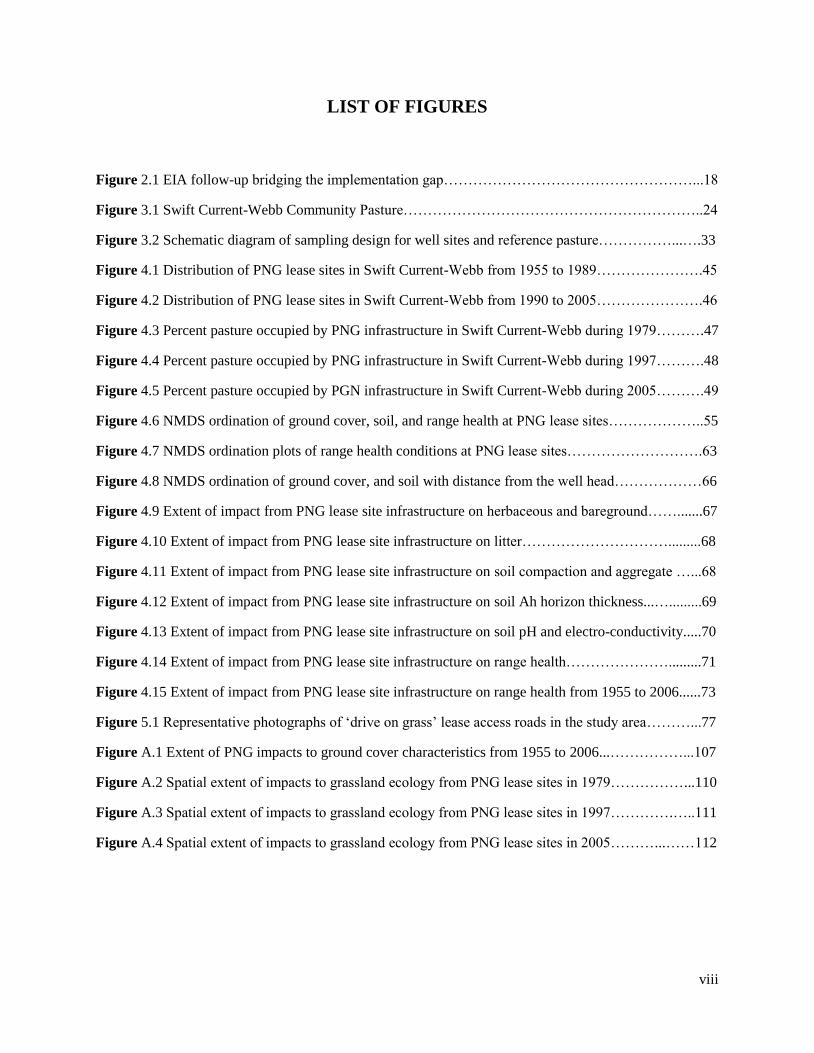
LIST OF FIGURES
Figure 2.1 EIA follow-up bridging the implementation gap……………………………………………...18
Figure 3.1 Swift Current-Webb Community Pasture……………………………………………………..24
Figure 3.2 Schematic diagram of sampling design for well sites and reference pasture……………...….33
Figure 4.1 Distribution of PNG lease sites in Swift Current-Webb from 1955 to 1989………………….45
Figure 4.2 Distribution of PNG lease sites in Swift Current-Webb from 1990 to 2005………………….46
Figure 4.3 Percent pasture occupied by PNG infrastructure in Swift Current-Webb during 1979……….47
Figure 4.4 Percent pasture occupied by PNG infrastructure in Swift Current-Webb during 1997……….48
Figure 4.5 Percent pasture occupied by PGN infrastructure in Swift Current-Webb during 2005……….49
Figure 4.6 NMDS ordination of ground cover, soil, and range health at PNG lease sites………………..55
Figure 4.7 NMDS ordination plots of range health conditions at PNG lease sites……………………….63
Figure 4.8 NMDS ordination of ground cover, and soil with distance from the well head………………66
Figure 4.9 Extent of impact from PNG lease site infrastructure on herbaceous and bareground…….......67
Figure 4.10 Extent of impact from PNG lease site infrastructure on litter………………………….........68
Figure 4.11 Extent of impact from PNG lease site infrastructure on soil compaction and aggregate …...68
Figure 4.12 Extent of impact from PNG lease site infrastructure on soil Ah horizon thickness...….........69
Figure 4.13 Extent of impact from PNG lease site infrastructure on soil pH and electro-conductivity.....70
Figure 4.14 Extent of impact from PNG lease site infrastructure on range health………………….........71
Figure 4.15 Extent of impact from PNG lease site infrastructure on range health from 1955 to 2006......73
Figure 5.1 Representative photographs of ‗drive on grass‘ lease access roads in the study area………...77
Figure A.1 Extent of PNG impacts to ground cover characteristics from 1955 to 2006...……………...107
Figure A.2 Spatial extent of impacts to grassland ecology from PNG lease sites in 1979……………...110
Figure A.3 Spatial extent of impacts to grassland ecology from PNG lease sites in 1997………….…..111
Figure A.4 Spatial extent of impacts to grassland ecology from PNG lease sites in 2005………...……112

ix
LIST OF ACRONYMS
AAFC: Agriculture and Agri-Foods Canada
ABG: Abandoned Gas Well
ABO: Abandoned Oil Well
ACT: Canadian Environmental Assessment Act
AG: Active Gas Well
AO: Active Oil Well
AP3: Antelope
Bbl: Barrels of Oil
CEAA: Canadian Environmental Assessment Agency
CEA: Cumulative Effects Assessment
D&A: Drilled and Abandoned Well
EA: Environmental Assessment
EIA: Environmental Impact Assessment
EMP: Environmental Management Plan
EMPA: Environmental Management and Protection Act
EMS: Environmental Management Systems
EPP: Environmental Protection Plan
GSHRES: Great Sand Hills Regional Environmental Study
HT1/2: Hatton
HTHR4: Hatton-Haverhill
IV: Indicator Value
mcf: Thousands of Cubic Feet
MRPP: Multi-Response Permutation Procedure
MAH: Municipal Affairs and Housing
NMDS: Non-Metric Multidimensional Scaling
NTS: National Topographical System
PFRA: Prairie Farm Rehabilitation Administration
PNG: Petroleum and Natural Gas
PTG: Potential Gas Well
RM: Rural Municipalities
ROW: Right of Way
SAF: Saskatchewan Agriculture and Food
SE: Saskatchewan Environment
SEM: Saskatchewan Energy and Mines
SG: Suspended Gas Well
SO: Suspended Oil Well
WHPA: Wildlife Habitat Protection Act
VEC: Valued Ecosystem Component
1
CHAPTER 1
INTRODUCTION
The majority of the Canadian northern Great Plains is located in Saskatchewan, covering
over 235,000 km2 or approximately 25% of the province‘s total land area (CPRC 1998). In
Saskatchewan, this prairie ecozone is divided into two grassland ecoregions: the mixed grassland
and the moist mixed grassland. The mixed grassland ecoregion is the most predominant and
accounts for 86,444 km2 or 64.5% of the total prairie (Coupland 1961, CPRC 1998).
The mixed grasslands of Saskatchewan once supported a rich and highly specialized flora
and fauna. Today, however, the mixed grasslands is considered endangered habitat (Adams et al.
2004). Since 1995, for example, 37 species of birds, mammals and plants that once thrived in
the prairies have been placed on the List of Species at Risk by the Committee on the Status of
Endangered Wildlife in Canada (COSEWIC) (CPRC 1998). Pressures from agriculture, and
more recently oil and gas development have resulted in the region now being one of the most
significantly modified landscapes in Canada.
Increased surface disturbance via conventional and non-conventional (coal bed methane) oil
and gas activity have the potential to cause both long term and wide spread effects on mixed
grassland ecosystems. Oil and gas surface lease sites, on average, disturb an area of 1.6 ha
(Berquist et al. 2007). For conventional oil and gas activity, lease sites contain a single well and
supporting infrastructure, including a pump jack or screw pump, separator, and solution tank.
For non-conventional activity, the 1.6 ha area includes up to five wellheads, water disposal and
injection facilities, and multiple access roads (Berquist et al. 2007). Associated with lease site
activities is surface disturbance, the potential loss of native species, and risk of significant
2
alteration of flora composition due to both fragmentation and the direct elimination of native
habitat (Wilson 1995; Adams et al. 1996; Sinton 2001; Adams et al. 2004).
There are more than 20,000 operating oil wells and approximately 10,000 gas wells (sweet
and sour) located in the prairie ecozone, of which 10,465 (35%) are located in Saskatchewan
(CAPP 2007). In 2006, 2,250 and 1,350 new oil and gas wells were drilled in Saskatchewan
(CAPP 2007), the majority of which were drilled in the southwest mixed grassland region (CCEI
2006). The future of oil and gas activity in the province is likely to include not only increased
conventional energy sources, but also unconventional operations (CCEI 2006). It is estimated
that 80% of oil and gas production over the next 10 years will come from currently untapped
sources, which are primarily of unconventional sources (CCEI 2006). Further, by 2025,
unconventional gas, namely coal bed methane, tight gas, and shale gas, is projected to account
for over 50% of the total gas produced in Canada (CCEI 2006). This is of particular concern in
Saskatchewan, given that nearly all of the province‘s unconventional gas deposits are located in
grassland ecosystems.
The management and regulation of the impacts associated with oil and gas activities occurs
largely through the Environmental Impact Assessment (EIA) process. At the federal level, this
includes the Canadian Environmental Assessment Act, and in Saskatchewan The Saskatchewan
Environmental Assessment Act. Environmental impact assessment is broadly defined as a formal
process designed to systematically identify, evaluate, predict, mitigate, and monitor the effects of
development activities on the environment (Bailey 1997; Gibson 2002; Cashmore 2004). In
practice however, the majority of attention in the EIA process is on the pre-decision stages of
project approval, with limited attention to the post-development stages to determine the actual
environmental effects of project development and whether mitigation measures were actually

3
implemented and are effective (Arts et al. 2001; Marshall 2005). This, in turn, prevents the
Valued Ecosystem Components (VECs) identified in EIA (see Beanlands and Duinker 1983)
from being included in future policy and practice, and limits the empirical focus of follow-up
programs.
In the context of this study, the most significant limitation to current follow-up practice in
EIA is the lack of integration of ecosystem components, and thus limited conservation of
ecological integrity through post-decision monitoring and mitigation programs (Tinker et al.
2005; Legg et al. 2006). To date, ―…few detailed empirical based studies that explore the utility
of follow-up techniques…‖ have been done (Morrison-Saunders et al. 2003). Legg et al. (2006),
for example, argue that monitoring programs that address the conservation of ecological
components need to be revisited, so as to ensure that predicted effects can be verified and
effectively mitigated. In the absence of ecological-based follow-up, we know little about the
actual outcomes of project development (Morrison-Saunders et al. 2003). This is problematic
given that EIA is the primary means for identifying and mitigating the effects of oil and gas
activity on grassland ecosystems, and oil and gas development is expected to increase in the
province in the near future.
This thesis examines ecological-based follow-up programs for oil and gas activity in
grassland ecosystems, particularly within the context of Prairie Farm Rehabilitation
Administration (PFRA) lands, Agriculture and Agri-Food Canada (AAFC). Established in 1935,
the PFRA‘s primary goals are the protection of grasslands productivity and biodiversity within
the prairie provinces of Canada (PFRA 2005). Despite this mandate, the requirements outlined
for project assessment and approval on PFRA lands lack the implementation of follow-up or
monitoring programs (PFRA 2005a).

4
This research examines the current state of development of oil and gas activity on PFRA
lands, and the integration of ecological components in mitigation and monitoring practices.
Ecological-based follow-up refers to the monitoring and assessment of grassland range health,
which includes measures of vascular plant community composition; percent cover, and soil
properties; compaction, pH, electro-conductivity, texture and horizon thickness.
1.1 Purpose and Objectives
The overall purpose of this research is to advance the current understanding and practice of
ecological-based EIA follow-up programs. More specifically, this thesis ‗follows-up‘ on
decades of oil and gas activity on PFRA lands in southwest Saskatchewan in order to assess the
effects of oil and gas development on grassland ecosystems. This is accomplished through two
research objectives.
The first objective was to characterize the spatial and temporal footprint of oil and gas
development in the Swift Current-Webb Community Pasture. This consists of the following sub-
objectives:
to characterize the distribution of oil and gas infrastructure in the study area from 1955 to
2006; and
to determine the total pasture occupied by oil and gas lease site development.
The second objective was to assess the effects of oil and gas lease sites on grassland ecology.
This consists of the following sub-objectives:
to assess how abiotic and biotic conditions differ between lease and off-lease sites;
to determine how the impacts to abiotic and biotic conditions vary with lease site drill
date and infrastructure lease class;

5
to determine how the impacts to abiotic and biotic conditions vary based on lease site
annual and cumulative production measures;
to examine the relationship between abiotic and biotic conditions at increasing distance
from the well sites; and
to determine the spatial extent of the impacts from PNG development to abiotic and
biotic conditions.
The main contributions of this research are threefold. First, this research helps to advance
the current understanding and practice of ecological-based follow-up programs in EIA. This, in
turn, will allow for more informed EIA decisions, including mitigation measures, to be made
with regards to ecological considerations. Alongside improving the PFRA management
programs, this will contribute to improved understanding of ecological-based follow-up
programs. Second, the collection and analysis of ecological field data in the Swift Current-Webb
Community pasture provides for a better understanding of the effects of oil and gas activity on
grassland communities. The results contribute to improved scientific understanding of how
grassland communities respond to oil and gas lease site activity, and the effectiveness of the EIA
process in managing those effects. Third, this research provides a methodology for conducting
ecological-based EIA follow-up programs and site assessments to mitigate the impacts of oil and
gas activity on grasslands. This methodology addresses concerns raised by the Canadian
Environmental Assessment Agency (2000) regarding the lack of ecological-based follow-up
methods and applications in Canadian EIA.

6
1.2 Thesis Organization
This thesis consists of five chapters, including the introductory chapter. Chapter 2 reviews
the current literature on grassland ecosystems within the context of the potential effects of oil
and gas development, and examines the state-of-practice of post-decision EIA follow-up. The
research methods and study area are described in Chapter 3, followed by presentation of the
research results in Chapter 4. Chapter 5 consolidates and discusses the overall thesis findings
and situates these findings within the broader context of EIA follow-up programs, and identifies
directions for future research.

7
CHAPTER 2
OIL AND GAS DEVELOPMENT IN SASKATCHEWAN AND
POST-DECISION EFFECTS ASSESSMENT
2.1 Introduction
This chapter reviews the current state of grasslands in Saskatchewan and the effects of
anthropogenic disturbance, including oil and gas development, on prairie ecosystems. The
regulatory processes and environmental assessment framework associated with oil and gas
development in the province are also introduced, and the current limitations of project level EIA
in assessing the total effects of disturbance caused by oil and gas development on grasslands is
addressed. Specific attention is given to the status of post-decision follow-up programs and the
inability of current EIA follow-up practices to understand the actual effects of oil and gas
development on grassland ecosystems.
2.2 The Great Plains of Saskatchewan, Canada
The northern Great Plains of Saskatchewan is one of the most significantly modified
landscapes in Canada (Gauthier et al. 2003). Historically, natural disturbances such as fire,
grazing and drought were the primary factors determining vegetation succession in this grassland
ecosystem (Holechek et al. 1995). The introduction of anthropogenic disturbance, however,
specifically large scale crop cultivation, livestock rearing, and grazing, alongside the suppression
of fire, have dramatically altered grassland composition, structure and function (Forman 1995;
Holechek et al. 1995).
8
Approximately 85% of all Canadian prairies have been transformed by anthropogenic
disturbance (Adams et al. 2004). In the northern Great Plains, more than 80% of mixed
grasslands have been transformed (PCAP 1995). The native grasslands that once characterized
the Canadian Great Plains supported rich and highly specialized communities of flora and fauna,
endemic only to the ecoregion. Today the prairie ecozone is home to a growing number of
exotic, threatened, and endangered species (Adams et al. 2004). Over the last century,
agricultural practices in the northern Great Plains have had the greatest impact on the prairie
ecosystem. However, in recent years, increased pressures from large-scale commercial oil and
gas development have significantly altered the remaining native prairie landscape (Sinton 2001;
Berquist et al. 2007). All ecosystem properties are sensitive to natural and anthropogenic
disturbance. When these disturbances are dispersed over large temporal and spatial scales, the
impacts are minimized. However, oil and gas lease sites often include multiple wells located in
close proximity to other petroleum and natural gas (PNG) infrastructure.
The construction of oil and gas lease sites, have the potential to reduce grassland productivity
due to transformation of natural soil components, removal of native plant communities, and the
introduction of exotic species (Wilson 1995; Adams et al. 1996; Sinton 2001; Adams et al.
2004). The effects of surface disturbances associated with oil and gas activity relate
predominantly to the disruption of nutrient and water exchange (Jentsch 2002). The medium for
this exchange is soil, with chemical and physical components that are sensitive to alteration
(Willms et al. 2005). While natural disturbances rarely alter soil properties, anthropogenic
disturbances caused by industrial development have the potential to dramatically affect soil
structure (Zink et al. 1995). For example, a study conducted by Rowell et al. (1993) in south and
central Alberta on the rehabilitation of soils following oil well drilling and pipeline construction
9
in a grassland ecosystem, revealed that the impacts of industrial activity on soils affect a variety
of chemical, physical and biological components. As a result of physical alteration (e.g. soil
compaction, loss of bulk density, redistribution of clay particles, and horizon admixing) from
pipeline construction, disturbed sites were found to have high electrical conductivity, and sulfate
concentrations, and low pH, organic matter, cation exchange capacity, and moisture content in
comparison to adjacent sites undisturbed by pipeline construction (Rowell et al. 1993;
Cummings et al. 2005).
Soil disturbances in grassland ecosystems have a direct effect on vegetation community
composition. Berquist et al.‘s (2007) work on grassland species composition near coal bed
methane development sites supports this claim. Their research found that non-native species
richness increased with increasing proximity to well heads and, at the same time, low native
species richness was observed surrounding disturbed well sites but increased with increasing
distance from the well head. Associated with species composition differences between disturbed
and undisturbed sites were differences in chemical and physical soil properties. Non-native
species at well sites were correlated most significantly with high percentages of nitrogen in soils,
low pH, and low percentages of native plant species (Berquist et al. 2007). Alteration in
environmental gradients and competition regimes surrounding coal bed methane lease sites was
found to promote non-native species establishment.
Altered environments are, however, still subject to species succession and environmental
cycles (MacDougall et al. 2006). This is supported by Wilson et al. (1995), who studied the
natural revegetation of disturbed mixed grasslands in Saskatchewan, dominated by non-native,
exotic and/or fugitive plant species. Their findings indicate that natural succession of disturbed
sites occurred from exotic species to a more native community composition (Stipa comata,
10
Bouteloua gracilis). Further, a study of 45-year old mined land in Dakota by Wali (1999)
reveals how vegetation succession occurs in mixed grasslands following disturbance. Prior to
disturbance, the Dakota site was comprised of Stipa comata, Bouteloua gracilis, Agropyron
smithii, Carex filifolia and Koelaria cristata. Following disturbance, the site experienced an
influx of exotics such as Descurainia sophia, Hordeum jubatum and Kochia scoparia. Over the
45-year period, invasive species were replaced by Stipa viridula, Achillea millefolium and
Schizachyrium scoparium. While the relationship between biodiversity and ecosystem function
is complex, this study suggests that following disturbance natural succession over time can
restore ecosystem biodiversity (Tilman 2004; Fridley et al. 2007).
The conservation of biodiversity is imperative for the preservation of ecological properties
and processes, and is the focus of a great deal of applied ecological research (see Tilman 1997;
Hobson et al. 2002; Schneider et al. 2003; Balvanera et al. 2006). The alteration of biophysical
components associated with anthropogenic disturbances results in the alteration of ecological
properties, which in turn, often results in a loss of biodiversity and a decline in ecosystem
function and native plant species richness (Hooper et al. 2005). This stresses the importance of
incorporating measures of ecological integrity into environmental management and EIA
practices for industrial development sites in grassland environments.
This thesis adopts an applied ecological-based approach to the assessment of grassland
productivity in EIA follow-up that includes examining net primary production, physical and
chemical soil properties, soil hydrologic function (permeability and erosion), cycling of nutrients
and energy from litter, and plant species diversity. This ecological-based approach is termed
‗range health assessment‘, and is specifically developed for assessing the ecological integrity of
grassland ecosystems (Adams et al. 2005). Range health assessments are methodological tools
11
that build upon the more traditional ‗range conditions approach‘ for site assessment, placing
special consideration on plant community type in relation to site potential (Adams et al. 2004).
In this thesis the examination of grassland ecological integrity incorporates a refined range health
assessment methodology to determine the impacts of oil and gas activity.
2.3 Oil and Gas Development in Saskatchewan
Early oil and gas discoveries in Saskatchewan were the result of intensive exploration
activities of large multinational corporations exploring reserves near Lloydminster (CPRC 2006).
Of the first wells drilled in the province, the most significant was a gas well drilled by the
Lloydminster Gas Company, in the rural municipality of Vermillion River (Roy 1998). The
extraction of shallow gas in the province was followed by the discovery of heavy oil, both in the
Lloydminster area and in southwest Saskatchewan (Roy 1988). Within the province, the
commercial development of oil began in the late 1940s (Knight 1956; CPRC 2006). Current
production is largely driven by non-integrated Canadian and American energy companies (CPRC
2006; GSER 2009a), while the majority of the province‘s oil is exported to the United States
(Minnesota and mid-west) and Ontario, via the Enbridge Pipeline (CPRC 2006; GSIR 2008).
Much of the natural gas produced in Saskatchewan is retained in the province, and supports
larger energy-intensive mining operations (CPRC 2006).
The majority of oil and gas reserves in the province are under the jurisdiction of Crown
dispositions. The three major dispositions in the province are petroleum, natural gas, and oil
shale and oil sands (GSER 2009a). Oil reserves are located predominantly in the west,
southwest and south central parts of the province, whereas gas reserves are situated primarily in
the west-southwest, south central, and southeast parts of the province (GSER 2009a). Petroleum

12
and natural gas reserves are extracted from five main Cretaceous formations, namely Bearpaw,
Battle, Belly River, and Milk River (GSER 2009). Recent oil shale and oil sands development in
the province is primarily in the southeast and northwest, and northwest regions of the province,
respectively (GSER 2009a). As of 2009, 78% of total PNG rights in Saskatchewan were held by
the Provincial Crown (GSER 2009a). Freehold land claims (18.5%), Indian reserves (2%), and
Federal jurisdiction (1.5%) comprise the remaining PNG land holdings in the province
(GSER2009a). The province‘s 78% of PNG dispositions accounts for approximately 24 million
hectares of Crown land. Of this, approximately 7 million hectares (29%) has been leased to
national and international oil and gas companies (GSIR 2008).
The majority of Crown dispositions leased by the provincial government are for the
exploration of PNG reserves (GSER 2009). The remaining lease sites issued are for the
exploration of oil shale (38 leases: 777692.5 ha) and oil sand deposits (5 leases: 45355.4 ha)
(GSER 2009). In 2008, revenues from royalties, taxes and sales of petroleum leases totaled
$1.12 billion, or approximately 15% of provincial government revenues (GSIR 2008). The
greatest financial contribution to provincial revenue stems from over 3,200 lease sites in the
southwest region of the province, including Weyburn-Estevan (1,398 wells), Kindersley (1,006
wells), and Swift Current (776 wells) (GSER 2009b).
Over the last twenty years, PNG production in Saskatchewan has doubled (CAPP 2007).
This increase has been most significant in the southwest region of the province (Maple Creek,
Swift Current area) (CAPP 2007). In 2006, 2,250 new oil wells and 1,350 new gas wells were
drilled in the province (CAPP 2007), the majority in the southwest region (CCEI 2006). Most of
the province‘s future sources of unconventional gas reserves, namely coal bed methane, tight
gas, and shale gas, are also situated in this prairie ecozone.

13
2.4 Oil and Gas Regulatory Process and Environmental Impact Assessment
Saskatchewan‘s PNG reserves are managed under The Department of Energy and Mines Act
and The Oil and Gas Conservation Act (DJC 2007). The acts outline and administer the
exploration, development, management and conservation provisions and requirements for non-
renewable resources in the province (GSIR 2001; DJC 2007). Given that the majority of PNG
reserves are located on Crown land, a number of government bodies are involved in PNG
regulation and approval processes (GSHRES 2007). Four governing bodies oversee provincial
regulations for PNG drilling and exploration: Saskatchewan Energy and Mines (SEM),
Saskatchewan Environment (SE), Municipal Affairs and Housing (MAH), and Saskatchewan
Agriculture and Food (SAF) (GSIR 2001). Under certain circumstances, such as PNG
development on PFRA community pastures, the purchase or lease of surface and mineral rights
also involves the jurisdiction of the federal government.
Prior to obtaining approval for oil and gas exploration and development, companies must be
registered in Saskatchewan under the Corporations Branch of Saskatchewan Justice (BSIB
2001). Exploration approval is followed by the purchase or lease of the subsurface PNG rights,
from either individual freehold mineral holders or the Crown (GSIR 2001). In Saskatchewan,
over 75% of mineral rights are held by the province, while 1.5% is held by the federal
government (GSIR 2001). Mineral rights purchased from the Crown are done so through the
Mineral Rights Branch of SEM, and are subject to public offerings (GSIR 2001). It is the role of
SEM to determine if the land in question has any surface restrictions (Table 2.1). If SEM
decides to post the PNG rights for sale, a public offering is held. Once the successful bidder
obtains the PNG lease, the proponent submits to SEM an application to drill, operate and
produce (GSIR 2001). SEM then issues a license to drill, operate and produce based on the
14
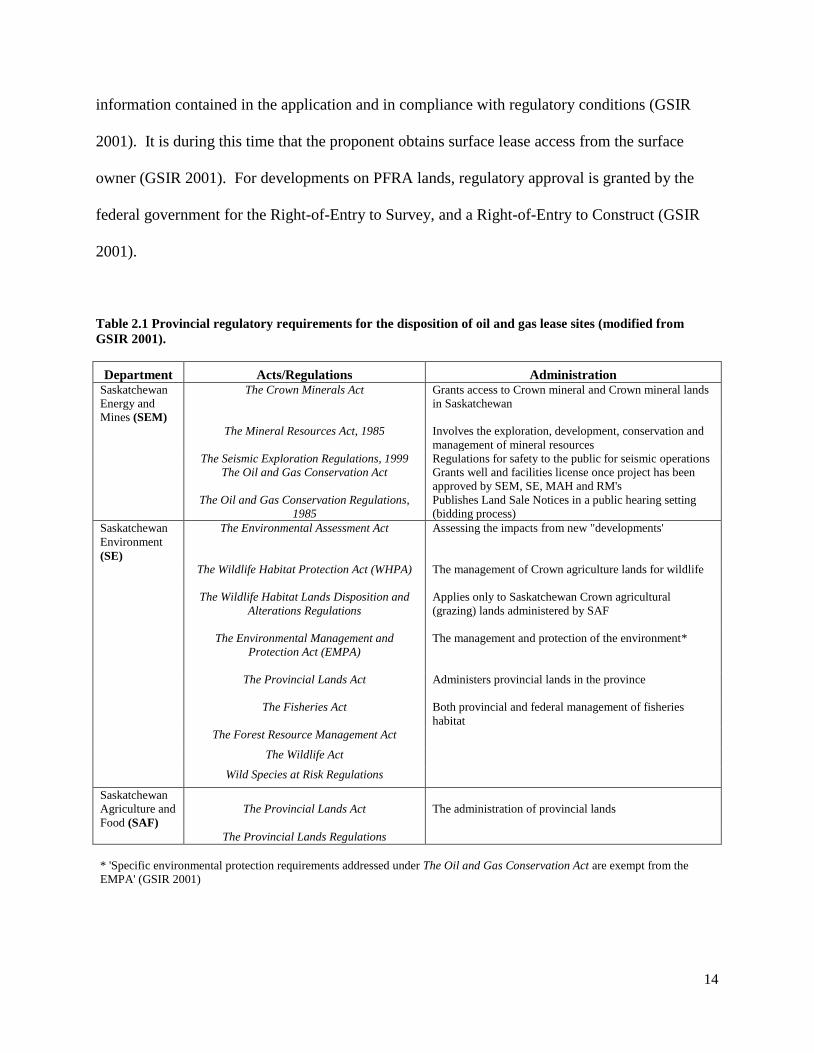
information contained in the application and in compliance with regulatory conditions (GSIR
2001). It is during this time that the proponent obtains surface lease access from the surface
owner (GSIR 2001). For developments on PFRA lands, regulatory approval is granted by the
federal government for the Right-of-Entry to Survey, and a Right-of-Entry to Construct (GSIR
2001).
Table 2.1 Provincial regulatory requirements for the disposition of oil and gas lease sites (modified from
GSIR 2001).
Department Acts/Regulations Administration Saskatchewan
Energy and
Mines (SEM)
The Crown Minerals Act Grants access to Crown mineral and Crown mineral lands
in Saskatchewan
The Mineral Resources Act, 1985 Involves the exploration, development, conservation and
management of mineral resources
The Seismic Exploration Regulations, 1999 Regulations for safety to the public for seismic operations
The Oil and Gas Conservation Act Grants well and facilities license once project has been
approved by SEM, SE, MAH and RM's
The Oil and Gas Conservation Regulations,
1985
Publishes Land Sale Notices in a public hearing setting
(bidding process)
Saskatchewan
Environment
(SE)
The Environmental Assessment Act
Assessing the impacts from new "developments'
The Wildlife Habitat Protection Act (WHPA)
The management of Crown agriculture lands for wildlife
The Wildlife Habitat Lands Disposition and
Alterations Regulations
Applies only to Saskatchewan Crown agricultural
(grazing) lands administered by SAF
The Environmental Management and
Protection Act (EMPA)
The management and protection of the environment*
The Provincial Lands Act
Administers provincial lands in the province
The Fisheries Act
Both provincial and federal management of fisheries
habitat
The Forest Resource Management Act
The Wildlife Act
Wild Species at Risk Regulations
Saskatchewan
Agriculture and
Food (SAF)
The Provincial Lands Act The administration of provincial lands
The Provincial Lands Regulations
* 'Specific environmental protection requirements addressed under The Oil and Gas Conservation Act are exempt from the
EMPA' (GSIR 2001)

15
Before site preparation and development can commence, all necessary approvals must be
obtained from SE, SAF, MAH and/or the respective Rural Municipalities (RM‘s) (GSIR 2001).
Regardless of private or Crown surface rights, the proponent must obtain environmental
clearance from SE (GSIR 2001). In those cases where surface rights fall on Crown agricultural
land (i.e., PFRA land holdings), the proponent must also contact SAF to secure surface lease
rights from the lessee (GSIR 2001) before development can begin. Under SAF jurisdiction, the
proponent is required to submit a site restoration plan as part of the development proposal (GSIR
2001). For development on PFRA lands, the proponent contacts SAF to determine if any
restrictions exist. If the lessee grants approval, the proponent prepares a survey plan, project
proposal and restoration plan for SAF and SE. For development within environmentally
sensitive areas, such as native prairie, SE requires the proponent to submit both project proposals
and environmental protection plans (GSIR 2001). Once SAF has conducted its environmental
review of the proposed project, a surface lease agreement is prepared and approval for drilling is
granted (GSIR 2001). At this stage, it is possible for SE to determine the project a
‗development‘ under section 2(d) of The Saskatchewan Environmental Assessment Act, which
initiates the EIA process and a formal review of the development plan or environmental
protection plan by the Environmental Assessment Branch (EAB) (GSIR 2001).
2.5 Post-decision Effects Assessment of Oil and Gas Development
The first environmental assessment process in Canada was introduced in 1973, by way of the
federal Environmental Assessment and Review Process (EARP), later to be implemented as law
in 1995 under the Canadian Environmental Assessment Act (Gibson 2002). In Saskatchewan,
EIA was adopted in 1975, and formally implemented as law under The Saskatchewan
Environmental Assessment Act in 1980. Broadly defined as a decision making tool employed to

16
identify and evaluate the potential environmental effects of particular actions (Cashmore 2004;
Hanna 2005), EIA ensures ―an evaluation of the effects likely to arise from a major project or
action which significantly affects the environment‖ (Jay et al. 2007).
From a practical standpoint, the main goal or purpose of EIA is to constitute the generation
of information (focused reports) related to the decision making process through the provision of
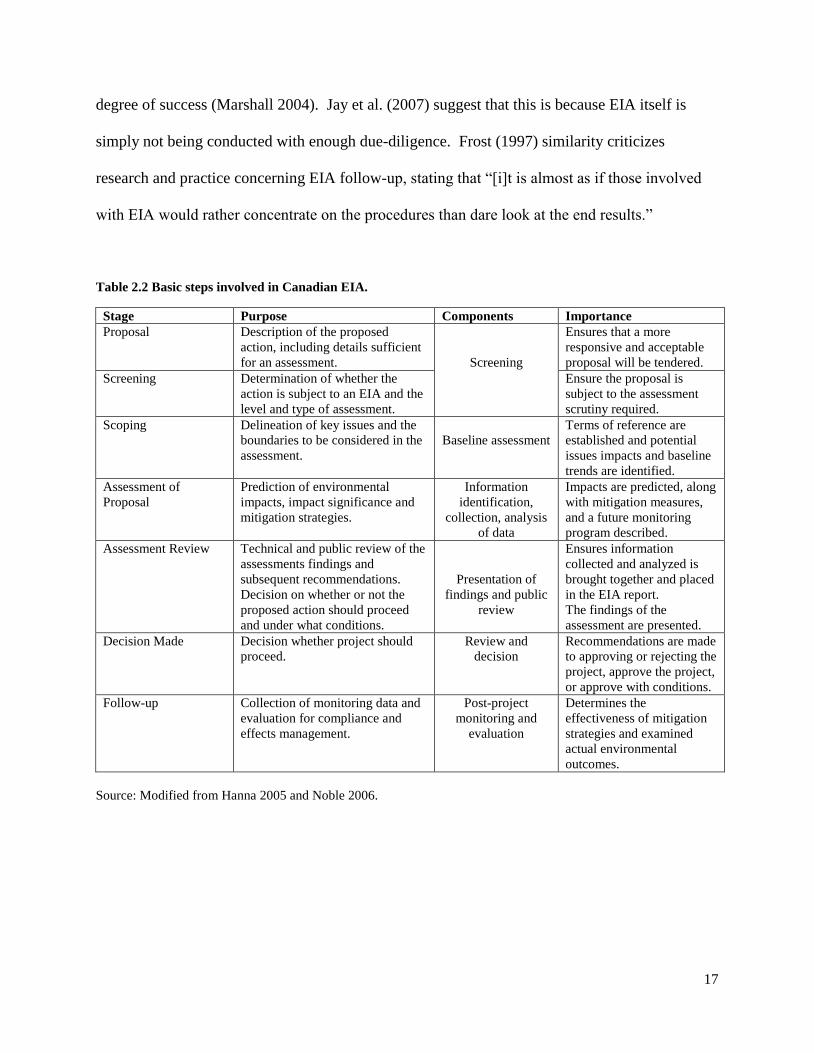
accurate impact forecasts (Bailey 1997; Cashmore 2004). The process of conducting an EIA,
which fulfills this purpose, involves a series of sequential steps from proposal development to
post-approval follow-up (Table 2.2). The follow-up stage of EIA, which focuses on the actual
ecological implications of development actions, is arguably the most important part of EIA in
ensuring that the process meets its sustainability mandate. The problem, however, is that follow-
up in EIA is rarely done or rarely done well (Hanna 2005; Marshall et al. 2005; Jay et al. 2007).
2.5.1 Follow-up practice
It is widely recognized and accepted that the EIA process is made more accountable through
the integration of follow-up programs (Figure 2.1) (Table 2.3) (Bailey 1997; Arts et al. 2001;
Marshall et al. 2005; Jay et al. 2007; Morrison-Saunders et al. 2007). In Canada, follow-up
programs are a legislated requirement under the Canadian Environmental Assessment Act
(CEAA 2000) for comprehensive and review panel assessments, and at the discretion of the
regulatory authority for screening-level EIAs. Under The Saskatchewan Environmental
Assessment Act there is no formal requirement for follow-up, but the Minister of Environmental
has the authority to require that follow-up be conducted and monitoring programs implemented
as a condition of project approval. Despite this, follow-up programs are yet to be effectively
included in the EIA process, provincially, federally, or internationally, with any consistent
17
degree of success (Marshall 2004). Jay et al. (2007) suggest that this is because EIA itself is
simply not being conducted with enough due-diligence. Frost (1997) similarity criticizes
research and practice concerning EIA follow-up, stating that ―[i]t is almost as if those involved
with EIA would rather concentrate on the procedures than dare look at the end results.‖
Table 2.2 Basic steps involved in Canadian EIA.
Stage Purpose Components Importance
Proposal Description of the proposed
action, including details sufficient
for an assessment.
Screening
Ensures that a more
responsive and acceptable
proposal will be tendered.
Screening Determination of whether the
action is subject to an EIA and the
level and type of assessment.
Ensure the proposal is
subject to the assessment
scrutiny required.
Scoping Delineation of key issues and the
boundaries to be considered in the
assessment.
Baseline assessment
Terms of reference are
established and potential
issues impacts and baseline
trends are identified.
Assessment of
Proposal
Prediction of environmental
impacts, impact significance and
mitigation strategies.
Information
identification,
collection, analysis
of data
Impacts are predicted, along
with mitigation measures,
and a future monitoring
program described.
Assessment Review Technical and public review of the
assessments findings and
subsequent recommendations.
Decision on whether or not the
proposed action should proceed
and under what conditions.
Presentation of
findings and public
review
Ensures information
collected and analyzed is
brought together and placed
in the EIA report.
The findings of the
assessment are presented.
Decision Made Decision whether project should
proceed.
Review and
decision
Recommendations are made
to approving or rejecting the
project, approve the project,
or approve with conditions.
Follow-up Collection of monitoring data and
evaluation for compliance and
effects management.
Post-project
monitoring and
evaluation
Determines the
effectiveness of mitigation
strategies and examined
actual environmental
outcomes.
Source: Modified from Hanna 2005 and Noble 2006.

18
Figure 2.1. EIA follow-up bridging the implementation gap, (Source: modified from Marshall 2004)
Table 2.3 Components of the follow-up process
Elements IAIA 00’ Actions Outlined Functions or Objectives of Follow-Up
Monitoring The collection of data and comparison with
standards, predictions or expectations
Provide information about the
consequences of an activity
Evaluation The appraisal of the conformance with standards,
predictions or expectations as well as the
environmental performance of the activity
Enhance scientific knowledge about
environmental systems
Management Making decisions and taking the appropriate
action in response to issues arising from
monitoring and evaluation activities
Improve public awareness about the actual
effects of development projects
Communication Informing the stakeholders as well as the general
public about the results of the EIA follow-up
Maintain some decision-making flexibility
Source: Compiled based on Arts et al. 2001; Marshall 2005
Addressing these concerns is imperative to advancing follow-up in EIA and thus determining
the actual outcomes of development and the effectiveness of mitigation measures. Incorporating
feedback into the EIA process in the form of follow-up promotes learning from experience, and
prevents EIA from becoming a pro forma exercise (Marshall 2005). Morrison-Saunders et al.
(2005) and Morrison-Saunders and Marshall (2007), for example, argue that follow-up programs
can be implemented to control compliance, verify predictions, reduce uncertainty, and improve
pre-decision making within an EIA framework. The overall benefit of follow-up in EIA, is an
improved understanding of impact uncertainties associated with an activity through project

19
planning and decision-making, and the opportunity to mitigate potentially unforeseen adverse
environmental outcomes (Arts et al. 2001).
Much international attention has focused on identifying the results of follow-up through case
study analysis (Morris et al. 1995), and the culmination of core has been the focus of several
annual general meetings of the International Association of Impact Assessment (IAIA) (see
Morrison-Saunders et al. 2003). Storey and Noble (2002), for example, using examples drawn
primarily from Canada illustrate the limitations of current follow-up approaches and suggest
―that greater value from the process could be achieved by focusing on whether the objectives of
the project in question were achieved‖ rather than retaining the current focus of EIA follow-up
on verifying the predictive accuracy of the project‘s environmental impact statement. Their
investigation of follow-up was an empirical focus on methodologies, which is a rare but
beneficial approach to follow-up analysis. The advantage of studying methodologies is that such
research reveals the underlying structure and systematic approach associated with conducting
follow-up, identifying gaps in knowledge and potential flaws in the process (Morris et al. 1995).
Lessons learnt from methodological reviews of follow-up (see Storey and Noble 2002) reveal
that the effectiveness of the impact assessment process itself is secondary to the monitoring and
post-approval assessment of actual environmental outcomes. In other words, predictive accuracy
and promised mitigation is of secondary importance to verifying the effectiveness of impact
management measures and determining whether unanticipated environmental effects are
occurring. At a time when follow-up was perceived as important, but rarely done, the approach
taken by Storey and Noble (2002) was innovative, focusing on methodological efficiency in
terms of mitigating real impacts. As a result, advancements in follow-up research need to focus
on the efficacy of follow-up, and in particular follow-up methodology, in order to shift current
20
practice from a simple ‗damage control‘ function towards a more proactive approach to
environmental management through the EIA process. The challenge, however, is that although
the benefits associated with conducting more effects-based follow-up programs are well
documented, knowledge of how follow-up programs can be advanced through empirical research
is relatively unknown.
The Canadian Environmental Assessment Agency has addressed this concern, in part,
through research priorities developed to improve follow-up effectiveness associated with EIA
science, which include the development of effective approaches for determining follow-up
requirements that are of a consistent design; methods for assessing and reporting on the accuracy
of predictions and the effectiveness of mitigation measures; the development of consistent
approaches or ‗best practices‘ in conducting follow-up; assessment of the contributions of
follow-up programs to better understand cumulative effects assessment (CEA) and proposed
directions for integrating CEA and follow-up design; and identifying, integrating and applying
broad and case-specific sustainability decision criteria and indicators (CEAA 2000).
2.6 Conclusion
It is well documented that the construction of oil and gas infrastructure (pipelines, access
roads, lease sites) can dramatically reduce grassland biodiversity. This is of significant concern
in Saskatchewan, given that oil and gas development in the mixed grasslands region is likely to
increase in the foreseeable future. The problem is amplified by the inability of the current
environmental management framework, EIA, to properly identify, predict, mitigate and monitor
the effects of development on the environment. The literature indicates that, in practice, the most
important component of the EIA process, follow-up, is rarely done or rarely done well. As a

21
result, the EIA process, and hence development management and mitigation, is focused primarily
on predicted outcomes. Such an approach fails to address the actual environmental effects
associated with oil and gas development on grassland ecosystems (see Tinker et al. 2005; Legg et
al. 2006).
There have been few detailed, empirically based studies that explore the utility of follow-up,
particularly within the context of grassland ecosystems (see Morrison-Saunders et al. 2003). A
recent review of the requirements for project approval on PFRA lands, for example reveals that
no attention is given to monitoring and mitigation programs (PFRA 2005a). This lack of follow-
up prevents knowing the actual effects of oil and gas development, and whether the mitigation
measures implemented are working. As such, follow-up programs that address the conservation
of ecological components needs to be revisited, and a more scientifically robust approach
developed such that attention can be directed towards identifying and managing actual project
outcomes on ecological systems (see Legg et al. 2006). This research will help determine the
actual effects of oil and gas development on grassland ecology, and provide guidance for future
follow-up program design and implementation on PFRA lands in southwest Saskatchewan.

22
CHAPTER 3
RESEARCH METHODS AND ANALYTICAL TOOLS
3.1 Introduction
This research uses a combination of methods and analytical tools including aerial photo
analysis, secondary-source data, and the collection and analysis of ecological field data. Both
methods were used to determine the spatial extent of oil and gas development and the impacts to
grassland ecosystems. The goal of the first phase of this research was to determine the spatial
and temporal distribution and associated physical footprint of oil and gas infrastructure in the
study area. To accomplish this, satellite and air photo imagery were used, and direct loss of
PFRA pasture from PNG infrastructure was calculated.
The second phase of the research, the assessment of environmental effects of oil and gas
development on grasslands, involved the collection and analysis of field data from the Swift
Current-Webb PFRA community pasture. To gain a representative sample, thirty-one lease sites
were surveyed, stratified into three groups. The data collected included ground cover, physical
and chemical soil properties, and plant community data. The goal was to assess the effects of oil
and gas development on grassland plant communities and soil properties. To realize this
objective, differences between oil and gas lease sites and reference pastures were examined
based on plant community and soil variables. Lease site drill year, infrastructure, operational
status, and production data were examined to gain a greater understanding of the factors that may
influence development impacts, and to determine the ecological footprint surrounding oil and gas
lease sites, beyond the direct footprint of the infrastructure.

23
3.2 Study Area: Swift Current-Webb Community Pasture
Swift Current-Webb Community Pasture was established in 1938 by the PFRA,
Agriculture and Agri-Foods Canada. While the provincial government of Saskatchewan holds
the land rights, the pasture falls under the jurisdiction of the federal government. The pasture
covers a total area of approximately 98.8 km2 (9,882 ha), and is situated within the RMs of Webb
(No. 138) and Swift Current (No. 137). The pasture is further defined by the legal land locations
of Twn15/Rge16, Twn16/Rge15 and Twn15/Rge15 W3M (Figure 3.1).
Swift Current-Webb has a cold, semi-arid steppe climate. The average annual temperature is
approximately 3 oC, with mean monthly temperatures ranging from -10
oC (January) to 16.0
oC
(July) (Environment Canada Meteorological Service of Canada 2007). On average, the area
receives approximately 350mm of precipitation: 280mm of rain and 70mm of snow water
equivalent (Environment Canada Meteorological Service of Canada 2007). Prevailing winds are
from the west-northwest, where the average annual wind speed is approximately 20km/h
(GSHRES 2007).
Landscape features in the region are a direct result of both the advance and retreat of the Late
Wisconsinan Laurentide ice sheet during the last glaciation period (late Pleistocene and early
Holocene) (GSHRES 2007). Topographic relief is low, and is reflective of the low energy
fluvial environment present approximately 11,000 year ago (Klassen 2002). The aspect of the
study area is generally to the NW, with an average slope of 0.64o. Remnants of the glaciation
event are reflected by gently irregular glaciolacustrine plains, consisting of glaciofluvial
complexes, fine grained glaciolacustrine silts and sands, and aeolian deposits (Klassen 2002).
The fine-grained sediments were further transported by wind activity (aeolian) which resulted in
the soil textures and dune complexes currently observed.

Figure 3.1 Swift Current-Webb Community Pasture Source: Provincial Maps of Canada, (http://atlas.gc.ca) and Prairie Farm Rehabilitation Administration Archives
25
Sand dunes are located within the NW section of the pasture, and are part of the same dune
complex that comprises the Great Sand Hills.
Glacial and post-glacial deposits have resulted in the formation of a predominantly fine
grained, well sorted sandy environment. Three dune sand and sandy loam soil classes, all of
which fall under the brown classification, dominate Swift Current-Webb pasture. The three main
soil taxonomic groups are the humic regosol Antelope (AP3), and orthic brown Hatton-Haverhill
(HTHR4) and Hatton (HT1/2). The fine-grained nature of the parent material along with
increased wind alteration has resulted in all soils displaying poor development (Saskatchewan
Institute of Pedology 1998). Soil textures increase the pasture‘s susceptibility to wind erosion,
particularly when surface vegetation is removed. The sensitivity of the area to disturbance has
resulted in the land being used historically for grazing rather than cereal crop production
(Saskatchewan Institute of Pedology 1998).
Despite the pasture‘s isolation from agricultural cultivation and urban development,
industrial development and cattle grazing activity have significantly altered the vegetation. Swift
Current-Webb pasture is a remnant patch of semi-intact native prairie surrounded by cultivated
lands. Fire has been suppressed within the pasture since it was established, thus drought and
grazing pressures have been the predominant factors influencing species and community
composition. An ecological assessment circa 2005 (PFRA 2005b) indicates that the native
grassland communities make up 49.40 km2 (approximately 50%) of the pasture, while the
remaining 50% consists of re-seeded vegetation (PFRA 2005b). The portions of the pasture re-
seeded were done so with Agropyron pectiniforme (crested wheat grass), in an attempt to
stabilize the highly eroded landscape. The remainder of the pasture consists of a mix of both tall
and short annual grass species: Stipa comata (needle-thread grass), Calamovilfa longifolia (sand
26
reed grass), Agropyron smithii (western wheat grass), and Koelaria cristata (June grass).
Bouteloua gracilis (blue grama) is also present, but is not dominant (Table A.1). Stands of
shrubs are present, particularly in the sand dunes, and include Artemisia cana (sagebrush),
Elaeagnus commutata (wolf willow), Juniperus horizontalis, (creeping juniper), and
Symphoricarpus occidentalis (western snowberry). The most common perennial forbs are Rosa
acicularis (prickly rose), Heterotheca villosa, (hairy golden aster), Psorelea lanceolata (lanced
leaved psorelea), Artemisia frigida (pasture sage), Salvia argentea (silver sage) and Grindelia
squarrosa (gumweed).
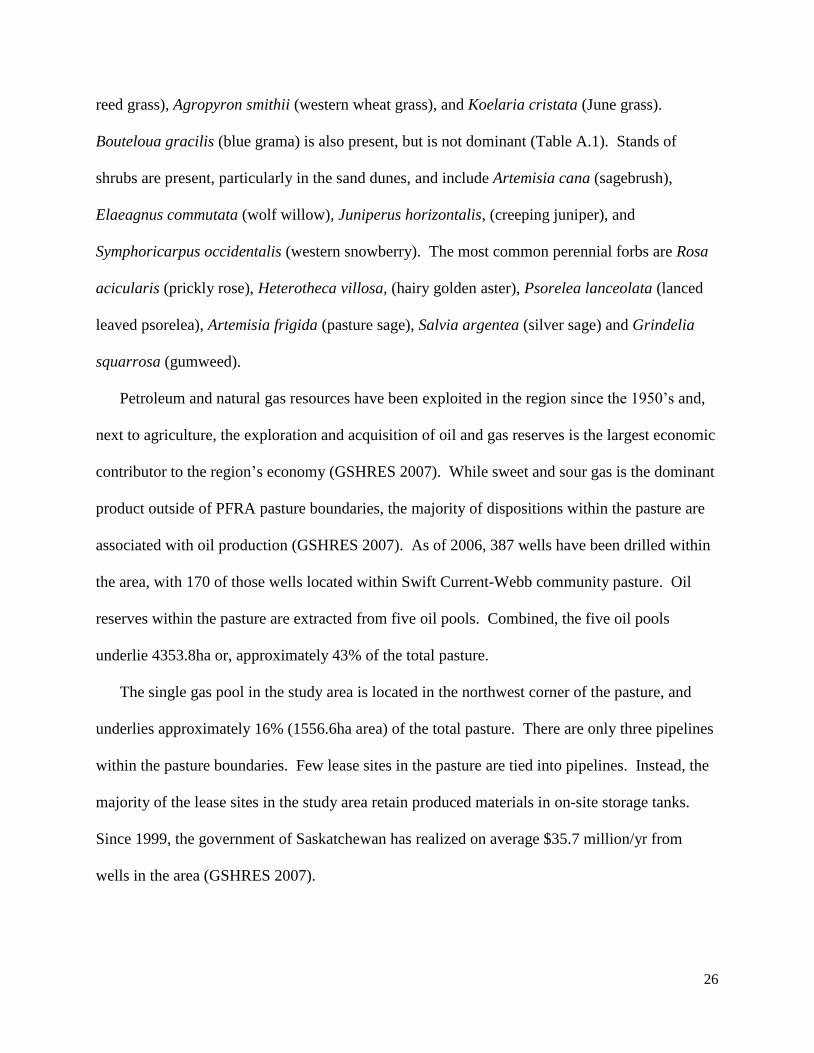
Petroleum and natural gas resources have been exploited in the region since the 1950‘s and,
next to agriculture, the exploration and acquisition of oil and gas reserves is the largest economic
contributor to the region‘s economy (GSHRES 2007). While sweet and sour gas is the dominant
product outside of PFRA pasture boundaries, the majority of dispositions within the pasture are
associated with oil production (GSHRES 2007). As of 2006, 387 wells have been drilled within
the area, with 170 of those wells located within Swift Current-Webb community pasture. Oil
reserves within the pasture are extracted from five oil pools. Combined, the five oil pools
underlie 4353.8ha or, approximately 43% of the total pasture.
The single gas pool in the study area is located in the northwest corner of the pasture, and
underlies approximately 16% (1556.6ha area) of the total pasture. There are only three pipelines
within the pasture boundaries. Few lease sites in the pasture are tied into pipelines. Instead, the
majority of the lease sites in the study area retain produced materials in on-site storage tanks.
Since 1999, the government of Saskatchewan has realized on average $35.7 million/yr from
wells in the area (GSHRES 2007).
27
3.2.1 PFRA objectives and land management
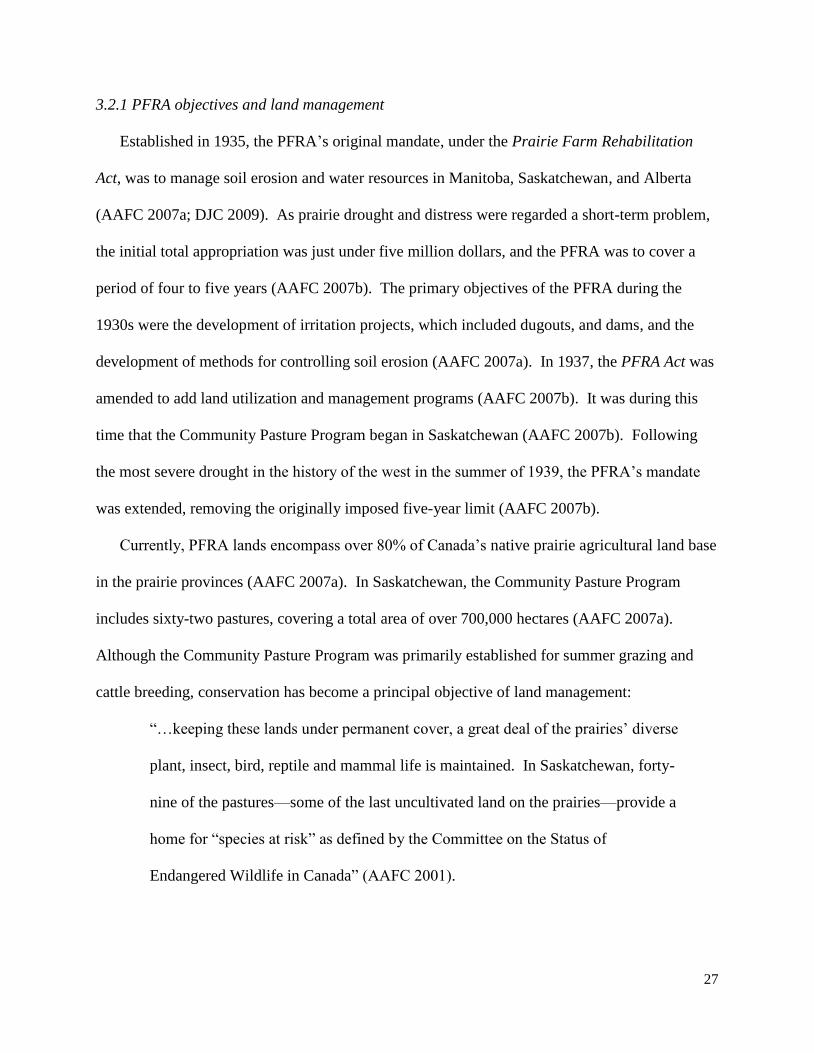
Established in 1935, the PFRA‘s original mandate, under the Prairie Farm Rehabilitation
Act, was to manage soil erosion and water resources in Manitoba, Saskatchewan, and Alberta
(AAFC 2007a; DJC 2009). As prairie drought and distress were regarded a short-term problem,
the initial total appropriation was just under five million dollars, and the PFRA was to cover a
period of four to five years (AAFC 2007b). The primary objectives of the PFRA during the
1930s were the development of irritation projects, which included dugouts, and dams, and the
development of methods for controlling soil erosion (AAFC 2007a). In 1937, the PFRA Act was
amended to add land utilization and management programs (AAFC 2007b). It was during this
time that the Community Pasture Program began in Saskatchewan (AAFC 2007b). Following
the most severe drought in the history of the west in the summer of 1939, the PFRA‘s mandate
was extended, removing the originally imposed five-year limit (AAFC 2007b).
Currently, PFRA lands encompass over 80% of Canada‘s native prairie agricultural land base
in the prairie provinces (AAFC 2007a). In Saskatchewan, the Community Pasture Program
includes sixty-two pastures, covering a total area of over 700,000 hectares (AAFC 2007a).
Although the Community Pasture Program was primarily established for summer grazing and
cattle breeding, conservation has become a principal objective of land management:
―…keeping these lands under permanent cover, a great deal of the prairies‘ diverse
plant, insect, bird, reptile and mammal life is maintained. In Saskatchewan, forty-
nine of the pastures—some of the last uncultivated land on the prairies—provide a
home for ―species at risk‖ as defined by the Committee on the Status of
Endangered Wildlife in Canada‖ (AAFC 2001).

28
PFRA land management also addresses the ―Biodiversity Strategy‖ outlined by AAFC through
the conservation of natural lands within agro-ecosystems (AAFC 2007a). This is accomplished
through the use of conservation range management principles and practices to maintain
biodiversity on rangelands (AAFC 2007a). Given that both the mixed and short grass prairies of
North America have been reduced to approximately 30% of their former extent (Gauthier et al.
2003; AAFC 2009), the role of prairie ecosystem conservation is of significant importance
within the province of Saskatchewan. However, despite conservation initiatives, pressures from
development are posing limitations on ecosystem based land management strategies.
It should be expected that PFRA management plans for oil and gas reflect the goals of its
mandate, but this is not necessarily the case. A review of the requirements for oil and gas project
approval on PFRA lands reveals that limited to no attention is given to following-up on
development actions through monitoring programs (PFRA 2005a). As a result, there is limited
knowledge of the effects of oil and gas development on the grassland ecosystem. This is
concerning given that as a federal department, the PFRA (AAFC) has a legislated responsibility
under the Canadian Environmental Assessment Act to ensure that the effects of development are
assessed and appropriately managed.
3.3 Data Collection and Analysis
Two types of data were collected to realize the objectives of this thesis: aerial photo and
secondary-source data for oil and gas wells in the study area, and primary field data. To realize
the first objective, aerial photo and secondary-source data of oil and gas well production and
distribution were collected to characterize the spatial and temporal footprint of oil and gas
infrastructure development in the study area. The second objective, to assess the effects of oil

29
and gas lease sites on grassland ecology, was realized through primary field data collection and
analysis. For multivariate statistical analyses, multiple methods were used to ensure that the
trends were not biased by the method chosen.
3.3.1 Aerial photo and secondary source data
Well ticket (GeoScoutTM
) information was used to classify all lease sites within the study
area into one of five time periods (pre-1970, 1970-1979, 1980-1989, 1990-1999, and 2000-
2006). Oil and gas lease sites were then further stratified based on infrastructure type (oil, or
gas) and well activity (active, completed/suspended, or abandoned).
The amount of the study area occupied by oil and gas infrastructure was determined by air
photo and satellite imagery analysis. Air photos (A25143–1979, A27728-1997) were obtained
from the National Air Photo Library, Natural Resources Canada, and cover a township area
(1:50,000). Prior to analysis, air photos were orthorectified using ArcGIS 9.3TM
. Satellite
images (2005 - SPOT 5 Imagery) were used to document recent oil and gas activity in the study
area. The high resolution (2.5m) black and white SPOT 5 images used are part of the
Saskatchewan Geospatial Imagery Collaborative Project, and were obtained from the
Information Technologies Office website of the Government of Saskatchewan. To cover the
study area, three 1:50,000 satellite images (NTS – 72K08, 72K01, 72J05) were required.
For each of the three years where imagery are available (1979, 1997, and 2005), the footprint
of oil and gas infrastructure was calculated by overlaying polygons onto surface features. Area
and perimeter were calculated for PFRA roads, trails, lease sites and lease access roads using
HAWTH TOOLSTM
. Fragmentation metrics calculated for each patch class included patch
density (#/100ha), and edge density (edge:area ratio) (Linke et al. 2008). The percentage of
30
pasture area occupied by PFRA roads, trails, lease sites and lease access roads was determined
over the entire twenty-six year time period. PFRA trails represent cattle trails with light vehicle
traffic, PFRA roads are ROWs present prior to PNG development. PNG infrastructure includes
lease sites and lease site access roads. Maps were generated to display land use change
occurring from 1979-1991 and 1991-2005. Because no air photos or satellite images of the study
area exist for the 1980s, the timeframe of the analysis differs from the distribution maps.
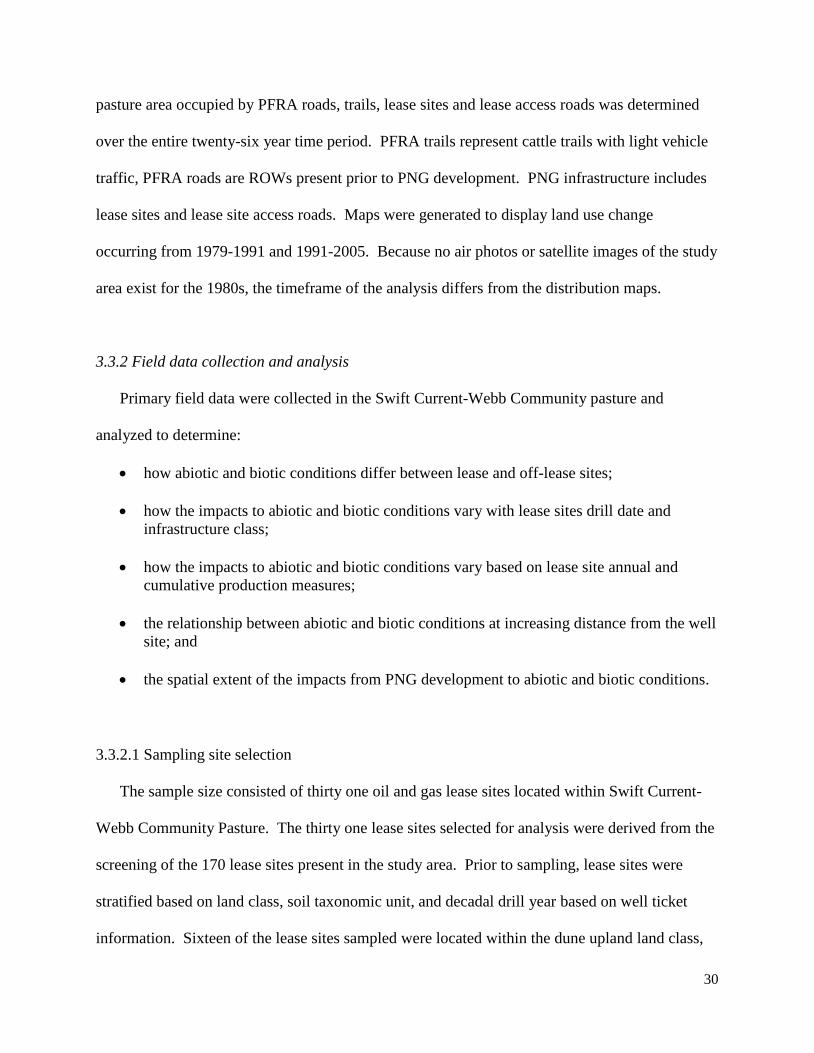
3.3.2 Field data collection and analysis
Primary field data were collected in the Swift Current-Webb Community pasture and
analyzed to determine:
how abiotic and biotic conditions differ between lease and off-lease sites;
how the impacts to abiotic and biotic conditions vary with lease sites drill date and
infrastructure class;
how the impacts to abiotic and biotic conditions vary based on lease site annual and
cumulative production measures;
the relationship between abiotic and biotic conditions at increasing distance from the well
site; and
the spatial extent of the impacts from PNG development to abiotic and biotic conditions.
3.3.2.1 Sampling site selection
The sample size consisted of thirty one oil and gas lease sites located within Swift Current-
Webb Community Pasture. The thirty one lease sites selected for analysis were derived from the
screening of the 170 lease sites present in the study area. Prior to sampling, lease sites were
stratified based on land class, soil taxonomic unit, and decadal drill year based on well ticket
information. Sixteen of the lease sites sampled were located within the dune upland land class,

31
while fifteen were located within mixed grassland. Due to the spatial distribution of the lease
sites, it was not possible to sample an equal representation of lease sites stratified by the three
soil taxonomic units Antelope (AP3), Hatton-Haverhill (HTHR4), and Hatton (HT1/2) (Table
A.2). The lease sites encompassed final drill years from 1955 to 2005. With the exception of the
pre-1970s decade class, eight lease sites per decade (1970, 1980, 1990 and 2000) were sampled.
3.3.2.2 Field sampling design
Field data were collected during the summer (May 28th
to July 19th
) of 2008. Due to the
spatial extent of the disturbance on the landscape, a gradient to background approach was
adopted for assessing the impacts from development. Estimation of a species area curve from
pre-existing range health data (PFRA 2005b), indicated that four transects provided sufficient
sample area to adequately characterize plant community composition at a lease site. Since the
extent of lease site disturbance from the wellhead was initially unknown, pilot sites were used to
determine the appropriate transect length. The 6 pilot sites included oil and gas wells drilled in
the 1980s, 1990s, and 2000s from the two landscape classes. A transect length of 40m was
determined from the pilot sites to adequately capture the spatial extent of disturbance from the
wellhead, which was then applied to the remainder of the lease sites sampled (Figure 3.2). To
prevent overlap of the transects, azimuth orientations were separated by a minimum of 10
degrees. In cases where a transect ran parallel to or intersected with a roadway, the transect
azimuth was re-determined. Following the sampling design for the Great Sand Hills Regional
Environmental Study (GSHRES 2007), all transects were not allowed to be within 20m of a
roadway buffer generated from a species response curve. This was a precautionary measure to
prevent bias from the disturbance effects of roadways.

32
Transects were used to position the plots at even intervals away from the lease, where a
0.50m2 litter estimation frame and a .20m x .50m Daubenmire frame were used to collect
environmental and biotic data. For each 40m transect, the distance between each of the subplots
was 5m. The sampling design was based on previous research done in Alberta and
Saskatchewan grasslands (GSHRES 2007). When enclosures located within the lease site ROW
ran perpendicular to the transect line, their distance (m) from the wellhead was recorded.
For every lease site surveyed, a reference sample (pasture land) located 100m from the lease
site ROW boundary was established. The reference sites were located within a similar land class
as the associated lease site, and upwards of 200m from dugouts, and areas of heavy grazing
activity. Each reference site was comprised of eight subplots divided into four transect lines
oriented N-S and E-W. Each of the four transect lines contained two subplots where biophysical
information was collected using both a 0.50m2 litter estimation frame and a .20m x .50m
Daubenmire frame. Reference site soil data were collected from a single soil sample from the
center of the ‗x‘ sampling pattern. The reference sites were also located at least 20m from
adjacent and surrounding roadways.

33
Figure 3.2 Schematic diagram showing the sampling design for well sites and reference pasture
3.3.2.3 Field data collection
Data were collected at the quadrat level from the thirty one lease sites and associated
reference sites. The environmental variables examined included: slope, aspect, % herbaceous, %
bare ground, % litter, soil compaction, % aggregates, % clubmoss (Lycopodiaceae), % oil
spill/contaminated. For each transect, the environmental variables mentioned were sampled at
the subplot level. Eight samples were collected per transect and reference site, for a total of 32
samples per lease site. Lease site slope (o) is expressed as an average value per transect,
measured from quadrats one, four, five and eight using a Brunton Compass. For the reference
sites, a single slope value was recorded for each of the four transects. Canopy cover values were
used to determine visual estimates of herbaceous, bare ground, aggregate, clubmoss, and oil
spill/contaminated ground cover values. Cover values, which summed to 100%, were visually
estimated to the nearest 1%. Soil compaction was measured by penetration resistance (kg/cm2)

34
using a calibrated ring penetrometer with a 12mm cone diameter at 2cm depth. Litter cover
values were determined by hand raking the 0.50m2 quadrats, as outlined by Adams et al. (2003).
Data collected from soil samples included: pH, electro-conductivity, % silt, % sand, % clay.
For both the lease and reference sites, soil samples were taken to a depth of 15cm with a 10cm
diameter soil corer. Given that the landscape (blowout dune complex) displays poorly developed
soils, a 15cm coring depth was considered deep enough to document soil conditions in the
rooting zone and organic soil horizon depths. At the lease sites, samples were taken from two
randomly selected transects. The soil samples used to determine pH and electro-conductivity
were taken from quadrats one, four, five and eight for one transect, and quadrats one and eight
for the other transect. Of the two transects selected for pH and electro-conductivity soil samples,
soil texture (% silt, % sand, % clay) was determined from the first, middle, and last quadrat of
one transect. For each reference site, a single soil sample was taken. Soil pH and electro-
conductivity were measured using a Fisher Scientific AP62TM
portable soil pH/mV meter. Soil
texture was measured using a Horiba LA-950TM
laser particle size analyzer. Particle size
distribution was determined for sand, silt and clay.
Biotic data collected from both lease and reference pasture sites consisted of plant species,
visually estimated to the nearest 1% cover. Percent cover data was collected for all observed
grasses and herbaceous or woody forb species, considered desirable or undesirable to the study
area. For each species the average % cover for the transect line was calculated. Vegetation
trampling and trailing from livestock were also documented.
Production data from oil and gas lease sites included: final drill year and month; year
suspended; production time; and production type (gas, oil, water). Oil and gas data were
collected from GeoScoutTM
well tickets. Lease type was also obtained from well tickets, and
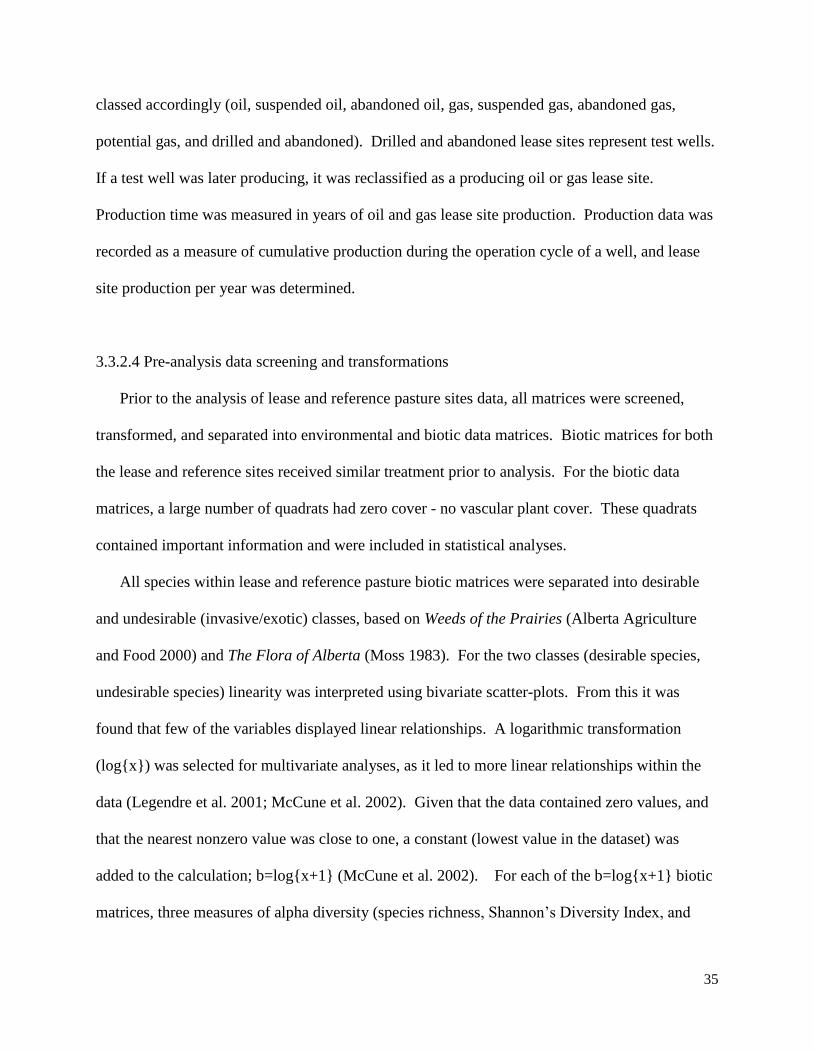
35
classed accordingly (oil, suspended oil, abandoned oil, gas, suspended gas, abandoned gas,
potential gas, and drilled and abandoned). Drilled and abandoned lease sites represent test wells.
If a test well was later producing, it was reclassified as a producing oil or gas lease site.
Production time was measured in years of oil and gas lease site production. Production data was
recorded as a measure of cumulative production during the operation cycle of a well, and lease
site production per year was determined.
3.3.2.4 Pre-analysis data screening and transformations
Prior to the analysis of lease and reference pasture sites data, all matrices were screened,
transformed, and separated into environmental and biotic data matrices. Biotic matrices for both
the lease and reference sites received similar treatment prior to analysis. For the biotic data
matrices, a large number of quadrats had zero cover - no vascular plant cover. These quadrats
contained important information and were included in statistical analyses.
All species within lease and reference pasture biotic matrices were separated into desirable
and undesirable (invasive/exotic) classes, based on Weeds of the Prairies (Alberta Agriculture
and Food 2000) and The Flora of Alberta (Moss 1983). For the two classes (desirable species,
undesirable species) linearity was interpreted using bivariate scatter-plots. From this it was
found that few of the variables displayed linear relationships. A logarithmic transformation
(log{x}) was selected for multivariate analyses, as it led to more linear relationships within the
data (Legendre et al. 2001; McCune et al. 2002). Given that the data contained zero values, and
that the nearest nonzero value was close to one, a constant (lowest value in the dataset) was
added to the calculation; b=log{x+1} (McCune et al. 2002). For each of the b=log{x+1} biotic
matrices, three measures of alpha diversity (species richness, Shannon‘s Diversity Index, and
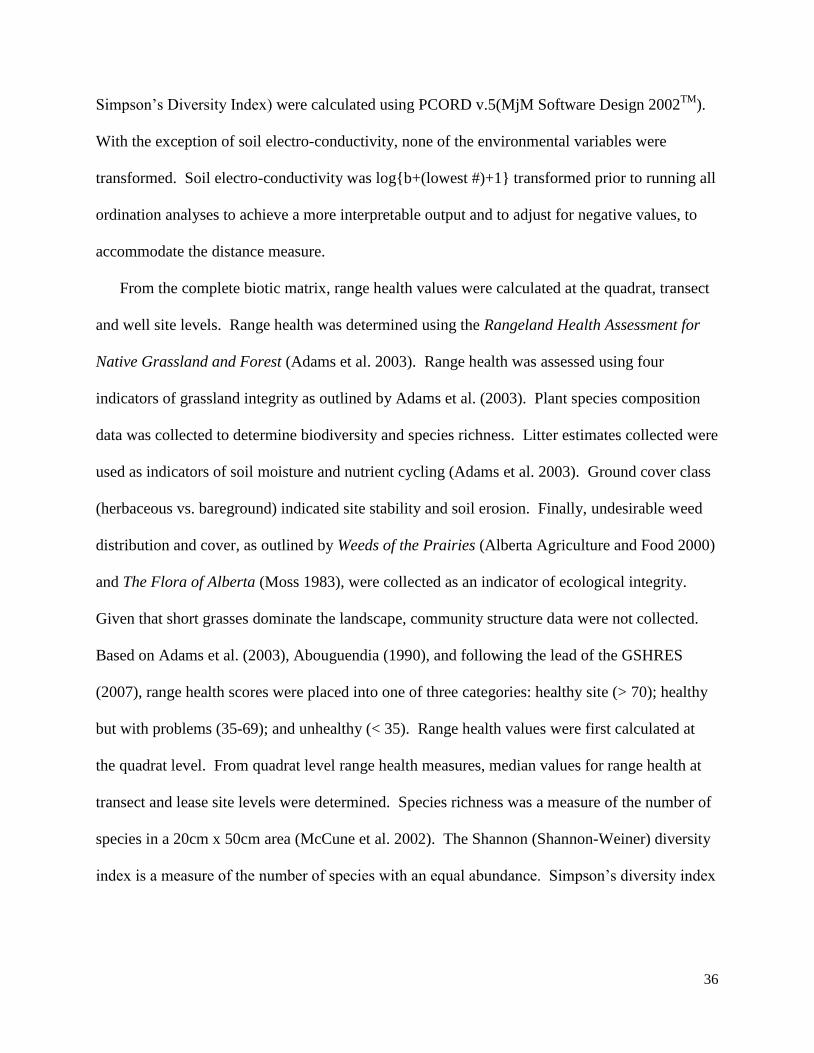
36
Simpson‘s Diversity Index) were calculated using PCORD v.5(MjM Software Design 2002TM
).
With the exception of soil electro-conductivity, none of the environmental variables were
transformed. Soil electro-conductivity was log{b+(lowest #)+1} transformed prior to running all
ordination analyses to achieve a more interpretable output and to adjust for negative values, to
accommodate the distance measure.
From the complete biotic matrix, range health values were calculated at the quadrat, transect
and well site levels. Range health was determined using the Rangeland Health Assessment for
Native Grassland and Forest (Adams et al. 2003). Range health was assessed using four
indicators of grassland integrity as outlined by Adams et al. (2003). Plant species composition
data was collected to determine biodiversity and species richness. Litter estimates collected were
used as indicators of soil moisture and nutrient cycling (Adams et al. 2003). Ground cover class
(herbaceous vs. bareground) indicated site stability and soil erosion. Finally, undesirable weed
distribution and cover, as outlined by Weeds of the Prairies (Alberta Agriculture and Food 2000)
and The Flora of Alberta (Moss 1983), were collected as an indicator of ecological integrity.
Given that short grasses dominate the landscape, community structure data were not collected.
Based on Adams et al. (2003), Abouguendia (1990), and following the lead of the GSHRES
(2007), range health scores were placed into one of three categories: healthy site (> 70); healthy
but with problems (35-69); and unhealthy (< 35). Range health values were first calculated at
the quadrat level. From quadrat level range health measures, median values for range health at
transect and lease site levels were determined. Species richness was a measure of the number of
species in a 20cm x 50cm area (McCune et al. 2002). The Shannon (Shannon-Weiner) diversity
index is a measure of the number of species with an equal abundance. Simpson‘s diversity index
37
represents the chance that two randomly selected plants will be of the same species (McCune et
al. 2002).
Prior to running all statistical analyses, data matrices were screened for multivariate outliers
using the most appropriate distance measure. All samples found to have a distance greater than
2.0 standard deviations from the overall mean were removed. A Euclidean distance measure was
used for all analyses involving environmental variables, while a Bray-Curtis (SØrenson) distance
measure was used for the biotic data (McCune et al. 2002).
3.3.2.5 Multi-Response Permutation Procedure (MRPP)
All MRPP analyses were run using PCORD v.5(MjM Software Design 2002TM
). Distance
measures were selected on the basis of maintaining consistency with associated analyses (outlier
analysis, ordination) and attaining the most logical/interpretable output. MRPP analyses were
selected for group comparison given that they are not confined by the assumptions of linearity
(McCune et al. 2002). This non-parametric randomization procedure calculates the average
within-group distance for each group, and the probability of difference by randomly
reassignment of sample units to groups. The output of this procedure is a test statistic (A-value,
Delta, and t-statistic) that represents a measure of difference between groups. An A-value equal
to zero indicates within group heterogeneity expected by change, while a value greater than zero
indicates greater heterogeneity occurring within groups by chance. Assumptions are based on
the calculated p-value, where a value <0.05 indicates significant group differences (McCune et
al. 2002). For all MRPP analyses, plots were used as replicates.
MRPP analysis was used to test for statistical differences between the lease and reference
sites. The two sites were compared based on ground cover variables: % herbaceous ground

38
cover, % bare ground cover, % club moss cover; environmental variables: litter (lb/ac), Ah soil
horizon depth (mm), soil compaction (kg/cm2); soil properties: pH, and electro-conductivity; and
biotic variables: range health (median values per transect), and desirable and undesirable species
alpha diversity. For each group of variables, a separate MRPP test was run.
Statistical differences in response values between lease site final drill year and infrastructure
type were tested using MRPP analysis. Response variables included the ground cover and
environmental variables identified above as well as biotic variables of range health (median
values per transect), and desirable/undesirable species alpha diversity. The soil sampling design
prevented the comparison of final drill year, and infrastructure type based on soil pH, electro-
conductivity, and texture.
3.3.2.6 Non-Metric Multidimensional Scaling (NMDS)
To determine the basis for which a priori defined groups differed, an NMDS (McCune et al.
2002) method of ordination was used. NMDS is considered an exploratory ordination technique,
and in this case was used as an investigative tool (McGarigal et al. 2000; Beals 2006; Hirst et al.
2007). Variables were input to NMDS where ordinal scale environmental and biotic data were
used to generate vector overlay plots to compare a priori groups (McCune et al. 2002). For the
analysis of ground cover, soil and biotic data, plots were used as replicates. NMDS was selected
as the ordination method because despite log transformation, the data remained non linear, which
is accommodated by NMDS (McCune et al. 2002). Although NMDS does not require linear
data, monotonic transformations reduce stress and improve stability of the final solution as they
alter the distances calculated between observations within the ordination data without changing
their ranks (Legendre et al. 2001; McCune et al. 2002). Further, environmental and biotic
39
variables contained a significant number of zero values, which would have resulted in poor
performances with other ordination techniques. For each ordination analysis, the distance
measure was selected to maintain consistency with other analytical tools. All NMDS ordinations
were run with PCORD v.5(MjM Software Design 2002TM
). The a priori defined group variables
(drill year, infrastructure class, and distance from well head) were overlaid in the ordination with
symbols to display classes. Environmental and biotic variables were used to generate vector
overlay plots (McCune et al. 2002). For each analysis, the number of samples, variables, runs,
dimensionality, stress, instability, Monte Carlo test p-value, axis scores (r2) values, and distance
measure were recorded. Scree plots were generated for each NMDS analysis to determine the
number of axes (dimensionality) in the final solution which captured the most variation in the
data, with the lowest stress. The number of axes selected was based on the ―elbow‖ in the scree
plot (McCune et al. 2002).
The analysis of lease site final drill year and infrastructure type was based on the same data
used for the MRPP analysis. The median values provided a more interpretable and accurate
ordination output. An NMDS ordination analysis was used to determine how lease site
production influenced ground cover, environmental, and soil variables, as well as the biotic
variables range health (median values per well), and desirable/undesirable species alpha
diversity. The analysis used production data (production time (yrs), gas (mcf), oil (Bbl), and
water (Bbl)) from each of the thirty one leases sites. From the NMDS, a correlation analysis was
used to determine how distance from the well head influenced ground cover, physical and
chemical soil, and biotic variables. Distance measures from the well head were assigned to
classes 0m – 40m at a 5m intervals: 0m, 5m, 10m, 15m, 20m, 25m, 30m, 35m, 40m. The
analysis included all ground cover, soil, and range health values, measured as a median values

40
across transects. Biotic variables include the % cover and alpha diversity measures of desirable
and undesirable species. To correct for the presence of zero range health values close to the
well, the lowest observed value (2) was added to all sample units.
3.3.2.7 Indicator species analysis
Using PCORD v.5(MjM Software Design 2002TM
), Dufrene and Legendre‘s (1997) method
for calculating species indicators (McCune et al. 2002) were run to determine how a priori
groups differed based on desirable and undesirable species presence. Indicator analyses were run
for both the desirable and undesirable species classes to determine which species most
significantly differed between lease sites based on drill year and lease type. For all indicator
analyses, a Monte Carlo test of significance was set to 4,999 permutations and a random seed
was selected. Indicator Values (IV %) were selected as the strongest indicators of difference
between the groups. From all analyses, all species had a relative abundance value greater than
5%, and were not considered rare to the environment. For the comparison of lease and reference
sites the desirable plant species dataset contained 1183 plots and 46 variables (species) while the
undesirable plant species dataset contained 1176 plots and 40 variables. For this analysis, an IV
was used to determine how species differed between the four classes: desirable by year, desirable
by lease, undesirable by year and undesirable by lease.
3.3.2.8 Calculating the spatial extent of ecological effects
Graphical representations were used to determine how variables differed with distance from
the well head. Geographic extents of effects in meters were calculated for ground cover
characteristics, soil properties and biotic data. Ground cover and soil variables % herbaceous

41
and % bareground, % aggregate and soil compaction, and soil pH and electro-conductivity were
plotted against each other due to strong correlation scores. The representation of biotic data
included undesirable species richness and range health values.
The spatial extent of the impacts from development (i.e., distance from the well head) was
calculated for each of the following date classes: 1950 – 1979, 1980s, 1990s, and 2000s. These
‗impact zones‘ were generated for trails, PFRA and lease access roads, and lease sites. Impact
zones were calculated in ArcGIS 9.3TM
using BUFFER WIZARDTM
and HAWTH TOOLSTM
.
Fragmentation metrics were calculated for each patch class included patch density (#/100ha), and
edge density (Linke et al. 2008).
For the three years (1979, 1997, and 2005), the spatial extent of the ecological effects were
generated for trails, PFRA and lease access roads, and lease sites. The spatial extents were
calculated in ArcGIS 9.3TM
using BUFFER WIZARDTM
and HAWTH TOOLSTM
, and overlain
onto the previously generated polygons for each of the three maps (1979, 1997, and 2005). From
the impact assessments of the Great Sand Hills (GSHRES 2007), a 20m impact zone was
adopted for trails, and roads. Based on the results from the graphical representations a 25m
impact extent was assigned to all lease sites.

42
CHAPTER 4
RESULTS
4.1 Introduction
This chapter presents the results for each of the two main objectives outlined in Chapter 1.
The results include findings from the analysis of the spatial and temporal development and
distribution of oil and gas lease sites and associated infrastructure in Swift Current-Webb PFRA
pasture and surrounding area, and the effects of oil and gas lease site activity on grassland plant
communities and soil properties.
4.2 Spatial and Temporal Development of Oil and Gas in the Swift Current-Webb
Community Pasture
The majority of oil and gas development in the study area and surrounding region occurred
during the mid to late 1990s (Table 4.1) (Figures 4.1, 4.2). Over 60% of PNG development in
the area occurred during this time period, with four times as many wells drilled in this decade
than in the previous decades combined. The magnitude of development that occurred during the
latter part of the 1990s is reflected by the calculated patch density metric of wells per hectare for
oil and gas lease sites, which increased from 0.4 wells/ha in 1997 to 1.10 wells/ha by 2005. The
comparison of study area lease site drill dates to provincial data reveals that production trends in
the study area reflect the development of oil pools throughout southwest region of Saskatchewan
in general (GSIR 2009).
Development in the study area and surrounding region is focused primarily on oil extracted
from six oil pools that encompass an area approximately of 43.6 km2. As of 2006, there were 81
actively producing oil wells within the pasture, or which approximately 75% were drilled during

43
the latter part of the1990s. During the fifty-year period of development in the area, natural gas
production accounted for only 4% of total well development. The dominance of oil production
in the study area is not reflective of production in the region. Southwest Saskatchewan
(Wymark, Gull Lake, and Maple Creek) is dominated by natural gas production (GSIR 2009).
The majority of oil production occurs in the southeast (Weyburn, Estevan) region of the province
(GSIR 2009).
4.2.1 Physical footprint of oil and gas infrastructure
Between 1979 and 2005, the physical footprint of oil and gas infrastructure increased from
0.20% to 1.00% of the landscape in the study area. Most of this increase occurred between 1997
and 2005, when oil and gas infrastructure and the total direct loss of grassland habitat more than
doubled (Figures 4.3 – 4.5). The direct loss of grassland habitat to trails and PFRA roads
decreased between 1979 and 2005. During the same time, however, lease access roads increased
from occupying 0.13% to 0.42% of the landscape. The trend was also observed in patch density
values, where patch density per 100ha increased from 0.11 patches in 1979 to 0.12 patches in
1997 and 0.42 patches in 2005 (see Tables 4.2 – 4.4). This increase is due in part to the change
in use and reclassification of roads and trails as lease access roads. The observed trend coincides
with findings from the GSHRES (2007), where new road segments were 150 times more likely
to be associated with new lease development than elsewhere on the landscape.
Edge density values associated with development were greatest for existing PFRA and lease
site access roads (Tables 4.2 - 4.4). In 2006 the total percent loss from infrastructure within the
pasture was 1.26% (Table 4.4). Of this 1.26%, PFRA and lease site access ROWs accounted for
6% and 33% of the study area, respectively, with an edge density value for ROWs of 3,299m/ha.

44
Lease sites, which contributed to 49% of the total 1.26% loss, had a combined edge density value
of only 595m/ha. This indicates that the edge density values from ROWs are nearly six times
greater than those associated with oil and gas lease sites. One of the most significant findings
from the fragmentation metric is the change in edge density from 3,676.7 for 11 access roads in
1979, to 1954.0 for 41 access roads in 2005. This indicates that management practices involving
the construction of ROWs have decreased edge habitat. A similar trend was observed for oil and
gas lease sites. Although lease sites on average had much lower area to edge values, the change
from 419.7 for 14 wells in 1979 to 595.0 for 108 wells in 2005 indicates some improvements in
management practice. At the landscape level, these are desired trends given that increased edge
density increases the edge effect and landscape fragmentation. Edge habitats are often associated
with undesirable plant species, and reductions in desirable plant biodiversity.
TABLE 4.1 Oil and gas infrastructure in the Swift Current-Webb Community Pasture, 1955 – 2005.
Lease Site Classification pre-1970s 1970s 1980s 1990s 2000s
Active Oil 1 1 9 61 9
Completed/Suspended Oil 0 0 5 17 1
Abandoned Oil 11 3 11 26 2
Active Gas 2 1 0 0 0
Completed/Suspended Gas 2 1 0 3 1
Abandoned Gas 0 1 1 0 0
Total Number of Leases 16 7 26 107 13

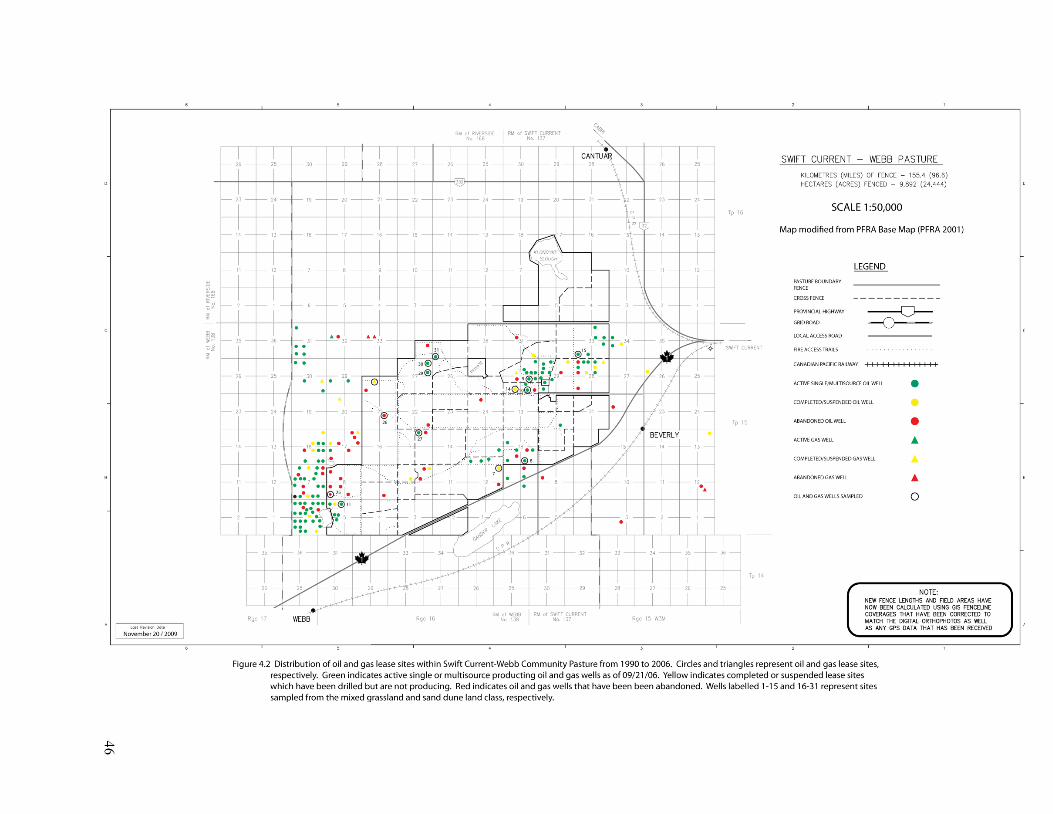

47
Figure 4.3 Distribution of oil and gas lease sites within Swift Current-Webb Community
Pasture (AAFC-PFRA) in 1979.
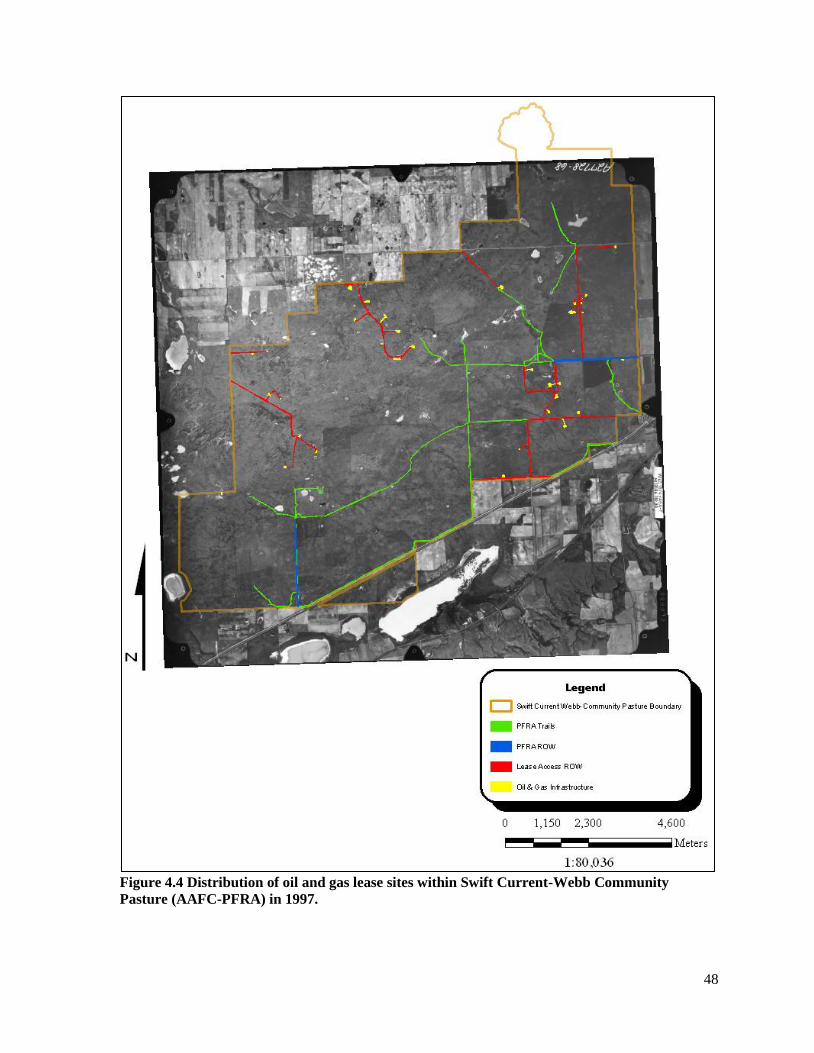
48
Figure 4.4 Distribution of oil and gas lease sites within Swift Current-Webb Community
Pasture (AAFC-PFRA) in 1997.

49
Figure 4.5 Distribution of oil and gas lease sites within Swift Current-Webb Community
Pasture (AAFC-PFRA) in 1997.

50
TABLE 4.2 Pasture area occupied by oil and gas infrastructure (PFRA roads, trails, lease sites, lease access
roads) in 1979
1979 Air Photo
Patch
Count Patch Class Area (ha) Perimeter (m)
Patch Density
(#/100ha)
Edge Density
(m/ha) %Area Loss
2 PFRA Pasture 9,736.21 58,837.18 N/A N/A N/A
3 PFRA Roads 14.66 15,700.88 0.03 1,071.30 0.15
13 Trails 42.70 93,495.01 0.13 2,189.60 0.44
14 Lease Sites 6.77 2,841.23 0.14 419.70 0.07
11
Lease Access
Roads 12.66 46,547.26 0.11 3,676.70 0.13
TOTAL
43 N/A 9,813.00 21,7421.56 N/A N/A 0.79
TABLE 4.3 Pasture area occupied by oil and gas infrastructure (PFRA roads, trails, lease sites, lease access
roads) in 1997
1997 Air Photo
Patch
Count Patch Class Area (ha) Perimeter (m)
Patch Density
(#/100ha)
Edge Density
(m/ha) % Area Loss
2 PFRA Pasture 9,702.20 59,046.50 N/A N/A N/A
2 PFRA Roads 10.72 9,641.50 0.02 899.10 0.11
13 Trails 46.98 82,642.63 0.13 1,759.00 0.48
34 Lease Sites 12.45 10,454.15 0.4 839.60 0.13
12
Lease Access
Roads 33.71 52,193.80 0.12 1,548.30 0.35
TOTAL
63 N/A 9,806.07 21,3978.52 N/A N/A 1.07
TABLE 4.4 Pasture area occupied by oil and gas infrastructure (PFRA roads, trails, lease sites, lease access
roads) in 2005
2005 Air Photo
Patch
Count Patch Class Area (ha) Perimeter (m)
Patch Density
(#/100ha)
Edge Density
(m/ha) % Area Loss
2 PFRA Pasture 9,815.39 59,050.93 N/A N/A N/A
2 PFRA Roads 7.33 9,851.90 0.02 1,345.00 0.08
6 Trails 17.48 33,210.46 0.06 1,900.50 0.18
108 Lease Sites 57.47 34,191.74 1.10 595.00 0.59
41
Lease Access
Roads 41.38 80,861.10 0.42 1,954.00 0.42
TOTAL
159 N/A 9,939.03 217,166.129 N/A N/A 1.26

51
4.3 The Effects of Oil and Gas Lease Sites on Grassland Ecology
Understanding the spatial and temporal development of the oil and gas industry, and the
direct physical footprint of associated oil and gas infrastructure, is necessary, but not sufficient,
to understand the actual effects of development activities on the landscape. Arguably, the effects
of oil and gas development extend well beyond the direct disturbance of the infrastructure. The
broader impacts of oil and gas development on grassland ecosystems may be assessed by
evaluating the influences of the timing of lease site drill activities, infrastructure type, PNG
production on grassland communities, and the distance to which the effects from development
progress outwards from the well head.
4.3.1 Comparing lease sites to off-lease sites
Oil and gas lease sites in the study area differed most significantly from the reference pasture
based on ground cover composition variables and species composition. MRPP analysis from the
thirty-one surveyed sites and reference pastures revealed that the PNG lease sites differed from
the reference pasture based on undesirable species diversity, and ground cover composition
variables (Table 4.5).
TABLE 4.5 MRPP analysis comparing oil and gas lease sites to the reference pasture
Multi-response Permutation Procedure (MRPP)
Test
n-
lease
n-Reference
pasture A-value Observed Delta Expected Delta t-stat
Ground cover
composition 29 118 0.13 0.23 0.26 -34.40**
Undesirable species
% cover 31 115 0.09 0.26 0.29 -18.03**
Undesirable alpha
species 25 120 0.36 0.15 0.23 -71.04**
*Superscript ** indicates values at a 0.01 significance level.

52
When compared to reference pasture sites, lease sites were observed to have lower %
herbaceous cover, % clubmoss cover, % litter values, and greater % bareground values (Table
4.6). On average, the percentage of bare ground (34%) observed within 20m of oil and gas lease
sites was 3.5 times greater than that at the reference pasture sites. At the same time, the percent
of lease site herbaceous ground cover (65%) was significantly lower than the reference pasture
sites (93%). Lease site litter values were 3 times lower than those at the reference pastures
(Table 4.6).
Soil Ah horizon thickness was found to significantly differ between the lease and reference
pasture sites. When compared to lease sites, on average, the Ah thickness values at reference
sites (7cm) were almost 3 times thicker. Similarly, when compared to the lease sites, the upper
20cm of the soil column at the reference sites had lower pH, % clay, and higher electro-
conductivity values (Table 4.6). Lease and reference sites showed no difference based on soil
compaction.
TABLE 4.6 Median values + standard deviation and t-tests scores for ground cover, and physical
and chemical soil variables at lease sites and reference pastures.*
Lease sites + std. Reference pasture + std. t
% Herbaceous 65.38 + 7.46 93.13 + 11.49 18.33**
% Bare ground 34.44 + 7.34 6.88 + 11.35 -20.62**
% Club moss 5.56 + 10.72 10 + 4.03 7.03**
% Litter 33.75 + 40.11 75 + 23.41 6.66**
Ah thickness 0.5 + 3.45 7 + 2.58 14.76**
Soil Compaction 1.8 + 1.17 1.8 + 1.13 0.57
% Sand 88.01 + 3.69 88.15 + 4.16 2.17*
% Clay 0.69 + 0.74 0.38 + 0.96 -3.24**
% Silt 11.23 + 3.24 11.07 + 3.47 -1.39
pH 7.43 + 0.62 6.76 + 0.49 -12.38**
Log (Electro-conductivity) 2.86 + 0.12 3.06 + 0.17 12.55**
* Superscript ** indicates a 0.01 significance level, while superscript * indicates a 0.05 significance level.

53
The analysis of % cover of undesirable species indicated that lease and reference pasture sites
form well-separated, homogenous clusters (A = 0.089, t = -18.03) (Table 4.5). More specifically,
lease and reference sites were found to differ based on alpha measures of undesirable species
diversity. This indicated that while lease and reference sites may have similar desirable species
compositions, collectively lease sites have a greater abundance of undesirable species. The
indicator species analysis of undesirable species suggested significant differences between lease
and reference sites based on the increased abundance of several undesirable species at the lease
sites (Table 4.7). Lease sites were likely to have a greater abundance of alkali grass (Puccinellia
nuttalliana), wood whitlow-grass (Draba nemorosa), flixweed (Descurainia sophia), ball
mustard (Neslia paniculata), bluebur (Lappula squarrosa), foxtail barley (Hordeum jubatum),
kochia (Kochia scoparia), and Russian thistle (Salsola pestifer). The analysis revealed that lease
sites were more likely to be dominated by undesirable perennial forbs than the desirable
graminoid species that were present in the reference pasture (see Table 4.7).
The desirable species found to differ between the lease and reference sites were blue grama
grass (Bouteloua gracilis), Indian rice grass (Oryzopsis hymenoides), Canada blue grass (Poa
compressa), muhly spp. (Muhlenbergia spp.), aster species (aster spp.), pale comandra
(Comandra palliada), silver-leaved psoralea (Psoralea argophylla), and thread-leaved sedge
(Carex filifolia) (Table A.3).
The impacts from PNG lease site construction to ground cover and biotic variables were
similar across landscape types (dune and mixed grassland) and soil taxa. This suggests that
impacts associated with lease activity are independent of changes to soil texture.

54
TABLE 4.7 Results of indicator analysis of undesirable species comparing lease sites to reference
pasture sites.*
Undesirable species Oil and gas lease sites (IV%) Reference pasture sites (IV%)
No Species Present 25.0** 0.0
Alkali grass (Puccinellia spp.) 33.7** 0.0
Kentucky blue grass (Poa pratensis) 18.5* 0.0
Pygmy-flower (Androsace septentrionalis) 0.0 20.0*
Fringe sage (Atremisia frigid) 55.7** 0.0
Wood whitlow grass (Draba nemorosa) 20.6** 0.0
Flixweed (Descurainia sophia) 31.5* 0.0
Ball mustard ( Neslia paniculata) 24.2* 0.0
Skeleton weed (Lygodesmia rostrata) 0.0 12.2*
Bluebur (Lappula squarrosa) 28.3* 0.0
Foxtail barley (Hordeum jubatum) 20.8* 0.0
Kochia (Kochia scoparia) 18.3* 0.0
Russian thistle (Salsola pestifer) 21.7* 0.0
*Shaded cells indicate species that were significant indicators for each of the lease classes. Superscript ** indicates
values at a 0.01 significance level, while superscript * indicates a 0.05 significance level.
4.3.2 Relationship between well drill year and lease class, and the impacts to grassland ecology
Although slight differences in species composition were observed between oil and gas wells,
no significant differences were observed between lease infrastructure types based on species
composition (Figure 4.6). Instead, lease sites were found to differ based on operational status,
specifically based on ground cover and plant species conditions. From the ordination analyses
(with lease operational status categories) and joint plot overlay of environmental and range
health values, it was found that ‗active‘ lease sites had greater % bare ground values, and lower
% litter, % herbaceous, and range health values (Figure 4.6, Table 4.8). Amongst all 8 lease type
classes, ‗active‘ oil and gas lease sites displayed, on average, the greatest % bare ground values
(25% bare ground) and the lowest values for % herbaceous and % litter at 75% and 20%
respectively. All operational status classes were found to have low % clubmoss (0-2%) and low
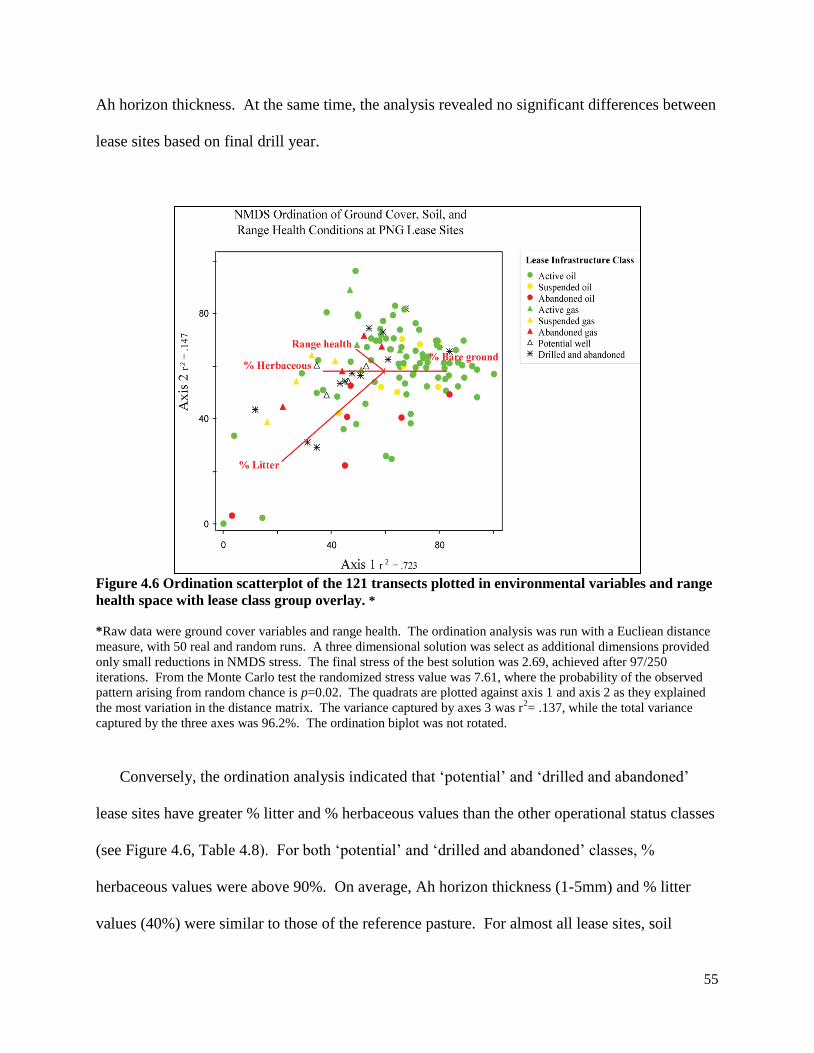
55
Ah horizon thickness. At the same time, the analysis revealed no significant differences between
lease sites based on final drill year.
Figure 4.6 Ordination scatterplot of the 121 transects plotted in environmental variables and range
health space with lease class group overlay. *
*Raw data were ground cover variables and range health. The ordination analysis was run with a Eucliean distance
measure, with 50 real and random runs. A three dimensional solution was select as additional dimensions provided
only small reductions in NMDS stress. The final stress of the best solution was 2.69, achieved after 97/250
iterations. From the Monte Carlo test the randomized stress value was 7.61, where the probability of the observed
pattern arising from random chance is p=0.02. The quadrats are plotted against axis 1 and axis 2 as they explained
the most variation in the distance matrix. The variance captured by axes 3 was r2= .137, while the total variance
captured by the three axes was 96.2%. The ordination biplot was not rotated.
Conversely, the ordination analysis indicated that ‗potential‘ and ‗drilled and abandoned‘
lease sites have greater % litter and % herbaceous values than the other operational status classes
(see Figure 4.6, Table 4.8). For both ‗potential‘ and ‗drilled and abandoned‘ classes, %
herbaceous values were above 90%. On average, Ah horizon thickness (1-5mm) and % litter
values (40%) were similar to those of the reference pasture. For almost all lease sites, soil

56
compaction ranged from 1.65 to 2.20 kg/cm2. The only exceptions were ‗potential‘ and
‗suspended‘ gas lease sites drilled in highly active sand dune blowouts, where compaction values
were 0.50 kg/cm2. Lease sites located within the sand dune environment were also found to have
low % herbaceous, % litter, and range health values.
Based on operational status, the MRPP analysis suggested that oil and gas lease sites differ
from the reference sites more significantly based on desirable species diversity than undesirable
diversity measures (Table 4.9). When compared to reference pasture all lease classes were found
to have significantly greater undesirable species richness, and diversity values (Table 4.10). All
five lease classes displayed similar desirable species richness and diversity values (Table 4.10).
Compared to the reference pasture, ‗active‘ oil and gas lease sites were found to have higher
undesirable species richness, and diversity values. The undesirable species richness, and
diversity values recorded at ‗active‘ oil and gas lease sites were, on average, 3.5 times greater
than those associated with the reference sites (Table 4.10).
TABLE 4.8 Axis correlation scores for axis 1 and axis 2 for the NMDS ordination analysis of 121
transects plotted in environmental variables and range health space with lease class group overlay.
Axis 1 (r2 = .723) Axis 2 (r
2 = .147)
r value r value
% Herbaceous -0.649 0.097
% Bare ground 0.658 0.097
% Clubmoss 0.008 -0.022
% Litter -0.903 -0.72
Ah soil horizon thickness (mm) -0.109 -0.052
Soil compaction (kg/cm) 0.011 -0.06
Range health -0.414 0.485
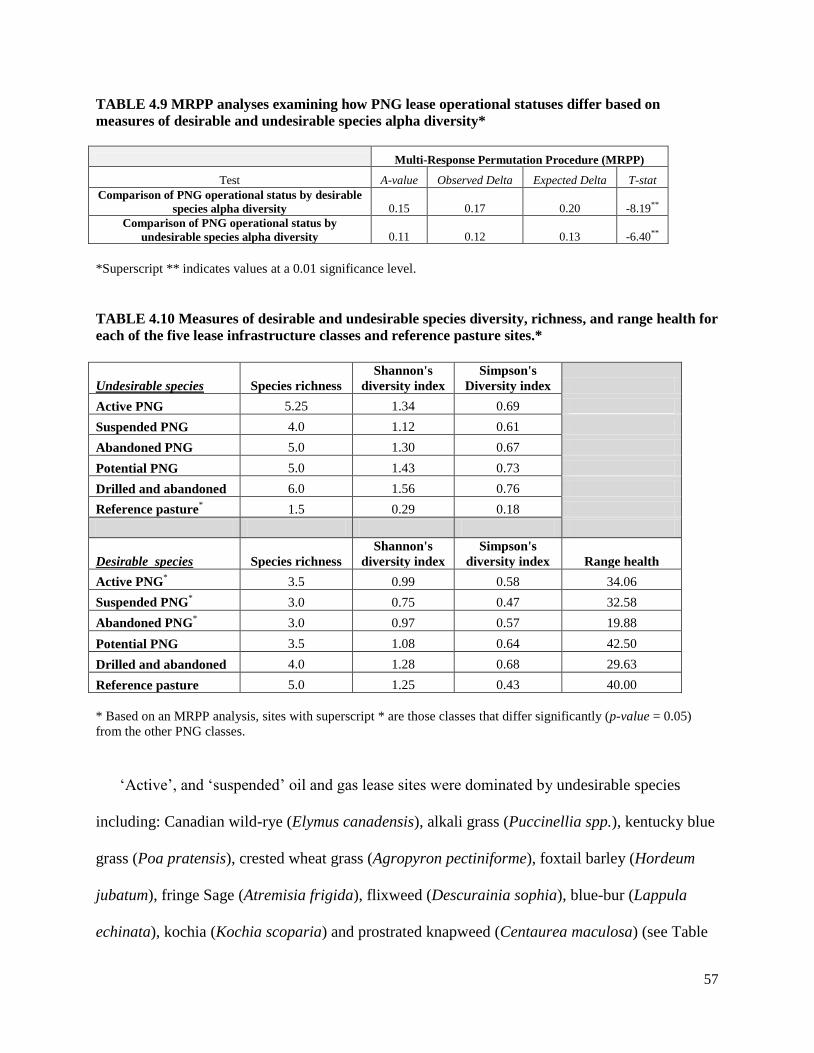
57
TABLE 4.9 MRPP analyses examining how PNG lease operational statuses differ based on
measures of desirable and undesirable species alpha diversity*
Multi-Response Permutation Procedure (MRPP)
Test A-value Observed Delta Expected Delta T-stat
Comparison of PNG operational status by desirable
species alpha diversity 0.15 0.17 0.20 -8.19**
Comparison of PNG operational status by
undesirable species alpha diversity 0.11 0.12 0.13 -6.40**
*Superscript ** indicates values at a 0.01 significance level.
TABLE 4.10 Measures of desirable and undesirable species diversity, richness, and range health for
each of the five lease infrastructure classes and reference pasture sites.*
Undesirable species Species richness
Shannon's
diversity index
Simpson's
Diversity index
Active PNG 5.25 1.34 0.69
Suspended PNG 4.0 1.12 0.61
Abandoned PNG 5.0 1.30 0.67
Potential PNG 5.0 1.43 0.73
Drilled and abandoned 6.0 1.56 0.76
Reference pasture*
1.5 0.29 0.18
Desirable species Species richness
Shannon's
diversity index
Simpson's
diversity index Range health
Active PNG*
3.5 0.99 0.58 34.06
Suspended PNG*
3.0 0.75 0.47 32.58
Abandoned PNG*
3.0 0.97 0.57 19.88
Potential PNG 3.5 1.08 0.64 42.50
Drilled and abandoned 4.0 1.28 0.68 29.63
Reference pasture 5.0 1.25 0.43 40.00
* Based on an MRPP analysis, sites with superscript * are those classes that differ significantly (p-value = 0.05)
from the other PNG classes.
‗Active‘, and ‗suspended‘ oil and gas lease sites were dominated by undesirable species
including: Canadian wild-rye (Elymus canadensis), alkali grass (Puccinellia spp.), kentucky blue
grass (Poa pratensis), crested wheat grass (Agropyron pectiniforme), foxtail barley (Hordeum
jubatum), fringe Sage (Atremisia frigida), flixweed (Descurainia sophia), blue-bur (Lappula
echinata), kochia (Kochia scoparia) and prostrated knapweed (Centaurea maculosa) (see Table

58
A.4). The abundance of undesirable species at the ‗active‘ and ‗suspended‘ sites supports the
low range health values calculated. Average range health values for ‗active‘ (34.0), and
‗suspended‘ (32.5) sites were considerably lower than average range health values for reference
pasture sites (40.0) (see Table 4.10), which had more desirable tufted and rhizomatous grasses
than PNG lease sites (Table 4.11).
TABLE 4.11 Results of indicator analysis of desirable species at the reference pasture sites.*
Desirable species Reference pasture sites (IV%)
Northern wheat grass (Agropyron dasystachyum) 59.5*
June grass (Koeleria cristata) 65.7**
Needle and thread grass (Stipa comata) 53.7*
Thread-leaved sedge (Carex elecocharis) 68.8**
*Superscript ** indicates values at a 0.01 significance level, while superscript * indicates a 0.05 significance level.
Of the five infrastructure classes, ‗drilled and abandoned‘ and ‗potential‘ lease sites had the
greatest desirable species richness, and diversity values (see Table 4.10). Although average
desirable species richness values for ‗drilled and abandoned‘ and ‗potential‘ oil and gas lease
sites were greater than all other lease site operational classes, they were still lower than the
average reference pasture value. When compared to the other lease classes, ‗drilled and
abandoned‘ sites displayed the greatest undesirable species richness, and diversity. ‗Drilled and
abandoned‘ sites were dominated by foxtail barley (Hordeum jubatum), and perennial forbs;
yellow sweet clover (Melilotus officinalis), skeleton weed (Lygodesmia rostrata), and kochia
(Kochia scoparia) (see Table A.4). The presence of undesirable species surrounding ‗drilled and
abandoned‘ sites speaks to the lack of reclamation activity within the study area. This is
supported by the low range health values (20.0) and desirable species richness and diversity at
‗abandoned‘ lease sites (see Table 4.10).

59
Slight differences were observed between lease infrastructure types (oil well vs. gas well)
based on species presence. Oil lease sites were dominated by undesirable rhizomatous and tufted
grass species such as alkali grass (Puccinellia spp.), crested wheat grass (Agropyron
pectiniforme), and foxtail barely (Hordeum jubatum), as well as fringe sage (Artemisia frigida),
and prostrate knotweed (Centaurea maculosa) (see Table A.4). Gas wells were found to have
lower undesirable species diversity and presence than oil wells. ‗Active‘, ‗suspended‘, and
‗abandoned‘ gas wells were dominated by crested wheat grass (Agropyron pectiniforme), and
perennial forbs; fringe sage (Artemisia frigida), flixweed (Descurainia sophia), and blue-bur
(Lappula echinata) which were rare at gas lease sites (see Table A.4). ‗Drilled and abandoned‘
sites displayed low undesirable species diversity measures compared to the other lease classes.
‗Drilled and abandoned‘ sites were dominated by foxtail barley (Hordeum jubatum), and
perennial forbs; yellow sweet clover (Melilotus officinalis), skeleton weed (Lygodesmia
rostrata), and kochia (Kochia scoparia) (see Table A.4).
The analysis of drill year, and month suggested that compared to the reference pasture, lease
site classes drilled at any time of the year have low % litter, % herbaceous, and range health
values. This suggested that the impacts associated with lease site activity persist for over 50
years. Lease sites were dominated by bare ground, crested wheat grass (Agropyron
pectiniforme), downy brome (Bromus tectorum), foxtail barley (Hordeum jubatum), flixweed
(Descurainia Sophia) and prickly rose (Rosa acicularis). At the same time, lease sites failed to
form significant clusters based on drill month. An exception to the above is that the oil sites
drilled from 2004 to 2005 were dominated by northern wheat grass (Agropyron dasystachyum),
blue grama (Bouteloua gracilis), Indian rice grass (Achnatherum hymenoides), false solomon‘s-
seal (Smilacina trifolia), goldenrod (Solidago spp.), and western snowberry (Symphoricarpos
60
occidentalis) (see Table A.5). This finding implies that lease sites drilled more recently may
benefit from improved management practices and reseeding techniques.
4.3.3 Well production and abiotic and biotic conditions
Prior to comparing well site production information with the environmental and biotic
variables, a NMDS ordination was run on the production data for each of the thirty-one lease
sites. To determine how different oil and gas lease sites (classed by operational status) grouped
based on production time (yrs), gas (mcf), oil (Bbl), and water (Bbl). As expected, the ‗active‘
oil lease sites were found to have the greatest production of oil (Bbl) and water (Bbl). It was
important to make this distinction so that comparisons between annual and cumulative lease site
production data, and oil and gas lease site operational status could be made.
The analysis indicated that increased cumulative well site production at lease sites was
related to increased alteration of ground cover, soil pH/electro-conductivity, and plant species
composition variables (Table 4.12). Of the ground cover variables examined, % litter showed
the greatest alteration from increased oil production (Table 4.13). Irrespective of drill date, the
analysis of lease site cumulative production data revealed that increased production resulted in
lower % litter values. Lease sites with increased oil production levels also displayed lower %
herbaceous, and greater % bare ground values (Table 4.13). As expected, the analysis of annual
production levels revealed similar finding.
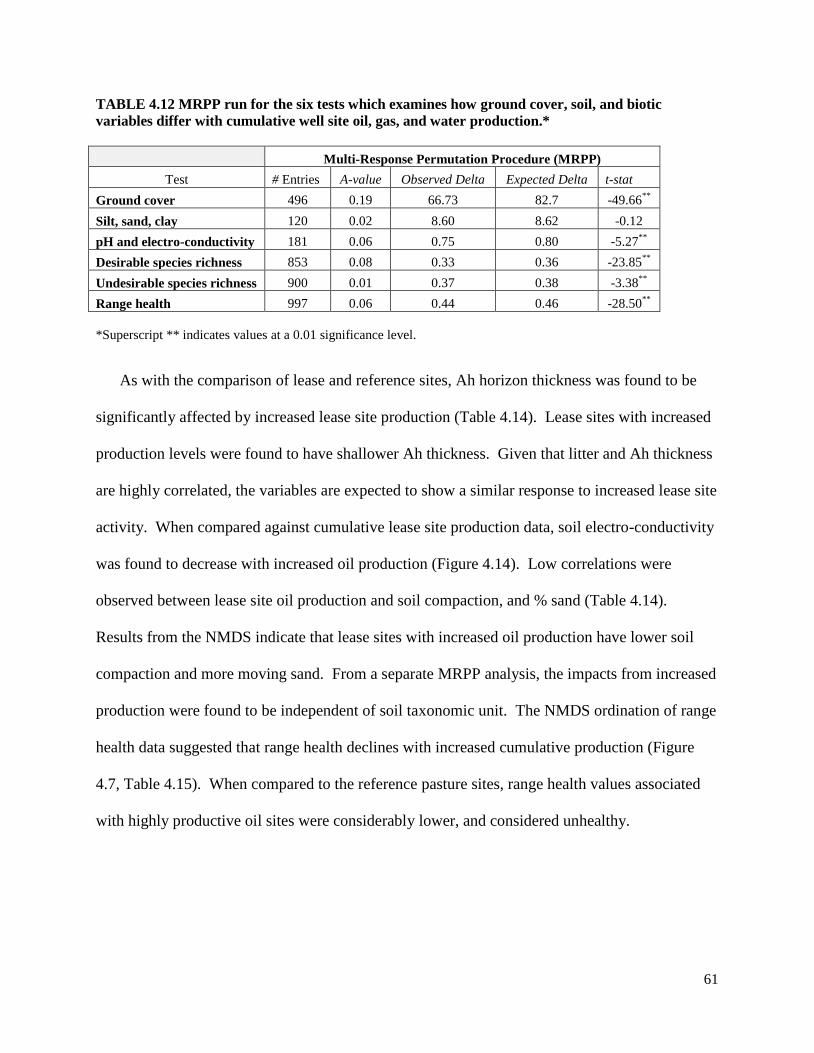
61
TABLE 4.12 MRPP run for the six tests which examines how ground cover, soil, and biotic
variables differ with cumulative well site oil, gas, and water production.*
Multi-Response Permutation Procedure (MRPP)
Test # Entries A-value Observed Delta Expected Delta t-stat
Ground cover 496 0.19 66.73 82.7 -49.66**
Silt, sand, clay 120 0.02 8.60 8.62 -0.12
pH and electro-conductivity 181 0.06 0.75 0.80 -5.27**
Desirable species richness 853 0.08 0.33 0.36 -23.85**
Undesirable species richness 900 0.01 0.37 0.38 -3.38**
Range health 997 0.06 0.44 0.46 -28.50**
*Superscript ** indicates values at a 0.01 significance level.
As with the comparison of lease and reference sites, Ah horizon thickness was found to be
significantly affected by increased lease site production (Table 4.14). Lease sites with increased
production levels were found to have shallower Ah thickness. Given that litter and Ah thickness
are highly correlated, the variables are expected to show a similar response to increased lease site
activity. When compared against cumulative lease site production data, soil electro-conductivity
was found to decrease with increased oil production (Figure 4.14). Low correlations were
observed between lease site oil production and soil compaction, and % sand (Table 4.14).
Results from the NMDS indicate that lease sites with increased oil production have lower soil
compaction and more moving sand. From a separate MRPP analysis, the impacts from increased
production were found to be independent of soil taxonomic unit. The NMDS ordination of range
health data suggested that range health declines with increased cumulative production (Figure
4.7, Table 4.15). When compared to the reference pasture sites, range health values associated
with highly productive oil sites were considerably lower, and considered unhealthy.

62
TABLE 4.13 Axis correlation scores for axis 1 and axis 3 for the NMDS ordination analysis ground
cover properties from 121 transects plotted lease site production data (gas, oil, water, production
time) space.*
Axis 1 (r2 = .379) Axis 3 (r
2 = .305)
r value r value
% Herbaceous .177 -.305
% Bare ground -.219 .092
% Clubmoss -.015 .141
% Litter .217 -.305
Gas production levels (Mcf) -.077 .084
Oil production levels (Bbl) -.326 .554
Wrt production levels (Bbl) -.167 .731
*The ordination analysis was run with a Eucliean distance measure, with 50 real and random runs. A three
dimensions solution was select as additional dimensions provided only small reductions in NMDS stress. The
variance captured by axes 2 was r2= .108, while the total variance captured by the three axes was 79.3%. The final
stress of the best solution was 4.28, achieved after 130/250 iterations. From the Monte Carlo test the randomized
stress value was 11.03, where the probability of random chance is p=0.02.
TABLE 4.14 Axis correlation scores for axis 1 and axis 2 from the NMDS ordination analysis of
ground cover and soil properties for the thirty one oil and gas lease sites plotted in lease site
production data (gas, oil, water, production time) space with lease class groups overlay.*
Axis 1 (r
2 = .896) Axis 2(r
2 = .092)
r value r value
% Sand -.097 .172
Soil electro-conductivity .188 .186
%Litter .154 .101
Ah soil horizon depth(mm) .131 .125
Soil compaction (kg/cm2) .094 .074
Oil (Bbl) -.152 -.044
*The ordination analysis was run with a Eucliean distance measure, with 50 real and random runs. A three
dimensions solution was select as additional dimensions provided only small reductions in NMDS stress. The
variance captured by axes 2 was r2= .108, while the total variance captured by the three axes was 79.3%. The final
stress of the best solution was 4.42, achieved after 50/250 iterations. From the Monte Carlo test the randomized
stress value was 10.28, where the probability of random chance is p=0.02.
The analysis of plant community data against lease site annual production data revealed that
as oil and gas production increased, desirable species richness, declined (Table 4.16). Overall,
increased annual production of both oil and gas also resulted in a decline of desirable species
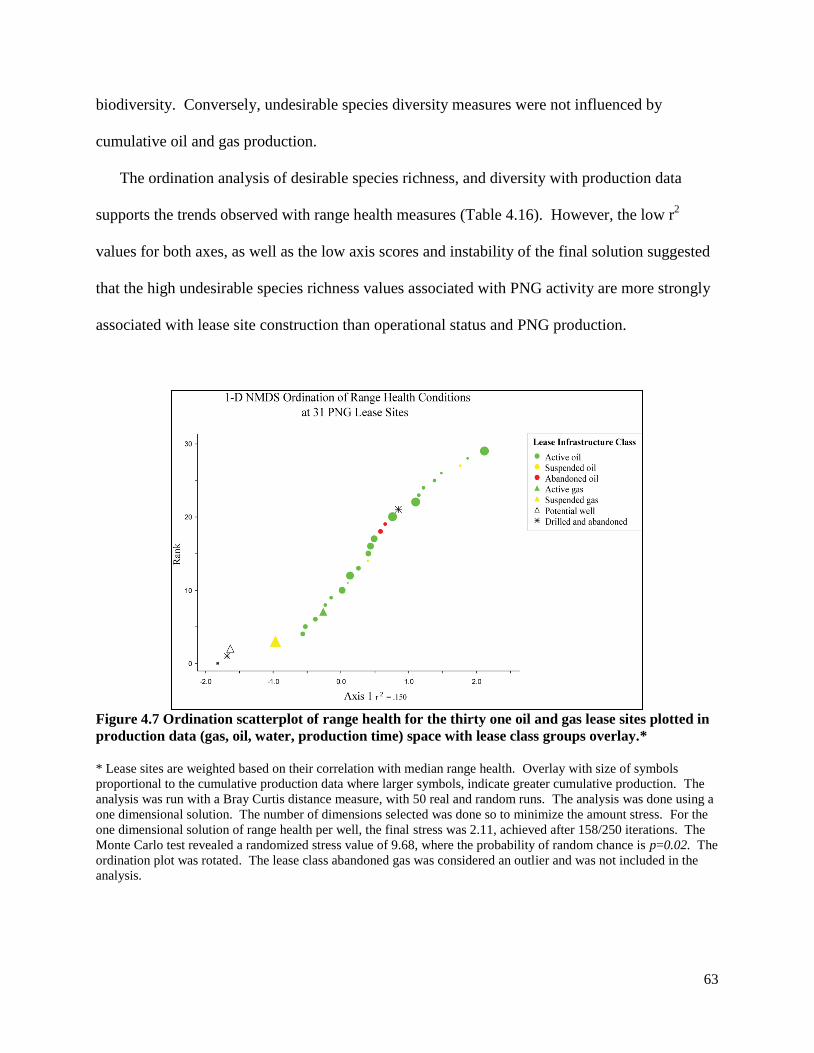
63
biodiversity. Conversely, undesirable species diversity measures were not influenced by
cumulative oil and gas production.
The ordination analysis of desirable species richness, and diversity with production data
supports the trends observed with range health measures (Table 4.16). However, the low r2
values for both axes, as well as the low axis scores and instability of the final solution suggested
that the high undesirable species richness values associated with PNG activity are more strongly
associated with lease site construction than operational status and PNG production.
Figure 4.7 Ordination scatterplot of range health for the thirty one oil and gas lease sites plotted in
production data (gas, oil, water, production time) space with lease class groups overlay.*
* Lease sites are weighted based on their correlation with median range health. Overlay with size of symbols
proportional to the cumulative production data where larger symbols, indicate greater cumulative production. The
analysis was run with a Bray Curtis distance measure, with 50 real and random runs. The analysis was done using a
one dimensional solution. The number of dimensions selected was done so to minimize the amount stress. For the
one dimensional solution of range health per well, the final stress was 2.11, achieved after 158/250 iterations. The
Monte Carlo test revealed a randomized stress value of 9.68, where the probability of random chance is p=0.02. The
ordination plot was rotated. The lease class abandoned gas was considered an outlier and was not included in the
analysis.

64
TABLE 4.15 Axis correlation scores from the NMDS ordination analysis of range health for the
thirty one oil and gas lease sites plotted in production data (gas, oil, water, production time) space
with lease class groups overlay (Figure 4.7).
Axis 1 (r
2 = .150)
r value
Range Health (Median) -.159
Oil (Bbl) .555
Gas (Mcf) .205
TABLE 4.16 Axis correlation scores from the NMDS ordination analysis of desirable species
richness, diversity, and production data (oil, gas) for the thirty one oil and gas lease sites plotted in
production data (gas, oil, water, production time) space with lease class groups overlay.*
Axis 1 (r
2 = .645) Axis 2(r
2 = -.021)
r value r value
Shannon’s Diversity Index .346 .301
Simpson’s Diversity Index .396 .304
Oil production levels(Bbl) -.453 .305
Gas production levels (Mcf) -.342 -.339
*The analysis was run with a Bray Curtis distance measure, with 50 real and random runs. A three dimensional
solution was selected to minimize stress. The final stress was 8.89, achieved after 250/250 iterations. The Monte
Carlo test revealed a randomized stress value of 9.29, where the probability of random chance is p=0.02. Lease sites
are plotted against axis 1 (r2 = .645) and axis 2 (r
2 = -.021) as they explained the most variation in the distance
matrix. The variation captured by the NMDS ordination was 62.3%.
4.3.4 Abiotic and biotic conditions at increasing distance from the well head
Ground cover, soil conditions, and plant communities differed significantly with increasing
distance from the well head. Of all of the impacts associated with lease sites, % litter, Ah
thickness, % herbaceous cover, desirable species diversity and range health were found to
increase with distance from the well head. Soil compaction, electro-conductivity, and % bare
ground cover were found to decrease with increasing distance from the well head. With the
exception of % litter and soil compaction, the observed impacts were found to be irrespective of
infrastructure type, well operational status, and/or the number of years of production (see Table
A.6).

65
The MRPP analysis of distance groups (0m, 5m, 10m, 15m, 20m, 25m, 30m, 35m, 40m,
45m) based on ground cover variables indicated significant within group homogeneity (A =
0.193) and well separated clusters (t = -49.66). From the NMDS ordination analysis, the
variables most strongly associated with axis 1 (r2=0.125) were % litter (-0.931), % bare ground
(0.762), and % herbaceous (-0.761). For axis 2 (r2=0.875), % herbaceous (-0.942), and bare
ground (0.935) were the most strongly correlated variables (Figure 4.8, Table 4.17). From the
NMDS ordination joint plot overlay (Figure 4.8) of ground cover and soil variables, quadrats
close to the well head were found to have greater % bare ground, and soil compaction values (see
Table 4.17). On the other hand, the well head had lower % herbaceous, % litter, and Ah horizon
thickness values. The graphical results indicated that ground cover variables (% herbaceous, %
bare ground, and % litter) increase significantly with distance from the well. The results
suggested that the effects of development extend at least 25m from the well head (Figures 4.9,
4.10, 4.11, 4.12, and 4.13).
The analysis of soil properties revealed that soil compaction and aggregate material (as a %
of ground cover) increased with proximity to the well. Although soil compaction values at the
lease site were greater than the reference pasture, the analysis indicated that the highest
compaction were within 5m – 10m of the well head (Figure 4.11). Values for both variables
were greater within 10m of the well head than those of the reference pasture sites. The observed
spatial extent of the impacts is consistent with construction practices that involve the re-
contouring and padding of the lease site.

66
Figure 4.8 Ordination scatterplot of the 496 quadrats within two randomly selected transects from
each of the thirty one oil and gas lease sites with a ground cover, and soil overlay.*
*The NMDS ordination analysis was run with a Euclidean distance measure, with 50 real and random runs. A three
dimensional solution was selected as additional dimensions provided only small reductions in NMDS stress. The
final stress of the best solution was 5.24, achieved after 121/250 iterations. From the Monte Carlo test the
randomized stress value was 8.67, where the probability of the observed pattern arising from random chance is
p=0.03. The Quadrats are plotted against axis 1 and axis 2 as they explained the most variation in the distance
matrix. The variance captured by axes 1 and 2 are (r2= 0.125) and axis 2 (r
2= 0.875), respectively. A ground cover,
and soil joint plot was added to interpret how the variables related to the a priori defined group formations. The
ordination biplot was rotated 27 degrees to improve the interpretation. Two randomly selected transects were used
for comparison given sufficient data and a large sample size.

67
TABLE 4.17 Axis correlation scores for axis 1 and axis 2 for the NMDS ordination analysis of 496
quadrats within two randomly selected transects from each of the thirty one oil and gas lease sites
with a ground cover, and soil overlay
Axis 1 (r2 = .425) Axis 2 (r
2 = .969)
r value r value
% Herbaceous 0.946 0.586
% Bare ground -0.947 -0.587
% Clubmoss 0.325 0.135
% Litter 0.561 0.947
Ah soil horizon thickness (mm) 0.326 0.252
Aggregate >2mm -0.186 -0.152
Soil compaction (kg/cm) -0.292 -0.173
% Erosion -0.232 -0.185
% Spill -0.06 -0.064
Figure 4.9 Bareground and herbaceous ground cover values against distance from the center of the well
head. Values are plotted as median values with +/- standard error.

68
Figure 4.10 Litter ground cover value against distance from the center of the well head. Values are plotted
as median values with +/- standard error.
Figure 4.11 Soil compaction and aggregate values against distance from the center of the well head. Values
are plotted as median values with +/- standard error.

69
Figure 4.12 Soil Ah horizon thickness values against distance in meters from the center of the well head.
Values are plotted as median values with +/- standard error.
Ah thickness was found to increase with increasing distance from the well head, with the
greatest alterations occurring within 0m - 5m (Figure 4.12). Although the impacts to Ah
thickness from lease site development were most severe at close proximity to the well head,
values were lower than the reference pasture (Figure 4.12). Lease sites differed from the
reference pasture sites within 0m – 5m of the well based on Ah soil horizon thickness.
No difference was observed between distance classes based on texture (sand, silt, clay). The
sites surveyed were dominated by poorly developed sandy soils. Although the sites were
dominated by sand, other studies suggest that the construction of access roads increased the
presence of % silt, and % clay in the soil. The plots did suggest that the impacts to soil pH and
electro-conductivity extend 35m from the well head. Further, both soil pH and electro-
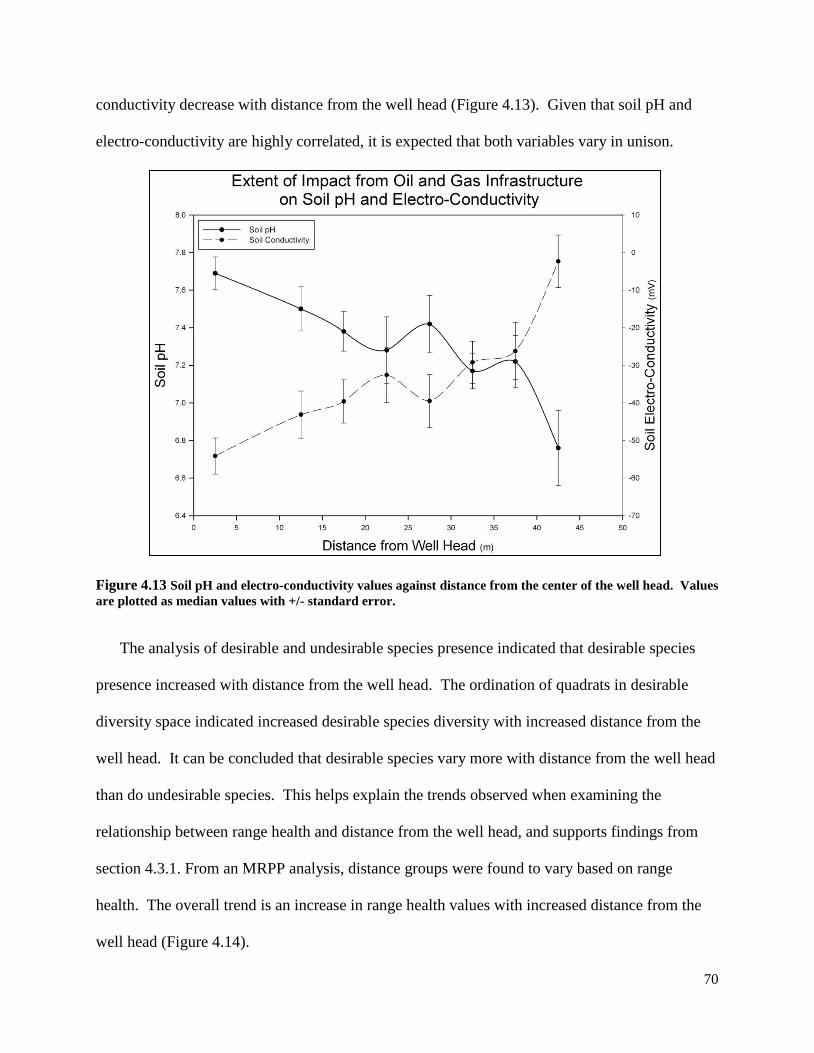
70
conductivity decrease with distance from the well head (Figure 4.13). Given that soil pH and
electro-conductivity are highly correlated, it is expected that both variables vary in unison.
Figure 4.13 Soil pH and electro-conductivity values against distance from the center of the well head. Values
are plotted as median values with +/- standard error.
The analysis of desirable and undesirable species presence indicated that desirable species
presence increased with distance from the well head. The ordination of quadrats in desirable
diversity space indicated increased desirable species diversity with increased distance from the
well head. It can be concluded that desirable species vary more with distance from the well head
than do undesirable species. This helps explain the trends observed when examining the
relationship between range health and distance from the well head, and supports findings from
section 4.3.1. From an MRPP analysis, distance groups were found to vary based on range
health. The overall trend is an increase in range health values with increased distance from the
well head (Figure 4.14).
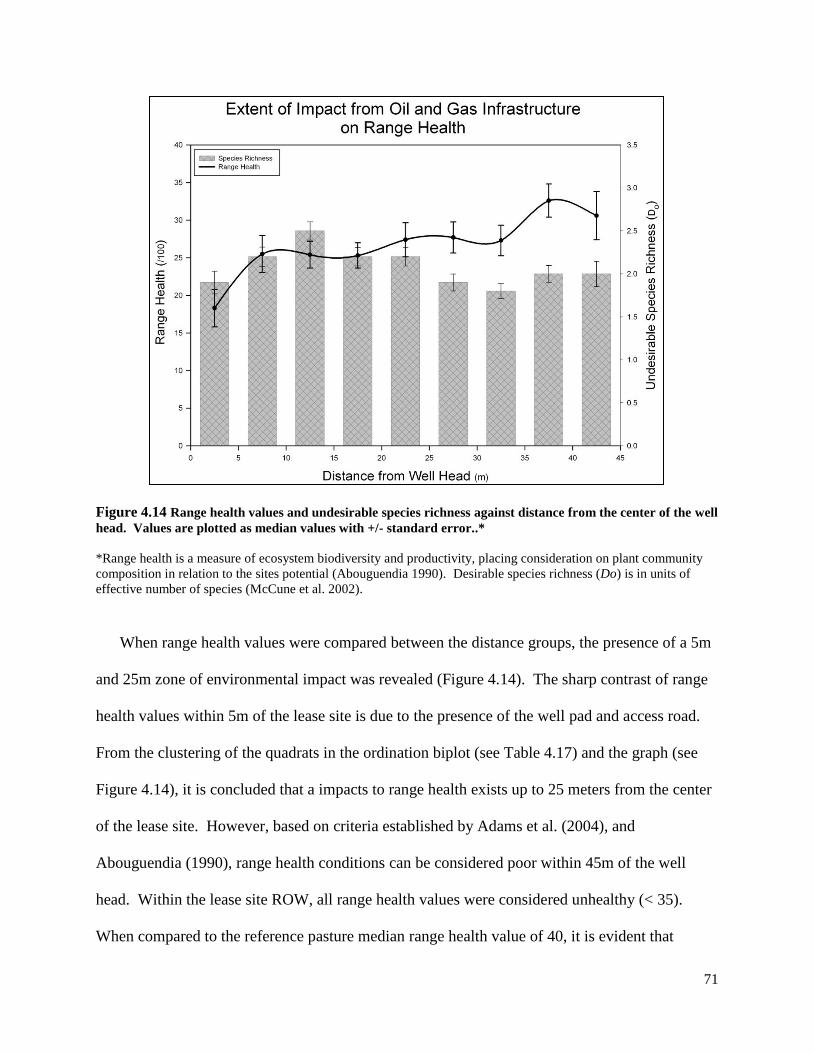
71
Figure 4.14 Range health values and undesirable species richness against distance from the center of the well
head. Values are plotted as median values with +/- standard error..*
*Range health is a measure of ecosystem biodiversity and productivity, placing consideration on plant community
composition in relation to the sites potential (Abouguendia 1990). Desirable species richness (Do) is in units of
effective number of species (McCune et al. 2002).
When range health values were compared between the distance groups, the presence of a 5m
and 25m zone of environmental impact was revealed (Figure 4.14). The sharp contrast of range
health values within 5m of the lease site is due to the presence of the well pad and access road.
From the clustering of the quadrats in the ordination biplot (see Table 4.17) and the graph (see
Figure 4.14), it is concluded that a impacts to range health exists up to 25 meters from the center
of the lease site. However, based on criteria established by Adams et al. (2004), and
Abouguendia (1990), range health conditions can be considered poor within 45m of the well
head. Within the lease site ROW, all range health values were considered unhealthy (< 35).
When compared to the reference pasture median range health value of 40, it is evident that
72
although range health conditions improve with distance from the well head, conditions are still
poor.
4.3.5 Spatial extent of oil and gas well sites impacts on grassland ecology
The impacts of oil and gas development on grassland ecology extend up to 25 meters from
the well head. To determine how, and if, changes to environmental management (EIA/EPP) over
the 50 year development period have affected the spatial extent of lease site impacts, the lease
sites were analyzed at a temporal scale. The spatial extent of impacts to ground cover and soil
variables during each time period (1950-1979, 1980s, 1990s, 2000s) revealed slight differences
between lease site drill dates (Figure A.1). The spatial extent of the impacts from lease sites
drilled from 1950 to 1999 were observed to be greater than those drilled more recently (Figure
4.15).
For each date class, the spatial extents of the impacts were calculated by comparing lease
distance values (0 to 40m) to the median values from the reference pasture. For lease sites
drilled from 1950 to 1979, the spatial extent of impacts to ground cover (% herbaceous, % bare
ground, and % litter), and soil variables were found to extend 15m from the well head (Figure
A.1). This suggests that although lease sites have not been reclaimed, natural re-vegetation has,
to an extent, reduced the footprint of oil and gas development; however, the impacts from
development are long term.

73
Figure 4.15 Range health values for lease sites from 1955 to 2006 against distance from the well head.
Values are plotted as median values with +/- standard error.
The impacts to range health from those lease sites constructed from 1950 to 1979 were found
to extend approximately 15m from the well head (Figure 4.15). Lease sites drilled from 2000 to
2006 had smaller ground cover and soil impacts than those drilled during the 1990s. The
impacts associated with lease sites drilled from 2000 to 2006 were found to extend 10m to 15m
from well head (Figure 4.15). The analysis of lease sites drilled during the 2000s revealed
smaller impacts to range health than lease sites drilled earlier. Lease sites drilled during the
1990s exhibited the greatest spatial extent of impacts - the majority of development within the
study area also occurred during this decade (Figure 4.15).
While on average, impacts were found to extend 25m from the well head, impacts to range
health were found to extend beyond 40m from the well head (see Figure 4.14). When compared

74
to reference pasture sites, range health at oil and gas lease sites is considerably lower, regardless
of the year the site was drilled and/or abandoned. An unexpected finding is that oil and gas
impact type and severity were irrespective of landscape type (dune or mixed grassland) and/or
soil taxon. Further, the duration and severity of the impacts were found to be irrespective of
infrastructure type, operational status, and/or the number of years of production. This suggests
that regardless of environmental conditions, lease sites require significant time to recover and in
most cases natural re-vegetation is not a sufficient management practice for grassland
conservation and EIA.

75
CHAPTER 5
DISCUSSION AND CONCLUSIONS
5.1 Introduction
The purpose of the thesis was to examine follow-up implementation in current EIA practice,
and to further the understanding of the effects of PNG development on grassland ecosystems.
While the majority of anthropogenic disturbance to Saskatchewan grasslands has been the result
of agricultural practices, over the last two and a half decades increased PNG activity has played a
significant role in grassland disturbance. This is of significant concern in Saskatchewan, given
that PNG development is expected to increase in the near future, and that the EIA process in
place to manage the effects of such development focuses more on the pre-decision stage of
impact prediction than it does following-up to verify and manage the actual effects of
development.
This Chapter summarizes the key findings emerging from the thesis. The research results are
discussed in the context of the broader literature on grassland effects assessment from PNG
activity and the practice of EIA follow-up. PFRA‘s current approach to development impact
assessment and management, and the lessons emerging for future practices are also discussed.
The Chapter concludes by identifying limitations to the research, and outlines areas for future
consideration.
5.2 Spatial and Temporal Development of PNG Activity in Southwest Saskatchewan
Over the last 50 years, PNG development in the study area and in southwest Saskatchewan in
general has focused primarily on the production of crude oil. During this time, the majority of
development occurred in the mid to late 1990s. The introduction of new technologies such as

76
horizontal drilling has allowed for the retrieval of resources previously considered uneconomical.
While this technology was first introduced and implemented in the province during the mid
1980s, its use and subsequent resource production did not peak until the 1990s (CPRC 2006).
Since 1979, the percentage of the landscape in the PFRA study area occupied by PNG
infrastructure, including lease sites and access roads, has increased fivefold, the majority of
which occurred between 1997 and 2005. Despite the significant increase in PNG activity in the
study area over the last decade, there has been little EIA/EPP activity associated with this
development. Of all the EIAs and EPPs conducted in the study area, for example, seven (29%)
were for development proposals during the 1990s – five for single wells, one for monitoring
activities, and one for a multi well project. Of the forty-nine oil and gas developments that
occurred between 1955 and 1989, only three project proposals were submitted, all of which were
submitted during the 1980s. From 2000 to 2006, 17 project proposals were submitted for oil and
gas development in the study area, thirteen of which were EIAs/EPPs associated with the
construction of individual or multi-well oil and gas lease sites.
In those cases where EIAs or EPPs have been completed in the study area, the focus has been
primarily on the lease site, or on individual well activity, with little consideration for cumulative
effects or for effects beyond the direct physical footprint of the lease site infrastructure itself.
However, and consistent with previous research, this research affirms that the concentration of
multiple lease site activities, including the construction of access roads as part of PNG
development, has the potential to significantly alter grassland habitat (GSHRES 2007). For
example, ROWs classified as PFRA roads in the study area are, on average, 16m in width. The
construction of ROWs involves re-contouring and grading of the surface for the development of
the coarse sand and gravel aggregate pad. Despite all the ROWs being crowned to facilitate

77
drainage, few of the existing PFRA roads have underground culverts or ditches. Lease access
roads in the study area range from 12m to 18m in width. In many cases, lease access roads do
not involve the buildup of an aggregate pad. To minimize the environmental impacts, lease
access roads within highly sensitive terrain (e.g. sand dune/blowout complex) employ a ‗drive on
grass‘ approach (Golder 2005). In some cases, tar (‗oiled roads‘) has been used in attempt to
stabilize highly eroded and moving sand sections. Despite best intentions, it appears that the
‗drive on grass‘ approach fails as a mitigation measure. Many of the access roads in the sand
dune complex are cut deeply into the landscape (Figure 5.1). From the survey of lease sites, the
impacts from access roads are long term.
Figure 5.1 Representative photographs of ‘drive on grass’ lease site access roads. Access roads are
located in a sand dune, blowout complex located in Twn15/Rge15 sections 35, 26, 23, 16, and 21.
78
The construction of roadways and increased truck traffic associated with a producing well
results in the loss of vegetation, which in turn exposes large sections of moving sand (see also
Patten et al. 2006; GSHRES 2007). Independent of re-seeding as a site mitigation practice, the
impacts from PNG development are significant in that they are associated with a long-term loss
of grassland biodiversity (Forman et al. 2003; Gelbard et al. 2003; Patten et al. 2006). Where
possible, new access roads in the study area have made use of existing oil and gas and PFRA
ROWs and trails to minimize impacts. However, despite the impacts associated with ROW
construction in this highly sensitive environment, they are largely ignored in development
planning and impact assessment (Van Lamoen et al. 2002). Rather, attention is focused on the
regulatory requirements for site access, construction and operations.
5.3 Impacts of PNG Lease Sites on Mixed Grassland Ecosystems
Consistent with recent literature (see Hammermseister 2001; Osterman 2001; Desserud 2006;
Elsinger 2009), the 31 PNG lease sites surveyed were found to differ significantly from the
reference pasture based on ground cover conditions, physical and chemical soil properties, and
undesirable plant diversity. Work by Neath (1987), Osterman (2001), Berquist et al. (2007), and
Elsinger (2009), in a similar environment, suggests that the admixing and stripping of topsoil
during the construction, operation and maintenance of sites significantly alters ground cover and
soil properties. Findings from this research suggest that the admixing of soil horizons and the
removal of surface vegetation associated with the re-contouring and leveling of PNG lease sites
in the PFRA pasture results in a loss of herbaceous, litter and clubmoss ground cover.
In most cases, the pre-selected lease site is leveled to facilitate the construction of the well
head, flare stack, pump jack, and storage tanks. The shallow Ah thickness values observed at the
79
lease sites (2.5cm) is likely the direct result of soil admixing and construction practices, which
involve the removal of topsoil (see Berquist et al. 2007; Elsinger 2009). Petherbridge (2000)
found that the mixing of organic rich topsoil with the mineral subsoil elevates clay, electro-
conductivity, and pH concentrations. The inability to separate horizons during the re-contouring
process of lease site construction results in significant alteration of the organic soil horizon. This
is exacerbated in the study area given the nature of the landscape and poor soil development (see
Neath 1987).
Alteration of the upper O and A soil horizons results in the loss of desirable seed bank, which
has been found to increase the susceptibility of a disturbed site to exotic and/or undesirable
species invasion (Wilsey et al. 2003). Results from this research indicate that the alteration of
soil properties (admixing) associated with PNG development results in the loss of grassland
biodiversity, structure, and an influx of undesirable species. Neath (1990), Berquist (et al. 2007),
and Elsinger (2009) suggest that the absence of desirable species associated with oil and gas
development in grasslands results from: rapid colonization of undesirable following disturbance;
the ability of undesirable species to cope with ‗unfavorable‘ environmental conditions; the
alteration of physical (compaction, bulk density) and chemistry (organic horizon) soil properties;
and the competitive advantage of an established undesirable community. Once an undesirable
‗hot-spot‘ becomes established, surrounding areas are prone to invasion (Maron et al. 2004).
From a landscape management perspective, this is problematic given that lease sites facilitate the
dispersal of undesirable species into the surrounding ‗native‘ environment (Maron et al. 2004).
Vegetation cover at the lease site is controlled by the industry proponent (mowing program)
in order to minimize the risk of grass fires within the lease sites. This removal of vegetation
helps explain the low litter values observed at the lease sites, which, in turn, accelerates soil
80
erosion and provides unfavorable growing conditions for germinating plants. The absence of
litter prevents shading, thereby increasing surface temperature and removing soil moisture.
From a physiological standpoint, the removal of organic material has been found to significantly
affect desirable plant species diversity and seed banks due to the removal of growth promoting
chemicals (gibberellins, auxins, and amino acids) derived from humus found in healthy grassland
soils (Saviozzi et al. 2001).
Although considered undesirable for grazing, clubmoss (Lycopodiacea) is an integral
component of grassland ecosystems as it provides soil stability, reducing the risk of erosion
(Colberg and Romo 2003). The observation of little to no clubmoss at lease sites in the study
area is consistent with other studies where physical alteration has resulted in a long-term (up to
75 years) loss of clubmoss (Neath 1987; Ostermann 2001). The loss of clubmoss at lease sites is
well documented and is considered damaging to desirable grassland productivity, given that little
is known regarding its re-establishment once removed (Colberg and Romo 2003; Romo and Bai
2004).
Surprisingly, no significant differences were observed between samples taken from fenced
lease sites, versus those not fenced. Fences that enclose the PNG lease site ROW and/or
infrastructure, are established by the proponent to prevent cattle contact with the well head.
Consequently, lease fences act to limit ‗on-site‘ grazing activity. Results from this research
suggest that the effects of development are independent of grazing activity. Given that range
health values are considered poor both outside and inside the fenced area, it can be inferred that
the development of a lease site ROW has a greater impact to grassland ecosystems than grazing.

81
5.4 The Role of PNG Productivity, Infrastructure Type, and Year Drilled
The construction and maintenance of lease sites was found to result in the reduction of
herbaceous ground cover, % litter, Ah soil horizon thickness, and % clubmoss, and an influx of
undesirable species - independent of infrastructure type, and/or operational status. However, the
impacts from development are accelerated on ‗active‘ oil and gas lease sites due to the increased
amount of traffic for well service, and tank truck vehicles associated with a producing site.
Most lease sites in the study area are oil lease sites, not connected via pipeline, and thus
require vehicle traffic, specifically tank truck traffic, to empty storage batteries. The increased
activity at operating (active), and/or previously operating (suspended) oil lease sites was found to
result in a loss of vegetative ground cover (see, also, Berquist et al. 2007). To facilitate
increased traffic at production sites, access roads are constructed around the lease site, involving
the removal of vegetation and the buildup of an aggregate pad. The majority of ‗active‘, and
some ‗abandoned‘, lease sites were found to have low (unhealthy) range health values. These
findings suggest that operational, highly productive lease sites have the greatest impact to
grassland ecology.
Interestingly, the impacts from development were not as severe for highly productive gas
lease sites. This observation is likely because all of the gas wells in the pasture and surrounding
area are tied into pipelines. Also, gas wells were drilled with a truck-mounted rig, and some
incorporated a ‗drive-on-grass‘ access road, which, to an extent, minimized disturbance. Low
soil compaction levels associated with oil and gas well heads were unexpected, but speak to the
nature of the terrain within the study area. Many of the surveyed oil lease sites in the study area
are located in a sand dune complex.

82
Lease sites drilled in 1955 showed no significant difference in terms of ground cover, species
diversity, and range health from those drilled more recently. These results suggest that the
impacts from development are long term. The long-term nature of the impacts of PNG
development is due to the fact that the majority of lease sites within the study area are left
abandoned and/or suspended rather than decommissioned. This, in turn, prevents rehabilitation
practices from taking place. Findings indicate that lease sites not decommissioned, but left
abandoned and/or suspended for over 50 years, are not being re-vegetated through natural
processes. The lack of abandoned and/or suspended PNG lease site decommissioning prevents
the onset of reclamation efforts to facilitate the rehabilitation of degraded grasslands within the
lease site.
As outlined in EIA/EPPs for the study area, lease sites are to be reseeded with an agronomic
mix following construction. Under reclamation requirements, the mixture applied is certified
under The Canadian Seed Act and consists of northern wheatgrass,(Agropyron dasystachyum)
western wheatgrass(Agropyron smithii), blue grama grass(Bouteloua gracilis), prairie sand reed
grass(Calamovilfa longifolia), green needle grass(Stipa viridula), Indian rice grass(Achnatherum
hymenoides), and Canadian wild-rye (Elymus canadensis). Findings from this research,
however, indicate that lease site reseeding methods are limited in their ability to reduce non-
desirable species diversity. Although desirable species presence was found to increase after
reseeding, undesirable forb and graminoid species were found to dominate PNG lease sites. This
is true for all lease sites in the study area, regardless of the year drilled. Given the lack of
reclamation within the study area, findings suggest that the impacts associated with development
persist, even after a well is abandoned.

83
With regard to the time of year a lease site is drilled, no significant differences in impacts
were observed between those sites drilled during the winter months and those drilled during
other times of the year. Although most PNG development in the study area occurs in the winter
months, the majority of disturbance is associated with the maintenance and service of the lease
site, which occurs throughout the year. Contrary to ‗best management practices‘, winter drilling
programs in the study area appear to have the same long-term impact to grasslands as those
drilled during the summer, spring, and fall seasons. However, lease sites drilled during the
months of December to March appear to have a slight positive correlation with % litter and %
herbaceous. Despite this observation, there is insufficient evidence to support the notion that
drilling programs have lower impacts to grasslands during the winter months. Although winter
drilling programs are less detrimental to grasslands in the short term, the long-term operation
throughout the year is when the majority of the disturbance occurs.
It is important to note that the comments made regarding winter drilling as a mitigation
measure for PNG activity are specific to this research, and study area. During the winter months,
Swift Current-Webb Community Pasture receives very little snow (Golder 2005), which in turn
prevents the degradation of sod and soil during PNG lease site construction. Other studies
examining the impacts of lease site operations on grassland ecosystems emphasize the
importance of winter drilling as an environmental management plan (EMP) (GSHRES 2007).
By no means does this thesis suggest not incorporating winter drilling programs as an EMP for
PNG activity in Saskatchewan. When applicable, winter drilling programs should be adopted as
an EMP for PNG construction, given that the benefits outweigh the drawback.
84
5.5 Spatial Extent of the PNG Impacts to Grassland Ecosystems
In 1979, the percentage of the study area occupied by lease sites and lease access roads was
0.07% and 0.13%, respectively. However, when the ecological effects of lease site activities are
considered, namely the effects of construction, operations, and maintenance, the total ecological
footprint of lease sites and access roads increased to 0.31% and 0.67%, respectively. Combined,
the total ecological footprint of PNG development pre-1979 accounted for 25% of the total
disturbed area in the pasture. The other 75% of disturbance within the study area is accounted
for by PFRA access roads and trails. In 1997, the percentage of the pasture occupied by both
lease sites and access roads was 1.07%. In 2005, the percentage occupied by lease sites and
access roads increased to 1.30%. When the ecological effects of lease sites and access roads
were considered, the percent loss increased to 4.50% in 1997, and 5.10% in 2005. In 1997, the
ecological footprint of PNG development accounted for 45% of the total disturbance in the study
area while the other 55% of disturbance is accounted for by PFRA access roads and trails. In
2005, the ecological footprint of PNG development accounted for over 75% of the total disturbed
area in the pasture. The remaining 25% of disturbance is accounted for by PFRA access roads
and trails. Although management practices appear to be minimizing the spatial extent of the
impacts associated with individual PNG lease sites, these results suggest that at the landscape
level fragmentation and cumulative loss from PNG development is increasing.
Effects associated with the construction, maintenance, and operation of oil and gas lease
sites extend beyond the direct physical footprint of the infrastructure. The average size of PNG
lease sites in the study area, and surrounding region, is 10,000m2 or 1ha. Given that the well
head is at the center of the lease, the distance from the well head to the lease boundary is
approximately 50m. Where required, construction occurs throughout the 10,000m2 lease.

85
However, findings from this thesis suggest that the impacts from PNG development do not
occupy the entire 10,000m2 ROW.
Construction of the aggregate pad and lease road, which in some instances also involves re-
contouring of the lease site, alters soil properties and results in the removal of herbaceous ground
cover. The well head itself is treated with chemical herbicides to prevent fire hazards. This, in
turn, significantly reduces the presence of both desirable and undesirable species within 0m –
10m of the well head. Low Ah values associated with oil and gas lease sites is the result of
construction practices. It is not surprising that mineral soil horizons are so poorly developed
within 0m – 10m of the well head, given the presence of the aggregate pad. In terms of range
health surrounding the well head, conditions were considered poor within 40m of the well head.
Associated with the construction of an oil or gas lease site are an aggregate pad upon which
the pump jack or screw pump is located, and the lease site road. It is important to note that the
lease site road and the lease access road differ in size, construction techniques, and also impact.
Lease site roads are often simply extensions of the aggregate pad upon which traffic travels.
Findings from the analysis indicated that although the impacts from the aggregate pad and lease
road are severe, they are confined to close proximity to the well head itself.
Low soil acidity and increased electro-conductivity values close to the well head reflect
construction practices prior to the mid 1980s, which involved the handling of spills and solution
water. Before regulations outlined in the EIA regarding the handling of spills and solution water
were introduced, it was common practice for operations to spread solution water and spills
throughout the lease, rather than removing them. This in turn increased the alkali concentration
in soils and reduced soil acidity (Letey 2000). As previously discussed, increased bare ground

86
accelerates soil moisture evaporation, which is likely contributing to soil salinity, and electro-
conductivity.
In order to restore sections of the pasture that have been altered through oil and gas
developed to native conditions, reclamation practices are required. Work by Hammermeister
(2001), Desserud (2006), and Elsinger (2009) indicates that the restoration of once native
grassland ecosystems following oil and gas development requires adaptive monitoring to control
grazing pressures, and promote native grassland community establishment. However, given that
the majority of abandoned oil and/or gas lease sites within the study area have not been
decommissioned, reclamation practices have not been implemented. As a result the impacts
associated with the infrastructure and the construction of the aggregate pad (within the ROW)
persists for 50 years. This suggests that recent changes to lease site management and
construction practices (EIA/EPP) are decreasing the associated impacts to grassland ecosystems.
Although management has reduced the impacts of oil and gas lease site activity on grassland
ecology, significant impacts exist within the study area.
5.6 Implications for EIA Follow-up Programs and Grassland Management
An effective follow-up program should contribute knowledge for the management of future
development projects (Arts et al. 2001). Findings from this thesis, however, reveal a disconnect
between impact assessment, planned mitigation, and understanding and managing the actual
outcomes of development. A good follow-up program allows for more appropriate decisions
concerning future developments, including choices about mitigation measures, to be made with
consideration for ecological effects management. As emphasized in the literature (e.g. Treweek

87
1996; Cashmore 2004; Tinker et al. 2005; Legg et al. 2006), follow-up programs, supported by
empirical science, allows for key VECs to be included in future policy and practice.
From conducting a ‗follow-up‘ assessment of nearly fifty years of oil and gas activity within
a grassland ecosystem it is recommended that construction practices strive to minimize surface
disturbance. To minimize the loss of desirable/native species, vegetative diversity, and essential
ground cover characteristics, it is suggested that:
1. PNG lease site construction practices should avoid recontouring and leveling the entire lease
ROW when possible. In cases where recountouring is required, attempts should be made to
avoid soil admixing by separating organic and mineral horizons.
2. To avoid soil contamination, spills and solution fluids should be trucked off site. The burial
and/or spreading of solution water, drilling chips and/or fluids within the lease ROW should
not be permissible.
3. Given the sensitivity of the study site, areas of moving sand should be avoided. Following
lease site construction, exposed soil should be covered with Geotextile fabric and litter to
help stabilize the soil, and promote revegetation. It is not recommended that crested wheat
grass (Agropyron pectiniforme) be used to stabilize the landscape.
Regarding PNG development in the study area, current guidelines for project proposals are
detailed in PFRA‘s 2005 ‗Environmental Assessment Plan Outline‘ (PFRA 2005a). This
document encompasses key components that need to be addressed and included in project
proposals and EIA/EPPs. Specifically, the review of project proposals (EIA/EPPs) reveals that
sufficient pre-decision attention is directed towards the construction of a lease site. However,
little to no attention is given to decommissioning and reclamation of the lease site, or to
88
following-up on the cumulative or landscape impacts of multiple lease sites. In this regard,
mitigation measures outlined in PFRA‘s 2005 ‗Environmental Assessment Plan Outline‘ require
greater detail regarding the key VECs to be addressed in assessment and monitoring programs,
as well as the implementation of specific post-construction measures to control surface
disturbance.
Despite the intent of PFRA‘s reclamation guidelines and strategy, it is limited by the fact that
few of the PNG lease sites within the study area are decommissioned. Rather, most lease sites
are left abandoned. Under the current legislation, it is more financially viable for the proponent
to continue renewing an abandoned lease site, rather than engage in de-construction and
reclamation strategies. Findings from this research reveal that lease sites left abandoned are
unable to recover to pre-development conditions via natural processes. In order to address the
long term impacts form development, PNG lease sites need to be decommissioned.
5.7 Conclusions
A number of issues have emerged from this research that require further attention. First,
while indirect, the study identified significant impacts to grasslands associated with the
construction and maintenance of lease site access roads. Numerous studies, including the
GSHRES (2007), identify access roads as a major contributor to the fragmentation and
degradation of grassland landscapes. Although included in the project proposal screening stage,
the construction of access roads requires little to no post-decision monitoring or follow-up. As a
result, the total impacts of PNG development are unknown or largely ignored. Although it was
beyond the scope of this thesis, preliminary findings in the study area and findings from research
elsewhere, suggest that the impacts of access roads should not be overlooked in future scenarios.

89
Second, uncertainty remains regarding the construction of pipelines within the study area and
the effects of pipeline development. While none of the oil lease sites within the study area and
surrounding region are tied into pipelines, the majority of gas well are. Collectively, the total
footprint of gas lease sites were observed to be lower than the those associated with oil wells,
which may be due to lower truck traffic at gas sites due to the presence of the pipeline.
However, insufficient evidence exists to suggest that all lease sites should be connected to
pipelines rather than use storage tanks, as the effects of pipeline construction and fracturing in
the study area were outside the scope of this thesis. While construction practices associated with
the development of oil and gas pipelines in grassland ecosystems have significantly improved
over the last fifteen years, it is unknown whether the impacts are lower than those associated
with increased vehicle traffic.
Third, as with many environmental studies of this nature, the lack of appropriate temporal
and spatial baseline information needs to be addressed. From a temporal standpoint, insufficient
baseline information exists for the study area before the 1990s. As a result, lease sites drilled
from 1955 to present can only be compared to baseline data collected in the summer of 2008.
Spatially, to ensure that the baseline data collected were independent of PNG impacts, the
reference pasture sites were located upwards of 100m from PNG lease site ROWs. Further,
given that cattle grazing has been the primary focus of land use within the study area, it is
important to make the distinction that baseline data collected in the study area represents lands,
that have been subjected to over 30 years of disturbance due to conservation grazing activities.
This baseline needs to be taken into consideration when making inferences regarding the impacts
of PNG on ‗pristine‘ native grasslands. In order to advance the understanding of the impacts of

90
development within the study area, range health management plans conducted by the PFRA
should attempt to focus on the collection of long term, collaborative baseline data.
Fourth, given the historical and ongoing nature of land use in the study area, to fully
understand the impacts associated with PNG development there is a need to assess total or
cumulative environmental effects. Conservation grazing remains the predominant focus of land
use in the study area. Although not fully supported by this thesis, research by Neath (1990) and
Elsinger (2009) suggest that the impacts and restoration efforts associated with PNG
developments are negatively affected by increased grazing pressures. Given that lease site
ROWs located in heavily grazed fields are often not fenced, grazing occurs in close proximity to
lease site infrastructure. The areas surrounding lease sites are subject to interactive and
synergistic cumulative effects form PNG lease site construction and grazing pressures.
Interactive and synergistic pressures likely also persist surrounding lease access roads where
grazing occurs. Future research in this area is required to address recent concerns presented by
Environment Canada regarding the nature of cumulative effects in the province, which include
PNG development within PFRA lands.
In conclusion, the impacts of PNG development to dune blowouts and mixed grasslands in
the study area extend well beyond the direct, physical footprint of infrastructure itself and are
long term. The research indicates that under current EIA/EPP practice, the actual effects of
development are not sufficiently addressed or understood. While the role of the EIA process is
to identify, evaluate, predict, mitigate, and monitor the effects of PNG development on the
environment, the lack of follow-up monitoring programs prevents knowing the actual spatial and
temporal extent of the impacts, and whether or not the implemented mitigation measures were
successful. In order to better understand and manage the effects of PNG development on

91
grasslands in Saskatchewan and Canada, the EIA process requires a more adaptive approach
where scientific, ecological-based knowledge derived from follow-up programs is incorporated
into pre-decision stages of development assessment and decision making.
92
LITERATURE CITED
Abouguendia Z. 1990. Range plan development. A practical guide to planning for management
and improvements of Saskatchewan rangeland. New pasture and grazing technology project,
Appendix E.
Adams B.W., W. Tedder, D. Downing, and A. Janz. 1996. Reclamation of mixed grass prairie
disturbed by pipeline construction; reclamation research technical advisory committee, 50pp.
Adams, B.W., G., Ehlert, C., Stone, D., Lawrence, M., Alexander, M., Willoughby, D. Moisey,
A., Burkinshaw, J. Carlson. 2004. Rangeland health assessment for grassland, forest and tame
pasture. Alberta Sustainable Resource Development, Public Lands and Forests, p.12-19.
Agriculture and Agri-Food Canada; Historical Series (AAFC). 2001. [Online] http://epe.lac-
bac.gc.ca/100/205/301/ic/cdc/agrican/pubweb/hs3_toc.asp Accessed Feb 2 2009.
Agriculture and Agri-Food Canada (AAFC). 2006. Re-establishment of a mixed native
grassland in southwest Saskatchewan.
Agriculture and Agri-Food Canada; Environmental Assessment (AAFC). 2009. [Online]
http://www4.agr.gc.ca/AAFC-AAC/display-afficher.do?id=1187706462232&lang=eng Accessed
Feb 2 2009.
Agriculture and Agri-Food Canada; Prairie Farm Rehabilitation Administration (AAFC)–
Organizational Overview. 2007a. [Online] http://www4.agr.gc.ca/AAFC-AAC/display-
afficher.do?id=1187364281958⟨=e Last Accessed: Feb 2 2009.
Agriculture and Agri-Food Canada; PFRA History (AAFC). 2007b. [Online]
http://www4.agr.gc.ca/AAFC-AAC/display-afficher.do?id=1187374232064&lang=eng Last
Accessed: Feb 2 2009.
Alberta Agriculture and Food. 2000. Weeds of the prairies. Alberta Agriculture and Food,
Edmonton, Alberta. 266 pp.
Arts J., P. Caldwell, and A. Morrison-Saunders. 2001. Environmental impact assessment follow-
up: good practice and future directions – findings from a workshop at the IAIA 2000 conference.
Impact Assessment and Project Appraisal 19: 175-185.
Bailey J. 1997. Environmental impact assessment and management: An anderexplored
relationship. Environmental Management 21:317-327.
Balvanera P., A.B. Pfisterer, N. Buchmann, J.S. He, T. Nakashizuka, D. Raffaelli, and B.
Schmid. 2006. Quantifying the evidence for biodiversity effects on ecosystem functioning and
services Ecological Letters 9: 1146-1156.

93
Beals, M.J. 2006. Understanding community structure: A data-driven multivariate approach.
Oecologia, 150: 484-495.
Beanlands G. and P. Duinker. 1983. An ecological framework for environmental impact
assessment. Journal of Environmental Management, 18: 267-277.
Berquist E., P. Evangelista, and T.J. Stohlgren. 2007. Invasive species and coal bed methane
development in the Powder River Basin, Wyoming. Environmental Monitoring Assessment 128:
381-394.
Business Services Improvement Branch Economic and Co-operative Development; The
Provincial regulatory approval process in Saskatchewan for petroleum and natural gas drilling
and seismic exploration (BSIB). 2001. [Online]
http://www.ir.gov.sk.ca/adx/aspx/adxGetMedia.aspx?DocID=2946,3384,5460,2936,Documents
&MediaID=4721&Filename=drillingpaper.pdf Accessed Feb 21 2009.
Canadian Association of Petroleum Producers (CAPP). 2007. [Online].
http://www.capp.ca/default.asp?V_DOC_ID=677 Last Accessed: 26 February 2008.
Canadian Center for Energy Information (CCEI). 2006. Canada‘s unconventional natural gas
resources.
Canadian Environmental Assessment Agency (CEAA). 2000. [Online].
http://www.ceaa.gc.ca/015/priorities_e.htm Last Accessed: 9 November 2007.
Canadian Plains Research Center (CPRC). 1998. Saskatchewan prairie biodiversity study, eds.
Pepper G.W., and D.A. Gauthier, Canada/Saskatchewan Agricultural Green Plan Agreement.
Canadian Plains Research Center (CPRC), University of Regina: The encyclopedia of
Saskatchewan. 2006. [Online] http://esask.uregina.ca/entry/oil_and_gas_industry.html Last
Accessed: Jan 24 2009.
Cashmore M. 2004. The role of science in environmental impact assessment: process and
procedure versus purpose in the development of theory. Environmental Impact Assessment
Review 24: 403-426.
Clarke K.R., P.J. Somerfield, and M.G. Chapman. 2006. On resemblance measures for
ecological studies, including taxonomic dissimilarities and a zero-adjusted Bray-Curtis
coefficient for denuded assemblages. Journal of Experimental Marine Biology & Ecology 330:
55-80.
Colgerg T.J., J.T. Romo. 2003. Club moss effects on plant water status and standing crop.
Journal of Range Management 56: 489-495.
Coupland R.T. 1961. A reconsideration of grassland classification in the northern great plains
of North America. Journal of Grassland Ecology l8: 135 – 167.
94
Cummings J., N. Reid, I. Davies, and C. Grants. 2005. Adaptive restoration of sand-mined areas
for biological conservation. Journal of Applied Ecology 42: 160-170.
Department of Justice Canada; The oil and gas conservation regulations, 1985 (DJC). 2007.
[Online] http://www.qp.gov.sk.ca/documents/English/Regulations/Regulations/O2R1.pdf
Accessed Feb 21 2009.
Department of Justice Canada; Prairie Farm Rehabilitation Act (AAFC). 2009. [Online]
http://laws.justice.gc.ca/en/showdoc/cs/P-17///en?page=1 Last Accessed Feb 2 2009.
Desserud, P.A. 2006. Restoration of rough fescue grasslands on pipelines in southwest Alberta.
M.Sc. Thesis. University of Calgary. Calgary, Alberta: pp.190.
Dufrene M., and P. Legendre. 1997. Species assemblages and indicator species: the need for a
flexible asymmetrical approach. Ecological Monographs 67: 345-366.
Elsinger, M.E. 2009. Reclamation status of rough fescue grasslands at Rumsey block in central
Alberta, after oil and gas well sites and pipeline disturbances. M.Sc. Thesis. University of
Alberta. Edmonton, Alberta: pp. 247.
Environment Canada - Meteorological Service of Canada. 2007. Annual temperature trends,
extremes and current season ranking, 1948-2008 (61 Years). Online, accessed March 31st 2007.
http://www.msc-
smc.ec.gc.ca/ccrm/bulletin/rsummarytable_e.html?table=temperature&season=Winter&date=20
08&nyears=61
Forman R.T.T. 1995. Land Mosaics: The ecology of landscapes and regions; Cambridge
University Press, UK, p. 407.
Forman R.T.T., D. Sperling, J.A. Bissonette, A.P. Clevenger, C.D. Cutshall, V.H. Dale, L.
Fahriq, R.L. France, C.R. Goldman, K. Heanue, J. Jones, F. Swanson, T.Turrentine, and T.C.
Winter. 2003. Chapter 4, Roadsides and Vegetation, in, Road Ecology; Science and Solutions,
Island Press, Washington D.C., pp. 75-113.
Fridley J.D., J.J. Stachowicz, S. Naeem, D.F. Sax, E.W. Seabloom, M.D. Smith, T.J. Stohlgren,
D. Tilman, and B. Von Holle. 2007. The invasion paradox: reconciling pattern and process in
species invasion. Ecology 88: 3-17.
Frost R. 1997. EIA monitoring and audit, in Weston J., ed., Planning and environmental impact
assessment in practice: Harlow, Addison Wesley, p. 141-164.
Gauthier D.L., Johnson, H.B., Mayeux, H.S. and Polley, H.W. 2003. in Grasslands towards a
North American conservation strategy. Co-published by commission for environmental
cooperation and Canadian plains research center, University of Regina 2003.
Gelbard J.L., and S. Harrison. 2003. Roadless habitats as refuges for native grasslands:
Interactions with soil, aspect, and grazing. Ecological Applications 13: 404-415.

95
Gibson R.B. 2002. From Wreck Cove to Voisey‘s Bay: the evolution of federal environmental
assessment in Canada. Impact Assessment and Project Appraisal 20: 151-159.
Golder Associates Ltd. 2005. Project proposal for the proposed Java South 2-20-15-15 W3M
drilling project, prepared for Husky Energy Ltd, Swift Current, Saskatchewan.
Government of Saskatchewan Energy and Resources (GSER). 2009. [Online]
http://www.infomaps.gov.sk.ca/website/SIR_Geological_Atlas/viewer.htm Last Accessed:
February 1 1009.
Government of Saskatchewan Energy and Resources; Crown dispositions (GSER). 2009a.
[Online] http://www.er.gov.sk.ca/Default.aspx?DN=3832,3402,3384,2936,Documents Accessed
Feb 3 2009.
Government of Saskatchewan Energy and Resources; Great year for oil and gas well drilling
(GSER). 2009b. [Online] http://www.gov.sk.ca/news?newsId=2f88c86a-6906-41f1-b472-
eb8527dc9666 Accessed Feb 3 2009.
Government of Saskatchewan Industry and Resources; The Provincial regulatory approval
process – petroleum and natural gas drilling (Detailed) (GSIR). 2001. [Online]
http://www.ir.gov.sk.ca/adx/aspx/adxGetMedia.aspx?DocID=2946,3384,5460,2936,Documents
&MediaID=4724&Filename=drilling.pdf Accessed Feb 21 2009.
Government of Saskatchewan Industry and Resources; Crude oil in Saskatchewan (GSIR).
2008.
[Online]http://www.ir.gov.sk.ca/adx/aspx/adxGetMedia.aspx?DocID=5871,5775,2936,Documen
ts&MediaID=18882&Filename=crude.pdf Last Accessed: Jan 24 2009.
Government of Saskatchewan Industry and Resources (GSER). 2009. [Online]
http://www.infomaps.gov.sk.ca/website/SIR_Oil_And_Gas_Wells/viewer.htm Last Accessed:
January 24 2009.
Great Sand Hills Regional Environmental Study (GSHRES). 2007. [Online].
http://www.environment.gov.sk.ca/Default.aspx?DN=32911ed7-b6a9-495c-8d47-66c593a5d92a
Last Accessed: November 27th
2007.
Hammermeister A.M. 2001. An ecological analysis of prairie rehabilitation on petroleum
wellsites in southeastern Alberta. PhD Dissertation. University of Alberta, Edmonton, Alberta.
Hanna K.S. 2005. A brief introduction to environmental impact assessment, in Hanna K. S., ed.,
Environmental Impact Assessment, Practice and Participation: New York, Oxford University
Press, p. 3-15.
Hirst C.N., and D.A. Jackson. 2007. Reconstructing community relationships: the impacts of
sampling error, ordination approach, and gradient length. Diversity and Distributions 13: 361-
371.
96
Hobson K.A., E.M. Bayne, and S.L. Van Wilgenburg. 2002. Large-scale conservation of forest
to agriculture in the Boreal Plains of Saskatchewan. Conservation Biology 16: 1530-1541.
Holeckek J.L., R.D. Pieper, C.H. Herbel. 1995. Range Management Principles and Practices,
Second Edition. Prentice Hall, New Jersey, pp. 112-130, 208, 445-464.
Hooper D.U., F.S. Chapin, J.J. Ewel, A. Hector, P. Inchausti, S. Lavorel, J.H. Lawton, D.M.
Lodge, M.Loreau, S. Naeem, B. Schmid, H. Setala, A.J. Symstad, J. Vandermeer, and D.A.
Wardel. 2005. Effects of biodiversity on ecosystem functioning: a consensus of current
knowledge. Ecological Monographs 75: 3-35.
Jay S., C. Jones, P. Slinn, and C. Wood. 2007. Environmental impact assessment: retrospective
and prospect. Environmental Impact Assessment Review 27: 287-300.
Jentsch A. 2002. Impact of disturbance on biodiversity and resilience of ecosystems. Integrated
Project (1.6.3 Global Change and Ecosystems): Disturbance. Center of Environmental Research
Leipzig-Halle, Germany.
Klassen, R.W. 2002. Surficial geology of the Cypress Lake and Wood Mountains, Map areas,
Southwestern Saskatchewan. Geological Survey of Canada 562: 3-22.
Knight O. 1956. Oil – Canada‘s New Wealth in The Business History Review, The Presidents
and Fellows of Harvard College, vol30, #3 pp. 297 – 328.
Legendre P., and E.D. Gallagher. 2001. Ecologically meaningful transformations for ordination
of species data. Oecologia 129: 271-280.
Legg C., and L. Nagy. 2006. Why most conservation monitoring is, but need not be, a waste of
time. Journal of Environmental Management 78: 194-199.
Letey P. 2000. Soil salinity poses challenges for sustainable agriculture and wildlife: California
Agriculture, 54: 43.
Linke J., G.J. McDermid, A.D. Pape, A.J. McLane, D.N. Laskin, M. Hall-Beyer, and S.E.
Franklin. 2008. The influence of patch-delineation mismatches on multi-temporal landscape
pattern analysis. Landscape Ecology, 24: 157-170.
MacDougall A.S., J. Boucher, R. Turkington, and G.E. Bradfield. 2006. Patterns of plant
invasion along an environmental stress gradient. Journal of Vegetation Science 17: 47-56.
Maron L.J., Vila M. Bommarco, R. Elmendorf, and P. Beardsley. 2004. Rapid evolution of an
invasive plant: Ecological Monographs, Ecological Society of America, pp. 261-280.
Marshall R. 2004. Can industry benefit from participation in EIA follow-up? The ScottishPower
experience in Morrison-Saunders and Arts (2004a), pages 118-153.
Marshall R. 2005. Environmental impact assessment follow-up and its benefits for industry.
Impact Assessment and Project Appraisal 23: 191-196.
97
Marshall R., J. Arts, and A. Morrison-Saunders. 2005. International principles for best practice
EIA follow-up. Impact Assessment and Project Appraisal 23: 175-181.
McCune B., and J.B. Grace. 2002. Analysis of Ecological Communities, MjM Software Design,
Glendale Beach, Oregon, p. 45-58, 75-77, 102-114, 112-124, 188-194.
McGarigal K., Cushman S., Stafford S. 2000. Chapter 4, Discriminant Analysis, in Multivariate
Statistics for Wildlife and Ecology Research,Springer Science + business Media Inc, New York,
pp.129-179.
Morris P., and R. Therivel. 1995. Introduction and Interactions Between Impacts, in Morris P.,
and R. Therivel, eds., Methods of Environmental Impact Assessment: Vancouver, UBC Press, p.
1-7, 297-305.
Morrison-Saunders A., J. Arts, and J. Baker. 2003. Lessons from practice: Towards successful
follow-up. Impact Assessment and Project Appraisal 21: 43-56.
Morrison-Saunders A., and J. Arts. 2005. Learning from experience: emerging trends in
environmental impact assessment follow-up. Impact Assessment and Project Appraisal 23: 170-
174.
Morrison-Saunders A., and R. Marshall. 2007. EIA Follow-up, International Best Practice
Principles. Special Publication Series No.6, Fargo, USA: International Association for Impact
Assessment.
Moss E.H. 1983. Flora of Alberta. Second Edition, revised by J.G. Packer. University of Toronto
Press, Toronto, Ontario. 687 pp.
Neath M.A., D.S. Chanasyk, R.L. Rothwell, and A.W. Bailey. 1990. Grazing impacts on
infiltration in mixed prairie and fescue grassland ecosystems of Alberta. Canadian Journal of
Soil Science 70: 593-605.
Neath M.A., W.B. McGill, and A.W. Bailey. 1987. Persistence of changes in selected soil
chemical and physical properties after pipeline installation in solonetzic native rangeland.
Canadian Journal of Soil Science 67: 747-763.
Noble B.F. 2006. Introduction to Environmental Impact Assessment, A guide to principles and
practice: New York, Oxford University Press, p. 10 – 24.
Noss R. 1990. Indicators for monitoring biodiversity: a hierarchical approach. Conservation
Biology 4: 355-363.
Osterman D.K. 2001. Revegetation assessment of a twelve-year old pipeline on native rangeland
in southern Alberta. M.Sc. Thesis. University of Alberta. Edmonton, Alberta; pp. 121.
Patten M.A., E. Shochat, D.L. Reinking, D.H. Wolfe, and S.K. Sherrod. 2006. Habitat edge, land
management, and rates of brood parasitism in tallgrass prairie. Ecological Applications 16: 687-
695.
98
Petherbridge W.L. 2000. Sod salvage and minimal disturbance pipeline restoration techniques:
implications for native prairie restoration. M.Sc. Thesis. University of Alberta, Edmonton,
Alberta.
Prairie Conservation Action Plan (PCAP). 1995. Alberta prairie conservation action plan; 1996-
2000. Prairie Conservation Forum, 17pp.
Prairie Farm Rehabilitation Administration (PFRA). 2005. [Online]
http://www.agr.gc.ca/pfra/pfhist_e.htm Last Accessed: November 17 2007.
Prairie Farm Rehabilitation Administration. 2005a. PFRA Environmental assessment plan
outline. Prairie Farm Rehabilitation Administration (PFRA) – AAFC.
Prairie Farm Rehabilitation Administration (PFRA). 2005b. Range management plan for Swift
Current-Webb PFRA Community Pasture.
Prairie Farm Rehabilitation Administration (PFRA). 2007. [Online]
http://www.agr.gc.ca/pfra/biodiversity/intro_e.htm Last Accessed: November 17 2007.
Romo J.T., and Y. Bai. 2004. Seed bank and plant community composition, mixed prairie of
Saskatchewan. Journal of Range Management 57: 300-304.
Rowell M.J., and L.Z. Florence. 1993. Characteristics associated with difference between
undisturbed and industrially-disturbed soils. Soil Biology and Biochemistry 25: 1499-1511.
Roy, Schaeffer. 1988. In the public interest: The oil and gas industry of Saskatchewan 1905 –
1950. Masters Thesis, University of Saskatchewan.
Saskatchewan Institute of Pedology, 1998, Preliminary Soil Map and Report: Saskatchewan Soil
Survey, University of Saskatchewan, p.30-36
Saviozzi A., R. Levi-Minzi, R. Cardelli, and R. Riffaldi. 2001. A comparison of soil quality in
adjacent cultivated, forest and native grassland soils. Plant and Soil 233: 251-259.
Scheider R.R., J.B. Stelfox, S. Boutin, and S. Wasel. 2003. Managing the cumulative impacts of
land uses in the Western Canadian Sedimentary Basin: A modeling approach. Conservation
Biology 7: 1-8.
Sinton H. M. 2001. Prairie Oil and Gas – A Lighter Footprint: Edmonton, Alberta, Alberta
Environment.
Storey K., and B. Noble. 2002. Increasing the utility of follow-up in Canadian environmental
assessment: a review of requirements, concepts and experience. [Online]. http://www.ceaa-
acee.gc.ca/015/001/030/index_e.htm Last Accessed: 11 November 2007
Tilman, D. 1997. Chapter 8, Mechanisms of plant competition, in Crawley, M.J., ed. Plant
Ecology, Blackwell Science, United Kingdom, pp. 242-262.

99
Tilman, D. 2004. Nice tradeoffs, neutrality, and community structure: a stochastic theory of
resource competition, invasion, and community assembly. Proc. National Academy of Science
101: 10854-10861.
Tinker L., D. Cobb, A. Bond, and M. Cashmore. 2005. Impact mitigation in environmental
assessment: paper promises or the basis of consent conditions? Impact Assessment and Project
Appraisal 23: 265-280.
Treweek J. 1996. Ecology and Environmental Impact Assessment. Journal of Applied Ecology
33: 191-199.
Van Lamoen F., and J. Arts. 2002. EIA follow-up for road projects: What do we want and need
to know? Paper presented at the International Association for Impact Assessment Annual
Conference June 2002. The Hague, NL.
Wali K.W. 1999. Ecological succession and the rehabilitation of disturbed terrestrial ecosystems.
Plant and Soil 213: 195-220.
Willms W.D., and B.H. Ellert, H.H. Janzen, and H. Douwes. 2005. Evaluation of native and
introduced grasses for reclamation and production. Rangeland Ecology Management 58: 177-
183.
Wilsey, J.B. and Polley, W.H., 2003, Effects of Seed Additions and Grazing History on Diversity
and Productivity of Subhumid Grasslands. Ecology, Ecological Society of America, 930-931.
Wilson S.D., and A.K. Gerry. 1995. Strategies for mixed-grass prairie restoration: Herbicide,
tilling and nitrogen manipulation. Society of Ecological Restoration 3: 290-298.
Zink J.A., M.F. Allen, D. Heindl-Tenhunen, and E.B. Allen. 1995. The effect of a disturbed
corridor on an ecological reserve. Restoration Ecology 3: 304-310.

100
CHAPTER 6
APPENDIX
Table A.1 Desirable and undesirable grasses, grass-likes, forbs and woody forbs in Swift Current-Webb Pasture
List of grass and grass-like species, including common and Latin names1
Common Name Latin Name Undesirable Range Species (x)
Indian Rice Grass Achnatherum hymenoides
Northern Wheat Grass Agropyron dasystachyum
Crested Wheat Grass Agropyron pectiniforme x
Western Wheat Grass Agropyron smithii
Blue Grama Grass Bouteloua gracilis
Smooth Brome Bromus inermis x
Downy Brome Bromus tectorum x
Sand Grass Calamovilfa longifolia
Low Sedge Carex elecocharis
Thread-leaved sedge Carex filifolia
Canadian Wild-rye Elymus canadensis x
Quack Grass Elytrigia repens x
Foxtail Barley Hordeum jubatum x
Baltic Rush Juncus balticus
June Grass Koeleria cristata
Plains Muhly Muhlenbergia cuspidata
Mat Muhly Muhlenbergia richardsonis
Kentucky Blue Grass Poa pratensis x
Sandlebergs Blue Grass Poa sandbergii
Alkali Grass Puccinellia spp. x
Sand Dropseed Sporobolus cryptandrus
Needle and Thread Grass Stipa comata
Western Porcupine Grass Stipa curtiseta 1Latin names taken from USDA Plants Database (http://plants.usda.gov/) and Flora of
Alberta (Moss 1983)

101
List of forb species, including common and Latin names1
Common Name Latin Name Undesirable Range Species (x)
Yarrow Achillea millefolium
Nodding Onion Allium cernuum
Pymgy Flower Androsace septentrionalis x
Pussytoes Antennaria spp.
Rock Crest Arabis spp.
Pasture Sage Artemisia frigida x
Buffalo Bean Astragalus crassicarpus
Milk-Vetch Austragalus spp. x
Blue Bell Campanula rotundifolia
Nodding Thistle Carduus nutans x
Prostrate Knapweed Centaurea maculosa x
Field Chickweed Cerastium arvense x
Goosefoot Chenopodium spp. x
Hairy Golden Aster Chrysopsis villosa
Canadian Thistle Cirsium arvense x
White Thistle Cirsium hookerianum x
Pale Comandra Comandra pallida
Flixweed Descurainia sophia x
Wood Whitlow Grass Draba nemorosa x
Horsetail Species Equisetum spp. x
Aven species Geum spp.
Gumweed Grindelia squarrosa x
Spiny Ironplant Haplopappus spinulosus x
Kochia Kochia scoparia x
Blue-Bur Lappula echinata x
Pepper Grass Lepidium densiflorum x
Skeletonweed Lygodesmia rostrata x
Yellow Sweet Clover Melilotus officinalis x
Alfalfa Medicago sativa x
Pin Cushion Cactus Navarretia minima
Ball Mustard Neslia paniculata x
Prickly Pear Cactus Opuntia spp.
Locoweed Oxytropis spp. x
White Beards Tongue Penstemon albidus x
Moss Phlox Phlox hoodii
Plantain Plantago spp. x
Prairie Cinquefoil Potentilla
Silverweed Potentila anserina x
Shrubby Cinquefoil Potentilla fruticosa

102
List of forb species, including common and Latin names continued
Common Name Latin Name Undesirable Range Species (x)
Silver-leaved psoralea Psoralea argophylla
Prairie Cone Flower Ratibida columnifera
Russian Thistle Salsola pestifer x
Solomon's Seal Smilacina trifolia x
Wild Tomato Solanum triflorum
Goldenrod Solidago spp.
Sow Thistle Sonchus spp. x
Scarlet Mallow Sphaeralcea coccinea
Dandelion Taraxacum officinale x
Golden Bean Thermopsis rhombifolia x
Yellow Goat's Beard Tragopogon dubius x
American Vetch Vicia americana 1Latin names taken from USDA Plants Database (http://plants.usda.gov/) and Flora of
Alberta (Moss 1983)
List of woody forb species, including common and Latin names1
Common Name Latin Name Undesirable Range Species (x)
Western Snowberry Symphoricarpos occidentalis
Silver Sagebrush Artemisia cana
Wolf Willow Elaeagnus commutata
Wild Licorice Glycyrrhiza lepidota
Prickly Rose Rosa acicularis x
Wood Rose Rosa woodsii 1Latin names taken from USDA Plants Database (http://plants.usda.gov/) and Flora of
Alberta (Moss 1983)
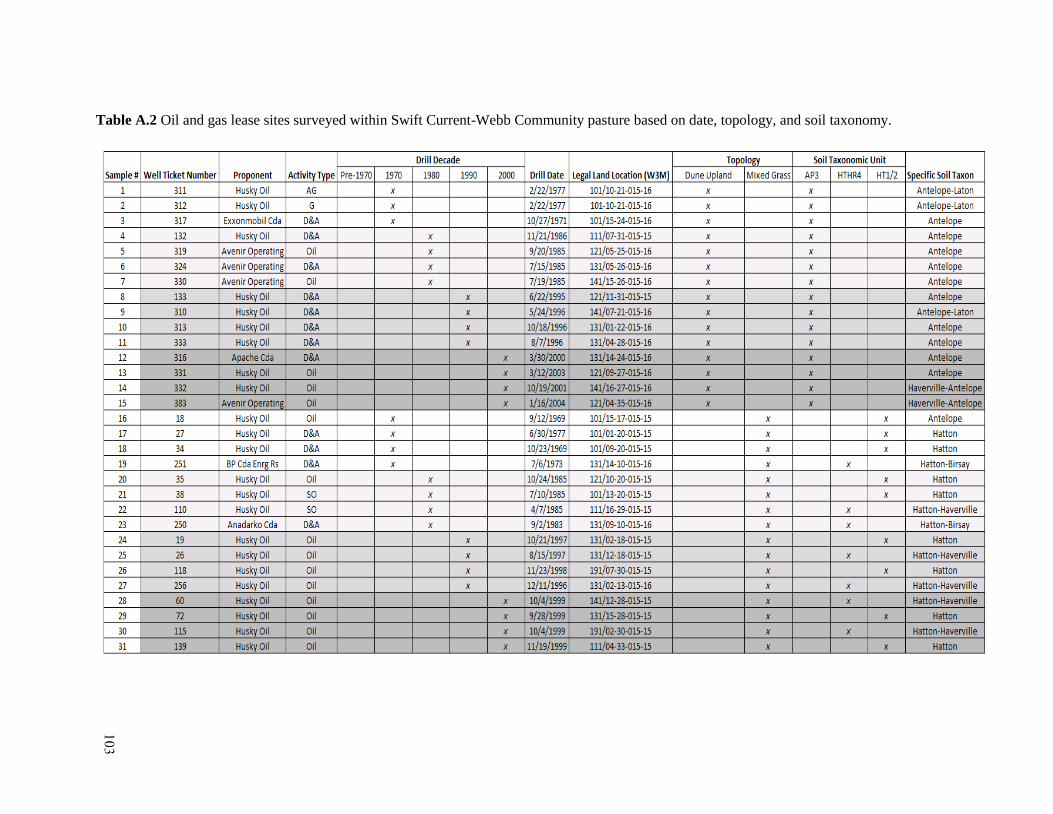
Table A.2 Oil and gas lease sites surveyed within Swift Current-Webb Community pasture based on date, topology, and soil taxonomy.

TABLE A.3 Results of indicator analysis of desirable species comparing lease sites to reference pasture sites.*
Desirable species Oil and gas lease sites (IV%) Reference pasture sites (IV%)
Blue grama grass (Bouteloua gracilis) 32.9** 0.0
Indian rice grass (Oryzopsis hymenoides) 10.7* 0.0
Canada blue grass (Poa compressa) 40.7* 0.0
Muhly species (Muhlenbergia spp.) 15.2** 0.0
Aster species (aster spp.) 9.7* 0.0
Pale comandra (Comandra palliada) 18.4* 0.0
Silver-leaved psoralea (Psoralea argophylla) 28.5* 0.0
Three-leaved sedge (Carex filifolia) 31.7** 0.0
*Indicator species were selected based on a measure of Indicator Value (%) at a 0.05 significance level. Shaded cells indicate species that were significant
indicators for each of the lease classes. All species have a relative abundance value greater than 5%, and are not considered rare to the environment.

Table A.4 Results of indicator analysis of undesirable species comparing lease sites by class. Indicators species were selected based on a measure of
Indicator Value (%) at a 0.05 significance level. Yellow indicates species which are significant indicators for each of the lease classes. Red
indicates species which were significant, but considered rare (below 5% Relative Abundance). Significant results are shown in bold.
Lease Class Active Oil Active Gas Suspended Oil Suspended Gas Abandoned Oil Abandoned Gas Potential Well Drilled and Abandoned p-value
Elymus canadensis 0 0 39 0 0 0 5 0 0.02
Puccinellia spp. 6 5 38 0 7 0 1 0 0.04
Poa pratensis 6 0 0 0 3 0 47 0 0.01
Agropyron
pectiniforme 17 28 2 2 14 21 2 0 <0.01
Hordeum jubatum 1 0 3 0 1 1 0 58 <0.01
Atremisia frigida 16 26 7 15 9 16 4 1 0.01
Melilotus officinalis 0 0 0 0 1 0 0 42 0.02
Lygodesmia rostrata 0 4 0 1 0 0 0 35 0.04
Descurainia sophia 4 0 7 56 0 5 5 0 <0.01
Solanum triflorum 0 50 0 0 0 0 0 0 <0.01
Lappula echinata 9 0 6 49 0 2 1 1 <0.01
Kochia scoparia 1 0 0 0 1 17 0 38 0.03
Centaurea maculosa 1 0 80 1 1 0 0 0 <0.01
Glycyrrhiza lepidota 0 0 0 0 23 0 58 0 <0.01
Cirsium
hookerianum 1 0 0 0 9 0 63 0 <0.01

Table A.5 Results of indicator analysis of desirable species comparing lease sites by class. Indicators species were selected based on a measure of Indicator
Value (%) at a 0.05 significance level. Yellow indicates species which are significant indicators for each of the lease classes. Red indicates species which were
significant, but considered rare (below 5% Relative Abundance). Significant results are shown in bold.
Lease Class Active Oil Active Gas Suspended Oil Suspended Gas Abandoned Oil Abandoned Gas Potential Well Drilled and Abandoned p-value
No species present 7 1 0 0 5 29 0 0 0.04
Agropyron smithii 12 3 7 17 5 8 0 45 <0.01
Agropyron
dasystachyum 9 0 42 13 7 3 11 7 <0.01
Calamovilfa
longifolia 7 1 0 43 11 4 2 0 0.01
Poa sandbergii 1 0 0 0 2 0 88 0 <0.01
Stipa curtiseta 0 0 10 9 0 1 3 36 0.03
Achnatherum
hymenoides 0 0 45 2 0 0 0 0 0.01
Carex filifolia 7 3 0 4 17 8 44 3 <0.01
Smilacina trifolia 0 0 49 0 2 0 2 4 <0.01
Antennaria spp. 3 2 0 0 0 2 32 0 0.05
Symphoricarpos
occidentalis 1 8 35 0 3 2 21 18 0.03
Table A.6 Kruskal-Wallis one way analysis of variance of the lease classes based on ground cover and soil properties.*
% Herbaceous % Bare Ground % Litter Soil Compaction
Lease Class Std. Error p-value Std. Error p-value Std. Error p-value Std. Error p-value
PNG vs. Suspended - -
- -
11.49 0.01
0.28 <0.01
PNG vs. Drilled & Abandoned - -
- -
13.19 0.01
0.29 <0.01
Oil vs. Abandoned 6.05 <0.01
6.03 <0.01
7.8 <0.01
0.24 <0.01
Gas vs. Abandoned - -
- -
12.01 <0.01
0.28 <0.01
*Null hypothesis: variables are equal between the a priori groups. Significant results are shown in bold.

Figure A.1 Ecological extent of the impacts from oil and gas infrastructure to ground cover characteristics and soil properties which extend beyond the
physical footprint of infrastructure from 1955 to 2006. Standard error of the mean was calculated by dividing the standard deviation by the square root
of the sample size.

Table A.7 Pasture area occupied by the calculated oil and gas impact radii (PFRA roads, trails, lease sites, lease access roads) in 1979.
1979 Air Photo – Impact Extents
Patch
Count Patch Class Area (ha) Perimeter (m)
Patch Density
(#/100ha)
Edge Density
(m/ha) %Area Loss
2 PFRA Pasture 9736.214 58837.182 N/A N/A N/A
3 PFRA Roads 46.429 16070.670 0.03 349.3 0.477
5 Trails 229.476 93352.941 0.05 407.7 2.357
14 Lease Sites 30.600 5447.200 0.14 178.0 0.314
8 Lease Access Roads 65.530 26915.647 0.08 410.7 0.673
TOTAL
32 N/A 10108.249 200623.641 N/A N/A 3.821
Area and perimeter values were calculated in ArcGIS 9.3TM
using Buffer Wizard and HAWTH TOOLSTM
. Analysis indicates that trails account for the greatest
amount of altered pasture (area - 2.36%). From impact extents, the combined percent associated with lease sites and access roads accounts for an alteration area
of 0.987% (Figure A.1).
Table A.8 Pasture area occupied by the calculated oil and gas impact radii (PFRA roads, trails, lease sites, lease access roads) in 1997.
1997 Air Photo – Impact Extents
Patch
Count Patch Class Area (ha) Perimeter (m)
Patch Density
(#/100ha)
Edge Density
(m/ha) % Area Loss
2 PFRA Pasture 9702.202 59046.490 N/A N/A N/A
2 PFRA Roads 30.259 9892.568 0.02 327.6 0.312
4 Trails 211.180 81842.814 0.04 387.7 2.177
33 Lease Sites 53.036 16365.466 0.33 308.6 0.547
8 Lease Access Roads 142.969 54375.914 0.08 380.5 1.474
TOTAL
49 N/A 10139.645 221523.252 N/A N/A 4.509
Area and perimeter values were calculated in ArcGIS 9.3
TM using Buffer Wizard and HAWTH TOOLS
TM. Analysis indicates that trails still account for the
greatest amount of altered pasture area ( 2.18%). From impact extents, the combined percent associated with lease sites and access roads accounts for an
alteration area of 2.01% (Figure A.2). The percent of pasture altered by lease sites has nearly doubled since 1979.
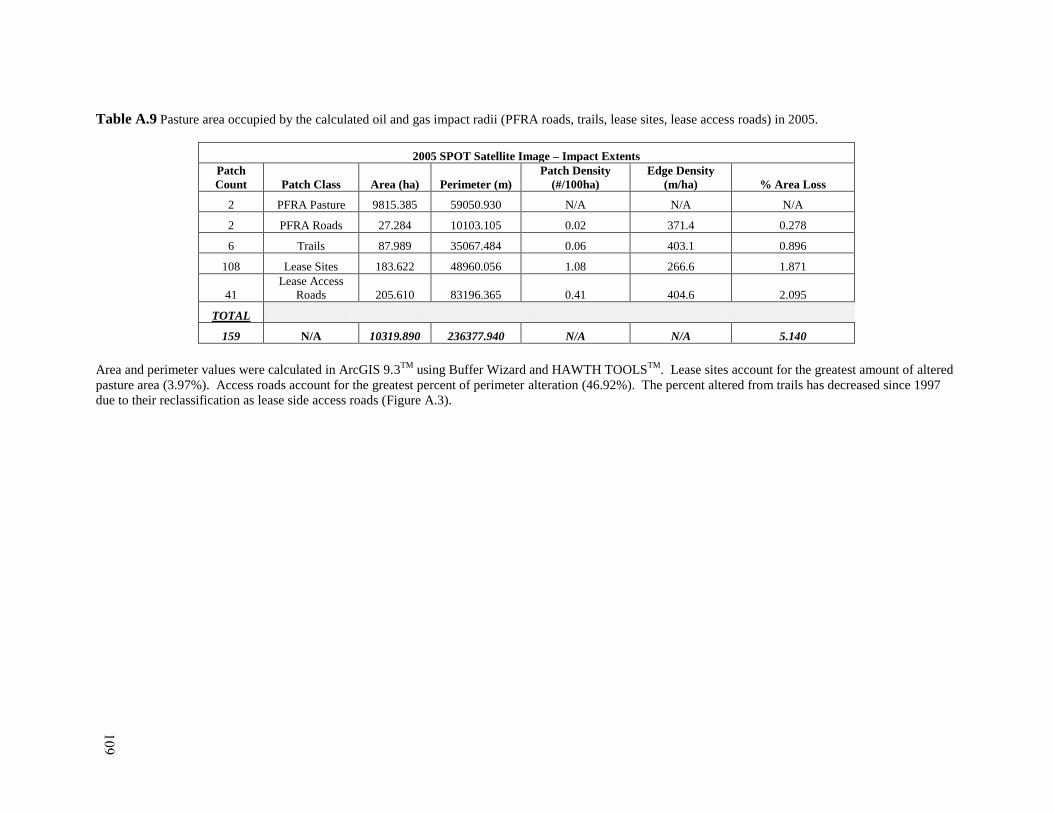
Table A.9 Pasture area occupied by the calculated oil and gas impact radii (PFRA roads, trails, lease sites, lease access roads) in 2005.
2005 SPOT Satellite Image – Impact Extents
Patch
Count Patch Class Area (ha) Perimeter (m)
Patch Density
(#/100ha)
Edge Density
(m/ha) % Area Loss
2 PFRA Pasture 9815.385 59050.930 N/A N/A N/A
2 PFRA Roads 27.284 10103.105 0.02 371.4 0.278
6 Trails 87.989 35067.484 0.06 403.1 0.896
108 Lease Sites 183.622 48960.056 1.08 266.6 1.871
41
Lease Access
Roads 205.610 83196.365 0.41 404.6 2.095
TOTAL
159 N/A 10319.890 236377.940 N/A N/A 5.140
Area and perimeter values were calculated in ArcGIS 9.3
TM using Buffer Wizard and HAWTH TOOLS
TM. Lease sites account for the greatest amount of altered
pasture area (3.97%). Access roads account for the greatest percent of perimeter alteration (46.92%). The percent altered from trails has decreased since 1997
due to their reclassification as lease side access roads (Figure A.3).
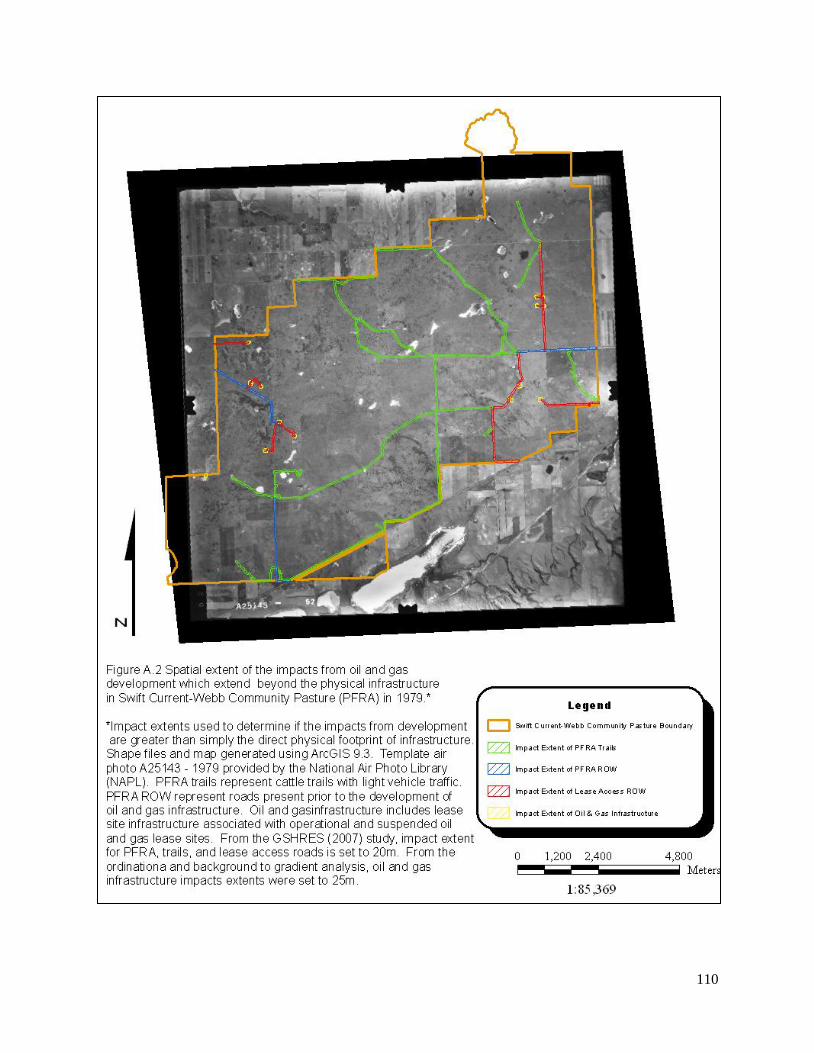
110

111

112