Environmental Assessment for North Texas Optimization of ...
121
Environmental Assessment for North Texas Optimization of Airspace and Procedures in the Metroplex Average Annual Day Flight Schedules HMMH Report No. 305220.002 September 2013 Prepared for: Federal Aviation Administration Fort Worth, TX Prepared by: Robert Mentzer Jr. Christopher Waite Harris Miller Miller & Hanson Inc. 77 South Bedford Street Burlington, MA 01803 T 781.229.0707 F 781.229.7939
-
Upload
khangminh22 -
Category
Documents
-
view
4 -
download
0
Transcript of Environmental Assessment for North Texas Optimization of ...
Environmental Assessment for North Texas
Optimization of Airspace and Procedures in the
Metroplex
Average Annual Day Flight Schedules
HMMH Report No. 305220.002
September 2013
Prepared for:
Federal Aviation Administration
Fort Worth, TX
Prepared by:
Robert Mentzer Jr.
Christopher Waite
Harris Miller Miller & Hanson Inc.
77 South Bedford Street
Burlington, MA 01803
T 781.229.0707
F 781.229.7939

Contents
Environmental Assessment for North Texas Optimization of Airspace and Procedures in the Metroplex
iii
Contents
1 Introduction....................................................................................................................................... 1
2 2011 Average Annual Day Flight Schedule.................................................................................... 2
2.1 Methodology ....................................................................................................................................... 22.2 Average Annual Day Itinerant IFR Aircraft Operations....................................................................... 3
3 2014 and 2019 Average Annual Day Flight Schedules ............................................................... 10
3.1 Assumptions ..................................................................................................................................... 103.1.1 Assumed Percentage Increases in Operations ................................................................................ 103.1.2 Future Fleet Mix Assumptions .......................................................................................................... 113.2 Aircraft Activity Assumptions ............................................................................................................ 143.3 Methodology and Results ................................................................................................................. 143.3.1 2014 Average Annual Day Flight Schedule...................................................................................... 143.4 2019 Average Annual Day Flight Schedule...................................................................................... 24
4 Detailed Tables ............................................................................................................................... 32
Tables
Table 1. 2011 Itinerant IFR Annual and AAD Aircraft Operations by Aircraft Category ...................... 4
Table 2. DFW OAPM Itinerant IFR AAD Aircraft Operations by Aircraft Category, Type of Operation,and Time of Day - 2011 ............................................................................................................................... 5
Table 3. DAL OAPM Itinerant IFR AAD Aircraft Operations by Aircraft Category, Type of Operation,and Time of Day - 2011 ............................................................................................................................... 5
Table 4. ADS OAPM Itinerant IFR AAD Aircraft Operations by Aircraft Category, Type of Operation,and Time of Day - 2011 ............................................................................................................................... 6
Table 5. AFW OAPM Itinerant IFR AAD Aircraft Operations by Aircraft Category, Type of Operation,and Time of Day - 2011 ............................................................................................................................... 6
Table 6. FTW OAPM Itinerant IFR AAD Aircraft Operations by Aircraft Category, Type of Operation,and Time of Day - 2011 ............................................................................................................................... 7
Table 7. DTO OAPM Itinerant IFR AAD Aircraft Operations by Aircraft Category, Type of Operation,and Time of Day - 2011 ............................................................................................................................... 7
Table 8. TKI OAPM Itinerant IFR AAD Aircraft Operations by Aircraft Category, Type of Operation,and Time of Day - 2011 ............................................................................................................................... 8
Table 9. GKY OAPM Itinerant IFR AAD Aircraft Operations by Aircraft Category, Type of Operation,and Time of Day - 2011 ............................................................................................................................... 8
Table 10. RBD OAPM Itinerant IFR AAD Aircraft Operations by Aircraft Category, Type ofOperation, and Time of Day - 2011 ............................................................................................................ 9
Environmental Assessment for North Texas Optimization of Airspace and Procedures in the Metroplex
iv
Table 11. FWS OAPM Itinerant IFR AAD Aircraft Operations by Aircraft Category, Type ofOperation, and Time of Day - 2011 ............................................................................................................ 9
Table 12. NFW OAPM Itinerant IFR AAD Aircraft Operations by Aircraft Category, Type ofOperation, and Time of Day - 2011 .......................................................................................................... 10
Table 13. Percentage Increases of Annual Itinerant Aircraft Operations by Aircraft Category (1 of 2)12
Table 13. Percentage Increases of Annual Itinerant Aircraft Operations by Aircraft Category (2 of 2)13
Table 14. Aircraft Type Replacement Assumptions – 2014 and 2019 ................................................. 14
Table 15. Itinerant IFR AAD Aircraft Operations by Aircraft Category – 2014 (1 of 2) ....................... 16
Table 15. Itinerant IFR AAD Aircraft Operations by Aircraft Category – 2014 (2 of 2) ....................... 17
Table 16. DFW OAPM Itinerant IFR AAD Aircraft Operations by Aircraft Category, Type ofOperation, and Time of Day - 2014 .......................................................................................................... 19
Table 17. DAL OAPM Itinerant IFR AAD Aircraft Operations by Aircraft Category, Type ofOperation, and Time of Day - 2014 .......................................................................................................... 19
Table 18. ADS OAPM Itinerant IFR AAD Aircraft Operations by Aircraft Category, Type ofOperation, and Time of Day - 2014 .......................................................................................................... 20
Table 19. AFW OAPM Itinerant IFR AAD Aircraft Operations by Aircraft Category, Type ofOperation, and Time of Day - 2014 .......................................................................................................... 20
Table 20. FTW OAPM Itinerant IFR AAD Aircraft Operations by Aircraft Category, Type ofOperation, and Time of Day - 2014 .......................................................................................................... 21
Table 21. DTO OAPM Itinerant IFR AAD Aircraft Operations by Aircraft Category, Type ofOperation, and Time of Day - 2014 .......................................................................................................... 21
Table 22. TKI OAPM Itinerant IFR AAD Aircraft Operations by Aircraft Category, Type of Operation,and Time of Day - 2014 ............................................................................................................................. 22
Table 23. GKY OAPM Itinerant IFR AAD Aircraft Operations by Aircraft Category, Type ofOperation, and Time of Day - 2014 .......................................................................................................... 22
Table 24. RBD OAPM Itinerant IFR AAD Aircraft Operations by Aircraft Category, Type ofOperation, and Time of Day - 2014 .......................................................................................................... 23
Table 25. FWS OAPM Itinerant IFR AAD Aircraft Operations by Aircraft Category, Type ofOperation, and Time of Day - 2014 .......................................................................................................... 23
Table 26. NFW OAPM Itinerant IFR AAD Aircraft Operations by Aircraft Category, Type ofOperation, and Time of Day - 2014 .......................................................................................................... 24
Table 27. Itinerant IFR AAD Aircraft Operations by Aircraft Category – 2019 (1 of 2) ....................... 25
Table 27. Itinerant IFR AAD Aircraft Operations by Aircraft Category – 2019 (2 of 2) ....................... 26
Table 28. DFW OAPM Itinerant IFR AAD Aircraft Operations by Aircraft Category, Type ofOperation, and Time of Day - 2019 .......................................................................................................... 27
Table 29. DAL OAPM Itinerant IFR AAD Aircraft Operations by Aircraft Category, Type ofOperation, and Time of Day - 2019 .......................................................................................................... 27
Contents
Environmental Assessment for North Texas Optimization of Airspace and Procedures in the Metroplex
v
Table 30. ADS OAPM Itinerant IFR AAD Aircraft Operations by Aircraft Category, Type ofOperation, and Time of Day - 2019 .......................................................................................................... 28
Table 31. AFW OAPM Itinerant IFR AAD Aircraft Operations by Aircraft Category, Type ofOperation, and Time of Day - 2019 .......................................................................................................... 28
Table 32. FTW OAPM Itinerant IFR AAD Aircraft Operations by Aircraft Category, Type ofOperation, and Time of Day - 2019 .......................................................................................................... 29
Table 33. DTO OAPM Itinerant IFR AAD Aircraft Operations by Aircraft Category, Type ofOperation, and Time of Day - 2019 .......................................................................................................... 29
Table 34. TKI OAPM Itinerant IFR AAD Aircraft Operations by Aircraft Category, Type of Operation,and Time of Day - 2019 ............................................................................................................................. 30
Table 35. GKY OAPM Itinerant IFR AAD Aircraft Operations by Aircraft Category, Type ofOperation, and Time of Day - 2019 .......................................................................................................... 30
Table 36. RBD OAPM Itinerant IFR AAD Aircraft Operations by Aircraft Category, Type ofOperation, and Time of Day - 2019 .......................................................................................................... 31
Table 37. FWS OAPM Itinerant IFR AAD Aircraft Operations by Aircraft Category, Type ofOperation, and Time of Day - 2019 .......................................................................................................... 31
Table 38. NFW OAPM Itinerant IFR AAD Aircraft Operations by Aircraft Category, Type ofOperation, and Time of Day - 2019 .......................................................................................................... 32
Table 39. DFW – AAD Itinerant IFR Aircraft Operations, by Aircraft Category, Aircraft Type andTime of Day, 2011...................................................................................................................................... 32
Table 40. DAL – AAD Itinerant IFR Aircraft Operations by Aircraft Category, Aircraft Type and Timeof Day, 2011 ............................................................................................................................................... 36
Table 41. ADS - AAD Itinerant IFR Aircraft Operations by Aircraft Category, Aircraft Type and Timeof Day - 2011 .............................................................................................................................................. 39
Table 42. AFW - AAD Itinerant IFR Aircraft Operations by Aircraft Category, Aircraft Type and Timeof Day - 2011 .............................................................................................................................................. 42
Table 43. FTW - AAD Itinerant IFR Aircraft Operations by Aircraft Category, Aircraft Type and Timeof Day - 2011 .............................................................................................................................................. 45
Table 44. DTO OAPM Itinerant IFR Aircraft Operations by Aircraft Category, Type of Operation, andTime of Day - 2011..................................................................................................................................... 48
Table 45. TKI - AAD Itinerant IFR Aircraft Operations by Aircraft Category, Aircraft Type and Timeof Day - 2011 .............................................................................................................................................. 50
Table 46. GKY - AAD Itinerant IFR Aircraft Operations by Aircraft Category, Aircraft Type and Timeof Day - 2011 .............................................................................................................................................. 52
Table 47. RBD - AAD Itinerant IFR Aircraft Operations by Aircraft Category, Aircraft Type and Timeof Day - 2011 .............................................................................................................................................. 54
Table 48. FWS - AAD Itinerant IFR Aircraft Operations by Aircraft Category, Aircraft Type and Timeof Day - 2011 .............................................................................................................................................. 56
Table 49. NFW- AAD Itinerant IFR Aircraft Operations by Aircraft Category, Aircraft Type and Timeof Day - 2011 .............................................................................................................................................. 58
Environmental Assessment for North Texas Optimization of Airspace and Procedures in the Metroplex
vi
Table 50. DFW – AAD Itinerant IFR Aircraft Operations by Aircraft Category, Aircraft Type andTime of Day, 2014...................................................................................................................................... 60
Table 51. DAL – AAD Itinerant IFR Aircraft Operations by Aircraft Category, Aircraft Type and Timeof Day, 2014 ............................................................................................................................................... 63
Table 52. ADS - AAD Itinerant IFR Aircraft Operations by Aircraft Category, Aircraft Type and Timeof Day - 2014 .............................................................................................................................................. 66
Table 53. AFW - AAD Itinerant IFR Aircraft Operations by Aircraft Category, Aircraft Type and Timeof Day - 2014 .............................................................................................................................................. 69
Table 54. FTW - AAD Itinerant IFR Aircraft Operations by Aircraft Category, Aircraft Type and Timeof Day - 2014 .............................................................................................................................................. 72
Table 55. DTO OAPM Itinerant IFR Aircraft Operations by Aircraft Category, Type of Operation, andTime of Day - 2014..................................................................................................................................... 75
Table 56. TKI - AAD Itinerant IFR Aircraft Operations by Aircraft Category, Aircraft Type and Timeof Day - 2014 .............................................................................................................................................. 77
Table 57. GKY - AAD Itinerant IFR Aircraft Operations by Aircraft Category, Aircraft Type and Timeof Day - 2014 .............................................................................................................................................. 79
Table 58. RBD - AAD Itinerant IFR Aircraft Operations by Aircraft Category, Aircraft Type and Timeof Day - 2014 .............................................................................................................................................. 81
Table 59. FWS - AAD Itinerant IFR Aircraft Operations by Aircraft Category, Aircraft Type and Timeof Day - 2014 .............................................................................................................................................. 83
Table 60. NFW- AAD Itinerant IFR Aircraft Operations by Aircraft Category, Aircraft Type and Timeof Day - 2014 .............................................................................................................................................. 85
Table 61. DFW – AAD Itinerant IFR Aircraft Operations by Aircraft Category, Aircraft Type andTime of Day, 2019...................................................................................................................................... 87
Table 62. DAL – AAD Itinerant IFR Aircraft Operations by Aircraft Category, Aircraft Type and Timeof Day, 2019 ............................................................................................................................................... 90
Table 63. ADS - AAD Itinerant IFR Aircraft Operations by Aircraft Category, Aircraft Type and Timeof Day - 2019 .............................................................................................................................................. 93
Table 64. AFW - AAD Itinerant IFR Aircraft Operations by Aircraft Category, Aircraft Type and Timeof Day - 2019 .............................................................................................................................................. 96
Table 65. FTW - AAD Itinerant IFR Aircraft Operations by Aircraft Category, Aircraft Type and Timeof Day - 2019 .............................................................................................................................................. 99
Table 66. DTO OAPM Itinerant IFR Aircraft Operations by Aircraft Category, Type of Operation, andTime of Day - 2019................................................................................................................................... 102
Table 67. TKI - AAD Itinerant IFR Aircraft Operations by Aircraft Category, Aircraft Type and Timeof Day - 2019 ............................................................................................................................................ 104
Table 68. GKY - AAD Itinerant IFR Aircraft Operations by Aircraft Category, Aircraft Type and Timeof Day - 2019 ............................................................................................................................................ 106
Table 69. RBD - AAD Itinerant IFR Aircraft Operations by Aircraft Category, Aircraft Type and Timeof Day - 2019 ............................................................................................................................................ 108
Contents
Environmental Assessment for North Texas Optimization of Airspace and Procedures in the Metroplex
vii
Table 70. FWS - AAD Itinerant IFR Aircraft Operations by Aircraft Category, Aircraft Type and Timeof Day - 2019 ............................................................................................................................................ 110
Table 71. NFW- AAD Itinerant IFR Aircraft Operations by Aircraft Category, Aircraft Type and Timeof Day - 2019 ............................................................................................................................................ 112

Environmental Assessment for North Texas Optimization of Airspace and Procedures in the Metroplex
viii
This page intentionally left blank.
Average Annual Day Flight Schedules
1
1 Introduction
Aircraft flight schedules were prepared to support the aircraft noise analysis for the North TexasOptimization of the Airspace and Procedures in the Metroplex (OAPM) project EnvironmentalAssessment (EA) (See Aircraft Noise Technical Report.) A flight schedule lists aircraft activity (numberof operations by arrival/departure, time of day, aircraft type, and destination/origin) for a design daywhich, for purposes of this EA, is an average annual day (AAD)1 at the following airports:
Dallas/Fort Worth International Airport (DFW)
Dallas Love Field (DAL)
Fort Worth Meacham International Airport (FTW)
Addison Airport (ADS)
Fort Worth Alliance Airport (AFW)
Fort Worth NAS Joint Reserve Base/Carswell Field (NFW)
Collin County Regional Airport At McKinney (TKI)
Arlington Municipal Airport (GKY)
Denton Municipal Airport (DTO)
Dallas Executive Airport (RBD)
Fort Worth Spinks Airport (FWS)
The flight schedules serve as aircraft activity input to the aircraft noise analysis discussed in the AircraftNoise Technical Report for the North Texas OAPM EA.
Three flight schedules were developed to represent AAD flight activity at the Study Airports,corresponding to the years assessed for aircraft noise conditions:
The 2011 AAD flight schedule was developed based on actual 2011 activity and used to model2011 conditions aircraft noise exposure (see Section 4.3.1 of the North Texas OAPM EA.)
Two future AAD flight schedules were developed to represent activity for the years 2014 and2019 and used to model future aircraft noise exposure (see Section 5.1 of the North Texas OAPMEA.) The two future AAD flight schedules were developed based on the 2011 Federal AviationAdministration (FAA) Terminal Area Forecast (TAF), which was released in January 2012. TheTAF is the official forecast of aviation activity at FAA facilities and is updated annually.
The following key assumptions are relevant to the development of the AAD flight schedules:
The FAA tracks three types of aircraft operations in the TAF: local operations (those that departfrom and land at the same airport), overflight operations (those that pass in the vicinity of but donot land at an Study Airport), and itinerant operations (those that either depart from or arrive at anStudy Airport, operating to or from airports located outside of the local area airspace). The AADflight schedules developed for this EA include only itinerant operations, because the ProposedAction involves the design of standard instrument arrival and departure procedures that are onlyused by aircraft performing itinerant operations.
1 An average annual day (AAD) represents all the aircraft operations for every day in a study year divided by 365,the number of days in a year. The AAD does not reflect a particular day, but is meant to represent a typical day overa period of a year.
Environmental Assessment for North Texas Optimization of Airspace and Procedures in the Metroplex
2
The AAD flight schedules only include operations conducted by aircraft operating underInstrument Flight Rules (IFR) because the Proposed Action involves the design of standardinstrument arrival and departure procedures, which are only used by aircraft operating underIFR.2
The 2014 and 2019 flight schedules represent future itinerant IFR AAD activity for both the ProposedAction and the No Action Alternative. As stated in Section 2.4 of the North Texas OAPM EA, theProposed Action would not result in an increase in the numbers of aircraft operations at the StudyAirports, but would increase the efficiency of aircraft movements through terminal airspace. In otherwords, the total numbers of aircraft operations for the future itinerant IFR AADs are expected to be thesame under both the Proposed Action and the No Action Alternative.
This technical report presents the methodology used to develop the itinerant IFR AAD flight schedules aswell as summary data for the itinerant IFR AAD flight schedules for each Study Airport.
2 2011 Average Annual Day Flight Schedule
The 2011 itinerant IFR AAD flight schedule was developed from a dataset of IFR flight activity for theStudy Airports for the full calendar year (CY) 2011. The CY 2011 dataset was derived from utilizingradar data obtained from the FAA’s Performance Data Analysis and Reporting System (PDARS). ThePDARS database was queried for the 2011 calendar year for all IFR-filed flights that operated at theStudy Airports within the General Study Area as described in Section 4.1.1 of the EA. During this 365day period, 83 days of data were unusable. The 282 days of usable data span all seasons and runwayusage configurations for the study airports in the General Study Area. This data was used to develop the2011 AAD flight schedule.
2.1 Methodology
Processing the full 2011 itinerant IFR dataset included the following steps:
a) Dataset coding - Using data in the CY 2011 dataset, several additional fields were coded toprovide additional information to aid in the analysis, as follows:
Type of operation - arrival or departure, coded using the origin/destination cities listed in theoriginal dataset.
Time of day - daytime (departing or arriving between 7:00 a.m. and 9:59 p.m.) or nighttime(departing or arriving between 10:00 p.m. and 6:59 a.m.), coded using the arrival/departuretime listed in the original dataset.
2 Aircraft operate under two distinct categories of flight rules: Visual Flight Rules (VFR) and Instrument FlightRules (IFR). These flight rules generally correspond with two categories of weather conditions: VisualMeteorological Conditions (VMC) and Instrument Meteorological Conditions (IMC). VMC generally exist duringfair to good weather with good visibility. IMC occur during periods when visibility falls to less than three statutemiles or the ceiling (the distance from the ground to the bottom layer of clouds when the clouds cover more than 50percent of the sky) drops to lower than 1,000 feet. Under VFR, pilots are able to fly whatever route they chose andare responsible to “see and avoid” other aircraft and obstacles such as terrain to maintain safe separation. Under IFRATC is responsible for providing separation from other aircraft and terrain and pilots use cockpit instruments andradar to fly routes specified by ATC and to comply with ATC instructions. Pilots must follow IFR during IMC;however, due to various factors such as the general requirement for aircraft to operate under IFR in Class A airspace(i.e., enroute airspace between 18,000 feet Mean Sea Level (MSL) and 60,000 feet MSL), the majority ofcommercial air traffic operates under IFR regardless of weather conditions.
Average Annual Day Flight Schedules
3
Aircraft category - Per categories defined by the FAA, coded using the aircraft identifier inthe dataset:
o Air carrier - an aircraft with seating capacity of more than 60 seats or a maximumpayload capacity of more than 18,000 pounds carrying passengers or cargo for hire orcompensation, and having a company three-letter code designator in the dataset. Thisincludes U.S. and foreign flag carriers.
o Air Taxi - an aircraft designed to have a maximum seating capacity of 60 seats or lessor a maximum payload capacity of 18,000 pounds or less carrying passengers or cargofor hire or compensation, and having a company three-letter code designator in thedataset.
o General Aviation - all civil aircraft, except those classified as air carriers or air taxis.
o Military - all classes of military aircraft operating at FAA facilities.
b) Aircraft type for noise modeling - Per the aircraft database included in the FAA’s NoiseIntegrated Routing System model (NIRS) 7.0b3, coded based on the aircraft identifier in thedataset. NIRS is an FAA-approved computer model that evaluates aircraft noise in the vicinity ofairports and is used to evaluate changes in noise exposure related to air traffic procedure changes.The NIRS aircraft database includes most, but not all, aircraft types. If an aircraft in the CY 2011dataset was included in the NIRS aircraft database, the matching aircraft type was used; however,if an aircraft in the CY 2011 dataset was not included in the NIRS aircraft dataset, it wasnecessary to identify an equivalent, representative aircraft approved for use by the FAA, referredto as an aircraft substitution. Because the CY 2011 dataset consisted of a full year of data, the CY2011 dataset included a wide range of unique aircraft types, not all of which were in the NIRSaircraft database, requiring some FAA approved aircraft substitutions.
c) Terminal airspace arrivals and departures - Operations were coded using a spatial analysisthat assigned each departure operation to a Standard Instrument Departure (SID) exiting aspecific Dallas-Fort Worth Terminal Approach Radar Control (TRACON) (D10) gate, and eacharrival operation to a Standard Terminal Arrival Route (STAR) entering a specific D10 gatebased on the location of the origin or destination airport.
d) Dataset normalization - The numbers of operations in the CY 2011 dataset was adjusted tomatch the actual numbers of 2011 operations by Study Airport. The source for the actual numbersof 2011 aircraft operations by Study Airport was data published by the FAA in the Air TrafficActivity System (ATADS) and the Traffic Flow Management System Counts (TFMSC). Thisadjustment allowed for the cleaned CY 2011 dataset (following the deletion of incompleteentries) to reflect the total annual itinerant IFR operations at the Study Airports as reported byFAA. Adjustments were also made to ensure that arrivals and departures were balanced (i.e., eachtype of operation representing 50 percent of the total operations). Through the normalizationprocess, the fleet mix percentages within each aircraft category remained unchanged.
2.2 Average Annual Day Itinerant IFR Aircraft Operations
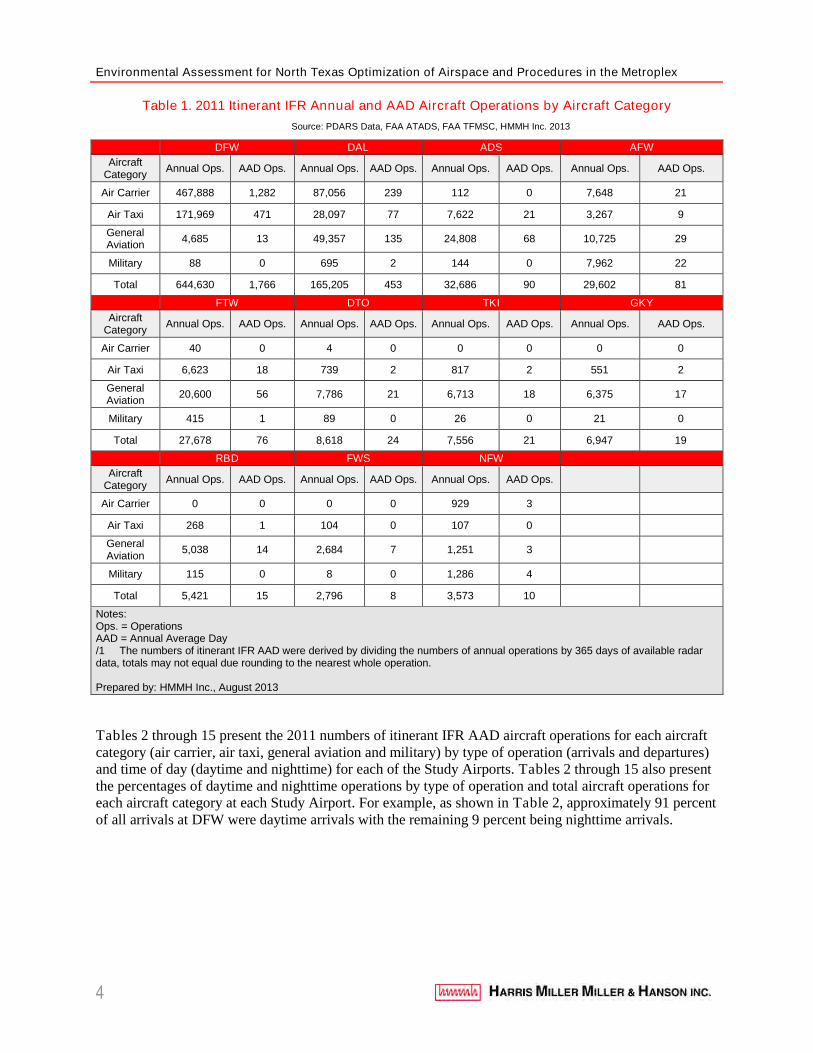
Table 1 presents the 2011 annual and AAD numbers of itinerant IFR aircraft operations for each of theStudy Airports by aircraft category (air carrier, air taxi, general aviation, and military). The numbers ofitinerant IFR AAD aircraft operations for each category at each airport were derived by dividing thenumbers of annual itinerant IFR aircraft operations by 365 days.
Environmental Assessment for North Texas Optimization of Airspace and Procedures in the Metroplex
4
Table 1. 2011 Itinerant IFR Annual and AAD Aircraft Operations by Aircraft Category
Source: PDARS Data, FAA ATADS, FAA TFMSC, HMMH Inc. 2013
DFW DAL ADS AFW
AircraftCategory
Annual Ops. AAD Ops. Annual Ops. AAD Ops. Annual Ops. AAD Ops. Annual Ops. AAD Ops.
Air Carrier 467,888 1,282 87,056 239 112 0 7,648 21
Air Taxi 171,969 471 28,097 77 7,622 21 3,267 9
GeneralAviation
4,685 13 49,357 135 24,808 68 10,725 29
Military 88 0 695 2 144 0 7,962 22
Total 644,630 1,766 165,205 453 32,686 90 29,602 81
FTW DTO TKI GKY
AircraftCategory
Annual Ops. AAD Ops. Annual Ops. AAD Ops. Annual Ops. AAD Ops. Annual Ops. AAD Ops.
Air Carrier 40 0 4 0 0 0 0 0
Air Taxi 6,623 18 739 2 817 2 551 2
GeneralAviation
20,600 56 7,786 21 6,713 18 6,375 17
Military 415 1 89 0 26 0 21 0
Total 27,678 76 8,618 24 7,556 21 6,947 19
RBD FWS NFW
AircraftCategory
Annual Ops. AAD Ops. Annual Ops. AAD Ops. Annual Ops. AAD Ops.
Air Carrier 0 0 0 0 929 3
Air Taxi 268 1 104 0 107 0
GeneralAviation
5,038 14 2,684 7 1,251 3
Military 115 0 8 0 1,286 4
Total 5,421 15 2,796 8 3,573 10
Notes:Ops. = OperationsAAD = Annual Average Day/1 The numbers of itinerant IFR AAD were derived by dividing the numbers of annual operations by 365 days of available radardata, totals may not equal due rounding to the nearest whole operation.
Prepared by: HMMH Inc., August 2013
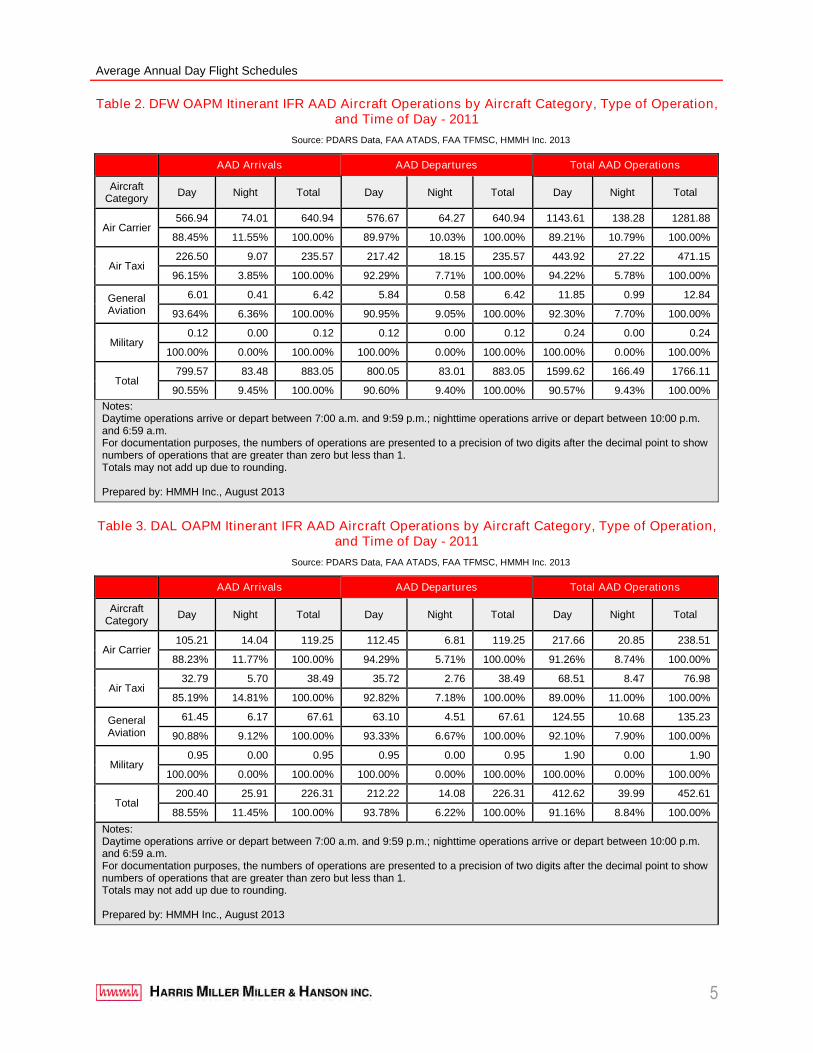
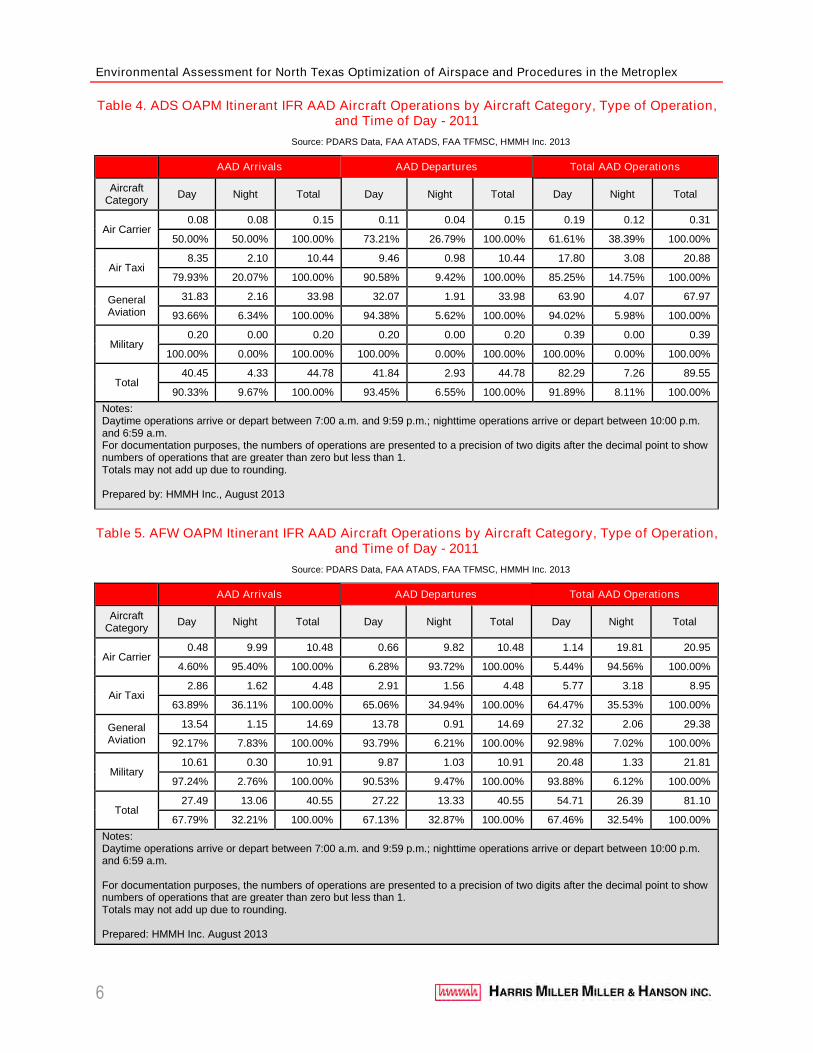
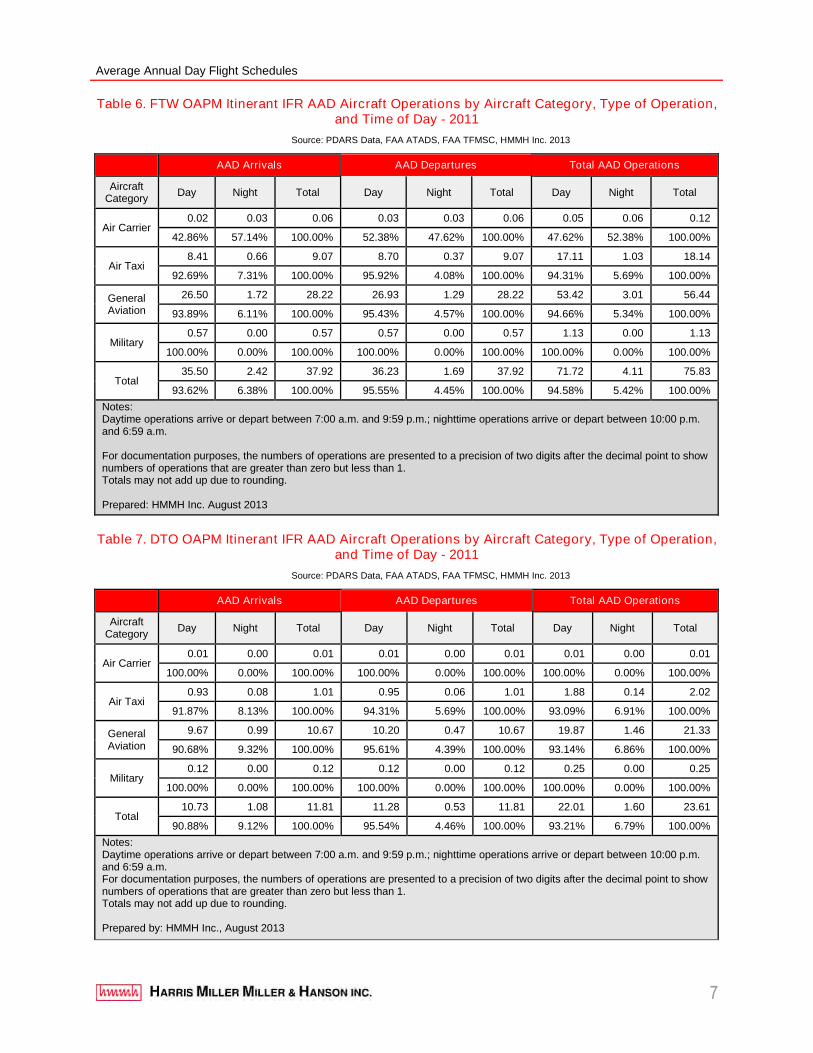
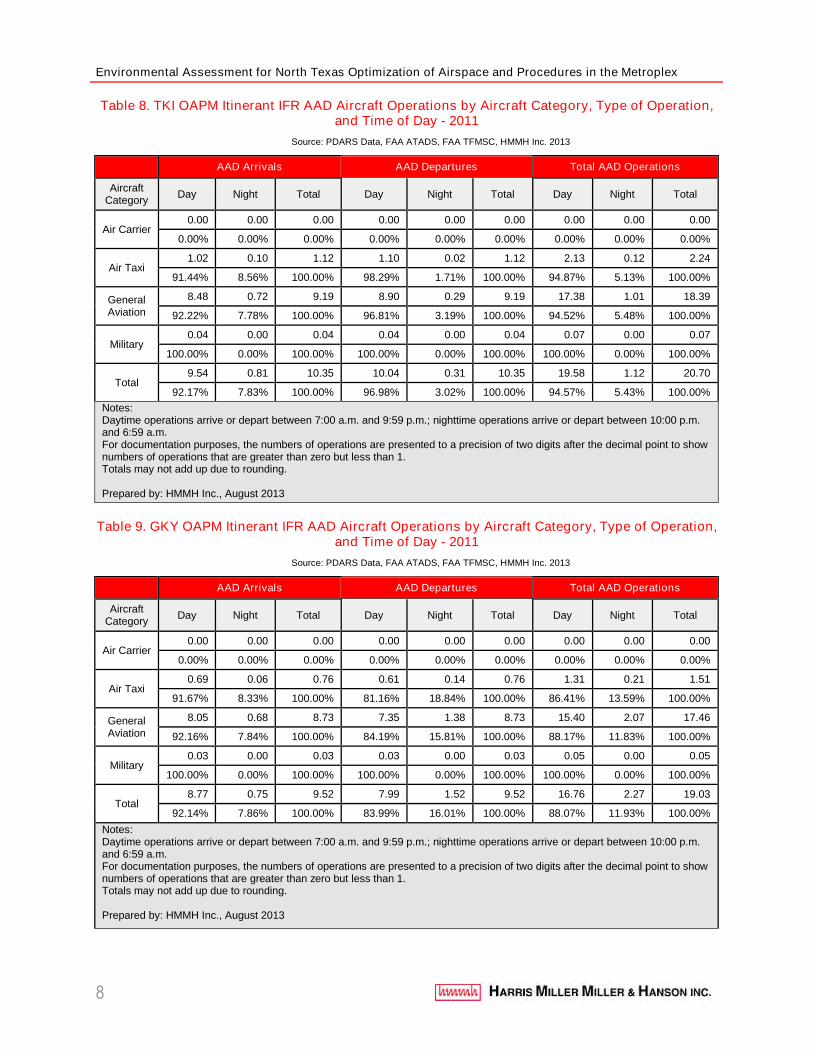
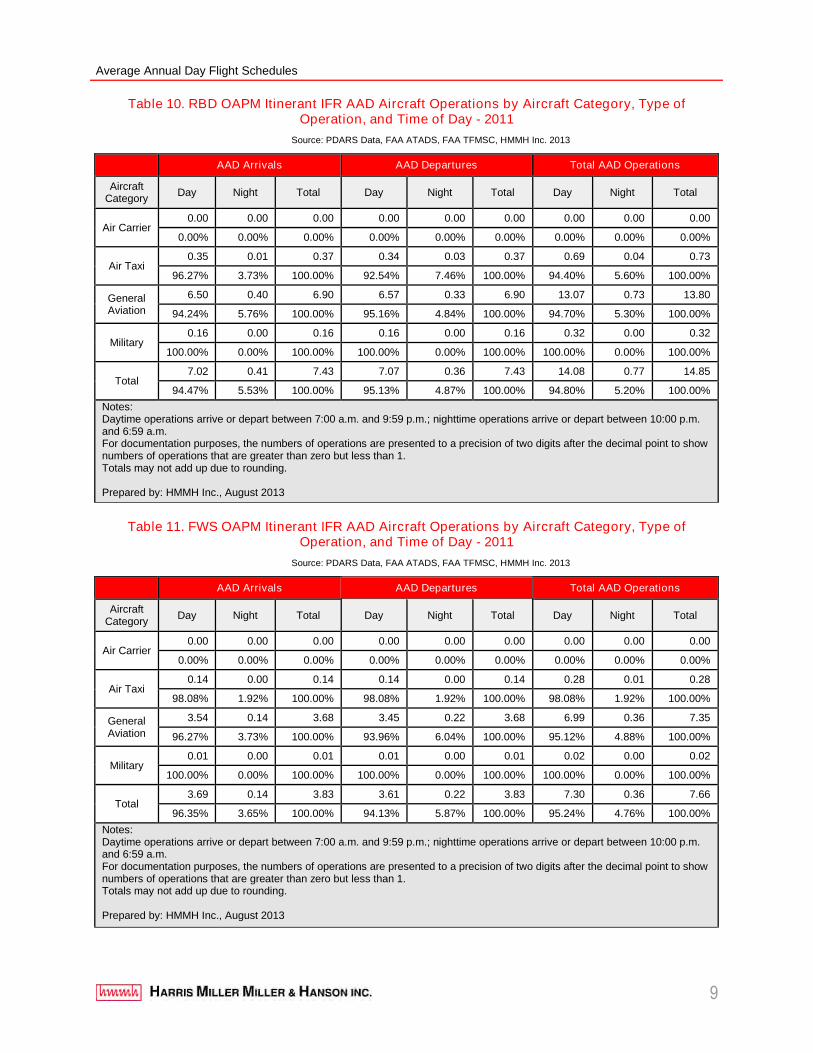
Tables 2 through 15 present the 2011 numbers of itinerant IFR AAD aircraft operations for each aircraftcategory (air carrier, air taxi, general aviation and military) by type of operation (arrivals and departures)and time of day (daytime and nighttime) for each of the Study Airports. Tables 2 through 15 also presentthe percentages of daytime and nighttime operations by type of operation and total aircraft operations foreach aircraft category at each Study Airport. For example, as shown in Table 2, approximately 91 percentof all arrivals at DFW were daytime arrivals with the remaining 9 percent being nighttime arrivals.
Average Annual Day Flight Schedules
5
Table 2. DFW OAPM Itinerant IFR AAD Aircraft Operations by Aircraft Category, Type of Operation,and Time of Day - 2011
Source: PDARS Data, FAA ATADS, FAA TFMSC, HMMH Inc. 2013
AAD Arrivals AAD Departures Total AAD Operations
AircraftCategory
Day Night Total Day Night Total Day Night Total
Air Carrier566.94 74.01 640.94 576.67 64.27 640.94 1143.61 138.28 1281.88
88.45% 11.55% 100.00% 89.97% 10.03% 100.00% 89.21% 10.79% 100.00%
Air Taxi226.50 9.07 235.57 217.42 18.15 235.57 443.92 27.22 471.15
96.15% 3.85% 100.00% 92.29% 7.71% 100.00% 94.22% 5.78% 100.00%
GeneralAviation
6.01 0.41 6.42 5.84 0.58 6.42 11.85 0.99 12.84
93.64% 6.36% 100.00% 90.95% 9.05% 100.00% 92.30% 7.70% 100.00%
Military0.12 0.00 0.12 0.12 0.00 0.12 0.24 0.00 0.24
100.00% 0.00% 100.00% 100.00% 0.00% 100.00% 100.00% 0.00% 100.00%
Total799.57 83.48 883.05 800.05 83.01 883.05 1599.62 166.49 1766.11
90.55% 9.45% 100.00% 90.60% 9.40% 100.00% 90.57% 9.43% 100.00%
Notes:Daytime operations arrive or depart between 7:00 a.m. and 9:59 p.m.; nighttime operations arrive or depart between 10:00 p.m.and 6:59 a.m.For documentation purposes, the numbers of operations are presented to a precision of two digits after the decimal point to shownumbers of operations that are greater than zero but less than 1.Totals may not add up due to rounding.
Prepared by: HMMH Inc., August 2013
Table 3. DAL OAPM Itinerant IFR AAD Aircraft Operations by Aircraft Category, Type of Operation,and Time of Day - 2011
Source: PDARS Data, FAA ATADS, FAA TFMSC, HMMH Inc. 2013
AAD Arrivals AAD Departures Total AAD Operations
AircraftCategory
Day Night Total Day Night Total Day Night Total
Air Carrier105.21 14.04 119.25 112.45 6.81 119.25 217.66 20.85 238.51
88.23% 11.77% 100.00% 94.29% 5.71% 100.00% 91.26% 8.74% 100.00%
Air Taxi32.79 5.70 38.49 35.72 2.76 38.49 68.51 8.47 76.98
85.19% 14.81% 100.00% 92.82% 7.18% 100.00% 89.00% 11.00% 100.00%
GeneralAviation
61.45 6.17 67.61 63.10 4.51 67.61 124.55 10.68 135.23
90.88% 9.12% 100.00% 93.33% 6.67% 100.00% 92.10% 7.90% 100.00%
Military0.95 0.00 0.95 0.95 0.00 0.95 1.90 0.00 1.90
100.00% 0.00% 100.00% 100.00% 0.00% 100.00% 100.00% 0.00% 100.00%
Total200.40 25.91 226.31 212.22 14.08 226.31 412.62 39.99 452.61
88.55% 11.45% 100.00% 93.78% 6.22% 100.00% 91.16% 8.84% 100.00%
Notes:Daytime operations arrive or depart between 7:00 a.m. and 9:59 p.m.; nighttime operations arrive or depart between 10:00 p.m.and 6:59 a.m.For documentation purposes, the numbers of operations are presented to a precision of two digits after the decimal point to shownumbers of operations that are greater than zero but less than 1.Totals may not add up due to rounding.
Prepared by: HMMH Inc., August 2013
Environmental Assessment for North Texas Optimization of Airspace and Procedures in the Metroplex
6
Table 4. ADS OAPM Itinerant IFR AAD Aircraft Operations by Aircraft Category, Type of Operation,and Time of Day - 2011
Source: PDARS Data, FAA ATADS, FAA TFMSC, HMMH Inc. 2013
AAD Arrivals AAD Departures Total AAD Operations
AircraftCategory
Day Night Total Day Night Total Day Night Total
Air Carrier0.08 0.08 0.15 0.11 0.04 0.15 0.19 0.12 0.31
50.00% 50.00% 100.00% 73.21% 26.79% 100.00% 61.61% 38.39% 100.00%
Air Taxi8.35 2.10 10.44 9.46 0.98 10.44 17.80 3.08 20.88
79.93% 20.07% 100.00% 90.58% 9.42% 100.00% 85.25% 14.75% 100.00%
GeneralAviation
31.83 2.16 33.98 32.07 1.91 33.98 63.90 4.07 67.97
93.66% 6.34% 100.00% 94.38% 5.62% 100.00% 94.02% 5.98% 100.00%
Military0.20 0.00 0.20 0.20 0.00 0.20 0.39 0.00 0.39
100.00% 0.00% 100.00% 100.00% 0.00% 100.00% 100.00% 0.00% 100.00%
Total40.45 4.33 44.78 41.84 2.93 44.78 82.29 7.26 89.55
90.33% 9.67% 100.00% 93.45% 6.55% 100.00% 91.89% 8.11% 100.00%
Notes:Daytime operations arrive or depart between 7:00 a.m. and 9:59 p.m.; nighttime operations arrive or depart between 10:00 p.m.and 6:59 a.m.For documentation purposes, the numbers of operations are presented to a precision of two digits after the decimal point to shownumbers of operations that are greater than zero but less than 1.Totals may not add up due to rounding.
Prepared by: HMMH Inc., August 2013
Table 5. AFW OAPM Itinerant IFR AAD Aircraft Operations by Aircraft Category, Type of Operation,and Time of Day - 2011
Source: PDARS Data, FAA ATADS, FAA TFMSC, HMMH Inc. 2013
AAD Arrivals AAD Departures Total AAD Operations
AircraftCategory
Day Night Total Day Night Total Day Night Total
Air Carrier0.48 9.99 10.48 0.66 9.82 10.48 1.14 19.81 20.95
4.60% 95.40% 100.00% 6.28% 93.72% 100.00% 5.44% 94.56% 100.00%
Air Taxi2.86 1.62 4.48 2.91 1.56 4.48 5.77 3.18 8.95
63.89% 36.11% 100.00% 65.06% 34.94% 100.00% 64.47% 35.53% 100.00%
GeneralAviation
13.54 1.15 14.69 13.78 0.91 14.69 27.32 2.06 29.38
92.17% 7.83% 100.00% 93.79% 6.21% 100.00% 92.98% 7.02% 100.00%
Military10.61 0.30 10.91 9.87 1.03 10.91 20.48 1.33 21.81
97.24% 2.76% 100.00% 90.53% 9.47% 100.00% 93.88% 6.12% 100.00%
Total27.49 13.06 40.55 27.22 13.33 40.55 54.71 26.39 81.10
67.79% 32.21% 100.00% 67.13% 32.87% 100.00% 67.46% 32.54% 100.00%
Notes:Daytime operations arrive or depart between 7:00 a.m. and 9:59 p.m.; nighttime operations arrive or depart between 10:00 p.m.and 6:59 a.m.
For documentation purposes, the numbers of operations are presented to a precision of two digits after the decimal point to shownumbers of operations that are greater than zero but less than 1.Totals may not add up due to rounding.
Prepared: HMMH Inc. August 2013
Average Annual Day Flight Schedules
7
Table 6. FTW OAPM Itinerant IFR AAD Aircraft Operations by Aircraft Category, Type of Operation,and Time of Day - 2011
Source: PDARS Data, FAA ATADS, FAA TFMSC, HMMH Inc. 2013
AAD Arrivals AAD Departures Total AAD Operations
AircraftCategory
Day Night Total Day Night Total Day Night Total
Air Carrier0.02 0.03 0.06 0.03 0.03 0.06 0.05 0.06 0.12
42.86% 57.14% 100.00% 52.38% 47.62% 100.00% 47.62% 52.38% 100.00%
Air Taxi8.41 0.66 9.07 8.70 0.37 9.07 17.11 1.03 18.14
92.69% 7.31% 100.00% 95.92% 4.08% 100.00% 94.31% 5.69% 100.00%
GeneralAviation
26.50 1.72 28.22 26.93 1.29 28.22 53.42 3.01 56.44
93.89% 6.11% 100.00% 95.43% 4.57% 100.00% 94.66% 5.34% 100.00%
Military0.57 0.00 0.57 0.57 0.00 0.57 1.13 0.00 1.13
100.00% 0.00% 100.00% 100.00% 0.00% 100.00% 100.00% 0.00% 100.00%
Total35.50 2.42 37.92 36.23 1.69 37.92 71.72 4.11 75.83
93.62% 6.38% 100.00% 95.55% 4.45% 100.00% 94.58% 5.42% 100.00%
Notes:Daytime operations arrive or depart between 7:00 a.m. and 9:59 p.m.; nighttime operations arrive or depart between 10:00 p.m.and 6:59 a.m.
For documentation purposes, the numbers of operations are presented to a precision of two digits after the decimal point to shownumbers of operations that are greater than zero but less than 1.Totals may not add up due to rounding.
Prepared: HMMH Inc. August 2013
Table 7. DTO OAPM Itinerant IFR AAD Aircraft Operations by Aircraft Category, Type of Operation,and Time of Day - 2011
Source: PDARS Data, FAA ATADS, FAA TFMSC, HMMH Inc. 2013
AAD Arrivals AAD Departures Total AAD Operations
AircraftCategory
Day Night Total Day Night Total Day Night Total
Air Carrier0.01 0.00 0.01 0.01 0.00 0.01 0.01 0.00 0.01
100.00% 0.00% 100.00% 100.00% 0.00% 100.00% 100.00% 0.00% 100.00%
Air Taxi0.93 0.08 1.01 0.95 0.06 1.01 1.88 0.14 2.02
91.87% 8.13% 100.00% 94.31% 5.69% 100.00% 93.09% 6.91% 100.00%
GeneralAviation
9.67 0.99 10.67 10.20 0.47 10.67 19.87 1.46 21.33
90.68% 9.32% 100.00% 95.61% 4.39% 100.00% 93.14% 6.86% 100.00%
Military0.12 0.00 0.12 0.12 0.00 0.12 0.25 0.00 0.25
100.00% 0.00% 100.00% 100.00% 0.00% 100.00% 100.00% 0.00% 100.00%
Total10.73 1.08 11.81 11.28 0.53 11.81 22.01 1.60 23.61
90.88% 9.12% 100.00% 95.54% 4.46% 100.00% 93.21% 6.79% 100.00%
Notes:Daytime operations arrive or depart between 7:00 a.m. and 9:59 p.m.; nighttime operations arrive or depart between 10:00 p.m.and 6:59 a.m.For documentation purposes, the numbers of operations are presented to a precision of two digits after the decimal point to shownumbers of operations that are greater than zero but less than 1.Totals may not add up due to rounding.
Prepared by: HMMH Inc., August 2013
Environmental Assessment for North Texas Optimization of Airspace and Procedures in the Metroplex
8
Table 8. TKI OAPM Itinerant IFR AAD Aircraft Operations by Aircraft Category, Type of Operation,and Time of Day - 2011
Source: PDARS Data, FAA ATADS, FAA TFMSC, HMMH Inc. 2013
AAD Arrivals AAD Departures Total AAD Operations
AircraftCategory
Day Night Total Day Night Total Day Night Total
Air Carrier0.00 0.00 0.00 0.00 0.00 0.00 0.00 0.00 0.00
0.00% 0.00% 0.00% 0.00% 0.00% 0.00% 0.00% 0.00% 0.00%
Air Taxi1.02 0.10 1.12 1.10 0.02 1.12 2.13 0.12 2.24
91.44% 8.56% 100.00% 98.29% 1.71% 100.00% 94.87% 5.13% 100.00%
GeneralAviation
8.48 0.72 9.19 8.90 0.29 9.19 17.38 1.01 18.39
92.22% 7.78% 100.00% 96.81% 3.19% 100.00% 94.52% 5.48% 100.00%
Military0.04 0.00 0.04 0.04 0.00 0.04 0.07 0.00 0.07
100.00% 0.00% 100.00% 100.00% 0.00% 100.00% 100.00% 0.00% 100.00%
Total9.54 0.81 10.35 10.04 0.31 10.35 19.58 1.12 20.70
92.17% 7.83% 100.00% 96.98% 3.02% 100.00% 94.57% 5.43% 100.00%
Notes:Daytime operations arrive or depart between 7:00 a.m. and 9:59 p.m.; nighttime operations arrive or depart between 10:00 p.m.and 6:59 a.m.For documentation purposes, the numbers of operations are presented to a precision of two digits after the decimal point to shownumbers of operations that are greater than zero but less than 1.Totals may not add up due to rounding.
Prepared by: HMMH Inc., August 2013
Table 9. GKY OAPM Itinerant IFR AAD Aircraft Operations by Aircraft Category, Type of Operation,and Time of Day - 2011
Source: PDARS Data, FAA ATADS, FAA TFMSC, HMMH Inc. 2013
AAD Arrivals AAD Departures Total AAD Operations
AircraftCategory
Day Night Total Day Night Total Day Night Total
Air Carrier0.00 0.00 0.00 0.00 0.00 0.00 0.00 0.00 0.00
0.00% 0.00% 0.00% 0.00% 0.00% 0.00% 0.00% 0.00% 0.00%
Air Taxi0.69 0.06 0.76 0.61 0.14 0.76 1.31 0.21 1.51
91.67% 8.33% 100.00% 81.16% 18.84% 100.00% 86.41% 13.59% 100.00%
GeneralAviation
8.05 0.68 8.73 7.35 1.38 8.73 15.40 2.07 17.46
92.16% 7.84% 100.00% 84.19% 15.81% 100.00% 88.17% 11.83% 100.00%
Military0.03 0.00 0.03 0.03 0.00 0.03 0.05 0.00 0.05
100.00% 0.00% 100.00% 100.00% 0.00% 100.00% 100.00% 0.00% 100.00%
Total8.77 0.75 9.52 7.99 1.52 9.52 16.76 2.27 19.03
92.14% 7.86% 100.00% 83.99% 16.01% 100.00% 88.07% 11.93% 100.00%
Notes:Daytime operations arrive or depart between 7:00 a.m. and 9:59 p.m.; nighttime operations arrive or depart between 10:00 p.m.and 6:59 a.m.For documentation purposes, the numbers of operations are presented to a precision of two digits after the decimal point to shownumbers of operations that are greater than zero but less than 1.Totals may not add up due to rounding.
Prepared by: HMMH Inc., August 2013
Average Annual Day Flight Schedules
9
Table 10. RBD OAPM Itinerant IFR AAD Aircraft Operations by Aircraft Category, Type ofOperation, and Time of Day - 2011
Source: PDARS Data, FAA ATADS, FAA TFMSC, HMMH Inc. 2013
AAD Arrivals AAD Departures Total AAD Operations
AircraftCategory
Day Night Total Day Night Total Day Night Total
Air Carrier0.00 0.00 0.00 0.00 0.00 0.00 0.00 0.00 0.00
0.00% 0.00% 0.00% 0.00% 0.00% 0.00% 0.00% 0.00% 0.00%
Air Taxi0.35 0.01 0.37 0.34 0.03 0.37 0.69 0.04 0.73
96.27% 3.73% 100.00% 92.54% 7.46% 100.00% 94.40% 5.60% 100.00%
GeneralAviation
6.50 0.40 6.90 6.57 0.33 6.90 13.07 0.73 13.80
94.24% 5.76% 100.00% 95.16% 4.84% 100.00% 94.70% 5.30% 100.00%
Military0.16 0.00 0.16 0.16 0.00 0.16 0.32 0.00 0.32
100.00% 0.00% 100.00% 100.00% 0.00% 100.00% 100.00% 0.00% 100.00%
Total7.02 0.41 7.43 7.07 0.36 7.43 14.08 0.77 14.85
94.47% 5.53% 100.00% 95.13% 4.87% 100.00% 94.80% 5.20% 100.00%
Notes:Daytime operations arrive or depart between 7:00 a.m. and 9:59 p.m.; nighttime operations arrive or depart between 10:00 p.m.and 6:59 a.m.For documentation purposes, the numbers of operations are presented to a precision of two digits after the decimal point to shownumbers of operations that are greater than zero but less than 1.Totals may not add up due to rounding.
Prepared by: HMMH Inc., August 2013
Table 11. FWS OAPM Itinerant IFR AAD Aircraft Operations by Aircraft Category, Type ofOperation, and Time of Day - 2011
Source: PDARS Data, FAA ATADS, FAA TFMSC, HMMH Inc. 2013
AAD Arrivals AAD Departures Total AAD Operations
AircraftCategory
Day Night Total Day Night Total Day Night Total
Air Carrier0.00 0.00 0.00 0.00 0.00 0.00 0.00 0.00 0.00
0.00% 0.00% 0.00% 0.00% 0.00% 0.00% 0.00% 0.00% 0.00%
Air Taxi0.14 0.00 0.14 0.14 0.00 0.14 0.28 0.01 0.28
98.08% 1.92% 100.00% 98.08% 1.92% 100.00% 98.08% 1.92% 100.00%
GeneralAviation
3.54 0.14 3.68 3.45 0.22 3.68 6.99 0.36 7.35
96.27% 3.73% 100.00% 93.96% 6.04% 100.00% 95.12% 4.88% 100.00%
Military0.01 0.00 0.01 0.01 0.00 0.01 0.02 0.00 0.02
100.00% 0.00% 100.00% 100.00% 0.00% 100.00% 100.00% 0.00% 100.00%
Total3.69 0.14 3.83 3.61 0.22 3.83 7.30 0.36 7.66
96.35% 3.65% 100.00% 94.13% 5.87% 100.00% 95.24% 4.76% 100.00%
Notes:Daytime operations arrive or depart between 7:00 a.m. and 9:59 p.m.; nighttime operations arrive or depart between 10:00 p.m.and 6:59 a.m.For documentation purposes, the numbers of operations are presented to a precision of two digits after the decimal point to shownumbers of operations that are greater than zero but less than 1.Totals may not add up due to rounding.
Prepared by: HMMH Inc., August 2013
Environmental Assessment for North Texas Optimization of Airspace and Procedures in the Metroplex
10
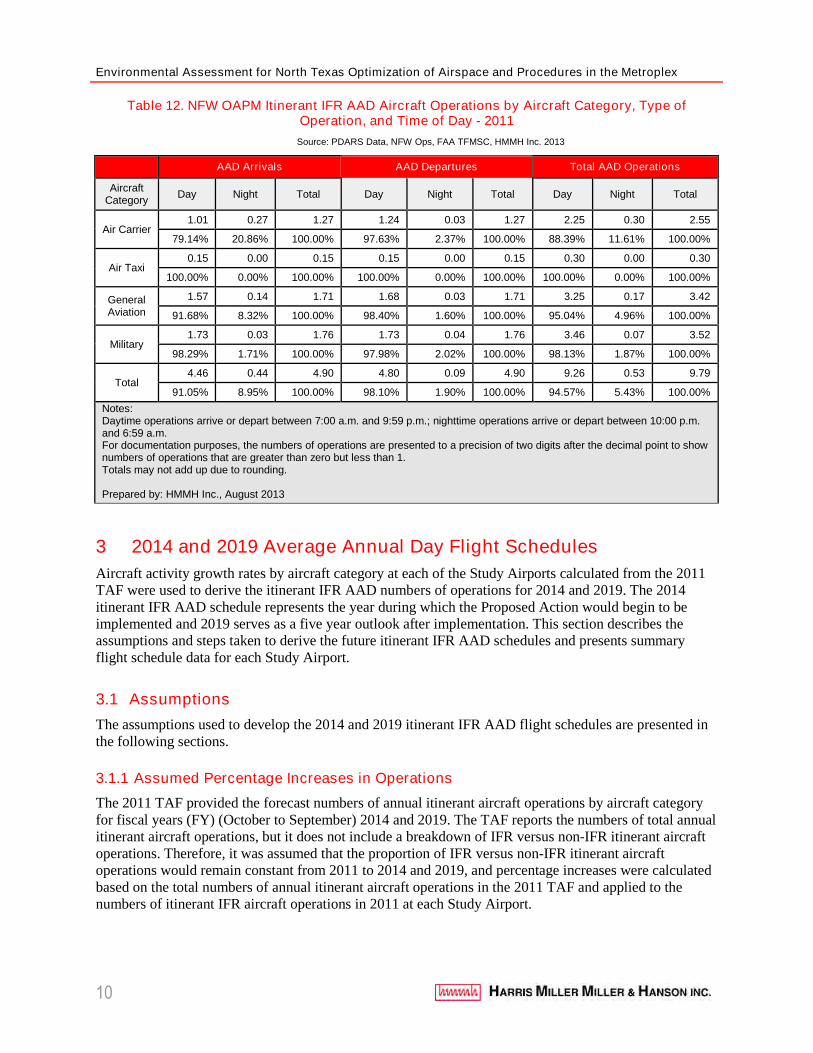
Table 12. NFW OAPM Itinerant IFR AAD Aircraft Operations by Aircraft Category, Type ofOperation, and Time of Day - 2011
Source: PDARS Data, NFW Ops, FAA TFMSC, HMMH Inc. 2013
AAD Arrivals AAD Departures Total AAD Operations
AircraftCategory
Day Night Total Day Night Total Day Night Total
Air Carrier1.01 0.27 1.27 1.24 0.03 1.27 2.25 0.30 2.55
79.14% 20.86% 100.00% 97.63% 2.37% 100.00% 88.39% 11.61% 100.00%
Air Taxi0.15 0.00 0.15 0.15 0.00 0.15 0.30 0.00 0.30
100.00% 0.00% 100.00% 100.00% 0.00% 100.00% 100.00% 0.00% 100.00%
GeneralAviation
1.57 0.14 1.71 1.68 0.03 1.71 3.25 0.17 3.42
91.68% 8.32% 100.00% 98.40% 1.60% 100.00% 95.04% 4.96% 100.00%
Military1.73 0.03 1.76 1.73 0.04 1.76 3.46 0.07 3.52
98.29% 1.71% 100.00% 97.98% 2.02% 100.00% 98.13% 1.87% 100.00%
Total4.46 0.44 4.90 4.80 0.09 4.90 9.26 0.53 9.79
91.05% 8.95% 100.00% 98.10% 1.90% 100.00% 94.57% 5.43% 100.00%
Notes:Daytime operations arrive or depart between 7:00 a.m. and 9:59 p.m.; nighttime operations arrive or depart between 10:00 p.m.and 6:59 a.m.For documentation purposes, the numbers of operations are presented to a precision of two digits after the decimal point to shownumbers of operations that are greater than zero but less than 1.Totals may not add up due to rounding.
Prepared by: HMMH Inc., August 2013
3 2014 and 2019 Average Annual Day Flight Schedules
Aircraft activity growth rates by aircraft category at each of the Study Airports calculated from the 2011TAF were used to derive the itinerant IFR AAD numbers of operations for 2014 and 2019. The 2014itinerant IFR AAD schedule represents the year during which the Proposed Action would begin to beimplemented and 2019 serves as a five year outlook after implementation. This section describes theassumptions and steps taken to derive the future itinerant IFR AAD schedules and presents summaryflight schedule data for each Study Airport.
3.1 Assumptions
The assumptions used to develop the 2014 and 2019 itinerant IFR AAD flight schedules are presented inthe following sections.
3.1.1 Assumed Percentage Increases in Operations
The 2011 TAF provided the forecast numbers of annual itinerant aircraft operations by aircraft categoryfor fiscal years (FY) (October to September) 2014 and 2019. The TAF reports the numbers of total annualitinerant aircraft operations, but it does not include a breakdown of IFR versus non-IFR itinerant aircraftoperations. Therefore, it was assumed that the proportion of IFR versus non-IFR itinerant aircraftoperations would remain constant from 2011 to 2014 and 2019, and percentage increases were calculatedbased on the total numbers of annual itinerant aircraft operations in the 2011 TAF and applied to thenumbers of itinerant IFR aircraft operations in 2011 at each Study Airport.
Average Annual Day Flight Schedules
11
The 2019 TAF forecast for DAL includes the expiration of the Wright Amendment in 20143. Percentchange levels in 2019 for DAL are significantly larger than the change levels forecasted for other studyarea airports.
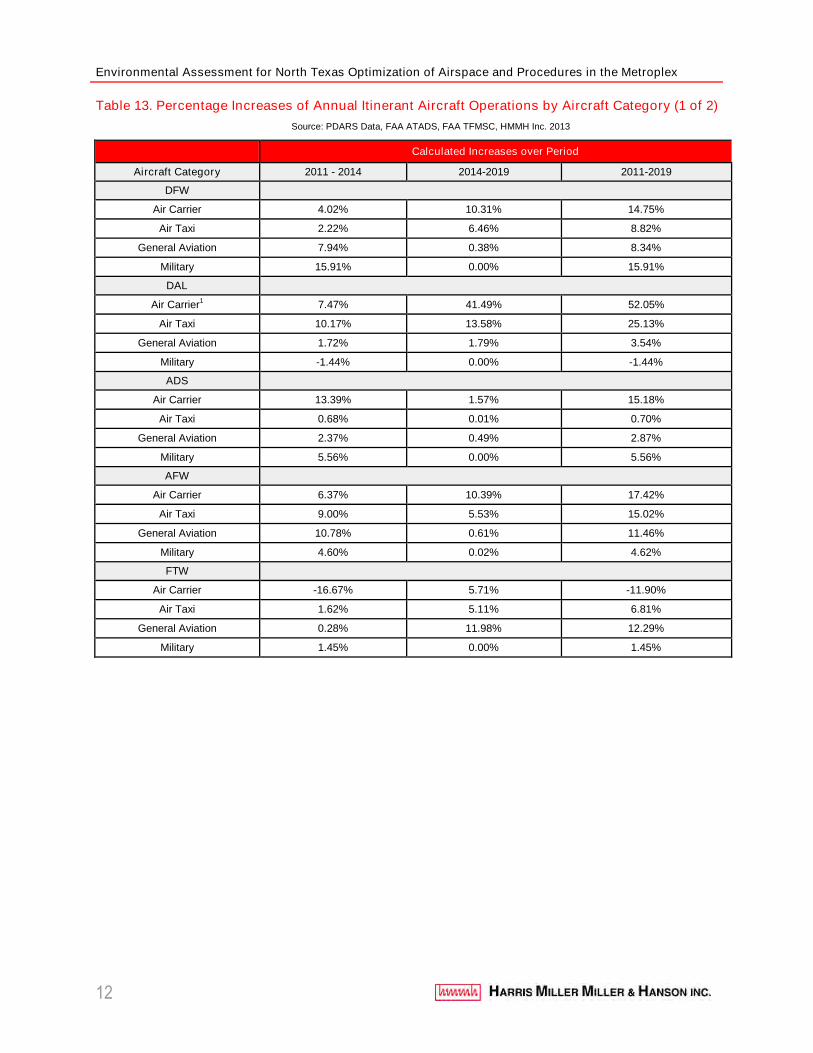
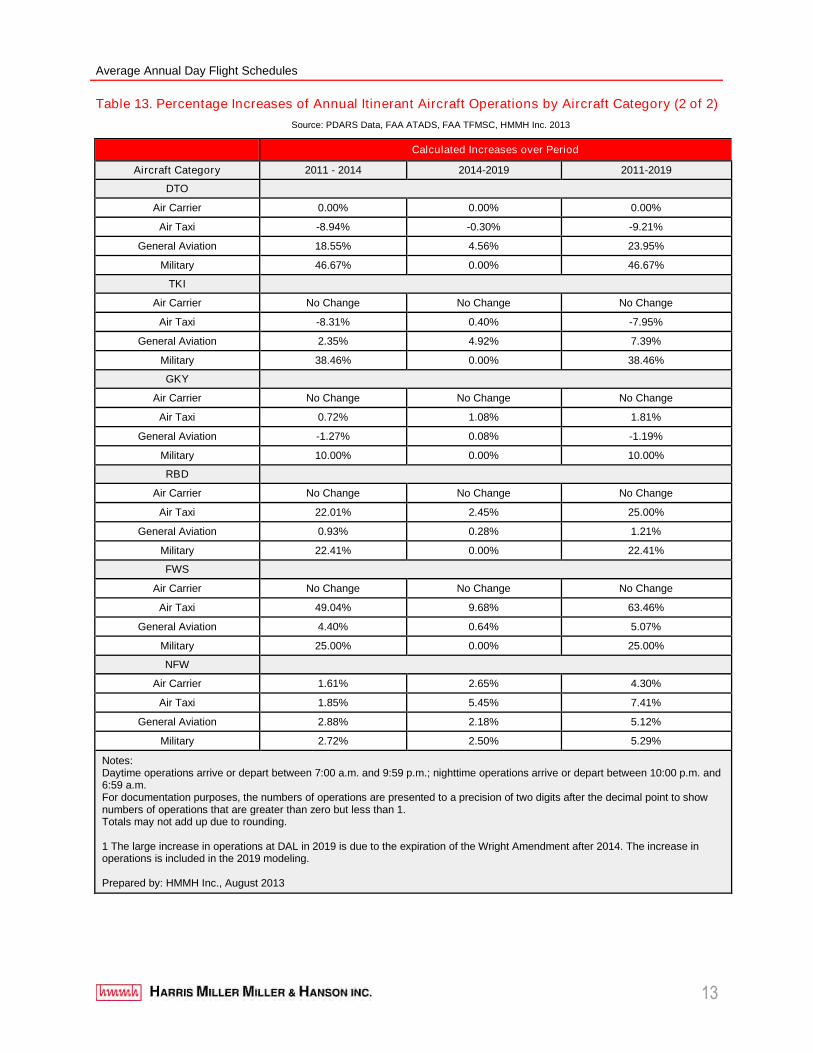
Table 13 presents the projected numbers of annual itinerant aircraft operations for 2011, 2014, and 2019and associated calculated percentage increases for the periods of 2011-2014, 2014-2019, and 2011-2019for each aircraft category at each of the Study Airports.
3.1.2 Future Fleet Mix Assumptions
The future fleet mixes - The mix of aircraft types projected to operate at the Study Airports in 2014 and2019 were developed beginning with the 2011 itinerant IFR AAD fleet mix. Assumptions were maderegarding fleet mix changes as a result of anticipated aircraft retirements of older and less fuel efficientaircraft types, as well as new aircraft acquisitions.
The future fleet mix assumptions were developed using aircraft types already designated in NIRS aircrafttypes (as described in Section 2.1). Using various sources, information was collected on plannedacquisition of new aircraft by operators. This information, as well as general professional judgment andexpertise related to industry trends was used to identify the types of aircraft that would be assumed to becompletely or partially replaced by newer and more fuel efficient aircraft types by 2014 and 2019.Examples of those NIRS aircraft types included the 727EM1 and 727EM2 (Boeing 727); 737500 (Boeing737-500); MD81, MD82, and MD83 (McDonnell Douglas MD-80), GIIB (Gulfstream IIB); LEAR25(Learjet 25), and DO328 (NIRS substitution for the ATR-72). 777-300 service was added to DFW for2014 and 2019.
In the air carrier and air taxi aircraft categories, operations by aircraft types identified as newer or morefuel-efficient were scaled to the forecast while out of production aircraft remained at 2011 activity levelsin the 2014 and 2019 flight schedules. In the general aviation and military aircraft categories, no newaircraft types were assumed in the 2014 and 2019 flight schedules when compared with those operated in2011.
3 Email from Peter LeBoff, FAA APO-100 to Robert Mentzer Jr. HMMH sent on 10/17/2012 confirming theinclusion of the expiration of the Wright Amendment for DAL in the 2012 TAF data.
Environmental Assessment for North Texas Optimization of Airspace and Procedures in the Metroplex
12
Table 13. Percentage Increases of Annual Itinerant Aircraft Operations by Aircraft Category (1 of 2)
Source: PDARS Data, FAA ATADS, FAA TFMSC, HMMH Inc. 2013
Calculated Increases over Period
Aircraft Category 2011 - 2014 2014-2019 2011-2019
DFW
Air Carrier 4.02% 10.31% 14.75%
Air Taxi 2.22% 6.46% 8.82%
General Aviation 7.94% 0.38% 8.34%
Military 15.91% 0.00% 15.91%
DAL
Air Carrier1 7.47% 41.49% 52.05%
Air Taxi 10.17% 13.58% 25.13%
General Aviation 1.72% 1.79% 3.54%
Military -1.44% 0.00% -1.44%
ADS
Air Carrier 13.39% 1.57% 15.18%
Air Taxi 0.68% 0.01% 0.70%
General Aviation 2.37% 0.49% 2.87%
Military 5.56% 0.00% 5.56%
AFW
Air Carrier 6.37% 10.39% 17.42%
Air Taxi 9.00% 5.53% 15.02%
General Aviation 10.78% 0.61% 11.46%
Military 4.60% 0.02% 4.62%
FTW
Air Carrier -16.67% 5.71% -11.90%
Air Taxi 1.62% 5.11% 6.81%
General Aviation 0.28% 11.98% 12.29%
Military 1.45% 0.00% 1.45%
Average Annual Day Flight Schedules
13
Table 13. Percentage Increases of Annual Itinerant Aircraft Operations by Aircraft Category (2 of 2)
Source: PDARS Data, FAA ATADS, FAA TFMSC, HMMH Inc. 2013
Calculated Increases over Period
Aircraft Category 2011 - 2014 2014-2019 2011-2019
DTO
Air Carrier 0.00% 0.00% 0.00%
Air Taxi -8.94% -0.30% -9.21%
General Aviation 18.55% 4.56% 23.95%
Military 46.67% 0.00% 46.67%
TKI
Air Carrier No Change No Change No Change
Air Taxi -8.31% 0.40% -7.95%
General Aviation 2.35% 4.92% 7.39%
Military 38.46% 0.00% 38.46%
GKY
Air Carrier No Change No Change No Change
Air Taxi 0.72% 1.08% 1.81%
General Aviation -1.27% 0.08% -1.19%
Military 10.00% 0.00% 10.00%
RBD
Air Carrier No Change No Change No Change
Air Taxi 22.01% 2.45% 25.00%
General Aviation 0.93% 0.28% 1.21%
Military 22.41% 0.00% 22.41%
FWS
Air Carrier No Change No Change No Change
Air Taxi 49.04% 9.68% 63.46%
General Aviation 4.40% 0.64% 5.07%
Military 25.00% 0.00% 25.00%
NFW
Air Carrier 1.61% 2.65% 4.30%
Air Taxi 1.85% 5.45% 7.41%
General Aviation 2.88% 2.18% 5.12%
Military 2.72% 2.50% 5.29%
Notes:Daytime operations arrive or depart between 7:00 a.m. and 9:59 p.m.; nighttime operations arrive or depart between 10:00 p.m. and6:59 a.m.For documentation purposes, the numbers of operations are presented to a precision of two digits after the decimal point to shownumbers of operations that are greater than zero but less than 1.Totals may not add up due to rounding.
1 The large increase in operations at DAL in 2019 is due to the expiration of the Wright Amendment after 2014. The increase inoperations is included in the 2019 modeling.
Prepared by: HMMH Inc., August 2013
Environmental Assessment for North Texas Optimization of Airspace and Procedures in the Metroplex
14
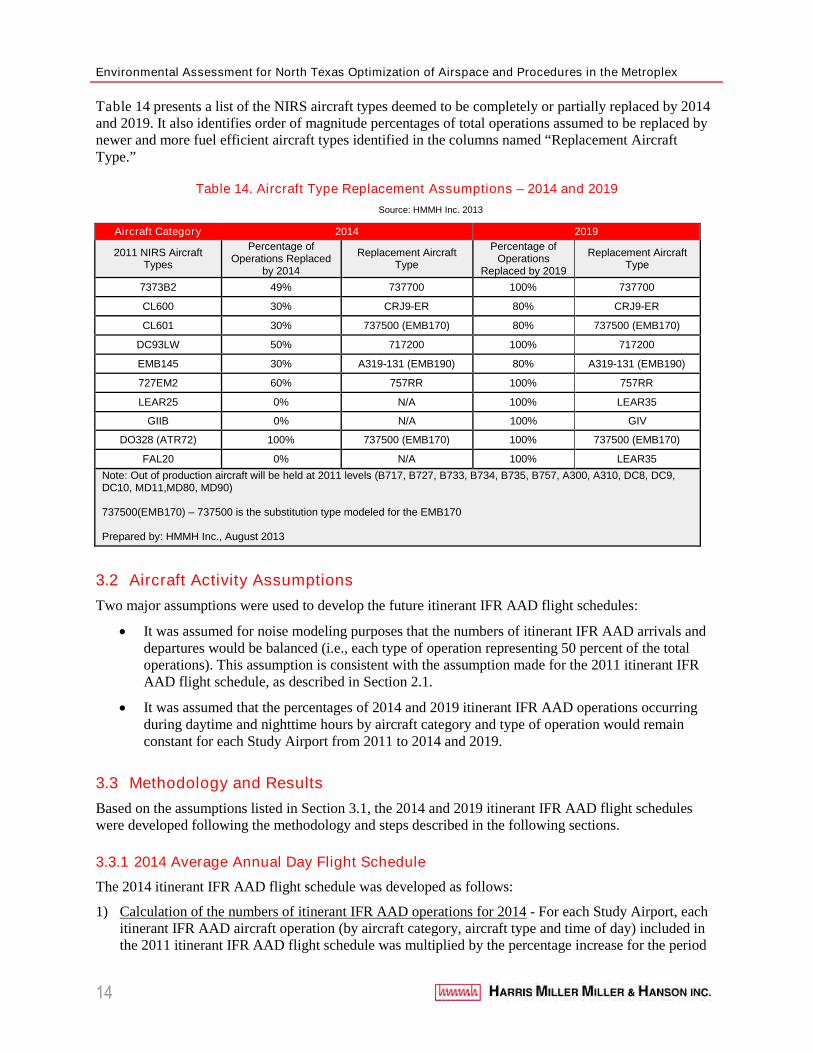
Table 14 presents a list of the NIRS aircraft types deemed to be completely or partially replaced by 2014and 2019. It also identifies order of magnitude percentages of total operations assumed to be replaced bynewer and more fuel efficient aircraft types identified in the columns named “Replacement AircraftType.”
Table 14. Aircraft Type Replacement Assumptions – 2014 and 2019
Source: HMMH Inc. 2013
Aircraft Category 2014 2019
2011 NIRS AircraftTypes
Percentage ofOperations Replaced
by 2014
Replacement AircraftType
Percentage ofOperations
Replaced by 2019
Replacement AircraftType
7373B2 49% 737700 100% 737700
CL600 30% CRJ9-ER 80% CRJ9-ER
CL601 30% 737500 (EMB170) 80% 737500 (EMB170)
DC93LW 50% 717200 100% 717200
EMB145 30% A319-131 (EMB190) 80% A319-131 (EMB190)
727EM2 60% 757RR 100% 757RR
LEAR25 0% N/A 100% LEAR35
GIIB 0% N/A 100% GIV
DO328 (ATR72) 100% 737500 (EMB170) 100% 737500 (EMB170)
FAL20 0% N/A 100% LEAR35
Note: Out of production aircraft will be held at 2011 levels (B717, B727, B733, B734, B735, B757, A300, A310, DC8, DC9,DC10, MD11,MD80, MD90)
737500(EMB170) – 737500 is the substitution type modeled for the EMB170
Prepared by: HMMH Inc., August 2013
3.2 Aircraft Activity Assumptions
Two major assumptions were used to develop the future itinerant IFR AAD flight schedules:
It was assumed for noise modeling purposes that the numbers of itinerant IFR AAD arrivals anddepartures would be balanced (i.e., each type of operation representing 50 percent of the totaloperations). This assumption is consistent with the assumption made for the 2011 itinerant IFRAAD flight schedule, as described in Section 2.1.
It was assumed that the percentages of 2014 and 2019 itinerant IFR AAD operations occurringduring daytime and nighttime hours by aircraft category and type of operation would remainconstant for each Study Airport from 2011 to 2014 and 2019.
3.3 Methodology and Results
Based on the assumptions listed in Section 3.1, the 2014 and 2019 itinerant IFR AAD flight scheduleswere developed following the methodology and steps described in the following sections.
3.3.1 2014 Average Annual Day Flight Schedule
The 2014 itinerant IFR AAD flight schedule was developed as follows:
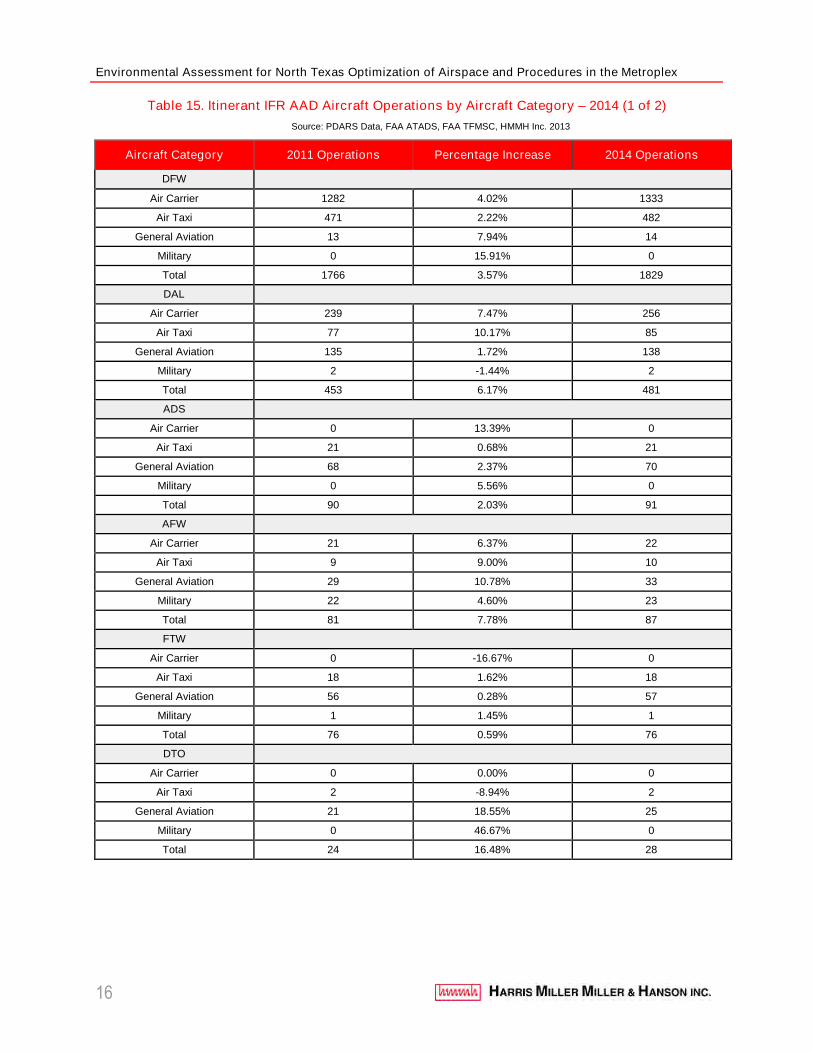
1) Calculation of the numbers of itinerant IFR AAD operations for 2014 - For each Study Airport, eachitinerant IFR AAD aircraft operation (by aircraft category, aircraft type and time of day) included inthe 2011 itinerant IFR AAD flight schedule was multiplied by the percentage increase for the period
Average Annual Day Flight Schedules
15
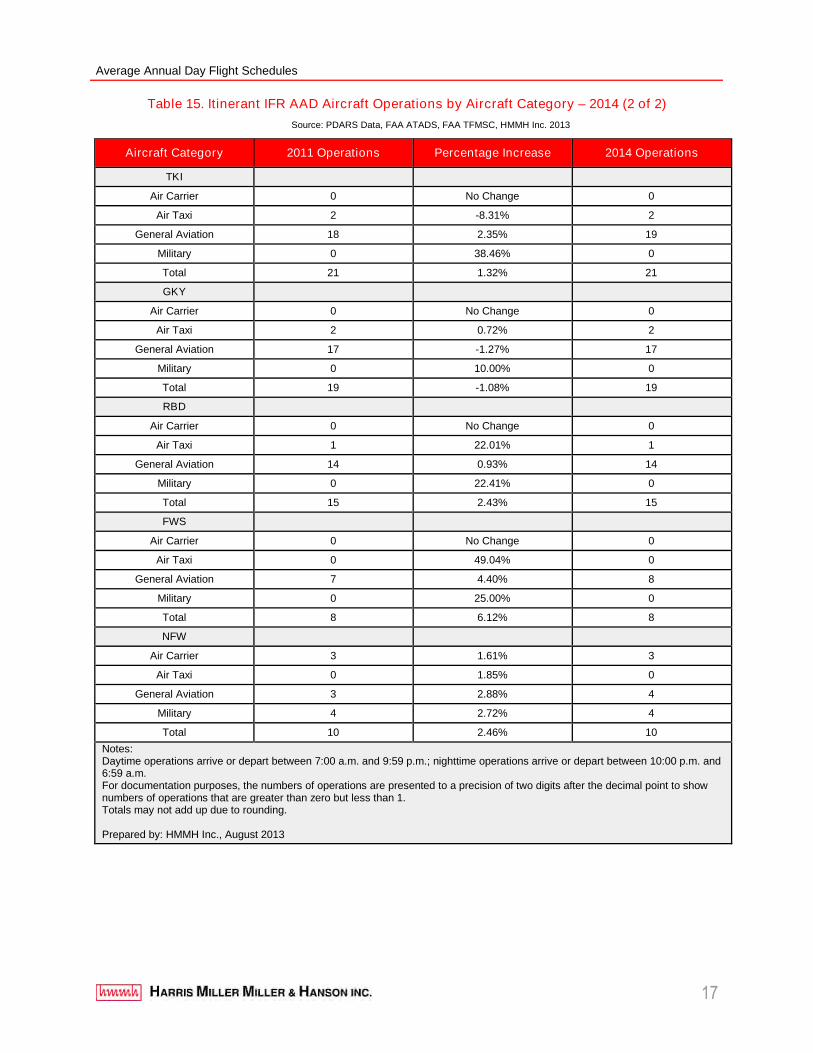
of 2011-2014 identified in Table 13. Table 15 presents the numbers of itinerant IFR AAD aircraftoperations by airport and aircraft category for 2014, along with the 2011 itinerant IFR AAD aircraftoperations and percentage increases calculated for 2014. For example, each itinerant IFR AAD aircarrier operation at DFW was unchanged, resulting in the 2014 operation numbers to be identical to2011 operations.
2) Development of 2014 itinerant IFR AAD flight schedule fleet mix - Based on the fleet mixassumptions for 2014, each aircraft type was assessed to be either retained in the 2014 fleet, or to bereplaced by newer aircraft, based on the fleet assumptions presented in Table 14. There were no fleetmix adjustments for 2014, resulting in the 2014 fleet mix to be identical to the 2011 fleet mix.
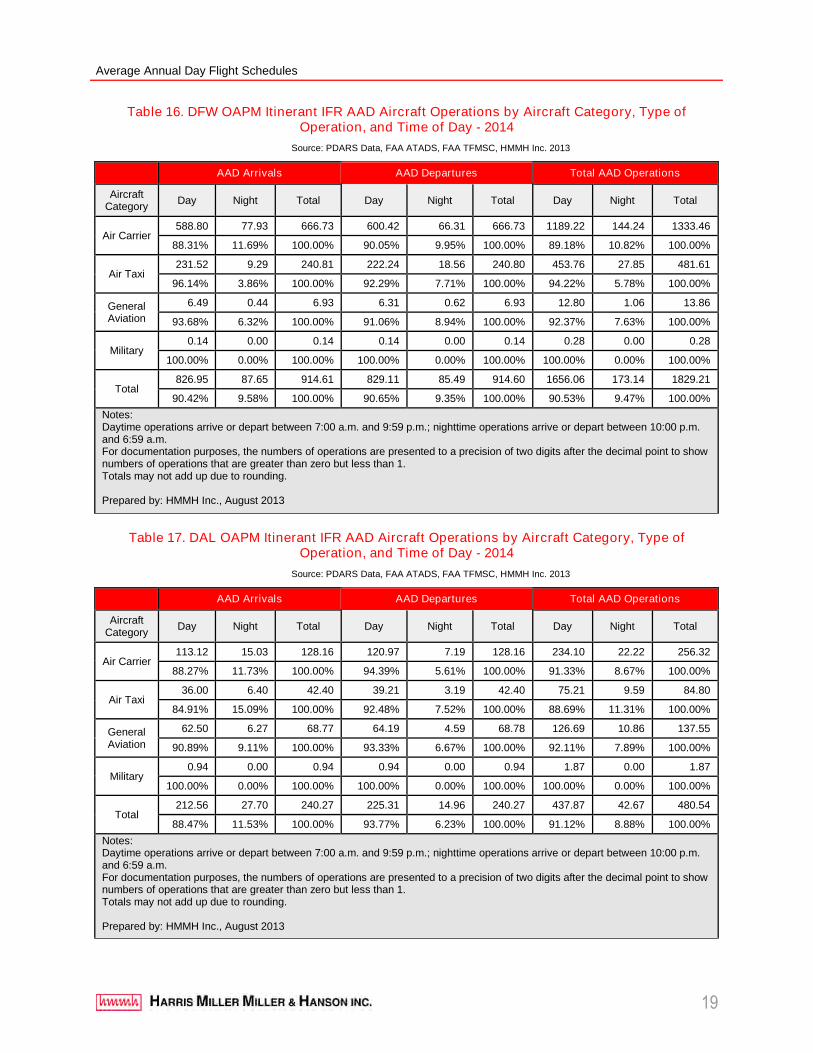
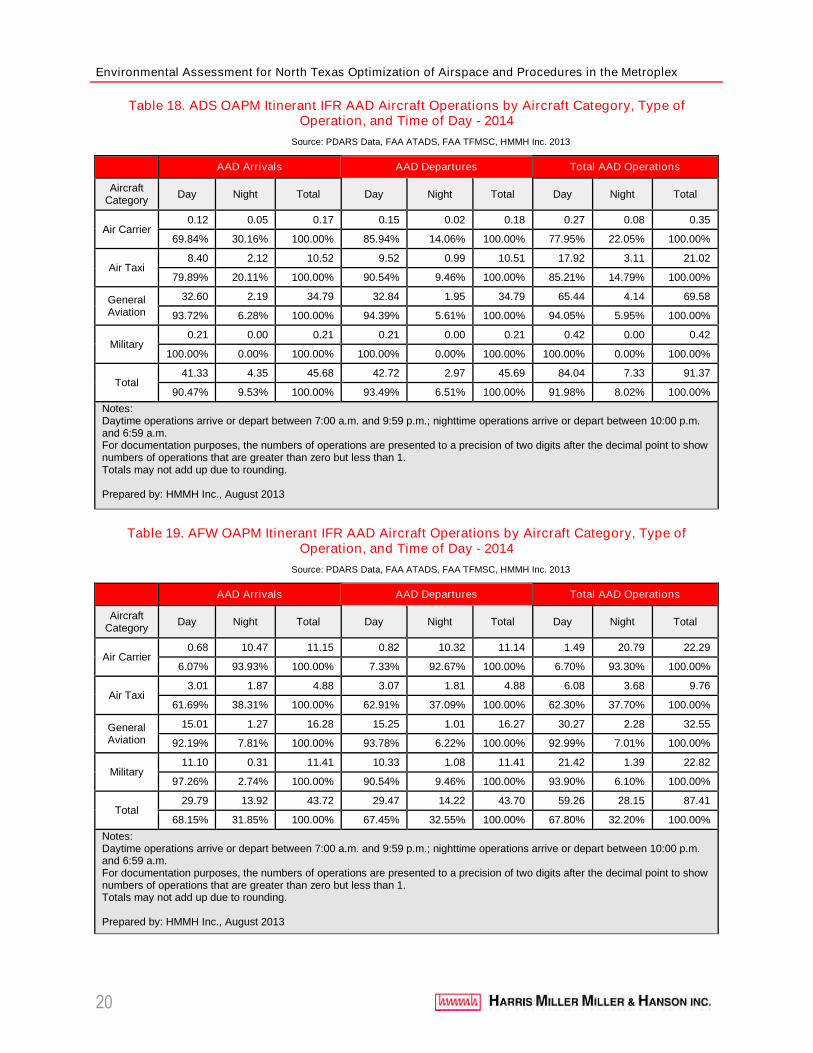
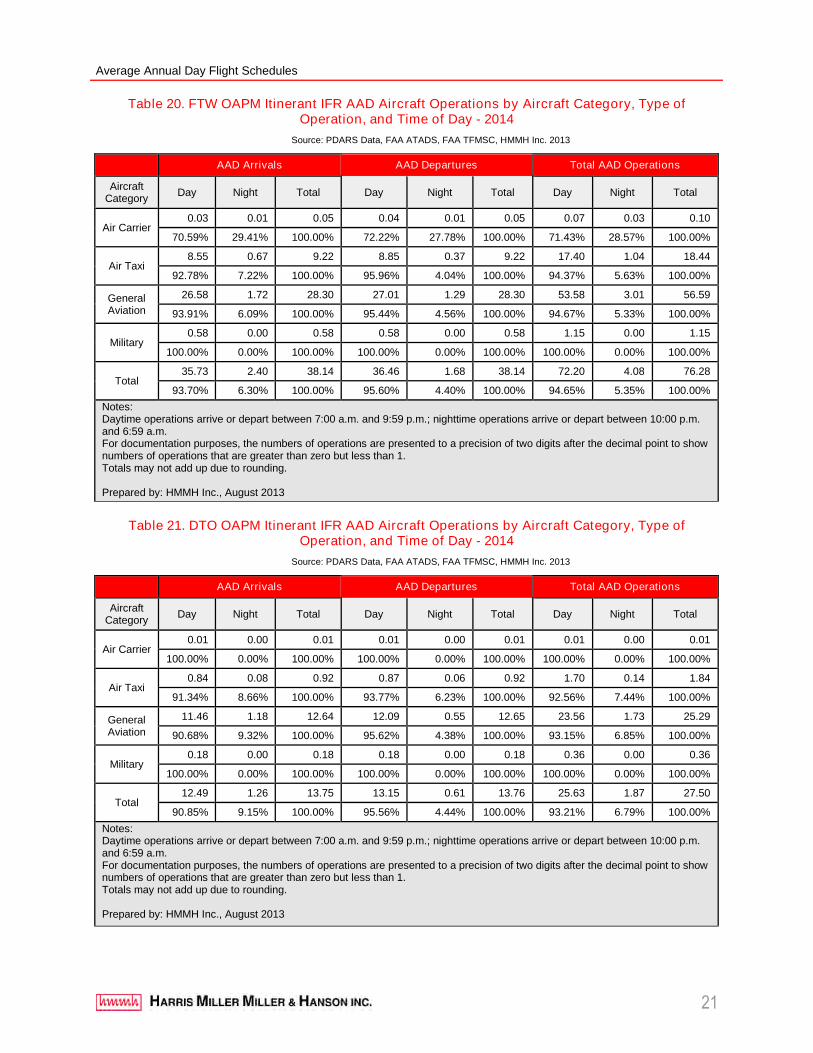
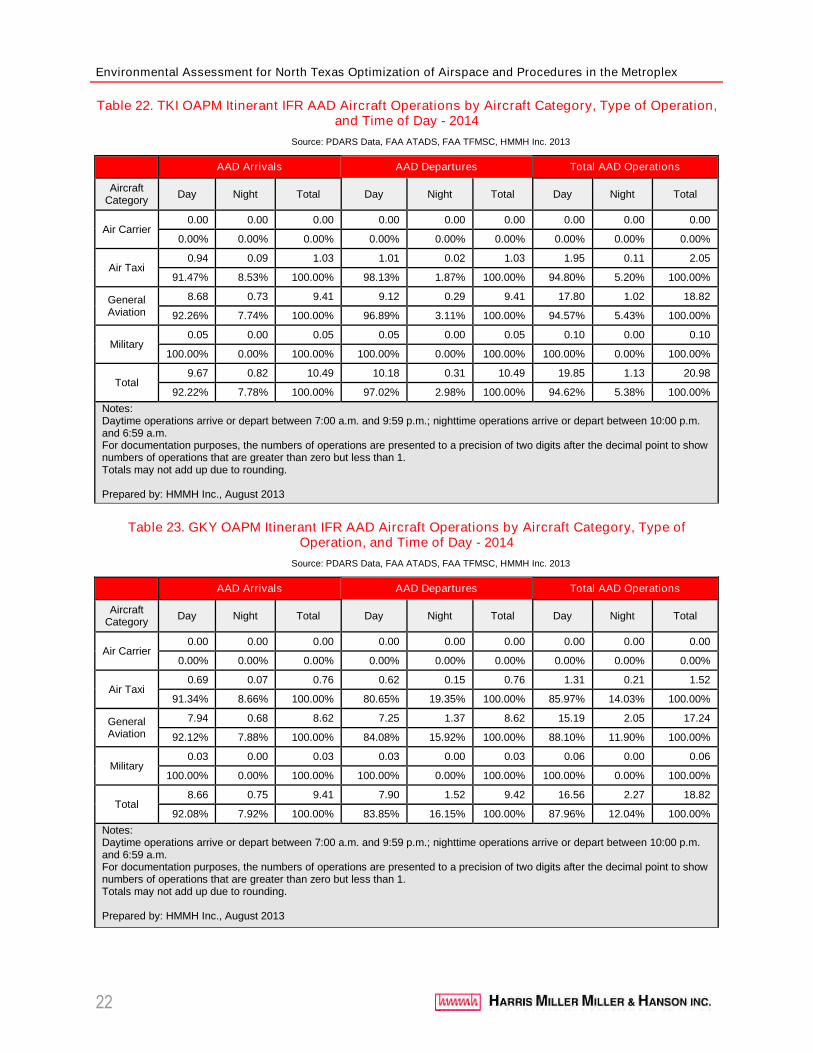
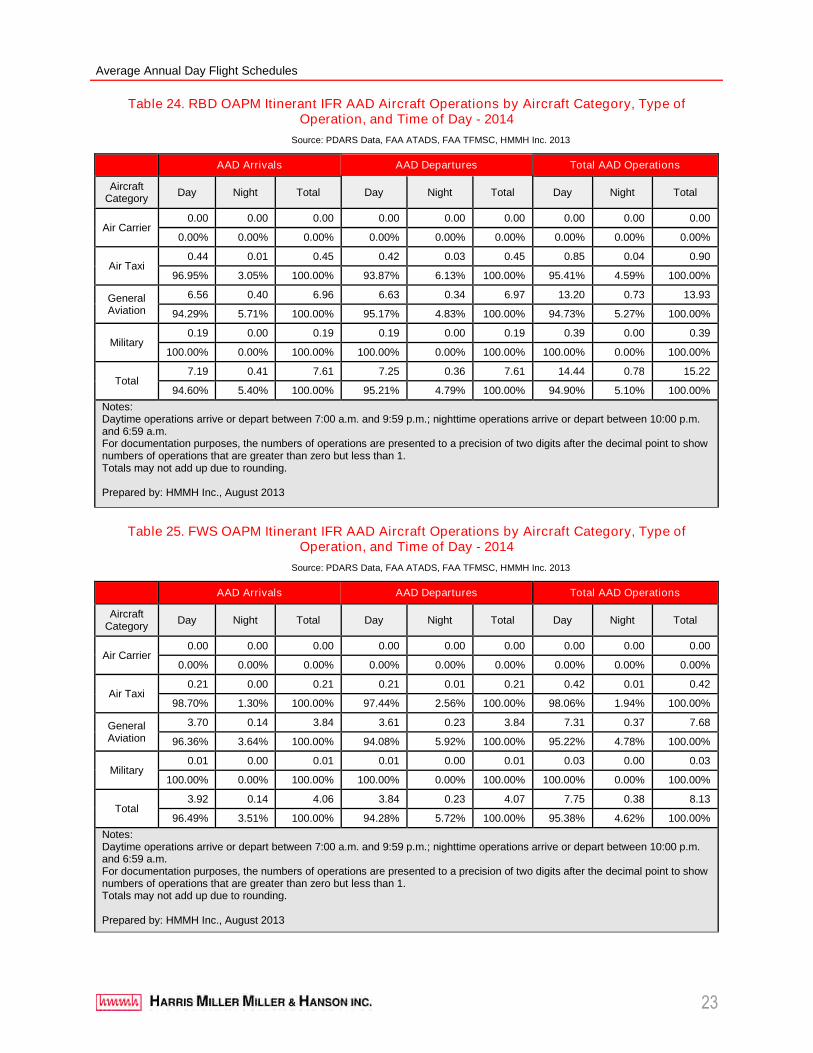
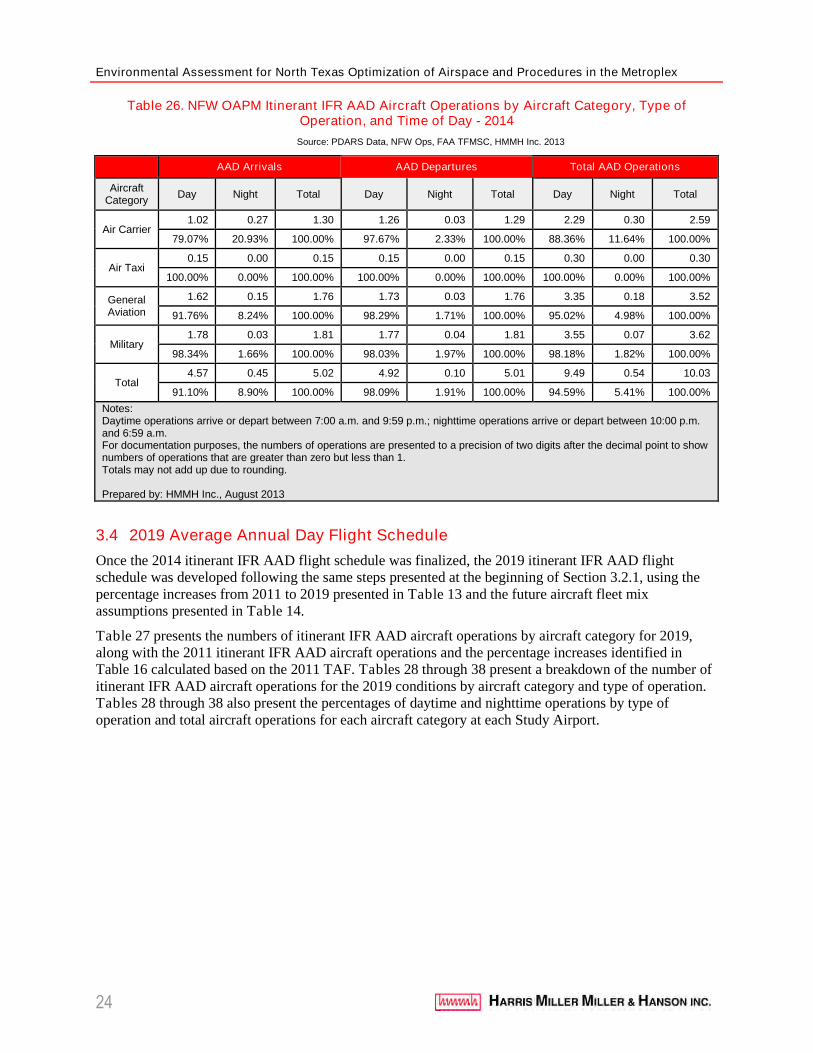
3) Flight schedule verification - Summary results and tables were generated and verified throughout theprocess to ensure that the numbers of arrivals and departures remain balanced (i.e., each setrepresenting 50 percent of the total operations) and that the percentages of day and night operationswere consistent with the 2011 itinerant IFR AAD flight schedule for each aircraft category at each ofthe Study Airports. Tables 16 through 26 present the numbers of itinerant IFR AAD aircraftoperations for 2014 by aircraft category and type of operation. Tables 16 through 26 also present thepercentages of daytime and nighttime operations by type of operation and total aircraft operations foreach aircraft category at each Study Airport.
Environmental Assessment for North Texas Optimization of Airspace and Procedures in the Metroplex
16
Table 15. Itinerant IFR AAD Aircraft Operations by Aircraft Category – 2014 (1 of 2)
Source: PDARS Data, FAA ATADS, FAA TFMSC, HMMH Inc. 2013
Aircraft Category 2011 Operations Percentage Increase 2014 Operations
DFW
Air Carrier 1282 4.02% 1333
Air Taxi 471 2.22% 482
General Aviation 13 7.94% 14
Military 0 15.91% 0
Total 1766 3.57% 1829
DAL
Air Carrier 239 7.47% 256
Air Taxi 77 10.17% 85
General Aviation 135 1.72% 138
Military 2 -1.44% 2
Total 453 6.17% 481
ADS
Air Carrier 0 13.39% 0
Air Taxi 21 0.68% 21
General Aviation 68 2.37% 70
Military 0 5.56% 0
Total 90 2.03% 91
AFW
Air Carrier 21 6.37% 22
Air Taxi 9 9.00% 10
General Aviation 29 10.78% 33
Military 22 4.60% 23
Total 81 7.78% 87
FTW
Air Carrier 0 -16.67% 0
Air Taxi 18 1.62% 18
General Aviation 56 0.28% 57
Military 1 1.45% 1
Total 76 0.59% 76
DTO
Air Carrier 0 0.00% 0
Air Taxi 2 -8.94% 2
General Aviation 21 18.55% 25
Military 0 46.67% 0
Total 24 16.48% 28
Average Annual Day Flight Schedules
17
Table 15. Itinerant IFR AAD Aircraft Operations by Aircraft Category – 2014 (2 of 2)
Source: PDARS Data, FAA ATADS, FAA TFMSC, HMMH Inc. 2013
Aircraft Category 2011 Operations Percentage Increase 2014 Operations
TKI
Air Carrier 0 No Change 0
Air Taxi 2 -8.31% 2
General Aviation 18 2.35% 19
Military 0 38.46% 0
Total 21 1.32% 21
GKY
Air Carrier 0 No Change 0
Air Taxi 2 0.72% 2
General Aviation 17 -1.27% 17
Military 0 10.00% 0
Total 19 -1.08% 19
RBD
Air Carrier 0 No Change 0
Air Taxi 1 22.01% 1
General Aviation 14 0.93% 14
Military 0 22.41% 0
Total 15 2.43% 15
FWS
Air Carrier 0 No Change 0
Air Taxi 0 49.04% 0
General Aviation 7 4.40% 8
Military 0 25.00% 0
Total 8 6.12% 8
NFW
Air Carrier 3 1.61% 3
Air Taxi 0 1.85% 0
General Aviation 3 2.88% 4
Military 4 2.72% 4
Total 10 2.46% 10
Notes:Daytime operations arrive or depart between 7:00 a.m. and 9:59 p.m.; nighttime operations arrive or depart between 10:00 p.m. and6:59 a.m.For documentation purposes, the numbers of operations are presented to a precision of two digits after the decimal point to shownumbers of operations that are greater than zero but less than 1.Totals may not add up due to rounding.
Prepared by: HMMH Inc., August 2013

Average Annual Day Flight Schedules
19
Table 16. DFW OAPM Itinerant IFR AAD Aircraft Operations by Aircraft Category, Type ofOperation, and Time of Day - 2014
Source: PDARS Data, FAA ATADS, FAA TFMSC, HMMH Inc. 2013
AAD Arrivals AAD Departures Total AAD Operations
AircraftCategory
Day Night Total Day Night Total Day Night Total
Air Carrier588.80 77.93 666.73 600.42 66.31 666.73 1189.22 144.24 1333.46
88.31% 11.69% 100.00% 90.05% 9.95% 100.00% 89.18% 10.82% 100.00%
Air Taxi231.52 9.29 240.81 222.24 18.56 240.80 453.76 27.85 481.61
96.14% 3.86% 100.00% 92.29% 7.71% 100.00% 94.22% 5.78% 100.00%
GeneralAviation
6.49 0.44 6.93 6.31 0.62 6.93 12.80 1.06 13.86
93.68% 6.32% 100.00% 91.06% 8.94% 100.00% 92.37% 7.63% 100.00%
Military0.14 0.00 0.14 0.14 0.00 0.14 0.28 0.00 0.28
100.00% 0.00% 100.00% 100.00% 0.00% 100.00% 100.00% 0.00% 100.00%
Total826.95 87.65 914.61 829.11 85.49 914.60 1656.06 173.14 1829.21
90.42% 9.58% 100.00% 90.65% 9.35% 100.00% 90.53% 9.47% 100.00%
Notes:Daytime operations arrive or depart between 7:00 a.m. and 9:59 p.m.; nighttime operations arrive or depart between 10:00 p.m.and 6:59 a.m.For documentation purposes, the numbers of operations are presented to a precision of two digits after the decimal point to shownumbers of operations that are greater than zero but less than 1.Totals may not add up due to rounding.
Prepared by: HMMH Inc., August 2013
Table 17. DAL OAPM Itinerant IFR AAD Aircraft Operations by Aircraft Category, Type ofOperation, and Time of Day - 2014
Source: PDARS Data, FAA ATADS, FAA TFMSC, HMMH Inc. 2013
AAD Arrivals AAD Departures Total AAD Operations
AircraftCategory
Day Night Total Day Night Total Day Night Total
Air Carrier113.12 15.03 128.16 120.97 7.19 128.16 234.10 22.22 256.32
88.27% 11.73% 100.00% 94.39% 5.61% 100.00% 91.33% 8.67% 100.00%
Air Taxi36.00 6.40 42.40 39.21 3.19 42.40 75.21 9.59 84.80
84.91% 15.09% 100.00% 92.48% 7.52% 100.00% 88.69% 11.31% 100.00%
GeneralAviation
62.50 6.27 68.77 64.19 4.59 68.78 126.69 10.86 137.55
90.89% 9.11% 100.00% 93.33% 6.67% 100.00% 92.11% 7.89% 100.00%
Military0.94 0.00 0.94 0.94 0.00 0.94 1.87 0.00 1.87
100.00% 0.00% 100.00% 100.00% 0.00% 100.00% 100.00% 0.00% 100.00%
Total212.56 27.70 240.27 225.31 14.96 240.27 437.87 42.67 480.54
88.47% 11.53% 100.00% 93.77% 6.23% 100.00% 91.12% 8.88% 100.00%
Notes:Daytime operations arrive or depart between 7:00 a.m. and 9:59 p.m.; nighttime operations arrive or depart between 10:00 p.m.and 6:59 a.m.For documentation purposes, the numbers of operations are presented to a precision of two digits after the decimal point to shownumbers of operations that are greater than zero but less than 1.Totals may not add up due to rounding.
Prepared by: HMMH Inc., August 2013
Environmental Assessment for North Texas Optimization of Airspace and Procedures in the Metroplex
20
Table 18. ADS OAPM Itinerant IFR AAD Aircraft Operations by Aircraft Category, Type ofOperation, and Time of Day - 2014
Source: PDARS Data, FAA ATADS, FAA TFMSC, HMMH Inc. 2013
AAD Arrivals AAD Departures Total AAD Operations
AircraftCategory
Day Night Total Day Night Total Day Night Total
Air Carrier0.12 0.05 0.17 0.15 0.02 0.18 0.27 0.08 0.35
69.84% 30.16% 100.00% 85.94% 14.06% 100.00% 77.95% 22.05% 100.00%
Air Taxi8.40 2.12 10.52 9.52 0.99 10.51 17.92 3.11 21.02
79.89% 20.11% 100.00% 90.54% 9.46% 100.00% 85.21% 14.79% 100.00%
GeneralAviation
32.60 2.19 34.79 32.84 1.95 34.79 65.44 4.14 69.58
93.72% 6.28% 100.00% 94.39% 5.61% 100.00% 94.05% 5.95% 100.00%
Military0.21 0.00 0.21 0.21 0.00 0.21 0.42 0.00 0.42
100.00% 0.00% 100.00% 100.00% 0.00% 100.00% 100.00% 0.00% 100.00%
Total41.33 4.35 45.68 42.72 2.97 45.69 84.04 7.33 91.37
90.47% 9.53% 100.00% 93.49% 6.51% 100.00% 91.98% 8.02% 100.00%
Notes:Daytime operations arrive or depart between 7:00 a.m. and 9:59 p.m.; nighttime operations arrive or depart between 10:00 p.m.and 6:59 a.m.For documentation purposes, the numbers of operations are presented to a precision of two digits after the decimal point to shownumbers of operations that are greater than zero but less than 1.Totals may not add up due to rounding.
Prepared by: HMMH Inc., August 2013
Table 19. AFW OAPM Itinerant IFR AAD Aircraft Operations by Aircraft Category, Type ofOperation, and Time of Day - 2014
Source: PDARS Data, FAA ATADS, FAA TFMSC, HMMH Inc. 2013
AAD Arrivals AAD Departures Total AAD Operations
AircraftCategory
Day Night Total Day Night Total Day Night Total
Air Carrier0.68 10.47 11.15 0.82 10.32 11.14 1.49 20.79 22.29
6.07% 93.93% 100.00% 7.33% 92.67% 100.00% 6.70% 93.30% 100.00%
Air Taxi3.01 1.87 4.88 3.07 1.81 4.88 6.08 3.68 9.76
61.69% 38.31% 100.00% 62.91% 37.09% 100.00% 62.30% 37.70% 100.00%
GeneralAviation
15.01 1.27 16.28 15.25 1.01 16.27 30.27 2.28 32.55
92.19% 7.81% 100.00% 93.78% 6.22% 100.00% 92.99% 7.01% 100.00%
Military11.10 0.31 11.41 10.33 1.08 11.41 21.42 1.39 22.82
97.26% 2.74% 100.00% 90.54% 9.46% 100.00% 93.90% 6.10% 100.00%
Total29.79 13.92 43.72 29.47 14.22 43.70 59.26 28.15 87.41
68.15% 31.85% 100.00% 67.45% 32.55% 100.00% 67.80% 32.20% 100.00%
Notes:Daytime operations arrive or depart between 7:00 a.m. and 9:59 p.m.; nighttime operations arrive or depart between 10:00 p.m.and 6:59 a.m.For documentation purposes, the numbers of operations are presented to a precision of two digits after the decimal point to shownumbers of operations that are greater than zero but less than 1.Totals may not add up due to rounding.
Prepared by: HMMH Inc., August 2013
Average Annual Day Flight Schedules
21
Table 20. FTW OAPM Itinerant IFR AAD Aircraft Operations by Aircraft Category, Type ofOperation, and Time of Day - 2014
Source: PDARS Data, FAA ATADS, FAA TFMSC, HMMH Inc. 2013
AAD Arrivals AAD Departures Total AAD Operations
AircraftCategory
Day Night Total Day Night Total Day Night Total
Air Carrier0.03 0.01 0.05 0.04 0.01 0.05 0.07 0.03 0.10
70.59% 29.41% 100.00% 72.22% 27.78% 100.00% 71.43% 28.57% 100.00%
Air Taxi8.55 0.67 9.22 8.85 0.37 9.22 17.40 1.04 18.44
92.78% 7.22% 100.00% 95.96% 4.04% 100.00% 94.37% 5.63% 100.00%
GeneralAviation
26.58 1.72 28.30 27.01 1.29 28.30 53.58 3.01 56.59
93.91% 6.09% 100.00% 95.44% 4.56% 100.00% 94.67% 5.33% 100.00%
Military0.58 0.00 0.58 0.58 0.00 0.58 1.15 0.00 1.15
100.00% 0.00% 100.00% 100.00% 0.00% 100.00% 100.00% 0.00% 100.00%
Total35.73 2.40 38.14 36.46 1.68 38.14 72.20 4.08 76.28
93.70% 6.30% 100.00% 95.60% 4.40% 100.00% 94.65% 5.35% 100.00%
Notes:Daytime operations arrive or depart between 7:00 a.m. and 9:59 p.m.; nighttime operations arrive or depart between 10:00 p.m.and 6:59 a.m.For documentation purposes, the numbers of operations are presented to a precision of two digits after the decimal point to shownumbers of operations that are greater than zero but less than 1.Totals may not add up due to rounding.
Prepared by: HMMH Inc., August 2013
Table 21. DTO OAPM Itinerant IFR AAD Aircraft Operations by Aircraft Category, Type ofOperation, and Time of Day - 2014
Source: PDARS Data, FAA ATADS, FAA TFMSC, HMMH Inc. 2013
AAD Arrivals AAD Departures Total AAD Operations
AircraftCategory
Day Night Total Day Night Total Day Night Total
Air Carrier0.01 0.00 0.01 0.01 0.00 0.01 0.01 0.00 0.01
100.00% 0.00% 100.00% 100.00% 0.00% 100.00% 100.00% 0.00% 100.00%
Air Taxi0.84 0.08 0.92 0.87 0.06 0.92 1.70 0.14 1.84
91.34% 8.66% 100.00% 93.77% 6.23% 100.00% 92.56% 7.44% 100.00%
GeneralAviation
11.46 1.18 12.64 12.09 0.55 12.65 23.56 1.73 25.29
90.68% 9.32% 100.00% 95.62% 4.38% 100.00% 93.15% 6.85% 100.00%
Military0.18 0.00 0.18 0.18 0.00 0.18 0.36 0.00 0.36
100.00% 0.00% 100.00% 100.00% 0.00% 100.00% 100.00% 0.00% 100.00%
Total12.49 1.26 13.75 13.15 0.61 13.76 25.63 1.87 27.50
90.85% 9.15% 100.00% 95.56% 4.44% 100.00% 93.21% 6.79% 100.00%
Notes:Daytime operations arrive or depart between 7:00 a.m. and 9:59 p.m.; nighttime operations arrive or depart between 10:00 p.m.and 6:59 a.m.For documentation purposes, the numbers of operations are presented to a precision of two digits after the decimal point to shownumbers of operations that are greater than zero but less than 1.Totals may not add up due to rounding.
Prepared by: HMMH Inc., August 2013
Environmental Assessment for North Texas Optimization of Airspace and Procedures in the Metroplex
22
Table 22. TKI OAPM Itinerant IFR AAD Aircraft Operations by Aircraft Category, Type of Operation,and Time of Day - 2014
Source: PDARS Data, FAA ATADS, FAA TFMSC, HMMH Inc. 2013
AAD Arrivals AAD Departures Total AAD Operations
AircraftCategory
Day Night Total Day Night Total Day Night Total
Air Carrier0.00 0.00 0.00 0.00 0.00 0.00 0.00 0.00 0.00
0.00% 0.00% 0.00% 0.00% 0.00% 0.00% 0.00% 0.00% 0.00%
Air Taxi0.94 0.09 1.03 1.01 0.02 1.03 1.95 0.11 2.05
91.47% 8.53% 100.00% 98.13% 1.87% 100.00% 94.80% 5.20% 100.00%
GeneralAviation
8.68 0.73 9.41 9.12 0.29 9.41 17.80 1.02 18.82
92.26% 7.74% 100.00% 96.89% 3.11% 100.00% 94.57% 5.43% 100.00%
Military0.05 0.00 0.05 0.05 0.00 0.05 0.10 0.00 0.10
100.00% 0.00% 100.00% 100.00% 0.00% 100.00% 100.00% 0.00% 100.00%
Total9.67 0.82 10.49 10.18 0.31 10.49 19.85 1.13 20.98
92.22% 7.78% 100.00% 97.02% 2.98% 100.00% 94.62% 5.38% 100.00%
Notes:Daytime operations arrive or depart between 7:00 a.m. and 9:59 p.m.; nighttime operations arrive or depart between 10:00 p.m.and 6:59 a.m.For documentation purposes, the numbers of operations are presented to a precision of two digits after the decimal point to shownumbers of operations that are greater than zero but less than 1.Totals may not add up due to rounding.
Prepared by: HMMH Inc., August 2013
Table 23. GKY OAPM Itinerant IFR AAD Aircraft Operations by Aircraft Category, Type ofOperation, and Time of Day - 2014
Source: PDARS Data, FAA ATADS, FAA TFMSC, HMMH Inc. 2013
AAD Arrivals AAD Departures Total AAD Operations
AircraftCategory
Day Night Total Day Night Total Day Night Total
Air Carrier0.00 0.00 0.00 0.00 0.00 0.00 0.00 0.00 0.00
0.00% 0.00% 0.00% 0.00% 0.00% 0.00% 0.00% 0.00% 0.00%
Air Taxi0.69 0.07 0.76 0.62 0.15 0.76 1.31 0.21 1.52
91.34% 8.66% 100.00% 80.65% 19.35% 100.00% 85.97% 14.03% 100.00%
GeneralAviation
7.94 0.68 8.62 7.25 1.37 8.62 15.19 2.05 17.24
92.12% 7.88% 100.00% 84.08% 15.92% 100.00% 88.10% 11.90% 100.00%
Military0.03 0.00 0.03 0.03 0.00 0.03 0.06 0.00 0.06
100.00% 0.00% 100.00% 100.00% 0.00% 100.00% 100.00% 0.00% 100.00%
Total8.66 0.75 9.41 7.90 1.52 9.42 16.56 2.27 18.82
92.08% 7.92% 100.00% 83.85% 16.15% 100.00% 87.96% 12.04% 100.00%
Notes:Daytime operations arrive or depart between 7:00 a.m. and 9:59 p.m.; nighttime operations arrive or depart between 10:00 p.m.and 6:59 a.m.For documentation purposes, the numbers of operations are presented to a precision of two digits after the decimal point to shownumbers of operations that are greater than zero but less than 1.Totals may not add up due to rounding.
Prepared by: HMMH Inc., August 2013
Average Annual Day Flight Schedules
23
Table 24. RBD OAPM Itinerant IFR AAD Aircraft Operations by Aircraft Category, Type ofOperation, and Time of Day - 2014
Source: PDARS Data, FAA ATADS, FAA TFMSC, HMMH Inc. 2013
AAD Arrivals AAD Departures Total AAD Operations
AircraftCategory
Day Night Total Day Night Total Day Night Total
Air Carrier0.00 0.00 0.00 0.00 0.00 0.00 0.00 0.00 0.00
0.00% 0.00% 0.00% 0.00% 0.00% 0.00% 0.00% 0.00% 0.00%
Air Taxi0.44 0.01 0.45 0.42 0.03 0.45 0.85 0.04 0.90
96.95% 3.05% 100.00% 93.87% 6.13% 100.00% 95.41% 4.59% 100.00%
GeneralAviation
6.56 0.40 6.96 6.63 0.34 6.97 13.20 0.73 13.93
94.29% 5.71% 100.00% 95.17% 4.83% 100.00% 94.73% 5.27% 100.00%
Military0.19 0.00 0.19 0.19 0.00 0.19 0.39 0.00 0.39
100.00% 0.00% 100.00% 100.00% 0.00% 100.00% 100.00% 0.00% 100.00%
Total7.19 0.41 7.61 7.25 0.36 7.61 14.44 0.78 15.22
94.60% 5.40% 100.00% 95.21% 4.79% 100.00% 94.90% 5.10% 100.00%
Notes:Daytime operations arrive or depart between 7:00 a.m. and 9:59 p.m.; nighttime operations arrive or depart between 10:00 p.m.and 6:59 a.m.For documentation purposes, the numbers of operations are presented to a precision of two digits after the decimal point to shownumbers of operations that are greater than zero but less than 1.Totals may not add up due to rounding.
Prepared by: HMMH Inc., August 2013
Table 25. FWS OAPM Itinerant IFR AAD Aircraft Operations by Aircraft Category, Type ofOperation, and Time of Day - 2014
Source: PDARS Data, FAA ATADS, FAA TFMSC, HMMH Inc. 2013
AAD Arrivals AAD Departures Total AAD Operations
AircraftCategory
Day Night Total Day Night Total Day Night Total
Air Carrier0.00 0.00 0.00 0.00 0.00 0.00 0.00 0.00 0.00
0.00% 0.00% 0.00% 0.00% 0.00% 0.00% 0.00% 0.00% 0.00%
Air Taxi0.21 0.00 0.21 0.21 0.01 0.21 0.42 0.01 0.42
98.70% 1.30% 100.00% 97.44% 2.56% 100.00% 98.06% 1.94% 100.00%
GeneralAviation
3.70 0.14 3.84 3.61 0.23 3.84 7.31 0.37 7.68
96.36% 3.64% 100.00% 94.08% 5.92% 100.00% 95.22% 4.78% 100.00%
Military0.01 0.00 0.01 0.01 0.00 0.01 0.03 0.00 0.03
100.00% 0.00% 100.00% 100.00% 0.00% 100.00% 100.00% 0.00% 100.00%
Total3.92 0.14 4.06 3.84 0.23 4.07 7.75 0.38 8.13
96.49% 3.51% 100.00% 94.28% 5.72% 100.00% 95.38% 4.62% 100.00%
Notes:Daytime operations arrive or depart between 7:00 a.m. and 9:59 p.m.; nighttime operations arrive or depart between 10:00 p.m.and 6:59 a.m.For documentation purposes, the numbers of operations are presented to a precision of two digits after the decimal point to shownumbers of operations that are greater than zero but less than 1.Totals may not add up due to rounding.
Prepared by: HMMH Inc., August 2013
Environmental Assessment for North Texas Optimization of Airspace and Procedures in the Metroplex
24
Table 26. NFW OAPM Itinerant IFR AAD Aircraft Operations by Aircraft Category, Type ofOperation, and Time of Day - 2014
Source: PDARS Data, NFW Ops, FAA TFMSC, HMMH Inc. 2013
AAD Arrivals AAD Departures Total AAD Operations
AircraftCategory
Day Night Total Day Night Total Day Night Total
Air Carrier1.02 0.27 1.30 1.26 0.03 1.29 2.29 0.30 2.59
79.07% 20.93% 100.00% 97.67% 2.33% 100.00% 88.36% 11.64% 100.00%
Air Taxi0.15 0.00 0.15 0.15 0.00 0.15 0.30 0.00 0.30
100.00% 0.00% 100.00% 100.00% 0.00% 100.00% 100.00% 0.00% 100.00%
GeneralAviation
1.62 0.15 1.76 1.73 0.03 1.76 3.35 0.18 3.52
91.76% 8.24% 100.00% 98.29% 1.71% 100.00% 95.02% 4.98% 100.00%
Military1.78 0.03 1.81 1.77 0.04 1.81 3.55 0.07 3.62
98.34% 1.66% 100.00% 98.03% 1.97% 100.00% 98.18% 1.82% 100.00%
Total4.57 0.45 5.02 4.92 0.10 5.01 9.49 0.54 10.03
91.10% 8.90% 100.00% 98.09% 1.91% 100.00% 94.59% 5.41% 100.00%
Notes:Daytime operations arrive or depart between 7:00 a.m. and 9:59 p.m.; nighttime operations arrive or depart between 10:00 p.m.and 6:59 a.m.For documentation purposes, the numbers of operations are presented to a precision of two digits after the decimal point to shownumbers of operations that are greater than zero but less than 1.Totals may not add up due to rounding.
Prepared by: HMMH Inc., August 2013
3.4 2019 Average Annual Day Flight Schedule
Once the 2014 itinerant IFR AAD flight schedule was finalized, the 2019 itinerant IFR AAD flightschedule was developed following the same steps presented at the beginning of Section 3.2.1, using thepercentage increases from 2011 to 2019 presented in Table 13 and the future aircraft fleet mixassumptions presented in Table 14.
Table 27 presents the numbers of itinerant IFR AAD aircraft operations by aircraft category for 2019,along with the 2011 itinerant IFR AAD aircraft operations and the percentage increases identified inTable 16 calculated based on the 2011 TAF. Tables 28 through 38 present a breakdown of the number ofitinerant IFR AAD aircraft operations for the 2019 conditions by aircraft category and type of operation.Tables 28 through 38 also present the percentages of daytime and nighttime operations by type ofoperation and total aircraft operations for each aircraft category at each Study Airport.
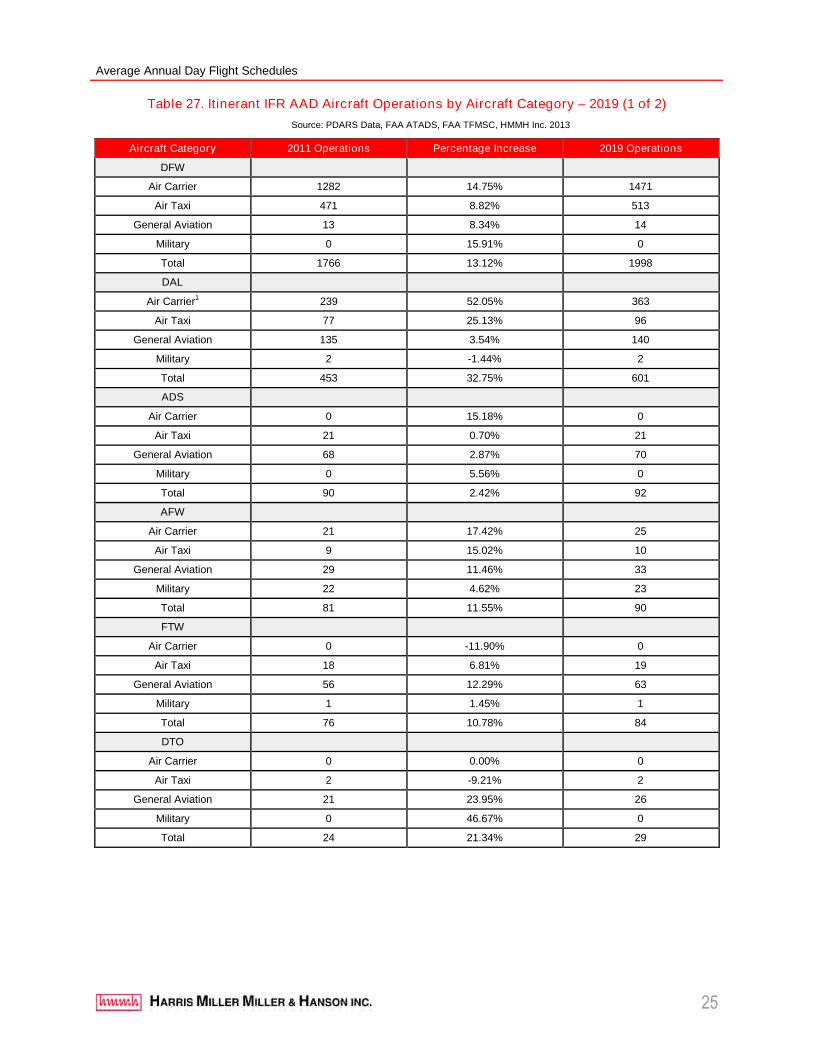
Average Annual Day Flight Schedules
25
Table 27. Itinerant IFR AAD Aircraft Operations by Aircraft Category – 2019 (1 of 2)
Source: PDARS Data, FAA ATADS, FAA TFMSC, HMMH Inc. 2013
Aircraft Category 2011 Operations Percentage Increase 2019 Operations
DFW
Air Carrier 1282 14.75% 1471
Air Taxi 471 8.82% 513
General Aviation 13 8.34% 14
Military 0 15.91% 0
Total 1766 13.12% 1998
DAL
Air Carrier1 239 52.05% 363
Air Taxi 77 25.13% 96
General Aviation 135 3.54% 140
Military 2 -1.44% 2
Total 453 32.75% 601
ADS
Air Carrier 0 15.18% 0
Air Taxi 21 0.70% 21
General Aviation 68 2.87% 70
Military 0 5.56% 0
Total 90 2.42% 92
AFW
Air Carrier 21 17.42% 25
Air Taxi 9 15.02% 10
General Aviation 29 11.46% 33
Military 22 4.62% 23
Total 81 11.55% 90
FTW
Air Carrier 0 -11.90% 0
Air Taxi 18 6.81% 19
General Aviation 56 12.29% 63
Military 1 1.45% 1
Total 76 10.78% 84
DTO
Air Carrier 0 0.00% 0
Air Taxi 2 -9.21% 2
General Aviation 21 23.95% 26
Military 0 46.67% 0
Total 24 21.34% 29
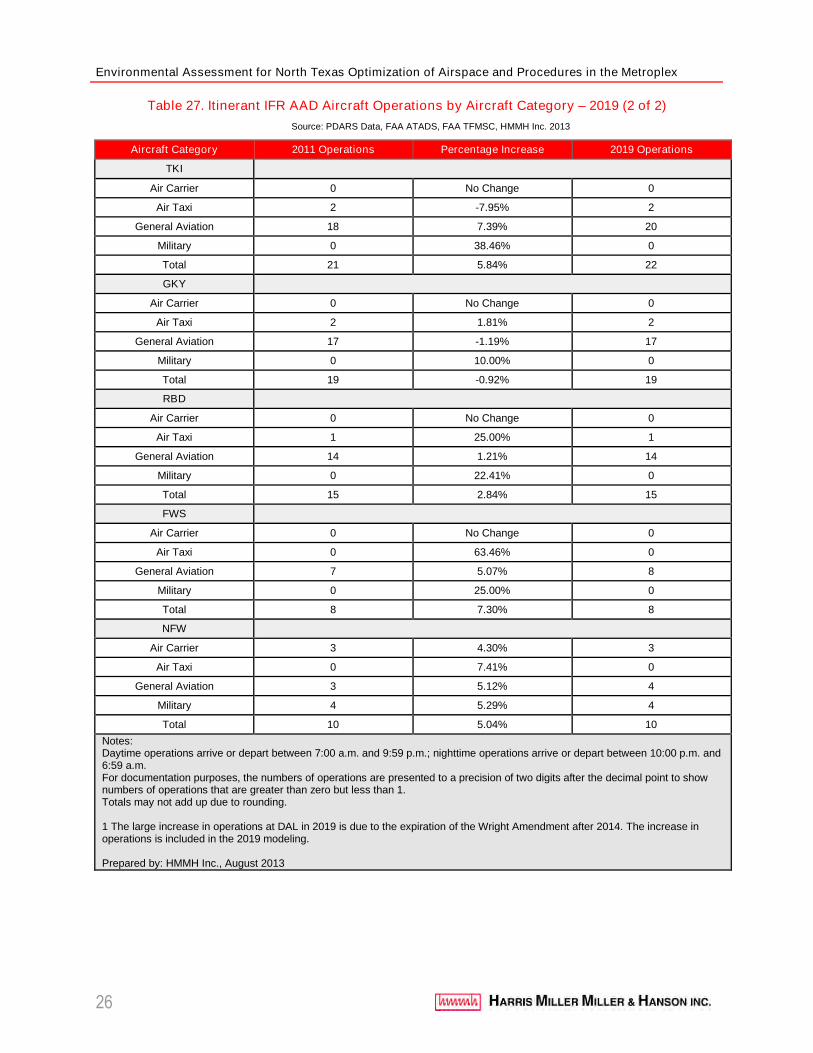
Environmental Assessment for North Texas Optimization of Airspace and Procedures in the Metroplex
26
Table 27. Itinerant IFR AAD Aircraft Operations by Aircraft Category – 2019 (2 of 2)
Source: PDARS Data, FAA ATADS, FAA TFMSC, HMMH Inc. 2013
Aircraft Category 2011 Operations Percentage Increase 2019 Operations
TKI
Air Carrier 0 No Change 0
Air Taxi 2 -7.95% 2
General Aviation 18 7.39% 20
Military 0 38.46% 0
Total 21 5.84% 22
GKY
Air Carrier 0 No Change 0
Air Taxi 2 1.81% 2
General Aviation 17 -1.19% 17
Military 0 10.00% 0
Total 19 -0.92% 19
RBD
Air Carrier 0 No Change 0
Air Taxi 1 25.00% 1
General Aviation 14 1.21% 14
Military 0 22.41% 0
Total 15 2.84% 15
FWS
Air Carrier 0 No Change 0
Air Taxi 0 63.46% 0
General Aviation 7 5.07% 8
Military 0 25.00% 0
Total 8 7.30% 8
NFW
Air Carrier 3 4.30% 3
Air Taxi 0 7.41% 0
General Aviation 3 5.12% 4
Military 4 5.29% 4
Total 10 5.04% 10
Notes:Daytime operations arrive or depart between 7:00 a.m. and 9:59 p.m.; nighttime operations arrive or depart between 10:00 p.m. and6:59 a.m.For documentation purposes, the numbers of operations are presented to a precision of two digits after the decimal point to shownumbers of operations that are greater than zero but less than 1.Totals may not add up due to rounding.
1 The large increase in operations at DAL in 2019 is due to the expiration of the Wright Amendment after 2014. The increase inoperations is included in the 2019 modeling.
Prepared by: HMMH Inc., August 2013
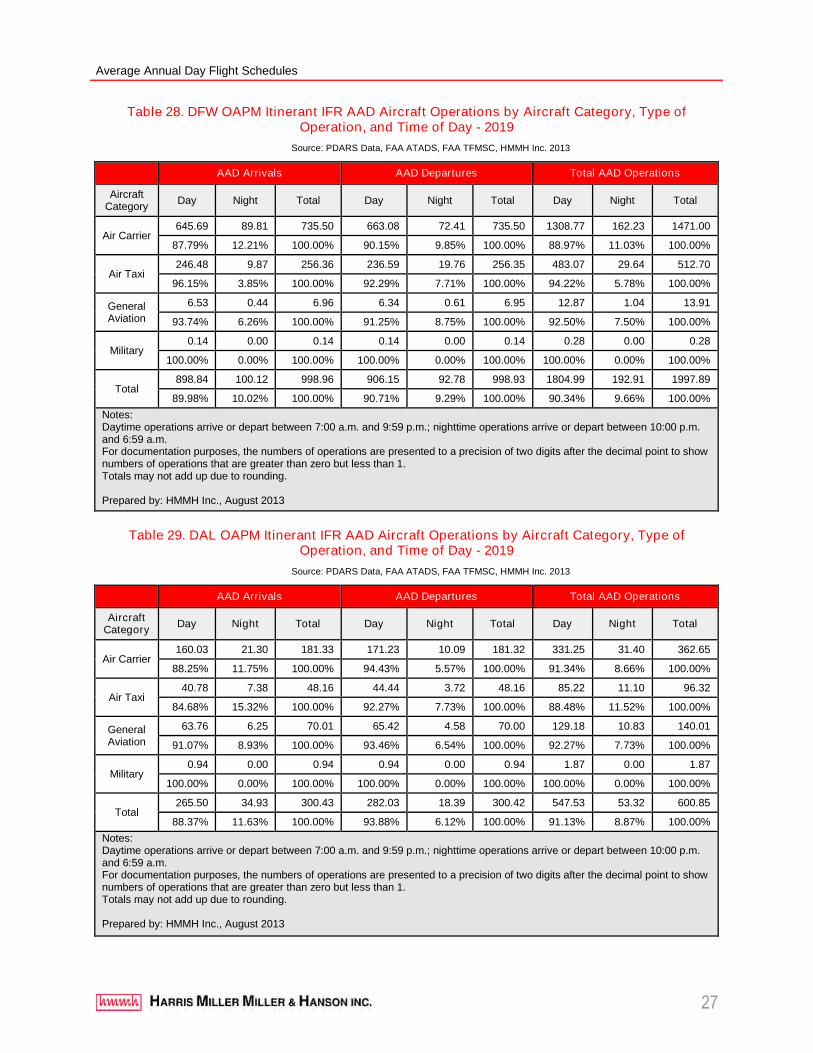
Average Annual Day Flight Schedules
27
Table 28. DFW OAPM Itinerant IFR AAD Aircraft Operations by Aircraft Category, Type ofOperation, and Time of Day - 2019
Source: PDARS Data, FAA ATADS, FAA TFMSC, HMMH Inc. 2013
AAD Arrivals AAD Departures Total AAD Operations
AircraftCategory
Day Night Total Day Night Total Day Night Total
Air Carrier645.69 89.81 735.50 663.08 72.41 735.50 1308.77 162.23 1471.00
87.79% 12.21% 100.00% 90.15% 9.85% 100.00% 88.97% 11.03% 100.00%
Air Taxi246.48 9.87 256.36 236.59 19.76 256.35 483.07 29.64 512.70
96.15% 3.85% 100.00% 92.29% 7.71% 100.00% 94.22% 5.78% 100.00%
GeneralAviation
6.53 0.44 6.96 6.34 0.61 6.95 12.87 1.04 13.91
93.74% 6.26% 100.00% 91.25% 8.75% 100.00% 92.50% 7.50% 100.00%
Military0.14 0.00 0.14 0.14 0.00 0.14 0.28 0.00 0.28
100.00% 0.00% 100.00% 100.00% 0.00% 100.00% 100.00% 0.00% 100.00%
Total898.84 100.12 998.96 906.15 92.78 998.93 1804.99 192.91 1997.89
89.98% 10.02% 100.00% 90.71% 9.29% 100.00% 90.34% 9.66% 100.00%
Notes:Daytime operations arrive or depart between 7:00 a.m. and 9:59 p.m.; nighttime operations arrive or depart between 10:00 p.m.and 6:59 a.m.For documentation purposes, the numbers of operations are presented to a precision of two digits after the decimal point to shownumbers of operations that are greater than zero but less than 1.Totals may not add up due to rounding.
Prepared by: HMMH Inc., August 2013
Table 29. DAL OAPM Itinerant IFR AAD Aircraft Operations by Aircraft Category, Type ofOperation, and Time of Day - 2019
Source: PDARS Data, FAA ATADS, FAA TFMSC, HMMH Inc. 2013
AAD Arrivals AAD Departures Total AAD Operations
AircraftCategory
Day Night Total Day Night Total Day Night Total
Air Carrier160.03 21.30 181.33 171.23 10.09 181.32 331.25 31.40 362.65
88.25% 11.75% 100.00% 94.43% 5.57% 100.00% 91.34% 8.66% 100.00%
Air Taxi40.78 7.38 48.16 44.44 3.72 48.16 85.22 11.10 96.32
84.68% 15.32% 100.00% 92.27% 7.73% 100.00% 88.48% 11.52% 100.00%
GeneralAviation
63.76 6.25 70.01 65.42 4.58 70.00 129.18 10.83 140.01
91.07% 8.93% 100.00% 93.46% 6.54% 100.00% 92.27% 7.73% 100.00%
Military0.94 0.00 0.94 0.94 0.00 0.94 1.87 0.00 1.87
100.00% 0.00% 100.00% 100.00% 0.00% 100.00% 100.00% 0.00% 100.00%
Total265.50 34.93 300.43 282.03 18.39 300.42 547.53 53.32 600.85
88.37% 11.63% 100.00% 93.88% 6.12% 100.00% 91.13% 8.87% 100.00%
Notes:Daytime operations arrive or depart between 7:00 a.m. and 9:59 p.m.; nighttime operations arrive or depart between 10:00 p.m.and 6:59 a.m.For documentation purposes, the numbers of operations are presented to a precision of two digits after the decimal point to shownumbers of operations that are greater than zero but less than 1.Totals may not add up due to rounding.
Prepared by: HMMH Inc., August 2013
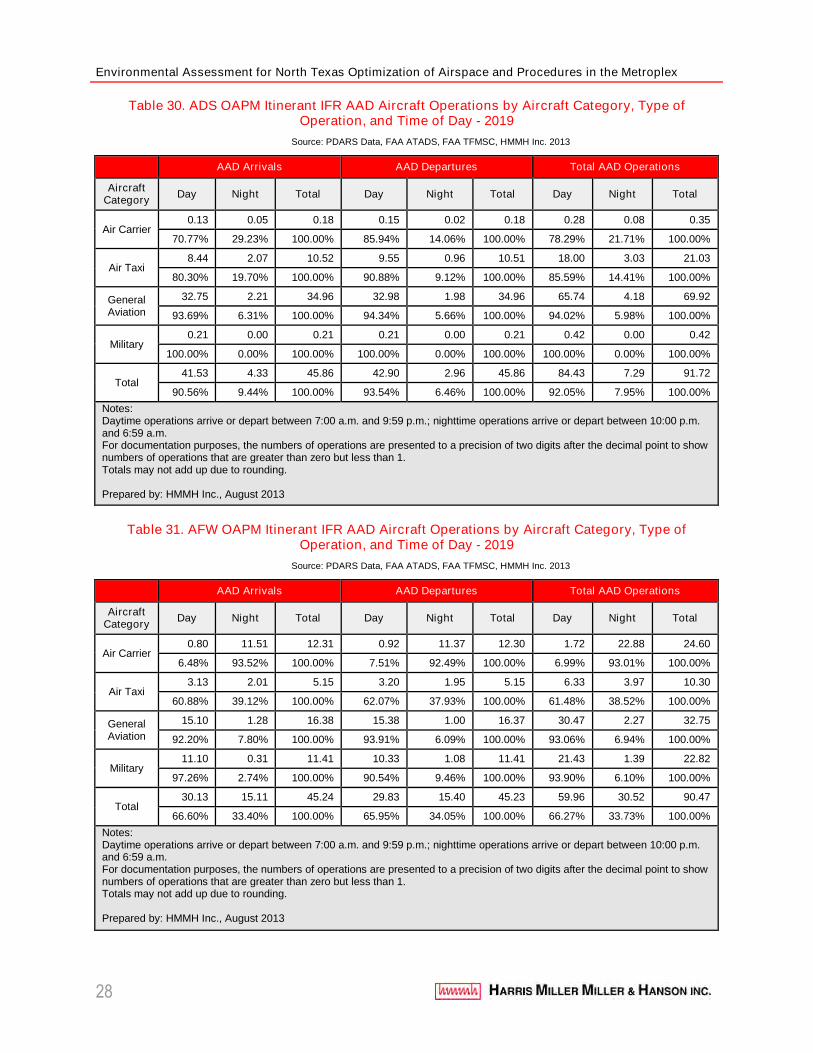
Environmental Assessment for North Texas Optimization of Airspace and Procedures in the Metroplex
28
Table 30. ADS OAPM Itinerant IFR AAD Aircraft Operations by Aircraft Category, Type ofOperation, and Time of Day - 2019
Source: PDARS Data, FAA ATADS, FAA TFMSC, HMMH Inc. 2013
AAD Arrivals AAD Departures Total AAD Operations
AircraftCategory
Day Night Total Day Night Total Day Night Total
Air Carrier0.13 0.05 0.18 0.15 0.02 0.18 0.28 0.08 0.35
70.77% 29.23% 100.00% 85.94% 14.06% 100.00% 78.29% 21.71% 100.00%
Air Taxi8.44 2.07 10.52 9.55 0.96 10.51 18.00 3.03 21.03
80.30% 19.70% 100.00% 90.88% 9.12% 100.00% 85.59% 14.41% 100.00%
GeneralAviation
32.75 2.21 34.96 32.98 1.98 34.96 65.74 4.18 69.92
93.69% 6.31% 100.00% 94.34% 5.66% 100.00% 94.02% 5.98% 100.00%
Military0.21 0.00 0.21 0.21 0.00 0.21 0.42 0.00 0.42
100.00% 0.00% 100.00% 100.00% 0.00% 100.00% 100.00% 0.00% 100.00%
Total41.53 4.33 45.86 42.90 2.96 45.86 84.43 7.29 91.72
90.56% 9.44% 100.00% 93.54% 6.46% 100.00% 92.05% 7.95% 100.00%
Notes:Daytime operations arrive or depart between 7:00 a.m. and 9:59 p.m.; nighttime operations arrive or depart between 10:00 p.m.and 6:59 a.m.For documentation purposes, the numbers of operations are presented to a precision of two digits after the decimal point to shownumbers of operations that are greater than zero but less than 1.Totals may not add up due to rounding.
Prepared by: HMMH Inc., August 2013
Table 31. AFW OAPM Itinerant IFR AAD Aircraft Operations by Aircraft Category, Type ofOperation, and Time of Day - 2019
Source: PDARS Data, FAA ATADS, FAA TFMSC, HMMH Inc. 2013
AAD Arrivals AAD Departures Total AAD Operations
AircraftCategory
Day Night Total Day Night Total Day Night Total
Air Carrier0.80 11.51 12.31 0.92 11.37 12.30 1.72 22.88 24.60
6.48% 93.52% 100.00% 7.51% 92.49% 100.00% 6.99% 93.01% 100.00%
Air Taxi3.13 2.01 5.15 3.20 1.95 5.15 6.33 3.97 10.30
60.88% 39.12% 100.00% 62.07% 37.93% 100.00% 61.48% 38.52% 100.00%
GeneralAviation
15.10 1.28 16.38 15.38 1.00 16.37 30.47 2.27 32.75
92.20% 7.80% 100.00% 93.91% 6.09% 100.00% 93.06% 6.94% 100.00%
Military11.10 0.31 11.41 10.33 1.08 11.41 21.43 1.39 22.82
97.26% 2.74% 100.00% 90.54% 9.46% 100.00% 93.90% 6.10% 100.00%
Total30.13 15.11 45.24 29.83 15.40 45.23 59.96 30.52 90.47
66.60% 33.40% 100.00% 65.95% 34.05% 100.00% 66.27% 33.73% 100.00%
Notes:Daytime operations arrive or depart between 7:00 a.m. and 9:59 p.m.; nighttime operations arrive or depart between 10:00 p.m.and 6:59 a.m.For documentation purposes, the numbers of operations are presented to a precision of two digits after the decimal point to shownumbers of operations that are greater than zero but less than 1.Totals may not add up due to rounding.
Prepared by: HMMH Inc., August 2013
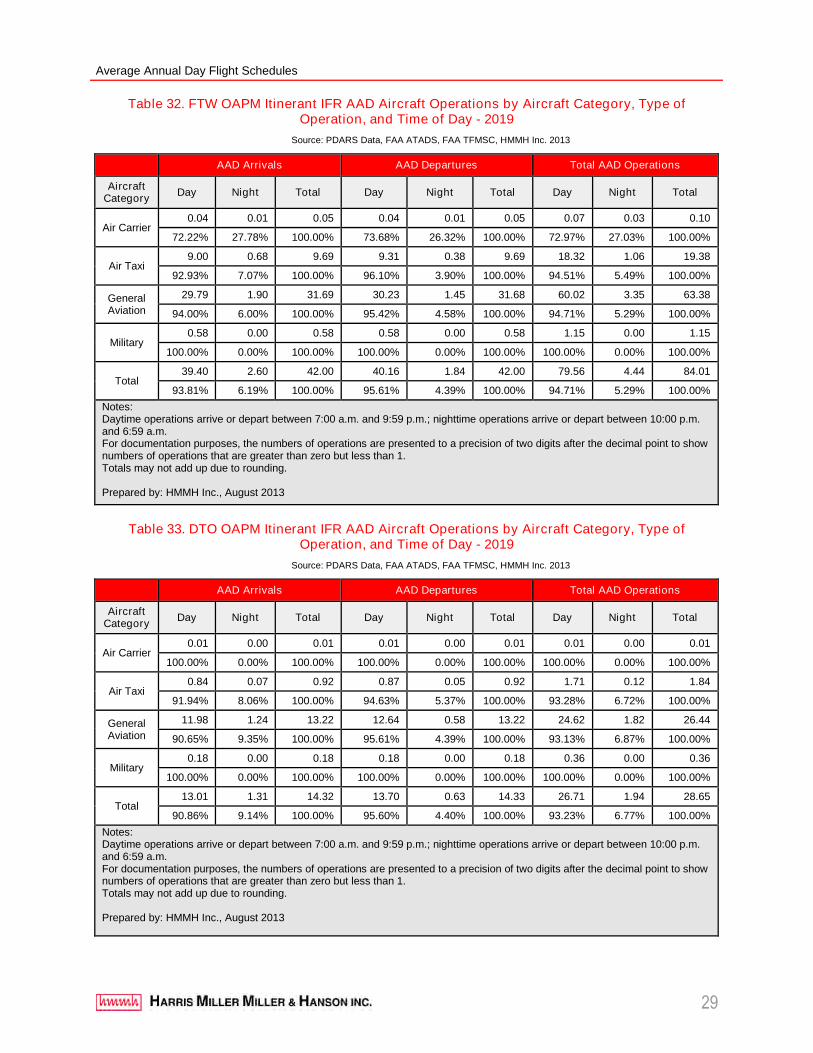
Average Annual Day Flight Schedules
29
Table 32. FTW OAPM Itinerant IFR AAD Aircraft Operations by Aircraft Category, Type ofOperation, and Time of Day - 2019
Source: PDARS Data, FAA ATADS, FAA TFMSC, HMMH Inc. 2013
AAD Arrivals AAD Departures Total AAD Operations
AircraftCategory
Day Night Total Day Night Total Day Night Total
Air Carrier0.04 0.01 0.05 0.04 0.01 0.05 0.07 0.03 0.10
72.22% 27.78% 100.00% 73.68% 26.32% 100.00% 72.97% 27.03% 100.00%
Air Taxi9.00 0.68 9.69 9.31 0.38 9.69 18.32 1.06 19.38
92.93% 7.07% 100.00% 96.10% 3.90% 100.00% 94.51% 5.49% 100.00%
GeneralAviation
29.79 1.90 31.69 30.23 1.45 31.68 60.02 3.35 63.38
94.00% 6.00% 100.00% 95.42% 4.58% 100.00% 94.71% 5.29% 100.00%
Military0.58 0.00 0.58 0.58 0.00 0.58 1.15 0.00 1.15
100.00% 0.00% 100.00% 100.00% 0.00% 100.00% 100.00% 0.00% 100.00%
Total39.40 2.60 42.00 40.16 1.84 42.00 79.56 4.44 84.01
93.81% 6.19% 100.00% 95.61% 4.39% 100.00% 94.71% 5.29% 100.00%
Notes:Daytime operations arrive or depart between 7:00 a.m. and 9:59 p.m.; nighttime operations arrive or depart between 10:00 p.m.and 6:59 a.m.For documentation purposes, the numbers of operations are presented to a precision of two digits after the decimal point to shownumbers of operations that are greater than zero but less than 1.Totals may not add up due to rounding.
Prepared by: HMMH Inc., August 2013
Table 33. DTO OAPM Itinerant IFR AAD Aircraft Operations by Aircraft Category, Type ofOperation, and Time of Day - 2019
Source: PDARS Data, FAA ATADS, FAA TFMSC, HMMH Inc. 2013
AAD Arrivals AAD Departures Total AAD Operations
AircraftCategory
Day Night Total Day Night Total Day Night Total
Air Carrier0.01 0.00 0.01 0.01 0.00 0.01 0.01 0.00 0.01
100.00% 0.00% 100.00% 100.00% 0.00% 100.00% 100.00% 0.00% 100.00%
Air Taxi0.84 0.07 0.92 0.87 0.05 0.92 1.71 0.12 1.84
91.94% 8.06% 100.00% 94.63% 5.37% 100.00% 93.28% 6.72% 100.00%
GeneralAviation
11.98 1.24 13.22 12.64 0.58 13.22 24.62 1.82 26.44
90.65% 9.35% 100.00% 95.61% 4.39% 100.00% 93.13% 6.87% 100.00%
Military0.18 0.00 0.18 0.18 0.00 0.18 0.36 0.00 0.36
100.00% 0.00% 100.00% 100.00% 0.00% 100.00% 100.00% 0.00% 100.00%
Total13.01 1.31 14.32 13.70 0.63 14.33 26.71 1.94 28.65
90.86% 9.14% 100.00% 95.60% 4.40% 100.00% 93.23% 6.77% 100.00%
Notes:Daytime operations arrive or depart between 7:00 a.m. and 9:59 p.m.; nighttime operations arrive or depart between 10:00 p.m.and 6:59 a.m.For documentation purposes, the numbers of operations are presented to a precision of two digits after the decimal point to shownumbers of operations that are greater than zero but less than 1.Totals may not add up due to rounding.
Prepared by: HMMH Inc., August 2013
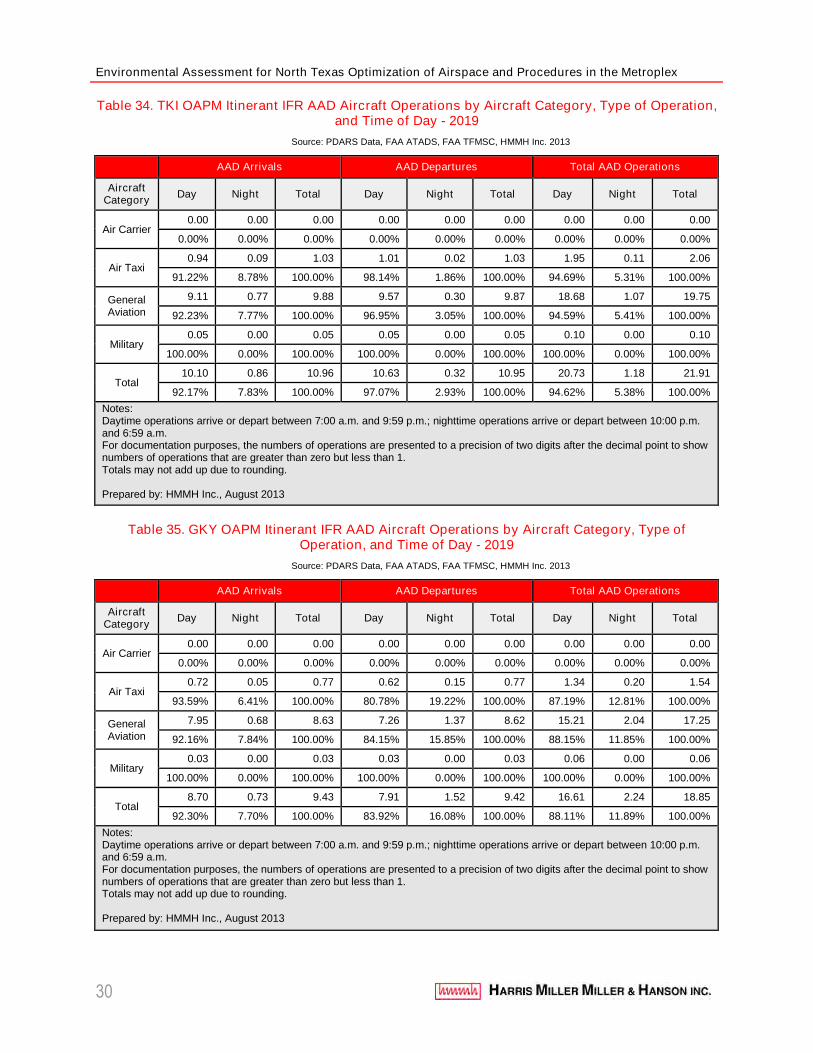
Environmental Assessment for North Texas Optimization of Airspace and Procedures in the Metroplex
30
Table 34. TKI OAPM Itinerant IFR AAD Aircraft Operations by Aircraft Category, Type of Operation,and Time of Day - 2019
Source: PDARS Data, FAA ATADS, FAA TFMSC, HMMH Inc. 2013
AAD Arrivals AAD Departures Total AAD Operations
AircraftCategory
Day Night Total Day Night Total Day Night Total
Air Carrier0.00 0.00 0.00 0.00 0.00 0.00 0.00 0.00 0.00
0.00% 0.00% 0.00% 0.00% 0.00% 0.00% 0.00% 0.00% 0.00%
Air Taxi0.94 0.09 1.03 1.01 0.02 1.03 1.95 0.11 2.06
91.22% 8.78% 100.00% 98.14% 1.86% 100.00% 94.69% 5.31% 100.00%
GeneralAviation
9.11 0.77 9.88 9.57 0.30 9.87 18.68 1.07 19.75
92.23% 7.77% 100.00% 96.95% 3.05% 100.00% 94.59% 5.41% 100.00%
Military0.05 0.00 0.05 0.05 0.00 0.05 0.10 0.00 0.10
100.00% 0.00% 100.00% 100.00% 0.00% 100.00% 100.00% 0.00% 100.00%
Total10.10 0.86 10.96 10.63 0.32 10.95 20.73 1.18 21.91
92.17% 7.83% 100.00% 97.07% 2.93% 100.00% 94.62% 5.38% 100.00%
Notes:Daytime operations arrive or depart between 7:00 a.m. and 9:59 p.m.; nighttime operations arrive or depart between 10:00 p.m.and 6:59 a.m.For documentation purposes, the numbers of operations are presented to a precision of two digits after the decimal point to shownumbers of operations that are greater than zero but less than 1.Totals may not add up due to rounding.
Prepared by: HMMH Inc., August 2013
Table 35. GKY OAPM Itinerant IFR AAD Aircraft Operations by Aircraft Category, Type ofOperation, and Time of Day - 2019
Source: PDARS Data, FAA ATADS, FAA TFMSC, HMMH Inc. 2013
AAD Arrivals AAD Departures Total AAD Operations
AircraftCategory
Day Night Total Day Night Total Day Night Total
Air Carrier0.00 0.00 0.00 0.00 0.00 0.00 0.00 0.00 0.00
0.00% 0.00% 0.00% 0.00% 0.00% 0.00% 0.00% 0.00% 0.00%
Air Taxi0.72 0.05 0.77 0.62 0.15 0.77 1.34 0.20 1.54
93.59% 6.41% 100.00% 80.78% 19.22% 100.00% 87.19% 12.81% 100.00%
GeneralAviation
7.95 0.68 8.63 7.26 1.37 8.62 15.21 2.04 17.25
92.16% 7.84% 100.00% 84.15% 15.85% 100.00% 88.15% 11.85% 100.00%
Military0.03 0.00 0.03 0.03 0.00 0.03 0.06 0.00 0.06
100.00% 0.00% 100.00% 100.00% 0.00% 100.00% 100.00% 0.00% 100.00%
Total8.70 0.73 9.43 7.91 1.52 9.42 16.61 2.24 18.85
92.30% 7.70% 100.00% 83.92% 16.08% 100.00% 88.11% 11.89% 100.00%
Notes:Daytime operations arrive or depart between 7:00 a.m. and 9:59 p.m.; nighttime operations arrive or depart between 10:00 p.m.and 6:59 a.m.For documentation purposes, the numbers of operations are presented to a precision of two digits after the decimal point to shownumbers of operations that are greater than zero but less than 1.Totals may not add up due to rounding.
Prepared by: HMMH Inc., August 2013
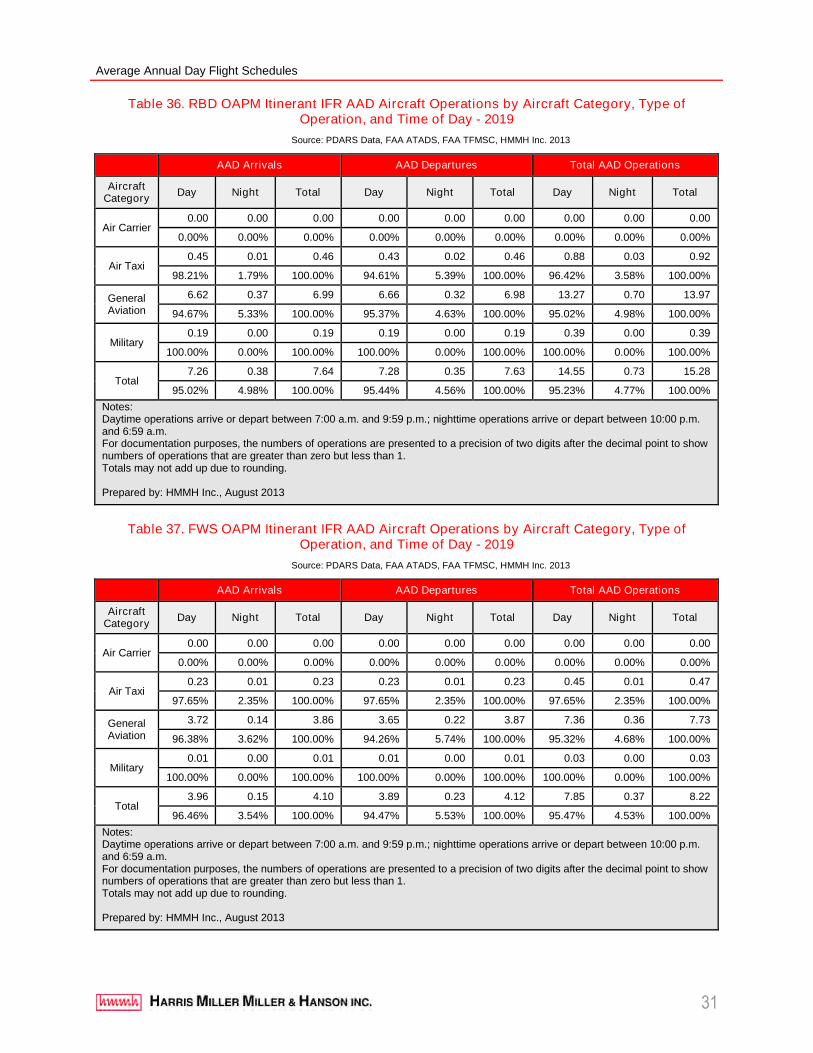
Average Annual Day Flight Schedules
31
Table 36. RBD OAPM Itinerant IFR AAD Aircraft Operations by Aircraft Category, Type ofOperation, and Time of Day - 2019
Source: PDARS Data, FAA ATADS, FAA TFMSC, HMMH Inc. 2013
AAD Arrivals AAD Departures Total AAD Operations
AircraftCategory
Day Night Total Day Night Total Day Night Total
Air Carrier0.00 0.00 0.00 0.00 0.00 0.00 0.00 0.00 0.00
0.00% 0.00% 0.00% 0.00% 0.00% 0.00% 0.00% 0.00% 0.00%
Air Taxi0.45 0.01 0.46 0.43 0.02 0.46 0.88 0.03 0.92
98.21% 1.79% 100.00% 94.61% 5.39% 100.00% 96.42% 3.58% 100.00%
GeneralAviation
6.62 0.37 6.99 6.66 0.32 6.98 13.27 0.70 13.97
94.67% 5.33% 100.00% 95.37% 4.63% 100.00% 95.02% 4.98% 100.00%
Military0.19 0.00 0.19 0.19 0.00 0.19 0.39 0.00 0.39
100.00% 0.00% 100.00% 100.00% 0.00% 100.00% 100.00% 0.00% 100.00%
Total7.26 0.38 7.64 7.28 0.35 7.63 14.55 0.73 15.28
95.02% 4.98% 100.00% 95.44% 4.56% 100.00% 95.23% 4.77% 100.00%
Notes:Daytime operations arrive or depart between 7:00 a.m. and 9:59 p.m.; nighttime operations arrive or depart between 10:00 p.m.and 6:59 a.m.For documentation purposes, the numbers of operations are presented to a precision of two digits after the decimal point to shownumbers of operations that are greater than zero but less than 1.Totals may not add up due to rounding.
Prepared by: HMMH Inc., August 2013
Table 37. FWS OAPM Itinerant IFR AAD Aircraft Operations by Aircraft Category, Type ofOperation, and Time of Day - 2019
Source: PDARS Data, FAA ATADS, FAA TFMSC, HMMH Inc. 2013
AAD Arrivals AAD Departures Total AAD Operations
AircraftCategory
Day Night Total Day Night Total Day Night Total
Air Carrier0.00 0.00 0.00 0.00 0.00 0.00 0.00 0.00 0.00
0.00% 0.00% 0.00% 0.00% 0.00% 0.00% 0.00% 0.00% 0.00%
Air Taxi0.23 0.01 0.23 0.23 0.01 0.23 0.45 0.01 0.47
97.65% 2.35% 100.00% 97.65% 2.35% 100.00% 97.65% 2.35% 100.00%
GeneralAviation
3.72 0.14 3.86 3.65 0.22 3.87 7.36 0.36 7.73
96.38% 3.62% 100.00% 94.26% 5.74% 100.00% 95.32% 4.68% 100.00%
Military0.01 0.00 0.01 0.01 0.00 0.01 0.03 0.00 0.03
100.00% 0.00% 100.00% 100.00% 0.00% 100.00% 100.00% 0.00% 100.00%
Total3.96 0.15 4.10 3.89 0.23 4.12 7.85 0.37 8.22
96.46% 3.54% 100.00% 94.47% 5.53% 100.00% 95.47% 4.53% 100.00%
Notes:Daytime operations arrive or depart between 7:00 a.m. and 9:59 p.m.; nighttime operations arrive or depart between 10:00 p.m.and 6:59 a.m.For documentation purposes, the numbers of operations are presented to a precision of two digits after the decimal point to shownumbers of operations that are greater than zero but less than 1.Totals may not add up due to rounding.
Prepared by: HMMH Inc., August 2013
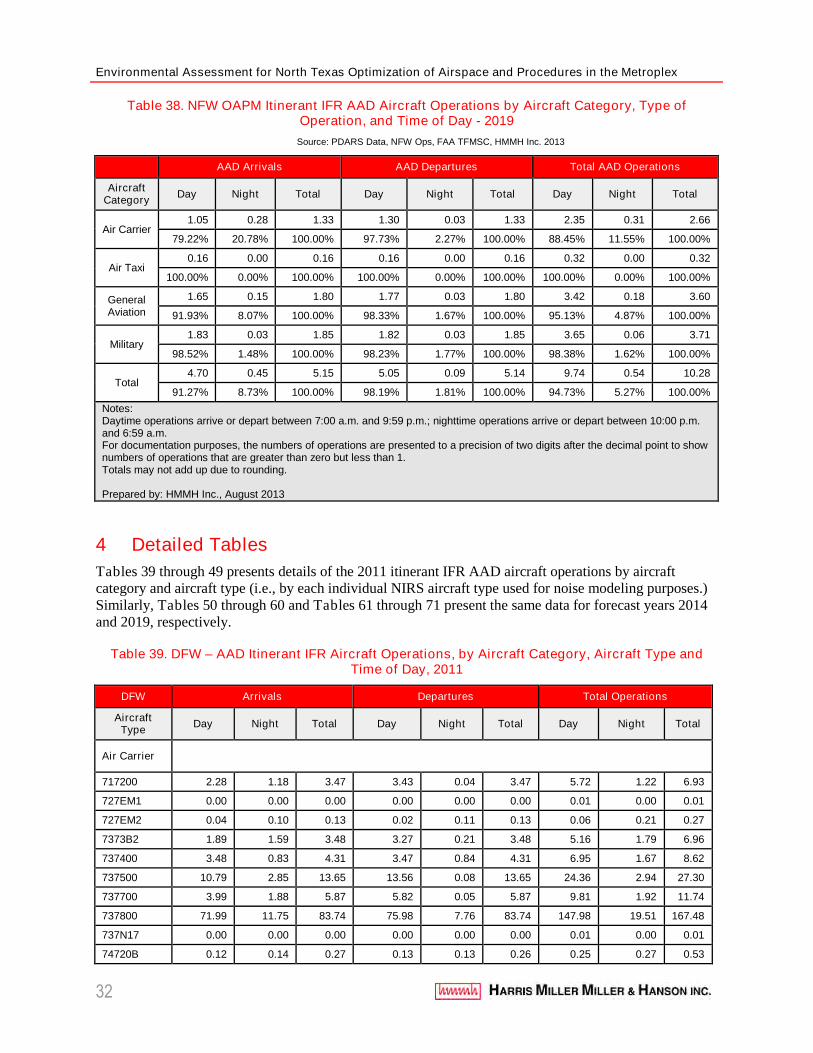
Environmental Assessment for North Texas Optimization of Airspace and Procedures in the Metroplex
32
Table 38. NFW OAPM Itinerant IFR AAD Aircraft Operations by Aircraft Category, Type ofOperation, and Time of Day - 2019
Source: PDARS Data, NFW Ops, FAA TFMSC, HMMH Inc. 2013
AAD Arrivals AAD Departures Total AAD Operations
AircraftCategory
Day Night Total Day Night Total Day Night Total
Air Carrier1.05 0.28 1.33 1.30 0.03 1.33 2.35 0.31 2.66
79.22% 20.78% 100.00% 97.73% 2.27% 100.00% 88.45% 11.55% 100.00%
Air Taxi0.16 0.00 0.16 0.16 0.00 0.16 0.32 0.00 0.32
100.00% 0.00% 100.00% 100.00% 0.00% 100.00% 100.00% 0.00% 100.00%
GeneralAviation
1.65 0.15 1.80 1.77 0.03 1.80 3.42 0.18 3.60
91.93% 8.07% 100.00% 98.33% 1.67% 100.00% 95.13% 4.87% 100.00%
Military1.83 0.03 1.85 1.82 0.03 1.85 3.65 0.06 3.71
98.52% 1.48% 100.00% 98.23% 1.77% 100.00% 98.38% 1.62% 100.00%
Total4.70 0.45 5.15 5.05 0.09 5.14 9.74 0.54 10.28
91.27% 8.73% 100.00% 98.19% 1.81% 100.00% 94.73% 5.27% 100.00%
Notes:Daytime operations arrive or depart between 7:00 a.m. and 9:59 p.m.; nighttime operations arrive or depart between 10:00 p.m.and 6:59 a.m.For documentation purposes, the numbers of operations are presented to a precision of two digits after the decimal point to shownumbers of operations that are greater than zero but less than 1.Totals may not add up due to rounding.
Prepared by: HMMH Inc., August 2013
4 Detailed Tables
Tables 39 through 49 presents details of the 2011 itinerant IFR AAD aircraft operations by aircraftcategory and aircraft type (i.e., by each individual NIRS aircraft type used for noise modeling purposes.)Similarly, Tables 50 through 60 and Tables 61 through 71 present the same data for forecast years 2014and 2019, respectively.
Table 39. DFW – AAD Itinerant IFR Aircraft Operations, by Aircraft Category, Aircraft Type andTime of Day, 2011
DFW Arrivals Departures Total Operations
AircraftType
Day Night Total Day Night Total Day Night Total
Air Carrier
717200 2.28 1.18 3.47 3.43 0.04 3.47 5.72 1.22 6.93
727EM1 0.00 0.00 0.00 0.00 0.00 0.00 0.01 0.00 0.01
727EM2 0.04 0.10 0.13 0.02 0.11 0.13 0.06 0.21 0.27
7373B2 1.89 1.59 3.48 3.27 0.21 3.48 5.16 1.79 6.96
737400 3.48 0.83 4.31 3.47 0.84 4.31 6.95 1.67 8.62
737500 10.79 2.85 13.65 13.56 0.08 13.65 24.36 2.94 27.30
737700 3.99 1.88 5.87 5.82 0.05 5.87 9.81 1.92 11.74
737800 71.99 11.75 83.74 75.98 7.76 83.74 147.98 19.51 167.48
737N17 0.00 0.00 0.00 0.00 0.00 0.00 0.01 0.00 0.01
74720B 0.12 0.14 0.27 0.13 0.13 0.26 0.25 0.27 0.53
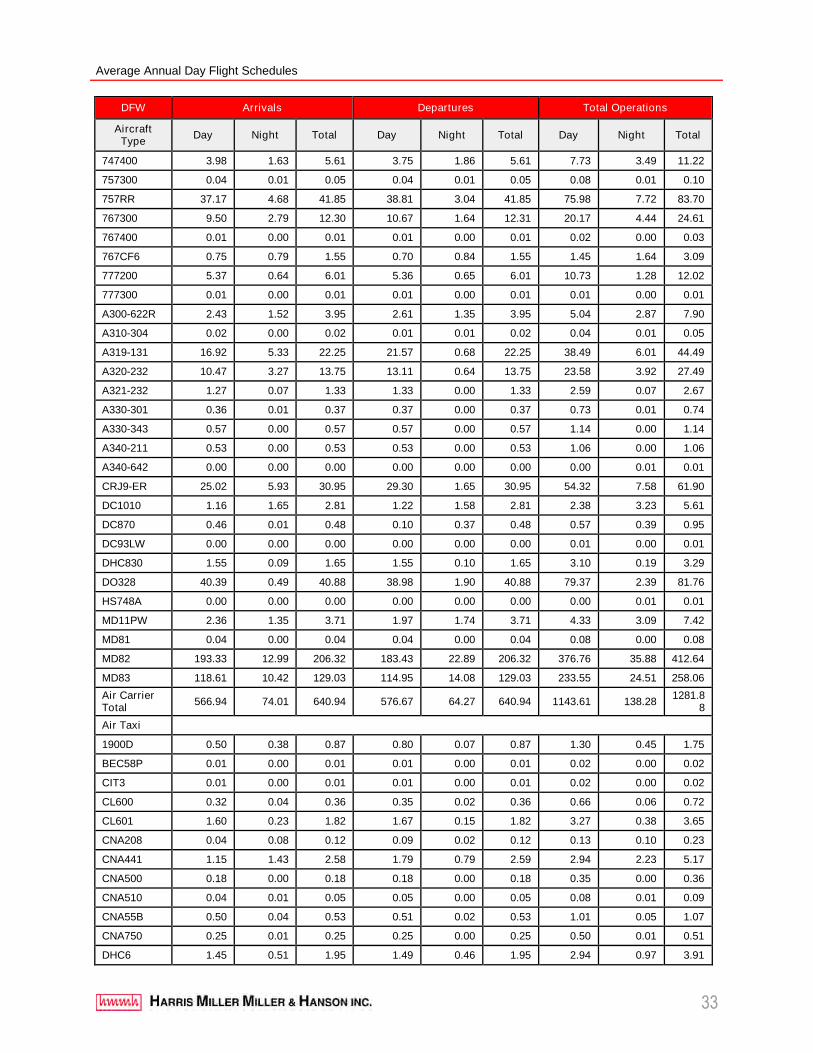
Average Annual Day Flight Schedules
33
DFW Arrivals Departures Total Operations
AircraftType
Day Night Total Day Night Total Day Night Total
747400 3.98 1.63 5.61 3.75 1.86 5.61 7.73 3.49 11.22
757300 0.04 0.01 0.05 0.04 0.01 0.05 0.08 0.01 0.10
757RR 37.17 4.68 41.85 38.81 3.04 41.85 75.98 7.72 83.70
767300 9.50 2.79 12.30 10.67 1.64 12.31 20.17 4.44 24.61
767400 0.01 0.00 0.01 0.01 0.00 0.01 0.02 0.00 0.03
767CF6 0.75 0.79 1.55 0.70 0.84 1.55 1.45 1.64 3.09
777200 5.37 0.64 6.01 5.36 0.65 6.01 10.73 1.28 12.02
777300 0.01 0.00 0.01 0.01 0.00 0.01 0.01 0.00 0.01
A300-622R 2.43 1.52 3.95 2.61 1.35 3.95 5.04 2.87 7.90
A310-304 0.02 0.00 0.02 0.01 0.01 0.02 0.04 0.01 0.05
A319-131 16.92 5.33 22.25 21.57 0.68 22.25 38.49 6.01 44.49
A320-232 10.47 3.27 13.75 13.11 0.64 13.75 23.58 3.92 27.49
A321-232 1.27 0.07 1.33 1.33 0.00 1.33 2.59 0.07 2.67
A330-301 0.36 0.01 0.37 0.37 0.00 0.37 0.73 0.01 0.74
A330-343 0.57 0.00 0.57 0.57 0.00 0.57 1.14 0.00 1.14
A340-211 0.53 0.00 0.53 0.53 0.00 0.53 1.06 0.00 1.06
A340-642 0.00 0.00 0.00 0.00 0.00 0.00 0.00 0.01 0.01
CRJ9-ER 25.02 5.93 30.95 29.30 1.65 30.95 54.32 7.58 61.90
DC1010 1.16 1.65 2.81 1.22 1.58 2.81 2.38 3.23 5.61
DC870 0.46 0.01 0.48 0.10 0.37 0.48 0.57 0.39 0.95
DC93LW 0.00 0.00 0.00 0.00 0.00 0.00 0.01 0.00 0.01
DHC830 1.55 0.09 1.65 1.55 0.10 1.65 3.10 0.19 3.29
DO328 40.39 0.49 40.88 38.98 1.90 40.88 79.37 2.39 81.76
HS748A 0.00 0.00 0.00 0.00 0.00 0.00 0.00 0.01 0.01
MD11PW 2.36 1.35 3.71 1.97 1.74 3.71 4.33 3.09 7.42
MD81 0.04 0.00 0.04 0.04 0.00 0.04 0.08 0.00 0.08
MD82 193.33 12.99 206.32 183.43 22.89 206.32 376.76 35.88 412.64
MD83 118.61 10.42 129.03 114.95 14.08 129.03 233.55 24.51 258.06
Air CarrierTotal
566.94 74.01 640.94 576.67 64.27 640.94 1143.61 138.281281.8
8
Air Taxi
1900D 0.50 0.38 0.87 0.80 0.07 0.87 1.30 0.45 1.75
BEC58P 0.01 0.00 0.01 0.01 0.00 0.01 0.02 0.00 0.02
CIT3 0.01 0.00 0.01 0.01 0.00 0.01 0.02 0.00 0.02
CL600 0.32 0.04 0.36 0.35 0.02 0.36 0.66 0.06 0.72
CL601 1.60 0.23 1.82 1.67 0.15 1.82 3.27 0.38 3.65
CNA208 0.04 0.08 0.12 0.09 0.02 0.12 0.13 0.10 0.23
CNA441 1.15 1.43 2.58 1.79 0.79 2.59 2.94 2.23 5.17
CNA500 0.18 0.00 0.18 0.18 0.00 0.18 0.35 0.00 0.36
CNA510 0.04 0.01 0.05 0.05 0.00 0.05 0.08 0.01 0.09
CNA55B 0.50 0.04 0.53 0.51 0.02 0.53 1.01 0.05 1.07
CNA750 0.25 0.01 0.25 0.25 0.00 0.25 0.50 0.01 0.51
DHC6 1.45 0.51 1.95 1.49 0.46 1.95 2.94 0.97 3.91
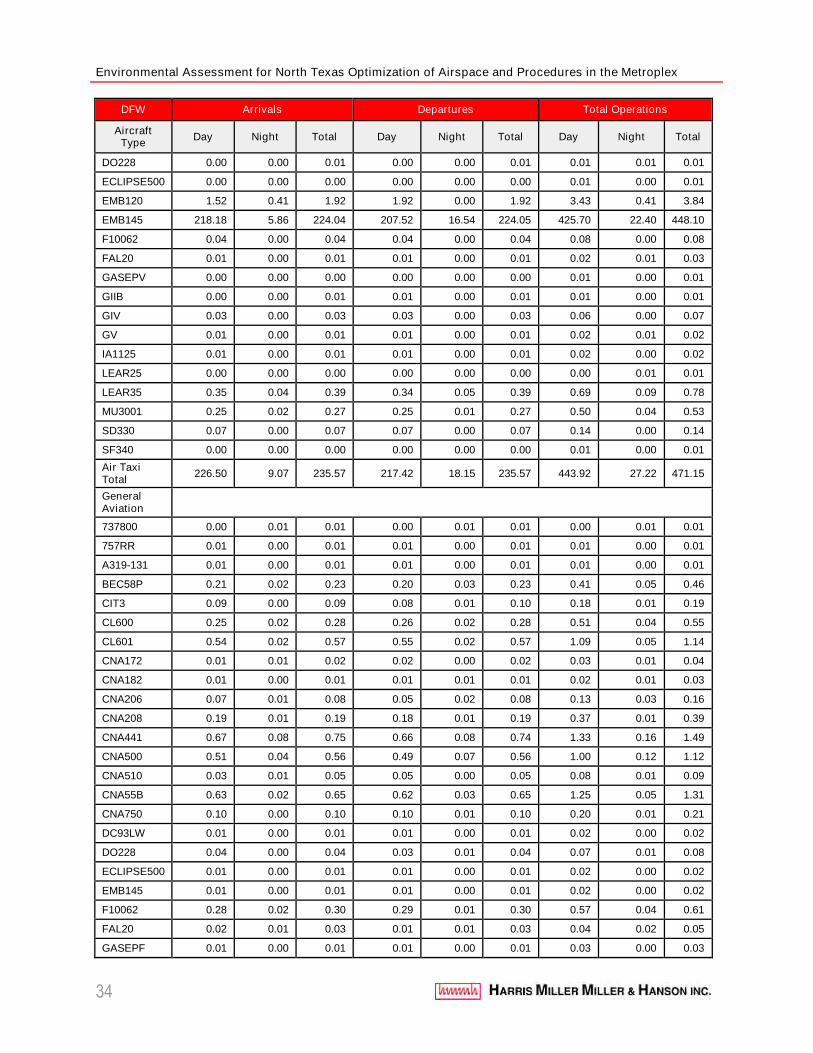
Environmental Assessment for North Texas Optimization of Airspace and Procedures in the Metroplex
34
DFW Arrivals Departures Total Operations
AircraftType
Day Night Total Day Night Total Day Night Total
DO228 0.00 0.00 0.01 0.00 0.00 0.01 0.01 0.01 0.01
ECLIPSE500 0.00 0.00 0.00 0.00 0.00 0.00 0.01 0.00 0.01
EMB120 1.52 0.41 1.92 1.92 0.00 1.92 3.43 0.41 3.84
EMB145 218.18 5.86 224.04 207.52 16.54 224.05 425.70 22.40 448.10
F10062 0.04 0.00 0.04 0.04 0.00 0.04 0.08 0.00 0.08
FAL20 0.01 0.00 0.01 0.01 0.00 0.01 0.02 0.01 0.03
GASEPV 0.00 0.00 0.00 0.00 0.00 0.00 0.01 0.00 0.01
GIIB 0.00 0.00 0.01 0.01 0.00 0.01 0.01 0.00 0.01
GIV 0.03 0.00 0.03 0.03 0.00 0.03 0.06 0.00 0.07
GV 0.01 0.00 0.01 0.01 0.00 0.01 0.02 0.01 0.02
IA1125 0.01 0.00 0.01 0.01 0.00 0.01 0.02 0.00 0.02
LEAR25 0.00 0.00 0.00 0.00 0.00 0.00 0.00 0.01 0.01
LEAR35 0.35 0.04 0.39 0.34 0.05 0.39 0.69 0.09 0.78
MU3001 0.25 0.02 0.27 0.25 0.01 0.27 0.50 0.04 0.53
SD330 0.07 0.00 0.07 0.07 0.00 0.07 0.14 0.00 0.14
SF340 0.00 0.00 0.00 0.00 0.00 0.00 0.01 0.00 0.01
Air TaxiTotal
226.50 9.07 235.57 217.42 18.15 235.57 443.92 27.22 471.15
GeneralAviation
737800 0.00 0.01 0.01 0.00 0.01 0.01 0.00 0.01 0.01
757RR 0.01 0.00 0.01 0.01 0.00 0.01 0.01 0.00 0.01
A319-131 0.01 0.00 0.01 0.01 0.00 0.01 0.01 0.00 0.01
BEC58P 0.21 0.02 0.23 0.20 0.03 0.23 0.41 0.05 0.46
CIT3 0.09 0.00 0.09 0.08 0.01 0.10 0.18 0.01 0.19
CL600 0.25 0.02 0.28 0.26 0.02 0.28 0.51 0.04 0.55
CL601 0.54 0.02 0.57 0.55 0.02 0.57 1.09 0.05 1.14
CNA172 0.01 0.01 0.02 0.02 0.00 0.02 0.03 0.01 0.04
CNA182 0.01 0.00 0.01 0.01 0.01 0.01 0.02 0.01 0.03
CNA206 0.07 0.01 0.08 0.05 0.02 0.08 0.13 0.03 0.16
CNA208 0.19 0.01 0.19 0.18 0.01 0.19 0.37 0.01 0.39
CNA441 0.67 0.08 0.75 0.66 0.08 0.74 1.33 0.16 1.49
CNA500 0.51 0.04 0.56 0.49 0.07 0.56 1.00 0.12 1.12
CNA510 0.03 0.01 0.05 0.05 0.00 0.05 0.08 0.01 0.09
CNA55B 0.63 0.02 0.65 0.62 0.03 0.65 1.25 0.05 1.31
CNA750 0.10 0.00 0.10 0.10 0.01 0.10 0.20 0.01 0.21
DC93LW 0.01 0.00 0.01 0.01 0.00 0.01 0.02 0.00 0.02
DO228 0.04 0.00 0.04 0.03 0.01 0.04 0.07 0.01 0.08
ECLIPSE500 0.01 0.00 0.01 0.01 0.00 0.01 0.02 0.00 0.02
EMB145 0.01 0.00 0.01 0.01 0.00 0.01 0.02 0.00 0.02
F10062 0.28 0.02 0.30 0.29 0.01 0.30 0.57 0.04 0.61
FAL20 0.02 0.01 0.03 0.01 0.01 0.03 0.04 0.02 0.05
GASEPF 0.01 0.00 0.01 0.01 0.00 0.01 0.03 0.00 0.03
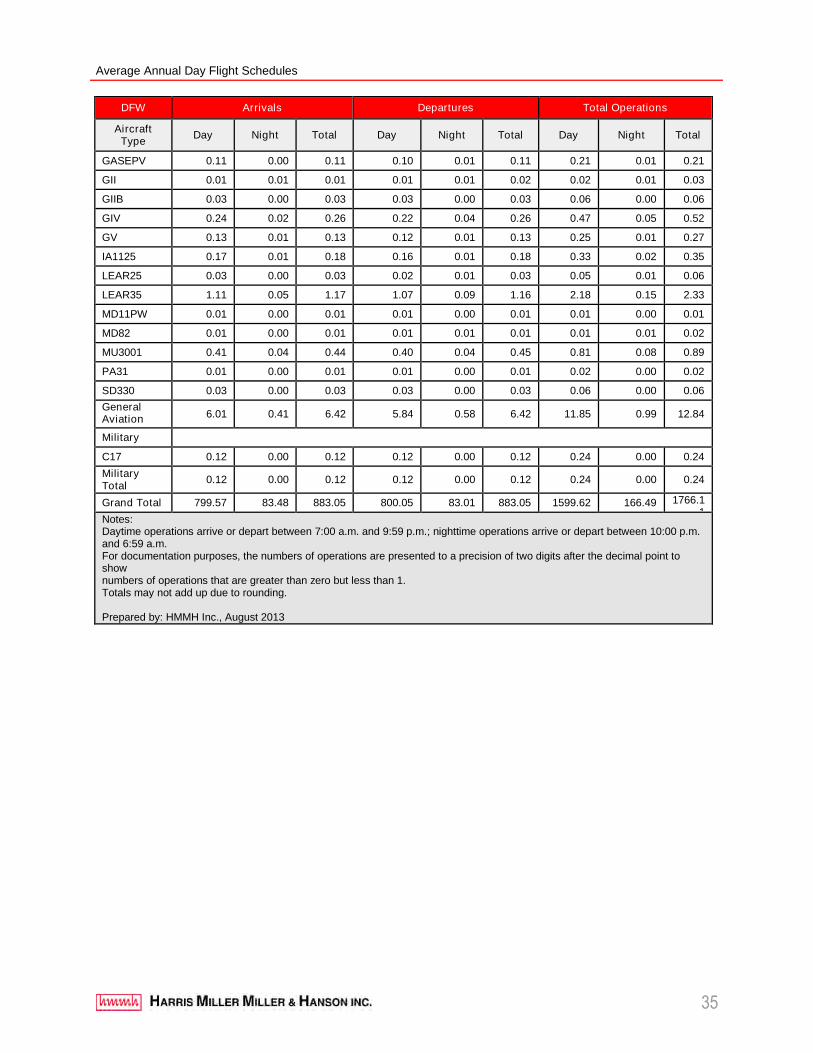
Average Annual Day Flight Schedules
35
DFW Arrivals Departures Total Operations
AircraftType
Day Night Total Day Night Total Day Night Total
GASEPV 0.11 0.00 0.11 0.10 0.01 0.11 0.21 0.01 0.21
GII 0.01 0.01 0.01 0.01 0.01 0.02 0.02 0.01 0.03
GIIB 0.03 0.00 0.03 0.03 0.00 0.03 0.06 0.00 0.06
GIV 0.24 0.02 0.26 0.22 0.04 0.26 0.47 0.05 0.52
GV 0.13 0.01 0.13 0.12 0.01 0.13 0.25 0.01 0.27
IA1125 0.17 0.01 0.18 0.16 0.01 0.18 0.33 0.02 0.35
LEAR25 0.03 0.00 0.03 0.02 0.01 0.03 0.05 0.01 0.06
LEAR35 1.11 0.05 1.17 1.07 0.09 1.16 2.18 0.15 2.33
MD11PW 0.01 0.00 0.01 0.01 0.00 0.01 0.01 0.00 0.01
MD82 0.01 0.00 0.01 0.01 0.01 0.01 0.01 0.01 0.02
MU3001 0.41 0.04 0.44 0.40 0.04 0.45 0.81 0.08 0.89
PA31 0.01 0.00 0.01 0.01 0.00 0.01 0.02 0.00 0.02
SD330 0.03 0.00 0.03 0.03 0.00 0.03 0.06 0.00 0.06
GeneralAviationTotal
6.01 0.41 6.42 5.84 0.58 6.42 11.85 0.99 12.84
Military
C17 0.12 0.00 0.12 0.12 0.00 0.12 0.24 0.00 0.24
MilitaryTotal
0.12 0.00 0.12 0.12 0.00 0.12 0.24 0.00 0.24
Grand Total 799.57 83.48 883.05 800.05 83.01 883.05 1599.62 166.49 1766.11
Notes:Daytime operations arrive or depart between 7:00 a.m. and 9:59 p.m.; nighttime operations arrive or depart between 10:00 p.m.and 6:59 a.m.For documentation purposes, the numbers of operations are presented to a precision of two digits after the decimal point toshownumbers of operations that are greater than zero but less than 1.Totals may not add up due to rounding.
Prepared by: HMMH Inc., August 2013
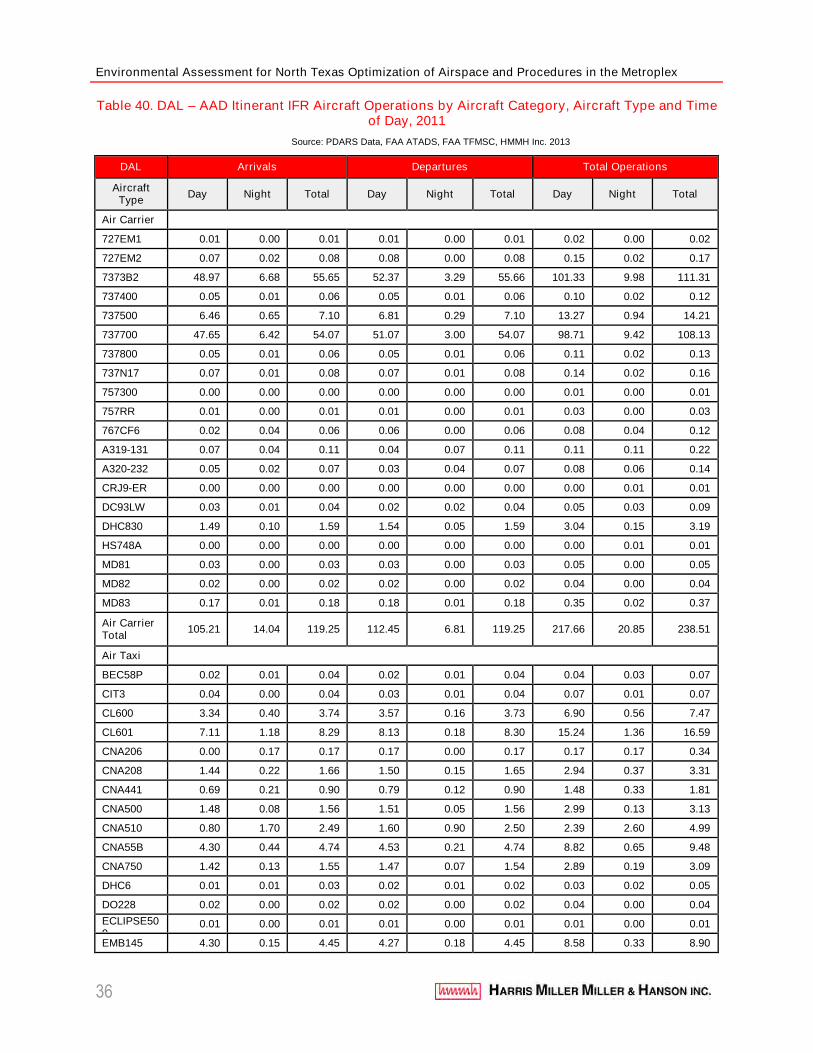
Environmental Assessment for North Texas Optimization of Airspace and Procedures in the Metroplex
36
Table 40. DAL – AAD Itinerant IFR Aircraft Operations by Aircraft Category, Aircraft Type and Timeof Day, 2011
Source: PDARS Data, FAA ATADS, FAA TFMSC, HMMH Inc. 2013
DAL Arrivals Departures Total Operations
AircraftType
Day Night Total Day Night Total Day Night Total
Air Carrier
727EM1 0.01 0.00 0.01 0.01 0.00 0.01 0.02 0.00 0.02
727EM2 0.07 0.02 0.08 0.08 0.00 0.08 0.15 0.02 0.17
7373B2 48.97 6.68 55.65 52.37 3.29 55.66 101.33 9.98 111.31
737400 0.05 0.01 0.06 0.05 0.01 0.06 0.10 0.02 0.12
737500 6.46 0.65 7.10 6.81 0.29 7.10 13.27 0.94 14.21
737700 47.65 6.42 54.07 51.07 3.00 54.07 98.71 9.42 108.13
737800 0.05 0.01 0.06 0.05 0.01 0.06 0.11 0.02 0.13
737N17 0.07 0.01 0.08 0.07 0.01 0.08 0.14 0.02 0.16
757300 0.00 0.00 0.00 0.00 0.00 0.00 0.01 0.00 0.01
757RR 0.01 0.00 0.01 0.01 0.00 0.01 0.03 0.00 0.03
767CF6 0.02 0.04 0.06 0.06 0.00 0.06 0.08 0.04 0.12
A319-131 0.07 0.04 0.11 0.04 0.07 0.11 0.11 0.11 0.22
A320-232 0.05 0.02 0.07 0.03 0.04 0.07 0.08 0.06 0.14
CRJ9-ER 0.00 0.00 0.00 0.00 0.00 0.00 0.00 0.01 0.01
DC93LW 0.03 0.01 0.04 0.02 0.02 0.04 0.05 0.03 0.09
DHC830 1.49 0.10 1.59 1.54 0.05 1.59 3.04 0.15 3.19
HS748A 0.00 0.00 0.00 0.00 0.00 0.00 0.00 0.01 0.01
MD81 0.03 0.00 0.03 0.03 0.00 0.03 0.05 0.00 0.05
MD82 0.02 0.00 0.02 0.02 0.00 0.02 0.04 0.00 0.04
MD83 0.17 0.01 0.18 0.18 0.01 0.18 0.35 0.02 0.37
Air CarrierTotal
105.21 14.04 119.25 112.45 6.81 119.25 217.66 20.85 238.51
Air Taxi
BEC58P 0.02 0.01 0.04 0.02 0.01 0.04 0.04 0.03 0.07
CIT3 0.04 0.00 0.04 0.03 0.01 0.04 0.07 0.01 0.07
CL600 3.34 0.40 3.74 3.57 0.16 3.73 6.90 0.56 7.47
CL601 7.11 1.18 8.29 8.13 0.18 8.30 15.24 1.36 16.59
CNA206 0.00 0.17 0.17 0.17 0.00 0.17 0.17 0.17 0.34
CNA208 1.44 0.22 1.66 1.50 0.15 1.65 2.94 0.37 3.31
CNA441 0.69 0.21 0.90 0.79 0.12 0.90 1.48 0.33 1.81
CNA500 1.48 0.08 1.56 1.51 0.05 1.56 2.99 0.13 3.13
CNA510 0.80 1.70 2.49 1.60 0.90 2.50 2.39 2.60 4.99
CNA55B 4.30 0.44 4.74 4.53 0.21 4.74 8.82 0.65 9.48
CNA750 1.42 0.13 1.55 1.47 0.07 1.54 2.89 0.19 3.09
DHC6 0.01 0.01 0.03 0.02 0.01 0.02 0.03 0.02 0.05
DO228 0.02 0.00 0.02 0.02 0.00 0.02 0.04 0.00 0.04
ECLIPSE500
0.01 0.00 0.01 0.01 0.00 0.01 0.01 0.00 0.01
EMB145 4.30 0.15 4.45 4.27 0.18 4.45 8.58 0.33 8.90
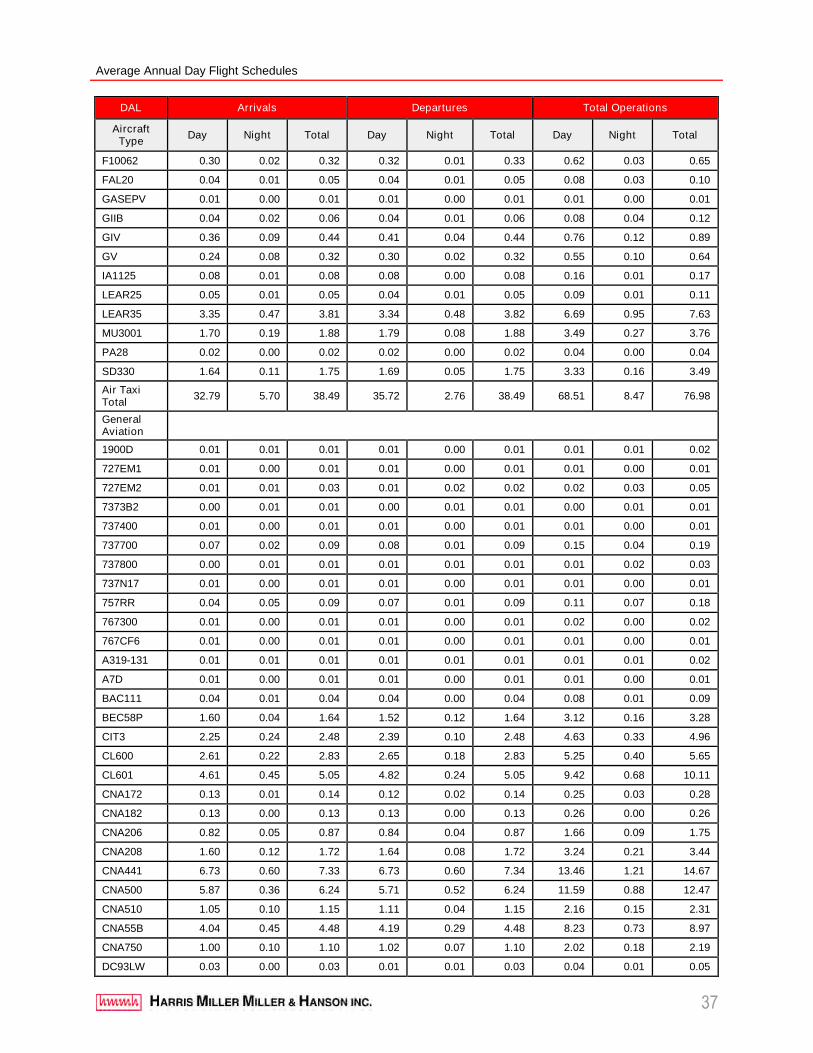
Average Annual Day Flight Schedules
37
DAL Arrivals Departures Total Operations
AircraftType
Day Night Total Day Night Total Day Night Total
F10062 0.30 0.02 0.32 0.32 0.01 0.33 0.62 0.03 0.65
FAL20 0.04 0.01 0.05 0.04 0.01 0.05 0.08 0.03 0.10
GASEPV 0.01 0.00 0.01 0.01 0.00 0.01 0.01 0.00 0.01
GIIB 0.04 0.02 0.06 0.04 0.01 0.06 0.08 0.04 0.12
GIV 0.36 0.09 0.44 0.41 0.04 0.44 0.76 0.12 0.89
GV 0.24 0.08 0.32 0.30 0.02 0.32 0.55 0.10 0.64
IA1125 0.08 0.01 0.08 0.08 0.00 0.08 0.16 0.01 0.17
LEAR25 0.05 0.01 0.05 0.04 0.01 0.05 0.09 0.01 0.11
LEAR35 3.35 0.47 3.81 3.34 0.48 3.82 6.69 0.95 7.63
MU3001 1.70 0.19 1.88 1.79 0.08 1.88 3.49 0.27 3.76
PA28 0.02 0.00 0.02 0.02 0.00 0.02 0.04 0.00 0.04
SD330 1.64 0.11 1.75 1.69 0.05 1.75 3.33 0.16 3.49
Air TaxiTotal
32.79 5.70 38.49 35.72 2.76 38.49 68.51 8.47 76.98
GeneralAviation
1900D 0.01 0.01 0.01 0.01 0.00 0.01 0.01 0.01 0.02
727EM1 0.01 0.00 0.01 0.01 0.00 0.01 0.01 0.00 0.01
727EM2 0.01 0.01 0.03 0.01 0.02 0.02 0.02 0.03 0.05
7373B2 0.00 0.01 0.01 0.00 0.01 0.01 0.00 0.01 0.01
737400 0.01 0.00 0.01 0.01 0.00 0.01 0.01 0.00 0.01
737700 0.07 0.02 0.09 0.08 0.01 0.09 0.15 0.04 0.19
737800 0.00 0.01 0.01 0.01 0.01 0.01 0.01 0.02 0.03
737N17 0.01 0.00 0.01 0.01 0.00 0.01 0.01 0.00 0.01
757RR 0.04 0.05 0.09 0.07 0.01 0.09 0.11 0.07 0.18
767300 0.01 0.00 0.01 0.01 0.00 0.01 0.02 0.00 0.02
767CF6 0.01 0.00 0.01 0.01 0.00 0.01 0.01 0.00 0.01
A319-131 0.01 0.01 0.01 0.01 0.01 0.01 0.01 0.01 0.02
A7D 0.01 0.00 0.01 0.01 0.00 0.01 0.01 0.00 0.01
BAC111 0.04 0.01 0.04 0.04 0.00 0.04 0.08 0.01 0.09
BEC58P 1.60 0.04 1.64 1.52 0.12 1.64 3.12 0.16 3.28
CIT3 2.25 0.24 2.48 2.39 0.10 2.48 4.63 0.33 4.96
CL600 2.61 0.22 2.83 2.65 0.18 2.83 5.25 0.40 5.65
CL601 4.61 0.45 5.05 4.82 0.24 5.05 9.42 0.68 10.11
CNA172 0.13 0.01 0.14 0.12 0.02 0.14 0.25 0.03 0.28
CNA182 0.13 0.00 0.13 0.13 0.00 0.13 0.26 0.00 0.26
CNA206 0.82 0.05 0.87 0.84 0.04 0.87 1.66 0.09 1.75
CNA208 1.60 0.12 1.72 1.64 0.08 1.72 3.24 0.21 3.44
CNA441 6.73 0.60 7.33 6.73 0.60 7.34 13.46 1.21 14.67
CNA500 5.87 0.36 6.24 5.71 0.52 6.24 11.59 0.88 12.47
CNA510 1.05 0.10 1.15 1.11 0.04 1.15 2.16 0.15 2.31
CNA55B 4.04 0.45 4.48 4.19 0.29 4.48 8.23 0.73 8.97
CNA750 1.00 0.10 1.10 1.02 0.07 1.10 2.02 0.18 2.19
DC93LW 0.03 0.00 0.03 0.01 0.01 0.03 0.04 0.01 0.05
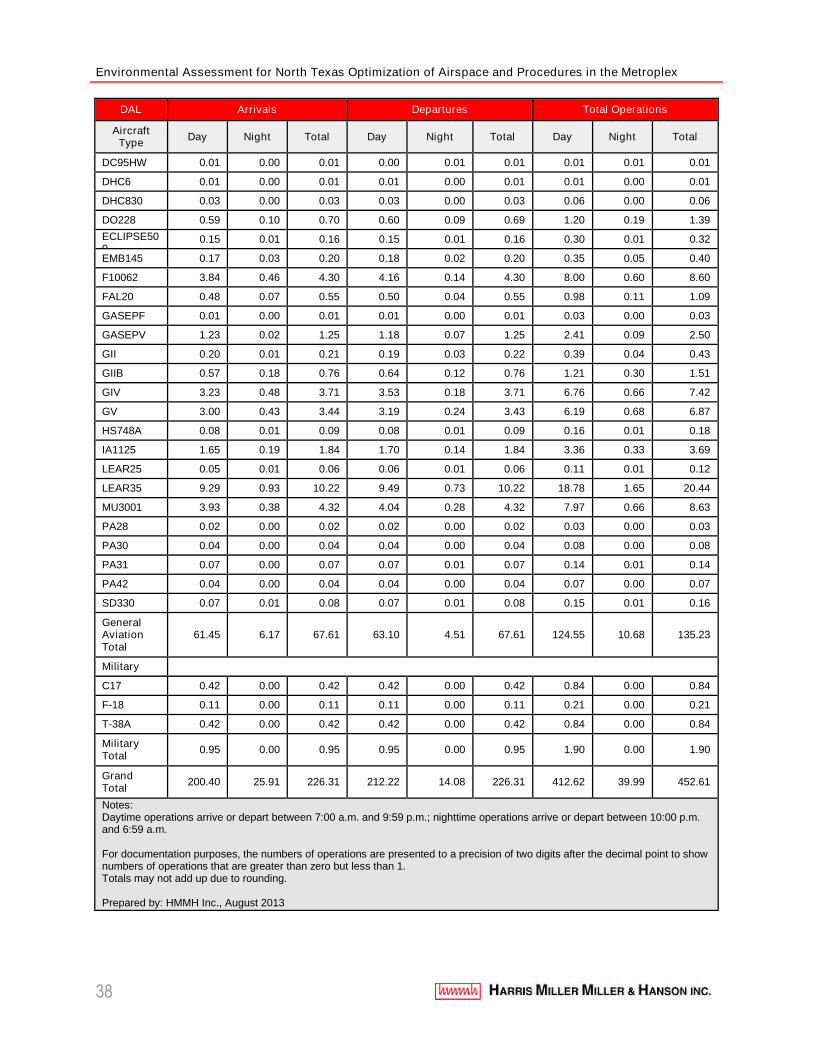
Environmental Assessment for North Texas Optimization of Airspace and Procedures in the Metroplex
38
DAL Arrivals Departures Total Operations
AircraftType
Day Night Total Day Night Total Day Night Total
DC95HW 0.01 0.00 0.01 0.00 0.01 0.01 0.01 0.01 0.01
DHC6 0.01 0.00 0.01 0.01 0.00 0.01 0.01 0.00 0.01
DHC830 0.03 0.00 0.03 0.03 0.00 0.03 0.06 0.00 0.06
DO228 0.59 0.10 0.70 0.60 0.09 0.69 1.20 0.19 1.39
ECLIPSE500
0.15 0.01 0.16 0.15 0.01 0.16 0.30 0.01 0.32
EMB145 0.17 0.03 0.20 0.18 0.02 0.20 0.35 0.05 0.40
F10062 3.84 0.46 4.30 4.16 0.14 4.30 8.00 0.60 8.60
FAL20 0.48 0.07 0.55 0.50 0.04 0.55 0.98 0.11 1.09
GASEPF 0.01 0.00 0.01 0.01 0.00 0.01 0.03 0.00 0.03
GASEPV 1.23 0.02 1.25 1.18 0.07 1.25 2.41 0.09 2.50
GII 0.20 0.01 0.21 0.19 0.03 0.22 0.39 0.04 0.43
GIIB 0.57 0.18 0.76 0.64 0.12 0.76 1.21 0.30 1.51
GIV 3.23 0.48 3.71 3.53 0.18 3.71 6.76 0.66 7.42
GV 3.00 0.43 3.44 3.19 0.24 3.43 6.19 0.68 6.87
HS748A 0.08 0.01 0.09 0.08 0.01 0.09 0.16 0.01 0.18
IA1125 1.65 0.19 1.84 1.70 0.14 1.84 3.36 0.33 3.69
LEAR25 0.05 0.01 0.06 0.06 0.01 0.06 0.11 0.01 0.12
LEAR35 9.29 0.93 10.22 9.49 0.73 10.22 18.78 1.65 20.44
MU3001 3.93 0.38 4.32 4.04 0.28 4.32 7.97 0.66 8.63
PA28 0.02 0.00 0.02 0.02 0.00 0.02 0.03 0.00 0.03
PA30 0.04 0.00 0.04 0.04 0.00 0.04 0.08 0.00 0.08
PA31 0.07 0.00 0.07 0.07 0.01 0.07 0.14 0.01 0.14
PA42 0.04 0.00 0.04 0.04 0.00 0.04 0.07 0.00 0.07
SD330 0.07 0.01 0.08 0.07 0.01 0.08 0.15 0.01 0.16
GeneralAviationTotal
61.45 6.17 67.61 63.10 4.51 67.61 124.55 10.68 135.23
Military
C17 0.42 0.00 0.42 0.42 0.00 0.42 0.84 0.00 0.84
F-18 0.11 0.00 0.11 0.11 0.00 0.11 0.21 0.00 0.21
T-38A 0.42 0.00 0.42 0.42 0.00 0.42 0.84 0.00 0.84
MilitaryTotal
0.95 0.00 0.95 0.95 0.00 0.95 1.90 0.00 1.90
GrandTotal
200.40 25.91 226.31 212.22 14.08 226.31 412.62 39.99 452.61
Notes:Daytime operations arrive or depart between 7:00 a.m. and 9:59 p.m.; nighttime operations arrive or depart between 10:00 p.m.and 6:59 a.m.
For documentation purposes, the numbers of operations are presented to a precision of two digits after the decimal point to shownumbers of operations that are greater than zero but less than 1.Totals may not add up due to rounding.
Prepared by: HMMH Inc., August 2013
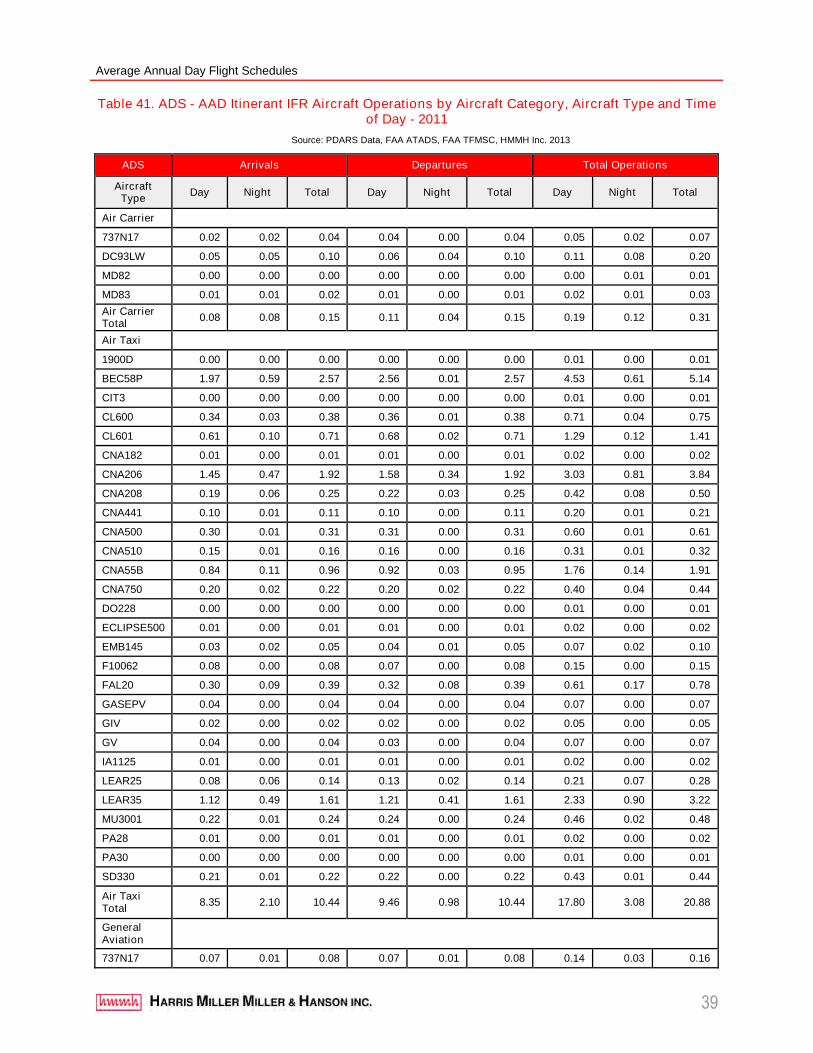
Average Annual Day Flight Schedules
39
Table 41. ADS - AAD Itinerant IFR Aircraft Operations by Aircraft Category, Aircraft Type and Timeof Day - 2011
Source: PDARS Data, FAA ATADS, FAA TFMSC, HMMH Inc. 2013
ADS Arrivals Departures Total Operations
AircraftType
Day Night Total Day Night Total Day Night Total
Air Carrier
737N17 0.02 0.02 0.04 0.04 0.00 0.04 0.05 0.02 0.07
DC93LW 0.05 0.05 0.10 0.06 0.04 0.10 0.11 0.08 0.20
MD82 0.00 0.00 0.00 0.00 0.00 0.00 0.00 0.01 0.01
MD83 0.01 0.01 0.02 0.01 0.00 0.01 0.02 0.01 0.03
Air CarrierTotal
0.08 0.08 0.15 0.11 0.04 0.15 0.19 0.12 0.31
Air Taxi
1900D 0.00 0.00 0.00 0.00 0.00 0.00 0.01 0.00 0.01
BEC58P 1.97 0.59 2.57 2.56 0.01 2.57 4.53 0.61 5.14
CIT3 0.00 0.00 0.00 0.00 0.00 0.00 0.01 0.00 0.01
CL600 0.34 0.03 0.38 0.36 0.01 0.38 0.71 0.04 0.75
CL601 0.61 0.10 0.71 0.68 0.02 0.71 1.29 0.12 1.41
CNA182 0.01 0.00 0.01 0.01 0.00 0.01 0.02 0.00 0.02
CNA206 1.45 0.47 1.92 1.58 0.34 1.92 3.03 0.81 3.84
CNA208 0.19 0.06 0.25 0.22 0.03 0.25 0.42 0.08 0.50
CNA441 0.10 0.01 0.11 0.10 0.00 0.11 0.20 0.01 0.21
CNA500 0.30 0.01 0.31 0.31 0.00 0.31 0.60 0.01 0.61
CNA510 0.15 0.01 0.16 0.16 0.00 0.16 0.31 0.01 0.32
CNA55B 0.84 0.11 0.96 0.92 0.03 0.95 1.76 0.14 1.91
CNA750 0.20 0.02 0.22 0.20 0.02 0.22 0.40 0.04 0.44
DO228 0.00 0.00 0.00 0.00 0.00 0.00 0.01 0.00 0.01
ECLIPSE500 0.01 0.00 0.01 0.01 0.00 0.01 0.02 0.00 0.02
EMB145 0.03 0.02 0.05 0.04 0.01 0.05 0.07 0.02 0.10
F10062 0.08 0.00 0.08 0.07 0.00 0.08 0.15 0.00 0.15
FAL20 0.30 0.09 0.39 0.32 0.08 0.39 0.61 0.17 0.78
GASEPV 0.04 0.00 0.04 0.04 0.00 0.04 0.07 0.00 0.07
GIV 0.02 0.00 0.02 0.02 0.00 0.02 0.05 0.00 0.05
GV 0.04 0.00 0.04 0.03 0.00 0.04 0.07 0.00 0.07
IA1125 0.01 0.00 0.01 0.01 0.00 0.01 0.02 0.00 0.02
LEAR25 0.08 0.06 0.14 0.13 0.02 0.14 0.21 0.07 0.28
LEAR35 1.12 0.49 1.61 1.21 0.41 1.61 2.33 0.90 3.22
MU3001 0.22 0.01 0.24 0.24 0.00 0.24 0.46 0.02 0.48
PA28 0.01 0.00 0.01 0.01 0.00 0.01 0.02 0.00 0.02
PA30 0.00 0.00 0.00 0.00 0.00 0.00 0.01 0.00 0.01
SD330 0.21 0.01 0.22 0.22 0.00 0.22 0.43 0.01 0.44
Air TaxiTotal
8.35 2.10 10.44 9.46 0.98 10.44 17.80 3.08 20.88
GeneralAviation
737N17 0.07 0.01 0.08 0.07 0.01 0.08 0.14 0.03 0.16
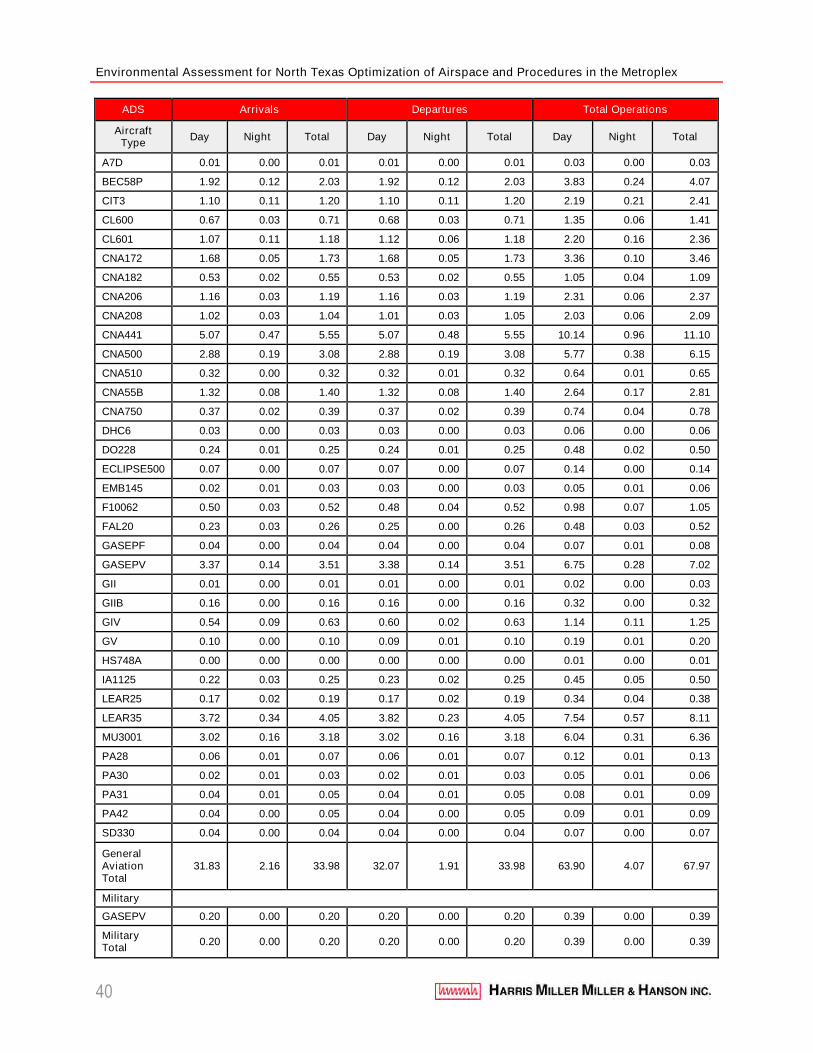
Environmental Assessment for North Texas Optimization of Airspace and Procedures in the Metroplex
40
ADS Arrivals Departures Total Operations
AircraftType
Day Night Total Day Night Total Day Night Total
A7D 0.01 0.00 0.01 0.01 0.00 0.01 0.03 0.00 0.03
BEC58P 1.92 0.12 2.03 1.92 0.12 2.03 3.83 0.24 4.07
CIT3 1.10 0.11 1.20 1.10 0.11 1.20 2.19 0.21 2.41
CL600 0.67 0.03 0.71 0.68 0.03 0.71 1.35 0.06 1.41
CL601 1.07 0.11 1.18 1.12 0.06 1.18 2.20 0.16 2.36
CNA172 1.68 0.05 1.73 1.68 0.05 1.73 3.36 0.10 3.46
CNA182 0.53 0.02 0.55 0.53 0.02 0.55 1.05 0.04 1.09
CNA206 1.16 0.03 1.19 1.16 0.03 1.19 2.31 0.06 2.37
CNA208 1.02 0.03 1.04 1.01 0.03 1.05 2.03 0.06 2.09
CNA441 5.07 0.47 5.55 5.07 0.48 5.55 10.14 0.96 11.10
CNA500 2.88 0.19 3.08 2.88 0.19 3.08 5.77 0.38 6.15
CNA510 0.32 0.00 0.32 0.32 0.01 0.32 0.64 0.01 0.65
CNA55B 1.32 0.08 1.40 1.32 0.08 1.40 2.64 0.17 2.81
CNA750 0.37 0.02 0.39 0.37 0.02 0.39 0.74 0.04 0.78
DHC6 0.03 0.00 0.03 0.03 0.00 0.03 0.06 0.00 0.06
DO228 0.24 0.01 0.25 0.24 0.01 0.25 0.48 0.02 0.50
ECLIPSE500 0.07 0.00 0.07 0.07 0.00 0.07 0.14 0.00 0.14
EMB145 0.02 0.01 0.03 0.03 0.00 0.03 0.05 0.01 0.06
F10062 0.50 0.03 0.52 0.48 0.04 0.52 0.98 0.07 1.05
FAL20 0.23 0.03 0.26 0.25 0.00 0.26 0.48 0.03 0.52
GASEPF 0.04 0.00 0.04 0.04 0.00 0.04 0.07 0.01 0.08
GASEPV 3.37 0.14 3.51 3.38 0.14 3.51 6.75 0.28 7.02
GII 0.01 0.00 0.01 0.01 0.00 0.01 0.02 0.00 0.03
GIIB 0.16 0.00 0.16 0.16 0.00 0.16 0.32 0.00 0.32
GIV 0.54 0.09 0.63 0.60 0.02 0.63 1.14 0.11 1.25
GV 0.10 0.00 0.10 0.09 0.01 0.10 0.19 0.01 0.20
HS748A 0.00 0.00 0.00 0.00 0.00 0.00 0.01 0.00 0.01
IA1125 0.22 0.03 0.25 0.23 0.02 0.25 0.45 0.05 0.50
LEAR25 0.17 0.02 0.19 0.17 0.02 0.19 0.34 0.04 0.38
LEAR35 3.72 0.34 4.05 3.82 0.23 4.05 7.54 0.57 8.11
MU3001 3.02 0.16 3.18 3.02 0.16 3.18 6.04 0.31 6.36
PA28 0.06 0.01 0.07 0.06 0.01 0.07 0.12 0.01 0.13
PA30 0.02 0.01 0.03 0.02 0.01 0.03 0.05 0.01 0.06
PA31 0.04 0.01 0.05 0.04 0.01 0.05 0.08 0.01 0.09
PA42 0.04 0.00 0.05 0.04 0.00 0.05 0.09 0.01 0.09
SD330 0.04 0.00 0.04 0.04 0.00 0.04 0.07 0.00 0.07
GeneralAviationTotal
31.83 2.16 33.98 32.07 1.91 33.98 63.90 4.07 67.97
Military
GASEPV 0.20 0.00 0.20 0.20 0.00 0.20 0.39 0.00 0.39
MilitaryTotal
0.20 0.00 0.20 0.20 0.00 0.20 0.39 0.00 0.39
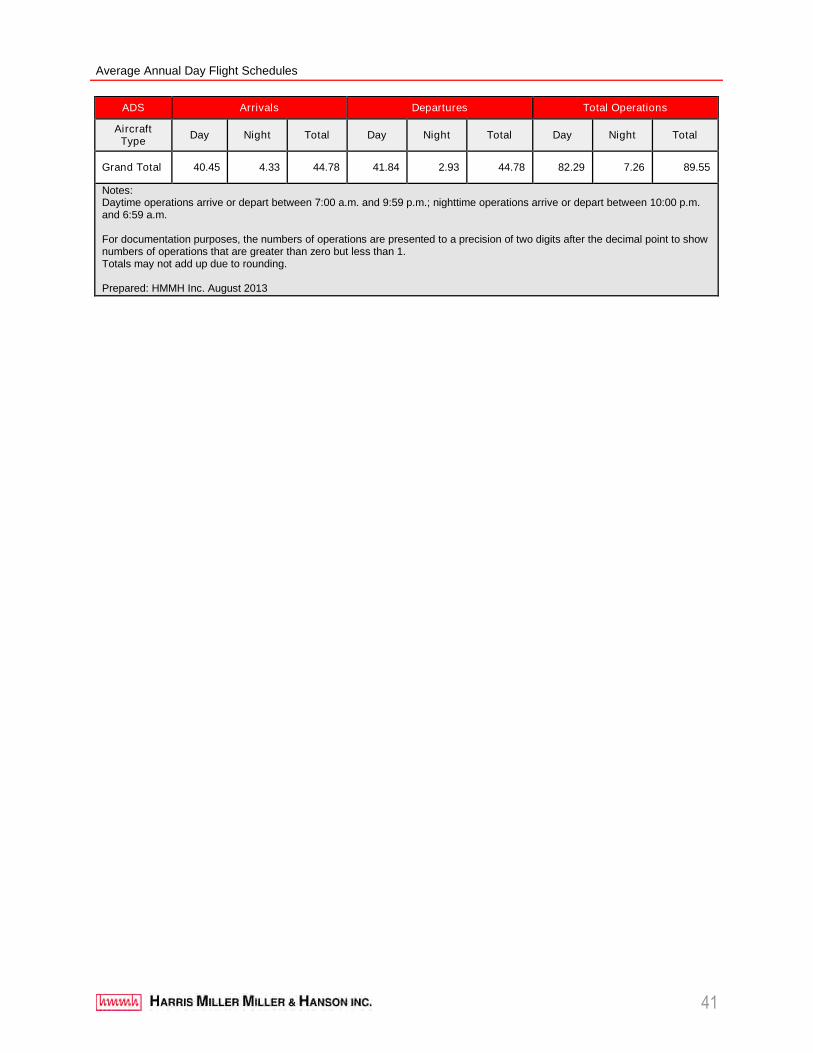
Average Annual Day Flight Schedules
41
ADS Arrivals Departures Total Operations
AircraftType
Day Night Total Day Night Total Day Night Total
Grand Total 40.45 4.33 44.78 41.84 2.93 44.78 82.29 7.26 89.55
Notes:Daytime operations arrive or depart between 7:00 a.m. and 9:59 p.m.; nighttime operations arrive or depart between 10:00 p.m.and 6:59 a.m.
For documentation purposes, the numbers of operations are presented to a precision of two digits after the decimal point to shownumbers of operations that are greater than zero but less than 1.Totals may not add up due to rounding.
Prepared: HMMH Inc. August 2013
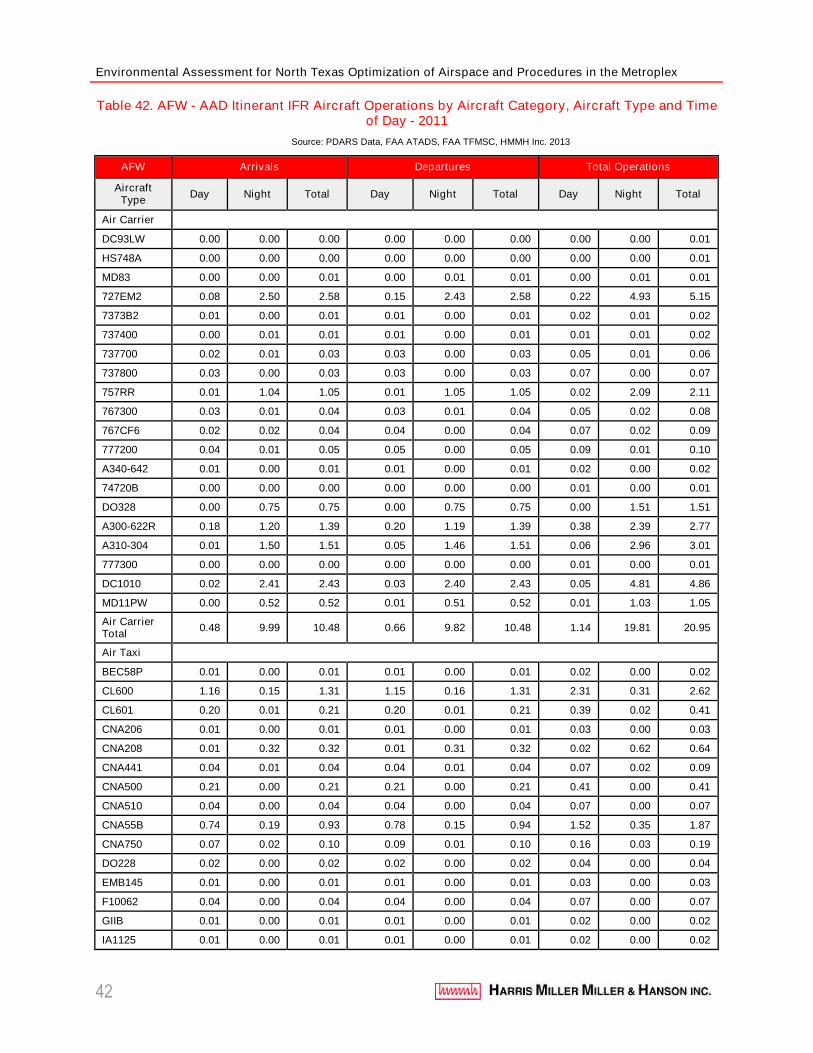
Environmental Assessment for North Texas Optimization of Airspace and Procedures in the Metroplex
42
Table 42. AFW - AAD Itinerant IFR Aircraft Operations by Aircraft Category, Aircraft Type and Timeof Day - 2011
Source: PDARS Data, FAA ATADS, FAA TFMSC, HMMH Inc. 2013
AFW Arrivals Departures Total Operations
AircraftType
Day Night Total Day Night Total Day Night Total
Air Carrier
DC93LW 0.00 0.00 0.00 0.00 0.00 0.00 0.00 0.00 0.01
HS748A 0.00 0.00 0.00 0.00 0.00 0.00 0.00 0.00 0.01
MD83 0.00 0.00 0.01 0.00 0.01 0.01 0.00 0.01 0.01
727EM2 0.08 2.50 2.58 0.15 2.43 2.58 0.22 4.93 5.15
7373B2 0.01 0.00 0.01 0.01 0.00 0.01 0.02 0.01 0.02
737400 0.00 0.01 0.01 0.01 0.00 0.01 0.01 0.01 0.02
737700 0.02 0.01 0.03 0.03 0.00 0.03 0.05 0.01 0.06
737800 0.03 0.00 0.03 0.03 0.00 0.03 0.07 0.00 0.07
757RR 0.01 1.04 1.05 0.01 1.05 1.05 0.02 2.09 2.11
767300 0.03 0.01 0.04 0.03 0.01 0.04 0.05 0.02 0.08
767CF6 0.02 0.02 0.04 0.04 0.00 0.04 0.07 0.02 0.09
777200 0.04 0.01 0.05 0.05 0.00 0.05 0.09 0.01 0.10
A340-642 0.01 0.00 0.01 0.01 0.00 0.01 0.02 0.00 0.02
74720B 0.00 0.00 0.00 0.00 0.00 0.00 0.01 0.00 0.01
DO328 0.00 0.75 0.75 0.00 0.75 0.75 0.00 1.51 1.51
A300-622R 0.18 1.20 1.39 0.20 1.19 1.39 0.38 2.39 2.77
A310-304 0.01 1.50 1.51 0.05 1.46 1.51 0.06 2.96 3.01
777300 0.00 0.00 0.00 0.00 0.00 0.00 0.01 0.00 0.01
DC1010 0.02 2.41 2.43 0.03 2.40 2.43 0.05 4.81 4.86
MD11PW 0.00 0.52 0.52 0.01 0.51 0.52 0.01 1.03 1.05
Air CarrierTotal
0.48 9.99 10.48 0.66 9.82 10.48 1.14 19.81 20.95
Air Taxi
BEC58P 0.01 0.00 0.01 0.01 0.00 0.01 0.02 0.00 0.02
CL600 1.16 0.15 1.31 1.15 0.16 1.31 2.31 0.31 2.62
CL601 0.20 0.01 0.21 0.20 0.01 0.21 0.39 0.02 0.41
CNA206 0.01 0.00 0.01 0.01 0.00 0.01 0.03 0.00 0.03
CNA208 0.01 0.32 0.32 0.01 0.31 0.32 0.02 0.62 0.64
CNA441 0.04 0.01 0.04 0.04 0.01 0.04 0.07 0.02 0.09
CNA500 0.21 0.00 0.21 0.21 0.00 0.21 0.41 0.00 0.41
CNA510 0.04 0.00 0.04 0.04 0.00 0.04 0.07 0.00 0.07
CNA55B 0.74 0.19 0.93 0.78 0.15 0.94 1.52 0.35 1.87
CNA750 0.07 0.02 0.10 0.09 0.01 0.10 0.16 0.03 0.19
DO228 0.02 0.00 0.02 0.02 0.00 0.02 0.04 0.00 0.04
EMB145 0.01 0.00 0.01 0.01 0.00 0.01 0.03 0.00 0.03
F10062 0.04 0.00 0.04 0.04 0.00 0.04 0.07 0.00 0.07
GIIB 0.01 0.00 0.01 0.01 0.00 0.01 0.02 0.00 0.02
IA1125 0.01 0.00 0.01 0.01 0.00 0.01 0.02 0.00 0.02
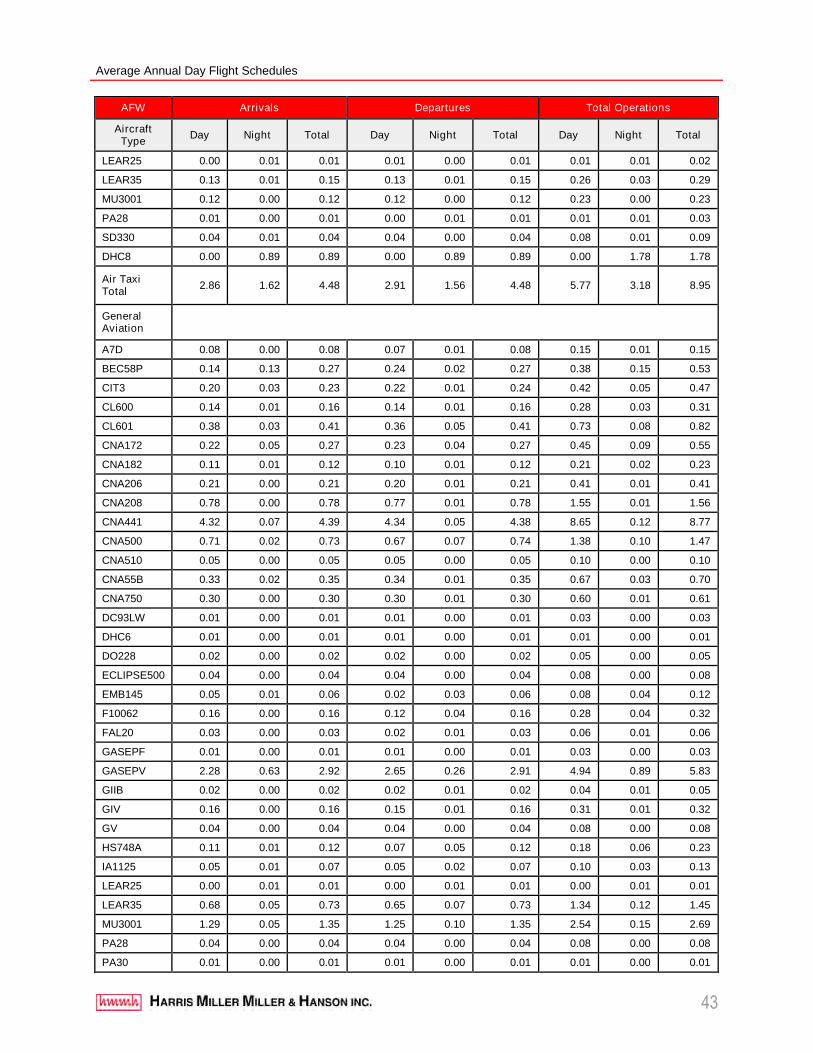
Average Annual Day Flight Schedules
43
AFW Arrivals Departures Total Operations
AircraftType
Day Night Total Day Night Total Day Night Total
LEAR25 0.00 0.01 0.01 0.01 0.00 0.01 0.01 0.01 0.02
LEAR35 0.13 0.01 0.15 0.13 0.01 0.15 0.26 0.03 0.29
MU3001 0.12 0.00 0.12 0.12 0.00 0.12 0.23 0.00 0.23
PA28 0.01 0.00 0.01 0.00 0.01 0.01 0.01 0.01 0.03
SD330 0.04 0.01 0.04 0.04 0.00 0.04 0.08 0.01 0.09
DHC8 0.00 0.89 0.89 0.00 0.89 0.89 0.00 1.78 1.78
Air TaxiTotal
2.86 1.62 4.48 2.91 1.56 4.48 5.77 3.18 8.95
GeneralAviation
A7D 0.08 0.00 0.08 0.07 0.01 0.08 0.15 0.01 0.15
BEC58P 0.14 0.13 0.27 0.24 0.02 0.27 0.38 0.15 0.53
CIT3 0.20 0.03 0.23 0.22 0.01 0.24 0.42 0.05 0.47
CL600 0.14 0.01 0.16 0.14 0.01 0.16 0.28 0.03 0.31
CL601 0.38 0.03 0.41 0.36 0.05 0.41 0.73 0.08 0.82
CNA172 0.22 0.05 0.27 0.23 0.04 0.27 0.45 0.09 0.55
CNA182 0.11 0.01 0.12 0.10 0.01 0.12 0.21 0.02 0.23
CNA206 0.21 0.00 0.21 0.20 0.01 0.21 0.41 0.01 0.41
CNA208 0.78 0.00 0.78 0.77 0.01 0.78 1.55 0.01 1.56
CNA441 4.32 0.07 4.39 4.34 0.05 4.38 8.65 0.12 8.77
CNA500 0.71 0.02 0.73 0.67 0.07 0.74 1.38 0.10 1.47
CNA510 0.05 0.00 0.05 0.05 0.00 0.05 0.10 0.00 0.10
CNA55B 0.33 0.02 0.35 0.34 0.01 0.35 0.67 0.03 0.70
CNA750 0.30 0.00 0.30 0.30 0.01 0.30 0.60 0.01 0.61
DC93LW 0.01 0.00 0.01 0.01 0.00 0.01 0.03 0.00 0.03
DHC6 0.01 0.00 0.01 0.01 0.00 0.01 0.01 0.00 0.01
DO228 0.02 0.00 0.02 0.02 0.00 0.02 0.05 0.00 0.05
ECLIPSE500 0.04 0.00 0.04 0.04 0.00 0.04 0.08 0.00 0.08
EMB145 0.05 0.01 0.06 0.02 0.03 0.06 0.08 0.04 0.12
F10062 0.16 0.00 0.16 0.12 0.04 0.16 0.28 0.04 0.32
FAL20 0.03 0.00 0.03 0.02 0.01 0.03 0.06 0.01 0.06
GASEPF 0.01 0.00 0.01 0.01 0.00 0.01 0.03 0.00 0.03
GASEPV 2.28 0.63 2.92 2.65 0.26 2.91 4.94 0.89 5.83
GIIB 0.02 0.00 0.02 0.02 0.01 0.02 0.04 0.01 0.05
GIV 0.16 0.00 0.16 0.15 0.01 0.16 0.31 0.01 0.32
GV 0.04 0.00 0.04 0.04 0.00 0.04 0.08 0.00 0.08
HS748A 0.11 0.01 0.12 0.07 0.05 0.12 0.18 0.06 0.23
IA1125 0.05 0.01 0.07 0.05 0.02 0.07 0.10 0.03 0.13
LEAR25 0.00 0.01 0.01 0.00 0.01 0.01 0.00 0.01 0.01
LEAR35 0.68 0.05 0.73 0.65 0.07 0.73 1.34 0.12 1.45
MU3001 1.29 0.05 1.35 1.25 0.10 1.35 2.54 0.15 2.69
PA28 0.04 0.00 0.04 0.04 0.00 0.04 0.08 0.00 0.08
PA30 0.01 0.00 0.01 0.01 0.00 0.01 0.01 0.00 0.01
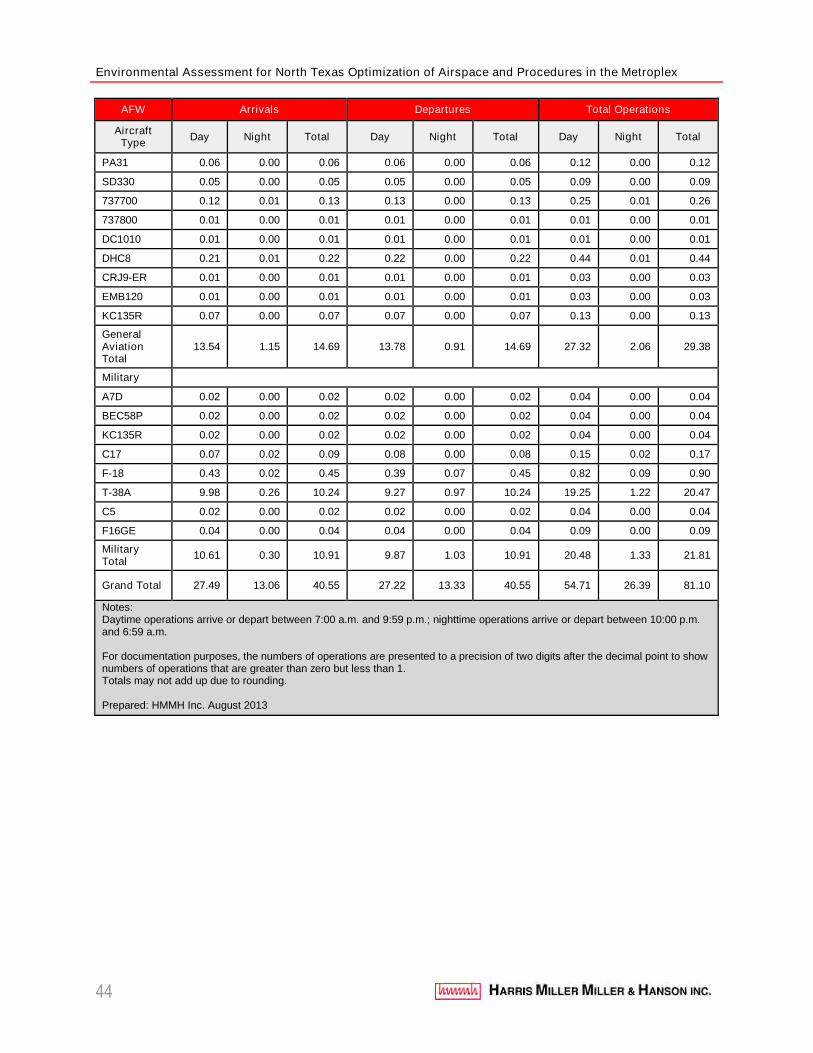
Environmental Assessment for North Texas Optimization of Airspace and Procedures in the Metroplex
44
AFW Arrivals Departures Total Operations
AircraftType
Day Night Total Day Night Total Day Night Total
PA31 0.06 0.00 0.06 0.06 0.00 0.06 0.12 0.00 0.12
SD330 0.05 0.00 0.05 0.05 0.00 0.05 0.09 0.00 0.09
737700 0.12 0.01 0.13 0.13 0.00 0.13 0.25 0.01 0.26
737800 0.01 0.00 0.01 0.01 0.00 0.01 0.01 0.00 0.01
DC1010 0.01 0.00 0.01 0.01 0.00 0.01 0.01 0.00 0.01
DHC8 0.21 0.01 0.22 0.22 0.00 0.22 0.44 0.01 0.44
CRJ9-ER 0.01 0.00 0.01 0.01 0.00 0.01 0.03 0.00 0.03
EMB120 0.01 0.00 0.01 0.01 0.00 0.01 0.03 0.00 0.03
KC135R 0.07 0.00 0.07 0.07 0.00 0.07 0.13 0.00 0.13
GeneralAviationTotal
13.54 1.15 14.69 13.78 0.91 14.69 27.32 2.06 29.38
Military
A7D 0.02 0.00 0.02 0.02 0.00 0.02 0.04 0.00 0.04
BEC58P 0.02 0.00 0.02 0.02 0.00 0.02 0.04 0.00 0.04
KC135R 0.02 0.00 0.02 0.02 0.00 0.02 0.04 0.00 0.04
C17 0.07 0.02 0.09 0.08 0.00 0.08 0.15 0.02 0.17
F-18 0.43 0.02 0.45 0.39 0.07 0.45 0.82 0.09 0.90
T-38A 9.98 0.26 10.24 9.27 0.97 10.24 19.25 1.22 20.47
C5 0.02 0.00 0.02 0.02 0.00 0.02 0.04 0.00 0.04
F16GE 0.04 0.00 0.04 0.04 0.00 0.04 0.09 0.00 0.09
MilitaryTotal
10.61 0.30 10.91 9.87 1.03 10.91 20.48 1.33 21.81
Grand Total 27.49 13.06 40.55 27.22 13.33 40.55 54.71 26.39 81.10
Notes:Daytime operations arrive or depart between 7:00 a.m. and 9:59 p.m.; nighttime operations arrive or depart between 10:00 p.m.and 6:59 a.m.
For documentation purposes, the numbers of operations are presented to a precision of two digits after the decimal point to shownumbers of operations that are greater than zero but less than 1.Totals may not add up due to rounding.
Prepared: HMMH Inc. August 2013
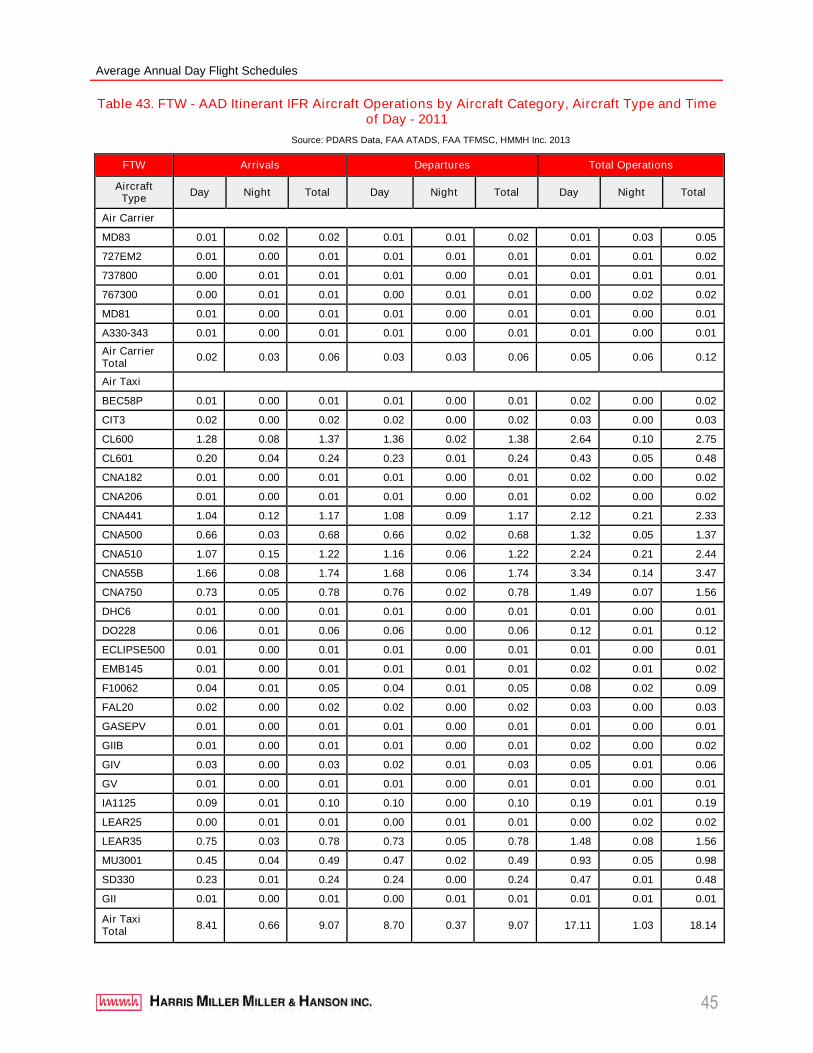
Average Annual Day Flight Schedules
45
Table 43. FTW - AAD Itinerant IFR Aircraft Operations by Aircraft Category, Aircraft Type and Timeof Day - 2011
Source: PDARS Data, FAA ATADS, FAA TFMSC, HMMH Inc. 2013
FTW Arrivals Departures Total Operations
AircraftType
Day Night Total Day Night Total Day Night Total
Air Carrier
MD83 0.01 0.02 0.02 0.01 0.01 0.02 0.01 0.03 0.05
727EM2 0.01 0.00 0.01 0.01 0.01 0.01 0.01 0.01 0.02
737800 0.00 0.01 0.01 0.01 0.00 0.01 0.01 0.01 0.01
767300 0.00 0.01 0.01 0.00 0.01 0.01 0.00 0.02 0.02
MD81 0.01 0.00 0.01 0.01 0.00 0.01 0.01 0.00 0.01
A330-343 0.01 0.00 0.01 0.01 0.00 0.01 0.01 0.00 0.01
Air CarrierTotal
0.02 0.03 0.06 0.03 0.03 0.06 0.05 0.06 0.12
Air Taxi
BEC58P 0.01 0.00 0.01 0.01 0.00 0.01 0.02 0.00 0.02
CIT3 0.02 0.00 0.02 0.02 0.00 0.02 0.03 0.00 0.03
CL600 1.28 0.08 1.37 1.36 0.02 1.38 2.64 0.10 2.75
CL601 0.20 0.04 0.24 0.23 0.01 0.24 0.43 0.05 0.48
CNA182 0.01 0.00 0.01 0.01 0.00 0.01 0.02 0.00 0.02
CNA206 0.01 0.00 0.01 0.01 0.00 0.01 0.02 0.00 0.02
CNA441 1.04 0.12 1.17 1.08 0.09 1.17 2.12 0.21 2.33
CNA500 0.66 0.03 0.68 0.66 0.02 0.68 1.32 0.05 1.37
CNA510 1.07 0.15 1.22 1.16 0.06 1.22 2.24 0.21 2.44
CNA55B 1.66 0.08 1.74 1.68 0.06 1.74 3.34 0.14 3.47
CNA750 0.73 0.05 0.78 0.76 0.02 0.78 1.49 0.07 1.56
DHC6 0.01 0.00 0.01 0.01 0.00 0.01 0.01 0.00 0.01
DO228 0.06 0.01 0.06 0.06 0.00 0.06 0.12 0.01 0.12
ECLIPSE500 0.01 0.00 0.01 0.01 0.00 0.01 0.01 0.00 0.01
EMB145 0.01 0.00 0.01 0.01 0.01 0.01 0.02 0.01 0.02
F10062 0.04 0.01 0.05 0.04 0.01 0.05 0.08 0.02 0.09
FAL20 0.02 0.00 0.02 0.02 0.00 0.02 0.03 0.00 0.03
GASEPV 0.01 0.00 0.01 0.01 0.00 0.01 0.01 0.00 0.01
GIIB 0.01 0.00 0.01 0.01 0.00 0.01 0.02 0.00 0.02
GIV 0.03 0.00 0.03 0.02 0.01 0.03 0.05 0.01 0.06
GV 0.01 0.00 0.01 0.01 0.00 0.01 0.01 0.00 0.01
IA1125 0.09 0.01 0.10 0.10 0.00 0.10 0.19 0.01 0.19
LEAR25 0.00 0.01 0.01 0.00 0.01 0.01 0.00 0.02 0.02
LEAR35 0.75 0.03 0.78 0.73 0.05 0.78 1.48 0.08 1.56
MU3001 0.45 0.04 0.49 0.47 0.02 0.49 0.93 0.05 0.98
SD330 0.23 0.01 0.24 0.24 0.00 0.24 0.47 0.01 0.48
GII 0.01 0.00 0.01 0.00 0.01 0.01 0.01 0.01 0.01
Air TaxiTotal
8.41 0.66 9.07 8.70 0.37 9.07 17.11 1.03 18.14
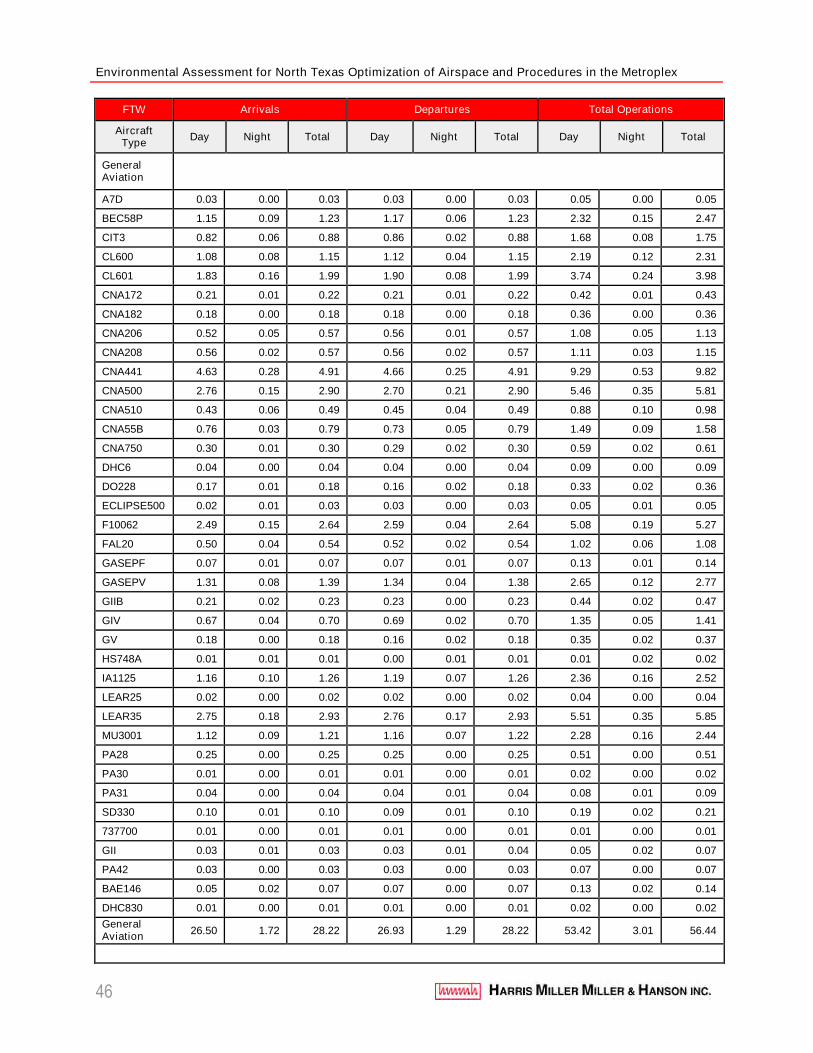
Environmental Assessment for North Texas Optimization of Airspace and Procedures in the Metroplex
46
FTW Arrivals Departures Total Operations
AircraftType
Day Night Total Day Night Total Day Night Total
GeneralAviation
A7D 0.03 0.00 0.03 0.03 0.00 0.03 0.05 0.00 0.05
BEC58P 1.15 0.09 1.23 1.17 0.06 1.23 2.32 0.15 2.47
CIT3 0.82 0.06 0.88 0.86 0.02 0.88 1.68 0.08 1.75
CL600 1.08 0.08 1.15 1.12 0.04 1.15 2.19 0.12 2.31
CL601 1.83 0.16 1.99 1.90 0.08 1.99 3.74 0.24 3.98
CNA172 0.21 0.01 0.22 0.21 0.01 0.22 0.42 0.01 0.43
CNA182 0.18 0.00 0.18 0.18 0.00 0.18 0.36 0.00 0.36
CNA206 0.52 0.05 0.57 0.56 0.01 0.57 1.08 0.05 1.13
CNA208 0.56 0.02 0.57 0.56 0.02 0.57 1.11 0.03 1.15
CNA441 4.63 0.28 4.91 4.66 0.25 4.91 9.29 0.53 9.82
CNA500 2.76 0.15 2.90 2.70 0.21 2.90 5.46 0.35 5.81
CNA510 0.43 0.06 0.49 0.45 0.04 0.49 0.88 0.10 0.98
CNA55B 0.76 0.03 0.79 0.73 0.05 0.79 1.49 0.09 1.58
CNA750 0.30 0.01 0.30 0.29 0.02 0.30 0.59 0.02 0.61
DHC6 0.04 0.00 0.04 0.04 0.00 0.04 0.09 0.00 0.09
DO228 0.17 0.01 0.18 0.16 0.02 0.18 0.33 0.02 0.36
ECLIPSE500 0.02 0.01 0.03 0.03 0.00 0.03 0.05 0.01 0.05
F10062 2.49 0.15 2.64 2.59 0.04 2.64 5.08 0.19 5.27
FAL20 0.50 0.04 0.54 0.52 0.02 0.54 1.02 0.06 1.08
GASEPF 0.07 0.01 0.07 0.07 0.01 0.07 0.13 0.01 0.14
GASEPV 1.31 0.08 1.39 1.34 0.04 1.38 2.65 0.12 2.77
GIIB 0.21 0.02 0.23 0.23 0.00 0.23 0.44 0.02 0.47
GIV 0.67 0.04 0.70 0.69 0.02 0.70 1.35 0.05 1.41
GV 0.18 0.00 0.18 0.16 0.02 0.18 0.35 0.02 0.37
HS748A 0.01 0.01 0.01 0.00 0.01 0.01 0.01 0.02 0.02
IA1125 1.16 0.10 1.26 1.19 0.07 1.26 2.36 0.16 2.52
LEAR25 0.02 0.00 0.02 0.02 0.00 0.02 0.04 0.00 0.04
LEAR35 2.75 0.18 2.93 2.76 0.17 2.93 5.51 0.35 5.85
MU3001 1.12 0.09 1.21 1.16 0.07 1.22 2.28 0.16 2.44
PA28 0.25 0.00 0.25 0.25 0.00 0.25 0.51 0.00 0.51
PA30 0.01 0.00 0.01 0.01 0.00 0.01 0.02 0.00 0.02
PA31 0.04 0.00 0.04 0.04 0.01 0.04 0.08 0.01 0.09
SD330 0.10 0.01 0.10 0.09 0.01 0.10 0.19 0.02 0.21
737700 0.01 0.00 0.01 0.01 0.00 0.01 0.01 0.00 0.01
GII 0.03 0.01 0.03 0.03 0.01 0.04 0.05 0.02 0.07
PA42 0.03 0.00 0.03 0.03 0.00 0.03 0.07 0.00 0.07
BAE146 0.05 0.02 0.07 0.07 0.00 0.07 0.13 0.02 0.14
DHC830 0.01 0.00 0.01 0.01 0.00 0.01 0.02 0.00 0.02
GeneralAviationTotal
26.50 1.72 28.22 26.93 1.29 28.22 53.42 3.01 56.44
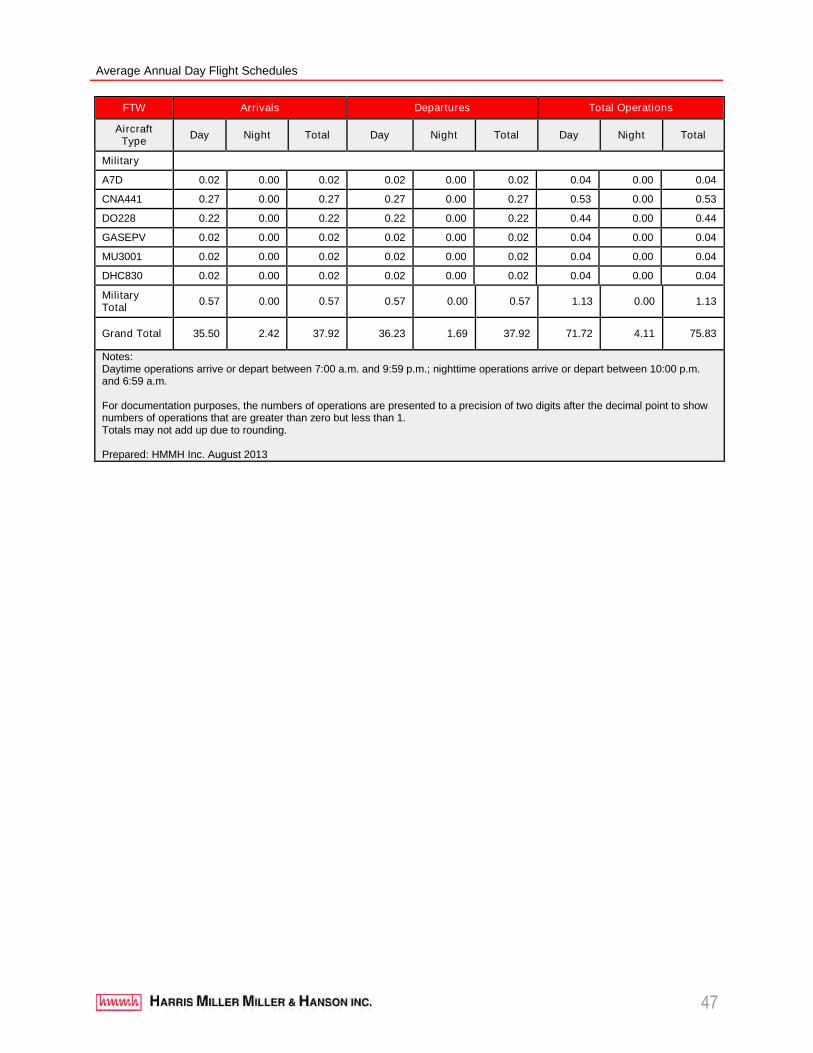
Average Annual Day Flight Schedules
47
FTW Arrivals Departures Total Operations
AircraftType
Day Night Total Day Night Total Day Night Total
Military
A7D 0.02 0.00 0.02 0.02 0.00 0.02 0.04 0.00 0.04
CNA441 0.27 0.00 0.27 0.27 0.00 0.27 0.53 0.00 0.53
DO228 0.22 0.00 0.22 0.22 0.00 0.22 0.44 0.00 0.44
GASEPV 0.02 0.00 0.02 0.02 0.00 0.02 0.04 0.00 0.04
MU3001 0.02 0.00 0.02 0.02 0.00 0.02 0.04 0.00 0.04
DHC830 0.02 0.00 0.02 0.02 0.00 0.02 0.04 0.00 0.04
MilitaryTotal
0.57 0.00 0.57 0.57 0.00 0.57 1.13 0.00 1.13
Grand Total 35.50 2.42 37.92 36.23 1.69 37.92 71.72 4.11 75.83
Notes:Daytime operations arrive or depart between 7:00 a.m. and 9:59 p.m.; nighttime operations arrive or depart between 10:00 p.m.and 6:59 a.m.
For documentation purposes, the numbers of operations are presented to a precision of two digits after the decimal point to shownumbers of operations that are greater than zero but less than 1.Totals may not add up due to rounding.
Prepared: HMMH Inc. August 2013
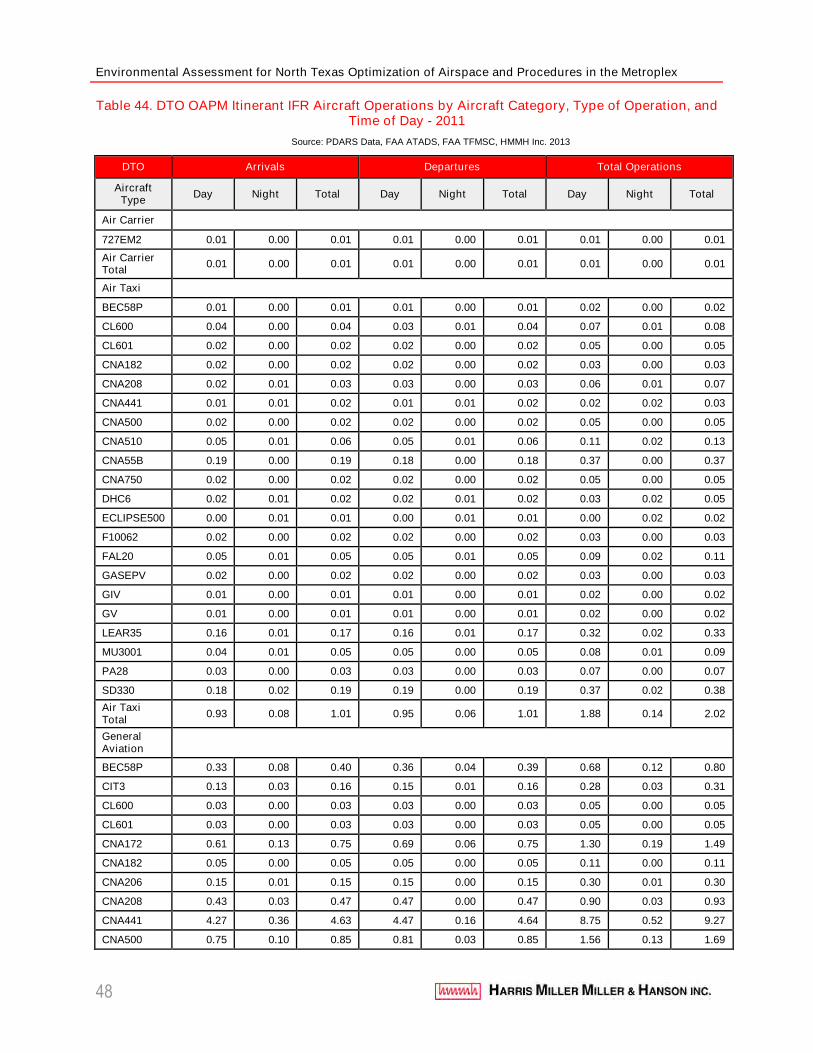
Environmental Assessment for North Texas Optimization of Airspace and Procedures in the Metroplex
48
Table 44. DTO OAPM Itinerant IFR Aircraft Operations by Aircraft Category, Type of Operation, andTime of Day - 2011
Source: PDARS Data, FAA ATADS, FAA TFMSC, HMMH Inc. 2013
DTO Arrivals Departures Total Operations
AircraftType
Day Night Total Day Night Total Day Night Total
Air Carrier
727EM2 0.01 0.00 0.01 0.01 0.00 0.01 0.01 0.00 0.01
Air CarrierTotal
0.01 0.00 0.01 0.01 0.00 0.01 0.01 0.00 0.01
Air Taxi
BEC58P 0.01 0.00 0.01 0.01 0.00 0.01 0.02 0.00 0.02
CL600 0.04 0.00 0.04 0.03 0.01 0.04 0.07 0.01 0.08
CL601 0.02 0.00 0.02 0.02 0.00 0.02 0.05 0.00 0.05
CNA182 0.02 0.00 0.02 0.02 0.00 0.02 0.03 0.00 0.03
CNA208 0.02 0.01 0.03 0.03 0.00 0.03 0.06 0.01 0.07
CNA441 0.01 0.01 0.02 0.01 0.01 0.02 0.02 0.02 0.03
CNA500 0.02 0.00 0.02 0.02 0.00 0.02 0.05 0.00 0.05
CNA510 0.05 0.01 0.06 0.05 0.01 0.06 0.11 0.02 0.13
CNA55B 0.19 0.00 0.19 0.18 0.00 0.18 0.37 0.00 0.37
CNA750 0.02 0.00 0.02 0.02 0.00 0.02 0.05 0.00 0.05
DHC6 0.02 0.01 0.02 0.02 0.01 0.02 0.03 0.02 0.05
ECLIPSE500 0.00 0.01 0.01 0.00 0.01 0.01 0.00 0.02 0.02
F10062 0.02 0.00 0.02 0.02 0.00 0.02 0.03 0.00 0.03
FAL20 0.05 0.01 0.05 0.05 0.01 0.05 0.09 0.02 0.11
GASEPV 0.02 0.00 0.02 0.02 0.00 0.02 0.03 0.00 0.03
GIV 0.01 0.00 0.01 0.01 0.00 0.01 0.02 0.00 0.02
GV 0.01 0.00 0.01 0.01 0.00 0.01 0.02 0.00 0.02
LEAR35 0.16 0.01 0.17 0.16 0.01 0.17 0.32 0.02 0.33
MU3001 0.04 0.01 0.05 0.05 0.00 0.05 0.08 0.01 0.09
PA28 0.03 0.00 0.03 0.03 0.00 0.03 0.07 0.00 0.07
SD330 0.18 0.02 0.19 0.19 0.00 0.19 0.37 0.02 0.38
Air TaxiTotal
0.93 0.08 1.01 0.95 0.06 1.01 1.88 0.14 2.02
GeneralAviation
BEC58P 0.33 0.08 0.40 0.36 0.04 0.39 0.68 0.12 0.80
CIT3 0.13 0.03 0.16 0.15 0.01 0.16 0.28 0.03 0.31
CL600 0.03 0.00 0.03 0.03 0.00 0.03 0.05 0.00 0.05
CL601 0.03 0.00 0.03 0.03 0.00 0.03 0.05 0.00 0.05
CNA172 0.61 0.13 0.75 0.69 0.06 0.75 1.30 0.19 1.49
CNA182 0.05 0.00 0.05 0.05 0.00 0.05 0.11 0.00 0.11
CNA206 0.15 0.01 0.15 0.15 0.00 0.15 0.30 0.01 0.30
CNA208 0.43 0.03 0.47 0.47 0.00 0.47 0.90 0.03 0.93
CNA441 4.27 0.36 4.63 4.47 0.16 4.64 8.75 0.52 9.27
CNA500 0.75 0.10 0.85 0.81 0.03 0.85 1.56 0.13 1.69
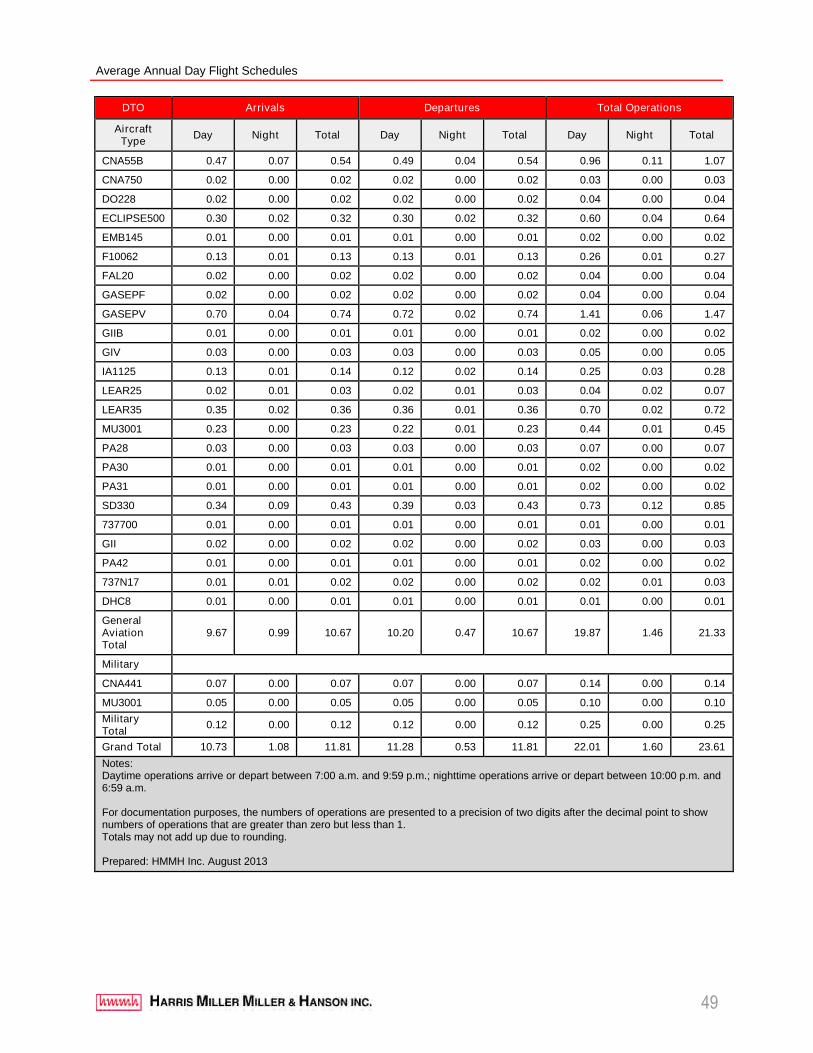
Average Annual Day Flight Schedules
49
DTO Arrivals Departures Total Operations
AircraftType
Day Night Total Day Night Total Day Night Total
CNA55B 0.47 0.07 0.54 0.49 0.04 0.54 0.96 0.11 1.07
CNA750 0.02 0.00 0.02 0.02 0.00 0.02 0.03 0.00 0.03
DO228 0.02 0.00 0.02 0.02 0.00 0.02 0.04 0.00 0.04
ECLIPSE500 0.30 0.02 0.32 0.30 0.02 0.32 0.60 0.04 0.64
EMB145 0.01 0.00 0.01 0.01 0.00 0.01 0.02 0.00 0.02
F10062 0.13 0.01 0.13 0.13 0.01 0.13 0.26 0.01 0.27
FAL20 0.02 0.00 0.02 0.02 0.00 0.02 0.04 0.00 0.04
GASEPF 0.02 0.00 0.02 0.02 0.00 0.02 0.04 0.00 0.04
GASEPV 0.70 0.04 0.74 0.72 0.02 0.74 1.41 0.06 1.47
GIIB 0.01 0.00 0.01 0.01 0.00 0.01 0.02 0.00 0.02
GIV 0.03 0.00 0.03 0.03 0.00 0.03 0.05 0.00 0.05
IA1125 0.13 0.01 0.14 0.12 0.02 0.14 0.25 0.03 0.28
LEAR25 0.02 0.01 0.03 0.02 0.01 0.03 0.04 0.02 0.07
LEAR35 0.35 0.02 0.36 0.36 0.01 0.36 0.70 0.02 0.72
MU3001 0.23 0.00 0.23 0.22 0.01 0.23 0.44 0.01 0.45
PA28 0.03 0.00 0.03 0.03 0.00 0.03 0.07 0.00 0.07
PA30 0.01 0.00 0.01 0.01 0.00 0.01 0.02 0.00 0.02
PA31 0.01 0.00 0.01 0.01 0.00 0.01 0.02 0.00 0.02
SD330 0.34 0.09 0.43 0.39 0.03 0.43 0.73 0.12 0.85
737700 0.01 0.00 0.01 0.01 0.00 0.01 0.01 0.00 0.01
GII 0.02 0.00 0.02 0.02 0.00 0.02 0.03 0.00 0.03
PA42 0.01 0.00 0.01 0.01 0.00 0.01 0.02 0.00 0.02
737N17 0.01 0.01 0.02 0.02 0.00 0.02 0.02 0.01 0.03
DHC8 0.01 0.00 0.01 0.01 0.00 0.01 0.01 0.00 0.01
GeneralAviationTotal
9.67 0.99 10.67 10.20 0.47 10.67 19.87 1.46 21.33
Military
CNA441 0.07 0.00 0.07 0.07 0.00 0.07 0.14 0.00 0.14
MU3001 0.05 0.00 0.05 0.05 0.00 0.05 0.10 0.00 0.10
MilitaryTotal
0.12 0.00 0.12 0.12 0.00 0.12 0.25 0.00 0.25
Grand Total 10.73 1.08 11.81 11.28 0.53 11.81 22.01 1.60 23.61
Notes:Daytime operations arrive or depart between 7:00 a.m. and 9:59 p.m.; nighttime operations arrive or depart between 10:00 p.m. and6:59 a.m.
For documentation purposes, the numbers of operations are presented to a precision of two digits after the decimal point to shownumbers of operations that are greater than zero but less than 1.Totals may not add up due to rounding.
Prepared: HMMH Inc. August 2013
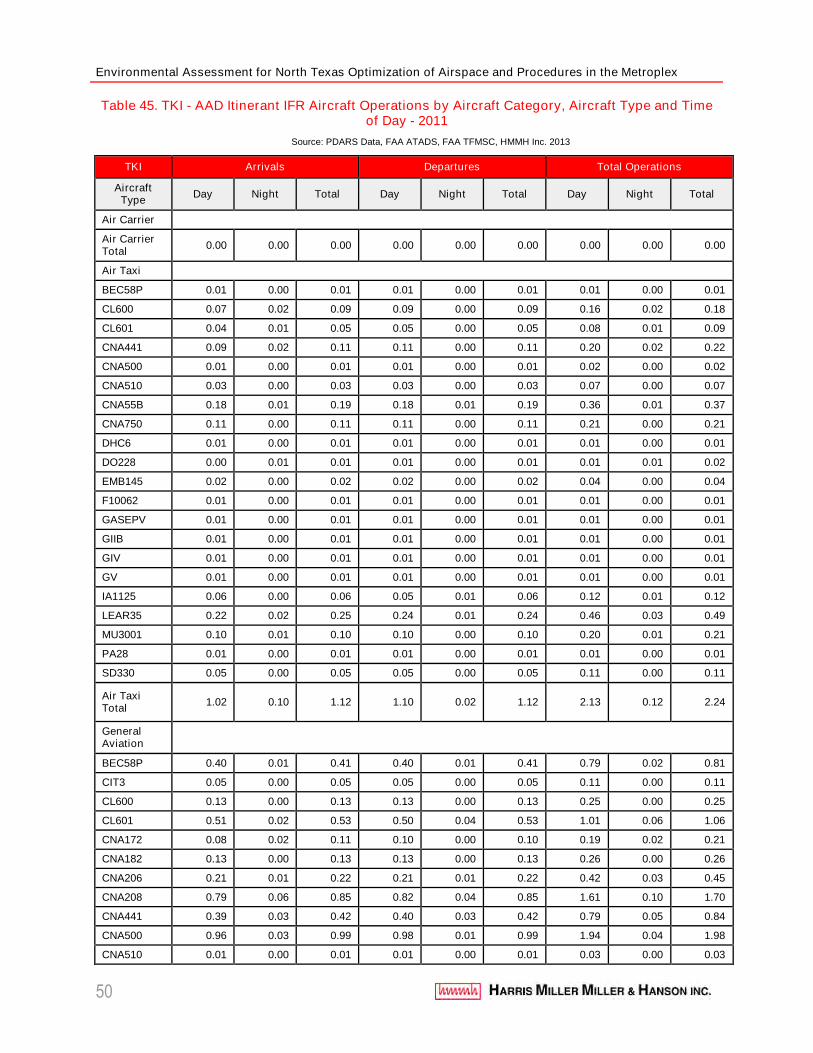
Environmental Assessment for North Texas Optimization of Airspace and Procedures in the Metroplex
50
Table 45. TKI - AAD Itinerant IFR Aircraft Operations by Aircraft Category, Aircraft Type and Timeof Day - 2011
Source: PDARS Data, FAA ATADS, FAA TFMSC, HMMH Inc. 2013
TKI Arrivals Departures Total Operations
AircraftType
Day Night Total Day Night Total Day Night Total
Air Carrier
Air CarrierTotal
0.00 0.00 0.00 0.00 0.00 0.00 0.00 0.00 0.00
Air Taxi
BEC58P 0.01 0.00 0.01 0.01 0.00 0.01 0.01 0.00 0.01
CL600 0.07 0.02 0.09 0.09 0.00 0.09 0.16 0.02 0.18
CL601 0.04 0.01 0.05 0.05 0.00 0.05 0.08 0.01 0.09
CNA441 0.09 0.02 0.11 0.11 0.00 0.11 0.20 0.02 0.22
CNA500 0.01 0.00 0.01 0.01 0.00 0.01 0.02 0.00 0.02
CNA510 0.03 0.00 0.03 0.03 0.00 0.03 0.07 0.00 0.07
CNA55B 0.18 0.01 0.19 0.18 0.01 0.19 0.36 0.01 0.37
CNA750 0.11 0.00 0.11 0.11 0.00 0.11 0.21 0.00 0.21
DHC6 0.01 0.00 0.01 0.01 0.00 0.01 0.01 0.00 0.01
DO228 0.00 0.01 0.01 0.01 0.00 0.01 0.01 0.01 0.02
EMB145 0.02 0.00 0.02 0.02 0.00 0.02 0.04 0.00 0.04
F10062 0.01 0.00 0.01 0.01 0.00 0.01 0.01 0.00 0.01
GASEPV 0.01 0.00 0.01 0.01 0.00 0.01 0.01 0.00 0.01
GIIB 0.01 0.00 0.01 0.01 0.00 0.01 0.01 0.00 0.01
GIV 0.01 0.00 0.01 0.01 0.00 0.01 0.01 0.00 0.01
GV 0.01 0.00 0.01 0.01 0.00 0.01 0.01 0.00 0.01
IA1125 0.06 0.00 0.06 0.05 0.01 0.06 0.12 0.01 0.12
LEAR35 0.22 0.02 0.25 0.24 0.01 0.24 0.46 0.03 0.49
MU3001 0.10 0.01 0.10 0.10 0.00 0.10 0.20 0.01 0.21
PA28 0.01 0.00 0.01 0.01 0.00 0.01 0.01 0.00 0.01
SD330 0.05 0.00 0.05 0.05 0.00 0.05 0.11 0.00 0.11
Air TaxiTotal
1.02 0.10 1.12 1.10 0.02 1.12 2.13 0.12 2.24
GeneralAviation
BEC58P 0.40 0.01 0.41 0.40 0.01 0.41 0.79 0.02 0.81
CIT3 0.05 0.00 0.05 0.05 0.00 0.05 0.11 0.00 0.11
CL600 0.13 0.00 0.13 0.13 0.00 0.13 0.25 0.00 0.25
CL601 0.51 0.02 0.53 0.50 0.04 0.53 1.01 0.06 1.06
CNA172 0.08 0.02 0.11 0.10 0.00 0.10 0.19 0.02 0.21
CNA182 0.13 0.00 0.13 0.13 0.00 0.13 0.26 0.00 0.26
CNA206 0.21 0.01 0.22 0.21 0.01 0.22 0.42 0.03 0.45
CNA208 0.79 0.06 0.85 0.82 0.04 0.85 1.61 0.10 1.70
CNA441 0.39 0.03 0.42 0.40 0.03 0.42 0.79 0.05 0.84
CNA500 0.96 0.03 0.99 0.98 0.01 0.99 1.94 0.04 1.98
CNA510 0.01 0.00 0.01 0.01 0.00 0.01 0.03 0.00 0.03
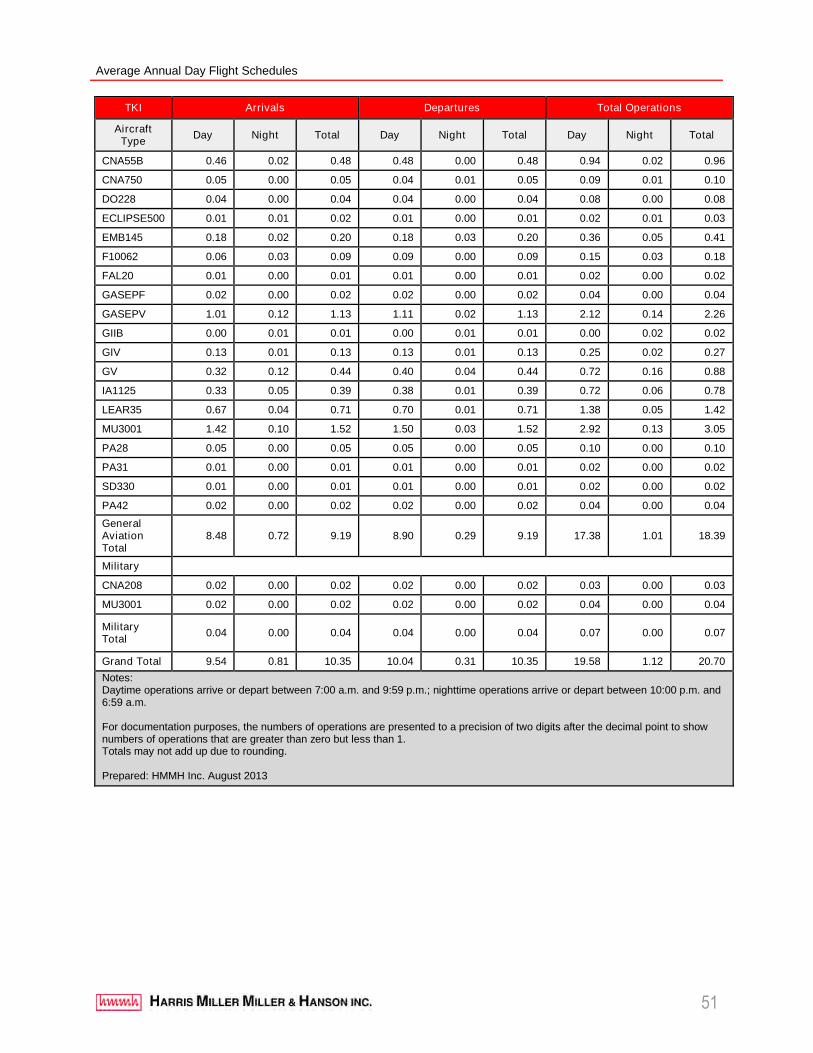
Average Annual Day Flight Schedules
51
TKI Arrivals Departures Total Operations
AircraftType
Day Night Total Day Night Total Day Night Total
CNA55B 0.46 0.02 0.48 0.48 0.00 0.48 0.94 0.02 0.96
CNA750 0.05 0.00 0.05 0.04 0.01 0.05 0.09 0.01 0.10
DO228 0.04 0.00 0.04 0.04 0.00 0.04 0.08 0.00 0.08
ECLIPSE500 0.01 0.01 0.02 0.01 0.00 0.01 0.02 0.01 0.03
EMB145 0.18 0.02 0.20 0.18 0.03 0.20 0.36 0.05 0.41
F10062 0.06 0.03 0.09 0.09 0.00 0.09 0.15 0.03 0.18
FAL20 0.01 0.00 0.01 0.01 0.00 0.01 0.02 0.00 0.02
GASEPF 0.02 0.00 0.02 0.02 0.00 0.02 0.04 0.00 0.04
GASEPV 1.01 0.12 1.13 1.11 0.02 1.13 2.12 0.14 2.26
GIIB 0.00 0.01 0.01 0.00 0.01 0.01 0.00 0.02 0.02
GIV 0.13 0.01 0.13 0.13 0.01 0.13 0.25 0.02 0.27
GV 0.32 0.12 0.44 0.40 0.04 0.44 0.72 0.16 0.88
IA1125 0.33 0.05 0.39 0.38 0.01 0.39 0.72 0.06 0.78
LEAR35 0.67 0.04 0.71 0.70 0.01 0.71 1.38 0.05 1.42
MU3001 1.42 0.10 1.52 1.50 0.03 1.52 2.92 0.13 3.05
PA28 0.05 0.00 0.05 0.05 0.00 0.05 0.10 0.00 0.10
PA31 0.01 0.00 0.01 0.01 0.00 0.01 0.02 0.00 0.02
SD330 0.01 0.00 0.01 0.01 0.00 0.01 0.02 0.00 0.02
PA42 0.02 0.00 0.02 0.02 0.00 0.02 0.04 0.00 0.04
GeneralAviationTotal
8.48 0.72 9.19 8.90 0.29 9.19 17.38 1.01 18.39
Military
CNA208 0.02 0.00 0.02 0.02 0.00 0.02 0.03 0.00 0.03
MU3001 0.02 0.00 0.02 0.02 0.00 0.02 0.04 0.00 0.04
MilitaryTotal
0.04 0.00 0.04 0.04 0.00 0.04 0.07 0.00 0.07
Grand Total 9.54 0.81 10.35 10.04 0.31 10.35 19.58 1.12 20.70
Notes:Daytime operations arrive or depart between 7:00 a.m. and 9:59 p.m.; nighttime operations arrive or depart between 10:00 p.m. and6:59 a.m.
For documentation purposes, the numbers of operations are presented to a precision of two digits after the decimal point to shownumbers of operations that are greater than zero but less than 1.Totals may not add up due to rounding.
Prepared: HMMH Inc. August 2013
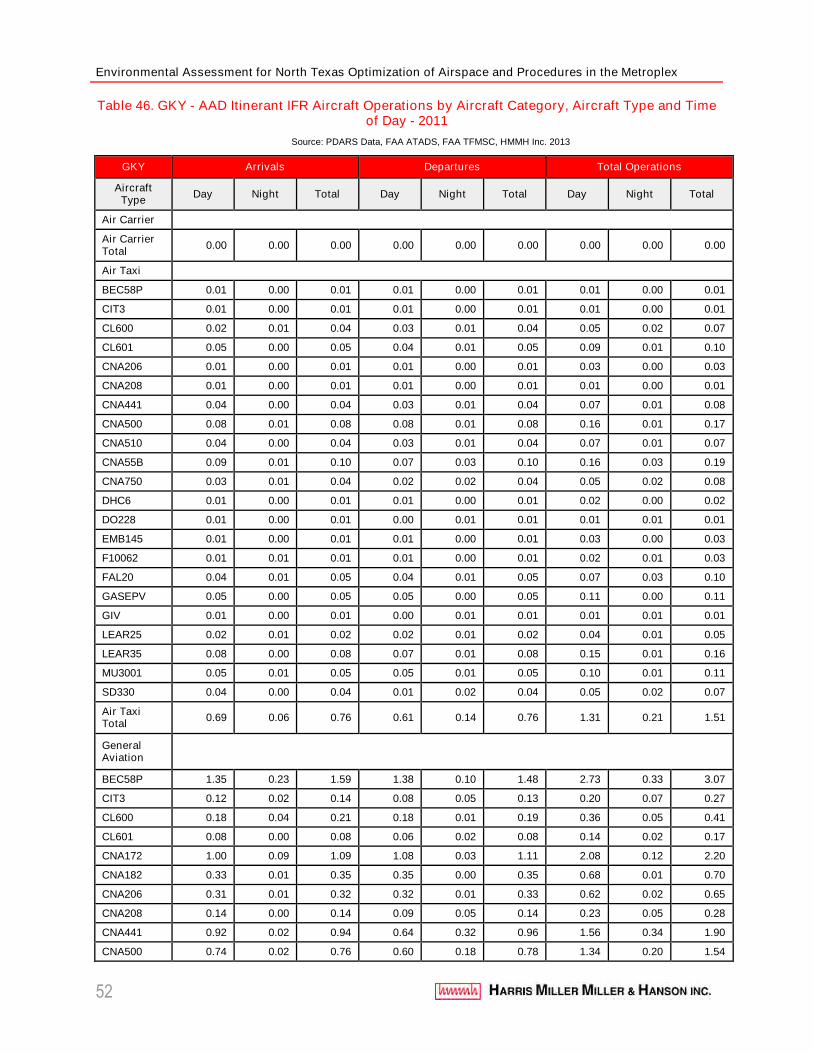
Environmental Assessment for North Texas Optimization of Airspace and Procedures in the Metroplex
52
Table 46. GKY - AAD Itinerant IFR Aircraft Operations by Aircraft Category, Aircraft Type and Timeof Day - 2011
Source: PDARS Data, FAA ATADS, FAA TFMSC, HMMH Inc. 2013
GKY Arrivals Departures Total Operations
AircraftType
Day Night Total Day Night Total Day Night Total
Air Carrier
Air CarrierTotal
0.00 0.00 0.00 0.00 0.00 0.00 0.00 0.00 0.00
Air Taxi
BEC58P 0.01 0.00 0.01 0.01 0.00 0.01 0.01 0.00 0.01
CIT3 0.01 0.00 0.01 0.01 0.00 0.01 0.01 0.00 0.01
CL600 0.02 0.01 0.04 0.03 0.01 0.04 0.05 0.02 0.07
CL601 0.05 0.00 0.05 0.04 0.01 0.05 0.09 0.01 0.10
CNA206 0.01 0.00 0.01 0.01 0.00 0.01 0.03 0.00 0.03
CNA208 0.01 0.00 0.01 0.01 0.00 0.01 0.01 0.00 0.01
CNA441 0.04 0.00 0.04 0.03 0.01 0.04 0.07 0.01 0.08
CNA500 0.08 0.01 0.08 0.08 0.01 0.08 0.16 0.01 0.17
CNA510 0.04 0.00 0.04 0.03 0.01 0.04 0.07 0.01 0.07
CNA55B 0.09 0.01 0.10 0.07 0.03 0.10 0.16 0.03 0.19
CNA750 0.03 0.01 0.04 0.02 0.02 0.04 0.05 0.02 0.08
DHC6 0.01 0.00 0.01 0.01 0.00 0.01 0.02 0.00 0.02
DO228 0.01 0.00 0.01 0.00 0.01 0.01 0.01 0.01 0.01
EMB145 0.01 0.00 0.01 0.01 0.00 0.01 0.03 0.00 0.03
F10062 0.01 0.01 0.01 0.01 0.00 0.01 0.02 0.01 0.03
FAL20 0.04 0.01 0.05 0.04 0.01 0.05 0.07 0.03 0.10
GASEPV 0.05 0.00 0.05 0.05 0.00 0.05 0.11 0.00 0.11
GIV 0.01 0.00 0.01 0.00 0.01 0.01 0.01 0.01 0.01
LEAR25 0.02 0.01 0.02 0.02 0.01 0.02 0.04 0.01 0.05
LEAR35 0.08 0.00 0.08 0.07 0.01 0.08 0.15 0.01 0.16
MU3001 0.05 0.01 0.05 0.05 0.01 0.05 0.10 0.01 0.11
SD330 0.04 0.00 0.04 0.01 0.02 0.04 0.05 0.02 0.07
Air TaxiTotal
0.69 0.06 0.76 0.61 0.14 0.76 1.31 0.21 1.51
GeneralAviation
BEC58P 1.35 0.23 1.59 1.38 0.10 1.48 2.73 0.33 3.07
CIT3 0.12 0.02 0.14 0.08 0.05 0.13 0.20 0.07 0.27
CL600 0.18 0.04 0.21 0.18 0.01 0.19 0.36 0.05 0.41
CL601 0.08 0.00 0.08 0.06 0.02 0.08 0.14 0.02 0.17
CNA172 1.00 0.09 1.09 1.08 0.03 1.11 2.08 0.12 2.20
CNA182 0.33 0.01 0.35 0.35 0.00 0.35 0.68 0.01 0.70
CNA206 0.31 0.01 0.32 0.32 0.01 0.33 0.62 0.02 0.65
CNA208 0.14 0.00 0.14 0.09 0.05 0.14 0.23 0.05 0.28
CNA441 0.92 0.02 0.94 0.64 0.32 0.96 1.56 0.34 1.90
CNA500 0.74 0.02 0.76 0.60 0.18 0.78 1.34 0.20 1.54
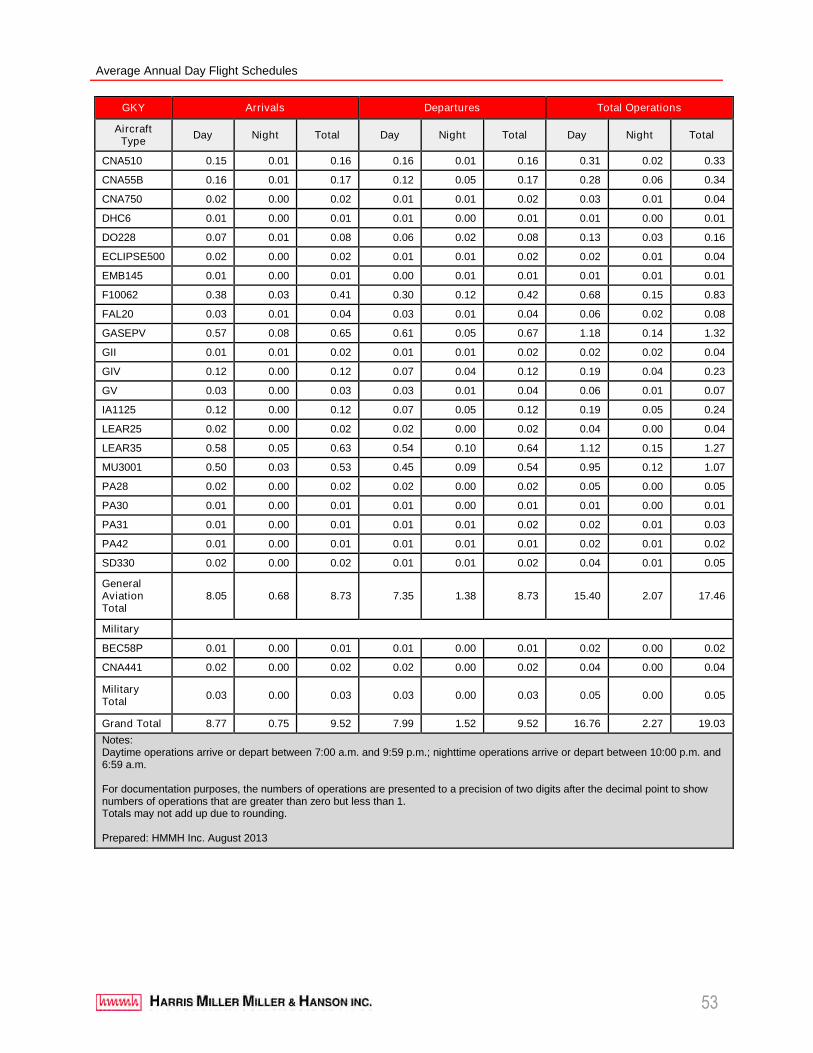
Average Annual Day Flight Schedules
53
GKY Arrivals Departures Total Operations
AircraftType
Day Night Total Day Night Total Day Night Total
CNA510 0.15 0.01 0.16 0.16 0.01 0.16 0.31 0.02 0.33
CNA55B 0.16 0.01 0.17 0.12 0.05 0.17 0.28 0.06 0.34
CNA750 0.02 0.00 0.02 0.01 0.01 0.02 0.03 0.01 0.04
DHC6 0.01 0.00 0.01 0.01 0.00 0.01 0.01 0.00 0.01
DO228 0.07 0.01 0.08 0.06 0.02 0.08 0.13 0.03 0.16
ECLIPSE500 0.02 0.00 0.02 0.01 0.01 0.02 0.02 0.01 0.04
EMB145 0.01 0.00 0.01 0.00 0.01 0.01 0.01 0.01 0.01
F10062 0.38 0.03 0.41 0.30 0.12 0.42 0.68 0.15 0.83
FAL20 0.03 0.01 0.04 0.03 0.01 0.04 0.06 0.02 0.08
GASEPV 0.57 0.08 0.65 0.61 0.05 0.67 1.18 0.14 1.32
GII 0.01 0.01 0.02 0.01 0.01 0.02 0.02 0.02 0.04
GIV 0.12 0.00 0.12 0.07 0.04 0.12 0.19 0.04 0.23
GV 0.03 0.00 0.03 0.03 0.01 0.04 0.06 0.01 0.07
IA1125 0.12 0.00 0.12 0.07 0.05 0.12 0.19 0.05 0.24
LEAR25 0.02 0.00 0.02 0.02 0.00 0.02 0.04 0.00 0.04
LEAR35 0.58 0.05 0.63 0.54 0.10 0.64 1.12 0.15 1.27
MU3001 0.50 0.03 0.53 0.45 0.09 0.54 0.95 0.12 1.07
PA28 0.02 0.00 0.02 0.02 0.00 0.02 0.05 0.00 0.05
PA30 0.01 0.00 0.01 0.01 0.00 0.01 0.01 0.00 0.01
PA31 0.01 0.00 0.01 0.01 0.01 0.02 0.02 0.01 0.03
PA42 0.01 0.00 0.01 0.01 0.01 0.01 0.02 0.01 0.02
SD330 0.02 0.00 0.02 0.01 0.01 0.02 0.04 0.01 0.05
GeneralAviationTotal
8.05 0.68 8.73 7.35 1.38 8.73 15.40 2.07 17.46
Military
BEC58P 0.01 0.00 0.01 0.01 0.00 0.01 0.02 0.00 0.02
CNA441 0.02 0.00 0.02 0.02 0.00 0.02 0.04 0.00 0.04
MilitaryTotal
0.03 0.00 0.03 0.03 0.00 0.03 0.05 0.00 0.05
Grand Total 8.77 0.75 9.52 7.99 1.52 9.52 16.76 2.27 19.03
Notes:Daytime operations arrive or depart between 7:00 a.m. and 9:59 p.m.; nighttime operations arrive or depart between 10:00 p.m. and6:59 a.m.
For documentation purposes, the numbers of operations are presented to a precision of two digits after the decimal point to shownumbers of operations that are greater than zero but less than 1.Totals may not add up due to rounding.
Prepared: HMMH Inc. August 2013
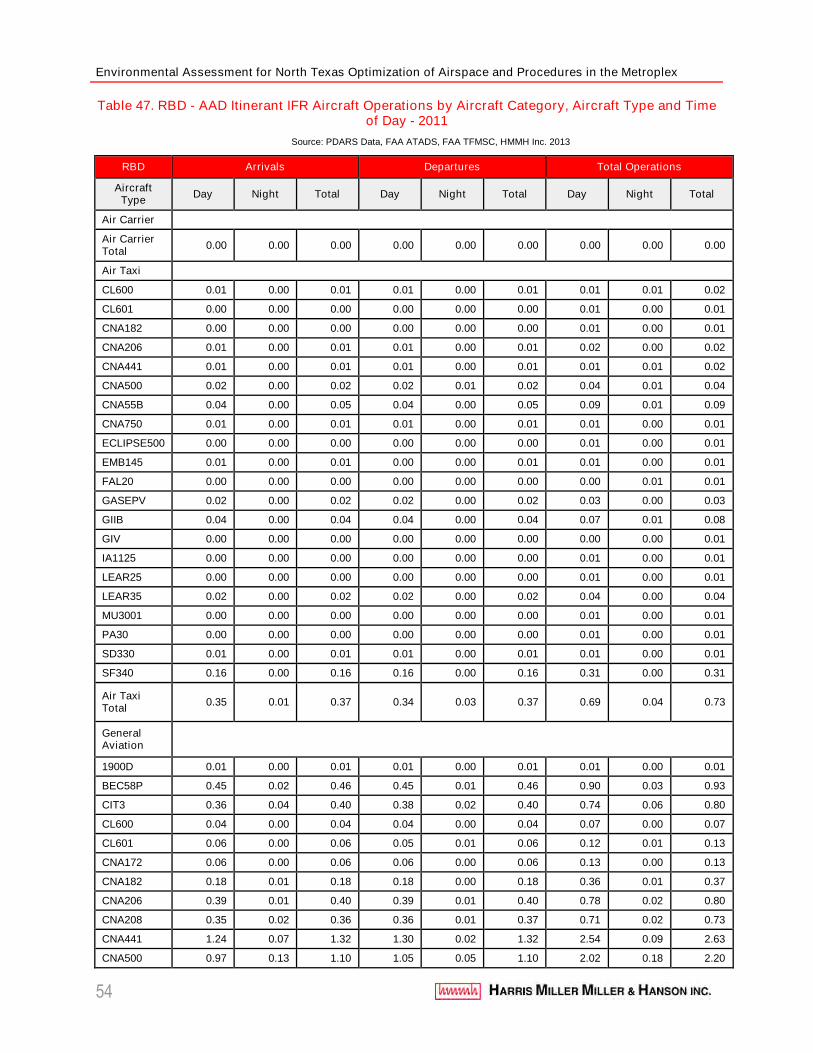
Environmental Assessment for North Texas Optimization of Airspace and Procedures in the Metroplex
54
Table 47. RBD - AAD Itinerant IFR Aircraft Operations by Aircraft Category, Aircraft Type and Timeof Day - 2011
Source: PDARS Data, FAA ATADS, FAA TFMSC, HMMH Inc. 2013
RBD Arrivals Departures Total Operations
AircraftType
Day Night Total Day Night Total Day Night Total
Air Carrier
Air CarrierTotal
0.00 0.00 0.00 0.00 0.00 0.00 0.00 0.00 0.00
Air Taxi
CL600 0.01 0.00 0.01 0.01 0.00 0.01 0.01 0.01 0.02
CL601 0.00 0.00 0.00 0.00 0.00 0.00 0.01 0.00 0.01
CNA182 0.00 0.00 0.00 0.00 0.00 0.00 0.01 0.00 0.01
CNA206 0.01 0.00 0.01 0.01 0.00 0.01 0.02 0.00 0.02
CNA441 0.01 0.00 0.01 0.01 0.00 0.01 0.01 0.01 0.02
CNA500 0.02 0.00 0.02 0.02 0.01 0.02 0.04 0.01 0.04
CNA55B 0.04 0.00 0.05 0.04 0.00 0.05 0.09 0.01 0.09
CNA750 0.01 0.00 0.01 0.01 0.00 0.01 0.01 0.00 0.01
ECLIPSE500 0.00 0.00 0.00 0.00 0.00 0.00 0.01 0.00 0.01
EMB145 0.01 0.00 0.01 0.00 0.00 0.01 0.01 0.00 0.01
FAL20 0.00 0.00 0.00 0.00 0.00 0.00 0.00 0.01 0.01
GASEPV 0.02 0.00 0.02 0.02 0.00 0.02 0.03 0.00 0.03
GIIB 0.04 0.00 0.04 0.04 0.00 0.04 0.07 0.01 0.08
GIV 0.00 0.00 0.00 0.00 0.00 0.00 0.00 0.00 0.01
IA1125 0.00 0.00 0.00 0.00 0.00 0.00 0.01 0.00 0.01
LEAR25 0.00 0.00 0.00 0.00 0.00 0.00 0.01 0.00 0.01
LEAR35 0.02 0.00 0.02 0.02 0.00 0.02 0.04 0.00 0.04
MU3001 0.00 0.00 0.00 0.00 0.00 0.00 0.01 0.00 0.01
PA30 0.00 0.00 0.00 0.00 0.00 0.00 0.01 0.00 0.01
SD330 0.01 0.00 0.01 0.01 0.00 0.01 0.01 0.00 0.01
SF340 0.16 0.00 0.16 0.16 0.00 0.16 0.31 0.00 0.31
Air TaxiTotal
0.35 0.01 0.37 0.34 0.03 0.37 0.69 0.04 0.73
GeneralAviation
1900D 0.01 0.00 0.01 0.01 0.00 0.01 0.01 0.00 0.01
BEC58P 0.45 0.02 0.46 0.45 0.01 0.46 0.90 0.03 0.93
CIT3 0.36 0.04 0.40 0.38 0.02 0.40 0.74 0.06 0.80
CL600 0.04 0.00 0.04 0.04 0.00 0.04 0.07 0.00 0.07
CL601 0.06 0.00 0.06 0.05 0.01 0.06 0.12 0.01 0.13
CNA172 0.06 0.00 0.06 0.06 0.00 0.06 0.13 0.00 0.13
CNA182 0.18 0.01 0.18 0.18 0.00 0.18 0.36 0.01 0.37
CNA206 0.39 0.01 0.40 0.39 0.01 0.40 0.78 0.02 0.80
CNA208 0.35 0.02 0.36 0.36 0.01 0.37 0.71 0.02 0.73
CNA441 1.24 0.07 1.32 1.30 0.02 1.32 2.54 0.09 2.63
CNA500 0.97 0.13 1.10 1.05 0.05 1.10 2.02 0.18 2.20

Average Annual Day Flight Schedules
55
RBD Arrivals Departures Total Operations
AircraftType
Day Night Total Day Night Total Day Night Total
CNA510 0.07 0.00 0.07 0.06 0.01 0.07 0.13 0.01 0.14
CNA55B 0.08 0.00 0.08 0.07 0.01 0.08 0.15 0.01 0.16
CNA750 0.02 0.00 0.02 0.02 0.01 0.02 0.04 0.01 0.04
DO228 0.01 0.00 0.01 0.01 0.00 0.01 0.02 0.00 0.02
ECLIPSE500 0.10 0.01 0.10 0.09 0.01 0.10 0.19 0.02 0.21
F10062 0.03 0.00 0.03 0.03 0.00 0.03 0.05 0.00 0.05
FAL20 0.01 0.00 0.01 0.01 0.00 0.01 0.02 0.00 0.02
GASEPF 0.03 0.00 0.03 0.03 0.00 0.03 0.05 0.00 0.05
GASEPV 0.87 0.01 0.88 0.88 0.00 0.88 1.75 0.01 1.76
GII 0.02 0.00 0.02 0.02 0.00 0.02 0.04 0.00 0.04
GIIB 0.14 0.04 0.17 0.15 0.02 0.17 0.28 0.06 0.34
GIV 0.07 0.01 0.08 0.08 0.00 0.08 0.16 0.01 0.17
GV 0.04 0.00 0.04 0.04 0.00 0.04 0.08 0.00 0.08
HS748A 0.01 0.00 0.01 0.01 0.00 0.01 0.01 0.00 0.01
IA1125 0.06 0.01 0.07 0.07 0.00 0.07 0.13 0.01 0.14
LEAR25 0.01 0.00 0.01 0.01 0.00 0.01 0.02 0.00 0.02
LEAR35 0.33 0.02 0.35 0.25 0.10 0.35 0.58 0.12 0.70
MU3001 0.44 0.02 0.45 0.39 0.06 0.45 0.83 0.07 0.90
PA28 0.02 0.00 0.02 0.02 0.00 0.02 0.03 0.00 0.03
PA31 0.04 0.00 0.04 0.04 0.00 0.04 0.08 0.00 0.08
SD330 0.01 0.00 0.01 0.01 0.00 0.01 0.01 0.00 0.01
SF340 0.01 0.00 0.01 0.01 0.00 0.01 0.01 0.00 0.01
GeneralAviationTotal
6.50 0.40 6.90 6.57 0.33 6.90 13.07 0.73 13.80
Military
CNA441 0.10 0.00 0.10 0.10 0.00 0.10 0.20 0.00 0.20
SD330 0.06 0.00 0.06 0.06 0.00 0.06 0.12 0.00 0.12
MilitaryTotal
0.16 0.00 0.16 0.16 0.00 0.16 0.32 0.00 0.32
Grand Total 7.02 0.41 7.43 7.07 0.36 7.43 14.08 0.77 14.85
Notes:Daytime operations arrive or depart between 7:00 a.m. and 9:59 p.m.; nighttime operations arrive or depart between 10:00 p.m. and6:59 a.m.
For documentation purposes, the numbers of operations are presented to a precision of two digits after the decimal point to shownumbers of operations that are greater than zero but less than 1.Totals may not add up due to rounding.
Prepared: HMMH Inc. August 2013
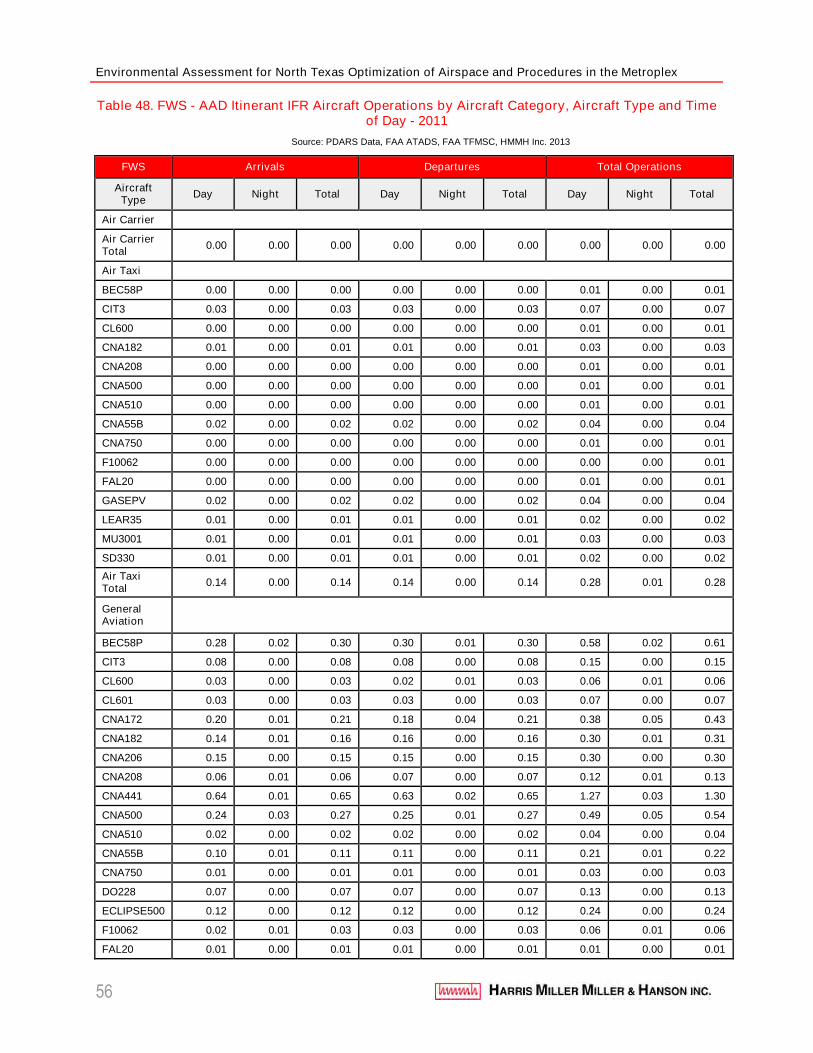
Environmental Assessment for North Texas Optimization of Airspace and Procedures in the Metroplex
56
Table 48. FWS - AAD Itinerant IFR Aircraft Operations by Aircraft Category, Aircraft Type and Timeof Day - 2011
Source: PDARS Data, FAA ATADS, FAA TFMSC, HMMH Inc. 2013
FWS Arrivals Departures Total Operations
AircraftType
Day Night Total Day Night Total Day Night Total
Air Carrier
Air CarrierTotal
0.00 0.00 0.00 0.00 0.00 0.00 0.00 0.00 0.00
Air Taxi
BEC58P 0.00 0.00 0.00 0.00 0.00 0.00 0.01 0.00 0.01
CIT3 0.03 0.00 0.03 0.03 0.00 0.03 0.07 0.00 0.07
CL600 0.00 0.00 0.00 0.00 0.00 0.00 0.01 0.00 0.01
CNA182 0.01 0.00 0.01 0.01 0.00 0.01 0.03 0.00 0.03
CNA208 0.00 0.00 0.00 0.00 0.00 0.00 0.01 0.00 0.01
CNA500 0.00 0.00 0.00 0.00 0.00 0.00 0.01 0.00 0.01
CNA510 0.00 0.00 0.00 0.00 0.00 0.00 0.01 0.00 0.01
CNA55B 0.02 0.00 0.02 0.02 0.00 0.02 0.04 0.00 0.04
CNA750 0.00 0.00 0.00 0.00 0.00 0.00 0.01 0.00 0.01
F10062 0.00 0.00 0.00 0.00 0.00 0.00 0.00 0.00 0.01
FAL20 0.00 0.00 0.00 0.00 0.00 0.00 0.01 0.00 0.01
GASEPV 0.02 0.00 0.02 0.02 0.00 0.02 0.04 0.00 0.04
LEAR35 0.01 0.00 0.01 0.01 0.00 0.01 0.02 0.00 0.02
MU3001 0.01 0.00 0.01 0.01 0.00 0.01 0.03 0.00 0.03
SD330 0.01 0.00 0.01 0.01 0.00 0.01 0.02 0.00 0.02
Air TaxiTotal
0.14 0.00 0.14 0.14 0.00 0.14 0.28 0.01 0.28
GeneralAviation
BEC58P 0.28 0.02 0.30 0.30 0.01 0.30 0.58 0.02 0.61
CIT3 0.08 0.00 0.08 0.08 0.00 0.08 0.15 0.00 0.15
CL600 0.03 0.00 0.03 0.02 0.01 0.03 0.06 0.01 0.06
CL601 0.03 0.00 0.03 0.03 0.00 0.03 0.07 0.00 0.07
CNA172 0.20 0.01 0.21 0.18 0.04 0.21 0.38 0.05 0.43
CNA182 0.14 0.01 0.16 0.16 0.00 0.16 0.30 0.01 0.31
CNA206 0.15 0.00 0.15 0.15 0.00 0.15 0.30 0.00 0.30
CNA208 0.06 0.01 0.06 0.07 0.00 0.07 0.12 0.01 0.13
CNA441 0.64 0.01 0.65 0.63 0.02 0.65 1.27 0.03 1.30
CNA500 0.24 0.03 0.27 0.25 0.01 0.27 0.49 0.05 0.54
CNA510 0.02 0.00 0.02 0.02 0.00 0.02 0.04 0.00 0.04
CNA55B 0.10 0.01 0.11 0.11 0.00 0.11 0.21 0.01 0.22
CNA750 0.01 0.00 0.01 0.01 0.00 0.01 0.03 0.00 0.03
DO228 0.07 0.00 0.07 0.07 0.00 0.07 0.13 0.00 0.13
ECLIPSE500 0.12 0.00 0.12 0.12 0.00 0.12 0.24 0.00 0.24
F10062 0.02 0.01 0.03 0.03 0.00 0.03 0.06 0.01 0.06
FAL20 0.01 0.00 0.01 0.01 0.00 0.01 0.01 0.00 0.01
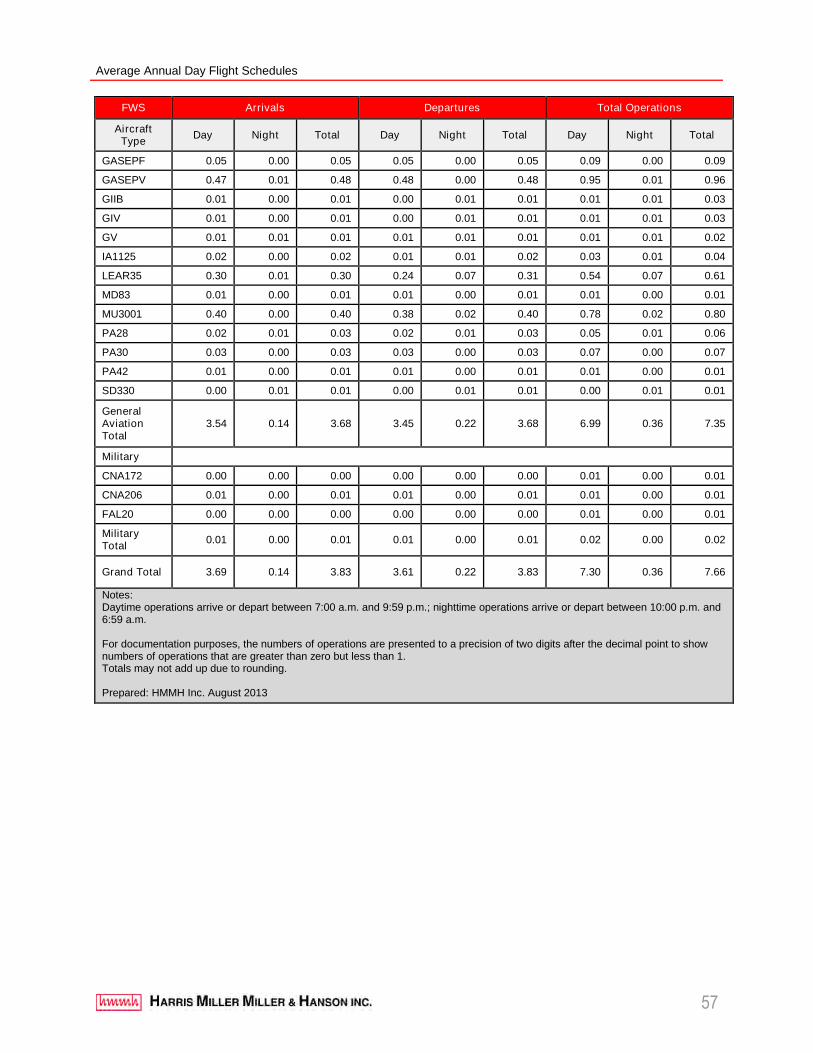
Average Annual Day Flight Schedules
57
FWS Arrivals Departures Total Operations
AircraftType
Day Night Total Day Night Total Day Night Total
GASEPF 0.05 0.00 0.05 0.05 0.00 0.05 0.09 0.00 0.09
GASEPV 0.47 0.01 0.48 0.48 0.00 0.48 0.95 0.01 0.96
GIIB 0.01 0.00 0.01 0.00 0.01 0.01 0.01 0.01 0.03
GIV 0.01 0.00 0.01 0.00 0.01 0.01 0.01 0.01 0.03
GV 0.01 0.01 0.01 0.01 0.01 0.01 0.01 0.01 0.02
IA1125 0.02 0.00 0.02 0.01 0.01 0.02 0.03 0.01 0.04
LEAR35 0.30 0.01 0.30 0.24 0.07 0.31 0.54 0.07 0.61
MD83 0.01 0.00 0.01 0.01 0.00 0.01 0.01 0.00 0.01
MU3001 0.40 0.00 0.40 0.38 0.02 0.40 0.78 0.02 0.80
PA28 0.02 0.01 0.03 0.02 0.01 0.03 0.05 0.01 0.06
PA30 0.03 0.00 0.03 0.03 0.00 0.03 0.07 0.00 0.07
PA42 0.01 0.00 0.01 0.01 0.00 0.01 0.01 0.00 0.01
SD330 0.00 0.01 0.01 0.00 0.01 0.01 0.00 0.01 0.01
GeneralAviationTotal
3.54 0.14 3.68 3.45 0.22 3.68 6.99 0.36 7.35
Military
CNA172 0.00 0.00 0.00 0.00 0.00 0.00 0.01 0.00 0.01
CNA206 0.01 0.00 0.01 0.01 0.00 0.01 0.01 0.00 0.01
FAL20 0.00 0.00 0.00 0.00 0.00 0.00 0.01 0.00 0.01
MilitaryTotal
0.01 0.00 0.01 0.01 0.00 0.01 0.02 0.00 0.02
Grand Total 3.69 0.14 3.83 3.61 0.22 3.83 7.30 0.36 7.66
Notes:Daytime operations arrive or depart between 7:00 a.m. and 9:59 p.m.; nighttime operations arrive or depart between 10:00 p.m. and6:59 a.m.
For documentation purposes, the numbers of operations are presented to a precision of two digits after the decimal point to shownumbers of operations that are greater than zero but less than 1.Totals may not add up due to rounding.
Prepared: HMMH Inc. August 2013
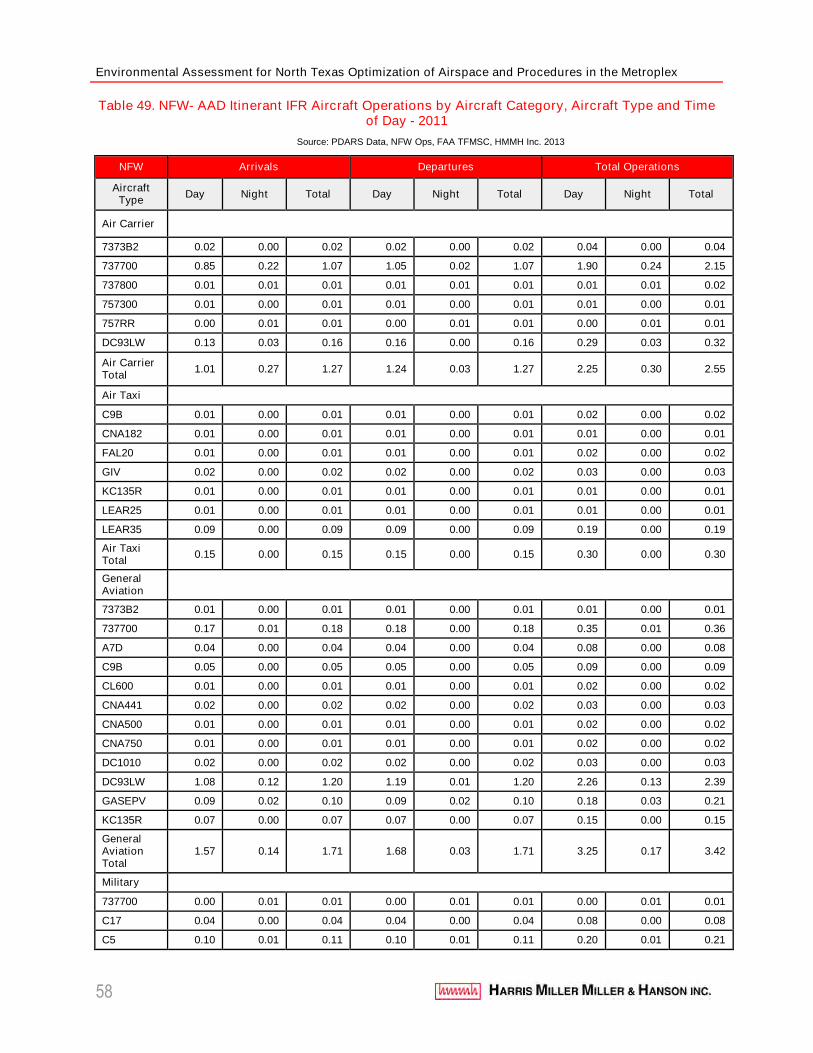
Environmental Assessment for North Texas Optimization of Airspace and Procedures in the Metroplex
58
Table 49. NFW- AAD Itinerant IFR Aircraft Operations by Aircraft Category, Aircraft Type and Timeof Day - 2011
Source: PDARS Data, NFW Ops, FAA TFMSC, HMMH Inc. 2013
NFW Arrivals Departures Total Operations
AircraftType
Day Night Total Day Night Total Day Night Total
Air Carrier
7373B2 0.02 0.00 0.02 0.02 0.00 0.02 0.04 0.00 0.04
737700 0.85 0.22 1.07 1.05 0.02 1.07 1.90 0.24 2.15
737800 0.01 0.01 0.01 0.01 0.01 0.01 0.01 0.01 0.02
757300 0.01 0.00 0.01 0.01 0.00 0.01 0.01 0.00 0.01
757RR 0.00 0.01 0.01 0.00 0.01 0.01 0.00 0.01 0.01
DC93LW 0.13 0.03 0.16 0.16 0.00 0.16 0.29 0.03 0.32
Air CarrierTotal
1.01 0.27 1.27 1.24 0.03 1.27 2.25 0.30 2.55
Air Taxi
C9B 0.01 0.00 0.01 0.01 0.00 0.01 0.02 0.00 0.02
CNA182 0.01 0.00 0.01 0.01 0.00 0.01 0.01 0.00 0.01
FAL20 0.01 0.00 0.01 0.01 0.00 0.01 0.02 0.00 0.02
GIV 0.02 0.00 0.02 0.02 0.00 0.02 0.03 0.00 0.03
KC135R 0.01 0.00 0.01 0.01 0.00 0.01 0.01 0.00 0.01
LEAR25 0.01 0.00 0.01 0.01 0.00 0.01 0.01 0.00 0.01
LEAR35 0.09 0.00 0.09 0.09 0.00 0.09 0.19 0.00 0.19
Air TaxiTotal
0.15 0.00 0.15 0.15 0.00 0.15 0.30 0.00 0.30
GeneralAviation
7373B2 0.01 0.00 0.01 0.01 0.00 0.01 0.01 0.00 0.01
737700 0.17 0.01 0.18 0.18 0.00 0.18 0.35 0.01 0.36
A7D 0.04 0.00 0.04 0.04 0.00 0.04 0.08 0.00 0.08
C9B 0.05 0.00 0.05 0.05 0.00 0.05 0.09 0.00 0.09
CL600 0.01 0.00 0.01 0.01 0.00 0.01 0.02 0.00 0.02
CNA441 0.02 0.00 0.02 0.02 0.00 0.02 0.03 0.00 0.03
CNA500 0.01 0.00 0.01 0.01 0.00 0.01 0.02 0.00 0.02
CNA750 0.01 0.00 0.01 0.01 0.00 0.01 0.02 0.00 0.02
DC1010 0.02 0.00 0.02 0.02 0.00 0.02 0.03 0.00 0.03
DC93LW 1.08 0.12 1.20 1.19 0.01 1.20 2.26 0.13 2.39
GASEPV 0.09 0.02 0.10 0.09 0.02 0.10 0.18 0.03 0.21
KC135R 0.07 0.00 0.07 0.07 0.00 0.07 0.15 0.00 0.15
GeneralAviationTotal
1.57 0.14 1.71 1.68 0.03 1.71 3.25 0.17 3.42
Military
737700 0.00 0.01 0.01 0.00 0.01 0.01 0.00 0.01 0.01
C17 0.04 0.00 0.04 0.04 0.00 0.04 0.08 0.00 0.08
C5 0.10 0.01 0.11 0.10 0.01 0.11 0.20 0.01 0.21
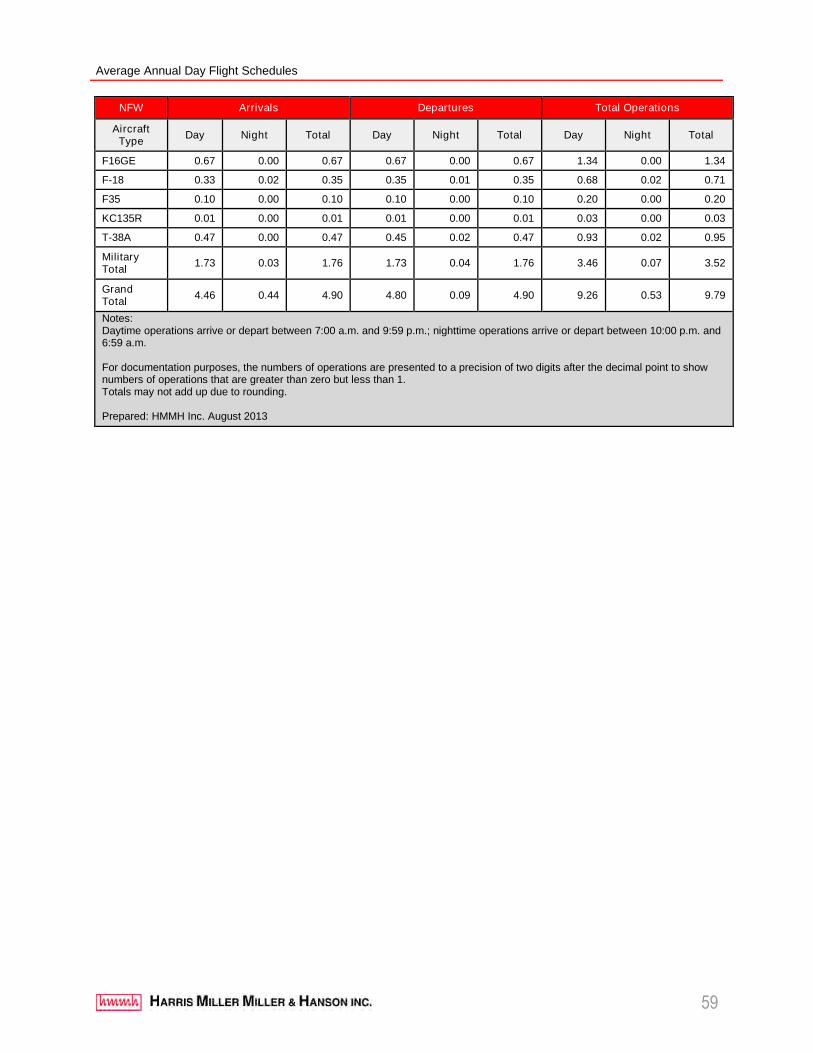
Average Annual Day Flight Schedules
59
NFW Arrivals Departures Total Operations
AircraftType
Day Night Total Day Night Total Day Night Total
F16GE 0.67 0.00 0.67 0.67 0.00 0.67 1.34 0.00 1.34
F-18 0.33 0.02 0.35 0.35 0.01 0.35 0.68 0.02 0.71
F35 0.10 0.00 0.10 0.10 0.00 0.10 0.20 0.00 0.20
KC135R 0.01 0.00 0.01 0.01 0.00 0.01 0.03 0.00 0.03
T-38A 0.47 0.00 0.47 0.45 0.02 0.47 0.93 0.02 0.95
MilitaryTotal
1.73 0.03 1.76 1.73 0.04 1.76 3.46 0.07 3.52
GrandTotal
4.46 0.44 4.90 4.80 0.09 4.90 9.26 0.53 9.79
Notes:Daytime operations arrive or depart between 7:00 a.m. and 9:59 p.m.; nighttime operations arrive or depart between 10:00 p.m. and6:59 a.m.
For documentation purposes, the numbers of operations are presented to a precision of two digits after the decimal point to shownumbers of operations that are greater than zero but less than 1.Totals may not add up due to rounding.
Prepared: HMMH Inc. August 2013
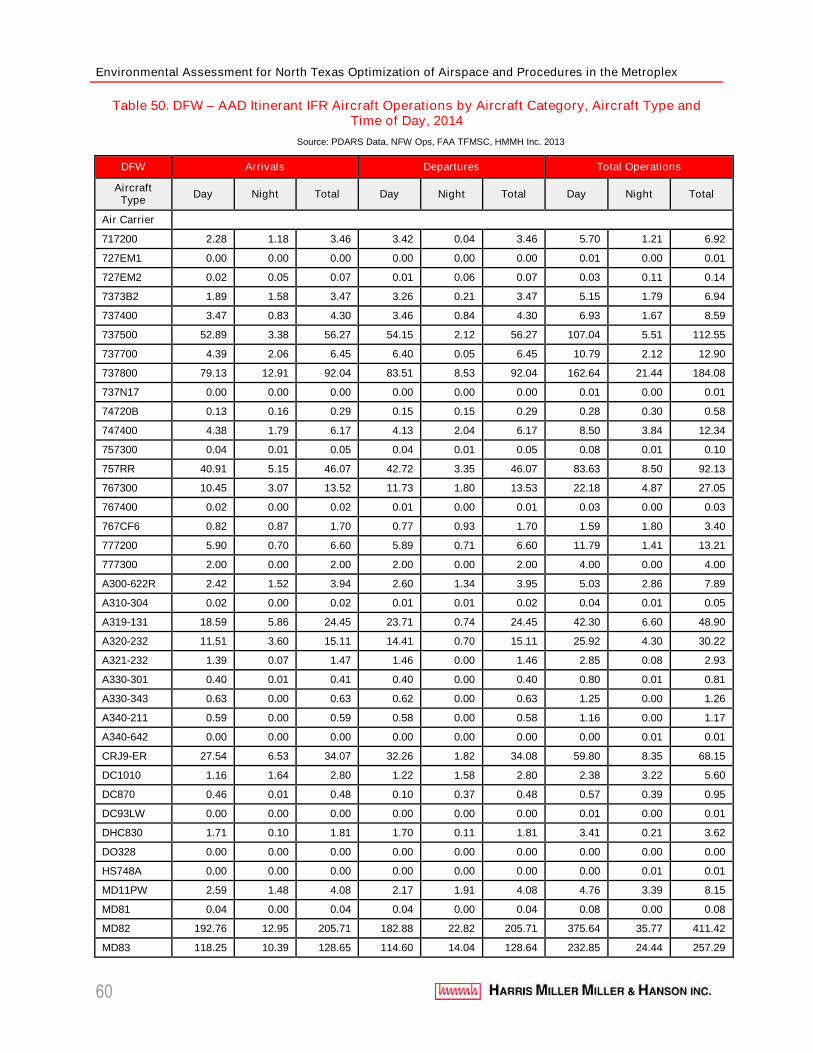
Environmental Assessment for North Texas Optimization of Airspace and Procedures in the Metroplex
60
Table 50. DFW – AAD Itinerant IFR Aircraft Operations by Aircraft Category, Aircraft Type andTime of Day, 2014
Source: PDARS Data, NFW Ops, FAA TFMSC, HMMH Inc. 2013
DFW Arrivals Departures Total Operations
AircraftType
Day Night Total Day Night Total Day Night Total
Air Carrier
717200 2.28 1.18 3.46 3.42 0.04 3.46 5.70 1.21 6.92
727EM1 0.00 0.00 0.00 0.00 0.00 0.00 0.01 0.00 0.01
727EM2 0.02 0.05 0.07 0.01 0.06 0.07 0.03 0.11 0.14
7373B2 1.89 1.58 3.47 3.26 0.21 3.47 5.15 1.79 6.94
737400 3.47 0.83 4.30 3.46 0.84 4.30 6.93 1.67 8.59
737500 52.89 3.38 56.27 54.15 2.12 56.27 107.04 5.51 112.55
737700 4.39 2.06 6.45 6.40 0.05 6.45 10.79 2.12 12.90
737800 79.13 12.91 92.04 83.51 8.53 92.04 162.64 21.44 184.08
737N17 0.00 0.00 0.00 0.00 0.00 0.00 0.01 0.00 0.01
74720B 0.13 0.16 0.29 0.15 0.15 0.29 0.28 0.30 0.58
747400 4.38 1.79 6.17 4.13 2.04 6.17 8.50 3.84 12.34
757300 0.04 0.01 0.05 0.04 0.01 0.05 0.08 0.01 0.10
757RR 40.91 5.15 46.07 42.72 3.35 46.07 83.63 8.50 92.13
767300 10.45 3.07 13.52 11.73 1.80 13.53 22.18 4.87 27.05
767400 0.02 0.00 0.02 0.01 0.00 0.01 0.03 0.00 0.03
767CF6 0.82 0.87 1.70 0.77 0.93 1.70 1.59 1.80 3.40
777200 5.90 0.70 6.60 5.89 0.71 6.60 11.79 1.41 13.21
777300 2.00 0.00 2.00 2.00 0.00 2.00 4.00 0.00 4.00
A300-622R 2.42 1.52 3.94 2.60 1.34 3.95 5.03 2.86 7.89
A310-304 0.02 0.00 0.02 0.01 0.01 0.02 0.04 0.01 0.05
A319-131 18.59 5.86 24.45 23.71 0.74 24.45 42.30 6.60 48.90
A320-232 11.51 3.60 15.11 14.41 0.70 15.11 25.92 4.30 30.22
A321-232 1.39 0.07 1.47 1.46 0.00 1.46 2.85 0.08 2.93
A330-301 0.40 0.01 0.41 0.40 0.00 0.40 0.80 0.01 0.81
A330-343 0.63 0.00 0.63 0.62 0.00 0.63 1.25 0.00 1.26
A340-211 0.59 0.00 0.59 0.58 0.00 0.58 1.16 0.00 1.17
A340-642 0.00 0.00 0.00 0.00 0.00 0.00 0.00 0.01 0.01
CRJ9-ER 27.54 6.53 34.07 32.26 1.82 34.08 59.80 8.35 68.15
DC1010 1.16 1.64 2.80 1.22 1.58 2.80 2.38 3.22 5.60
DC870 0.46 0.01 0.48 0.10 0.37 0.48 0.57 0.39 0.95
DC93LW 0.00 0.00 0.00 0.00 0.00 0.00 0.01 0.00 0.01
DHC830 1.71 0.10 1.81 1.70 0.11 1.81 3.41 0.21 3.62
DO328 0.00 0.00 0.00 0.00 0.00 0.00 0.00 0.00 0.00
HS748A 0.00 0.00 0.00 0.00 0.00 0.00 0.00 0.01 0.01
MD11PW 2.59 1.48 4.08 2.17 1.91 4.08 4.76 3.39 8.15
MD81 0.04 0.00 0.04 0.04 0.00 0.04 0.08 0.00 0.08
MD82 192.76 12.95 205.71 182.88 22.82 205.71 375.64 35.77 411.42
MD83 118.25 10.39 128.65 114.60 14.04 128.64 232.85 24.44 257.29
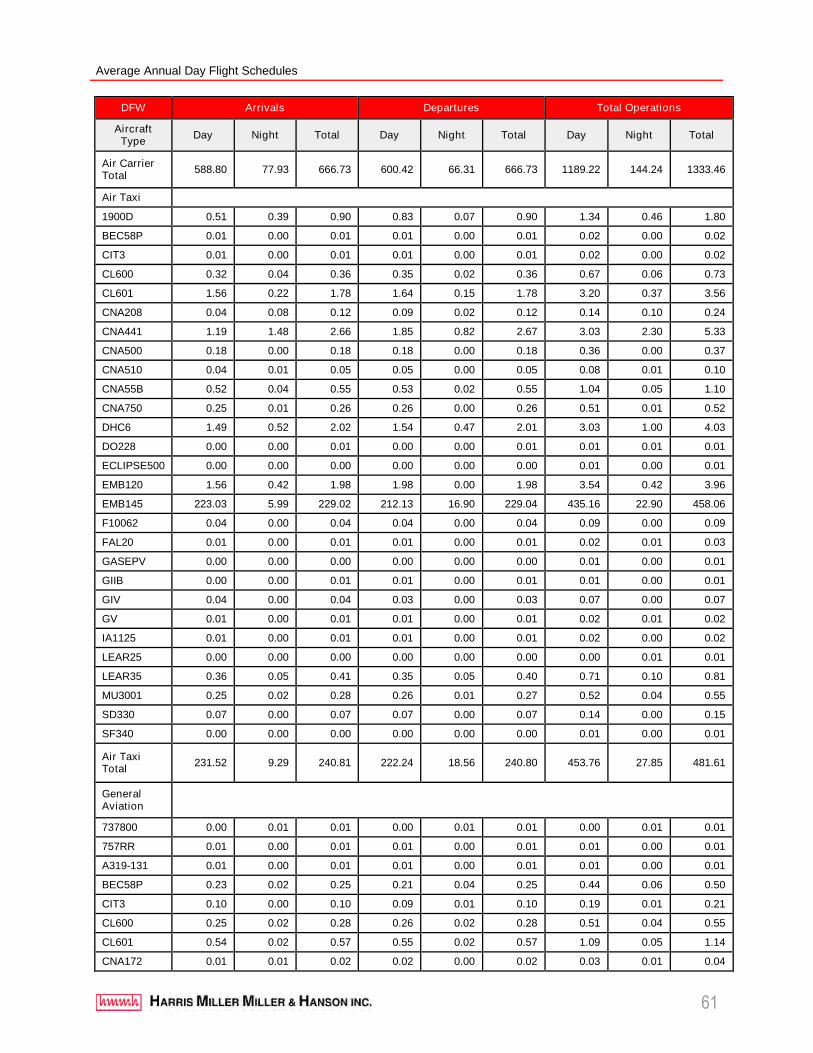
Average Annual Day Flight Schedules
61
DFW Arrivals Departures Total Operations
AircraftType
Day Night Total Day Night Total Day Night Total
Air CarrierTotal
588.80 77.93 666.73 600.42 66.31 666.73 1189.22 144.24 1333.46
Air Taxi
1900D 0.51 0.39 0.90 0.83 0.07 0.90 1.34 0.46 1.80
BEC58P 0.01 0.00 0.01 0.01 0.00 0.01 0.02 0.00 0.02
CIT3 0.01 0.00 0.01 0.01 0.00 0.01 0.02 0.00 0.02
CL600 0.32 0.04 0.36 0.35 0.02 0.36 0.67 0.06 0.73
CL601 1.56 0.22 1.78 1.64 0.15 1.78 3.20 0.37 3.56
CNA208 0.04 0.08 0.12 0.09 0.02 0.12 0.14 0.10 0.24
CNA441 1.19 1.48 2.66 1.85 0.82 2.67 3.03 2.30 5.33
CNA500 0.18 0.00 0.18 0.18 0.00 0.18 0.36 0.00 0.37
CNA510 0.04 0.01 0.05 0.05 0.00 0.05 0.08 0.01 0.10
CNA55B 0.52 0.04 0.55 0.53 0.02 0.55 1.04 0.05 1.10
CNA750 0.25 0.01 0.26 0.26 0.00 0.26 0.51 0.01 0.52
DHC6 1.49 0.52 2.02 1.54 0.47 2.01 3.03 1.00 4.03
DO228 0.00 0.00 0.01 0.00 0.00 0.01 0.01 0.01 0.01
ECLIPSE500 0.00 0.00 0.00 0.00 0.00 0.00 0.01 0.00 0.01
EMB120 1.56 0.42 1.98 1.98 0.00 1.98 3.54 0.42 3.96
EMB145 223.03 5.99 229.02 212.13 16.90 229.04 435.16 22.90 458.06
F10062 0.04 0.00 0.04 0.04 0.00 0.04 0.09 0.00 0.09
FAL20 0.01 0.00 0.01 0.01 0.00 0.01 0.02 0.01 0.03
GASEPV 0.00 0.00 0.00 0.00 0.00 0.00 0.01 0.00 0.01
GIIB 0.00 0.00 0.01 0.01 0.00 0.01 0.01 0.00 0.01
GIV 0.04 0.00 0.04 0.03 0.00 0.03 0.07 0.00 0.07
GV 0.01 0.00 0.01 0.01 0.00 0.01 0.02 0.01 0.02
IA1125 0.01 0.00 0.01 0.01 0.00 0.01 0.02 0.00 0.02
LEAR25 0.00 0.00 0.00 0.00 0.00 0.00 0.00 0.01 0.01
LEAR35 0.36 0.05 0.41 0.35 0.05 0.40 0.71 0.10 0.81
MU3001 0.25 0.02 0.28 0.26 0.01 0.27 0.52 0.04 0.55
SD330 0.07 0.00 0.07 0.07 0.00 0.07 0.14 0.00 0.15
SF340 0.00 0.00 0.00 0.00 0.00 0.00 0.01 0.00 0.01
Air TaxiTotal
231.52 9.29 240.81 222.24 18.56 240.80 453.76 27.85 481.61
GeneralAviation
737800 0.00 0.01 0.01 0.00 0.01 0.01 0.00 0.01 0.01
757RR 0.01 0.00 0.01 0.01 0.00 0.01 0.01 0.00 0.01
A319-131 0.01 0.00 0.01 0.01 0.00 0.01 0.01 0.00 0.01
BEC58P 0.23 0.02 0.25 0.21 0.04 0.25 0.44 0.06 0.50
CIT3 0.10 0.00 0.10 0.09 0.01 0.10 0.19 0.01 0.21
CL600 0.25 0.02 0.28 0.26 0.02 0.28 0.51 0.04 0.55
CL601 0.54 0.02 0.57 0.55 0.02 0.57 1.09 0.05 1.14
CNA172 0.01 0.01 0.02 0.02 0.00 0.02 0.03 0.01 0.04
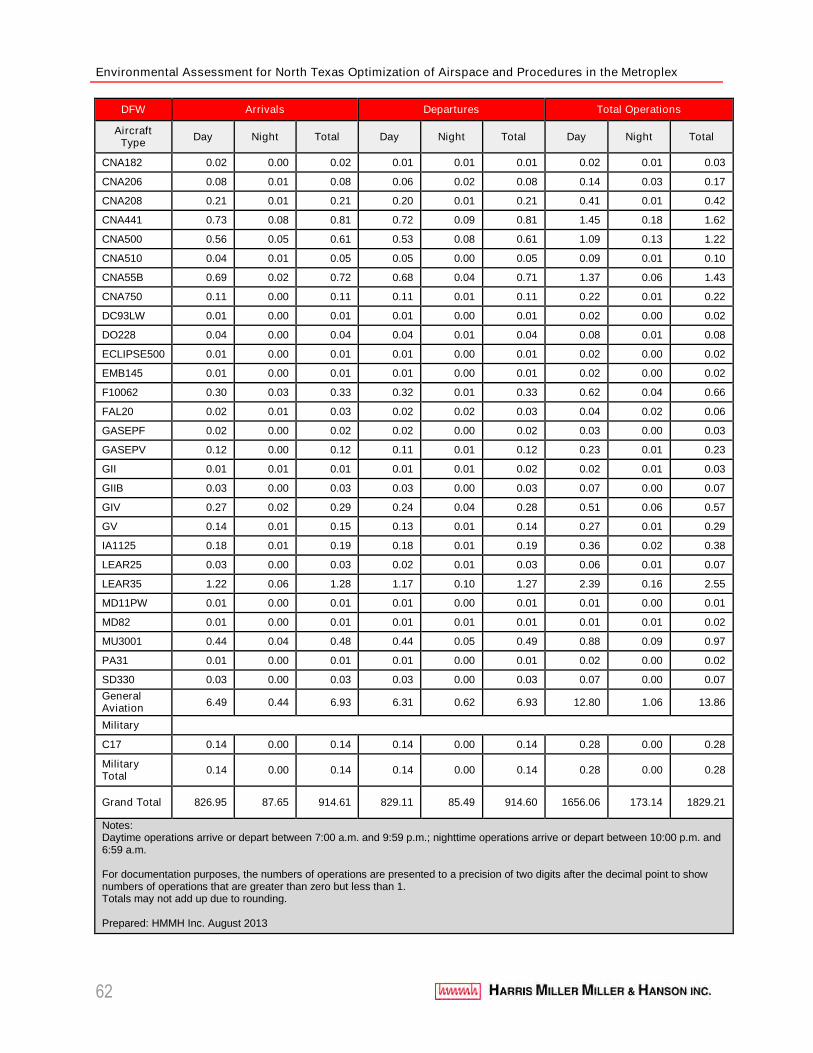
Environmental Assessment for North Texas Optimization of Airspace and Procedures in the Metroplex
62
DFW Arrivals Departures Total Operations
AircraftType
Day Night Total Day Night Total Day Night Total
CNA182 0.02 0.00 0.02 0.01 0.01 0.01 0.02 0.01 0.03
CNA206 0.08 0.01 0.08 0.06 0.02 0.08 0.14 0.03 0.17
CNA208 0.21 0.01 0.21 0.20 0.01 0.21 0.41 0.01 0.42
CNA441 0.73 0.08 0.81 0.72 0.09 0.81 1.45 0.18 1.62
CNA500 0.56 0.05 0.61 0.53 0.08 0.61 1.09 0.13 1.22
CNA510 0.04 0.01 0.05 0.05 0.00 0.05 0.09 0.01 0.10
CNA55B 0.69 0.02 0.72 0.68 0.04 0.71 1.37 0.06 1.43
CNA750 0.11 0.00 0.11 0.11 0.01 0.11 0.22 0.01 0.22
DC93LW 0.01 0.00 0.01 0.01 0.00 0.01 0.02 0.00 0.02
DO228 0.04 0.00 0.04 0.04 0.01 0.04 0.08 0.01 0.08
ECLIPSE500 0.01 0.00 0.01 0.01 0.00 0.01 0.02 0.00 0.02
EMB145 0.01 0.00 0.01 0.01 0.00 0.01 0.02 0.00 0.02
F10062 0.30 0.03 0.33 0.32 0.01 0.33 0.62 0.04 0.66
FAL20 0.02 0.01 0.03 0.02 0.02 0.03 0.04 0.02 0.06
GASEPF 0.02 0.00 0.02 0.02 0.00 0.02 0.03 0.00 0.03
GASEPV 0.12 0.00 0.12 0.11 0.01 0.12 0.23 0.01 0.23
GII 0.01 0.01 0.01 0.01 0.01 0.02 0.02 0.01 0.03
GIIB 0.03 0.00 0.03 0.03 0.00 0.03 0.07 0.00 0.07
GIV 0.27 0.02 0.29 0.24 0.04 0.28 0.51 0.06 0.57
GV 0.14 0.01 0.15 0.13 0.01 0.14 0.27 0.01 0.29
IA1125 0.18 0.01 0.19 0.18 0.01 0.19 0.36 0.02 0.38
LEAR25 0.03 0.00 0.03 0.02 0.01 0.03 0.06 0.01 0.07
LEAR35 1.22 0.06 1.28 1.17 0.10 1.27 2.39 0.16 2.55
MD11PW 0.01 0.00 0.01 0.01 0.00 0.01 0.01 0.00 0.01
MD82 0.01 0.00 0.01 0.01 0.01 0.01 0.01 0.01 0.02
MU3001 0.44 0.04 0.48 0.44 0.05 0.49 0.88 0.09 0.97
PA31 0.01 0.00 0.01 0.01 0.00 0.01 0.02 0.00 0.02
SD330 0.03 0.00 0.03 0.03 0.00 0.03 0.07 0.00 0.07
GeneralAviationTotal
6.49 0.44 6.93 6.31 0.62 6.93 12.80 1.06 13.86
Military
C17 0.14 0.00 0.14 0.14 0.00 0.14 0.28 0.00 0.28
MilitaryTotal
0.14 0.00 0.14 0.14 0.00 0.14 0.28 0.00 0.28
Grand Total 826.95 87.65 914.61 829.11 85.49 914.60 1656.06 173.14 1829.21
Notes:Daytime operations arrive or depart between 7:00 a.m. and 9:59 p.m.; nighttime operations arrive or depart between 10:00 p.m. and6:59 a.m.
For documentation purposes, the numbers of operations are presented to a precision of two digits after the decimal point to shownumbers of operations that are greater than zero but less than 1.Totals may not add up due to rounding.
Prepared: HMMH Inc. August 2013
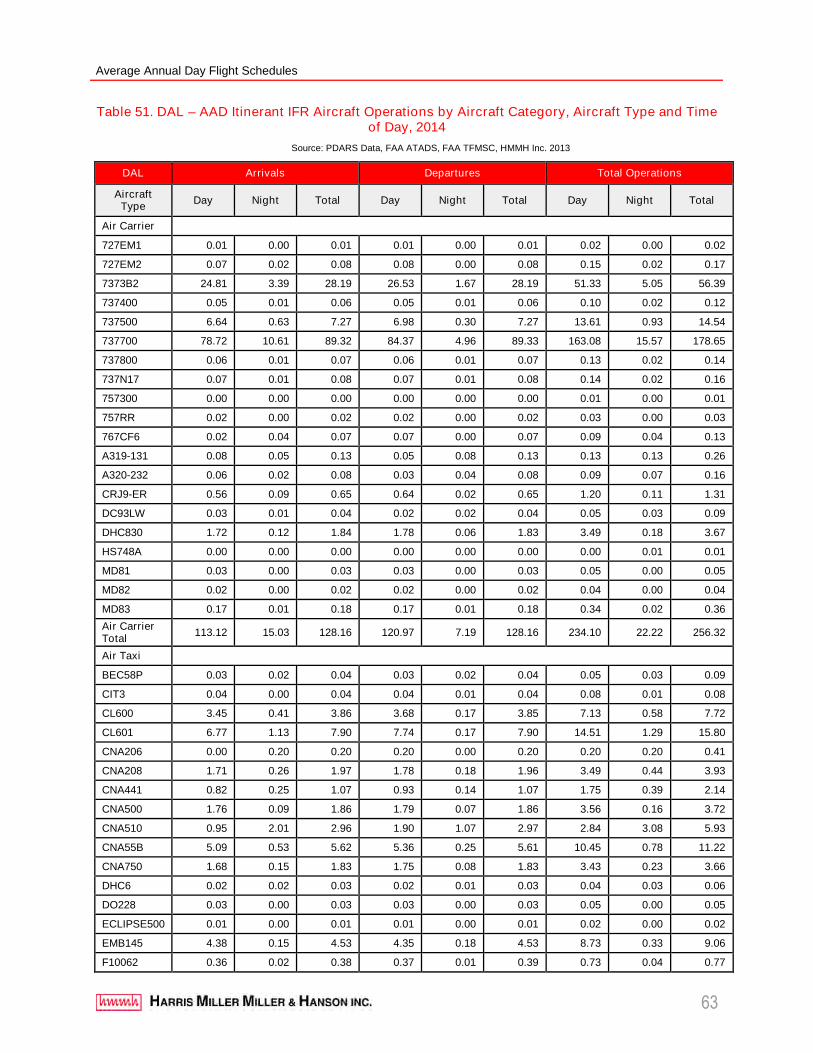
Average Annual Day Flight Schedules
63
Table 51. DAL – AAD Itinerant IFR Aircraft Operations by Aircraft Category, Aircraft Type and Timeof Day, 2014
Source: PDARS Data, FAA ATADS, FAA TFMSC, HMMH Inc. 2013
DAL Arrivals Departures Total Operations
AircraftType
Day Night Total Day Night Total Day Night Total
Air Carrier
727EM1 0.01 0.00 0.01 0.01 0.00 0.01 0.02 0.00 0.02
727EM2 0.07 0.02 0.08 0.08 0.00 0.08 0.15 0.02 0.17
7373B2 24.81 3.39 28.19 26.53 1.67 28.19 51.33 5.05 56.39
737400 0.05 0.01 0.06 0.05 0.01 0.06 0.10 0.02 0.12
737500 6.64 0.63 7.27 6.98 0.30 7.27 13.61 0.93 14.54
737700 78.72 10.61 89.32 84.37 4.96 89.33 163.08 15.57 178.65
737800 0.06 0.01 0.07 0.06 0.01 0.07 0.13 0.02 0.14
737N17 0.07 0.01 0.08 0.07 0.01 0.08 0.14 0.02 0.16
757300 0.00 0.00 0.00 0.00 0.00 0.00 0.01 0.00 0.01
757RR 0.02 0.00 0.02 0.02 0.00 0.02 0.03 0.00 0.03
767CF6 0.02 0.04 0.07 0.07 0.00 0.07 0.09 0.04 0.13
A319-131 0.08 0.05 0.13 0.05 0.08 0.13 0.13 0.13 0.26
A320-232 0.06 0.02 0.08 0.03 0.04 0.08 0.09 0.07 0.16
CRJ9-ER 0.56 0.09 0.65 0.64 0.02 0.65 1.20 0.11 1.31
DC93LW 0.03 0.01 0.04 0.02 0.02 0.04 0.05 0.03 0.09
DHC830 1.72 0.12 1.84 1.78 0.06 1.83 3.49 0.18 3.67
HS748A 0.00 0.00 0.00 0.00 0.00 0.00 0.00 0.01 0.01
MD81 0.03 0.00 0.03 0.03 0.00 0.03 0.05 0.00 0.05
MD82 0.02 0.00 0.02 0.02 0.00 0.02 0.04 0.00 0.04
MD83 0.17 0.01 0.18 0.17 0.01 0.18 0.34 0.02 0.36
Air CarrierTotal
113.12 15.03 128.16 120.97 7.19 128.16 234.10 22.22 256.32
Air Taxi
BEC58P 0.03 0.02 0.04 0.03 0.02 0.04 0.05 0.03 0.09
CIT3 0.04 0.00 0.04 0.04 0.01 0.04 0.08 0.01 0.08
CL600 3.45 0.41 3.86 3.68 0.17 3.85 7.13 0.58 7.72
CL601 6.77 1.13 7.90 7.74 0.17 7.90 14.51 1.29 15.80
CNA206 0.00 0.20 0.20 0.20 0.00 0.20 0.20 0.20 0.41
CNA208 1.71 0.26 1.97 1.78 0.18 1.96 3.49 0.44 3.93
CNA441 0.82 0.25 1.07 0.93 0.14 1.07 1.75 0.39 2.14
CNA500 1.76 0.09 1.86 1.79 0.07 1.86 3.56 0.16 3.72
CNA510 0.95 2.01 2.96 1.90 1.07 2.97 2.84 3.08 5.93
CNA55B 5.09 0.53 5.62 5.36 0.25 5.61 10.45 0.78 11.22
CNA750 1.68 0.15 1.83 1.75 0.08 1.83 3.43 0.23 3.66
DHC6 0.02 0.02 0.03 0.02 0.01 0.03 0.04 0.03 0.06
DO228 0.03 0.00 0.03 0.03 0.00 0.03 0.05 0.00 0.05
ECLIPSE500 0.01 0.00 0.01 0.01 0.00 0.01 0.02 0.00 0.02
EMB145 4.38 0.15 4.53 4.35 0.18 4.53 8.73 0.33 9.06
F10062 0.36 0.02 0.38 0.37 0.01 0.39 0.73 0.04 0.77
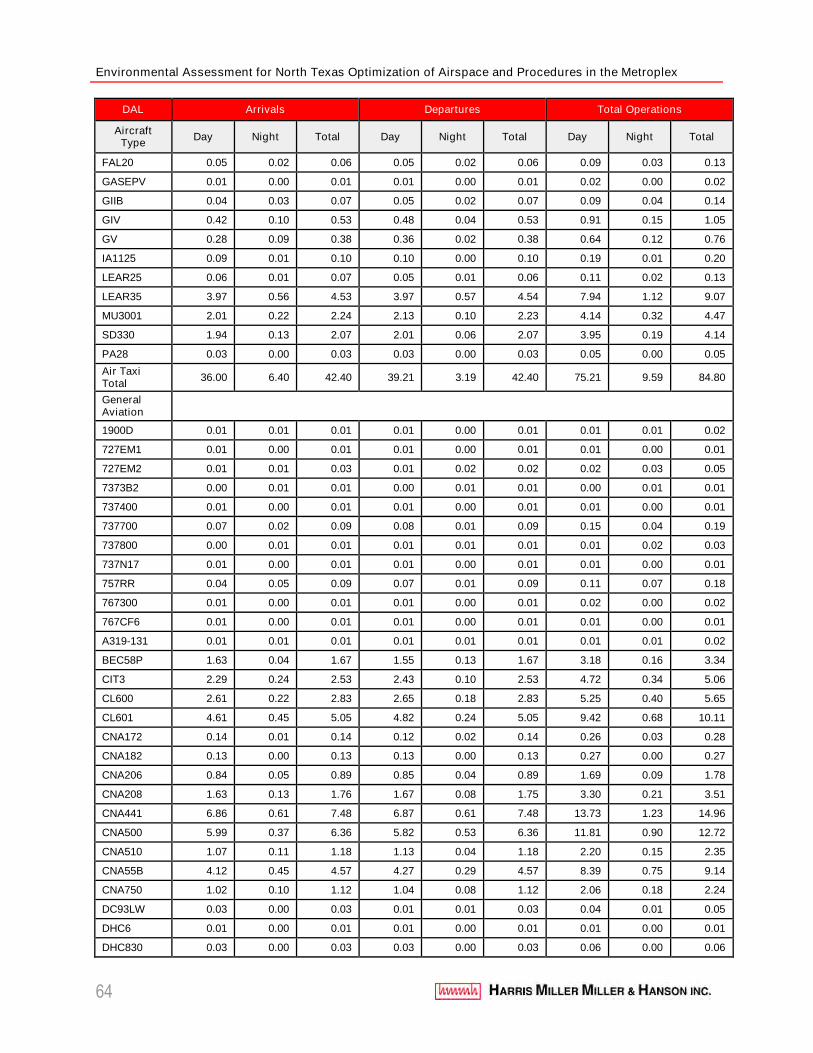
Environmental Assessment for North Texas Optimization of Airspace and Procedures in the Metroplex
64
DAL Arrivals Departures Total Operations
AircraftType
Day Night Total Day Night Total Day Night Total
FAL20 0.05 0.02 0.06 0.05 0.02 0.06 0.09 0.03 0.13
GASEPV 0.01 0.00 0.01 0.01 0.00 0.01 0.02 0.00 0.02
GIIB 0.04 0.03 0.07 0.05 0.02 0.07 0.09 0.04 0.14
GIV 0.42 0.10 0.53 0.48 0.04 0.53 0.91 0.15 1.05
GV 0.28 0.09 0.38 0.36 0.02 0.38 0.64 0.12 0.76
IA1125 0.09 0.01 0.10 0.10 0.00 0.10 0.19 0.01 0.20
LEAR25 0.06 0.01 0.07 0.05 0.01 0.06 0.11 0.02 0.13
LEAR35 3.97 0.56 4.53 3.97 0.57 4.54 7.94 1.12 9.07
MU3001 2.01 0.22 2.24 2.13 0.10 2.23 4.14 0.32 4.47
SD330 1.94 0.13 2.07 2.01 0.06 2.07 3.95 0.19 4.14
PA28 0.03 0.00 0.03 0.03 0.00 0.03 0.05 0.00 0.05
Air TaxiTotal
36.00 6.40 42.40 39.21 3.19 42.40 75.21 9.59 84.80
GeneralAviation
1900D 0.01 0.01 0.01 0.01 0.00 0.01 0.01 0.01 0.02
727EM1 0.01 0.00 0.01 0.01 0.00 0.01 0.01 0.00 0.01
727EM2 0.01 0.01 0.03 0.01 0.02 0.02 0.02 0.03 0.05
7373B2 0.00 0.01 0.01 0.00 0.01 0.01 0.00 0.01 0.01
737400 0.01 0.00 0.01 0.01 0.00 0.01 0.01 0.00 0.01
737700 0.07 0.02 0.09 0.08 0.01 0.09 0.15 0.04 0.19
737800 0.00 0.01 0.01 0.01 0.01 0.01 0.01 0.02 0.03
737N17 0.01 0.00 0.01 0.01 0.00 0.01 0.01 0.00 0.01
757RR 0.04 0.05 0.09 0.07 0.01 0.09 0.11 0.07 0.18
767300 0.01 0.00 0.01 0.01 0.00 0.01 0.02 0.00 0.02
767CF6 0.01 0.00 0.01 0.01 0.00 0.01 0.01 0.00 0.01
A319-131 0.01 0.01 0.01 0.01 0.01 0.01 0.01 0.01 0.02
BEC58P 1.63 0.04 1.67 1.55 0.13 1.67 3.18 0.16 3.34
CIT3 2.29 0.24 2.53 2.43 0.10 2.53 4.72 0.34 5.06
CL600 2.61 0.22 2.83 2.65 0.18 2.83 5.25 0.40 5.65
CL601 4.61 0.45 5.05 4.82 0.24 5.05 9.42 0.68 10.11
CNA172 0.14 0.01 0.14 0.12 0.02 0.14 0.26 0.03 0.28
CNA182 0.13 0.00 0.13 0.13 0.00 0.13 0.27 0.00 0.27
CNA206 0.84 0.05 0.89 0.85 0.04 0.89 1.69 0.09 1.78
CNA208 1.63 0.13 1.76 1.67 0.08 1.75 3.30 0.21 3.51
CNA441 6.86 0.61 7.48 6.87 0.61 7.48 13.73 1.23 14.96
CNA500 5.99 0.37 6.36 5.82 0.53 6.36 11.81 0.90 12.72
CNA510 1.07 0.11 1.18 1.13 0.04 1.18 2.20 0.15 2.35
CNA55B 4.12 0.45 4.57 4.27 0.29 4.57 8.39 0.75 9.14
CNA750 1.02 0.10 1.12 1.04 0.08 1.12 2.06 0.18 2.24
DC93LW 0.03 0.00 0.03 0.01 0.01 0.03 0.04 0.01 0.05
DHC6 0.01 0.00 0.01 0.01 0.00 0.01 0.01 0.00 0.01
DHC830 0.03 0.00 0.03 0.03 0.00 0.03 0.06 0.00 0.06
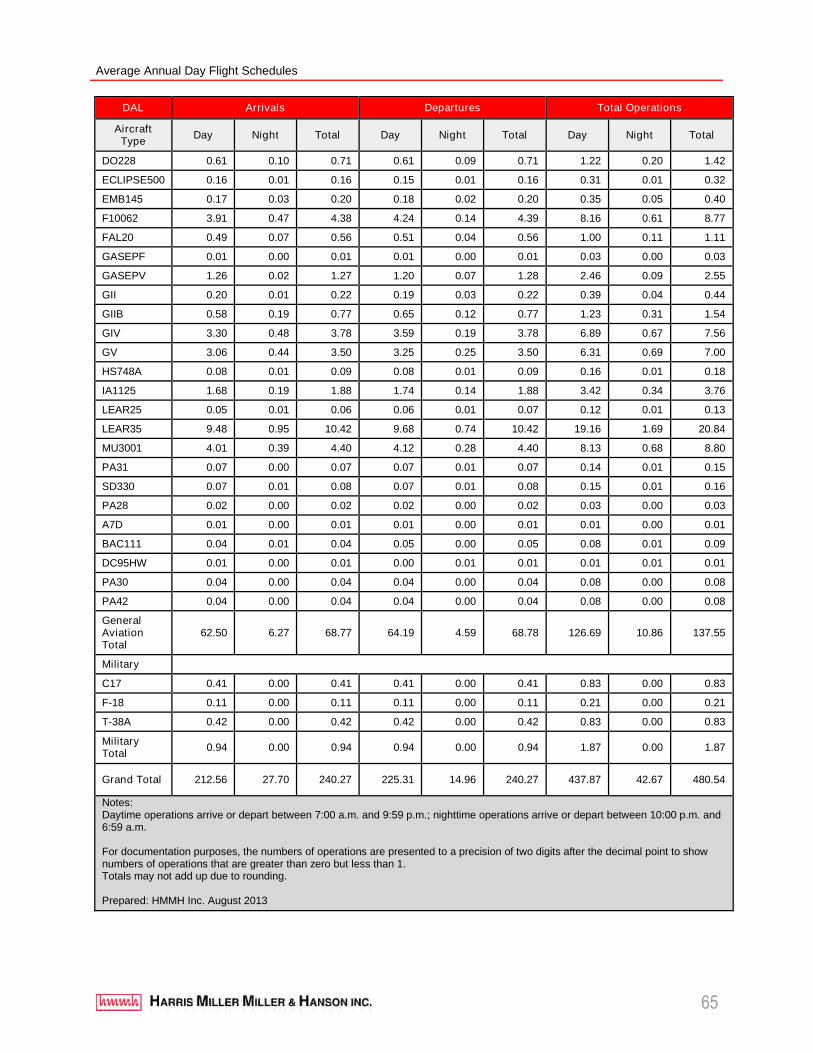
Average Annual Day Flight Schedules
65
DAL Arrivals Departures Total Operations
AircraftType
Day Night Total Day Night Total Day Night Total
DO228 0.61 0.10 0.71 0.61 0.09 0.71 1.22 0.20 1.42
ECLIPSE500 0.16 0.01 0.16 0.15 0.01 0.16 0.31 0.01 0.32
EMB145 0.17 0.03 0.20 0.18 0.02 0.20 0.35 0.05 0.40
F10062 3.91 0.47 4.38 4.24 0.14 4.39 8.16 0.61 8.77
FAL20 0.49 0.07 0.56 0.51 0.04 0.56 1.00 0.11 1.11
GASEPF 0.01 0.00 0.01 0.01 0.00 0.01 0.03 0.00 0.03
GASEPV 1.26 0.02 1.27 1.20 0.07 1.28 2.46 0.09 2.55
GII 0.20 0.01 0.22 0.19 0.03 0.22 0.39 0.04 0.44
GIIB 0.58 0.19 0.77 0.65 0.12 0.77 1.23 0.31 1.54
GIV 3.30 0.48 3.78 3.59 0.19 3.78 6.89 0.67 7.56
GV 3.06 0.44 3.50 3.25 0.25 3.50 6.31 0.69 7.00
HS748A 0.08 0.01 0.09 0.08 0.01 0.09 0.16 0.01 0.18
IA1125 1.68 0.19 1.88 1.74 0.14 1.88 3.42 0.34 3.76
LEAR25 0.05 0.01 0.06 0.06 0.01 0.07 0.12 0.01 0.13
LEAR35 9.48 0.95 10.42 9.68 0.74 10.42 19.16 1.69 20.84
MU3001 4.01 0.39 4.40 4.12 0.28 4.40 8.13 0.68 8.80
PA31 0.07 0.00 0.07 0.07 0.01 0.07 0.14 0.01 0.15
SD330 0.07 0.01 0.08 0.07 0.01 0.08 0.15 0.01 0.16
PA28 0.02 0.00 0.02 0.02 0.00 0.02 0.03 0.00 0.03
A7D 0.01 0.00 0.01 0.01 0.00 0.01 0.01 0.00 0.01
BAC111 0.04 0.01 0.04 0.05 0.00 0.05 0.08 0.01 0.09
DC95HW 0.01 0.00 0.01 0.00 0.01 0.01 0.01 0.01 0.01
PA30 0.04 0.00 0.04 0.04 0.00 0.04 0.08 0.00 0.08
PA42 0.04 0.00 0.04 0.04 0.00 0.04 0.08 0.00 0.08
GeneralAviationTotal
62.50 6.27 68.77 64.19 4.59 68.78 126.69 10.86 137.55
Military
C17 0.41 0.00 0.41 0.41 0.00 0.41 0.83 0.00 0.83
F-18 0.11 0.00 0.11 0.11 0.00 0.11 0.21 0.00 0.21
T-38A 0.42 0.00 0.42 0.42 0.00 0.42 0.83 0.00 0.83
MilitaryTotal
0.94 0.00 0.94 0.94 0.00 0.94 1.87 0.00 1.87
Grand Total 212.56 27.70 240.27 225.31 14.96 240.27 437.87 42.67 480.54
Notes:Daytime operations arrive or depart between 7:00 a.m. and 9:59 p.m.; nighttime operations arrive or depart between 10:00 p.m. and6:59 a.m.
For documentation purposes, the numbers of operations are presented to a precision of two digits after the decimal point to shownumbers of operations that are greater than zero but less than 1.Totals may not add up due to rounding.
Prepared: HMMH Inc. August 2013
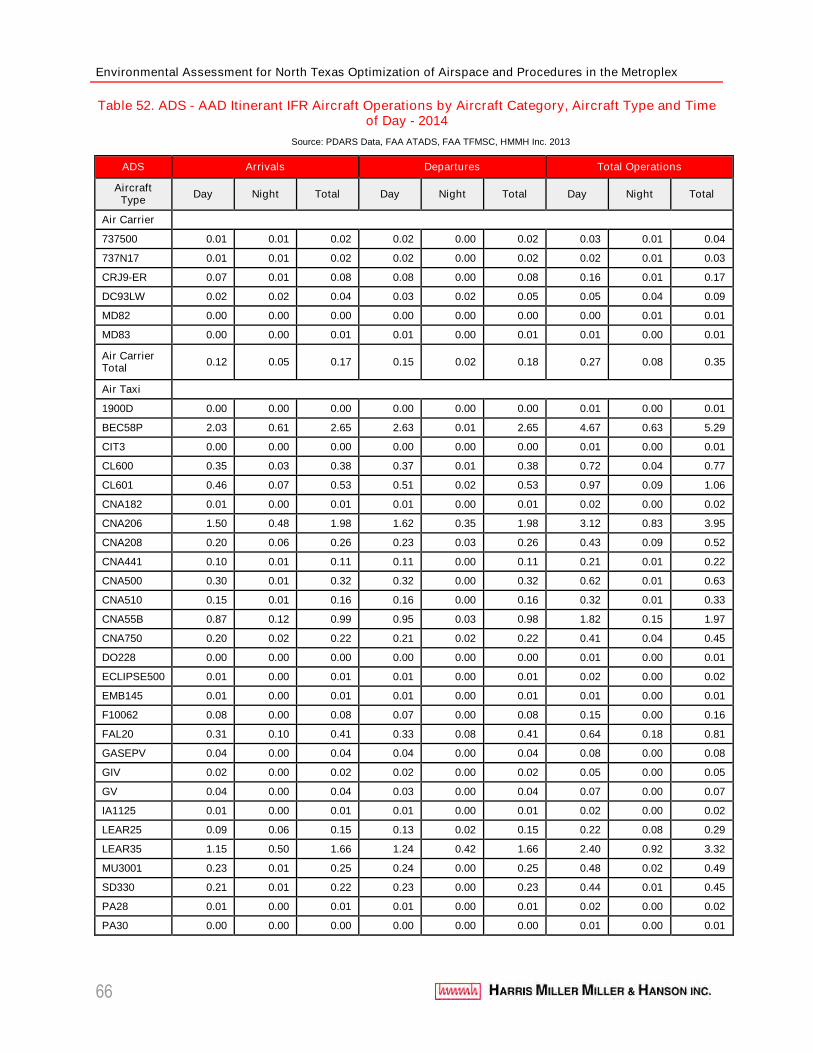
Environmental Assessment for North Texas Optimization of Airspace and Procedures in the Metroplex
66
Table 52. ADS - AAD Itinerant IFR Aircraft Operations by Aircraft Category, Aircraft Type and Timeof Day - 2014
Source: PDARS Data, FAA ATADS, FAA TFMSC, HMMH Inc. 2013
ADS Arrivals Departures Total Operations
AircraftType
Day Night Total Day Night Total Day Night Total
Air Carrier
737500 0.01 0.01 0.02 0.02 0.00 0.02 0.03 0.01 0.04
737N17 0.01 0.01 0.02 0.02 0.00 0.02 0.02 0.01 0.03
CRJ9-ER 0.07 0.01 0.08 0.08 0.00 0.08 0.16 0.01 0.17
DC93LW 0.02 0.02 0.04 0.03 0.02 0.05 0.05 0.04 0.09
MD82 0.00 0.00 0.00 0.00 0.00 0.00 0.00 0.01 0.01
MD83 0.00 0.00 0.01 0.01 0.00 0.01 0.01 0.00 0.01
Air CarrierTotal
0.12 0.05 0.17 0.15 0.02 0.18 0.27 0.08 0.35
Air Taxi
1900D 0.00 0.00 0.00 0.00 0.00 0.00 0.01 0.00 0.01
BEC58P 2.03 0.61 2.65 2.63 0.01 2.65 4.67 0.63 5.29
CIT3 0.00 0.00 0.00 0.00 0.00 0.00 0.01 0.00 0.01
CL600 0.35 0.03 0.38 0.37 0.01 0.38 0.72 0.04 0.77
CL601 0.46 0.07 0.53 0.51 0.02 0.53 0.97 0.09 1.06
CNA182 0.01 0.00 0.01 0.01 0.00 0.01 0.02 0.00 0.02
CNA206 1.50 0.48 1.98 1.62 0.35 1.98 3.12 0.83 3.95
CNA208 0.20 0.06 0.26 0.23 0.03 0.26 0.43 0.09 0.52
CNA441 0.10 0.01 0.11 0.11 0.00 0.11 0.21 0.01 0.22
CNA500 0.30 0.01 0.32 0.32 0.00 0.32 0.62 0.01 0.63
CNA510 0.15 0.01 0.16 0.16 0.00 0.16 0.32 0.01 0.33
CNA55B 0.87 0.12 0.99 0.95 0.03 0.98 1.82 0.15 1.97
CNA750 0.20 0.02 0.22 0.21 0.02 0.22 0.41 0.04 0.45
DO228 0.00 0.00 0.00 0.00 0.00 0.00 0.01 0.00 0.01
ECLIPSE500 0.01 0.00 0.01 0.01 0.00 0.01 0.02 0.00 0.02
EMB145 0.01 0.00 0.01 0.01 0.00 0.01 0.01 0.00 0.01
F10062 0.08 0.00 0.08 0.07 0.00 0.08 0.15 0.00 0.16
FAL20 0.31 0.10 0.41 0.33 0.08 0.41 0.64 0.18 0.81
GASEPV 0.04 0.00 0.04 0.04 0.00 0.04 0.08 0.00 0.08
GIV 0.02 0.00 0.02 0.02 0.00 0.02 0.05 0.00 0.05
GV 0.04 0.00 0.04 0.03 0.00 0.04 0.07 0.00 0.07
IA1125 0.01 0.00 0.01 0.01 0.00 0.01 0.02 0.00 0.02
LEAR25 0.09 0.06 0.15 0.13 0.02 0.15 0.22 0.08 0.29
LEAR35 1.15 0.50 1.66 1.24 0.42 1.66 2.40 0.92 3.32
MU3001 0.23 0.01 0.25 0.24 0.00 0.25 0.48 0.02 0.49
SD330 0.21 0.01 0.22 0.23 0.00 0.23 0.44 0.01 0.45
PA28 0.01 0.00 0.01 0.01 0.00 0.01 0.02 0.00 0.02
PA30 0.00 0.00 0.00 0.00 0.00 0.00 0.01 0.00 0.01
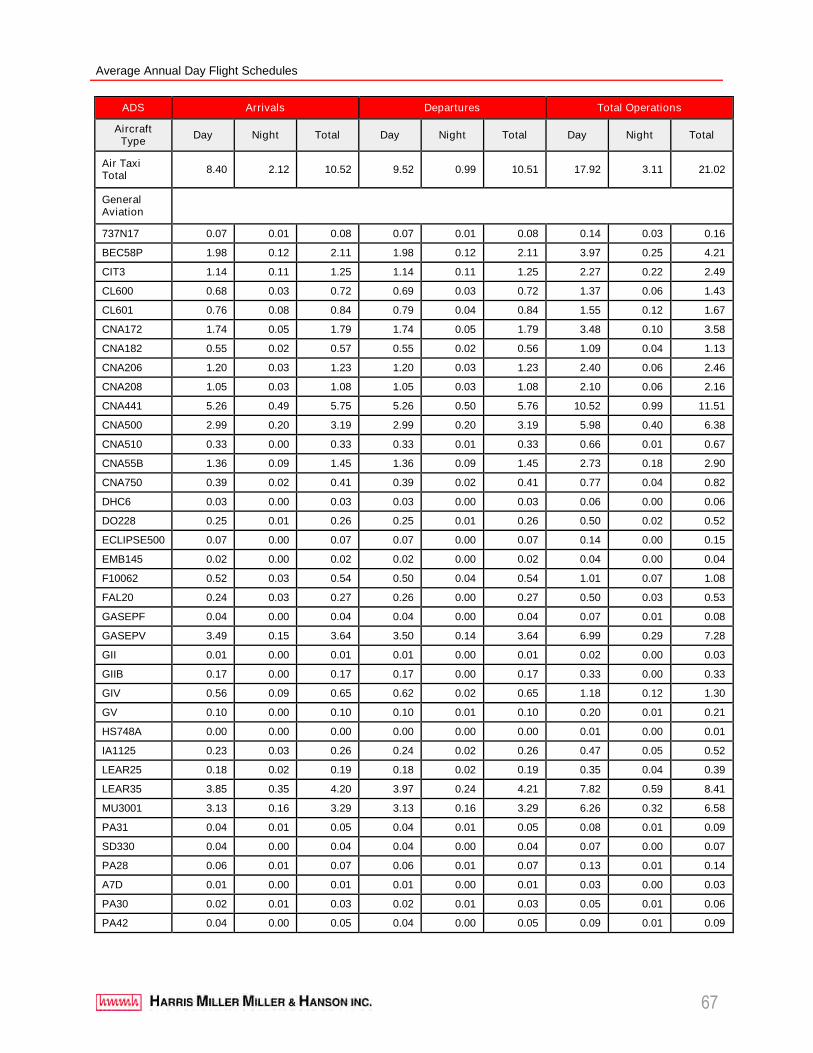
Average Annual Day Flight Schedules
67
ADS Arrivals Departures Total Operations
AircraftType
Day Night Total Day Night Total Day Night Total
Air TaxiTotal
8.40 2.12 10.52 9.52 0.99 10.51 17.92 3.11 21.02
GeneralAviation
737N17 0.07 0.01 0.08 0.07 0.01 0.08 0.14 0.03 0.16
BEC58P 1.98 0.12 2.11 1.98 0.12 2.11 3.97 0.25 4.21
CIT3 1.14 0.11 1.25 1.14 0.11 1.25 2.27 0.22 2.49
CL600 0.68 0.03 0.72 0.69 0.03 0.72 1.37 0.06 1.43
CL601 0.76 0.08 0.84 0.79 0.04 0.84 1.55 0.12 1.67
CNA172 1.74 0.05 1.79 1.74 0.05 1.79 3.48 0.10 3.58
CNA182 0.55 0.02 0.57 0.55 0.02 0.56 1.09 0.04 1.13
CNA206 1.20 0.03 1.23 1.20 0.03 1.23 2.40 0.06 2.46
CNA208 1.05 0.03 1.08 1.05 0.03 1.08 2.10 0.06 2.16
CNA441 5.26 0.49 5.75 5.26 0.50 5.76 10.52 0.99 11.51
CNA500 2.99 0.20 3.19 2.99 0.20 3.19 5.98 0.40 6.38
CNA510 0.33 0.00 0.33 0.33 0.01 0.33 0.66 0.01 0.67
CNA55B 1.36 0.09 1.45 1.36 0.09 1.45 2.73 0.18 2.90
CNA750 0.39 0.02 0.41 0.39 0.02 0.41 0.77 0.04 0.82
DHC6 0.03 0.00 0.03 0.03 0.00 0.03 0.06 0.00 0.06
DO228 0.25 0.01 0.26 0.25 0.01 0.26 0.50 0.02 0.52
ECLIPSE500 0.07 0.00 0.07 0.07 0.00 0.07 0.14 0.00 0.15
EMB145 0.02 0.00 0.02 0.02 0.00 0.02 0.04 0.00 0.04
F10062 0.52 0.03 0.54 0.50 0.04 0.54 1.01 0.07 1.08
FAL20 0.24 0.03 0.27 0.26 0.00 0.27 0.50 0.03 0.53
GASEPF 0.04 0.00 0.04 0.04 0.00 0.04 0.07 0.01 0.08
GASEPV 3.49 0.15 3.64 3.50 0.14 3.64 6.99 0.29 7.28
GII 0.01 0.00 0.01 0.01 0.00 0.01 0.02 0.00 0.03
GIIB 0.17 0.00 0.17 0.17 0.00 0.17 0.33 0.00 0.33
GIV 0.56 0.09 0.65 0.62 0.02 0.65 1.18 0.12 1.30
GV 0.10 0.00 0.10 0.10 0.01 0.10 0.20 0.01 0.21
HS748A 0.00 0.00 0.00 0.00 0.00 0.00 0.01 0.00 0.01
IA1125 0.23 0.03 0.26 0.24 0.02 0.26 0.47 0.05 0.52
LEAR25 0.18 0.02 0.19 0.18 0.02 0.19 0.35 0.04 0.39
LEAR35 3.85 0.35 4.20 3.97 0.24 4.21 7.82 0.59 8.41
MU3001 3.13 0.16 3.29 3.13 0.16 3.29 6.26 0.32 6.58
PA31 0.04 0.01 0.05 0.04 0.01 0.05 0.08 0.01 0.09
SD330 0.04 0.00 0.04 0.04 0.00 0.04 0.07 0.00 0.07
PA28 0.06 0.01 0.07 0.06 0.01 0.07 0.13 0.01 0.14
A7D 0.01 0.00 0.01 0.01 0.00 0.01 0.03 0.00 0.03
PA30 0.02 0.01 0.03 0.02 0.01 0.03 0.05 0.01 0.06
PA42 0.04 0.00 0.05 0.04 0.00 0.05 0.09 0.01 0.09
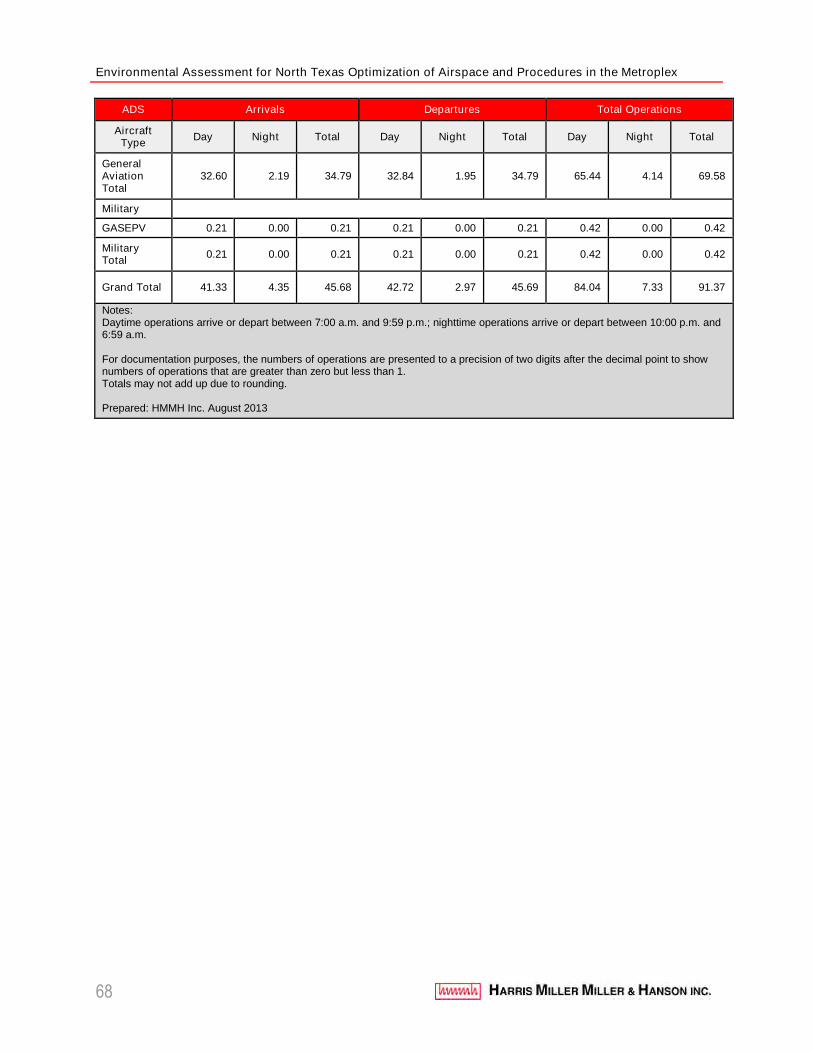
Environmental Assessment for North Texas Optimization of Airspace and Procedures in the Metroplex
68
ADS Arrivals Departures Total Operations
AircraftType
Day Night Total Day Night Total Day Night Total
GeneralAviationTotal
32.60 2.19 34.79 32.84 1.95 34.79 65.44 4.14 69.58
Military
GASEPV 0.21 0.00 0.21 0.21 0.00 0.21 0.42 0.00 0.42
MilitaryTotal
0.21 0.00 0.21 0.21 0.00 0.21 0.42 0.00 0.42
Grand Total 41.33 4.35 45.68 42.72 2.97 45.69 84.04 7.33 91.37
Notes:Daytime operations arrive or depart between 7:00 a.m. and 9:59 p.m.; nighttime operations arrive or depart between 10:00 p.m. and6:59 a.m.
For documentation purposes, the numbers of operations are presented to a precision of two digits after the decimal point to shownumbers of operations that are greater than zero but less than 1.Totals may not add up due to rounding.
Prepared: HMMH Inc. August 2013
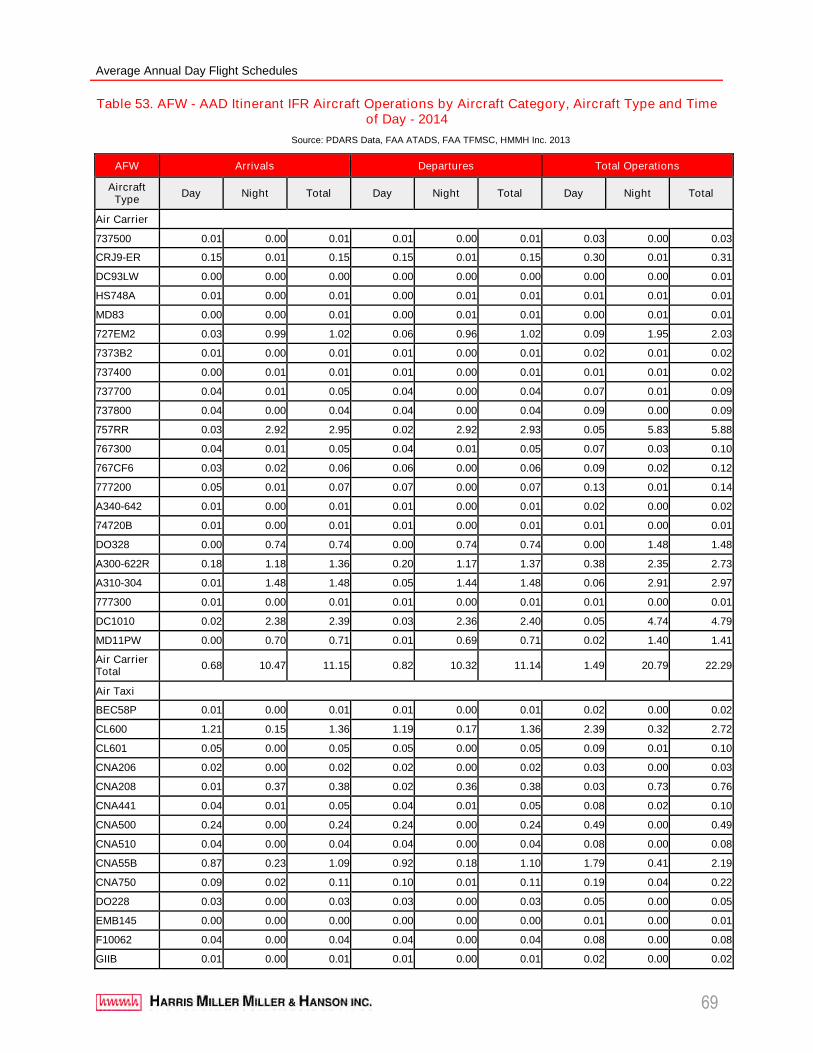
Average Annual Day Flight Schedules
69
Table 53. AFW - AAD Itinerant IFR Aircraft Operations by Aircraft Category, Aircraft Type and Timeof Day - 2014
Source: PDARS Data, FAA ATADS, FAA TFMSC, HMMH Inc. 2013
AFW Arrivals Departures Total Operations
AircraftType
Day Night Total Day Night Total Day Night Total
Air Carrier
737500 0.01 0.00 0.01 0.01 0.00 0.01 0.03 0.00 0.03
CRJ9-ER 0.15 0.01 0.15 0.15 0.01 0.15 0.30 0.01 0.31
DC93LW 0.00 0.00 0.00 0.00 0.00 0.00 0.00 0.00 0.01
HS748A 0.01 0.00 0.01 0.00 0.01 0.01 0.01 0.01 0.01
MD83 0.00 0.00 0.01 0.00 0.01 0.01 0.00 0.01 0.01
727EM2 0.03 0.99 1.02 0.06 0.96 1.02 0.09 1.95 2.03
7373B2 0.01 0.00 0.01 0.01 0.00 0.01 0.02 0.01 0.02
737400 0.00 0.01 0.01 0.01 0.00 0.01 0.01 0.01 0.02
737700 0.04 0.01 0.05 0.04 0.00 0.04 0.07 0.01 0.09
737800 0.04 0.00 0.04 0.04 0.00 0.04 0.09 0.00 0.09
757RR 0.03 2.92 2.95 0.02 2.92 2.93 0.05 5.83 5.88
767300 0.04 0.01 0.05 0.04 0.01 0.05 0.07 0.03 0.10
767CF6 0.03 0.02 0.06 0.06 0.00 0.06 0.09 0.02 0.12
777200 0.05 0.01 0.07 0.07 0.00 0.07 0.13 0.01 0.14
A340-642 0.01 0.00 0.01 0.01 0.00 0.01 0.02 0.00 0.02
74720B 0.01 0.00 0.01 0.01 0.00 0.01 0.01 0.00 0.01
DO328 0.00 0.74 0.74 0.00 0.74 0.74 0.00 1.48 1.48
A300-622R 0.18 1.18 1.36 0.20 1.17 1.37 0.38 2.35 2.73
A310-304 0.01 1.48 1.48 0.05 1.44 1.48 0.06 2.91 2.97
777300 0.01 0.00 0.01 0.01 0.00 0.01 0.01 0.00 0.01
DC1010 0.02 2.38 2.39 0.03 2.36 2.40 0.05 4.74 4.79
MD11PW 0.00 0.70 0.71 0.01 0.69 0.71 0.02 1.40 1.41
Air CarrierTotal
0.68 10.47 11.15 0.82 10.32 11.14 1.49 20.79 22.29
Air Taxi
BEC58P 0.01 0.00 0.01 0.01 0.00 0.01 0.02 0.00 0.02
CL600 1.21 0.15 1.36 1.19 0.17 1.36 2.39 0.32 2.72
CL601 0.05 0.00 0.05 0.05 0.00 0.05 0.09 0.01 0.10
CNA206 0.02 0.00 0.02 0.02 0.00 0.02 0.03 0.00 0.03
CNA208 0.01 0.37 0.38 0.02 0.36 0.38 0.03 0.73 0.76
CNA441 0.04 0.01 0.05 0.04 0.01 0.05 0.08 0.02 0.10
CNA500 0.24 0.00 0.24 0.24 0.00 0.24 0.49 0.00 0.49
CNA510 0.04 0.00 0.04 0.04 0.00 0.04 0.08 0.00 0.08
CNA55B 0.87 0.23 1.09 0.92 0.18 1.10 1.79 0.41 2.19
CNA750 0.09 0.02 0.11 0.10 0.01 0.11 0.19 0.04 0.22
DO228 0.03 0.00 0.03 0.03 0.00 0.03 0.05 0.00 0.05
EMB145 0.00 0.00 0.00 0.00 0.00 0.00 0.01 0.00 0.01
F10062 0.04 0.00 0.04 0.04 0.00 0.04 0.08 0.00 0.08
GIIB 0.01 0.00 0.01 0.01 0.00 0.01 0.02 0.00 0.02
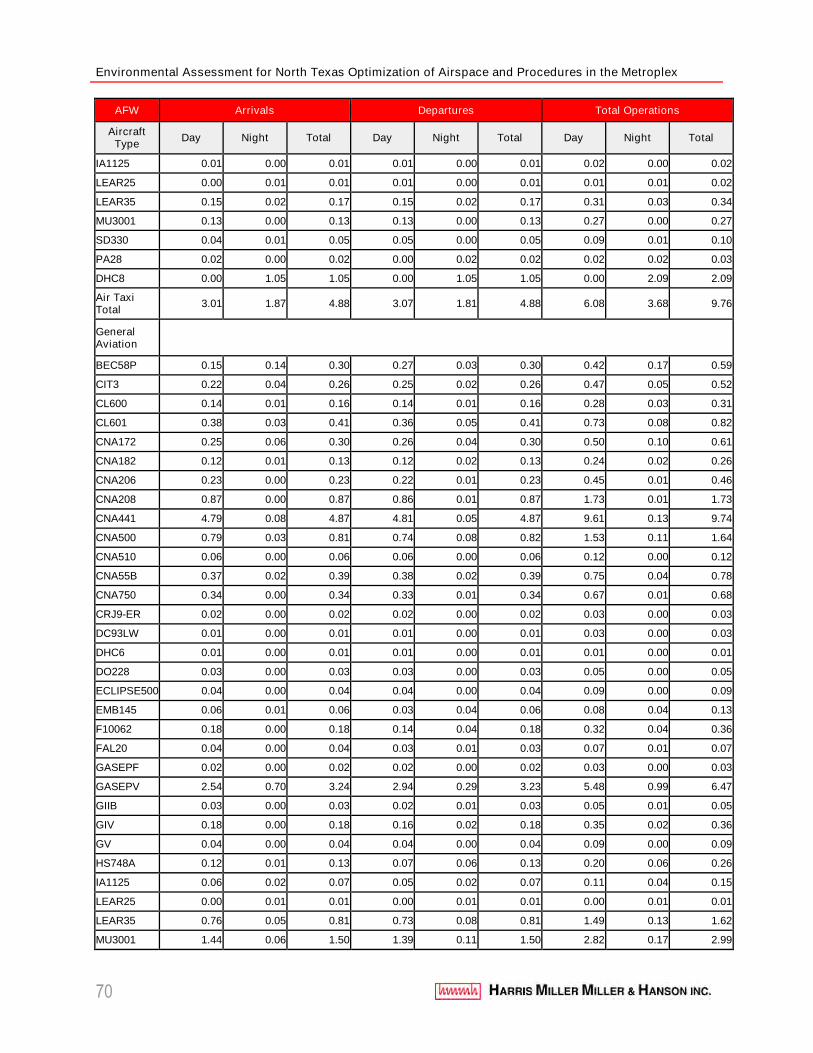
Environmental Assessment for North Texas Optimization of Airspace and Procedures in the Metroplex
70
AFW Arrivals Departures Total Operations
AircraftType
Day Night Total Day Night Total Day Night Total
IA1125 0.01 0.00 0.01 0.01 0.00 0.01 0.02 0.00 0.02
LEAR25 0.00 0.01 0.01 0.01 0.00 0.01 0.01 0.01 0.02
LEAR35 0.15 0.02 0.17 0.15 0.02 0.17 0.31 0.03 0.34
MU3001 0.13 0.00 0.13 0.13 0.00 0.13 0.27 0.00 0.27
SD330 0.04 0.01 0.05 0.05 0.00 0.05 0.09 0.01 0.10
PA28 0.02 0.00 0.02 0.00 0.02 0.02 0.02 0.02 0.03
DHC8 0.00 1.05 1.05 0.00 1.05 1.05 0.00 2.09 2.09
Air TaxiTotal
3.01 1.87 4.88 3.07 1.81 4.88 6.08 3.68 9.76
GeneralAviation
BEC58P 0.15 0.14 0.30 0.27 0.03 0.30 0.42 0.17 0.59
CIT3 0.22 0.04 0.26 0.25 0.02 0.26 0.47 0.05 0.52
CL600 0.14 0.01 0.16 0.14 0.01 0.16 0.28 0.03 0.31
CL601 0.38 0.03 0.41 0.36 0.05 0.41 0.73 0.08 0.82
CNA172 0.25 0.06 0.30 0.26 0.04 0.30 0.50 0.10 0.61
CNA182 0.12 0.01 0.13 0.12 0.02 0.13 0.24 0.02 0.26
CNA206 0.23 0.00 0.23 0.22 0.01 0.23 0.45 0.01 0.46
CNA208 0.87 0.00 0.87 0.86 0.01 0.87 1.73 0.01 1.73
CNA441 4.79 0.08 4.87 4.81 0.05 4.87 9.61 0.13 9.74
CNA500 0.79 0.03 0.81 0.74 0.08 0.82 1.53 0.11 1.64
CNA510 0.06 0.00 0.06 0.06 0.00 0.06 0.12 0.00 0.12
CNA55B 0.37 0.02 0.39 0.38 0.02 0.39 0.75 0.04 0.78
CNA750 0.34 0.00 0.34 0.33 0.01 0.34 0.67 0.01 0.68
CRJ9-ER 0.02 0.00 0.02 0.02 0.00 0.02 0.03 0.00 0.03
DC93LW 0.01 0.00 0.01 0.01 0.00 0.01 0.03 0.00 0.03
DHC6 0.01 0.00 0.01 0.01 0.00 0.01 0.01 0.00 0.01
DO228 0.03 0.00 0.03 0.03 0.00 0.03 0.05 0.00 0.05
ECLIPSE500 0.04 0.00 0.04 0.04 0.00 0.04 0.09 0.00 0.09
EMB145 0.06 0.01 0.06 0.03 0.04 0.06 0.08 0.04 0.13
F10062 0.18 0.00 0.18 0.14 0.04 0.18 0.32 0.04 0.36
FAL20 0.04 0.00 0.04 0.03 0.01 0.03 0.07 0.01 0.07
GASEPF 0.02 0.00 0.02 0.02 0.00 0.02 0.03 0.00 0.03
GASEPV 2.54 0.70 3.24 2.94 0.29 3.23 5.48 0.99 6.47
GIIB 0.03 0.00 0.03 0.02 0.01 0.03 0.05 0.01 0.05
GIV 0.18 0.00 0.18 0.16 0.02 0.18 0.35 0.02 0.36
GV 0.04 0.00 0.04 0.04 0.00 0.04 0.09 0.00 0.09
HS748A 0.12 0.01 0.13 0.07 0.06 0.13 0.20 0.06 0.26
IA1125 0.06 0.02 0.07 0.05 0.02 0.07 0.11 0.04 0.15
LEAR25 0.00 0.01 0.01 0.00 0.01 0.01 0.00 0.01 0.01
LEAR35 0.76 0.05 0.81 0.73 0.08 0.81 1.49 0.13 1.62
MU3001 1.44 0.06 1.50 1.39 0.11 1.50 2.82 0.17 2.99
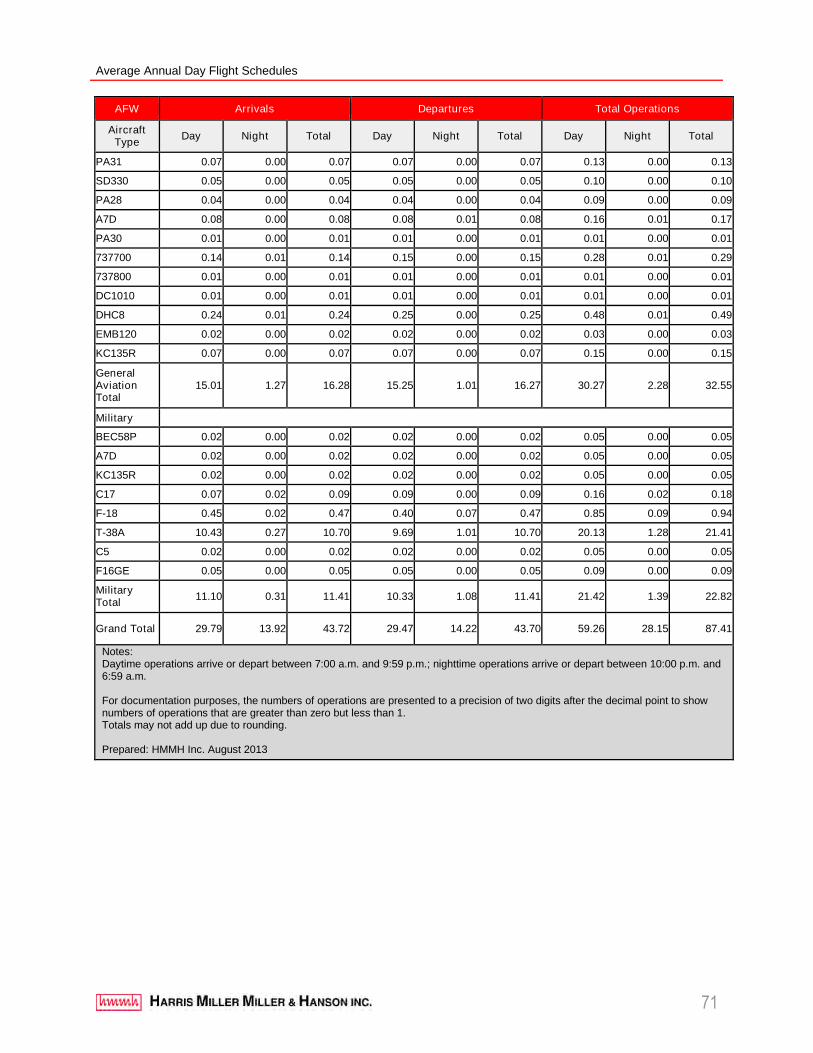
Average Annual Day Flight Schedules
71
AFW Arrivals Departures Total Operations
AircraftType
Day Night Total Day Night Total Day Night Total
PA31 0.07 0.00 0.07 0.07 0.00 0.07 0.13 0.00 0.13
SD330 0.05 0.00 0.05 0.05 0.00 0.05 0.10 0.00 0.10
PA28 0.04 0.00 0.04 0.04 0.00 0.04 0.09 0.00 0.09
A7D 0.08 0.00 0.08 0.08 0.01 0.08 0.16 0.01 0.17
PA30 0.01 0.00 0.01 0.01 0.00 0.01 0.01 0.00 0.01
737700 0.14 0.01 0.14 0.15 0.00 0.15 0.28 0.01 0.29
737800 0.01 0.00 0.01 0.01 0.00 0.01 0.01 0.00 0.01
DC1010 0.01 0.00 0.01 0.01 0.00 0.01 0.01 0.00 0.01
DHC8 0.24 0.01 0.24 0.25 0.00 0.25 0.48 0.01 0.49
EMB120 0.02 0.00 0.02 0.02 0.00 0.02 0.03 0.00 0.03
KC135R 0.07 0.00 0.07 0.07 0.00 0.07 0.15 0.00 0.15
GeneralAviationTotal
15.01 1.27 16.28 15.25 1.01 16.27 30.27 2.28 32.55
Military
BEC58P 0.02 0.00 0.02 0.02 0.00 0.02 0.05 0.00 0.05
A7D 0.02 0.00 0.02 0.02 0.00 0.02 0.05 0.00 0.05
KC135R 0.02 0.00 0.02 0.02 0.00 0.02 0.05 0.00 0.05
C17 0.07 0.02 0.09 0.09 0.00 0.09 0.16 0.02 0.18
F-18 0.45 0.02 0.47 0.40 0.07 0.47 0.85 0.09 0.94
T-38A 10.43 0.27 10.70 9.69 1.01 10.70 20.13 1.28 21.41
C5 0.02 0.00 0.02 0.02 0.00 0.02 0.05 0.00 0.05
F16GE 0.05 0.00 0.05 0.05 0.00 0.05 0.09 0.00 0.09
MilitaryTotal
11.10 0.31 11.41 10.33 1.08 11.41 21.42 1.39 22.82
Grand Total 29.79 13.92 43.72 29.47 14.22 43.70 59.26 28.15 87.41
Notes:Daytime operations arrive or depart between 7:00 a.m. and 9:59 p.m.; nighttime operations arrive or depart between 10:00 p.m. and6:59 a.m.
For documentation purposes, the numbers of operations are presented to a precision of two digits after the decimal point to shownumbers of operations that are greater than zero but less than 1.Totals may not add up due to rounding.
Prepared: HMMH Inc. August 2013
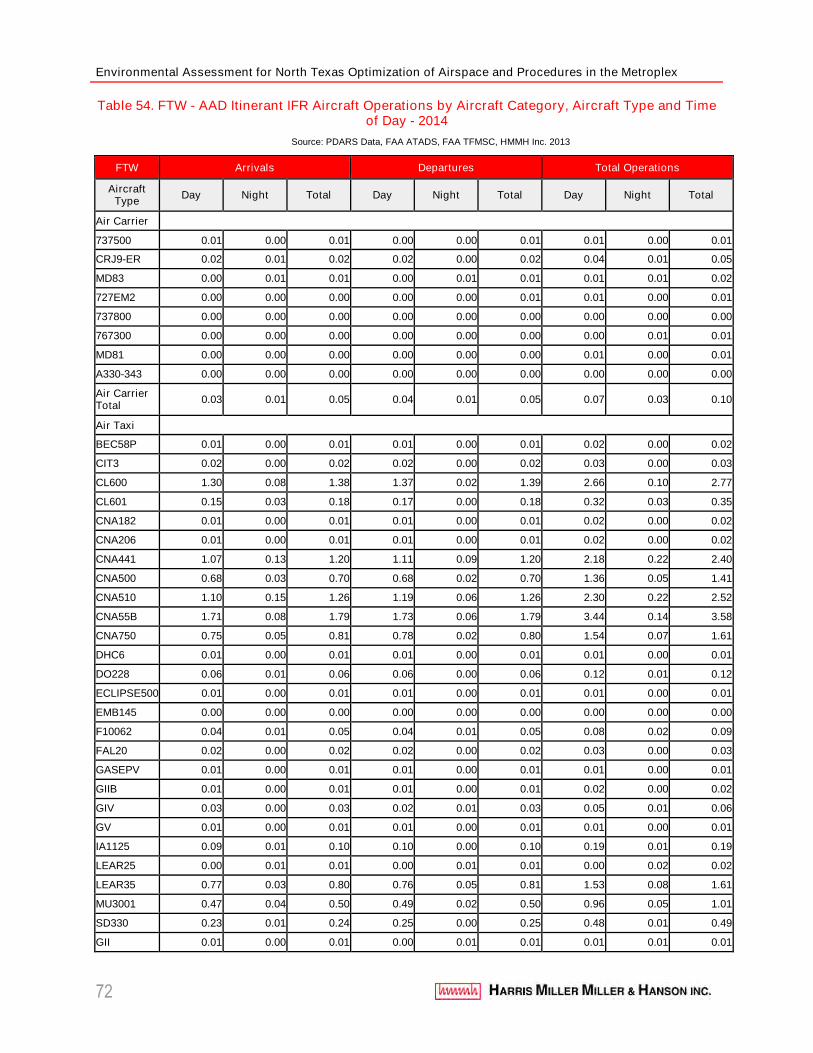
Environmental Assessment for North Texas Optimization of Airspace and Procedures in the Metroplex
72
Table 54. FTW - AAD Itinerant IFR Aircraft Operations by Aircraft Category, Aircraft Type and Timeof Day - 2014
Source: PDARS Data, FAA ATADS, FAA TFMSC, HMMH Inc. 2013
FTW Arrivals Departures Total Operations
AircraftType
Day Night Total Day Night Total Day Night Total
Air Carrier
737500 0.01 0.00 0.01 0.00 0.00 0.01 0.01 0.00 0.01
CRJ9-ER 0.02 0.01 0.02 0.02 0.00 0.02 0.04 0.01 0.05
MD83 0.00 0.01 0.01 0.00 0.01 0.01 0.01 0.01 0.02
727EM2 0.00 0.00 0.00 0.00 0.00 0.01 0.01 0.00 0.01
737800 0.00 0.00 0.00 0.00 0.00 0.00 0.00 0.00 0.00
767300 0.00 0.00 0.00 0.00 0.00 0.00 0.00 0.01 0.01
MD81 0.00 0.00 0.00 0.00 0.00 0.00 0.01 0.00 0.01
A330-343 0.00 0.00 0.00 0.00 0.00 0.00 0.00 0.00 0.00
Air CarrierTotal
0.03 0.01 0.05 0.04 0.01 0.05 0.07 0.03 0.10
Air Taxi
BEC58P 0.01 0.00 0.01 0.01 0.00 0.01 0.02 0.00 0.02
CIT3 0.02 0.00 0.02 0.02 0.00 0.02 0.03 0.00 0.03
CL600 1.30 0.08 1.38 1.37 0.02 1.39 2.66 0.10 2.77
CL601 0.15 0.03 0.18 0.17 0.00 0.18 0.32 0.03 0.35
CNA182 0.01 0.00 0.01 0.01 0.00 0.01 0.02 0.00 0.02
CNA206 0.01 0.00 0.01 0.01 0.00 0.01 0.02 0.00 0.02
CNA441 1.07 0.13 1.20 1.11 0.09 1.20 2.18 0.22 2.40
CNA500 0.68 0.03 0.70 0.68 0.02 0.70 1.36 0.05 1.41
CNA510 1.10 0.15 1.26 1.19 0.06 1.26 2.30 0.22 2.52
CNA55B 1.71 0.08 1.79 1.73 0.06 1.79 3.44 0.14 3.58
CNA750 0.75 0.05 0.81 0.78 0.02 0.80 1.54 0.07 1.61
DHC6 0.01 0.00 0.01 0.01 0.00 0.01 0.01 0.00 0.01
DO228 0.06 0.01 0.06 0.06 0.00 0.06 0.12 0.01 0.12
ECLIPSE500 0.01 0.00 0.01 0.01 0.00 0.01 0.01 0.00 0.01
EMB145 0.00 0.00 0.00 0.00 0.00 0.00 0.00 0.00 0.00
F10062 0.04 0.01 0.05 0.04 0.01 0.05 0.08 0.02 0.09
FAL20 0.02 0.00 0.02 0.02 0.00 0.02 0.03 0.00 0.03
GASEPV 0.01 0.00 0.01 0.01 0.00 0.01 0.01 0.00 0.01
GIIB 0.01 0.00 0.01 0.01 0.00 0.01 0.02 0.00 0.02
GIV 0.03 0.00 0.03 0.02 0.01 0.03 0.05 0.01 0.06
GV 0.01 0.00 0.01 0.01 0.00 0.01 0.01 0.00 0.01
IA1125 0.09 0.01 0.10 0.10 0.00 0.10 0.19 0.01 0.19
LEAR25 0.00 0.01 0.01 0.00 0.01 0.01 0.00 0.02 0.02
LEAR35 0.77 0.03 0.80 0.76 0.05 0.81 1.53 0.08 1.61
MU3001 0.47 0.04 0.50 0.49 0.02 0.50 0.96 0.05 1.01
SD330 0.23 0.01 0.24 0.25 0.00 0.25 0.48 0.01 0.49
GII 0.01 0.00 0.01 0.00 0.01 0.01 0.01 0.01 0.01
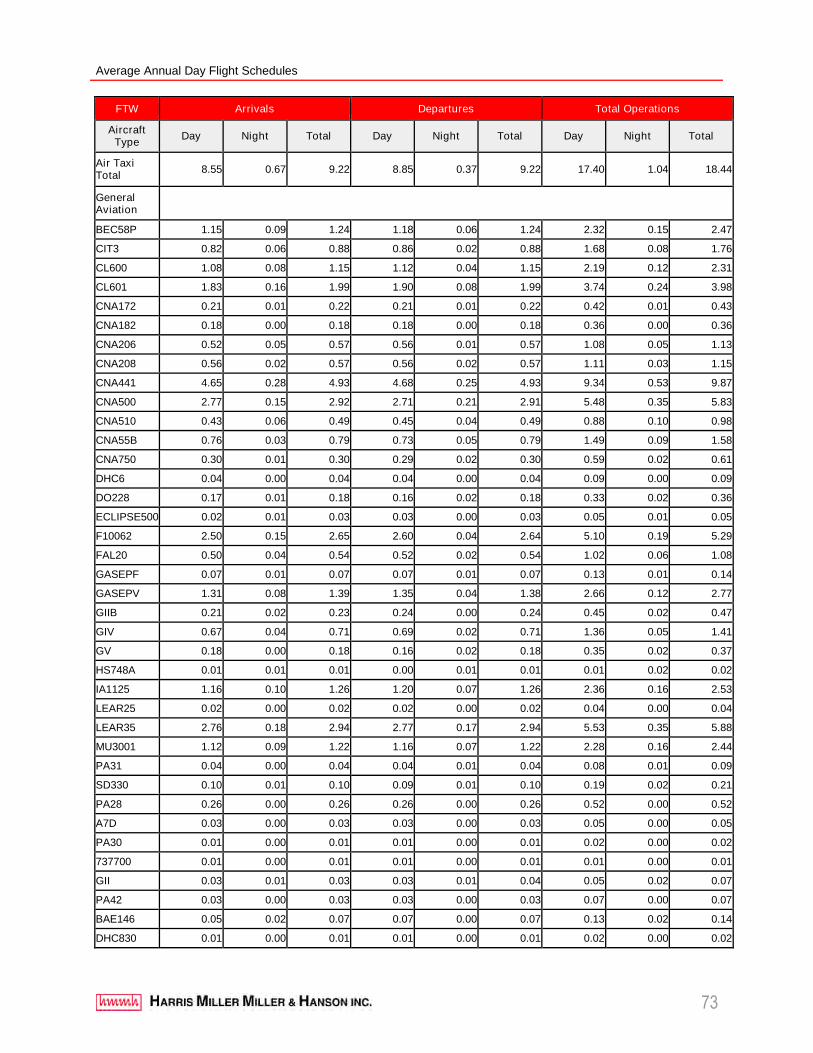
Average Annual Day Flight Schedules
73
FTW Arrivals Departures Total Operations
AircraftType
Day Night Total Day Night Total Day Night Total
Air TaxiTotal
8.55 0.67 9.22 8.85 0.37 9.22 17.40 1.04 18.44
GeneralAviation
BEC58P 1.15 0.09 1.24 1.18 0.06 1.24 2.32 0.15 2.47
CIT3 0.82 0.06 0.88 0.86 0.02 0.88 1.68 0.08 1.76
CL600 1.08 0.08 1.15 1.12 0.04 1.15 2.19 0.12 2.31
CL601 1.83 0.16 1.99 1.90 0.08 1.99 3.74 0.24 3.98
CNA172 0.21 0.01 0.22 0.21 0.01 0.22 0.42 0.01 0.43
CNA182 0.18 0.00 0.18 0.18 0.00 0.18 0.36 0.00 0.36
CNA206 0.52 0.05 0.57 0.56 0.01 0.57 1.08 0.05 1.13
CNA208 0.56 0.02 0.57 0.56 0.02 0.57 1.11 0.03 1.15
CNA441 4.65 0.28 4.93 4.68 0.25 4.93 9.34 0.53 9.87
CNA500 2.77 0.15 2.92 2.71 0.21 2.91 5.48 0.35 5.83
CNA510 0.43 0.06 0.49 0.45 0.04 0.49 0.88 0.10 0.98
CNA55B 0.76 0.03 0.79 0.73 0.05 0.79 1.49 0.09 1.58
CNA750 0.30 0.01 0.30 0.29 0.02 0.30 0.59 0.02 0.61
DHC6 0.04 0.00 0.04 0.04 0.00 0.04 0.09 0.00 0.09
DO228 0.17 0.01 0.18 0.16 0.02 0.18 0.33 0.02 0.36
ECLIPSE500 0.02 0.01 0.03 0.03 0.00 0.03 0.05 0.01 0.05
F10062 2.50 0.15 2.65 2.60 0.04 2.64 5.10 0.19 5.29
FAL20 0.50 0.04 0.54 0.52 0.02 0.54 1.02 0.06 1.08
GASEPF 0.07 0.01 0.07 0.07 0.01 0.07 0.13 0.01 0.14
GASEPV 1.31 0.08 1.39 1.35 0.04 1.38 2.66 0.12 2.77
GIIB 0.21 0.02 0.23 0.24 0.00 0.24 0.45 0.02 0.47
GIV 0.67 0.04 0.71 0.69 0.02 0.71 1.36 0.05 1.41
GV 0.18 0.00 0.18 0.16 0.02 0.18 0.35 0.02 0.37
HS748A 0.01 0.01 0.01 0.00 0.01 0.01 0.01 0.02 0.02
IA1125 1.16 0.10 1.26 1.20 0.07 1.26 2.36 0.16 2.53
LEAR25 0.02 0.00 0.02 0.02 0.00 0.02 0.04 0.00 0.04
LEAR35 2.76 0.18 2.94 2.77 0.17 2.94 5.53 0.35 5.88
MU3001 1.12 0.09 1.22 1.16 0.07 1.22 2.28 0.16 2.44
PA31 0.04 0.00 0.04 0.04 0.01 0.04 0.08 0.01 0.09
SD330 0.10 0.01 0.10 0.09 0.01 0.10 0.19 0.02 0.21
PA28 0.26 0.00 0.26 0.26 0.00 0.26 0.52 0.00 0.52
A7D 0.03 0.00 0.03 0.03 0.00 0.03 0.05 0.00 0.05
PA30 0.01 0.00 0.01 0.01 0.00 0.01 0.02 0.00 0.02
737700 0.01 0.00 0.01 0.01 0.00 0.01 0.01 0.00 0.01
GII 0.03 0.01 0.03 0.03 0.01 0.04 0.05 0.02 0.07
PA42 0.03 0.00 0.03 0.03 0.00 0.03 0.07 0.00 0.07
BAE146 0.05 0.02 0.07 0.07 0.00 0.07 0.13 0.02 0.14
DHC830 0.01 0.00 0.01 0.01 0.00 0.01 0.02 0.00 0.02
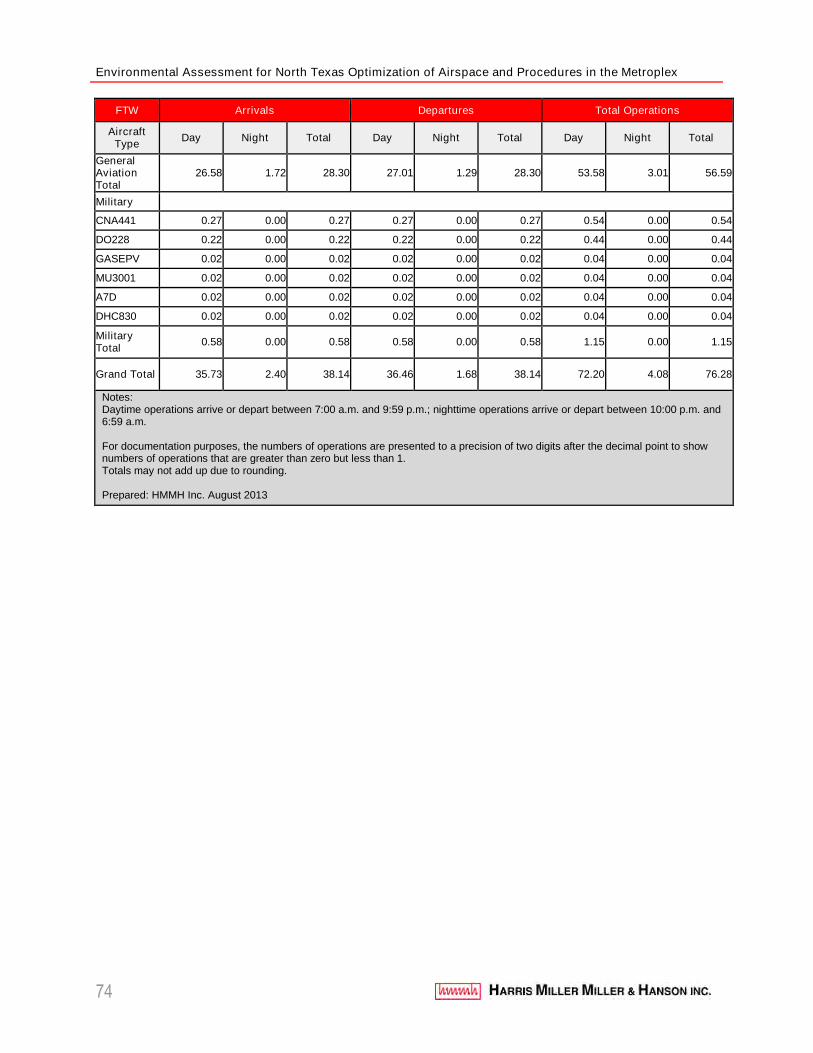
Environmental Assessment for North Texas Optimization of Airspace and Procedures in the Metroplex
74
FTW Arrivals Departures Total Operations
AircraftType
Day Night Total Day Night Total Day Night Total
GeneralAviationTotal
26.58 1.72 28.30 27.01 1.29 28.30 53.58 3.01 56.59
Military
CNA441 0.27 0.00 0.27 0.27 0.00 0.27 0.54 0.00 0.54
DO228 0.22 0.00 0.22 0.22 0.00 0.22 0.44 0.00 0.44
GASEPV 0.02 0.00 0.02 0.02 0.00 0.02 0.04 0.00 0.04
MU3001 0.02 0.00 0.02 0.02 0.00 0.02 0.04 0.00 0.04
A7D 0.02 0.00 0.02 0.02 0.00 0.02 0.04 0.00 0.04
DHC830 0.02 0.00 0.02 0.02 0.00 0.02 0.04 0.00 0.04
MilitaryTotal
0.58 0.00 0.58 0.58 0.00 0.58 1.15 0.00 1.15
Grand Total 35.73 2.40 38.14 36.46 1.68 38.14 72.20 4.08 76.28
Notes:Daytime operations arrive or depart between 7:00 a.m. and 9:59 p.m.; nighttime operations arrive or depart between 10:00 p.m. and6:59 a.m.
For documentation purposes, the numbers of operations are presented to a precision of two digits after the decimal point to shownumbers of operations that are greater than zero but less than 1.Totals may not add up due to rounding.
Prepared: HMMH Inc. August 2013
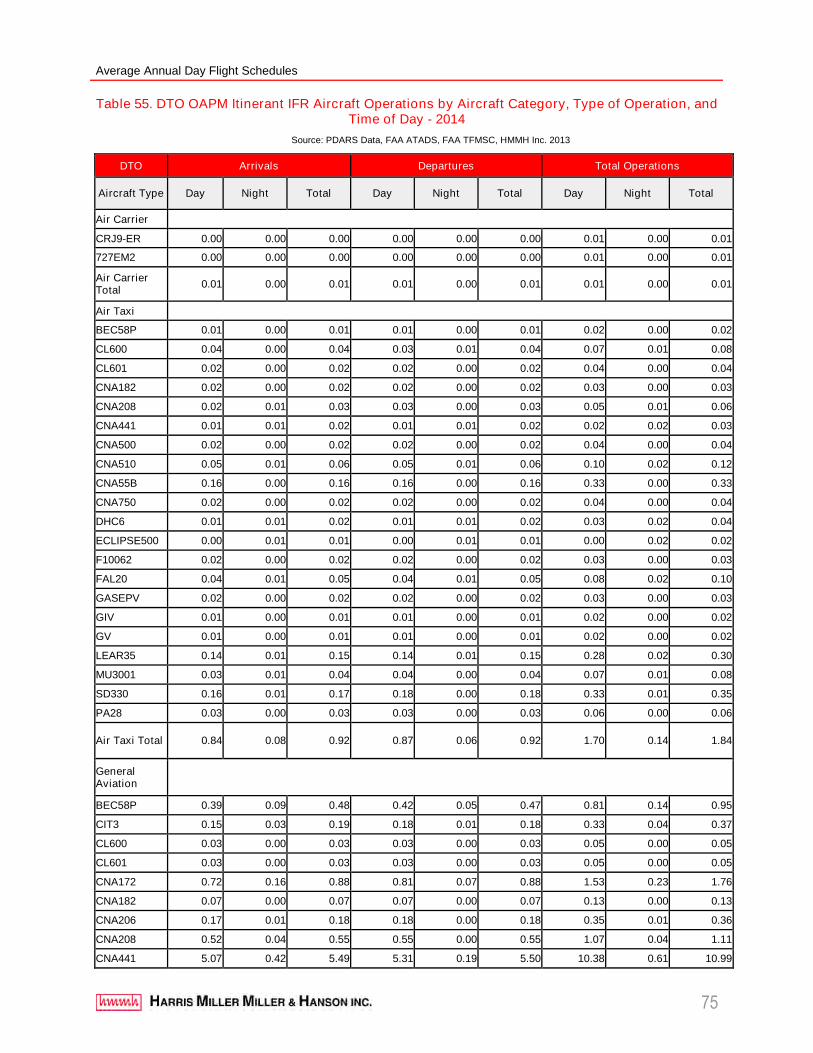
Average Annual Day Flight Schedules
75
Table 55. DTO OAPM Itinerant IFR Aircraft Operations by Aircraft Category, Type of Operation, andTime of Day - 2014
Source: PDARS Data, FAA ATADS, FAA TFMSC, HMMH Inc. 2013
DTO Arrivals Departures Total Operations
Aircraft Type Day Night Total Day Night Total Day Night Total
Air Carrier
CRJ9-ER 0.00 0.00 0.00 0.00 0.00 0.00 0.01 0.00 0.01
727EM2 0.00 0.00 0.00 0.00 0.00 0.00 0.01 0.00 0.01
Air CarrierTotal
0.01 0.00 0.01 0.01 0.00 0.01 0.01 0.00 0.01
Air Taxi
BEC58P 0.01 0.00 0.01 0.01 0.00 0.01 0.02 0.00 0.02
CL600 0.04 0.00 0.04 0.03 0.01 0.04 0.07 0.01 0.08
CL601 0.02 0.00 0.02 0.02 0.00 0.02 0.04 0.00 0.04
CNA182 0.02 0.00 0.02 0.02 0.00 0.02 0.03 0.00 0.03
CNA208 0.02 0.01 0.03 0.03 0.00 0.03 0.05 0.01 0.06
CNA441 0.01 0.01 0.02 0.01 0.01 0.02 0.02 0.02 0.03
CNA500 0.02 0.00 0.02 0.02 0.00 0.02 0.04 0.00 0.04
CNA510 0.05 0.01 0.06 0.05 0.01 0.06 0.10 0.02 0.12
CNA55B 0.16 0.00 0.16 0.16 0.00 0.16 0.33 0.00 0.33
CNA750 0.02 0.00 0.02 0.02 0.00 0.02 0.04 0.00 0.04
DHC6 0.01 0.01 0.02 0.01 0.01 0.02 0.03 0.02 0.04
ECLIPSE500 0.00 0.01 0.01 0.00 0.01 0.01 0.00 0.02 0.02
F10062 0.02 0.00 0.02 0.02 0.00 0.02 0.03 0.00 0.03
FAL20 0.04 0.01 0.05 0.04 0.01 0.05 0.08 0.02 0.10
GASEPV 0.02 0.00 0.02 0.02 0.00 0.02 0.03 0.00 0.03
GIV 0.01 0.00 0.01 0.01 0.00 0.01 0.02 0.00 0.02
GV 0.01 0.00 0.01 0.01 0.00 0.01 0.02 0.00 0.02
LEAR35 0.14 0.01 0.15 0.14 0.01 0.15 0.28 0.02 0.30
MU3001 0.03 0.01 0.04 0.04 0.00 0.04 0.07 0.01 0.08
SD330 0.16 0.01 0.17 0.18 0.00 0.18 0.33 0.01 0.35
PA28 0.03 0.00 0.03 0.03 0.00 0.03 0.06 0.00 0.06
Air Taxi Total 0.84 0.08 0.92 0.87 0.06 0.92 1.70 0.14 1.84
GeneralAviation
BEC58P 0.39 0.09 0.48 0.42 0.05 0.47 0.81 0.14 0.95
CIT3 0.15 0.03 0.19 0.18 0.01 0.18 0.33 0.04 0.37
CL600 0.03 0.00 0.03 0.03 0.00 0.03 0.05 0.00 0.05
CL601 0.03 0.00 0.03 0.03 0.00 0.03 0.05 0.00 0.05
CNA172 0.72 0.16 0.88 0.81 0.07 0.88 1.53 0.23 1.76
CNA182 0.07 0.00 0.07 0.07 0.00 0.07 0.13 0.00 0.13
CNA206 0.17 0.01 0.18 0.18 0.00 0.18 0.35 0.01 0.36
CNA208 0.52 0.04 0.55 0.55 0.00 0.55 1.07 0.04 1.11
CNA441 5.07 0.42 5.49 5.31 0.19 5.50 10.38 0.61 10.99
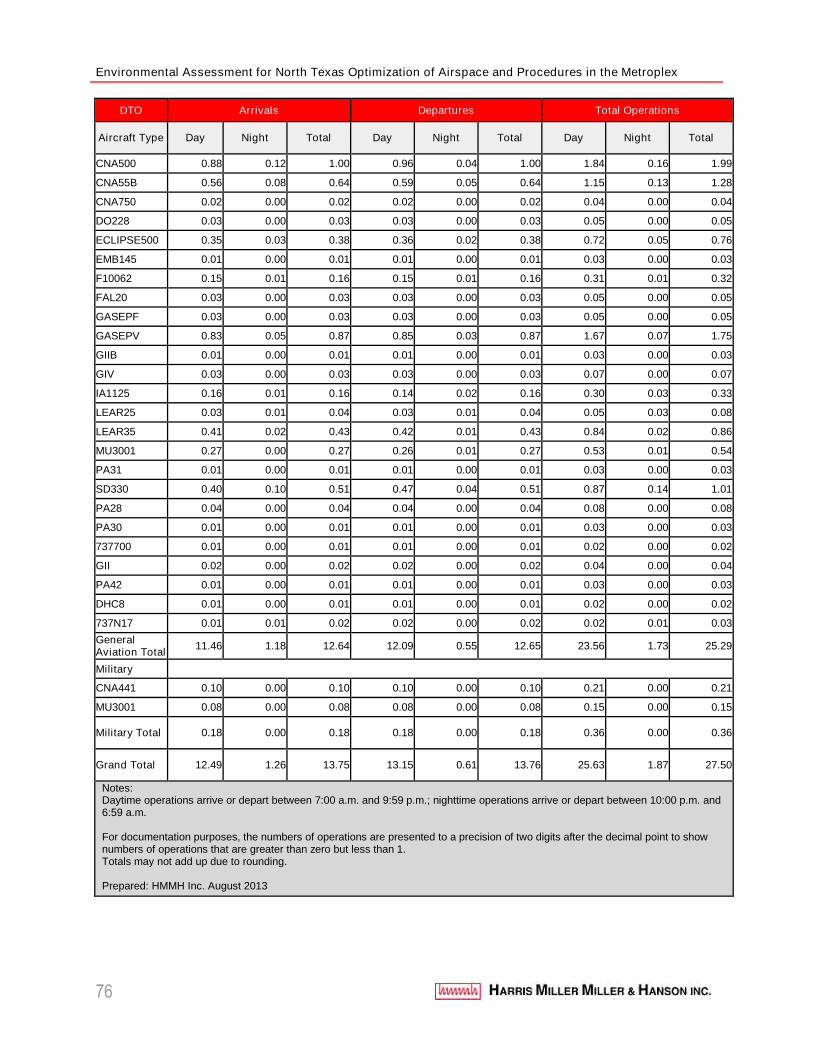
Environmental Assessment for North Texas Optimization of Airspace and Procedures in the Metroplex
76
DTO Arrivals Departures Total Operations
Aircraft Type Day Night Total Day Night Total Day Night Total
CNA500 0.88 0.12 1.00 0.96 0.04 1.00 1.84 0.16 1.99
CNA55B 0.56 0.08 0.64 0.59 0.05 0.64 1.15 0.13 1.28
CNA750 0.02 0.00 0.02 0.02 0.00 0.02 0.04 0.00 0.04
DO228 0.03 0.00 0.03 0.03 0.00 0.03 0.05 0.00 0.05
ECLIPSE500 0.35 0.03 0.38 0.36 0.02 0.38 0.72 0.05 0.76
EMB145 0.01 0.00 0.01 0.01 0.00 0.01 0.03 0.00 0.03
F10062 0.15 0.01 0.16 0.15 0.01 0.16 0.31 0.01 0.32
FAL20 0.03 0.00 0.03 0.03 0.00 0.03 0.05 0.00 0.05
GASEPF 0.03 0.00 0.03 0.03 0.00 0.03 0.05 0.00 0.05
GASEPV 0.83 0.05 0.87 0.85 0.03 0.87 1.67 0.07 1.75
GIIB 0.01 0.00 0.01 0.01 0.00 0.01 0.03 0.00 0.03
GIV 0.03 0.00 0.03 0.03 0.00 0.03 0.07 0.00 0.07
IA1125 0.16 0.01 0.16 0.14 0.02 0.16 0.30 0.03 0.33
LEAR25 0.03 0.01 0.04 0.03 0.01 0.04 0.05 0.03 0.08
LEAR35 0.41 0.02 0.43 0.42 0.01 0.43 0.84 0.02 0.86
MU3001 0.27 0.00 0.27 0.26 0.01 0.27 0.53 0.01 0.54
PA31 0.01 0.00 0.01 0.01 0.00 0.01 0.03 0.00 0.03
SD330 0.40 0.10 0.51 0.47 0.04 0.51 0.87 0.14 1.01
PA28 0.04 0.00 0.04 0.04 0.00 0.04 0.08 0.00 0.08
PA30 0.01 0.00 0.01 0.01 0.00 0.01 0.03 0.00 0.03
737700 0.01 0.00 0.01 0.01 0.00 0.01 0.02 0.00 0.02
GII 0.02 0.00 0.02 0.02 0.00 0.02 0.04 0.00 0.04
PA42 0.01 0.00 0.01 0.01 0.00 0.01 0.03 0.00 0.03
DHC8 0.01 0.00 0.01 0.01 0.00 0.01 0.02 0.00 0.02
737N17 0.01 0.01 0.02 0.02 0.00 0.02 0.02 0.01 0.03
GeneralAviation Total
11.46 1.18 12.64 12.09 0.55 12.65 23.56 1.73 25.29
Military
CNA441 0.10 0.00 0.10 0.10 0.00 0.10 0.21 0.00 0.21
MU3001 0.08 0.00 0.08 0.08 0.00 0.08 0.15 0.00 0.15
Military Total 0.18 0.00 0.18 0.18 0.00 0.18 0.36 0.00 0.36
Grand Total 12.49 1.26 13.75 13.15 0.61 13.76 25.63 1.87 27.50
Notes:Daytime operations arrive or depart between 7:00 a.m. and 9:59 p.m.; nighttime operations arrive or depart between 10:00 p.m. and6:59 a.m.
For documentation purposes, the numbers of operations are presented to a precision of two digits after the decimal point to shownumbers of operations that are greater than zero but less than 1.Totals may not add up due to rounding.
Prepared: HMMH Inc. August 2013
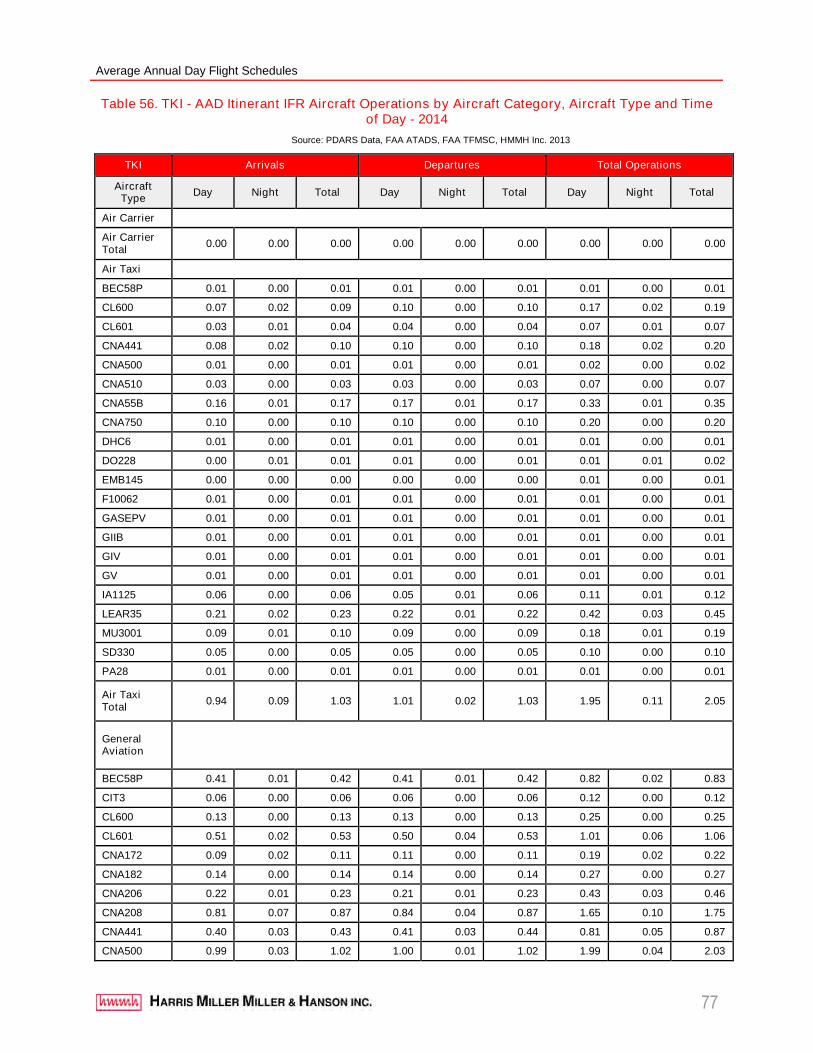
Average Annual Day Flight Schedules
77
Table 56. TKI - AAD Itinerant IFR Aircraft Operations by Aircraft Category, Aircraft Type and Timeof Day - 2014
Source: PDARS Data, FAA ATADS, FAA TFMSC, HMMH Inc. 2013
TKI Arrivals Departures Total Operations
AircraftType
Day Night Total Day Night Total Day Night Total
Air Carrier
Air CarrierTotal
0.00 0.00 0.00 0.00 0.00 0.00 0.00 0.00 0.00
Air Taxi
BEC58P 0.01 0.00 0.01 0.01 0.00 0.01 0.01 0.00 0.01
CL600 0.07 0.02 0.09 0.10 0.00 0.10 0.17 0.02 0.19
CL601 0.03 0.01 0.04 0.04 0.00 0.04 0.07 0.01 0.07
CNA441 0.08 0.02 0.10 0.10 0.00 0.10 0.18 0.02 0.20
CNA500 0.01 0.00 0.01 0.01 0.00 0.01 0.02 0.00 0.02
CNA510 0.03 0.00 0.03 0.03 0.00 0.03 0.07 0.00 0.07
CNA55B 0.16 0.01 0.17 0.17 0.01 0.17 0.33 0.01 0.35
CNA750 0.10 0.00 0.10 0.10 0.00 0.10 0.20 0.00 0.20
DHC6 0.01 0.00 0.01 0.01 0.00 0.01 0.01 0.00 0.01
DO228 0.00 0.01 0.01 0.01 0.00 0.01 0.01 0.01 0.02
EMB145 0.00 0.00 0.00 0.00 0.00 0.00 0.01 0.00 0.01
F10062 0.01 0.00 0.01 0.01 0.00 0.01 0.01 0.00 0.01
GASEPV 0.01 0.00 0.01 0.01 0.00 0.01 0.01 0.00 0.01
GIIB 0.01 0.00 0.01 0.01 0.00 0.01 0.01 0.00 0.01
GIV 0.01 0.00 0.01 0.01 0.00 0.01 0.01 0.00 0.01
GV 0.01 0.00 0.01 0.01 0.00 0.01 0.01 0.00 0.01
IA1125 0.06 0.00 0.06 0.05 0.01 0.06 0.11 0.01 0.12
LEAR35 0.21 0.02 0.23 0.22 0.01 0.22 0.42 0.03 0.45
MU3001 0.09 0.01 0.10 0.09 0.00 0.09 0.18 0.01 0.19
SD330 0.05 0.00 0.05 0.05 0.00 0.05 0.10 0.00 0.10
PA28 0.01 0.00 0.01 0.01 0.00 0.01 0.01 0.00 0.01
Air TaxiTotal
0.94 0.09 1.03 1.01 0.02 1.03 1.95 0.11 2.05
GeneralAviation
BEC58P 0.41 0.01 0.42 0.41 0.01 0.42 0.82 0.02 0.83
CIT3 0.06 0.00 0.06 0.06 0.00 0.06 0.12 0.00 0.12
CL600 0.13 0.00 0.13 0.13 0.00 0.13 0.25 0.00 0.25
CL601 0.51 0.02 0.53 0.50 0.04 0.53 1.01 0.06 1.06
CNA172 0.09 0.02 0.11 0.11 0.00 0.11 0.19 0.02 0.22
CNA182 0.14 0.00 0.14 0.14 0.00 0.14 0.27 0.00 0.27
CNA206 0.22 0.01 0.23 0.21 0.01 0.23 0.43 0.03 0.46
CNA208 0.81 0.07 0.87 0.84 0.04 0.87 1.65 0.10 1.75
CNA441 0.40 0.03 0.43 0.41 0.03 0.44 0.81 0.05 0.87
CNA500 0.99 0.03 1.02 1.00 0.01 1.02 1.99 0.04 2.03
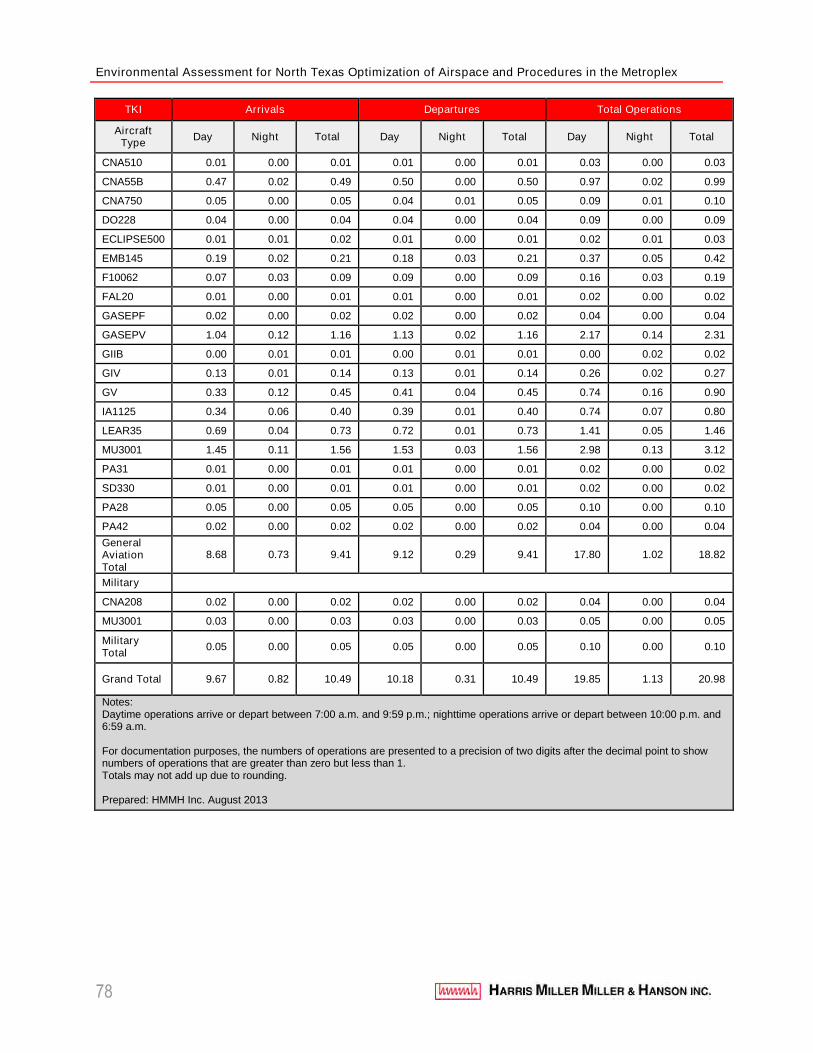
Environmental Assessment for North Texas Optimization of Airspace and Procedures in the Metroplex
78
TKI Arrivals Departures Total Operations
AircraftType
Day Night Total Day Night Total Day Night Total
CNA510 0.01 0.00 0.01 0.01 0.00 0.01 0.03 0.00 0.03
CNA55B 0.47 0.02 0.49 0.50 0.00 0.50 0.97 0.02 0.99
CNA750 0.05 0.00 0.05 0.04 0.01 0.05 0.09 0.01 0.10
DO228 0.04 0.00 0.04 0.04 0.00 0.04 0.09 0.00 0.09
ECLIPSE500 0.01 0.01 0.02 0.01 0.00 0.01 0.02 0.01 0.03
EMB145 0.19 0.02 0.21 0.18 0.03 0.21 0.37 0.05 0.42
F10062 0.07 0.03 0.09 0.09 0.00 0.09 0.16 0.03 0.19
FAL20 0.01 0.00 0.01 0.01 0.00 0.01 0.02 0.00 0.02
GASEPF 0.02 0.00 0.02 0.02 0.00 0.02 0.04 0.00 0.04
GASEPV 1.04 0.12 1.16 1.13 0.02 1.16 2.17 0.14 2.31
GIIB 0.00 0.01 0.01 0.00 0.01 0.01 0.00 0.02 0.02
GIV 0.13 0.01 0.14 0.13 0.01 0.14 0.26 0.02 0.27
GV 0.33 0.12 0.45 0.41 0.04 0.45 0.74 0.16 0.90
IA1125 0.34 0.06 0.40 0.39 0.01 0.40 0.74 0.07 0.80
LEAR35 0.69 0.04 0.73 0.72 0.01 0.73 1.41 0.05 1.46
MU3001 1.45 0.11 1.56 1.53 0.03 1.56 2.98 0.13 3.12
PA31 0.01 0.00 0.01 0.01 0.00 0.01 0.02 0.00 0.02
SD330 0.01 0.00 0.01 0.01 0.00 0.01 0.02 0.00 0.02
PA28 0.05 0.00 0.05 0.05 0.00 0.05 0.10 0.00 0.10
PA42 0.02 0.00 0.02 0.02 0.00 0.02 0.04 0.00 0.04
GeneralAviationTotal
8.68 0.73 9.41 9.12 0.29 9.41 17.80 1.02 18.82
Military
CNA208 0.02 0.00 0.02 0.02 0.00 0.02 0.04 0.00 0.04
MU3001 0.03 0.00 0.03 0.03 0.00 0.03 0.05 0.00 0.05
MilitaryTotal
0.05 0.00 0.05 0.05 0.00 0.05 0.10 0.00 0.10
Grand Total 9.67 0.82 10.49 10.18 0.31 10.49 19.85 1.13 20.98
Notes:Daytime operations arrive or depart between 7:00 a.m. and 9:59 p.m.; nighttime operations arrive or depart between 10:00 p.m. and6:59 a.m.
For documentation purposes, the numbers of operations are presented to a precision of two digits after the decimal point to shownumbers of operations that are greater than zero but less than 1.Totals may not add up due to rounding.
Prepared: HMMH Inc. August 2013
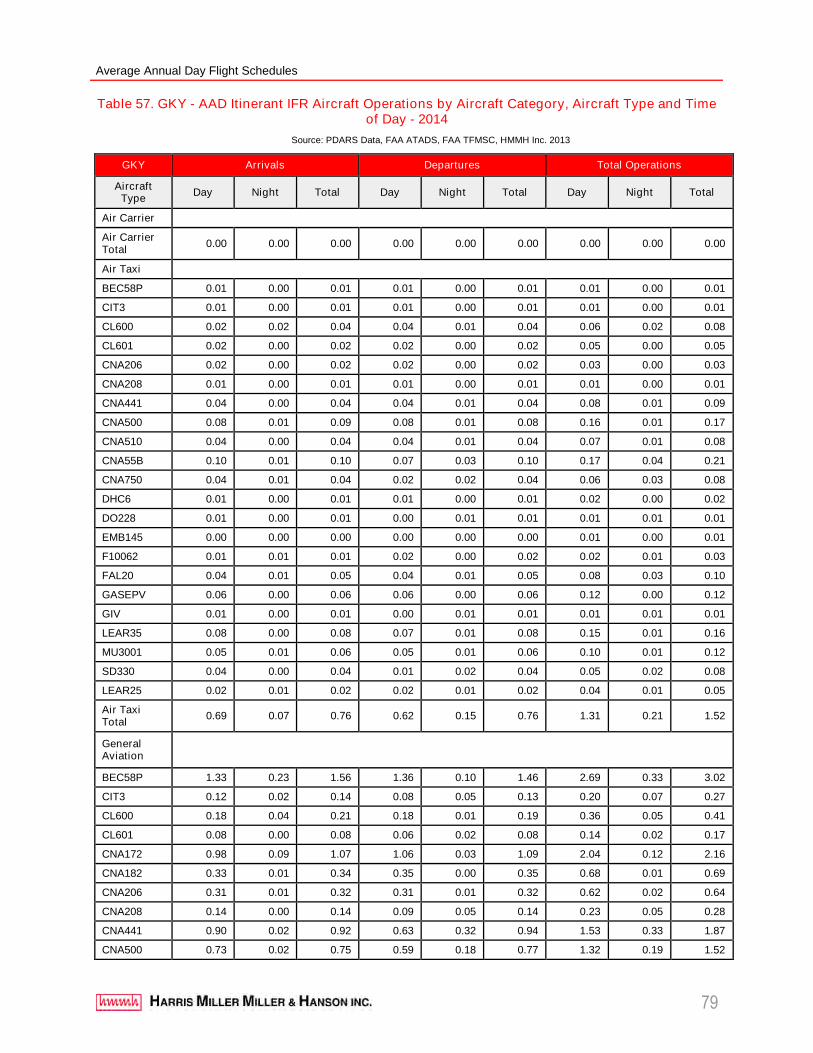
Average Annual Day Flight Schedules
79
Table 57. GKY - AAD Itinerant IFR Aircraft Operations by Aircraft Category, Aircraft Type and Timeof Day - 2014
Source: PDARS Data, FAA ATADS, FAA TFMSC, HMMH Inc. 2013
GKY Arrivals Departures Total Operations
AircraftType
Day Night Total Day Night Total Day Night Total
Air Carrier
Air CarrierTotal
0.00 0.00 0.00 0.00 0.00 0.00 0.00 0.00 0.00
Air Taxi
BEC58P 0.01 0.00 0.01 0.01 0.00 0.01 0.01 0.00 0.01
CIT3 0.01 0.00 0.01 0.01 0.00 0.01 0.01 0.00 0.01
CL600 0.02 0.02 0.04 0.04 0.01 0.04 0.06 0.02 0.08
CL601 0.02 0.00 0.02 0.02 0.00 0.02 0.05 0.00 0.05
CNA206 0.02 0.00 0.02 0.02 0.00 0.02 0.03 0.00 0.03
CNA208 0.01 0.00 0.01 0.01 0.00 0.01 0.01 0.00 0.01
CNA441 0.04 0.00 0.04 0.04 0.01 0.04 0.08 0.01 0.09
CNA500 0.08 0.01 0.09 0.08 0.01 0.08 0.16 0.01 0.17
CNA510 0.04 0.00 0.04 0.04 0.01 0.04 0.07 0.01 0.08
CNA55B 0.10 0.01 0.10 0.07 0.03 0.10 0.17 0.04 0.21
CNA750 0.04 0.01 0.04 0.02 0.02 0.04 0.06 0.03 0.08
DHC6 0.01 0.00 0.01 0.01 0.00 0.01 0.02 0.00 0.02
DO228 0.01 0.00 0.01 0.00 0.01 0.01 0.01 0.01 0.01
EMB145 0.00 0.00 0.00 0.00 0.00 0.00 0.01 0.00 0.01
F10062 0.01 0.01 0.01 0.02 0.00 0.02 0.02 0.01 0.03
FAL20 0.04 0.01 0.05 0.04 0.01 0.05 0.08 0.03 0.10
GASEPV 0.06 0.00 0.06 0.06 0.00 0.06 0.12 0.00 0.12
GIV 0.01 0.00 0.01 0.00 0.01 0.01 0.01 0.01 0.01
LEAR35 0.08 0.00 0.08 0.07 0.01 0.08 0.15 0.01 0.16
MU3001 0.05 0.01 0.06 0.05 0.01 0.06 0.10 0.01 0.12
SD330 0.04 0.00 0.04 0.01 0.02 0.04 0.05 0.02 0.08
LEAR25 0.02 0.01 0.02 0.02 0.01 0.02 0.04 0.01 0.05
Air TaxiTotal
0.69 0.07 0.76 0.62 0.15 0.76 1.31 0.21 1.52
GeneralAviation
BEC58P 1.33 0.23 1.56 1.36 0.10 1.46 2.69 0.33 3.02
CIT3 0.12 0.02 0.14 0.08 0.05 0.13 0.20 0.07 0.27
CL600 0.18 0.04 0.21 0.18 0.01 0.19 0.36 0.05 0.41
CL601 0.08 0.00 0.08 0.06 0.02 0.08 0.14 0.02 0.17
CNA172 0.98 0.09 1.07 1.06 0.03 1.09 2.04 0.12 2.16
CNA182 0.33 0.01 0.34 0.35 0.00 0.35 0.68 0.01 0.69
CNA206 0.31 0.01 0.32 0.31 0.01 0.32 0.62 0.02 0.64
CNA208 0.14 0.00 0.14 0.09 0.05 0.14 0.23 0.05 0.28
CNA441 0.90 0.02 0.92 0.63 0.32 0.94 1.53 0.33 1.87
CNA500 0.73 0.02 0.75 0.59 0.18 0.77 1.32 0.19 1.52
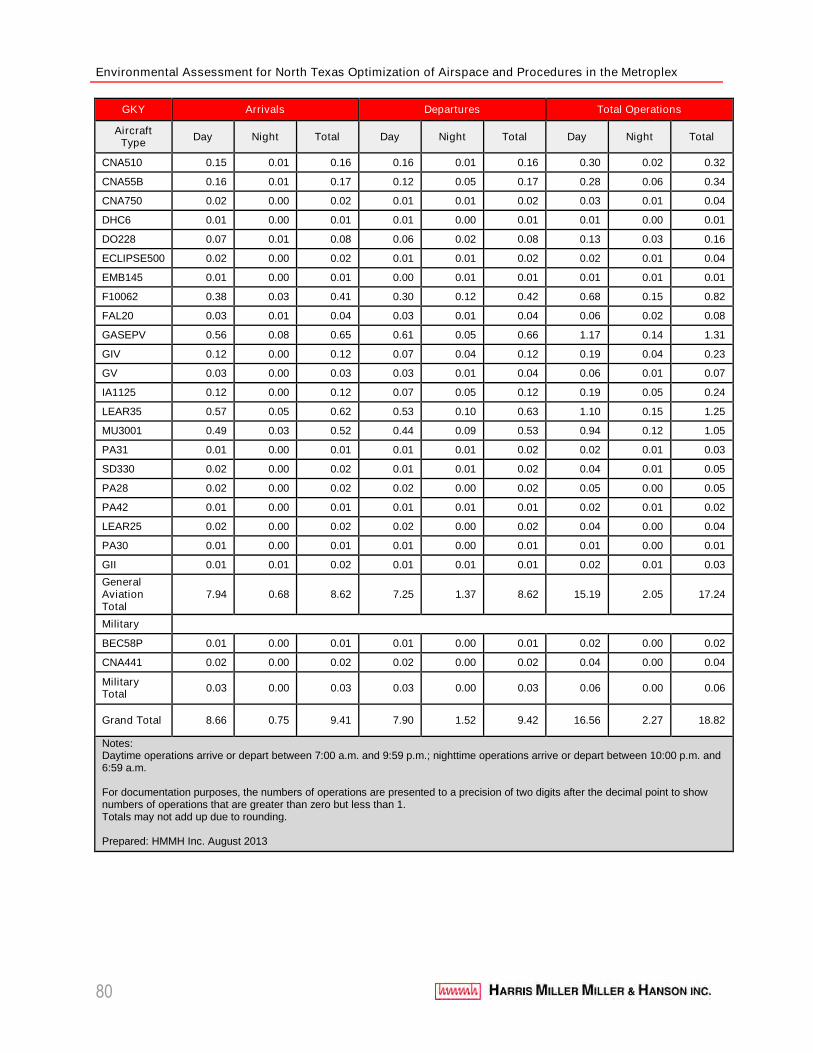
Environmental Assessment for North Texas Optimization of Airspace and Procedures in the Metroplex
80
GKY Arrivals Departures Total Operations
AircraftType
Day Night Total Day Night Total Day Night Total
CNA510 0.15 0.01 0.16 0.16 0.01 0.16 0.30 0.02 0.32
CNA55B 0.16 0.01 0.17 0.12 0.05 0.17 0.28 0.06 0.34
CNA750 0.02 0.00 0.02 0.01 0.01 0.02 0.03 0.01 0.04
DHC6 0.01 0.00 0.01 0.01 0.00 0.01 0.01 0.00 0.01
DO228 0.07 0.01 0.08 0.06 0.02 0.08 0.13 0.03 0.16
ECLIPSE500 0.02 0.00 0.02 0.01 0.01 0.02 0.02 0.01 0.04
EMB145 0.01 0.00 0.01 0.00 0.01 0.01 0.01 0.01 0.01
F10062 0.38 0.03 0.41 0.30 0.12 0.42 0.68 0.15 0.82
FAL20 0.03 0.01 0.04 0.03 0.01 0.04 0.06 0.02 0.08
GASEPV 0.56 0.08 0.65 0.61 0.05 0.66 1.17 0.14 1.31
GIV 0.12 0.00 0.12 0.07 0.04 0.12 0.19 0.04 0.23
GV 0.03 0.00 0.03 0.03 0.01 0.04 0.06 0.01 0.07
IA1125 0.12 0.00 0.12 0.07 0.05 0.12 0.19 0.05 0.24
LEAR35 0.57 0.05 0.62 0.53 0.10 0.63 1.10 0.15 1.25
MU3001 0.49 0.03 0.52 0.44 0.09 0.53 0.94 0.12 1.05
PA31 0.01 0.00 0.01 0.01 0.01 0.02 0.02 0.01 0.03
SD330 0.02 0.00 0.02 0.01 0.01 0.02 0.04 0.01 0.05
PA28 0.02 0.00 0.02 0.02 0.00 0.02 0.05 0.00 0.05
PA42 0.01 0.00 0.01 0.01 0.01 0.01 0.02 0.01 0.02
LEAR25 0.02 0.00 0.02 0.02 0.00 0.02 0.04 0.00 0.04
PA30 0.01 0.00 0.01 0.01 0.00 0.01 0.01 0.00 0.01
GII 0.01 0.01 0.02 0.01 0.01 0.01 0.02 0.01 0.03
GeneralAviationTotal
7.94 0.68 8.62 7.25 1.37 8.62 15.19 2.05 17.24
Military
BEC58P 0.01 0.00 0.01 0.01 0.00 0.01 0.02 0.00 0.02
CNA441 0.02 0.00 0.02 0.02 0.00 0.02 0.04 0.00 0.04
MilitaryTotal
0.03 0.00 0.03 0.03 0.00 0.03 0.06 0.00 0.06
Grand Total 8.66 0.75 9.41 7.90 1.52 9.42 16.56 2.27 18.82
Notes:Daytime operations arrive or depart between 7:00 a.m. and 9:59 p.m.; nighttime operations arrive or depart between 10:00 p.m. and6:59 a.m.
For documentation purposes, the numbers of operations are presented to a precision of two digits after the decimal point to shownumbers of operations that are greater than zero but less than 1.Totals may not add up due to rounding.
Prepared: HMMH Inc. August 2013
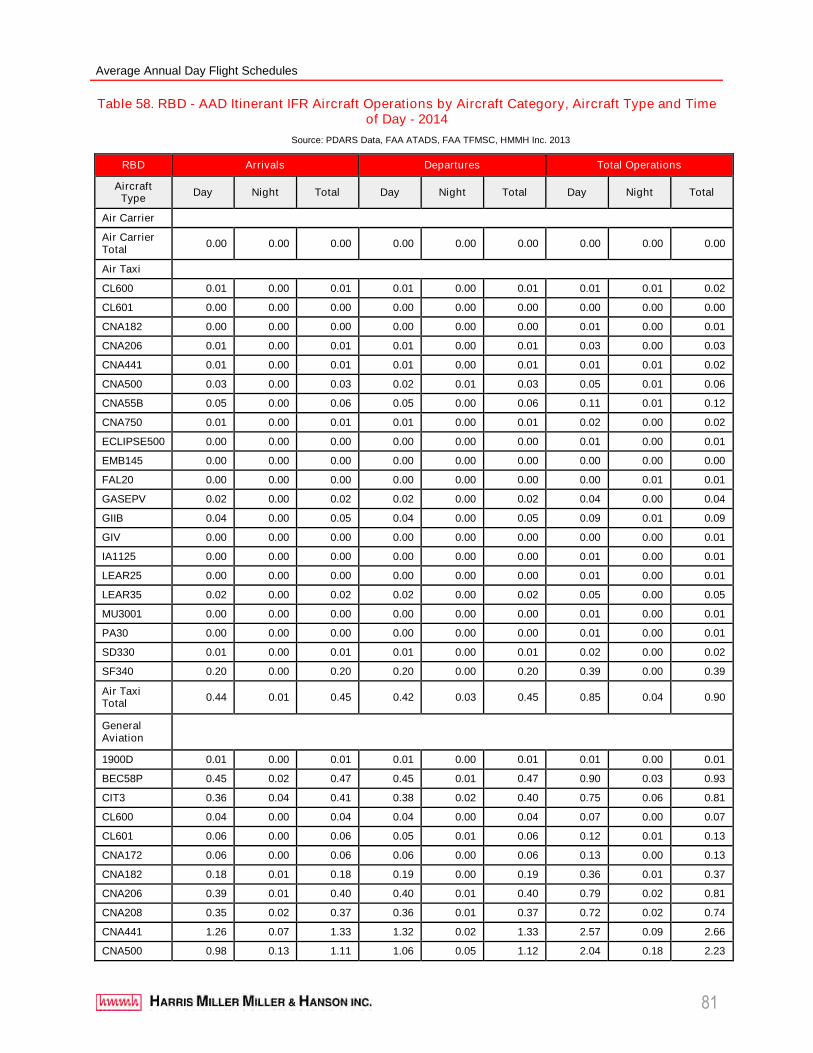
Average Annual Day Flight Schedules
81
Table 58. RBD - AAD Itinerant IFR Aircraft Operations by Aircraft Category, Aircraft Type and Timeof Day - 2014
Source: PDARS Data, FAA ATADS, FAA TFMSC, HMMH Inc. 2013
RBD Arrivals Departures Total Operations
AircraftType
Day Night Total Day Night Total Day Night Total
Air Carrier
Air CarrierTotal
0.00 0.00 0.00 0.00 0.00 0.00 0.00 0.00 0.00
Air Taxi
CL600 0.01 0.00 0.01 0.01 0.00 0.01 0.01 0.01 0.02
CL601 0.00 0.00 0.00 0.00 0.00 0.00 0.00 0.00 0.00
CNA182 0.00 0.00 0.00 0.00 0.00 0.00 0.01 0.00 0.01
CNA206 0.01 0.00 0.01 0.01 0.00 0.01 0.03 0.00 0.03
CNA441 0.01 0.00 0.01 0.01 0.00 0.01 0.01 0.01 0.02
CNA500 0.03 0.00 0.03 0.02 0.01 0.03 0.05 0.01 0.06
CNA55B 0.05 0.00 0.06 0.05 0.00 0.06 0.11 0.01 0.12
CNA750 0.01 0.00 0.01 0.01 0.00 0.01 0.02 0.00 0.02
ECLIPSE500 0.00 0.00 0.00 0.00 0.00 0.00 0.01 0.00 0.01
EMB145 0.00 0.00 0.00 0.00 0.00 0.00 0.00 0.00 0.00
FAL20 0.00 0.00 0.00 0.00 0.00 0.00 0.00 0.01 0.01
GASEPV 0.02 0.00 0.02 0.02 0.00 0.02 0.04 0.00 0.04
GIIB 0.04 0.00 0.05 0.04 0.00 0.05 0.09 0.01 0.09
GIV 0.00 0.00 0.00 0.00 0.00 0.00 0.00 0.00 0.01
IA1125 0.00 0.00 0.00 0.00 0.00 0.00 0.01 0.00 0.01
LEAR25 0.00 0.00 0.00 0.00 0.00 0.00 0.01 0.00 0.01
LEAR35 0.02 0.00 0.02 0.02 0.00 0.02 0.05 0.00 0.05
MU3001 0.00 0.00 0.00 0.00 0.00 0.00 0.01 0.00 0.01
PA30 0.00 0.00 0.00 0.00 0.00 0.00 0.01 0.00 0.01
SD330 0.01 0.00 0.01 0.01 0.00 0.01 0.02 0.00 0.02
SF340 0.20 0.00 0.20 0.20 0.00 0.20 0.39 0.00 0.39
Air TaxiTotal
0.44 0.01 0.45 0.42 0.03 0.45 0.85 0.04 0.90
GeneralAviation
1900D 0.01 0.00 0.01 0.01 0.00 0.01 0.01 0.00 0.01
BEC58P 0.45 0.02 0.47 0.45 0.01 0.47 0.90 0.03 0.93
CIT3 0.36 0.04 0.41 0.38 0.02 0.40 0.75 0.06 0.81
CL600 0.04 0.00 0.04 0.04 0.00 0.04 0.07 0.00 0.07
CL601 0.06 0.00 0.06 0.05 0.01 0.06 0.12 0.01 0.13
CNA172 0.06 0.00 0.06 0.06 0.00 0.06 0.13 0.00 0.13
CNA182 0.18 0.01 0.18 0.19 0.00 0.19 0.36 0.01 0.37
CNA206 0.39 0.01 0.40 0.40 0.01 0.40 0.79 0.02 0.81
CNA208 0.35 0.02 0.37 0.36 0.01 0.37 0.72 0.02 0.74
CNA441 1.26 0.07 1.33 1.32 0.02 1.33 2.57 0.09 2.66
CNA500 0.98 0.13 1.11 1.06 0.05 1.12 2.04 0.18 2.23
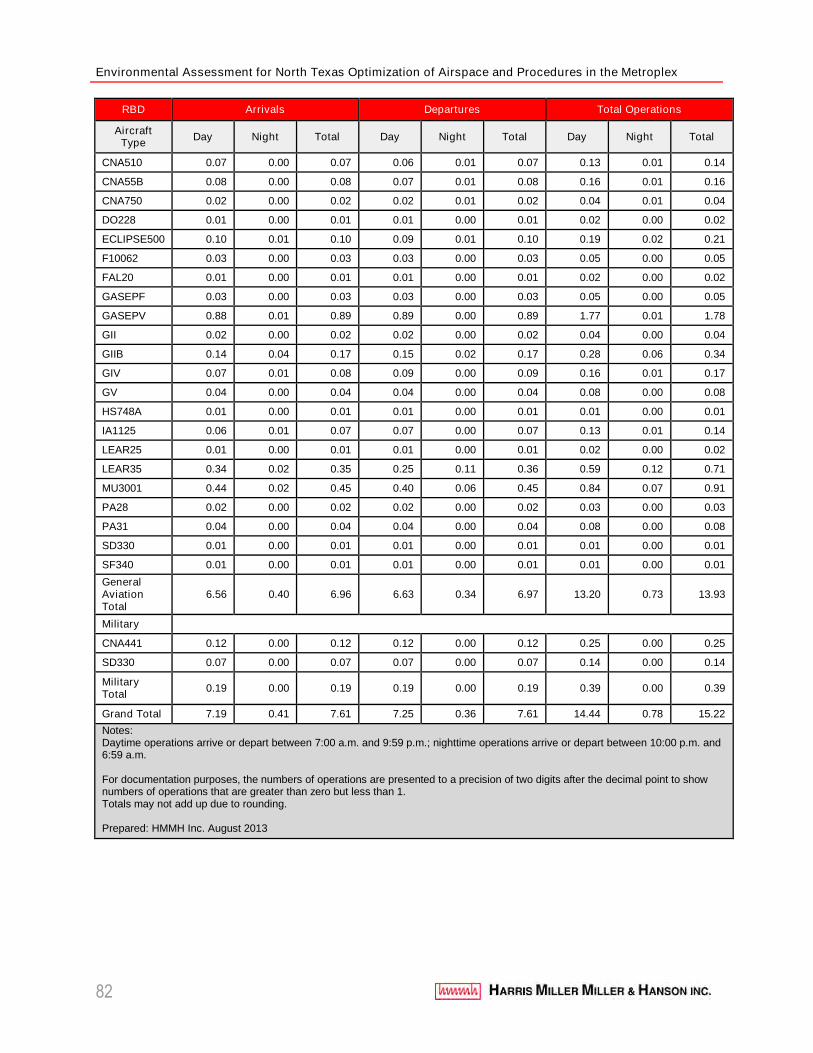
Environmental Assessment for North Texas Optimization of Airspace and Procedures in the Metroplex
82
RBD Arrivals Departures Total Operations
AircraftType
Day Night Total Day Night Total Day Night Total
CNA510 0.07 0.00 0.07 0.06 0.01 0.07 0.13 0.01 0.14
CNA55B 0.08 0.00 0.08 0.07 0.01 0.08 0.16 0.01 0.16
CNA750 0.02 0.00 0.02 0.02 0.01 0.02 0.04 0.01 0.04
DO228 0.01 0.00 0.01 0.01 0.00 0.01 0.02 0.00 0.02
ECLIPSE500 0.10 0.01 0.10 0.09 0.01 0.10 0.19 0.02 0.21
F10062 0.03 0.00 0.03 0.03 0.00 0.03 0.05 0.00 0.05
FAL20 0.01 0.00 0.01 0.01 0.00 0.01 0.02 0.00 0.02
GASEPF 0.03 0.00 0.03 0.03 0.00 0.03 0.05 0.00 0.05
GASEPV 0.88 0.01 0.89 0.89 0.00 0.89 1.77 0.01 1.78
GII 0.02 0.00 0.02 0.02 0.00 0.02 0.04 0.00 0.04
GIIB 0.14 0.04 0.17 0.15 0.02 0.17 0.28 0.06 0.34
GIV 0.07 0.01 0.08 0.09 0.00 0.09 0.16 0.01 0.17
GV 0.04 0.00 0.04 0.04 0.00 0.04 0.08 0.00 0.08
HS748A 0.01 0.00 0.01 0.01 0.00 0.01 0.01 0.00 0.01
IA1125 0.06 0.01 0.07 0.07 0.00 0.07 0.13 0.01 0.14
LEAR25 0.01 0.00 0.01 0.01 0.00 0.01 0.02 0.00 0.02
LEAR35 0.34 0.02 0.35 0.25 0.11 0.36 0.59 0.12 0.71
MU3001 0.44 0.02 0.45 0.40 0.06 0.45 0.84 0.07 0.91
PA28 0.02 0.00 0.02 0.02 0.00 0.02 0.03 0.00 0.03
PA31 0.04 0.00 0.04 0.04 0.00 0.04 0.08 0.00 0.08
SD330 0.01 0.00 0.01 0.01 0.00 0.01 0.01 0.00 0.01
SF340 0.01 0.00 0.01 0.01 0.00 0.01 0.01 0.00 0.01
GeneralAviationTotal
6.56 0.40 6.96 6.63 0.34 6.97 13.20 0.73 13.93
Military
CNA441 0.12 0.00 0.12 0.12 0.00 0.12 0.25 0.00 0.25
SD330 0.07 0.00 0.07 0.07 0.00 0.07 0.14 0.00 0.14
MilitaryTotal
0.19 0.00 0.19 0.19 0.00 0.19 0.39 0.00 0.39
Grand Total 7.19 0.41 7.61 7.25 0.36 7.61 14.44 0.78 15.22
Notes:Daytime operations arrive or depart between 7:00 a.m. and 9:59 p.m.; nighttime operations arrive or depart between 10:00 p.m. and6:59 a.m.
For documentation purposes, the numbers of operations are presented to a precision of two digits after the decimal point to shownumbers of operations that are greater than zero but less than 1.Totals may not add up due to rounding.
Prepared: HMMH Inc. August 2013
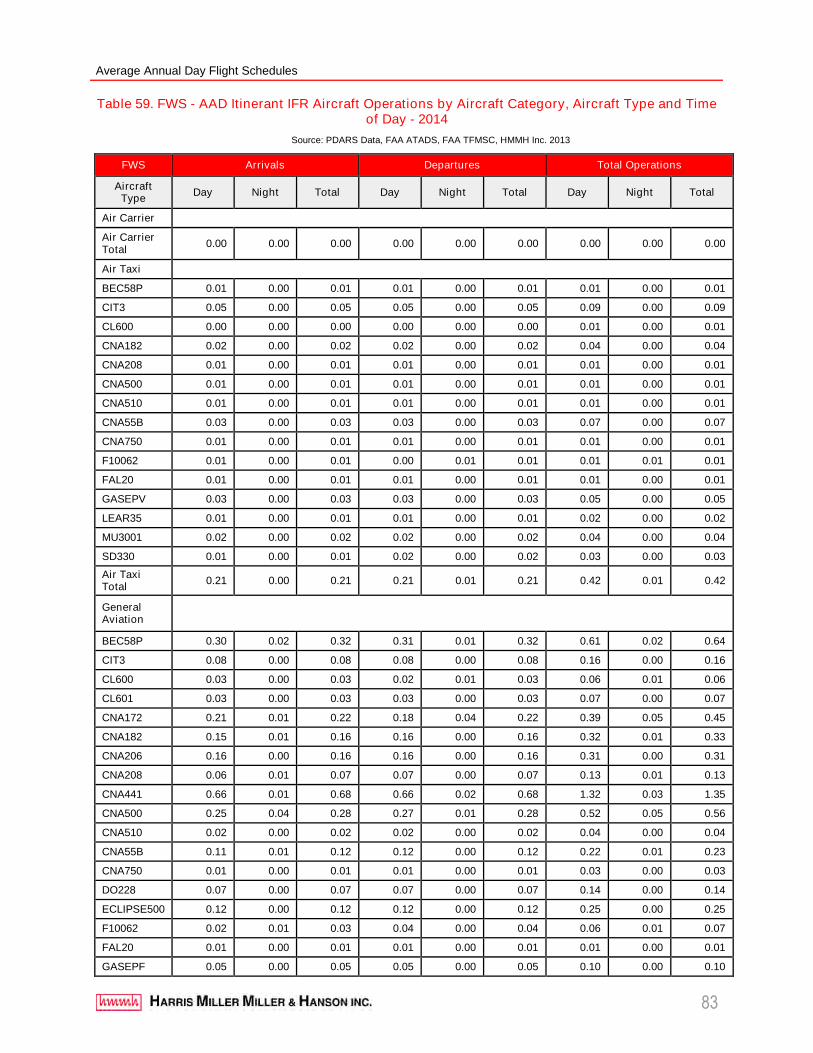
Average Annual Day Flight Schedules
83
Table 59. FWS - AAD Itinerant IFR Aircraft Operations by Aircraft Category, Aircraft Type and Timeof Day - 2014
Source: PDARS Data, FAA ATADS, FAA TFMSC, HMMH Inc. 2013
FWS Arrivals Departures Total Operations
AircraftType
Day Night Total Day Night Total Day Night Total
Air Carrier
Air CarrierTotal
0.00 0.00 0.00 0.00 0.00 0.00 0.00 0.00 0.00
Air Taxi
BEC58P 0.01 0.00 0.01 0.01 0.00 0.01 0.01 0.00 0.01
CIT3 0.05 0.00 0.05 0.05 0.00 0.05 0.09 0.00 0.09
CL600 0.00 0.00 0.00 0.00 0.00 0.00 0.01 0.00 0.01
CNA182 0.02 0.00 0.02 0.02 0.00 0.02 0.04 0.00 0.04
CNA208 0.01 0.00 0.01 0.01 0.00 0.01 0.01 0.00 0.01
CNA500 0.01 0.00 0.01 0.01 0.00 0.01 0.01 0.00 0.01
CNA510 0.01 0.00 0.01 0.01 0.00 0.01 0.01 0.00 0.01
CNA55B 0.03 0.00 0.03 0.03 0.00 0.03 0.07 0.00 0.07
CNA750 0.01 0.00 0.01 0.01 0.00 0.01 0.01 0.00 0.01
F10062 0.01 0.00 0.01 0.00 0.01 0.01 0.01 0.01 0.01
FAL20 0.01 0.00 0.01 0.01 0.00 0.01 0.01 0.00 0.01
GASEPV 0.03 0.00 0.03 0.03 0.00 0.03 0.05 0.00 0.05
LEAR35 0.01 0.00 0.01 0.01 0.00 0.01 0.02 0.00 0.02
MU3001 0.02 0.00 0.02 0.02 0.00 0.02 0.04 0.00 0.04
SD330 0.01 0.00 0.01 0.02 0.00 0.02 0.03 0.00 0.03
Air TaxiTotal
0.21 0.00 0.21 0.21 0.01 0.21 0.42 0.01 0.42
GeneralAviation
BEC58P 0.30 0.02 0.32 0.31 0.01 0.32 0.61 0.02 0.64
CIT3 0.08 0.00 0.08 0.08 0.00 0.08 0.16 0.00 0.16
CL600 0.03 0.00 0.03 0.02 0.01 0.03 0.06 0.01 0.06
CL601 0.03 0.00 0.03 0.03 0.00 0.03 0.07 0.00 0.07
CNA172 0.21 0.01 0.22 0.18 0.04 0.22 0.39 0.05 0.45
CNA182 0.15 0.01 0.16 0.16 0.00 0.16 0.32 0.01 0.33
CNA206 0.16 0.00 0.16 0.16 0.00 0.16 0.31 0.00 0.31
CNA208 0.06 0.01 0.07 0.07 0.00 0.07 0.13 0.01 0.13
CNA441 0.66 0.01 0.68 0.66 0.02 0.68 1.32 0.03 1.35
CNA500 0.25 0.04 0.28 0.27 0.01 0.28 0.52 0.05 0.56
CNA510 0.02 0.00 0.02 0.02 0.00 0.02 0.04 0.00 0.04
CNA55B 0.11 0.01 0.12 0.12 0.00 0.12 0.22 0.01 0.23
CNA750 0.01 0.00 0.01 0.01 0.00 0.01 0.03 0.00 0.03
DO228 0.07 0.00 0.07 0.07 0.00 0.07 0.14 0.00 0.14
ECLIPSE500 0.12 0.00 0.12 0.12 0.00 0.12 0.25 0.00 0.25
F10062 0.02 0.01 0.03 0.04 0.00 0.04 0.06 0.01 0.07
FAL20 0.01 0.00 0.01 0.01 0.00 0.01 0.01 0.00 0.01
GASEPF 0.05 0.00 0.05 0.05 0.00 0.05 0.10 0.00 0.10
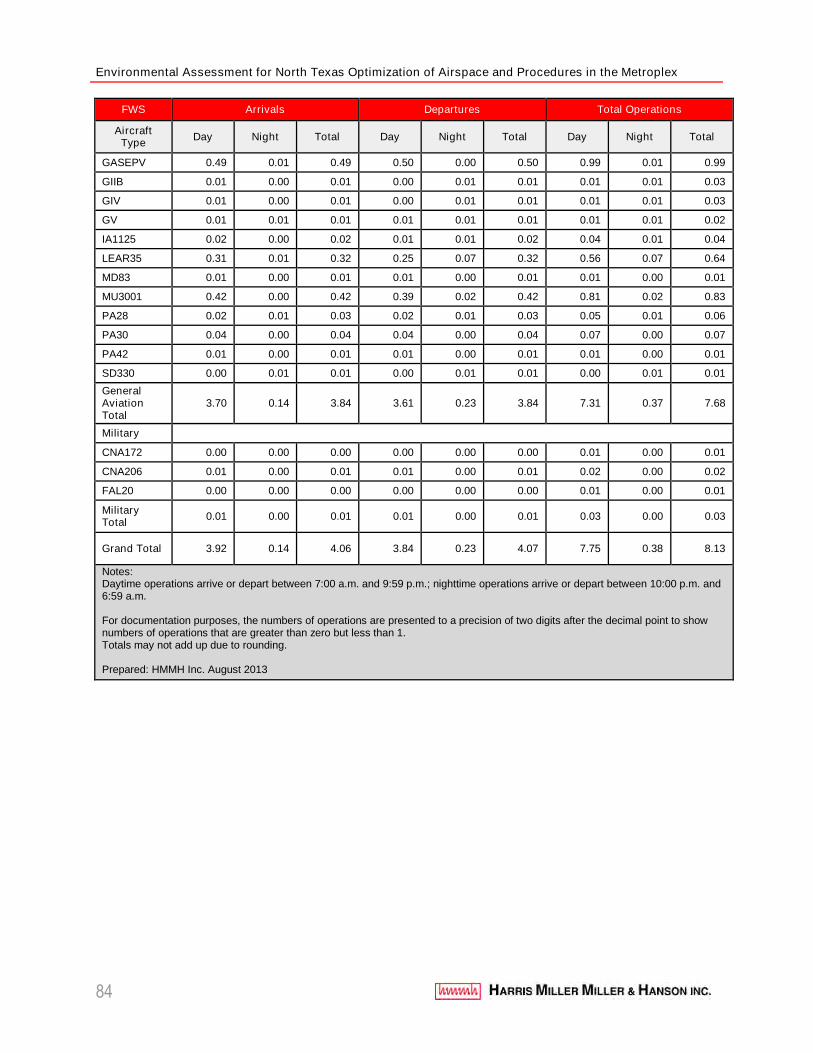
Environmental Assessment for North Texas Optimization of Airspace and Procedures in the Metroplex
84
FWS Arrivals Departures Total Operations
AircraftType
Day Night Total Day Night Total Day Night Total
GASEPV 0.49 0.01 0.49 0.50 0.00 0.50 0.99 0.01 0.99
GIIB 0.01 0.00 0.01 0.00 0.01 0.01 0.01 0.01 0.03
GIV 0.01 0.00 0.01 0.00 0.01 0.01 0.01 0.01 0.03
GV 0.01 0.01 0.01 0.01 0.01 0.01 0.01 0.01 0.02
IA1125 0.02 0.00 0.02 0.01 0.01 0.02 0.04 0.01 0.04
LEAR35 0.31 0.01 0.32 0.25 0.07 0.32 0.56 0.07 0.64
MD83 0.01 0.00 0.01 0.01 0.00 0.01 0.01 0.00 0.01
MU3001 0.42 0.00 0.42 0.39 0.02 0.42 0.81 0.02 0.83
PA28 0.02 0.01 0.03 0.02 0.01 0.03 0.05 0.01 0.06
PA30 0.04 0.00 0.04 0.04 0.00 0.04 0.07 0.00 0.07
PA42 0.01 0.00 0.01 0.01 0.00 0.01 0.01 0.00 0.01
SD330 0.00 0.01 0.01 0.00 0.01 0.01 0.00 0.01 0.01
GeneralAviationTotal
3.70 0.14 3.84 3.61 0.23 3.84 7.31 0.37 7.68
Military
CNA172 0.00 0.00 0.00 0.00 0.00 0.00 0.01 0.00 0.01
CNA206 0.01 0.00 0.01 0.01 0.00 0.01 0.02 0.00 0.02
FAL20 0.00 0.00 0.00 0.00 0.00 0.00 0.01 0.00 0.01
MilitaryTotal
0.01 0.00 0.01 0.01 0.00 0.01 0.03 0.00 0.03
Grand Total 3.92 0.14 4.06 3.84 0.23 4.07 7.75 0.38 8.13
Notes:Daytime operations arrive or depart between 7:00 a.m. and 9:59 p.m.; nighttime operations arrive or depart between 10:00 p.m. and6:59 a.m.
For documentation purposes, the numbers of operations are presented to a precision of two digits after the decimal point to shownumbers of operations that are greater than zero but less than 1.Totals may not add up due to rounding.
Prepared: HMMH Inc. August 2013
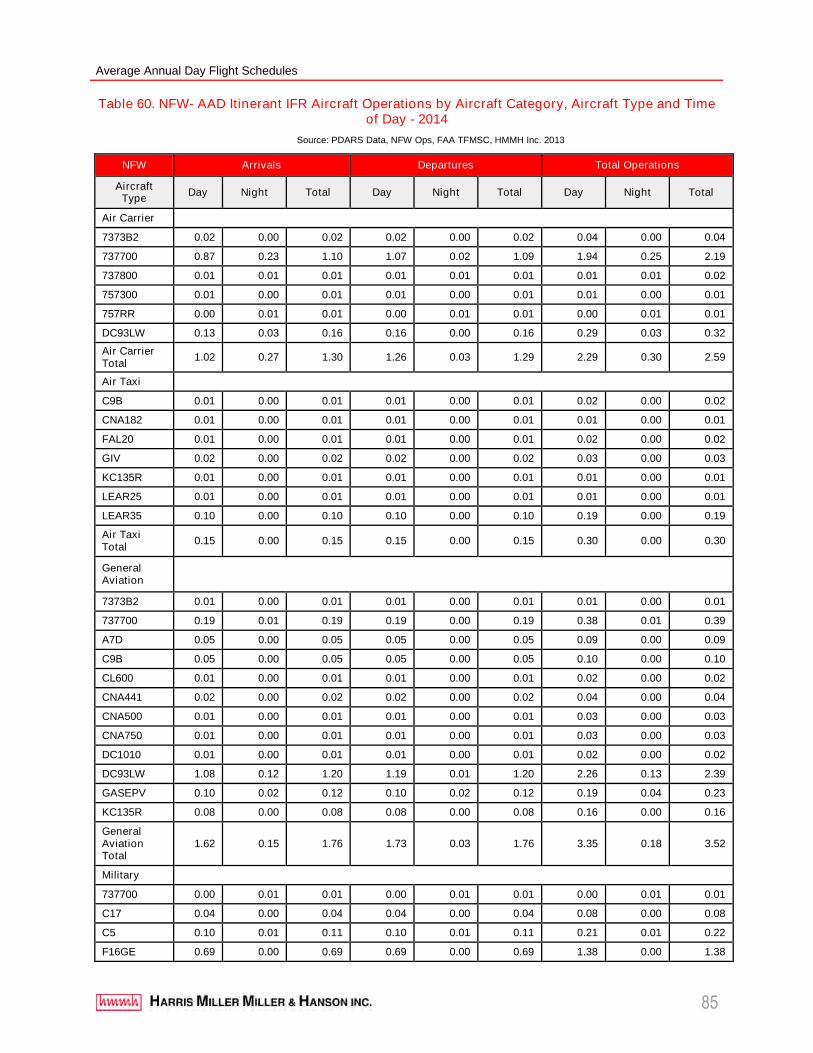
Average Annual Day Flight Schedules
85
Table 60. NFW- AAD Itinerant IFR Aircraft Operations by Aircraft Category, Aircraft Type and Timeof Day - 2014
Source: PDARS Data, NFW Ops, FAA TFMSC, HMMH Inc. 2013
NFW Arrivals Departures Total Operations
AircraftType
Day Night Total Day Night Total Day Night Total
Air Carrier
7373B2 0.02 0.00 0.02 0.02 0.00 0.02 0.04 0.00 0.04
737700 0.87 0.23 1.10 1.07 0.02 1.09 1.94 0.25 2.19
737800 0.01 0.01 0.01 0.01 0.01 0.01 0.01 0.01 0.02
757300 0.01 0.00 0.01 0.01 0.00 0.01 0.01 0.00 0.01
757RR 0.00 0.01 0.01 0.00 0.01 0.01 0.00 0.01 0.01
DC93LW 0.13 0.03 0.16 0.16 0.00 0.16 0.29 0.03 0.32
Air CarrierTotal
1.02 0.27 1.30 1.26 0.03 1.29 2.29 0.30 2.59
Air Taxi
C9B 0.01 0.00 0.01 0.01 0.00 0.01 0.02 0.00 0.02
CNA182 0.01 0.00 0.01 0.01 0.00 0.01 0.01 0.00 0.01
FAL20 0.01 0.00 0.01 0.01 0.00 0.01 0.02 0.00 0.02
GIV 0.02 0.00 0.02 0.02 0.00 0.02 0.03 0.00 0.03
KC135R 0.01 0.00 0.01 0.01 0.00 0.01 0.01 0.00 0.01
LEAR25 0.01 0.00 0.01 0.01 0.00 0.01 0.01 0.00 0.01
LEAR35 0.10 0.00 0.10 0.10 0.00 0.10 0.19 0.00 0.19
Air TaxiTotal
0.15 0.00 0.15 0.15 0.00 0.15 0.30 0.00 0.30
GeneralAviation
7373B2 0.01 0.00 0.01 0.01 0.00 0.01 0.01 0.00 0.01
737700 0.19 0.01 0.19 0.19 0.00 0.19 0.38 0.01 0.39
A7D 0.05 0.00 0.05 0.05 0.00 0.05 0.09 0.00 0.09
C9B 0.05 0.00 0.05 0.05 0.00 0.05 0.10 0.00 0.10
CL600 0.01 0.00 0.01 0.01 0.00 0.01 0.02 0.00 0.02
CNA441 0.02 0.00 0.02 0.02 0.00 0.02 0.04 0.00 0.04
CNA500 0.01 0.00 0.01 0.01 0.00 0.01 0.03 0.00 0.03
CNA750 0.01 0.00 0.01 0.01 0.00 0.01 0.03 0.00 0.03
DC1010 0.01 0.00 0.01 0.01 0.00 0.01 0.02 0.00 0.02
DC93LW 1.08 0.12 1.20 1.19 0.01 1.20 2.26 0.13 2.39
GASEPV 0.10 0.02 0.12 0.10 0.02 0.12 0.19 0.04 0.23
KC135R 0.08 0.00 0.08 0.08 0.00 0.08 0.16 0.00 0.16
GeneralAviationTotal
1.62 0.15 1.76 1.73 0.03 1.76 3.35 0.18 3.52
Military
737700 0.00 0.01 0.01 0.00 0.01 0.01 0.00 0.01 0.01
C17 0.04 0.00 0.04 0.04 0.00 0.04 0.08 0.00 0.08
C5 0.10 0.01 0.11 0.10 0.01 0.11 0.21 0.01 0.22
F16GE 0.69 0.00 0.69 0.69 0.00 0.69 1.38 0.00 1.38
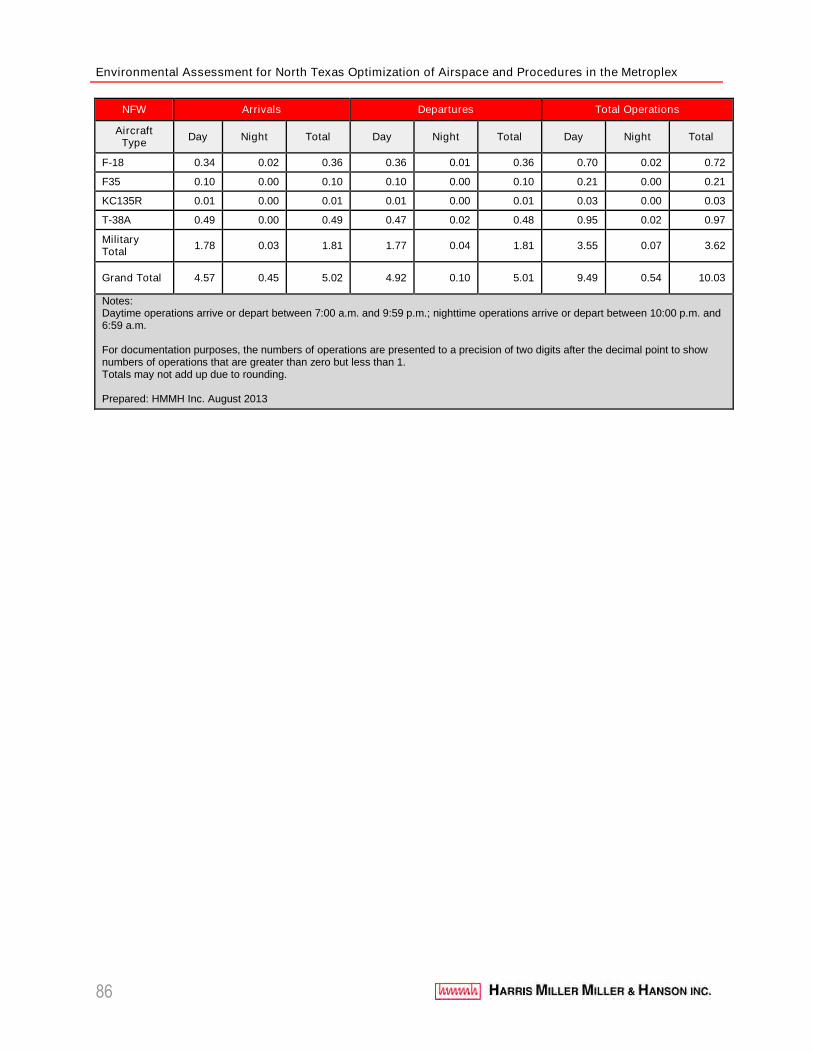
Environmental Assessment for North Texas Optimization of Airspace and Procedures in the Metroplex
86
NFW Arrivals Departures Total Operations
AircraftType
Day Night Total Day Night Total Day Night Total
F-18 0.34 0.02 0.36 0.36 0.01 0.36 0.70 0.02 0.72
F35 0.10 0.00 0.10 0.10 0.00 0.10 0.21 0.00 0.21
KC135R 0.01 0.00 0.01 0.01 0.00 0.01 0.03 0.00 0.03
T-38A 0.49 0.00 0.49 0.47 0.02 0.48 0.95 0.02 0.97
MilitaryTotal
1.78 0.03 1.81 1.77 0.04 1.81 3.55 0.07 3.62
Grand Total 4.57 0.45 5.02 4.92 0.10 5.01 9.49 0.54 10.03
Notes:Daytime operations arrive or depart between 7:00 a.m. and 9:59 p.m.; nighttime operations arrive or depart between 10:00 p.m. and6:59 a.m.
For documentation purposes, the numbers of operations are presented to a precision of two digits after the decimal point to shownumbers of operations that are greater than zero but less than 1.Totals may not add up due to rounding.
Prepared: HMMH Inc. August 2013
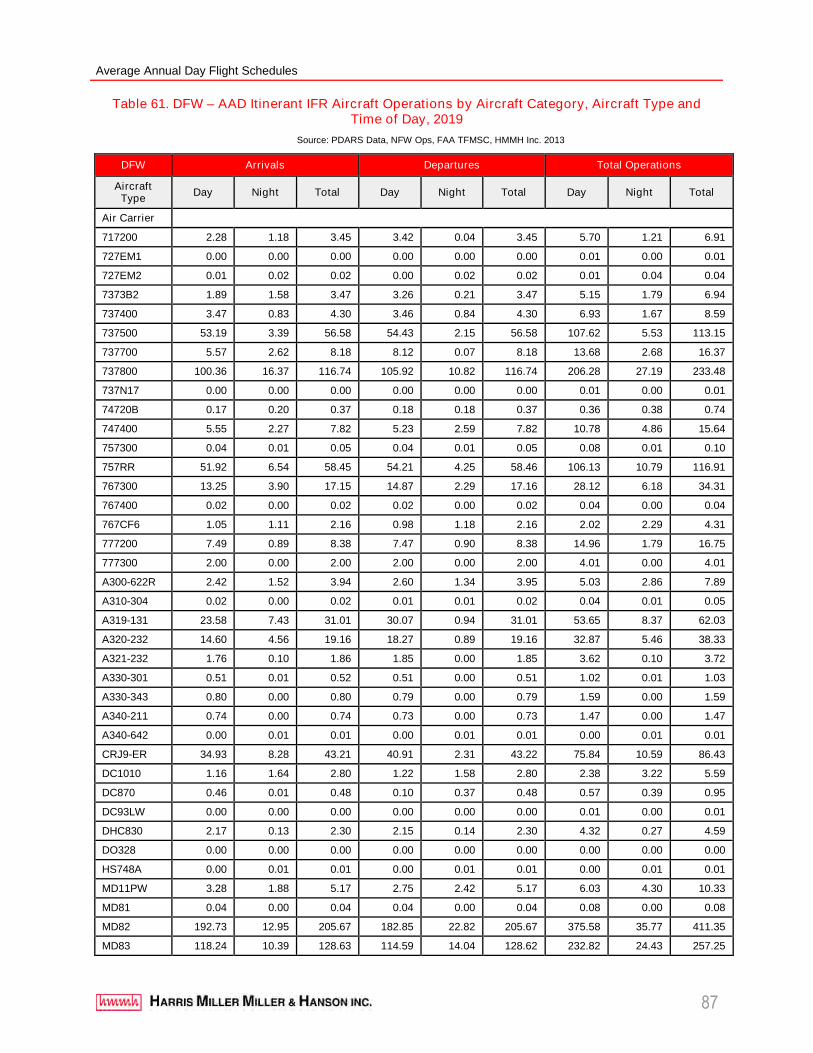
Average Annual Day Flight Schedules
87
Table 61. DFW – AAD Itinerant IFR Aircraft Operations by Aircraft Category, Aircraft Type andTime of Day, 2019
Source: PDARS Data, NFW Ops, FAA TFMSC, HMMH Inc. 2013
DFW Arrivals Departures Total Operations
AircraftType
Day Night Total Day Night Total Day Night Total
Air Carrier
717200 2.28 1.18 3.45 3.42 0.04 3.45 5.70 1.21 6.91
727EM1 0.00 0.00 0.00 0.00 0.00 0.00 0.01 0.00 0.01
727EM2 0.01 0.02 0.02 0.00 0.02 0.02 0.01 0.04 0.04
7373B2 1.89 1.58 3.47 3.26 0.21 3.47 5.15 1.79 6.94
737400 3.47 0.83 4.30 3.46 0.84 4.30 6.93 1.67 8.59
737500 53.19 3.39 56.58 54.43 2.15 56.58 107.62 5.53 113.15
737700 5.57 2.62 8.18 8.12 0.07 8.18 13.68 2.68 16.37
737800 100.36 16.37 116.74 105.92 10.82 116.74 206.28 27.19 233.48
737N17 0.00 0.00 0.00 0.00 0.00 0.00 0.01 0.00 0.01
74720B 0.17 0.20 0.37 0.18 0.18 0.37 0.36 0.38 0.74
747400 5.55 2.27 7.82 5.23 2.59 7.82 10.78 4.86 15.64
757300 0.04 0.01 0.05 0.04 0.01 0.05 0.08 0.01 0.10
757RR 51.92 6.54 58.45 54.21 4.25 58.46 106.13 10.79 116.91
767300 13.25 3.90 17.15 14.87 2.29 17.16 28.12 6.18 34.31
767400 0.02 0.00 0.02 0.02 0.00 0.02 0.04 0.00 0.04
767CF6 1.05 1.11 2.16 0.98 1.18 2.16 2.02 2.29 4.31
777200 7.49 0.89 8.38 7.47 0.90 8.38 14.96 1.79 16.75
777300 2.00 0.00 2.00 2.00 0.00 2.00 4.01 0.00 4.01
A300-622R 2.42 1.52 3.94 2.60 1.34 3.95 5.03 2.86 7.89
A310-304 0.02 0.00 0.02 0.01 0.01 0.02 0.04 0.01 0.05
A319-131 23.58 7.43 31.01 30.07 0.94 31.01 53.65 8.37 62.03
A320-232 14.60 4.56 19.16 18.27 0.89 19.16 32.87 5.46 38.33
A321-232 1.76 0.10 1.86 1.85 0.00 1.85 3.62 0.10 3.72
A330-301 0.51 0.01 0.52 0.51 0.00 0.51 1.02 0.01 1.03
A330-343 0.80 0.00 0.80 0.79 0.00 0.79 1.59 0.00 1.59
A340-211 0.74 0.00 0.74 0.73 0.00 0.73 1.47 0.00 1.47
A340-642 0.00 0.01 0.01 0.00 0.01 0.01 0.00 0.01 0.01
CRJ9-ER 34.93 8.28 43.21 40.91 2.31 43.22 75.84 10.59 86.43
DC1010 1.16 1.64 2.80 1.22 1.58 2.80 2.38 3.22 5.59
DC870 0.46 0.01 0.48 0.10 0.37 0.48 0.57 0.39 0.95
DC93LW 0.00 0.00 0.00 0.00 0.00 0.00 0.01 0.00 0.01
DHC830 2.17 0.13 2.30 2.15 0.14 2.30 4.32 0.27 4.59
DO328 0.00 0.00 0.00 0.00 0.00 0.00 0.00 0.00 0.00
HS748A 0.00 0.01 0.01 0.00 0.01 0.01 0.00 0.01 0.01
MD11PW 3.28 1.88 5.17 2.75 2.42 5.17 6.03 4.30 10.33
MD81 0.04 0.00 0.04 0.04 0.00 0.04 0.08 0.00 0.08
MD82 192.73 12.95 205.67 182.85 22.82 205.67 375.58 35.77 411.35
MD83 118.24 10.39 128.63 114.59 14.04 128.62 232.82 24.43 257.25
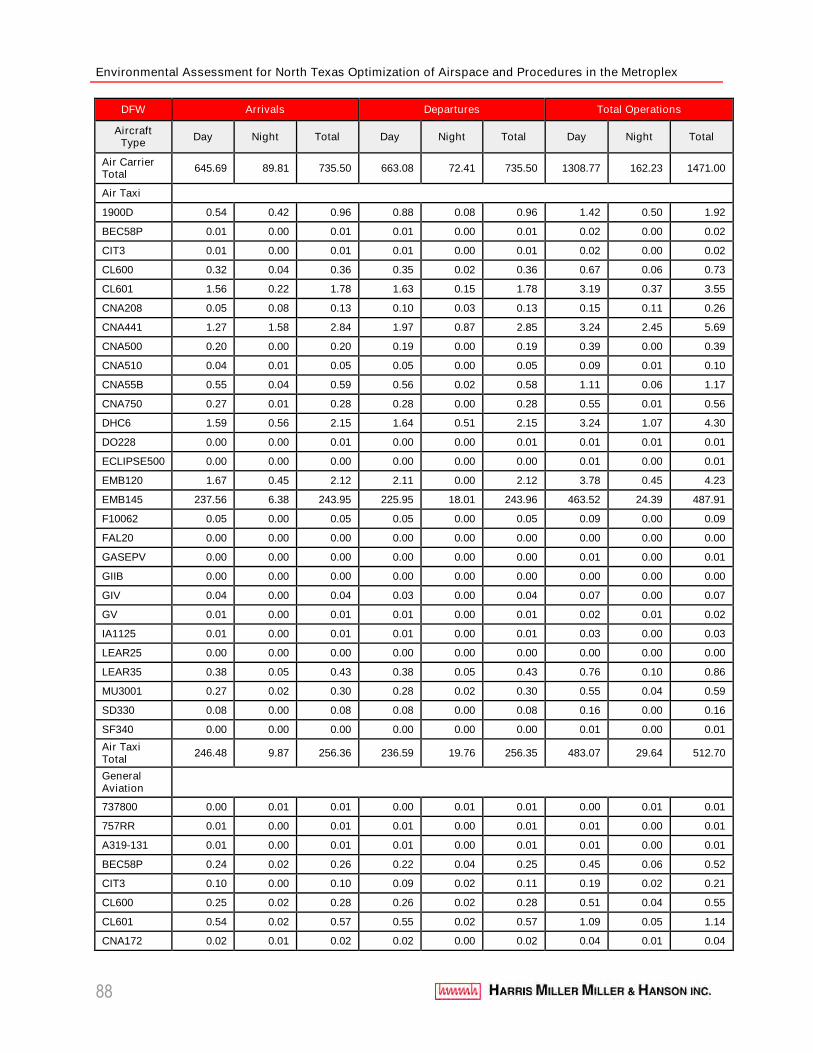
Environmental Assessment for North Texas Optimization of Airspace and Procedures in the Metroplex
88
DFW Arrivals Departures Total Operations
AircraftType
Day Night Total Day Night Total Day Night Total
Air CarrierTotal
645.69 89.81 735.50 663.08 72.41 735.50 1308.77 162.23 1471.00
Air Taxi
1900D 0.54 0.42 0.96 0.88 0.08 0.96 1.42 0.50 1.92
BEC58P 0.01 0.00 0.01 0.01 0.00 0.01 0.02 0.00 0.02
CIT3 0.01 0.00 0.01 0.01 0.00 0.01 0.02 0.00 0.02
CL600 0.32 0.04 0.36 0.35 0.02 0.36 0.67 0.06 0.73
CL601 1.56 0.22 1.78 1.63 0.15 1.78 3.19 0.37 3.55
CNA208 0.05 0.08 0.13 0.10 0.03 0.13 0.15 0.11 0.26
CNA441 1.27 1.58 2.84 1.97 0.87 2.85 3.24 2.45 5.69
CNA500 0.20 0.00 0.20 0.19 0.00 0.19 0.39 0.00 0.39
CNA510 0.04 0.01 0.05 0.05 0.00 0.05 0.09 0.01 0.10
CNA55B 0.55 0.04 0.59 0.56 0.02 0.58 1.11 0.06 1.17
CNA750 0.27 0.01 0.28 0.28 0.00 0.28 0.55 0.01 0.56
DHC6 1.59 0.56 2.15 1.64 0.51 2.15 3.24 1.07 4.30
DO228 0.00 0.00 0.01 0.00 0.00 0.01 0.01 0.01 0.01
ECLIPSE500 0.00 0.00 0.00 0.00 0.00 0.00 0.01 0.00 0.01
EMB120 1.67 0.45 2.12 2.11 0.00 2.12 3.78 0.45 4.23
EMB145 237.56 6.38 243.95 225.95 18.01 243.96 463.52 24.39 487.91
F10062 0.05 0.00 0.05 0.05 0.00 0.05 0.09 0.00 0.09
FAL20 0.00 0.00 0.00 0.00 0.00 0.00 0.00 0.00 0.00
GASEPV 0.00 0.00 0.00 0.00 0.00 0.00 0.01 0.00 0.01
GIIB 0.00 0.00 0.00 0.00 0.00 0.00 0.00 0.00 0.00
GIV 0.04 0.00 0.04 0.03 0.00 0.04 0.07 0.00 0.07
GV 0.01 0.00 0.01 0.01 0.00 0.01 0.02 0.01 0.02
IA1125 0.01 0.00 0.01 0.01 0.00 0.01 0.03 0.00 0.03
LEAR25 0.00 0.00 0.00 0.00 0.00 0.00 0.00 0.00 0.00
LEAR35 0.38 0.05 0.43 0.38 0.05 0.43 0.76 0.10 0.86
MU3001 0.27 0.02 0.30 0.28 0.02 0.30 0.55 0.04 0.59
SD330 0.08 0.00 0.08 0.08 0.00 0.08 0.16 0.00 0.16
SF340 0.00 0.00 0.00 0.00 0.00 0.00 0.01 0.00 0.01
Air TaxiTotal
246.48 9.87 256.36 236.59 19.76 256.35 483.07 29.64 512.70
GeneralAviation
737800 0.00 0.01 0.01 0.00 0.01 0.01 0.00 0.01 0.01
757RR 0.01 0.00 0.01 0.01 0.00 0.01 0.01 0.00 0.01
A319-131 0.01 0.00 0.01 0.01 0.00 0.01 0.01 0.00 0.01
BEC58P 0.24 0.02 0.26 0.22 0.04 0.25 0.45 0.06 0.52
CIT3 0.10 0.00 0.10 0.09 0.02 0.11 0.19 0.02 0.21
CL600 0.25 0.02 0.28 0.26 0.02 0.28 0.51 0.04 0.55
CL601 0.54 0.02 0.57 0.55 0.02 0.57 1.09 0.05 1.14
CNA172 0.02 0.01 0.02 0.02 0.00 0.02 0.04 0.01 0.04
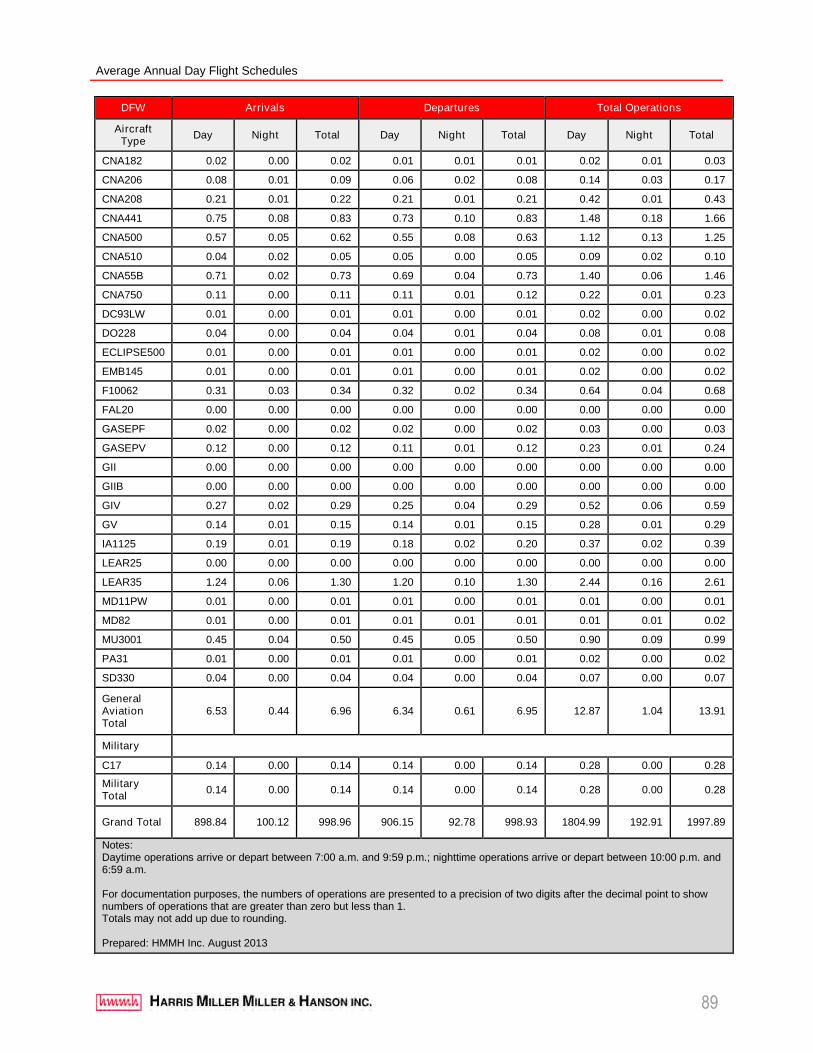
Average Annual Day Flight Schedules
89
DFW Arrivals Departures Total Operations
AircraftType
Day Night Total Day Night Total Day Night Total
CNA182 0.02 0.00 0.02 0.01 0.01 0.01 0.02 0.01 0.03
CNA206 0.08 0.01 0.09 0.06 0.02 0.08 0.14 0.03 0.17
CNA208 0.21 0.01 0.22 0.21 0.01 0.21 0.42 0.01 0.43
CNA441 0.75 0.08 0.83 0.73 0.10 0.83 1.48 0.18 1.66
CNA500 0.57 0.05 0.62 0.55 0.08 0.63 1.12 0.13 1.25
CNA510 0.04 0.02 0.05 0.05 0.00 0.05 0.09 0.02 0.10
CNA55B 0.71 0.02 0.73 0.69 0.04 0.73 1.40 0.06 1.46
CNA750 0.11 0.00 0.11 0.11 0.01 0.12 0.22 0.01 0.23
DC93LW 0.01 0.00 0.01 0.01 0.00 0.01 0.02 0.00 0.02
DO228 0.04 0.00 0.04 0.04 0.01 0.04 0.08 0.01 0.08
ECLIPSE500 0.01 0.00 0.01 0.01 0.00 0.01 0.02 0.00 0.02
EMB145 0.01 0.00 0.01 0.01 0.00 0.01 0.02 0.00 0.02
F10062 0.31 0.03 0.34 0.32 0.02 0.34 0.64 0.04 0.68
FAL20 0.00 0.00 0.00 0.00 0.00 0.00 0.00 0.00 0.00
GASEPF 0.02 0.00 0.02 0.02 0.00 0.02 0.03 0.00 0.03
GASEPV 0.12 0.00 0.12 0.11 0.01 0.12 0.23 0.01 0.24
GII 0.00 0.00 0.00 0.00 0.00 0.00 0.00 0.00 0.00
GIIB 0.00 0.00 0.00 0.00 0.00 0.00 0.00 0.00 0.00
GIV 0.27 0.02 0.29 0.25 0.04 0.29 0.52 0.06 0.59
GV 0.14 0.01 0.15 0.14 0.01 0.15 0.28 0.01 0.29
IA1125 0.19 0.01 0.19 0.18 0.02 0.20 0.37 0.02 0.39
LEAR25 0.00 0.00 0.00 0.00 0.00 0.00 0.00 0.00 0.00
LEAR35 1.24 0.06 1.30 1.20 0.10 1.30 2.44 0.16 2.61
MD11PW 0.01 0.00 0.01 0.01 0.00 0.01 0.01 0.00 0.01
MD82 0.01 0.00 0.01 0.01 0.01 0.01 0.01 0.01 0.02
MU3001 0.45 0.04 0.50 0.45 0.05 0.50 0.90 0.09 0.99
PA31 0.01 0.00 0.01 0.01 0.00 0.01 0.02 0.00 0.02
SD330 0.04 0.00 0.04 0.04 0.00 0.04 0.07 0.00 0.07
GeneralAviationTotal
6.53 0.44 6.96 6.34 0.61 6.95 12.87 1.04 13.91
Military
C17 0.14 0.00 0.14 0.14 0.00 0.14 0.28 0.00 0.28
MilitaryTotal
0.14 0.00 0.14 0.14 0.00 0.14 0.28 0.00 0.28
Grand Total 898.84 100.12 998.96 906.15 92.78 998.93 1804.99 192.91 1997.89
Notes:Daytime operations arrive or depart between 7:00 a.m. and 9:59 p.m.; nighttime operations arrive or depart between 10:00 p.m. and6:59 a.m.
For documentation purposes, the numbers of operations are presented to a precision of two digits after the decimal point to shownumbers of operations that are greater than zero but less than 1.Totals may not add up due to rounding.
Prepared: HMMH Inc. August 2013
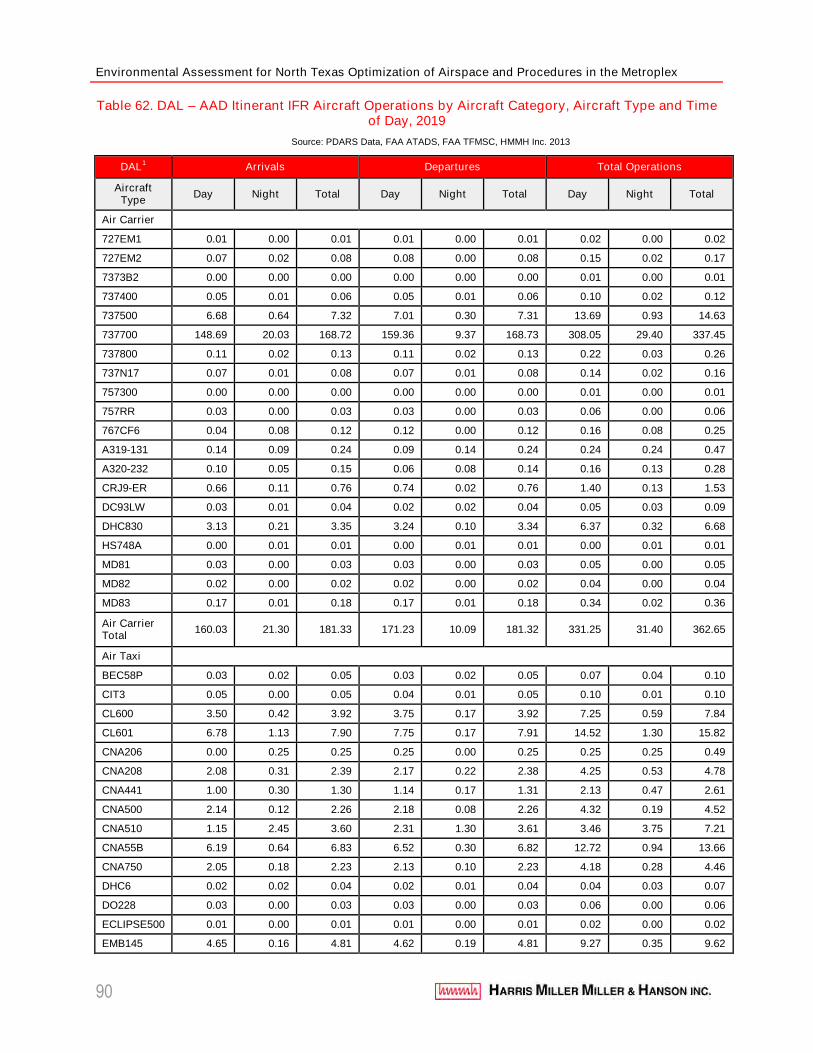
Environmental Assessment for North Texas Optimization of Airspace and Procedures in the Metroplex
90
Table 62. DAL – AAD Itinerant IFR Aircraft Operations by Aircraft Category, Aircraft Type and Timeof Day, 2019
Source: PDARS Data, FAA ATADS, FAA TFMSC, HMMH Inc. 2013
DAL1 Arrivals Departures Total Operations
AircraftType
Day Night Total Day Night Total Day Night Total
Air Carrier
727EM1 0.01 0.00 0.01 0.01 0.00 0.01 0.02 0.00 0.02
727EM2 0.07 0.02 0.08 0.08 0.00 0.08 0.15 0.02 0.17
7373B2 0.00 0.00 0.00 0.00 0.00 0.00 0.01 0.00 0.01
737400 0.05 0.01 0.06 0.05 0.01 0.06 0.10 0.02 0.12
737500 6.68 0.64 7.32 7.01 0.30 7.31 13.69 0.93 14.63
737700 148.69 20.03 168.72 159.36 9.37 168.73 308.05 29.40 337.45
737800 0.11 0.02 0.13 0.11 0.02 0.13 0.22 0.03 0.26
737N17 0.07 0.01 0.08 0.07 0.01 0.08 0.14 0.02 0.16
757300 0.00 0.00 0.00 0.00 0.00 0.00 0.01 0.00 0.01
757RR 0.03 0.00 0.03 0.03 0.00 0.03 0.06 0.00 0.06
767CF6 0.04 0.08 0.12 0.12 0.00 0.12 0.16 0.08 0.25
A319-131 0.14 0.09 0.24 0.09 0.14 0.24 0.24 0.24 0.47
A320-232 0.10 0.05 0.15 0.06 0.08 0.14 0.16 0.13 0.28
CRJ9-ER 0.66 0.11 0.76 0.74 0.02 0.76 1.40 0.13 1.53
DC93LW 0.03 0.01 0.04 0.02 0.02 0.04 0.05 0.03 0.09
DHC830 3.13 0.21 3.35 3.24 0.10 3.34 6.37 0.32 6.68
HS748A 0.00 0.01 0.01 0.00 0.01 0.01 0.00 0.01 0.01
MD81 0.03 0.00 0.03 0.03 0.00 0.03 0.05 0.00 0.05
MD82 0.02 0.00 0.02 0.02 0.00 0.02 0.04 0.00 0.04
MD83 0.17 0.01 0.18 0.17 0.01 0.18 0.34 0.02 0.36
Air CarrierTotal
160.03 21.30 181.33 171.23 10.09 181.32 331.25 31.40 362.65
Air Taxi
BEC58P 0.03 0.02 0.05 0.03 0.02 0.05 0.07 0.04 0.10
CIT3 0.05 0.00 0.05 0.04 0.01 0.05 0.10 0.01 0.10
CL600 3.50 0.42 3.92 3.75 0.17 3.92 7.25 0.59 7.84
CL601 6.78 1.13 7.90 7.75 0.17 7.91 14.52 1.30 15.82
CNA206 0.00 0.25 0.25 0.25 0.00 0.25 0.25 0.25 0.49
CNA208 2.08 0.31 2.39 2.17 0.22 2.38 4.25 0.53 4.78
CNA441 1.00 0.30 1.30 1.14 0.17 1.31 2.13 0.47 2.61
CNA500 2.14 0.12 2.26 2.18 0.08 2.26 4.32 0.19 4.52
CNA510 1.15 2.45 3.60 2.31 1.30 3.61 3.46 3.75 7.21
CNA55B 6.19 0.64 6.83 6.52 0.30 6.82 12.72 0.94 13.66
CNA750 2.05 0.18 2.23 2.13 0.10 2.23 4.18 0.28 4.46
DHC6 0.02 0.02 0.04 0.02 0.01 0.04 0.04 0.03 0.07
DO228 0.03 0.00 0.03 0.03 0.00 0.03 0.06 0.00 0.06
ECLIPSE500 0.01 0.00 0.01 0.01 0.00 0.01 0.02 0.00 0.02
EMB145 4.65 0.16 4.81 4.62 0.19 4.81 9.27 0.35 9.62
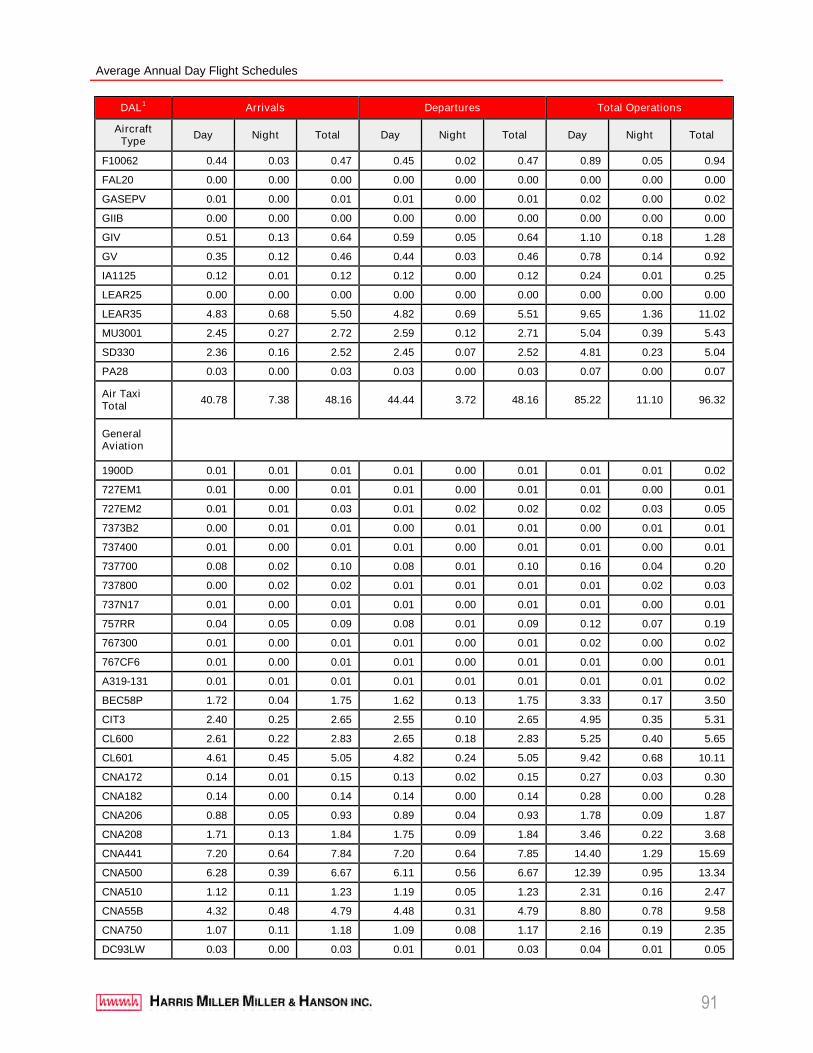
Average Annual Day Flight Schedules
91
DAL1 Arrivals Departures Total Operations
AircraftType
Day Night Total Day Night Total Day Night Total
F10062 0.44 0.03 0.47 0.45 0.02 0.47 0.89 0.05 0.94
FAL20 0.00 0.00 0.00 0.00 0.00 0.00 0.00 0.00 0.00
GASEPV 0.01 0.00 0.01 0.01 0.00 0.01 0.02 0.00 0.02
GIIB 0.00 0.00 0.00 0.00 0.00 0.00 0.00 0.00 0.00
GIV 0.51 0.13 0.64 0.59 0.05 0.64 1.10 0.18 1.28
GV 0.35 0.12 0.46 0.44 0.03 0.46 0.78 0.14 0.92
IA1125 0.12 0.01 0.12 0.12 0.00 0.12 0.24 0.01 0.25
LEAR25 0.00 0.00 0.00 0.00 0.00 0.00 0.00 0.00 0.00
LEAR35 4.83 0.68 5.50 4.82 0.69 5.51 9.65 1.36 11.02
MU3001 2.45 0.27 2.72 2.59 0.12 2.71 5.04 0.39 5.43
SD330 2.36 0.16 2.52 2.45 0.07 2.52 4.81 0.23 5.04
PA28 0.03 0.00 0.03 0.03 0.00 0.03 0.07 0.00 0.07
Air TaxiTotal
40.78 7.38 48.16 44.44 3.72 48.16 85.22 11.10 96.32
GeneralAviation
1900D 0.01 0.01 0.01 0.01 0.00 0.01 0.01 0.01 0.02
727EM1 0.01 0.00 0.01 0.01 0.00 0.01 0.01 0.00 0.01
727EM2 0.01 0.01 0.03 0.01 0.02 0.02 0.02 0.03 0.05
7373B2 0.00 0.01 0.01 0.00 0.01 0.01 0.00 0.01 0.01
737400 0.01 0.00 0.01 0.01 0.00 0.01 0.01 0.00 0.01
737700 0.08 0.02 0.10 0.08 0.01 0.10 0.16 0.04 0.20
737800 0.00 0.02 0.02 0.01 0.01 0.01 0.01 0.02 0.03
737N17 0.01 0.00 0.01 0.01 0.00 0.01 0.01 0.00 0.01
757RR 0.04 0.05 0.09 0.08 0.01 0.09 0.12 0.07 0.19
767300 0.01 0.00 0.01 0.01 0.00 0.01 0.02 0.00 0.02
767CF6 0.01 0.00 0.01 0.01 0.00 0.01 0.01 0.00 0.01
A319-131 0.01 0.01 0.01 0.01 0.01 0.01 0.01 0.01 0.02
BEC58P 1.72 0.04 1.75 1.62 0.13 1.75 3.33 0.17 3.50
CIT3 2.40 0.25 2.65 2.55 0.10 2.65 4.95 0.35 5.31
CL600 2.61 0.22 2.83 2.65 0.18 2.83 5.25 0.40 5.65
CL601 4.61 0.45 5.05 4.82 0.24 5.05 9.42 0.68 10.11
CNA172 0.14 0.01 0.15 0.13 0.02 0.15 0.27 0.03 0.30
CNA182 0.14 0.00 0.14 0.14 0.00 0.14 0.28 0.00 0.28
CNA206 0.88 0.05 0.93 0.89 0.04 0.93 1.78 0.09 1.87
CNA208 1.71 0.13 1.84 1.75 0.09 1.84 3.46 0.22 3.68
CNA441 7.20 0.64 7.84 7.20 0.64 7.85 14.40 1.29 15.69
CNA500 6.28 0.39 6.67 6.11 0.56 6.67 12.39 0.95 13.34
CNA510 1.12 0.11 1.23 1.19 0.05 1.23 2.31 0.16 2.47
CNA55B 4.32 0.48 4.79 4.48 0.31 4.79 8.80 0.78 9.58
CNA750 1.07 0.11 1.18 1.09 0.08 1.17 2.16 0.19 2.35
DC93LW 0.03 0.00 0.03 0.01 0.01 0.03 0.04 0.01 0.05
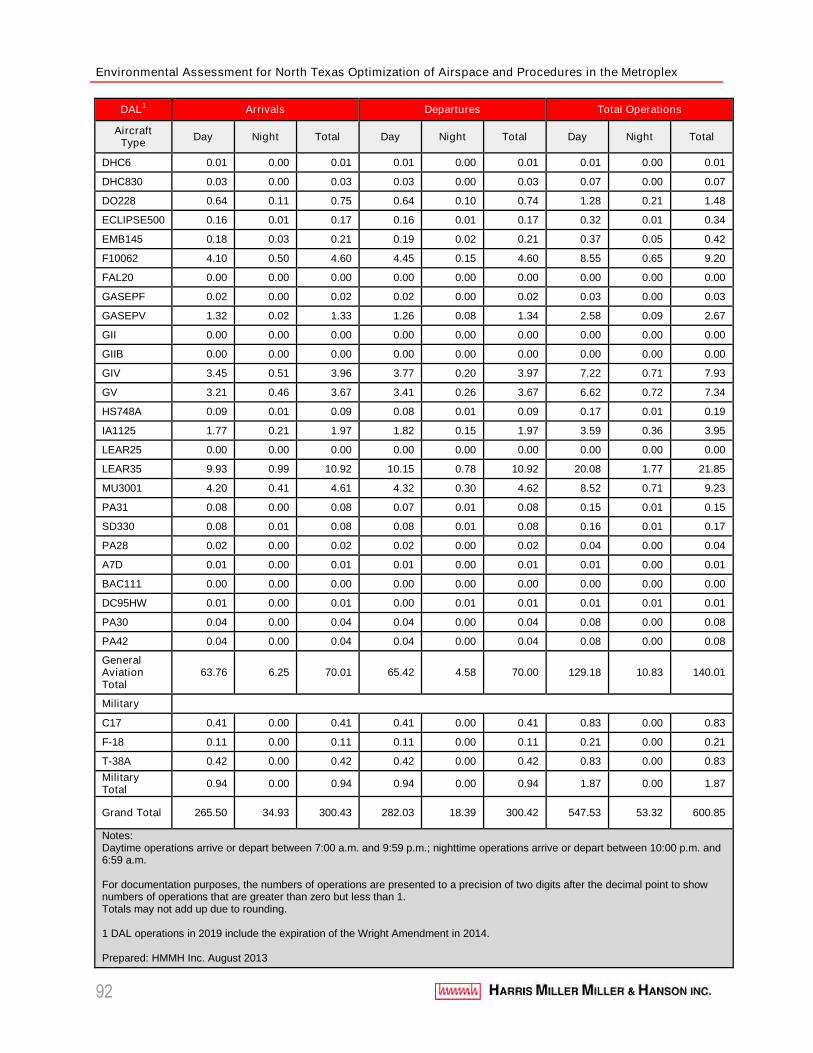
Environmental Assessment for North Texas Optimization of Airspace and Procedures in the Metroplex
92
DAL1 Arrivals Departures Total Operations
AircraftType
Day Night Total Day Night Total Day Night Total
DHC6 0.01 0.00 0.01 0.01 0.00 0.01 0.01 0.00 0.01
DHC830 0.03 0.00 0.03 0.03 0.00 0.03 0.07 0.00 0.07
DO228 0.64 0.11 0.75 0.64 0.10 0.74 1.28 0.21 1.48
ECLIPSE500 0.16 0.01 0.17 0.16 0.01 0.17 0.32 0.01 0.34
EMB145 0.18 0.03 0.21 0.19 0.02 0.21 0.37 0.05 0.42
F10062 4.10 0.50 4.60 4.45 0.15 4.60 8.55 0.65 9.20
FAL20 0.00 0.00 0.00 0.00 0.00 0.00 0.00 0.00 0.00
GASEPF 0.02 0.00 0.02 0.02 0.00 0.02 0.03 0.00 0.03
GASEPV 1.32 0.02 1.33 1.26 0.08 1.34 2.58 0.09 2.67
GII 0.00 0.00 0.00 0.00 0.00 0.00 0.00 0.00 0.00
GIIB 0.00 0.00 0.00 0.00 0.00 0.00 0.00 0.00 0.00
GIV 3.45 0.51 3.96 3.77 0.20 3.97 7.22 0.71 7.93
GV 3.21 0.46 3.67 3.41 0.26 3.67 6.62 0.72 7.34
HS748A 0.09 0.01 0.09 0.08 0.01 0.09 0.17 0.01 0.19
IA1125 1.77 0.21 1.97 1.82 0.15 1.97 3.59 0.36 3.95
LEAR25 0.00 0.00 0.00 0.00 0.00 0.00 0.00 0.00 0.00
LEAR35 9.93 0.99 10.92 10.15 0.78 10.92 20.08 1.77 21.85
MU3001 4.20 0.41 4.61 4.32 0.30 4.62 8.52 0.71 9.23
PA31 0.08 0.00 0.08 0.07 0.01 0.08 0.15 0.01 0.15
SD330 0.08 0.01 0.08 0.08 0.01 0.08 0.16 0.01 0.17
PA28 0.02 0.00 0.02 0.02 0.00 0.02 0.04 0.00 0.04
A7D 0.01 0.00 0.01 0.01 0.00 0.01 0.01 0.00 0.01
BAC111 0.00 0.00 0.00 0.00 0.00 0.00 0.00 0.00 0.00
DC95HW 0.01 0.00 0.01 0.00 0.01 0.01 0.01 0.01 0.01
PA30 0.04 0.00 0.04 0.04 0.00 0.04 0.08 0.00 0.08
PA42 0.04 0.00 0.04 0.04 0.00 0.04 0.08 0.00 0.08
GeneralAviationTotal
63.76 6.25 70.01 65.42 4.58 70.00 129.18 10.83 140.01
Military
C17 0.41 0.00 0.41 0.41 0.00 0.41 0.83 0.00 0.83
F-18 0.11 0.00 0.11 0.11 0.00 0.11 0.21 0.00 0.21
T-38A 0.42 0.00 0.42 0.42 0.00 0.42 0.83 0.00 0.83
MilitaryTotal
0.94 0.00 0.94 0.94 0.00 0.94 1.87 0.00 1.87
Grand Total 265.50 34.93 300.43 282.03 18.39 300.42 547.53 53.32 600.85
Notes:Daytime operations arrive or depart between 7:00 a.m. and 9:59 p.m.; nighttime operations arrive or depart between 10:00 p.m. and6:59 a.m.
For documentation purposes, the numbers of operations are presented to a precision of two digits after the decimal point to shownumbers of operations that are greater than zero but less than 1.Totals may not add up due to rounding.
1 DAL operations in 2019 include the expiration of the Wright Amendment in 2014.
Prepared: HMMH Inc. August 2013
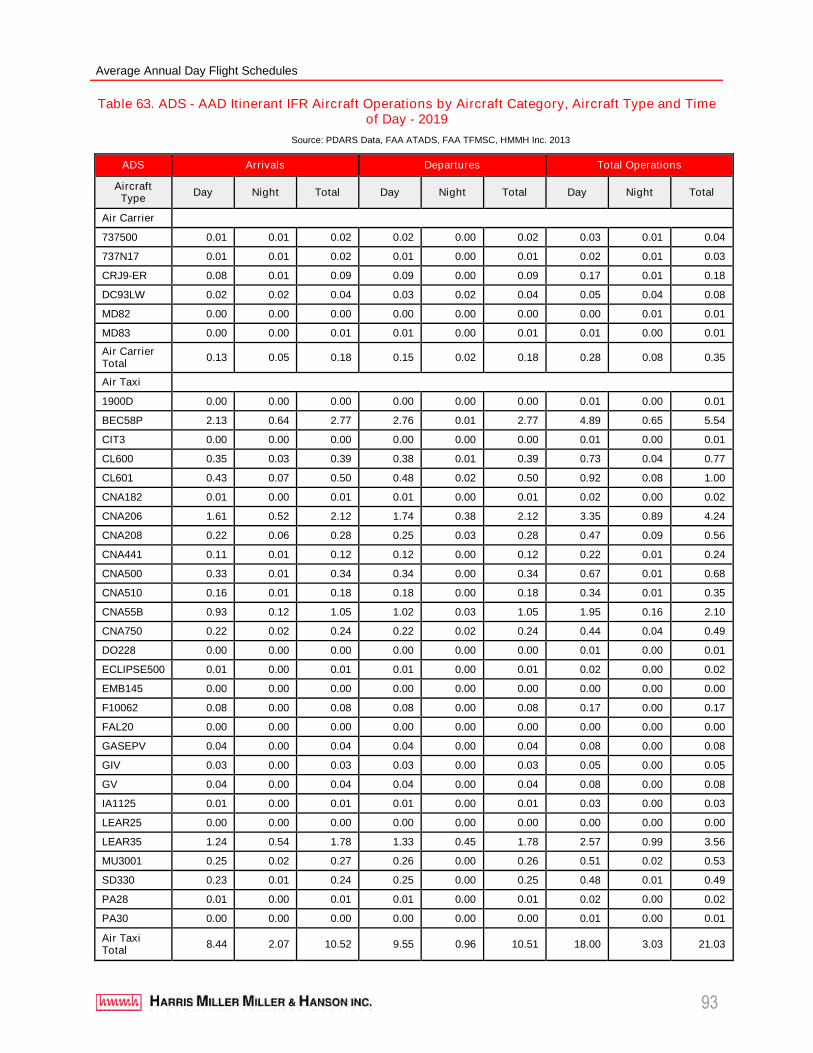
Average Annual Day Flight Schedules
93
Table 63. ADS - AAD Itinerant IFR Aircraft Operations by Aircraft Category, Aircraft Type and Timeof Day - 2019
Source: PDARS Data, FAA ATADS, FAA TFMSC, HMMH Inc. 2013
ADS Arrivals Departures Total Operations
AircraftType
Day Night Total Day Night Total Day Night Total
Air Carrier
737500 0.01 0.01 0.02 0.02 0.00 0.02 0.03 0.01 0.04
737N17 0.01 0.01 0.02 0.01 0.00 0.01 0.02 0.01 0.03
CRJ9-ER 0.08 0.01 0.09 0.09 0.00 0.09 0.17 0.01 0.18
DC93LW 0.02 0.02 0.04 0.03 0.02 0.04 0.05 0.04 0.08
MD82 0.00 0.00 0.00 0.00 0.00 0.00 0.00 0.01 0.01
MD83 0.00 0.00 0.01 0.01 0.00 0.01 0.01 0.00 0.01
Air CarrierTotal
0.13 0.05 0.18 0.15 0.02 0.18 0.28 0.08 0.35
Air Taxi
1900D 0.00 0.00 0.00 0.00 0.00 0.00 0.01 0.00 0.01
BEC58P 2.13 0.64 2.77 2.76 0.01 2.77 4.89 0.65 5.54
CIT3 0.00 0.00 0.00 0.00 0.00 0.00 0.01 0.00 0.01
CL600 0.35 0.03 0.39 0.38 0.01 0.39 0.73 0.04 0.77
CL601 0.43 0.07 0.50 0.48 0.02 0.50 0.92 0.08 1.00
CNA182 0.01 0.00 0.01 0.01 0.00 0.01 0.02 0.00 0.02
CNA206 1.61 0.52 2.12 1.74 0.38 2.12 3.35 0.89 4.24
CNA208 0.22 0.06 0.28 0.25 0.03 0.28 0.47 0.09 0.56
CNA441 0.11 0.01 0.12 0.12 0.00 0.12 0.22 0.01 0.24
CNA500 0.33 0.01 0.34 0.34 0.00 0.34 0.67 0.01 0.68
CNA510 0.16 0.01 0.18 0.18 0.00 0.18 0.34 0.01 0.35
CNA55B 0.93 0.12 1.05 1.02 0.03 1.05 1.95 0.16 2.10
CNA750 0.22 0.02 0.24 0.22 0.02 0.24 0.44 0.04 0.49
DO228 0.00 0.00 0.00 0.00 0.00 0.00 0.01 0.00 0.01
ECLIPSE500 0.01 0.00 0.01 0.01 0.00 0.01 0.02 0.00 0.02
EMB145 0.00 0.00 0.00 0.00 0.00 0.00 0.00 0.00 0.00
F10062 0.08 0.00 0.08 0.08 0.00 0.08 0.17 0.00 0.17
FAL20 0.00 0.00 0.00 0.00 0.00 0.00 0.00 0.00 0.00
GASEPV 0.04 0.00 0.04 0.04 0.00 0.04 0.08 0.00 0.08
GIV 0.03 0.00 0.03 0.03 0.00 0.03 0.05 0.00 0.05
GV 0.04 0.00 0.04 0.04 0.00 0.04 0.08 0.00 0.08
IA1125 0.01 0.00 0.01 0.01 0.00 0.01 0.03 0.00 0.03
LEAR25 0.00 0.00 0.00 0.00 0.00 0.00 0.00 0.00 0.00
LEAR35 1.24 0.54 1.78 1.33 0.45 1.78 2.57 0.99 3.56
MU3001 0.25 0.02 0.27 0.26 0.00 0.26 0.51 0.02 0.53
SD330 0.23 0.01 0.24 0.25 0.00 0.25 0.48 0.01 0.49
PA28 0.01 0.00 0.01 0.01 0.00 0.01 0.02 0.00 0.02
PA30 0.00 0.00 0.00 0.00 0.00 0.00 0.01 0.00 0.01
Air TaxiTotal
8.44 2.07 10.52 9.55 0.96 10.51 18.00 3.03 21.03
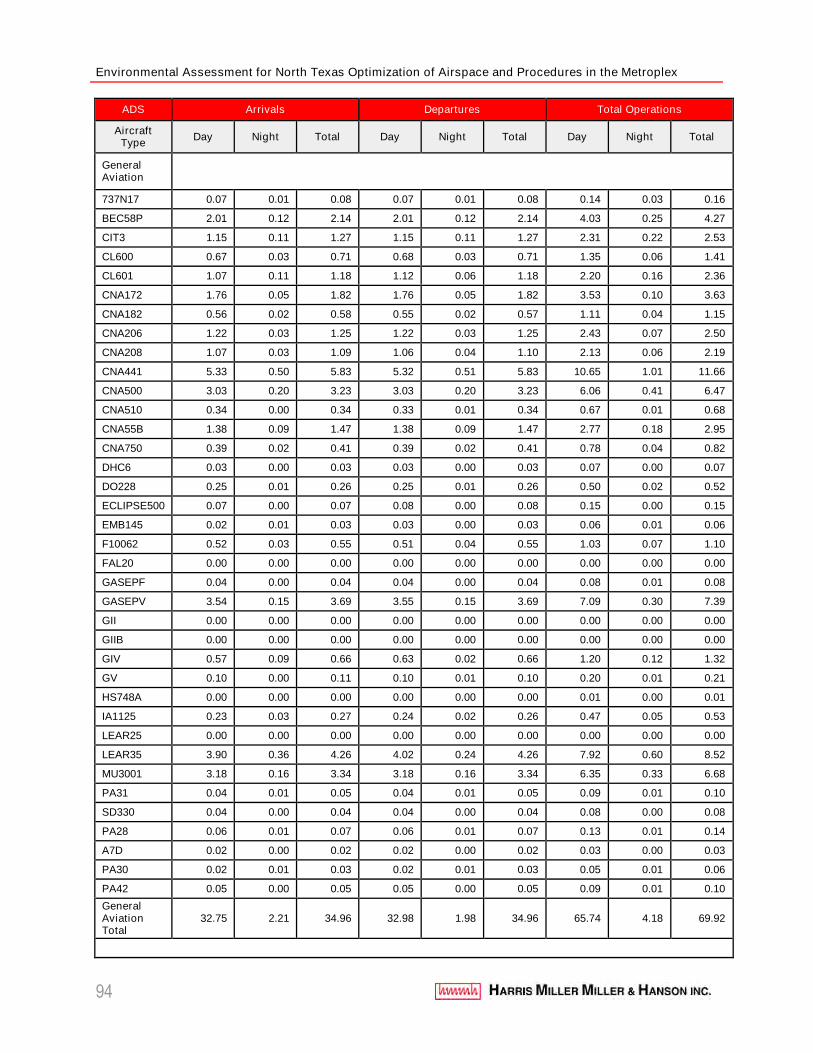
Environmental Assessment for North Texas Optimization of Airspace and Procedures in the Metroplex
94
ADS Arrivals Departures Total Operations
AircraftType
Day Night Total Day Night Total Day Night Total
GeneralAviation
737N17 0.07 0.01 0.08 0.07 0.01 0.08 0.14 0.03 0.16
BEC58P 2.01 0.12 2.14 2.01 0.12 2.14 4.03 0.25 4.27
CIT3 1.15 0.11 1.27 1.15 0.11 1.27 2.31 0.22 2.53
CL600 0.67 0.03 0.71 0.68 0.03 0.71 1.35 0.06 1.41
CL601 1.07 0.11 1.18 1.12 0.06 1.18 2.20 0.16 2.36
CNA172 1.76 0.05 1.82 1.76 0.05 1.82 3.53 0.10 3.63
CNA182 0.56 0.02 0.58 0.55 0.02 0.57 1.11 0.04 1.15
CNA206 1.22 0.03 1.25 1.22 0.03 1.25 2.43 0.07 2.50
CNA208 1.07 0.03 1.09 1.06 0.04 1.10 2.13 0.06 2.19
CNA441 5.33 0.50 5.83 5.32 0.51 5.83 10.65 1.01 11.66
CNA500 3.03 0.20 3.23 3.03 0.20 3.23 6.06 0.41 6.47
CNA510 0.34 0.00 0.34 0.33 0.01 0.34 0.67 0.01 0.68
CNA55B 1.38 0.09 1.47 1.38 0.09 1.47 2.77 0.18 2.95
CNA750 0.39 0.02 0.41 0.39 0.02 0.41 0.78 0.04 0.82
DHC6 0.03 0.00 0.03 0.03 0.00 0.03 0.07 0.00 0.07
DO228 0.25 0.01 0.26 0.25 0.01 0.26 0.50 0.02 0.52
ECLIPSE500 0.07 0.00 0.07 0.08 0.00 0.08 0.15 0.00 0.15
EMB145 0.02 0.01 0.03 0.03 0.00 0.03 0.06 0.01 0.06
F10062 0.52 0.03 0.55 0.51 0.04 0.55 1.03 0.07 1.10
FAL20 0.00 0.00 0.00 0.00 0.00 0.00 0.00 0.00 0.00
GASEPF 0.04 0.00 0.04 0.04 0.00 0.04 0.08 0.01 0.08
GASEPV 3.54 0.15 3.69 3.55 0.15 3.69 7.09 0.30 7.39
GII 0.00 0.00 0.00 0.00 0.00 0.00 0.00 0.00 0.00
GIIB 0.00 0.00 0.00 0.00 0.00 0.00 0.00 0.00 0.00
GIV 0.57 0.09 0.66 0.63 0.02 0.66 1.20 0.12 1.32
GV 0.10 0.00 0.11 0.10 0.01 0.10 0.20 0.01 0.21
HS748A 0.00 0.00 0.00 0.00 0.00 0.00 0.01 0.00 0.01
IA1125 0.23 0.03 0.27 0.24 0.02 0.26 0.47 0.05 0.53
LEAR25 0.00 0.00 0.00 0.00 0.00 0.00 0.00 0.00 0.00
LEAR35 3.90 0.36 4.26 4.02 0.24 4.26 7.92 0.60 8.52
MU3001 3.18 0.16 3.34 3.18 0.16 3.34 6.35 0.33 6.68
PA31 0.04 0.01 0.05 0.04 0.01 0.05 0.09 0.01 0.10
SD330 0.04 0.00 0.04 0.04 0.00 0.04 0.08 0.00 0.08
PA28 0.06 0.01 0.07 0.06 0.01 0.07 0.13 0.01 0.14
A7D 0.02 0.00 0.02 0.02 0.00 0.02 0.03 0.00 0.03
PA30 0.02 0.01 0.03 0.02 0.01 0.03 0.05 0.01 0.06
PA42 0.05 0.00 0.05 0.05 0.00 0.05 0.09 0.01 0.10
GeneralAviationTotal
32.75 2.21 34.96 32.98 1.98 34.96 65.74 4.18 69.92
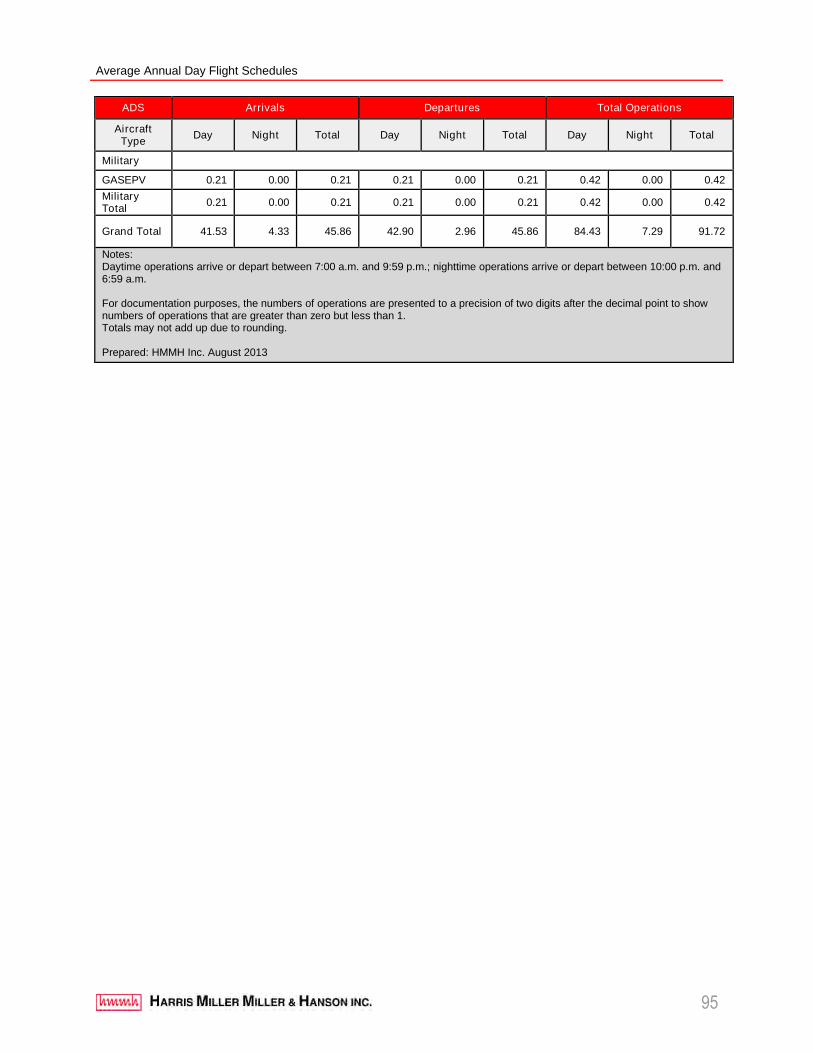
Average Annual Day Flight Schedules
95
ADS Arrivals Departures Total Operations
AircraftType
Day Night Total Day Night Total Day Night Total
Military
GASEPV 0.21 0.00 0.21 0.21 0.00 0.21 0.42 0.00 0.42
MilitaryTotal
0.21 0.00 0.21 0.21 0.00 0.21 0.42 0.00 0.42
Grand Total 41.53 4.33 45.86 42.90 2.96 45.86 84.43 7.29 91.72
Notes:Daytime operations arrive or depart between 7:00 a.m. and 9:59 p.m.; nighttime operations arrive or depart between 10:00 p.m. and6:59 a.m.
For documentation purposes, the numbers of operations are presented to a precision of two digits after the decimal point to shownumbers of operations that are greater than zero but less than 1.Totals may not add up due to rounding.
Prepared: HMMH Inc. August 2013
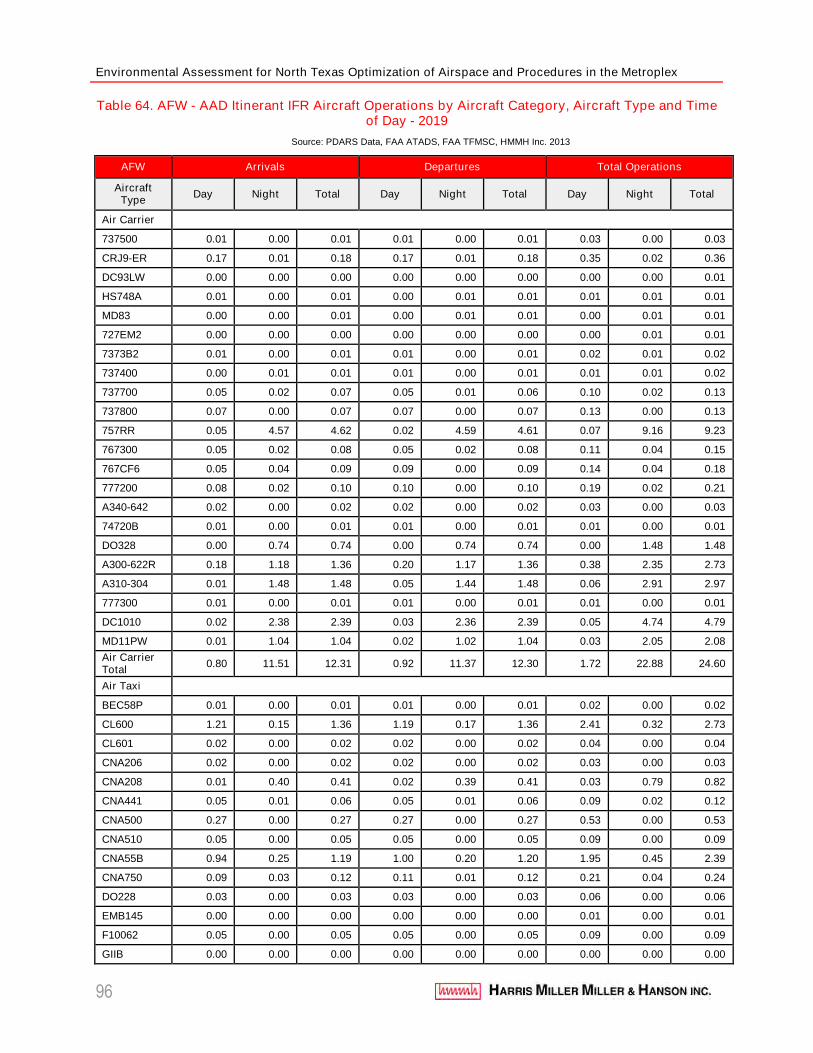
Environmental Assessment for North Texas Optimization of Airspace and Procedures in the Metroplex
96
Table 64. AFW - AAD Itinerant IFR Aircraft Operations by Aircraft Category, Aircraft Type and Timeof Day - 2019
Source: PDARS Data, FAA ATADS, FAA TFMSC, HMMH Inc. 2013
AFW Arrivals Departures Total Operations
AircraftType
Day Night Total Day Night Total Day Night Total
Air Carrier
737500 0.01 0.00 0.01 0.01 0.00 0.01 0.03 0.00 0.03
CRJ9-ER 0.17 0.01 0.18 0.17 0.01 0.18 0.35 0.02 0.36
DC93LW 0.00 0.00 0.00 0.00 0.00 0.00 0.00 0.00 0.01
HS748A 0.01 0.00 0.01 0.00 0.01 0.01 0.01 0.01 0.01
MD83 0.00 0.00 0.01 0.00 0.01 0.01 0.00 0.01 0.01
727EM2 0.00 0.00 0.00 0.00 0.00 0.00 0.00 0.01 0.01
7373B2 0.01 0.00 0.01 0.01 0.00 0.01 0.02 0.01 0.02
737400 0.00 0.01 0.01 0.01 0.00 0.01 0.01 0.01 0.02
737700 0.05 0.02 0.07 0.05 0.01 0.06 0.10 0.02 0.13
737800 0.07 0.00 0.07 0.07 0.00 0.07 0.13 0.00 0.13
757RR 0.05 4.57 4.62 0.02 4.59 4.61 0.07 9.16 9.23
767300 0.05 0.02 0.08 0.05 0.02 0.08 0.11 0.04 0.15
767CF6 0.05 0.04 0.09 0.09 0.00 0.09 0.14 0.04 0.18
777200 0.08 0.02 0.10 0.10 0.00 0.10 0.19 0.02 0.21
A340-642 0.02 0.00 0.02 0.02 0.00 0.02 0.03 0.00 0.03
74720B 0.01 0.00 0.01 0.01 0.00 0.01 0.01 0.00 0.01
DO328 0.00 0.74 0.74 0.00 0.74 0.74 0.00 1.48 1.48
A300-622R 0.18 1.18 1.36 0.20 1.17 1.36 0.38 2.35 2.73
A310-304 0.01 1.48 1.48 0.05 1.44 1.48 0.06 2.91 2.97
777300 0.01 0.00 0.01 0.01 0.00 0.01 0.01 0.00 0.01
DC1010 0.02 2.38 2.39 0.03 2.36 2.39 0.05 4.74 4.79
MD11PW 0.01 1.04 1.04 0.02 1.02 1.04 0.03 2.05 2.08
Air CarrierTotal
0.80 11.51 12.31 0.92 11.37 12.30 1.72 22.88 24.60
Air Taxi
BEC58P 0.01 0.00 0.01 0.01 0.00 0.01 0.02 0.00 0.02
CL600 1.21 0.15 1.36 1.19 0.17 1.36 2.41 0.32 2.73
CL601 0.02 0.00 0.02 0.02 0.00 0.02 0.04 0.00 0.04
CNA206 0.02 0.00 0.02 0.02 0.00 0.02 0.03 0.00 0.03
CNA208 0.01 0.40 0.41 0.02 0.39 0.41 0.03 0.79 0.82
CNA441 0.05 0.01 0.06 0.05 0.01 0.06 0.09 0.02 0.12
CNA500 0.27 0.00 0.27 0.27 0.00 0.27 0.53 0.00 0.53
CNA510 0.05 0.00 0.05 0.05 0.00 0.05 0.09 0.00 0.09
CNA55B 0.94 0.25 1.19 1.00 0.20 1.20 1.95 0.45 2.39
CNA750 0.09 0.03 0.12 0.11 0.01 0.12 0.21 0.04 0.24
DO228 0.03 0.00 0.03 0.03 0.00 0.03 0.06 0.00 0.06
EMB145 0.00 0.00 0.00 0.00 0.00 0.00 0.01 0.00 0.01
F10062 0.05 0.00 0.05 0.05 0.00 0.05 0.09 0.00 0.09
GIIB 0.00 0.00 0.00 0.00 0.00 0.00 0.00 0.00 0.00
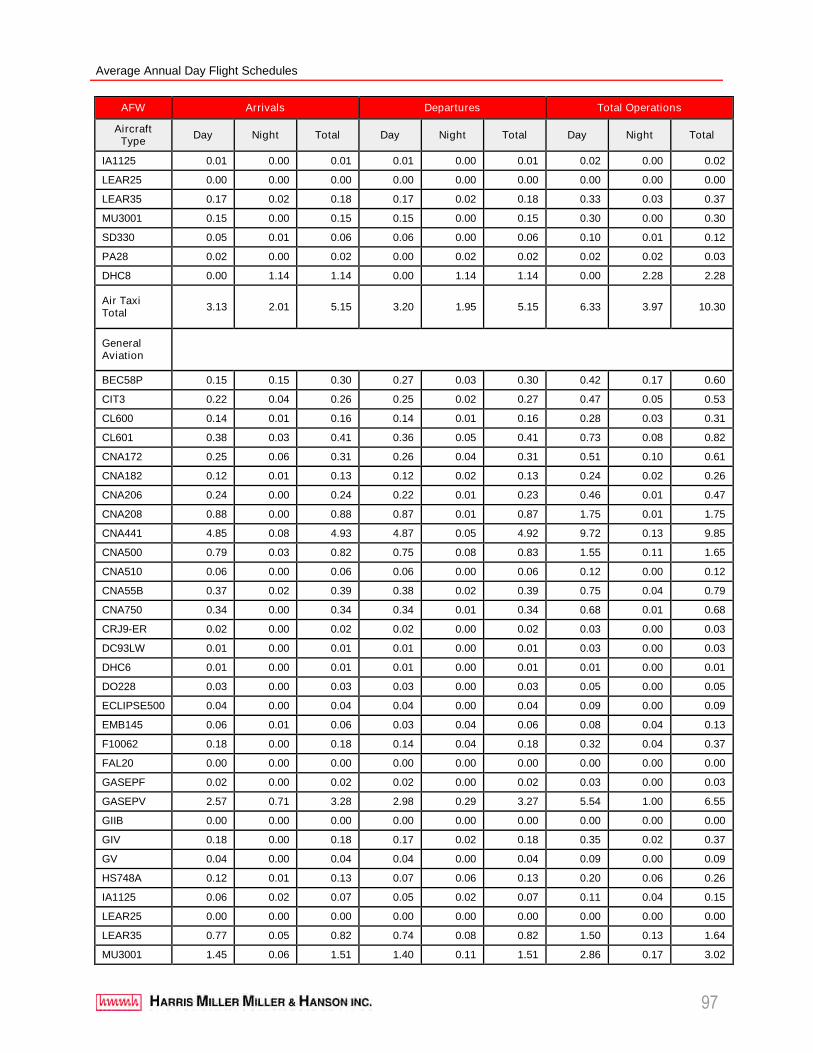
Average Annual Day Flight Schedules
97
AFW Arrivals Departures Total Operations
AircraftType
Day Night Total Day Night Total Day Night Total
IA1125 0.01 0.00 0.01 0.01 0.00 0.01 0.02 0.00 0.02
LEAR25 0.00 0.00 0.00 0.00 0.00 0.00 0.00 0.00 0.00
LEAR35 0.17 0.02 0.18 0.17 0.02 0.18 0.33 0.03 0.37
MU3001 0.15 0.00 0.15 0.15 0.00 0.15 0.30 0.00 0.30
SD330 0.05 0.01 0.06 0.06 0.00 0.06 0.10 0.01 0.12
PA28 0.02 0.00 0.02 0.00 0.02 0.02 0.02 0.02 0.03
DHC8 0.00 1.14 1.14 0.00 1.14 1.14 0.00 2.28 2.28
Air TaxiTotal
3.13 2.01 5.15 3.20 1.95 5.15 6.33 3.97 10.30
GeneralAviation
BEC58P 0.15 0.15 0.30 0.27 0.03 0.30 0.42 0.17 0.60
CIT3 0.22 0.04 0.26 0.25 0.02 0.27 0.47 0.05 0.53
CL600 0.14 0.01 0.16 0.14 0.01 0.16 0.28 0.03 0.31
CL601 0.38 0.03 0.41 0.36 0.05 0.41 0.73 0.08 0.82
CNA172 0.25 0.06 0.31 0.26 0.04 0.31 0.51 0.10 0.61
CNA182 0.12 0.01 0.13 0.12 0.02 0.13 0.24 0.02 0.26
CNA206 0.24 0.00 0.24 0.22 0.01 0.23 0.46 0.01 0.47
CNA208 0.88 0.00 0.88 0.87 0.01 0.87 1.75 0.01 1.75
CNA441 4.85 0.08 4.93 4.87 0.05 4.92 9.72 0.13 9.85
CNA500 0.79 0.03 0.82 0.75 0.08 0.83 1.55 0.11 1.65
CNA510 0.06 0.00 0.06 0.06 0.00 0.06 0.12 0.00 0.12
CNA55B 0.37 0.02 0.39 0.38 0.02 0.39 0.75 0.04 0.79
CNA750 0.34 0.00 0.34 0.34 0.01 0.34 0.68 0.01 0.68
CRJ9-ER 0.02 0.00 0.02 0.02 0.00 0.02 0.03 0.00 0.03
DC93LW 0.01 0.00 0.01 0.01 0.00 0.01 0.03 0.00 0.03
DHC6 0.01 0.00 0.01 0.01 0.00 0.01 0.01 0.00 0.01
DO228 0.03 0.00 0.03 0.03 0.00 0.03 0.05 0.00 0.05
ECLIPSE500 0.04 0.00 0.04 0.04 0.00 0.04 0.09 0.00 0.09
EMB145 0.06 0.01 0.06 0.03 0.04 0.06 0.08 0.04 0.13
F10062 0.18 0.00 0.18 0.14 0.04 0.18 0.32 0.04 0.37
FAL20 0.00 0.00 0.00 0.00 0.00 0.00 0.00 0.00 0.00
GASEPF 0.02 0.00 0.02 0.02 0.00 0.02 0.03 0.00 0.03
GASEPV 2.57 0.71 3.28 2.98 0.29 3.27 5.54 1.00 6.55
GIIB 0.00 0.00 0.00 0.00 0.00 0.00 0.00 0.00 0.00
GIV 0.18 0.00 0.18 0.17 0.02 0.18 0.35 0.02 0.37
GV 0.04 0.00 0.04 0.04 0.00 0.04 0.09 0.00 0.09
HS748A 0.12 0.01 0.13 0.07 0.06 0.13 0.20 0.06 0.26
IA1125 0.06 0.02 0.07 0.05 0.02 0.07 0.11 0.04 0.15
LEAR25 0.00 0.00 0.00 0.00 0.00 0.00 0.00 0.00 0.00
LEAR35 0.77 0.05 0.82 0.74 0.08 0.82 1.50 0.13 1.64
MU3001 1.45 0.06 1.51 1.40 0.11 1.51 2.86 0.17 3.02
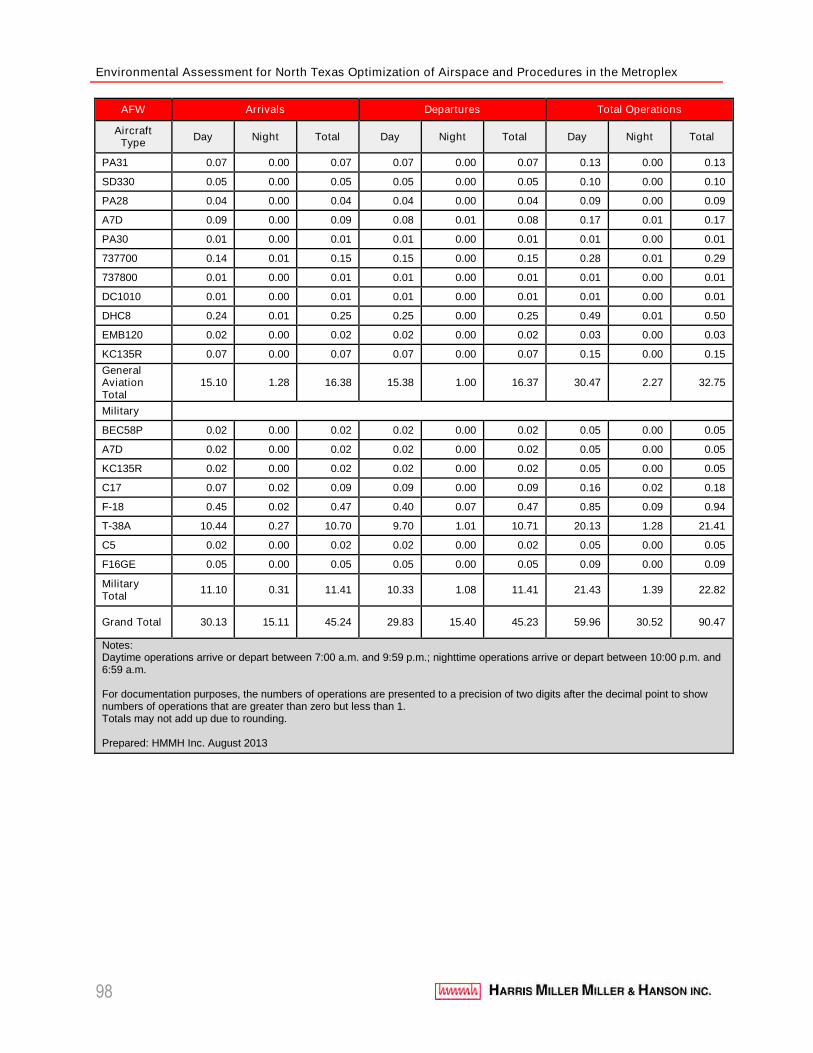
Environmental Assessment for North Texas Optimization of Airspace and Procedures in the Metroplex
98
AFW Arrivals Departures Total Operations
AircraftType
Day Night Total Day Night Total Day Night Total
PA31 0.07 0.00 0.07 0.07 0.00 0.07 0.13 0.00 0.13
SD330 0.05 0.00 0.05 0.05 0.00 0.05 0.10 0.00 0.10
PA28 0.04 0.00 0.04 0.04 0.00 0.04 0.09 0.00 0.09
A7D 0.09 0.00 0.09 0.08 0.01 0.08 0.17 0.01 0.17
PA30 0.01 0.00 0.01 0.01 0.00 0.01 0.01 0.00 0.01
737700 0.14 0.01 0.15 0.15 0.00 0.15 0.28 0.01 0.29
737800 0.01 0.00 0.01 0.01 0.00 0.01 0.01 0.00 0.01
DC1010 0.01 0.00 0.01 0.01 0.00 0.01 0.01 0.00 0.01
DHC8 0.24 0.01 0.25 0.25 0.00 0.25 0.49 0.01 0.50
EMB120 0.02 0.00 0.02 0.02 0.00 0.02 0.03 0.00 0.03
KC135R 0.07 0.00 0.07 0.07 0.00 0.07 0.15 0.00 0.15
GeneralAviationTotal
15.10 1.28 16.38 15.38 1.00 16.37 30.47 2.27 32.75
Military
BEC58P 0.02 0.00 0.02 0.02 0.00 0.02 0.05 0.00 0.05
A7D 0.02 0.00 0.02 0.02 0.00 0.02 0.05 0.00 0.05
KC135R 0.02 0.00 0.02 0.02 0.00 0.02 0.05 0.00 0.05
C17 0.07 0.02 0.09 0.09 0.00 0.09 0.16 0.02 0.18
F-18 0.45 0.02 0.47 0.40 0.07 0.47 0.85 0.09 0.94
T-38A 10.44 0.27 10.70 9.70 1.01 10.71 20.13 1.28 21.41
C5 0.02 0.00 0.02 0.02 0.00 0.02 0.05 0.00 0.05
F16GE 0.05 0.00 0.05 0.05 0.00 0.05 0.09 0.00 0.09
MilitaryTotal
11.10 0.31 11.41 10.33 1.08 11.41 21.43 1.39 22.82
Grand Total 30.13 15.11 45.24 29.83 15.40 45.23 59.96 30.52 90.47
Notes:Daytime operations arrive or depart between 7:00 a.m. and 9:59 p.m.; nighttime operations arrive or depart between 10:00 p.m. and6:59 a.m.
For documentation purposes, the numbers of operations are presented to a precision of two digits after the decimal point to shownumbers of operations that are greater than zero but less than 1.Totals may not add up due to rounding.
Prepared: HMMH Inc. August 2013
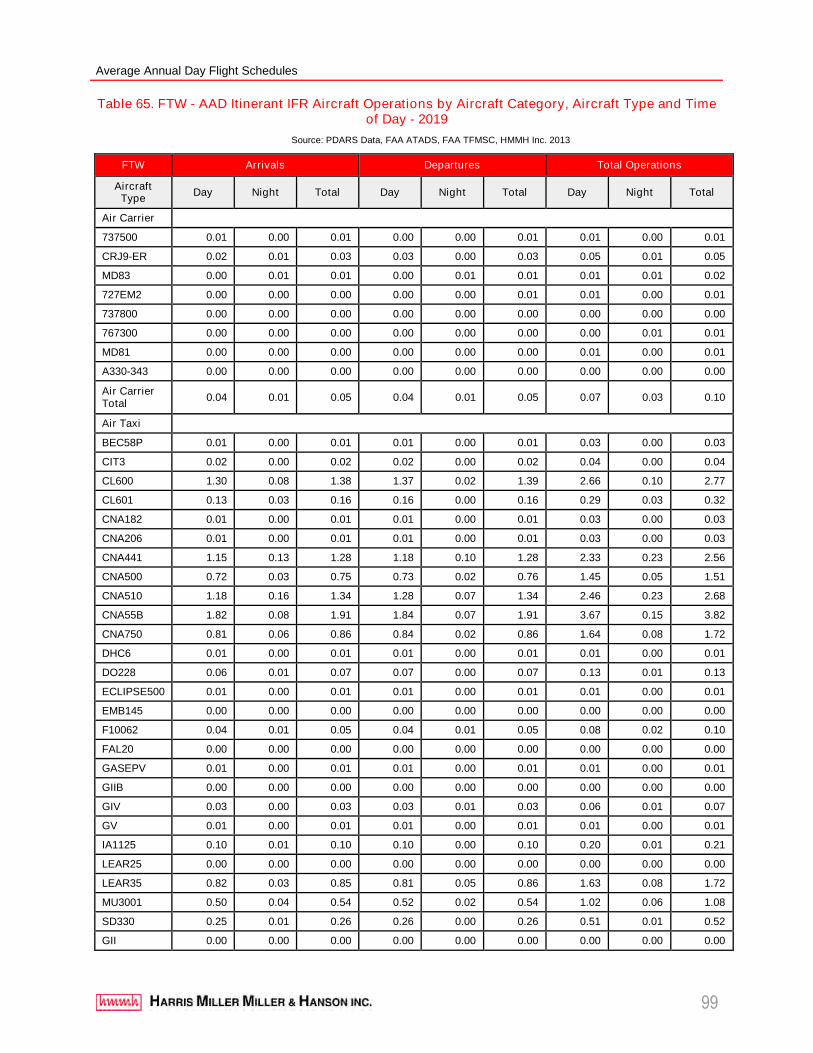
Average Annual Day Flight Schedules
99
Table 65. FTW - AAD Itinerant IFR Aircraft Operations by Aircraft Category, Aircraft Type and Timeof Day - 2019
Source: PDARS Data, FAA ATADS, FAA TFMSC, HMMH Inc. 2013
FTW Arrivals Departures Total Operations
AircraftType
Day Night Total Day Night Total Day Night Total
Air Carrier
737500 0.01 0.00 0.01 0.00 0.00 0.01 0.01 0.00 0.01
CRJ9-ER 0.02 0.01 0.03 0.03 0.00 0.03 0.05 0.01 0.05
MD83 0.00 0.01 0.01 0.00 0.01 0.01 0.01 0.01 0.02
727EM2 0.00 0.00 0.00 0.00 0.00 0.01 0.01 0.00 0.01
737800 0.00 0.00 0.00 0.00 0.00 0.00 0.00 0.00 0.00
767300 0.00 0.00 0.00 0.00 0.00 0.00 0.00 0.01 0.01
MD81 0.00 0.00 0.00 0.00 0.00 0.00 0.01 0.00 0.01
A330-343 0.00 0.00 0.00 0.00 0.00 0.00 0.00 0.00 0.00
Air CarrierTotal
0.04 0.01 0.05 0.04 0.01 0.05 0.07 0.03 0.10
Air Taxi
BEC58P 0.01 0.00 0.01 0.01 0.00 0.01 0.03 0.00 0.03
CIT3 0.02 0.00 0.02 0.02 0.00 0.02 0.04 0.00 0.04
CL600 1.30 0.08 1.38 1.37 0.02 1.39 2.66 0.10 2.77
CL601 0.13 0.03 0.16 0.16 0.00 0.16 0.29 0.03 0.32
CNA182 0.01 0.00 0.01 0.01 0.00 0.01 0.03 0.00 0.03
CNA206 0.01 0.00 0.01 0.01 0.00 0.01 0.03 0.00 0.03
CNA441 1.15 0.13 1.28 1.18 0.10 1.28 2.33 0.23 2.56
CNA500 0.72 0.03 0.75 0.73 0.02 0.76 1.45 0.05 1.51
CNA510 1.18 0.16 1.34 1.28 0.07 1.34 2.46 0.23 2.68
CNA55B 1.82 0.08 1.91 1.84 0.07 1.91 3.67 0.15 3.82
CNA750 0.81 0.06 0.86 0.84 0.02 0.86 1.64 0.08 1.72
DHC6 0.01 0.00 0.01 0.01 0.00 0.01 0.01 0.00 0.01
DO228 0.06 0.01 0.07 0.07 0.00 0.07 0.13 0.01 0.13
ECLIPSE500 0.01 0.00 0.01 0.01 0.00 0.01 0.01 0.00 0.01
EMB145 0.00 0.00 0.00 0.00 0.00 0.00 0.00 0.00 0.00
F10062 0.04 0.01 0.05 0.04 0.01 0.05 0.08 0.02 0.10
FAL20 0.00 0.00 0.00 0.00 0.00 0.00 0.00 0.00 0.00
GASEPV 0.01 0.00 0.01 0.01 0.00 0.01 0.01 0.00 0.01
GIIB 0.00 0.00 0.00 0.00 0.00 0.00 0.00 0.00 0.00
GIV 0.03 0.00 0.03 0.03 0.01 0.03 0.06 0.01 0.07
GV 0.01 0.00 0.01 0.01 0.00 0.01 0.01 0.00 0.01
IA1125 0.10 0.01 0.10 0.10 0.00 0.10 0.20 0.01 0.21
LEAR25 0.00 0.00 0.00 0.00 0.00 0.00 0.00 0.00 0.00
LEAR35 0.82 0.03 0.85 0.81 0.05 0.86 1.63 0.08 1.72
MU3001 0.50 0.04 0.54 0.52 0.02 0.54 1.02 0.06 1.08
SD330 0.25 0.01 0.26 0.26 0.00 0.26 0.51 0.01 0.52
GII 0.00 0.00 0.00 0.00 0.00 0.00 0.00 0.00 0.00
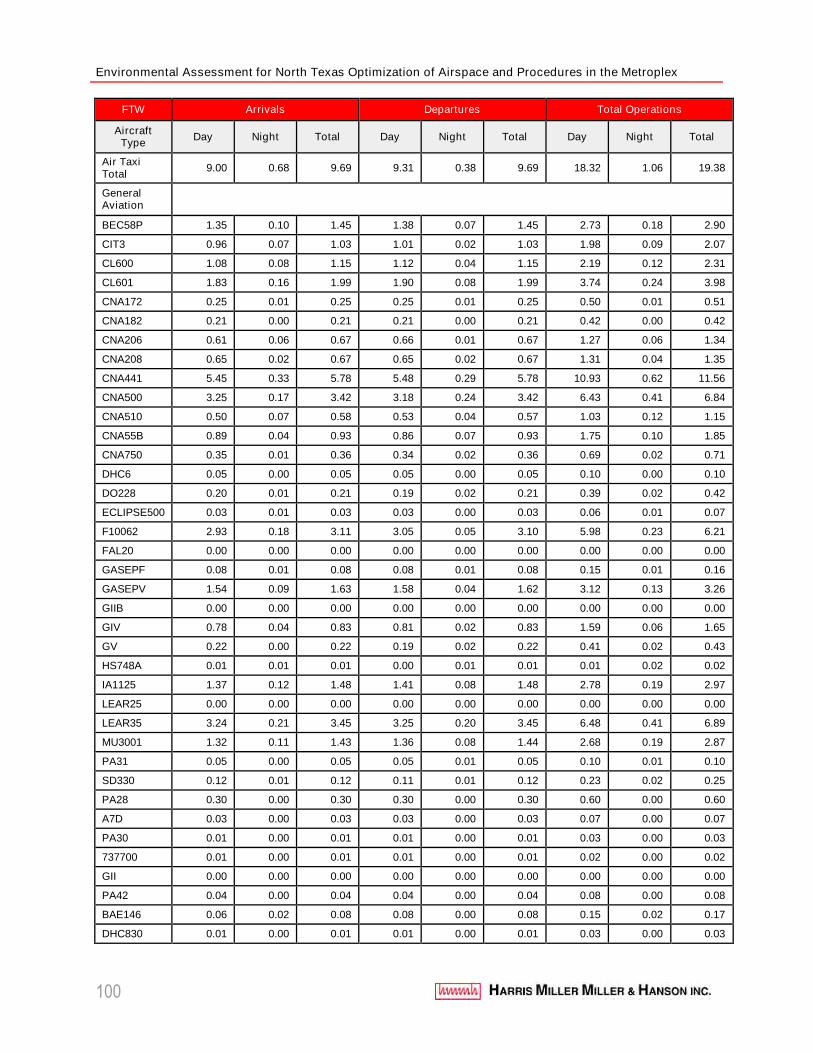
Environmental Assessment for North Texas Optimization of Airspace and Procedures in the Metroplex
100
FTW Arrivals Departures Total Operations
AircraftType
Day Night Total Day Night Total Day Night Total
Air TaxiTotal
9.00 0.68 9.69 9.31 0.38 9.69 18.32 1.06 19.38
GeneralAviation
BEC58P 1.35 0.10 1.45 1.38 0.07 1.45 2.73 0.18 2.90
CIT3 0.96 0.07 1.03 1.01 0.02 1.03 1.98 0.09 2.07
CL600 1.08 0.08 1.15 1.12 0.04 1.15 2.19 0.12 2.31
CL601 1.83 0.16 1.99 1.90 0.08 1.99 3.74 0.24 3.98
CNA172 0.25 0.01 0.25 0.25 0.01 0.25 0.50 0.01 0.51
CNA182 0.21 0.00 0.21 0.21 0.00 0.21 0.42 0.00 0.42
CNA206 0.61 0.06 0.67 0.66 0.01 0.67 1.27 0.06 1.34
CNA208 0.65 0.02 0.67 0.65 0.02 0.67 1.31 0.04 1.35
CNA441 5.45 0.33 5.78 5.48 0.29 5.78 10.93 0.62 11.56
CNA500 3.25 0.17 3.42 3.18 0.24 3.42 6.43 0.41 6.84
CNA510 0.50 0.07 0.58 0.53 0.04 0.57 1.03 0.12 1.15
CNA55B 0.89 0.04 0.93 0.86 0.07 0.93 1.75 0.10 1.85
CNA750 0.35 0.01 0.36 0.34 0.02 0.36 0.69 0.02 0.71
DHC6 0.05 0.00 0.05 0.05 0.00 0.05 0.10 0.00 0.10
DO228 0.20 0.01 0.21 0.19 0.02 0.21 0.39 0.02 0.42
ECLIPSE500 0.03 0.01 0.03 0.03 0.00 0.03 0.06 0.01 0.07
F10062 2.93 0.18 3.11 3.05 0.05 3.10 5.98 0.23 6.21
FAL20 0.00 0.00 0.00 0.00 0.00 0.00 0.00 0.00 0.00
GASEPF 0.08 0.01 0.08 0.08 0.01 0.08 0.15 0.01 0.16
GASEPV 1.54 0.09 1.63 1.58 0.04 1.62 3.12 0.13 3.26
GIIB 0.00 0.00 0.00 0.00 0.00 0.00 0.00 0.00 0.00
GIV 0.78 0.04 0.83 0.81 0.02 0.83 1.59 0.06 1.65
GV 0.22 0.00 0.22 0.19 0.02 0.22 0.41 0.02 0.43
HS748A 0.01 0.01 0.01 0.00 0.01 0.01 0.01 0.02 0.02
IA1125 1.37 0.12 1.48 1.41 0.08 1.48 2.78 0.19 2.97
LEAR25 0.00 0.00 0.00 0.00 0.00 0.00 0.00 0.00 0.00
LEAR35 3.24 0.21 3.45 3.25 0.20 3.45 6.48 0.41 6.89
MU3001 1.32 0.11 1.43 1.36 0.08 1.44 2.68 0.19 2.87
PA31 0.05 0.00 0.05 0.05 0.01 0.05 0.10 0.01 0.10
SD330 0.12 0.01 0.12 0.11 0.01 0.12 0.23 0.02 0.25
PA28 0.30 0.00 0.30 0.30 0.00 0.30 0.60 0.00 0.60
A7D 0.03 0.00 0.03 0.03 0.00 0.03 0.07 0.00 0.07
PA30 0.01 0.00 0.01 0.01 0.00 0.01 0.03 0.00 0.03
737700 0.01 0.00 0.01 0.01 0.00 0.01 0.02 0.00 0.02
GII 0.00 0.00 0.00 0.00 0.00 0.00 0.00 0.00 0.00
PA42 0.04 0.00 0.04 0.04 0.00 0.04 0.08 0.00 0.08
BAE146 0.06 0.02 0.08 0.08 0.00 0.08 0.15 0.02 0.17
DHC830 0.01 0.00 0.01 0.01 0.00 0.01 0.03 0.00 0.03
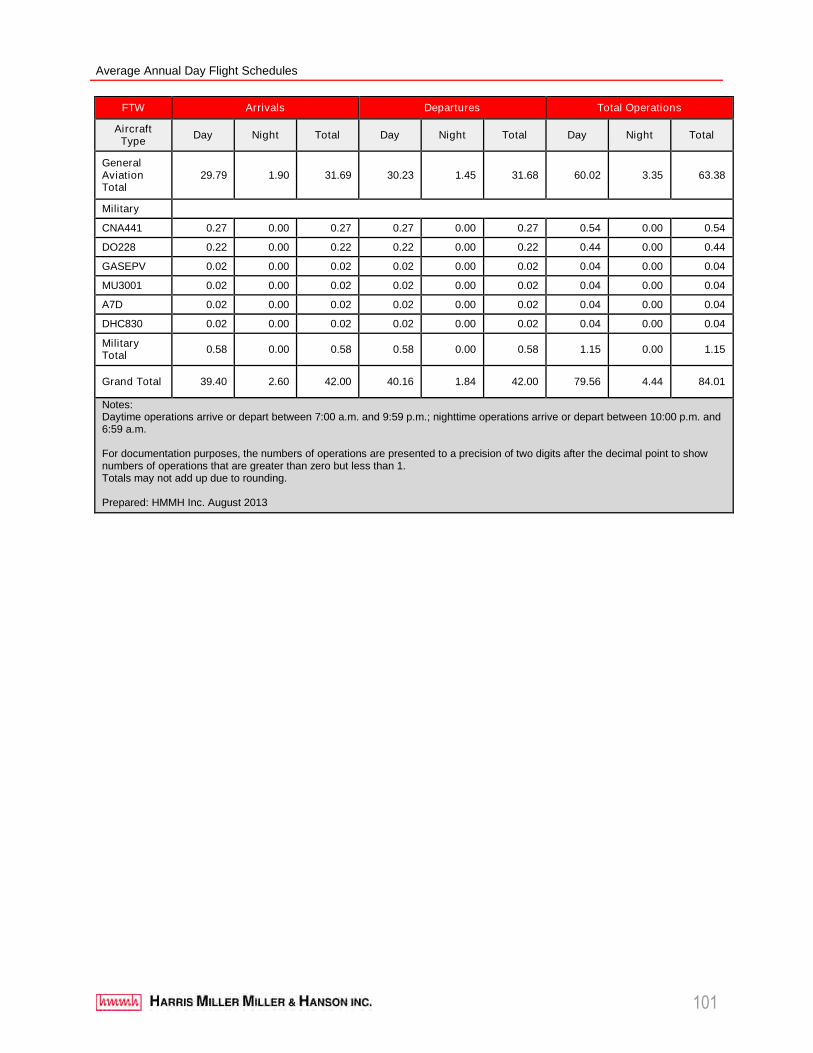
Average Annual Day Flight Schedules
101
FTW Arrivals Departures Total Operations
AircraftType
Day Night Total Day Night Total Day Night Total
GeneralAviationTotal
29.79 1.90 31.69 30.23 1.45 31.68 60.02 3.35 63.38
Military
CNA441 0.27 0.00 0.27 0.27 0.00 0.27 0.54 0.00 0.54
DO228 0.22 0.00 0.22 0.22 0.00 0.22 0.44 0.00 0.44
GASEPV 0.02 0.00 0.02 0.02 0.00 0.02 0.04 0.00 0.04
MU3001 0.02 0.00 0.02 0.02 0.00 0.02 0.04 0.00 0.04
A7D 0.02 0.00 0.02 0.02 0.00 0.02 0.04 0.00 0.04
DHC830 0.02 0.00 0.02 0.02 0.00 0.02 0.04 0.00 0.04
MilitaryTotal
0.58 0.00 0.58 0.58 0.00 0.58 1.15 0.00 1.15
Grand Total 39.40 2.60 42.00 40.16 1.84 42.00 79.56 4.44 84.01
Notes:Daytime operations arrive or depart between 7:00 a.m. and 9:59 p.m.; nighttime operations arrive or depart between 10:00 p.m. and6:59 a.m.
For documentation purposes, the numbers of operations are presented to a precision of two digits after the decimal point to shownumbers of operations that are greater than zero but less than 1.Totals may not add up due to rounding.
Prepared: HMMH Inc. August 2013
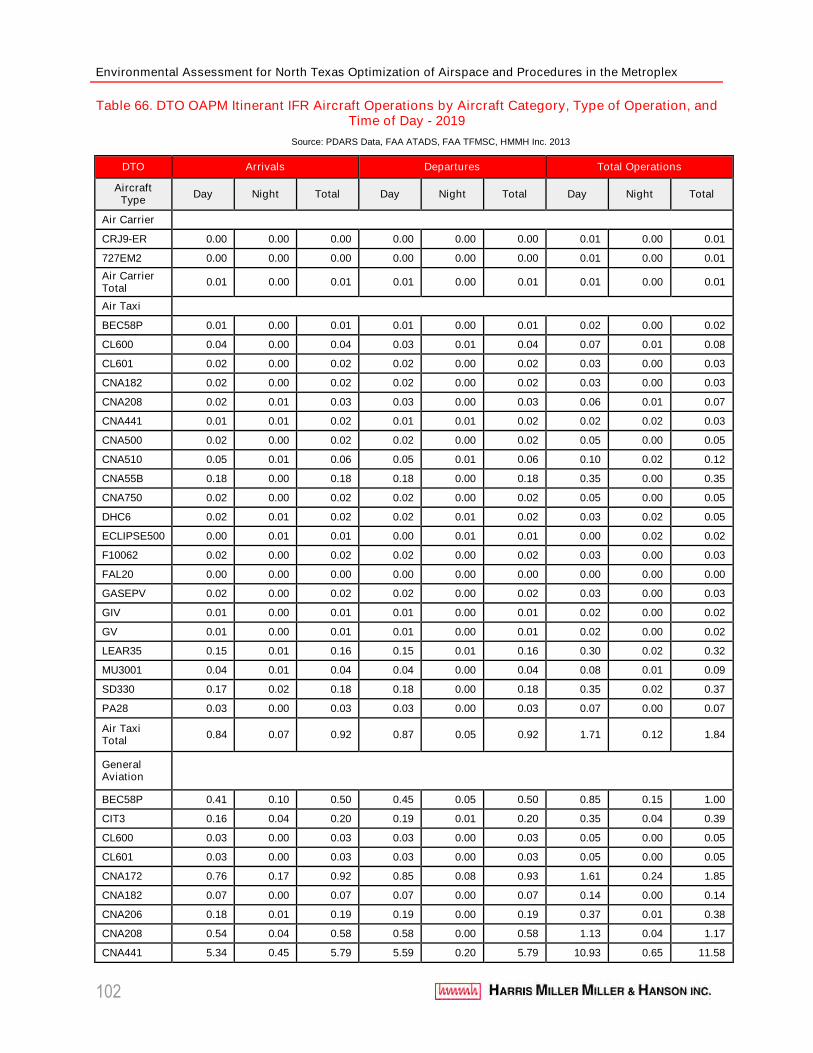
Environmental Assessment for North Texas Optimization of Airspace and Procedures in the Metroplex
102
Table 66. DTO OAPM Itinerant IFR Aircraft Operations by Aircraft Category, Type of Operation, andTime of Day - 2019
Source: PDARS Data, FAA ATADS, FAA TFMSC, HMMH Inc. 2013
DTO Arrivals Departures Total Operations
AircraftType
Day Night Total Day Night Total Day Night Total
Air Carrier
CRJ9-ER 0.00 0.00 0.00 0.00 0.00 0.00 0.01 0.00 0.01
727EM2 0.00 0.00 0.00 0.00 0.00 0.00 0.01 0.00 0.01
Air CarrierTotal
0.01 0.00 0.01 0.01 0.00 0.01 0.01 0.00 0.01
Air Taxi
BEC58P 0.01 0.00 0.01 0.01 0.00 0.01 0.02 0.00 0.02
CL600 0.04 0.00 0.04 0.03 0.01 0.04 0.07 0.01 0.08
CL601 0.02 0.00 0.02 0.02 0.00 0.02 0.03 0.00 0.03
CNA182 0.02 0.00 0.02 0.02 0.00 0.02 0.03 0.00 0.03
CNA208 0.02 0.01 0.03 0.03 0.00 0.03 0.06 0.01 0.07
CNA441 0.01 0.01 0.02 0.01 0.01 0.02 0.02 0.02 0.03
CNA500 0.02 0.00 0.02 0.02 0.00 0.02 0.05 0.00 0.05
CNA510 0.05 0.01 0.06 0.05 0.01 0.06 0.10 0.02 0.12
CNA55B 0.18 0.00 0.18 0.18 0.00 0.18 0.35 0.00 0.35
CNA750 0.02 0.00 0.02 0.02 0.00 0.02 0.05 0.00 0.05
DHC6 0.02 0.01 0.02 0.02 0.01 0.02 0.03 0.02 0.05
ECLIPSE500 0.00 0.01 0.01 0.00 0.01 0.01 0.00 0.02 0.02
F10062 0.02 0.00 0.02 0.02 0.00 0.02 0.03 0.00 0.03
FAL20 0.00 0.00 0.00 0.00 0.00 0.00 0.00 0.00 0.00
GASEPV 0.02 0.00 0.02 0.02 0.00 0.02 0.03 0.00 0.03
GIV 0.01 0.00 0.01 0.01 0.00 0.01 0.02 0.00 0.02
GV 0.01 0.00 0.01 0.01 0.00 0.01 0.02 0.00 0.02
LEAR35 0.15 0.01 0.16 0.15 0.01 0.16 0.30 0.02 0.32
MU3001 0.04 0.01 0.04 0.04 0.00 0.04 0.08 0.01 0.09
SD330 0.17 0.02 0.18 0.18 0.00 0.18 0.35 0.02 0.37
PA28 0.03 0.00 0.03 0.03 0.00 0.03 0.07 0.00 0.07
Air TaxiTotal
0.84 0.07 0.92 0.87 0.05 0.92 1.71 0.12 1.84
GeneralAviation
BEC58P 0.41 0.10 0.50 0.45 0.05 0.50 0.85 0.15 1.00
CIT3 0.16 0.04 0.20 0.19 0.01 0.20 0.35 0.04 0.39
CL600 0.03 0.00 0.03 0.03 0.00 0.03 0.05 0.00 0.05
CL601 0.03 0.00 0.03 0.03 0.00 0.03 0.05 0.00 0.05
CNA172 0.76 0.17 0.92 0.85 0.08 0.93 1.61 0.24 1.85
CNA182 0.07 0.00 0.07 0.07 0.00 0.07 0.14 0.00 0.14
CNA206 0.18 0.01 0.19 0.19 0.00 0.19 0.37 0.01 0.38
CNA208 0.54 0.04 0.58 0.58 0.00 0.58 1.13 0.04 1.17
CNA441 5.34 0.45 5.79 5.59 0.20 5.79 10.93 0.65 11.58
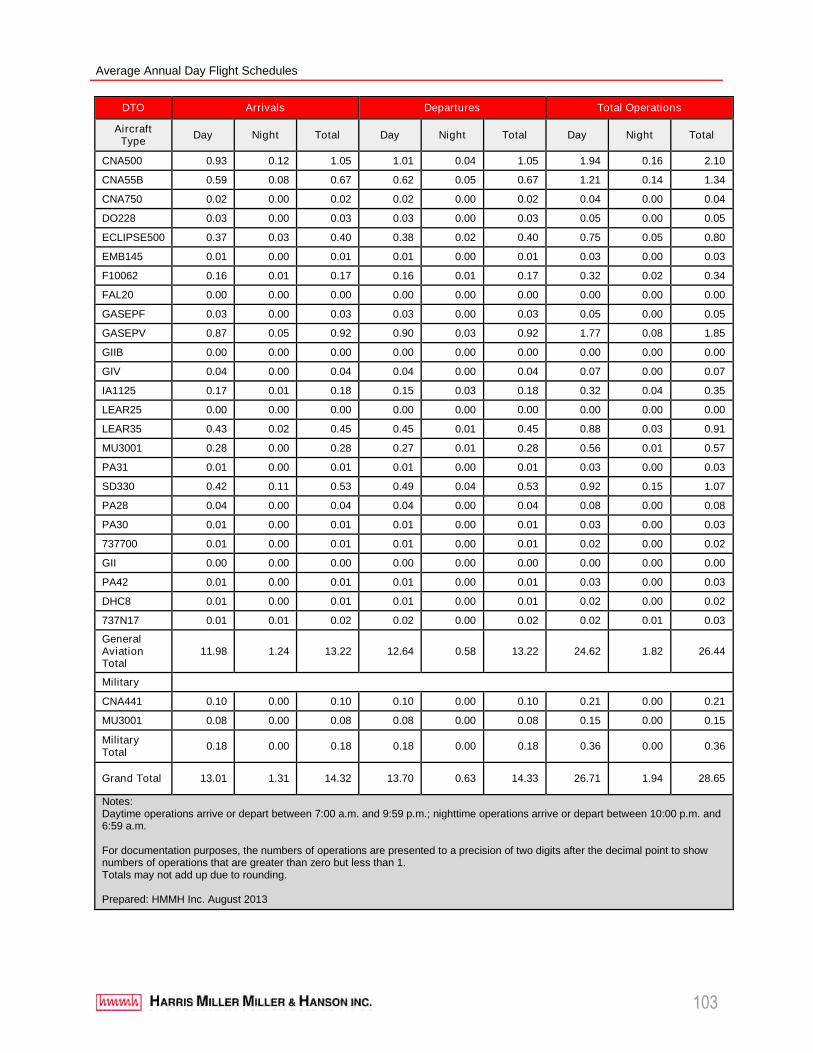
Average Annual Day Flight Schedules
103
DTO Arrivals Departures Total Operations
AircraftType
Day Night Total Day Night Total Day Night Total
CNA500 0.93 0.12 1.05 1.01 0.04 1.05 1.94 0.16 2.10
CNA55B 0.59 0.08 0.67 0.62 0.05 0.67 1.21 0.14 1.34
CNA750 0.02 0.00 0.02 0.02 0.00 0.02 0.04 0.00 0.04
DO228 0.03 0.00 0.03 0.03 0.00 0.03 0.05 0.00 0.05
ECLIPSE500 0.37 0.03 0.40 0.38 0.02 0.40 0.75 0.05 0.80
EMB145 0.01 0.00 0.01 0.01 0.00 0.01 0.03 0.00 0.03
F10062 0.16 0.01 0.17 0.16 0.01 0.17 0.32 0.02 0.34
FAL20 0.00 0.00 0.00 0.00 0.00 0.00 0.00 0.00 0.00
GASEPF 0.03 0.00 0.03 0.03 0.00 0.03 0.05 0.00 0.05
GASEPV 0.87 0.05 0.92 0.90 0.03 0.92 1.77 0.08 1.85
GIIB 0.00 0.00 0.00 0.00 0.00 0.00 0.00 0.00 0.00
GIV 0.04 0.00 0.04 0.04 0.00 0.04 0.07 0.00 0.07
IA1125 0.17 0.01 0.18 0.15 0.03 0.18 0.32 0.04 0.35
LEAR25 0.00 0.00 0.00 0.00 0.00 0.00 0.00 0.00 0.00
LEAR35 0.43 0.02 0.45 0.45 0.01 0.45 0.88 0.03 0.91
MU3001 0.28 0.00 0.28 0.27 0.01 0.28 0.56 0.01 0.57
PA31 0.01 0.00 0.01 0.01 0.00 0.01 0.03 0.00 0.03
SD330 0.42 0.11 0.53 0.49 0.04 0.53 0.92 0.15 1.07
PA28 0.04 0.00 0.04 0.04 0.00 0.04 0.08 0.00 0.08
PA30 0.01 0.00 0.01 0.01 0.00 0.01 0.03 0.00 0.03
737700 0.01 0.00 0.01 0.01 0.00 0.01 0.02 0.00 0.02
GII 0.00 0.00 0.00 0.00 0.00 0.00 0.00 0.00 0.00
PA42 0.01 0.00 0.01 0.01 0.00 0.01 0.03 0.00 0.03
DHC8 0.01 0.00 0.01 0.01 0.00 0.01 0.02 0.00 0.02
737N17 0.01 0.01 0.02 0.02 0.00 0.02 0.02 0.01 0.03
GeneralAviationTotal
11.98 1.24 13.22 12.64 0.58 13.22 24.62 1.82 26.44
Military
CNA441 0.10 0.00 0.10 0.10 0.00 0.10 0.21 0.00 0.21
MU3001 0.08 0.00 0.08 0.08 0.00 0.08 0.15 0.00 0.15
MilitaryTotal
0.18 0.00 0.18 0.18 0.00 0.18 0.36 0.00 0.36
Grand Total 13.01 1.31 14.32 13.70 0.63 14.33 26.71 1.94 28.65
Notes:Daytime operations arrive or depart between 7:00 a.m. and 9:59 p.m.; nighttime operations arrive or depart between 10:00 p.m. and6:59 a.m.
For documentation purposes, the numbers of operations are presented to a precision of two digits after the decimal point to shownumbers of operations that are greater than zero but less than 1.Totals may not add up due to rounding.
Prepared: HMMH Inc. August 2013
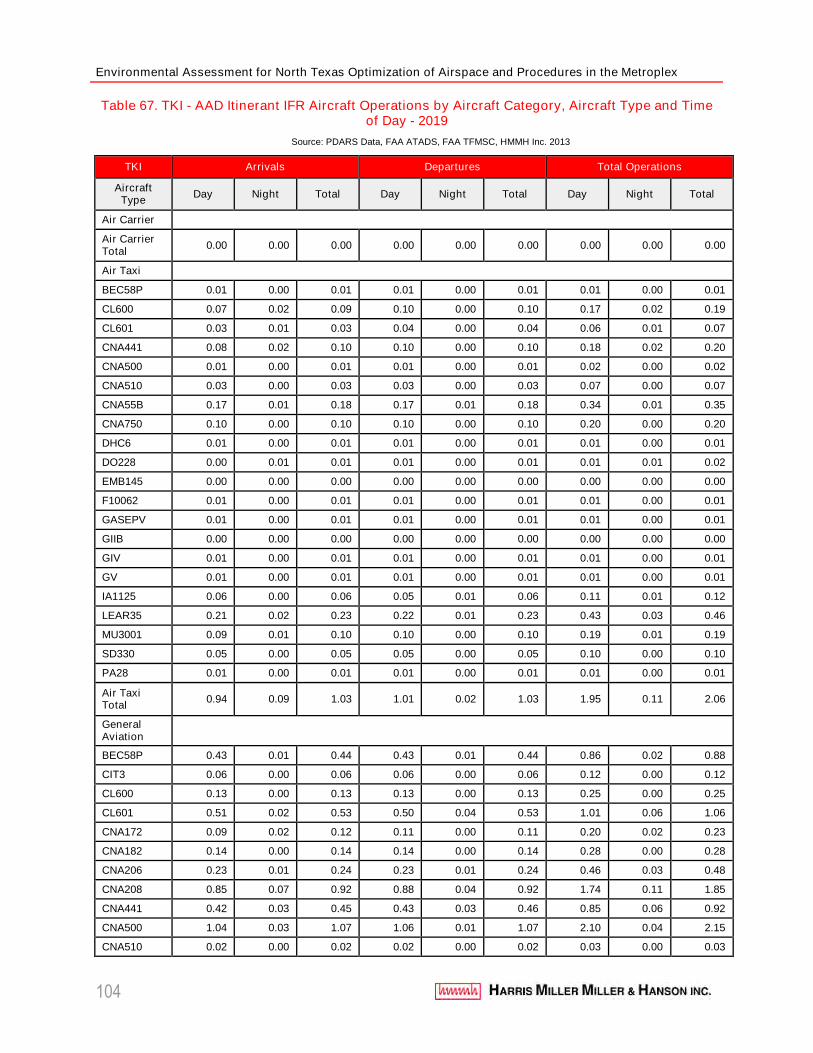
Environmental Assessment for North Texas Optimization of Airspace and Procedures in the Metroplex
104
Table 67. TKI - AAD Itinerant IFR Aircraft Operations by Aircraft Category, Aircraft Type and Timeof Day - 2019
Source: PDARS Data, FAA ATADS, FAA TFMSC, HMMH Inc. 2013
TKI Arrivals Departures Total Operations
AircraftType
Day Night Total Day Night Total Day Night Total
Air Carrier
Air CarrierTotal
0.00 0.00 0.00 0.00 0.00 0.00 0.00 0.00 0.00
Air Taxi
BEC58P 0.01 0.00 0.01 0.01 0.00 0.01 0.01 0.00 0.01
CL600 0.07 0.02 0.09 0.10 0.00 0.10 0.17 0.02 0.19
CL601 0.03 0.01 0.03 0.04 0.00 0.04 0.06 0.01 0.07
CNA441 0.08 0.02 0.10 0.10 0.00 0.10 0.18 0.02 0.20
CNA500 0.01 0.00 0.01 0.01 0.00 0.01 0.02 0.00 0.02
CNA510 0.03 0.00 0.03 0.03 0.00 0.03 0.07 0.00 0.07
CNA55B 0.17 0.01 0.18 0.17 0.01 0.18 0.34 0.01 0.35
CNA750 0.10 0.00 0.10 0.10 0.00 0.10 0.20 0.00 0.20
DHC6 0.01 0.00 0.01 0.01 0.00 0.01 0.01 0.00 0.01
DO228 0.00 0.01 0.01 0.01 0.00 0.01 0.01 0.01 0.02
EMB145 0.00 0.00 0.00 0.00 0.00 0.00 0.00 0.00 0.00
F10062 0.01 0.00 0.01 0.01 0.00 0.01 0.01 0.00 0.01
GASEPV 0.01 0.00 0.01 0.01 0.00 0.01 0.01 0.00 0.01
GIIB 0.00 0.00 0.00 0.00 0.00 0.00 0.00 0.00 0.00
GIV 0.01 0.00 0.01 0.01 0.00 0.01 0.01 0.00 0.01
GV 0.01 0.00 0.01 0.01 0.00 0.01 0.01 0.00 0.01
IA1125 0.06 0.00 0.06 0.05 0.01 0.06 0.11 0.01 0.12
LEAR35 0.21 0.02 0.23 0.22 0.01 0.23 0.43 0.03 0.46
MU3001 0.09 0.01 0.10 0.10 0.00 0.10 0.19 0.01 0.19
SD330 0.05 0.00 0.05 0.05 0.00 0.05 0.10 0.00 0.10
PA28 0.01 0.00 0.01 0.01 0.00 0.01 0.01 0.00 0.01
Air TaxiTotal
0.94 0.09 1.03 1.01 0.02 1.03 1.95 0.11 2.06
GeneralAviation
BEC58P 0.43 0.01 0.44 0.43 0.01 0.44 0.86 0.02 0.88
CIT3 0.06 0.00 0.06 0.06 0.00 0.06 0.12 0.00 0.12
CL600 0.13 0.00 0.13 0.13 0.00 0.13 0.25 0.00 0.25
CL601 0.51 0.02 0.53 0.50 0.04 0.53 1.01 0.06 1.06
CNA172 0.09 0.02 0.12 0.11 0.00 0.11 0.20 0.02 0.23
CNA182 0.14 0.00 0.14 0.14 0.00 0.14 0.28 0.00 0.28
CNA206 0.23 0.01 0.24 0.23 0.01 0.24 0.46 0.03 0.48
CNA208 0.85 0.07 0.92 0.88 0.04 0.92 1.74 0.11 1.85
CNA441 0.42 0.03 0.45 0.43 0.03 0.46 0.85 0.06 0.92
CNA500 1.04 0.03 1.07 1.06 0.01 1.07 2.10 0.04 2.15
CNA510 0.02 0.00 0.02 0.02 0.00 0.02 0.03 0.00 0.03
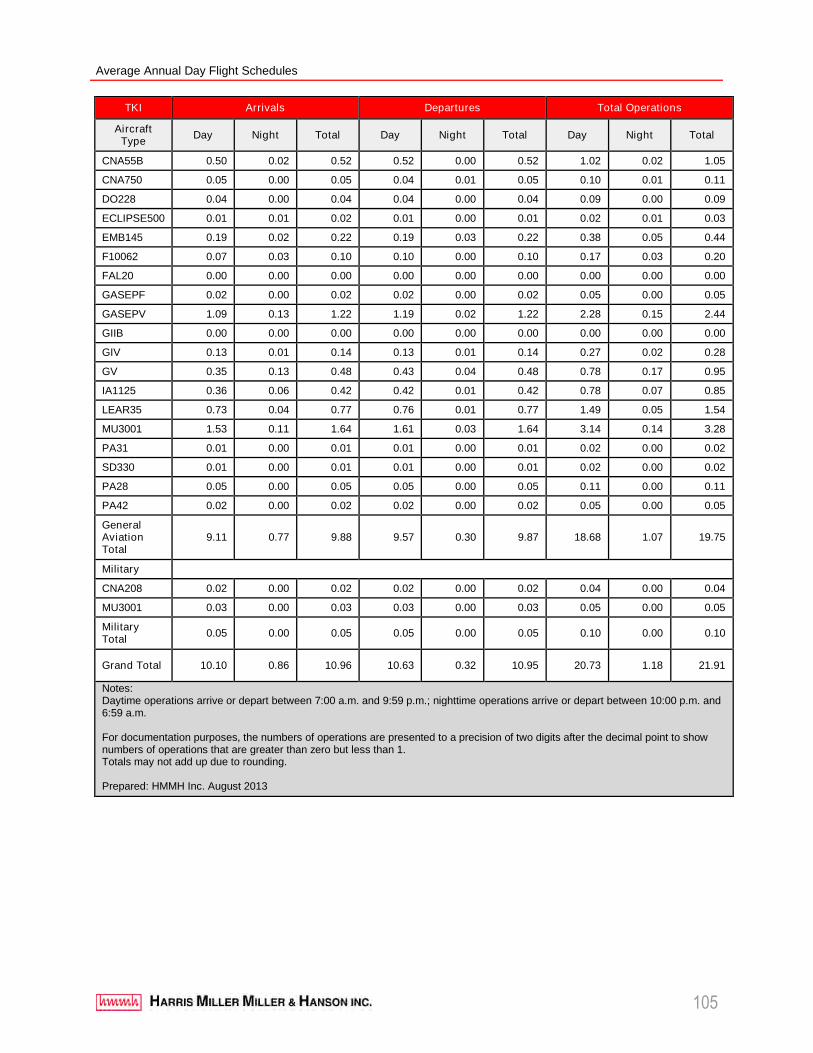
Average Annual Day Flight Schedules
105
TKI Arrivals Departures Total Operations
AircraftType
Day Night Total Day Night Total Day Night Total
CNA55B 0.50 0.02 0.52 0.52 0.00 0.52 1.02 0.02 1.05
CNA750 0.05 0.00 0.05 0.04 0.01 0.05 0.10 0.01 0.11
DO228 0.04 0.00 0.04 0.04 0.00 0.04 0.09 0.00 0.09
ECLIPSE500 0.01 0.01 0.02 0.01 0.00 0.01 0.02 0.01 0.03
EMB145 0.19 0.02 0.22 0.19 0.03 0.22 0.38 0.05 0.44
F10062 0.07 0.03 0.10 0.10 0.00 0.10 0.17 0.03 0.20
FAL20 0.00 0.00 0.00 0.00 0.00 0.00 0.00 0.00 0.00
GASEPF 0.02 0.00 0.02 0.02 0.00 0.02 0.05 0.00 0.05
GASEPV 1.09 0.13 1.22 1.19 0.02 1.22 2.28 0.15 2.44
GIIB 0.00 0.00 0.00 0.00 0.00 0.00 0.00 0.00 0.00
GIV 0.13 0.01 0.14 0.13 0.01 0.14 0.27 0.02 0.28
GV 0.35 0.13 0.48 0.43 0.04 0.48 0.78 0.17 0.95
IA1125 0.36 0.06 0.42 0.42 0.01 0.42 0.78 0.07 0.85
LEAR35 0.73 0.04 0.77 0.76 0.01 0.77 1.49 0.05 1.54
MU3001 1.53 0.11 1.64 1.61 0.03 1.64 3.14 0.14 3.28
PA31 0.01 0.00 0.01 0.01 0.00 0.01 0.02 0.00 0.02
SD330 0.01 0.00 0.01 0.01 0.00 0.01 0.02 0.00 0.02
PA28 0.05 0.00 0.05 0.05 0.00 0.05 0.11 0.00 0.11
PA42 0.02 0.00 0.02 0.02 0.00 0.02 0.05 0.00 0.05
GeneralAviationTotal
9.11 0.77 9.88 9.57 0.30 9.87 18.68 1.07 19.75
Military
CNA208 0.02 0.00 0.02 0.02 0.00 0.02 0.04 0.00 0.04
MU3001 0.03 0.00 0.03 0.03 0.00 0.03 0.05 0.00 0.05
MilitaryTotal
0.05 0.00 0.05 0.05 0.00 0.05 0.10 0.00 0.10
Grand Total 10.10 0.86 10.96 10.63 0.32 10.95 20.73 1.18 21.91
Notes:Daytime operations arrive or depart between 7:00 a.m. and 9:59 p.m.; nighttime operations arrive or depart between 10:00 p.m. and6:59 a.m.
For documentation purposes, the numbers of operations are presented to a precision of two digits after the decimal point to shownumbers of operations that are greater than zero but less than 1.Totals may not add up due to rounding.
Prepared: HMMH Inc. August 2013
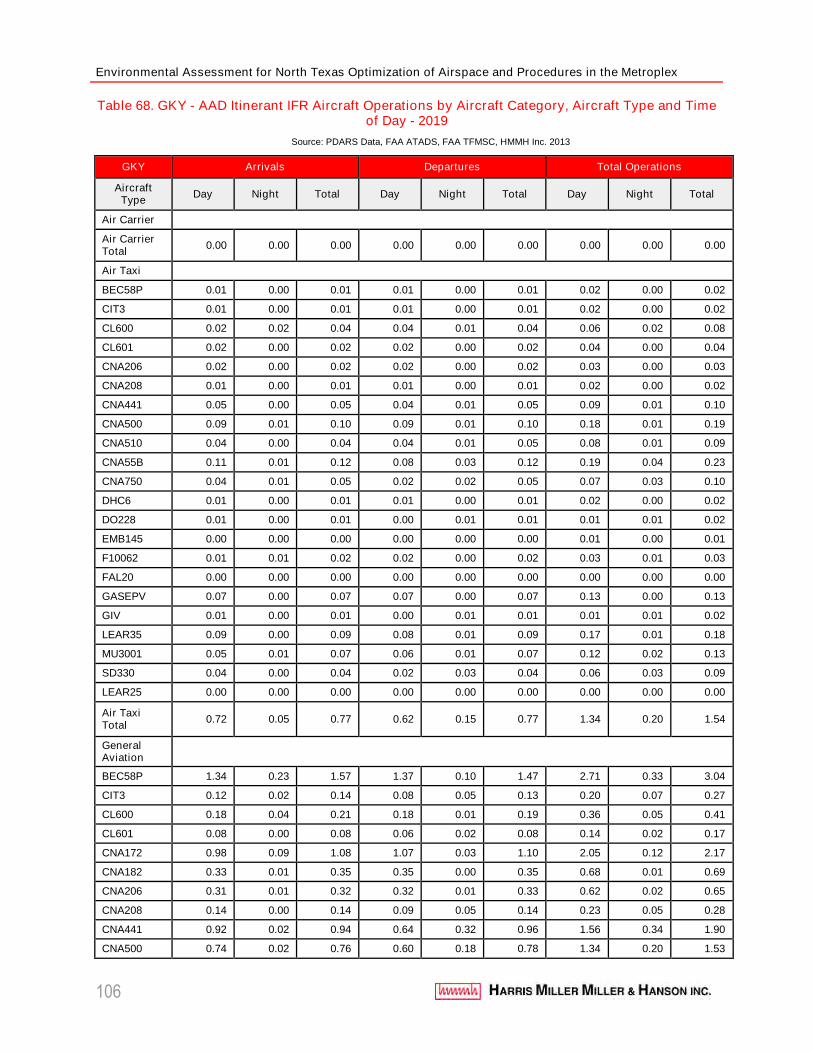
Environmental Assessment for North Texas Optimization of Airspace and Procedures in the Metroplex
106
Table 68. GKY - AAD Itinerant IFR Aircraft Operations by Aircraft Category, Aircraft Type and Timeof Day - 2019
Source: PDARS Data, FAA ATADS, FAA TFMSC, HMMH Inc. 2013
GKY Arrivals Departures Total Operations
AircraftType
Day Night Total Day Night Total Day Night Total
Air Carrier
Air CarrierTotal
0.00 0.00 0.00 0.00 0.00 0.00 0.00 0.00 0.00
Air Taxi
BEC58P 0.01 0.00 0.01 0.01 0.00 0.01 0.02 0.00 0.02
CIT3 0.01 0.00 0.01 0.01 0.00 0.01 0.02 0.00 0.02
CL600 0.02 0.02 0.04 0.04 0.01 0.04 0.06 0.02 0.08
CL601 0.02 0.00 0.02 0.02 0.00 0.02 0.04 0.00 0.04
CNA206 0.02 0.00 0.02 0.02 0.00 0.02 0.03 0.00 0.03
CNA208 0.01 0.00 0.01 0.01 0.00 0.01 0.02 0.00 0.02
CNA441 0.05 0.00 0.05 0.04 0.01 0.05 0.09 0.01 0.10
CNA500 0.09 0.01 0.10 0.09 0.01 0.10 0.18 0.01 0.19
CNA510 0.04 0.00 0.04 0.04 0.01 0.05 0.08 0.01 0.09
CNA55B 0.11 0.01 0.12 0.08 0.03 0.12 0.19 0.04 0.23
CNA750 0.04 0.01 0.05 0.02 0.02 0.05 0.07 0.03 0.10
DHC6 0.01 0.00 0.01 0.01 0.00 0.01 0.02 0.00 0.02
DO228 0.01 0.00 0.01 0.00 0.01 0.01 0.01 0.01 0.02
EMB145 0.00 0.00 0.00 0.00 0.00 0.00 0.01 0.00 0.01
F10062 0.01 0.01 0.02 0.02 0.00 0.02 0.03 0.01 0.03
FAL20 0.00 0.00 0.00 0.00 0.00 0.00 0.00 0.00 0.00
GASEPV 0.07 0.00 0.07 0.07 0.00 0.07 0.13 0.00 0.13
GIV 0.01 0.00 0.01 0.00 0.01 0.01 0.01 0.01 0.02
LEAR35 0.09 0.00 0.09 0.08 0.01 0.09 0.17 0.01 0.18
MU3001 0.05 0.01 0.07 0.06 0.01 0.07 0.12 0.02 0.13
SD330 0.04 0.00 0.04 0.02 0.03 0.04 0.06 0.03 0.09
LEAR25 0.00 0.00 0.00 0.00 0.00 0.00 0.00 0.00 0.00
Air TaxiTotal
0.72 0.05 0.77 0.62 0.15 0.77 1.34 0.20 1.54
GeneralAviation
BEC58P 1.34 0.23 1.57 1.37 0.10 1.47 2.71 0.33 3.04
CIT3 0.12 0.02 0.14 0.08 0.05 0.13 0.20 0.07 0.27
CL600 0.18 0.04 0.21 0.18 0.01 0.19 0.36 0.05 0.41
CL601 0.08 0.00 0.08 0.06 0.02 0.08 0.14 0.02 0.17
CNA172 0.98 0.09 1.08 1.07 0.03 1.10 2.05 0.12 2.17
CNA182 0.33 0.01 0.35 0.35 0.00 0.35 0.68 0.01 0.69
CNA206 0.31 0.01 0.32 0.32 0.01 0.33 0.62 0.02 0.65
CNA208 0.14 0.00 0.14 0.09 0.05 0.14 0.23 0.05 0.28
CNA441 0.92 0.02 0.94 0.64 0.32 0.96 1.56 0.34 1.90
CNA500 0.74 0.02 0.76 0.60 0.18 0.78 1.34 0.20 1.53

Average Annual Day Flight Schedules
107
GKY Arrivals Departures Total Operations
AircraftType
Day Night Total Day Night Total Day Night Total
CNA510 0.15 0.01 0.16 0.16 0.01 0.16 0.31 0.02 0.33
CNA55B 0.16 0.01 0.17 0.12 0.05 0.17 0.28 0.06 0.34
CNA750 0.02 0.00 0.02 0.01 0.01 0.02 0.03 0.01 0.04
DHC6 0.01 0.00 0.01 0.01 0.00 0.01 0.01 0.00 0.01
DO228 0.07 0.01 0.08 0.06 0.02 0.08 0.13 0.03 0.16
ECLIPSE500 0.02 0.00 0.02 0.01 0.01 0.02 0.02 0.01 0.04
EMB145 0.01 0.00 0.01 0.00 0.01 0.01 0.01 0.01 0.01
F10062 0.38 0.03 0.41 0.30 0.12 0.42 0.68 0.15 0.83
FAL20 0.00 0.00 0.00 0.00 0.00 0.00 0.00 0.00 0.00
GASEPV 0.57 0.08 0.65 0.61 0.05 0.67 1.18 0.14 1.32
GIV 0.12 0.00 0.12 0.07 0.04 0.12 0.19 0.04 0.23
GV 0.03 0.00 0.03 0.03 0.01 0.04 0.06 0.01 0.07
IA1125 0.12 0.00 0.12 0.07 0.05 0.12 0.19 0.05 0.24
LEAR35 0.58 0.05 0.63 0.53 0.10 0.64 1.11 0.15 1.27
MU3001 0.50 0.03 0.53 0.45 0.09 0.53 0.94 0.12 1.06
PA31 0.01 0.00 0.01 0.01 0.01 0.02 0.02 0.01 0.03
SD330 0.02 0.00 0.02 0.01 0.01 0.02 0.04 0.01 0.05
PA28 0.02 0.00 0.02 0.02 0.00 0.02 0.05 0.00 0.05
PA42 0.01 0.00 0.01 0.01 0.01 0.01 0.02 0.01 0.02
LEAR25 0.00 0.00 0.00 0.00 0.00 0.00 0.00 0.00 0.00
PA30 0.01 0.00 0.01 0.01 0.00 0.01 0.01 0.00 0.01
GII 0.01 0.01 0.02 0.01 0.01 0.01 0.02 0.01 0.03
GeneralAviationTotal
7.95 0.68 8.63 7.26 1.37 8.62 15.21 2.04 17.25
Military
BEC58P 0.01 0.00 0.01 0.01 0.00 0.01 0.02 0.00 0.02
CNA441 0.02 0.00 0.02 0.02 0.00 0.02 0.04 0.00 0.04
MilitaryTotal
0.03 0.00 0.03 0.03 0.00 0.03 0.06 0.00 0.06
Grand Total 8.70 0.73 9.43 7.91 1.52 9.42 16.61 2.24 18.85
Notes:Daytime operations arrive or depart between 7:00 a.m. and 9:59 p.m.; nighttime operations arrive or depart between 10:00 p.m. and6:59 a.m.
For documentation purposes, the numbers of operations are presented to a precision of two digits after the decimal point to shownumbers of operations that are greater than zero but less than 1.Totals may not add up due to rounding.
Prepared: HMMH Inc. August 2013
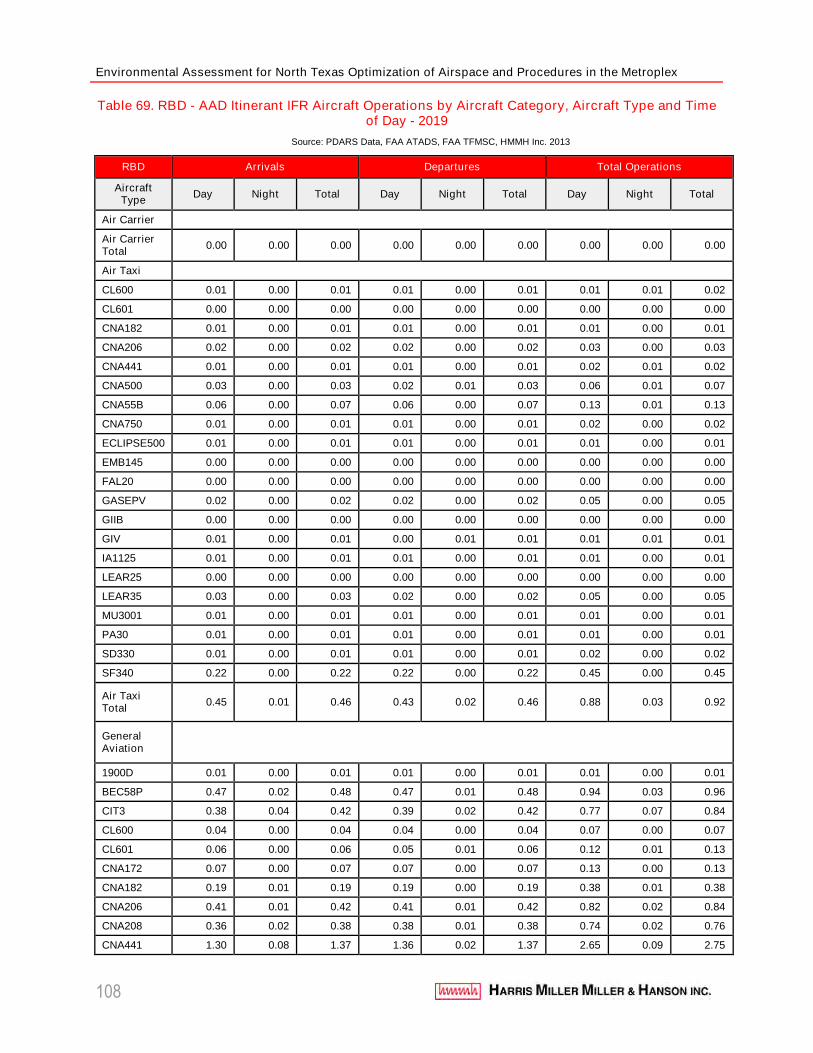
Environmental Assessment for North Texas Optimization of Airspace and Procedures in the Metroplex
108
Table 69. RBD - AAD Itinerant IFR Aircraft Operations by Aircraft Category, Aircraft Type and Timeof Day - 2019
Source: PDARS Data, FAA ATADS, FAA TFMSC, HMMH Inc. 2013
RBD Arrivals Departures Total Operations
AircraftType
Day Night Total Day Night Total Day Night Total
Air Carrier
Air CarrierTotal
0.00 0.00 0.00 0.00 0.00 0.00 0.00 0.00 0.00
Air Taxi
CL600 0.01 0.00 0.01 0.01 0.00 0.01 0.01 0.01 0.02
CL601 0.00 0.00 0.00 0.00 0.00 0.00 0.00 0.00 0.00
CNA182 0.01 0.00 0.01 0.01 0.00 0.01 0.01 0.00 0.01
CNA206 0.02 0.00 0.02 0.02 0.00 0.02 0.03 0.00 0.03
CNA441 0.01 0.00 0.01 0.01 0.00 0.01 0.02 0.01 0.02
CNA500 0.03 0.00 0.03 0.02 0.01 0.03 0.06 0.01 0.07
CNA55B 0.06 0.00 0.07 0.06 0.00 0.07 0.13 0.01 0.13
CNA750 0.01 0.00 0.01 0.01 0.00 0.01 0.02 0.00 0.02
ECLIPSE500 0.01 0.00 0.01 0.01 0.00 0.01 0.01 0.00 0.01
EMB145 0.00 0.00 0.00 0.00 0.00 0.00 0.00 0.00 0.00
FAL20 0.00 0.00 0.00 0.00 0.00 0.00 0.00 0.00 0.00
GASEPV 0.02 0.00 0.02 0.02 0.00 0.02 0.05 0.00 0.05
GIIB 0.00 0.00 0.00 0.00 0.00 0.00 0.00 0.00 0.00
GIV 0.01 0.00 0.01 0.00 0.01 0.01 0.01 0.01 0.01
IA1125 0.01 0.00 0.01 0.01 0.00 0.01 0.01 0.00 0.01
LEAR25 0.00 0.00 0.00 0.00 0.00 0.00 0.00 0.00 0.00
LEAR35 0.03 0.00 0.03 0.02 0.00 0.02 0.05 0.00 0.05
MU3001 0.01 0.00 0.01 0.01 0.00 0.01 0.01 0.00 0.01
PA30 0.01 0.00 0.01 0.01 0.00 0.01 0.01 0.00 0.01
SD330 0.01 0.00 0.01 0.01 0.00 0.01 0.02 0.00 0.02
SF340 0.22 0.00 0.22 0.22 0.00 0.22 0.45 0.00 0.45
Air TaxiTotal
0.45 0.01 0.46 0.43 0.02 0.46 0.88 0.03 0.92
GeneralAviation
1900D 0.01 0.00 0.01 0.01 0.00 0.01 0.01 0.00 0.01
BEC58P 0.47 0.02 0.48 0.47 0.01 0.48 0.94 0.03 0.96
CIT3 0.38 0.04 0.42 0.39 0.02 0.42 0.77 0.07 0.84
CL600 0.04 0.00 0.04 0.04 0.00 0.04 0.07 0.00 0.07
CL601 0.06 0.00 0.06 0.05 0.01 0.06 0.12 0.01 0.13
CNA172 0.07 0.00 0.07 0.07 0.00 0.07 0.13 0.00 0.13
CNA182 0.19 0.01 0.19 0.19 0.00 0.19 0.38 0.01 0.38
CNA206 0.41 0.01 0.42 0.41 0.01 0.42 0.82 0.02 0.84
CNA208 0.36 0.02 0.38 0.38 0.01 0.38 0.74 0.02 0.76
CNA441 1.30 0.08 1.37 1.36 0.02 1.37 2.65 0.09 2.75
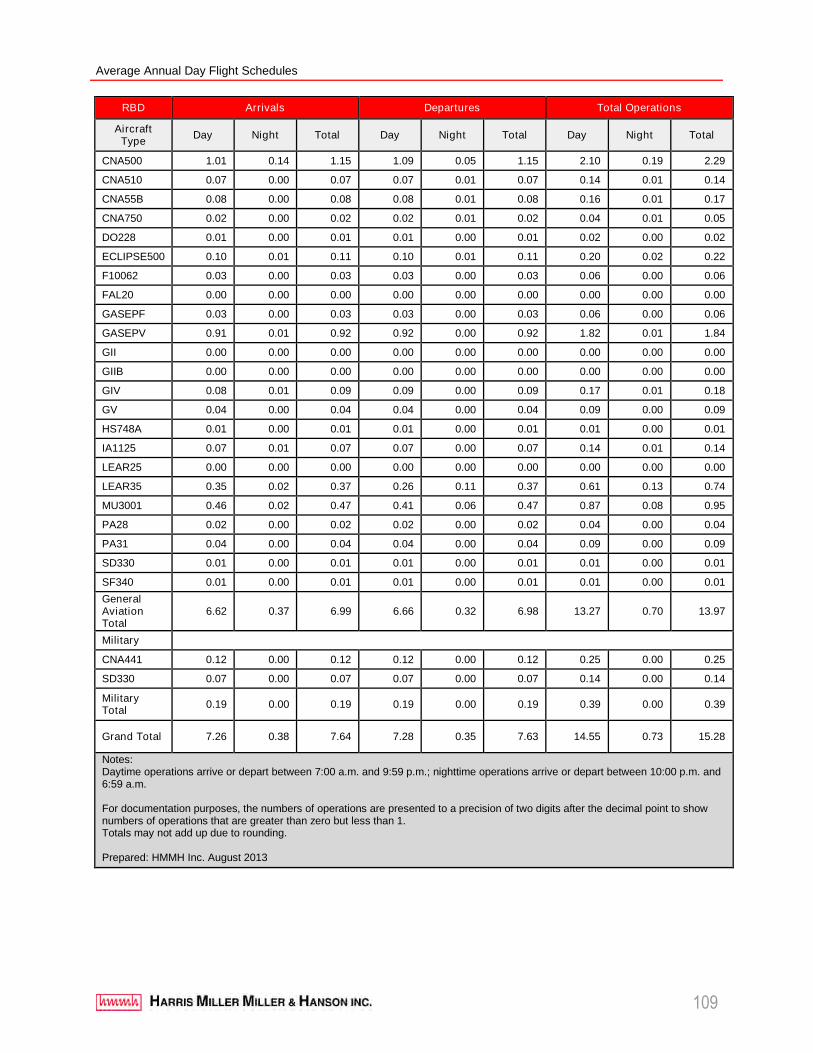
Average Annual Day Flight Schedules
109
RBD Arrivals Departures Total Operations
AircraftType
Day Night Total Day Night Total Day Night Total
CNA500 1.01 0.14 1.15 1.09 0.05 1.15 2.10 0.19 2.29
CNA510 0.07 0.00 0.07 0.07 0.01 0.07 0.14 0.01 0.14
CNA55B 0.08 0.00 0.08 0.08 0.01 0.08 0.16 0.01 0.17
CNA750 0.02 0.00 0.02 0.02 0.01 0.02 0.04 0.01 0.05
DO228 0.01 0.00 0.01 0.01 0.00 0.01 0.02 0.00 0.02
ECLIPSE500 0.10 0.01 0.11 0.10 0.01 0.11 0.20 0.02 0.22
F10062 0.03 0.00 0.03 0.03 0.00 0.03 0.06 0.00 0.06
FAL20 0.00 0.00 0.00 0.00 0.00 0.00 0.00 0.00 0.00
GASEPF 0.03 0.00 0.03 0.03 0.00 0.03 0.06 0.00 0.06
GASEPV 0.91 0.01 0.92 0.92 0.00 0.92 1.82 0.01 1.84
GII 0.00 0.00 0.00 0.00 0.00 0.00 0.00 0.00 0.00
GIIB 0.00 0.00 0.00 0.00 0.00 0.00 0.00 0.00 0.00
GIV 0.08 0.01 0.09 0.09 0.00 0.09 0.17 0.01 0.18
GV 0.04 0.00 0.04 0.04 0.00 0.04 0.09 0.00 0.09
HS748A 0.01 0.00 0.01 0.01 0.00 0.01 0.01 0.00 0.01
IA1125 0.07 0.01 0.07 0.07 0.00 0.07 0.14 0.01 0.14
LEAR25 0.00 0.00 0.00 0.00 0.00 0.00 0.00 0.00 0.00
LEAR35 0.35 0.02 0.37 0.26 0.11 0.37 0.61 0.13 0.74
MU3001 0.46 0.02 0.47 0.41 0.06 0.47 0.87 0.08 0.95
PA28 0.02 0.00 0.02 0.02 0.00 0.02 0.04 0.00 0.04
PA31 0.04 0.00 0.04 0.04 0.00 0.04 0.09 0.00 0.09
SD330 0.01 0.00 0.01 0.01 0.00 0.01 0.01 0.00 0.01
SF340 0.01 0.00 0.01 0.01 0.00 0.01 0.01 0.00 0.01
GeneralAviationTotal
6.62 0.37 6.99 6.66 0.32 6.98 13.27 0.70 13.97
Military
CNA441 0.12 0.00 0.12 0.12 0.00 0.12 0.25 0.00 0.25
SD330 0.07 0.00 0.07 0.07 0.00 0.07 0.14 0.00 0.14
MilitaryTotal
0.19 0.00 0.19 0.19 0.00 0.19 0.39 0.00 0.39
Grand Total 7.26 0.38 7.64 7.28 0.35 7.63 14.55 0.73 15.28
Notes:Daytime operations arrive or depart between 7:00 a.m. and 9:59 p.m.; nighttime operations arrive or depart between 10:00 p.m. and6:59 a.m.
For documentation purposes, the numbers of operations are presented to a precision of two digits after the decimal point to shownumbers of operations that are greater than zero but less than 1.Totals may not add up due to rounding.
Prepared: HMMH Inc. August 2013
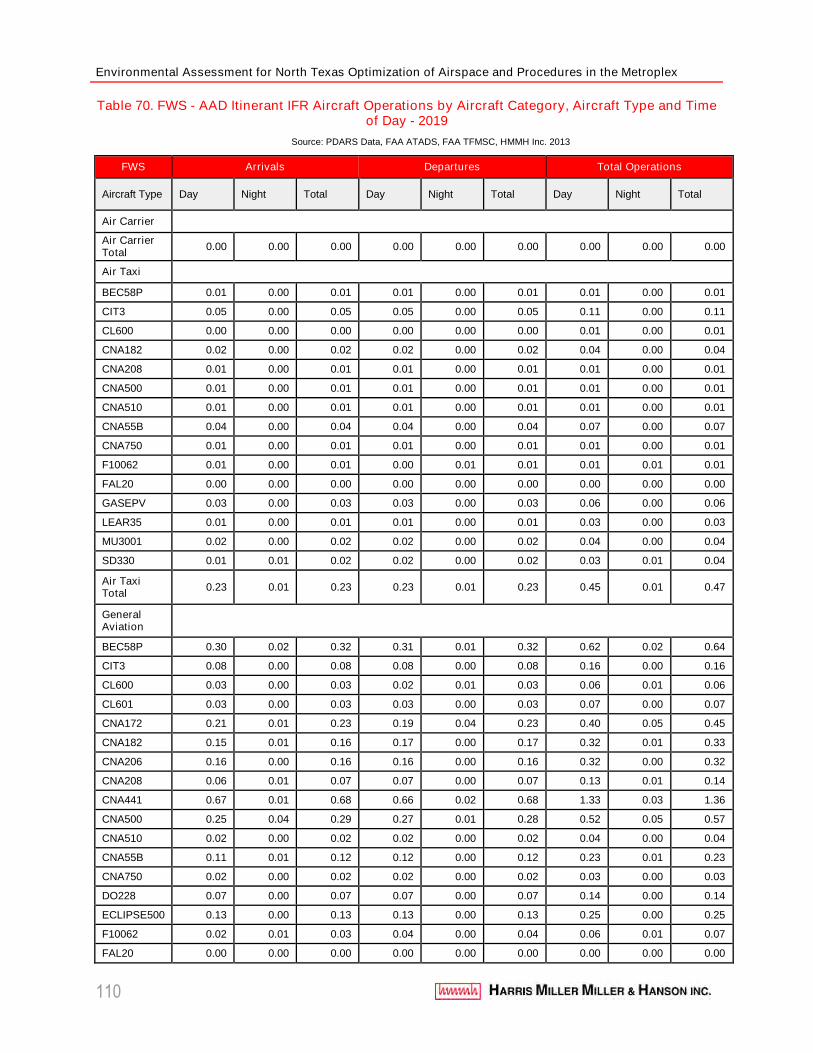
Environmental Assessment for North Texas Optimization of Airspace and Procedures in the Metroplex
110
Table 70. FWS - AAD Itinerant IFR Aircraft Operations by Aircraft Category, Aircraft Type and Timeof Day - 2019
Source: PDARS Data, FAA ATADS, FAA TFMSC, HMMH Inc. 2013
FWS Arrivals Departures Total Operations
Aircraft Type Day Night Total Day Night Total Day Night Total
Air Carrier
Air CarrierTotal
0.00 0.00 0.00 0.00 0.00 0.00 0.00 0.00 0.00
Air Taxi
BEC58P 0.01 0.00 0.01 0.01 0.00 0.01 0.01 0.00 0.01
CIT3 0.05 0.00 0.05 0.05 0.00 0.05 0.11 0.00 0.11
CL600 0.00 0.00 0.00 0.00 0.00 0.00 0.01 0.00 0.01
CNA182 0.02 0.00 0.02 0.02 0.00 0.02 0.04 0.00 0.04
CNA208 0.01 0.00 0.01 0.01 0.00 0.01 0.01 0.00 0.01
CNA500 0.01 0.00 0.01 0.01 0.00 0.01 0.01 0.00 0.01
CNA510 0.01 0.00 0.01 0.01 0.00 0.01 0.01 0.00 0.01
CNA55B 0.04 0.00 0.04 0.04 0.00 0.04 0.07 0.00 0.07
CNA750 0.01 0.00 0.01 0.01 0.00 0.01 0.01 0.00 0.01
F10062 0.01 0.00 0.01 0.00 0.01 0.01 0.01 0.01 0.01
FAL20 0.00 0.00 0.00 0.00 0.00 0.00 0.00 0.00 0.00
GASEPV 0.03 0.00 0.03 0.03 0.00 0.03 0.06 0.00 0.06
LEAR35 0.01 0.00 0.01 0.01 0.00 0.01 0.03 0.00 0.03
MU3001 0.02 0.00 0.02 0.02 0.00 0.02 0.04 0.00 0.04
SD330 0.01 0.01 0.02 0.02 0.00 0.02 0.03 0.01 0.04
Air TaxiTotal
0.23 0.01 0.23 0.23 0.01 0.23 0.45 0.01 0.47
GeneralAviation
BEC58P 0.30 0.02 0.32 0.31 0.01 0.32 0.62 0.02 0.64
CIT3 0.08 0.00 0.08 0.08 0.00 0.08 0.16 0.00 0.16
CL600 0.03 0.00 0.03 0.02 0.01 0.03 0.06 0.01 0.06
CL601 0.03 0.00 0.03 0.03 0.00 0.03 0.07 0.00 0.07
CNA172 0.21 0.01 0.23 0.19 0.04 0.23 0.40 0.05 0.45
CNA182 0.15 0.01 0.16 0.17 0.00 0.17 0.32 0.01 0.33
CNA206 0.16 0.00 0.16 0.16 0.00 0.16 0.32 0.00 0.32
CNA208 0.06 0.01 0.07 0.07 0.00 0.07 0.13 0.01 0.14
CNA441 0.67 0.01 0.68 0.66 0.02 0.68 1.33 0.03 1.36
CNA500 0.25 0.04 0.29 0.27 0.01 0.28 0.52 0.05 0.57
CNA510 0.02 0.00 0.02 0.02 0.00 0.02 0.04 0.00 0.04
CNA55B 0.11 0.01 0.12 0.12 0.00 0.12 0.23 0.01 0.23
CNA750 0.02 0.00 0.02 0.02 0.00 0.02 0.03 0.00 0.03
DO228 0.07 0.00 0.07 0.07 0.00 0.07 0.14 0.00 0.14
ECLIPSE500 0.13 0.00 0.13 0.13 0.00 0.13 0.25 0.00 0.25
F10062 0.02 0.01 0.03 0.04 0.00 0.04 0.06 0.01 0.07
FAL20 0.00 0.00 0.00 0.00 0.00 0.00 0.00 0.00 0.00
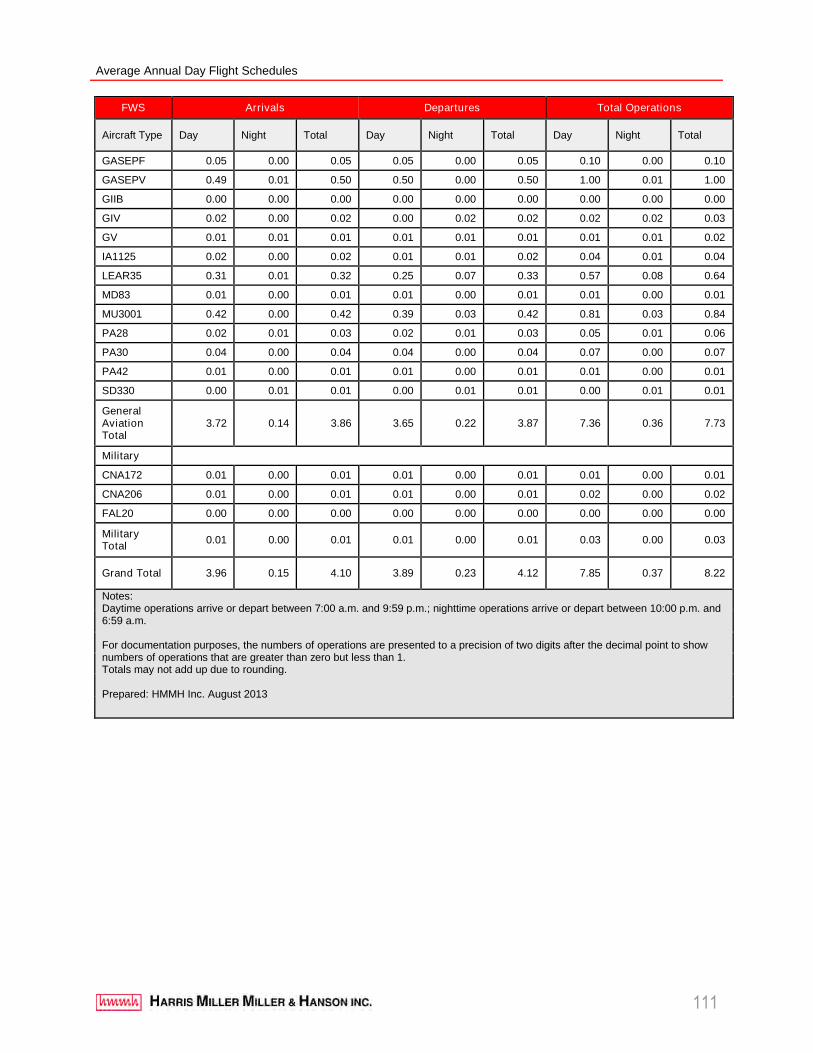
Average Annual Day Flight Schedules
111
FWS Arrivals Departures Total Operations
Aircraft Type Day Night Total Day Night Total Day Night Total
GASEPF 0.05 0.00 0.05 0.05 0.00 0.05 0.10 0.00 0.10
GASEPV 0.49 0.01 0.50 0.50 0.00 0.50 1.00 0.01 1.00
GIIB 0.00 0.00 0.00 0.00 0.00 0.00 0.00 0.00 0.00
GIV 0.02 0.00 0.02 0.00 0.02 0.02 0.02 0.02 0.03
GV 0.01 0.01 0.01 0.01 0.01 0.01 0.01 0.01 0.02
IA1125 0.02 0.00 0.02 0.01 0.01 0.02 0.04 0.01 0.04
LEAR35 0.31 0.01 0.32 0.25 0.07 0.33 0.57 0.08 0.64
MD83 0.01 0.00 0.01 0.01 0.00 0.01 0.01 0.00 0.01
MU3001 0.42 0.00 0.42 0.39 0.03 0.42 0.81 0.03 0.84
PA28 0.02 0.01 0.03 0.02 0.01 0.03 0.05 0.01 0.06
PA30 0.04 0.00 0.04 0.04 0.00 0.04 0.07 0.00 0.07
PA42 0.01 0.00 0.01 0.01 0.00 0.01 0.01 0.00 0.01
SD330 0.00 0.01 0.01 0.00 0.01 0.01 0.00 0.01 0.01
GeneralAviationTotal
3.72 0.14 3.86 3.65 0.22 3.87 7.36 0.36 7.73
Military
CNA172 0.01 0.00 0.01 0.01 0.00 0.01 0.01 0.00 0.01
CNA206 0.01 0.00 0.01 0.01 0.00 0.01 0.02 0.00 0.02
FAL20 0.00 0.00 0.00 0.00 0.00 0.00 0.00 0.00 0.00
MilitaryTotal
0.01 0.00 0.01 0.01 0.00 0.01 0.03 0.00 0.03
Grand Total 3.96 0.15 4.10 3.89 0.23 4.12 7.85 0.37 8.22
Notes:Daytime operations arrive or depart between 7:00 a.m. and 9:59 p.m.; nighttime operations arrive or depart between 10:00 p.m. and6:59 a.m.
For documentation purposes, the numbers of operations are presented to a precision of two digits after the decimal point to shownumbers of operations that are greater than zero but less than 1.Totals may not add up due to rounding.
Prepared: HMMH Inc. August 2013
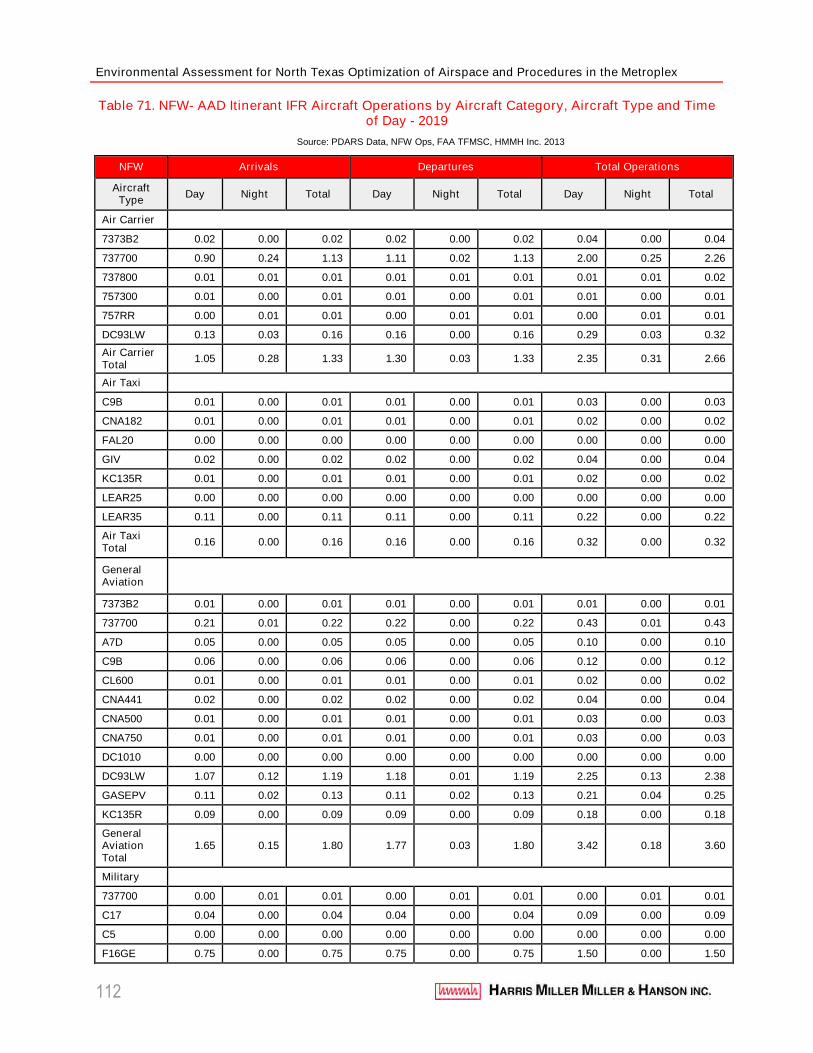
Environmental Assessment for North Texas Optimization of Airspace and Procedures in the Metroplex
112
Table 71. NFW- AAD Itinerant IFR Aircraft Operations by Aircraft Category, Aircraft Type and Timeof Day - 2019
Source: PDARS Data, NFW Ops, FAA TFMSC, HMMH Inc. 2013
NFW Arrivals Departures Total Operations
AircraftType
Day Night Total Day Night Total Day Night Total
Air Carrier
7373B2 0.02 0.00 0.02 0.02 0.00 0.02 0.04 0.00 0.04
737700 0.90 0.24 1.13 1.11 0.02 1.13 2.00 0.25 2.26
737800 0.01 0.01 0.01 0.01 0.01 0.01 0.01 0.01 0.02
757300 0.01 0.00 0.01 0.01 0.00 0.01 0.01 0.00 0.01
757RR 0.00 0.01 0.01 0.00 0.01 0.01 0.00 0.01 0.01
DC93LW 0.13 0.03 0.16 0.16 0.00 0.16 0.29 0.03 0.32
Air CarrierTotal
1.05 0.28 1.33 1.30 0.03 1.33 2.35 0.31 2.66
Air Taxi
C9B 0.01 0.00 0.01 0.01 0.00 0.01 0.03 0.00 0.03
CNA182 0.01 0.00 0.01 0.01 0.00 0.01 0.02 0.00 0.02
FAL20 0.00 0.00 0.00 0.00 0.00 0.00 0.00 0.00 0.00
GIV 0.02 0.00 0.02 0.02 0.00 0.02 0.04 0.00 0.04
KC135R 0.01 0.00 0.01 0.01 0.00 0.01 0.02 0.00 0.02
LEAR25 0.00 0.00 0.00 0.00 0.00 0.00 0.00 0.00 0.00
LEAR35 0.11 0.00 0.11 0.11 0.00 0.11 0.22 0.00 0.22
Air TaxiTotal
0.16 0.00 0.16 0.16 0.00 0.16 0.32 0.00 0.32
GeneralAviation
7373B2 0.01 0.00 0.01 0.01 0.00 0.01 0.01 0.00 0.01
737700 0.21 0.01 0.22 0.22 0.00 0.22 0.43 0.01 0.43
A7D 0.05 0.00 0.05 0.05 0.00 0.05 0.10 0.00 0.10
C9B 0.06 0.00 0.06 0.06 0.00 0.06 0.12 0.00 0.12
CL600 0.01 0.00 0.01 0.01 0.00 0.01 0.02 0.00 0.02
CNA441 0.02 0.00 0.02 0.02 0.00 0.02 0.04 0.00 0.04
CNA500 0.01 0.00 0.01 0.01 0.00 0.01 0.03 0.00 0.03
CNA750 0.01 0.00 0.01 0.01 0.00 0.01 0.03 0.00 0.03
DC1010 0.00 0.00 0.00 0.00 0.00 0.00 0.00 0.00 0.00
DC93LW 1.07 0.12 1.19 1.18 0.01 1.19 2.25 0.13 2.38
GASEPV 0.11 0.02 0.13 0.11 0.02 0.13 0.21 0.04 0.25
KC135R 0.09 0.00 0.09 0.09 0.00 0.09 0.18 0.00 0.18
GeneralAviationTotal
1.65 0.15 1.80 1.77 0.03 1.80 3.42 0.18 3.60
Military
737700 0.00 0.01 0.01 0.00 0.01 0.01 0.00 0.01 0.01
C17 0.04 0.00 0.04 0.04 0.00 0.04 0.09 0.00 0.09
C5 0.00 0.00 0.00 0.00 0.00 0.00 0.00 0.00 0.00
F16GE 0.75 0.00 0.75 0.75 0.00 0.75 1.50 0.00 1.50
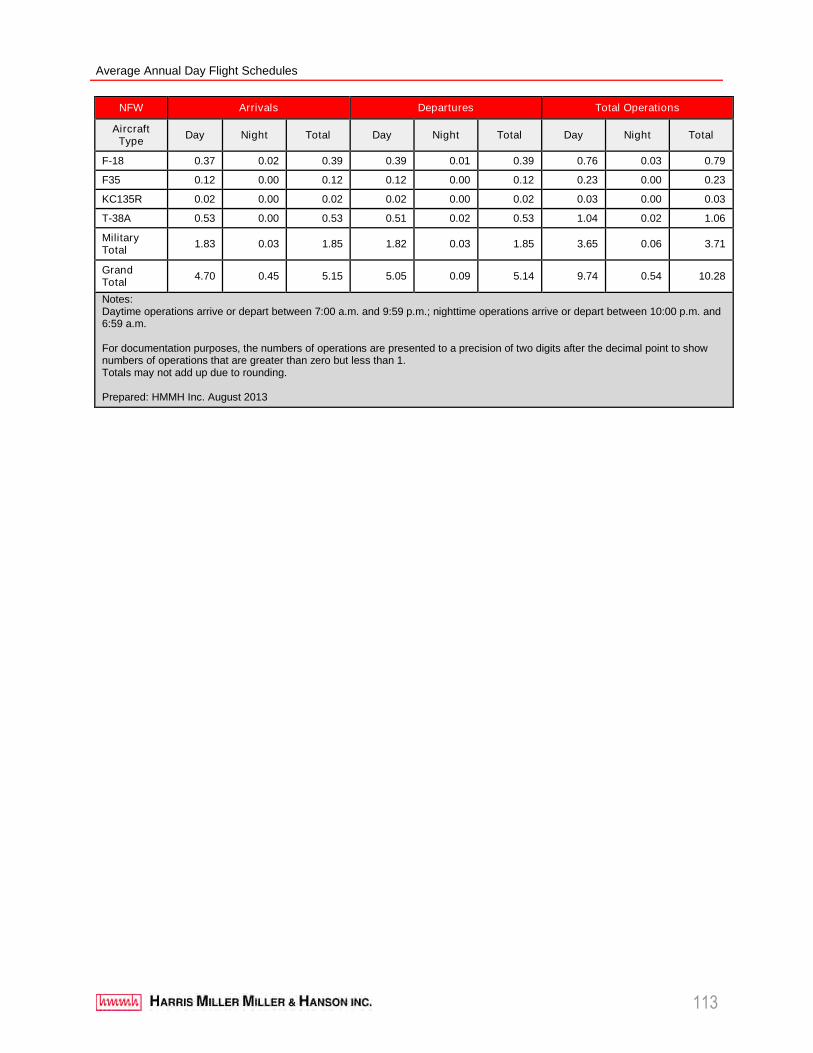
Average Annual Day Flight Schedules
113
NFW Arrivals Departures Total Operations
AircraftType
Day Night Total Day Night Total Day Night Total
F-18 0.37 0.02 0.39 0.39 0.01 0.39 0.76 0.03 0.79
F35 0.12 0.00 0.12 0.12 0.00 0.12 0.23 0.00 0.23
KC135R 0.02 0.00 0.02 0.02 0.00 0.02 0.03 0.00 0.03
T-38A 0.53 0.00 0.53 0.51 0.02 0.53 1.04 0.02 1.06
MilitaryTotal
1.83 0.03 1.85 1.82 0.03 1.85 3.65 0.06 3.71
GrandTotal
4.70 0.45 5.15 5.05 0.09 5.14 9.74 0.54 10.28
Notes:Daytime operations arrive or depart between 7:00 a.m. and 9:59 p.m.; nighttime operations arrive or depart between 10:00 p.m. and6:59 a.m.
For documentation purposes, the numbers of operations are presented to a precision of two digits after the decimal point to shownumbers of operations that are greater than zero but less than 1.Totals may not add up due to rounding.
Prepared: HMMH Inc. August 2013