Environmental and psychosocial correlates of physical activity in Portuguese and Belgian adults
10
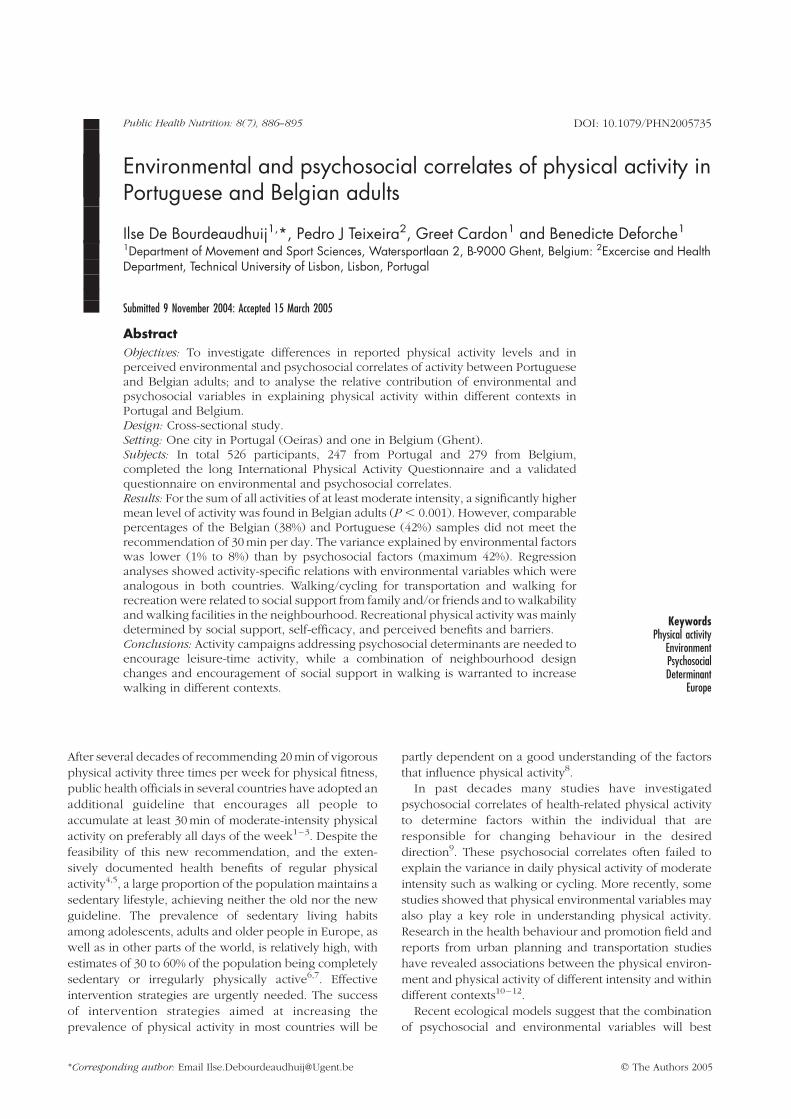
Environmental and psychosocial correlates of physical activity in Portuguese and Belgian adults Ilse De Bourdeaudhuij 1, *, Pedro J Teixeira 2 , Greet Cardon 1 and Benedicte Deforche 1 1 Department of Movement and Sport Sciences, Watersportlaan 2, B-9000 Ghent, Belgium: 2 Excercise and Health Department, Technical University of Lisbon, Lisbon, Portugal Submitted 9 November 2004: Accepted 15 March 2005 Abstract Objectives: To investigate differences in reported physical activity levels and in perceived environmental and psychosocial correlates of activity between Portuguese and Belgian adults; and to analyse the relative contribution of environmental and psychosocial variables in explaining physical activity within different contexts in Portugal and Belgium. Design: Cross-sectional study. Setting: One city in Portugal (Oeiras) and one in Belgium (Ghent). Subjects: In total 526 participants, 247 from Portugal and 279 from Belgium, completed the long International Physical Activity Questionnaire and a validated questionnaire on environmental and psychosocial correlates. Results: For the sum of all activities of at least moderate intensity, a significantly higher mean level of activity was found in Belgian adults (P , 0.001). However, comparable percentages of the Belgian (38%) and Portuguese (42%) samples did not meet the recommendation of 30 min per day. The variance explained by environmental factors was lower (1% to 8%) than by psychosocial factors (maximum 42%). Regression analyses showed activity-specific relations with environmental variables which were analogous in both countries. Walking/cycling for transportation and walking for recreation were related to social support from family and/or friends and to walkability and walking facilities in the neighbourhood. Recreational physical activity was mainly determined by social support, self-efficacy, and perceived benefits and barriers. Conclusions: Activity campaigns addressing psychosocial determinants are needed to encourage leisure-time activity, while a combination of neighbourhood design changes and encouragement of social support in walking is warranted to increase walking in different contexts. Keywords Physical activity Environment Psychosocial Determinant Europe After several decades of recommending 20 min of vigorous physical activity three times per week for physical fitness, public health officials in several countries have adopted an additional guideline that encourages all people to accumulate at least 30 min of moderate-intensity physical activity on preferably all days of the week 1–3 . Despite the feasibility of this new recommendation, and the exten- sively documented health benefits of regular physical activity 4,5 , a large proportion of the population maintains a sedentary lifestyle, achieving neither the old nor the new guideline. The prevalence of sedentary living habits among adolescents, adults and older people in Europe, as well as in other parts of the world, is relatively high, with estimates of 30 to 60% of the population being completely sedentary or irregularly physically active 6,7 . Effective intervention strategies are urgently needed. The success of intervention strategies aimed at increasing the prevalence of physical activity in most countries will be partly dependent on a good understanding of the factors that influence physical activity 8 . In past decades many studies have investigated psychosocial correlates of health-related physical activity to determine factors within the individual that are responsible for changing behaviour in the desired direction 9 . These psychosocial correlates often failed to explain the variance in daily physical activity of moderate intensity such as walking or cycling. More recently, some studies showed that physical environmental variables may also play a key role in understanding physical activity. Research in the health behaviour and promotion field and reports from urban planning and transportation studies have revealed associations between the physical environ- ment and physical activity of different intensity and within different contexts 10–12 . Recent ecological models suggest that the combination of psychosocial and environmental variables will best q The Authors 2005 *Corresponding author: Email [email protected] Public Health Nutrition: 8(7), 886–895 DOI: 10.1079/PHN2005735
Transcript of Environmental and psychosocial correlates of physical activity in Portuguese and Belgian adults
Environmental and psychosocial correlates of physical activity inPortuguese and Belgian adults
Ilse De Bourdeaudhuij1,*, Pedro J Teixeira2, Greet Cardon1 and Benedicte Deforche11Department of Movement and Sport Sciences, Watersportlaan 2, B-9000 Ghent, Belgium: 2Excercise and HealthDepartment, Technical University of Lisbon, Lisbon, Portugal
Submitted 9 November 2004: Accepted 15 March 2005
Abstract
Objectives: To investigate differences in reported physical activity levels and inperceived environmental and psychosocial correlates of activity between Portugueseand Belgian adults; and to analyse the relative contribution of environmental andpsychosocial variables in explaining physical activity within different contexts inPortugal and Belgium.Design: Cross-sectional study.Setting: One city in Portugal (Oeiras) and one in Belgium (Ghent).Subjects: In total 526 participants, 247 from Portugal and 279 from Belgium,completed the long International Physical Activity Questionnaire and a validatedquestionnaire on environmental and psychosocial correlates.Results: For the sum of all activities of at least moderate intensity, a significantly highermean level of activity was found in Belgian adults (P , 0.001). However, comparablepercentages of the Belgian (38%) and Portuguese (42%) samples did not meet therecommendation of 30 min per day. The variance explained by environmental factorswas lower (1% to 8%) than by psychosocial factors (maximum 42%). Regressionanalyses showed activity-specific relations with environmental variables which wereanalogous in both countries. Walking/cycling for transportation and walking forrecreation were related to social support from family and/or friends and to walkabilityand walking facilities in the neighbourhood. Recreational physical activity was mainlydetermined by social support, self-efficacy, and perceived benefits and barriers.Conclusions: Activity campaigns addressing psychosocial determinants are needed toencourage leisure-time activity, while a combination of neighbourhood designchanges and encouragement of social support in walking is warranted to increasewalking in different contexts.
KeywordsPhysical activity
EnvironmentPsychosocialDeterminant
Europe
After several decades of recommending 20 min of vigorous
physical activity three times per week for physical fitness,
public health officials in several countries have adopted an
additional guideline that encourages all people to
accumulate at least 30 min of moderate-intensity physical
activity on preferably all days of the week1–3. Despite the
feasibility of this new recommendation, and the exten-
sively documented health benefits of regular physical
activity4,5, a large proportion of the population maintains a
sedentary lifestyle, achieving neither the old nor the new
guideline. The prevalence of sedentary living habits
among adolescents, adults and older people in Europe, as
well as in other parts of the world, is relatively high, with
estimates of 30 to 60% of the population being completely
sedentary or irregularly physically active6,7. Effective
intervention strategies are urgently needed. The success
of intervention strategies aimed at increasing the
prevalence of physical activity in most countries will be
partly dependent on a good understanding of the factors
that influence physical activity8.
In past decades many studies have investigated
psychosocial correlates of health-related physical activity
to determine factors within the individual that are
responsible for changing behaviour in the desired
direction9. These psychosocial correlates often failed to
explain the variance in daily physical activity of moderate
intensity such as walking or cycling. More recently, some
studies showed that physical environmental variables may
also play a key role in understanding physical activity.
Research in the health behaviour and promotion field and
reports from urban planning and transportation studies
have revealed associations between the physical environ-
ment and physical activity of different intensity and within
different contexts10–12.
Recent ecological models suggest that the combination
of psychosocial and environmental variables will best
q The Authors 2005*Corresponding author: Email [email protected]
Public Health Nutrition: 8(7), 886–895 DOI: 10.1079/PHN2005735
explain physical activity13. As attributes associated with
walking for exercise are different from those associated
with walking for transportation12 or from sports activities14,
the relative contribution of psychosocial and environmen-
tal variables in explaining activities of different intensities
and within different contexts should be studied15.
Most studies on the environmental correlates of physical
activity have been conducted in the USA and Australia.
However, there is a need to examine the great variation in
environmental factors related to physical activity across
countries. To our knowledge, only very few studies have
lookedat these relationships in Europe16,17. Although results
of European studies on the psychosocial correlates of
physical activity were very similar to findings from the USA,
Australia and Canada18, the physical environment in Europe
is very different from that in these other parts of the world. In
thepresentpaper, the relationshipbetween theenvironment
and physical activity is studied in one country of middle
Europe (Belgium) and one of southern Europe (Portugal).
Previous studies showed that both countries have relatively
low levels of physical activity19,20. However, this was only
true for vigorous activities, as half of the population did
report regular moderate activities and walking21.
The aims of the present study were (1) to investigate
differences in reported physical activity levels and in
perceived environmental and psychosocial correlates of
activity between Portuguese and Belgian adults, and (2) to
analyse the relative contribution of environmental and
psychosocial variables in explaining physical activity
within different contexts in Portugal and Belgium.
Method
Sample and procedure
Participants were recruited in a city in Portugal (Oeiras) and
one in Belgium (Ghent). Oeiras is located about 20 km
north of Lisbon, it has about 162 000 inhabitants and covers
46 km2, having a population density of about 3500
inhabitants per km2. Ghent is located in the middle of the
Dutch-speaking part of Belgium (north), it has about
224 000 inhabitants, covers 150 km2 and has a population
density of about 1500 inhabitants per km2. Both cities have
a city centre, suburbs and a more rural part. A convenience
sample of adults was drawn through worksites, libraries
and socio-cultural societies. The researchers recruited
participants at the site, explained the rationale of the study
to them and gave them a questionnaire to complete in the
coming week. After one week the questionnaires were
collected personally at the site. This personal approach was
used to increase participation and make the sample
more representative. The final sample consisted of 526
participants, 247 from Portugal and 279 from Belgium.
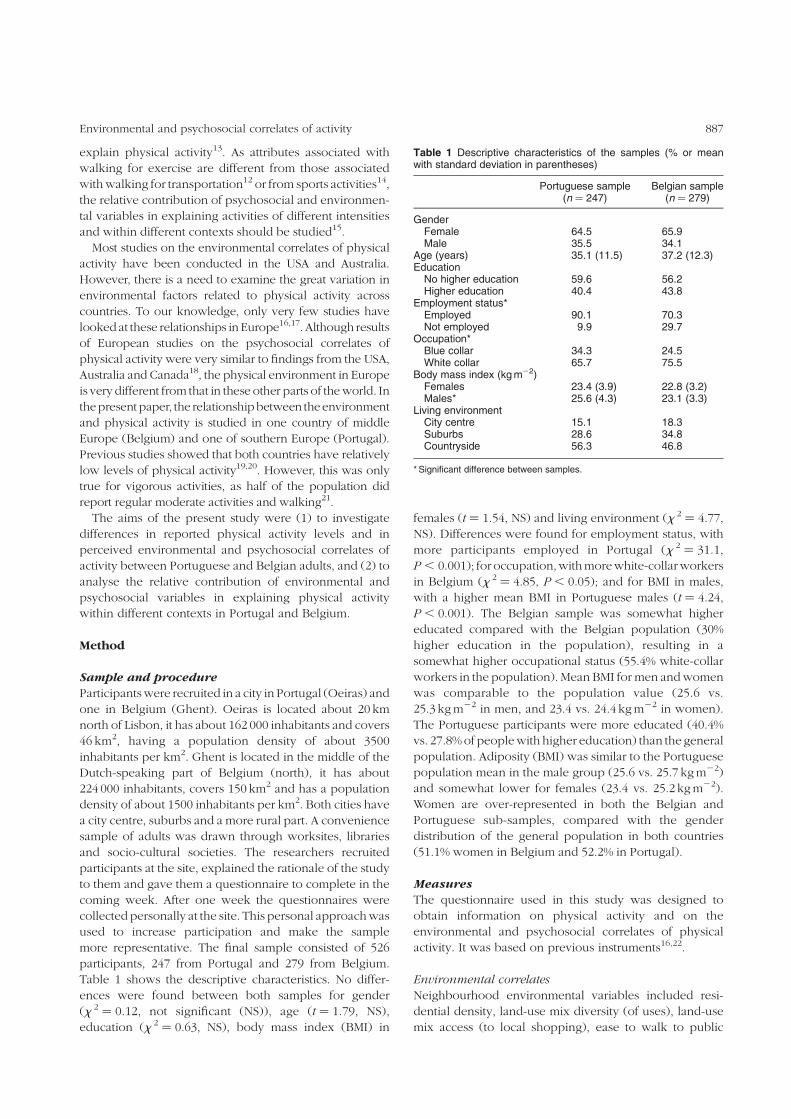
Table 1 shows the descriptive characteristics. No differ-
ences were found between both samples for gender
(x 2 ¼ 0.12, not significant (NS)), age (t ¼ 1.79, NS),
education (x 2 ¼ 0.63, NS), body mass index (BMI) in
females (t ¼ 1.54, NS) and living environment (x 2 ¼ 4.77,
NS). Differences were found for employment status, with
more participants employed in Portugal (x 2 ¼ 31.1,
P , 0.001); for occupation,withmorewhite-collarworkers
in Belgium (x 2 ¼ 4.85, P , 0.05); and for BMI in males,
with a higher mean BMI in Portuguese males (t ¼ 4.24,
P , 0.001). The Belgian sample was somewhat higher
educated compared with the Belgian population (30%
higher education in the population), resulting in a
somewhat higher occupational status (55.4% white-collar
workers in the population). Mean BMI for men and women
was comparable to the population value (25.6 vs.
25.3 kg m22 in men, and 23.4 vs. 24.4 kg m22 in women).
The Portuguese participants were more educated (40.4%
vs. 27.8% of people with higher education) than the general
population. Adiposity (BMI) was similar to the Portuguese
population mean in the male group (25.6 vs. 25.7 kg m22)
and somewhat lower for females (23.4 vs. 25.2 kg m22).
Women are over-represented in both the Belgian and
Portuguese sub-samples, compared with the gender
distribution of the general population in both countries
(51.1% women in Belgium and 52.2% in Portugal).
Measures
The questionnaire used in this study was designed to
obtain information on physical activity and on the
environmental and psychosocial correlates of physical
activity. It was based on previous instruments16,22.
Environmental correlates
Neighbourhood environmental variables included resi-
dential density, land-use mix diversity (of uses), land-use
mix access (to local shopping), ease to walk to public
Table 1 Descriptive characteristics of the samples (% or meanwith standard deviation in parentheses)
Portuguese sample(n ¼ 247)
Belgian sample(n ¼ 279)
GenderFemale 64.5 65.9Male 35.5 34.1
Age (years) 35.1 (11.5) 37.2 (12.3)Education
No higher education 59.6 56.2Higher education 40.4 43.8
Employment status*Employed 90.1 70.3Not employed 9.9 29.7
Occupation*Blue collar 34.3 24.5White collar 65.7 75.5
Body mass index (kg m22)Females 23.4 (3.9) 22.8 (3.2)Males* 25.6 (4.3) 23.1 (3.3)
Living environmentCity centre 15.1 18.3Suburbs 28.6 34.8Countryside 56.3 46.8
* Significant difference between samples.
Environmental and psychosocial correlates of activity 887
transportation stop, availability of sidewalks, availability of
bike lanes, neighbourhood aesthetics, perceived safety
from crime, perceived safety from traffic, connectivity of
the street network, satisfaction with neighbourhood
services and emotional satisfaction with neighbourhood.
In addition, environmental factors believed to be related
mainly to recreational physical activity included charac-
teristics of the worksite environment, physical activity
supplies in the home environment and convenience of
physical activity facilities. A separate study was executed
to assess reliability and validity of the environmental
questionnaire in a Belgian sample. The scales, scale
composition, items and response categories are also
reported in this separate study. The questionnaire showed
acceptable to good reliability and acceptable validity16.
Psychosocial correlates
Four major categories of psychosocial correlates were
included in this study: social variables, self-efficacy,
perceived benefits and perceived barriers. To measure
social variables, scores were calculated for modelling, social
normand social support from family and friends, scoredona
5-point rating scale. Principal components analysis revealed
two self-efficacy factors, one including self-efficacy towards
internal barriers (e.g. if you are tired) and one including self-
efficacy towards external barriers (e.g. if family or friends
need help). The items were scored on a 3-point rating scale.
Principal components analysis resulted in a six-factor
structure for perceived benefits (measured by the sub-
categories: competition, appearance, psychological, health,
pleasure and social) and a five-factor structure for perceived
barriers (measured by the subcategories: external obstacles,
lack of time, lack of interest, psychological and health
problems), scored on a 5-point rating scale.
Cronbach’s a of scales was moderate to high in both
countries for social variables (ranging from 0.58 to 0.92),
self-efficacy (ranging from 0.80 to 0.86), perceived
benefits (ranging from 0.61 to 0.83) and perceived barriers
(ranging from 0.50 to 0.80). A pilot study showed good
reliability and validity of the measures of the four major
categories of psychosocial variables23.
Physical activity
To obtain information on physical activity, the Inter-
national Physical Activity Questionnaire (IPAQ) was used.
Validity and reliability results demonstrated that the IPAQ
has comparable reliability and validity to other self-report
measures24,25. The long usual week version of the IPAQ
was chosen to provide more detailed information on
physical activity in different settings. Minutes of physical
activity of different intensity and within different contexts
were computed for a usual week (see Craig et al.25 for
further details).
Demographic variables included gender, age, edu-
cation, employment status, occupation, living environ-
ment, weight and height.
The questionnaires were translated using a translation
and back-translation protocol with English as the original
language.
Statistical analyses
Analyses were carried out using SPSS 11.5 software (SPSS
Inc., Chicago, IL, USA). Independent samples t-tests were
carried out to analyse differences in physical activity and
environmental and psychosocial variables between the
Portuguese and Belgian samples. For the t-tests, the
P-value was set at 0.01 to balance between type 1 and type
2 errors for multiple testing on correlated variables.
Before running the regression analyses, all variables with
non-significant bivariate correlations with a given type of
physical activity were omitted. Next, intercorrelations were
computed between all selected predictors. For predictors
showing intercorrelations higher than 0.50, only the
predictor with the highest bivariate correlation with the
criterionwaskept, theotherswere removed from themodel
to reduce multicollinearity. Multiple regression analyses
were executed within both countries, to determine the
variance explained in four dependent variables: active
transport, walking in leisure time, moderate to vigorous
activity in leisure time, and total physical activity of at least
moderate intensity. Demographic variables (gender, age
and education) were always entered as the first block in the
regressions. Two series of multiple regressions were run. In
the first series, environmental variables were included as a
second block in the regression, followed by the psycho-
social variables. This allows first an estimation of the
contribution of the environmental variables, and second an
estimation of the contribution of the psychosocial variables
beyond the variance accounted for by environmental
variables. In the second series, psychosocial variables were
included as a second block in the regression, followed by
the environmental variables, estimating the contribution of
the environmental variables beyond the variance
accounted for by psychosocial variables. The reverse
sequence of variable blocks in the two analyses gives more
specific information about the relative importance of both
groups of variables for physical activities within different
contexts which can be used in guiding public health
interventions. The tables present the semi-partial corre-
lations, along with the adjusted R 2 values. Conforming to
similar studies16,18,26–28, a logarithmic transformation was
used to improve the normality of the distribution for the
dependent variables. A P-value of#0.05 was considered to
be significant.
Results
Differences in physical activity
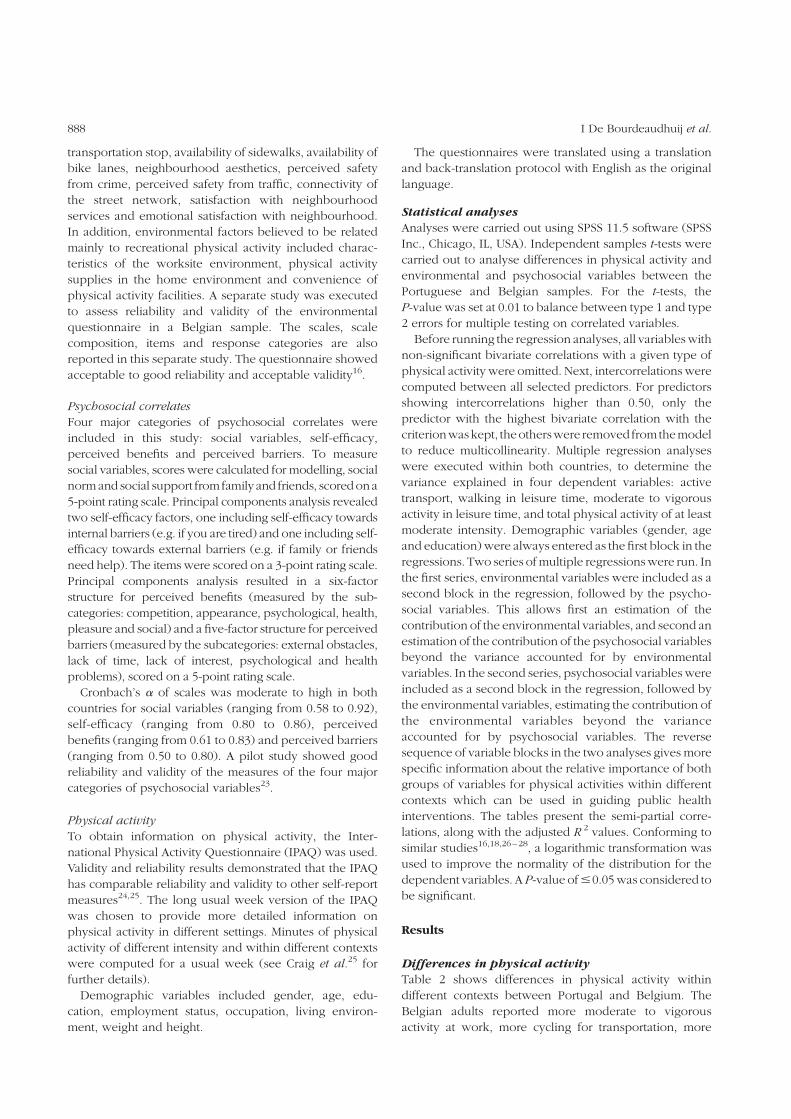
Table 2 shows differences in physical activity within
different contexts between Portugal and Belgium. The
Belgian adults reported more moderate to vigorous
activity at work, more cycling for transportation, more
I De Bourdeaudhuij et al.888
moderate to vigorous activity in the garden, and more
moderate activity in leisure time (all P , 0.001). The
Portuguese adults reported more walking for transpor-
tation (P , 0.001). No differences were found for the sum
of all active transport, for the sum of all moderate to
vigorous activity in leisure time, and for the total number
of minutes sitting per week. For the total sum of all
activities of at least moderate intensity, a significantly
higher mean level of activity was found in the Belgian
adults (P , 0.001). However, a comparable percentage of
the Belgian (38%) and Portuguese (42%) sample did not
meet the recommendation of 30 min of physical activity of
at least moderate intensity per day.
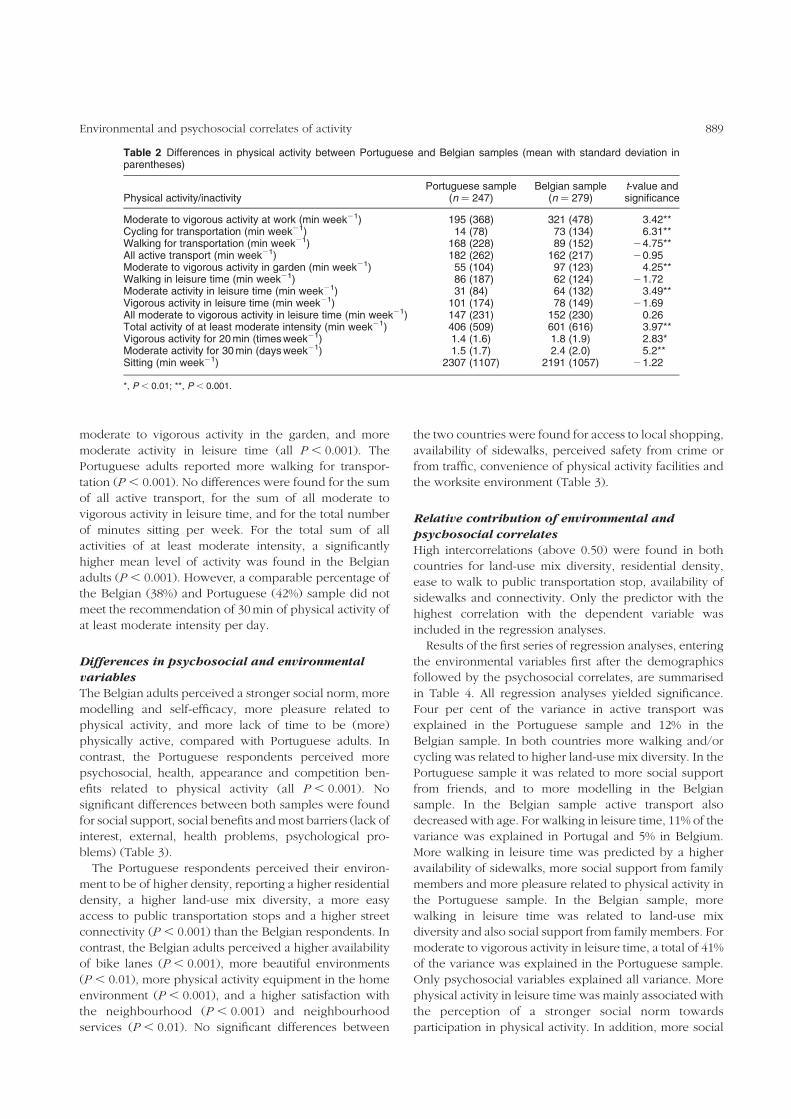
Differences in psychosocial and environmental
variables
The Belgian adults perceived a stronger social norm, more
modelling and self-efficacy, more pleasure related to
physical activity, and more lack of time to be (more)
physically active, compared with Portuguese adults. In
contrast, the Portuguese respondents perceived more
psychosocial, health, appearance and competition ben-
efits related to physical activity (all P , 0.001). No
significant differences between both samples were found
for social support, social benefits and most barriers (lack of
interest, external, health problems, psychological pro-
blems) (Table 3).
The Portuguese respondents perceived their environ-
ment to be of higher density, reporting a higher residential
density, a higher land-use mix diversity, a more easy
access to public transportation stops and a higher street
connectivity (P , 0.001) than the Belgian respondents. In
contrast, the Belgian adults perceived a higher availability
of bike lanes (P , 0.001), more beautiful environments
(P , 0.01), more physical activity equipment in the home
environment (P , 0.001), and a higher satisfaction with
the neighbourhood (P , 0.001) and neighbourhood
services (P , 0.01). No significant differences between
the two countries were found for access to local shopping,
availability of sidewalks, perceived safety from crime or
from traffic, convenience of physical activity facilities and
the worksite environment (Table 3).
Relative contribution of environmental and
psychosocial correlates
High intercorrelations (above 0.50) were found in both
countries for land-use mix diversity, residential density,
ease to walk to public transportation stop, availability of
sidewalks and connectivity. Only the predictor with the
highest correlation with the dependent variable was
included in the regression analyses.
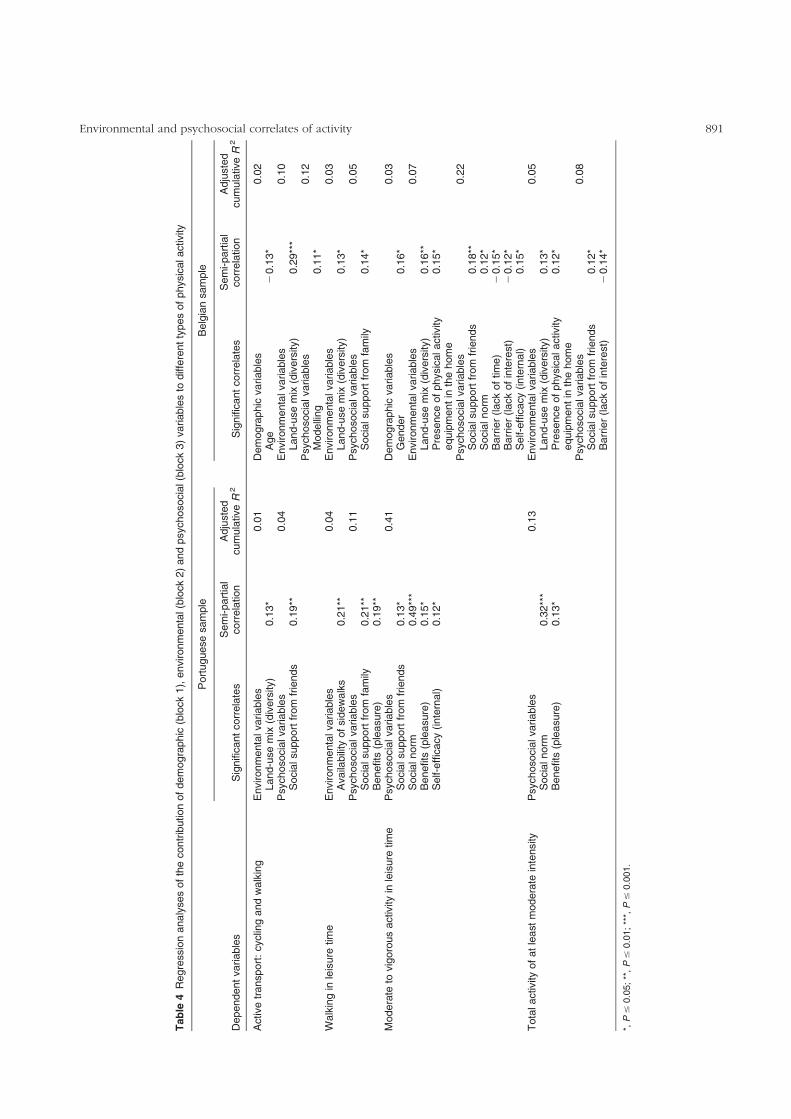
Results of the first series of regression analyses, entering
the environmental variables first after the demographics
followed by the psychosocial correlates, are summarised
in Table 4. All regression analyses yielded significance.
Four per cent of the variance in active transport was
explained in the Portuguese sample and 12% in the
Belgian sample. In both countries more walking and/or
cycling was related to higher land-use mix diversity. In the
Portuguese sample it was related to more social support
from friends, and to more modelling in the Belgian
sample. In the Belgian sample active transport also
decreased with age. For walking in leisure time, 11% of the
variance was explained in Portugal and 5% in Belgium.
More walking in leisure time was predicted by a higher
availability of sidewalks, more social support from family
members and more pleasure related to physical activity in
the Portuguese sample. In the Belgian sample, more
walking in leisure time was related to land-use mix
diversity and also social support from family members. For
moderate to vigorous activity in leisure time, a total of 41%
of the variance was explained in the Portuguese sample.
Only psychosocial variables explained all variance. More
physical activity in leisure time was mainly associated with
the perception of a stronger social norm towards
participation in physical activity. In addition, more social
Table 2 Differences in physical activity between Portuguese and Belgian samples (mean with standard deviation inparentheses)
Physical activity/inactivityPortuguese sample
(n ¼ 247)Belgian sample
(n ¼ 279)t-value andsignificance
Moderate to vigorous activity at work (min week21) 195 (368) 321 (478) 3.42**Cycling for transportation (min week21) 14 (78) 73 (134) 6.31**Walking for transportation (min week21) 168 (228) 89 (152) 24.75**All active transport (min week21) 182 (262) 162 (217) 20.95Moderate to vigorous activity in garden (min week21) 55 (104) 97 (123) 4.25**Walking in leisure time (min week21) 86 (187) 62 (124) 21.72Moderate activity in leisure time (min week21) 31 (84) 64 (132) 3.49**Vigorous activity in leisure time (min week21) 101 (174) 78 (149) 21.69All moderate to vigorous activity in leisure time (min week21) 147 (231) 152 (230) 0.26Total activity of at least moderate intensity (min week21) 406 (509) 601 (616) 3.97**Vigorous activity for 20 min (times week21) 1.4 (1.6) 1.8 (1.9) 2.83*Moderate activity for 30 min (days week21) 1.5 (1.7) 2.4 (2.0) 5.2**Sitting (min week21) 2307 (1107) 2191 (1057) 21.22
*, P , 0.01; **, P , 0.001.
Environmental and psychosocial correlates of activity 889
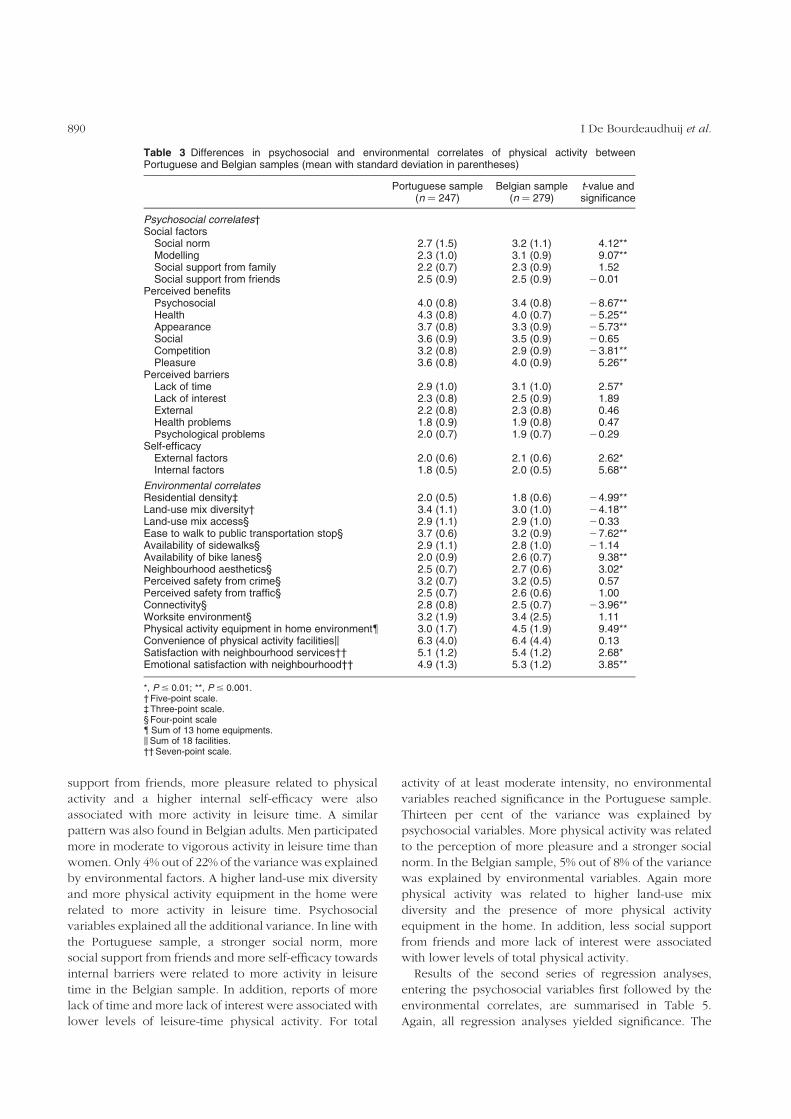
support from friends, more pleasure related to physical
activity and a higher internal self-efficacy were also
associated with more activity in leisure time. A similar
pattern was also found in Belgian adults. Men participated
more in moderate to vigorous activity in leisure time than
women. Only 4% out of 22% of the variance was explained
by environmental factors. A higher land-use mix diversity
and more physical activity equipment in the home were
related to more activity in leisure time. Psychosocial
variables explained all the additional variance. In line with
the Portuguese sample, a stronger social norm, more
social support from friends and more self-efficacy towards
internal barriers were related to more activity in leisure
time in the Belgian sample. In addition, reports of more
lack of time and more lack of interest were associated with
lower levels of leisure-time physical activity. For total
activity of at least moderate intensity, no environmental
variables reached significance in the Portuguese sample.
Thirteen per cent of the variance was explained by
psychosocial variables. More physical activity was related
to the perception of more pleasure and a stronger social
norm. In the Belgian sample, 5% out of 8% of the variance
was explained by environmental variables. Again more
physical activity was related to higher land-use mix
diversity and the presence of more physical activity
equipment in the home. In addition, less social support
from friends and more lack of interest were associated
with lower levels of total physical activity.
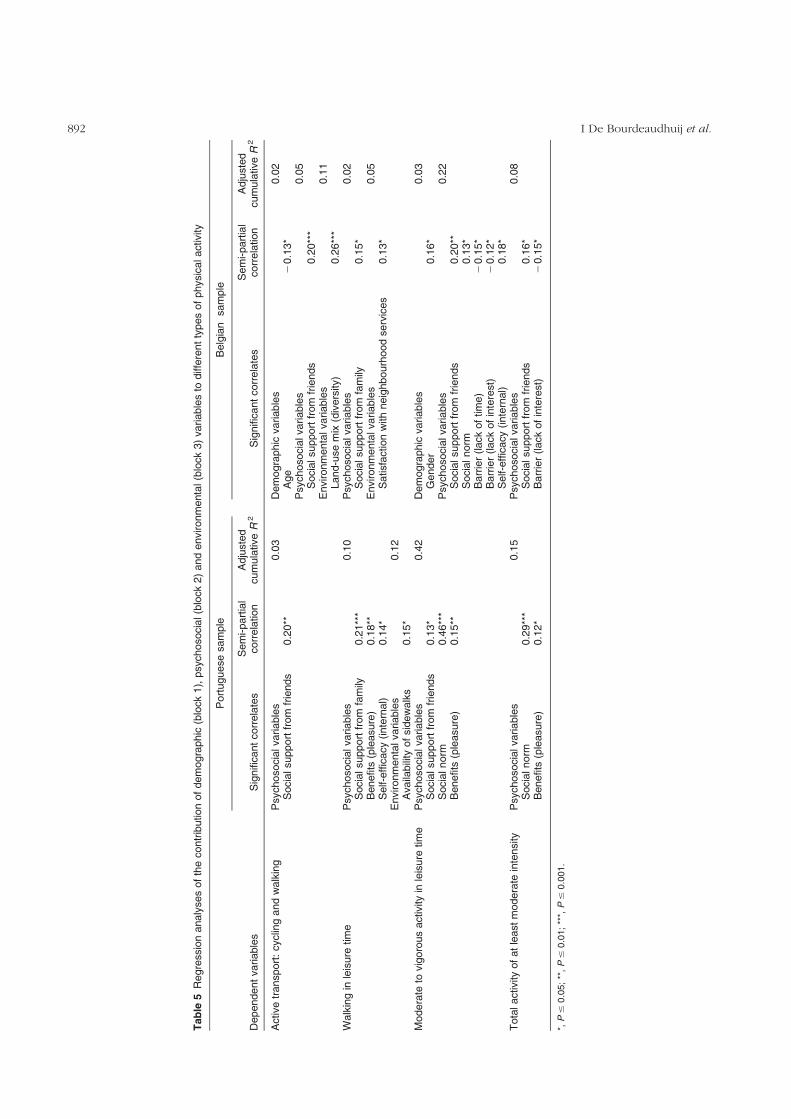
Results of the second series of regression analyses,
entering the psychosocial variables first followed by the
environmental correlates, are summarised in Table 5.
Again, all regression analyses yielded significance. The
Table 3 Differences in psychosocial and environmental correlates of physical activity betweenPortuguese and Belgian samples (mean with standard deviation in parentheses)
Portuguese sample(n ¼ 247)
Belgian sample(n ¼ 279)
t-value andsignificance
Psychosocial correlates†Social factors
Social norm 2.7 (1.5) 3.2 (1.1) 4.12**Modelling 2.3 (1.0) 3.1 (0.9) 9.07**Social support from family 2.2 (0.7) 2.3 (0.9) 1.52Social support from friends 2.5 (0.9) 2.5 (0.9) 20.01
Perceived benefitsPsychosocial 4.0 (0.8) 3.4 (0.8) 28.67**Health 4.3 (0.8) 4.0 (0.7) 25.25**Appearance 3.7 (0.8) 3.3 (0.9) 25.73**Social 3.6 (0.9) 3.5 (0.9) 20.65Competition 3.2 (0.8) 2.9 (0.9) 23.81**Pleasure 3.6 (0.8) 4.0 (0.9) 5.26**
Perceived barriersLack of time 2.9 (1.0) 3.1 (1.0) 2.57*Lack of interest 2.3 (0.8) 2.5 (0.9) 1.89External 2.2 (0.8) 2.3 (0.8) 0.46Health problems 1.8 (0.9) 1.9 (0.8) 0.47Psychological problems 2.0 (0.7) 1.9 (0.7) 20.29
Self-efficacyExternal factors 2.0 (0.6) 2.1 (0.6) 2.62*Internal factors 1.8 (0.5) 2.0 (0.5) 5.68**
Environmental correlatesResidential density‡ 2.0 (0.5) 1.8 (0.6) 24.99**Land-use mix diversity† 3.4 (1.1) 3.0 (1.0) 24.18**Land-use mix access§ 2.9 (1.1) 2.9 (1.0) 20.33Ease to walk to public transportation stop§ 3.7 (0.6) 3.2 (0.9) 27.62**Availability of sidewalks§ 2.9 (1.1) 2.8 (1.0) 21.14Availability of bike lanes§ 2.0 (0.9) 2.6 (0.7) 9.38**Neighbourhood aesthetics§ 2.5 (0.7) 2.7 (0.6) 3.02*Perceived safety from crime§ 3.2 (0.7) 3.2 (0.5) 0.57Perceived safety from traffic§ 2.5 (0.7) 2.6 (0.6) 1.00Connectivity§ 2.8 (0.8) 2.5 (0.7) 23.96**Worksite environment§ 3.2 (1.9) 3.4 (2.5) 1.11Physical activity equipment in home environment{ 3.0 (1.7) 4.5 (1.9) 9.49**Convenience of physical activity facilitiesk 6.3 (4.0) 6.4 (4.4) 0.13Satisfaction with neighbourhood services†† 5.1 (1.2) 5.4 (1.2) 2.68*Emotional satisfaction with neighbourhood†† 4.9 (1.3) 5.3 (1.2) 3.85**
*, P # 0.01; **, P # 0.001.† Five-point scale.‡ Three-point scale.§ Four-point scale{Sum of 13 home equipments.kSum of 18 facilities.†† Seven-point scale.
I De Bourdeaudhuij et al.890
Table
4R
egre
ssio
nanaly
ses
of
the
contr
ibution
of
dem
ogra
phic
(blo
ck
1),
environm
enta
l(b
lock
2)
and
psychosocia
l(b
lock
3)
variable
sto
diffe
rent
types
of
physic
alactivity
Port
uguese
sam
ple
Belg
ian
sam
ple
Dependent
variable
sS
ignifi
cant
corr
ela
tes
Sem
i-part
ial
corr
ela
tion
Adju
ste
dcum
ula
tiveR
2S
ignifi
cant
corr
ela
tes
Sem
i-part
ial
corr
ela
tion
Adju
ste
dcum
ula
tiveR
2
Active
transport
:cyclin
gand
walk
ing
Environm
enta
lvariable
s0.0
1D
em
ogra
phic
variable
s0.0
2Land-u
se
mix
(div
ers
ity)
0.1
3*
Age
20.1
3*
Psy
choso
cia
lvariable
s0.0
4E
nvironm
enta
lvariable
s0.1
0S
ocia
lsupport
from
frie
nds
0.1
9**
Land-u
se
mix
(div
ers
ity)
0.2
9**
*P
sychoso
cia
lvariable
s0.1
2M
odelli
ng
0.1
1*
Walk
ing
inle
isure
tim
eE
nvironm
enta
lvariable
s0.0
4E
nvironm
enta
lvariable
s0.0
3A
vaila
bili
tyof
sid
ew
alk
s0.2
1**
Land-u
se
mix
(div
ers
ity)
0.1
3*
Psy
choso
cia
lvariable
s0.1
1P
sychoso
cia
lvariable
s0.0
5S
ocia
lsupport
from
fam
ily0.2
1**
Socia
lsupport
from
fam
ily0.1
4*
Benefits
(ple
asure
)0.1
9**
Modera
teto
vig
oro
us
activ
ity
inle
isure
tim
eP
sychoso
cia
lvariable
s0.4
1D
em
ogra
phic
variable
s0.0
3S
ocia
lsupport
from
frie
nds
0.1
3*
Gender
0.1
6*
Socia
lnorm
0.4
9**
*E
nvironm
enta
lvariable
s0.0
7B
enefits
(ple
asure
)0.1
5*
Land-u
se
mix
(div
ers
ity)
0.1
6**
Self-
effi
cacy
(inte
rnal)
0.1
2*
Pre
sence
of
physic
alactivity
equip
ment
inth
ehom
e0.1
5*
Psy
choso
cia
lvariable
s0.2
2S
ocia
lsupport
from
frie
nds
0.1
8**
Socia
lnorm
0.1
2*
Barr
ier
(lack
of
tim
e)
20.1
5*
Barr
ier
(lack
of
inte
rest
)2
0.1
2*
Self-e
fficacy
(inte
rnal)
0.1
5*
Tota
lactiv
ity
of
at
least
modera
tein
tensity
Psy
choso
cia
lvariable
s0.1
3E
nvironm
enta
lvariable
s0.0
5S
ocia
lnorm
0.3
2**
*Land-u
se
mix
(div
ers
ity)
0.1
3*
Benefits
(ple
asure
)0.1
3*
Pre
sence
of
physic
alactivity
equip
ment
inth
ehom
e0.1
2*
Psy
choso
cia
lvariable
s0.0
8S
ocia
lsupport
from
frie
nds
0.1
2*
Barr
ier
(lack
of
inte
rest
)2
0.1
4*
*,P#
0.0
5;
**,P#
0.0
1;
***,P#
0.0
01.
Environmental and psychosocial correlates of activity 891
Table
5R
egre
ssio
nanaly
ses
of
the
contr
ibutio
nof
dem
ogra
phic
(blo
ck
1),
psyc
hosocia
l(b
lock
2)
and
environm
enta
l(b
lock
3)
variable
sto
diffe
rent
types
of
physic
alactiv
ity
Port
uguese
sam
ple
Belg
ian
sam
ple
Dependent
variable
sS
ignifi
cant
corr
ela
tes
Sem
i-part
ial
corr
ela
tion
Adju
ste
dcum
ula
tiveR
2S
ignifi
cant
corr
ela
tes
Sem
i-part
ial
corr
ela
tion
Adju
ste
dcum
ula
tiveR
2
Active
transport
:cyclin
gand
walk
ing
Psychosocia
lvariable
s0.0
3D
em
ogra
phic
variable
s0.0
2S
ocia
lsupport
from
frie
nds
0.2
0**
Age
20.1
3*
Psy
choso
cia
lvariable
s0.0
5S
ocia
lsupport
from
frie
nds
0.2
0**
*E
nvironm
enta
lvariable
s0.1
1Land-u
se
mix
(div
ers
ity)
0.2
6**
*W
alk
ing
inle
isure
tim
eP
sychosocia
lvariable
s0.1
0P
sychoso
cia
lvariable
s0.0
2S
ocia
lsupport
from
fam
ily0.2
1**
*S
ocia
lsupport
from
fam
ily0.1
5*
Benefits
(ple
asure
)0.1
8**
Environm
enta
lvariable
s0.0
5S
elf-e
fficacy
(inte
rnal)
0.1
4*
Satisfa
ction
with
neig
hbourh
ood
serv
ices
0.1
3*
Environm
enta
lvariable
s0.1
2A
vaila
bili
tyof
sid
ew
alk
s0.1
5*
Modera
teto
vig
oro
us
activity
inle
isure
tim
eP
sychosocia
lvariable
s0.4
2D
em
ogra
phic
variable
s0.0
3S
ocia
lsupport
from
frie
nds
0.1
3*
Gender
0.1
6*
Socia
lnorm
0.4
6**
*P
sychoso
cia
lvariable
s0.2
2B
enefits
(ple
asure
)0.1
5**
Socia
lsupport
from
frie
nds
0.2
0**
Socia
lnorm
0.1
3*
Barr
ier
(lack
of
tim
e)
20.1
5*
Barr
ier
(lack
of
inte
rest
)2
0.1
2*
Self-
effi
cacy
(inte
rnal)
0.1
8*
Tota
lactivity
of
at
least
modera
tein
tensity
Psychosocia
lvariable
s0.1
5P
sychoso
cia
lvariable
s0.0
8S
ocia
lnorm
0.2
9**
*S
ocia
lsupport
from
frie
nds
0.1
6*
Benefits
(ple
asure
)0.1
2*
Barr
ier
(lack
of
inte
rest
)2
0.1
5*
*,P#
0.0
5;
**,P#
0.0
1;
***,P#
0.0
01.
I De Bourdeaudhuij et al.892
total variance in physical activity explained by the
combination of the psychosocial and environmental
variables was very comparable with that from the first
series of regressions. However, the most noticeable
difference is that the contribution of environmental
variables was smaller or disappeared completely when
entering psychosocial correlates first. For moderate to
vigorous activity in leisure time, as well as for total activity
of at least moderate intensity, environmental variables no
longer contributed in both countries. For walking in
leisure time and for active transport, environmental
variables remained significant. However, in the Belgian
sample, land-use mix diversity did not reach significance
(P ¼ 0.09). Similarly, land-use mix diversity no longer
contributed significantly (P ¼ 0.09) in explaining active
transportation in Portugal.
Discussion
An ecological model was used to study the personal and
environmental correlates of physical activity in two
European countries.
The two series of regression analyses showed slightly
different results. When environmental variables were
entered first into the regression, they contributed
significantly to the variance in six of the eight analyses.
Higher walkability was positively associated with all four
measures of activity in the Belgian sample, and also to
active transportation in the Portuguese sample. Walking in
leisure time was also associated with the availability of
sidewalks in Portugal. This shows that walking for
transportation and walking for leisure share some
environmental correlates but are also slightly different12.
Leisure-time physical activity was related to the presence
of physical activity equipment in the home in Belgium and
convenience of physical activity facilities in Portugal. This
is in line with previous studies showing that leisure-time
exercise is especially related to the presence of
recreational resources10,15,16,29,30. However, aspects of
neighbourhood design also contributed to explain the
variance in leisure-time activity in the Belgian sample.
When environmental variables were entered after the
psychosocial variables, they remained significant corre-
lates for walking and cycling. Walkability/bikability was
related to active transport in Belgium. The availability of
sidewalks and satisfaction with neighbourhood services
were related to walking in leisure time in the Portuguese
and Belgian samples respectively, also after controlling for
psychosocial correlates. The environmental variables
could not explain additional variance in leisure-time
exercise beyond the effect of the psychosocial variables.
Previous studies were often not able to detect a
relationship between walking/cycling and psychosocial
correlates. In the present study, support from friends was
related to active transport and family support to walking in
leisure time in both samples. In line with previous studies,
social variables such as support from friends, the
perception of a positive social norm towards activity and
self-efficacy were also related to more leisure-time activity
in both samples9. In addition, perceived pleasure was
related to more activity in Portugal and lack of time and
lack of interest in activity were related to less activity in
Belgium.
The respondents in Portugal reported a higher
residential density, more land-use mix diversity, a higher
connectivity of streets and more convenience to walk to
public transportation compared with Belgian respondents.
Results also showed very high intercorrelations (above
0.50) between these variables. These are key environ-
mental factors that transportation and urban planning
researchers have found to be related to non-motorised
transport. All these environmental characteristics together
distinguish high walkable/bikable environments from
lower walkable/bikable environments11. In contrast, a
higher availability of bike lanes was reported in Belgium
compared with Portugal. From this we could argue that the
respondents in the Portuguese sample live in a more
walkable environment, but that the bikability might be
higher in the neighbourhood of the Belgian participants.
Differences in psychosocial correlates are especially
present for perceived benefits. Belgian people report
more pleasure and believe that being physically active is
more fun, compared with Portuguese ones. This suggests
that Belgian respondents are more intrinsically motivated
and engage in physical activity and sports for the inherent
pleasures of the activity. The motives of the Portuguese
sample may be more extrinsic and primarily dependent on
the external rewards from the activity. From Self-
Determination Theory31 and from previous studies32–34
we know that intrinsic motives are stronger determinants
of current and future activity and may be more important
from a health promotion perspective. This was also
confirmed by the regression analyses, showing a
consistent positive relationship between experiences of
pleasure and physical activity in the Portuguese sample.
Thirty-eight per cent of the Belgian sample and 42% of
the Portuguese sample did not meet the recommendation
of 30 min of physical activity of at least moderate intensity
per day. This is in line with the population prevalence data
in both countries if not only sports or vigorous activities,
but all activity of at least moderate intensity are included21.
However, differences were found dependent on the
context of the activity. Despite the comparable reports in
both countries for total minutes of active transportation,
more walking was reported in the Portuguese sample and
more cycling in the Belgian sample. In the same vein, no
difference was found for the sum of all moderate to
vigorous activity in leisure time, despite the higher score
for gardening and moderate leisure-time activity in
Belgium.
In general, the variance explained by environmental
factors was rather low, between 1% and 8%. The variance
Environmental and psychosocial correlates of activity 893
explained by psychosocial factors was generally much
higher, with a peak of 42% in leisure-time activity in
Portugal. Based on these percentages it is easy to conclude
that psychosocial factors are more important than
environmental variables in explaining physical activity.
However, given the specific relationships found in the
present study, this may be too easily assumed15.
Environmental factors were clearly related with walking
or cycling to get to and from places, and with walking for
exercise or recreation, in both European cities. A more
walkable/bikable neighbourhood, as defined by higher
land-use mix diversity, a higher connectivity of streets and
a higher residential density, was related to more walking/
cycling within different contexts. In a previous Belgian
study, analogous results were found. Availability of
sidewalks in males and land-use mix diversity and ease
to walk to a public transportation stop in females were
related to total walking time16. In a recent review of mainly
US and Australian studies, Owen et al.12 looked at
environmental influences on walking. In line with the
present study, accessibility of destinations and conven-
ience of facilities for walking were identified as associates
for walking for particular purposes. Two other correlates
of walking that arose from this review, aesthetic attributes
and perceptions about traffic and busy roads, were not
upheld in the present study. From a public health
perspective, it is important to notice that regular walking
may not (only) be the result of deliberate decision-making
but may (also) be an automatic reaction to a supportive
neighbourhood. As we know that walking is the most
commonly reported physical activity behaviour in
Europe21 with more than half of the population reporting
walking for 10 to 60 min on 4 to 7 days per week, and
walking can be easily incorporated in daily life which is
the ideal activity for sedentary, ‘non-sportive’ or very busy
people, more attention should be paid to building and/or
maintaining ‘walking-friendly’ environments35. Although
the variance explained may not be overwhelming,
environmental changes may affect large populations for
a prolonged period of time which may result in population
health benefits and reduced health costs.
The present results also show that environmental
factors may not be of equal importance in predicting
leisure-time physical activity. The presence and conven-
ience of exercise facilities and equipment may be
necessary but not sufficient to stimulate people to
become or remain active. Psychosocial factors such as
social support, self-efficacy, perceived benefits and
barriers are of higher importance, and it could be
assumed that regular exercise is mostly the result of
conscious individual decision-making. If we want to
encourage populations to participate in leisure-time
sports and fitness activities, education and motivational
strategies may be more important than environmental
changes. However, the two samples in the present study
were drawn from two cities with plenty of sports and
exercise facilities. The absence of facilities for example in
very rural areas might still have a negative impact on
exercise behaviour15.
The reliance on self-reported information for physical
activity and environmental variables, though adminis-
tered through validated questionnaires, is a limitation of
this study. It is essential to use objectively measured
environmental variables next to environmental percep-
tions to enhance understanding of environmental
influences on physical activity. A second limitation is
that no random samples were drawn, and that the study
was conducted in and around two cities, excluding
major rural areas. Most US and Australian studies also
investigated the relationship between environmental
factors and physical activity in cities. More data should
be gathered in rural areas to evaluate the full range of
environmental and physical activity variables. A third
limitation is that causal relations cannot be determined
from cross-sectional studies such as this. At this point in
time, the conceptualisation and measurement of
environmental attributes is still in its infancy compared
with the knowledge on psychosocial factors built for
about three decades. More research is needed to build
comprehensive environmental measures with additional
predictive power. Once a consensus is developed on
the most promising environmental correlates of physical
activity, they should be evaluated in prospective
studies.
The strength of the present study was the inclusion of a
broad range of potential psychosocial and environmental
correlates of physical activity, the measurement of
physical activity of different purposes and intensities,
and the inclusion of participants from two different
European countries. Present results indicated activity-
specific relations with environmental variables that were
analogous in both countries. Walking/cycling for trans-
portation and walking for recreation were related to social
support from family and/or friends and to walkability and
walking facilities in the neighbourhood. Recreational
physical activity was mainly determined by social support,
self-efficacy, and perceived benefits and barriers. This
suggests that public education campaigns addressing
these psychosocial determinants are needed to encourage
leisure-time activity, while a combination of neighbour-
hood design changes and encouragement of social
support in walking is warranted to increase walking in
different contexts.
Acknowledgements
The authors would like to thank Oeiras City Council, and
also Carla Ribeiro, Lıdia Lopes, Robin Van Den Bosch,
Ragnar Van Acker, Yoniko Sohier, Benjamin Meerhaeghe
and Samuel Van Egten for their help in data gathering in
Portugal and Belgium.
I De Bourdeaudhuij et al.894
References
1 World Health Organization (WHO). Global Strategy on Diet,Physical Activity, and Health. Geneva: WHO, 2004.
2 Council of Europe. Recommendation NO R(95) 17 of theCommittee of Ministers to the Member States on theSignificance of Sport for Society. Strasbourg: Council ofEurope, CDDS (95) 1995; 58: 8–10.
3 National Institutes of Health. Consensus Development Panelon Physical Activity and Cardiovascular Health. Journal ofthe American Medical Association 1996; 276: 241–6.
4 Bouchard C, Shephard R, Stephens T. Physical Activity,Fitness, and Health: International Proceedings andConsensus Statement. Champaign, IL: Human Kinetics, 1994.
5 Hardman A, Stensel D. Physical Activity and Health, TheEvidence Explained. London and New York: Routledge andTaylor & Francis Group, 2003.
6 Caspersen CJ, Merritt RK, Stephens T. International physicalactivity patterns: a methodological perspective. In: DishmanR, ed. Advances in Exercise Adherence. Champaign, IL:Human Kinetics, 1994; 73–110.
7 Steptoe A, Wardle J, Fuller R, Holte A, Justo J, Sanderman R,et al. Leisure-time physical exercise: prevalence, attitudinalcorrelates, and behavioral correlates among young Eur-opeans from 21 countries. Preventive Medicine 1997; 26:845–54.
8 Baranowski T, Anderson C, Carmack C. Mediating variableframework in physical activity interventions. How are wedoing? How might we do better? American Journal ofPreventive Medicine 1998; 15: 266–97.
9 Trost SG, Owen N, Bauman AE, Sallis JF, Brown W.Correlates of adults’ participation in physical activity: reviewand update. Medicine and Science in Sports and Exercise2002; 34: 1996–2001.
10 Humpel N, Owen N, Leslie E. Environmental factorsassociated with adults’ participation in physical activity: areview. American Journal of Preventive Medicine 2002; 22:188–99.
11 Saelens BE, Sallis JF, Frank LD. Environmental correlates ofwalking and cycling: findings from the transportation, urbandesign, and planning literatures. Annals of BehavioralMedicine 2003; 25: 80–91.
12 Owen N, Humpel N, Leslie E, Bauman A, Sallis J.Understanding environmental influences on walking:review and research agenda. American Journal ofPreventive Medicine 2004; 27: 67–76.
13 Sallis J, Owen N. Ecological models of health behavior. In:Glanz K, Lewis FM, Rimer BK, eds. Health Behavior andHealth Education: Theory, Research, and Practice, 3rd ed.San Francisco, CA: Jossey-Bass, 2002; 462–84.
14 Gilles-Corti B, Donovan R. The relative influence ofindividual, social and physical environment determinantsof physical activity. Social Science & Medicine 2002; 54:1793–812.
15 Sallis J, Johnson M, Calfas K, Caparosa S, Nichols J. Assessingperceived physical environmental variables that mayinfluence physical activity. Research Quarterly for Exerciseand Sport 1997; 68: 345–51.
16 De Bourdeaudhuij I, Sallis J, Saelens B. Environmentalcorrelates of physical activity in a sample of Belgian adults.American Journal of Health Promotion 2003; 18: 83–92.
17 Stead D. Relationships between land use, socioeconomicfactors, and travel patterns in Britain. EnvironmentalPlanning B 2001; 28: 499–528.
18 De Bourdeaudhuij I, Sallis J. Relative contribution ofpsychological determinants to the prediction of physicalactivity in three population based samples. PreventiveMedicine 2002; 34: 279–88.
19 European Commission. Pan-European Survey on ConsumerAttitudes to Physical Activity, Body-weight and Health.Luxembourg: Office for Official Publications of theEuropean Commission, 1999.
20 Angel Martınez-Gonzalez AM, Javier Varo J, Luis Santos J,De Irala J, Gibney M, Kearney J, et al. Prevalence of physicalactivity during leisure time in the European Union. Medicineand Science in Sports and Exercise 2001; 33: 1142–6.
21 European Commission. Eurobarometer Physical Activity.Special Eurobarometer 183-6, Wave 58.2, European OpinionResearch Group EEIG, Directorate General Health andConsumer Protection and Directorate General Press andCommunication, 2003; 1–49.
22 Saelens BE, Sallis JF, Black JB, Chen D. Neighborhood-baseddifferences in physical activity: an environment scaleevaluation. American Journal of Public Health 2003; 93:1552–8.
23 De Bourdeaudhuij I, Van Oost P, Mommerency G.Psychological Determinants of Leisure Time PhysicalActivity in Adolescents and Adults. Research Report,Ghent: Ghent University, 1994.
24 Vandelanotte C, De Bourdeaudhuij I, Sallis JF, Philippaerts R,Sjostrom M. Reliability and validity of a computerised andDutch version of the International Physical Activity Ques-tionnaire (IPAQ). Journal of Physical Activity and Health2005; 2: 63–75.
25 Craig CL, Marshall AL, Sjostrom M, Bauman AE, Booth ML,Ainsworth BE, et al. International physical activity ques-tionnaire: 12-country reliability and validity. Medicine andScience in Sports and Exercise 2003; 35: 1381–95.
26 De Bourdeaudhuij I, Van Oost P. A cluster-analytic approachtoward physical activity and other health related behaviors.Medicine and Science in Sports and Exercise 1999; 31:605–12.
27 De Backer G, Kornitzer M, Sobolski J, Dramaix M, Degre S,de Marneffe M, et al. Physical activity and physical fitnesslevels of Belgian males aged 40–55 years. Cardiology 1981;67: 110–28.
28 Folsom AR, Cook TC, Sprafka JM, Burke GL, Norsted SW,Jacobs DR. Differences in leisure-time physical activity levelsbetween blacks and whites in population-based samples:the Minnesota Heart Survey. Journal of Behavioral Medicine1991; 14: 1–9.
29 Jakicic JM, Wing RR, Butler BA, Jeffery RW. The relationshipbetween presence of exercise equipment in the home andphysical activity level. American Journal of HealthPromotion 1997; 11: 363–5.
30 Brownson RC, Baker EA, Housemann RA, Brennan LK,Bacak SJ. Environmental and policy determinants of physicalactivity in the United States. American Journal of PublicHealth 2001; 91: 1995–2003.
31 Deci EL, Ryan RM. Intrinsic Motivation and Self-determi-nation in Human Behaviour. New York: Plenum Press,1985.
32 Kimiecik JC, Harris AT. What is enjoyment? A conceptual/definitional analysis with implications for sport and exercisepsychology. Journal of Sport and Exercise Psychology 1996;18: 247–63.
33 Ingledew D, Markland D, Medley A. Exercise motives andstages of change. Journal of Health Psychology 1998; 3:477–89.
34 Ryan RM, Frederick CM, Lepes D, Rubio N, Sheldon KM.Intrinsic motivation and exercise adherence. InternationalJournal of Sport Psychology 1997; 28: 335–54.
35 Coogan PF, Coogan MA. When worlds collide: observationson the integration of epidemiology and transportationbehavioral analysis in the study of walking. AmericanJournal of Health Promotion 2004; 19: 39–44.
Environmental and psychosocial correlates of activity 895