
ENV /JM /M ON O(2015)15/P ART1 Unclassified - OECD
176
Unclassified ENV/JM/MONO(2015)15/PART1 Organisation de Coopération et de Développement Économiques Organisation for Economic Co-operation and Development 17-Dec-2015 ___________________________________________________________________________________________ _____________ English - Or. English ENVIRONMENT DIRECTORATE JOINT MEETING OF THE CHEMICALS COMMITTEE AND THE WORKING PARTY ON CHEMICALS, PESTICIDES AND BIOTECHNOLOGY DOSSIER ON ZINC OXIDE - PART 1 - Series on the Safety of Manufactured Nanomaterials No. 52 This document is only available in PDF format. JT03388453 Complete document available on OLIS in its original format This document and any map included herein are without prejudice to the status of or sovereignty over any territory, to the delimitation of international frontiers and boundaries and to the name of any territory, city or area. ENV/JM/MONO(2015)15/PART1 Unclassified English - Or. English
-
Upload
khangminh22 -
Category
Documents
-
view
9 -
download
0
Transcript of ENV /JM /M ON O(2015)15/P ART1 Unclassified - OECD
Unclassified ENV/JM/MONO(2015)15/PART1 Organisation de Coopération et de Développement Économiques Organisation for Economic Co-operation and Development 17-Dec-2015
___________________________________________________________________________________________
_____________ English - Or. English ENVIRONMENT DIRECTORATE
JOINT MEETING OF THE CHEMICALS COMMITTEE AND
THE WORKING PARTY ON CHEMICALS, PESTICIDES AND BIOTECHNOLOGY
DOSSIER ON ZINC OXIDE
- PART 1 -
Series on the Safety of Manufactured Nanomaterials
No. 52
This document is only available in PDF format.
JT03388453
Complete document available on OLIS in its original format
This document and any map included herein are without prejudice to the status of or sovereignty over any territory, to the delimitation of
international frontiers and boundaries and to the name of any territory, city or area.
EN
V/JM
/MO
NO
(2015)1
5/P
AR
T1
Un
classified
En
glish
- Or. E
ng
lish

ENV/JM/MONO(2015)15/PART1
2

ENV/JM/MONO(2015)15/PART1
3
OECD Environment, Health and Safety Publications
Series on the Safety of Manufactured Nanomaterials
No. 52
DOSSIER ON ZINC OXIDE
- PART 1 -
Environment Directorate
ORGANISATION FOR ECONOMIC CO-OPERATION AND DEVELOPMENT
Paris, 2015

ENV/JM/MONO(2015)15/PART1
4
Dossiers also published in the Series on the Safety of Manufactured Nanomaterials:
No. 44, Dossier on Gold nanoparticles (2015)
No. 45, Dossier on Cerium oxide (2015)
No. 46, Dossier on Dendrimers (2015)
No. 47, Dossier on Nanoclays (2015)
No. 48, Dossier on Fullerenes (2015)
No. 49, Dossier on Multiwalled Carbon Nanotubes (MWCNTs) (2015)
No. 50, Dossier on Single-walled Carbon Nanotubes (SWCNTs) (2015)
No. 51, Dossier on Silicon dioxide (2015)
No. 53, Dossier on Silver nanoparticles (2015)
No. 54, Dossier on Titanium dioxide (2015)
© OECD 2015
Applications for permission to reproduce or translate all or part of this material
should be made to: Head of Publications Service, [email protected],
OECD, 2 rue André-Pascal, 75775 Paris Cedex 16, France

ENV/JM/MONO(2015)15/PART1
5
ABOUT THE OECD
The Organisation for Economic Co-operation and Development (OECD) is an intergovernmental
organisation in which representatives of 34 industrialised countries in North and South America, Europe
and the Asia and Pacific region, as well as the European Commission, meet to co-ordinate and harmonise
policies, discuss issues of mutual concern, and work together to respond to international problems. Most of
the OECD’s work is carried out by more than 200 specialised committees and working groups composed
of member country delegates. Observers from several countries with special status at the OECD, and from
interested international organisations, attend many of the OECD’s workshops and other meetings.
Committees and working groups are served by the OECD Secretariat, located in Paris, France, which is
organised into directorates and divisions.
The Environment, Health and Safety Division publishes free-of-charge documents in eleven different
series: Testing and Assessment; Good Laboratory Practice and Compliance Monitoring; Pesticides;
Biocides; Risk Management; Harmonisation of Regulatory Oversight in Biotechnology; Safety of
Novel Foods and Feeds; Chemical Accidents; Pollutant Release and Transfer Registers; Emission
Scenario Documents; and Safety of Manufactured Nanomaterials. More information about the
Environment, Health and Safety Programme and EHS publications is available on the OECD’s World
Wide Web site (www.oecd.org/chemicalsafety/).
This publication was developed in the IOMC context. The contents do not necessarily reflect the
views or stated policies of individual IOMC Participating Organizations.
The Inter-Organisation Programme for the Sound Management of Chemicals (IOMC) was
established in 1995 following recommendations made by the 1992 UN Conference on
Environment and Development to strengthen co-operation and increase international co-
ordination in the field of chemical safety. The Participating Organisations are FAO, ILO, UNDP,
UNEP, UNIDO, UNITAR, WHO, World Bank and OECD. The purpose of the IOMC is to
promote co-ordination of the policies and activities pursued by the Participating Organisations,
jointly or separately, to achieve the sound management of chemicals in relation to human health
and the environment.

ENV/JM/MONO(2015)15/PART1
6
This publication is available electronically, at no charge.
For this and many other Environment,
Health and Safety publications, consult the OECD’s
World Wide Web site (www.oecd.org/chemicalsafety/)
or contact:
OECD Environment Directorate,
Environment, Health and Safety Division
2 rue André-Pascal
75775 Paris Cedex 16
France
Fax: (33-1) 44 30 61 80
E-mail: [email protected]
ENV/JM/MONO(2015)15/PART1
7
PREAMBLE
In November 2007, OECD’s Working Party on Manufactured Nanomaterials (WPMN) launched the
Sponsorship Programme for the Testing of Manufactured Nanomaterials (hereafter the Testing
Programme). The objective was to conduct specific tests, relevant to human health and environmental
safety endpoints, on a variety of manufactured nanomaterials (MN). The outcomes of the Testing
Programme were intended to assess the applicability of the existing test guidelines1 to nanomaterials, as
well as to provide useful information on any intrinsic properties of MNs, which are different from the
same bulk material with greater external dimensions. Understanding the properties of NMs is crucial to
choose appropriate strategies for hazard identification, risk assessment or risk management measures. The
Testing Programme involved delegations from OECD member countries, some non-member economies
and other stakeholders. The broad international representation, from a range of delegations enabled the
programme to pool expertise and resources without which this programme would not have been possible.
Before launching the Testing Programme, the WPMN first identified a broad list of possible
nanomaterials, and the list was later adjusted to a final selection of eleven MNs for testing2. This list
comprised: i) fullerenes (C60); ii) single-walled carbon nanotubes (SWCNTs); iii) multi-walled carbon
nanotubes (MWCNTs); iv) silver nanoparticles; v) titanium dioxide; vi) cerium oxide; vii) zinc oxide;
viii) silicon dioxide; ix) dendrimers; x) nanoclays; and xi) gold nanoparticles. One fundamental criterion
for selecting these materials was that they should be either in commercial use at the time or expected to be
in the near future. At the same time, other considerations were also given attention, such as the production
volume of the materials, the likely availability of such materials for testing and the existing information
that would readily be available on the materials.
It was also agreed that 59 endpoints would be addressed3 for each material corresponding to the following
categories: i) nanomaterial information/ identification; ii) physical-chemical properties and material
characterisation; iii) environmental fate; iv) toxicological and eco-toxicological effects; v) environmental
toxicology; vi) mammalian toxicology; and vii) material safety. These endpoints were judged to be most
important based largely on the general experience of testing chemicals, while taking into account the
potentially different or new properties of nanomaterials. It is worth noticing that it was not expected that
testing for all of the listed endpoints would be necessary for each of the selected MNs.
To assist with the Testing Programme, the WPMN developed two documents: i) a Preliminary Review of
OECD Test Guidelines for their Applicability to Manufactured Nanomaterials
[ENV/JM/MONO(2009)21]; and ii) Guidance Manual for the Testing of Manufactured Nanomaterials:
OECD's Sponsorship Programme (Guidance Manual) in 2009, which was subsequently updated in 2010
1 The OECD Test Guidelines are a collection of internationally agreed test methods used by government, industry and
independent laboratories. They are used to determine the safety of chemicals.
http://www.oecd.org/chemicalsafety/testing/oecdguidelinesforthetestingofchemicals.htm
2 Originally Iron nanoparticles, Aluminium, Carbon black, and Polystyrene were suggested but later withdrawn and replaced by
gold nanoparticles.
3 As specified in the Guidance Manual, “address” includes the term “completed” which provides that all dossiers will contain the
identified endpoint information. Note that for some endpoints (for example, solubility) it is specified that the endpoint must be
“completed”. In such instances “completed” means that all Dossiers will be providing this endpoint information.

ENV/JM/MONO(2015)15/PART1
8
[ENV/JM/MONO(2009)20/REV]4. The objective of this Guidance Manual was to guide sponsors
5 in the
testing of the materials while ensuring that the information collected was reliable, accurate, consistent and
therefore also comparable. The Guidance Manual addressed a whole range of issues including the
organisation of the work.
The Guidance Manual contains detailed information on the selected endpoints for testing and
recommendations on sample preparation and dosimetry.
The Guidance Manual also described the development of Dossier Development Plans (DDPs). These
plans were prepared by Lead sponsors, Co-sponsors together with contributors to describe the specific
plan for the testing of each nanomaterial including when and where the testing will be undertaken and by
whom. The DDPs also included information on the materials to be tested as well as information on issues
such as sample preparation and dosimetry. Each of the DDPs was prepared and reviewed by the WPMN
before testing work began.
Based on the lessons learned during the Testing Programme, the WPMN also developed Guidance on
Sample Preparation and Dosimetry for the Safety Testing of Manufactured Nanomaterials
[ENV/JM/MONO(2012)40]. This latter document is an update of an earlier text first published in 2010.
The work on OECD’s Testing Programme was completed by the end of 2013. In June 2014 the WPMN
agreed that for each nanomaterial the dataset would be published in IUCLID printed format6 7
. The
document will include the protocols and methods to allow their wider use (regulators and researchers).
The dataset in this document has been declassified and made publicly available and it is expected
regulators and researchers will wish to use it. Due to a broad dissemination of the data and the exploratory
setting in which they were developed there are a number of limitations in using the data of which
potential users should be aware. The programme focused on answering scientific questions in the field of
the OECD test guidelines but not to provide conclusions on the hazard or risk of the materials selected.
The data contained within these dossiers is raw data and has not been evaluated by either the programme
sponsors or the WPMN. Any conclusions found within these dossiers are under the responsibility of the
researchers who made them. The absence of data for some endpoints may be a gap for some endpoints but
for other end points there may not if the data was not considered necessary. Although the programme
ensured a broad participation of many stakeholders it was not intended to arrive at any pre-defined
regulatory datasets requirements or risk assessment decisions. It was recognised from the beginning that
4 It is worth noting that while the Guidance Manual for Sponsors was primarily intended as a guide to WPMN’s Testing
Programme, it is also expected that it will be of value to anyone involved in testing NMs.
5 The Guidance Manual noted, for example, that there could be three levels of participation to the programme. Lead sponsors,
who would assume responsibility for conducting or coordinating all of the testing, determined to be appropriate for each of the
endpoints for a specific nanomaterial. In some cases, “joint lead” arrangements were developed. Co-sponsors conducted some of
the testing determined to be appropriate and feasible to address the endpoints for a specific listed nanomaterial. Contributors
provided test data, reference or testing materials or other relevant information to the lead and co-sponsors.
6 IUCLID is a software programme for the administration of data on chemical substances. Although it was originally developed
to fulfill requirements in the EU for the evaluation and control of the risks of existing chemical substances, it is used by many
others.
7 SIAR = SIDS Initial Assessment Report (SIDS = Screening Information Data Set)

ENV/JM/MONO(2015)15/PART1
9
the exploratory nature of the work would require subsequent follow-up work for example to review the
specific needs that may arise when performing risk assessment of nanomaterials. In this context, the
programme's ultimate goal, to add to the knowledge of the properties of nanomaterials, would form a
cornerstone.
ENV/JM/MONO(2015)15/PART1
10
FOREWORD
As part of its Programme on the Safety of Manufactured Nanomaterials, OECD launched the Sponsorship
Programme for the Testing of Manufactured Nanomaterials (hereafter the Testing Programme). The
objective was to conduct specific tests, relevant to human health and environmental safety endpoints, on a
variety of manufactured nanomaterials (MN). The Testing Programme mainly aimed to assess the
applicability of the existing test guidelines to nanomaterials, as well as to provide useful information on
any intrinsic properties of MNs, which are different from the same bulk material with greater external
dimensions.
This document presents the Dossier of Zinc Oxide. This nanomaterial has been tested for a number of
endpoints for: i) Nanomaterials Information / Identification; ii) Physical-Chemical Properties; iii)
Environmental Fate; iv) Environmental Toxicology; v) Mammalian Toxicology; and vi) Material Safety.
They have been analysed using OECD Guidelines for the Testing of Chemicals (TG)8. The data is
presented in an IUCLID9 style format and includes the protocols and methods used (see Preamble).
The Business & Industry Advisory Committee to the OECD (BIAC) via the Nanotechnology Industries
Association (NIAC) led the Testing Programme on Zinc Oxide. This included the determination of the
tests that were appropriate, performing a number of tests, as well as coordinating tests and results
obtained by other the participating stakeholders. This programme has benefited from the co-sponsorship
and the contribution of Australia, the U S Food and Drug Administration (FDA), and Spain.
This document is published under the responsibility of the Joint Meeting of the Chemicals Committee and
Working Party on Chemicals, Pesticides and Biotechnology of the OECD.
8 http://www.oecd.org/env/testguidelines
9 IUCLID is a software programme for the administration of data on chemical substances. It was originally developed to fulfil
requirements in the EU for the evaluation and control of the risks of existing chemical substances. It is specifically relevant in the
context of an international programme for the initial assessment of chemical substances.

ENV/JM/MONO(2015)15/PART1
11
ACKNOWLEDGMENTS
The OECD Secretariat and the Working Party on Manufactured Nanomaterials wish to thank the Business
& Industry Advisory Committee to the OECD (BIAC) for leading the Testing Programme for Zinc Oxide.
They are specifically grateful to David Carlander from the Nanotechnology Industries Association. In
addition, we appreciate the efforts made by other countries that participated in the Testing Programme, in
particular to Australia, the US Food and Drug Administration (FDA), and Spain.
ENV/JM/MONO(2015)15/PART1
12
TABLE OF CONTENTS
- Part 1 -
PREAMBLE ................................................................................................................................................... 7
FOREWORD ................................................................................................................................................ 10
ACKNOWLEDGMENTS ............................................................................................................................ 11
1. GENERAL INFORMATION .................................................................................................................. 14
1.1 Identification ........................................................................................................................................ 14 1.2 Composition ......................................................................................................................................... 14 1.3 Identifiers ............................................................................................................................................. 15 1.4 Analytical information ......................................................................................................................... 15 1.5 Joint submission ................................................................................................................................... 15 1.6 Sponsors ............................................................................................................................................... 15 1.7 Suppliers .............................................................................................................................................. 15 1.8 Recipients ............................................................................................................................................. 15 1.9 Product and process orientated research and development .................................................................. 15
2. CLASSIFICATION & LABELLING AND PBT ASSESSMENT .......................................................... 15
3. MANUFACTURE, USE AND EXPOSURE ........................................................................................... 15
4. PHYSICAL AND CHEMICAL PROPERTIES....................................................................................... 15
4.1 Appearance/physical state/colour ........................................................................................................ 15 4.2 Melting point/freezing point ................................................................................................................ 24 4.3 Boiling point ........................................................................................................................................ 24 4.4 Density ................................................................................................................................................. 24 4.5 Particle size distribution (Granulometry) ............................................................................................. 24 4.6 Vapour pressure ................................................................................................................................... 54 4.7 Partition coefficient .............................................................................................................................. 54 4.8 Water solubility .................................................................................................................................... 54 4.9 Solubility in organic solvents / fat solubility ....................................................................................... 70 4.10 Surface tension ................................................................................................................................... 70 4.11 Flash point .......................................................................................................................................... 70 4.12 Auto flammability .............................................................................................................................. 70 4.13 Flammability ...................................................................................................................................... 70 4.14 Explosiveness ..................................................................................................................................... 70 4.15 Oxidising properties ........................................................................................................................... 70 4.16 Oxidation reduction potential ............................................................................................................ 70 4.17 Stability in organic solvents and identity of relevant degradation products ...................................... 77 4.18 Storage stability and reactivity towards container material ............................................................... 77 4.19 Stability: thermal, sunlight, metals .................................................................................................... 77 4.20 pH ....................................................................................................................................................... 82 4.21 Dissociation constant ......................................................................................................................... 82 4.22 Viscosity ............................................................................................................................................ 82 4.23 Additional physico-chemical information ......................................................................................... 82 4.24 Agglomeration/aggregation ............................................................................................................... 88 4.25 Crystalline phase ................................................................................................................................ 93 4.26 Crystallite and grain size .................................................................................................................. 101
ENV/JM/MONO(2015)15/PART1
13
4.27 Aspect ratio/shape ............................................................................................................................ 109 4.28 Specific surface area ........................................................................................................................ 109 4.29 Zeta potential ................................................................................................................................... 122 4.30 Surface chemistry............................................................................................................................. 130 4.31 Dustiness .......................................................................................................................................... 147 4.32 Porosity ............................................................................................................................................ 150 4.33 Pour density ..................................................................................................................................... 159 4.34 Photocatalytic activity ...................................................................................................................... 161 4.35 Radical formation potential .............................................................................................................. 173
- Part 2 -
5. ENVIRONMENTAL FATE AND PATHWAYS ................................ ENV/JM/MONO(2015)15/PART2
6. ECOTOXICOLOGICAL INFORMATION ........................................................................................ 1092
- Part 3 -
7. TOXICOLOGICAL INFORMATION ............................................... ENV/JM/MONO(2015)15/PART3
8. ANALYTICAL METHODS ................................................................ ENV/JM/MONO(2015)15/PART3
9. RESIDUES IN FOOD AND FEEDINGSTUFFS ............................... ENV/JM/MONO(2015)15/PART3
10. EFFECTIVENESS AGAINST TARGET ORGANISMS ................. ENV/JM/MONO(2015)15/PART3
11. GUIDANCE ON SAFE USE ............................................................ ENV/JM/MONO(2015)15/PART3
12. LITERATURE SEARCH .................................................................. ENV/JM/MONO(2015)15/PART3
13. ASSESSMENT REPORTS ............................................................... ENV/JM/MONO(2015)15/PART3
14. INFORMATION REQUIREMENTS ............................................... ENV/JM/MONO(2015)15/PART3
ENV/JM/MONO(2015)15/PART1
14
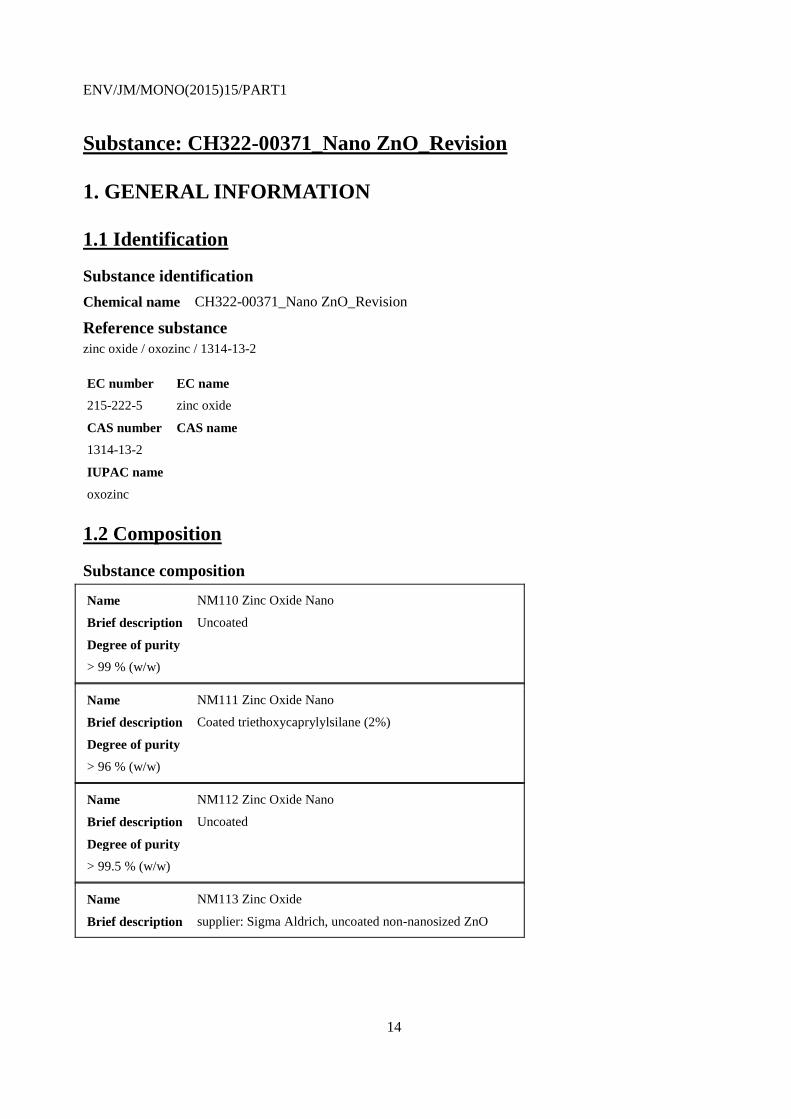
Substance: CH322-00371_Nano ZnO_Revision
1. GENERAL INFORMATION
1.1 Identification
Substance identification
Chemical name CH322-00371_Nano ZnO_Revision
Reference substance
zinc oxide / oxozinc / 1314-13-2
EC number EC name
215-222-5 zinc oxide
CAS number CAS name
1314-13-2
IUPAC name
oxozinc
1.2 Composition
Substance composition
Name NM110 Zinc Oxide Nano
Brief description Uncoated
Degree of purity
> 99 % (w/w)
Name NM111 Zinc Oxide Nano
Brief description Coated triethoxycaprylylsilane (2%)
Degree of purity
> 96 % (w/w)
Name NM112 Zinc Oxide Nano
Brief description Uncoated
Degree of purity
> 99.5 % (w/w)
Name NM113 Zinc Oxide
Brief description supplier: Sigma Aldrich, uncoated non-nanosized ZnO
ENV/JM/MONO(2015)15/PART1
15
1.3 Identifiers
1.4 Analytical information
1.5 Joint submission
1.6 Sponsors
1.7 Suppliers
1.8 Recipients
1.9 Product and process orientated research and development
2. CLASSIFICATION & LABELLING AND PBT ASSESSMENT
3. MANUFACTURE, USE AND EXPOSURE
4. PHYSICAL AND CHEMICAL PROPERTIES
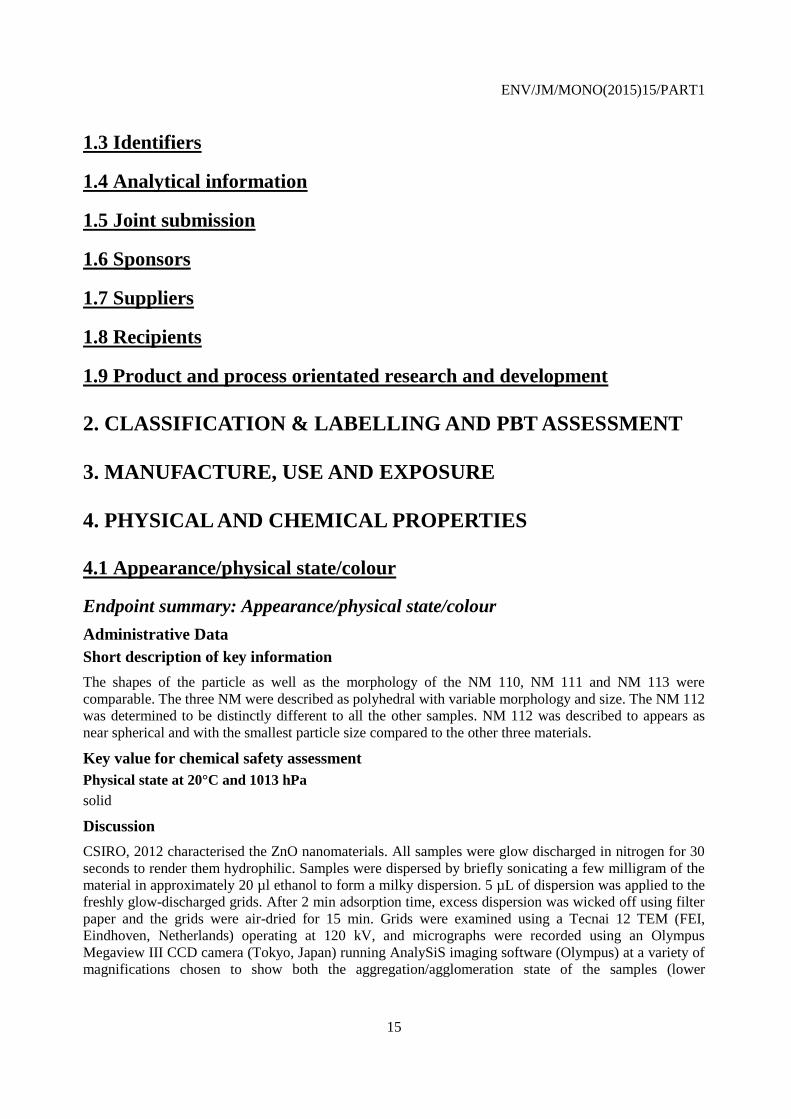
4.1 Appearance/physical state/colour
Endpoint summary: Appearance/physical state/colour
Administrative Data
Short description of key information
The shapes of the particle as well as the morphology of the NM 110, NM 111 and NM 113 were
comparable. The three NM were described as polyhedral with variable morphology and size. The NM 112
was determined to be distinctly different to all the other samples. NM 112 was described to appears as
near spherical and with the smallest particle size compared to the other three materials.
Key value for chemical safety assessment
Physical state at 20°C and 1013 hPa
solid
Discussion
CSIRO, 2012 characterised the ZnO nanomaterials. All samples were glow discharged in nitrogen for 30
seconds to render them hydrophilic. Samples were dispersed by briefly sonicating a few milligram of the
material in approximately 20 µl ethanol to form a milky dispersion. 5 µL of dispersion was applied to the
freshly glow-discharged grids. After 2 min adsorption time, excess dispersion was wicked off using filter
paper and the grids were air-dried for 15 min. Grids were examined using a Tecnai 12 TEM (FEI,
Eindhoven, Netherlands) operating at 120 kV, and micrographs were recorded using an Olympus
Megaview III CCD camera (Tokyo, Japan) running AnalySiS imaging software (Olympus) at a variety of
magnifications chosen to show both the aggregation/agglomeration state of the samples (lower

ENV/JM/MONO(2015)15/PART1
16
magnifications e.g. 6000x) as well as particle morphology (higher magnifications e.g. 100000x -
360000x).The four TEM images of the nanomaterials showing varied particle sizes and shapes in the
different samples. The TEM image of NM-110 indicated that the primary particles appeared polyhedral
with variable morphology and size. Two main types of morphology could be distinguished:
- Particles with aspect ratio close to 1 (typically 20 – 250 nm size and very few particles of approx.
400 nm size) and hexagonal morphology
- Particles with aspect ratio 2 to 7.5 (50 – 350 nm) with cubic, tetragonal and orthorhombic morphologies.
The TEM image of NM-111 indicated that the primary particles appeared polyhedral and with variable
morphology as observed in NM-110, but with different size distributions:
- Particles with aspect ratio near 1 (~90 % in the 20 – 200 nm range)
- Particles with aspect ratio 2 to 8.5 (~90 % in the 10 – 450 nm range
The TEM image of NM-112 indicated that primary particles were near spherical (rather than polyhedral)
with regular morphology and a relatively homogenous size distribution. Generally, particles had an aspect
ratio close to 1, with sizes varying between 20 and 50 nm and appeared distinctly different to all the other
samples (NM-110, NM-111 and NM-113).
- Particles with aspect ratio near 1 (typically in the 80 – 100 nm range)
- Particles with aspect ratio > 2 (typically in the 180 – > 200 nm range)
The TEM image of NM-113 showed that the sample was composed of polyhedral particles with sizes
ranging generally between 100 to 200 nm, and with some larger agglomerates.
Deakin University, 2012 inestigated the shape of the nanomaterials. TEM specimen was prepared by
evaporating a drop of the nanoparticle dispersion on a carbon-coated specimen grid. Grids were examined
using a JEOL JEM-2100 TEM operating at 200 kV. No further details about the sample preparation and
the method parameter were available. The TEM image of NM-110 and NM-111 indicated wide
distributions of shapes and sizes of primary particles. Furthermore the geometrical shapes indicated high
crystallinity and low surface defects. The TEM image of NM-112 indicated near spherical shape of the
primary particles and a high number of surface defects. The TEM image of NM-113 indicated
geometrical shapes and large particle sizes (>100 nm in diameter).
Conclusion
The TEM images analyses in the course of the two studies yielded comparable results. The appearances
of the particle as well as the morphology of the NM 110, NM 111 and NM 113 were comparable. The
three NM were described as polyhedral with variable morphology and size. The NM 112 was determined
to be distinctly different to all the other samples. NM 112 was described to appears as near spherical and
with the smallest particle size compared to the other 3 materials.
Endpoint study record: key_2012-03-05_Australia_CSIRO_Appearance_TEM
Administrative Data
Purpose flag key study
Study result type experimental result
Reliability 1 (reliable without restriction)
Rationale for reliability incl.
deficiencies
The documentation provide in the full study report was sufficient for the
data evaluation.
ENV/JM/MONO(2015)15/PART1
17
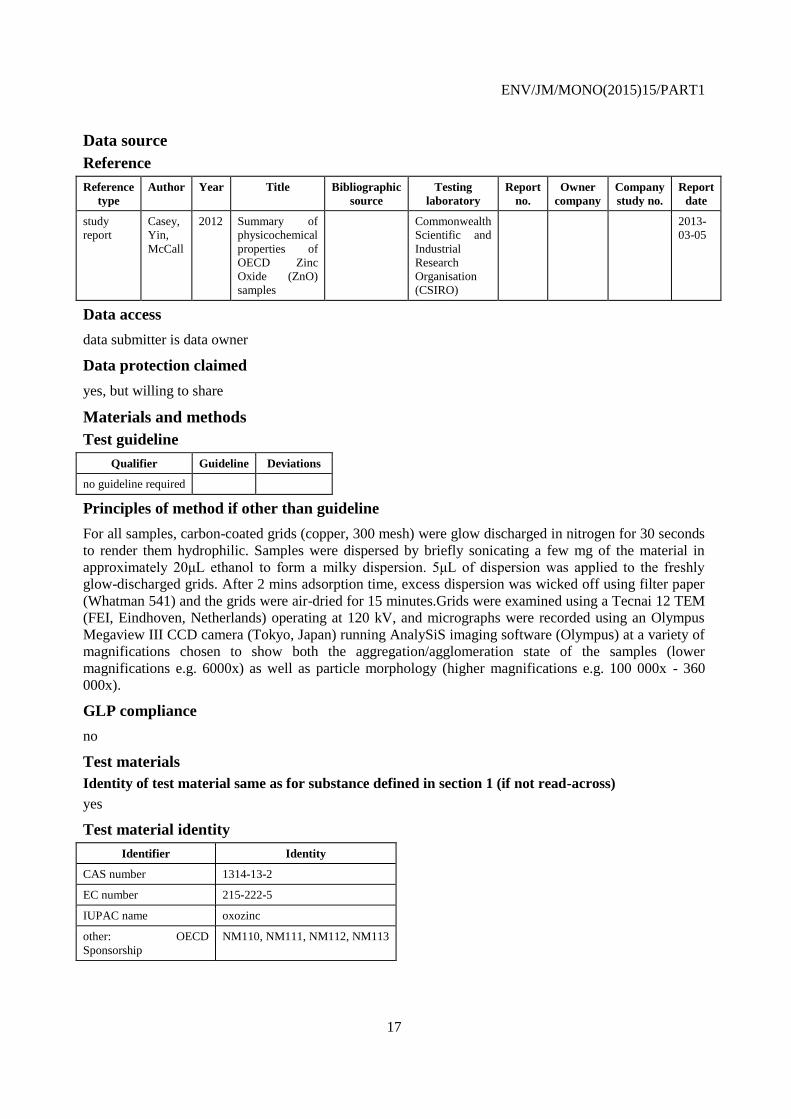
Data source
Reference
Reference
type
Author Year Title Bibliographic
source
Testing
laboratory
Report
no.
Owner
company
Company
study no.
Report
date
study
report
Casey,
Yin,
McCall
2012 Summary of
physicochemical
properties of
OECD Zinc
Oxide (ZnO)
samples
Commonwealth
Scientific and
Industrial
Research
Organisation
(CSIRO)
2013-
03-05
Data access
data submitter is data owner
Data protection claimed
yes, but willing to share
Materials and methods
Test guideline
Qualifier Guideline Deviations
no guideline required
Principles of method if other than guideline
For all samples, carbon-coated grids (copper, 300 mesh) were glow discharged in nitrogen for 30 seconds
to render them hydrophilic. Samples were dispersed by briefly sonicating a few mg of the material in
approximately 20μL ethanol to form a milky dispersion. 5μL of dispersion was applied to the freshly
glow-discharged grids. After 2 mins adsorption time, excess dispersion was wicked off using filter paper
(Whatman 541) and the grids were air-dried for 15 minutes.Grids were examined using a Tecnai 12 TEM
(FEI, Eindhoven, Netherlands) operating at 120 kV, and micrographs were recorded using an Olympus
Megaview III CCD camera (Tokyo, Japan) running AnalySiS imaging software (Olympus) at a variety of
magnifications chosen to show both the aggregation/agglomeration state of the samples (lower
magnifications e.g. 6000x) as well as particle morphology (higher magnifications e.g. 100 000x - 360
000x).
GLP compliance
no
Test materials
Identity of test material same as for substance defined in section 1 (if not read-across)
yes
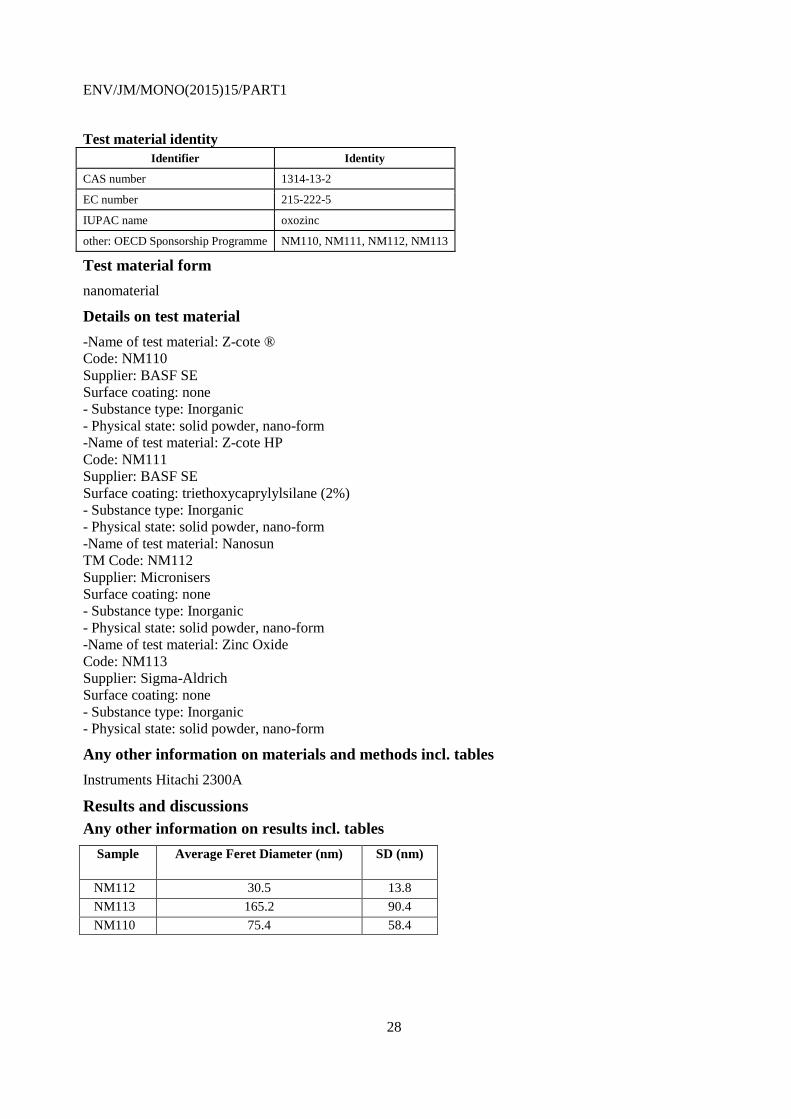
Test material identity
Identifier Identity
CAS number 1314-13-2
EC number 215-222-5
IUPAC name oxozinc
other: OECD
Sponsorship
NM110, NM111, NM112, NM113
ENV/JM/MONO(2015)15/PART1
18
Test material form
nanomaterial
Details on test material
-Name of test material: Z-cote ®
Code: NM110Supplier: BASF SE
Surface coating: none
- Substance type: Inorganic
- Physical state: solid powder, nano-form
-Name of test material: Z-cote HP
Code: NM111Supplier: BASF SE
Surface coating: triethoxycaprylylsilane (2%)
- Substance type: Inorganic
- Physical state: solid powder, nano-form
-Name of test material: Nanosun
TM Code: NM112
Supplier: Micronisers
Surface coating: none
- Substance type: Inorganic
- Physical state: solid powder, nano-form
-Name of test material: Zinc Oxide
Code: NM113Supplier: Sigma-Aldrich
Surface coating: none
- Substance type: Inorganic
- Physical state: solid powder, nano-form
Results and discussion
Physical state at 20°C and 1013 hPa
solid
Form
nanomaterial
Odour
odourless
Substance type
inorganic
Overall remarks, attachments
Remarks on results including tables and figures
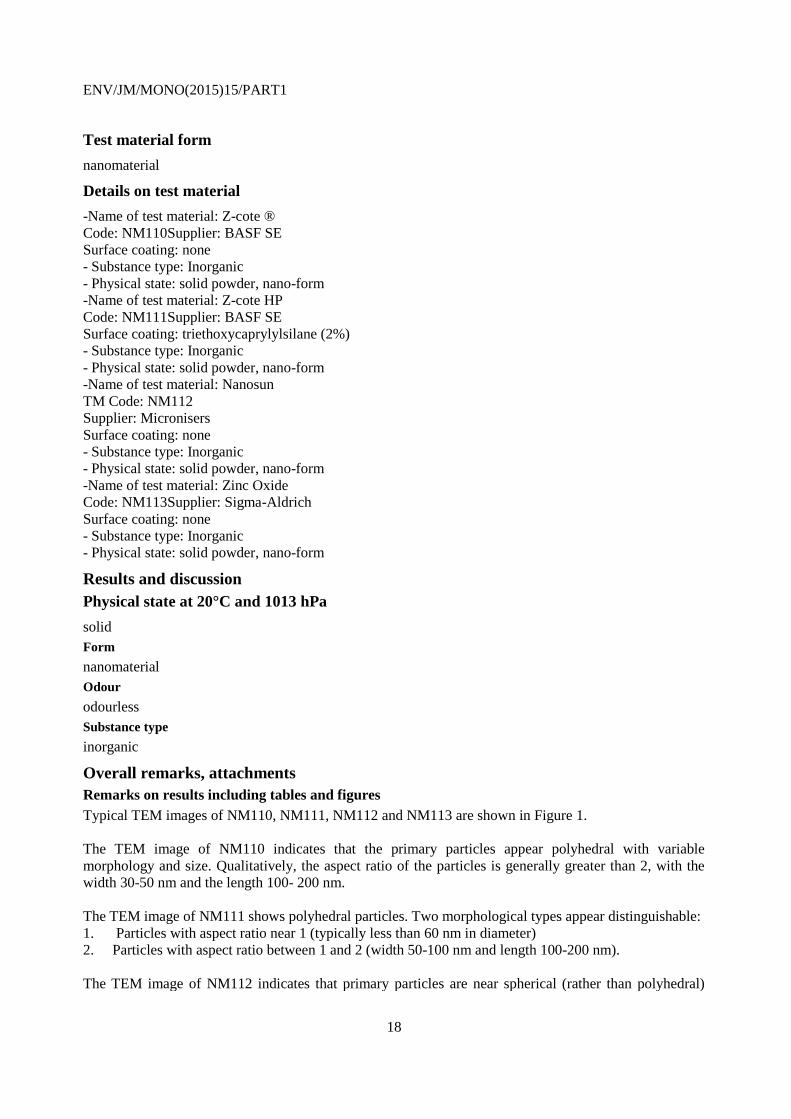
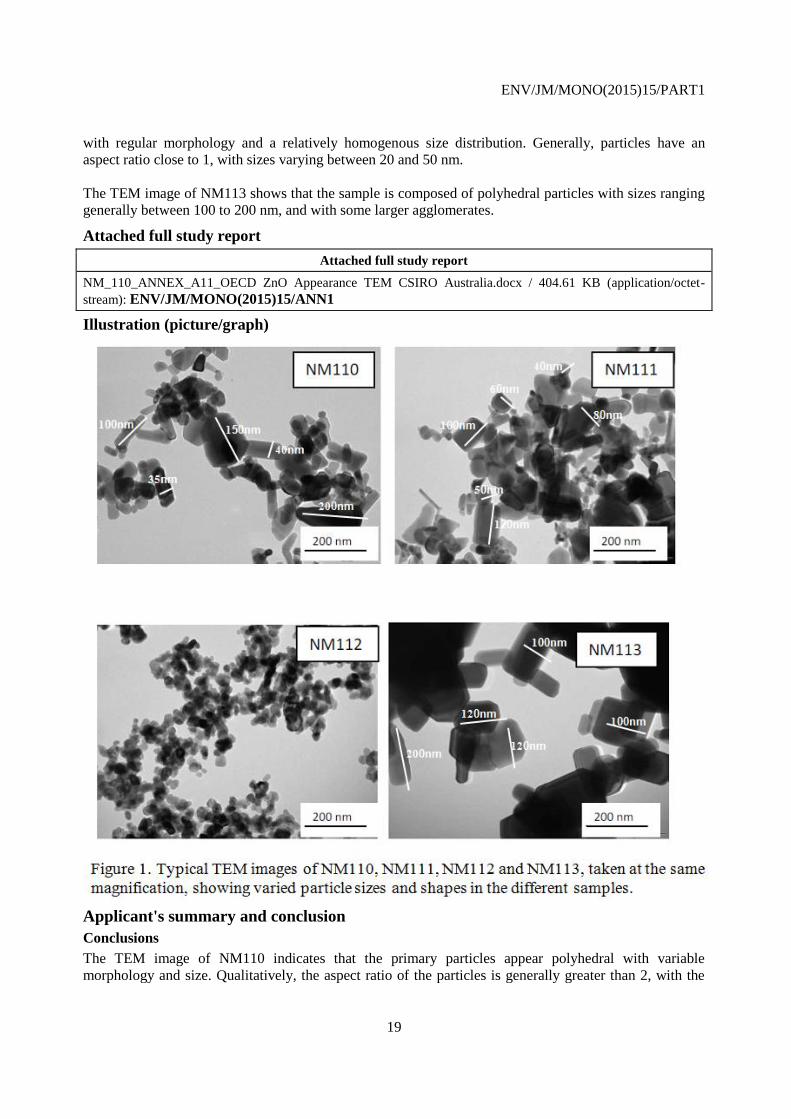
Typical TEM images of NM110, NM111, NM112 and NM113 are shown in Figure 1.
The TEM image of NM110 indicates that the primary particles appear polyhedral with variable
morphology and size. Qualitatively, the aspect ratio of the particles is generally greater than 2, with the
width 30-50 nm and the length 100- 200 nm.
The TEM image of NM111 shows polyhedral particles. Two morphological types appear distinguishable:
1. Particles with aspect ratio near 1 (typically less than 60 nm in diameter)
2. Particles with aspect ratio between 1 and 2 (width 50-100 nm and length 100-200 nm).
The TEM image of NM112 indicates that primary particles are near spherical (rather than polyhedral)
ENV/JM/MONO(2015)15/PART1
19
with regular morphology and a relatively homogenous size distribution. Generally, particles have an
aspect ratio close to 1, with sizes varying between 20 and 50 nm.
The TEM image of NM113 shows that the sample is composed of polyhedral particles with sizes ranging
generally between 100 to 200 nm, and with some larger agglomerates.
Attached full study report
Attached full study report
NM_110_ANNEX_A11_OECD ZnO Appearance TEM CSIRO Australia.docx / 404.61 KB (application/octet-
stream): ENV/JM/MONO(2015)15/ANN1
Illustration (picture/graph)
Applicant's summary and conclusion
Conclusions
The TEM image of NM110 indicates that the primary particles appear polyhedral with variable
morphology and size. Qualitatively, the aspect ratio of the particles is generally greater than 2, with the
ENV/JM/MONO(2015)15/PART1
20
width 30-50 nm and the length 100- 200 nm.
Executive summary
A study was conducted by CSIRO, 2012) to characterise the ZnO nanomaterials. All samples were glow
discharged in nitrogen for 30 seconds to render them hydrophilic. Samples were dispersed by briefly
sonicating a few milligram of the material in approximately 20 µl ethanol to form a milky dispersion. 5
µL of dispersion was applied to the freshly glow-discharged grids. After 2 min adsorption time, excess
dispersion was wicked off using filter paper and the grids were air-dried for 15 min. Grids were examined
using a Tecnai 12 TEM (FEI, Eindhoven, Netherlands) operating at 120 kV, and micrographs were
recorded using an Olympus Megaview III CCD camera (Tokyo, Japan) running AnalySiS imaging
software (Olympus) at a variety of magnifications chosen to show both the aggregation/agglomeration
state of the samples (lower magnifications e.g. 6000x) as well as particle morphology (higher
magnifications e.g. 100000x - 360000x).The four TEM images of the nanomaterials showing varied
particle sizes and shapes in the different samples. The TEM image of NM-110 indicated that the primary
particles appeared polyhedral with variable morphology and size. Two main types of morphology could
be distinguished:
- Particles with aspect ratio close to 1 (typically 20 – 250 nm size and very few particles of approx.
400 nm size) and hexagonal morphology
- Particles with aspect ratio 2 to 7.5 (50 – 350 nm) with cubic, tetragonal and orthorhombic morphologies.
The TEM image of NM-111 indicated that the primary particles appeared polyhedral and with variable
morphology as observed in NM-110, but with different size distributions:
- Particles with aspect ratio near 1 (~90 % in the 20 – 200 nm range)
- Particles with aspect ratio 2 to 8.5 (~90 % in the 10 – 450 nm range
The TEM image of NM-112 indicated that primary particles were near spherical (rather than polyhedral)
with regular morphology and a relatively homogenous size distribution. Generally, particles had an aspect
ratio close to 1, with sizes varying between 20 and 50 nm and appeared distinctly different to all the other
samples (NM-110, NM-111 and NM-113).
- Particles with aspect ratio near 1 (typically in the 80 – 100 nm range)
- Particles with aspect ratio > 2 (typically in the 180 – > 200 nm range)
The TEM image of NM-113 showed that the sample was composed of polyhedral particles with sizes
ranging generally between 100 to 200 nm, and with some larger agglomerates.
Endpoint study record: supporting_2012-03-
06_Australia_Deakin_Appearance_TEM
Administrative Data
Purpose flag supporting study
Study result type experimental result
Reliability 2 (reliable with restrictions)
Rationale for
reliability incl.
deficiencies
The documentation provide in the full study report was sufficient for the data evaluation but there were
some limitations within the study. The procedure for subsampling and data analysis and representation
was not explained in detail. According to the ECHA Guidance it is recommended to provide a
combination of terms and/or measurands to describe shape. Geometric macroshape descriptors were
available in ISO 9276-6:2008. Thus, the study was regarded as reliable with restrictions.
ENV/JM/MONO(2015)15/PART1
21
Data source
Reference
Reference
type
Author Year Title Bibliographic
source
Testing
laboratory
Report
no.
Owner
company
Company
study no.
Report
date
study
report
T Tsuzuki,
R He, R
Chaudhary
2012 Appearance
(by TEM)
Deakin
University
2012-
01-03
Data access
data submitter is data owner
Data protection claimed
yes, but willing to share
Materials and methods
Test guideline
Qualifier Guideline Deviations
no guideline followed
Principles of method if other than guideline
No details provided.
GLP compliance
no
Test materials
Identity of test material same as for substance defined in section 1 (if not read-across)
yes
Test material identity
Identifier Identity
CAS number 1314-13-2
CAS name 215-222-5
IUPAC name oxozinc
other: OECD Sponsorship Programme NM110, NM111, NM112, NM113
Test material form
nanomaterial
Details on test material
-Name of test material: Z-cote ®Code: NM110
Supplier: BASF SE
Surface coating: none
- Substance type: Inorganic
- Physical state: solid powder, nano-form
-Name of test material: Z-cote HP
Code: NM111
Supplier: BASF SE
Surface coating: triethoxycaprylylsilane (2%)
- Substance type: Inorganic
- Physical state: solid powder, nano-form
-Name of test material: Nanosun
ENV/JM/MONO(2015)15/PART1
22
TM Code: NM112
Supplier: Micronisers
Surface coating: none
- Substance type: Inorganic
- Physical state: solid powder, nano-form
-Name of test material: Zinc Oxide
Code: NM113
Supplier: Sigma-Aldrich
Surface coating: none
- Substance type: Inorganic
- Physical state: solid powder, nano-form
Any other information on materials and methods incl. tables
Measurement principle: Transmission electron microscopy
Instrument: JEOL JEM-2100
Sample preparation: TEM specimen was prepared by evaporating a drop of the nanoparticle dispersion on
a carbon-coated specimen grid.
Measurement parameters: electron beam energy 200 kV
Results and discussion
Physical state at 20°C and 1013 hPa
solid
Form
nanomaterial
Odour
odourless
Substance type
inorganic
Overall remarks, attachments
Remarks on results including tables and figures
Geometrical shapes with some sintering, indicating that the synthesis technique is a vapour phase
involving a high temperature. Geometrical shapes indicate high crystallinity and low surface defects.
Wide distributions of shapes and sizes of primary particles.
Attached full study report
Attached full study report
NM_110_ANNEX_A12_OECD ZnO TEM Australia Deakin.pdf / 430.09 KB (application/octet-stream):
ENV/JM/MONO(2015)15/ANN1
Illustration (picture/graph)

ENV/JM/MONO(2015)15/PART1
23
Applicant's summary and conclusion
Conclusions
The TEM image of NM 110 and NM 111 indicated wide distributions of shapes and sizes of primary
particles. Furthermore the geometrical shapes indicated high crystallinity and low surface defects. The
TEM image of NM 112 indicated near spherical shape of the primary particles and a high number of
surface defects. The TEM image of NM 113 indicated geometrical shapes and large particle sizes (>100
nm in diameter).
Executive summary
Deakin University, 2012 investigated the shape of the nanomaterials. TEM specimen were prepared by
evaporating a drop of the nanoparticle dispersion on a carbon-coated specimen grid. Grids were examined
using a JEOL JEM-2100 TEM operating at 200 kV. No further details about the sample preparation and
the method parameter were available. The TEM image of NM-110 and NM-111 indicated wide
distributions of shapes and sizes of primary particles. Furthermore the geometrical shapes indicated high
ENV/JM/MONO(2015)15/PART1
24
crystallinity and low surface defects. The TEM image of NM-112 indicated near spherical shape of the
primary particles and a high number of surface defects. The TEM image of NM-113 indicated
geometrical shapes and large particle sizes (>100 nm in diameter).
4.2 Melting point/freezing point
4.3 Boiling point
4.4 Density
4.5 Particle size distribution (Granulometry)
Endpoint summary: Particle size distribution (Granulometry)
Administrative Data
Short description of key information
The basic assumption (NM 113 as “bulk material” has the largest particle size) could be confirmed by
particle size determination. Throughout all measurements NM 112 was determined to have the smallest
particle size compared to the other nanomaterials. The results of the different measurements of NM 110
and NM 111 samples showed that these 2 nanomaterials have a comparable particle size. This general
trend was also observed for the endpoints density and surface area, which are directly linked to the
particle size.The mean particle size of the nanomaterials was determined to be 77.5 ± 18 nm for NM-110,
75.2 ± 7.6 nm for NM-111, 33.75 ± 6.2 nm for NM-112 and 149.7 ± 25 nm for nm 113 respectively.
Discussion
Several studies using different analytical techniques were available for particle size of the investigated
nanomaterials and were assessed in a weight of evidence approach.
The National Physical Laboratory (NPL), 2010 investigated the particle size distribution of the 4 test
items. In accordance with the ECHA guidance size distribution was investigated using multiple
techniques. According to the OECD guidance no single suitable and validated procedure is currently
available. Therefore different analytical measures using Transmission Electron Microscopy (TEM),
Scanning Electron Microscopy (SEM), Dynamic Light Scattering (DLS), Scanning Mobility Particle
Sizer (SMPS), centrifugal sedimentation method (CPS) and X-ray diffraction (XRD) were conducted
NPL, 2010 investigated the particle size of the test items NM-110, NM-112 and NM-113 using TEM.
Therefore a nanomaterial sample dispersion of 50 mg/L was made in accordance to the OECD
recommended protocol for sample dispersion. The dispersion was allowed to settle out in order to remove
the larger particles naturally as it sediments by gravity. The purpose of this sedimentation was to remove
large micron size particles. On day 2, there was clear visible evidence of sedimentation events of the
larger micron size particles having taken place. Two microliter aliquots were extracted from the top layer
(an opaque but slightly transparent layer). The sample was placed on TEM grids and allowed to air dry
for 10 minutes; grids are formvar/carbon on 400 meshes copper. Grids were used as supplied with no
further modification. All images were recorded using a Hitachi 2300 A instrument operated at 200 kV.
An adequate magnification was chosen for image acquisition e.g. for the estimation of primary particle
mean diameter. TEM micrographs were analysed by manually tracing contours of primary particles on to
a transparency sheet. The transparency sheet was scanned for further image analysis using ImageJ
software, which automatically calculated particle diameter dimensions. Furthermore an extremely small
area of the sample could be analysed, which might not be representative enough for the whole sample.
ENV/JM/MONO(2015)15/PART1
25
The comparatively small share of evaluated particles results in limited statistical precision. The mean
primary particle size was quoted with the corresponding standard deviation which represents the
broadness of the size distribution.
Based on the measurements of 77 particles the mean particle size of the NM 110 was determined to be
75.4 ± 58.4 nm.
Based on the measurements of 312 particles the mean particle size of the NM 111 was determined to be
30.5 ± 13.8 nm.
Based on the measurements of 87 particles the mean particle size of NM 113 was determined to be 165.2
± 90.4 nm.
NPL, 2010 investigated the particle size of the test items NM-110, NM-112 and NM-113 also using DLS.
Hydrodynamic size (z-average mean) measurements were obtained using a Zetasizer Nano ZS (Malvern
Instruments,UK) equipped with a 633 nm laser. A reference standard (polystyrene, latex bead, nominal
size of 100 nm, NIST traceable) was used to qualify the performance of the instrument. Sample analysis
involved filling of a disposable capillary cell (DTS1060, Malvern). Prior to their use, these cells were
thoroughly cleaned with ethanol and de-ionised water, as recommended by the instrument vendor.
Individual cell was then filled with the appropriate sample and flushed before re-filling; measurement was
carried out on the second filling. Malvern Instrument’s Dispersion Technology software (Version 4.0)
was used for data analysis. For particle size it was the z average diameter (the mean hydrodynamic
diameter) that was reported. The protocol for sample preparation was described by Tantra, R., Jing,S. and
Gohil, D.in Technical issues surrounding the preparation, characterisation and testing of nanoparticles for
ecotoxicological studies, in Environmental Toxicology 3, V.B. Popov, C.A. , Editor. 2010, WIT Press p.
165-176. The mean particle size of three distributions was determined to be 275 nm for NM-110, 253 nm
for NM-112 and 508 nm for NM-113 respectively.
NPL, 2010 determined the particle size distribution of Aerosolised nanomaterials by SMPS consisting of
a Differential Mobility Analyser (DMA) and Condensation Particle Counters (CPC) system. The DMA
within the SMPS was calibrated using reference material polystyrene latex beads from NIST. TSI
Fluidised Bed Aerosol Generator (FBAG) was used to produce an aerosol from the dry powder sample.
After introduction of the nanomaterial into the FBAG, the aerosol generated was allowed to stabilise for a
day prior to sending the aerosol to an SMPS. The CPC within the SMPS setup were calibrated according
to NPL’s UKAS accredited (ISO 17025) procedure, using an internally calibrated Faraday Cup
Electrometer and soot generator (model CAST 2). The SMPS was set to record at 4 minute intervals; at
least 6 SMPS scans of 200 seconds each were used for analysis. The data was processed using TSI
Aerosol Instrument Management (AIM) software, in which the mean size distribution from the stable
time segment was estimated. The size distribution was also analysed using an in-house curvefitting
program (as implemented in a recent SMPS intercomparison at METAS). The range of the SMPS size
distribution measurement was 16-660 nm. The Geometric Mean diameter and Geometric Standard
Deviation for each size distribution was estimated by fitting a log-normal curve to the size distribution
data plot. Each plot represents the mean values of at least 6 SMPS scans of 200 seconds each. The
Geometric Mean Particle Size was determined to be 289 nm for NM-110, 400 nm for NM-111, 269 nm
for NM-112 and 300 nm for NM-113 respectively.
NPL, 2010 investigated the particle size distribution of the NM-110 by SEM. SEM images were obtained
using a Supra 40 field emission scanning electron microscope from Carl Zeiss in which the optimal
spatial resolution of the microscope was a few nanometres. In-lens detector images were acquired at an
accelerating voltage of 15 kV, a working distance of ≈ 3 mm, and a tilt angle 0°. SEM instrument was
calibrated using a SIRA grid calibration set (SIRA, Chislehurst, Kent, UK). These are metal replicas of
cross ruled gratings of area of 60 mm2 with 19.7 lines/mm for low magnification and 2160 lines/mm for
high magnification calibrations, accurate to 0.2 %. For analysis of the “as received” nanoparticle powder,
a sample of the powder was sprinkled over a SEM carbon adhesive disc; one side of the carbon disc was
ENV/JM/MONO(2015)15/PART1
26
placed securely on a metal stub, whilst the other side was exposed to the nanoparticle powder. Excess
powder was removed by gently tapping the stub on its side until a light coating of powder on the surface
became apparent. An adequate magnification was chosen for image acquisition e.g. for the estimation of
primary particle mean diameter. The shape and limits of the primary particles should become apparent.
The SEM images were opened in ImageJ (a free image analysis program produced and distributed by the
National Institute of Health, US) installed on a Tablet PC (DELL XT1), and for each image at least 20
distinct particles identified, to measure at least 100 particles per replicate. The particles chosen were an
array of sizes to accurately represent the variety in the sample. Using the Pencil Tool (pencil width 2
pixels, colour black) the outlines of these particles were drawn using the supplied digital ‘pen’. The image
was calibrated with reference to the scale marking on the image. Then the threshold level adjusted so that
only the particle outlines were highlighted. The particles were then measured using the Analyze Particles
tool, which produced a results table of various measurements of the particles. This process was repeated
for each image of the particular replicate (seven in total – giving a minimum of 140 particles identified.
Feret’s diameter – also called the “maximum calliper length”, i.e. the longest distance between any two
points along the selection boundary - was recorded and the scientific graphing and analysis software,
SciDAVis, where a histogram (bin size 2) was plotted, showing the particle size distribution of the
replicate. The entire process was repeated for each replicate (r1, r2, r3) for all six sub-samples of both the
ZnO and NM-110 samples. From the SEM image a broad range of particle sizes were seen from small
(20-50 nm) circular or spherical particles, to much larger (>100 nm) rod shaped particles. Overall, the
particle size distributions between replicates per sub-sample are very similar, only differing by an average
range of 14.6nm for the ZnO-HP1 sample and 8.4nm for the ZnO sample. An exception however, is the
difference in the replicates of sub-sample 0830 for NM-100.The mean particle size for NM-110 is in the
range 70-80nm, and for the ZnO sample the range 100-111nm. Except for sub-sample 1455 which is
93.3nm, larger than that of the other sub-samples for NM-110 and for ZnO, sub-sample 0599 at 90.3nm
has a comparatively small mean particle size.
In conclusion the study conducted by CSIRO, 2012 was regarded as most reliable as the methodical
comparison of particle size lead to high reliability as the results using different analytical techniques leads
to comparable results. These results were furthermore supplemented by the other studies.
Endpoint study record: WoE_2010_06-17_NPL for PROSPECT_Particle
size,size distribution_TEM
Administrative Data
Purpose flag weight of evidence
Study result type experimental result
Reliability 2 (reliable with restrictions)
Rationale for
reliability incl.
deficiencies
The study was regarded as in general scientifically acceptable. Nevertheless, only limited
documentation of the data evaluation was provided in the full study reports. Thus, it was not
possible to assess the validity of the provided data as the sample preparation and the data
analysis could have a significant influence to the result. In general it should be possible to
calculate the Particle size distribution from TEM data. Furthermore respective ISO guidelines
are available (ISO/TR 27628:2007. ISO/13322-1:2004 and ISO/13322-2:2006). It was not
indicated in the report if the experiment was conducted in accordance with these guidance
documents (in the absence of a validated OECD guideline). The evaluated particles (ca. 1,000
was regarded as sufficient for data evaluation as the NanoDefine project and its recently
published guidance on TEM evaluation does not require more than 1000 particles.
Furthermore the used protocol for sample preparation is not recommended by NanoDefine or
other sources, and can introduce biais towards smaller particles. Thus, the study was regarded
as reliable with restrictions.

ENV/JM/MONO(2015)15/PART1
27
Data source
Reference
Reference
type
Author Year Title Bibliographic
source
Testing
laboratory
Report
no.
Owner
company
Company
study no.
Report
date
study
report
National
Physical
Laboratory
2010 PROTOCOL
for TEM
image
acquisition
and analysis
National
Physical
Laboratory
Hampton
Road
Teddington
Middlesex
TW11 0LW
2010-
06-17
Data access
data submitter is data owner
Data protection claimed
yes, but willing to share
Materials and methods
Type of distribution
other: determined by Transmission electron microscopy
Principles of method if other than guideline
Nanomaterial sample dispersion of 50 mg/L was made in accordance to the OECD recommended
protocol for sample dispersion. The dispersion was allowed to settle out in order to remove the larger
particles naturally as it sediments by gravity. The purpose of this sedimentation was to remove large
micron size particles; TEM sample preparation is crucial and particles up to ~ 200 nm thick are required
for acquiring successful transmission images. On day 2, there was clear visible evidence of sedimentation
events of the larger micron size particles having taken place. 2 microliter aliquots were extracted from the
top layer (an opaque but slightly transparent layer). The sample was placed on TEM grids and allowed to
air dry for 10 minutes; grids are formvar/carbon on 400 mesh copper (purchased from Agar Scientific
UK). Grids were used as supplied with no further modification. All images were acquired using a Hitachi
2300A instrument operated at 200 kV. The instrument is based at the University of Surrey, Guildford and
analysis was carried out by NPL personnel. An adequate magnification was chosen for image acquisition
e.g. for the estimation of primary particle mean diameter. The shape and limits of the primary particles
should become apparent. TEM micrographs were analysed by manually tracing contours of primary
particles on to a transparency sheet. The transparency sheet was scanned for further image analysis using
ImageJ software, which automatically calculated particle diameter dimensions. The mean primary particle
size was quoted with the corresponding standard deviation; note that the s.d. here represents the broadness
of the size distribution (not error).
GLP compliance
no
Test materials
Identity of test material same as for substance defined in section 1 (if not read-across)
yes
ENV/JM/MONO(2015)15/PART1
28
Test material identity
Identifier Identity
CAS number 1314-13-2
EC number 215-222-5
IUPAC name oxozinc
other: OECD Sponsorship Programme NM110, NM111, NM112, NM113
Test material form
nanomaterial
Details on test material
-Name of test material: Z-cote ®
Code: NM110
Supplier: BASF SE
Surface coating: none
- Substance type: Inorganic
- Physical state: solid powder, nano-form
-Name of test material: Z-cote HP
Code: NM111
Supplier: BASF SE
Surface coating: triethoxycaprylylsilane (2%)
- Substance type: Inorganic
- Physical state: solid powder, nano-form
-Name of test material: Nanosun
TM Code: NM112
Supplier: Micronisers
Surface coating: none
- Substance type: Inorganic
- Physical state: solid powder, nano-form
-Name of test material: Zinc Oxide
Code: NM113
Supplier: Sigma-Aldrich
Surface coating: none
- Substance type: Inorganic
- Physical state: solid powder, nano-form
Any other information on materials and methods incl. tables
Instruments Hitachi 2300A
Results and discussions
Any other information on results incl. tables
Sample Average Feret Diameter (nm) SD (nm)
NM112 30.5 13.8
NM113 165.2 90.4
NM110 75.4 58.4

ENV/JM/MONO(2015)15/PART1
29
Overall remarks, attachments
Attached full study report
Attached full study report
NM_110_ANNEX_A15_ TEM data from NPL.doc / 1.39 MB (application/octet-stream):
ENV/JM/MONO(2015)15/ANN2
Applicant's summary and conclusion
Conclusions
Based on the measurements of 77 particles the mean particle size of the NM 110 was determined to be
75.4 ± 58.4 nm. Based on the measurements of 312 particles the mean particle size of the NM 111 was
determined to be 30.5 ± 13.8 nm. Based on the measurements of 87 particles the mean particle size of
NM 113 was determined to be 165.2 ± 90.4 nm.
Executive summary
NPL, 2010 investigated the particle size of the test items NM-110, NM-112 and NM-113 using TEM.
Therefore a nanomaterial sample dispersion of 50 mg/L was made in accordance to the OECD
recommended protocol for sample dispersion. The dispersion was allowed to settle out in order to remove
the larger particles naturally as it sediments by gravity. The purpose of this sedimentation was to remove
large micron size particles. On day 2, there was clear visible evidence of sedimentation events of the
larger micron size particles having taken place. Two microliter aliquots were extracted from the top layer
(an opaque but slightly transparent layer). The sample was placed on TEM grids and allowed to air dry
for 10 minutes; grids are formvar/carbon on 400 meshes copper. Grids were used as supplied with no
further modification. All images were recorded using a Hitachi 2300 A instrument operated at 200 kV.
An adequate magnification was chosen for image acquisition e.g. for the estimation of primary particle
mean diameter. TEM micrographs were analysed by manually tracing contours of primary particles on to
a transparency sheet. The transparency sheet was scanned for further image analysis using ImageJ
software, which automatically calculated particle diameter dimensions. Furthermore an extremely small
area of the sample could be analysed, which might not be representative enough for the whole sample.
The comparatively small share of evaluated particles results in limited statistical precision. The mean
primary particle size was quoted with the corresponding standard deviation which represents the
broadness of the size distribution.
Based on the measurements of 77 particles the mean particle size of the NM 110 was determined to be
75.4 ± 58.4 nm.
Based on the measurements of 312 particles the mean particle size of the NM 111 was determined to be
30.5 ± 13.8 nm.
Based on the measurements of 87 particles the mean particle size of NM 113 was determined to be 165.2
± 90.4 nm.
Endpoint study record: WoE_2010-06-17_NPL for PROSPECT_Particle size,
size distribution_DLS
Administrative Data
Purpose flag weight of evidence
Study result type experimental result
Reliability 2 (reliable with restrictions)
Rationale for
reliability incl.
deficiencies
The study was regarded as in general scientifically acceptable. It was not indicated in the
report if the experiment was conducted in accordance with available guidance documents. The
procedure of the sample preparation and subsampling was provided and regarded as
sufficient. In conclusion the study was regarded as reliable with restrictions and reliable for
the weight of evidence approach.
ENV/JM/MONO(2015)15/PART1
30
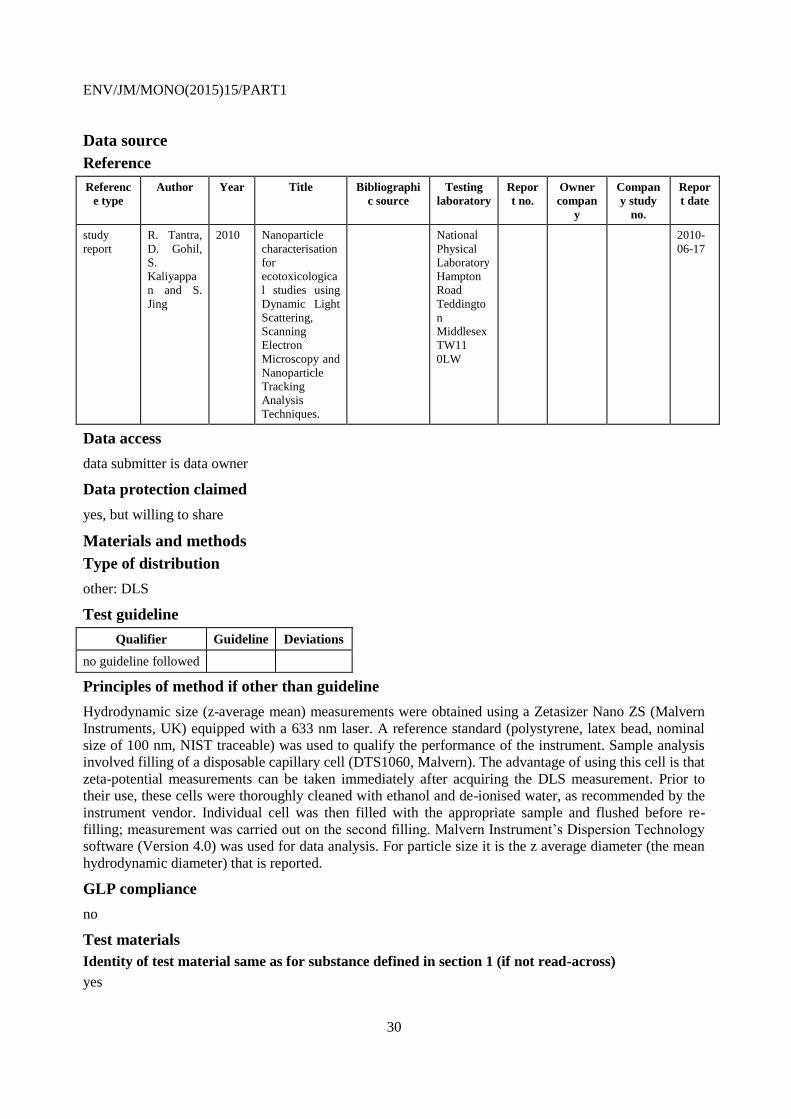
Data source
Reference
Referenc
e type
Author Year Title Bibliographi
c source
Testing
laboratory
Repor
t no.
Owner
compan
y
Compan
y study
no.
Repor
t date
study
report
R. Tantra,
D. Gohil,
S.
Kaliyappa
n and S.
Jing
2010 Nanoparticle
characterisation
for
ecotoxicologica
l studies using
Dynamic Light
Scattering,
Scanning
Electron
Microscopy and
Nanoparticle
Tracking
Analysis
Techniques.
National
Physical
Laboratory
Hampton
Road
Teddingto
n
Middlesex
TW11
0LW
2010-
06-17
Data access
data submitter is data owner
Data protection claimed
yes, but willing to share
Materials and methods
Type of distribution
other: DLS
Test guideline
Qualifier Guideline Deviations
no guideline followed
Principles of method if other than guideline
Hydrodynamic size (z-average mean) measurements were obtained using a Zetasizer Nano ZS (Malvern
Instruments, UK) equipped with a 633 nm laser. A reference standard (polystyrene, latex bead, nominal
size of 100 nm, NIST traceable) was used to qualify the performance of the instrument. Sample analysis
involved filling of a disposable capillary cell (DTS1060, Malvern). The advantage of using this cell is that
zeta-potential measurements can be taken immediately after acquiring the DLS measurement. Prior to
their use, these cells were thoroughly cleaned with ethanol and de-ionised water, as recommended by the
instrument vendor. Individual cell was then filled with the appropriate sample and flushed before re-
filling; measurement was carried out on the second filling. Malvern Instrument’s Dispersion Technology
software (Version 4.0) was used for data analysis. For particle size it is the z average diameter (the mean
hydrodynamic diameter) that is reported.
GLP compliance
no
Test materials
Identity of test material same as for substance defined in section 1 (if not read-across)
yes
ENV/JM/MONO(2015)15/PART1
31
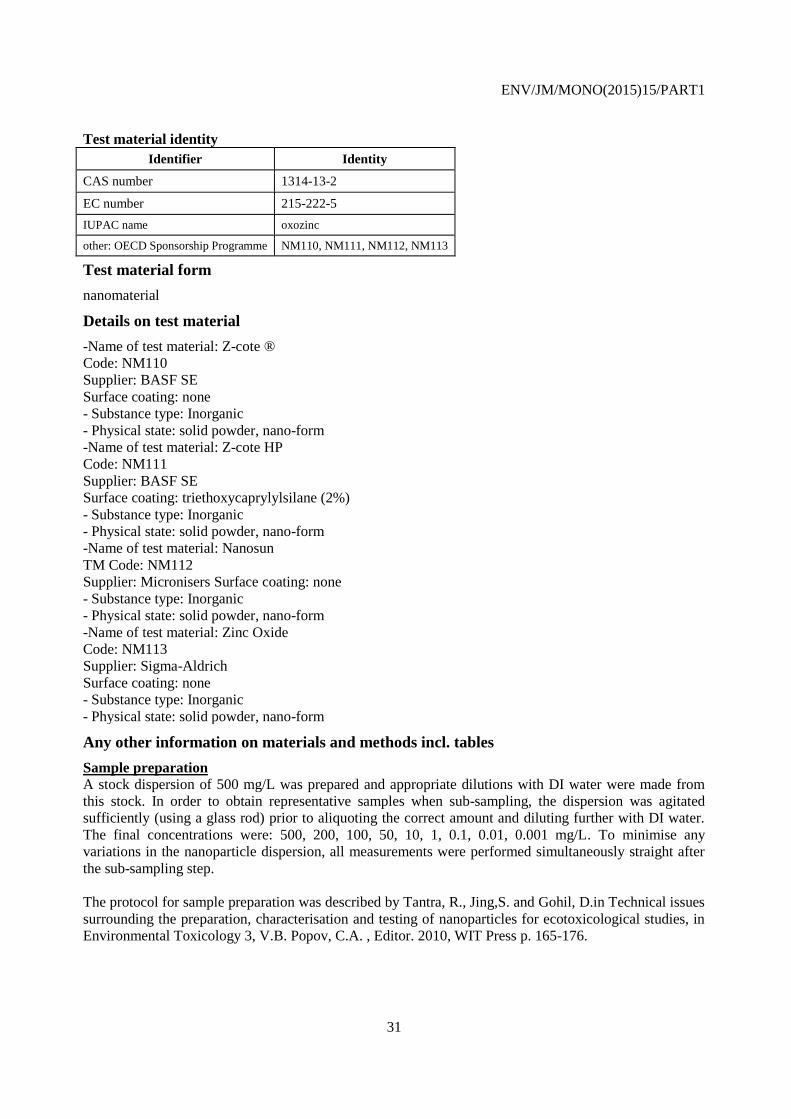
Test material identity
Identifier Identity
CAS number 1314-13-2
EC number 215-222-5
IUPAC name oxozinc
other: OECD Sponsorship Programme NM110, NM111, NM112, NM113
Test material form
nanomaterial
Details on test material
-Name of test material: Z-cote ®
Code: NM110
Supplier: BASF SE
Surface coating: none
- Substance type: Inorganic
- Physical state: solid powder, nano-form
-Name of test material: Z-cote HP
Code: NM111
Supplier: BASF SE
Surface coating: triethoxycaprylylsilane (2%)
- Substance type: Inorganic
- Physical state: solid powder, nano-form
-Name of test material: Nanosun
TM Code: NM112
Supplier: Micronisers Surface coating: none
- Substance type: Inorganic
- Physical state: solid powder, nano-form
-Name of test material: Zinc Oxide
Code: NM113
Supplier: Sigma-Aldrich
Surface coating: none
- Substance type: Inorganic
- Physical state: solid powder, nano-form
Any other information on materials and methods incl. tables
Sample preparation A stock dispersion of 500 mg/L was prepared and appropriate dilutions with DI water were made from
this stock. In order to obtain representative samples when sub-sampling, the dispersion was agitated
sufficiently (using a glass rod) prior to aliquoting the correct amount and diluting further with DI water.
The final concentrations were: 500, 200, 100, 50, 10, 1, 0.1, 0.01, 0.001 mg/L. To minimise any
variations in the nanoparticle dispersion, all measurements were performed simultaneously straight after
the sub-sampling step.
The protocol for sample preparation was described by Tantra, R., Jing,S. and Gohil, D.in Technical issues
surrounding the preparation, characterisation and testing of nanoparticles for ecotoxicological studies, in
Environmental Toxicology 3, V.B. Popov, C.A. , Editor. 2010, WIT Press p. 165-176.
ENV/JM/MONO(2015)15/PART1
32
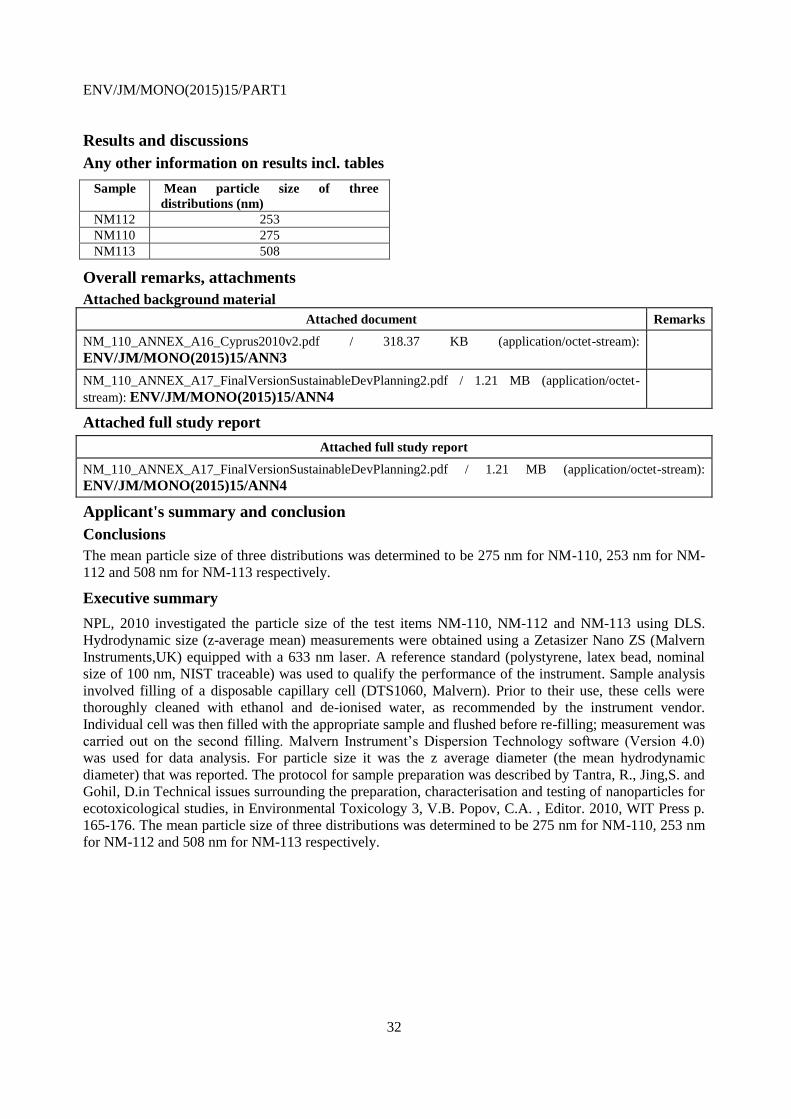
Results and discussions
Any other information on results incl. tables
Sample Mean particle size of three
distributions (nm)
NM112 253
NM110 275
NM113 508
Overall remarks, attachments
Attached background material
Attached document Remarks
NM_110_ANNEX_A16_Cyprus2010v2.pdf / 318.37 KB (application/octet-stream):
ENV/JM/MONO(2015)15/ANN3
NM_110_ANNEX_A17_FinalVersionSustainableDevPlanning2.pdf / 1.21 MB (application/octet-
stream): ENV/JM/MONO(2015)15/ANN4
Attached full study report
Attached full study report
NM_110_ANNEX_A17_FinalVersionSustainableDevPlanning2.pdf / 1.21 MB (application/octet-stream):
ENV/JM/MONO(2015)15/ANN4
Applicant's summary and conclusion
Conclusions
The mean particle size of three distributions was determined to be 275 nm for NM-110, 253 nm for NM-
112 and 508 nm for NM-113 respectively.
Executive summary
NPL, 2010 investigated the particle size of the test items NM-110, NM-112 and NM-113 using DLS.
Hydrodynamic size (z-average mean) measurements were obtained using a Zetasizer Nano ZS (Malvern
Instruments,UK) equipped with a 633 nm laser. A reference standard (polystyrene, latex bead, nominal
size of 100 nm, NIST traceable) was used to qualify the performance of the instrument. Sample analysis
involved filling of a disposable capillary cell (DTS1060, Malvern). Prior to their use, these cells were
thoroughly cleaned with ethanol and de-ionised water, as recommended by the instrument vendor.
Individual cell was then filled with the appropriate sample and flushed before re-filling; measurement was
carried out on the second filling. Malvern Instrument’s Dispersion Technology software (Version 4.0)
was used for data analysis. For particle size it was the z average diameter (the mean hydrodynamic
diameter) that was reported. The protocol for sample preparation was described by Tantra, R., Jing,S. and
Gohil, D.in Technical issues surrounding the preparation, characterisation and testing of nanoparticles for
ecotoxicological studies, in Environmental Toxicology 3, V.B. Popov, C.A. , Editor. 2010, WIT Press p.
165-176. The mean particle size of three distributions was determined to be 275 nm for NM-110, 253 nm
for NM-112 and 508 nm for NM-113 respectively.
ENV/JM/MONO(2015)15/PART1
33
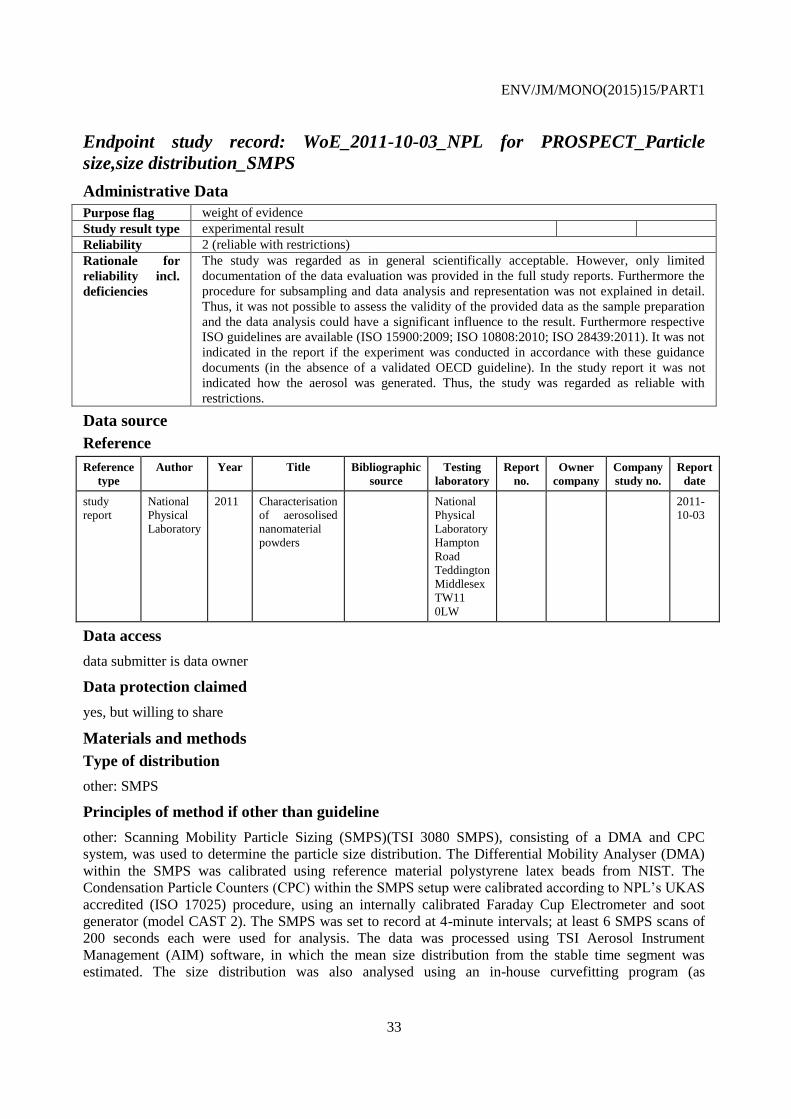
Endpoint study record: WoE_2011-10-03_NPL for PROSPECT_Particle
size,size distribution_SMPS
Administrative Data
Purpose flag weight of evidence
Study result type experimental result
Reliability 2 (reliable with restrictions)
Rationale for
reliability incl.
deficiencies
The study was regarded as in general scientifically acceptable. However, only limited
documentation of the data evaluation was provided in the full study reports. Furthermore the
procedure for subsampling and data analysis and representation was not explained in detail.
Thus, it was not possible to assess the validity of the provided data as the sample preparation
and the data analysis could have a significant influence to the result. Furthermore respective
ISO guidelines are available (ISO 15900:2009; ISO 10808:2010; ISO 28439:2011). It was not
indicated in the report if the experiment was conducted in accordance with these guidance
documents (in the absence of a validated OECD guideline). In the study report it was not
indicated how the aerosol was generated. Thus, the study was regarded as reliable with
restrictions.
Data source
Reference
Reference
type
Author Year Title Bibliographic
source
Testing
laboratory
Report
no.
Owner
company
Company
study no.
Report
date
study
report
National
Physical
Laboratory
2011 Characterisation
of aerosolised
nanomaterial
powders
National
Physical
Laboratory
Hampton
Road
Teddington
Middlesex
TW11
0LW
2011-
10-03
Data access
data submitter is data owner
Data protection claimed
yes, but willing to share
Materials and methods
Type of distribution
other: SMPS
Principles of method if other than guideline
other: Scanning Mobility Particle Sizing (SMPS)(TSI 3080 SMPS), consisting of a DMA and CPC
system, was used to determine the particle size distribution. The Differential Mobility Analyser (DMA)
within the SMPS was calibrated using reference material polystyrene latex beads from NIST. The
Condensation Particle Counters (CPC) within the SMPS setup were calibrated according to NPL’s UKAS
accredited (ISO 17025) procedure, using an internally calibrated Faraday Cup Electrometer and soot
generator (model CAST 2). The SMPS was set to record at 4-minute intervals; at least 6 SMPS scans of
200 seconds each were used for analysis. The data was processed using TSI Aerosol Instrument
Management (AIM) software, in which the mean size distribution from the stable time segment was
estimated. The size distribution was also analysed using an in-house curvefitting program (as
ENV/JM/MONO(2015)15/PART1
34
implemented in a recent SMPS intercomparison at METAS).
GLP compliance
no
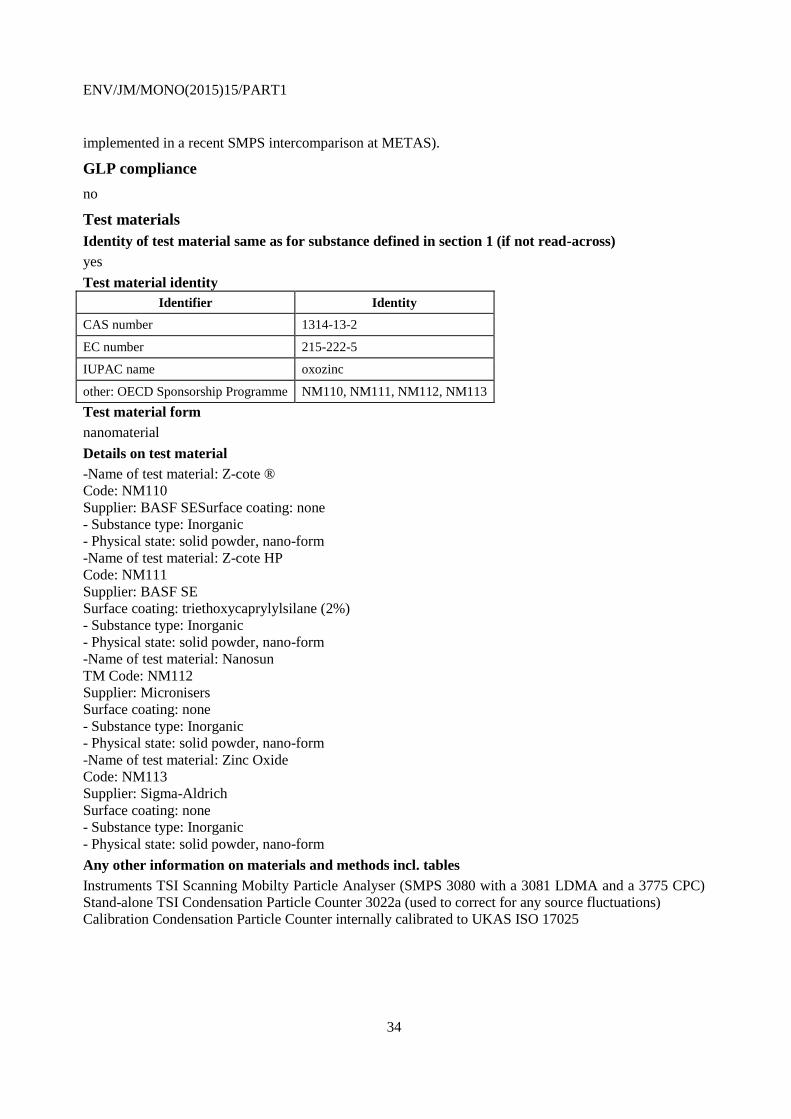
Test materials
Identity of test material same as for substance defined in section 1 (if not read-across)
yes
Test material identity
Identifier Identity
CAS number 1314-13-2
EC number 215-222-5
IUPAC name oxozinc
other: OECD Sponsorship Programme NM110, NM111, NM112, NM113
Test material form
nanomaterial
Details on test material
-Name of test material: Z-cote ®
Code: NM110
Supplier: BASF SESurface coating: none
- Substance type: Inorganic
- Physical state: solid powder, nano-form
-Name of test material: Z-cote HP
Code: NM111
Supplier: BASF SE
Surface coating: triethoxycaprylylsilane (2%)
- Substance type: Inorganic
- Physical state: solid powder, nano-form
-Name of test material: Nanosun
TM Code: NM112
Supplier: Micronisers
Surface coating: none
- Substance type: Inorganic
- Physical state: solid powder, nano-form
-Name of test material: Zinc Oxide
Code: NM113
Supplier: Sigma-Aldrich
Surface coating: none
- Substance type: Inorganic
- Physical state: solid powder, nano-form
Any other information on materials and methods incl. tables
Instruments TSI Scanning Mobilty Particle Analyser (SMPS 3080 with a 3081 LDMA and a 3775 CPC)
Stand-alone TSI Condensation Particle Counter 3022a (used to correct for any source fluctuations)
Calibration Condensation Particle Counter internally calibrated to UKAS ISO 17025
ENV/JM/MONO(2015)15/PART1
35
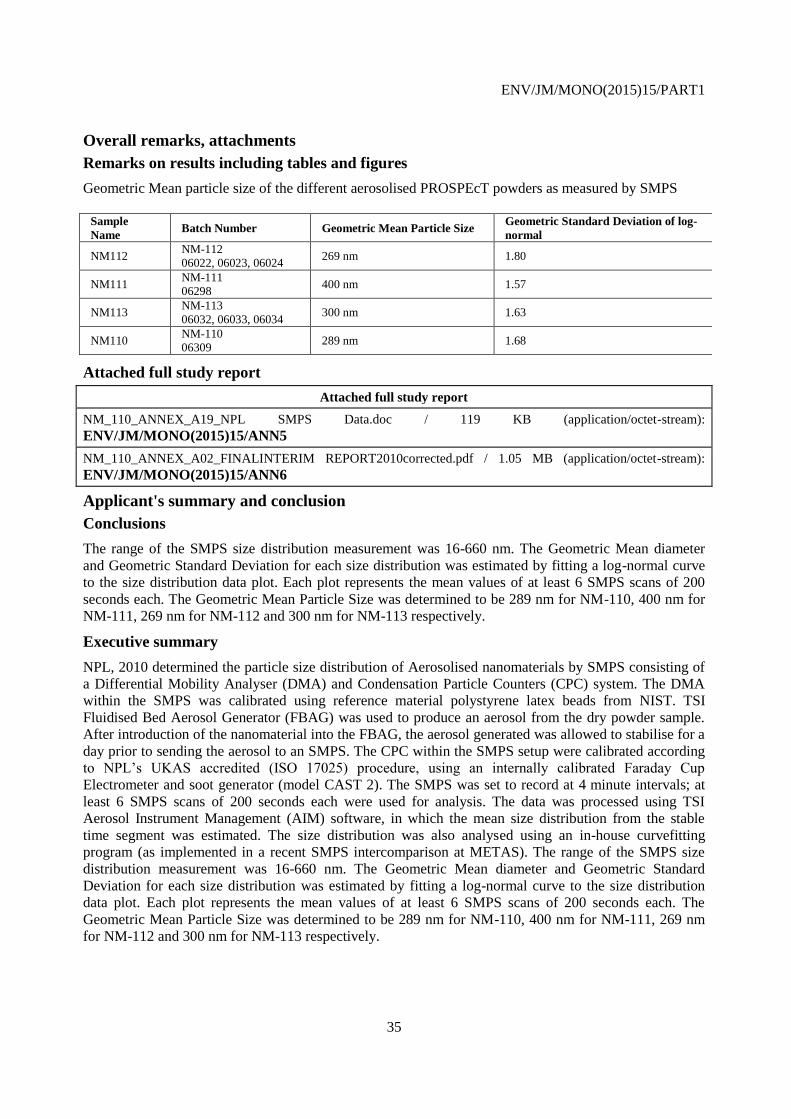
Overall remarks, attachments
Remarks on results including tables and figures
Geometric Mean particle size of the different aerosolised PROSPEcT powders as measured by SMPS
Sample
Name Batch Number Geometric Mean Particle Size
Geometric Standard Deviation of log-
normal
NM112 NM-112
06022, 06023, 06024 269 nm 1.80
NM111 NM-111
06298 400 nm 1.57
NM113 NM-113
06032, 06033, 06034 300 nm 1.63
NM110 NM-110
06309 289 nm 1.68
Attached full study report
Attached full study report
NM_110_ANNEX_A19_NPL SMPS Data.doc / 119 KB (application/octet-stream):
ENV/JM/MONO(2015)15/ANN5
NM_110_ANNEX_A02_FINALINTERIM REPORT2010corrected.pdf / 1.05 MB (application/octet-stream):
ENV/JM/MONO(2015)15/ANN6
Applicant's summary and conclusion
Conclusions
The range of the SMPS size distribution measurement was 16-660 nm. The Geometric Mean diameter
and Geometric Standard Deviation for each size distribution was estimated by fitting a log-normal curve
to the size distribution data plot. Each plot represents the mean values of at least 6 SMPS scans of 200
seconds each. The Geometric Mean Particle Size was determined to be 289 nm for NM-110, 400 nm for
NM-111, 269 nm for NM-112 and 300 nm for NM-113 respectively.
Executive summary
NPL, 2010 determined the particle size distribution of Aerosolised nanomaterials by SMPS consisting of
a Differential Mobility Analyser (DMA) and Condensation Particle Counters (CPC) system. The DMA
within the SMPS was calibrated using reference material polystyrene latex beads from NIST. TSI
Fluidised Bed Aerosol Generator (FBAG) was used to produce an aerosol from the dry powder sample.
After introduction of the nanomaterial into the FBAG, the aerosol generated was allowed to stabilise for a
day prior to sending the aerosol to an SMPS. The CPC within the SMPS setup were calibrated according
to NPL’s UKAS accredited (ISO 17025) procedure, using an internally calibrated Faraday Cup
Electrometer and soot generator (model CAST 2). The SMPS was set to record at 4 minute intervals; at
least 6 SMPS scans of 200 seconds each were used for analysis. The data was processed using TSI
Aerosol Instrument Management (AIM) software, in which the mean size distribution from the stable
time segment was estimated. The size distribution was also analysed using an in-house curvefitting
program (as implemented in a recent SMPS intercomparison at METAS). The range of the SMPS size
distribution measurement was 16-660 nm. The Geometric Mean diameter and Geometric Standard
Deviation for each size distribution was estimated by fitting a log-normal curve to the size distribution
data plot. Each plot represents the mean values of at least 6 SMPS scans of 200 seconds each. The
Geometric Mean Particle Size was determined to be 289 nm for NM-110, 400 nm for NM-111, 269 nm
for NM-112 and 300 nm for NM-113 respectively.
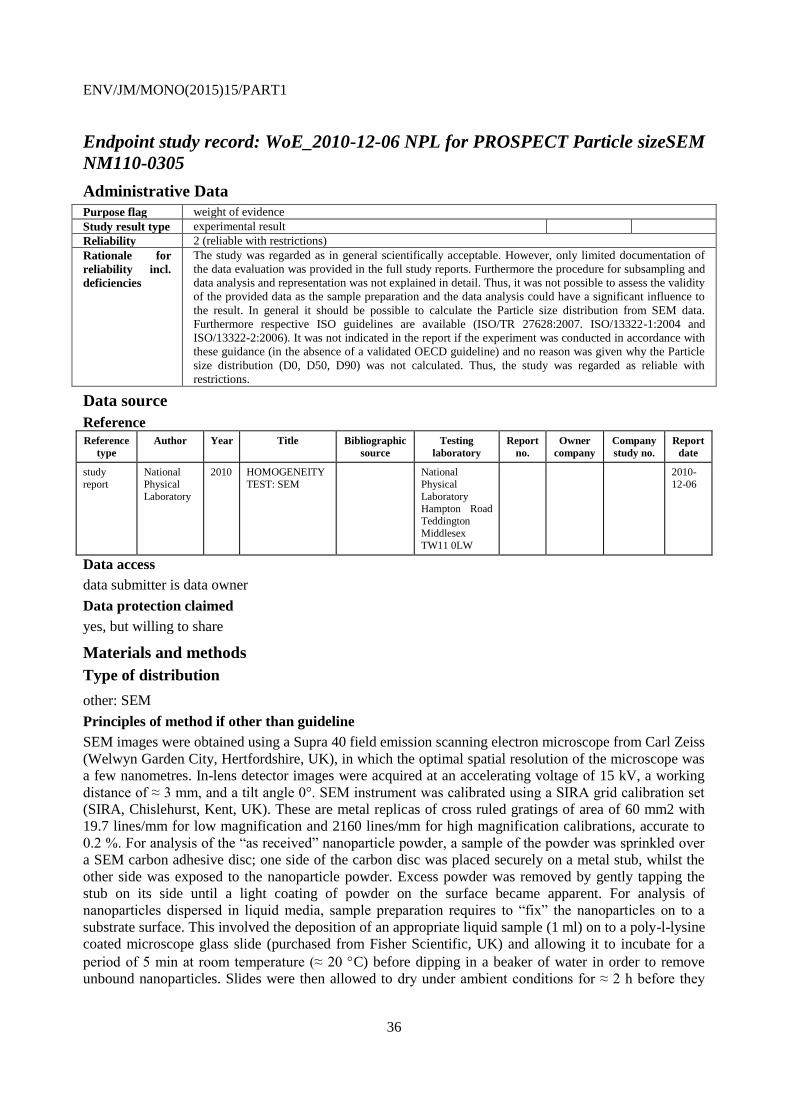
ENV/JM/MONO(2015)15/PART1
36
Endpoint study record: WoE_2010-12-06 NPL for PROSPECT Particle sizeSEM
NM110-0305
Administrative Data
Purpose flag weight of evidence
Study result type experimental result
Reliability 2 (reliable with restrictions)
Rationale for
reliability incl.
deficiencies
The study was regarded as in general scientifically acceptable. However, only limited documentation of
the data evaluation was provided in the full study reports. Furthermore the procedure for subsampling and
data analysis and representation was not explained in detail. Thus, it was not possible to assess the validity
of the provided data as the sample preparation and the data analysis could have a significant influence to
the result. In general it should be possible to calculate the Particle size distribution from SEM data.
Furthermore respective ISO guidelines are available (ISO/TR 27628:2007. ISO/13322-1:2004 and
ISO/13322-2:2006). It was not indicated in the report if the experiment was conducted in accordance with
these guidance (in the absence of a validated OECD guideline) and no reason was given why the Particle
size distribution (D0, D50, D90) was not calculated. Thus, the study was regarded as reliable with
restrictions.
Data source
Reference
Reference
type
Author Year Title Bibliographic
source
Testing
laboratory
Report
no.
Owner
company
Company
study no.
Report
date
study
report
National
Physical
Laboratory
2010 HOMOGENEITY
TEST: SEM National
Physical
Laboratory Hampton Road
Teddington
Middlesex TW11 0LW
2010-
12-06
Data access
data submitter is data owner
Data protection claimed
yes, but willing to share
Materials and methods
Type of distribution
other: SEM
Principles of method if other than guideline
SEM images were obtained using a Supra 40 field emission scanning electron microscope from Carl Zeiss
(Welwyn Garden City, Hertfordshire, UK), in which the optimal spatial resolution of the microscope was
a few nanometres. In-lens detector images were acquired at an accelerating voltage of 15 kV, a working
distance of ≈ 3 mm, and a tilt angle 0°. SEM instrument was calibrated using a SIRA grid calibration set
(SIRA, Chislehurst, Kent, UK). These are metal replicas of cross ruled gratings of area of 60 mm2 with
19.7 lines/mm for low magnification and 2160 lines/mm for high magnification calibrations, accurate to
0.2 %. For analysis of the “as received” nanoparticle powder, a sample of the powder was sprinkled over
a SEM carbon adhesive disc; one side of the carbon disc was placed securely on a metal stub, whilst the
other side was exposed to the nanoparticle powder. Excess powder was removed by gently tapping the
stub on its side until a light coating of powder on the surface became apparent. For analysis of
nanoparticles dispersed in liquid media, sample preparation requires to “fix” the nanoparticles on to a
substrate surface. This involved the deposition of an appropriate liquid sample (1 ml) on to a poly-l-lysine
coated microscope glass slide (purchased from Fisher Scientific, UK) and allowing it to incubate for a
period of 5 min at room temperature (≈ 20 C) before dipping in a beaker of water in order to remove
unbound nanoparticles. Slides were then allowed to dry under ambient conditions for ≈ 2 h before they
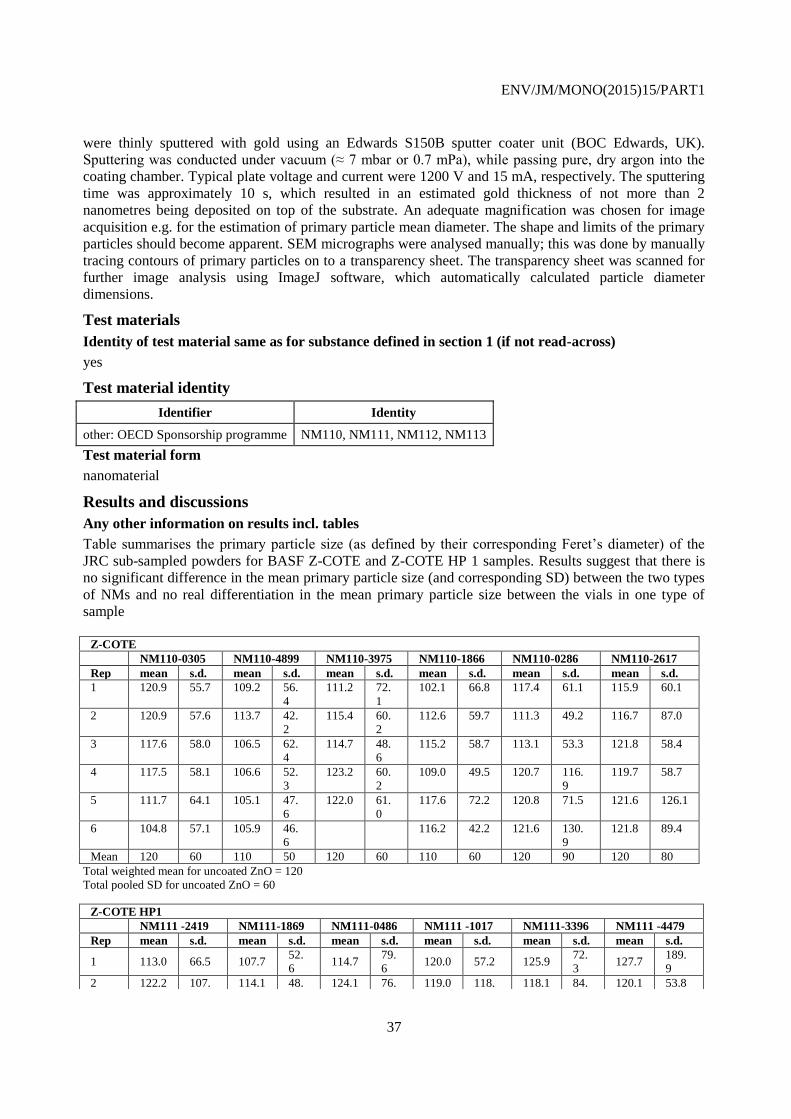
ENV/JM/MONO(2015)15/PART1
37
were thinly sputtered with gold using an Edwards S150B sputter coater unit (BOC Edwards, UK).
Sputtering was conducted under vacuum (≈ 7 mbar or 0.7 mPa), while passing pure, dry argon into the
coating chamber. Typical plate voltage and current were 1200 V and 15 mA, respectively. The sputtering
time was approximately 10 s, which resulted in an estimated gold thickness of not more than 2
nanometres being deposited on top of the substrate. An adequate magnification was chosen for image
acquisition e.g. for the estimation of primary particle mean diameter. The shape and limits of the primary
particles should become apparent. SEM micrographs were analysed manually; this was done by manually
tracing contours of primary particles on to a transparency sheet. The transparency sheet was scanned for
further image analysis using ImageJ software, which automatically calculated particle diameter
dimensions.
Test materials
Identity of test material same as for substance defined in section 1 (if not read-across)
yes
Test material identity
Identifier Identity
other: OECD Sponsorship programme NM110, NM111, NM112, NM113
Test material form
nanomaterial
Results and discussions
Any other information on results incl. tables
Table summarises the primary particle size (as defined by their corresponding Feret’s diameter) of the
JRC sub-sampled powders for BASF Z-COTE and Z-COTE HP 1 samples. Results suggest that there is
no significant difference in the mean primary particle size (and corresponding SD) between the two types
of NMs and no real differentiation in the mean primary particle size between the vials in one type of
sample
Z-COTE
NM110-0305 NM110-4899 NM110-3975 NM110-1866 NM110-0286 NM110-2617
Rep mean s.d. mean s.d. mean s.d. mean s.d. mean s.d. mean s.d.
1 120.9 55.7 109.2 56.
4
111.2 72.
1
102.1 66.8 117.4 61.1 115.9 60.1
2 120.9 57.6 113.7 42.
2
115.4 60.
2
112.6 59.7 111.3 49.2 116.7 87.0
3 117.6 58.0 106.5 62.
4
114.7 48.
6
115.2 58.7 113.1 53.3 121.8 58.4
4 117.5 58.1 106.6 52.
3
123.2 60.
2
109.0 49.5 120.7 116.
9
119.7 58.7
5 111.7 64.1 105.1 47.
6
122.0 61.
0
117.6 72.2 120.8 71.5 121.6 126.1
6 104.8 57.1 105.9 46.
6
116.2 42.2 121.6 130.
9
121.8 89.4
Mean 120 60 110 50 120 60 110 60 120 90 120 80
Total weighted mean for uncoated ZnO = 120
Total pooled SD for uncoated ZnO = 60
Z-COTE HP1
NM111 -2419 NM111-1869 NM111-0486 NM111 -1017 NM111-3396 NM111 -4479
Rep mean s.d. mean s.d. mean s.d. mean s.d. mean s.d. mean s.d.
1 113.0 66.5 107.7 52.
6 114.7
79.
6 120.0 57.2 125.9
72.
3 127.7
189.
9
2 122.2 107. 114.1 48. 124.1 76. 119.0 118. 118.1 84. 120.1 53.8

ENV/JM/MONO(2015)15/PART1
38
8 0 4 6 2
3 127.7 134.
1 102.6
62.
6 112.6
57.
6 125.1 68.1 126.0
84.
2 118.5 41.8
4 123.1 42.7 102.2 54.
2 118.3
73.
0 119.8
118.
3 120.1
82.
6 127.9 65.4
5 113.2 47.0 110.1 48.
7 113.4
74.
3 124.8 79.0 127.5
81.
7 127.9 68.8
6 119.6 67.3 104.1 47.
6 123.0
89.
7 110.7 57.0 117.3
63.
6
Mean
Total weighted mean for coated ZnO = 120 Total pooled SD for coated ZnO = 80
Overall remarks, attachments
Attached full study report
Attached full study report
NM_110_ANNEX_A20_ZnO HOMOGENEITY SEM.doc / 45 KB (application/octet-stream):
ENV/JM/MONO(2015)15/ANN1
Applicant's summary and conclusion
Conclusions
The total weighted mean for NM-110 was determined to be 120 nm and the total weighted mean for NM-
111 was determined to be 120 nm respectively. Results suggest that there is no significant difference in
the mean primary particle size (and corresponding SD) between the two types of NMs and no real
differentiation in the mean primary particle size between the vials in one type of sample.
Executive summary
NPL, 2010 determined the particle size distribution by SEM. SEM images were obtained using a Supra
40 field emission scanning electron microscope from Carl Zeiss (Welwyn Garden City, Hertfordshire,
UK), in which the optimal spatial resolution of the microscope was a few nanometres. For analysis of the
“as received” nanoparticle powder, a sample of the powder was sprinkled over a SEM carbon adhesive
disc; one side of the carbon disc was placed securely on a metal stub, whilst the other side was exposed to
the nanoparticle powder. Excess powder was removed by gently tapping the stub on its side until a light
coating of powder on the surface became apparent. An adequate magnification was chosen for image
acquisition e.g. for the estimation of primary particle mean diameter. The shape and limits of the primary
particles should become apparent. SEM micrographs were analysed manually; this was done by manually
tracing contours of primary particles on to a transparency sheet. The transparency sheet was scanned for
further image analysis using ImageJ software, which automatically calculated particle. The total weighted
mean for NM-110 was determined to be 120 nm and the total weighted mean for NM-111 was determined
to be 120 nm respectively. Results suggest that there is no significant difference in the mean primary
particle size (and corresponding SD) between the two types of NMs and no real differentiation in the
mean primary particle size between the vials in one type of sample.

ENV/JM/MONO(2015)15/PART1
39
Endpoint study record: WoE_2012-03-
05_Australia_CSIRO_Particle_Size_TEM_XRD_BET
Administrative Data
Purpose flag weight of evidence
Study result type experimental result
Reliability 2 (reliable with restrictions)
Rationale for
reliability incl.
deficiencies
The study was regarded as in general scientifically acceptable. Particle size measurement
from TEM images were performed on 100 particles. However, only limited documentation of
the data evaluation was provided in the full study reports. Furthermore the procedure for
subsampling and data analysis and representation was not explained in detail. Thus, it was not
possible to assess the validity of the provided data as the sample preparation and the data
analysis could have a significant influence to the result. The respective ISO guidelines are
available but it was not indicated in the report if the experiment was conducted in accordance
with these guidance documents (in the absence of a validated OECD guideline). Nevertheless
the methodical comparison adds high reliability. Therefore the study was regarded as reliable
with restrictions.
Data source
Reference
Reference
type
Author Year Title Bibliographic
source
Testing
laboratory
Report
no.
Owner
company
Company
study no.
Report
date
study
report
Casey,
Yin,
McCall
2012 Summary of
physicochemical
properties of
OECD Zinc
Oxide (ZnO)
samples
Commonwealth
Scientific and
Industrial
Research
Organisation
2012-
03-05
Data access
data submitter is data owner
Data protection claimed
yes, but willing to share
Materials and methods
Type of distribution
other: TEM
Test guideline
Qualifier Guideline Deviations
no guideline followed
Principles of method if other than guideline
Two methods were used to estimate average particle size based on TEM results. Both Feret’s diameter
and the equivalent circular diameter were determined by measuring 100 individual particles in TEM
images. (i) Feret’s diameter (D Feret TEM) is a parameter that is widely used in imaging of irregularly-
shaped particles. Feret’s diameter can be defined as the “maximum calliper length” i.e. the longest
distance between any two points along the selection boundary.(ii) Use of the equivalent circular diameter
technique requires that a spherical shape be assigned to the particles. The equivalent circular diameter (D
circ TEM) is an estimate of the diameter of a circle that has the same area as that of the projected particle.
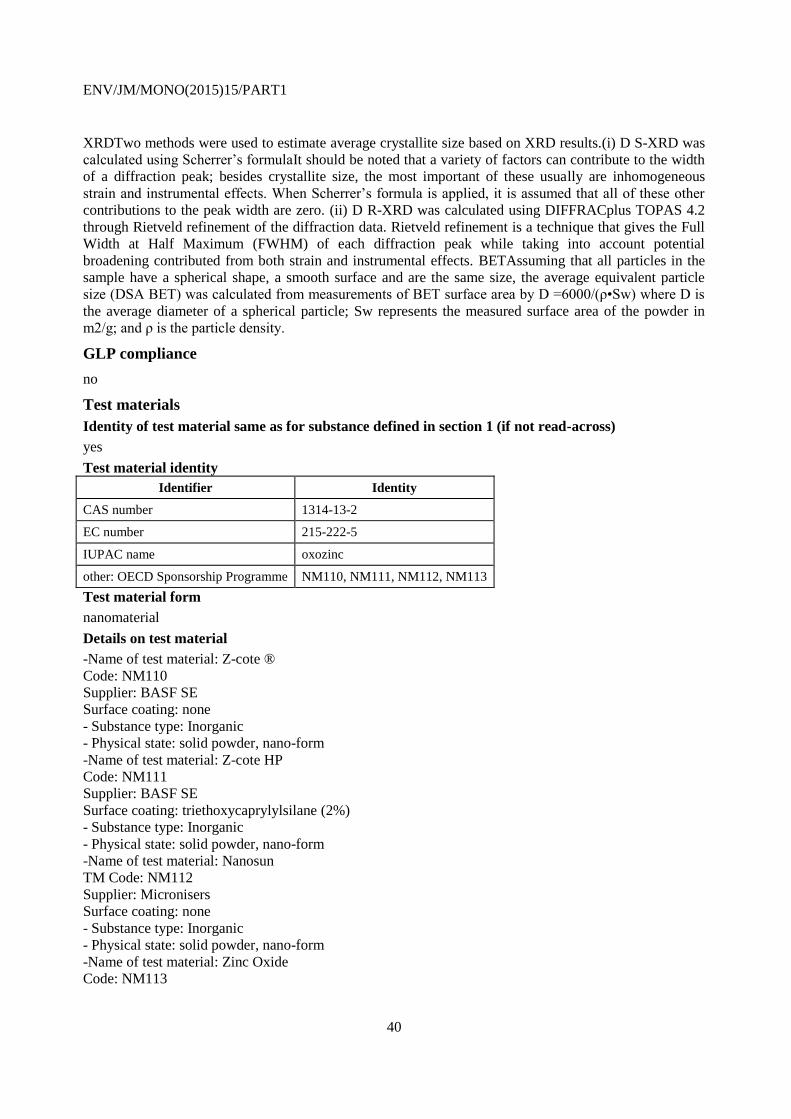
ENV/JM/MONO(2015)15/PART1
40
XRDTwo methods were used to estimate average crystallite size based on XRD results.(i) D S-XRD was
calculated using Scherrer’s formulaIt should be noted that a variety of factors can contribute to the width
of a diffraction peak; besides crystallite size, the most important of these usually are inhomogeneous
strain and instrumental effects. When Scherrer’s formula is applied, it is assumed that all of these other
contributions to the peak width are zero. (ii) D R-XRD was calculated using DIFFRACplus TOPAS 4.2
through Rietveld refinement of the diffraction data. Rietveld refinement is a technique that gives the Full
Width at Half Maximum (FWHM) of each diffraction peak while taking into account potential
broadening contributed from both strain and instrumental effects. BETAssuming that all particles in the
sample have a spherical shape, a smooth surface and are the same size, the average equivalent particle
size (DSA BET) was calculated from measurements of BET surface area by D =6000/(ρ•Sw) where D is
the average diameter of a spherical particle; Sw represents the measured surface area of the powder in
m2/g; and ρ is the particle density.
GLP compliance
no
Test materials
Identity of test material same as for substance defined in section 1 (if not read-across)
yes
Test material identity
Identifier Identity
CAS number 1314-13-2
EC number 215-222-5
IUPAC name oxozinc
other: OECD Sponsorship Programme NM110, NM111, NM112, NM113
Test material form
nanomaterial
Details on test material
-Name of test material: Z-cote ®
Code: NM110
Supplier: BASF SE
Surface coating: none
- Substance type: Inorganic
- Physical state: solid powder, nano-form
-Name of test material: Z-cote HP
Code: NM111
Supplier: BASF SE
Surface coating: triethoxycaprylylsilane (2%)
- Substance type: Inorganic
- Physical state: solid powder, nano-form
-Name of test material: Nanosun
TM Code: NM112
Supplier: Micronisers
Surface coating: none
- Substance type: Inorganic
- Physical state: solid powder, nano-form
-Name of test material: Zinc Oxide
Code: NM113
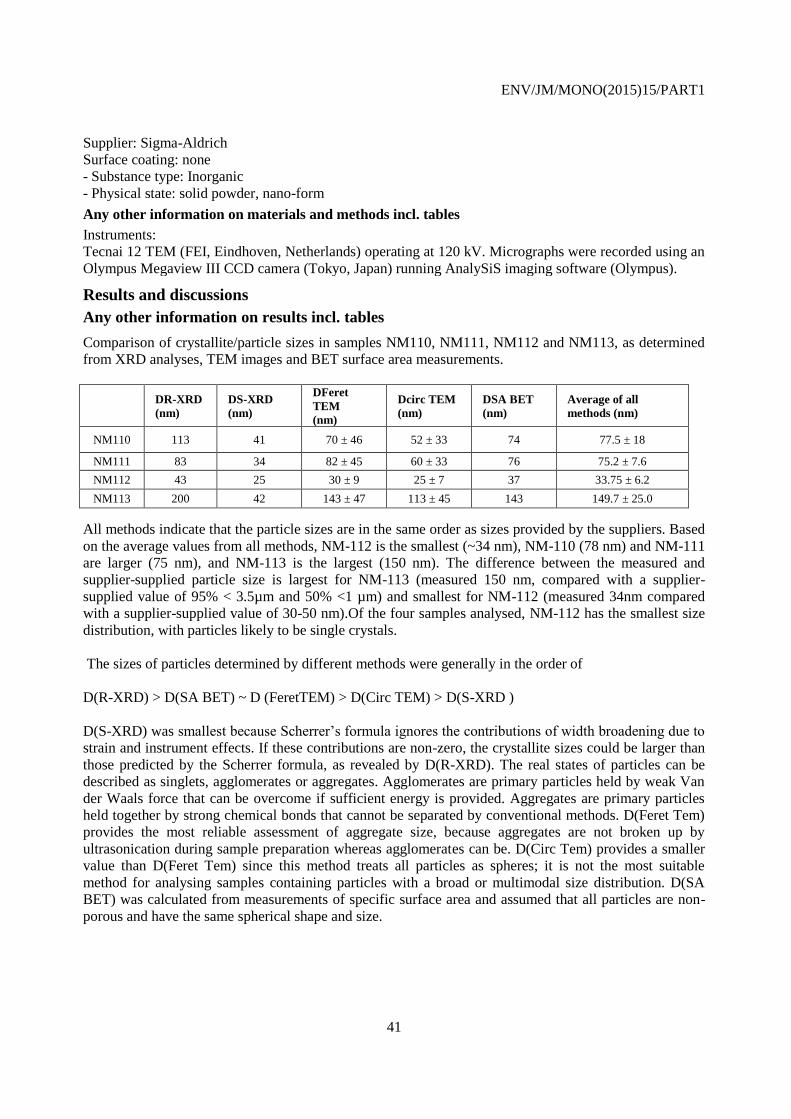
ENV/JM/MONO(2015)15/PART1
41
Supplier: Sigma-Aldrich
Surface coating: none
- Substance type: Inorganic
- Physical state: solid powder, nano-form
Any other information on materials and methods incl. tables
Instruments:
Tecnai 12 TEM (FEI, Eindhoven, Netherlands) operating at 120 kV. Micrographs were recorded using an
Olympus Megaview III CCD camera (Tokyo, Japan) running AnalySiS imaging software (Olympus).
Results and discussions
Any other information on results incl. tables
Comparison of crystallite/particle sizes in samples NM110, NM111, NM112 and NM113, as determined
from XRD analyses, TEM images and BET surface area measurements.
DR-XRD
(nm)
DS-XRD
(nm)
DFeret
TEM
(nm)
Dcirc TEM
(nm)
DSA BET
(nm)
Average of all
methods (nm)
NM110 113 41 70 ± 46 52 ± 33 74 77.5 ± 18
NM111 83 34 82 ± 45 60 ± 33 76 75.2 ± 7.6
NM112 43 25 30 ± 9 25 ± 7 37 33.75 ± 6.2
NM113 200 42 143 ± 47 113 ± 45 143 149.7 ± 25.0
All methods indicate that the particle sizes are in the same order as sizes provided by the suppliers. Based
on the average values from all methods, NM-112 is the smallest (~34 nm), NM-110 (78 nm) and NM-111
are larger (75 nm), and NM-113 is the largest (150 nm). The difference between the measured and
supplier-supplied particle size is largest for NM-113 (measured 150 nm, compared with a supplier-
supplied value of 95% < 3.5µm and 50% <1 µm) and smallest for NM-112 (measured 34nm compared
with a supplier-supplied value of 30-50 nm).Of the four samples analysed, NM-112 has the smallest size
distribution, with particles likely to be single crystals.
The sizes of particles determined by different methods were generally in the order of
D(R-XRD) > D(SA BET) ~ D (FeretTEM) > D(Circ TEM) > D(S-XRD )
D(S-XRD) was smallest because Scherrer’s formula ignores the contributions of width broadening due to
strain and instrument effects. If these contributions are non-zero, the crystallite sizes could be larger than
those predicted by the Scherrer formula, as revealed by D(R-XRD). The real states of particles can be
described as singlets, agglomerates or aggregates. Agglomerates are primary particles held by weak Van
der Waals force that can be overcome if sufficient energy is provided. Aggregates are primary particles
held together by strong chemical bonds that cannot be separated by conventional methods. D(Feret Tem)
provides the most reliable assessment of aggregate size, because aggregates are not broken up by
ultrasonication during sample preparation whereas agglomerates can be. D(Circ Tem) provides a smaller
value than D(Feret Tem) since this method treats all particles as spheres; it is not the most suitable
method for analysing samples containing particles with a broad or multimodal size distribution. D(SA
BET) was calculated from measurements of specific surface area and assumed that all particles are non-
porous and have the same spherical shape and size.
ENV/JM/MONO(2015)15/PART1
42
Overall remarks, attachments
Attached full study report
Attached full study report
NM_110_ANNEX_A21_OECD ZnO Crystallite Size CSIRO Australia.docx / 29.24 KB (application/octet-stream):
ENV/JM/MONO(2015)15/ANN1
Applicant's summary and conclusion
Conclusions
All methods indicate that the particle sizes are in the same size range. Based on the average values from
all methods, the particle size was determined to be ~34 nm for NM 112, 78 nm for NM 110, 75 nm for
NM 111 and 150 nm for NM 113.
Executive summary
CSIRO, 2012 investigated the particle size distribution of the 4 nanomaterials. The particle size was
determined using XRD, TEM and Brunauer–Emmett–Teller (BET) surface area measurements. Two
XRD methods were used to estimate average crystallite size based on XRD results. The D S-XRDwas
calculated using Scherrer’s formula and D R-XRD was calculated using DIFFRACplus TOPAS 4.2
through Rietveld refinement of the diffraction data. For TEM measurements two methods were used to
estimate average particle size based on TEM results. Both Feret’s diameter and the equivalent circular
diameter were determined by measuring 100 individual particles in TEM images. The BET measurements
were performed under the assumption that that all particles in the sample have a spherical shape, a smooth
surface and are the same size. The average equivalent particle size (DSA BET) was calculated from
measurements of BET surface area. All methods indicate that the particle sizes are in the same size range.
Based on the average values from all methods, the particle size was determined to be ~34 nm for
NM-112, 78 nm for NM-110, 75 nm for NM-111 and 150 nm for NM-113. The particles size determined
by different methods were generally in the order of
D R-XRD > D SA BET ~ D Feret TEM > D Circ TEM > D S-XRD.D S-XRD
was smallest because Scherrer’s formula ignores the contributions of width broadening due to strain and
instrument effects. If these contributions are non-zero, the crystallite sizes could be larger than those
predicted by the Scherrer’s formula, as revealed by D R-XRD. The real states of particles can be
described as singlets, agglomerates or aggregates. Agglomerates are primary particles held by weak Van
der Waals force that can be overcome if sufficient energy is provided. Aggregates are primary particles
held together by strong chemical bonds that cannot be separated by conventional methods. D Feret-TEM
provides the most reliable assessment of aggregate size, because aggregates are not broken up by
ultrasonication during sample preparation whereas agglomerates can be. D Circ-TEM provides a smaller
value than D Feret-TEM since this method treats all particles as spheres; it is not the most suitable
method for analysing samples containing particles with a broad or multimodal size distribution.
D SA-BET was calculated from measurements of specific surface area and assumed that all particles are
non-porous and have the same spherical shape and size.

ENV/JM/MONO(2015)15/PART1
43
Endpoint study record: WoE_2010-12-03_NPL for PROSPECT_Particle
size,size distribution_CPS
Administrative Data
Purpose flag weight of evidence
Study result type experimental result
Reliability 2 (reliable with restrictions)
Rationale for
reliability incl.
deficiencies
The study was regarded as in general scientifically acceptable. However, only limited
documentation of the data evaluation was provided in the full study reports. The author of the
study erroneously described the D10 distribution that 10 mass % of the particles will have
particle larger diameter as the given value. Thus, the D10 and D90 values were reversed.
Furthermore the procedure for subsampling and data analysis and representation was not
explained in detail. Thus, it was not possible to assess the validity of the provided data as the
sample preparation and the data analysis could have a significant influence to the result.
Furthermore respective ISO guidelines (ISO 13318-1:2001; ISO 13318-2:2007; ISO 13318-
3:2004) are available (for details see comments above). It was not indicated in the report if the
experiment was conducted in accordance with these guidance documents (in the absence of a
validated OECD guideline). Therefore the study was regarded as reliable with restrictions.
Data source
Reference
Reference
type
Author Year Title Bibliographic
source
Testing
laboratory
Report
no.
Owner
company
Company
study no.
Report
date
study
report
National
Physical
Laboratory
2010 Particle size
measurements
by cps disc
centrifuge
National
Physical
Laboratory,
Teddington,
Middlesex,
United
Kingdom
2010-
12-03
Data access
data submitter is data owner
Data protection claimed
yes, but willing to share
Materials and methods
Type of distribution
other: CPS
Test guideline
Qualifier Guideline Deviations
no guideline followed
Principles of method if other than guideline
Particle size distribution by centrifugal sedimentation was acquired using CPS Disc Centrifuge Model DC
20000 instrument (Analytik Ltd, UK). At the start of the method, the centrifuge was brought up to speed
by partially filling the disc with a sucrose gradient fluid and dodecane cap fluid. The purpose of the
gradient fluid was to stabilise the sedimentation; the purpose of the cap fluid was to maintain the gradient
inside the disc. The disc centrifuge was then allowed to equilibrate at 6000 rpm for 1 hour; this gradient
will be stable and used within the next 6 hours. 0.2 ml of the nanoparticle sample (50 mg/L) was injected
into the disc; a calibration standard was injected after every three samples. Analysis was run against a
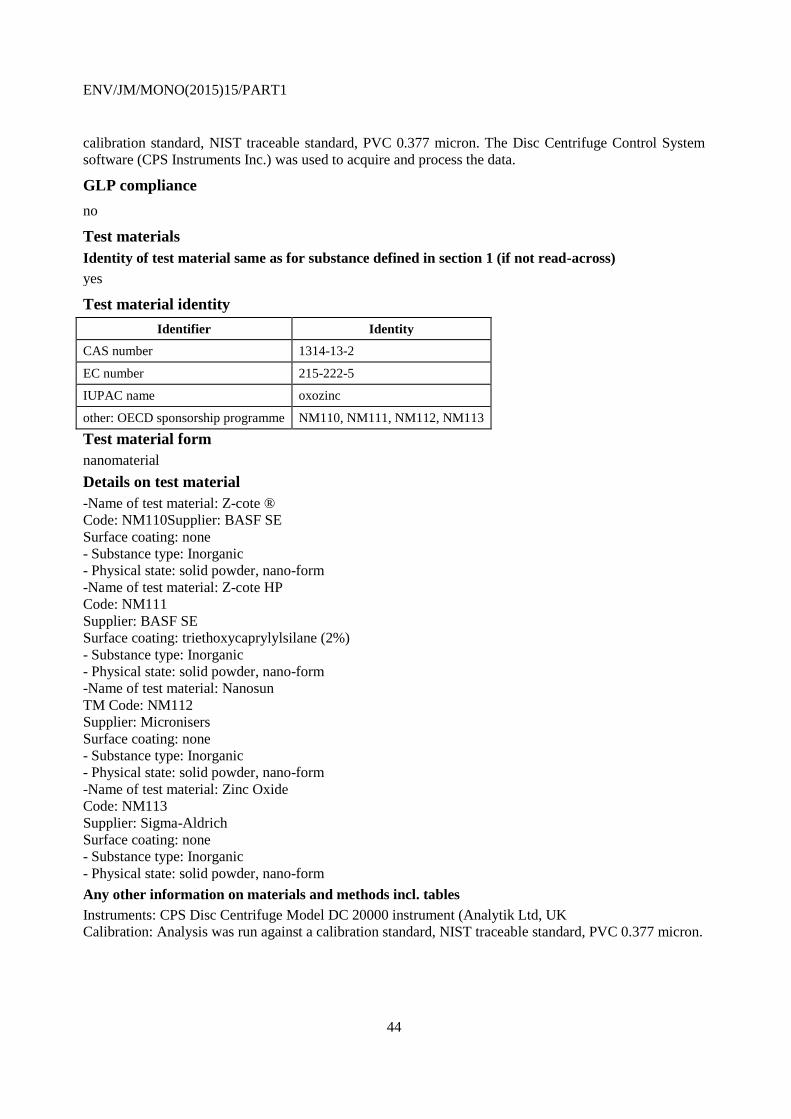
ENV/JM/MONO(2015)15/PART1
44
calibration standard, NIST traceable standard, PVC 0.377 micron. The Disc Centrifuge Control System
software (CPS Instruments Inc.) was used to acquire and process the data.
GLP compliance
no
Test materials
Identity of test material same as for substance defined in section 1 (if not read-across)
yes
Test material identity
Identifier Identity
CAS number 1314-13-2
EC number 215-222-5
IUPAC name oxozinc
other: OECD sponsorship programme NM110, NM111, NM112, NM113
Test material form
nanomaterial
Details on test material
-Name of test material: Z-cote ®
Code: NM110Supplier: BASF SE
Surface coating: none
- Substance type: Inorganic
- Physical state: solid powder, nano-form
-Name of test material: Z-cote HP
Code: NM111
Supplier: BASF SE
Surface coating: triethoxycaprylylsilane (2%)
- Substance type: Inorganic
- Physical state: solid powder, nano-form
-Name of test material: Nanosun
TM Code: NM112
Supplier: Micronisers
Surface coating: none
- Substance type: Inorganic
- Physical state: solid powder, nano-form
-Name of test material: Zinc Oxide
Code: NM113
Supplier: Sigma-Aldrich
Surface coating: none
- Substance type: Inorganic
- Physical state: solid powder, nano-form
Any other information on materials and methods incl. tables
Instruments: CPS Disc Centrifuge Model DC 20000 instrument (Analytik Ltd, UK
Calibration: Analysis was run against a calibration standard, NIST traceable standard, PVC 0.377 micron.
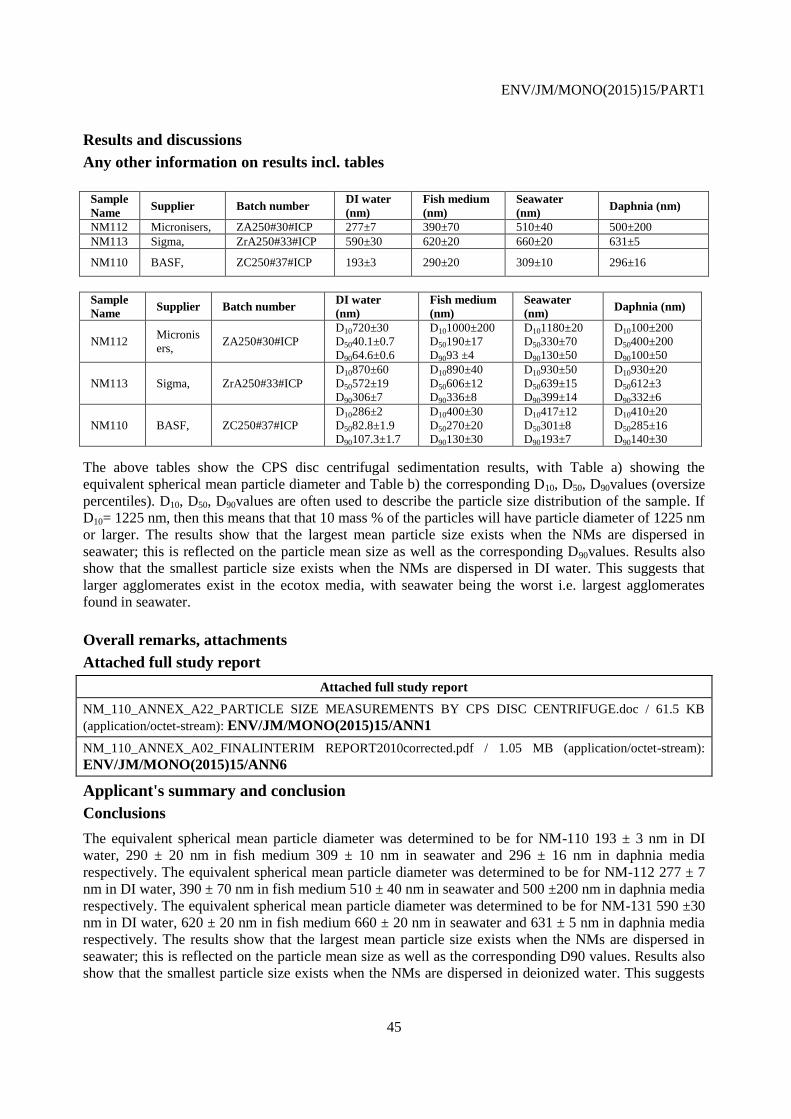
ENV/JM/MONO(2015)15/PART1
45
Results and discussions
Any other information on results incl. tables
Sample
Name Supplier Batch number
DI water
(nm)
Fish medium
(nm)
Seawater
(nm) Daphnia (nm)
NM112 Micronisers, ZA250#30#ICP 277±7 390±70 510±40 500±200
NM113 Sigma, ZrA250#33#ICP 590±30 620±20 660±20 631±5
NM110 BASF, ZC250#37#ICP 193±3 290±20 309±10 296±16
Sample
Name Supplier Batch number
DI water
(nm)
Fish medium
(nm)
Seawater
(nm) Daphnia (nm)
NM112 Micronis
ers, ZA250#30#ICP
D10720±30
D5040.1±0.7
D9064.6±0.6
D101000±200
D50190±17
D9093 ±4
D101180±20
D50330±70
D90130±50
D10100±200
D50400±200
D90100±50
NM113 Sigma, ZrA250#33#ICP
D10870±60
D50572±19
D90306±7
D10890±40
D50606±12
D90336±8
D10930±50
D50639±15
D90399±14
D10930±20
D50612±3
D90332±6
NM110 BASF, ZC250#37#ICP
D10286±2
D5082.8±1.9
D90107.3±1.7
D10400±30
D50270±20
D90130±30
D10417±12
D50301±8
D90193±7
D10410±20
D50285±16
D90140±30 The above tables show the CPS disc centrifugal sedimentation results, with Table a) showing the
equivalent spherical mean particle diameter and Table b) the corresponding D10, D50, D90values (oversize
percentiles). D10, D50, D90values are often used to describe the particle size distribution of the sample. If
D10= 1225 nm, then this means that that 10 mass % of the particles will have particle diameter of 1225 nm
or larger. The results show that the largest mean particle size exists when the NMs are dispersed in
seawater; this is reflected on the particle mean size as well as the corresponding D90values. Results also
show that the smallest particle size exists when the NMs are dispersed in DI water. This suggests that
larger agglomerates exist in the ecotox media, with seawater being the worst i.e. largest agglomerates
found in seawater.
Overall remarks, attachments
Attached full study report
Attached full study report
NM_110_ANNEX_A22_PARTICLE SIZE MEASUREMENTS BY CPS DISC CENTRIFUGE.doc / 61.5 KB
(application/octet-stream): ENV/JM/MONO(2015)15/ANN1
NM_110_ANNEX_A02_FINALINTERIM REPORT2010corrected.pdf / 1.05 MB (application/octet-stream):
ENV/JM/MONO(2015)15/ANN6
Applicant's summary and conclusion
Conclusions
The equivalent spherical mean particle diameter was determined to be for NM-110 193 ± 3 nm in DI
water, 290 ± 20 nm in fish medium 309 ± 10 nm in seawater and 296 ± 16 nm in daphnia media
respectively. The equivalent spherical mean particle diameter was determined to be for NM-112 277 ± 7
nm in DI water, 390 ± 70 nm in fish medium 510 ± 40 nm in seawater and 500 ±200 nm in daphnia media
respectively. The equivalent spherical mean particle diameter was determined to be for NM-131 590 ±30
nm in DI water, 620 ± 20 nm in fish medium 660 ± 20 nm in seawater and 631 ± 5 nm in daphnia media
respectively. The results show that the largest mean particle size exists when the NMs are dispersed in
seawater; this is reflected on the particle mean size as well as the corresponding D90 values. Results also
show that the smallest particle size exists when the NMs are dispersed in deionized water. This suggests

ENV/JM/MONO(2015)15/PART1
46
that larger agglomerates exist in the ecotox media, i.e. largest agglomerates found in seawater.
Executive summary
NPL, 2010 investigated the particle size distribution by using CPS Disc Centrifuge. Analysis was run
against a calibration standard, NIST traceable standard, PVC 0.377 micron. The equivalent spherical
mean particle diameter was determined to be for NM-110 193 ± 3 nm in DI water, 290 ± 20 nm in fish
medium 309 ± 10 nm in seawater and 296 ± 16 nm in daphnia media respectively. The equivalent
spherical mean particle diameter was determined to be for NM-112 277 ± 7 nm in DI water, 390 ± 70 nm
in fish medium 510 ± 40 nm in seawater and 500 ±200 nm in daphnia media respectively. The equivalent
spherical mean particle diameter was determined to be for NM-131 590 ±30 nm in DI water, 620 ± 20 nm
in fish medium 660 ± 20 nm in seawater and 631 ± 5 nm in daphnia media respectively.
Endpoint study record: WoE_2010-06-17_NPL for PROSPECT_Particle
size,size distribution_SEM
Administrative Data
Purpose flag weight of evidence
Study result type experimental result
Reliability 4 (not assignable)
Rationale for
reliability incl.
deficiencies
The study was regarded as in general scientifically acceptable. However, only limited
documentation of the data evaluation was provided in the full study reports. Furthermore the
procedure for subsampling and data analysis and representation was not explained in detail.
The evaluation of minimum of 50 particles measured in the SEM images was considered as
statistical not sufficient for data evaluation. In addition it was not specified which Feret
Diameter was reported. Therefore, the reliability could not be assigned.
Data source
Reference
Reference
type
Author Year Title Bibliographic
source
Testing
laboratory
Report
no.
Owner
company
Company
study no.
Report
date
study
report
National
Physical
Laboratory
2010 THE
PROSPEcT
Interim
REPORT
and
information
related to the
SEM particle
sizing
National
Physical
Laboratory
Hampton
Road
Teddington
Middlesex
TW11 0LW
2010-
06-17
Data access
data submitter is data owner
Data protection claimed
yes, but willing to share
Materials and methods
Type of distribution
other: SEM

ENV/JM/MONO(2015)15/PART1
47
Test guideline
Qualifier Guideline Deviations
no guideline followed
Principles of method if other than guideline
SEM images were obtained using a Supra 40 field emission scanning electron microscope from Carl Zeiss
(Welwyn Garden City, Hertfordshire, UK), in which the optimal spatial resolution of the microscope was
a few nanometres. Inlens detector images were acquired at an accelerating voltage of 15 kV, a working
distance of ≈ 3 mm, and a tilt angle 0°. SEM instrument was calibrated using a SIRA grid calibration set
(SIRA, Chislehurst, Kent, UK). These are metal replicas of cross ruled gratings of area of 60 mm2 with
19.7 lines/mm for low magnification and 2160 lines/mm for high magnification calibrations, accurate to
0.2 %. For analysis of the “as received” nanoparticle powder, a sample of the powder was sprinkled over
a SEM carbon adhesive disc; one side of the carbon disc was placed securely on a metal stub, whilst the
other side was exposed to the nanoparticle powder. Excess powder was removed by gently tapping the
stub on its side until a light coating of powder on the surface became apparent. For analysis of
nanoparticles dispersed in liquid media, sample preparation requires to “fix” the nanoparticles on to a
substrate surface. This involved the deposition of an appropriate liquid sample (1 ml) on to a poly-l-lysine
coated microscope glass slide (purchased from Fisher Scientific, UK) and allowing it to incubate for a
period of 5 min at room temperature (≈ 20 °C) before dipping in a beaker of water in order to remove
unbound nanoparticles. Slides were then allowed to dry under ambient conditions for ≈ 2 h before they
were thinly sputtered with gold using an Edwards S150B sputter coater unit (BOC Edwards, UK).
Sputtering was conducted under vacuum (≈ 7 mbar or 0.7 mPa), while passing pure, dry argon into the
coating chamber. Typical plate voltage and current were 1200 V and 15 mA, respectively. The sputtering
time was approximately 10 s, which resulted in an estimated gold thickness of not more than 2
nanometres being deposited on top of the substrate. An adequate magnification was chosen for image
acquisition e.g. for the estimation of primary particle mean diameter. The shape and limits of the primary
particles should become apparent.
GLP compliance
no
Test materials
Identity of test material same as for substance defined in section 1 (if not read-across)
yes
Test material identity
Identifier Identity
CAS number 1314-13-2
EC number 215-222-5
IUPAC name oxozinc
other: OECD Sponsorship programme NM110, NM111, NM112, NM113
Test material form
nanomaterial
Details on test material
-Name of test material: Z-cote ®
Code: NM110
Supplier: BASF SE
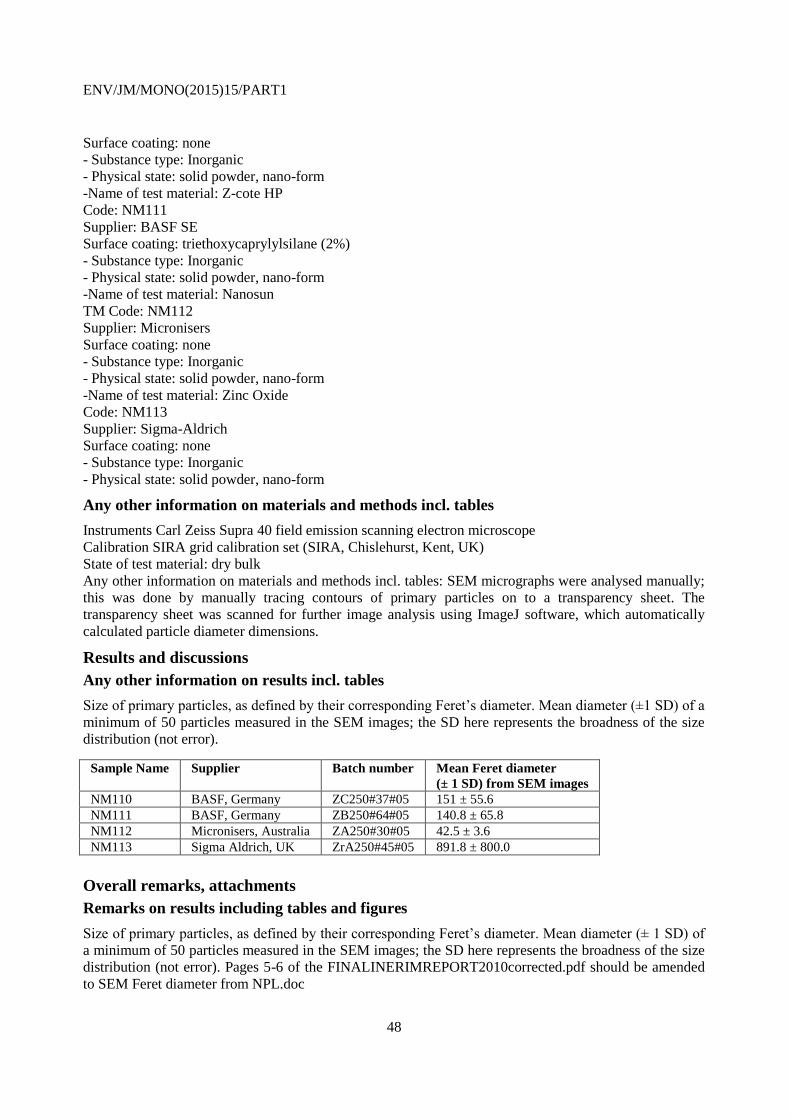
ENV/JM/MONO(2015)15/PART1
48
Surface coating: none
- Substance type: Inorganic
- Physical state: solid powder, nano-form
-Name of test material: Z-cote HP
Code: NM111
Supplier: BASF SE
Surface coating: triethoxycaprylylsilane (2%)
- Substance type: Inorganic
- Physical state: solid powder, nano-form
-Name of test material: Nanosun
TM Code: NM112
Supplier: Micronisers
Surface coating: none
- Substance type: Inorganic
- Physical state: solid powder, nano-form
-Name of test material: Zinc Oxide
Code: NM113
Supplier: Sigma-Aldrich
Surface coating: none
- Substance type: Inorganic
- Physical state: solid powder, nano-form
Any other information on materials and methods incl. tables
Instruments Carl Zeiss Supra 40 field emission scanning electron microscope
Calibration SIRA grid calibration set (SIRA, Chislehurst, Kent, UK)
State of test material: dry bulk
Any other information on materials and methods incl. tables: SEM micrographs were analysed manually;
this was done by manually tracing contours of primary particles on to a transparency sheet. The
transparency sheet was scanned for further image analysis using ImageJ software, which automatically
calculated particle diameter dimensions.
Results and discussions
Any other information on results incl. tables
Size of primary particles, as defined by their corresponding Feret’s diameter. Mean diameter (±1 SD) of a
minimum of 50 particles measured in the SEM images; the SD here represents the broadness of the size
distribution (not error).
Sample Name Supplier Batch number Mean Feret diameter
(± 1 SD) from SEM images
NM110 BASF, Germany ZC250#37#05 151 ± 55.6
NM111 BASF, Germany ZB250#64#05 140.8 ± 65.8
NM112 Micronisers, Australia ZA250#30#05 42.5 ± 3.6
NM113 Sigma Aldrich, UK ZrA250#45#05 891.8 ± 800.0
Overall remarks, attachments
Remarks on results including tables and figures
Size of primary particles, as defined by their corresponding Feret’s diameter. Mean diameter (± 1 SD) of
a minimum of 50 particles measured in the SEM images; the SD here represents the broadness of the size
distribution (not error). Pages 5-6 of the FINALINERIMREPORT2010corrected.pdf should be amended
to SEM Feret diameter from NPL.doc
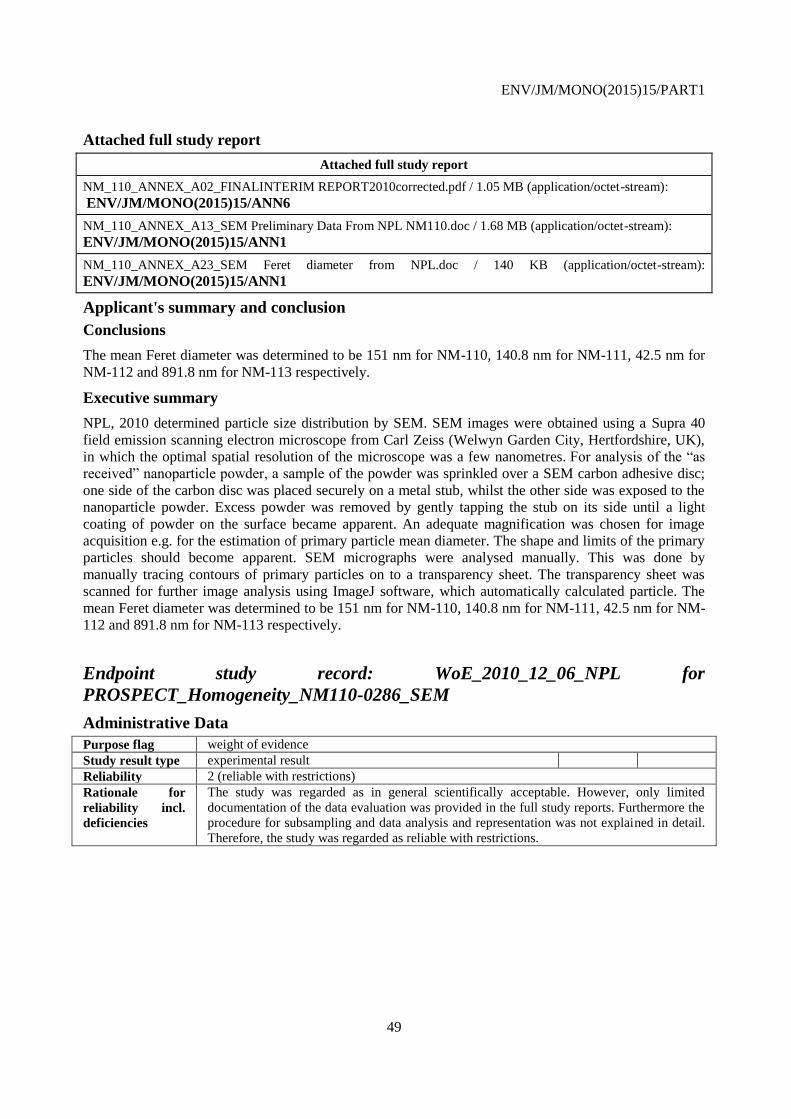
ENV/JM/MONO(2015)15/PART1
49
Attached full study report
Attached full study report
NM_110_ANNEX_A02_FINALINTERIM REPORT2010corrected.pdf / 1.05 MB (application/octet-stream):
ENV/JM/MONO(2015)15/ANN6
NM_110_ANNEX_A13_SEM Preliminary Data From NPL NM110.doc / 1.68 MB (application/octet-stream):
ENV/JM/MONO(2015)15/ANN1
NM_110_ANNEX_A23_SEM Feret diameter from NPL.doc / 140 KB (application/octet-stream):
ENV/JM/MONO(2015)15/ANN1
Applicant's summary and conclusion
Conclusions
The mean Feret diameter was determined to be 151 nm for NM-110, 140.8 nm for NM-111, 42.5 nm for
NM-112 and 891.8 nm for NM-113 respectively.
Executive summary
NPL, 2010 determined particle size distribution by SEM. SEM images were obtained using a Supra 40
field emission scanning electron microscope from Carl Zeiss (Welwyn Garden City, Hertfordshire, UK),
in which the optimal spatial resolution of the microscope was a few nanometres. For analysis of the “as
received” nanoparticle powder, a sample of the powder was sprinkled over a SEM carbon adhesive disc;
one side of the carbon disc was placed securely on a metal stub, whilst the other side was exposed to the
nanoparticle powder. Excess powder was removed by gently tapping the stub on its side until a light
coating of powder on the surface became apparent. An adequate magnification was chosen for image
acquisition e.g. for the estimation of primary particle mean diameter. The shape and limits of the primary
particles should become apparent. SEM micrographs were analysed manually. This was done by
manually tracing contours of primary particles on to a transparency sheet. The transparency sheet was
scanned for further image analysis using ImageJ software, which automatically calculated particle. The
mean Feret diameter was determined to be 151 nm for NM-110, 140.8 nm for NM-111, 42.5 nm for NM-
112 and 891.8 nm for NM-113 respectively.
Endpoint study record: WoE_2010_12_06_NPL for
PROSPECT_Homogeneity_NM110-0286_SEM
Administrative Data
Purpose flag weight of evidence
Study result type experimental result
Reliability 2 (reliable with restrictions)
Rationale for
reliability incl.
deficiencies
The study was regarded as in general scientifically acceptable. However, only limited
documentation of the data evaluation was provided in the full study reports. Furthermore the
procedure for subsampling and data analysis and representation was not explained in detail.
Therefore, the study was regarded as reliable with restrictions.
ENV/JM/MONO(2015)15/PART1
50
Data source
Reference
Referen
ce type
Author Year Title Bibliographic
source
Testing
laboratory
Repo
rt no.
Owner
compa
ny
Compa
ny
study
no.
Repo
rt
date
study
report
National
Physical
Laborat
ory
Homo
geneit
y_NM
110
National
Physical
Laboratory,
Teddington,
Middlesex,
United
Kingdom
2010-
12-06
Data access
data submitter is data owner
Data protection claimed
yes, but willing to share
Materials and methods
Test guideline
Qualifier Guideline Deviations
no guideline followed
Principles of method if other than guideline
SEM images were obtained using a Supra 40 field emission scanning electron microscope from Carl Zeiss
in which the optimal spatial resolution of the microscope was a few nanometres. In-lens detector images
were acquired at an accelerating voltage of 15 kV, a working distance of ≈ 3 mm, and a tilt angle 0°. SEM
instrument was calibrated using a SIRA grid calibration set (SIRA, Chislehurst, Kent, UK). These are
metal replicas of cross ruled gratings of area of 60 mm2 with 19.7 lines/mm for low magnification and
2160 lines/mm for high magnification calibrations, accurate to 0.2 %. For analysis of the “as received”
nanoparticle powder, a sample of the powder was sprinkled over a SEM carbon adhesive disc; one side of
the carbon disc was placed securely on a metal stub, whilst the other side was exposed to the nanoparticle
powder. Excess powder was removed by gently tapping the stub on its side until a light coating of powder
on the surface became apparent. An adequate magnification was chosen for image acquisition e.g. for the
estimation of primary particle mean diameter. The shape and limits of the primary particles should
become apparent.The SEM images were opened in ImageJ (a free image analysis program produced and
distributed by the National Institute of Health, US) installed on a Tablet PC (DELL XT1), and for each
image at least 20 distinct particles identified, to measure at least 100 particles per replicate. The particles
chosen were an array of sizes to accurately represent the variety in the sample. Using the Pencil Tool
(pencil width 2 pixels, colour black) the outlines of these particles were drawn using the supplied digital
‘pen’. The image was calibrated with reference to the scale marking on the image. Then the threshold
level adjusted so that only the particle outlines were highlighted. The particles were then measured using
the Analyze Particles tool, which produced a results table of various measurements of the particles. This
process was repeated for each image of the particular replicate (seven in total – giving a minimum of 140
particles identified. Feret’s diameter – also called the “maximum calliper length”, i.e. the longest distance
between any two points along the selection boundary - was recorded and the scientific graphing and
analysis software, SciDAVis, where a histogram (bin size 2) was plotted, showing the particle size
distribution of the replicate. The entire process was repeated for each replicate (r1, r2, r3) for all six sub-
samples of both the ZnO and ZnO-HP1 samples.

ENV/JM/MONO(2015)15/PART1
51
GLP compliance
no
Test materials
Identity of test material same as for substance defined in section 1 (if not read-across)
yes
Test material identity Identifier Identity
CAS number 1314-13-2
EC number 215-222-5
IUPAC name oxozinc
other: OECD sponsorship programme NM110, NM111, NM112, NM113
Test material form
nanomaterial
Confidential details on test material
-Name of test material: Z-cote ®
Code: NM110
Supplier: BASF SE
Surface coating: none
- Substance type: Inorganic
- Physical state: solid powder, nano-form
-Name of test material: Z-cote HP
Code: NM111
Supplier: BASF SE
Surface coating: triethoxycaprylylsilane (2%)
- Substance type: Inorganic
- Physical state: solid powder, nano-form
-Name of test material: Nanosun
TM Code: NM112
Supplier: Micronisers
Surface coating: none
- Substance type: Inorganic
- Physical state: solid powder, nano-form
-Name of test material: Zinc Oxide
Code: NM113
Supplier: Sigma-Aldrich
Surface coating: none
- Substance type: Inorganic
- Physical state: solid powder, nano-form
Any other information on materials and methods incl. tables
Instruments: Supra 40 field emission scanning electron microscope from Carl Zeiss (Welwyn Garden
City, Hertfordshire, UK) Calibration: SEM instrument was calibrated using a SIRA grid calibration set
(SIRA, Chislehurst, Kent, UK).
Overall remarks, attachments
Remarks on results including tables and figures
The results are summarised in Table below with the histograms and example images given in the
appendix. The findings are: 1.From the SEM image a broad range of particle sizes were seen from small (20-50 nm) circular or
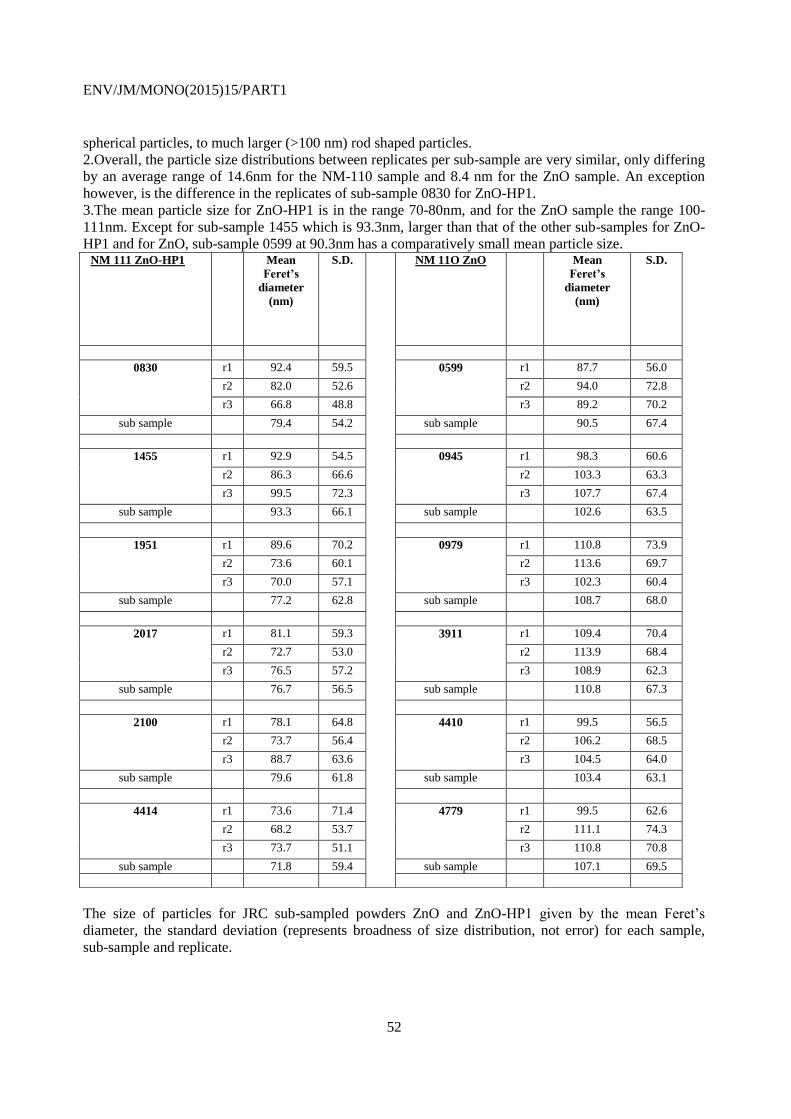
ENV/JM/MONO(2015)15/PART1
52
spherical particles, to much larger (>100 nm) rod shaped particles. 2.Overall, the particle size distributions between replicates per sub-sample are very similar, only differing
by an average range of 14.6nm for the NM-110 sample and 8.4 nm for the ZnO sample. An exception
however, is the difference in the replicates of sub-sample 0830 for ZnO-HP1. 3.The mean particle size for ZnO-HP1 is in the range 70-80nm, and for the ZnO sample the range 100-
111nm. Except for sub-sample 1455 which is 93.3nm, larger than that of the other sub-samples for ZnO-
HP1 and for ZnO, sub-sample 0599 at 90.3nm has a comparatively small mean particle size.
The size of particles for JRC sub-sampled powders ZnO and ZnO-HP1 given by the mean Feret’s
diameter, the standard deviation (represents broadness of size distribution, not error) for each sample,
sub-sample and replicate.
NM 111 ZnO-HP1 Mean
Feret’s
diameter
(nm)
S.D. NM 11O ZnO Mean
Feret’s
diameter
(nm)
S.D.
0830 r1 92.4 59.5 0599 r1 87.7 56.0
r2 82.0 52.6 r2 94.0 72.8
r3 66.8 48.8 r3 89.2 70.2
sub sample 79.4 54.2 sub sample 90.5 67.4
1455 r1 92.9 54.5 0945 r1 98.3 60.6
r2 86.3 66.6 r2 103.3 63.3
r3 99.5 72.3 r3 107.7 67.4
sub sample 93.3 66.1 sub sample 102.6 63.5
1951 r1 89.6 70.2 0979 r1 110.8 73.9
r2 73.6 60.1 r2 113.6 69.7
r3 70.0 57.1 r3 102.3 60.4
sub sample 77.2 62.8 sub sample 108.7 68.0
2017 r1 81.1 59.3 3911 r1 109.4 70.4
r2 72.7 53.0 r2 113.9 68.4
r3 76.5 57.2 r3 108.9 62.3
sub sample 76.7 56.5 sub sample 110.8 67.3
2100 r1 78.1 64.8 4410 r1 99.5 56.5
r2 73.7 56.4 r2 106.2 68.5
r3 88.7 63.6 r3 104.5 64.0
sub sample 79.6 61.8 sub sample 103.4 63.1
4414 r1 73.6 71.4 4779 r1 99.5 62.6
r2 68.2 53.7 r2 111.1 74.3
r3 73.7 51.1 r3 110.8 70.8
sub sample 71.8 59.4 sub sample 107.1 69.5
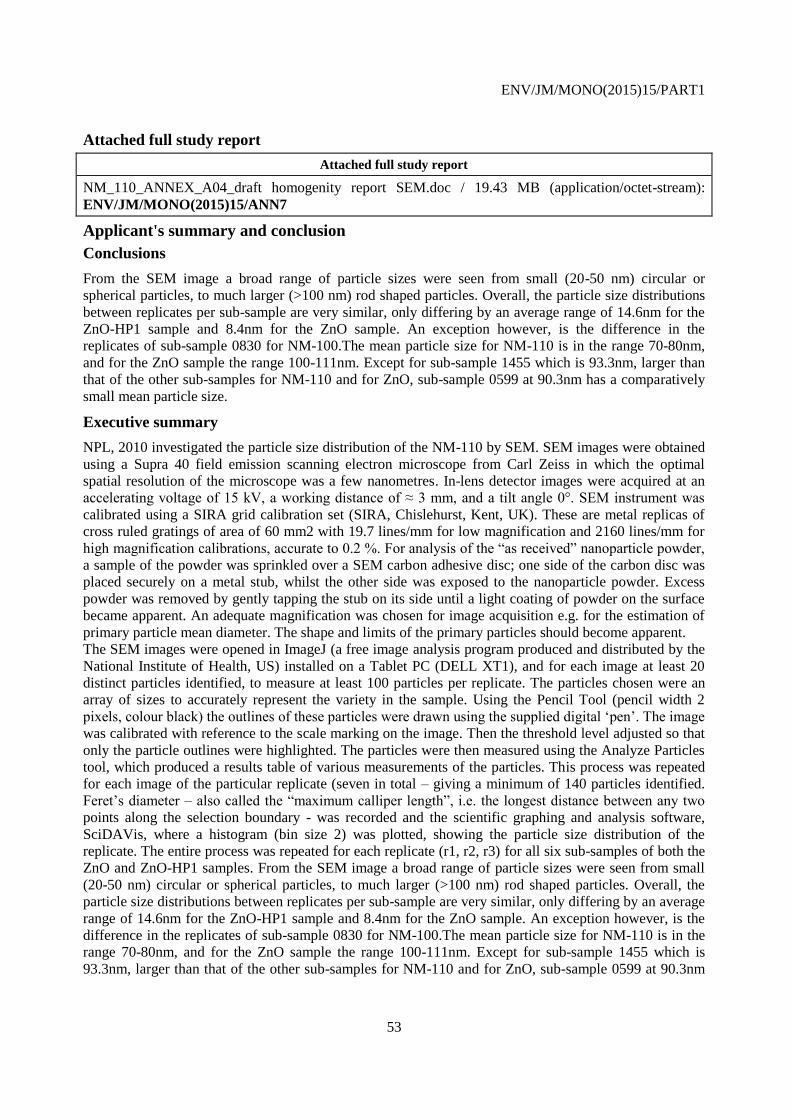
ENV/JM/MONO(2015)15/PART1
53
Attached full study report
Attached full study report
NM_110_ANNEX_A04_draft homogenity report SEM.doc / 19.43 MB (application/octet-stream):
ENV/JM/MONO(2015)15/ANN7
Applicant's summary and conclusion
Conclusions
From the SEM image a broad range of particle sizes were seen from small (20-50 nm) circular or
spherical particles, to much larger (>100 nm) rod shaped particles. Overall, the particle size distributions
between replicates per sub-sample are very similar, only differing by an average range of 14.6nm for the
ZnO-HP1 sample and 8.4nm for the ZnO sample. An exception however, is the difference in the
replicates of sub-sample 0830 for NM-100.The mean particle size for NM-110 is in the range 70-80nm,
and for the ZnO sample the range 100-111nm. Except for sub-sample 1455 which is 93.3nm, larger than
that of the other sub-samples for NM-110 and for ZnO, sub-sample 0599 at 90.3nm has a comparatively
small mean particle size.
Executive summary
NPL, 2010 investigated the particle size distribution of the NM-110 by SEM. SEM images were obtained
using a Supra 40 field emission scanning electron microscope from Carl Zeiss in which the optimal
spatial resolution of the microscope was a few nanometres. In-lens detector images were acquired at an
accelerating voltage of 15 kV, a working distance of ≈ 3 mm, and a tilt angle 0°. SEM instrument was
calibrated using a SIRA grid calibration set (SIRA, Chislehurst, Kent, UK). These are metal replicas of
cross ruled gratings of area of 60 mm2 with 19.7 lines/mm for low magnification and 2160 lines/mm for
high magnification calibrations, accurate to 0.2 %. For analysis of the “as received” nanoparticle powder,
a sample of the powder was sprinkled over a SEM carbon adhesive disc; one side of the carbon disc was
placed securely on a metal stub, whilst the other side was exposed to the nanoparticle powder. Excess
powder was removed by gently tapping the stub on its side until a light coating of powder on the surface
became apparent. An adequate magnification was chosen for image acquisition e.g. for the estimation of
primary particle mean diameter. The shape and limits of the primary particles should become apparent.
The SEM images were opened in ImageJ (a free image analysis program produced and distributed by the
National Institute of Health, US) installed on a Tablet PC (DELL XT1), and for each image at least 20
distinct particles identified, to measure at least 100 particles per replicate. The particles chosen were an
array of sizes to accurately represent the variety in the sample. Using the Pencil Tool (pencil width 2
pixels, colour black) the outlines of these particles were drawn using the supplied digital ‘pen’. The image
was calibrated with reference to the scale marking on the image. Then the threshold level adjusted so that
only the particle outlines were highlighted. The particles were then measured using the Analyze Particles
tool, which produced a results table of various measurements of the particles. This process was repeated
for each image of the particular replicate (seven in total – giving a minimum of 140 particles identified.
Feret’s diameter – also called the “maximum calliper length”, i.e. the longest distance between any two
points along the selection boundary - was recorded and the scientific graphing and analysis software,
SciDAVis, where a histogram (bin size 2) was plotted, showing the particle size distribution of the
replicate. The entire process was repeated for each replicate (r1, r2, r3) for all six sub-samples of both the
ZnO and ZnO-HP1 samples. From the SEM image a broad range of particle sizes were seen from small
(20-50 nm) circular or spherical particles, to much larger (>100 nm) rod shaped particles. Overall, the
particle size distributions between replicates per sub-sample are very similar, only differing by an average
range of 14.6nm for the ZnO-HP1 sample and 8.4nm for the ZnO sample. An exception however, is the
difference in the replicates of sub-sample 0830 for NM-100.The mean particle size for NM-110 is in the
range 70-80nm, and for the ZnO sample the range 100-111nm. Except for sub-sample 1455 which is
93.3nm, larger than that of the other sub-samples for NM-110 and for ZnO, sub-sample 0599 at 90.3nm
ENV/JM/MONO(2015)15/PART1
54
has a comparatively small mean particle size.
4.6 Vapour pressure
4.7 Partition coefficient
4.8 Water solubility
Endpoint summary: Water solubility
Administrative Data
Short description of key information
It was shown that the dissolution rates were fastest when the NMs were dispersed in deionized water,
with NM 110 dissolving the fastest and NM 112 dissolving the slowest. Out of all ecotox media, fish
medium showed highest dissolution rate followed by daphnia and then seawater. Dispersing
nanomaterials in such ecotox media would mean less stable dispersion and this subsequently equates to
the reduced surface area concentrations and thus a lower dissolution rate. There was no significant
difference in dissolution rate between the uncoated ZnO nanomaterials and the bulk material.
Discussion
Four studies using different analytical techniques were available for dissolution of the investigated
nanomaterials and were assessed in a weight of evidence approach.
A dissolution study was conducted by CSIRO, 2012 in artificial soil solution of with ionic composition
typical of that found in Australian soil porewater. The solution pH was buffered to 4, 7 or 9 throughout
the dissolution study. The NM stock solution was added with 20 mL of artificial soil solution (final
concentration of ~ 300 µg Zn/L) into 50 mL centrifuge tubes. The solution pH was maintained at 4, 7, or
9 using perchloric acid (HClO4, 0.1 M) or sodium hydroxide (0.1 M) and buffered using 0.1 mM sodium
acetate (NaCH3COO), 0.1 mM 2-(N morpholino)ethanesulfonic acid sodium salt (MES), or 0.1 mM
sodium borate (Na2B4O7 x 10 H2O) solutions, respectively. The solutions were shaken on an end-over-
end shaker for 0, 24h and 7d. At individual time periods, 2 mL of solution was removed and added into 1
kDa ultra filtration devices (UF). The UF devices were centrifuged at 4000 g for 15 min and total Zn
concentrations in filtrates determined using inductively coupled plasma-mass spectrometry. The
dissolution of NM in each pH solution and time period was expressed as a percentage of the total Zn
added. The dissolution for all NM was highest at pH 4 and lowest at pH 9. As there is doubt on the
validity of the presented data, e.g the time series, the absolute values as well as the differences between
ZnO grades were regarded to be not plausible, no further results was taken into account.
A publication by Rogers et al., 2010, was available. The dissolution of NM-110 in synthetic softwater
medium without EDTA and buffered at pH 7.5±0.1 with 2 mM piperazine-N,N’-bis(ethanesulfonic acid)
was determined using the equilibrium dialysis technique described by Franklin et al., 2007. The
dissolution of NM-110 was determined to be 6.77±0.12 mg/L at pH = 7.5 in US EPA medium. Due to the
different test procedure, conditions and the lack of data from the other three nanomaterials, this result was
regarded as less relevant.
The dissolution of NM 110, NM 112, NM 113 in different media (deionized water, fish medium, daphnia
medium and seawater) were investigated by NPL, 2010 using inductively coupled plasma mass
spectrometry (ICP-MS). Dispersion was performed in accordance to the recommended PROSPEcT
protocol. A concentration of 50 mg/L was made up for each sample; a total volume of 1 L was made up
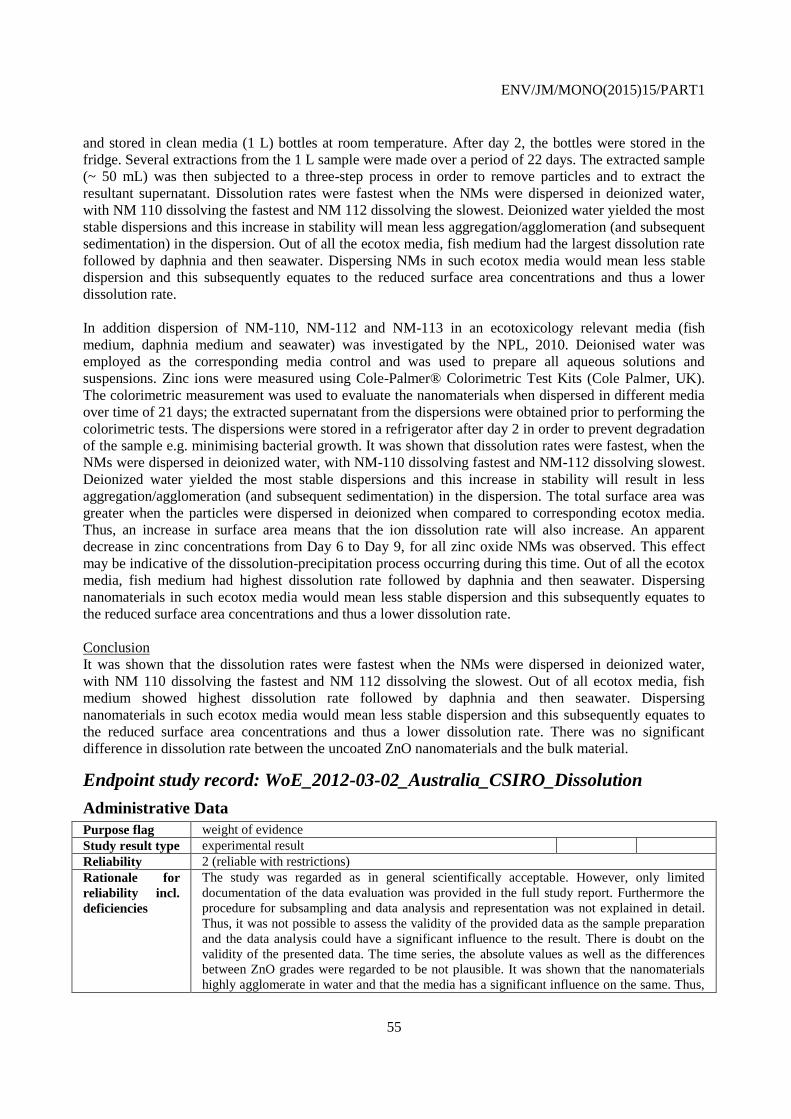
ENV/JM/MONO(2015)15/PART1
55
and stored in clean media (1 L) bottles at room temperature. After day 2, the bottles were stored in the
fridge. Several extractions from the 1 L sample were made over a period of 22 days. The extracted sample
(~ 50 mL) was then subjected to a three-step process in order to remove particles and to extract the
resultant supernatant. Dissolution rates were fastest when the NMs were dispersed in deionized water,
with NM 110 dissolving the fastest and NM 112 dissolving the slowest. Deionized water yielded the most
stable dispersions and this increase in stability will mean less aggregation/agglomeration (and subsequent
sedimentation) in the dispersion. Out of all the ecotox media, fish medium had the largest dissolution rate
followed by daphnia and then seawater. Dispersing NMs in such ecotox media would mean less stable
dispersion and this subsequently equates to the reduced surface area concentrations and thus a lower
dissolution rate.
In addition dispersion of NM-110, NM-112 and NM-113 in an ecotoxicology relevant media (fish
medium, daphnia medium and seawater) was investigated by the NPL, 2010. Deionised water was
employed as the corresponding media control and was used to prepare all aqueous solutions and
suspensions. Zinc ions were measured using Cole-Palmer® Colorimetric Test Kits (Cole Palmer, UK).
The colorimetric measurement was used to evaluate the nanomaterials when dispersed in different media
over time of 21 days; the extracted supernatant from the dispersions were obtained prior to performing the
colorimetric tests. The dispersions were stored in a refrigerator after day 2 in order to prevent degradation
of the sample e.g. minimising bacterial growth. It was shown that dissolution rates were fastest, when the
NMs were dispersed in deionized water, with NM-110 dissolving fastest and NM-112 dissolving slowest.
Deionized water yielded the most stable dispersions and this increase in stability will result in less
aggregation/agglomeration (and subsequent sedimentation) in the dispersion. The total surface area was
greater when the particles were dispersed in deionized when compared to corresponding ecotox media.
Thus, an increase in surface area means that the ion dissolution rate will also increase. An apparent
decrease in zinc concentrations from Day 6 to Day 9, for all zinc oxide NMs was observed. This effect
may be indicative of the dissolution-precipitation process occurring during this time. Out of all the ecotox
media, fish medium had highest dissolution rate followed by daphnia and then seawater. Dispersing
nanomaterials in such ecotox media would mean less stable dispersion and this subsequently equates to
the reduced surface area concentrations and thus a lower dissolution rate.
Conclusion
It was shown that the dissolution rates were fastest when the NMs were dispersed in deionized water,
with NM 110 dissolving the fastest and NM 112 dissolving the slowest. Out of all ecotox media, fish
medium showed highest dissolution rate followed by daphnia and then seawater. Dispersing
nanomaterials in such ecotox media would mean less stable dispersion and this subsequently equates to
the reduced surface area concentrations and thus a lower dissolution rate. There was no significant
difference in dissolution rate between the uncoated ZnO nanomaterials and the bulk material.
Endpoint study record: WoE_2012-03-02_Australia_CSIRO_Dissolution
Administrative Data
Purpose flag weight of evidence
Study result type experimental result
Reliability 2 (reliable with restrictions)
Rationale for
reliability incl.
deficiencies
The study was regarded as in general scientifically acceptable. However, only limited
documentation of the data evaluation was provided in the full study report. Furthermore the
procedure for subsampling and data analysis and representation was not explained in detail.
Thus, it was not possible to assess the validity of the provided data as the sample preparation
and the data analysis could have a significant influence to the result. There is doubt on the
validity of the presented data. The time series, the absolute values as well as the differences
between ZnO grades were regarded to be not plausible. It was shown that the nanomaterials
highly agglomerate in water and that the media has a significant influence on the same. Thus,

ENV/JM/MONO(2015)15/PART1
56
due to the unknown composition of the used artificial soil solution (no reference was
provided), there is a unknown factor which have an influence on the result. Thus, the study
was regarded as reliable with restrictions.
Data source
Reference
Reference
type
Author Year Title Bibliographic
source
Testing
laboratory
Report
no.
Owner
company
Company
study no.
Report
date
study
report
Cornelis
et al.
2012 Dissolution Commonwealth
Scientific and
Industrial
Research
Organisation
00001 2012-
03-02
Data access
data submitter is data owner
Data protection claimed
yes
Materials and methods
Type of method
flask method
Principles of method if other than guideline
Dissolution of NM-110 was examined in an artificial soil solution at pH 4, 7 and 9 (see attached
dissolution method).
GLP compliance
no
Test materials
Identity of test material same as for substance defined in section 1 (if not read-across)
yes
Test material identity
Identifier Identity
CAS number 1314-13-2
EC number 215-222-5
IUPAC name oxozinc
other: OECD Sponsorship Programme NM110, NM111, NM112, NM113
Test material form
nanomaterial
Details on test material
-Name of test material: Z-cote ®
Code: NM110Supplier: BASF SE
Surface coating: none
- Substance type: Inorganic
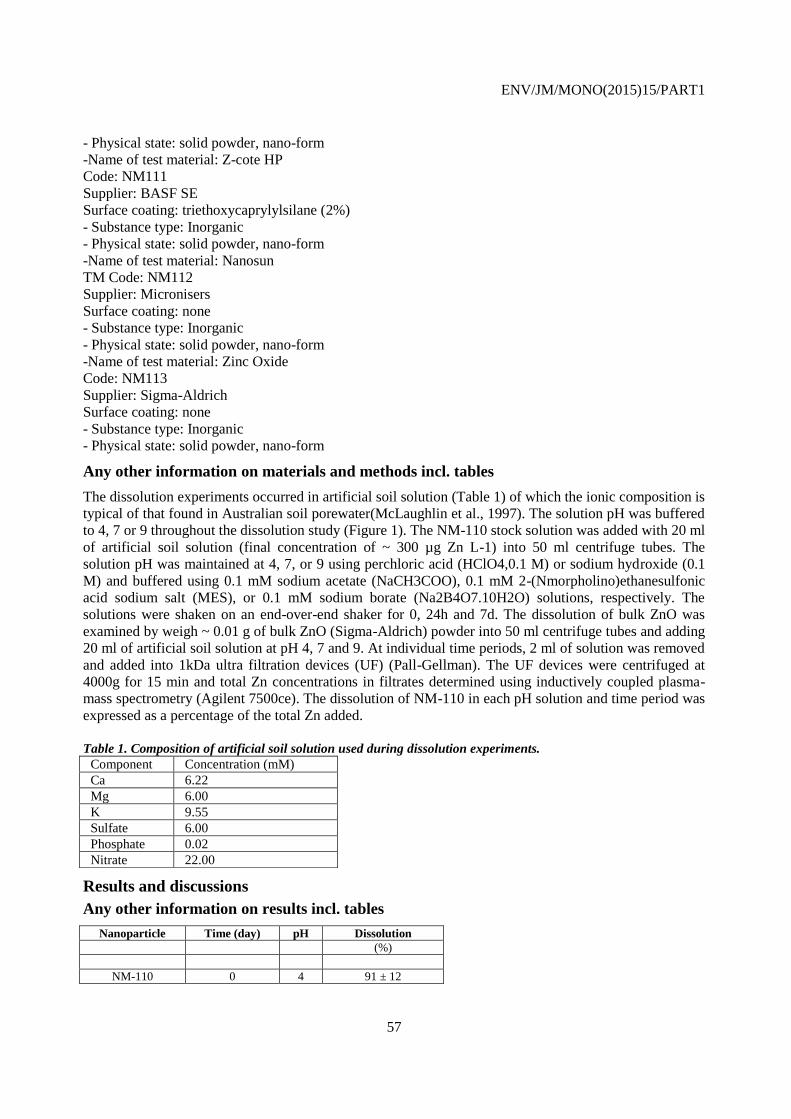
ENV/JM/MONO(2015)15/PART1
57
- Physical state: solid powder, nano-form
-Name of test material: Z-cote HP
Code: NM111
Supplier: BASF SE
Surface coating: triethoxycaprylylsilane (2%)
- Substance type: Inorganic
- Physical state: solid powder, nano-form
-Name of test material: Nanosun
TM Code: NM112
Supplier: Micronisers
Surface coating: none
- Substance type: Inorganic
- Physical state: solid powder, nano-form
-Name of test material: Zinc Oxide
Code: NM113
Supplier: Sigma-Aldrich
Surface coating: none
- Substance type: Inorganic
- Physical state: solid powder, nano-form
Any other information on materials and methods incl. tables
The dissolution experiments occurred in artificial soil solution (Table 1) of which the ionic composition is
typical of that found in Australian soil porewater(McLaughlin et al., 1997). The solution pH was buffered
to 4, 7 or 9 throughout the dissolution study (Figure 1). The NM-110 stock solution was added with 20 ml
of artificial soil solution (final concentration of ~ 300 µg Zn L-1) into 50 ml centrifuge tubes. The
solution pH was maintained at 4, 7, or 9 using perchloric acid (HClO4,0.1 M) or sodium hydroxide (0.1
M) and buffered using 0.1 mM sodium acetate (NaCH3COO), 0.1 mM 2-(Nmorpholino)ethanesulfonic
acid sodium salt (MES), or 0.1 mM sodium borate (Na2B4O7.10H2O) solutions, respectively. The
solutions were shaken on an end-over-end shaker for 0, 24h and 7d. The dissolution of bulk ZnO was
examined by weigh ~ 0.01 g of bulk ZnO (Sigma-Aldrich) powder into 50 ml centrifuge tubes and adding
20 ml of artificial soil solution at pH 4, 7 and 9. At individual time periods, 2 ml of solution was removed
and added into 1kDa ultra filtration devices (UF) (Pall-Gellman). The UF devices were centrifuged at
4000g for 15 min and total Zn concentrations in filtrates determined using inductively coupled plasma-
mass spectrometry (Agilent 7500ce). The dissolution of NM-110 in each pH solution and time period was
expressed as a percentage of the total Zn added.
Table 1. Composition of artificial soil solution used during dissolution experiments.
Component Concentration (mM)
Ca 6.22
Mg 6.00
K 9.55
Sulfate 6.00
Phosphate 0.02
Nitrate 22.00
Results and discussions
Any other information on results incl. tables
Nanoparticle Time (day) pH Dissolution
(%)
NM-110 0 4 91 ± 12
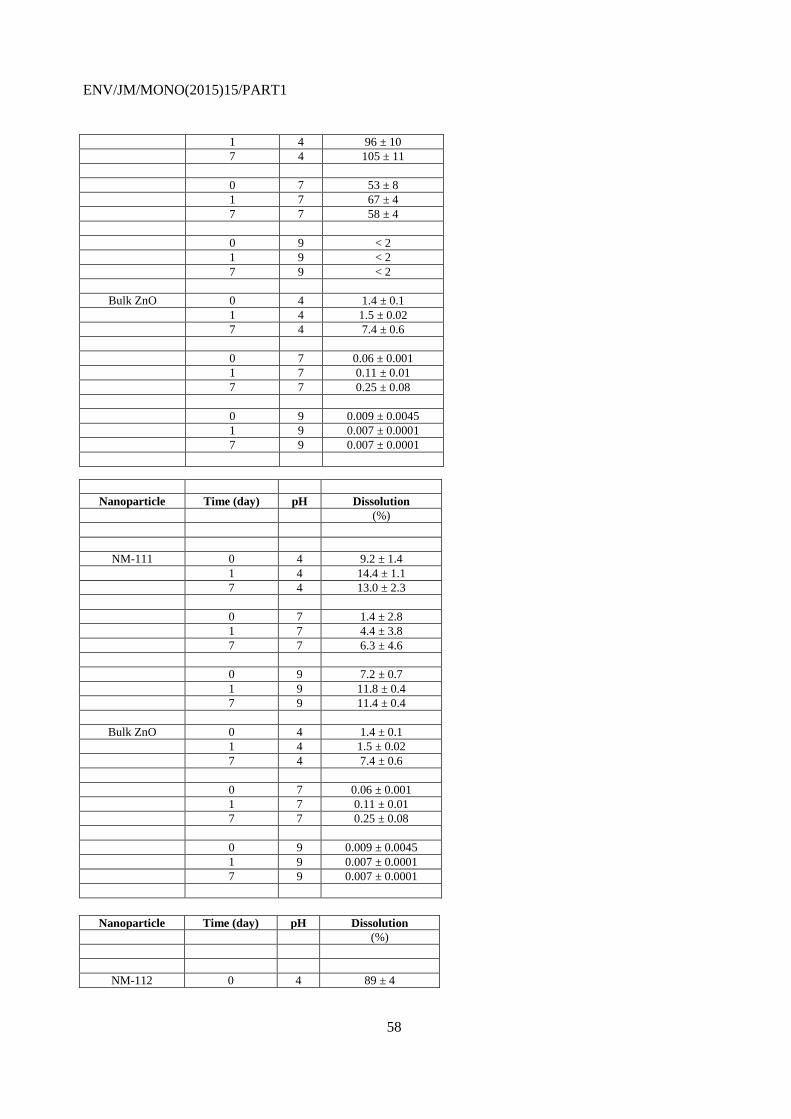
ENV/JM/MONO(2015)15/PART1
58
1 4 96 ± 10
7 4 105 ± 11
0 7 53 ± 8
1 7 67 ± 4
7 7 58 ± 4
0 9 < 2
1 9 < 2
7 9 < 2
Bulk ZnO 0 4 1.4 ± 0.1
1 4 1.5 ± 0.02
7 4 7.4 ± 0.6
0 7 0.06 ± 0.001
1 7 0.11 ± 0.01
7 7 0.25 ± 0.08
0 9 0.009 ± 0.0045
1 9 0.007 ± 0.0001
7 9 0.007 ± 0.0001
Nanoparticle Time (day) pH Dissolution
(%)
NM-111 0 4 9.2 ± 1.4
1 4 14.4 ± 1.1
7 4 13.0 ± 2.3
0 7 1.4 ± 2.8
1 7 4.4 ± 3.8
7 7 6.3 ± 4.6
0 9 7.2 ± 0.7
1 9 11.8 ± 0.4
7 9 11.4 ± 0.4
Bulk ZnO 0 4 1.4 ± 0.1
1 4 1.5 ± 0.02
7 4 7.4 ± 0.6
0 7 0.06 ± 0.001
1 7 0.11 ± 0.01
7 7 0.25 ± 0.08
0 9 0.009 ± 0.0045
1 9 0.007 ± 0.0001
7 9 0.007 ± 0.0001
Nanoparticle Time (day) pH Dissolution
(%)
NM-112 0 4 89 ± 4

ENV/JM/MONO(2015)15/PART1
59
1 4 81 ± 7
7 4 82 ± 4
0 7 62 ± 3
1 7 60 ± 6
7 7 65 ± 3
0 9 2.7 ± 1.0
1 9 2.5 ± 0.5
7 9 2.8 ± 0.6
Bulk ZnO 0 4 1.4 ± 0.1
1 4 1.5 ± 0.02
7 4 7.4 ± 0.6
0 7 0.06 ± 0.001
1 7 0.11 ± 0.01
7 7 0.25 ± 0.08
0 9 0.009 ± 0.0045
1 9 0.007 ± 0.0001
7 9 0.007 ± 0.0001
Overall remarks, attachments
Attached full study report
Attached full study report
NM_110_ANNEX_A24_NanoHub_NM-110_dissolution method.docx / 102.15 KB (application/octet-stream):
ENV/JM/MONO(2015)15/ANN1
NM_110_ANNEX_A25_NanoHub_NM-110_dissolution_data.docx / 11.72 KB (application/octet-stream):
ENV/JM/MONO(2015)15/ANN1
NM_111_ANNEX_A19_NanoHub_NM-111_dissolution_data.docx / 11.49 KB (application/octet-stream):
ENV/JM/MONO(2015)15/ANN1
NM_112_ANNEX_A24_NanoHub_NM-112_dissolution_data.docx / 11.59 KB (application/octet-stream):
ENV/JM/MONO(2015)15/ANN1
Applicant's summary and conclusion
Conclusions
It was shown that the dissolution for all NM was highest at pH 4 and lowest at pH 9. As there is doubt on
the validity of the presented data, e.g. the time series, the absolute values as well as the differences
between ZnO grades were regarded to be not plausible, no further results was taken into account.
Executive summary
A dissolution study was conducted by CSIRO, 2012 in artificial soil solution of with ionic composition
typical of that found in Australian soil porewater. The solution pH was buffered to 4, 7 or 9 throughout
the dissolution study. The NM stock solution was added with 20 mL of artificial soil solution (final
concentration of ~ 300 µg Zn/L) into 50 mL centrifuge tubes. The solution pH was maintained at 4, 7, or
9 using perchloric acid (HClO4, 0.1 M) or sodium hydroxide (0.1 M) and buffered using 0.1 mM sodium
acetate (NaCH3COO), 0.1 mM 2-(N morpholino)ethanesulfonic acid sodium salt (MES), or 0.1 mM
sodium borate (Na2B4O7 x 10 H2O) solutions, respectively. The solutions were shaken on an end-over-
end shaker for 0, 24h and 7d. At individual time periods, 2 mL of solution was removed and added into 1
kDa ultra filtration devices (UF). The UF devices were centrifuged at 4000 g for 15 min and total Zn
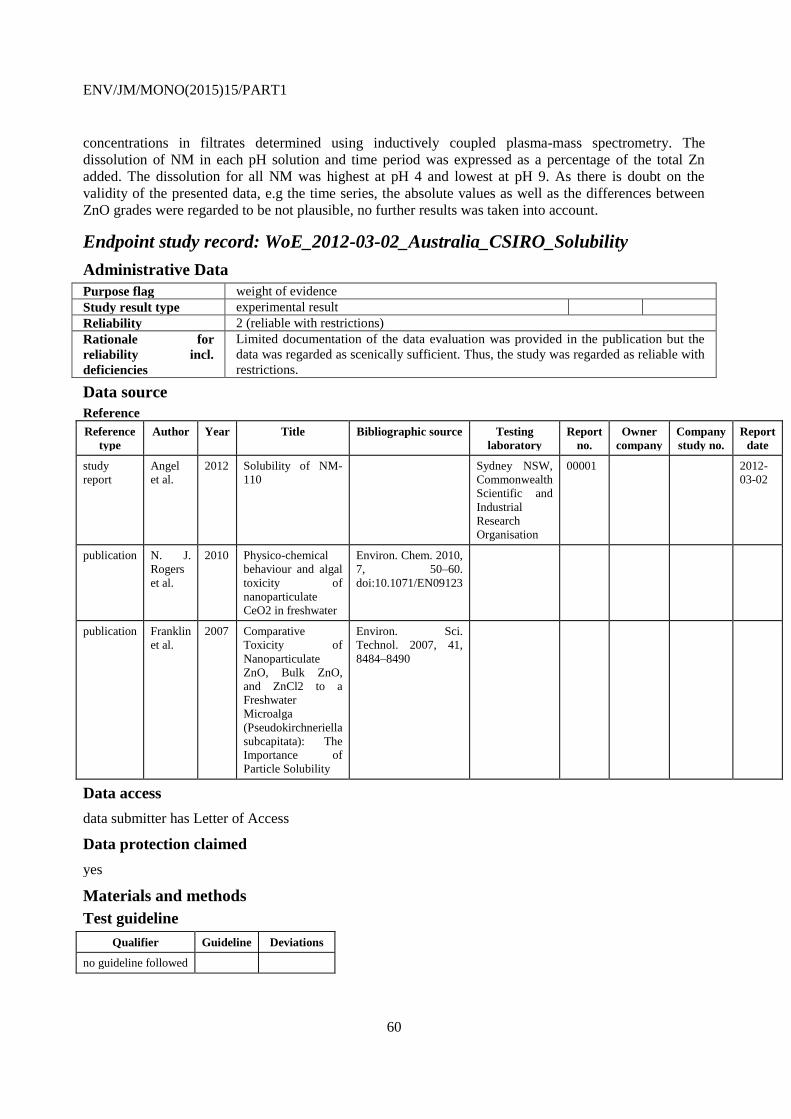
ENV/JM/MONO(2015)15/PART1
60
concentrations in filtrates determined using inductively coupled plasma-mass spectrometry. The
dissolution of NM in each pH solution and time period was expressed as a percentage of the total Zn
added. The dissolution for all NM was highest at pH 4 and lowest at pH 9. As there is doubt on the
validity of the presented data, e.g the time series, the absolute values as well as the differences between
ZnO grades were regarded to be not plausible, no further results was taken into account.
Endpoint study record: WoE_2012-03-02_Australia_CSIRO_Solubility
Administrative Data
Purpose flag weight of evidence
Study result type experimental result
Reliability 2 (reliable with restrictions)
Rationale for
reliability incl.
deficiencies
Limited documentation of the data evaluation was provided in the publication but the
data was regarded as scenically sufficient. Thus, the study was regarded as reliable with
restrictions.
Data source
Reference
Reference
type
Author Year Title Bibliographic source Testing
laboratory
Report
no.
Owner
company
Company
study no.
Report
date
study
report
Angel
et al.
2012 Solubility of NM-
110
Sydney NSW,
Commonwealth
Scientific and
Industrial
Research
Organisation
00001 2012-
03-02
publication N. J.
Rogers
et al.
2010 Physico-chemical
behaviour and algal
toxicity of
nanoparticulate
CeO2 in freshwater
Environ. Chem. 2010,
7, 50–60.
doi:10.1071/EN09123
publication Franklin
et al.
2007 Comparative
Toxicity of
Nanoparticulate
ZnO, Bulk ZnO,
and ZnCl2 to a
Freshwater
Microalga
(Pseudokirchneriella
subcapitata): The
Importance of
Particle Solubility
Environ. Sci.
Technol. 2007, 41,
8484–8490
Data access
data submitter has Letter of Access
Data protection claimed
yes
Materials and methods
Test guideline
Qualifier Guideline Deviations
no guideline followed
ENV/JM/MONO(2015)15/PART1
61
Type of method
other: dialysis
Principles of method if other than guideline
The dissolution of NM-110 in synthetic softwater medium without EDTA and buffered at pH 7.5 +- 0.1
with 2 mM piperazine-N,N’-bis(ethanesulfonic acid) (PIPES: Sigma-Aldrich) (US EPA, 1994) was
determined using the equilibrium dialysis technique described by Franklin et al. (2007). Cole Parmer
Spectra/Por 7 dialysis membranes with a molecular weight cut-off of 1000 Dalton (~1 nm nominal pore
size) and 45 mm diameter were cut into 9 cm lengths with a Teflon-coated razor blade and washed
thoroughly in Milli-Q water. The dialysis cells were filled with 10 mL Milli-Q water and sealed with acid
washed (1% v/v HNO3) plastic dialysis clips. A concentrated suspension of NM-110 was prepared for
each type of nanoparticle by accurately weighing 0.12 g NM-110 into polycarbonate vials, pipetting 10
mL deionised water into the vial, and sonicating for 30 minutes. The suspension was then shaken
vigorously and quantitatively transferred into 3 L of synthetic softwater to achieve 40 mg/L ZnO in
solution. Triplicate tanks were utilised in dialysis tests so that three replicates were sampled at each time-
point. The dialysis cells were added to the test solution and continually stirred under constant light and
temperature (24ºC) conditions for 72 hours. The total volume of the dialysis cells was kept to below 5%
of the test solution in order to minimise dilution effects as dissolved zinc diffused into the dialysis cells.
A cell was removed from each triplicate tank at each sampling time andan aliquot of solution was
removed from the cells by pipette. A 5 mL volume of the external solution was also withdrawn using a
syringe and filtered through a 0.1 μm filter (Pall) at each time point to measure the zinc in this fraction.
Total zinc was measured at the start and end of the experiment only. The samples were acidified to 0.5%
v/v HNO3 (Merck tracepur) and the zinc concentration measured by ICP-MS (Agilent 7500ce).
GLP compliance
no
Test materials
Identity of test material same as for substance defined in section 1 (if not read-across)
yes
Test material identity
Identifier Identity
CAS number 1314-13-2
EC number 215-222-5
IUPAC name oxozinc
other: OECD Sponsorship programme NM110, NM111, NM112, NM113
Test material form
nanomaterial
Details on test material
-Name of test material: Z-cote ®
Code: NM110Supplier: BASF SE
Surface coating: none
- Substance type: Inorganic
- Physical state: solid powder, nano-form
-Name of test material: Z-cote HP
Code: NM111
ENV/JM/MONO(2015)15/PART1
62
Supplier: BASF SE
Surface coating: triethoxycaprylylsilane (2%)
- Substance type: Inorganic
- Physical state: solid powder, nano-form
-Name of test material: Nanosun
TM Code: NM112
Supplier: Micronisers
Surface coating: none
- Substance type: Inorganic
- Physical state: solid powder, nano-form
-Name of test material: Zinc Oxide
Code: NM113
Supplier: Sigma-Aldrich
Surface coating: none
- Substance type: Inorganic
- Physical state: solid powder, nano-form
Results and discussions
Any other information on results incl. tables
Sample I.D. NM110
Dispersion medium US EPA medium
pH 7.5
Solubility 6.77 ± 0.12 mg/L
Overall remarks, attachments
Attached background material
Attached document Remarks
NM_110_ANNEX_A26_Franklin et al 2007.pdf / 465.82 KB (application/octet-stream):
ENV/JM/MONO(2015)15/ANN8
NM_110_ANNEX_A27_Rogers et al 2010.pdf / 395.58 KB (application/octet-stream):
ENV/JM/MONO(2015)15/ANN9
Applicant's summary and conclusion
Conclusions
The dissolution of NM 110 was determined to be 6.77 ± 0.12 mg/L at pH = 7.5 in US EPA medium.
Executive summary
The dissolution of NM-110 in synthetic softwater medium without EDTA and buffered at pH 7.5 ± 0.1
with 2 mM piperazine-N,N’-bis(ethanesulfonic acid) was determined using the equilibrium dialysis
technique described by Franklin et al., 2007. The dissolution of NM-110 was determined to be 6.77 ±
0.12 mg/L at pH = 7.5 in US EPA medium. Due to the different test procedure, conditions and the lack of
data from the other three nanomaterials, this result was regarded as less relevant.
ENV/JM/MONO(2015)15/PART1
63
Endpoint study record: WoE_2010-12-09_NPL for PROSPECT_Water solubility
Administrative Data
Purpose flag weight of evidence
Study result type experimental result
Reliability 2 (reliable with restrictions)
Rationale for
reliability incl.
deficiencies
The study was regarded as scientifically acceptable. However, only limited documentation of
the data evaluation was provided in the publication. It was shown that the nanomaterials
highly agglomerate in water and that the media has a significant influence on the same. The
agglomeration of the test item was not determined by supporting analytics. Thus, the
influence of the agglomeration of the nanomaterial could not be estimated. The Powder was
not subsampled by spinning riffler. Therefore the study was regarded as reliable with
restrictions.
Data source
Reference
Reference
type
Author Year Title Bibliographic
source
Testing
laboratory
Report
no.
Owner
company
Company
study no.
Report
date
study
report
National
Physical
Laboratory
2010 DISSOLUTION
OF NMs IN
VARIOUS
MEDIA
National
Physical
Laboratory,
Teddington,
Middlesex,
United
Kingdom
2010-
12-09
Data access
data submitter is data owner
Data protection claimed
yes, but willing to share
Materials and methods
Test guideline
Qualifier Guideline Deviations
no guideline followed
Type of method
ICP-MS
Principles of method if other than guideline
Dissolution to the mass proportion of the NM in colloidal suspension that has lost its particulate character
i.e. from a particle form to ionic or molecular form i.e. measuring the ion concentration over a specific
period of time. This involved a sample extraction followed by analysis i.e. extraction in the removal of
the NM particles and subsequent collection of supernatant using ICP-MS; the series of data below ties in
with the calorimetric testing. Dispersion was performed in accordance to the recommended PROSPEcT
video. Concentrations of 50 mg/L was made up for each sample; a total volume of 1 L was made up and
stored in clean media (1 L) bottles at room temperature. After day 2, the bottles were stored in the fridge.
Several extractions from the 1 L sample was made over a period of 22 days; prior to extraction, the
bottles were gently agitated (this was done by hand) to allow proper mixing to ensure homogeneity. The
extracted sample (~ 50 ml) was then subjected to a three-step process in order to remove particles and to
extract the resultant supernatant. This step was done immediately after extraction. First step, involved the
ENV/JM/MONO(2015)15/PART1
64
extraction of aggregates/agglomerates using filtration method, through a Millipore Express PES
membrane, 0.1 μm pore size filter (Fisher, UK) under vacuum. In the second step, the resultant filtrant
was centrifuged (Centrifuge 5430, Eppendorf, UK) (7500 rpm for one hour). Finally, the extraction of the
clear supernatant was carried out by using Peri-Star Pro peristaltic pump (World Precision Instruments,
UK); this was done carefully (so as to not disturb the pellet). Less than half of the supernatant was
collected. The resultant supernatant was then stored in the freezer for analysis using ICP-MS; this work
was subcontracted and performed by a personnel in LGC (Laboratory Government Chemist, UK). The
ICP-MS analysis was carried out using an Agilent 7500ce ICP-MS Octopole Reaction System, operating
in standard (no collision cell gas) mode for Cerium (Ce) and Helium mode for Zinc (Zn). The instrument
is UKAS accredited and was set up following standard operating procedure (SOP) INS/A1-0013. The
samples were defrosted and equilibrated to room temperature, then shaken, to ensure homogeneity. An
aliquot of 0.2g – 0.23g was taken from each sample and digested in a CEM Discover microwave, SOP
INS/A1-0014, using a mixture of HNO3/H2O2. The digested samples were then diluted to 5g prior to
analysis. The samples were digested and analysed over a period of 5 days. Validation was carried out
following SOP INS/A1-0015, this includes spiked recoveries and replicate analyses.
GLP compliance
no
Test materials
Identity of test material same as for substance defined in section 1 (if not read-across)
yes
Test material identity
Identifier Identity
CAS number 1314-13-2
EC number 215-222-5
IUPAC name oxozinc
other: OECD Sponsorship Programme NM110, Nm111, NM112, NM113
Test material form
nanomaterial
Details on test material
-Name of test material: Z-cote ®
Code: NM110Supplier: BASF SE
Surface coating: none
- Substance type: Inorganic
- Physical state: solid powder, nano-form
-Name of test material: Z-cote HP
Code: NM111Supplier: BASF SE
Surface coating: triethoxycaprylylsilane (2%)
- Substance type: Inorganic
- Physical state: solid powder, nano-form
-Name of test material: Nanosun
TM Code: NM112
Supplier: Micronisers
Surface coating: none
- Substance type: Inorganic
- Physical state: solid powder, nano-form
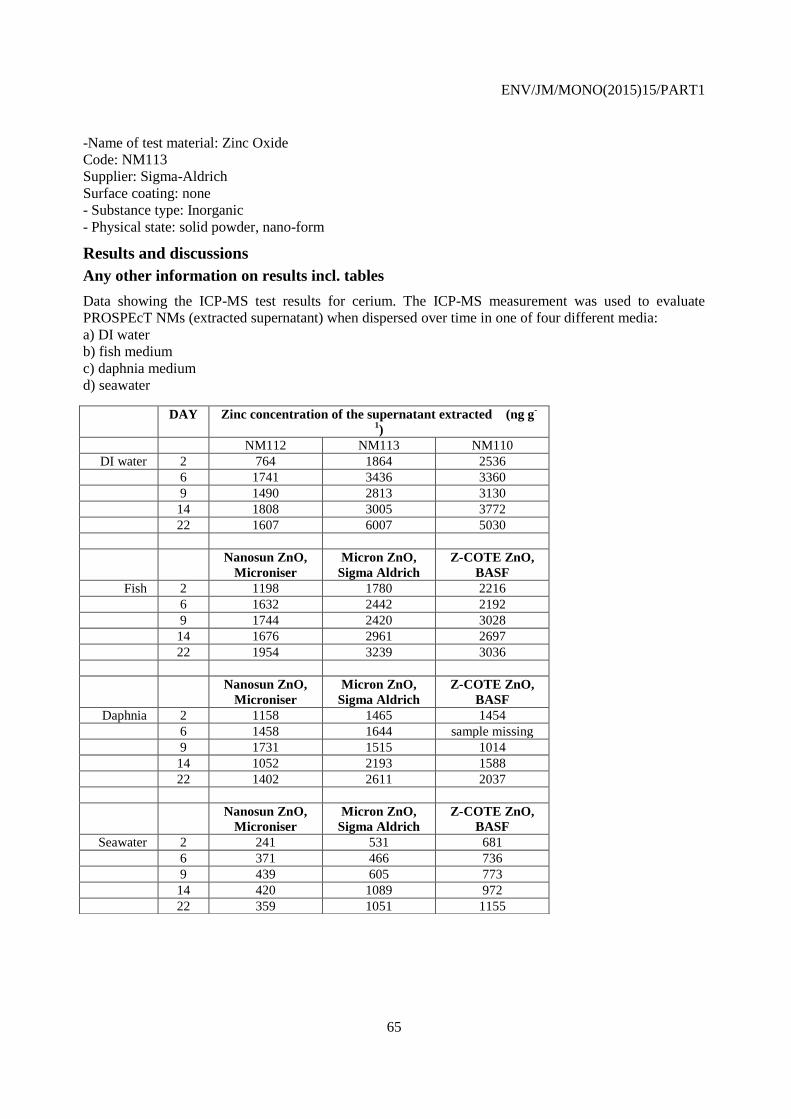
ENV/JM/MONO(2015)15/PART1
65
-Name of test material: Zinc Oxide
Code: NM113
Supplier: Sigma-Aldrich
Surface coating: none
- Substance type: Inorganic
- Physical state: solid powder, nano-form
Results and discussions
Any other information on results incl. tables
Data showing the ICP-MS test results for cerium. The ICP-MS measurement was used to evaluate
PROSPEcT NMs (extracted supernatant) when dispersed over time in one of four different media: a) DI water b) fish medium c) daphnia medium d) seawater
DAY Zinc concentration of the supernatant extracted (ng g-
1)
NM112 NM113 NM110
DI water 2 764 1864 2536
6 1741 3436 3360
9 1490 2813 3130
14 1808 3005 3772
22 1607 6007 5030
Nanosun ZnO,
Microniser
Micron ZnO,
Sigma Aldrich
Z-COTE ZnO,
BASF
Fish 2 1198 1780 2216
6 1632 2442 2192
9 1744 2420 3028
14 1676 2961 2697
22 1954 3239 3036
Nanosun ZnO,
Microniser
Micron ZnO,
Sigma Aldrich
Z-COTE ZnO,
BASF
Daphnia 2 1158 1465 1454
6 1458 1644 sample missing
9 1731 1515 1014
14 1052 2193 1588
22 1402 2611 2037
Nanosun ZnO,
Microniser
Micron ZnO,
Sigma Aldrich
Z-COTE ZnO,
BASF
Seawater 2 241 531 681
6 371 466 736
9 439 605 773
14 420 1089 972
22 359 1051 1155
ENV/JM/MONO(2015)15/PART1
66
Overall remarks, attachments
Attached full study report
Attached full study report
NM_110_ANNEX_A02_FINALINTERIM REPORT2010corrected.pdf / 1.05 MB (application/octet-
stream): ENV/JM/MONO(2015)15/ANN6
NM_110_ANNEX_A29_AdditionalDissolutionDataICP-MS.doc.doc / 111.5 KB (application/octet-
stream): ENV/JM/MONO(2015)15/ANN1
Applicant's summary and conclusion
Conclusions
Dissolution rates were fastest when the NMs were dispersed in deionized water, with NM 110 dissolving
the fastest and NM 112 dissolving the slowest. Deionized water yielded the most stable dispersions and
this increase in stability will mean less aggregation/agglomeration (and subsequent sedimentation) in the
dispersion. Out of all the ecotox media, fish medium had the largest dissolution rate followed by daphnia
and then seawater.
Executive summary
The dissolution of NM 110, NM 112, NM 113 in different media (deionized water, fish medium, daphnia
medium and seawater) were investigated by NPL, 2010 using inductively coupled plasma mass
spectrometry (ICP-MS). Dispersion was performed in accordance to the recommended PROSPEcT
protocol. A concentration of 50 mg/L was made up for each sample; a total volume of 1 L was made up
and stored in clean media (1 L) bottles at room temperature. After day 2, the bottles were stored in the
fridge. Several extractions from the 1 L sample were made over a period of 22 days. The extracted sample
(~ 50 mL) was then subjected to a three-step process in order to remove particles and to extract the
resultant supernatant. Dissolution rates were fastest when the NMs were dispersed in deionized water,
with NM 110 dissolving the fastest and NM 112 dissolving the slowest. Deionized water yielded the most
stable dispersions and this increase in stability will mean less aggregation/agglomeration (and subsequent
sedimentation) in the dispersion. Out of all the ecotox media, fish medium had the largest dissolution rate
followed by daphnia and then seawater. Dispersing NMs in such ecotox media would mean less stable
dispersion and this subsequently equates to the reduced surface area concentrations and thus a lower
dissolution rate.
Endpoint study record: WoE_2010-12-09_NPL for PROSPECT_Water solubility
Administrative Data
Purpose flag weight of evidence
Study result type experimental result
Reliability 2 (reliable with restrictions)
Rationale for
reliability incl.
deficiencies
The study was regarded as scientifically acceptable. However, only limited documentation of
the data evaluation was provided. It was shown that the nanomaterials highly agglomerate in
water and that the media has a significant influence on the same. The agglomeration of the
test item was not determined by supporting analytics. Thus, the influence of the
agglomeration of the nanomaterial could not be estimated. The Powder was not subsampled
by spinning riffler. Therefore the study was regarded as reliable with restrictions.
ENV/JM/MONO(2015)15/PART1
67
Data source
Reference
Reference
type
Author Year Title Bibliographic
source
Testing
laboratory
Report
no.
Owner
company
Company
study no.
Report
date
study
report
National
Physical
Laboratory
2010 DISSOLUTION
OF NMs IN
VARIOUS
MEDIA
National
Physical
Laboratory,
Teddington,
Middlesex,
United
Kingdom
2010-
12-09
Data access
data submitter is data owner
Data protection claimed
yes, but willing to share
Materials and methods
Test guideline
Qualifier Guideline Deviations
no guideline
followed
Type of method
flask method
Principles of method if other than guideline
Deionised water was employed as the corresponding media control and was used to prepare all aqueous
solutions and suspensions. Zinc ions were measured using Cole-Palmer® Colorimetric Test Kits (Cole
Palmer, UK). The colorimetric measurement was used to evaluate the nanomaterials when dispersed in
different media over time of 21 days; the extracted supernatant from the dispersions were obtained prior
to performing the colorimetric tests. The dispersions were stored in a refrigerator after day 2 in order to
prevent degradation of the sample e.g. minimising bacterial growth.
GLP compliance
no
Test materials
Identity of test material same as for substance defined in section 1 (if not read-across)
yes
Test material identity
Identifier Identity
CAS number 1314-13-2
EC number 215-222-5
IUPAC name oxozinc
other: OECD Sponsorship Programme NM110, Nm111, NM112, NM113
ENV/JM/MONO(2015)15/PART1
68
Test material form
nanomaterial
Details on test material
-Name of test material: Z-cote ®
Code: NM110
Supplier: BASF SE
Surface coating: none
- Substance type: Inorganic
- Physical state: solid powder, nano-form
-Name of test material: Z-cote HP
Code: NM111
Supplier: BASF SE
Surface coating: triethoxycaprylylsilane (2%)
- Substance type: Inorganic
- Physical state: solid powder, nano-form
-Name of test material: Nanosun
TM Code: NM112
Supplier: Micronisers
Surface coating: none
- Substance type: Inorganic
- Physical state: solid powder, nano-form
-Name of test material: Zinc Oxide
Code: NM113
Supplier: Sigma-Aldrich
Surface coating: none
- Substance type: Inorganic
- Physical state: solid powder, nano-form
Results and discussions
Details on results
The results of the colorimetric zinc ion tests; the aim here was to evaluate the dissolution events, for 21
days, of the PROSPEcT ZnO powders in the various media. The dispersions were stored in a refrigerator
after day 2 in order to prevent degradation of the sample e.g. minimising bacterial growth. Results show
the following trends: a) Dissolution rates were fastest when the NMs were dispersed in DI water, with Z-
COTE ZnO from BASF dissolving the fastest and Nanosun ZnO dissolving the slowest. As shown earlier
in this report, DI water yielded the most stable dispersions and this increase in stability will mean less
aggregation/agglomeration (and subsequent sedimentation) in the dispersion. Hence, the total surface area
is greater when the particles are dispersed in DI if compared to corresponding ecotox media; an increase
in surface area means that the ion dissolution rate will also increase.b) Of particular interest is the result in
Figure 2a, in which we see an apparent decrease in zinc concentrations from Day 6 to Day 9, for all zinc
oxide NMs. This effect may be indicative of the dissolution-precipitation process occurring during this
time.c) Out of all the ecotox media, fish medium had the largest dissolution rate followed by daphnia and
then seawater. Dispersing NMs in such ecotox media would mean less stable dispersion and this
subsequently equates to the reduced surface area concentrations and thus a lower dissolution rate. In
addition, the much larger ionic concentration in seawater may indirectly affect the dissolution rates,
possibly through the ability to influence “inner–sphere adsorption”, which have been known to be
important in mineral dissolution.
ENV/JM/MONO(2015)15/PART1
69
Overall remarks, attachments
Attached full study report
Attached full study report
NM_110_ANNEX_A28_DISSOLUTION OF NMs IN VARIOUS MEDIA.doc / 2.91 MB (application/octet-
stream): ENV/JM/MONO(2015)15/ANN1
Applicant's summary and conclusion
Conclusions
Out of all the ecotox media, fish medium had highest dissolution rate followed by daphnia and then
seawater. Dispersing nanomaterials in such ecotox media would mean less stable dispersion and this
subsequently equates to the reduced surface area concentrations and thus a lower dissolution rate.
Executive summary
Dispersion of NM-110, NM-112 and NM-113 in an ecotoxicology relevant media (fish medium, daphnia
medium and seawater) was investigated by the NPL, 2010. Deionised water was employed as the
corresponding media control and was used to prepare all aqueous solutions and suspensions. Zinc ions
were measured using Cole-Palmer® Colorimetric Test Kits (Cole Palmer, UK). The colorimetric
measurement was used to evaluate the nanomaterials when dispersed in different media over time of 21
days; the extracted supernatant from the dispersions were obtained prior to performing the colorimetric
tests. The dispersions were stored in a refrigerator after day 2 in order to prevent degradation of the
sample e.g. minimising bacterial growth. It was shown that dissolution rates were fastest, when the NMs
were dispersed in deionized water, with NM-110 dissolving fastest and NM-112 dissolving slowest.
Deionized water yielded the most stable dispersions and this increase in stability will result in less
aggregation/agglomeration (and subsequent sedimentation) in the dispersion. The total surface area was
greater when the particles were dispersed in deionized when compared to corresponding ecotox media.
Thus, an increase in surface area means that the ion dissolution rate will also increase. An apparent
decrease in zinc concentrations from Day 6 to Day 9, for all zinc oxide NMs was observed. This effect
may be indicative of the dissolution-precipitation process occurring during this time. Out of all the ecotox
media, fish medium had highest dissolution rate followed by daphnia and then seawater. Dispersing
nanomaterials in such ecotox media would mean less stable dispersion and this subsequently equates to
the reduced surface area concentrations and thus a lower dissolution rate.
ENV/JM/MONO(2015)15/PART1
70
4.9 Solubility in organic solvents / fat solubility
4.10 Surface tension
4.11 Flash point
4.12 Auto flammability
4.13 Flammability
4.14 Explosiveness
4.15 Oxidising properties
4.16 Oxidation reduction potential
Endpoint summary: Oxidation reduction potential
Administrative Data
Short description of key information
No reliable information was available.
Discussion
A study was conducted by NPL, 2010 using Cyclic voltammetric method to determine the redox potential
of NM-110. Results show two redox processes that are taking place, which was referred to as “Redox 1”
and “Redox 2”. Each redox reaction consists of two half-reactions i.e. for oxidation and reduction
reactions and these correspond to the oxidation peak and reduction peak in the C-V plot.
Furthermore it was indicated by the study director that the values should be treated with caution as:
a) Peaks were very broad, so numbers are only approximate.
b) Peak-peak separation was large, indicating that the processes were not fully reversible.
NPL, 2010 investigated the redox potential measurements, using ORP probe electrode, of various ZnO
dispersions (NM-100, NM-112 and NM-113), in various liquid media. NM-111 could not be investigated
by this method as it was difficult to disperse. The redox potential ORP electrode was calibrated against
Calibration Solution. This standard solution was also used to verify the performance of the electrode in
the beginning and end of the study. Redox potential measurements were carried out on freshly dispersed
NM in various media (deionized water, fish medium, daphnia medium and seawater). Dispersion of the
individual nanomaterial in the appropriate liquid media was carried out in accordance to the protocol as
recommended under PROSPECT/OECD (as part of the OECD guidelines). Redox potential was
determined to be highest in fish water and to be lowest in seawater.
The results showed that there were no significant differences in the redox potential between the different
nanomaterials.
ENV/JM/MONO(2015)15/PART1
71
Endpoint study record: WoE_2010-12-05 NPL for PROSPECT Oxidation
reduction potential.001
Administrative Data
Purpose flag weight of evidence
Study result type experimental result
Reliability 4 (not assignable)
Rationale for
reliability incl.
deficiencies
It was indicated by the study director that, the assignment is speculative in nature, as the
Pourbaix diagram is a potential-pH diagram and is a map of thermodynamic possibilities. The
Pourbaix diagram may well identify the lowest energy state of Zn but the exact speciation
may not exist as the corresponding redox reaction may not be favoured for kinetic reasons.
Therefore the reliable of the study could not be assigned.
Data source
Reference
Reference
type
Author Year Title Bibliographic
source
Testing
laboratory
Report
no.
Owner
company
Company
study no.
Report
date
study
report
National
Physical
Laboratory
2010 Redox
potential
measurements
National
Physical
Laboratory,
Teddington,
Middlesex,
United
Kingdom
2010-
12-05
Data access
data submitter is data owner
Data protection claimed
yes, but willing to share
Materials and methods
Principles of method if other than guideline
Cyclic voltammetry. Cyclic voltammetric experiments were performed using Autolab PGSTAT 12
potentiostat, equipped with a PC for electrochemical measurement. A conventional three electrode cell
was employed throughout the experiments with: NM electrode as the working electrode (WE), Hg/HgO
as a reference (RE) and platinum electrode as the counter electrode (CE). Prior to use the Hg/HgO
reference electrode was calibrated against a saturated calomel electrode (-149 mV against a SCE). Cyclic
voltammograms were acquired after exposure of the working electrode to the test solution (100 ml) in a
glass filled cell; electrical connection to the working electrode was achieved by connecting a small
mounted crocodile clip to the silver gauze that was attached to the WE. The WE was immersed so that
approximately two thirds of the disc (and no silver) was exposed to the solution. Cyclic voltammetry (5
cycles) was undertaken at a rate of 100 mV/s, between the potentials of 0.7 V and –1.8 V.
GLP compliance
no
Test materials
Identity of test material same as for substance defined in section 1 (if not read-across)
yes
ENV/JM/MONO(2015)15/PART1
72
Test material identity
Identifier Identity
CAS number 1314-13-2
EC number 215-222-5
IUPAC name oxozinc
other: OECD sponsorship programme NM110, NM111, NM112, NM113
Test material form
nanomaterial
Details on test material
electrode made from bulk NM
Confidential details on test material
-Name of test material: Z-cote ®
Code: NM110Supplier: BASF SE
Surface coating: none
- Substance type: Inorganic
- Physical state: solid powder, nano-form
-Name of test material: Z-cote HP
Code: NM111Supplier: BASF SE
Surface coating: triethoxycaprylylsilane (2%)
- Substance type: Inorganic
- Physical state: solid powder, nano-form
-Name of test material: Nanosun
TM Code: NM112
Supplier: Micronisers
Surface coating: none
- Substance type: Inorganic
- Physical state: solid powder, nano-form
-Name of test material: Zinc Oxide
Code: NM113
Supplier: Sigma-Aldrich
Surface coating: none
- Substance type: Inorganic
- Physical state: solid powder, nano-form
Results and discussions
Any other information on results incl. tables
Figure shows a typical cyclic voltammogram (C-V) of PROSPEcT Z-COTE ZnO (BASF,) electrode in
seawater at a scan rate of 100 mV/s. Results show two redox processes that are taking place, which will
be referred to as “Redox 1” and “Redox 2”. Each redox reaction consists of two half-reactions i.e. for
oxidation and reduction reactions and these correspond to the oxidation peak and reduction peak in the C-
V plot. From these values, a mid-point potential was reported, which gave an indication of the
corresponding redox potential value; the information from the C-V plot is summarised on Table 10. It is
evident from the C-V plot that the redox potential values reported here should be treated with caution as: A) Peaks were very broad, so numbers are only approximate B) Peak-peak separation was large, indicating that the processes were not fully reversible A summary of reduction and oxidation potential and the corresponding redox potential values for Z-COTE
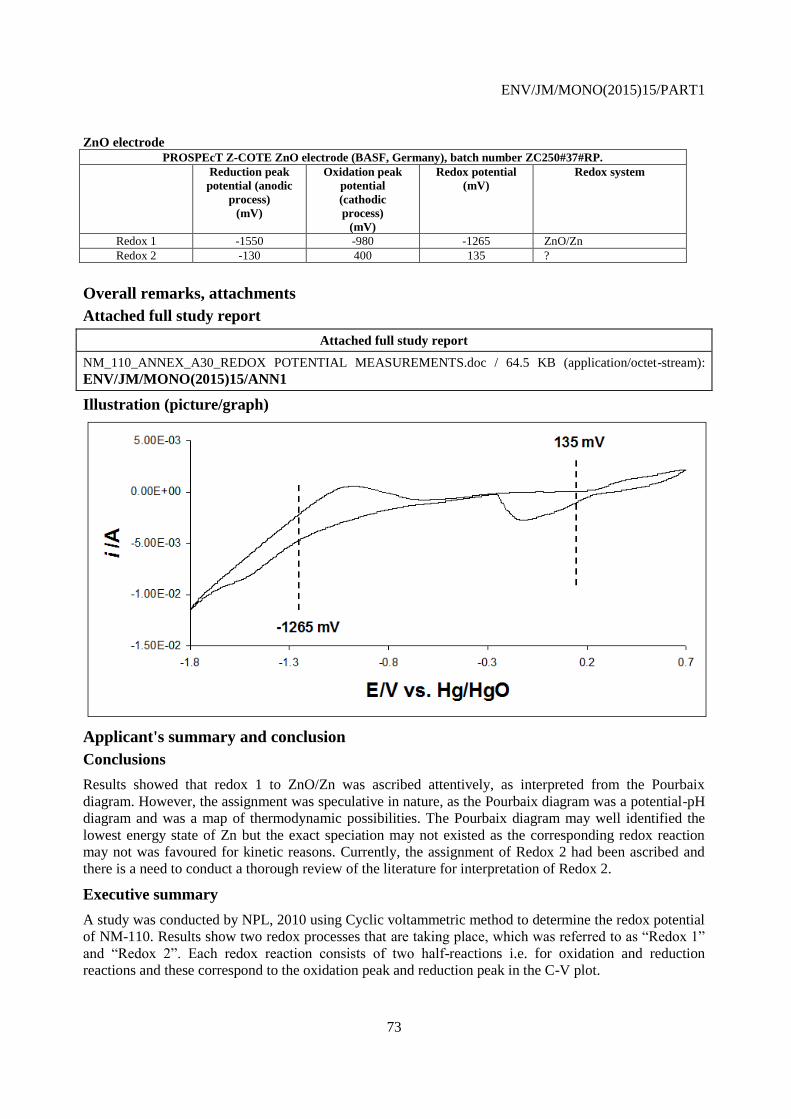
ENV/JM/MONO(2015)15/PART1
73
ZnO electrode PROSPEcT Z-COTE ZnO electrode (BASF, Germany), batch number ZC250#37#RP.
Reduction peak
potential (anodic
process)
(mV)
Oxidation peak
potential
(cathodic
process)
(mV)
Redox potential
(mV)
Redox system
Redox 1 -1550 -980 -1265 ZnO/Zn
Redox 2 -130 400 135 ?
Overall remarks, attachments
Attached full study report
Attached full study report
NM_110_ANNEX_A30_REDOX POTENTIAL MEASUREMENTS.doc / 64.5 KB (application/octet-stream):
ENV/JM/MONO(2015)15/ANN1
Illustration (picture/graph)
Applicant's summary and conclusion
Conclusions
Results showed that redox 1 to ZnO/Zn was ascribed attentively, as interpreted from the Pourbaix
diagram. However, the assignment was speculative in nature, as the Pourbaix diagram was a potential-pH
diagram and was a map of thermodynamic possibilities. The Pourbaix diagram may well identified the
lowest energy state of Zn but the exact speciation may not existed as the corresponding redox reaction
may not was favoured for kinetic reasons. Currently, the assignment of Redox 2 had been ascribed and
there is a need to conduct a thorough review of the literature for interpretation of Redox 2.
Executive summary
A study was conducted by NPL, 2010 using Cyclic voltammetric method to determine the redox potential
of NM-110. Results show two redox processes that are taking place, which was referred to as “Redox 1”
and “Redox 2”. Each redox reaction consists of two half-reactions i.e. for oxidation and reduction
reactions and these correspond to the oxidation peak and reduction peak in the C-V plot.

ENV/JM/MONO(2015)15/PART1
74
Furthermore it was indicated by the study director that the values should be treated with caution as: a) Peaks were very broad, so numbers are only approximate. b) Peak-peak separation was large, indicating that the processes were not fully reversible.
Endpoint study record: WoE_2010-12-10_NPL for
PROSPECT_Oxidationreduction potential
Administrative Data
Purpose flag weight of evidence
Study result type experimental result
Reliability 4 (not assignable)
Rationale for
reliability incl.
deficiencies
The redox potential values acquired from ORP electrode may be indicative of the redox
state of the entire system and it is difficult to quantify the reliability of such
measurements. Thus, the reliability of the study could not be assigned.
Data source
Reference
Reference
type
Author Year Title Bibliographic
source
Testing
laboratory
Report
no.
Owner
company
Company
study no.
Report
date
study
report
National
Physical
Laboratory
2010 Redox
Potential
National
Physical
Laboratory,
Teddington,
Middlesex,
United
Kingdom
2010-
12-10
Data access
data submitter is data owner
Data protection claimed
yes, but willing to share
Materials and methods
Principles of method if other than guideline
Redox potential were measured using an ORP Oakton® Waterproof ORP Testr®, purchased from Cole
Palmer UK; this in effect measures the potential difference across two electrodes i.e. a Pt electrode
against a double junction Ag/AgCl reference electrode. The electrode was used in accordance to the
manufacturer’s instructions. Prior to use the electrode was pre-condition in clean tap water for 30 minutes
before rinsing in distilled water. When making measurements, the electrode was carefully placed in a vial
containing the sample; there must be sufficient liquid sample to cover the sensing element. The electrode
was carefully stirred a little and then placed in a fixed position, slightly above the bottom of the container.
The signal output was allowed to settle for 5 minutes before a reading i.e. the “field potential” was noted.
After measurement, the electrode was cleaned with tap water and final rinse was with distilled water, after
which further measurements can be made. When not in use, the electrode was stored in a solution of
Oakton® electrode storage solution, as recommended by the manufacturer.
GLP compliance
no
ENV/JM/MONO(2015)15/PART1
75
Test materials
Test material identity
Identifier Identity
CAS number 1314-13-2
EC number 215-222-5
IUPAC name oxozinc
other: OECD sponsorship programme NM110, NM111, NM112, NM113
Test material form
nanomaterial
Details on test material
-Name of test material: Z-cote ®
Code: NM110
Supplier: BASF SE
Surface coating: none
- Substance type: Inorganic
- Physical state: solid powder, nano-form
-Name of test material: Z-cote HP
Code: NM111
Supplier: BASF SE
Surface coating: triethoxycaprylylsilane (2%)
- Substance type: Inorganic
- Physical state: solid powder, nano-form
-Name of test material: Nanosun
TM Code: NM112
Supplier: Micronisers
Surface coating: none
- Substance type: Inorganic
- Physical state: solid powder, nano-form
-Name of test material: Zinc Oxide
Code: NM113
Supplier: Sigma-Aldrich
Surface coating: none
- Substance type: Inorganic
- Physical state: solid powder, nano-form
Any other information on materials and methods incl. tables
The redox potential ORP electrode was calibrated against YSI® Zobell ORP Calibration Solution
(purchased from Cole Palmer); this reagent was made available in dry form and was reconstituted with
125 mL of DI water prior to use, after which the solution has ~ 6 months expiry date. This standard
solution was also used to verify the performance of the electrode in the beginning and end of the study.
For Ag/AgCl reference, the redox potential value for Zobell solution was 231 ±10 mV (depending on
temperature); at ~ 20 C, this value was ~ 237 mV. Redox potential was carried out on freshly dispersed
NM in various media; the media was the DI water and the three ecotox media chosen by the University of
Exeter (fish, daphnia, water flea and seawater). All field potential values recorded were subjected to an
additive correction factor of +206 mV; this was necessary so that the final value was reported as if the
reference electrode was a standard hydrogen reference electrode instead of the Ag/AgCl. Dispersion of
the individual nanomaterial in the appropriate liquid media was carried out in accordance to the protocol
ENV/JM/MONO(2015)15/PART1
76
recommended under PROSPEcT programme (as part of the OECD guidelines); currently this protocol is
accessible through the NIA website. Note: protocol associated with making pellets and measuring redox
potential via acquiring the cyclic voltamogram (initially proposed) was not used. Several issues were
raised, to include the fact that these are semiconducting based material and therefore has a high
resistance; current flow will be limited under such measurements. In addition, the pellets were not shown
to be not stable i.e. there were signs of disintegration.
Results and discussions
Any other information on results incl. tables
MEDIA BLANKS ONLY Redox potential (mV) pH
DI water 405 N/A
Daphnia 425 7.94
Fish water 418 7.34
Seawater 384 8.75 Redox potential of NM dispersion in various liquid media, the value quoted is relative to the standard
hydrogen reference electrode; values quoted in mV.
NM112 NM113 NM110
DI water 398 398 396
Fish media 424 430 427
Daphnia media 415 415 422
Seawater 380 374 379
Overall remarks, attachments
Attached full study report
Attached full study report
NM_110_ANNEX_A31_Redox Potential from NPL.rtf / 46.55 KB (application/rtf):
ENV/JM/MONO(2015)15/ANN1
NM_110_ANNEX_A02_FINALINTERIM REPORT2010corrected.pdf / 1.05 MB (application/octet-
stream): ENV/JM/MONO(2015)15/ANN6
Applicant's summary and conclusion
Conclusions
Redox potential was determined to be highest in fish water and to be lowest in seawater. The results
showed that there were no significant differences in the redox potential between the different
nanomaterials
Executive summary
NPL, 2010 investigated the redox potential measurements, using ORP probe electrode, of various ZnO
dispersions (NM-100, NM-112 and NM-113), in various liquid media. NM-111 could not be investigated
by this method as it was difficult to disperse. The redox potential ORP electrode was calibrated against
Calibration Solution. This standard solution was also used to verify the performance of the electrode in
the beginning and end of the study. Redox potential measurements were carried out on freshly dispersed
NM in various media (deionized water, fish medium, daphnia medium and seawater). Dispersion of the
individual nanomaterial in the appropriate liquid media was carried out in accordance to the protocol as
recommended under PROSPECT/OECD (as part of the OECD guidelines).Redox potential was
determined to be highest in fish water and to be lowest in seawater. The results showed that there were no
significant differences in the redox potential between the different nanomaterials.

ENV/JM/MONO(2015)15/PART1
77
4.17 Stability in organic solvents and identity of relevant degradation
products
4.18 Storage stability and reactivity towards container material
4.19 Stability: thermal, sunlight, metals
Endpoint summary: Stability: thermal, sunlight, metals
Administrative Data
Short description of key information
All weight-losses were small (less than 6%), little / no oxidation occurred up to 1100 °C. Slight
differences in the degree of weight loss were observed between different samples; NM-110 and NM-113
were both very stable and exhibited minor losses (< 0.6 wt %) while losses from NM-111 and NM-112
were much higher (4-6wt% and 1-2wt% respectively). Mass spectrometry identified CO2 and water when
both NM-111 and NM-112 were heated in air, but not when NM-110 and NM-113 were heated in air.
When heated in argon, traces of both CO2 and water were identified in all samples. The 4-6 wt% loss by
NM-111 suggests that the quantity of coating may be higher than the nominative 2 wt %.
Discussion
CSIRO, 2012 determined the thermal properties of the different nanomaterials using a Setaram Evolution
Differential Thermal Analysis / Thermogravimetric (DTA/TG) thermal analyser with a carrier gas of air
or argon, and using a heating ramp rate of 20°C/min to a maximum temperature of 1100°C. Volatile
species were simultaneously analysed by mass spectrometry; species of interest were those with atomic
mass units of 2, 12, 16, 17, 18, 28, 44, 48, and 64. All weight-losses were small (less than 6 %),
indicating that little/no oxidation occurred up to 1100 °C. Slight differences in the degree of weight loss
were observed between different samples; NM-110 and NM-113 were both very stable and exhibited
minor losses (< 0.6 wt%) while losses from NM-111 and NM-112 were much higher (4-6 wt% and 1-
2 wt% respectively). Mass spectrometry identified CO2and water when both NM-111 and NM-112 were
heated in air, but not when NM-110 and NM-113 were heated in air. When heated in argon, traces of both
CO2and water were identified in all samples. The 4-6 wt% loss by NM-111 suggests that the quantity of
coating may be higher than the nominative 2 wt %. For NM-111, the onset of coating decomposition
occurred at similar temperatures in both air (328 °C) and argon (290 °C). However, NM-111 exhibited a
much sharper and larger (5-7 times) exotherm in air compared with argon. These observations are
consistent with thermal oxidation of the coating which occurs between 350 - 420 °C. Degradation via
thermal depolymerization occurs at higher temperatures (420 - 480 °C). The respective exotherms of
311 J/g (air) and 40 J/g (argon) reflect the oxidative nature of the reaction for NM-111, and the larger
amounts of CO2 and water detected by mass spec (compared with uncoated samples NM-110, NM-112
and NM-113) confirm coating degradation. The fact that NM-112 is the only uncoated ZnO that exhibits
CO2and water release at low temperatures combined with having the highest surface area suggests that it
is more reactive in its adsorption behavior and is more likely to be less stable in the longer term than its
larger-sized counterparts.
In conclusion it was shown that the difference in thermal properties for the 4 nanomaterials is not linked
with the material form (nano or bulk) but rather with coating.

ENV/JM/MONO(2015)15/PART1
78
Endpoint study record: Key_2012-03-
05_Australia_CSIRO_Thermal_Stability_DTA/TG
Administrative Data
Purpose flag key study
Study result type experimental result
Reliability 2 (reliable with restrictions)
Rationale for
reliability incl.
deficiencies
The study was regarded as scientifically acceptable. Non-GLP study but similar to
guideline. However, only limited documentation of the full study report was available.
Thus, the study was regarded as reliable with restrictions.
Data source
Reference
Reference
type
Author Year Title Bibliographic
source
Testing
laboratory
Report
no.
Owner
company
Company
study no.
Report
date
study
report
Casey,
Yin,
McCall
2012 Summary of
physicochemical
properties of
OECD Zinc
Oxide (ZnO)
samples -
Thermal
analysis
Commonwealth
Scientific and
Industrial
Research
Organisation
2012-
03-05
Data access
data submitter is data owner
Data protection claimed
yes, but willing to share
Materials and methods
Test guideline
Qualifier Guideline Deviations
equivalent or similar
to
OECD Guideline 113 (Screening Test for Thermal Stability and Stability in
Air)
no
Principles of method if other than guideline
Thermal properties of the ZnO samples were analysed using a Setaram Evolution Differential Thermal
Analysis /Thermogravimetric (DTA/TG) thermal analyser with a carrier gas of air or argon, and using a
heating ramp rate of 20°C/min to a maximum temperature of 1100°C. Volatile species were
simultaneously analysed by mass spectrometry; species of interest were those with atomic mass units of
2, 12, 16, 17, 18, 28, 44, 48, and 64.
GLP compliance
no
Test materials
Identity of test material same as for substance defined in section 1 (if not read-across)
yes
ENV/JM/MONO(2015)15/PART1
79
Test material identity
Identifier Identity
CAS number 1314-13-2
EC number 215-222-5
IUPAC name oxozinc
other: OECD Sponsorship Programme NM110, NM111, NM112, NM113
Test material form
nanomaterial
Confidential details on test material
-Name of test material: Z-cote ®
Code: NM110Supplier: BASF SE
Surface coating: none
- Substance type: Inorganic
- Physical state: solid powder, nano-form
-Name of test material: Z-cote HP
Code: NM111
Supplier: BASF SE
Surface coating: triethoxycaprylylsilane (2%)
- Substance type: Inorganic
- Physical state: solid powder, nano-form
-Name of test material: Nanosun
TM Code: NM112
Supplier: Micronisers
Surface coating: none
- Substance type: Inorganic
- Physical state: solid powder, nano-form
-Name of test material: Zinc Oxide
Code: NM113
Supplier: Sigma-Aldrich
Surface coating: none
- Substance type: Inorganic
- Physical state: solid powder, nano-form
Details on methods
Thermal properties of the ZnO samples were analysed using a Setaram Evolution Differential Thermal
Analysis /Thermogravimetric (DTA/TG) thermal analyser with a carrier gas of air or argon, and using a
heating ramp rate of 20°C/min to a maximum temperature of 1100°C. Volatile species were
simultaneously analysed by mass spectrometry; species of interest were those with atomic mass units of
2, 12, 16, 17, 18, 28, 44, 48, and 64.
Results and discussions
For study on stability to metals
Any other information on results incl. tables
Figure 1 and 2 present the DTA/TGresults of ZnO samples heated to 1100 °C under air or argon, and
Table 2 lists the losses in weight for these samples. All weight-losses were small (less than 6%),
indicating that little/no oxidation occurred up to 1100 °C. Slight differences in the degree of weight loss
were observed between different samples; NM-110 and NM-113 were both very stable and exhibited
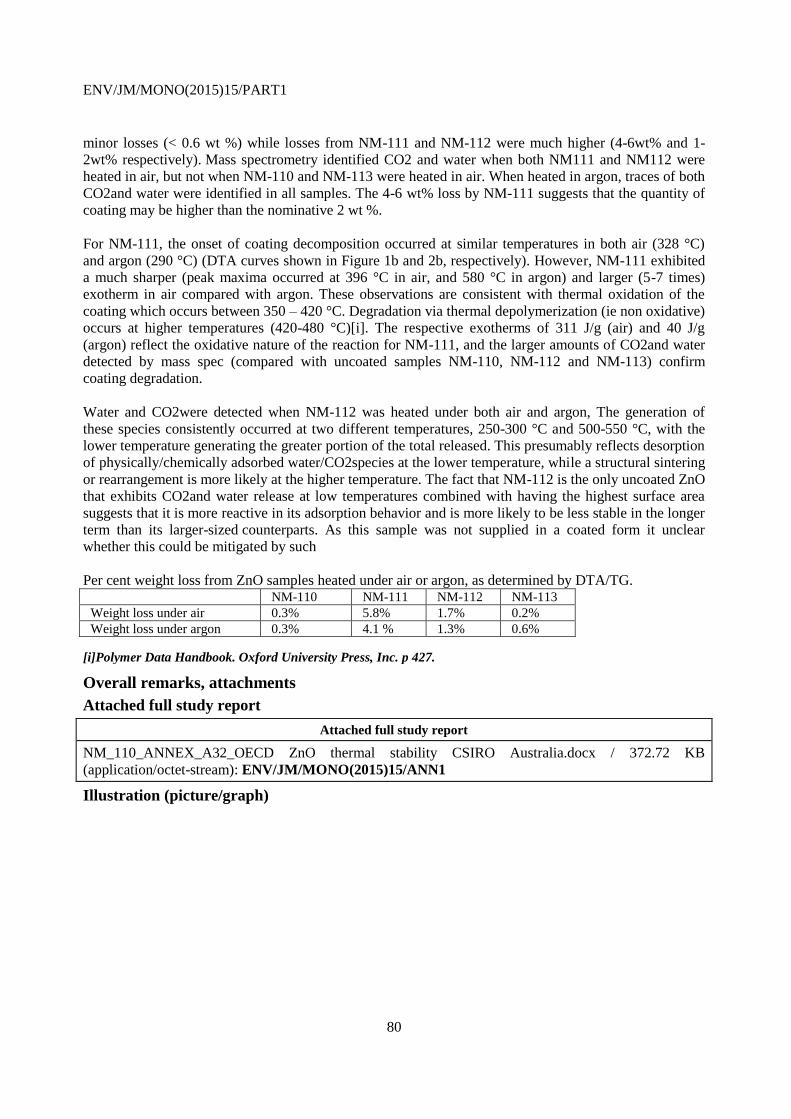
ENV/JM/MONO(2015)15/PART1
80
minor losses (< 0.6 wt %) while losses from NM-111 and NM-112 were much higher (4-6wt% and 1-
2wt% respectively). Mass spectrometry identified CO2 and water when both NM111 and NM112 were
heated in air, but not when NM-110 and NM-113 were heated in air. When heated in argon, traces of both
CO2and water were identified in all samples. The 4-6 wt% loss by NM-111 suggests that the quantity of
coating may be higher than the nominative 2 wt %.
For NM-111, the onset of coating decomposition occurred at similar temperatures in both air (328 °C)
and argon (290 °C) (DTA curves shown in Figure 1b and 2b, respectively). However, NM-111 exhibited
a much sharper (peak maxima occurred at 396 °C in air, and 580 °C in argon) and larger (5-7 times)
exotherm in air compared with argon. These observations are consistent with thermal oxidation of the
coating which occurs between 350 – 420 °C. Degradation via thermal depolymerization (ie non oxidative)
occurs at higher temperatures (420-480 °C)[i]. The respective exotherms of 311 J/g (air) and 40 J/g
(argon) reflect the oxidative nature of the reaction for NM-111, and the larger amounts of CO2and water
detected by mass spec (compared with uncoated samples NM-110, NM-112 and NM-113) confirm
coating degradation.
Water and CO2were detected when NM-112 was heated under both air and argon, The generation of
these species consistently occurred at two different temperatures, 250-300 °C and 500-550 °C, with the
lower temperature generating the greater portion of the total released. This presumably reflects desorption
of physically/chemically adsorbed water/CO2species at the lower temperature, while a structural sintering
or rearrangement is more likely at the higher temperature. The fact that NM-112 is the only uncoated ZnO
that exhibits CO2and water release at low temperatures combined with having the highest surface area
suggests that it is more reactive in its adsorption behavior and is more likely to be less stable in the longer
term than its larger-sized counterparts. As this sample was not supplied in a coated form it unclear
whether this could be mitigated by such
Per cent weight loss from ZnO samples heated under air or argon, as determined by DTA/TG. NM-110 NM-111 NM-112 NM-113
Weight loss under air 0.3% 5.8% 1.7% 0.2%
Weight loss under argon 0.3% 4.1 % 1.3% 0.6%
[i]Polymer Data Handbook. Oxford University Press, Inc. p 427.
Overall remarks, attachments
Attached full study report
Attached full study report
NM_110_ANNEX_A32_OECD ZnO thermal stability CSIRO Australia.docx / 372.72 KB
(application/octet-stream): ENV/JM/MONO(2015)15/ANN1
Illustration (picture/graph)
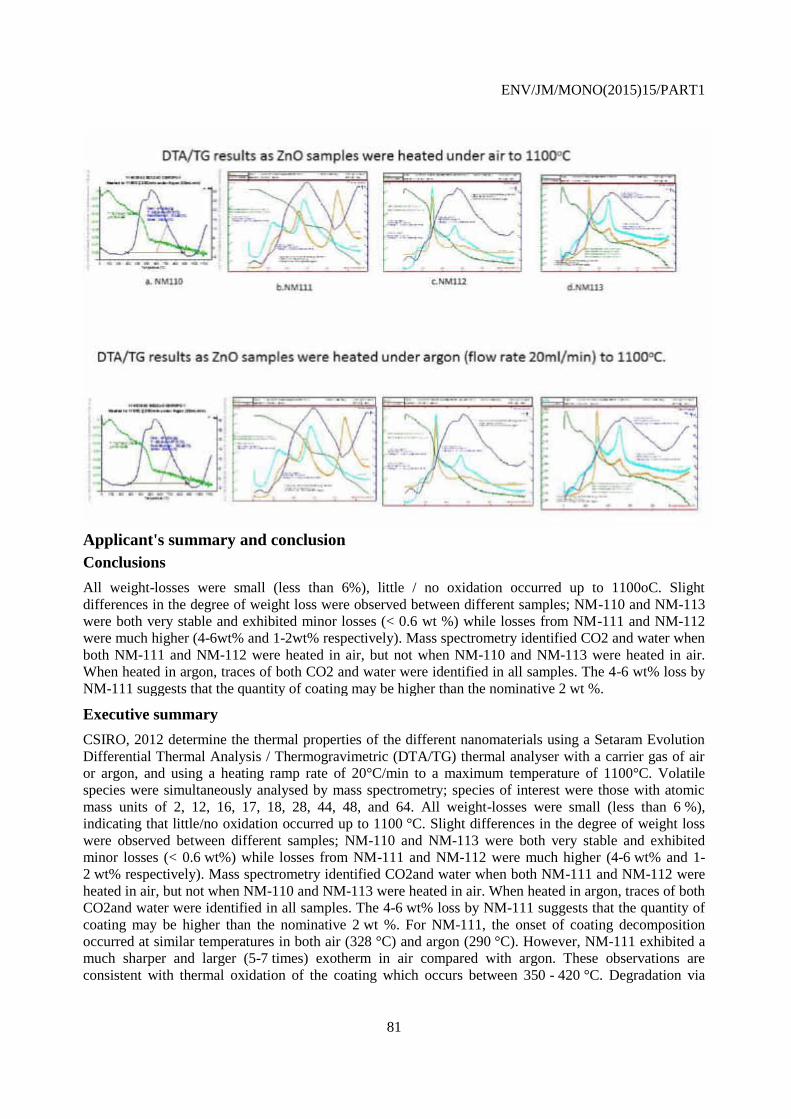
ENV/JM/MONO(2015)15/PART1
81
Applicant's summary and conclusion
Conclusions
All weight-losses were small (less than 6%), little / no oxidation occurred up to 1100oC. Slight
differences in the degree of weight loss were observed between different samples; NM-110 and NM-113
were both very stable and exhibited minor losses (< 0.6 wt %) while losses from NM-111 and NM-112
were much higher (4-6wt% and 1-2wt% respectively). Mass spectrometry identified CO2 and water when
both NM-111 and NM-112 were heated in air, but not when NM-110 and NM-113 were heated in air.
When heated in argon, traces of both CO2 and water were identified in all samples. The 4-6 wt% loss by
NM-111 suggests that the quantity of coating may be higher than the nominative 2 wt %.
Executive summary
CSIRO, 2012 determine the thermal properties of the different nanomaterials using a Setaram Evolution
Differential Thermal Analysis / Thermogravimetric (DTA/TG) thermal analyser with a carrier gas of air
or argon, and using a heating ramp rate of 20°C/min to a maximum temperature of 1100°C. Volatile
species were simultaneously analysed by mass spectrometry; species of interest were those with atomic
mass units of 2, 12, 16, 17, 18, 28, 44, 48, and 64. All weight-losses were small (less than 6 %),
indicating that little/no oxidation occurred up to 1100 °C. Slight differences in the degree of weight loss
were observed between different samples; NM-110 and NM-113 were both very stable and exhibited
minor losses (< 0.6 wt%) while losses from NM-111 and NM-112 were much higher (4-6 wt% and 1-
2 wt% respectively). Mass spectrometry identified CO2and water when both NM-111 and NM-112 were
heated in air, but not when NM-110 and NM-113 were heated in air. When heated in argon, traces of both
CO2and water were identified in all samples. The 4-6 wt% loss by NM-111 suggests that the quantity of
coating may be higher than the nominative 2 wt %. For NM-111, the onset of coating decomposition
occurred at similar temperatures in both air (328 °C) and argon (290 °C). However, NM-111 exhibited a
much sharper and larger (5-7 times) exotherm in air compared with argon. These observations are
consistent with thermal oxidation of the coating which occurs between 350 - 420 °C. Degradation via
ENV/JM/MONO(2015)15/PART1
82
thermal depolymerization occurs at higher temperatures (420 - 480 °C). The respective exotherms of
311 J/g (air) and 40 J/g (argon) reflect the oxidative nature of the reaction for NM-111, and the larger
amounts of CO2 and water detected by mass spec (compared with uncoated samples NM-110, NM-112
and NM-113) confirm coating degradation. The fact that NM-112 is the only uncoated ZnO that exhibits
CO2and water release at low temperatures combined with having the highest surface area suggests that it
is more reactive in its adsorption behavior and is more likely to be less stable in the longer term than its
larger-sized counterparts.
In conclusion it was shown that the difference in thermal properties for the 4 nanomaterials is not linked
with the material form (nano or bulk) but rather with coating.
4.20 pH
4.21 Dissociation constant
4.22 Viscosity
4.23 Additional physico-chemical information
Endpoint study record: supporting_2010-12-03 NPL for PROSPECT Stability
monitoring_Turbidity
Administrative Data
Purpose flag supporting study
Study result type experimental result
Reliability 4 (not assignable)
Rationale for reliability
incl. deficiencies
Limited documentation of the data evaluation was provided in the full study
reports. Thus, the reliability could not be assigned.
Data source
Reference
Reference
type
Author Year Title Bibliographic
source
Testing
laboratory
Report
no.
Owner
company
Company
study no.
Report
date
study
report
National
Physical
Laboratory
2010 Dispersion
stability as
determined by
turbidity
measurements
National
Physical
Laboratory,
Teddington,
Middlesex,
United
Kingdom
2010-
12-03
Data access
data submitter is data owner
Data protection claimed
yes, but willing to share
Materials and methods
Endpoint investigated
other: Turbidity
ENV/JM/MONO(2015)15/PART1
83
Test guideline
Qualifier Guideline Deviations
no guideline followed
Principles of method if other than guideline
Turbidity was measured using HF Scientific – Micro100 RI turbidity meter (Cole-Palmer, UK); this
meter has an infrared light source that meets the international standard ISO 7027 for turbidity
measurements. The meter was calibrated on standards, which are based on AMCO-AEPA-1
microspheres; these standards are traceable to standard formazin suspension. Standard values of 1000, 10
and 0.02 NTU were used to calibrate the meter. Prior to use, the meter was allowed to warm up for 30
minutes. Sample cuvettes (HF Scientific (USA)) were used to hold the sample. Note that glass thickness
may vary from cuvette to cuvette and within the same cuvette. Hence, individual vials were indexed;
indexing of the cuvette entails finding the point of the cuvette that light passes through that gives the
lowest reading; once indexed the holder can be marked accordingly. Prior to their use, cuvettes were
cleaned, in accordance to manufacturer’s instructions. This involved washing the interior and exterior of
the cuvette with a detergent (2% Hellmanex in DI water); it was then rinsed several times in distilled
water before finally rinsing in DI water. The cuvette was further rinsed with the sample two times before
filling (30ml) and analysed. The cuvette was placed into the meter and signal allowed to settle before
taking readings.
GLP compliance
no
Test materials
Identity of test material same as for substance defined in section 1 (if not read-across)
yes
Test material identity
Identifier Identity
CAS number 1314-13-2
EC number 215-222-5
IUPAC name oxozinc
other: OECD Sponsorship Programme NM110, NM111, NM112, NM113
Test material form
nanomaterial
Details on test material
-Name of test material: Z-cote ®
Code: NM110
Supplier: BASF SE
Surface coating: none
- Substance type: Inorganic
- Physical state: solid powder, nano-form
-Name of test material: Z-cote HP
Code: NM111
Supplier: BASF SE
Surface coating: triethoxycaprylylsilane (2%)
- Substance type: Inorganic
- Physical state: solid powder, nano-form
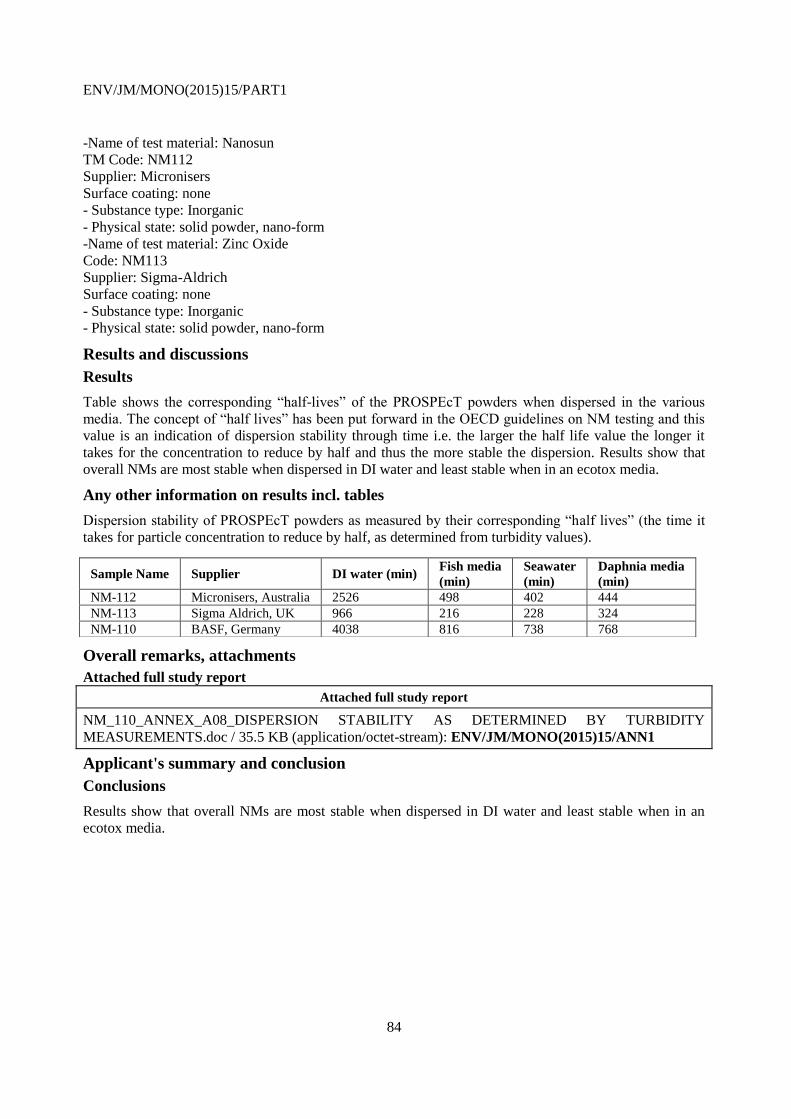
ENV/JM/MONO(2015)15/PART1
84
-Name of test material: Nanosun
TM Code: NM112
Supplier: Micronisers
Surface coating: none
- Substance type: Inorganic
- Physical state: solid powder, nano-form
-Name of test material: Zinc Oxide
Code: NM113
Supplier: Sigma-Aldrich
Surface coating: none
- Substance type: Inorganic
- Physical state: solid powder, nano-form
Results and discussions
Results
Table shows the corresponding “half-lives” of the PROSPEcT powders when dispersed in the various
media. The concept of “half lives” has been put forward in the OECD guidelines on NM testing and this
value is an indication of dispersion stability through time i.e. the larger the half life value the longer it
takes for the concentration to reduce by half and thus the more stable the dispersion. Results show that
overall NMs are most stable when dispersed in DI water and least stable when in an ecotox media.
Any other information on results incl. tables
Dispersion stability of PROSPEcT powders as measured by their corresponding “half lives” (the time it
takes for particle concentration to reduce by half, as determined from turbidity values).
Sample Name Supplier DI water (min) Fish media
(min)
Seawater
(min)
Daphnia media
(min)
NM-112 Micronisers, Australia 2526 498 402 444
NM-113 Sigma Aldrich, UK 966 216 228 324
NM-110 BASF, Germany 4038 816 738 768
Overall remarks, attachments
Attached full study report
Attached full study report
NM_110_ANNEX_A08_DISPERSION STABILITY AS DETERMINED BY TURBIDITY
MEASUREMENTS.doc / 35.5 KB (application/octet-stream): ENV/JM/MONO(2015)15/ANN1
Applicant's summary and conclusion
Conclusions
Results show that overall NMs are most stable when dispersed in DI water and least stable when in an
ecotox media.
ENV/JM/MONO(2015)15/PART1
85
Endpoint study record: supporting_2012-03-
05_Australia_CSIRO_Chemical_Analysis_ICP-AES
Administrative Data
Purpose flag supporting study
Study result type experimental result
Reliability 1 (reliable without restriction)
Rationale for reliability incl.
deficiencies
The study was conducted in accordance with ISO-standardized
method.
Data source
Reference
Reference
type
Author Year Title Bibliographic
source
Testing
laboratory
Report
no.
Owner
company
Company
study no.
Report
date
study
report
Casey,
Yin,
McCall
2012 Summary of
physicochemical
properties of
OECD Zinc
Oxide (ZnO)
samples -
Chemical
Analysis
Commonwealth
Scientific and
Industrial
Research
Organisation
2012-
03-05
Data access
data submitter is data owner
Data protection claimed
yes, but willing to share
Materials and methods
Endpoint investigated
other: elemental analysis
Principles of method if other than guideline
Experiments to determine the elemental composition of the ZnO samples were performed in duplicate.
Approximately 0.15g of ZnO sample was dissolved in a 1:1 HNO3: H2O2 mixture with heating for 30
minutes. The solution was diluted to 100 mL, internal standard Sc was added, and the resultant solution
was analysed by Inductively Coupled Plasma-Atomic Emission Spectroscopy (Varian 730 Axial ICP-
AES). Certified multi-element solutions were also used to check the accuracy.
GLP compliance
no
Test materials
Identity of test material same as for substance defined in section 1 (if not read-across)
yes
ENV/JM/MONO(2015)15/PART1
86
Test material identity
Identifier Identity
CAS number 1314-13-2
EC number 215-222-5
IUPAC name oxozinc
other: OECD sponsorship programme NM110, NM111, NM112, NM113
Test material form
nanomaterial
Details on test material
-Name of test material: Z-cote ®
Code: NM110
Supplier: BASF SE
Surface coating: none
- Substance type: Inorganic
- Physical state: solid powder, nano-form
-Name of test material: Z-cote HP
Code: NM111
Supplier: BASF SE
Surface coating: triethoxycaprylylsilane (2%)
- Substance type: Inorganic
- Physical state: solid powder, nano-form
-Name of test material: Nanosun
TM Code: NM112
Supplier: Micronisers
Surface coating: none
- Substance type: Inorganic
- Physical state: solid powder, nano-form
-Name of test material: Zinc Oxide
Code: NM113
Supplier: Sigma-Aldrich
Surface coating: none
- Substance type: Inorganic
- Physical state: solid powder, nano-form
Results and discussions
Any other information on results incl. tables
The table presents the elemental analysis of the four ZnO samples. In general, Zn was the main element
detected with few secondary elements present, but there were noticeable differences between samples in
the quantities of trace elements detected. For example, NM-112 had substantially higher levels (5-60
times) of alkali metals (Ca, Na) and Al compared with all other samples. NM-113 appeared to have a
significantly higher level of Cu (8-45 times other samples). The amount of Si appeared to be relatively
constant across samples but was statistically higher in NM-111 probably due to the silicon-containing
dimethicone coating. The elevated alkali metal levels present in NM-112 were confirmed by the supplier
as a consistent analysis of their product, while the elevated amount of Cu in NM-113 was inconsistent
with (i.e. higher than) nominative published product data.
Table 2. Elemental analyses of four ZnO samples, NM110, NM111, NM112 and NM113. The data are
expressed in units of weight% and ppm.
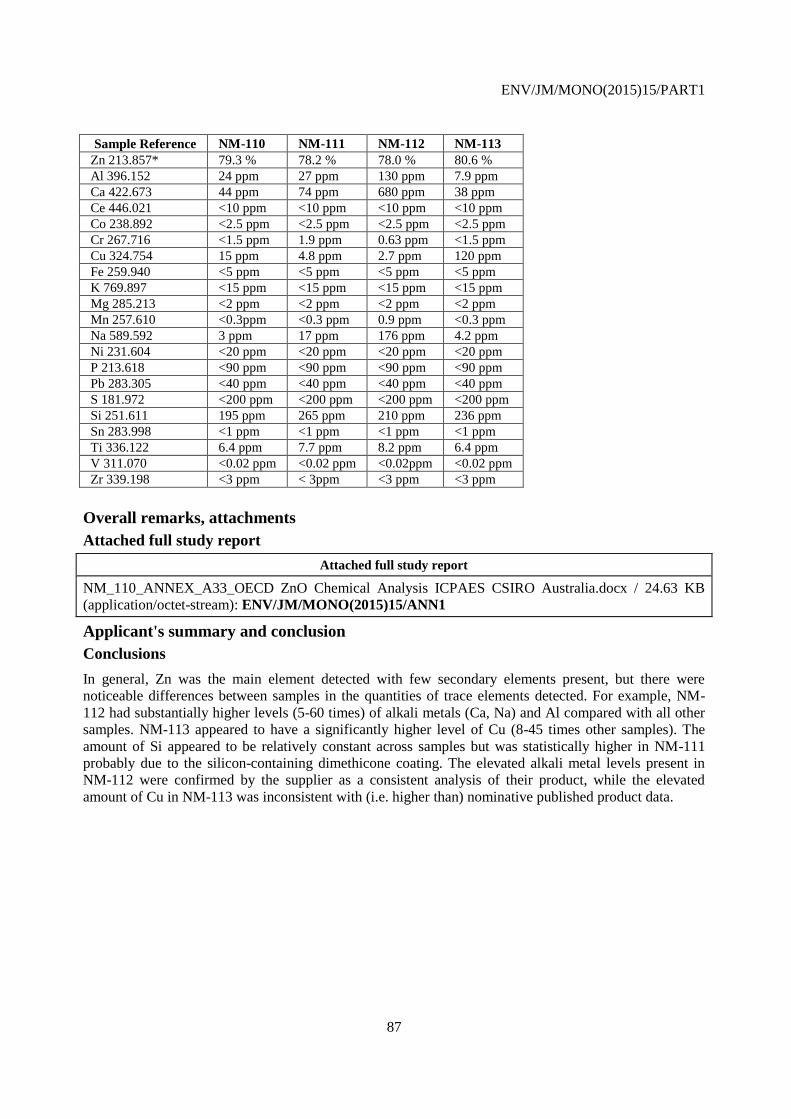
ENV/JM/MONO(2015)15/PART1
87
Sample Reference NM-110 NM-111 NM-112 NM-113
Zn 213.857* 79.3 % 78.2 % 78.0 % 80.6 %
Al 396.152 24 ppm 27 ppm 130 ppm 7.9 ppm
Ca 422.673 44 ppm 74 ppm 680 ppm 38 ppm
Ce 446.021 <10 ppm <10 ppm <10 ppm <10 ppm
Co 238.892 <2.5 ppm <2.5 ppm <2.5 ppm <2.5 ppm
Cr 267.716 <1.5 ppm 1.9 ppm 0.63 ppm <1.5 ppm
Cu 324.754 15 ppm 4.8 ppm 2.7 ppm 120 ppm
Fe 259.940 <5 ppm <5 ppm <5 ppm <5 ppm
K 769.897 <15 ppm <15 ppm <15 ppm <15 ppm
Mg 285.213 <2 ppm <2 ppm <2 ppm <2 ppm
Mn 257.610 <0.3ppm <0.3 ppm 0.9 ppm <0.3 ppm
Na 589.592 3 ppm 17 ppm 176 ppm 4.2 ppm
Ni 231.604 <20 ppm <20 ppm <20 ppm <20 ppm
P 213.618 <90 ppm <90 ppm <90 ppm <90 ppm
Pb 283.305 <40 ppm <40 ppm <40 ppm <40 ppm
S 181.972 <200 ppm <200 ppm <200 ppm <200 ppm
Si 251.611 195 ppm 265 ppm 210 ppm 236 ppm
Sn 283.998 <1 ppm <1 ppm <1 ppm <1 ppm
Ti 336.122 6.4 ppm 7.7 ppm 8.2 ppm 6.4 ppm
V 311.070 <0.02 ppm <0.02 ppm <0.02ppm <0.02 ppm
Zr 339.198 <3 ppm < 3ppm <3 ppm <3 ppm
Overall remarks, attachments
Attached full study report
Attached full study report
NM_110_ANNEX_A33_OECD ZnO Chemical Analysis ICPAES CSIRO Australia.docx / 24.63 KB
(application/octet-stream): ENV/JM/MONO(2015)15/ANN1
Applicant's summary and conclusion
Conclusions
In general, Zn was the main element detected with few secondary elements present, but there were
noticeable differences between samples in the quantities of trace elements detected. For example, NM-
112 had substantially higher levels (5-60 times) of alkali metals (Ca, Na) and Al compared with all other
samples. NM-113 appeared to have a significantly higher level of Cu (8-45 times other samples). The
amount of Si appeared to be relatively constant across samples but was statistically higher in NM-111
probably due to the silicon-containing dimethicone coating. The elevated alkali metal levels present in
NM-112 were confirmed by the supplier as a consistent analysis of their product, while the elevated
amount of Cu in NM-113 was inconsistent with (i.e. higher than) nominative published product data.
ENV/JM/MONO(2015)15/PART1
88
4.24 Agglomeration/aggregation
Endpoint study record: WoE_2012-03-
05_Australia_CSIRO_Agglomeration/Aggregation_SEM
Administrative Data
Purpose flag weight of evidence
Study result type experimental result
Reliability 2 (reliable with restrictions)
Rationale for
reliability incl.
deficiencies
The documentation provided in the full study report was sufficient for the data evaluation. Subjective
assessment of sample agglomeration/aggregation based on viewing SEM images. Thus, the study was
regarded as reliable with restrictions.
Data source
Reference
Reference
type
Author Year Title Bibliographic
source
Testing
laboratory
Report
no.
Owner
company
Company
study no.
Report
date
study
report
Casey,
Yin,
McCall
2012 Summary of
physicochemical
properties of
OECD Zinc
Oxide (ZnO)
samples - Dry
state-
representative
SEM pictures
Commonwealth
Scientific and
Industrial
Research
Organisation
2012-
03-05
Data access
data submitter is data owner
Data protection claimed
yes, but willing to share
Materials and methods
Test guideline
Qualifier Guideline Deviations
no guideline followed
Method
SEM
Details on methods and data evaluation
A Philips XL30 field emission Scanning Electron Microscope (SEM) was used for this study. The
optimal spatial resolution of the microscope was from 2-5 nm with varying accelerating voltage from 30
KV to 1 kV. Images of ZnO particles were acquired at an accelerating voltage of 5 kV, a working
distance of ≈ 10 mm, and a tilt angle 0°. An SEM metal stub was covered with adhesive conducting tape
and a small amount of “as received” ZnO powder(around 5 mg) was sprinkled over the tape. The surface
of the powder sample was flattened with a spatula. Excess powder was removed by gently tapping the
stub on its side until a light coating of powder on the surface became apparent. The nanoparticles were
thinly sputtered with iridium using a Polaron SC570 sputter coater. Sputtering was conducted under
vacuum while passing gas was argon. The coating deposition time was 20 seconds at a plate current of
50mA, giving a coating thickness of approximately 1 nm.

ENV/JM/MONO(2015)15/PART1
89
Data gathering
Instruments
Philips XL30 field emission Scanning Electron Microscope (SEM)
GLP compliance
no
Test materials
Identity of test material same as for substance defined in section 1 (if not read-across)
yes
Test material Identity
Identifier Identity
CAS number 1314-13-2
EC number 215-222-5
IUPAC name oxozinc
other: OECD Sponsorship programme NM110, NM111, NM112, NM113
Test material form
nanomaterial - aerosol
Confidential details on test material
-Name of test material: Z-cote ®
Code: NM110
Supplier: BASF SE
Surface coating: none
- Substance type: Inorganic
- Physical state: solid powder, nano-form
-Name of test material: Z-cote HP
Code: NM111Supplier: BASF SE
Surface coating: triethoxycaprylylsilane (2%)
- Substance type: Inorganic
- Physical state: solid powder, nano-form
-Name of test material: Nanosun
TM Code: NM112
Supplier: Micronisers
Surface coating: none
- Substance type: Inorganic
- Physical state: solid powder, nano-form
-Name of test material: Zinc Oxide
Code: NM113
Supplier: Sigma-Aldrich
Surface coating: none
- Substance type: Inorganic
- Physical state: solid powder, nano-form
Overall remarks, attachments
Attached full study report
Attached full
study report
NM_110_ANNEX_A34_OECD ZnO Agglommeration Aggregation SEM CSIRO
Australia.docx / 313 KB (application/octet-stream):
ENV/JM/MONO(2015)15/ANN1

ENV/JM/MONO(2015)15/PART1
90
Illustration (picture/graph)
Applicant's summary and conclusion
Conclusions
SEM images reveal that ZnO particles as powder without media were agglomerated. The particle size was
smallest for sample NM 112 and largest for NM 113, consistent with analyses of TEM images (please
refer to IUCLID section 4.1).
Executive summary
CSIRO, 2012 investigated the agglomeration/aggregation of the nanomaterials. Therefore a Philips XL30
field emission SEM was used for this study. The optimal spatial resolution of the microscope was from 2-
5 nm with varying accelerating voltage from 30 kV to 1 kV. Images of ZnO particles were acquired at an
accelerating voltage of 5 kV, a working distance of ≈ 10 mm, and a tilt angle 0°. An SEM metal stub was
covered with adhesive conducting tape and a small amount of “as received” ZnO powder (around 5 mg)
was sprinkled over the tape. The surface of the powder sample was flattened with spatula. Excess powder
was removed by gently tapping the stub on its side until a light coating of powder on the surface became
apparent. The nanoparticles were thinly sputtered with iridium using a Polaron SC570 sputter coater.
Sputtering was conducted under vacuum while passing gas was argon. The coating deposition time was
20 seconds at a plate current of 50 mA, giving a coating thickness of approximately 1 nm. SEM images
reveal that ZnO particles as powder without media were agglomerated. The particle size was smallest for
sample NM-112 and largest for NM-113, consistent with analyses of TEM images (please refer to
IUCLID section 4.1).
ENV/JM/MONO(2015)15/PART1
91
Endpoint study record: WoE_2012-03-
05_Australia_CSIRO_Agglomeration/Aggregation_DLS
Administrative Data
Purpose flag weight of evidence
Study result type experimental result
Reliability 2 (reliable with restrictions)
Rationale for
reliability incl.
deficiencies
The study was regarded as scientifically acceptable. DLS is mainly suitable for assessing
dispersed samples containing particles/agglomerates with narrow size distributions. Thus,
the study was regarded as reliable with restrictions.
Data source
Reference
Reference
type
Author Year Title Bibliographic
source
Testing
laboratory
Report
no.
Owner
company
Company
study no.
Report
date
study
report
Casey,
Yin,
McCall
2012 Summary of
physicochemical
properties of
OECD Zinc
Oxide (ZnO)
samples - Wet
state-Dynamic
Light Scattering
(DLS)
Commonwealth
Scientific and
Industrial
Research
Organisation
2012-
03-05
Data access
data submitter is data owner
Data protection claimed
yes, but willing to share
Materials and methods
Method
DLS
Details on methods and data evaluation
Measurements of hydrodynamic size were obtained using a Brookhaven particle size analyzer 90Plus
equipped with a 657 nm laser. Reference standards (Duke polystyrene latex, with a nominal size of 100
nm, and NIST RM8013 Au nanoparticles with a nominal size of 60 nm) were used to assess the
performance of the instrument. 10 mg as received ZnO particles were added to a measuring cuvette
containing 3 ml of deionised water. The cuvette was placed in an ultrasonic bath, ultrasonicated for 10
seconds and then shaken to ensure the particles were well dispersed before starting the dynamic light
scattering measurements. Each size distribution curve and correlation function curve that was generated
was based on 10 measurements. Experiments for each sample were performed in triplicate. The
temperature was maintained at 25oC. The cuvette was thoroughly washed with deionised water after each
experiment.
Data gathering
Instruments
Brookhaven particle size analyzer 90Plus equipped with a 657 nm laser
Calibration
ENV/JM/MONO(2015)15/PART1
92
Reference standards (Duke polystyrene latex, with a nominal size of 100 nm, and NIST RM8013 Au
nanoparticleswith a nominal size of 60 nm) were used to assess the performance of the instrument. The
measured hyrdrodyamic diameter for Duke polystyrene latex was 98 nm, and for NIST RM8013 Au
nanoparticles was 61 nm.
Test materials
Identity of test material same as for substance defined in section 1 (if not read-across)
yes
Reference material/nanomaterial and Sample identification number
Identifier Identity
reference material/nanomaterial Duke polystyrene latex, nominal size 100 nm
reference material/nanomaterial NIST RM8013 Au nanoparticles, nominal size 60 nm
Test material Identity
Identifier Identity
other: OECD Sponsorship programme NM110, NM111, NM112, NM113
Test material form
nanomaterial - dispersion
Overall remarks, attachments
Remarks on results incl. tables and figures
Size distribution curves and correlation function curves for NM110, NM112 and NM113 are given in the
attached study report. DLS data were not obtained for sample NM111, as its surface coating makes it
hydrophobic and the sample could not be dispersed readily in water.
Attached full study report
Attached full
study report
NM_110_ANNEX_A35_OECD ZnO Agglomeration Aggregation DLS CSIRO Australia.docx /
223.43 KB (application/octet-stream): ENV/JM/MONO(2015)15/ANN1
Applicant's summary and conclusion
Conclusions
The mean hydrodynamic sizes for NM 110, NM 112 and NM 113 were determined to be 338 nm, 444 nm
and 466 nm respectively. These hydrodynamic diameters appeared to be independent of the primary
particle sizes, suggesting that particles from the ZnO samples were aggregated /agglomerated when
dispersed in deionized water.
Executive summary
CSIRO, 2012 determined the hydrodynamic size of the test items using Dynamic Light Scattering (DLS).
DLS data were not obtained for sample NM-111, as its surface coating made it hydrophobic and the
sample could not be dispersed readily in water. Measurements of hydrodynamic size were obtained using
a Brookhaven particle size analyser 90Plus equipped with a 657 nm laser. Reference standards (Duke
polystyrene latex, with a nominal size of 100 nm, and NIST RM8013 Au nanoparticles with a nominal
size of 60 nm) were used to assess the performance of the instrument. 10 mg as received ZnO particles
were added to a measuring cuvette containing 3 mL of deionised water. The cuvette was placed in an
ultrasonic bath, ultrasonicated for 10 seconds and then shaken to ensure the particles were well dispersed
before starting the dynamic light scattering measurements. Each size distribution curve and correlation
function curve that was generated was based on 10 measurements. Experiments for each sample were
performed in triplicate. The temperature was maintained at 25 °C. The cuvette was thoroughly washed
with deionised water after each experiment. The measured hydrodynamic diameter for Duke polystyrene
ENV/JM/MONO(2015)15/PART1
93
latex was 98 nm, and for NIST RM8013 Au nanoparticles was 61 nm. The mean hydrodynamic sizes for
NM-110, NM-112 and NM-113 were determined to be 338 nm, 444 nm and 466 nm respectively. These
hydrodynamic diameters appeared to be independent of the primary particle sizes, suggesting that
particles from the ZnO samples were aggregated /agglomerated when dispersed in deionized water.
4.25 Crystalline phase
Endpoint study record: WoE_2012-03-
05_Australia_CSIRO_Crystalline_Phase_XRD
Administrative Data
Purpose flag weight of evidence
Study result type experimental result
Reliability 1 (reliable without restriction)
Rationale for
reliability incl.
deficiencies
The study was regarded as reliable without restrictions. XRD is fully ISO
standardized and all procedures and techniques were regarded to be compliant.
Data source
Reference
Reference
type
Author Year Title Bibliographic
source
Testing
laboratory
Report
no.
Owner
company
Company
study no.
Report
date
study
report
Casey,
Yin,
McCall
2012 Summary of
physicochemical
properties of
OECD Zinc
Oxide (ZnO)
samples -
Crystalline
phase
Commonwealth
Scientific and
Industrial
Research
Organisation
2012-
03-05
Data access
data submitter is data owner
Data protection claimed
yes, but willing to share
Materials and methods
Test guideline
Qualifier Guideline Deviations
no guideline followed
Method
x-ray diffraction (XRD)
Details on methods and data evaluation
A suitable amount of particles (~0.5g) was packed in a plastic sample holder and a glass slide used to
flatten the surface. The crystallite phase was determined using a Bruker ASX-D8 X-Ray Diffractometer
(XRD) using Cu K(alpha) radiation. The operation current and voltage was 40mA and 40kV respectively.
The scan ranged from 5o to 85o with a step size of 0.02o and a scan speed of 0.40 second/step. The

ENV/JM/MONO(2015)15/PART1
94
aperture slit size directing the x-ray source was 0.2mm.
Data gathering
Instruments
Bruker ASX-D8 X-Ray Diffractometer (XRD) using Cu K(alpha) radiation
GLP compliance
no
Test materials
Identity of test material same as for substance defined in section 1 (if not read-across)
yes
Test material identity
Identifier Identity
CAS number 1314-13-2
EC number 215-222-5
IUPAC name oxozinc
other: OECD sponsorship programme NM110, NM111, NM112, NM113
Test material form
nanomaterial - powder
Confidential details on test material
-Name of test material: Z-cote ®
Code: NM110
Supplier: BASF SE
Surface coating: none
- Substance type: Inorganic
- Physical state: solid powder, nano-form
-Name of test material: Z-cote HP
Code: NM111
Supplier: BASF SE
Surface coating: triethoxycaprylylsilane (2%)
- Substance type: Inorganic
- Physical state: solid powder, nano-form
-Name of test material: Nanosun
TM Code: NM112
Supplier: Micronisers
Surface coating: none
- Substance type: Inorganic
- Physical state: solid powder, nano-form
-Name of test material: Zinc Oxide
Code: NM113
Supplier: Sigma-Aldrich
Surface coating: none
- Substance type: Inorganic
- Physical state: solid powder, nano-form
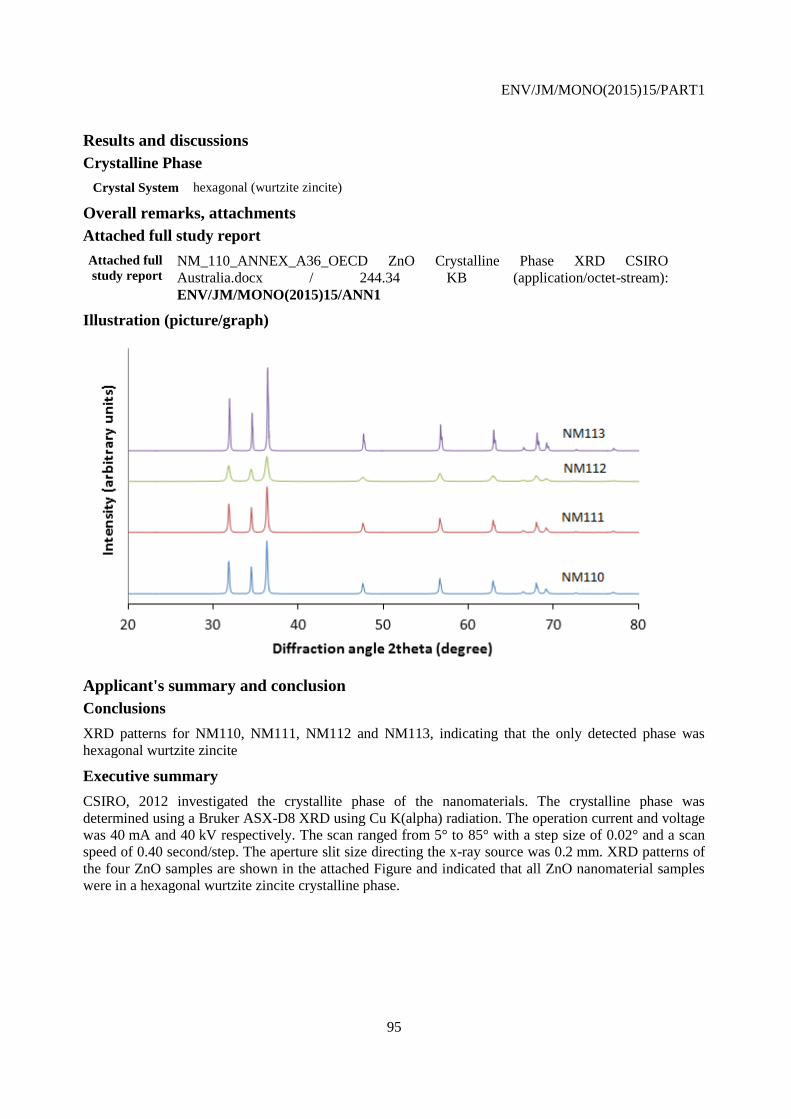
ENV/JM/MONO(2015)15/PART1
95
Results and discussions
Crystalline Phase
Crystal System hexagonal (wurtzite zincite)
Overall remarks, attachments
Attached full study report
Attached full
study report NM_110_ANNEX_A36_OECD ZnO Crystalline Phase XRD CSIRO
Australia.docx / 244.34 KB (application/octet-stream):
ENV/JM/MONO(2015)15/ANN1
Illustration (picture/graph)
Applicant's summary and conclusion
Conclusions
XRD patterns for NM110, NM111, NM112 and NM113, indicating that the only detected phase was
hexagonal wurtzite zincite
Executive summary
CSIRO, 2012 investigated the crystallite phase of the nanomaterials. The crystalline phase was
determined using a Bruker ASX-D8 XRD using Cu K(alpha) radiation. The operation current and voltage
was 40 mA and 40 kV respectively. The scan ranged from 5° to 85° with a step size of 0.02° and a scan
speed of 0.40 second/step. The aperture slit size directing the x-ray source was 0.2 mm. XRD patterns of
the four ZnO samples are shown in the attached Figure and indicated that all ZnO nanomaterial samples
were in a hexagonal wurtzite zincite crystalline phase.
ENV/JM/MONO(2015)15/PART1
96
Endpoint study record: WoE_2012-03-
06_Australia_Deakin_Crystallinephase_XRD
Administrative Data
Purpose flag weight of evidence
Study result
type
experimental result
Reliability 2 (reliable with restrictions)
Rationale for
reliability incl.
deficiencies
The study was regarded as reliable with restrictions. XRD secondary use was the analysis of
peak width to obtain crystallite size. Uncertainties grow above ~50nm (as is the case for
several samples, see TEM). It was concluded that this method was not ideally suited for
present samples.
Data source
Reference
Reference
type
Author Year Title Bibliographic
source
Testing
laboratory
Report
no.
Owner
company
Company
study no.
Report
date
study
report
Tsuzuki,
Re
2012 Crystal phase
& crystallite
size
measurements
for OECD ZnO
samples
Deakin
University
GEELONG
VIC 3220
Australia
2012-
03-06
Data access
data submitter is data owner
Data protection claimed
yes, but willing to share
Materials and methods
Test guideline
Qualifier Guideline Deviations
no guideline followed
Method
x-ray diffraction (XRD)
Details on methods and data evaluation
Power: 40 kV, 30 mAX-rays: Cu-K-alphaSlit width: 2 00 mmScan step size: 0.02 degreeScan type:
continuousTime per step: 0.5 sec
Sampling
Dry powder (as-received) was packed in a plastic sample holder. The surface was flattened using a glass
slide
Data gathering
Instruments
Panalytical X’Pert Pro MRD
ENV/JM/MONO(2015)15/PART1
97
GLP compliance
no
Test materials
Identity of test material same as for substance defined in section 1 (if not read-across)
yes
Test material identity
Identifier Identity
CAS number 1314-13-2
EC number 215-222-5
IUPAC name oxozinc
other: OECD Sponsorship Programme NM110, NM111, NM112, NM113
Test material form
nanomaterial - powder
Confidential details on test material
-Name of test material: Z-cote ®
Code: NM110
Supplier: BASF SE
Surface coating: none
- Substance type: Inorganic
- Physical state: solid powder, nano-form
-Name of test material: Z-cote HP
Code: NM111
Supplier: BASF SE
Surface coating: triethoxycaprylylsilane (2%)
- Substance type: Inorganic
- Physical state: solid powder, nano-form
-Name of test material: Nanosun
TM Code: NM112
Supplier: Micronisers Surface coating: none
- Substance type: Inorganic
- Physical state: solid powder, nano-form
-Name of test material: Zinc Oxide
Code: NM113
Supplier: Sigma-Aldrich
Surface coating: none- Substance type: Inorganic
- Physical state: solid powder, nano-form
Results and discussions
Crystalline Phase
Common Name wuritzite
Crystal System hexagonal
Remarks on results incl. tables
Sample Crystallite size (nm)
NM110 24
NM111 21

ENV/JM/MONO(2015)15/PART1
98
NM112 21
NM113 27
Overall remarks, attachments
Attached full study report
Attached full
study report
NM_110_ANNEX_A37_OECD ZnO XRD Auatsralia Deakin.pdf / 85.42 KB
(application/octet-stream): ENV/JM/MONO(2015)15/ANN1
Illustration (picture/graph)
Applicant's summary and conclusion
Conclusions
XRD patterns of the four ZnO samples are shown in the attached figure and indicated that all ZnO
ENV/JM/MONO(2015)15/PART1
99
nanomaterial samples were in a hexagonal wurtzite zincite crystalline phase.
Executive summary
The Australia Deakin University, 2012 investigated the crystalline phase of the test items. The crystallite
phase was determined using a X’Pert Pro MRD X-Ray Diffractometer (XRD) using Cu K(alpha)
radiation. The operation current and voltage was 40 mA and 40 kV respectively. The scan ranged from
10° to 80° with a step size of 0.02° and a scan speed of 0.50 second/step. The aperture slit size directing
the x-ray source was 200 nm. XRD patterns of the four ZnO samples are shown in the attached figure and
indicated that all ZnO nanomaterial samples were in a hexagonal wurtzite zincite crystalline phase.
Endpoint study record: WoE_2011-08-11_NPL for PROSPECT_XRD
Administrative Data
Purpose flag disregarded study
Study result type experimental result
Reliability 4 (not assignable)
Rationale for
reliability incl.
deficiencies
The study does not provide information about the crystalline phase. In addition the study
has significant limitations regarding documentation and data evaluation. Thus, the
reliability of the study could not be assigned.
Data source
Reference
Reference
type
Author Year Title Bibliographic
source
Testing
laboratory
Report
no.
Owner
company
Company
study no.
Report
date
study
report
National
Physical
Laboratory
2011 NPL for
PROSPECT
XRD
National
Physical
Laboratory,
Teddington,
Middlesex,
United
Kingdom
2011-
08-11
Data access
data submitter is data owner
Data protection claimed
yes, but willing to share
Cross-reference to same study
4.26 Crystallite and grain size
Materials and methods
Test guideline
Qualifier Guideline Deviations
no guideline followed
Method
x-ray diffraction (XRD)
ENV/JM/MONO(2015)15/PART1
100
Data gathering
Instruments
Siemens D5000 diffractometer
GLP compliance
no
Test materials
Identity of test material same as for substance defined in section 1 (if not read-across)
yes
Test material identity
Identifier Identity
CAS number 1314-13-2
EC number 215-222-5
IUPAC name oxozinc
other: OECD Sponsorship programme NM110, NM11, NM112, NM113
Test material form
nanomaterial - aerosol
Confidential details on test material
-Name of test material: Z-cote ®
Code: NM110
Supplier: BASF SE
Surface coating: none
- Substance type: Inorganic
- Physical state: solid powder, nano-form
-Name of test material: Z-cote HP
Code: NM111
Supplier: BASF SE
Surface coating: triethoxycaprylylsilane (2%)
- Substance type: Inorganic
- Physical state: solid powder, nano-form
-Name of test material: Nanosun
TM Code: NM112
Supplier: Micronisers
Surface coating: none
- Substance type: Inorganic
- Physical state: solid powder, nano-form
-Name of test material: Zinc Oxide
Code: NM113
Supplier: Sigma-Aldrich
Surface coating: none
- Substance type: Inorganic
- Physical state: solid powder, nano-form
ENV/JM/MONO(2015)15/PART1
101
Results and discussions
Crystalline Phase
Crystal System hexagonal
Space Group P63mc
Crystallographic planes a = 3.2493(38) Å, c = 5.2097(2) Å
Remarks on results incl. tables
Scherrer equation size data
Material Crystallite Diameter (nm)
NM-112 24.1
NM-111 33.8
NM-110 41.5
NM-113 41.5
Overall remarks, attachments
Remarks on results including tables and figures
This size data however should be interpreted with care. The technique is generally regarded to break
down for particle size, when the particle size is above 100nm. The size determination is also greatly
affected by the size distribution of the particles in the powder. As larger particles tend to swamp the size
contribution from the smaller size fraction. Therefore, the technique works best with particles under 100
nm and with a narrow size distribution.
Attached full study report
Attached full
study report
NM_110_ANNEX_A39_XRD Preliminary Data from NPL.doc / 507.5 KB
(application/octet-stream): ENV/JM/MONO(2015)15/ANN10
4.26 Crystallite and grain size
Endpoint study record: Key_2012-03-
05_Australia_CSIRO_Crystallite_Size_XRD_Scherrer
Administrative Data
Purpose flag key study
Study result type experimental result
Reliability 1 (reliable without restriction)
Rationale for
reliability incl.
deficiencies
The study was regarded as scientifically acceptable. Contributions to the widths of Xray
diffraction peaks from crystal strain and instrument effects are assumed to be zero. Using
XRD the average particle size can be estimated. Specific factors can influence the peak width,
such as microstrain, lattice defects and temperature factors. Due to the limited documentation
it was not possible to estimate the influence of these factors to the result. Thus, the study was
regarded as reliable with restrictions.
ENV/JM/MONO(2015)15/PART1
102
Data source
Reference
Reference
type
Author Year Title Bibliographic
source
Testing
laboratory
Report
no.
Owner
company
Company
study no.
Report
date
study
report
Casey,
Yin,
McCall
2012 Summary of
physicochemical
properties of
OECD Zinc
Oxide (ZnO)
samples -
Comparison of
particle/crystallite
sizes as
determined using
XRD, TEM and
BET surface area
measurements
Commonwealth
Scientific and
Industrial
Research
Organisation
2012-
03-05
Data access
data submitter is data owner
Data protection claimed
yes, but willing to share
Materials and methods
Test guideline
Qualifier Guideline Deviations
no guideline followed
Method
x-ray diffraction (XRD)
Details on methods and data evaluation
D S-XRD was calculated using Scherrer’s formula. It should be noted that a variety of factors can
contribute to the width of a diffraction peak; besides crystallite size, the most important of these usually
are inhomogeneous strain and instrumental effects. When Scherrer’s formula is applied, it is assumed that
all of these other contributions to the peak width are zero.
Data gathering
Instruments
Bruker ASX-D8 X-Ray Diffractometer (XRD) using Cu K(alpha) radiation
GLP compliance
no
Test materials
Test material identity
Identifier Identity
CAS number 1314-13-2
EC number 215-222-5
IUPAC name oxozinc

ENV/JM/MONO(2015)15/PART1
103
other: OECD Sponsorship programme NM110, NM111, NM112, NM113
Test material form
nanomaterial
Confidential details on test material
-Name of test material: Z-cote ®
Code: NM110
Supplier: BASF SE
Surface coating: none
- Substance type: Inorganic
- Physical state: solid powder, nano-form
-Name of test material: Z-cote HP
Code: NM111
Supplier: BASF SE
Surface coating: triethoxycaprylylsilane (2%)
- Substance type: Inorganic
- Physical state: solid powder, nano-form
-Name of test material: Nanosun
TM Code: NM112
Supplier: Micronisers
Surface coating: none
- Substance type: Inorganic
- Physical state: solid powder, nano-form
-Name of test material: Zinc Oxide
Code: NM113
Supplier: Sigma-Aldrich
Surface coating: none
- Substance type: Inorganic
- Physical state: solid powder, nano-for
Results and discussions
Remarks on results including tables and figures
Comparison of crystallite/particle sizes in samples NM110, NM111, NM112 and NM113, as determined
from XRD analyses, TEM images and BET surface area measurements.
DR-XRD
(nm)
DS-XRD
(nm)
DFeret TEM
(nm)
Dcirc TEM
(nm)
DSA BET
(nm) Average of all methods (nm)
NM110 113 41 70 ± 46 52 ± 33 74 77.5 ± 18
NM111 83 34 82 ± 45 60 ± 33 76 75.2 ± 7.6
NM112 43 25 30 ± 9 25 ± 7 37 33.75 ± 6.2
NM113 200 42 143 ± 47 113 ± 45 143 149.7 ± 25.0
All methods indicate that the particle sizes are in the same order as sizes provided by the suppliers. Based
on the average values from all methods, NM-112 is the smallest (~34 nm), NM-110 (78 nm) and NM111
are larger (75 nm), and NM-113 is the largest (150 nm). The difference between the measured and
supplier-supplied particle size is largest for NM113 (measured 150nm, compared with a supplier-supplied
value of 95% < 3.5µm and 50% <1µm) and smallest for NM112 (measured 34nm compared with a
supplier-supplied value of 30-50nm).Of the four samples analysed, NM112 has the smallest size
distribution, with particles likely to be single crystals.
The sizes of particles determined by different methods were generally in the order of

ENV/JM/MONO(2015)15/PART1
104
DR-XRD> DSA BET~ DFeretTEM> DCirc TEM> DS-XRD
DS-XRDwas smallest because Scherrer’s formula ignores the contributions of width broadening due to
strain and instrument effects. If these contributions are non-zero, the crystallite sizes could be larger than
those predicted by the Scherrer formula, as revealed by DR-XRD. The real states of particles can be
described as singlets, agglomerates or aggregates. Agglomerates are primary particles held by weak Van
der Waals force that can be overcome if sufficient energy is provided. Aggregates are primary particles
held together by strong chemical bonds that cannot be separated by conventional methods. DFeret
TEMprovides the most reliable assessment of aggregate size, because aggregates are not broken up by
ultrasonication during sample preparation whereas agglomerates can be. DCirc TEMprovides a smaller value
than DFeret TEMsince this methodtreats all particles as spheres; it is not the most suitable method for
analysing samples containing particles with a broad or multimodal size distribution. DSABETwas calculated
from measurements of specific surface area and assumed that all particles are non-porous and have the
same spherical shape and size.
Attached full study report
Attached full study
report
NM_110_ANNEX_A21_OECD ZnO Crystallite Size CSIRO Australia.docx / 29.24 KB
(application/octet-stream): ENV/JM/MONO(2015)15/ANN1
Applicant's summary and conclusion
Executive summary
CSIRO, 2012 investigated the crystallite size of the nanomaterials. Two methods were used to estimate
average crystallite size based on XRD results. Crystallite size of the test samples were calculated using
Scherrer’s formula (D S-XRD) and through Rietveld refinement of the diffraction data (D R-XRD). The
crystallite size of the test samples determined in two independent experiments calculated using Scherrer’s
formula were comparable for all nanomaterial samples. The crystallite sizes determined by XRD were in
the range of 24 nm (NM-112) to 42 nm. Both NM-110 and NM-113 have the same crystallite size of 42
nm. The average crystallite size determined by Rietveld refinement yielded larger crystallite sizes. This
result could be explained by the fact that the Scherrer’s formula ignores the contributions of width
broadening due to strain and instrument effects. If these contributions are non-zero, the crystallite sizes
could be larger than those predicted by the Scherrer formula, as revealed by Rietveld refinement of the
diffraction data (D-R XRD). These data were regarded as most reliable.
Endpoint study record: supporting_2010-07-02_NPL for PROSPECT_Crystallite
andgrain size_XRD
Administrative Data
Purpose flag supporting study
Study result type experimental result
Reliability 2 (reliable with restrictions)
Rationale for
reliability incl.
deficiencies
The study was regarded as scientifically acceptable. In general XRD is the recommended
method in the respective ECHA guidance. However, only limited documentation of the data
evaluation was provided in the full study report. Furthermore the procedure for subsampling
and data analysis and representation was not explained in detail. Thus, it was not possible to
assess the validity of the provided data as the sample preparation and the data analysis could
have a significant influence to the result Other factors can also influence the peak width, such
as microstrain, lattice defects and temperature factors. Based on the provided data neither
these influences could not be assessed nor was it investigated in the study. Thus, the study
was regarded as reliable with restrictions.
ENV/JM/MONO(2015)15/PART1
105
Data source
Reference
Reference
type
Author Year Title Bibliographic
source
Testing
laboratory
Report
no.
Owner
company
Company
study no.
Report
date
study
report
National
Physical
Laboratory
2010 X-ray
diffraction
analysis of 7
nanoparticle
samples –
direct
comparison
for
PROSPEcT
National
Physical
Laboratory,
Teddington,
Middlesex,
United
Kingdom
2010-
07-02
Data access
data submitter is data owner
Data protection claimed
yes, but willing to share
Materials and methods
Test guideline
Qualifier Guideline Deviations
no guideline followed
Method
x-ray diffraction (XRD)
Data gathering
GLP compliance
no
Test materials
Test material identity
Identifier Identity
CAS number 1314-13-2
EC number 215-222-5
IUPAC name oxozinc
other: OECD Sponsorship Programme NM110, NM111, NM112 , NM113
Test material form
nanomaterial
Confidential details on test material
-Name of test material: Z-cote ®
Code: NM110
Supplier: BASF SE
Surface coating: none
- Substance type: Inorganic
- Physical state: solid powder, nano-form
-Name of test material: Z-cote HP
Code: NM111
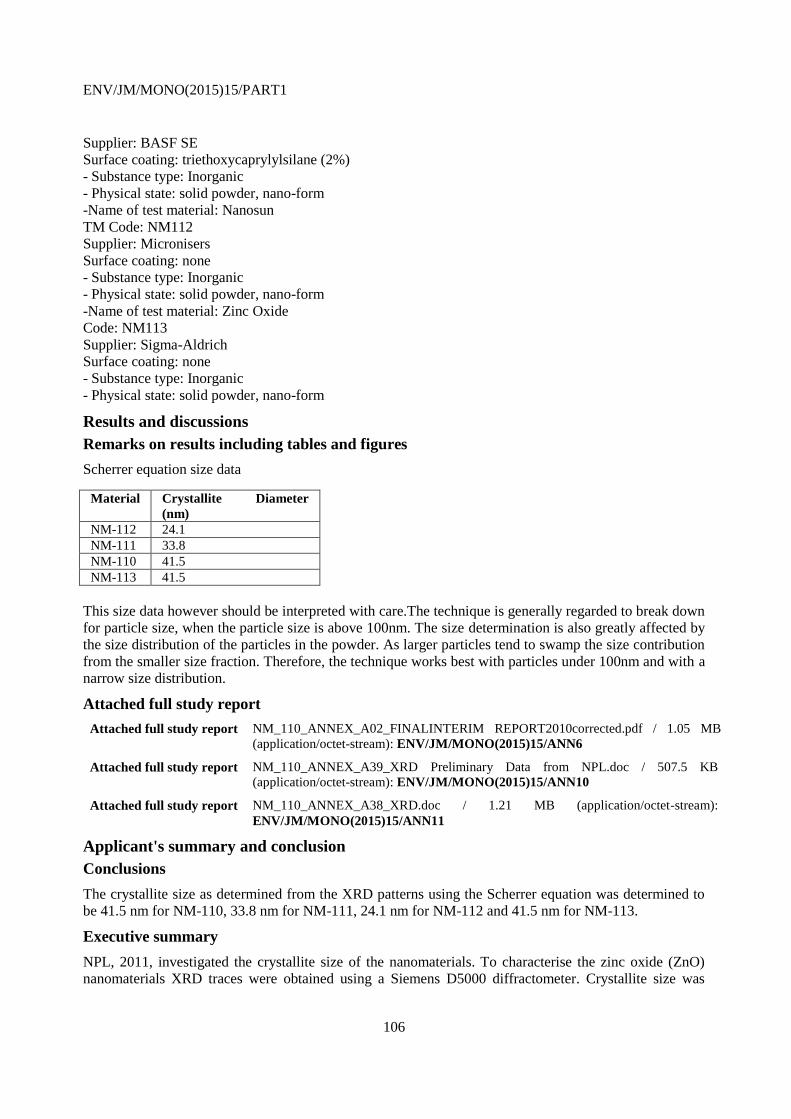
ENV/JM/MONO(2015)15/PART1
106
Supplier: BASF SE
Surface coating: triethoxycaprylylsilane (2%)
- Substance type: Inorganic
- Physical state: solid powder, nano-form
-Name of test material: Nanosun
TM Code: NM112
Supplier: Micronisers
Surface coating: none
- Substance type: Inorganic
- Physical state: solid powder, nano-form
-Name of test material: Zinc Oxide
Code: NM113
Supplier: Sigma-Aldrich
Surface coating: none
- Substance type: Inorganic
- Physical state: solid powder, nano-form
Results and discussions
Remarks on results including tables and figures
Scherrer equation size data
Material Crystallite Diameter
(nm)
NM-112 24.1
NM-111 33.8
NM-110 41.5
NM-113 41.5
This size data however should be interpreted with care.The technique is generally regarded to break down
for particle size, when the particle size is above 100nm. The size determination is also greatly affected by
the size distribution of the particles in the powder. As larger particles tend to swamp the size contribution
from the smaller size fraction. Therefore, the technique works best with particles under 100nm and with a
narrow size distribution.
Attached full study report
Attached full study report NM_110_ANNEX_A02_FINALINTERIM REPORT2010corrected.pdf / 1.05 MB
(application/octet-stream): ENV/JM/MONO(2015)15/ANN6
Attached full study report NM_110_ANNEX_A39_XRD Preliminary Data from NPL.doc / 507.5 KB
(application/octet-stream): ENV/JM/MONO(2015)15/ANN10
Attached full study report NM_110_ANNEX_A38_XRD.doc / 1.21 MB (application/octet-stream):
ENV/JM/MONO(2015)15/ANN11
Applicant's summary and conclusion
Conclusions
The crystallite size as determined from the XRD patterns using the Scherrer equation was determined to
be 41.5 nm for NM-110, 33.8 nm for NM-111, 24.1 nm for NM-112 and 41.5 nm for NM-113.
Executive summary
NPL, 2011, investigated the crystallite size of the nanomaterials. To characterise the zinc oxide (ZnO)
nanomaterials XRD traces were obtained using a Siemens D5000 diffractometer. Crystallite size was
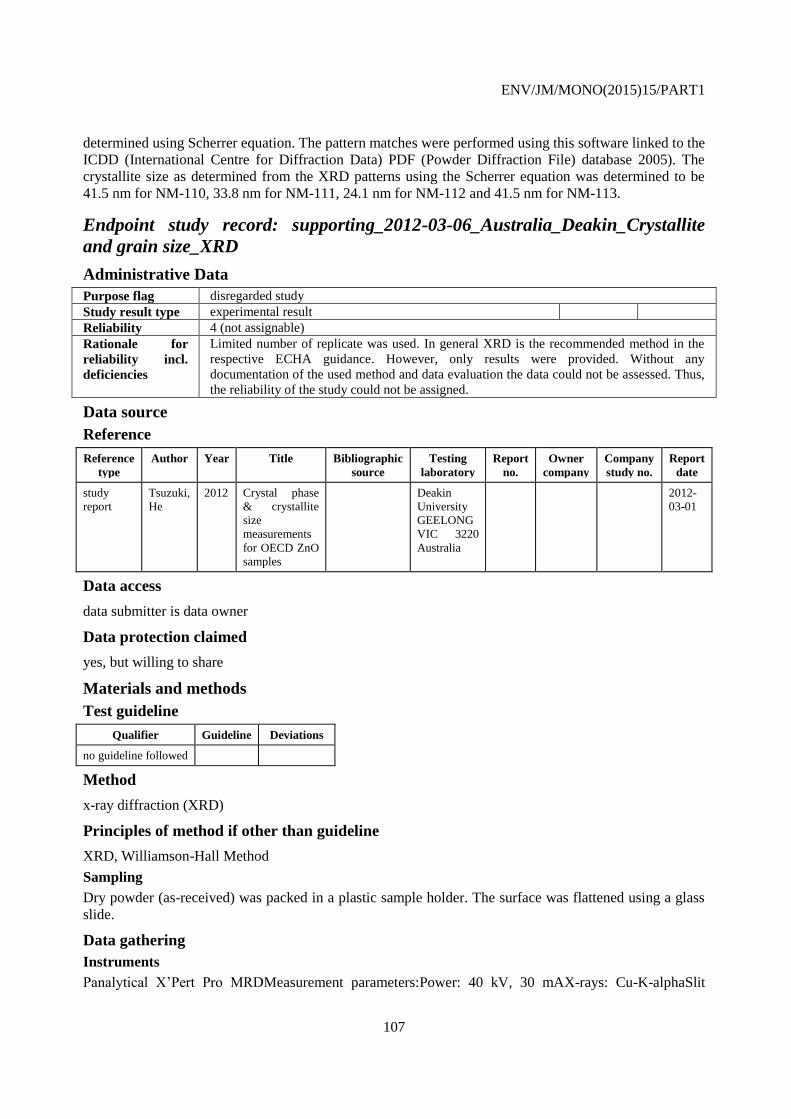
ENV/JM/MONO(2015)15/PART1
107
determined using Scherrer equation. The pattern matches were performed using this software linked to the
ICDD (International Centre for Diffraction Data) PDF (Powder Diffraction File) database 2005). The
crystallite size as determined from the XRD patterns using the Scherrer equation was determined to be
41.5 nm for NM-110, 33.8 nm for NM-111, 24.1 nm for NM-112 and 41.5 nm for NM-113.
Endpoint study record: supporting_2012-03-06_Australia_Deakin_Crystallite
and grain size_XRD
Administrative Data
Purpose flag disregarded study
Study result type experimental result
Reliability 4 (not assignable)
Rationale for
reliability incl.
deficiencies
Limited number of replicate was used. In general XRD is the recommended method in the
respective ECHA guidance. However, only results were provided. Without any
documentation of the used method and data evaluation the data could not be assessed. Thus,
the reliability of the study could not be assigned.
Data source
Reference
Reference
type
Author Year Title Bibliographic
source
Testing
laboratory
Report
no.
Owner
company
Company
study no.
Report
date
study
report
Tsuzuki,
He
2012 Crystal phase
& crystallite
size
measurements
for OECD ZnO
samples
Deakin
University
GEELONG
VIC 3220
Australia
2012-
03-01
Data access
data submitter is data owner
Data protection claimed
yes, but willing to share
Materials and methods
Test guideline
Qualifier Guideline Deviations
no guideline followed
Method
x-ray diffraction (XRD)
Principles of method if other than guideline
XRD, Williamson-Hall Method
Sampling
Dry powder (as-received) was packed in a plastic sample holder. The surface was flattened using a glass
slide.
Data gathering
Instruments
Panalytical X’Pert Pro MRDMeasurement parameters:Power: 40 kV, 30 mAX-rays: Cu-K-alphaSlit

ENV/JM/MONO(2015)15/PART1
108
width: 2 00 mmScan step size: 0.02 degreeScan type: continuousTime per step: 0.5 sec
GLP compliance
no
Test materials
Test material identity
Identifier Identity
CAS number 1314-13-2
EC number 215-222-5
IUPAC name oxozinc
other: OECD Sponsorship Programme NM110, NM111, NM112, NM113
Test material form
nanomaterial
Confidential details on test material
-Name of test material: Z-cote ®
Code: NM110
Supplier: BASF SE
Surface coating: none
- Substance type: Inorganic
- Physical state: solid powder, nano-form
-Name of test material: Z-cote HP
Code: NM111
Supplier: BASF SE
Surface coating: triethoxycaprylylsilane (2%)
- Substance type: Inorganic
- Physical state: solid powder, nano-form
-Name of test material: Nanosun
TM Code: NM112
Supplier: Micronisers
Surface coating: none
- Substance type: Inorganic
- Physical state: solid powder, nano-form
-Name of test material: Zinc Oxide
Code: NM113
Supplier: Sigma-Aldrich
Surface coating: none
- Substance type: Inorganic
- Physical state: solid powder, nano-form
Results and discussions
Attached full study report
Attached full study
report
NM_110_ANNEX_A37_OECD ZnO XRD Auatsralia Deakin.pdf / 85.42 KB
(application/octet-stream): ENV/JM/MONO(2015)15/ANN1
Remarks on results incl. tables
Sample Crystallite size (nm)
NM110 24

ENV/JM/MONO(2015)15/PART1
109
NM111 21
NM112 21
NM113 27
4.27 Aspect ratio/shape
4.28 Specific surface area
Endpoint study record: WoE_2010-06-25_NPL for PROSPECT_specific
surfacearea_BET
Administrative Data
Purpose flag supporting study
Study result type experimental result
Reliability 2 (reliable with restrictions)
Rationale for
reliability incl.
deficiencies
The study was regarded as scientifically acceptable. However, only limited documentation of
the data evaluation was provided in the full study report. Furthermore the procedure for
subsampling and data analysis and representation was not explained in detail. There are
specific sample splitting practices to be followed (cf. ISO 14488:2007). It was not indicated in
the study report that these sampling procedures were followed. Thus, there is a doubt that the
sample could be considered to be representative of the whole sample with a defined
confidence level. Thus, it was not possible to assess the validity of the provided data as the
sample preparation and the data analysis could have a significant influence to the result. The
most requirements as outlined in ECHA guidance were fulfilled. Thus, the results were
regarded as reliable with restrictions.
Data source
Reference
Reference
type
Author Year Title Bibliographic
source
Testing
laboratory
Report
no.
Owner
company
Company
study no.
Report
date
study
report
National
Physical
Laboratory
2010 National
Physical
Laboratory,
Teddington,
Middlesex,
United Kingdom
2010-
06-25
Data access
data submitter is data owner
Data protection claimed
yes, but willing to share
Materials and methods
Test guideline
Qualifier Guideline Deviations
according to ISO 9277:2010 Determination of the specific surface area of solids by gas adsortion -
BET method
no data
Methods
BET (BET (Brunauer, Emmett and Teller) Multipoint Specific Surface Area determination)
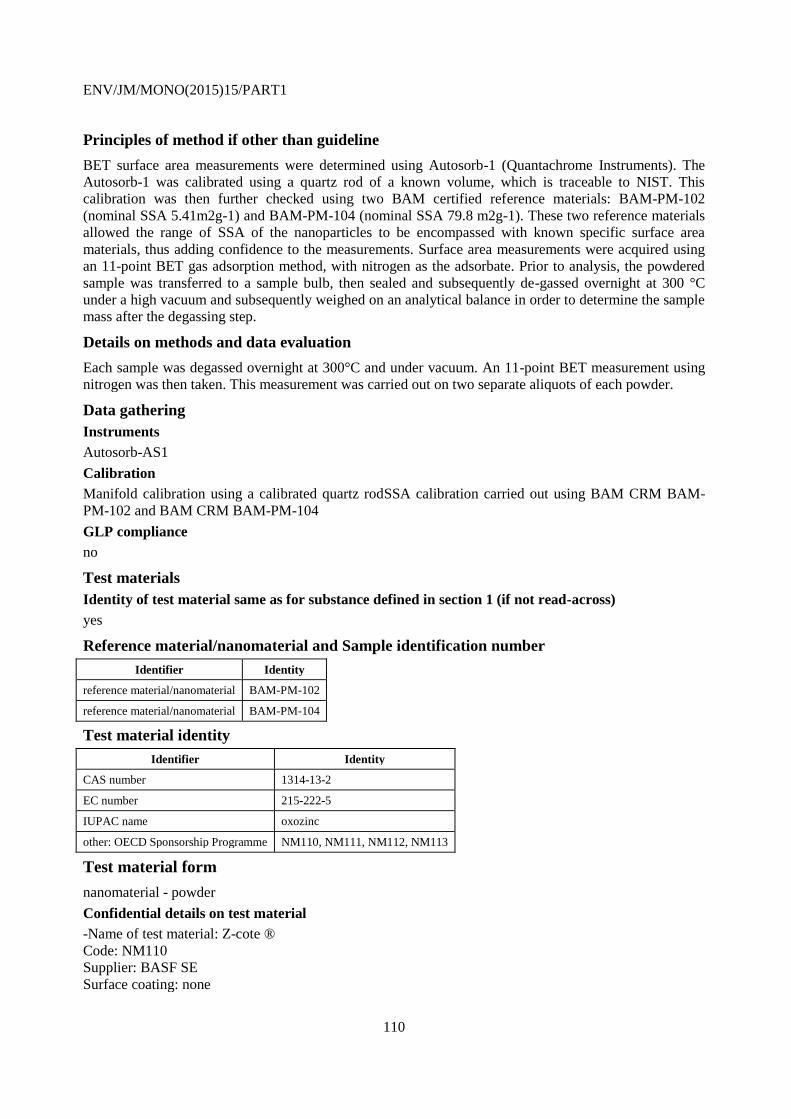
ENV/JM/MONO(2015)15/PART1
110
Principles of method if other than guideline
BET surface area measurements were determined using Autosorb-1 (Quantachrome Instruments). The
Autosorb-1 was calibrated using a quartz rod of a known volume, which is traceable to NIST. This
calibration was then further checked using two BAM certified reference materials: BAM-PM-102
(nominal SSA 5.41m2g-1) and BAM-PM-104 (nominal SSA 79.8 m2g-1). These two reference materials
allowed the range of SSA of the nanoparticles to be encompassed with known specific surface area
materials, thus adding confidence to the measurements. Surface area measurements were acquired using
an 11-point BET gas adsorption method, with nitrogen as the adsorbate. Prior to analysis, the powdered
sample was transferred to a sample bulb, then sealed and subsequently de-gassed overnight at 300 °C
under a high vacuum and subsequently weighed on an analytical balance in order to determine the sample
mass after the degassing step.
Details on methods and data evaluation
Each sample was degassed overnight at 300°C and under vacuum. An 11-point BET measurement using
nitrogen was then taken. This measurement was carried out on two separate aliquots of each powder.
Data gathering
Instruments
Autosorb-AS1
Calibration
Manifold calibration using a calibrated quartz rodSSA calibration carried out using BAM CRM BAM-
PM-102 and BAM CRM BAM-PM-104
GLP compliance
no
Test materials
Identity of test material same as for substance defined in section 1 (if not read-across)
yes
Reference material/nanomaterial and Sample identification number
Identifier Identity
reference material/nanomaterial BAM-PM-102
reference material/nanomaterial BAM-PM-104
Test material identity
Identifier Identity
CAS number 1314-13-2
EC number 215-222-5
IUPAC name oxozinc
other: OECD Sponsorship Programme NM110, NM111, NM112, NM113
Test material form
nanomaterial - powder
Confidential details on test material
-Name of test material: Z-cote ®
Code: NM110
Supplier: BASF SE
Surface coating: none
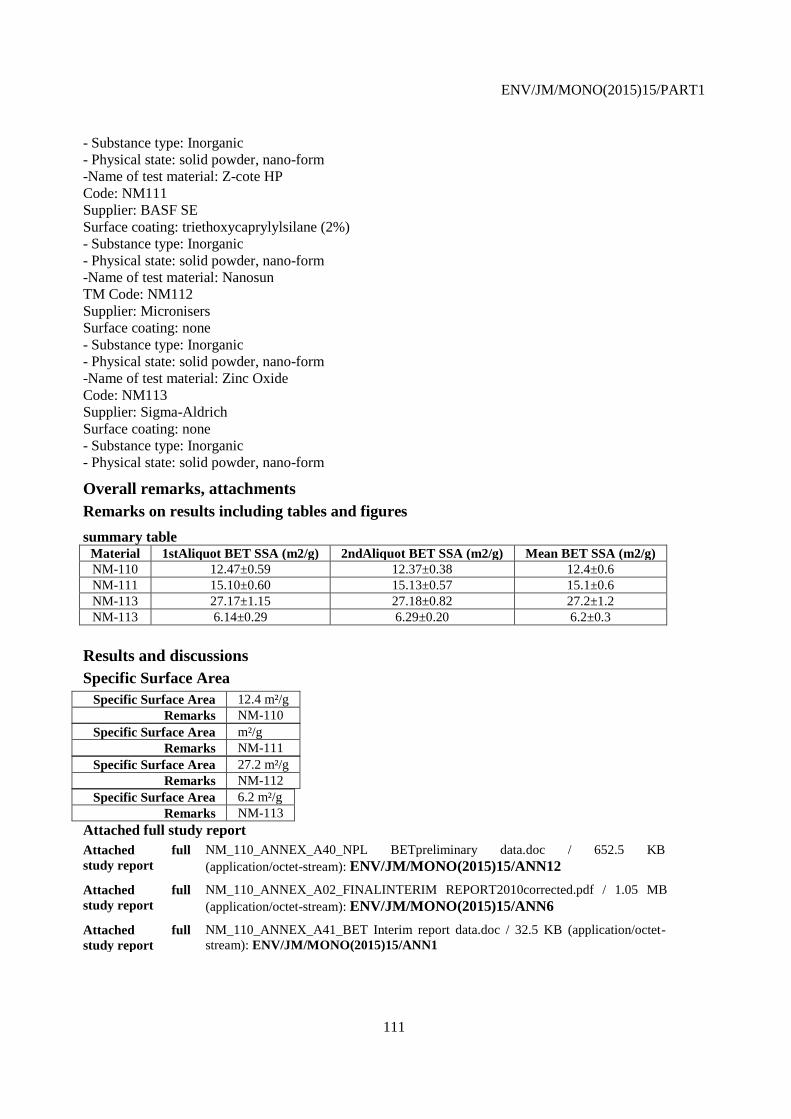
ENV/JM/MONO(2015)15/PART1
111
- Substance type: Inorganic
- Physical state: solid powder, nano-form
-Name of test material: Z-cote HP
Code: NM111
Supplier: BASF SE
Surface coating: triethoxycaprylylsilane (2%)
- Substance type: Inorganic
- Physical state: solid powder, nano-form
-Name of test material: Nanosun
TM Code: NM112
Supplier: Micronisers
Surface coating: none
- Substance type: Inorganic
- Physical state: solid powder, nano-form
-Name of test material: Zinc Oxide
Code: NM113
Supplier: Sigma-Aldrich
Surface coating: none
- Substance type: Inorganic
- Physical state: solid powder, nano-form
Overall remarks, attachments
Remarks on results including tables and figures
summary table Material 1stAliquot BET SSA (m2/g) 2ndAliquot BET SSA (m2/g) Mean BET SSA (m2/g)
NM-110 12.47±0.59 12.37±0.38 12.4±0.6
NM-111 15.10±0.60 15.13±0.57 15.1±0.6
NM-113 27.17±1.15 27.18±0.82 27.2±1.2
NM-113 6.14±0.29 6.29±0.20 6.2±0.3
Results and discussions
Specific Surface Area
Specific Surface Area 12.4 m²/g
Remarks NM-110
Specific Surface Area m²/g
Remarks NM-111
Specific Surface Area 27.2 m²/g
Remarks NM-112
Specific Surface Area 6.2 m²/g
Remarks NM-113
Attached full study report
Attached full
study report
NM_110_ANNEX_A40_NPL BETpreliminary data.doc / 652.5 KB
(application/octet-stream): ENV/JM/MONO(2015)15/ANN12
Attached full
study report
NM_110_ANNEX_A02_FINALINTERIM REPORT2010corrected.pdf / 1.05 MB
(application/octet-stream): ENV/JM/MONO(2015)15/ANN6
Attached full
study report
NM_110_ANNEX_A41_BET Interim report data.doc / 32.5 KB (application/octet-
stream): ENV/JM/MONO(2015)15/ANN1

ENV/JM/MONO(2015)15/PART1
112
Applicant's summary and conclusion
Conclusions
The specific surface area was determined to be 12.4 ± 0.6 m2/g for NM-110, 15.1 ± 0.6 m2/g for NM-11,
27.92 ± 1.2 m2/g for NM-112 and 6.2 ± 0.3 m2/g for NM-113.
Executive summary
The specific surface area of the NMs was investigated NPL, 2010 using BET Multipoint Specific Surface
Area (SSA) determination. BET surface area measurements were determined using Autosorb-1
(Quantachrome Instruments). The Autosorb-1 was calibrated using a quartz rod of a known volume,
which is traceable to NIST. This calibration was then further checked using two BAM certified reference
materials: BAM-PM-102 (nominal SSA 5.41 m2/g) and BAM-PM-104 (nominal SSA 79.8 m²/g). These
two reference materials allowed the range of SSA of the nanoparticles to be encompassed with known
specific surface area materials, thus adding confidence to the measurements. Surface area measurements
were acquired using an 11-point BET gas adsorption method, with nitrogen as the adsorbate. Prior to
analysis, the powdered sample was transferred to a sample bulb, then sealed and subsequently de-gassed
overnight at 300 °C under a high vacuum and subsequently weighed on an analytical balance in order to
determine the sample mass after the degassing step. The specific surface area was determined to be 12.4 ±
0.6 m2/g for NM-110, 15.1 ± 0.6 m2/g for NM-11, 27.92 ± 1.2 m2/g for NM-112 and 6.2 ± 0.3 m2/g for
NM-113.
Endpoint study record: WoE_2012-03-
05_Australia_CSIRO_Specific_Surface_Area_BET
Administrative Data
Purpose flag weight of evidence
Study result type experimental result
Reliability 2 (reliable with restrictions)
Rationale for
reliability incl.
deficiencies
The study was regarded as scientifically acceptable. However, only limited documentation of
the data evaluation was provided in the full study report. Furthermore the procedure for
subsampling and data analysis and representation was not explained in detail. There are
specific sample splitting practices to be followed (cf. ISO 14488:2007). It was not indicated in
the study report that these sampling procedures were followed and if reference standards were
used. Thus, there is a doubt that the sample could be considered to be representative. It was
not possible to assess the validity of the provided data as the sample preparation and the data
analysis have a significant influence to the result. However, other requirements as outlined in
ECHA guidance were fulfilled.
Data source
Reference
Reference
type
Author Year Title Bibliographic
source
Testing
laboratory
Report
no.
Owner
company
Company
study no.
Report
date
study
report
Casy,
Yin,
McCAll
2012 Summary of
physicochemical
properties of
OECD Zinc
Oxide (ZnO)
samples - BET
Surface Area
Commonwealth
Scientific and
Industrial
Research
Organisation
2012-
03-05
Data access
data submitter is data owner
ENV/JM/MONO(2015)15/PART1
113
Data protection claimed
yes, but willing to share
Materials and methods
Test guideline
Qualifier Guideline Deviations
according
to
ISO 9277:2010 Determination of the specific surface area of solids by gas adsortion -
BET method
no data
Methods
BET
Details on methods and data evaluation
BET Surface Area was determined using a Micromeritics Tristar II 3020 which uses physical adsorption
and capillary condensation principles to obtain information about the surface area and porosity of a solid
material. Prior to analysis, the powdered sample was transferred to a sample bulb, which was then sealed
and de-gassed overnight at 300C under high vacuum, and subsequently weighed on an analytical balance
in order to determine the sample mass after the degassing step. Then the sample tube containing degassed
sample was cooled to 77K (the temperature of liquid nitrogen) and exposed to the analysis gas (nitrogen)
at 11 controlled pressures. With each incremental pressure increase, the number of gas molecules
adsorbed on the surface increases. The equilibrated pressure (P) is compared to the saturation pressure
(P0) and their relative pressure ratio (P/P0) is recorded along with the quantity of gas adsorbed by the
sample at each equilibrated pressure. Experiments were done in duplicate, on different days.
Data gathering
Instruments
Micromeritics Tristar II 3020
GLP compliance
no
Test materials
Identity of test material same as for substance defined in section 1 (if not read-across)
yes
Test material identity
Identifier Identity
CAS number 1314-13-2
EC number 215-222-5
IUPAC name oxozinc
other: OECD Sponsorship programme NM110, NM111, NM112, NM113
Test material form
nanomaterial - powder
Confidential details on test material
-Name of test material: Z-cote ®
Code: NM110Supplier: BASF SE
Surface coating: none
- Substance type: Inorganic
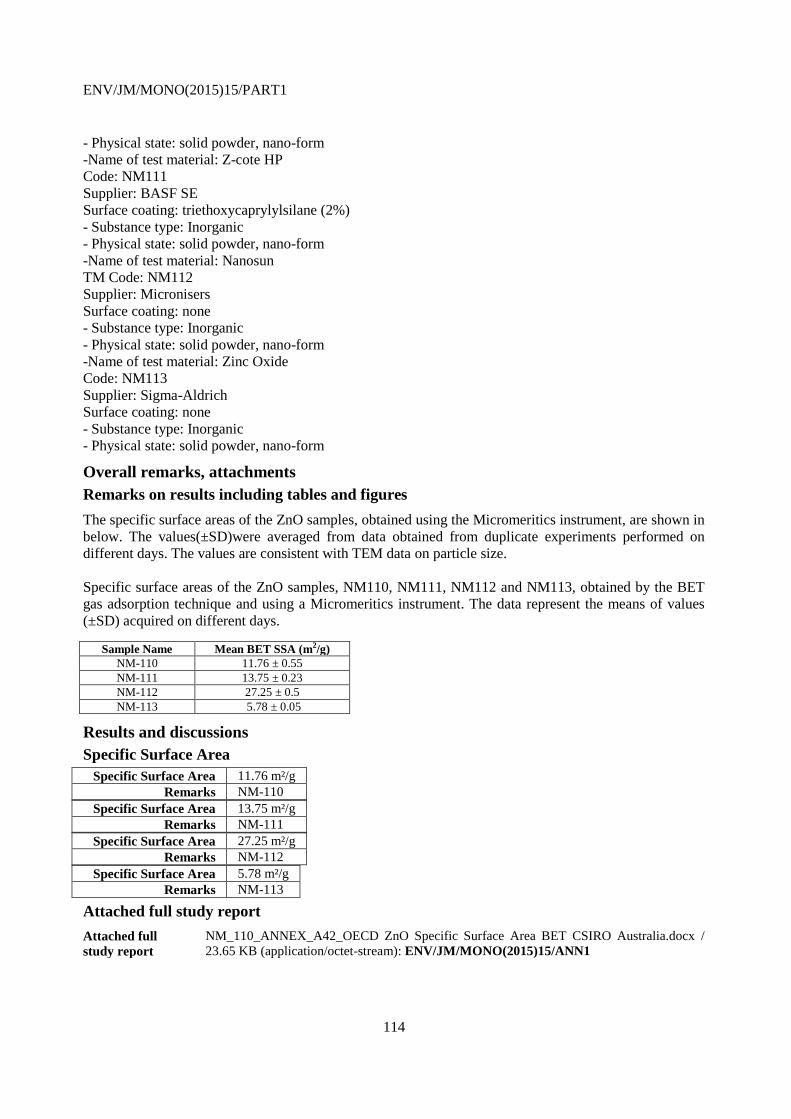
ENV/JM/MONO(2015)15/PART1
114
- Physical state: solid powder, nano-form
-Name of test material: Z-cote HP
Code: NM111
Supplier: BASF SE
Surface coating: triethoxycaprylylsilane (2%)
- Substance type: Inorganic
- Physical state: solid powder, nano-form
-Name of test material: Nanosun
TM Code: NM112
Supplier: Micronisers
Surface coating: none
- Substance type: Inorganic
- Physical state: solid powder, nano-form
-Name of test material: Zinc Oxide
Code: NM113
Supplier: Sigma-Aldrich
Surface coating: none
- Substance type: Inorganic
- Physical state: solid powder, nano-form
Overall remarks, attachments
Remarks on results including tables and figures
The specific surface areas of the ZnO samples, obtained using the Micromeritics instrument, are shown in
below. The values(±SD)were averaged from data obtained from duplicate experiments performed on
different days. The values are consistent with TEM data on particle size.
Specific surface areas of the ZnO samples, NM110, NM111, NM112 and NM113, obtained by the BET
gas adsorption technique and using a Micromeritics instrument. The data represent the means of values
(±SD) acquired on different days.
Sample Name Mean BET SSA (m2/g)
NM-110 11.76 ± 0.55
NM-111 13.75 ± 0.23
NM-112 27.25 ± 0.5
NM-113 5.78 ± 0.05
Results and discussions
Specific Surface Area
Specific Surface Area 11.76 m²/g
Remarks NM-110
Specific Surface Area 13.75 m²/g
Remarks NM-111
Specific Surface Area 27.25 m²/g
Remarks NM-112
Specific Surface Area 5.78 m²/g
Remarks NM-113
Attached full study report
Attached full
study report
NM_110_ANNEX_A42_OECD ZnO Specific Surface Area BET CSIRO Australia.docx /
23.65 KB (application/octet-stream): ENV/JM/MONO(2015)15/ANN1

ENV/JM/MONO(2015)15/PART1
115
Applicant's summary and conclusion
Conclusions
The specific surface area was determined to be 11.76 ± 0.55 m2/g for NM-110, 13.75 ± 0.23 m2/g for
NM-11, 27.25 ± 0.5 m2/g for NM-112 and 5.78 ± 0.05 m2/g for NM-113.
Executive summary
CSIRO, 2012 investigated the specific surface area of the nanomaterials. BET Surface Area was
determined using a Micromeritics Tristar II 3020 which uses physical adsorption and capillary
condensation principles to obtain information about the surface area and porosity of a solid material. Prior
to analysis, the powdered sample was transferred to a sample bulb, which was then sealed and de-gassed
overnight at 300 °C under a high vacuum, and subsequently weighed on an analytical balance in order to
determine the sample mass after the degassing step. Then the sample tube containing degassed sample
was cooled to 77 K (the temperature of liquid nitrogen) and exposed to the analysis gas (nitrogen) at
controlled pressures. With each incremental pressure increase, the number of gas molecules adsorbed on
the surface increases. The equilibrated pressure (P) was compared to the saturation pressure (P0) and their
relative pressure ratio (P/P0) was recorded along with the quantity of gas adsorbed by the sample at each
equilibrated pressure. Experiments were done in duplicate, on different days. The values (±SD) were
averaged from data obtained from duplicate experiments performed on different days. The specific
surface areas of the ZnO samples, NM 110, NM 111, NM 112 and NM 113, obtained by the BET gas
adsorption technique was determined to be 11.76 ± 0.55 m2/g for NM-110, 13.75 ± 0.23 m2/g for NM-
11, 27.25 ± 0.5 m2/g for NM-112 and 5.78 ± 0.05 m2/g for NM-113.
Endpoint study record: WoE_2011-12-19_NPL for PROSPECT_BET analysis
Administrative Data
Purpose flag weight of evidence
Study result type experimental result
Reliability 2 (reliable with restrictions)
Rationale for
reliability incl.
deficiencies
The study was regarded as scientifically acceptable. However, only limited documentation of
the data evaluation was provided in the full study report. Furthermore the procedure for
subsampling and data analysis and representation was not explained in detail. There are
specific sample splitting practices to be followed (cf. ISO 14488:2007). It was not indicated in
the study report that these sampling procedures were followed. Thus, there is a doubt that the
sample could be considered to be representative. Thus, it was not possible to assess the
validity of the provided data as the sample preparation and the data analysis have a significant
influence to the result. However, other requirements as outlined in ECHA guidance were
fulfilled.
Data source
Reference
Reference
type
Author Year Title Bibliographic
source
Testing
laboratory
Report
no.
Owner
company
Company
study no.
Report date
study
report
MCA
Cambridge
2011 BET
measure
ments
MCA
Cambridge
010611
MCACa
mbridge
2011-12-19
Data access
data submitter is data owner
Data protection claimed
yes, but willing to share

ENV/JM/MONO(2015)15/PART1
116
Materials and methods
Test guideline
Qualifier Guideline Deviations
no guideline followed
Methods
BET
Details on methods and data evaluation
A Micromeritics TriStar II (3020) was used for the collection of nitrogen adsorption / desorption isotherm
data up to a saturation pressure of approximately 0.995 P/Po. The analysis was typically conducted to
measure 45 adsorption relative pressure points and 23 desorption relative pressure points. Samples were
outgassed overnight in vacuo at 300 degC using a Micromeritics VacPrep apparatus prior to analysis. In
order to indicate any possible microporous nature of the materials additional relative pressure data were
also collected at pressures lower than the usual starting point for analyses using this instrument. These
were in the approximate range 0.005 to 0.01 P/Po. Whilst the data reduction methods available are
unsuitable for application to the micropore range the characteristic shape of the adsorption isotherm at
these low partial pressures would provide a good indication of the presence of micropores in the sample
material. The sample tube dead space was measured for each analysis using helium (CP grade) thus
providing warm and cold freespace values. Samples requiring only BET surface area analysis were
analysed using the same equipment with the application ofthe same freespace measurement technique.
BET surface area was calculated using partial pressures in the nominal range 0.07 to 0.25.Data Reduction.
The samples for which the full adsorption/desorption isotherms were analysed graphical plots of the
adsorption/desorption isotherm and BET surface area transform plot together with tabulated data for each
are presented.
Data gathering
Instruments
Micromeritics TriStar II
Calibration
BAM standard Alumina BAM-pm-104
GLP compliance
no
Test materials
Identity of test material same as for substance defined in section 1 (if not read-across)
yes
Reference material/nanomaterial and Sample identification number
Identifier Identity
reference material/nanomaterial BAM standard Alumina BAM-pm-104
Test material identity
Identifier Identity
CAS number 1314-13-2
EC number 215-222-5
IUPAC name oxozinc
other: OECD Sponsorship Programme NM110, NM111, NM112, NM113

ENV/JM/MONO(2015)15/PART1
117
Test material form
nanomaterial - powder
Confidential details on test material
-Name of test material: Z-cote ®
Code: NM110
Supplier: BASF SE
Surface coating: none
- Substance type: Inorganic
- Physical state: solid powder, nano-form
-Name of test material: Z-cote HP
Code: NM111
Supplier: BASF SE
Surface coating: triethoxycaprylylsilane (2%)
- Substance type: Inorganic
- Physical state: solid powder, nano-form
-Name of test material: Nanosun
TM Code: NM112
Supplier: Micronisers
Surface coating: none
- Substance type: Inorganic
- Physical state: solid powder, nano-form
-Name of test material: Zinc Oxide
Code: NM113
Supplier: Sigma-Aldrich
Surface coating: none
- Substance type: Inorganic
- Physical state: solid powder, nano-form
Overall remarks, attachments
Remarks on results including tables and figures
Sample Sample code Multipointsurface area by Nitrogen (m2g
-1) BETC-value
NM112 ZA250#30#ICP 27.15 ± 0.0199 252
NM111 ZB250#64#ICP 14.62± 0.0483 21
NM113 ZrA250#33#ICP 4.33 ± 0.0011 198
NM110 Zc250#37#ICP 11.91± 0.0041 234
Results and discussions
Attached full study report
Attached full study
report
NM_110_ANNEX_A43_010611MCACambridge.doc / 93 KB (application/octet-
stream): ENV/JM/MONO(2015)15/ANN1
Remarks on results incl. tables
The BET C-value:
The C-value is part of the characterisation – regardless of the theoretical explanations (relationship to the
heat of adsorption, residence time of the adsorbate molecules, etc.) the best practical aspect is the
relationship to the intercept on the BET plot – the higher the C-value the smaller the intercept. Also, a
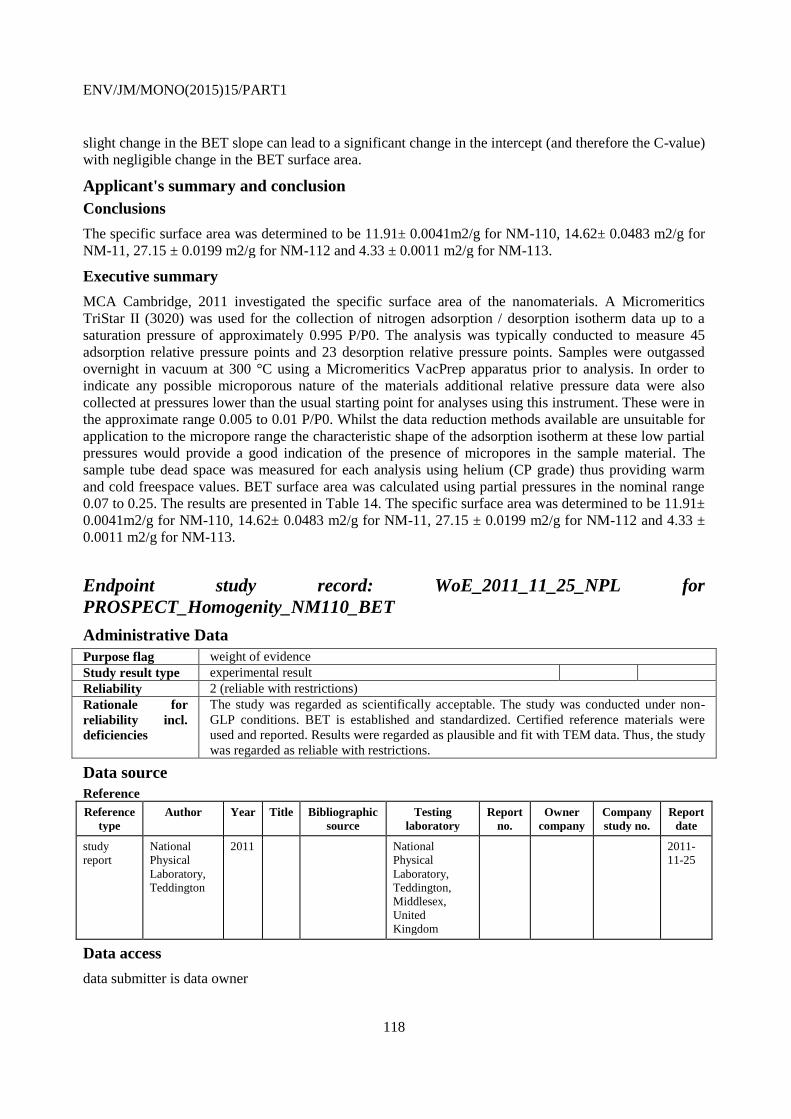
ENV/JM/MONO(2015)15/PART1
118
slight change in the BET slope can lead to a significant change in the intercept (and therefore the C-value)
with negligible change in the BET surface area.
Applicant's summary and conclusion
Conclusions
The specific surface area was determined to be 11.91± 0.0041m2/g for NM-110, 14.62± 0.0483 m2/g for
NM-11, 27.15 ± 0.0199 m2/g for NM-112 and 4.33 ± 0.0011 m2/g for NM-113.
Executive summary
MCA Cambridge, 2011 investigated the specific surface area of the nanomaterials. A Micromeritics
TriStar II (3020) was used for the collection of nitrogen adsorption / desorption isotherm data up to a
saturation pressure of approximately 0.995 P/P0. The analysis was typically conducted to measure 45
adsorption relative pressure points and 23 desorption relative pressure points. Samples were outgassed
overnight in vacuum at 300 °C using a Micromeritics VacPrep apparatus prior to analysis. In order to
indicate any possible microporous nature of the materials additional relative pressure data were also
collected at pressures lower than the usual starting point for analyses using this instrument. These were in
the approximate range 0.005 to 0.01 P/P0. Whilst the data reduction methods available are unsuitable for
application to the micropore range the characteristic shape of the adsorption isotherm at these low partial
pressures would provide a good indication of the presence of micropores in the sample material. The
sample tube dead space was measured for each analysis using helium (CP grade) thus providing warm
and cold freespace values. BET surface area was calculated using partial pressures in the nominal range
0.07 to 0.25. The results are presented in Table 14. The specific surface area was determined to be 11.91±
0.0041m2/g for NM-110, 14.62± 0.0483 m2/g for NM-11, 27.15 ± 0.0199 m2/g for NM-112 and 4.33 ±
0.0011 m2/g for NM-113.
Endpoint study record: WoE_2011_11_25_NPL for
PROSPECT_Homogenity_NM110_BET
Administrative Data
Purpose flag weight of evidence
Study result type experimental result
Reliability 2 (reliable with restrictions)
Rationale for
reliability incl.
deficiencies
The study was regarded as scientifically acceptable. The study was conducted under non-
GLP conditions. BET is established and standardized. Certified reference materials were
used and reported. Results were regarded as plausible and fit with TEM data. Thus, the study
was regarded as reliable with restrictions.
Data source
Reference
Reference
type
Author Year Title Bibliographic
source
Testing
laboratory
Report
no.
Owner
company
Company
study no.
Report
date
study
report
National
Physical
Laboratory,
Teddington
2011 National
Physical
Laboratory,
Teddington,
Middlesex,
United
Kingdom
2011-
11-25
Data access
data submitter is data owner
ENV/JM/MONO(2015)15/PART1
119
Data protection claimed
yes, but willing to share
Materials and methods
Test guideline
Qualifier Guideline Deviations
no guideline followed
Methods
BET
Principles of method if other than guideline
A Micromeritics TriStar II (3020) was used for the collection of nitrogen adsorption/desorption isotherm
data up to a saturation pressure of approximately 0.995 P/Po. The analysis was typically conducted to
measure 45 adsorption relative pressure points and 23 desorption relative pressure points. Samples were
outgassed overnight in vacuo at 300 degC using a Micromeritics VacPrep apparatus prior to analysis. In
order to indicate any possible microporous nature of the materials additional relative pressure data were
also collected at pressures lower than the usual starting point for analyses using this instrument. These
were in the approximate range 0.005 to 0.01 P/Po. The sample tube dead space was measured for each
analysis using helium (CP grade) thus providing warm and cold freespace values. Samples requiring only
BET surface area analysis were analysed using the same equipment with the application of the same
freespace measurement technique. BET surface area was calculated using partial pressures in the nominal
range 0.07 to 0.25.
Data gathering
Instruments
Micromeritics TriStar II (3020)
GLP compliance
no
Test materials
Identity of test material same as for substance defined in section 1 (if not read-across)
yes
Reference material/nanomaterial and Sample identification number
Identifier Identity
reference material/nanomaterial BAM-PM-104
reference material/nanomaterial BAM-PM-102
Test material identity
Identifier Identity
CAS number 1314-13-2
EC number 215-222-5
IUPAC name oxozinc
other: OECD sponsorship programme NM110, NM111
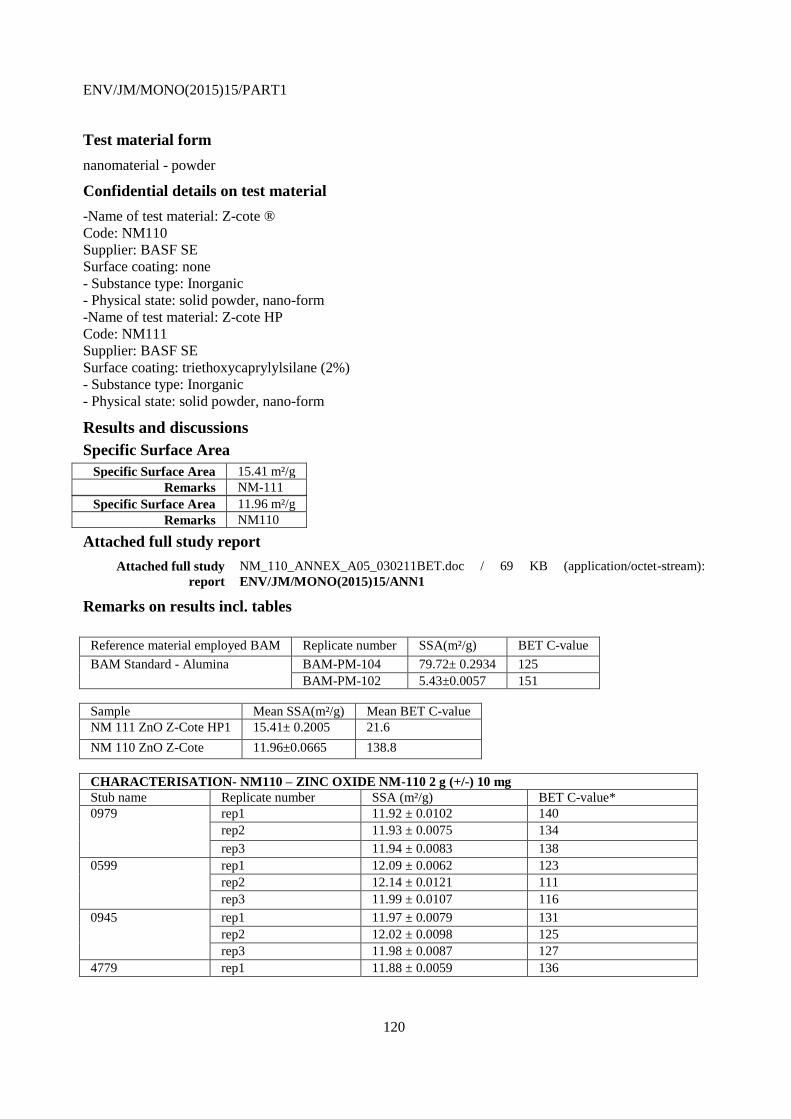
ENV/JM/MONO(2015)15/PART1
120
Test material form
nanomaterial - powder
Confidential details on test material
-Name of test material: Z-cote ®
Code: NM110
Supplier: BASF SE
Surface coating: none
- Substance type: Inorganic
- Physical state: solid powder, nano-form
-Name of test material: Z-cote HP
Code: NM111
Supplier: BASF SE
Surface coating: triethoxycaprylylsilane (2%)
- Substance type: Inorganic
- Physical state: solid powder, nano-form
Results and discussions
Specific Surface Area
Specific Surface Area 15.41 m²/g
Remarks NM-111
Specific Surface Area 11.96 m²/g
Remarks NM110
Attached full study report
Attached full study
report
NM_110_ANNEX_A05_030211BET.doc / 69 KB (application/octet-stream):
ENV/JM/MONO(2015)15/ANN1
Remarks on results incl. tables
Reference material employed BAM Replicate number SSA(m²/g) BET C-value
BAM Standard - Alumina BAM-PM-104 79.72± 0.2934 125
BAM-PM-102 5.43±0.0057 151
Sample Mean SSA(m²/g) Mean BET C-value
NM 111 ZnO Z-Cote HP1 15.41± 0.2005 21.6
NM 110 ZnO Z-Cote 11.96±0.0665 138.8
CHARACTERISATION- NM110 – ZINC OXIDE NM-110 2 g (+/-) 10 mg
Stub name Replicate number SSA (m²/g) BET C-value*
0979 rep1 11.92 ± 0.0102 140
rep2 11.93 ± 0.0075 134
rep3 11.94 ± 0.0083 138
0599 rep1 12.09 ± 0.0062 123
rep2 12.14 ± 0.0121 111
rep3 11.99 ± 0.0107 116
0945 rep1 11.97 ± 0.0079 131
rep2 12.02 ± 0.0098 125
rep3 11.98 ± 0.0087 127
4779 rep1 11.88 ± 0.0059 136
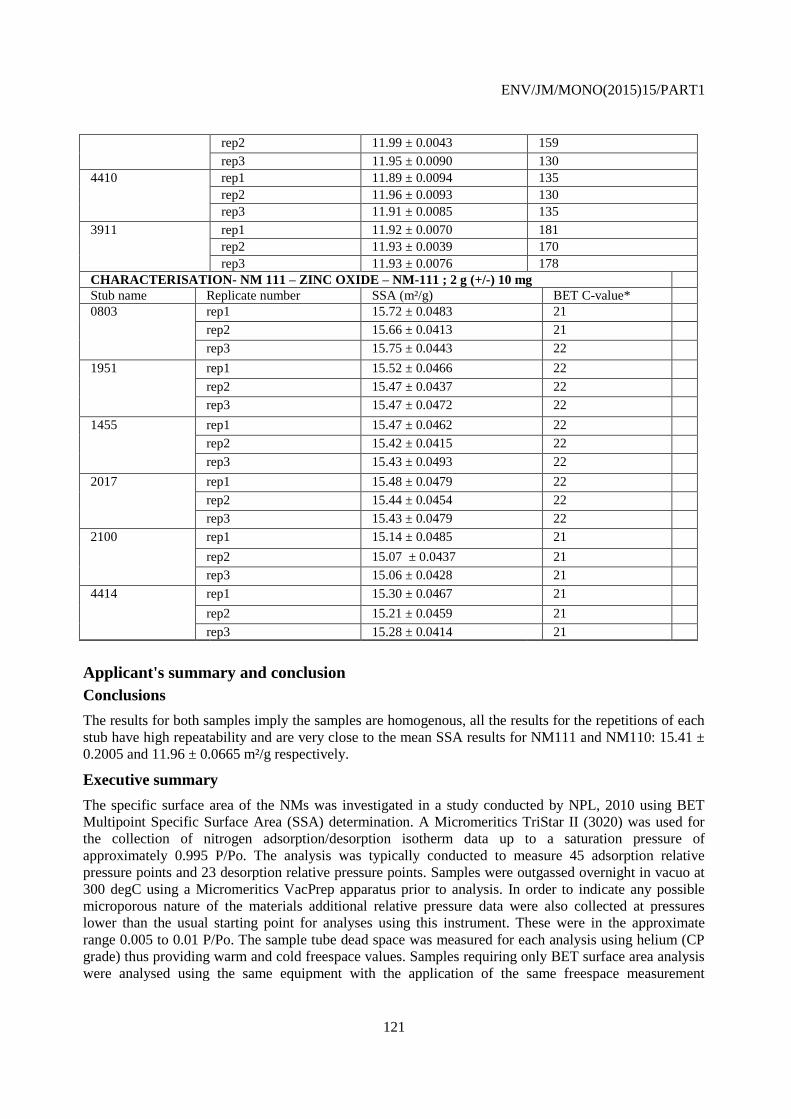
ENV/JM/MONO(2015)15/PART1
121
rep2 11.99 ± 0.0043 159
rep3 11.95 ± 0.0090 130
4410 rep1 11.89 ± 0.0094 135
rep2 11.96 ± 0.0093 130
rep3 11.91 ± 0.0085 135
3911 rep1 11.92 ± 0.0070 181
rep2 11.93 ± 0.0039 170
rep3 11.93 ± 0.0076 178
CHARACTERISATION- NM 111 – ZINC OXIDE – NM-111 ; 2 g (+/-) 10 mg
Stub name Replicate number SSA (m²/g) BET C-value*
0803 rep1 15.72 ± 0.0483 21
rep2 15.66 ± 0.0413 21
rep3 15.75 ± 0.0443 22
1951 rep1 15.52 ± 0.0466 22
rep2 15.47 ± 0.0437 22
rep3 15.47 ± 0.0472 22
1455 rep1 15.47 ± 0.0462 22
rep2 15.42 ± 0.0415 22
rep3 15.43 ± 0.0493 22
2017 rep1 15.48 ± 0.0479 22
rep2 15.44 ± 0.0454 22
rep3 15.43 ± 0.0479 22
2100 rep1 15.14 ± 0.0485 21
rep2 15.07 ± 0.0437 21
rep3 15.06 ± 0.0428 21
4414 rep1 15.30 ± 0.0467 21
rep2 15.21 ± 0.0459 21
rep3 15.28 ± 0.0414 21
Applicant's summary and conclusion
Conclusions
The results for both samples imply the samples are homogenous, all the results for the repetitions of each
stub have high repeatability and are very close to the mean SSA results for NM111 and NM110: 15.41 ±
0.2005 and 11.96 ± 0.0665 m²/g respectively.
Executive summary
The specific surface area of the NMs was investigated in a study conducted by NPL, 2010 using BET
Multipoint Specific Surface Area (SSA) determination. A Micromeritics TriStar II (3020) was used for
the collection of nitrogen adsorption/desorption isotherm data up to a saturation pressure of
approximately 0.995 P/Po. The analysis was typically conducted to measure 45 adsorption relative
pressure points and 23 desorption relative pressure points. Samples were outgassed overnight in vacuo at
300 degC using a Micromeritics VacPrep apparatus prior to analysis. In order to indicate any possible
microporous nature of the materials additional relative pressure data were also collected at pressures
lower than the usual starting point for analyses using this instrument. These were in the approximate
range 0.005 to 0.01 P/Po. The sample tube dead space was measured for each analysis using helium (CP
grade) thus providing warm and cold freespace values. Samples requiring only BET surface area analysis
were analysed using the same equipment with the application of the same freespace measurement

ENV/JM/MONO(2015)15/PART1
122
technique. BET surface area was calculated using partial pressures in the nominal range 0.07 to 0.25.
The results for both samples imply the samples are homogenous, all the results for the repetitions of each
stub have high repeatability and are very close to the mean SSA results for NM111 and NM110: 15.41 ±
0.2005 and 11.96 ± 0.0665 m²/g respectively.
4.29 Zeta potential
Endpoint study record: WoE_2010-12-03 NPL for PROSPECT Zeta potential
Administrative Data
Study result type experimental result
Reliability 2 (reliable with restrictions)
Rationale for
reliability incl.
deficiencies
The study was regarded as scientifically acceptable. However, only limited documentation of
the data evaluation was provided in the full study reports. Furthermore the procedure for
subsampling and data analysis was not explained in detail. There were some uncertainties
because size was used to evaluate the electroporetic mobility in terms of zeta potential, and
size was not well determined in this equipment. However, these deficiencies were regarded to
have a minor impact on the obtained results.
Data source
Reference
Reference
type
Author Year Title Bibliographic
source
Testing
laboratory
Report
no.
Owner
company
Company
study no.
Report
date
study
report
National
Physical
Laboratory
2010 Zeta-
potential
National
Physical
Laboratory,
Teddington,
Middlesex,
United
Kingdom
2010-
12-03
Data access
data submitter is data owner
Data protection claimed
yes, but willing to share
Materials and methods
Test guideline
Qualifier Guideline Deviations
no guideline followed
Methods
Laser-Doppler (Laser-Doppler-Electrophoresi)
Details on methods and data evaluation
Electrophoretic measurements were obtained using a Zetasizer Nano ZS (Malvern Instruments, UK)
equipped with a 633 nm laser. The reference standard (DTS1230, zeta-potential standard from Malvern)
was used to qualify the performance of the instrument. Sample preparation involved filling of a
disposable capillary cell (DTS1060, Malvern). Prior to their use, these cells were thoroughly cleaned with
ethanol and de-ionised water, as recommended by the instrument vendor. For analysis, the individual cell
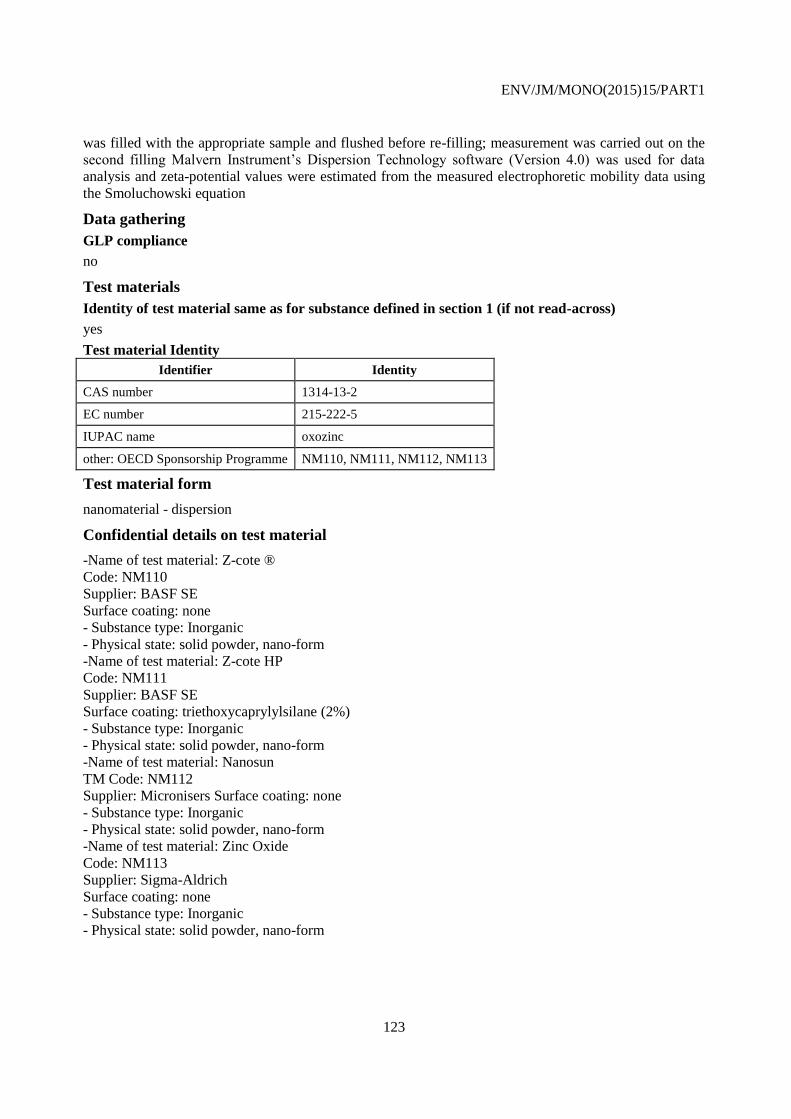
ENV/JM/MONO(2015)15/PART1
123
was filled with the appropriate sample and flushed before re-filling; measurement was carried out on the
second filling Malvern Instrument’s Dispersion Technology software (Version 4.0) was used for data
analysis and zeta-potential values were estimated from the measured electrophoretic mobility data using
the Smoluchowski equation
Data gathering
GLP compliance
no
Test materials
Identity of test material same as for substance defined in section 1 (if not read-across)
yes
Test material Identity
Identifier Identity
CAS number 1314-13-2
EC number 215-222-5
IUPAC name oxozinc
other: OECD Sponsorship Programme NM110, NM111, NM112, NM113
Test material form
nanomaterial - dispersion
Confidential details on test material
-Name of test material: Z-cote ®
Code: NM110
Supplier: BASF SE
Surface coating: none
- Substance type: Inorganic
- Physical state: solid powder, nano-form
-Name of test material: Z-cote HP
Code: NM111
Supplier: BASF SE
Surface coating: triethoxycaprylylsilane (2%)
- Substance type: Inorganic
- Physical state: solid powder, nano-form
-Name of test material: Nanosun
TM Code: NM112
Supplier: Micronisers Surface coating: none
- Substance type: Inorganic
- Physical state: solid powder, nano-form
-Name of test material: Zinc Oxide
Code: NM113
Supplier: Sigma-Aldrich
Surface coating: none
- Substance type: Inorganic
- Physical state: solid powder, nano-form
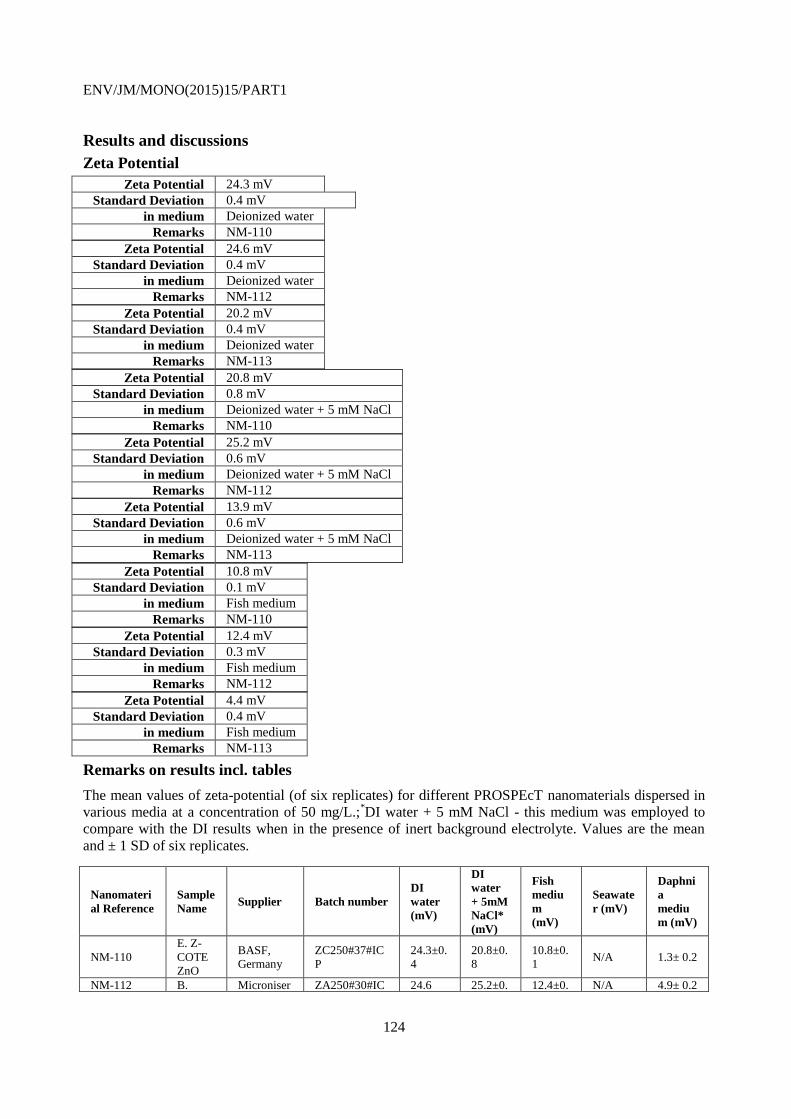
ENV/JM/MONO(2015)15/PART1
124
Results and discussions
Zeta Potential
Zeta Potential 24.3 mV
Standard Deviation 0.4 mV
in medium Deionized water
Remarks NM-110
Zeta Potential 24.6 mV
Standard Deviation 0.4 mV
in medium Deionized water
Remarks NM-112
Zeta Potential 20.2 mV
Standard Deviation 0.4 mV
in medium Deionized water
Remarks NM-113
Zeta Potential 20.8 mV
Standard Deviation 0.8 mV
in medium Deionized water + 5 mM NaCl
Remarks NM-110
Zeta Potential 25.2 mV
Standard Deviation 0.6 mV
in medium Deionized water + 5 mM NaCl
Remarks NM-112
Zeta Potential 13.9 mV
Standard Deviation 0.6 mV
in medium Deionized water + 5 mM NaCl
Remarks NM-113
Zeta Potential 10.8 mV
Standard Deviation 0.1 mV
in medium Fish medium
Remarks NM-110
Zeta Potential 12.4 mV
Standard Deviation 0.3 mV
in medium Fish medium
Remarks NM-112
Zeta Potential 4.4 mV
Standard Deviation 0.4 mV
in medium Fish medium
Remarks NM-113
Remarks on results incl. tables
The mean values of zeta-potential (of six replicates) for different PROSPEcT nanomaterials dispersed in
various media at a concentration of 50 mg/L.;*DI water + 5 mM NaCl - this medium was employed to
compare with the DI results when in the presence of inert background electrolyte. Values are the mean
and ± 1 SD of six replicates.
Nanomateri
al Reference
Sample
Name Supplier Batch number
DI
water
(mV)
DI
water
+ 5mM
NaCl*
(mV)
Fish
mediu
m
(mV)
Seawate
r (mV)
Daphni
a
mediu
m (mV)
NM-110
E. Z-
COTE
ZnO
BASF,
Germany
ZC250#37#IC
P
24.3±0.
4
20.8±0.
8
10.8±0.
1 N/A 1.3± 0.2
NM-112 B. Microniser ZA250#30#IC 24.6 25.2±0. 12.4±0. N/A 4.9± 0.2
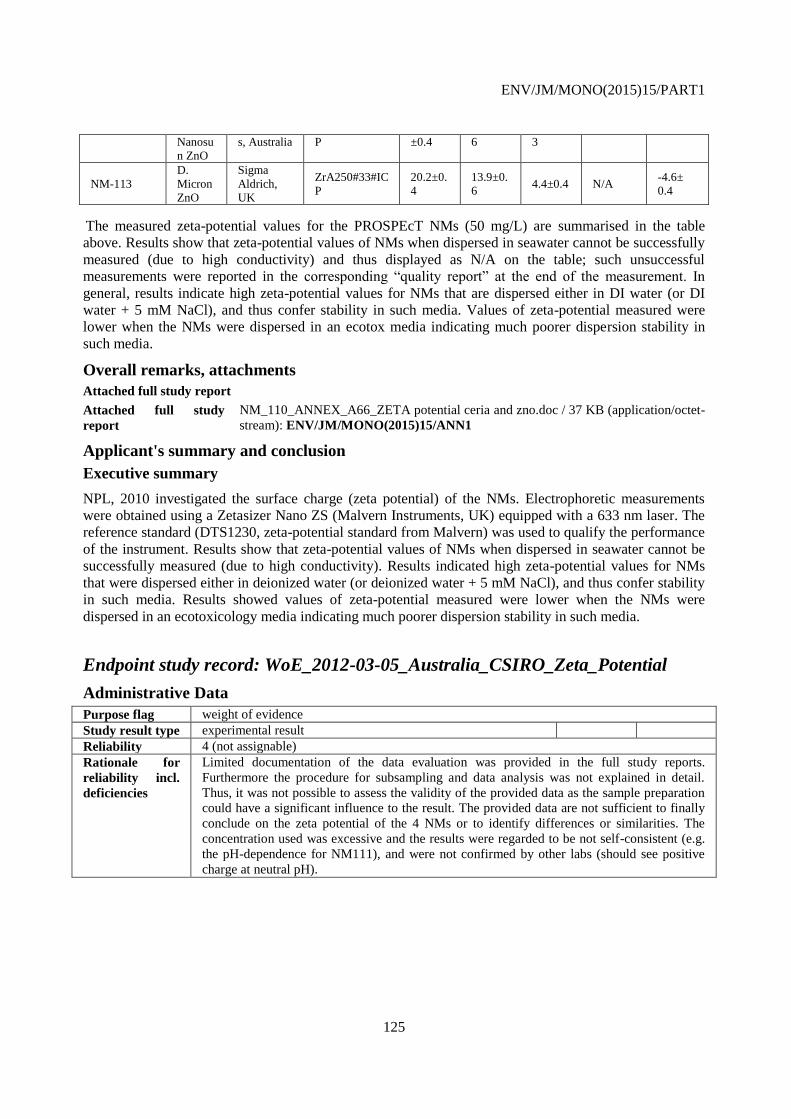
ENV/JM/MONO(2015)15/PART1
125
Nanosu
n ZnO
s, Australia P ±0.4 6 3
NM-113
D.
Micron
ZnO
Sigma
Aldrich,
UK
ZrA250#33#IC
P
20.2±0.
4
13.9±0.
6 4.4±0.4 N/A
-4.6±
0.4
The measured zeta-potential values for the PROSPEcT NMs (50 mg/L) are summarised in the table
above. Results show that zeta-potential values of NMs when dispersed in seawater cannot be successfully
measured (due to high conductivity) and thus displayed as N/A on the table; such unsuccessful
measurements were reported in the corresponding “quality report” at the end of the measurement. In
general, results indicate high zeta-potential values for NMs that are dispersed either in DI water (or DI
water + 5 mM NaCl), and thus confer stability in such media. Values of zeta-potential measured were
lower when the NMs were dispersed in an ecotox media indicating much poorer dispersion stability in
such media.
Overall remarks, attachments
Attached full study report
Attached full study
report
NM_110_ANNEX_A66_ZETA potential ceria and zno.doc / 37 KB (application/octet-
stream): ENV/JM/MONO(2015)15/ANN1
Applicant's summary and conclusion
Executive summary
NPL, 2010 investigated the surface charge (zeta potential) of the NMs. Electrophoretic measurements
were obtained using a Zetasizer Nano ZS (Malvern Instruments, UK) equipped with a 633 nm laser. The
reference standard (DTS1230, zeta-potential standard from Malvern) was used to qualify the performance
of the instrument. Results show that zeta-potential values of NMs when dispersed in seawater cannot be
successfully measured (due to high conductivity). Results indicated high zeta-potential values for NMs
that were dispersed either in deionized water (or deionized water + 5 mM NaCl), and thus confer stability
in such media. Results showed values of zeta-potential measured were lower when the NMs were
dispersed in an ecotoxicology media indicating much poorer dispersion stability in such media.
Endpoint study record: WoE_2012-03-05_Australia_CSIRO_Zeta_Potential
Administrative Data
Purpose flag weight of evidence
Study result type experimental result
Reliability 4 (not assignable)
Rationale for
reliability incl.
deficiencies
Limited documentation of the data evaluation was provided in the full study reports.
Furthermore the procedure for subsampling and data analysis was not explained in detail.
Thus, it was not possible to assess the validity of the provided data as the sample preparation
could have a significant influence to the result. The provided data are not sufficient to finally
conclude on the zeta potential of the 4 NMs or to identify differences or similarities. The
concentration used was excessive and the results were regarded to be not self-consistent (e.g.
the pH-dependence for NM111), and were not confirmed by other labs (should see positive
charge at neutral pH).
ENV/JM/MONO(2015)15/PART1
126
Data source
Reference
Reference
type
Author Year Title Bibliographic
source
Testing
laboratory
Report
no.
Owner
company
Company
study no.
Report
date
study
report
Casey,
Yin,
McCall
2012 Surface
charge
(zeta
potential)
Commonwealth
Scientific and
Industrial
Research
Organisation
2012-
03-05
Data access
data submitter is data owner
Data protection claimed
yes, but willing to share
Materials and methods
Test guideline
Qualifier Guideline Deviations
no guideline followed
Methods
Laser-Doppler (Laser-Doppler-Electrophoresi)
Details on methods and data evaluation
Zeta potentials of samples were determined at different pH values (pH=2, 4, 6, 8 and 10) using a
Brookhaven particle size analyser 90Plus equipped with a 657 nm laser. 10 mg “as-received” ZnO sample
was dispersed in a cuvette containing 3 ml DI water, and the pH was adjusted by adding either 0.1M HCl
or 0.1M NaOH. The cuvette was placed in an ultrasonic bath for 10 seconds and then shaken manually to
ensure good dispersion of particles in the sample. The electrode was inserted into the dispersion and the
Zeta potential at each pH was measured 5 times and an average was determined. The temperature of all
measurements was maintained at 25 °C. The cuvette was thoroughly washed with deionised water after
each measurement.
Data gathering
Instruments
Brookhaven particle size analyser 90Plus equipped with a 657 nm laser
GLP compliance
no
Test materials
Identity of test material same as for substance defined in section 1 (if not read-across)
yes
Test material Identity
Identifier Identity
CAS number 1314-13-2
EC number 215-222-5
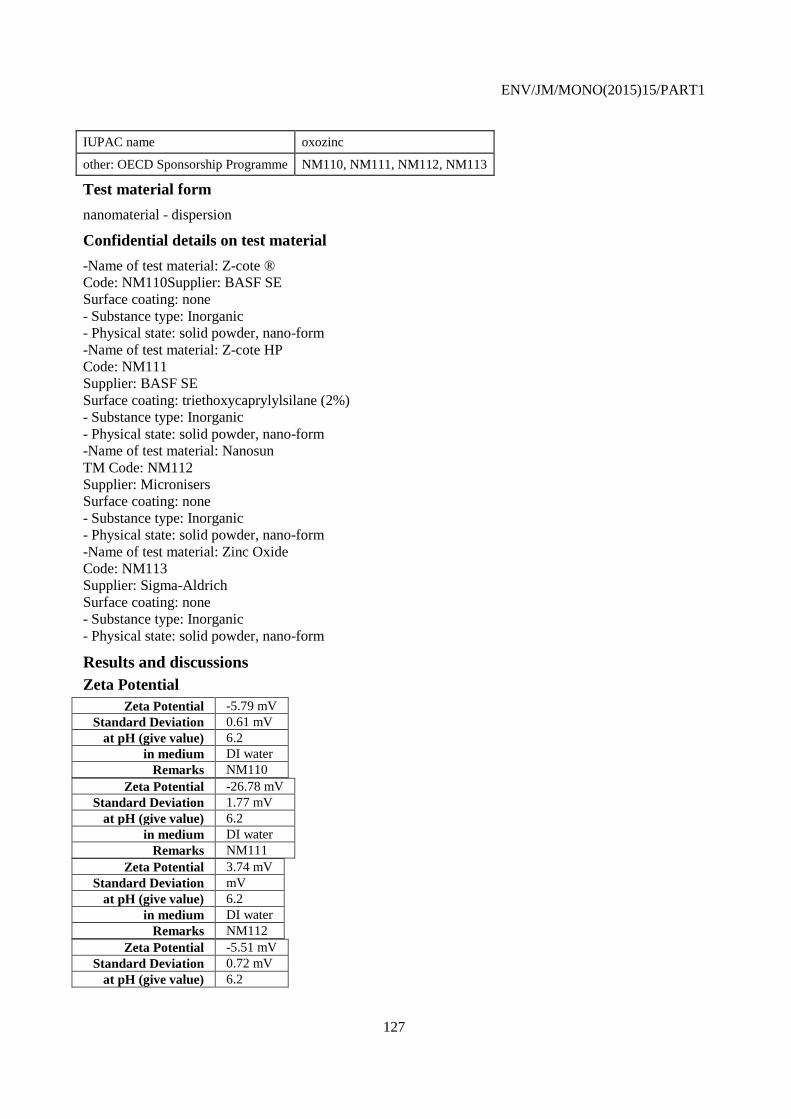
ENV/JM/MONO(2015)15/PART1
127
IUPAC name oxozinc
other: OECD Sponsorship Programme NM110, NM111, NM112, NM113
Test material form
nanomaterial - dispersion
Confidential details on test material
-Name of test material: Z-cote ®
Code: NM110Supplier: BASF SE
Surface coating: none
- Substance type: Inorganic
- Physical state: solid powder, nano-form
-Name of test material: Z-cote HP
Code: NM111
Supplier: BASF SE
Surface coating: triethoxycaprylylsilane (2%)
- Substance type: Inorganic
- Physical state: solid powder, nano-form
-Name of test material: Nanosun
TM Code: NM112
Supplier: Micronisers
Surface coating: none
- Substance type: Inorganic
- Physical state: solid powder, nano-form
-Name of test material: Zinc Oxide
Code: NM113
Supplier: Sigma-Aldrich
Surface coating: none
- Substance type: Inorganic
- Physical state: solid powder, nano-form
Results and discussions
Zeta Potential
Zeta Potential -5.79 mV
Standard Deviation 0.61 mV
at pH (give value) 6.2
in medium DI water
Remarks NM110
Zeta Potential -26.78 mV
Standard Deviation 1.77 mV
at pH (give value) 6.2
in medium DI water
Remarks NM111
Zeta Potential 3.74 mV
Standard Deviation mV
at pH (give value) 6.2
in medium DI water
Remarks NM112
Zeta Potential -5.51 mV
Standard Deviation 0.72 mV
at pH (give value) 6.2

ENV/JM/MONO(2015)15/PART1
128
in medium DI water
Remarks NM113
Isoelectric Point
Isoelectric Point 3.9
in medium deionised water
Remarks NM110
Isoelectric Point 2.7
in medium deionised water
Remarks NM111
Isoelectric Point 6.5
in medium deionised water
Remarks NM112
Isoelectric Point 5.1
in medium deionised
water
Remarks NM113
Remarks on results incl. tables
The table and the figure show the relationship between zeta potential and pH for the four ZnO samples
tested. The pH value at which the net surface charge is zero is called the isoelectrical point (IEP). The
IEPs are 3.9 for NM110, 6.5 for NM112 and 5.1 for NM113. IEPs in the range 4-6 are consistent with the
dissociation of water to H+ and OH- on the particle’s surface and, where there is no surface coating, the
IEP will be due solely to this dissociation. This therefore suggests that there is no specific surface coating
on NM110, NM112 and NM113.
The IEP of NM111 is nominally 2.7, based on the data acquired. This IEP, which is significantly lower
than IEPs determined for the uncoated NM110, NM112 and NM113, is suggestive of a different surface
reaction (other than water dissociation) occurring on the coated NM111. However, NM111 is
hydrophobic and observed to be very difficult to disperse in aqueous solutions; it is difficult to reconcile
this observation with measurements of large zeta potential in water at most pHs. One possible explanation
may be that the zeta potential data pertain to a small portion of the sample that is able to disperse.
Therefore these data on zeta potential for NM111 should not be considered as representative of the
sample, unless supported by other evidence. Table Zeta potentials for ZnO samples dispersed in DI water where the pH was adjusted by adding either 0.1M
HCl or 0.1M NaOH.
pH NM110
Zeta
potential
mV
NM110
SD
NM111
Zeta
potential
mV
NM111
SD
NM112
Zeta
potential
mV
NM112
SD
NM113
Zeta
potential
mV
NM113
SD
2.10 25.04 1.84 14.36 3.01 24.04 1.91 16.94 2.74
4.00 -1.50 0.6 -33.67 2.76 10.20 0.92 5.94 3.1
6.20 -5.79 0.61 -26.78 1.77 3.74 0.56 -5.51 0.72
8.10 -21.63 0.82 -28.20 1.5 -22.00 3.45 -13.50 0.76
10.00 -31.45 0.48 -19.25 1.06 -33.34 0.62 -37.38 1.25
Overall remarks, attachments
Attached full study report
Attached full
study report
NM_110_ANNEX_A67_OECD ZnO Zeta Potential CSIRO Australia.docx / 57.33 KB
(application/octet-stream): ENV/JM/MONO(2015)15/ANN1
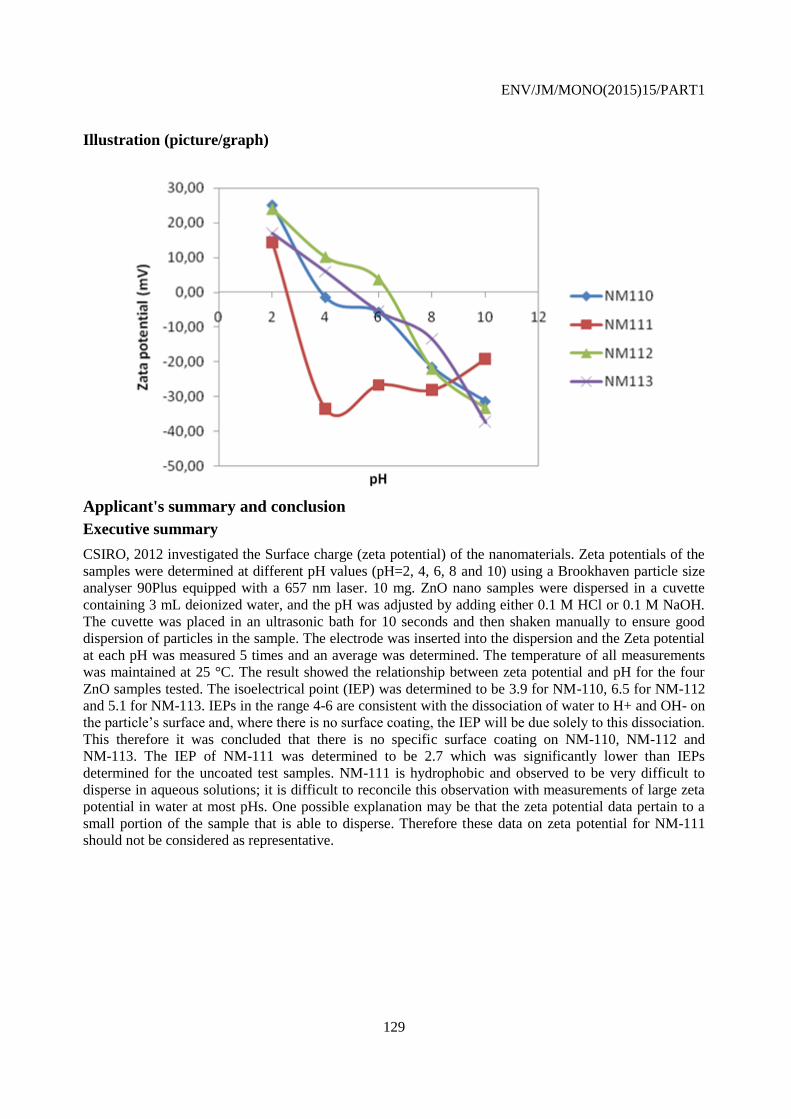
ENV/JM/MONO(2015)15/PART1
129
Illustration (picture/graph)
Applicant's summary and conclusion
Executive summary
CSIRO, 2012 investigated the Surface charge (zeta potential) of the nanomaterials. Zeta potentials of the
samples were determined at different pH values (pH=2, 4, 6, 8 and 10) using a Brookhaven particle size
analyser 90Plus equipped with a 657 nm laser. 10 mg. ZnO nano samples were dispersed in a cuvette
containing 3 mL deionized water, and the pH was adjusted by adding either 0.1 M HCl or 0.1 M NaOH.
The cuvette was placed in an ultrasonic bath for 10 seconds and then shaken manually to ensure good
dispersion of particles in the sample. The electrode was inserted into the dispersion and the Zeta potential
at each pH was measured 5 times and an average was determined. The temperature of all measurements
was maintained at 25 °C. The result showed the relationship between zeta potential and pH for the four
ZnO samples tested. The isoelectrical point (IEP) was determined to be 3.9 for NM-110, 6.5 for NM-112
and 5.1 for NM-113. IEPs in the range 4-6 are consistent with the dissociation of water to H+ and OH- on
the particle’s surface and, where there is no surface coating, the IEP will be due solely to this dissociation.
This therefore it was concluded that there is no specific surface coating on NM-110, NM-112 and
NM-113. The IEP of NM-111 was determined to be 2.7 which was significantly lower than IEPs
determined for the uncoated test samples. NM-111 is hydrophobic and observed to be very difficult to
disperse in aqueous solutions; it is difficult to reconcile this observation with measurements of large zeta
potential in water at most pHs. One possible explanation may be that the zeta potential data pertain to a
small portion of the sample that is able to disperse. Therefore these data on zeta potential for NM-111
should not be considered as representative.
ENV/JM/MONO(2015)15/PART1
130
4.30 Surface chemistry
Endpoint study record: WoE_2012-03-
05_Australia_CSIRO_Surface_Chemistry_XPS
Administrative Data
Purpose flag weight of evidence
Study result type experimental result
Reliability 2 (reliable with restrictions)
Rationale for
reliability incl.
deficiencies
XPS is sensitive to contaminantsThe used XPS method is recommended in the OECD
guideline for the determination of the surface chemistry. However, only limited
documentation of the data evaluation was provided in the full study report. As sample
preparation and the data analysis have a significant influence on the result there are some
concerns on the validity of the data.
Data source
Reference
Reference
type
Author Year Title Bibliographic
source
Testing
laboratory
Report
no.
Owner
company
Company
study no.
Report
date
study
report
Casey,
Yin,
McCall
2012 Summary of
physicochemical
properties of
OECD Zinc
Oxide (ZnO)
samples -
Surface
chemistry
Commonwealth
Scientific and
Industrial
Research
Organisation
2012-
03-05
Data access
data submitter is data owner
Data protection claimed
yes, but willing to share
Materials and methods
Test guideline
Qualifier Guideline Deviations
no guideline followed
Methods
XPS
Details on methods and data evaluation
Individual wells of a powder sample holder were filled with “as received” ZnO samples (1 well per
sample). Samples were analysed using a Kratos HS spectrometer fitted with a monochromated Al
K(alpha) source, under standard conditions. The sampling depth was several nm (~10 nm maximum) and
the analysis area was ~ 0.3 mm × 0.7 mm. Samples were analysed at 2 different times, approximately 2
months apart
ENV/JM/MONO(2015)15/PART1
131
Data gathering
Instruments
Kratos HS spectrometer fitted with a monochromated Al K(alpha) source
GLP compliance
no
Test materials
Identity of test material same as for substance defined in section 1 (if not read-across)
yes
Test material Identity
Identifier Identity
CAS number 1314-13-2
EC number 215-222-5
IUPAC name oxozinc
other: OECD sponsorship programme NM110, NM111, NM112, NM113
Test material form
nanomaterial - powder
Confidential details on test material
-Name of test material: Z-cote ®
Code: NM110
Supplier: BASF SE
Surface coating: none
- Substance type: Inorganic
- Physical state: solid powder, nano-form
-Name of test material: Z-cote HP
Code: NM111Supplier: BASF SE
Surface coating: triethoxycaprylylsilane (2%)
- Substance type: Inorganic
- Physical state: solid powder, nano-form
-Name of test material: Nanosun
TM Code: NM112
Supplier: Micronisers
Surface coating: none
- Substance type: Inorganic
- Physical state: solid powder, nano-form
-Name of test material: Zinc OxideCode: NM113
Supplier: Sigma-Aldrich
Surface coating: none- Substance type: Inorganic
- Physical state: solid powder, nano-form
Results and discussions
Functionalisation
Remarks on results incl. tables
The table presents the average of two data sets obtained 2 months apart. In all samples, zinc, oxygen and
carbon were the major species present, with minor traces of chlorine detected in NM110, NM112 and
NM113 but not NM111. The ratios of Zn:O were near, but not quite, stoichiometric typically with a
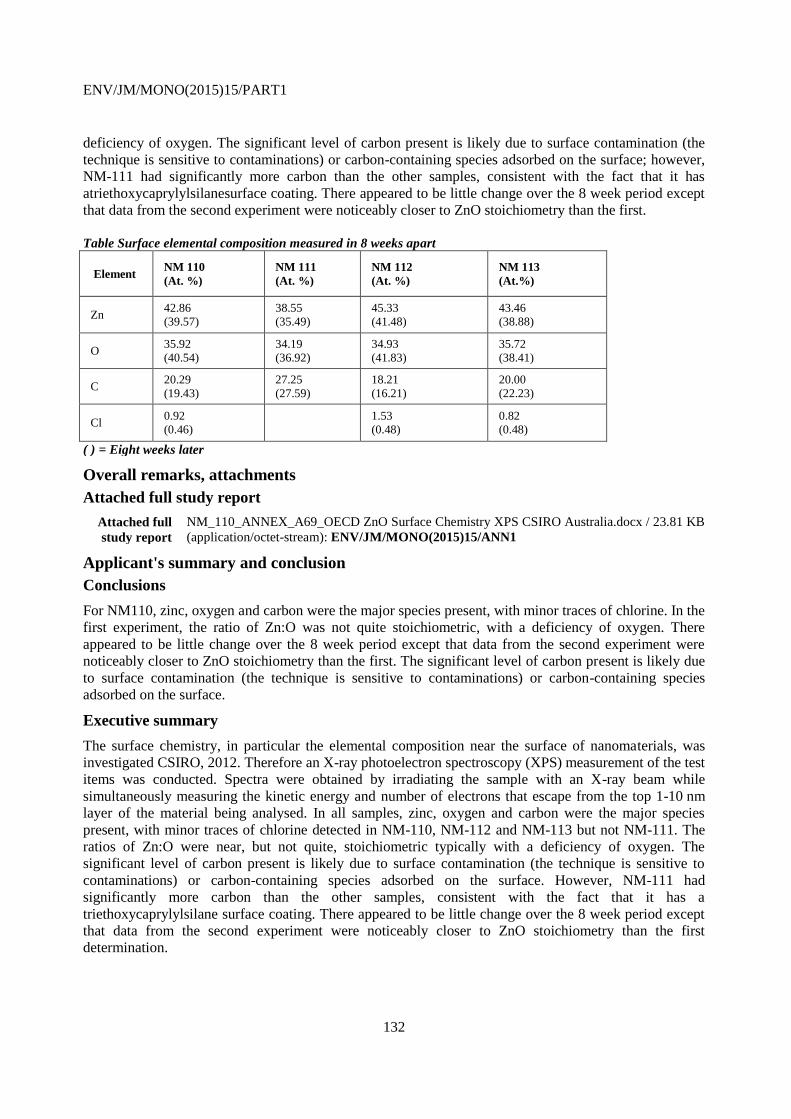
ENV/JM/MONO(2015)15/PART1
132
deficiency of oxygen. The significant level of carbon present is likely due to surface contamination (the
technique is sensitive to contaminations) or carbon-containing species adsorbed on the surface; however,
NM-111 had significantly more carbon than the other samples, consistent with the fact that it has
atriethoxycaprylylsilanesurface coating. There appeared to be little change over the 8 week period except
that data from the second experiment were noticeably closer to ZnO stoichiometry than the first.
Table Surface elemental composition measured in 8 weeks apart
Element NM 110
(At. %)
NM 111
(At. %)
NM 112
(At. %)
NM 113
(At.%)
Zn 42.86
(39.57)
38.55
(35.49)
45.33
(41.48)
43.46
(38.88)
O 35.92
(40.54)
34.19
(36.92)
34.93
(41.83)
35.72
(38.41)
C 20.29
(19.43)
27.25
(27.59)
18.21
(16.21)
20.00
(22.23)
Cl 0.92
(0.46)
1.53
(0.48)
0.82
(0.48)
( ) = Eight weeks later
Overall remarks, attachments
Attached full study report
Attached full
study report
NM_110_ANNEX_A69_OECD ZnO Surface Chemistry XPS CSIRO Australia.docx / 23.81 KB
(application/octet-stream): ENV/JM/MONO(2015)15/ANN1
Applicant's summary and conclusion
Conclusions
For NM110, zinc, oxygen and carbon were the major species present, with minor traces of chlorine. In the
first experiment, the ratio of Zn:O was not quite stoichiometric, with a deficiency of oxygen. There
appeared to be little change over the 8 week period except that data from the second experiment were
noticeably closer to ZnO stoichiometry than the first. The significant level of carbon present is likely due
to surface contamination (the technique is sensitive to contaminations) or carbon-containing species
adsorbed on the surface.
Executive summary
The surface chemistry, in particular the elemental composition near the surface of nanomaterials, was
investigated CSIRO, 2012. Therefore an X-ray photoelectron spectroscopy (XPS) measurement of the test
items was conducted. Spectra were obtained by irradiating the sample with an X-ray beam while
simultaneously measuring the kinetic energy and number of electrons that escape from the top 1-10 nm
layer of the material being analysed. In all samples, zinc, oxygen and carbon were the major species
present, with minor traces of chlorine detected in NM-110, NM-112 and NM-113 but not NM-111. The
ratios of Zn:O were near, but not quite, stoichiometric typically with a deficiency of oxygen. The
significant level of carbon present is likely due to surface contamination (the technique is sensitive to
contaminations) or carbon-containing species adsorbed on the surface. However, NM-111 had
significantly more carbon than the other samples, consistent with the fact that it has a
triethoxycaprylylsilane surface coating. There appeared to be little change over the 8 week period except
that data from the second experiment were noticeably closer to ZnO stoichiometry than the first
determination.
ENV/JM/MONO(2015)15/PART1
133
Endpoint study record: Disregarded_2010-07-02_NPL for
PROSPECT_Surface_chemistry_XPS
Administrative Data
Purpose flag disregarded study
Study result type experimental result
Reliability 3 (not reliable)
Rationale for
reliability incl.
deficiencies
Limited documentation of the data evaluation was provided in the full study report. Thus, it
was not possible to assess the validity of the provided data as the sample preparation and the
data analysis have a significant influence to the result. Due to the contamination on the
particles with carbon the results of the measurements were not reliable and thus were not
taken into account
Data source
Reference
Reference
type
Author Year Title Bibliographic
source
Testing
laboratory
Report
no.
Owner
company
Company
study no.
Report
date
study
report
National
Physical
Laboratory
2010 XPS element
atomic
concentrations
National
Physical
Laboratory,
Teddington,
Middlesex,
United
Kingdom
2010-
07-02
Data access
data submitter is data owner
Data protection claimed
yes, but willing to share
Materials and methods
Test guideline
Qualifier Guideline Deviations
according to other guideline: ISO 15472 no data
Methods
XPS (ISO 15472)
Details on methods and data evaluation
XPS measurements were obtained in ultra high vacuum using a Kratos AXIS Ultra DLD (Kratos
Analytical, UK) instrument fitted with a monochromated Al Kasource, which was operated at 15kV and
5mA emission. Photoelectrons from the top few nanometres of the surface were detected in the normal
emission direction over an analysis area of approximately 700 x 300 micrometres. Spectra in the range
1400 to –10 eV binding energy and a step size of 1 eV, using a pass energy of 160 eV were acquired from
selected areas of each sample. The peak areas were measured after removal of a Tougaard background.
The manufacturer’s intensity calibration and commonly employed sensitivity factors were used to
determine the concentration of the elements present. High resolution narrow scans of some of the peaks of
interest were acquired with a step size of 0.1 eV and 20 eV pass energy. (The manufacturer calibrated the
intensity calibration over the energy range). The energy scale was calibrated according to ISO 15472
Surface chemical analysis – X-ray photoelectron spectrometers – Calibration of energy scales. However,
ENV/JM/MONO(2015)15/PART1
134
the charge neutraliser was used when acquiring the spectra, which shifted the peaks, by several eV. The C
1s hydrocarbon peak (285 eV binding energy) was used to determine the shift for identifying the peaks.
Samples were prepared using carbon adhesive tape to affix them to 1 cm copper squares. Care was taken
to cover the tape with the powders as completely as possible but some samples had better coverage than
others and in a lot of cases there was a signal detected from the tape as well as the powder itself. The tape
contained oxygen and silicon in addition to carbon.
Data gathering
Instruments
Kratos AXIS Ultra DLD (Kratos Analytical, UK) instrument fitted with a monochromated Al Kasource
Calibration
The energy scale was calibrated according to ISO 15472 Surface chemical analysis – X-ray
photoelectronspectrometers – Calibration of energy scales
GLP compliance
no
Test materials
Identity of test material same as for substance defined in section 1 (if not read-across)
yes
Test material Identity
Identifier Identity
CAS number 1314-13-2
EC number 215-222-5
IUPAC name oxozinc
other: OECD Sponsorship Programme NM110, NM111, NM112, NM113
Test material form
nanomaterial - powder
Confidential details on test material
-Name of test material: Z-cote ®
Code: NM110
Supplier: BASF SESurface coating: none
- Substance type: Inorganic
- Physical state: solid powder, nano-form
-Name of test material: Z-cote HP
Code: NM111
Supplier: BASF SE
Surface coating: triethoxycaprylylsilane (2%)
- Substance type: Inorganic
- Physical state: solid powder, nano-form
-Name of test material: Nanosun
TM Code: NM112
Supplier: Micronisers
Surface coating: none
- Substance type: Inorganic
- Physical state: solid powder, nano-form

ENV/JM/MONO(2015)15/PART1
135
-Name of test material: Zinc Oxide
Code: NM113Supplier: Sigma-Aldrich
Surface coating: none
- Substance type: Inorganic
- Physical state: solid powder, nano-form
Overall remarks, attachments
Remarks on results including tables and figures
The elemental composition of the different PROSPEcT powders as measured by XPS is summarised
below, where the elemental concentrations of the elements: carbon (C), cerium (Ce), oxygen (O), silicon
(Si) and zinc (Zn) are shown.As expected, XPS can successfully differentiate between vials containing
cerium and vials containing zinc; and it was observed that no cross contamination had occurred between
the two types of batches within the detection limit of XPS. As evident from the results, there was a
significant contribution of carbon and this can be largely attributed to contamination on the particles.
Areas of best coverage were selected for analysis and, using XPS analysis of the carbon tape alone which
showed a composition of 74% C, 21% O and 5% Si. From the lack of any significant signal from Si on
samples, it was estimated that there was better than 90% coverage within these analysis areas. A different
sample preparation procedure could be adopted to separate background carbon signal from that on the
particles during XPS measurements. XPS results also showed the presence of Si and this was mainly
associated with Z-COTE HP 1 ZnO sample i.e. Si 2s of 3.5%. This can be attributed to the fact that this
sample was coated with triethoxycapryl silane and hence the silicon signal contribution. The silicon
contribution with the Z-COTE of 0.3 % is lower than the estimated detection limit for Si of ~ 0.5% and
can be regarded as lying within the noise level.
Sample
Name Supplier Batch number
C 1s
(%)
O 1s
(%)
Si 2s
(%)
Zn
2p3/2(%)
NM112 Micronisers, Australia ZA250#30#03 64.7 26.9 0.0 8.4
NM111 BASF, Germany ZB250#64#03 67.9 24.3 3.5 4.3
NM113 Sigma Aldrich, UK ZrA250#33#ICP 25.6 44.3 0.0 30.1
NM110 BASF, Germany ZC250#37#03 69.0 25.1 0.3 5.6 XPS element atomic concentrations results of PROSPEcT powders; the powders were spread on to an adhesive
carbon tape.
Attached full study report
Attached full study
report
NM_110_ANNEX_A70_XPS element concentrations.doc / 38 KB (application/octet-
stream): ENV/JM/MONO(2015)15/ANN1
Attached full study
report
NM_110_ANNEX_A02_FINALINTERIM REPORT2010corrected.pdf / 1.05 MB
(application/octet-stream): ENV/JM/MONO(2015)15/ANN6
Applicant's summary and conclusion
Executive summary
A study, which was disregarded, was conducted by NPL, 2010 to determine the elemental composition of
the different nanomaterials as measured by XPS. XPS measurements were obtained in ultra-high vacuum
using a Kratos AXIS Ultra DLD (Kratos Analytical, UK) instrument fitted with a monochromated Al K-
source, which was operated at 15 kV and 5 mA emission. Photoelectrons from the top few nanometers of
the surface were detected in the normal emission direction over an analysis area of approximately 700 x
300 micrometres. Spectra in the range 1400 to –10 eV binding energy and a step size of 1 eV, using a
pass energy of 160 eV were acquired from selected areas of each sample. The peak areas were measured
after removal of a Tougaard background. The manufacturer’s intensity calibration and commonly
employed sensitivity factors were used to determine the concentration of the elements present. High
ENV/JM/MONO(2015)15/PART1
136
resolution narrow scans of some of the peaks of interest were acquired with a step size of 0.1 eV and
20 eV pass energy. (The manufacturer calibrated the intensity calibration over the energy range). The
energy scale was calibrated according to ISO 15472. The charge neutraliser was used when acquiring the
spectra, which shifted the peaks, by several eV. The carbon 1s hydrocarbon peak (285 eV binding energy)
was used to determine the shift for identifying the peaks. Samples were prepared using carbon adhesive
tape to affix them to 1 cm copper squares. Care was taken to cover the tape with the powders as
completely as possible but some samples had better coverage than others and in a lot of cases there were a
signal detected from the tape as well as the powder itself. The tape contained oxygen and silicon in
addition to carbon. As evident from the results, there was a significant contribution of carbon and this can
be largely attributed to contamination on the particles. Areas of best coverage were selected for analysis
and, using XPS analysis of the carbon tape alone which showed a composition of 74% C, 21% O and 5%
Si. Due to the lack of any significant signal from Si on samples, it was estimated that there was a better
than 90 % coverage within these analysis areas. XPS also showed the presence of Si mainly associated
with NM-111 sample i.e. Si 2s of 3.5 %. This can be attributed to the fact that this sample was coated
with triethoxycapryl silane. The silicon contribution with NM-110 of 0.3 % is lower than the estimated
detection limit for Si of ~ 0.5% and can be regarded as within the analytical noise level.
Endpoint study record: Disregarded_2011-12-14_NPL for PROSPECT_ToF
SIMS
Administrative Data
Purpose flag disregarded study
Study result type experimental result
Reliability 3 (not reliable)
Rationale for
reliability incl.
deficiencies
In the study report, it was concluded that XPS technique provides a more informative and quantitative
chemical analysis of the NMs as the ToF-SIMS method has significant deficits at the moment. Thus,
the provided data were regarded as unreliable and were not taken into account.
Data source
Reference
Reference
type
Author Year Title Bibliographic
source
Testing
laboratory
Report
no.
Owner
company
Company
study no.
Report
date
study
report
National
Physical
Laboratory
2011 Characterization
of PROSPEcT
samples by
ToF-SIMS
National
Physical
Laboratory,
Teddington,
Middlesex,
United
Kingdom
2011-
12-14
Data access
data submitter is data owner
Data protection claimed
yes, but willing to share
Materials and methods
Test guideline
Qualifier Guideline Deviations
no guideline followed
Methods
SIMS (ToF SIMS)
ENV/JM/MONO(2015)15/PART1
137
Details on methods and data evaluation
The ToF-SIMS instrument utilized for this work is an IONTOF (Germany) ToF-SIMS IV. ToF-SIMS
analysis was performed with a Bi+ cluster primary beam (incident at 45° from the sample normal with an
energy of 25 keV) to obtain high mass resolution mass spectra with an imaging resolution of
approximately 5 μm. The ion beam is rastered over an area of 500 μm × 500 μm using a 256 × 256 pixel
raster. The ion beam current was measured before and after each sample was analysed. The raw data that
was recorded consisted of a ToF-SIMS mass spectrum at every pixel. Data analysis was carried out
retrospectively from the raw data using ION-TOF SurfaceLab 6.1 software
Data gathering
Instruments
IONTOF
Calibration
The instrument is periodically checked for repeatability and constancy of the relative intensity scale using
ISO 23830:2008. The mass scale is calibrated following ISO/DIS 13084. The spatial scales are calibrated
using metal grids with spacings of 25 μm and 125 μm.
GLP compliance
no
Test materials
Identity of test material same as for substance defined in section 1 (if not read-across)
yes
Test material Identity
Test material form
nanomaterial - powder
Confidential details on test material
-Name of test material: Z-cote ®
Code: NM110
Supplier: BASF SE
Surface coating: none
- Substance type: Inorganic
- Physical state: solid powder, nano-form
-Name of test material: Z-cote HP
Code: NM111
Supplier: BASF SE
Surface coating: triethoxycaprylylsilane (2%)
- Substance type: Inorganic
- Physical state: solid powder, nano-form
-Name of test material: Nanosun
TM Code: NM112
Identifier Identity
CAS number 1314-13-2
EC number 215-222-5
IUPAC name oxozinc
other: OECD Sponsorship Programme NM110, NM111, NM112, NM113
ENV/JM/MONO(2015)15/PART1
138
Supplier: Micronisers
Surface coating: none
- Substance type: Inorganic
- Physical state: solid powder, nano-form
-Name of test material: Zinc Oxide
Code: NM113
Supplier: Sigma-Aldrich
Surface coating: none
- Substance type: Inorganic
- Physical state: solid powder, nano-form
Results and discussions
Functionalisation
Remarks on results incl. tables
Effect of sample topography Assessment of sample preparation protocol for Tof-SIMS analysis performed on ZnO nanoparticles.
Enlargement of the spectrum showing the 69Zn+ peak. The spectrum exhibits a satellite peak shifted
0.045 mass units from the Zn+ peak.
Region-of-interest ToF-SIMS spectra, regenerated from two areas of the image which are shown in the
inset. This shows that the higher intensity peak (red) originates from the central area of the sample, and
the shifted peak (blue) originates from the bright area surrounded by dark circular regions. Similar
features are observed on other samples and is a typical artefact due to sample topography.
As expected, a 69Zn+ peak is observed at 69.93 u in the mass spectra. However, it was also observed an
unknown satellite peak whose apparent mass was 0.045 u higher than the 69Zn+ peak. A detailed data
analysis was performed to elucidate the origin of the two peaks. The total ion image, reveals significant
spatial inhomoegenity on the sample. It was found that the two peaks originate from different regions of
the sample. The higher intensity peak originates from the flat central area, while the shifted peak
originates from a bright area which is surrounded by a dark circular region. Similar effects were observed
for other peaks associated to the nanoparticles, both on this and other samples. This effect was interpreted
as an instrumental artefact due to sample topography. The peak marked in red is associated to regions of
the sample where the nanoparticle powder forms a relatively flat film on the adhesive tape. The bright
areas which are surrounded by circular dark regions are interpreted as a large aggregation of nanoparticles
(> 100 μm) on the surface of the sample. Due to topography effects, secondary ions from the top of the
aggregate particle are detected with a delayed time-of-flight (higher apparent mass) compared to
secondary ions from the flat areas of the sample. These peaks are also broadened and have poorer mass
resolution compared to peaks from the flat area, due to the larger spread in ion time-of-flight. The
aggregate is also surrounded by dark areas where the topographic effects prevent the secondary ions from
reaching the mass spectrometer. For these reasons, for the purpose of this study, only signals originating
from the flat areas of the samples were considered in the analysis of the ZnO powders.
Chemical analysis of nanopowders The spectrum of each nanopowder sample was compared against that of the carbon tape. In addition to
the peaks characteristic for the carbon tape, the nanopowder samples exhibited peaks that were related to
the elemental composition of the nanopowders. ZnO nanopowder samples exhibited mainly peaks
associated with Zn and O and their isotopes (Figure 2C). In addition to H and C contaminants, N was also
observed (Figure 2D). It is interesting to note that some of the peaks associated with the presence of CH3
groups are low for Sample C (Figure 2D). This sample is the Z-cote HP1 nanoparticles, which according
to the manufacturer (BASF) has a triethoxycaprylylsilane coating at the surface. It is possible that CH3
groups are characteristic of the surface of uncoated ZnO nanoparticles. However, the silicone shell could
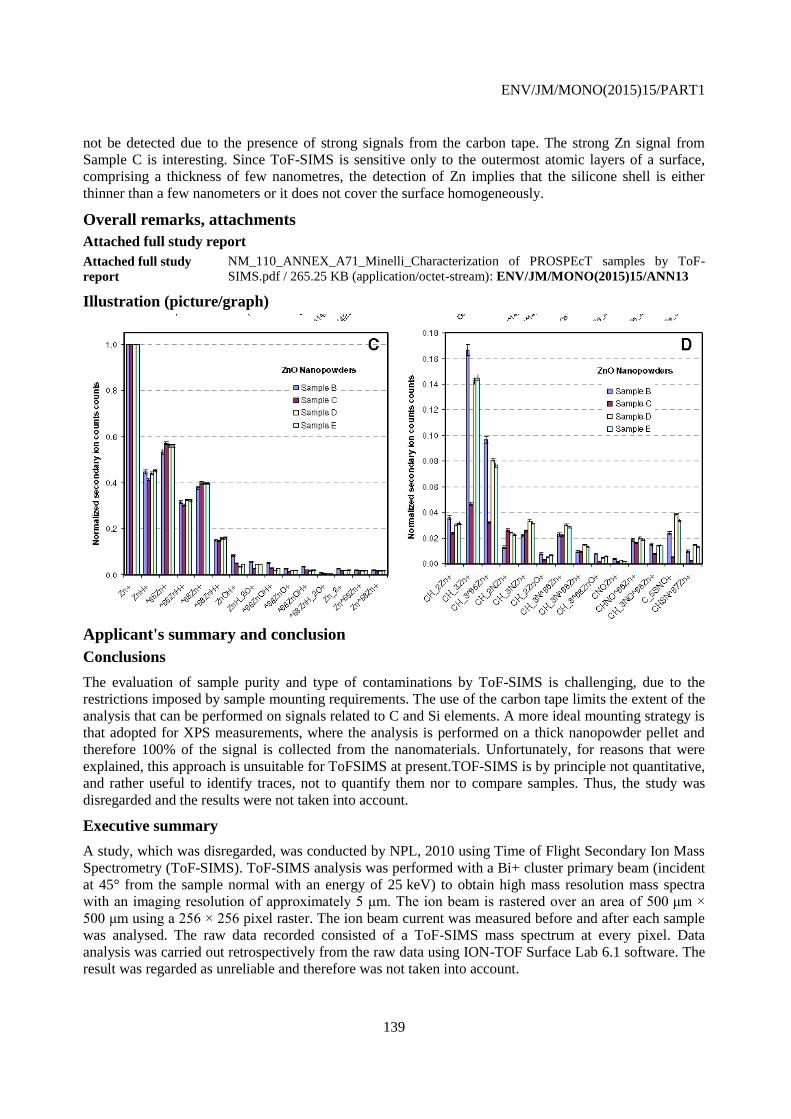
ENV/JM/MONO(2015)15/PART1
139
not be detected due to the presence of strong signals from the carbon tape. The strong Zn signal from
Sample C is interesting. Since ToF-SIMS is sensitive only to the outermost atomic layers of a surface,
comprising a thickness of few nanometres, the detection of Zn implies that the silicone shell is either
thinner than a few nanometers or it does not cover the surface homogeneously.
Overall remarks, attachments
Attached full study report
Attached full study
report
NM_110_ANNEX_A71_Minelli_Characterization of PROSPEcT samples by ToF-
SIMS.pdf / 265.25 KB (application/octet-stream): ENV/JM/MONO(2015)15/ANN13
Illustration (picture/graph)
Applicant's summary and conclusion
Conclusions
The evaluation of sample purity and type of contaminations by ToF-SIMS is challenging, due to the
restrictions imposed by sample mounting requirements. The use of the carbon tape limits the extent of the
analysis that can be performed on signals related to C and Si elements. A more ideal mounting strategy is
that adopted for XPS measurements, where the analysis is performed on a thick nanopowder pellet and
therefore 100% of the signal is collected from the nanomaterials. Unfortunately, for reasons that were
explained, this approach is unsuitable for ToFSIMS at present.TOF-SIMS is by principle not quantitative,
and rather useful to identify traces, not to quantify them nor to compare samples. Thus, the study was
disregarded and the results were not taken into account.
Executive summary
A study, which was disregarded, was conducted by NPL, 2010 using Time of Flight Secondary Ion Mass
Spectrometry (ToF-SIMS). ToF-SIMS analysis was performed with a Bi+ cluster primary beam (incident
at 45° from the sample normal with an energy of 25 keV) to obtain high mass resolution mass spectra
with an imaging resolution of approximately 5 μm. The ion beam is rastered over an area of 500 μm ×
500 μm using a 256 × 256 pixel raster. The ion beam current was measured before and after each sample
was analysed. The raw data recorded consisted of a ToF-SIMS mass spectrum at every pixel. Data
analysis was carried out retrospectively from the raw data using ION-TOF Surface Lab 6.1 software. The
result was regarded as unreliable and therefore was not taken into account.
ENV/JM/MONO(2015)15/PART1
140
Endpoint study record: WoE_2010_12_06_NPL for
PROSPECT_Homogeneity_NM110-4899_XPS
Administrative Data
Purpose flag weight of evidence
Study result type experimental result
Reliability 2 (reliable with restrictions)
Rationale for reliability
incl. deficiencies
The study was not conducted in compliance with GLP. The results are scientifically
acceptable. Thus, the study was regarded as reliable with restrictions.
Data source
Reference
Reference
type
Author Year Title Bibliographic
source
Testing
laboratory
Report
no.
Owner
company
Company
study no.
Report
date
study
report
National
Physical
Laboratory
2010 National
Physical
Laboratory,
Teddington,
Middlesex,
United Kingdom
2010-
12-06
Data access
data submitter is data owner
Data protection claimed
yes, but willing to share
Materials and methods
Test guideline
Qualifier Guideline Deviations
no guideline followed
Methods
XPS
Principles of method if other than guideline
XPS measurements were obtained in ultra high vacuum using a Kratos AXIS Ultra DLD (Kratos
Analytical, UK) instrument fitted with a monochromated Al Kasource, which was operated at 15kV and
5mA emission. Photoelectrons from the top few nanometres of the surface were detected in the normal
emission direction over an analysis area of approximately 700 x 300 micrometres. Spectra in the range
1400 to –10 eV binding energy and a step size of 1 eV, using a pass energy of 160 eV were acquired from
selected areas of each sample. The peak areas were measured after removal of a Tougaard background.
The manufacturer’s intensity calibration and commonly employed sensitivity factors were used to
determine the concentration of the elements present. High resolution narrow scans of some of the peaks of
interest were acquired with a step size of 0.1 eV and 20 eV pass energy. (The manufacturer calibrated the
intensity calibration over the energy range). The energy scale was calibrated according to ISO 15472
Surface chemical analysis – X-ray photoelectron spectrometers – Calibration of energy scales. However,
the charge neutraliser was used when acquiring the spectra, which shifted the peaks, by several eV. The C
1s hydrocarbon peak (285 eV binding energy) was used to determine the shift for identifying the peaks.
Samples were prepared using carbon adhesive tape to affix them to 1 cm copper squares. Care was taken
to cover the tape with the powders as completely as possible but some samples had better coverage than
others and in a lot of cases there was a signal detected from the tape as well as the powder itself. The tape
ENV/JM/MONO(2015)15/PART1
141
contained oxygen and silicon in addition to carbon.
Data gathering
Instruments
Instruments: Kratos AXIS Ultra DLD (Kratos Analytical, UK)Calibration: The manufacturer’s intensity
calibration
GLP compliance
no
Test materials
Test material Identity
Identifier Identity
CAS number 1314-13-2
EC number 215-222-5
IUPAC name oxozinc
other: OECD sponsorship programme NM110, NM111
Test material form
nanomaterial - powder
Confidential details on test material
-Name of test material: Z-cote ®
Code: NM110
Supplier: BASF SE
Surface coating: none
- Substance type: Inorganic
- Physical state: solid powder, nano-form
-Name of test material: Z-cote HP
Code: NM111
Supplier: BASF SE
Surface coating: triethoxycaprylylsilane (2%)
- Substance type: Inorganic
- Physical state: solid powder, nano-form
Results and discussions
Functionalisation
Remarks on results incl. tables
The table shows the elemental compositions of the sub-sampled BASF powders for: a) Z-COTE and b) Z-
COTE HP 1. The powders are adhered on to an (adhesive) carbon tape, in which the elemental
composition of the tape was shown to be (atomic %) 74.3% C, 20.9% O, 4.8% Si. It is clear from the
table of results that there is significant carbon and oxygen signal for both Z-COTE and Z-COTE HP1,
which potentially originates from the carbon tape on which the NMs were fixed. Although the area
(analysis area of ~ 700 x 300 µm, with information depth of ~ 8nm) was carefully chosen to obtain
maximum particle coverage, it is clear that the carbon and oxygen tape background signal is contributing
towards the XPS signal. Nonetheless, we can deduce clear significant difference in the XPS results
between the two sets of vials, which are as follows:
a) The count rate of Zn peaks were always lower from Z-COTE HP 1 samples vs. Z-COTE samples i.e. 4
to 11.5 kcps and 19 to 23 kcps, respectively. This can be attributed to the presence of a triethoxycarpryl
silane coating associated with Z-COTE HP 1 samples.
ENV/JM/MONO(2015)15/PART1
142
b) The Si level is much higher (3.1 to 4.1 %) in Z-COTE HP 1 if compared to Z-COTE (0 to ~1%). This
is consistent with the presence of a silane coating with the former sample. The silicon signal contribution
(of less than 1%) can be attributed to silicon background signal from the fixing tape.
XPS results for JRC sub-sampled powders for: a) BASF Z-COTE (NM-110) and b) Z-COTE HP 1 (NM-
111). Replicates: 1 vial, 1 replicate per vial.
NM-110/atomic%
Sample batch C 1s% O 1s% Si 2s% Zn 2p3/2%
NM110-4899 57.7 29.8 1.0 11.5
NM110-2617 45.7 35.2 0.2 18.9
NM110-1866 43.8 36.2 0.0 19.9
NM110-3795 35.7 39.7 0.0 24.7
NM110-0286 38.0 38.8 0.0 23.1
NM110-0305 36.0 39.6 0.0 24.4
NM-111/atomic%
Sample batch C 1s% O 1s% Si 2s% Zn 2p3/2%
NM111-4825 59.1 28.3 3.4 9.2
NM111-2419 68.6 23.7 3.9 3.9
NM111-1869 70.6 23.2 3.5 2.7
NM111-4779 67.7 24.3 3.8 4.1
NM111-1017 57.7 28.4 4.1 9.7
NM111-3396 70.2 23.3 3.4 3.1
NM111-0486 72.8 22.3 3.4 1.5
Overall remarks, attachments
Attached full study report
Attached full study
report
NM_110_ANNEX_A06_Homogeneity testing using XPS.doc / 40 KB (application/octet-
stream): ENV/JM/MONO(2015)15/ANN1
Applicant's summary and conclusion
Conclusions
The count rate of Zn peaks were always lower from NM-111 samples vs. NM-110 samples i.e. 4 to 11.5
kcps and 19 to 23 kcps, respectively. This was attributed to the presence of a triethoxycarpryl silane
coating associated with NM-111 samples. Furthermore the Si level was much higher (3.1 to 4.1 %) in
NM-111 1 if compared to NM-110 (0 to ~1%). This was consistent with the presence of a silane coating
with the former sample. The silicon signal contribution (of less than 1%) can be attributed to silicon
background signal from the fixing tape.
Executive summary
NPL, 2010 determined the elemental composition of the different nanomaterials as measured by XPS.
XPS measurements were obtained in ultra high vacuum using a Kratos AXIS Ultra DLD (Kratos
Analytical, UK) instrument fitted with a monochromated Al Kasource, which was operated at 15kV and
5mA emission. Photoelectrons from the top few nanometres of the surface were detected in the normal
emission direction over an analysis area of approximately 700 x 300 micrometres. Spectra in the range
1400 to –10 eV binding energy and a step size of 1 eV, using a pass energy of 160 eV were acquired from
selected areas of each sample. The peak areas were measured after removal of a Tougaard background.
The manufacturer’s intensity calibration and commonly employed sensitivity factors were used to
determine the concentration of the elements present. High resolution narrow scans of some of the peaks of
interest were acquired with a step size of 0.1 eV and 20 eV pass energy. (The manufacturer calibrated the
intensity calibration over the energy range). The energy scale was calibrated according to ISO 15472
ENV/JM/MONO(2015)15/PART1
143
Surface chemical analysis – X-ray photoelectron spectrometers – Calibration of energy scales. However,
the charge neutraliser was used when acquiring the spectra, which shifted the peaks, by several eV. The C
1s hydrocarbon peak (285 eV binding energy) was used to determine the shift for identifying the peaks.
Samples were prepared using carbon adhesive tape to affix them to 1 cm copper squares. Care was taken
to cover the tape with the powders as completely as possible but some samples had better coverage than
others and in a lot of cases there was a signal detected from the tape as well as the powder itself. The tape
contained oxygen and silicon in addition to carbon.
The elemental compositions of the sub-sampled BASF powders for: a) Z-COTE and b) Z-COTE HP
1. The powders were adhered on to an (adhesive) carbon tape, in which the elemental composition of the
tape was shown to be (atomic %) 74.3% C, 20.9% O, 4.8% Si. It is clear from the table of results that
there is significant carbon and oxygen signal for both Z-COTE and Z-COTE HP1, which potentially
originates from the carbon tape on which the NMs were fixed. Although the area (analysis area of ~ 700 x
300 µm, with information depth of ~ 8nm) was carefully chosen to obtain maximum particle coverage, it
is clear that the carbon and oxygen tape background signal is contributing towards the XPS signal.
Nonetheless, it was deduced a clear significant difference in the XPS results between the two sets of vials
The count rate of Zn peaks were always lower from NM-111 samples vs. NM-110 samples i.e. 4 to 11.5
kcps and 19 to 23 kcps, respectively. This was attributed to the presence of a triethoxycarpryl silane
coating associated with NM-111 samples. Furthermore the Si level was much higher (3.1 to 4.1 %) in
NM-111 1 if compared to NM-110 (0 to ~1%). This was consistent with the presence of a silane coating
with the former sample. The silicon signal contribution (of less than 1%) can be attributed to silicon
background signal from the fixing tape.
Endpoint study record: WoE_2010_12_06_NPL for
PROSPECT_Homogeneity_NM110-2617_XPS
Administrative Data
Purpose flag weight of evidence
Study result type experimental result
Reliability 2 (reliable with restrictions)
Rationale for reliability
incl. deficiencies
The study was not conducted in compliance with GLP. The results are scientifically
acceptable. Thus, the study was regarded as reliable with restrictions.
Data source
Reference
Reference
type
Author Year Title Bibliographic
source
Testing
laboratory
Report
no.
Owner
company
Company
study no.
Report
date
study
report
National
Physical
Laboratory
2010 Homogeneity
NM110-2617
XPS
National
Physical
Laboratory,
Teddington,
Middlesex,
United
Kingdom
2010-
12-06
Data access
data submitter is data owner
Data protection claimed
yes
ENV/JM/MONO(2015)15/PART1
144
Materials and methods
Test guideline
Qualifier Guideline Deviations
no guideline followed
Methods
XPS
Principles of method if other than guideline
XPS measurements were obtained in ultra high vacuum using a Kratos AXIS Ultra DLD (Kratos
Analytical, UK) instrument fitted with a monochromated Al Ksource, which was operated at 15kV and
5mA emission. Photoelectrons from the top few nanometres of the surface were detected in the normal
emission direction over an analysis area of approximately 700 x 300 micrometres. Spectra in the range
1400 to –10 eV binding energy and a step size of 1 eV, using a pass energy of 160 eV were acquired from
selected areas of each sample. The peak areas were measured after removal of a Tougaard background.
The manufacturer’s intensity calibration and commonly employed sensitivity factors were used to
determine the concentration of the elements present. High resolution narrow scans of some of the peaks of
interest were acquired with a step size of 0.1 eV and 20 eV pass energy. (The manufacturer calibrated the
intensity calibration over the energy range). The energy scale was calibrated according to ISO 15472
Surface chemical analysis – X-ray photoelectron spectrometers – Calibration of energy scales. However,
the charge neutraliser was used when acquiring the spectra, which shifted the peaks by several eV. The C
1s hydrocarbon peak (285 eV binding energy) was used to determine the shift for identifying the
peaks.The pellets of the sample powders were produced using the KBr Quick Press pellet presser. The
powder was loaded from half to ¾ filled and gently pressed before the 3 pieces were inserted into the
socket of the pellet maker. The handle was carefully pressed until some resistance was felt, and when
pressed downwards there was ~ 1. 5 cm gap between the stop-screw on the handle to the central body.
After a few minutes the handle was released, and pressure re-applied twice more until the presser clicked
three times in total. The 3 piece assembly was taken out and the pellet removed.
Data gathering
GLP compliance
no
Test materials
Identity of test material same as for substance defined in section 1 (if not read-across)
yes
Test material Identity
Identifier Identity
CAS number 1314-13-2
EC number 215-222-5
IUPAC name oxozinc
other: OECD sponsorship programme NM110, NM111, Nm112, NM113
Test material form
nanomaterial - powder
Confidential details on test material
-Name of test material: Z-cote ®
Code: NM110Supplier: BASF SE
Surface coating: none

ENV/JM/MONO(2015)15/PART1
145
- Substance type: Inorganic
- Physical state: solid powder, nano-form
-Name of test material: Z-cote HP
Code: NM111
Supplier: BASF SE
Surface coating: triethoxycaprylylsilane (2%)
- Substance type: Inorganic
- Physical state: solid powder, nano-form
-Name of test material: Nanosun
TM Code: NM112
Supplier: Micronisers
Surface coating: none
- Substance type: Inorganic
- Physical state: solid powder, nano-form
-Name of test material: Zinc Oxide
Code: NM113
Supplier: Sigma-Aldrich
Surface coating: none- Substance type: Inorganic- Physical state: solid powder, nano-form
Results and discussions
Functionalisation
Remarks on results incl. tables
Showing the elemental compositions from the NM111 ZnO HP1 sample as determined by XPS. Stub name replicate number C 1s % O 1s % Si 2s % Zn 2p3/2 %
0803 rep1 21.5 44.0 1.8 32.6
21.9 43.8 1.9 32.4
rep2 24.8 41.5 2.0 31.8
25.5 41.3 1.5 31.7
rep3 25.5 41.3 1.5 31.6
25.9 40.7 1.9 31.5
1951 rep1 31.2 37.1 1.4 30.3
rep2 29.2 39.0 1.7 30.1
rep3 29.9 38.5 2.0 29.7
1455 rep1 31.5 37.2 1.6 29.7
rep2 30.5 38.1 1.1 30.3
rep3 32.0 36.9 1.4 29.6
2017 rep1 29.6 38.6 1.8 30.0
rep2 30.1 38.0 1.6 30.3
rep3 30.4 37.8 2.2 29.6
2100 rep1 30.3 37.6 1.6 30.5
rep2 31.8 36.6 1.8 29.7
rep3 31.5 37.0 1.2 30.3
30.0 37.9 1.6 30.5
4414 rep1 31.1 37.6 1.2 30.1
31.7 36.9 1.6 29.8
rep2 28.2 39.4 2.0 30.5
29.0 38.9 1.9 30.1
rep3 29.2 38.4 2.2 30.2
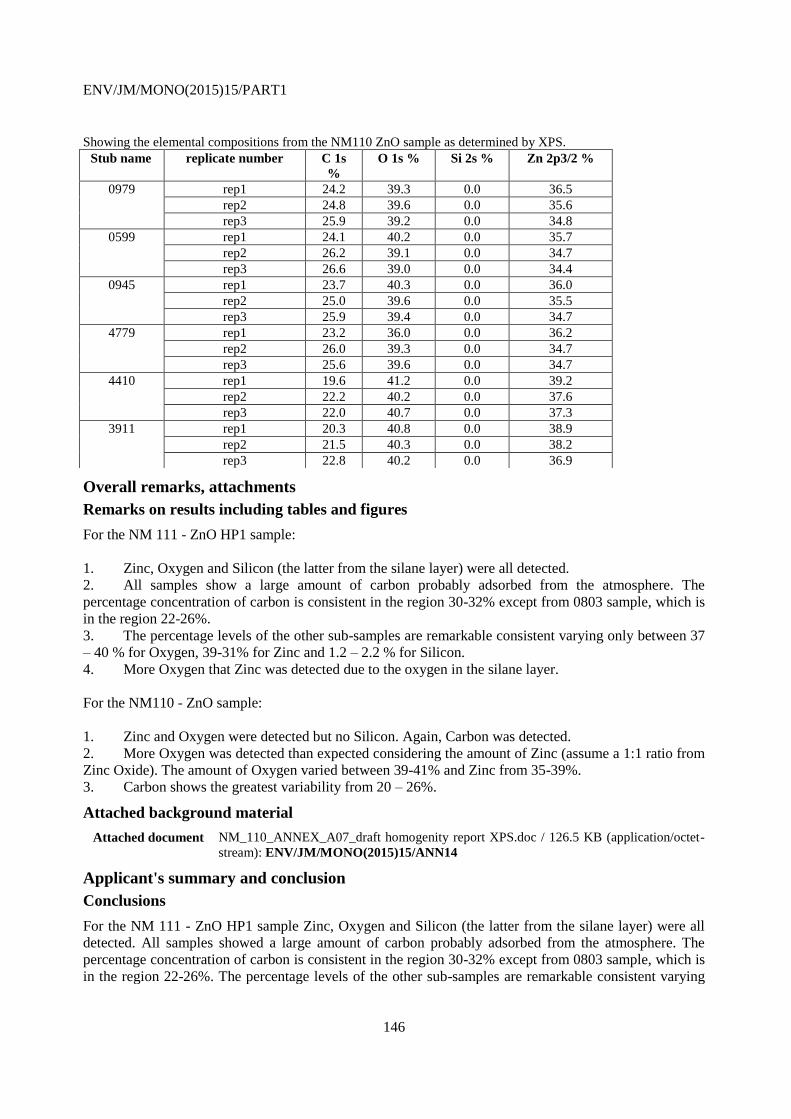
ENV/JM/MONO(2015)15/PART1
146
Showing the elemental compositions from the NM110 ZnO sample as determined by XPS. Stub name replicate number C 1s
%
O 1s % Si 2s % Zn 2p3/2 %
0979 rep1 24.2 39.3 0.0 36.5
rep2 24.8 39.6 0.0 35.6
rep3 25.9 39.2 0.0 34.8
0599 rep1 24.1 40.2 0.0 35.7
rep2 26.2 39.1 0.0 34.7
rep3 26.6 39.0 0.0 34.4
0945 rep1 23.7 40.3 0.0 36.0
rep2 25.0 39.6 0.0 35.5
rep3 25.9 39.4 0.0 34.7
4779 rep1 23.2 36.0 0.0 36.2
rep2 26.0 39.3 0.0 34.7
rep3 25.6 39.6 0.0 34.7
4410 rep1 19.6 41.2 0.0 39.2
rep2 22.2 40.2 0.0 37.6
rep3 22.0 40.7 0.0 37.3
3911 rep1 20.3 40.8 0.0 38.9
rep2 21.5 40.3 0.0 38.2
rep3 22.8 40.2 0.0 36.9
Overall remarks, attachments
Remarks on results including tables and figures
For the NM 111 - ZnO HP1 sample:
1. Zinc, Oxygen and Silicon (the latter from the silane layer) were all detected.
2. All samples show a large amount of carbon probably adsorbed from the atmosphere. The
percentage concentration of carbon is consistent in the region 30-32% except from 0803 sample, which is
in the region 22-26%.
3. The percentage levels of the other sub-samples are remarkable consistent varying only between 37
– 40 % for Oxygen, 39-31% for Zinc and 1.2 – 2.2 % for Silicon.
4. More Oxygen that Zinc was detected due to the oxygen in the silane layer.
For the NM110 - ZnO sample:
1. Zinc and Oxygen were detected but no Silicon. Again, Carbon was detected.
2. More Oxygen was detected than expected considering the amount of Zinc (assume a 1:1 ratio from
Zinc Oxide). The amount of Oxygen varied between 39-41% and Zinc from 35-39%.
3. Carbon shows the greatest variability from 20 – 26%.
Attached background material
Attached document NM_110_ANNEX_A07_draft homogenity report XPS.doc / 126.5 KB (application/octet-
stream): ENV/JM/MONO(2015)15/ANN14
Applicant's summary and conclusion
Conclusions
For the NM 111 - ZnO HP1 sample Zinc, Oxygen and Silicon (the latter from the silane layer) were all
detected. All samples showed a large amount of carbon probably adsorbed from the atmosphere. The
percentage concentration of carbon is consistent in the region 30-32% except from 0803 sample, which is
in the region 22-26%. The percentage levels of the other sub-samples are remarkable consistent varying
ENV/JM/MONO(2015)15/PART1
147
only between 37 – 40 % for Oxygen, 39-31% for Zinc and 1.2 – 2.2 % for Silicon. More Oxygen that
Zinc was detected due to the oxygen in the silane layer.For the NM110 - ZnO sample Zinc and Oxygen
were detected but no Silicon. In addition, Carbon was detected. More Oxygen was detected than expected
considering the amount of Zinc (assume a 1:1 ratio from Zinc Oxide). The amount of Oxygen varied
between 39-41% and Zinc from 35-39%.Carbon shows the greatest variability from 20 – 26%.
Executive summary
NPL, 2010 determined the elemental composition of the different nanomaterials as measured by XPS.
XPS measurements were obtained in ultra high vacuum using a Kratos AXIS Ultra DLD (Kratos
Analytical, UK) instrument fitted with a monochromated Al K alpha source, which was operated at 15kV
and 5mA emission. Photoelectrons from the top few nanometres of the surface were detected in the
normal emission direction over an analysis area of approximately 700 x 300 micrometres. Spectra in the
range 1400 to –10 eV binding energy and a step size of 1 eV, using a pass energy of 160 eV were
acquired from selected areas of each sample. The peak areas were measured after removal of a Tougaard
background. The manufacturer’s intensity calibration and commonly employed sensitivity factors were
used to determine the concentration of the elements present. High resolution narrow scans of some of the
peaks of interest were acquired with a step size of 0.1 eV and 20 eV pass energy. (The manufacturer
calibrated the intensity calibration over the energy range). The energy scale was calibrated according to
ISO 15472 Surface chemical analysis – X-ray photoelectron spectrometers – Calibration of energy scales.
However, the charge neutraliser was used when acquiring the spectra, which shifted the peaks by several
eV. The C 1s hydrocarbon peak (285 eV binding energy) was used to determine the shift for identifying
the peaks. The pellets of the sample powders were produced using the KBr Quick Press pellet
presser. The powder was loaded from half to ¾ filled and gently pressed before the 3 pieces were inserted
into the socket of the pellet maker. The handle was carefully pressed until some resistance was felt, and
when pressed downwards there was ~ 1. 5 cm gap between the stop-screw on the handle to the central
body. After a few minutes the handle was released, and pressure re-applied twice more until the presser
clicked three times in total. The 3 piece assembly was taken out and the pellet removed.
The experimentally determined elemental compositions for all materials For the NM 111 - ZnO HP1
sample Zinc, Oxygen and Silicon (the latter from the silane layer) were all detected. All samples showed
a large amount of carbon probably adsorbed from the atmosphere. The percentage concentration of
carbon is consistent in the region 30-32% except from 0803 sample, which is in the region 22-26%. The
percentage levels of the other sub-samples are remarkable consistent varying only between 37 – 40 % for
Oxygen, 39-31% for Zinc and 1.2 – 2.2 % for Silicon. More Oxygen that Zinc was detected due to the
oxygen in the silane layer.
For the NM110 - ZnO sample Zinc and Oxygen were detected but no Silicon. In addition, Carbon was
detected. More Oxygen was detected than expected considering the amount of Zinc (assume a 1:1 ratio
from Zinc Oxide). The amount of Oxygen varied between 39-41% and Zinc from 35-39%.Carbon shows
the greatest variability from 20 – 26%.
4.31 Dustiness
Endpoint study record: Key_2011-25-11_NPL for PROSPECT_Dustiness
Administrative Data
Purpose flag key study
Study result type experimental result
Reliability 2 (reliable with restrictions)
Rationale for
reliability incl.
deficiencies
The method is recommended in the respective ECHA guidance and was regarded as
suitable to determine the distribution of particles of respirable or inhalable size. However,
only limited documentation of the data evaluation was provided in the full study report.
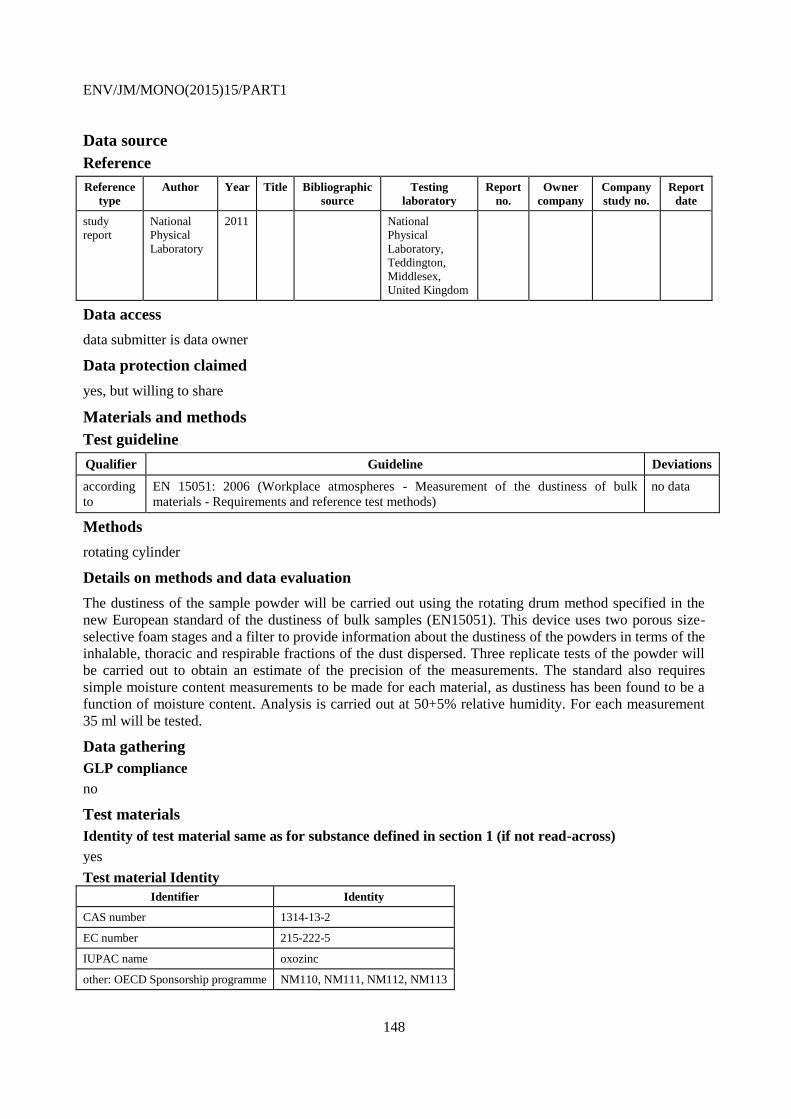
ENV/JM/MONO(2015)15/PART1
148
Data source
Reference
Reference
type
Author Year Title Bibliographic
source
Testing
laboratory
Report
no.
Owner
company
Company
study no.
Report
date
study
report
National
Physical
Laboratory
2011 National
Physical
Laboratory,
Teddington,
Middlesex,
United Kingdom
Data access
data submitter is data owner
Data protection claimed
yes, but willing to share
Materials and methods
Test guideline
Qualifier Guideline Deviations
according
to
EN 15051: 2006 (Workplace atmospheres - Measurement of the dustiness of bulk
materials - Requirements and reference test methods)
no data
Methods
rotating cylinder
Details on methods and data evaluation
The dustiness of the sample powder will be carried out using the rotating drum method specified in the
new European standard of the dustiness of bulk samples (EN15051). This device uses two porous size-
selective foam stages and a filter to provide information about the dustiness of the powders in terms of the
inhalable, thoracic and respirable fractions of the dust dispersed. Three replicate tests of the powder will
be carried out to obtain an estimate of the precision of the measurements. The standard also requires
simple moisture content measurements to be made for each material, as dustiness has been found to be a
function of moisture content. Analysis is carried out at 50+5% relative humidity. For each measurement
35 ml will be tested.
Data gathering
GLP compliance
no
Test materials
Identity of test material same as for substance defined in section 1 (if not read-across)
yes
Test material Identity
Identifier Identity
CAS number 1314-13-2
EC number 215-222-5
IUPAC name oxozinc
other: OECD Sponsorship programme NM110, NM111, NM112, NM113
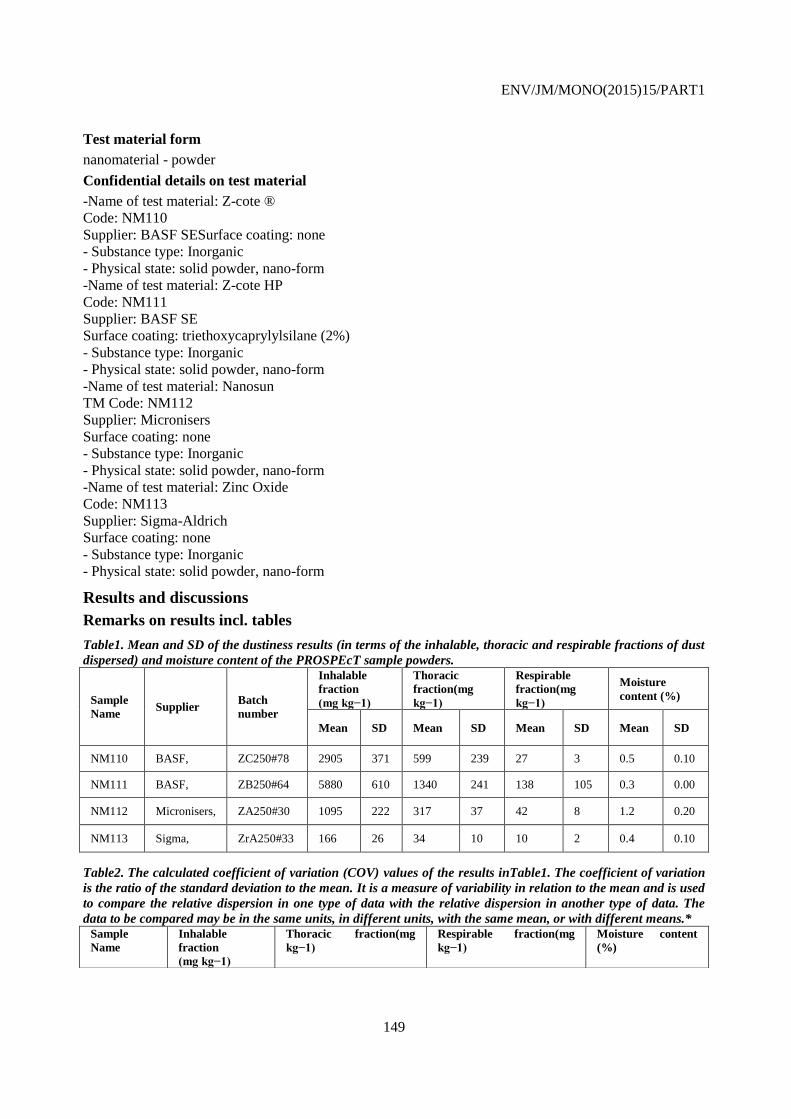
ENV/JM/MONO(2015)15/PART1
149
Test material form
nanomaterial - powder
Confidential details on test material
-Name of test material: Z-cote ®
Code: NM110
Supplier: BASF SESurface coating: none
- Substance type: Inorganic
- Physical state: solid powder, nano-form
-Name of test material: Z-cote HP
Code: NM111
Supplier: BASF SE
Surface coating: triethoxycaprylylsilane (2%)
- Substance type: Inorganic
- Physical state: solid powder, nano-form
-Name of test material: Nanosun
TM Code: NM112
Supplier: Micronisers
Surface coating: none
- Substance type: Inorganic
- Physical state: solid powder, nano-form
-Name of test material: Zinc Oxide
Code: NM113
Supplier: Sigma-Aldrich
Surface coating: none
- Substance type: Inorganic
- Physical state: solid powder, nano-form
Results and discussions
Remarks on results incl. tables
Table1. Mean and SD of the dustiness results (in terms of the inhalable, thoracic and respirable fractions of dust
dispersed) and moisture content of the PROSPEcT sample powders.
Sample
Name Supplier
Batch
number
Inhalable
fraction
(mg kg−1)
Thoracic
fraction(mg
kg−1)
Respirable
fraction(mg
kg−1)
Moisture
content (%)
Mean SD Mean SD Mean SD Mean SD
NM110 BASF, ZC250#78 2905 371 599 239 27 3 0.5 0.10
NM111 BASF, ZB250#64 5880 610 1340 241 138 105 0.3 0.00
NM112 Micronisers, ZA250#30 1095 222 317 37 42 8 1.2 0.20
NM113 Sigma, ZrA250#33 166 26 34 10 10 2 0.4 0.10
Table2. The calculated coefficient of variation (COV) values of the results inTable1. The coefficient of variation
is the ratio of the standard deviation to the mean. It is a measure of variability in relation to the mean and is used
to compare the relative dispersion in one type of data with the relative dispersion in another type of data. The
data to be compared may be in the same units, in different units, with the same mean, or with different means.* Sample
Name
Inhalable
fraction
(mg kg−1)
Thoracic fraction(mg
kg−1)
Respirable fraction(mg
kg−1)
Moisture content
(%)
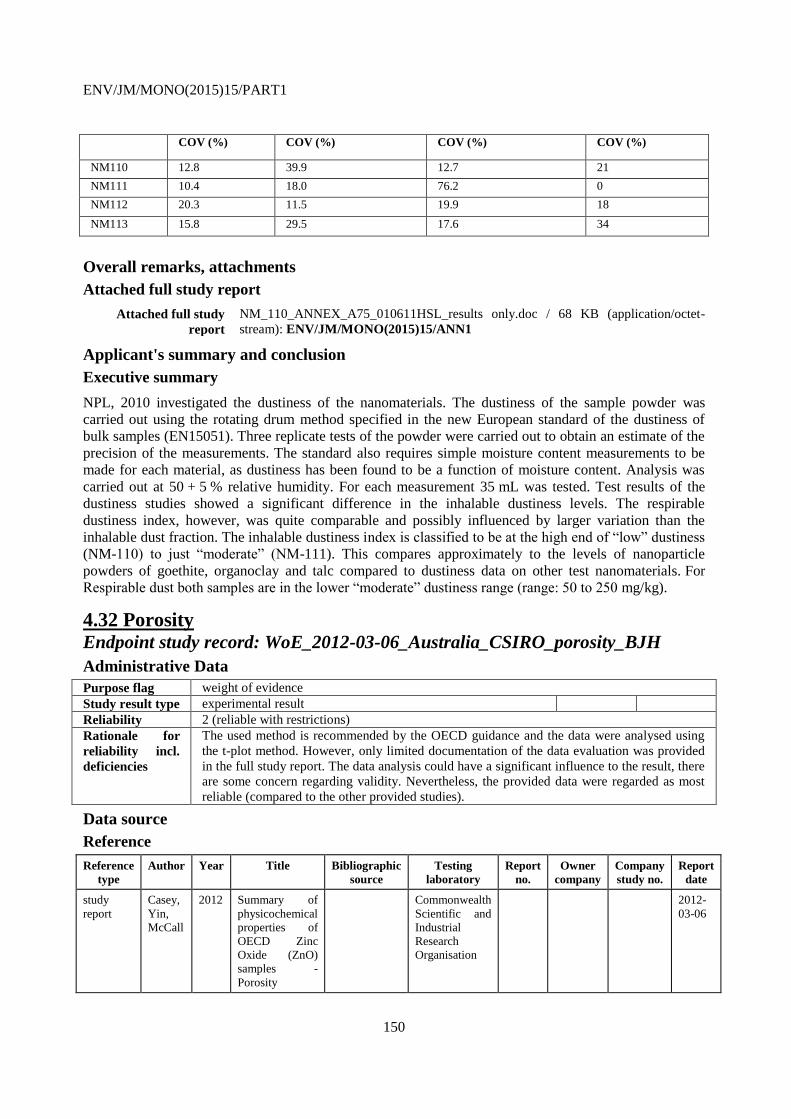
ENV/JM/MONO(2015)15/PART1
150
COV (%) COV (%) COV (%) COV (%)
NM110 12.8 39.9 12.7 21
NM111 10.4 18.0 76.2 0
NM112 20.3 11.5 19.9 18
NM113 15.8 29.5 17.6 34
Overall remarks, attachments
Attached full study report
Attached full study
report
NM_110_ANNEX_A75_010611HSL_results only.doc / 68 KB (application/octet-
stream): ENV/JM/MONO(2015)15/ANN1
Applicant's summary and conclusion
Executive summary
NPL, 2010 investigated the dustiness of the nanomaterials. The dustiness of the sample powder was
carried out using the rotating drum method specified in the new European standard of the dustiness of
bulk samples (EN15051). Three replicate tests of the powder were carried out to obtain an estimate of the
precision of the measurements. The standard also requires simple moisture content measurements to be
made for each material, as dustiness has been found to be a function of moisture content. Analysis was
carried out at 50 + 5 % relative humidity. For each measurement 35 mL was tested. Test results of the
dustiness studies showed a significant difference in the inhalable dustiness levels. The respirable
dustiness index, however, was quite comparable and possibly influenced by larger variation than the
inhalable dust fraction. The inhalable dustiness index is classified to be at the high end of “low” dustiness
(NM-110) to just “moderate” (NM-111). This compares approximately to the levels of nanoparticle
powders of goethite, organoclay and talc compared to dustiness data on other test nanomaterials. For
Respirable dust both samples are in the lower “moderate” dustiness range (range: 50 to 250 mg/kg).
4.32 Porosity Endpoint study record: WoE_2012-03-06_Australia_CSIRO_porosity_BJH
Administrative Data
Purpose flag weight of evidence
Study result type experimental result
Reliability 2 (reliable with restrictions)
Rationale for
reliability incl.
deficiencies
The used method is recommended by the OECD guidance and the data were analysed using
the t-plot method. However, only limited documentation of the data evaluation was provided
in the full study report. The data analysis could have a significant influence to the result, there
are some concern regarding validity. Nevertheless, the provided data were regarded as most
reliable (compared to the other provided studies).
Data source
Reference
Reference
type
Author Year Title Bibliographic
source
Testing
laboratory
Report
no.
Owner
company
Company
study no.
Report
date
study
report
Casey,
Yin,
McCall
2012 Summary of
physicochemical
properties of
OECD Zinc
Oxide (ZnO)
samples -
Porosity
Commonwealth
Scientific and
Industrial
Research
Organisation
2012-
03-06
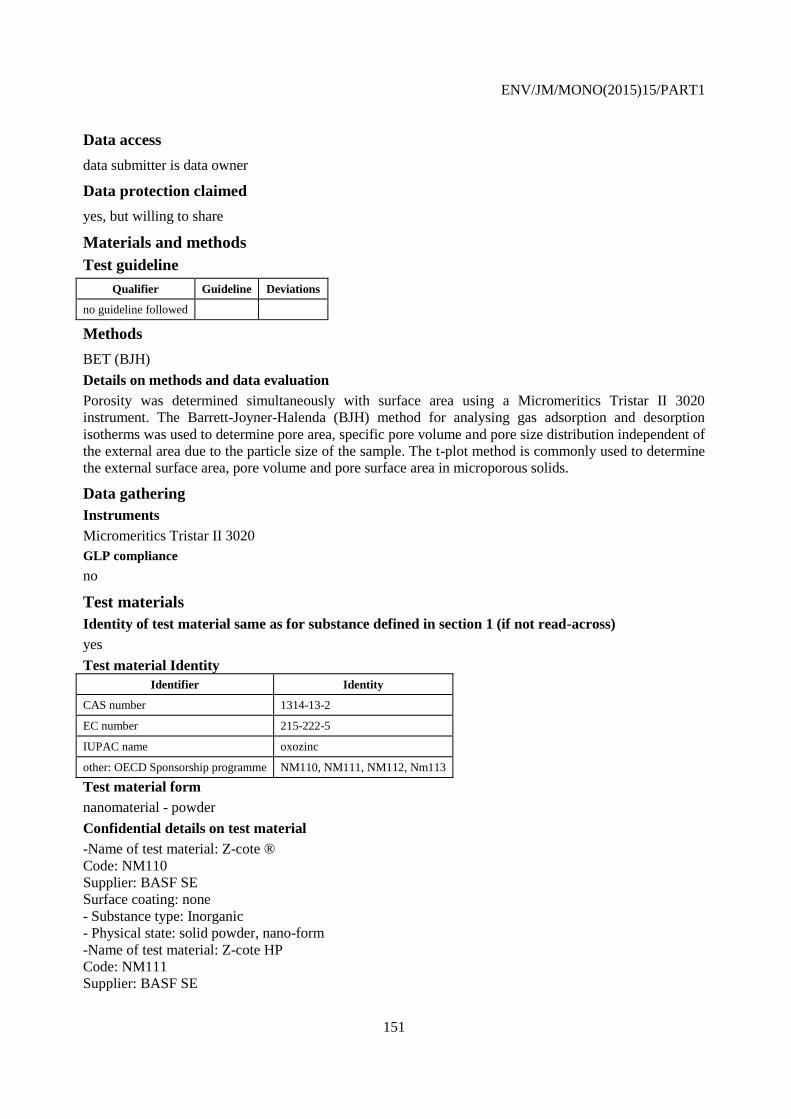
ENV/JM/MONO(2015)15/PART1
151
Data access
data submitter is data owner
Data protection claimed
yes, but willing to share
Materials and methods
Test guideline
Qualifier Guideline Deviations
no guideline followed
Methods
BET (BJH)
Details on methods and data evaluation
Porosity was determined simultaneously with surface area using a Micromeritics Tristar II 3020
instrument. The Barrett-Joyner-Halenda (BJH) method for analysing gas adsorption and desorption
isotherms was used to determine pore area, specific pore volume and pore size distribution independent of
the external area due to the particle size of the sample. The t-plot method is commonly used to determine
the external surface area, pore volume and pore surface area in microporous solids.
Data gathering
Instruments
Micromeritics Tristar II 3020
GLP compliance
no
Test materials
Identity of test material same as for substance defined in section 1 (if not read-across)
yes
Test material Identity
Identifier Identity
CAS number 1314-13-2
EC number 215-222-5
IUPAC name oxozinc
other: OECD Sponsorship programme NM110, NM111, NM112, Nm113
Test material form
nanomaterial - powder
Confidential details on test material
-Name of test material: Z-cote ®
Code: NM110
Supplier: BASF SE
Surface coating: none
- Substance type: Inorganic
- Physical state: solid powder, nano-form
-Name of test material: Z-cote HP
Code: NM111
Supplier: BASF SE

ENV/JM/MONO(2015)15/PART1
152
Surface coating: triethoxycaprylylsilane (2%)
- Substance type: Inorganic
- Physical state: solid powder, nano-form
-Name of test material: Nanosun
TM Code: NM112
Supplier: Micronisers
Surface coating: none
- Substance type: Inorganic
- Physical state: solid powder, nano-form
-Name of test material: Zinc Oxide
Code: NM113
Supplier: Sigma
-AldrichSurface coating: none
- Substance type: Inorganic
- Physical state: solid powder, nano-form
Results and discussions
Remarks on results incl. tables
The Table presents the external surface area, micropore surface area and volume, and a determination of
the average pore width for all ZnO samples.All samples have either low or no microporosity. The major
contribution to total surface area is from external surfaces and is thus predominantly determined by
particle size and shape rather than high internal porosity.
For pristine samples of ZnO (NM110, NM112 and NM113) the surface areas, when determined by adding
the t-Plot micropore surface area and the t-plot external surface area, are generally consistent with those
determined by the BET method. However, for NM111 (the coated sample), the t-plot calculation indicates
no micropore surface area and an external surface area considerably greater than that determined by the
BET method (~21 m²/gcf 14 m²/g). This variation is likely due to the presence of the hydrophobic
(mesoporous) silicone coating which has capacity to adsorb gas both internally and externally and imply a
greater surface area. The fact that no microporous volume is reported suggests that any porosity is likely
mesoporous. Consequently, for the coated sample only, the-plot external surface area (multi-layer)
calculation is higher than the BET specific surface area (monolayer) calculation.
Table Porosity of the ZnO samples, NM110, NM111, NM112 and NM113.
Sample
Name
t-Plot
Micropore
Surface Area:
m²/g
t-Plot External
Surface Area : m²/g
t-Plot micropore
volume: cm³/g
BJH Desorption
average pore width
(4V/A): Å
NM-110 1.79315± 0.58 9.97± 0.98 0.000805± 0.00029 89.7445± 4.5
NM-111 0 20.899±0.312 0 208.02±4.67
NM-112 5.3518± 0.85 21.9027± 1.17 0.0024255± 0.0004 157.63± 10.3
NM-113 1.38765± 0.66 4.39675± 0.11 0.000638± 0.11 107.49± 12.7
Overall remarks, attachments
Attached full study report
Attached full
study report
NM_110_ANNEX_A76_OECD ZnO porosity CSIRO Australia.docx / 23.98 KB
(application/octet-stream): ENV/JM/MONO(2015)15/ANN1
Applicant's summary and conclusion
Executive summary
CSIRO, 2012, determined the porosity simultaneously with surface area using a Micromeritics Tristar II

ENV/JM/MONO(2015)15/PART1
153
3020 instrument. The Barrett-Joyner-Halenda (BJH) method for analysing gas adsorption and desorption
isotherms was used to determine pore area, specific pore volume and pore size distribution independent of
the external area due to the particle size of the sample. All samples have either low or no microporosity.
The major contribution to total surface area is from external surfaces and is thus predominantly
determined by particle size and shape rather than high internal porosity. For pristine samples of ZnO
(NM-110, NM-112 and NM-113) the surface areas are generally consistent with those determined by the
BET method. However, for NM-111 (the coated sample), the t-plot calculation indicates no micropore
(pores smaller than 2 nm in diameter) surface area and an external surface area considerably greater than
that determined by the BET method (~21 m²/g cf 14 m²/g). This variation is likely due to the presence of
the hydrophobic (mesoporous) silicone coating which has capacity to adsorb gas both internally and
externally and imply a greater surface area. The fact that no microporous volume is reported suggests that
any porosity is likely mesoporous (pores greater than 2 nm and less than 50 nm in diameter).
Consequently, for the coated sample only, the t-plot external surface area (multi-layer) calculation is
higher than the BET specific surface area (monolayer) calculation.
Endpoint study record: WoE_2012-03-06_Australia_Deakin_Pore size_BJH
Administrative Data
Study result type experimental result
Reliability 2 (reliable with restrictions)
Rationale for
reliability incl.
deficiencies
limited number of replicates. However, only limited documentation was provided. The
results were only presented as data plots and no further explanation with respect to data
handling and analysis were provided. There are some concerns on validity as the data
analysis have a significant influence to the result.
Data source
Reference
Reference
type
Author Year Title Bibliographic
source
Testing
laboratory
Report
no.
Owner
company
Company
study no.
Report
date
study
report
Tsuzuki,
He
2012 Crystal phase &
crystallite size
measurements
for OECD ZnO
samples
Deakin
University
2012-
03-06
Data access
data submitter is data owner
Data protection claimed
yes, but willing to share
Materials and methods
Methods
BET (BJH)
Principles of method if other than guideline
N2 gas adsorption at 77K
Sampling
Sample preparation: degassing at 150 C for 1 h
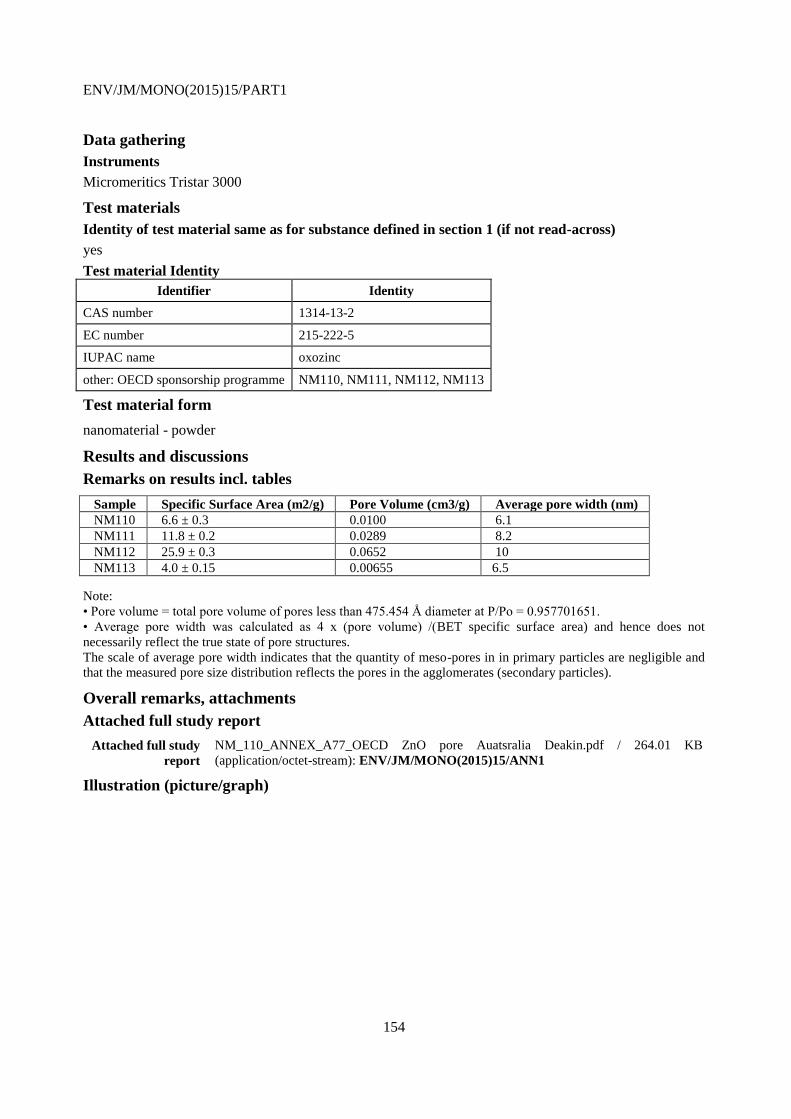
ENV/JM/MONO(2015)15/PART1
154
Data gathering
Instruments
Micromeritics Tristar 3000
Test materials
Identity of test material same as for substance defined in section 1 (if not read-across)
yes
Test material Identity
Identifier Identity
CAS number 1314-13-2
EC number 215-222-5
IUPAC name oxozinc
other: OECD sponsorship programme NM110, NM111, NM112, NM113
Test material form
nanomaterial - powder
Results and discussions
Remarks on results incl. tables
Sample Specific Surface Area (m2/g) Pore Volume (cm3/g) Average pore width (nm)
NM110 6.6 ± 0.3 0.0100 6.1
NM111 11.8 ± 0.2 0.0289 8.2
NM112 25.9 ± 0.3 0.0652 10
NM113 4.0 ± 0.15 0.00655 6.5 Note: • Pore volume = total pore volume of pores less than 475.454 Å diameter at P/Po = 0.957701651. • Average pore width was calculated as 4 x (pore volume) /(BET specific surface area) and hence does not
necessarily reflect the true state of pore structures. The scale of average pore width indicates that the quantity of meso-pores in in primary particles are negligible and
that the measured pore size distribution reflects the pores in the agglomerates (secondary particles).
Overall remarks, attachments
Attached full study report
Attached full study
report
NM_110_ANNEX_A77_OECD ZnO pore Auatsralia Deakin.pdf / 264.01 KB
(application/octet-stream): ENV/JM/MONO(2015)15/ANN1
Illustration (picture/graph)
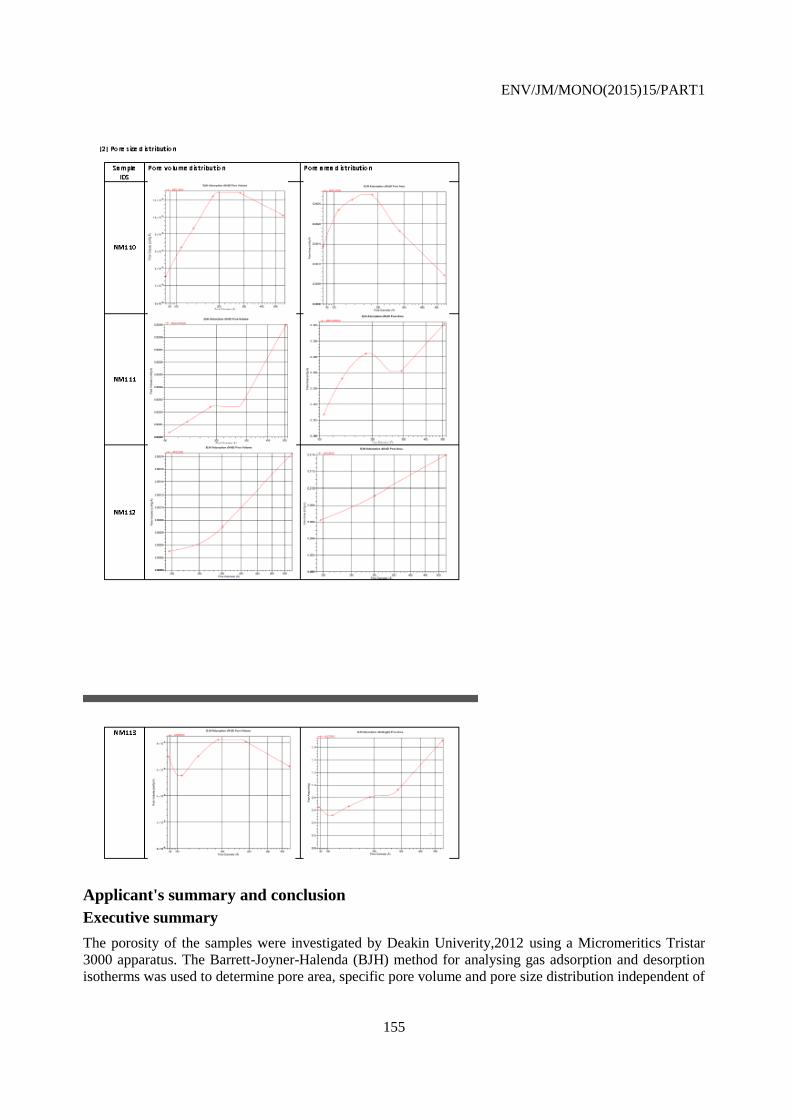
ENV/JM/MONO(2015)15/PART1
155
Applicant's summary and conclusion
Executive summary
The porosity of the samples were investigated by Deakin Univerity,2012 using a Micromeritics Tristar
3000 apparatus. The Barrett-Joyner-Halenda (BJH) method for analysing gas adsorption and desorption
isotherms was used to determine pore area, specific pore volume and pore size distribution independent of
ENV/JM/MONO(2015)15/PART1
156
the external area due to the particle size of the sample. The scale of average pore width indicates that the
quantity of meso-pores in in primary particles are negligible and that the measured pore size distribution
reflects the pores in the agglomerates (secondary particles). All samples have very low microporosity.
The major contribution to total surface area is from external surfaces and is thus predominantly
determined by particle size and shape rather than high internal porosity. NM-112 has the highest surface
area and micropore volume of all the samples approximately 3-4 times greater than other samples.
Endpoint study record: WoE_2011-12-19_NPL for PROSPECT_Porosity
Administrative Data
Purpose flag weight of evidence
Study result type experimental result
Reliability 2 (reliable with restrictions)
Rationale for
reliability incl.
deficiencies
The study was regarded was reliable with restrictions. The used methodology is well-
established. However, only very limited documentation of the data evaluation was provided in
the full study report. Furthermore the procedure for data analysis and representation was not
explained in detail. There were some concerns on validity as the data analysis have a
significant influence to the result.
Data source
Reference
Reference
type
Author Year Title Bibliogr
aphic
source
Testing
laboratory
Report no. Owner
company
Company
study no.
Report
date
study
report
National
Physical
Laboratory
2011 Porosity MCACambr
idge
010611MCAC
ambridge
2011-
12-19
Data access
data submitter is data owner
Data protection claimed
yes, but willing to share
Materials and methods
Test guideline
Qualifier Guideline Deviations
no guideline followed
Methods
BET
Principles of method if other than guideline
InstrumentationA Micromeritics TriStar II (3020) was used for the collection of nitrogen adsorption /
desorption isotherm data up to a saturation pressure of approximately 0.995 P/Po. The analysis was
typically conducted to measure 45 adsorption relative pressure points and 23 desorption relative pressure
points. Samples were outgassed overnight in vacuo at 300 degC using a Micromeritics VacPrep apparatus
prior to analysis. In order to indicate any possible microporous nature of the materials additional relative
pressure data were also collected at pressures lower than the usual starting point for analyses using this
instrument. These were in the approximate range 0.005 to 0.01 P/Po. Whilst the data reduction methods
available are unsuitable for application to the micropore range the characteristic shape of the adsorption

ENV/JM/MONO(2015)15/PART1
157
isotherm at these low partial pressures would provide a good indication of the presence of micropores in
the sample material. The sample tube dead space was measured for each analysis using helium (CP grade)
thus providing warm and cold freespace values. Samples requiring only BET surface area analysis were
analysed using the same equipment with the application ofthe same freespace measurement technique.
BET surface area was calculated using partial pressures in the nominal range 0.07 to 0.25.Data Reduction.
The samples for which the full adsorption/desorption isotherms were analysed graphical plots of the
adsorption/desorption isotherm and BET surface area transform plot together with tabulated data for each
are presented. The pore size distribution is presented as pore size by volume and area from the adsorption
isotherm using the BJH method. The lower limit of BJH calculations in terms of pore size (by diameter)
is extended below the typical value in order to highlight any possible microporous nature of the materials.
The pore size distribution data presented in the BJH reports is applied to a maximum of 1000Å, although
data below approximately 20Å should be considered only as a guide to the full porous nature of the
materials. The total pore volume of the materials is calculated from the volume of nitrogen adsorbed at
the maximum relative pressure obtained on the adsorption branch of the isotherm and is detailed on the
summary report.
Data gathering
Instruments
Micromeritics TriStar II
Calibration
BAM Standard - Alumina BAM-PM-104BAM Standard - Alumina BAM-PM-102
GLP compliance
no
Test materials
Identity of test material same as for substance defined in section 1 (if not read-across)
yes
Test material Identity
Identifier Identity
CAS number 1314-13-2
EC number 215-222-5
IUPAC name oxozinc
other: OECD sponsorship programme NM110, NM111, NM112, NM113
Test material form
nanomaterial - powder
Confidential details on test material
-Name of test material: Z-cote ®
Code: NM110
Supplier: BASF SE
Surface coating: none
- Substance type: Inorganic
- Physical state: solid powder, nano-form
-Name of test material: Z-cote HP
Code: NM111
ENV/JM/MONO(2015)15/PART1
158
Supplier: BASF SE
Surface coating: triethoxycaprylylsilane (2%)
- Substance type: Inorganic
- Physical state: solid powder, nano-form
-Name of test material: Nanosun
TM Code: NM112
Supplier: Micronisers
Surface coating: none
- Substance type: Inorganic
- Physical state: solid powder, nano-form
-Name of test material: Zinc Oxide
Code: NM113
Supplier: Sigma-Aldrich
Surface coating: none
- Substance type: Inorganic
- Physical state: solid powder, nano-form
Results and discussions
Remarks on results incl. tables
Porosity Sample Porosity (cm3/g)
NM110 0.041538
NM111 0.071347
NM112 0.158354
NM113 0.013820
Overall remarks, attachments
Attached full study report
Attached full study report NM_110_ANNEX_A43_010611MCACambridge.doc / 93 KB (application/octet-
stream): ENV/JM/MONO(2015)15/ANN1
Applicant's summary and conclusion
Conclusions
The porosity was determined to be 0.041538 cm3/g for NM-110, 0.071347 cm3/g for NM-111, 0.158354
cm3/g for NM-112 and 0.013820 cm3/g for NM-113 respectively.
Executive summary
As study was conducted by the MCA in Cambridge, 2011 to determine the porosity of the NMs. A
Micromeritics TriStar II (3020) was used for the collection of nitrogen adsorption / desorption isotherm
data up to a saturation pressure of approximately 0.995 P/P0. The analysis was typically conducted to
measure 45 adsorption relative pressure points and 23 desorption relative pressure points. Samples were
outgassed overnight in vacuum at 300 °C using a Micromeritics VacPrep apparatus prior to analysis. In
order to indicate any possible microporous nature of the materials additional relative pressure data were
also collected at pressures lower than the usual starting point for analyses using this instrument. These
were in the approximate range 0.005 to 0.01 P/P0. Whilst the data reduction methods available are
unsuitable for application to the micropore range the characteristic shape of the adsorption isotherm at

ENV/JM/MONO(2015)15/PART1
159
these low partial pressures would provide a good indication of the presence of micropores in the sample
material. The sample tube dead space was measured for each analysis using helium (CP grade) thus
providing warm and cold freespace values. Samples requiring only BET surface area analysis were
analysed using the same equipment with the application of the same freespace measurement technique.
BET surface area was calculated using partial pressures in the nominal range 0.07 to 0.25.
The pore size distribution is presented as pore size by volume and area from the adsorption isotherm
using the BJH method. The pore size distribution data presented in the BJH reports is applied to a
maximum of 1000 Å. The total pore volume of the materials is calculated from the volume of nitrogen
adsorbed at the maximum relative pressure obtained on the adsorption branch of the isotherm. The
porosity was determined to be 0.041538 cm3/g for NM-110, 0.071347 cm3/g for NM-111, 0.158354
cm3/g for NM-112 and 0.013820 cm3/g for NM-113 respectively.
4.33 Pour density
Endpoint study record: Key_2011-12-13_NPL for PROSPECT_pour density
Administrative Data
Purpose flag key study
Study result type experimental result
Reliability 4 (not assignable)
Rationale for
reliability incl.
deficiencies
The study was regarded as scientifically acceptable. However, only limited documentation of
the data evaluation was provided in the full study report. It is not clear how the data of the
bulk density was determined. In the study report the experimental determination of the tap
density and the calculation of the carr index where roughly described. According to the
OECD guidance the procedure for pour density measurements is described in ASTM Standard
D1513 – 05e2. Due to the limited documentation it was not possible to assess if the data were
obtained in accordance with recognised guidance. The provided results for density are not
consistent with the data on particle size which were in general regarded as reliable. This,
inconsistence might be caused by different parameter (e.g. sample preparation, representative
sample). Thus, it was not possible to finally conclude on pour density.
Data source
Reference
Reference
type
Author Year Title Bibliographic
source
Testing
laboratory
Report
no.
Owner
company
Company
study no.
Report
date
study
report
Escubed
Ltd
2011 Pour density
Analysis:
Outsourced
work for
PROSPEcT.
National
Physical
Laboratory,
Teddington,
Middlesex,
United
Kingdom
2011-
12-13
Data access
data submitter is data owner
Data protection claimed
yes, but willing to share
Materials and methods
Test guideline
Qualifier Guideline Deviations
no guideline followed
ENV/JM/MONO(2015)15/PART1
160
Method
other: tapped density
Details on methods and data evaluation
Using a Copley JV2000, a known mass of the dry sample was placed into a measuring cylinder to a
recorded volume and ‘tapped’ by mechanically raising and lowering by a set distance until a consistent
volume was reached, which corresponds to the maximum packing density of the material.
Data gathering
Instruments
Copley
JV2000
GLP compliance
no
Test materials
Identity of test material same as for substance defined in section 1 (if not read-across)
yes
Test material Identity
Identifier Identity
CAS number 1314-13-2
EC number 215-222-5
IUPAC name oxozinc
other: OECD Sponsorship Programme NM110, NM111, NM112, NM113
Test material form
nanomaterial - powder
Confidential details on test material
-Name of test material: Z-cote ®
Code: NM110
Supplier: BASF SE
Surface coating: none
- Substance type: Inorganic
- Physical state: solid powder, nano-form
-Name of test material: Z-cote HP
Code: NM111
Supplier: BASF SE
Surface coating: triethoxycaprylylsilane (2%)
- Substance type: Inorganic
- Physical state: solid powder, nano-form
-Name of test material: Nanosun
TM Code: NM112
Supplier: Micronisers
Surface coating: none
- Substance type: Inorganic
- Physical state: solid powder, nano-form
-Name of test material: Zinc Oxide
Code: NM113

ENV/JM/MONO(2015)15/PART1
161
Supplier: Sigma-Aldrich
Surface coating: none
- Substance type: Inorganic
- Physical state: solid powder, nano-form
Results and discussions
Remarks on results incl. tables
Sample Bulk Density (g/cm3) Tapped Density (g/cm3) Carr Index
NM110 0.293 0.346 15.351
NM111 0.693 0.832 16.799
NM112 0.415 0.519 20.000
NM113 0.646 0.714 9.471
Overall remarks, attachments
Attached full study report
Attached full study report NM_110_ANNEX_A44_pour density.doc / 45.5 KB (application/octet-stream):
ENV/JM/MONO(2015)15/ANN1
Applicant's summary and conclusion
Executive summary
Escubed Ltd., 2012 determined the density of the nanomaterials using a Copley JV2000. A known mass
of the dry sample was placed into a measuring cylinder to a recorded volume and tapped by mechanically
raising and lowering by a set distance until a consistent volume was reached, which corresponds to the
maximum packing density of the material. The Carr Index was calculated from the respective bulk and
tapped densities.NM-110 and NM-111 have comparable particle size. NM-112 was determined to have
the smallest particle size compared to the other 3 nanomaterials and NM-113 (“bulk material”) was
determined to have the largest particle size. As the particle size directly influence the tapped density, this
general trend should be observed in the density measurements. The provided results for density are not
consistent with the data on particle size which were in general regarded as reliable. This, inconsistence
might be caused by different parameter (e.g. sample preparation, representative sample). Thus, it was not
possible to finally conclude on pour density.
4.34 Photocatalytic activity
Endpoint study record: WoE_2010-12-05 NPL for PROSPECT Photocatalytic
activity.001 Free radical formation
Administrative Data
Purpose flag weight of evidence
Study result type experimental result
Reliability 2 (reliable with restrictions)
Rationale for
reliability incl.
deficiencies
The study was regarded as scientifically acceptable. However, only limited documentation of
the data evaluation was provided in the full study reports. The photocatalytic activity of the
ZnO samples depends on the particle size as well as the specific surface area and geometrical
shape. The surface treatment is essential to understand the behaviour of the nanomaterial
under consideration.

ENV/JM/MONO(2015)15/PART1
162
Data source
Reference
Reference
type
Author Year Title Bibliographic
source
Testing
laboratory
Report
no.
Owner
company
Company
study no.
Report
date
study
report
National
Physical
Laboratory
2010 Free radical
formation
under
photocatalytic
conditions
National
Physical
Laboratory,
Teddington,
Middlesex,
United
Kingdom
2010-
12-05
Data access
data submitter is data owner
Data protection claimed
yes, but willing to share
Materials and methods
Test guideline
Qualifier Guideline Deviations
no guideline followed
Methods
other: UV-vis spectroscopy
Details on methods and data evaluation
The photocatalytic activity of materials refers to their ability to create electron-hole pairs under light
irradiation, which then generate reactive oxygen species (ROS) such as free radicals (e.g. superoxide
radicals, hydroxyl radicals, etc.), hydrogen peroxide, singlet oxygen, etc. ROS lifetime is generally below
the millisecond range, which makes their detection challenging. One strategy to detect ROS formation is
to use scavenging substances that get oxidised by ROS into stable chemical compound whose
concentration can be detected. A method for assessing the general oxidative activity of the NMs under
irradiation is by using potassium iodide (KI) test. The oxidation of iodide ions results in the production of
tri-iodide ions, whose concentration can be assessed by measuring optical absorbance at 352 nm.UV-vis
spectroscopy for the detection of tri-iodide ions. KI test under irradiated conditionsA 5 M KI (Sigma, St.
Louis, MO) solution in ultra-pure water was freshly prepared; shaking and vortexing was preferred to
sonication to dissolve KI. KI solution was added to the samples of NMs as received after dispersion
(50mg/L), to obtain a typically 1 mL volume sample, with 0.1M KI. 6 x 3 samples were prepared for each
NM/media combination. Additionally, 6 x 3 samples containing 0.1 M KI only and 50mg/L Anatase NMs
(Anatase Nanopowder, Sigma) for each media were prepared as negative and positive controls
respectively; 6 NM samples plus controls were prepared and assessed in total. All samples were contained
in individual 2mL microcentrifuge tubes. Samples were irradiated under a 1kW Solar Simulator (Newport
Corporation, Stratford, CT). The instrument posses a personal wavelength correctionTM Certificate by
Newport. The irradiance of the Solar Simulator was measured to be 1000 Wm-2 using an optical
power/energy meter (Newport, model 842-PE). Irradiation was performed on groups of 40
microcentrifuge tubes. The tubes were placed vertically under the centre of the lamp of the solar
simulator, on an in-house made polystyrene holder, their cups having been removed. The samples were
subjected to 10min periods of irradiation, followed by 5min period of non-irradiation to reduce sample
overheating. After each 10 min period, 1x3 samples for each NM/media combination and controls were
ENV/JM/MONO(2015)15/PART1
163
removed from the irradiations. Samples irradiated for 0 min, 10 min, 20 min, 30 min, 40 min and 60 min
were collected for each NM/media combination and controls. The samples containing NMs were
centrifuged at 20800 rcf for 15 min and 800 µL of supernatant was collected in a new micro-centrifuge
tube and then analysed using UV-visible spectroscopy (see protocol below). UV-visible spectroscopy for
KI testThe UV-visible spectrum (absorbance scans from 300 nm to 500 nm) was acquired for samples
that were irradiated for 60 minutes. Optical absorbance at 352 nm was acquired for all samples.
Absorption spectra were acquired with a Lambda 850 UV-Vis spectrometer supported by UV Winlab
software [Version 5.1.5] (Perkin Elmer, Waltham, MA). The instrument wavelength calibration was
checked using Holmium glass standards (Serial # 9393, Starna Scientific, Hainault, UK). For the
reference channel of the spectrophotometer a matched cell containing the corresponding dispersing media
(with no nanoparticles) was used. Absorption spectra were acquired on samples that have been irradiated
for 60 minutes. Absorbance scans from 300nm to 500nm were performed, using a slit width of 2 nm and
a scan rate of 50 nm/min. After each sample, the cuvette was cleaned with a 2% solution of Hellmanex
detergent, rinsed with pure water and ethanol and then blow-dried. Optical absorbance at 352nm was
performed using a plate-reader Victor3 1420 multilabel counter (Perkin Elmer), supported by Wallac
1420 software (Perkin Elmer). 300L of each sample (supernatant after centrifugation) was placed in the
wells of a 96-well plate. Only the wells of rows 2 to 6 and columns 1 to 10 were used, as they had the
same level of noise. The absorption at 352nm was measured using a 0.1s measurement time. Measured
absorption values were displayed on a 0 a.u. to 2 a.u. scale.
Data gathering
GLP compliance
no
Test materials
Identity of test material same as for substance defined in section 1 (if not read-across)
yes
Test material Identity
Identifier Identity
CAS number 1314-13-2
EC number 215-222-5
IUPAC name oxozinc
other: OECD Sponsorship Programme NM110, NM111, NM112, NM113
Test material form
nanomaterial - powder
Confidential details on test material
-Name of test material: Z-cote ®
Code: NM110Supplier: BASF SE
Surface coating: none
- Substance type: Inorganic
- Physical state: solid powder, nano-form
-Name of test material: Z-cote HP
Code: NM111
Supplier: BASF SE
Surface coating: triethoxycaprylylsilane (2%)
- Substance type: Inorganic
- Physical state: solid powder, nano-form
ENV/JM/MONO(2015)15/PART1
164
-Name of test material: Nanosun
TM Code: NM112
Supplier: Micronisers
Surface coating: none
- Substance type: Inorganic
- Physical state: solid powder, nano-form
-Name of test material: Zinc Oxide
Code: NM113
Supplier: Sigma-Aldrich
Surface coating: none
- Substance type: Inorganic
- Physical state: solid powder, nano-form
Results and discussions
Remarks on results incl. tables
The figure compares the absorption measured at 352 nm for all the NM samples in 4 different media after
60 min of total irradiation; the corresponding negative control (i.e. media with no NMs) are also
shown.Results show that there was a certain level of tri-iodide (I3-) measured in the irradiated sample
containing media only. Interestingly, tri-iodide was suppressed in seawater and may be attributed to a
higher concentration of ions (potentially with some scavenging capacity either to ROS species or to
electron (or holes) at the NM surface) in this media. As expected, results for Anatase (TiO2), being the
most active photocatalytic material, show a much higher rate of tri-iodide formation than the
corresponding PROSPEcT NMs. In particular, the absorbance signal was highest in DI water, with the
lack of ionic species in the media. Again, when in seawater, the absorbance signal was reduced (as in the
corresponding blank i.e. seawater with no Anatase). There are several possible explanations for this:
a) Presence of scavengers in solution, as previously described.
b) Enhanced aggregation/sedimentation of the NMs in seawater media compared to other media.
Out of all the PROSPEcT NMs, we see Nanograin CeO2following a similar trend to Anatase, in having
the largest absorbance signal in DI water and the smallest when in seawater. Z-COTE ZnO is interesting,
in that it does not follow a similar pattern observed with Anatase and Nanograin CeO2. With Z-COTE
ZnO, the absorbance signal is much higher in seawater than when dispersed in the other three media. At
present we offer no explanation for this observation. With the other PROSPEcT NMs, the absorbance
signals were within a similar range to that of the corresponding irradiated blank. Samples that were kept
in the dark exhibited no absorption peak at 352 nm.
Lastly, a UV-visible plate reader was used to follow the cumulative production of I3-with varying
irradiation time; this was quantified by measuring absorption at 352 nm. In summary, results show that
absorbance signal generally increases with irradiation time and this can be attributed to the increase in the
amount of ROS being generated. Again, our findings are consistent with previous observations, in that:
a) Anatase gave the highest absorbance reading.
b) Z-COTE ZnO gave a higher absorbance reading in seawater than when in other media
Overall remarks, attachments
Attached full study report
Attached full
study report
NM_110_ANNEX_A45_FREE RADICAL FORMATION UNDER PHOTOCATALYTIC
CONDITIONS.doc / 78.5 KB (application/octet-stream): ENV/JM/MONO(2015)15/ANN1
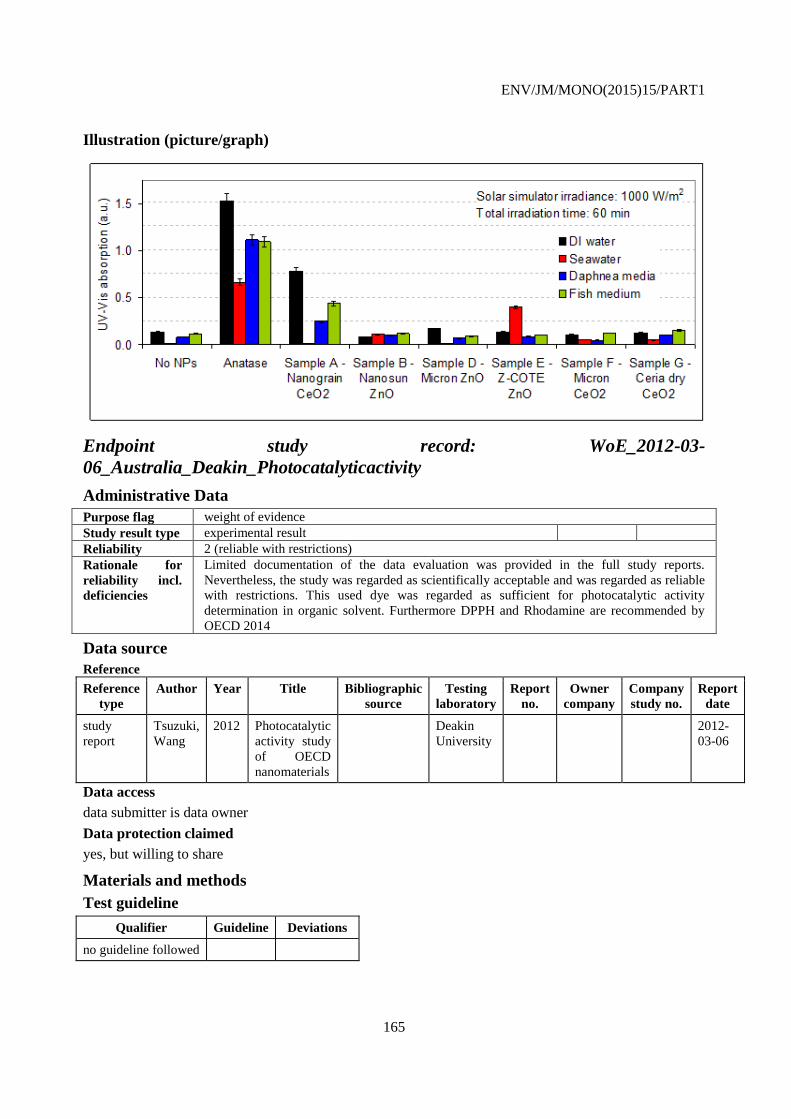
ENV/JM/MONO(2015)15/PART1
165
Illustration (picture/graph)
Endpoint study record: WoE_2012-03-
06_Australia_Deakin_Photocatalyticactivity
Administrative Data
Purpose flag weight of evidence
Study result type experimental result
Reliability 2 (reliable with restrictions)
Rationale for
reliability incl.
deficiencies
Limited documentation of the data evaluation was provided in the full study reports.
Nevertheless, the study was regarded as scientifically acceptable and was regarded as reliable
with restrictions. This used dye was regarded as sufficient for photocatalytic activity
determination in organic solvent. Furthermore DPPH and Rhodamine are recommended by
OECD 2014
Data source
Reference
Reference
type
Author Year Title Bibliographic
source
Testing
laboratory
Report
no.
Owner
company
Company
study no.
Report
date
study
report
Tsuzuki,
Wang
2012 Photocatalytic
activity study
of OECD
nanomaterials
Deakin
University
2012-
03-06
Data access
data submitter is data owner
Data protection claimed
yes, but willing to share
Materials and methods
Test guideline
Qualifier Guideline Deviations
no guideline followed

ENV/JM/MONO(2015)15/PART1
166
Methods
other: UV-vis
Principles of method if other than guideline
Decomposition of Rhodamine-B dye in the presence of nanomaterial, detected by UV-Vis spectroscopy.
Details on methods and data evaluation
For each measurement, 0.012g of the powder sample was added into 100 ml of Rhodamine B (RhB)
aqueous solution having the concentration of 0.0096g/L. The suspension was placed in a quartz beaker
with a quartz watch glass as a lid. The suspension was then stirred in the dark for 1 h to ensure the
establishment of adsorption and desorption equilibrium of RhB on the particle surface. Subsequently the
suspension was irradiated with simulated sunlight using an Atlas Suntest XLS+ instrument (equipped
with a 150 W xenon lamp) with a flux of 300 wm-2 while continuously stirred. The temperature of the
solution was regulated to 37 °C (air cooling). At given intervals, 3 mL of the suspension was extracted
and then centrifuged at 6000 rpm for 10 min to separate the nanoparticles from the supernatant. UV-Vis
absorbance spectra of the supernatant were measured with a Varian Cary 3E spectrophotometer. The
intensity of the optical adsorption peak around 554 nm was used to monitor the rate of dye degradation.
Each of the photocatalytic activity tests was repeated three times. Overall rates of the reactive dye
degradation were calculated assuming the first-order kinetics. It is assumed that extraction of a small
quantity of sample (3 mL each x max 6) does not alter the UV exposure conditions of the remaining
sample.
Data gathering
Instruments
Varian Cary 3E UV-Vis spectrophotometer:Atlas Suntest CPS+ instrument equipped with a 150 W
Xenon lamp.
GLP compliance
no
Test materials
Identity of test material same as for substance defined in section 1 (if not read-across)
yes
Test material Identity
Identifier Identity
CAS number 1314-13-2
EC number 215-222-5
IUPAC name oxozinc
other: OECD Sponsorship Programme NM110, NM111, NM112, NM113
Test material form
nanomaterial - powder
Confidential details on test material
-Name of test material: Z-cote ®
Code: NM110
Supplier: BASF SE
Surface coating: none
- Substance type: Inorganic
- Physical state: solid powder, nano-form
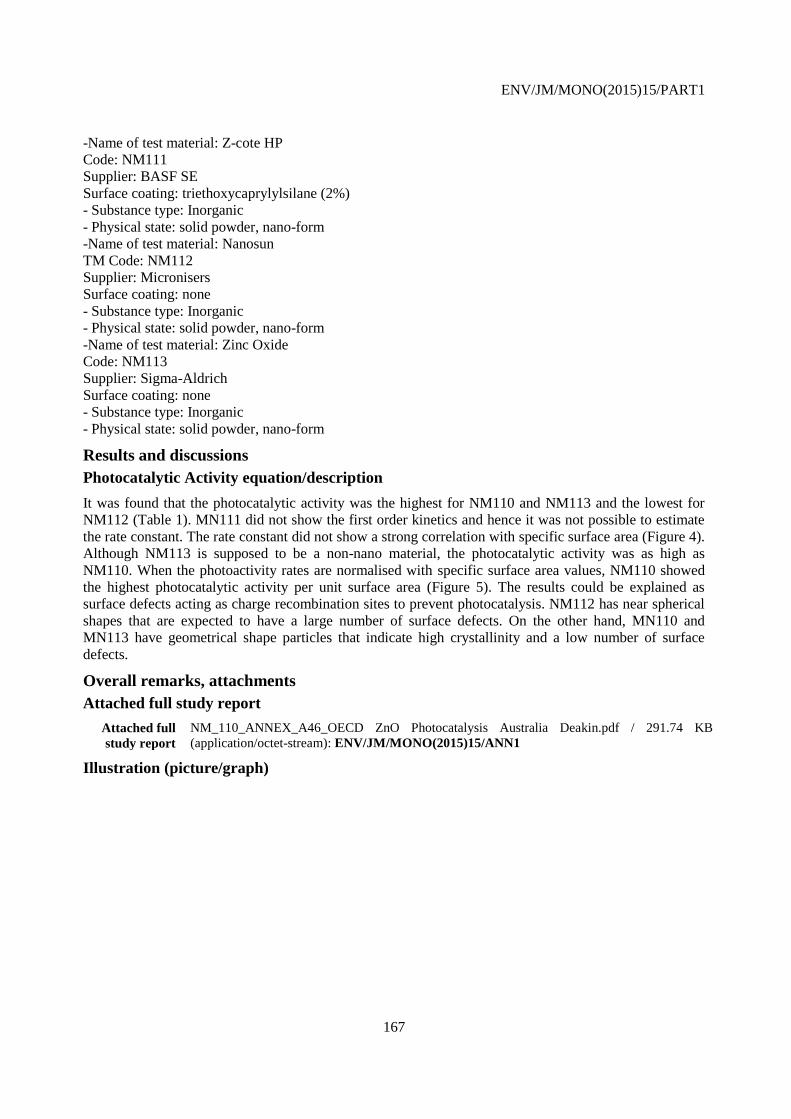
ENV/JM/MONO(2015)15/PART1
167
-Name of test material: Z-cote HP
Code: NM111
Supplier: BASF SE
Surface coating: triethoxycaprylylsilane (2%)
- Substance type: Inorganic
- Physical state: solid powder, nano-form
-Name of test material: Nanosun
TM Code: NM112
Supplier: Micronisers
Surface coating: none
- Substance type: Inorganic
- Physical state: solid powder, nano-form
-Name of test material: Zinc Oxide
Code: NM113
Supplier: Sigma-Aldrich
Surface coating: none
- Substance type: Inorganic
- Physical state: solid powder, nano-form
Results and discussions
Photocatalytic Activity equation/description
It was found that the photocatalytic activity was the highest for NM110 and NM113 and the lowest for
NM112 (Table 1). MN111 did not show the first order kinetics and hence it was not possible to estimate
the rate constant. The rate constant did not show a strong correlation with specific surface area (Figure 4).
Although NM113 is supposed to be a non-nano material, the photocatalytic activity was as high as
NM110. When the photoactivity rates are normalised with specific surface area values, NM110 showed
the highest photocatalytic activity per unit surface area (Figure 5). The results could be explained as
surface defects acting as charge recombination sites to prevent photocatalysis. NM112 has near spherical
shapes that are expected to have a large number of surface defects. On the other hand, MN110 and
MN113 have geometrical shape particles that indicate high crystallinity and a low number of surface
defects.
Overall remarks, attachments
Attached full study report
Attached full
study report
NM_110_ANNEX_A46_OECD ZnO Photocatalysis Australia Deakin.pdf / 291.74 KB
(application/octet-stream): ENV/JM/MONO(2015)15/ANN1
Illustration (picture/graph)
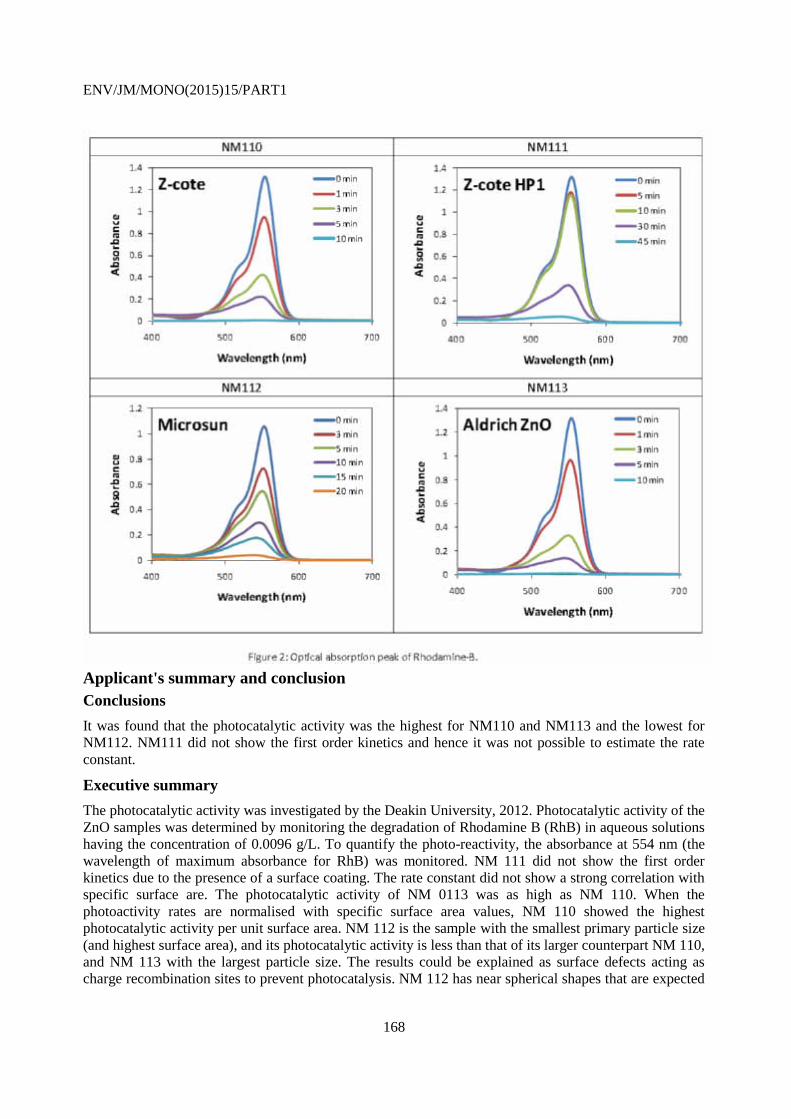
ENV/JM/MONO(2015)15/PART1
168
Applicant's summary and conclusion
Conclusions
It was found that the photocatalytic activity was the highest for NM110 and NM113 and the lowest for
NM112. NM111 did not show the first order kinetics and hence it was not possible to estimate the rate
constant.
Executive summary
The photocatalytic activity was investigated by the Deakin University, 2012. Photocatalytic activity of the
ZnO samples was determined by monitoring the degradation of Rhodamine B (RhB) in aqueous solutions
having the concentration of 0.0096 g/L. To quantify the photo-reactivity, the absorbance at 554 nm (the
wavelength of maximum absorbance for RhB) was monitored. NM 111 did not show the first order
kinetics due to the presence of a surface coating. The rate constant did not show a strong correlation with
specific surface are. The photocatalytic activity of NM 0113 was as high as NM 110. When the
photoactivity rates are normalised with specific surface area values, NM 110 showed the highest
photocatalytic activity per unit surface area. NM 112 is the sample with the smallest primary particle size
(and highest surface area), and its photocatalytic activity is less than that of its larger counterpart NM 110,
and NM 113 with the largest particle size. The results could be explained as surface defects acting as
charge recombination sites to prevent photocatalysis. NM 112 has near spherical shapes that are expected

ENV/JM/MONO(2015)15/PART1
169
to have a large number of surface defects. On the other hand, MN110 and MN113 have geometrical shape
particles that indicate high crystallinity and a low number of surface defects results in higher
photocatalytic activities.
Endpoint study record: WoE_2012-03-
06_Australia_CSIRO_Photocatalytic_Activity
Administrative Data
Purpose flag weight of evidence
Study result type experimental result
Reliability 2 (reliable with restrictions)
Rationale for
reliability incl.
deficiencies
Limited documentation of the data evaluation was provided in the full study reports.
Nevertheless, the study was regarded as scientifically acceptable and was regarded as reliable
with restrictions. This used dye was regarded as sufficient for photocatalytic activity
determination in organic solvent. Furthermore DPPH and Rhodamine are recommended by
OECD 2014
Data source
Reference
Reference
type
Author Year Title Bibliographic
source
Testing
laboratory
Report
no.
Owner
company
Company
study no.
Report
date
study
report
Casey,
Yin,
McCall
2012 Summary of
physicochemical
properties of
OECD Zinc
Oxide (ZnO)
samples -
Photocatalytic
activity
CSIRO 2012-
03-06
Data access
data submitter is data owner
Data protection claimed
yes, but willing to share
Materials and methods
Test guideline
Qualifier Guideline Deviations
no guideline followed
Methods
other: UV-vis spectroscopy
Principles of method if other than guideline
Degradation of 1,1-diphenyl-2-picrylhydrazyl (DPPH) dye in the presence of nanomaterial, detected by
UV-Visspectroscopy.
Details on methods and data evaluation
Photocatalytic activity of the ZnO samples was determined by monitoring the degradation of 1,1-
diphenyl-2- picrylhydrazyl (DPPH), following the procedure described by Dransfield et al (2000). To
quantify the photo-reactivity, the absorbance at 520 nm (the wavelength of maximum absorbance for the
purple DPPH radical) was monitored. Two 62.5ml mixtures of 1:1 Mineral Oil White Light
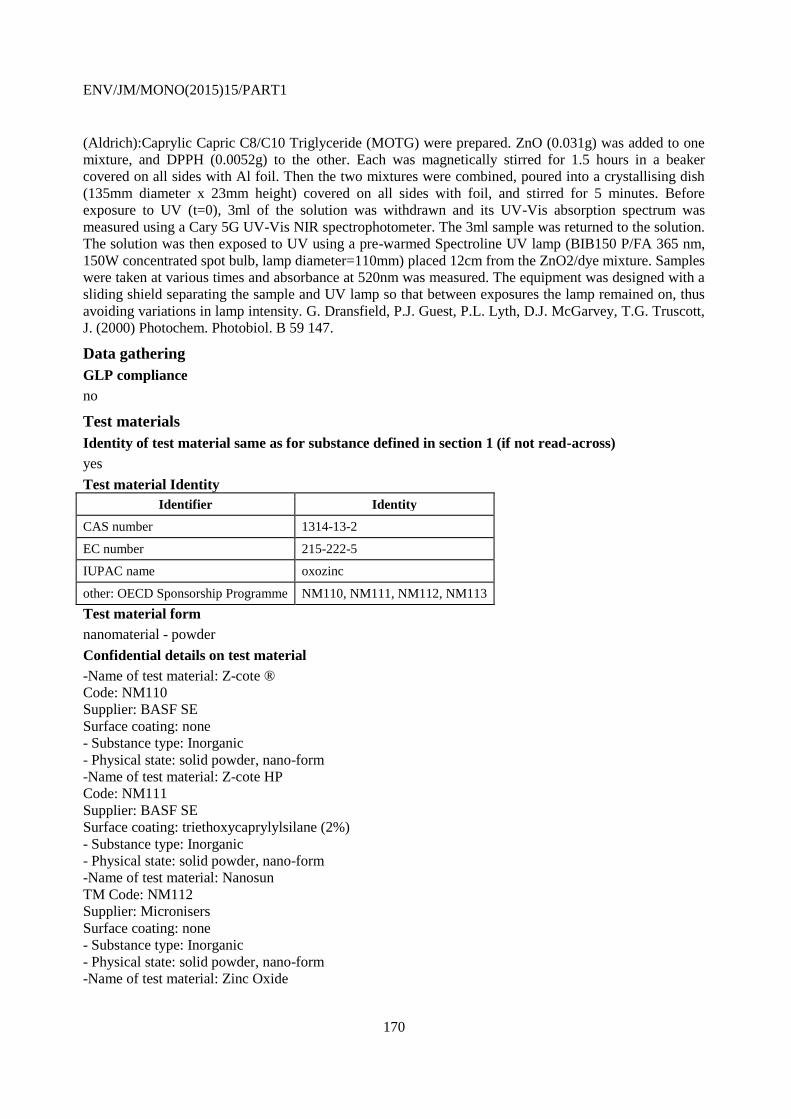
ENV/JM/MONO(2015)15/PART1
170
(Aldrich):Caprylic Capric C8/C10 Triglyceride (MOTG) were prepared. ZnO (0.031g) was added to one
mixture, and DPPH (0.0052g) to the other. Each was magnetically stirred for 1.5 hours in a beaker
covered on all sides with Al foil. Then the two mixtures were combined, poured into a crystallising dish
(135mm diameter x 23mm height) covered on all sides with foil, and stirred for 5 minutes. Before
exposure to UV (t=0), 3ml of the solution was withdrawn and its UV-Vis absorption spectrum was
measured using a Cary 5G UV-Vis NIR spectrophotometer. The 3ml sample was returned to the solution.
The solution was then exposed to UV using a pre-warmed Spectroline UV lamp (BIB150 P/FA 365 nm,
150W concentrated spot bulb, lamp diameter=110mm) placed 12cm from the ZnO2/dye mixture. Samples
were taken at various times and absorbance at 520nm was measured. The equipment was designed with a
sliding shield separating the sample and UV lamp so that between exposures the lamp remained on, thus
avoiding variations in lamp intensity. G. Dransfield, P.J. Guest, P.L. Lyth, D.J. McGarvey, T.G. Truscott,
J. (2000) Photochem. Photobiol. B 59 147.
Data gathering
GLP compliance
no
Test materials
Identity of test material same as for substance defined in section 1 (if not read-across)
yes
Test material Identity
Identifier Identity
CAS number 1314-13-2
EC number 215-222-5
IUPAC name oxozinc
other: OECD Sponsorship Programme NM110, NM111, NM112, NM113
Test material form
nanomaterial - powder
Confidential details on test material
-Name of test material: Z-cote ®
Code: NM110
Supplier: BASF SE
Surface coating: none
- Substance type: Inorganic
- Physical state: solid powder, nano-form
-Name of test material: Z-cote HP
Code: NM111
Supplier: BASF SE
Surface coating: triethoxycaprylylsilane (2%)
- Substance type: Inorganic
- Physical state: solid powder, nano-form
-Name of test material: Nanosun
TM Code: NM112
Supplier: Micronisers
Surface coating: none
- Substance type: Inorganic
- Physical state: solid powder, nano-form
-Name of test material: Zinc Oxide

ENV/JM/MONO(2015)15/PART1
171
Code: NM113
Supplier: Sigma-Aldrich
Surface coating: none
- Substance type: Inorganic
- Physical state: solid powder, nano-form
Results and discussions
Remarks on results incl. tables
Figure 1(a) presents typical absorption spectra of DPPH in a dispersion containing NM112, upon
exposure to UV irradiation for various times. With increasing exposure time, the absorbance (C)
reducesfrom its initial level (C0). Figure 1(b) presents the absorbance ratio (C/C0) as a function of time
for DPPH for various samples. The data were further analysed by comparing (i) the decay time (the time
required to bleach the dye) and (ii) the first order rate constant of the radical consumption (A) calculated
by using the linear relationship between ln(c/c0) and irradiation time t.
The decay times and rate constants for the ZnO samples are listed in the Table. A shorter decay time and
larger rate constant corresponds to higher photocatalytic activity. In addition to charge transfer and
subsequent radical formation, recombination of separated electrons and holes in/on the ZnO particle may
be effective in suppressing photocatalytic activity. Theoretically, photocatalytic activity should decrease
with increasing particle size (or decreasing surface area) because recombination processes dominate at
larger sizes. However, the expected correlation between surface area and photocatalytic activity does not
appear to be supported by the data. NM112 is the sample with the smallest primary particle size (and
highest surface area), and yet its photocatalytic activity is less than that of its larger counterpart NM110,
and comparable to NM113 with the largest particle size. For ZnO, it has been reported that as particle size
decreases to the nanoscale (40-80nm) photo-reactivity increases, but observed increases are substantially
lower than those expected from associated increases in surface area. Theoretically effects normally
associated with high surface area may somehow be contributing to this observed deviation. The influence
on photocatalytic activity of the combination of radical surface recombination and surface migration rates
with availability of surface adsorbed species may be greater than that of volume recombination.
A comparison of the data in Figure 1(b) and Table for the BASF-supplied samples NM110 (uncoated)
and NM111 (similar size to NM110 but with a surface coating), indicates that the presence of a surface
coating appears to mitigate, but not eliminate, photocatalytic activity.
Decay times and rate constants of DPPH used as a probe to monitor the photocatalytic activity of the ZnO
samples NM110, NM111, NM112 and NM113.
DPPH as probe
Decay time (min) Rate constant (min-1)
NM110 9 0.124
NM111 11 0.112
NM112 11 0.069
NM113 15 0.089
A shorter decay time and larger rate constant corresponds to higher photocatalytic activity.
Overall remarks, attachments
Remarks on results including tables and figures
Figure 1. (a) Typical absorption spectra of the dye DPPH in a dispersion of NM112 after exposure to UV
irradiation for varying times. (b) The absorbance at time t relative to the initial absorbance at time zero
(C/C0) is plotted as a function of UV exposure time for all four ZnO samples NM110, NM111, NM112
and NM113. Data denoted by DPPH are for the dye alone without ZnO. Data for the photocatalytic P25
(TiO2) are included for comparison.
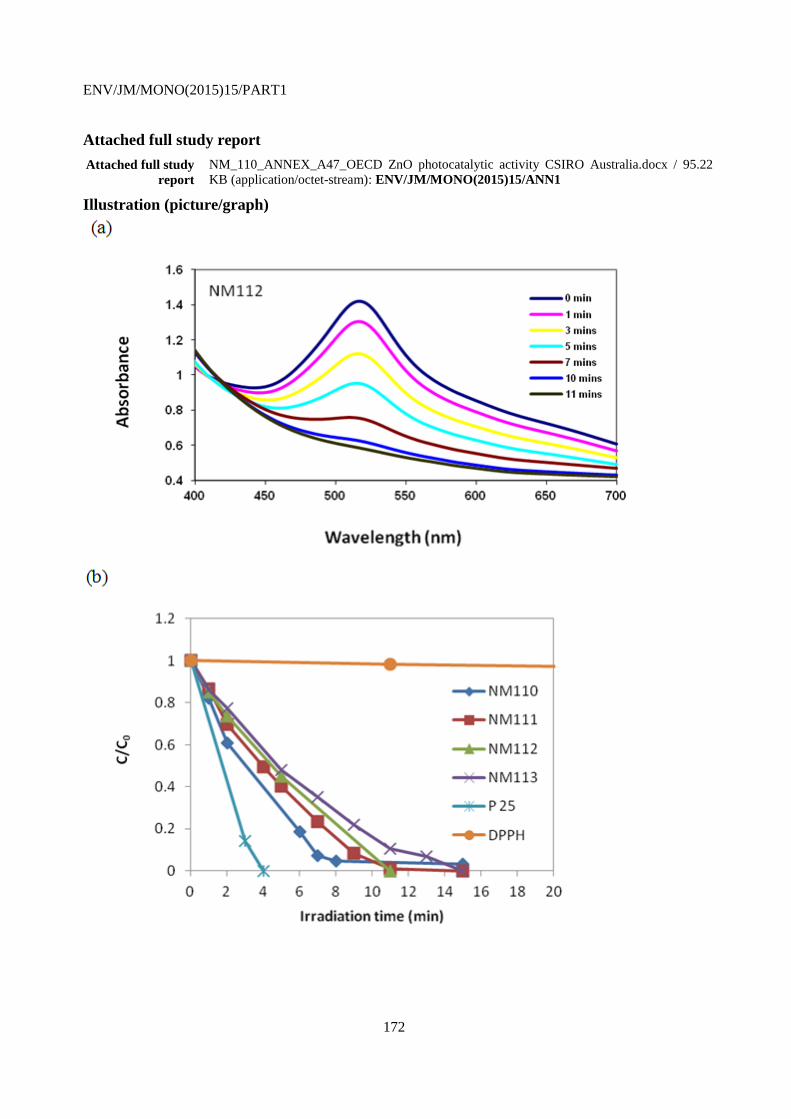
ENV/JM/MONO(2015)15/PART1
172
Attached full study report
Attached full study
report
NM_110_ANNEX_A47_OECD ZnO photocatalytic activity CSIRO Australia.docx / 95.22
KB (application/octet-stream): ENV/JM/MONO(2015)15/ANN1
Illustration (picture/graph)

ENV/JM/MONO(2015)15/PART1
173
Applicant's summary and conclusion
Conclusions
Theoretically, photocatalytic activity should decrease with increasing particle size (or decreasing surface
area) because recombination processes dominate at larger sizes. However, the expected correlation
between surface area and photocatalytic activity does not appear to be supported by the data obtained for
NM110, NM111, NM112 and NM113. NM110 is more photocatalytic than the other three ZnO samples,
in the system used here.
Executive summary
The photocatalytic activity was investigated in a study conducted by CSIRO, 2012 by monitoring the
degradation of 1,1-diphenyl-2-picrylhydrazyl (DPPH) in mixtures of 1:1 Mineral Oil White Light :
Caprylic Capric C8/C10 Triglyceride (MOTG), following the procedure described by Dransfield et al.,
2000. To quantify the photo-reactivity, the absorbance at 520 nm (the wavelength of maximum
absorbance for the purple DPPH radical) was monitored. The data were analysed by comparing (i) the
decay time (the time required to bleach the dye) and (ii) the first order rate constant of the radical
consumption calculated by using the linear relationship between ln(c/c0) and irradiation time t. A shorter
decay time and larger rate constant corresponds to higher photocatalytic activity. In addition to charge
transfer and subsequent radical formation, recombination of separated electrons and surface defects in/on
the ZnO particle may be effective in suppressing photocatalytic activity. Theoretically, photocatalytic
activity should decrease with increasing particle size (or decreasing surface area) because recombination
processes dominate at larger sizes. However, the expected correlation between surface area and
photocatalytic activity was not supported by the data. NM-112 is the sample with the smallest primary
particle size (and highest surface area), and yet its photocatalytic activity is less than that of its larger
counterpart NM-110, and comparable to NM-113 with the largest particle size. The influence on
photocatalytic activity of the combination of radical surface recombination and surface migration rates
with availability of surface adsorbed species may be greater than that of volume recombination. A
comparison of the data for the samples NM-110 (uncoated) and NM-111 (similar size to NM-110 but
with a surface coating), indicates that the presence of a surface coating appears to mitigate, but not
eliminate, photocatalytic activity.
4.35 Radical formation potential
Endpoint study record: RL4_2010-12-09_NPL for PROSPECT_Radical
formation potential_Photocatalytic conditions
Administrative Data
Purpose flag key study
Study result type experimental result
Reliability 4 (not assignable)
Rationale for reliability
incl. deficiencies
Limited documentation of the full study report was available. Based on the
provided data no further conclusion could be achieved.

ENV/JM/MONO(2015)15/PART1
174
Data source
Reference
Reference
type
Author Year Title Bibliographic
source
Testing
laboratory
Report
no.
Owner
company
Company
study no.
Report
date
study
report
National
Physical
Laboratory
2010 Interim Report
on the Physico-
Chemical
Characterisation
of PROSPEcT
Nanomaterials.
unpublpished
report
National
Physical
Laboratory
Hampton
Road,
Teddington,
Middlesex,
TW11 0LW
2010-
09-01
Data access
data submitter is data owner
Data protection claimed
yes, but willing to share
Materials and methods
Test guideline
Qualifier Guideline Deviations
no guideline followed
Principles of method if other than guideline
The photocatalytic activity of materials refers to their ability to create electron-hole pairs under light
irradiation, which then generate reactive oxygen species (ROS) such as free radicals (e.g. superoxide
radicals, hydroxyl radicals, etc.), hydrogen peroxide, singlet oxygen, etc.
Details on methods and data evaluation
- Irradiation was performed on groups of 40 microcentrifuge tubes. The tubes were placed vertically
under the centre of the lamp of the solar simulator, on an in-house made polystyrene holder, their cups
having been removed. - The samples were subjected to 10min periods of irradiation, followed by 5min
period of non-irradiation to reduce sample overheating.- After each 10 min period, 1x3 samples for each
NP/media combination and controls were removed from the irradiations.- Samples irradiated for 0 min,
10 min, 20 min, 30 min, 40 min and 60 min were collected for each NP/media combination and controls.-
The samples containing NPs
Data gathering
Instruments
1kW Solar Simulator (Newport Corporation, Stratford, CT)Lambda 850 UV-Vis spectrometerPlate-reader
Victor 1420 multilabel counter (Perkin Elmer)
Calibration
The instrument wavelength calibration was checked using Holmium glass standards (Serial # 9393,Starna
Scientific,Hainault, Uk)
GLP compliance
no
ENV/JM/MONO(2015)15/PART1
175
Test materials
Identity of test material same as for substance defined in section 1 (if not read-across)
yes
Test material Identity
Identifier Identity
CAS number 1314-13-2
EC number 215-222-5
IUPAC name oxozinc
other: OECD Sponsorship Programme NM110, NM111, NM112, NM113
Test material form
nanomaterial - powder
Confidential details on test material
-Name of test material: Z-cote ®
Code: NM110
Supplier: BASF SE
Surface coating: none
- Substance type: Inorganic
- Physical state: solid powder, nano-form
-Name of test material: Z-cote HP
Code: NM111
Supplier: BASF SE
Surface coating: triethoxycaprylylsilane (2%)
- Substance type: Inorganic
- Physical state: solid powder, nano-form
-Name of test material: Nanosun
TM Code: NM112
Supplier: Micronisers
Surface coating: none
- Substance type: Inorganic
- Physical state: solid powder, nano-form
-Name of test material: Zinc Oxide
Code: NM113
Supplier: Sigma-Aldrich
Surface coating: none
- Substance type: Inorganic
- Physical state: solid powder, nano-form
Results and discussions
Remarks on results incl. tables
Absorbance readings at 352 nm after being irradiated with solar simulator at 1000 W/m2, for 60 minutes.
Overall remarks, attachments
Attached full study report
Attached full
study report
NM_110_ANNEX_A45_FREE RADICAL FORMATION UNDER PHOTOCATALYTIC
CONDITIONS.doc / 78.5 KB (application/octet-stream): ENV/JM/MONO(2015)15/ANN1
Attached full
study report
NM_110_ANNEX_A02_FINALINTERIM REPORT2010corrected.pdf / 1.05 MB
(application/octet-stream): ENV/JM/MONO(2015)15/ANN6
ENV/JM/MONO(2015)15/PART1
176
Applicant's summary and conclusion
Executive summary
NPL, 2010 investigated the radical formation potential. The test items were dispersed in four different
media in the presence of KI (deionized water, seawater, daphnia and fish media) and the dispersions were
exposed for 60 minutes, under 1000 W/m2 white light irradiation. Anatase (TiO2) was used as positive
control. Results showed that there was a certain level of tri-iodide (I3-) measured in the irradiated sample.
Tri-iodide was suppressed in seawater and may be attributed to a higher concentration of ions in this
media. Results for Anatase (TiO2), being the most active photocatalytic material, show a much higher
rate of tri-iodide formation than the corresponding zinc oxide NMs. In particular, the absorbance signal
was highest in deionized water, lower in daphnia and fish media and when in seawater, the absorbance
signal was reduced (as in the corresponding blank i.e. seawater with no Anatase). It was shown that the
absorbance signal of NM 111 is much higher in seawater than when dispersed in the other three media. In
the course of the present study no explanation was found. In general, for the ZnO nanomaterials the
absorbance signals were within a similar range to that of the corresponding irradiated blank (Samples that
were kept in the dark exhibited no absorption peak at 352 nm) indicating no differences Radical
formation potential between bulk and nano ZnO.