ENV /EP OC/W P B W E(2015)1/R EV1 For Official Use - OECD
72
For Official Use ENV/EPOC/WPBWE(2015)1/REV1 Organisation de Coopération et de Développement Économiques Organisation for Economic Co-operation and Development 28-Sep-2015 ___________________________________________________________________________________________ _____________ English - Or. English ENVIRONMENT DIRECTORATE ENVIRONMENT POLICY COMMITTEE Working Party on Biodiversity, Water and Ecosystems THE ECONOMICS OF MARINE PROTECTED AREAS Paris, 21-22 October, 2015 This first draft of the project on the economics of marine protected areas is for discussion at the 8th WPBWE meeting. Written comments on this document are requested no later than 13 November, 2015. ACTION REQUIRED: For discussion. Contact person: Katia Karousakis ENV/CBW, Tel. (33-1) 45 24 98 83; email: [email protected] JT03382572 Complete document available on OLIS in its original format This document and any map included herein are without prejudice to the status of or sovereignty over any territory, to the delimitation of international frontiers and boundaries and to the name of any territory, city or area. ENV/EPOC/WPBWE(2015)1/REV1 For Official Use English - Or. English
-
Upload
khangminh22 -
Category
Documents
-
view
0 -
download
0
Transcript of ENV /EP OC/W P B W E(2015)1/R EV1 For Official Use - OECD

For Official Use ENV/EPOC/WPBWE(2015)1/REV1 Organisation de Coopération et de Développement Économiques Organisation for Economic Co-operation and Development 28-Sep-2015
___________________________________________________________________________________________
_____________ English - Or. English ENVIRONMENT DIRECTORATE
ENVIRONMENT POLICY COMMITTEE
Working Party on Biodiversity, Water and Ecosystems
THE ECONOMICS OF MARINE PROTECTED AREAS
Paris, 21-22 October, 2015
This first draft of the project on the economics of marine protected areas is for discussion at the 8th WPBWE
meeting. Written comments on this document are requested no later than 13 November, 2015.
ACTION REQUIRED: For discussion.
Contact person: Katia Karousakis ENV/CBW, Tel. (33-1) 45 24 98 83; email:
JT03382572
Complete document available on OLIS in its original format
This document and any map included herein are without prejudice to the status of or sovereignty over any territory, to the delimitation of
international frontiers and boundaries and to the name of any territory, city or area.
EN
V/E
PO
C/W
PB
WE
(2015)1
/RE
V1
For O
fficial U
se
En
glish
- Or. E
ng
lish

ENV/EPOC/WPBWE(2015)1/REV1
2
NOTE BY THE SECRETARIAT
This report presents a first draft of the project on The Economics of Marine Protected Areas, as
mandated under the EPOC 2015-2016 programme of work, and agreed at the 7th WPBWE meeting in
February, 2015. The document provides an initial overview of four of the five issues to be addressed in this
project. Comments provided by delegates on the scoping paper [ENV/EPOC/WPBWE(2015)1] on which
Chapter 1 has built, have been addressed.
Delegates are requested to (i) provide comments on the initial scope, structure and content of this first
draft; and (ii) provide additional examples based on recent domestic experiences with MPA management,
including challenges, insights, and lessons learned.
In addition, Delegates are invited to contact the Secretariat if they wish to provide a short presentation
at the 8th WPBWE meeting, during the agenda item on The Economics of Marine Protected Areas.
Presentations are requested to cover the following issues and be limited to 5 slides:
Introduction/overview.
MPA siting criteria and extent of CBA.
Monitoring and reporting: methods and cost.
Compliance and enforcement: methods, effectiveness and cost.
Other key challenges and lessons learned.
Due to time constraints, the Secretariat may need to select three speakers to present; however, all of
the presentations received would be made available on the WPBWE Clearspace site.
Next steps foreseen are as follows:
Incorporate comments received by delegates on this draft.
Add a section on Adaptive management in Chapter 3.
Add a section on Governance in Chapter 3.
Draft Chapter 5 on Effective Policy Mixes.
Add examples and insights on MPA design and implementation based on information received
from Delegates.
Further edits and revisions throughout the existing chapters to address remaining gaps, reflect
new material and to highlight policy relevant outcomes.

ENV/EPOC/WPBWE(2015)1/REV1
3
TABLE OF CONTENTS
EXECUTIVE SUMMARY ............................................................................................................................. 5
1. MARINE BIODIVERSITY AND THE ROLE OF MARINE PROTECTED AREAS: AN
INTRODUCTION ........................................................................................................................................... 7
1.1 Marine biodiversity and the international context............................................................................. 7 1.2. Trends, values and policy instruments related to marine biodiversity .............................................. 8 1.3 The role of MPAs and an overview of current status and trends .................................................... 16 References .................................................................................................................................................. 20
2. THE ECONOMICS OF MARINE PROTECTED AREAS ................................................................... 24
2.1 The benefits and costs of MPAs...................................................................................................... 24 2.2 Using cost-benefit analysis to inform MPA decision-making ........................................................ 29 References .................................................................................................................................................. 31
3. EFFECTIVE MANAGEMENT OF MARINE PROTECTED AREAS ................................................ 37
3.1 Clear goals and objectives ............................................................................................................... 37 3.2 Siting, size and number of MPAs ................................................................................................... 37 3.3 Monitoring and reporting ................................................................................................................ 40 3.4 Compliance and enforcement .......................................................................................................... 45 References .................................................................................................................................................. 47
4. SUSTAINABLE FINANCING OF MARINE PROTECTED AREAS ................................................. 52
4.1 Financing instruments and approaches ........................................................................................... 52 4.2 Developing a Finance Strategy for MPAs....................................................................................... 63 References .................................................................................................................................................. 68
Tables
Table 1.1. Examples of marine and coastal ecosystem services ............................................................. 12 Table 1.2. Policy instruments for marine biodiversity conservation and sustainable use ....................... 14 Table 1.3. Drivers of marine biodiversity loss and instruments to address them .................................... 16 Table 1.4. Recent designations of large MPAs and potential sites under development .......................... 19 Table 2.1. Major Benefits and Costs of MPAs ........................................................................................ 25 Table 2.2. Examples of MPA valuation studies ...................................................................................... 26 Annex Table 2.1. Costs of MPAs ........................................................................................................... 33 Table 3.1 Possible monitoring elements for MPAs ................................................................................ 43 Annex Table 3.1. Goals of different MPAs ............................................................................................ 50 Table 4.1. Financing of MPAs: Selected examples ................................................................................. 53 Table 4.2. Examples of MPA user fees ................................................................................................... 58 Table 4.3 Estimated cost of the MPA network in French waters ........................................................... 64 Table 4.4. Financing marine conservation and sustainable use ............................................................... 67

ENV/EPOC/WPBWE(2015)1/REV1
4
Figures
Figure 1.1 Global trends in the state of world marine fish stocks, 1974-2011 ..................................... 9 Figure 1.2. Trends in global MPA coverage over time ........................................................................ 17 Figure 1.3. Percentage of marine area (0-200 nautical miles) covered by protected areas in the
regions ............................................................................................................................... 17 Figure 3.1 Conducting MPA Management Effectiveness Evaluation ................................................ 42
Boxes
Box 1.1 Examples of costs of inaction ...................................................................................................... 13 Box 2.1 The Total Economic Value of Marine Protected Areas .............................................................. 24 Box 2.2 Global costs of MPA expansion and models to predict establishment and management costs at
an MPA ..................................................................................................................................... 29 Box 2.3 Examples of CBA of Marine Protected Areas ............................................................................ 30 Box 3.1 The 7 key steps of the MPA Dashboard ...................................................................................... 44 Box 3.2 Most common drivers of non-compliance in MPAs in the Solomon Islands .............................. 45 Box 4.1 Chumbe Island Coral Park .......................................................................................................... 63 Box 4.2 Sustainable Finance Strategy and Plan for the Belize Protected Area System ........................... 65

ENV/EPOC/WPBWE(2015)1/REV1
5
EXECUTIVE SUMMARY
Marine Protected Areas (MPAs) have been receiving increasing attention from policy makers as an
instrument for marine biodiversity conservation and sustainable use. MPAs cover about 3.4% of the total
marine environment and, under the Convention on Biological Diversity (CBD), Parties have agreed to
increase this to 10% by 2020. In addition to protecting habitats, and buffering against storms and erosion,
MPAs can provide multiple other ecosystem services that are fundamental for human well-being, including
for fisheries, tourism, recreation and carbon storage. Total ecosystem service benefits of achieving a 10%
coverage of MPAs have been estimated at USD 622-923 billion over the period 2015-2050.
While some progress has been made in expanding MPA coverage over the past few years, further
efforts are required. In addition however, substantial further efforts are needed to enhance the design and
implementation of MPAs, as evidence suggests that in many cases, they are not meeting their intended
objectives. Key challenges include strategically siting MPAs so as to maximise environmental and socio-
economic benefits in a cost-effective way, putting in place robust monitoring and reporting frameworks,
ensuring solid compliance and enforcement mechanisms, and mobilising sufficient finance to ensure
sustainable management. Issues this report considers therefore include1:
What are the costs and benefits associated with MPAs?
Across nations, how and why have MPAs been chosen as the appropriate management response?
How are MPAs being sited in practice? To what extent are siting decisions informed by
economic considerations (i.e. cost-benefit analysis), as well as other factors such as climate
change?
How effective have MPAs been in addressing the threats caused by e.g., over-fishing and habitat
destruction, and in conserving biodiversity more broadly?
What type of monitoring, compliance and enforcement regimes have been adopted across
different MPAs and how to they compare in terms of effectiveness and cost?
How are MPAs financed and what options are there to scale this up?
How have MPAs been implemented together with other policy instruments, to more
comprehensively and effectively address the multiple drivers of marine biodiversity loss?
Some preliminary insights include:
1. While studies evaluating the costs and benefits of MPAs do exist, in general economic evaluation
is not yet widespread and is not being used to help inform the design and implementation of
MPAs. Siting of MPAs needs to be undertaken in more strategic manner, to enhance the
environmental as well as cost-effectiveness of MPAs. Software tools such as Marxan and
MarZone which aid systematic reserve design have been used in a few cases but should be
adopted more widely.
1 Note that this first draft does not yet address all of these issues.

ENV/EPOC/WPBWE(2015)1/REV1
6
2. Monitoring of MPAs, which is important initially in order to establish ecological and
socioeconomic baseline data, as well as afterwards, to assess trends in performance over time,
has often not been undertaken as rigorously as needed. Challenges encountered include lack of
sufficient human resources, equipment, and infrastructure. Monitoring protocols can help to
provide guidance to MPA managers, as well as to streamline monitoring methods across MPAs
so as to facilitate comparison. Creating databases with publicly available information can help to
increase transparency and enable the sharing of information and lessons learned across different
MPAs and their respective management approaches.
3. Compliance and enforcement methods also vary substantially across MPAs, with existing studies
suggesting that few MPAs have a robust compliance and enforcement regime in place. Overall,
adequately financing MPAs is a major challenge and is likely to be exacerbated as countries
strive to meet the 10% Target under the CBD. MPA financing strategies, which include
identifying the financing needs, and the possible instruments through which finance can be
mobilised, should form an integral component of a MPA management plan.

ENV/EPOC/WPBWE(2015)1/REV1
7
1. MARINE BIODIVERSITY AND THE ROLE OF MARINE PROTECTED AREAS:
AN INTRODUCTION
1.1 Marine biodiversity and the international context
1. Marine ecosystems are immensely varied both in type and geographical extent. They encompass
oceans, salt marshes and intertidal zones estuaries and lagoons, mangroves and coral reefs, the deep sea
and the sea floor2. Covering about 70% of the earth’s surface, these ecosystems play a crucial role in
human welfare, providing social, economic, and environmental benefits to the earth’s growing population.
It is estimated, for example, that 2.6 billion people rely on oceans for their protein intake (through seafood)
(FAO, 2014), and that more than 500 million people are engaged in ocean-related livelihoods (UNDP,
2012). Marine ecosystems also provide a variety of other services that are critical for human wellbeing,
such as coastal protection, marine biodiversity, and carbon sequestration. Oceans for example, contain
nearly 300,000 identified species (though actual numbers may lie in the millions) and have absorbed one
third of the carbon dioxide resulting from human activities (Bijma et al, 2013), while mangroves and coral
reefs provide valuable protection against extreme weather events such as storms and floods
2. These ecosystems are under increasing pressure due to human activity. Today, 60% of the
world’s major marine ecosystems have been degraded or are being used unsustainably (UNEP, 2011).
Many fisheries are over-exploited, with some stocks on the verge of collapse, and coral reefs are bleaching
due to ocean acidification and other pressures. Concurrently, pollution from land based sources including
marine litter is threatening species and marine habitats and climate change compounds these effects,
altering both the thermal and chemical characteristics of the ocean as well as its dynamics and nutrient
availability (Bijma et al, 2013). Since the 1980’s, for example, an estimated 20% of global mangroves have
been lost and 19% of coral reefs have disappeared (UNDP, 2012). The welfare costs that this imposes on
society are high - estimates suggest that the cumulative economic impact of poor ocean management
practices is in the order of USD 200 billion per year (UNDP, 2012).
3. Growing awareness of the significance of the challenge as well as the need for more co-ordinated
action to counteract these trends has put the conservation and sustainable use of the marine environment
firmly on the international agenda. Marine biodiversity figures among the Aichi Targets under the
Convention on Biological Diversity (CBD), including Target 11 on marine protected areas: “By 2020, at
least…10% of coastal and marine areas, especially areas of particular importance for biodiversity and
ecosystem services, are conserved through effectively and equitably managed, ecologically representative
and well-connected systems of protected areas and other effective area-based conservation measures…” :
Marine biodiversity also features as one of the proposed UN Sustainable Development Goals (SDG’s) for
the post 2015 development agenda i.e., “Conserve and sustainably use the oceans, seas and marine
resources for sustainable development” (UN, 2014). More concerted policy efforts will therefore be needed
to curb current trends if these targets are to be achieved.
2 Marine ecosystems can be contrasted with freshwater ecosystems, which have a lower salt content.
http://en.wikipedia.org/wiki/Marine_ecosystem.

ENV/EPOC/WPBWE(2015)1/REV1
8
1.2. Trends, values and policy instruments related to marine biodiversity
1.2.1 Trends in state of and pressures on marine biodiversity
4. The state of and pressures on marine biodiversity are alarming and available state indicators point
overwhelmingly to declining trends.3 According to the Living Planet Index, marine species declined by
39% between 1970 and 2010 (WWF, 2010) and currently over 550 species of fish and invertebrates are
listed as threatened (critically endangered, endangered and vulnerable) in the IUCN Red List (Pitcher and
Cheung, 2013)4. According to the same list, coral species are moving towards increased extinction risk
most rapidly and coral reefs have been singled out as an ecosystem that is probably under more immediate
threat from human impacts than any other (Marine Pollution Bulletin 2013). 19% of coral reefs have been
effectively destroyed and 24% are under threat due to human pressures such as unsustainable tourism,
coastal development and overfishing (Wilkinson C, 2004; 2008). Some hotspots are particularly fragile,
such as within the Great Barrier Reef where hard coral cover has declined from 28 to 14% since 1986 and
the rate of decline has increased substantially in recent years (De áth et al. 2012).5
5. Turning to the state of world fish stocks, FAO (2014) finds that in 2011, 28.8 percent of fish
stocks were estimated as fished at a biologically unsustainable level (and therefore overfished), compared
to 10% in 1974 (Figure 1). Of the total number of stocks assessed in 2011, fully fished stocks accounted
for 61.3 percent and underfished stocks 9.9 percent (separated by the line in Figure 1). Branch et al (2011)
find that at present 28-33% of all stocks are overexploited and 7-13% of all stocks are collapsed.
6. Moreover, the IPCC (2014) finds that ocean acidification has increased by around 26% since
pre-industrial times6 and notes that, based on historical evidence, recovery from such changes in ocean pH
can take many thousands of years. It is projected that continued anthropogenic carbon dioxide emissions
will further increase ocean acidity to levels that will have widespread impacts, mostly deleterious, on
marine organisms and ecosystems. Ocean acidification is particularly a threat to coral reefs and calcifying
animals such as shellfish.
3 A World Ocean Assessment is currently underway, which is due for release shortly.
http://www.worldoceanassessment.org/
4 While the marine data is poor, a first IUCN Red List of Threatened Species assessment available for all known
species of marine shore-fish, marine mammals, sea turtles, sea birds, corals, mangroves and sea grasses in a major
marine biogeographic region of tropical eastern Pacific, indicated that 12% are under threat.
5 The decline has been most severe on the reefs south of the latitude 20 degrees (near Bowen) particularly since 2006.
Since then hard coral cover has fallen from about 35 to 8% in the southern third of the region.
6 Measured as hydrogen ion concentration.

ENV/EPOC/WPBWE(2015)1/REV1
9
Figure 1.1. Global trends in the state of world marine fish stocks, 1974-2011
Notes: Dark shading = within biologically sustainable levels; light shading = at biologically unsustainable levels.
The light line divides the stocks within biologically sustainable levels into two subcategories: fully fished (above the line) and
underfished (below the line). Source: FAO, 2014.
7. The main pressures driving marine biodiversity and ecosystems loss and decline include
overfishing, pollution, habitat destruction, climate change and invasive alien species. Each of these drivers
is summarised below.
Over-fishing
8. With rising incomes, growing population and evolving diets, demand for fish has been steadily
increasing. Global fish production is increasing at an average annual rate of 3.2%, outpacing world
population growth at 1.6 % (FAO, 2014). In 2012, total global fish capture production was 91.3 million
tonnes with the share of fish production used for direct human consumption increasing from 70% in the
1980s to more than 85% in 2012 (FAO, 2014). Fish continues to be the most traded food commodity in the
world. Aquaculture is one of the fastest growing food producing sectors and provides half of all fish for
human consumption. Its production has expanded at an average annual rate of 6.2% in the period between
2000 and 2012 (FAO, 2014). The total number of fishing vessels in the world was estimated to be about
4.72 million in 2012, with efforts to reduce overcapacity in fishing fleets not resulting in effective
outcomes across the board (FAO, 2014). In addition, world fishery production is expected to be 17%
higher by 2023 (OECD-FAO, 2014), mainly due to projected increases in aquaculture.
9. Illegal, unreported and unregulated (IUU) fishing also continues to present challenges. About
11-26 million tons of fish is lost to IUU - i.e. a mean loss of 18% across all fisheries (Agnew et al, 2009).
Distinct from this is the issue of wastage, where eight percent, or 7.2 million tonnes, of the global fisheries
catch consists of non-target species, which are subsequently discarded (FAO, 2004), and thus has impacts
on species and ecosystems.

ENV/EPOC/WPBWE(2015)1/REV1
10
Pollution
10. Marine pollution occurs when harmful, or potentially harmful, effects result from the entry into
the ocean of chemicals, particles, industrial, agricultural and residential waste, noise, or the spread of
invasive organisms.7 Most sources of marine pollution are land based (80%, GOC, 2014), often from
nonpoint sources such as agricultural runoff. The pathways of marine pollution include direct discharge;
land run-off; ship pollution (e.g. ballast water and hot water discharge); atmospheric pollution; and deep
sea mining, with the resulting types of pollution consisting of acidification; eutrophication; marine litter;
toxins; and underwater noise. Carbon dioxide emissions are the main driver of ocean acidification. Excess
nutrients lead to eutrophication. For example, 85% of the sewage discharged in the Mediterranean Sea is
untreated, leading to eutrophication. Left unchecked, eutrophication can lead to the creation of dead zones,
as has occurred in different parts of the world including the Gulf of Mexico, Black Sea and the Baltic Sea8.
Habitat destruction
11. Habitat destruction along the coast and in the ocean results from harmful fishing practices such as
trawling or dynamite fishing; poor land use practices in agriculture, coastal development and forestry
sectors; and other human activities such as mining9 and anchoring, as well as tourism and coastal
encroachment. For example, logging and vegetation removal can introduce sediments from soil erosion,
and harbour development and other land-based activities can lead to the destruction of mangroves, which
serve as nurseries for species of fish and shell fish, and provide flood protection. Poor shipping practices
and coastal tourist activities such as snorkelling, boating and scuba diving come in direct contact with
fragile wetlands and coral reefs, consequently damaging marine habitats and degrading the ecosystem
services they provide.
Climate change
12. [Insert 2 sentences on how climate will affect physical and chemical characteristics, and how this
will vary across regions also. See Boyd et al] Climate change is rapidly impacting species and ecosystems
that are already under stress from over fishing and habitat loss. Rising Sea Surface Temperatures (SST)
and sea levels due to thermal expansion of water and melting of the continental glaciers is altering the
behaviour and demographic traits of marine species. Tropical storms and heavy rainfall have physically
damaged coral reefs, marine ecosystems and coastal regions. According to Doney et al (2011), climate
change impacts to marine biodiversity has already resulted in either a loss or degradation of 50% of salt
marshes, 35% of mangroves, 30% of coral reefs and 20% of seagrasses worldwide. Coral reefs are one of
the most vulnerable ecosystems to climate change impacts. Episodes of coral bleaching due to ocean
acidification and anomalously high sea water temperatures have become more frequent in recent times,
leading to coral mortality and declining coral cover, showing no immediate prospects of recovery. Cheung
et al (2009) (cited in the IPCC 5th Assessment Report) have projected climate change impacts to marine
biodiversity to 2050 and predict numerous local extinctions, species invasion, and turnover of over 60% of
present biodiversity with implications for ecological disturbances that potentially disrupt ecosystem
services.
7 Marine pollution has been defined as “the introduction by man, directly or indirectly, of substances or energy into
the marine environment, including estuaries which results or is likely to result in such deleterious effects as harm to
living resources and marine life, hazards to human health, hindrance to marine activities, including fishing and other
legitimate uses of the sea, impairment of quality for use of sea water and reduction of amenities”
(Art.1 (4) UNCLOS).
8 There are reportedly 405 dead zones worldwide covering an ocean expanse of 250,000 km2 (UNDP, 2012).
9 e.g., gravel extraction, oil exploration, and constructions of windmill farms.

ENV/EPOC/WPBWE(2015)1/REV1
11
Invasive alien species
13. The introduction of non-native marine species to marine ecosystems to which they do not belong
constitutes another serious threat to the marine environment. Most of these alien species are rapidly
introduced to a different habitat through ballast water from commercial shipping operations across the
oceans. An estimated 7,000 marine species are carried around the world in ballast water every day
(WWF, 2009). Coastal tourism, boat hulls, eutrophication and marine pollution also move marine species
far from their natural ranges. These foreign organisms are responsible for severe environmental impacts
such as altering native ecosystem by disrupting native habitats, extinction of some marine flora and fauna,
decreased water quality, increasing competition and predation among species, and spread of disease.
Across the oceans, fish, crabs, clams, mussels, and corals that were unintentionally introduced have also
resulted in adverse economic impacts such as collapse of fish stock, damage to coastal areas (smothering of
beaches; decreased recreational opportunities) and cost for control. For example, the comb jelly in the
Black Sea (and most recently invaded Baltic Sea) is held responsible for the collapse of fisheries worth
several million dollars annually (Science Daily, 2008). Invasive alien species affect marine industries
(including fishing and tourism) as well as human health (via the introduction of fatal pathogens such as
cholera bacteria) (see Bax et al. 2003).
1.2.2. Economic value of marine ecosystems
14. While oceans and other marine ecosystems were once considered an inexhaustible supply of
food, an important trade route, as well as a dumping ground for sewage, continuing trends in the state of
and pressures on marine biodiversity is now an increasing cause for concern. Marine resources degradation
is arguably pushing beyond ecologically and economically sustainable thresholds. One of the underlying
reasons for this is that that many of the benefits provided by marine and coastal ecosystems - such as
coastal protection, fish nursery, water purification, marine biodiversity, and carbon sequestration (see
Table 1.1) - are not reflected in the prices of traditional goods and services on the market. This
undervaluation of marine ecosystem services results in under-investment in conservation and lost
opportunities for economic growth and poverty reduction.
15. Estimating and accounting for the economic values associated with these services is important to
help improve decision- and policy-making processes, including management decisions and priority setting
(i.e. to more efficiently allocate resources between competing uses) (Naber et al., 2008), as well as the
design of policy instruments for marine conservation and sustainable use. In Sri Lanka for example, greater
conservation efforts of its salt water marsh, a natural buffer against flooding, were prompted when its
ability to protect cities was valued at USD 5 million annually (Global Partnership for Oceans, n.d.).
16. A number of studies have estimated the economic value of marine ecosystems, examples of
which are highlighted below. While these vary in terms of scope (e.g. different ecosystems, varying
geographical scales), they serve to illustrate that the benefits are considerable.
17. Taking into account the number of people engaged in coastal livelihood activities, marine and
coastal resources directly provide at least USD 3 trillion worth of economic goods and services annually
(UNDP, 2012). Marine environment supports approximately 61% of world’s total Gross National Product
(GNP) by directly and indirectly providing fundamental goods and ecosystem services10
(including coastal
tourism, recreation and employment) upon which human well-being depends (UNESCO, 2012). Global
aquaculture production (including food fish and aquatic algae) contributes about USD 144.4 billion
towards the global economy (FAO, 2014); the shipping industry contributes to 90% of the global trade; and
10
Not necessarily confined to coastal activities but including coastal industries such as maritime equipment industry
and many more.

ENV/EPOC/WPBWE(2015)1/REV1
12
the tourism industry, of which marine and coastal tourism is a major part, represents 5% of global GDP
(UNDP, 2012).
Table 1.1. Examples of marine and coastal ecosystem services and their scale
Ecosystem service Category (examples) Scale
1. Provisioning
Food (e.g., fisheries and aquaculture) Fuel (e.g., mangrove wood and offshore oil and gas) Alternative energy (e.g., offshore wind and wave energy) Natural products (e.g., sand, pearls, diatomaceous earth) Genetic and pharmaceutical products Space for ports and shipping
Global Local/regional/global ? Local/regional/global Local/regional/Global Local/regional/ global
2. Regulating
Biological regulation Weather regulation Carbon sequestration Shoreline stabilization/ erosion control Natural hazard protection (e.g., from storms, hurricanes, and floods) Nutrient regulation Waste processing
Global Global Regional Regional ? Local/regional/global Local/regional/global
3. Supporting Soil, sediment, and sand formation Photosynthesis Nutrient cycling
Local/regional Global Regional/global
4. Cultural
Tourism Recreation Spiritual values Education and research Aesthetics
Local/regional/global Local/regional/global Local/regional/global Local/regional/global Local
Source: adapted from Lau, 2012. (nb - third column is my assumption).
18. Coral ecosystems are estimated to provide an average value of approximately USD 172 billion a
year to the world economy (Veron et al, 2009). The value comes from ecosystem services including food
and raw materials, moderation of extreme ocean events, water purification, recreation, tourism and
maintenance of biodiversity. Moreover, about 500 million people directly or indirectly depend on coral
reefs as their source of livelihood11
.
19. The Global Ocean Commission estimates that the global economic value of carbon sequestration
associated with seas and oceans ranges between USD 74 billion and USD 222 billion per year
(GOC, 2014).
20. In a more comprehensive study, de Groot et al. (2012) provide global estimates of a number of
ecosystems and services, including for open oceans, coral reefs, coastal systems, and coastal and inland
wetlands. They find the total value of ecosystem services ranges between 490 int$/year12
for the total
bundle of ecosystem services that can potentially be provided by an ‘average’ hectare of open oceans to
almost 350,000 int$/year for the potential services of an ‘average’ hectare of coral reefs.
11
http://www.globalpartnershipforoceans.org/key-issues/recognizing-economic-value-oceans
12 Values converted to a common set of units, namely 2007 ‘International’ $/year, i.e. translated into USD values on
the basis of Purchasing Power Parity (PPP).

ENV/EPOC/WPBWE(2015)1/REV1
13
21. There are numerous other valuation studies which have been undertaken at national or local scale
and/or cover fewer ecosystem components. A national level study for the UK, for example, provide ‘best
estimates’ of the monetary value of eight of the 13 goods and services of marine biodiversity (Beaumont
et al, 2008). These include food provision (GBP 513 million), raw materials (GBP 81.5 million), gas and
climate regulation (GBP 0.4-8.42 billion), disturbance prevention and alleviation (GBP 0.5-1.1 billion),
and leisure and recreation (GBP 11.77 billion). Similarly, Lange (2009) estimates the value of marine
ecosystem services in Zanzibar and finds it account for 30% of GDP13
. As the marine environment
continues to be threatened, if corrective measures are not taken soon, the costs of inaction are anticipated to
be high (see Box 1.1).
Box 1.1 Examples of costs of inaction
The cumulative economic impact of poor ocean management practices is about USD 200 billion per year (UNDP, 2012)
The World Bank and FAO estimated the economic losses due to overfishing at USD 50 billion annually (UNDP, 2012).
Invasive marine species, especially those carried in ship ballast water and on ship hulls, cause an estimated USD 100 billion each year in economic damage to infrastructure, ecosystems and livelihoods (Catalysing Ocean Finance Vol. 1).
The IPCC (2014) model projections suggest a potential loss of up to 13% to annual total fishery value in the US, or globally over 100 billion USD annually by 2100 (Cooley and Doney, 2009; Narita et al., 2012).
Brander et al. (2012) estimate that the loss of tropical reef cover due to ocean acidification will cause damages of USD between 528 and 870 billion (year 2000 value) by 2100.
On a global scale, the total estimated costs of coastal protection, relocation of people, and loss of land to sea level rise ranges from about USD 200 billion for an increase of sea level of 0.5 metres to five times that - USD 1 trillion - for a 1-metre rise, to about USD 2 trillion for an increase of 2 metres (Nicholls and Cazenave, 2010).
In the absence of pro-active mitigation measures, climate change will increase the cost of damage to the ocean by an additional USD 322 billion per year by 2050 (Noone, 2012).
1.2.3. Instruments for the conservation and sustainable use of marine biodiversity
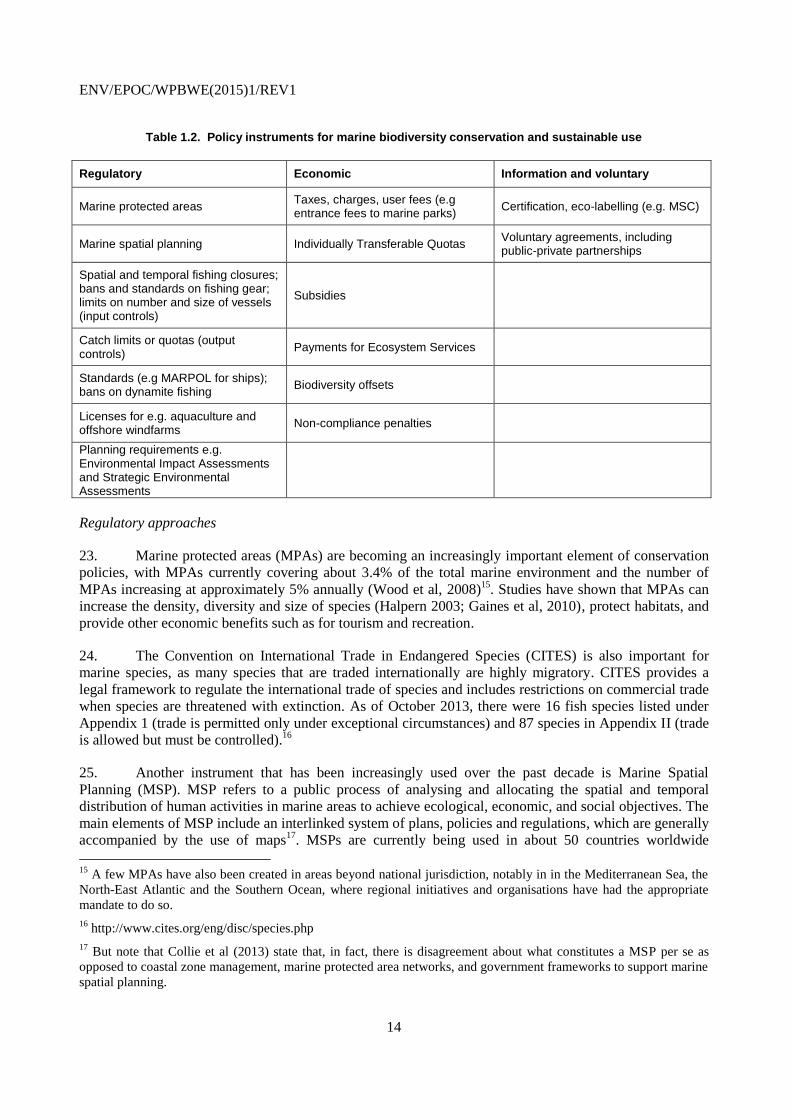
22. A number of policy instruments are available to promote the conservation and sustainable use of
marine biodiversity. Table 1.2 below categorises these in terms of regulatory, economic, and information
and voluntary instruments. Each of these is discussed in turn.14
13
This study only accounted for provisioning (fishing, seaweed farming, mangrove harvesting) and cultural services
(tourism).
14 It is important to note however that since most of the drivers of marine biodiversity loss stem from land-based
activities (as described in Section 3), instruments to address these activities are just as relevant.
ENV/EPOC/WPBWE(2015)1/REV1
14
Table 1.2. Policy instruments for marine biodiversity conservation and sustainable use
Regulatory Economic Information and voluntary
Marine protected areas Taxes, charges, user fees (e.g entrance fees to marine parks)
Certification, eco-labelling (e.g. MSC)
Marine spatial planning Individually Transferable Quotas Voluntary agreements, including public-private partnerships
Spatial and temporal fishing closures; bans and standards on fishing gear; limits on number and size of vessels (input controls)
Subsidies
Catch limits or quotas (output controls)
Payments for Ecosystem Services
Standards (e.g MARPOL for ships); bans on dynamite fishing
Biodiversity offsets
Licenses for e.g. aquaculture and offshore windfarms
Non-compliance penalties
Planning requirements e.g. Environmental Impact Assessments and Strategic Environmental Assessments
Regulatory approaches
23. Marine protected areas (MPAs) are becoming an increasingly important element of conservation
policies, with MPAs currently covering about 3.4% of the total marine environment and the number of
MPAs increasing at approximately 5% annually (Wood et al, 2008)15
. Studies have shown that MPAs can
increase the density, diversity and size of species (Halpern 2003; Gaines et al, 2010), protect habitats, and
provide other economic benefits such as for tourism and recreation.
24. The Convention on International Trade in Endangered Species (CITES) is also important for
marine species, as many species that are traded internationally are highly migratory. CITES provides a
legal framework to regulate the international trade of species and includes restrictions on commercial trade
when species are threatened with extinction. As of October 2013, there were 16 fish species listed under
Appendix 1 (trade is permitted only under exceptional circumstances) and 87 species in Appendix II (trade
is allowed but must be controlled).16
25. Another instrument that has been increasingly used over the past decade is Marine Spatial
Planning (MSP). MSP refers to a public process of analysing and allocating the spatial and temporal
distribution of human activities in marine areas to achieve ecological, economic, and social objectives. The
main elements of MSP include an interlinked system of plans, policies and regulations, which are generally
accompanied by the use of maps17
. MSPs are currently being used in about 50 countries worldwide
15
A few MPAs have also been created in areas beyond national jurisdiction, notably in in the Mediterranean Sea, the
North-East Atlantic and the Southern Ocean, where regional initiatives and organisations have had the appropriate
mandate to do so.
16 http://www.cites.org/eng/disc/species.php
17 But note that Collie et al (2013) state that, in fact, there is disagreement about what constitutes a MSP per se as
opposed to coastal zone management, marine protected area networks, and government frameworks to support marine
spatial planning.
ENV/EPOC/WPBWE(2015)1/REV1
15
including New Zealand, Canada, US, China, Norway, the Netherlands and Germany 18
. Collie et al (2013)
examine 16 MSPs around the world to compare practical experience with formulaic guidance on MSPs. As
the development of MSPs are still fairly recent, further progress is needed in areas such as identifying data
needs as well as clear criteria or frameworks for developing planning options (see e.g. Jay, 2015).
26. Other regulatory instruments include the more traditional standards on fishing gear, quotas on
fish catch, commercial fishing permits, emission standards for waterway engines, fuel sulphur limits for
vessels, amongst many others. Planning tools such as Environmental Impacts Assessments (EIAs) and
Strategic Environmental Assessments (SEA) are also used. EIA’s can be required to assess the impacts of
projects such as offshore windfarms, harbour expansion and dredging, marine aquaculture, and oil
platforms and rigs. Strategic Environmental Assessments (SEAs) tend to be undertaken for larger
activities, such as to inform a nation’s strategy for the development of marine energy (e.g. Scotland).
Economic instruments
27. Probably the most commonly applied economic instrument to address marine conservation and
sustainable use is individually transferable quota (ITQ) systems or variants to ITQs. As of 2008, 148 major
fisheries around the world had adopted some variant of this approach (Costello et al. 2008) along with
approximately 100 smaller fisheries in individual countries. Approximately 10% of the marine harvest was
managed by ITQs as of 2008.
28. Other examples of economic instruments include the US 10% federal excise tax on sales of sport
fishing equipment and motorboat fuel, which is used to finance the U.S Aquatic Resources Trust Fund. In
Israel, a marine environmental protection fee is levied on ships calling at Israeli ports and oil unloading
platforms. This fee varies according to the size of the ship and the amount of oil, with the revenues going
to the Marine Pollution Prevention Fund (OECD, 2011).
29. Entrance fees to marine national parks are being used in a number of countries, including
Mexico, Belize, Thailand, and the Galapagos Islands in Ecuador. Payments for ecosystem services (PES)
in the marine context have also been introduced. For example, local hotels and tourism operators can pay
for reef conservation due to the benefits associated with decreased beach erosion and species conservation
(e.g. for scuba divers) (see Chapter 4 for further discussion).
30. Another concept that is being explored is marine biodiversity offsets, for industries such as
petroleum exploration, renewable energy, and seabed mining. Scoping work for such instruments has been
undertaken for Belize and the UK for example.
Information and voluntary instruments
31. Information instruments aim to address informational asymmetries that often exist between
business, government and society. Eco-labels and certification are instruments that have been fairly widely
adopted in the case of fisheries for example. Two hundred and twenty four fisheries have been
independently certified as meeting the Marine Stewardship Council (MSC) standard for sustainable fishing
with another 94 currently undergoing assessment (MSC, 2014). Friends of the Sea (FoS) is another
important certification scheme in terms of volume, though several others also exist (OECD, 2011). Other
voluntary instruments that have been used include negotiated agreements between government and e.g.
fishers to establish voluntary marine conservation areas.
18
http://www.unesco-ioc-marinesp.be/msp_around_the_world

ENV/EPOC/WPBWE(2015)1/REV1
16
1.3 The role of MPAs and an overview of current status and trends
32. Each of the instruments described above within the broad headings of regulatory, economic, and
information and voluntary instruments are able to help address one or more of the drivers of marine
biodiversity loss discussed in Section 1.2.1. For example, MPAs can contribute to help addressing
over-fishing and habitat destruction, and can help to minimise noise pollution, for example, if ships are not
allowed to navigate through such areas. Instruments such as ITQs are able to contribute to addressing
over-fishing, and pollution abatement measures (including those targeting land-based pollution) are able to
contribute to addressing issues such as plastics pollution, nutrient loading, greenhouse gas emissions, and
invasive alien species. A simplified (non-comprehensive) depiction of this is provided in Table 1.3.
Table 1.3. Drivers of marine biodiversity loss and instruments to address them
Instruments
Drivers of marine biodiversity loss
Marine protected areas
Fisheries management such as ITQs
Pollution abatement measures
Other regulatory measures
Over-fishing 2 2 0 1
Pollution 1 0 2 1
Habitat destruction 2 0 1 1
Climate change 0 0 2 1
Invasive alien species
0 0 1 1
Source: Notes: 0 implies not able to address this driver, 1 implies has potential to help address driver (depending on instrument and context); 2 implies has significant potential to address driver.
33. Despite the suite of policy instruments that are available to address marine conservation and
sustainable use, current and projected trends in the state of marine biodiversity clearly highlight that the
collective response to this challenge must be significantly scaled up and improved. Reflecting experience
in the U.S. for example, TNC (2012) summarises: “For years, there has been chronic underinvestment in
marine conservation funding. Underfunding and shrinking budgets at the federal, regional, state, and local
levels have left critical habitats unmapped and unprotected; reduced monitoring and scientific investments;
hampered restoration efforts; and impeded new, effective national policy initiatives such as fishery
reforms, regional ocean governance, marine spatial planning, large-scale coastal conservation, and
ecosystem-based management. This situation persists despite longstanding and widespread recognition of
the problem.” These issues by no means only arise in the U.S. but are prevalent across many, if not most,
OECD countries, and indeed worldwide.
34. As indicated above, MPAs are a key component of the suite of instruments for the conservation
and sustainable use of marine biodiversity. Interest in MPAs as a management instrument has been
increasing over the past two decades, with more than 7,300 MPAs in place around the world today. They
cover about 12.3 million km2, or 3.4%, of the global marine area, with substantial variation on coverage
between different regions (Deguignet et al, 2014; Thomas et al, 2014) (see Figure 1.2 and 1.3). While
many different names have been given to marine areas that are, to some degree, protected by spatially
explicit restrictions, a frequently cited definition of an MPA is: ‘a clearly defined geographical space,
recognised, dedicated and managed, through legal or other effective means, to achieve the long term
conservation of nature with associated ecosystem services and cultural values’ (Dudley, 2008).

ENV/EPOC/WPBWE(2015)1/REV1
17
Figure 1.2. Trends in global MPA coverage over time
Source: Thomas et al (2014).
Figure 1.3. Percentage of marine area (0-200 nautical miles) covered by protected areas in the regions
The numbers indicate the percentage of marine area protected in each region
Source: Deguignet et al. (2014).

ENV/EPOC/WPBWE(2015)1/REV1
18
35. A more recent trend has been the establishment of large scale MPAs (LSMPAs), often described
as MPAs larger than 100,000 km2. Data indicates that 10 of the existing MPAs or those currently under
creation, account for more than 53% of the worlds’ total MPA coverage (Devillers et al. 2014).
36. MPAs have a wide range of potential ecological, social, and economic functions, including
biodiversity conservation, protecting sensitive habitats, maintaining tourism, providing refuge for
intensively fished species, and ensuring sustainable multiple uses. Accordingly, the levels of restriction
associated with MPAs vary, from partial (e.g. focus only on benthic species, or only limiting one type of
fishing gear or activity) to high (e.g. ‘no-take’ zones, also often called ‘marine reserves’) and almost total
(‘no-entry’ zones).19
While some MPAs have a single level of protection, others are multi-use areas
subdivided into zones of various levels of protection. According to the World Database on Protected Areas
(WDPA), of the 3.41% global MPA coverage, only 0.59% is established as no-take MPAs (Thomas et al.,
2014). Instead, many MPAs allow extractive activities such as commercial trawling and oil and gas
exploration and extraction. In Australia, for example, trawling is permitted in specific areas of the Great
Barrier Reef Marine Park and also in the Shark Bay Marine Park (a Western Australian state MPA),
although both are World Heritage Areas and highly valuable MPAs (Devilliers, 2014). Several of the very
large MPAs recently created or planned in the Pacific Ocean (e.g. Phoenix Islands Protected Area) allow
fishing across most of their extents (Pala, 2013; De Santo, 2013) (Table 1.4).
37. While some progress has been made towards meeting the CBD 2011-2020 Aichi Target for
MPAs, the literature suggests that considerably more needs to be done to ensure their effectiveness and
ecological representativeness, in addition to their geographic coverage (Ban et al., 2014; Bignoli
et al., 2014; Dunn et al., 2014; Fox et al., 2014, cited in Brander, 2015). Moreover, the economic aspects
of marine protected areas have received less attention in the literature, with studies suggesting that MPA
decision-making and management may not be as efficient or cost-effective as it could be. Given that
countries are supposed to increase MPA coverage to 10% by 2020, from a level of 3.4% today, issues that
are relevant and that this report intends to address include:
What are the costs and benefits associated with MPAs?
Across nations, how and why have MPAs been chosen as the appropriate management response?
How are MPAs being sited in practice? To what extent are siting decisions informed by
economic considerations (i.e. cost-benefit analysis), as well as other factors such as climate
change?
How effective have MPAs been in addressing the threats caused by e.g., over-fishing and habitat
destruction, and in conserving biodiversity more broadly?
What type of monitoring, compliance and enforcement regimes have been adopted across
different MPAs and how do they compare in terms of effectiveness and cost?
How are MPAs financed and what options are there to scale this up?
How have MPAs been implemented together with other policy instruments, to more
comprehensively and effectively address the multiple drivers of marine biodiversity loss?
19
Different classifications exist, such as those by IUCN, and those in the US. See
http://marineprotectedareas.noaa.gov/pdf/helpful-resources/factsheets/mpa_classification_may2011.pdf

ENV/EPOC/WPBWE(2015)1/REV1
19
Table 1.4. Recent designations of large MPAs and potential sites under development
Year MPA, country Extractive activities allowed Total size
2006 Papah_anaumoku_akea Marine National Monument, North West Hawaiian Islands, USA
Initially bottomfish fishing was allowed. Since 15 June 2011 the entire area has been no-take.
341,362 km2
2007 Benthic Protection Areas, New Zealand (17 sites)
Off-bottom trawl fishing permitted with strict controls in most sites.
Kermadec Islands’ territorial waters (7450 km2) is currently no take but there is a proposal to make the entire 620,500 km2 area no-take, which would represent 56% of total combined area of New Zealand’s Benthic Protection Areas
Combined area of: 1,100,000 km2
2007 South East Commonwealth Marine Reserve Network, Australia (14 sites)
Depending on the area, recreational fishing, charter fishing, mining, some commercial fishing.
68% (154,435 km2) is no-take 226,458 km2
2008 Phoenix Islands Protected Area (PIPA), Kiribati
1. Distant Water Fishing Nation (DWFN) tuna fishing
2. Domestic commercial fishing licenses
3.87% (15,800 km2) is no-take, to be increased to 25% when trust fund becomes active
408,250 km2
2009
Marine National Monuments, USA
(1) Marianas Trench (246,608 km2)
(2) Pacific Remote Islands (225,039 km2)
(3) Rose Atoll (34,838 km2)
Commercial fishing is prohibited but recreational, non-commercial and traditional/ sustenance fishing may be allowed.
Combined area just under: 500,000 km2
2009 Prince Edward Islands MPA, South Africa Commercial fishing
34% (61,415 km2) is no-take 180,633 km2
2009 South Orkneys Marine Protected Area, British Antarctic Territory (UK/Argentina/high seas)
The entire area is no-take 93,787 km2
2010 Chagos Archipelago, British Indian Ocean Territory, UK (also claimed by Mauritius)
The entire area is no-take 640,000 km2
2010 Motu Motiro Hiva Marine Park, Chile 74% (150,000 km2) of the area is no-take 203,374 km2
2012 Coral Sea Commonwealth Marine Reserve (Australia)
51% (504,820 km2) is proposed to be no-take.
Recreational fishing and selected commercial fishing gear types allowed in remainder, but demersal trawling, demersal longlining, and gillnetting are banned throughout.
989,842 km2
2012 South Georgia and South Sandwich Islands, MPA (UK/Argentina)
Commercial bottom trawling is banned throughout. Longlining is allowed at depths
>700 m in a small area of the MPA, under strict regulation. There are three existing restricted impact areas, covering 3563 km2 in which long-lining is not normally allowed.
Territorial waters (12 nm) surrounding each island and the Shag Rocks are no-take, a total of 20,000 km2 (2% of total area)
1,000,000 km2
TBD Cook Islands MPA (in planning) TBD 1,000,000 km2
TBD Sargasso Sea MPA (in planning, high seas) TBD
TBD 5,000,000 km2
2015 Pitcairn Island (UK) TBD 800,000 km2
TBD Antarctic Ross Sea TBD 3,600,000 km2
TBD Bermuda’s EEZ (UK) TBD 300,000 km2
Source: De Santo (2013).

ENV/EPOC/WPBWE(2015)1/REV1
20
References
Deguignet M., Juffe-Bignoli D., Harrison J., MacSharry B., Burgess N., Kingston N., (2014), 2014 United
Nations List of Protected Areas. UNEP-WCMC: Cambridge, UK.
Devillers et al (2014). Reinventing residual reserves in the sea: are we favouring ease of establishment over
need for protection?
Agnew et al. (2009). Estimating the worldwide extent of illegal fishing, PLoS ONE 4(2).
Ateweberhan et al, (2013). Climate change impacts on coral reefs: Synergies with local effects,
possibilities for acclimation, and management implications. Marine Pollution Bulletin.
Balmford et al. (2004), The Worldwide Costs of Marine Protected Areas. PNAS 101:26.
Bax et al. (2003). Marine Invasive Alien Species: A Threat to Global Biodiversity. Marine Policy 27:
313-323.
Beamont et al. (2008). Economic valuation for the conservation of marine biodiversity. Marine Pollution
Bulletin 56: 386-396.
Bijma et al (2013). Climate change and the oceans - What does the future hold? Marine Pollution Bulletin.
BIO Intelligence Service (2013), Comparative analysis of biodiversity governance in Europe, Draft final
report prepared for. GIP ATEN.
http://www.biois.com/wp/wp-content/uploads/2013/08/Biodiversity-governance-in-Europe_FR_120
72013.pdf.
Branch et al. (2011). Contrasting Global Trends in Marine Fishery Status Obtained from Catches and from
Stock Assessments. Conservation Biology, Volume 25, No. 4, 777-786.
Brander, L.M., K. Rehdanz, R.S.J. Tol and P.J.H. Van Beukering (2012). The economic impact of ocean
acidification on coral reefs. Climate Change Economics, No. 3, Vol. 1.
Burke et al. (2011). Reefs at Risk Revisited WRI http://www.wri.org/publication/reefs-risk-revisited.
Collie, Adamowicz, Beck, Craig, Essington, Fluharty, Rice, Sanchirico. (2013). Marine Spatial
Planning in Practice. Estuaries, Coastal and Shelf Science. Vol. 117.
De Groot et al. (2012). Global Estimates of the Value of Ecosystem Services. Ecosystem Services. Vol
1(1) pp. 50-61.
Doney et al. (2012). Climate Change Impacts on Marine Ecosystems Annu. Rev. Mar. Sci. 4:11-37.
Edgar et al. (2014). Global conservation outcomes depend on marine protected areas with five key features. Nature
506, 216-220.
FAO (2004). State of the World Fisheries and Aquaculture. Rome: FAO.
FAO (2014). The State of World Fisheries and Aquaculture. Rome: FAO.

ENV/EPOC/WPBWE(2015)1/REV1
21
Ferraro C. (2007). A Global Survey of Sea Turtle Payment Incentive Programs. A Report to the Southwest
Fisheries Science Center, National Marine Fisheries Service.
Gravestock P, Roberts CM, Bailey A. (2007). The income requirements of marine protected areas. Ocean
and Coastal Management; 51:272-83.
Great Barrier Reef Marine Park Authority (2009). Great Barrier Reef Outlook Report, Townsville,
Australia
Great Barrier Reef Marine Park Authority (2014). Great Barrier Reef Region Strategic Assessment:
Strategic Assessment Report
Global Oceans Commission (2014). From Decline to Recovery: A Rescue Package for the Global Oceans.
Halpern et al (2008). Global Map of Human Impact on Marine Ecosystems. Science. 319.
IPCC (2014). Climate Change 2014. Synthesis Report: Summary for Policy Makers.
https://www.ipcc.ch/pdf/assessment-report/ar5/syr/SYR_AR5_SPMcorr1.pdf
IPSO (not dated). Implementing the Global State of the Ocean Report.
http://www.stateoftheocean.org/pdfs/ipso_report_051208web.pdf
Lau, W. (2012). Beyond carbon: Conceptualizing payments for ecosystem services in blue forests on
carbon and other marine and coastal ecosystem services. Ocean and Coastal Management.
Lange (2009). Economic value of marine ecosystem services in Zanzibar: Implications for marine
conservation and sustainable development. Ocean and Coastal Management
McCrea-Strub et al. (2011) Understanding the cost of establishing marine protected areas. Marine Policy
35: 1-9
MSC (2014). Global Impacts Summary Report 2014.
http://www.msc.org/documents/environmental-benefits/global-impacts/msc-global-impacts-summar
y-report-2014
Myers, N. (1988). Threatened Biotas: "Hot Spots" in Tropical Forests. The Environmentalist 8, 1-20.
Mohammed E. Y. (ed) (2013). Economic Incentives for Marine and Coastal Conservation: Prospects,
Challenges and Policy Implications (Hardback) Routledge (focus on PES).
Naber et al. (2008). Valuation of Marine Ecosystem Services : A Gap Analysis.
https://www.cbd.int/marine/voluntary-reports/vr-mc-wb-en.pdf
Nicholls, R. J. and A. Cazenave (2010), Sea Level Rise and its Impacts on Coastal Zones. Science. 328
Noone, K., R. Sumaila, and R. J. Diaz eds. (2012). Valuing the Ocean - Draft Executive Summary.
Stockholm Environment Institute.
OAGC (2012). Chapter 3: Marine Protected Areas. Report of the Commissioner of the Environment and
Sustainable Development. Office of the Auditor General of Canada Available at:
http://www.oag-bvg.gc.ca/internet/English/parl_cesd_201212_03_e_37712.html

ENV/EPOC/WPBWE(2015)1/REV1
22
OECD (2010). Paying for Biodiversity: Enhancing the Cost-Effectiveness of Payments for Ecosystem
Services. OECD Publishing
OECD (2011). Fisheries and Aquaculture Certification, OECD Publishing.
http://dx.doi.org/10.1787/9789264119680-en
OECD (2011). Environmental Performance Review of Israel. OECD Publishing.
OECD-FAO (2014). The OECD-FAO Agricultural Outlook to 2023. OECD Publishing.
OECD forthcoming (2014). The Ocean Environment: Expected changes to 2050 and their potential direct
impact on the ocean economy.
Pitcher and Cheung (2013). Fisheries: Hope or Despair? Marine Pollution Bulletin.
Reid W. V. et al., (2005). Millennium Ecosystem Assessment: Ecosystems and Human Well-Being—
Synthesis Report (World Resources Institute, Washington, DC).
Roberts, C.M. et al. (2002). Marine biodiversity hotspots and conservation priorities for tropical reefs.
Science 295, 1280-1284.
R. Stuart-Smith, A.E. Bates, J.S. Lefcheck, J.E. Duffy, S.C. Baker, R.J. Thomson, J.F. Stuart-Smith, N.A.
Hill, S.J. Kininmonth, L. Airoldi, M.A. Becerro, S.J. Campbell, T.P. Dawson, S.A. Navarette, G.A.
Soler, E.M.A. Strain, T.J. Willis, G.J. Edgar. 2013. “Integrating abundance and functional traits
reveals new global hotspots of fish diversity.” Nature 501 (7468): 539-542.
Sanchirico, J. N. (2004). Designing a Cost - Effective Marine Reserve Network: A Bioeconomic
Metapopulation Analysis. Marine Resource Economics, 19 (1): 46-63.
Secretariat of the Convention on Biological Diversity (SCBD) (2014). An Updated Synthesis of the Impacts
of Ocean Acidification on Marine Biodiversity (Eds: S. Hennige, J.M. Roberts & P. Williamson).
Montreal, Technical Series No. 75.
Smith, MD; Lynham, J; Sanchirico, JN; Wilson, JA (2010).Political economy of marine reserves:
understanding the role of opportunity costs. Proceedings of the National Academy of Sciences of the
USA 107(43): 18300-305.
Thomas H.L., et al. (2014). Evaluating official marine protected area coverage for Aichi Target 11:
appraising the data and methods that define our progress. Aquatic Conservation: Marine and
Freshwater Ecosystems 24 (suppl. 2).
TNC (2012). Monies for Marine Conservation. The Nature Conservancy
http://www.marineplanning.org/pdf/Monies_for_Marine_Conservation.pdf
UNEP (2011). Towards a Green Economy: pathways to sustainable development and poverty eradication
(a synthesis for policy makers). United Nations Environment Programme.
UNDP (2012). Catalysing Ocean Finance Volume I Transforming Markets to Restore and Protect the
Global Ocean.
http://www.undp.org/content/dam/undp/library/Environment%20and%20Energy/Water%20and%20
Ocean%20Governance/Oceans%20and%20Coastal%20Area%20Governance/Catalysing-Ocean-Fin
ance-Vol-I.pdf

ENV/EPOC/WPBWE(2015)1/REV1
23
Veron, J. E. N, O. Hoegh-Guldberg, T. M. Lenton, J. M. Lough, D. O. Obura, P. Pearce-Kelly, C. R, C
Sheppards, M. Spalding, M. G. Stafford-Smith, and A. D. Rogers (2009). The Coral Reef Crisis: The
Critical Importance of. Marine Pollution Bulletin 58.10: 1428-436.
Vince, J. (2014) Oceans governance and marine spatial planning in Australia. Australian Journal of
Maritime & Ocean Affairs. Vol. 6(1).
Watson et al. (2014). The performance and potential of protected areas. Nature. 515
Wood LJ, Fish L, Laughren J, Pauly D. (2008) Assessing progress towards global marine protection
targets: shortfalls in information and action. Oryx; 42:340-51.
White, C., Halpern, B. S. & Kappel, C. V. (2012) Ecosystem service tradeoff analysis reveals the value of
marine spatial planning for multiple ocean uses. Proc. Natl Acad. Sci. USA 109, 4696-4701.
WWF (2009). Silent Invasion - The spread of marine invasive species via ships’ ballast water

ENV/EPOC/WPBWE(2015)1/REV1
24
2. THE ECONOMICS OF MARINE PROTECTED AREAS
2.1 The benefits and costs of MPAs
38. Prior to making a decision on whether or not to create a particular MPA, it is important to have
an understanding of the estimated benefits that the MPA can deliver, as well as the estimated costs of
establishing and maintaining an MPA. Combining these two pieces of information allows decision makers
to evaluate the net economic benefits to society from investing in an MPA. It can also provide insights on
how these values are distributed, i.e., over time, at different levels of scale, and between different user
groups, which is important for understanding the distributional implications of MPAs, and thus how they
can best be managed. Finally, understanding the costs associated with MPAs enables planners to budget
and to help secure adequate finance for the effective long-term management of MPAs (see Chapter 4).
39. MPAs can provide a wide variety of benefits ranging from the conservation of whole of areas that
harbour important biodiversity, serving as nursery grounds for fisheries, protecting habitats that buffer the
impacts of storms and waves, as well as removing excess nutrients and pollutants from the water, and
providing more sustainable tourism and recreational benefits, amongst others. These benefits fall under the
various components of the total economic value (TEV) (see Box 2.1).
Box 2.1 The Total Economic Value of Marine Protected Areas
Direct values – raw materials, services and products that can be consumed, traded or enjoyed on site, e.g. fish, building materials.
Indirect values – maintenance of natural and human systems through for example, coastal protection, storm control, and for provision of habitat for economically important species caught off-site.
Option values – the value of maintaining the area to allow for potential, but currently unknown, future uses e.g. tourism, pharmaceutical uses, industrial activities.
Non-use values – the intrinsic value of the area accruing to people who may not use the site, based on
existence, bequest and altruistic motives, and sometimes including components of social, such as cultural, scientific, and heritage values.
40. The costs associated with MPAs can be divided into three categories, namely direct, indirect, and
opportunity costs. Direct costs cover both establishment and operational costs, where establishment costs
include capital outlays for e.g. boats, offices, site delineation, planning activities, licence buybacks, land
purchases, and gazetting, and operational costs include administration, supplies, maintenance, fuel, training
and employment, and monitoring, and enforcement (Ban et al., 2011; Butardo-Toribio, Alino, and
Guiang, 2009). Recurrent capital costs (e.g. purchases of vessels and replacements) may also be considered
ongoing annual operational costs (Ban et al., 2011). A clear distinction is often difficult, as some
establishment activities may continue into the operational phase, and vice versa (Butardo-Toribio, Alino,
and Guiang, 2009).

ENV/EPOC/WPBWE(2015)1/REV1
25
41. Indirect costs include possible compensation and/or alternative livelihood payments to groups
adversely affected by the creation of an MPA, such as fishers or displaced local communities (CFA, 2003).
Concerns held by these affected groups may also increase social resistance or create other conflicts
(Emerton, 2003; Butardo-Toribio, Alino, and Guiang, 2009), and thus increase direct costs by requiring
more outreach to build support, legal actions or responses, increased enforcement to counter illegal fishing,
and so forth. The impacts of increased numbers of visitors, infrastructure developments, or populations of
certain species may also cause indirect costs (WWF, 2005).
42. Opportunity costs refer to losses in potential earnings, such as foregone commercial fishing
income, or foregone tourism or recreation revenues from activities such as charter diving or fishing (CFA,
2003; Cook and Heinen, 2005; Emerton, 2003). It has been suggested that opportunity costs to industry,
e.g. fishing losses, rerouting of shipping lanes, or mine closures, can constitute the largest proportion of
MPA costs (Ban and Klein, 2009; Gravestock, Roberts, and Bailey, 2008). However, in several cases they
have found to be negligible (see section 4.1.3). Table 2.1 summarises the major benefits and costs20
.
Table 2.1. Major Benefits and Costs of MPAs
BENEFITS COSTS
Biodiversity Conservation – MPAs can lead to the recovery of exploited species in reserves, increased species diversity and improvements in habitat. These changes are expected to lead to greater resilience of populations to environmental perturbations, reducing the likelihood of local extinctions.
Direct Costs – Including costs of:
Establishment
Administration
Employment
Monitoring and enforcement
Ecosystem Services – Protection of habitats such as reefs provides protection against storms and coastal erosion, and increases assimilative capacity for pollutants.
Indirect costs: Possible compensation payments to those adversely affected by the decision to establish the reserve – for example:
Fishers and processors in the short-term
Alternative employment packages
Infrastructure costs of increasing tourism
Displaced communities, if relocated
Fishery Enhancement – After some time lag, the results of protection include larger, more valuable and variable fish species within the reserve, with transfer of benefits to fishing areas through adult spillover and larval export. Habitat protection increases production in reserves. Stock protection reduces the likelihood of fishery collapse.
Opportunity Costs – Loss of potential earnings, e.g.
Short-term fishery revenues
Revenues from activities forbidden in the MPA, such as coral mining, shell extraction and blast fishing
Large-scale tourism and resort development
Industrial and infrastructure development
Tourism and Recreation – Better opportunities for tourism and recreation is a major objective of many MPAs. Enhancement of fish stocks in reserves and the associated habitat protection increase appeal for tourism. This creates employment opportunities directly linked to the reserve (e.g. tour guides, wardens) and could stimulate a multiplier effect through the local economy (e.g. hotels, restaurants, infrastructure, taxi services, etc.).
Biochemical Informational Services – There are potential gains from pharmaceutical bioprospecting – future discoveries of important medicinal components
Education and Research – MPAs provide opportunities to learn about processes from ‘undisturbed’ regions
Source: Adapted from CFA (2003).
20
This table will be updated in the next version.

ENV/EPOC/WPBWE(2015)1/REV1
26
2.1.1. Benefits of MPAs
43. A number of valuation studies have been undertaken to estimate the benefits of MPAs21
.
Table 2.2 illustrates the types of services, the values, and the methods used across several MPA valuation
studies. Very few, if at all any, studies conduct comprehensive estimation of the total economic value but
rather estimate components thereof. Estimating components of the TEV of MPAs, ideally those that are
presumed to be the largest, can often be sufficient to make the case for an MPA, when compared with the
estimated costs associated with them.
Table 2.2. Examples of MPA valuation studies
Site Type of service Value Method Source
MPA network in Scottish offshore and territorial waters
Direct and indirect values (not option values)
GBP 6.3-10 billion over 20 years
Benefits transfer Links Economics Forum (2012)
Scottish waters MPA Existence and option values WTP GBP 70-77 for ‘best’ option
Choice experiment and contingent valuation
Jobstvogt et al (2014)
Bahamas Indirect values of key habitat functions
USD 11 million Benefits transfer Clavelle and Jylkka (2013)
Network of marine conservation zones, UK
7 categories of ecosystem goods and services
GBP 10-23 billion for a 20 year time period
Benefits transfer Hussein et al (2010)
Network of marine conservation zones, UK
Non-use values of ecosystem services
WTP to halt loss of marine biodiversity and environmental benefits GBP 21 and 16 billion respectively
Choice experiment McVittie and Moran (2010)
Hon Mun MPA, Vietnam Fishery, aquaculture and other
USD 54-73 million
Travel cost method Production function
Contingent valuation
Nam et al (2005)
Belize Tourism, fishery and shoreline protection
USD 400 million per year Various WRI (2008)
Lundy, UK Recreational benefits Travel cost method Chan et al (2012)
Seychelles Recreational benefits WTP USD 12.20. Consumer Surplus USD 88,000
Contingent valuation Mathieu et al (1998)
Network of MPAs, Colombia
Carbon sequestration EUR 43-300 million depending on exogenous variables, for 2013-2020
Based on market prices of carbon
Zarata-Barrera and Maldonado (2015)
MPAs along Garden Route, South Africa
Fishing, recreational, existence
PV R600-800 million
Value per fish
Travel cost method
Contingent valuation
Turpie et al (2006)
7 marine areas in New Zealand
Ecosystems goods and services
Areas generated an average ES value of NZD 403billion per year for 2010
Benefit Transfer Van den Belt and Cole (2014)
21
46 valuation studies are listed under the heading of “marine parks”, for example, in the Marine Ecosystem Services
Partnership (MESP) database: http://marineecosystemservices.org. Another database with valuation studies is
www.esvaluation.org/serves.php
ENV/EPOC/WPBWE(2015)1/REV1
27
44. A limited number of studies have estimated the global benefits of MPAs. Heal and Rising (2014)
estimate global benefits of MPAs for harvested fish stocks. They find that on average, a 1% increase in
protected area results in an increase in the growth rate of fish populations by about 1%. Brander et al.
(2015) estimate that the total ecosystem service benefits of achieving 10% coverage of MPAs are in the
range USD 622-923 billion over the period 2015-2050, and for 30% coverage range between USD 719 to
1,145 billion. The ecosystem services covered include coastal protection, fisheries, tourism, recreation and
carbon storage provided by coral reefs, mangroves and coastal wetlands. Variation in benefits across
scenarios is largely due to differences in the provision of services from coral reefs.
2.1.2 Costs of MPAs
Direct Costs
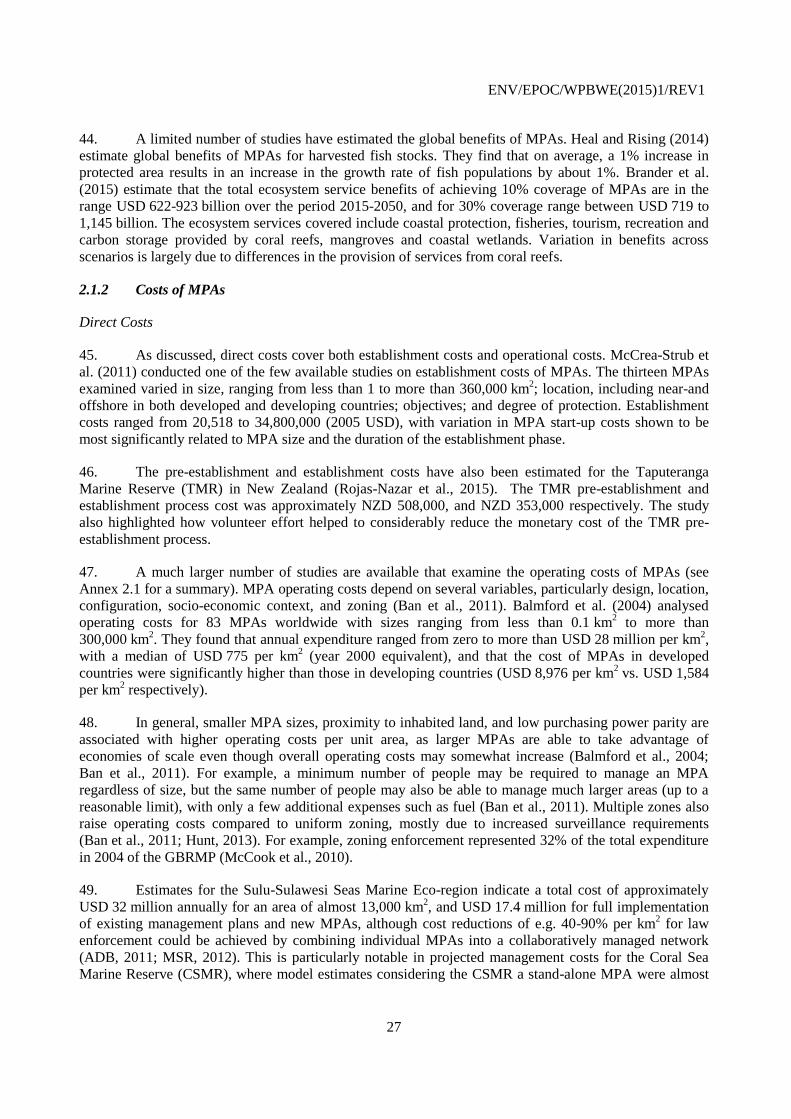
45. As discussed, direct costs cover both establishment costs and operational costs. McCrea-Strub et
al. (2011) conducted one of the few available studies on establishment costs of MPAs. The thirteen MPAs
examined varied in size, ranging from less than 1 to more than 360,000 km2; location, including near-and
offshore in both developed and developing countries; objectives; and degree of protection. Establishment
costs ranged from 20,518 to 34,800,000 (2005 USD), with variation in MPA start-up costs shown to be
most significantly related to MPA size and the duration of the establishment phase.
46. The pre-establishment and establishment costs have also been estimated for the Taputeranga
Marine Reserve (TMR) in New Zealand (Rojas-Nazar et al., 2015). The TMR pre-establishment and
establishment process cost was approximately NZD 508,000, and NZD 353,000 respectively. The study
also highlighted how volunteer effort helped to considerably reduce the monetary cost of the TMR pre-
establishment process.
47. A much larger number of studies are available that examine the operating costs of MPAs (see
Annex 2.1 for a summary). MPA operating costs depend on several variables, particularly design, location,
configuration, socio-economic context, and zoning (Ban et al., 2011). Balmford et al. (2004) analysed
operating costs for 83 MPAs worldwide with sizes ranging from less than 0.1 km2 to more than
300,000 km2. They found that annual expenditure ranged from zero to more than USD 28 million per km
2,
with a median of USD 775 per km2 (year 2000 equivalent), and that the cost of MPAs in developed
countries were significantly higher than those in developing countries (USD 8,976 per km2 vs. USD 1,584
per km2 respectively).
48. In general, smaller MPA sizes, proximity to inhabited land, and low purchasing power parity are
associated with higher operating costs per unit area, as larger MPAs are able to take advantage of
economies of scale even though overall operating costs may somewhat increase (Balmford et al., 2004;
Ban et al., 2011). For example, a minimum number of people may be required to manage an MPA
regardless of size, but the same number of people may also be able to manage much larger areas (up to a
reasonable limit), with only a few additional expenses such as fuel (Ban et al., 2011). Multiple zones also
raise operating costs compared to uniform zoning, mostly due to increased surveillance requirements
(Ban et al., 2011; Hunt, 2013). For example, zoning enforcement represented 32% of the total expenditure
in 2004 of the GBRMP (McCook et al., 2010).
49. Estimates for the Sulu-Sulawesi Seas Marine Eco-region indicate a total cost of approximately
USD 32 million annually for an area of almost 13,000 km2, and USD 17.4 million for full implementation
of existing management plans and new MPAs, although cost reductions of e.g. 40-90% per km2 for law
enforcement could be achieved by combining individual MPAs into a collaboratively managed network
(ADB, 2011; MSR, 2012). This is particularly notable in projected management costs for the Coral Sea
Marine Reserve (CSMR), where model estimates considering the CSMR a stand-alone MPA were almost

ENV/EPOC/WPBWE(2015)1/REV1
28
double estimates assuming Great Barrier Reef management arrangements would be extended to the CSMR
(Ban et al., 2011; Table 2.4).
50. In a regional level study, IUCN (2006) finds that Mediterranean marine reserves of IUCN
Categories I-IV require approximately EUR 75 million (year 2006 equivalent) annually, while
coastal/marine and broad marine areas of IUCN Categories V-VI require an additional
EUR 88-441 million annually (IUCN, 2006b).
Indirect costs
51. Indirect costs can be difficult to quantify, especially with respect to incremental increases in
funding and personnel for outreach or for programmes to build community support. However,
compensatory payments, which often form a large proportion of the cost of establishment, can be analysed.
For example, reef fishermen in the Soufriere Marine Management Area in St. Lucia lost 35% of their
original fishing grounds when an MPA was created. Compensation of USD 150 per month was paid to 20
of the most dependent fishermen for the first year, and after six years, commercial fish biomass had
increased fourfold inside the reserve and threefold in adjacent fishing grounds, leading to general support
for the MPA (WWF, 2005).
52. Compensation payments, however, have also been noted to be far greater than the actual
opportunity costs. Payments for the 2004 expansions of Great Barrier Reef no-take areas totalled over
AUD 200 million, more than five times the affected gross value of production (GVP) of AUD 43 million.
Similarly, compensation payments for the 2012 creation of the Coral Sea Marine Reserve were expected to
be on the order of AUD 20 million for GVP impacts of AUD 3.5 million (Hunt, 2013).
Opportunity costs
53. Opportunity costs vary widely depending on the possible activities in place. In Kisite-Mputungi
Marine National Park, Kenya, opportunity costs were higher by a factor of 10 than operating expenditures
(Emerton, 2003). Gleason et al. (2013) estimated that the maximum potential net economic losses to
fishermen of establishing California’s MPA network ranged from 1-29% of revenue depending on the
fishery, with the final MPA network proposal reflecting a maximum loss of 6.3% for eight fisheries. A
socioeconomic assessment of the Cod Grounds MPA in Australia (Schirmer, Casey, and Mazur, 2004)
found that fishers would lose between 5-70% of gross commercial fishing income; that fishing co-
operatives would lose between 3-5.5% of currently landed catch; and that alternative fishing areas would
be subject to higher pressures. However it should be noted that the proposed Cod Grounds area was
3.1 km2, supporting up to 14 owner-operator fishing businesses, meaning that these results were highly
specific.
54. In contrast, estimates of costs to the Scottish fisheries sector from establishing an MPA network
were considered minimal, ranging from GBP 0.05 million to 4.97 million, or 0% to 2% of gross value
added output, under worst-case scenarios (Government of Scotland, 2013). In the Tortugas Ecological
Reserve in Florida, impacts to commercial fisheries were expected to be negligible, approximately 1.16%
of harvest revenue, although impacts to charter boat operators were 12-13% of revenue (Cook and
Heinen, 2005).
55. The opportunity costs associated with MPAs can be minimised however, through careful MPA
design and zoning. Using the spatial prioritisation software Zonation, Leathwick et al. (2008) found that
MPA siting models for New Zealand that controlled for both conservation and minimum fishing

ENV/EPOC/WPBWE(2015)1/REV1
29
opportunity costs produced 85% of the conservation value of MPAs sited by conservation value only, but
with no loss of fishing activity22
(see section 3.2 for further discussion).
Box 2.2 Global costs of MPA expansion and models to predict establishment and management costs at an MPA
Global costs of MPA expansion
Based on operating costs, Balmford et al (2004) estimated that a global MPA network covering 20-30% of the world’s seas would cost between USD 5-19 billion a year. More recently, Brander et al (2015) estimate that the total cost of achieving 10% global coverage of MPAs is in the range of USD 45-47 billion over the period 2015-2050 and the total costs of achieving 30% coverage are in the range USD 223-228 billion23. The cost categories included in these estimates are
the set-up and operating costs of MPAs and the opportunity costs to commercial fisheries.
Models to predict MPA establishment and management costs
Based on the MPA data collected, McCrea et al (2011) and Balmford et al (2004) developed models to predict MPA establishment cost and management cost, respectively. These are:
log (establishment cost) = 3.73 + 0.28 t (years) + 0.26 log (a, km2)
log (annual cost) = 5. 62 – 0.72log (Protected Area area, km2) – 0.0002 ( Distance, km
2) – 0.30 (PPP)
where all logarithms are of base ten.
The latter model for example states that the cost of managing a marine protected area is a nonlinear function of the size of the proposed protected area, distance of area from land, and the purchasing power parity of the nation. Klein (2010) used this model to predict the management costs of MPAs in each ecoregion in the Coral Triangle and Ban et al (2011) applied the model to estimate management costs of a proposed Coral Sea MPA in Australia. In the case of the Coral Sea MPA, the results were not considered realistic as the Balmford et al (2004) model does not differentiate between no-take and multiple zone MPAs. Further applications of this approach are merited to assess validity of the models, as would the development of alternative models that factor in MPA zoning.
2.2 Using cost-benefit analysis to inform MPA decision-making24
56. A cost-benefit analysis compares the benefits of protection (i.e. the direct and indirect benefits
that stakeholders receive from the area) with the costs of protection (i.e. the direct, indirect and opportunity
costs). As benefits and costs flow over time rather than in just one period, discounting this flow gives the
Net Present Value (NPV) of an MPA, i.e., the discounted sum of all future costs and benefits (Hanley and
Barbier, 2009).
22
For 96 demersal fish species.
23 All monetary values are expressed as present values computed over the period 2015-2050 using a discount rate of
3% in USD at 2013 price levels.
24 This section in particular requires substantial further work.

ENV/EPOC/WPBWE(2015)1/REV1
30
57. An MPA should be established when the NPV of an MPA exceeds that of an alternative use:
NPV of MPA – NPV of alternative use > 0
or
NPV of total economic value of an MPA > NPV of direct, indirect and opportunity costs.
58. Examples of CBA studies of MPAs are highlighted in Box 2.3.
Box 2.3 Examples of CBA of Marine Protected Areas
Taka Bone Rate Marine Protected Area, Indonesia
The quantifiable net benefits of managing the Taka Bone Rate Marine Protected Area (MPA), Indonesia, as a protected area were estimated to be between $3.5 and $5.0 million in Net Present Value terms, at a 10% discount rate over 25 years. The creation of MPAs allowed fish stocks and yields to recover, and stopped destructive fishing practices (Cesar, 2002).
The UK Marine Bill
In accordance with Regulatory Impact Assessment (RIA) guidelines, a mid-range benefit present value from the McVittie and Moran (2010) study using a 20 year cut off point is GBP 16.6 billion based on the aggregated median WTP for a halt in the loss of biodiversity and a UK Treasury discount rate of 3.5%. As part of the RIA, a separate cost study suggested that specific Marine Bill restrictions could, over a 20 year time horizon amount to costs of between GBP 0.4 billion and GBP 1.2 billion (ABP, 2007), implying that the benefits significantly outweigh the costs of the regulation.
59. In a global study, Brander et al. (2015) examine the net benefits of protecting marine habitats
through expanding the coverage of no-take MPAs. Using a baseline of 3.4% MPA coverage, they examine
the benefits under scenarios of 10% and 30% increase in coverage. Two criteria are used to determine the
spatial allocation of MPAs namely: 1) marine biodiversity; 2) exposure of marine ecosystems to human
impacts. Global data on species biodiversity were obtained from www.aquamaps.org and data on human
impact on marine ecosystems were obtained from Halpern et al. (2008). The results of the cost-benefit
analysis show that all six scenarios for expanding MPAs to 10% and 30% coverage are economically
advisable. The ratios of benefits to costs are in the range 3.17 – 19.77. More specifically, under a 10%
scenario targeting high biodiversity and low human impact, yields a benefit-cost ratio of 19.77, and under a
high biodiversity, high human impact yields a ratio of 15.02.
60. In general, methodological issues that need to be considered when conducting a cost-benefit
analysis are (UNEP-WCMC, 2011): the treatment of risk and uncertainty; avoiding the risk of double
counting; scale dependence of values for certain services; and dealing with cumulative impacts.25
61. While cost-benefit analysis should in theory be undertaken any time the establishment of an MPA
is being considered, very few seem to have been undertaken in practice. Though CBA can be time and
resource intensive, they provide information that is crucial to ensuring that resources are allocated to their
25
How these issues can be addressed are described in UNEP-WCMC (2011). Further discussion here lies beyond the
scope of this report.

ENV/EPOC/WPBWE(2015)1/REV1
31
most effective use. Notably, the 2008 EU Marine Strategy Framework Directive requires CBA prior to the
introduction of any new measure. Under Article 13, Programmes of Measures, the Directive states:
“3. Member States shall ensure that measures are cost-effective and technically feasible, and shall
carry out impact assessments, including cost-benefit analyses, prior to the introduction of any
new measure.
4. Programmes of measure established pursuant to this Article shall include spatial protection
measures, contributing to coherent and representative networks of marine protected areas,
adequately covering the diversity of the constituent ecosystems, such as special areas of
conservation pursuant to the Habitats Directive, special protection areas pursuant to the Birds
Directive, and marine protected areas as agreed by the Community or Member States concerned
in the framework of international or regional agreements to which they are parties.”
References
Ban et al., (2011) Designing, implementing and managing marine protected areas: emerging trends and
opportunities for coral reef nations. Journal of Experimental Marine Biology and Ecology. 408:21–31.
Ban, NC, and Klein CJ (2009). Spatial socio-economic data as a cost in systematic marine conservation
planning. Conservation Letters 2:2, 06-215.
Barbier, E.B.; Hacker, S.D.; Kennedy, C.; Koch, E.W.; Stier, A.C.; Silliman, B.R. (2011). The value of estuarine
and coastal ecosystem services. Ecological Monographs 81(2): 169–193. doi: 10.1890/10-1510.1
Brander et al. (2015). The Benefits to People of Expanding of Marine Protected Areas. IVM Institute for
Environmental Studies. Report prepared for WWF.
Butardo-Toribio, Alino, and Guiang, (2009). Cost-Benefit Study of Marine Protected Areas: Implications
on Financing and Institutional Needs. Philippine Agricultural Scientist. 92 (2).
Chan et al (2012) Tourism Management, 33. 971-977
Clavelle and Jylkka (2013). Ecosystem Service Valuation of Proposed Protected Areas in Abaco, The
Bahamas. http://sfg.msi.ucsb.edu/current-projects/SFG_Abaco_FinalReport_041614.pdf
Gravestock, P., Roberts, C., and Bailey, (2008). The income requirements of marine protected areas.
Ocean & Coastal Management 51: 272-283
Halpern et al. (2008). A Global Map of Human Impacts on Marine Ecosystems. Science 319.
Hanley and Barbier (2009). Pricing Nature: Cost-Benefits Analysis and Environmental Policy. Edward Elgar.
Hussain, S.S., Winrow-Giffin, A., Moran, D., Robinson, L. a, Fofana, A., Paramor, O.a.L., Frid,
C.L.J., (2010). An ex ante ecological economic assessment of the benefits arising from marine protected
areas designation in the UK. Ecological Economics. 69 (4), 828–838.
Jobvogst et al. (2014). Looking below the surface: The cultural ecosystem service values of UK marine
protected areas (MPAs). Ecosystem Services 10: 97-119

ENV/EPOC/WPBWE(2015)1/REV1
32
Jobstvogt, N., Hanley, N., Hynes, S., Kenter, J., Witte, U., 2014. Twenty thousand sterling under the sea:
estimating the value of protecting deep-sea biodiversity. Ecological Economics. 97, 10–19.
Leathwick et al. (2008). Novel methods for the design and evaluation of MPAs on offshore waters.
Conservation Letters 1 (2).
Leenhardt et al. (2013). The rise of large-scale marine protected areas: Conservation or geopolitics? Ocean
& Coastal Management. 1-7.
Links Economic Forum (2012). Valuing the Benefits of Designating a Network of Scottish MPAs in
Territorial and Offshore Waters.
http://www.scotlink.org/files/publication/LINKReports/Valuing_the_benefits_MPA_Network_Scotl
and_Report_(final).pdf
Mathieu, L. (1998). The Economic Value of Marine Parks of the Seychelles. M.Sc. Thesis. University of
Edinburgh, Edinburgh, UK.
McCrea-Strub et al. (2011). Understanding the cost of establishing marine protected areas. Marine Policy
35: 1-9.
McCook, L. J., T. Ayling, M. Cappo, J. H. Choat, R. D. Evans, D. M. De Freitas, M. Heupel, T. P. Hughes,
G. P. Jones, B. Mapstone, H. Marsh, M. Mills, F. J. Molloy, C. R. Pitcher, R. L. Pressey, G. R. Russ,
S. Sutton, H. Sweatman, R. Tobin, D. R. Wachenfeld, and D. H. Williamson. (2010). Adaptive
management of the Great Barrier Reef: a globally significant demonstration of the benefits of
networks of marine reserves. Proceedings of the National Academy of Sciences 107:18278-18285.
http://dx.doi.org/10.1073/pnas.0909335107.
McVittie and Moran (2010). Valuing the non-use benefits of marine conservation zones: An application to
the UK Marine Bill. Ecological Economics 70, 413–424.
Nam et al (2005). Economics of conservation for the Hon Mun Marine Protected Area in Vietnam. In
Nature’s Wealth: The Economics of Ecosystem Services and Poverty.
Pascal, N. 2011. Cost--‐Benefit analysis of community based MPAs.5 case studies in the Vanuatu, South
Pacific. Component 3A. Socio--‐economic and coral reef ecosystems. CRISP Research reports.
CRIOBE (EPHE/CNRS), Insular Research Center and Environment Observatory, Moorea, French
Polynesia.
Rojas-Nazar et al. (2015). Marine reserve establishment and on-going management costs: A case study
from New Zealand. Marine Policy 60: 216-224.
Turpie et al. (2006). The Economic Value of MPAs along the Garden Route Coast, South Africa. Report
prepared for WWF.
UNEP-WCMC (2011) Marine and coastal ecosystem services: Valuation methods and their application.
UNEP-WCMC Biodiversity Series No. 33. 46 pp.
Zarrata-Barrera and Maldonado (2015).

ENV/EPOC/WPBWE(2015)1/REV1
33
Annex Table 2.1. Costs of MPAs
Name Size (km2) Zoning Cost Currency Notes
Coral Sea, Australia (before 2012 establishment) Ban et al., 2011
972,000 100% no-take (IUCN Ia)
12,550,000 (O) 2009 AUD Model estimate. Assumes managed as independent MPA.
Coral Sea, Australia (before 2012 establishment) Ban et al., 2011
972,000 30% no-take 24,528,000 (O) 2009 AUD Model estimate. Assumes managed as independent MPA.
Coral Sea, Australia (before 2012 establishment) Ban et al., 2011
972,000 100% no-take (IUCN Ia)
7,800,000 (O) 2009 AUD Expert estimate. Assumes extension of GBR management.
Coral Sea, Australia (before 2012 establishment) Ban et al., 2011
972,000 30% no-take 13,400,000 (O) 2009 AUD Expert estimate. Assumes extension of GBR management.
Ashmore Reef, Australia Ban et al., 2011
583 94% no-take 6% IUCN II
348,000 (O) 2009 AUD
Cod Grounds, Australia Ban et al., 2011
3 100% no-take 188,000 (O) 2009 AUD
Incorporated into larger new Cod Grounds Commonwealth Marine Reserve, 2012.
Coringa-Herald, Australia Ban et al., 2011
8,852 100% no-take 211,000 (O) 2009 AUD Incorporated into Coral Sea Commonwealth Marine Reserve, 2012
Elizabeth and Middleton Reefs, Australia Ban et al., 2011
1,880 76% no-take 24% IUCN II
100,000 (O) 2009 AUD Incorporated into new Lord Howe Commonwealth Marine Reserve, 2012
Great Australian Bight, Australia Ban et al., 2011
19,395 100% IUCN VI 259,000 (O) 2009 AUD Incorporated into larger new Great Australian Bight Marine Reserve, 2012.
Heard and McDonald Islands, Australia Ban et al., 2011
64,658 100% no-take 620,000 (O) 2009 AUD
Lord Howe Island, Australia Ban et al., 2011
3003 32% no-take 68% IUCN IV
152,000 (O) 2009 AUD Incorporated into new Lord Howe Commonwealth Marine Reserve, 2012
Mermaid Reef, Australia Ban et al., 2011
540 100% no-take 132,000 (O) 2009 AUD
Ningaloo, Australia Ban et al., 2011
2,435 100% IUCN II 148,000 (O) 2009 AUD
Solitary Islands, Australia Ban et al., 2011
152 0.5% no-take 24% IUCN IV 75% IUCN VI
232,000 (O) 2009 AUD Replaced by Solitary Islands Commonwealth Marine Reserve, 2012.
Great Barrier Reef, Australia Great Barrier Reef Marine Park Authority, 2014
344,520
34% no-take (IUCN 1a/II) 4.4% IUCN IV 62% IUCN VI
55,417,000 (O) 2014 AUD For year ending 30 June 2014.
Annex Table 2.1 continued next page.

ENV/EPOC/WPBWE(2015)1/REV1
34
Annex Table 2.1. Costs of MPAs
(continued)
Name Size (km2) Zoning Cost Currency Notes
Port Cros National Park, France IUCN, 2006b
18 0.16% no-take 99.84% IUCN IV
5,000,000 (O) 2006 EUR Estimate
Miramare, Italy IUCN, 2006b
1.2 25% no-take 75% IUCN IV
400,000 (O) 2006 EUR Estimate
MPA network, Italy IUCN, 2006b
120 n/a 250,000 (O) 2006 EUR Estimate
Masia Blanca, Spain IUCN, 2006b
2.8 No-take: n/a 100% IUCN IV
120,000 (O) 2006 EUR Estimate
Columbretes, Spain IUCN, 2006b
44 No-take: n/a
100% IUCN IV 1,235,000 (O) 2006 EUR Estimate
Estrecho, Spain IUCN, 2006b
92.5 100% IUCN V 500,000 (O) 2006 EUR Estimate
La Graciosa, High Seas IUCN, 2006b
707 n/a 600,000 (O) 2006 EUR Estimate
Alboran, High Seas IUCN, 2006b
2,000 n/a 800,000 (O) 2006 EUR Estimate
Pelagos, High Seas IUCN, 2006b
87,492 100% IUCN IV 250,000 (O) 2006 EUR Estimate
Mariana Trench, United States McCrea-Strub et al., 2011
246,608 100% IUCN III 10,000,000 (E) 2005 USD Estimate
Papahanaumokuakea, United States McCrea-Strub et al., 2011
362,100 100% no-take 34,800,000 (E) 2005 USD Estimate
Papahanaumokuakea, United States Papahanaumokueakea, 2008
362,100 100% no-take 48,402,407 (O) 2008 USD Year 5, estimate to achieve desired goals.
MPA Network, California, United States
Gleason et al., 2013 1,542 54% no-take 38,000,000 2013 USD
For a 7-year process. Size and no-take % refer to the area added to existing networks.
Seaflower, Colombia McCrea-Strub et al., 2011
65,018
0.18% no-entry 3.6% no-take
3.2% sustainable use (IUCN VI) 93.02% buffer (IUCN VI)
14,795,169 (E) 2005 USD Estimate
Lafken Mapu Lahual, Chile Gelcich et al., 2013
44 100% IUCN IV 343,620 (O) 2009 USD Estimate
MPA network, Belize
WWF, 2005 n/a Various 2,500,000 (O) 2003 USD
Includes management agency operating cost.
Annex Table 2.1 continued next page.

ENV/EPOC/WPBWE(2015)1/REV1
35
Annex Table 2.1. Costs of MPAs
(continued)
Name Size (km2) Zoning Cost Currency Notes
Saba, Netherlands Antilles McCrea-Strub et al., 2011
8.7 15% no-take
85% IUCN VI 557,237 (E) 2005 USD Estimate
Bonaire, Netherlands Antilles McCrea-Strub et al., 2011
27 15% no-take
85% IUCN II 1,145,058 (E) 2005 USD Estimate
Bonaire, Netherlands Antilles Thur, 2010
27 15% no-take
85% IUCN II 270,000 (O) 2002 USD
Kayangel, Palau Ngedebuul, 2012
1,686 100% IUCN VI 185,563 (O) 2012 USD Projected average, 2014-17
Kisite/Mpunguti, Kenya Emerton and Tessema, 2001
39 K: 100% no-take M: local fishing permitted
135,000 (O) 2000 USD Projected average, 2000-04
Chumbe Island, Tanzania McCrea-Strub et al., 2011
0.5 100% no-take 1,583,455 (E) 2005 USD Estimate
Nha Trang Bay, Vietnam McCrea-Strub et al., 2011
160 10% no-take
90% unknown 2,370,832 (E) 2005 USD Estimate
Pilar, Philippines Butardo-Toribio, Alino, and Guiang, 2009
1.8 17% no-take 445,082 (E) 528,617 (O)
2006 PHP Incurred average
Villahermosa, Philippines Butardo-Toribio, Alino, and Guiang, 2009
0.69 43% no-take 377,867 (E) 237,353 (O)
2006 PHP Incurred average
Bibilik, Philippines Butardo-Toribio, Alino, and Guiang, 2009
0.2 100% no-take 799,159 (E) 445,297 (O)
2006 PHP Incurred average
Tambunan, Philippines Butardo-Toribio, Alino, and Guiang, 2009
1.03 100% no-take 840,778 (E) 710,180 (O)
2006 PHP Incurred average
Talisay, Philippines Butardo-Toribio, Alino, and Guiang, 2009
0.3 30% no-take 357,576 (E) 332,007 (O)
2006 PHP Incurred average
MIISTA, Philippines Butardo-Toribio, Alino, and Guiang, 2009
1.6 100% no-take 741,081 (E) 771,699 (O)
2006 PHP Incurred average
Apo Reef, Philippines MSR, 2012
275 100% IUCN II/VI 185,978 (O) 2012 USD Average, 2012-21
Tubbataha Reef, Philippines MSR, 2012
970 100% no-take 514,000 (O) 2012 USD Average, 2012-21
Annex Table 2.1 continued next page.

ENV/EPOC/WPBWE(2015)1/REV1
36
Annex Table 2.1. Costs of MPAs
(continued)
Name Size (km2) Zoning Cost Currency Notes
Gilutongan, Philippines MSR, 2012
0.15 100% no-take
29,893 (O) 2012 USD Average, 2012-21
Hinobaan, Philippines MSR, 2012
0.25 n/a 36,381 (O) 2012 USD Average, 2012-21
Berau, Indonesia MSR, 2010
12,378 8% no-take (assumed) 92% IUCN VI
685,382 (O) 2011 USD Average, 2011-20
Bunaken, Indonesia MSR, 2010
890 790 marine
100% IUCN II 1,417,723 (O) 2011 USD Average, 2011-20
Taputeranga Marine Reserve, New Zealand
Rojas-Nazar et al. (2015)
Pre-establishment cost NZ$508,000. Establishment process cost NZ$353,000. Annual management costs across the 5 reserves ranged between NZ$43,200 and NZ$112,500 between 2008/09 and 2010/11. Annual fishers displacement cost: NZ$22,000 per annum.

ENV/EPOC/WPBWE(2015)1/REV1
37
3. EFFECTIVE MANAGEMENT OF MARINE PROTECTED AREAS
62. Marine protected areas are intended to contribute to the conservation and sustainable use of
marine ecosystems. However, their effectiveness varies and depends on how they are designed and
implemented. This chapter examines the key features that need to be considered for these to be able to
deliver on their intended objectives in an environmentally and cost effective way. Key features include
clearly defining the goals and objectives of the MPA; determining the location, size and number of the
MPAs; establishing robust monitoring and reporting frameworks; and ensuring appropriate compliance and
enforcement regimes26
.
3.1 Clear goals and objectives
63. The specific goals of individual MPAs vary, with some broader than others, and can include
environmental, social and economic objectives. Environmental objectives can, for example, be to protect
depleted, threatened, rare or endemic species or populations; conserve habitats; and prevent outside
activities from adversely affective the MPA. Social objectives may include higher incomes, food security
and better health, while economic objectives may be to ensure sustainable fisheries and tourism. In the
Galapagos, for example, the marine reserve introduced in 2000 was intended to (a) reduce conflicts
between uses, principally tourism, fishing and scientific research; (b) protect marine biodiversity; and
(c) promote sustainable uses. The goals of other MPAs are highlighted in Annex 3.1.
64. The goals and objectives of an MPA will have distinct implications for its design and
implementation, including on where to locate the MPA, the size and type of zoning restrictions that may be
appropriate, as well as the indicator and monitoring needs. The importance of establishing clear goals and
objectives for MPAs should therefore not be underestimated. The objectives should also be stated at an
operational level, so as to be specific, measurable, achievable, realistic and time-bound (i.e., SMART). In
this context, it is therefore helpful to also define key desired outcomes that the MPA is intended to achieve
(Jones, 2009). A SMART objective could for example be to prevent further loss of key (defined) habitats
by 2015.
65. Finally, when setting objectives, it is also important to understand the main threats to marine
biodiversity in the area (e.g. over-fishing, pollution, habitat degradation, etc – see Chapter 1) in order to
gauge to what extent MPAs will be able to address these, and what additional policy instruments may be
needed to complement MPAs (for discussion on policy mixes, see Chapter 5).
3.2 Siting, size and number of MPAs
66. The appropriate location, size and number of MPAs will depend on the objectives of the MPA.
With regard to location, as discussed in Chapter 2, the decision on whether or not to invest in a specific
MPA should ideally be informed by cost benefit analysis. In cases where there are multiple sites that merit
26
As indicated in the Note to Secretariat, the next version of this chapter is intended to include additional sections on
Governance (including discussion of distributional issues) and on Adaptive Management.

ENV/EPOC/WPBWE(2015)1/REV1
38
designation as an MPA, but where resources are limited, priorities may need to be established. While
marine ecosystems are generally more spatially and temporally complex that terrestrial ecosystems, the
general principles for determining where to prioritise resources for an MPA should follow the same as
those for terrestrial biodiversity. This implies identifying areas with (1) highest biodiversity benefits,
(2) highest risk of loss, and (3) lowest opportunity costs (see OECD, 2010).
67. While ecological criteria is the norm for determining where to locate an MPA (i.e., by identifying
ecologically significant and representative areas)27
, studies suggest however that often MPAs are situated
in locations that are not under direct threat of loss (Burke et al, 2011; Edgar, 2011; Deviliers et al. 2014).
As noted by Watson et al (2014), large and remote MPAs may not necessarily avert imminent and direct
threats in populated coastal waters where pressures on biodiversity often remain intense. This implies that
resources are not allocated to areas where they will have greatest environmental impact. Similarly,
opportunity costs are also often not taken into account, implying that resources are not allocated in the
most cost-effective manner.
68. A few exceptions that do this to some extent are academic studies though it is not clear whether
the results have been incorporated into public decision-making processes. Klein et al (2008) for example
examine how to design a network of MPAs along the Californian central coast. The primary objective of
the MPA design was to minimise the “cost” of the protected areas to the fishing industry while ensuring
that the conservation and non-consumptive socioeconomic goals were achieved. With the aim of cost-
effectively protecting coral reef, Klein et al (2010) use information on threats to marine ecosystems,
effectiveness of management actions at abating threats, and the management and opportunity costs of two
conservation actions (i.e. land-based and sea-based), to calculate the rate of return on investment in sixteen
ecoregions in the Coral Triangle.
69. A handful of studies have attempted to undertake this type of analysis at the global level
however. Combining data available on species diversity and the distribution of threats from human impact
to coral reefs28
(the most biologically diverse of shallow water marine ecosystems), Roberts (2002)
identified 10 hotspot priorities for reef conservation, namely in South Japan, the Gulf of Guinea, the North
Indian Ocean, Eastern South Africa, Cape Verde Islands, West Caribbean, Red Sea, Philippines, South
Mascarene Islands and the Sunda Islands.
70. Pompa et al. (2011) used data on all marine and freshwater mammal species, and find that the
nine most biodiverse marine hotspots are located in: the coasts of Baja California, north-eastern America,
Peru, Argentina, north-western Africa, South Africa, Japan, Australia, and New Zealand. In addition they
identified eleven key conservation sites that were deemed irreplaceable because the presence of endemic
species. These are the Hawaiian Islands, Galapagos Islands, San Felix and Juan Fernández Islands,
Mediterranean Sea, Caspian Sea, Kerguelen Islands, Amazon River, Lake Baikal, Yang-Tze River, Indus
River, and the Ganges River. These sites had unique species, such as the Galapagos fur seal (A.
galapagoensis) and the Mediterranean monk seal (Monachus monachus). Interestingly, six irreplaceable
sites were continental (rivers and lakes), and five were marine.
71. More recently, Stuart-Smith (2013) use a modified approach, integrating abundance and
functional traits of fish diversity to identify global marine hotspots. Their results suggest further
unrecognised biodiversity value in some temperate and southern hemisphere marine regions.
27
This is the approach taken in most countries (e.g. the EU, Lebanon), and is the criteria specified in CBD Aichi
Target 11 for marine protected areas.
28 From Bryant et al (1998).

ENV/EPOC/WPBWE(2015)1/REV1
39
72. In terms of risk of loss (or threat), Halpern et al. (2008) developed a global map of human
impact on marine ecosystems29
and suggested to overlay this with a map of hotspots to identify areas of
possible conservation priority. This approach has subsequently been undertaken by Selig et al (2014) who
identified global priorities for marine biodiversity conservation. They used modelled spatial distribution
data for nearly 12,500 species to quantify global patterns of species richness and two measures of
endemism. By combining these data with spatial information on cumulative human impacts (from Halpern
et al. 2008), they identified priority areas where marine biodiversity is most and least impacted by human
activities, both within Exclusive Economic Zones (EEZs) and Areas Beyond National Jurisdiction (ABNJ).
Their analyses highlighted places that are both accepted priorities for marine conservation like the Coral
Triangle, as well as less well-known locations in the southwest Indian Ocean, western Pacific Ocean,
Arctic and Antarctic Oceans, and within semi-enclosed seas like the Mediterranean and Baltic Seas. They
find for example that countries like the Philippines, Japan, and China, which have large areas of highly
impacted priority areas, should be considered urgent priorities for conservation intervention.
73. Brander et al (2015) combined this also with opportunity costs (see discussion in Chapter 2),
though they do not provide information on where the MPAs are located. While Selig et al (2014) and
Brander et al (2015) are global studies, similar analysis conducted at the national level, using more refined
data where available, would allow for more informed and cost-effective decision-making processes.
Prioritisation software and modelling tools such as Marxan and Marzone should be used to identify where
MPAs should be located to maximise benefits and reduce costs (see e.g. Giakoumi et al, 2011; Micheli et
al, 2013; Mazor et al, 2014). Other tools and initiatives currently under development which may be useful
in this regard include marine InVest30
and Mapping Ocean Wealth - a three year initiative by The Nature
Conservancy that intends to map monetary values and other benefits including jobs, fish production, food
security, and risk reduction (Spalding et al. 2014).
3.2.1 Size and number of MPAs
74. There are three basic MPA designs that are most commonly used and discussed: a small single
area, a large single area, or a network of areas. A small area may be appropriate if the objective is to
protect a unique habitat, a site-specific life cycle event (such as spawning aggregation that occurs in a
single area), or a unique shipwreck. A large single area may be used to protect species nursery grounds, or
representative habitat from either fishing pressure or destruction of habitat. A network of MPAs may be
used to protect habitats needed for the diversity of life stages common among marine species to ensure that
larval transport occurs throughout an entire region..
75. Scientific recommendations regarding size for marine reserves and MPAs range from at least
3km2 to at least 13km
2. According to IUCN however, only 35-60% of existing MPAs meet these minimum
size recommendations.31
Agardy et al (2015) highlight several examples where the size of the MPA has
failed to guarantee the conservation of the species they were intended to protect. One of these is the
Vaquita, an endemic species located in the northern Gulf of California, Mexico, and one of the most
endangered mammals in the world. The boundaries of a Biosphere Reserve created in 1993 left 40% of the
29
They find that there are large extents of heavily impacted ocean in the North Sea, the South and East China Seas,
and the Bering Sea. Much of the coastal area of Europe, North America, the Caribbean, China and Southeast Asia are
also heavily impacted. The least impacted areas are largely near the poles, but also appear along the north coast of
Australia, and small, scattered locations along the coasts of South America, Africa, Indonesia and in the tropical
Pacific.
30 http://www.naturalcapitalproject.org/pubs/marine/MarineInVEST_Apr2010.pdf
31 http://www.protectplanetocean.org/collections/introduction/introbox/globalmpas/introduction-item.html

ENV/EPOC/WPBWE(2015)1/REV1
40
species already greatly reduced habitat outside its designation, thereby allowing continued intense gillnet
fishing which threatens its survival.
76. Edgar (2014) show that the conservation benefits of 87 MPAs investigated worldwide increase
exponentially with the accumulation of five key features: large (>100km2), no take, old (>10 years), well
enforced, and isolated by deep water or sand. General recommendations for MPA design based on the
work of Ban et al (2011) are that larger MPAs are better, that 20–50% of any region should be designated
as no-take areas, and that networks of MPAs should be comprehensive, adequate and representative. In
contrast, they find that in many developing countries, coral reef MPAs are numerous but small with
variable representation of habitats, and that MPAs are typically not planned to contribute to representative,
connected networks (McCook et al., 2009b, TNC et al., 2008, Weeks et al., 2010a and Wood et al., 2008).
77. A large emphasis is also being placed on the development of MPA networks which can enhance
benefits and contribute to broader ecosystem objectives (e.g. greater protection for highly migratory
species, enhanced resilience against localised environmental change, amongst others). The IUCN defines
MPA network as “a collection of individual MPAs or reserves operating cooperatively and synergistically,
at various spatial scales, and with a range of protection levels that are designed to meet objectives that a
single reserve cannot achieve” (IUCN WCPA, 2008) and has developed a guide for developing national
and regional capacity to build these (IUCN, 2007).
78. As noted by Green et al. (2014), various ecological guidelines have been developed for designing
MPA networks: These focus on achieving fisheries (e.g., Fogarty and Botsford 2007), biodiversity
(e.g., Almany et al. 2009) or climate change (e.g., McLeod et al. 2012) objectives independently, or
fisheries and biodiversity (Roberts et al. 2003; Gaines et al. 2010) or biodiversity and climate change
(McLeod et al. 2009) objectives combined. Green et al. (2014) provide guidelines for how to achieve
fisheries, biodiversity, and climate change objectives together. These too however need to be integrated
with economic considerations.
79. Overall, while there is an increasing plethora of initiatives to develop prioritisation approaches
for MPAs, insufficient attention is being paid to incorporating economic aspects. In a review of 18 large
scale conservation plans for the Mediterranean Sea, for example, Micheli et al. (2013) find that most of
these are nearly exclusively driven by biodiversity criteria, a few also incorporate threats, and none
incorporate cost. To address this gap, Mazor et al. (2014) developed surrogates that account for revenue
from multiple marine sectors: commercial fishing, noncommercial fishing, and aquaculture. Such revenue
can translate into an opportunity cost for the implementation of an MPA network. Using the software tool
Marxan, they set conservation targets to protect 10% of the distribution of 77 threatened marine species in
the Mediterranean Sea. They compared nine scenarios of opportunity cost by calculating the area and cost
required to meet these targets and also compared these spatial priorities with those that are considered
consensus areas by the proposed prioritisation schemes in the Mediterranean Sea. They find that for less
than 10% of the Sea's area, the conservation targets can be achieved while incurring opportunity costs of
less than 1%.
3.3 Monitoring and reporting
80. Monitoring is important for three fundamental reasons, namely to establish baseline data, to
assess whether MPA objectives are being met, and to enable adaptive management. Monitoring should
include both ecological and socio-economic aspects, inside and outside the MPA. The information can
ultimately help managers improve the management effectiveness and efficiency of an MPA.

ENV/EPOC/WPBWE(2015)1/REV1
41
3.3.1 Establishing baselines
81. Baseline data at the time of MPA designation provide a snapshot that can be used to evaluate
future changes (Puotinen, 1994). While the specific information that a baseline should cover will depend
on the objectives of an MPA, in general, this should include (Pomeroy 2005; Maxwell et al, 2014):
Mapping the distribution and abundance of key species and habitats (such as coral reefs);
The status of ecosystem communities, fish populations and fishing practices;
The size and structure of the human uses and threats, and the importance to communities;
Government rules and regulations in the area, and understanding the decision-making processes
in local communities.
82. According to MacNeil (2015), few baselines have been established for determining when MPA
objectives have been met however. Exceptions include the Galapagos Marine Biodiversity Baseline
(2002)32
, the First Report Card (2009 Baseline) of the Great Barrier Reef in Australia, and more recently,
baseline monitoring of Southern California’s MPAs which concluded in mid-2014. This 5-year baseline
monitoring period for the south coast region began in 2012 after 36 new MPAs (and 12 pre-existing MPAs
and two special closures at the Channel Islands). The baseline projects characterised a range of ecosystems
including rocky intertidal, kelp forests, and sandy beaches. Other elements of the baseline assessment
included surveys of human usage (such as fishing and wildlife viewing), studying waters deeper than 100
meters via remotely operated vehicle surveys, and conducting aerial surveys to map nearshore habitats.33
In
another recent study focussing specifically on the impact of an MPA on coral health, Hein et al. (2015)
conducted a baseline analysis both inside and outside a proposed MPA in Thailand. Data was therefore
collected on coral health, levels of sedimentation, diving pressure, snorkelling pressure, waste-water run-
off, and boat traffic.
3.3.2 Monitoring to assess effectiveness
83. To assess whether an MPA is effectively meeting its objectives, monitoring needs to be
conducted at regular intervals so as to be able to detect changes and trends over time. At a minimum, the
steps involved in preparing for ecological and socio-economic monitoring include identifying the purposes
of monitoring, selecting the relevant indicators, defining the methods and process to conduct the
monitoring, identifying and consulting with stakeholders, and identifying the monitoring team.
84. This is important because MPA monitoring has often been hampered by constraints including
human resources (staff, capacity); financial resources, equipment and infrastructure, geographical
characteristics of MPAs (e.g. secluded, extended), and knowledge (e.g. uncertainties associated with
marine ecosystem complexities). To this end, a clear understanding of the constraints will help to establish
realistic monitoring plans, where resources may need to be prioritised, as well as the need for training and
capacity-building.
85. Several types of assessment frameworks are available for use to evaluate effectiveness in MPAs.
These include the Marine Protected Area Management Effectiveness Initiative (MPA-MEI)34
, the MPA
32
http://www.galapagospark.org/documentos/DPNG_linea_base_rmg.pdf
33 https://cdfwmarine.wordpress.com/2015/02/04/south-coast-mpa-baseline-monitoring/
34 A primary product of the MPA-MEI is a guidebook designed to provide step-by-step guidance to managers and
other practitioners in: (a) selecting the relevant biophysical, socioeconomic, and governance indicators for the
evaluation of a particular MPA, (b) developing a process for planning for and implementing this evaluation, and (c)
using the results generated to inform and adaptively manage the MPA.

ENV/EPOC/WPBWE(2015)1/REV1
42
Performance Assessment System (PAS), the driver-pressure-state-impacts-response (DPSIR) framework,
and goal-objective-indicator-success (GOIS) (Hilborn et al. 2004, Pomeroy et al. 2004, Ojeda-Martínez
et al. 2009, Stelzenmüller and Pinnegar 2011). These frameworks take into account objectives and goals,
realistic benchmarks or indicators to measure success, simple and organised monitoring programmes, and
continuous feedback by all interested parties (Pomeroy et al. 2004, Ojeda-Martínez et al. 2009).
86. Moreover, several countries have developed specific monitoring protocols or plans for MPAs,
such as in Palau35
and in the Channel Island in the U.S.36
In other countries, monitoring plans are being
developed to support National Strategies for Marine Protected Areas, such as in Lebanon. Several guidance
documents have also been developed to help MPA managers conduct effective monitoring
(e.g. Pomoroy, 2004; MedPan, 2014) (See Figure 3.1).
Figure 3.1 Conducting MPA Management Effectiveness Evaluation
Source: Pomeroy (2005).
87. As indicated above, while the specific elements to be monitored should be based on the
objectives of the MPA, common elements that these tend to include are listed in Table 3.1.
35
http://www.picrc.org/images/stories/PICRCdoc/Publications/Monitoring_Protocol.pdf
36 http://www.dfg.ca.gov/marine/channel_islands/monitoring.asp

ENV/EPOC/WPBWE(2015)1/REV1
43
Table 3.1 Possible monitoring elements for MPAs
Examples Notes or method
Ecological
Species abundance
Pollution loads
Health of ecosystem (e.g. live coral vs non-live coral)
Density and size of commercial fish
Export of larval and adult fish from MPA
See grass community
Visibility
Temperature
Sediment
Bathymetry/bed level
Underwater visual census by snorkel or SCUBA
e.g. if goal is fisheries management
e.g. if goal is fisheries management
for climate change impacts
Socio-economic
Existence and adoption of a management plan
Local population size
Number of tourists visiting site
Fish catch or CPUE
Costs of MPA management (e.g. staff, equipment, training)
Revenue from e.g. user fees, and other sources of MPA finance (e.g. national budget, NGOs, ODA)
Level of resource conflict
Degree of information dissemination to encourage compliance
Level of compliance
Yes/No
Recorded at entry
Within and outside MPA to evaluate displacement effects
Management annual report
See section 3.5
88. Different monitoring approaches and frameworks have been used across different MPAs. While
these may be partly influenced by the institutional structures in place and the level of capacity, developing
a monitoring framework should be guided by the need for accuracy, cost-effectiveness, efficiency and ease
of collection (Maxwell, 2014).
89. Perhaps one of the longest running monitoring programmes is that for the Great Barrier Reef in
Australia. More than 50 different monitoring programmes are underway, which are either publicly or
privately funded. These include Seagrass Watch, AIMS long-term monitoring programme, Reef and
Health Impact surveys, amongst many others.
90. To assess whether MPAs are effectively meeting their goals, the French Marine Protected Areas
Agency which was established in 2006 subsequently initiated a project in 2007 to develop an MPA
Dashboard. The dashboard is composed of 7 key steps (see Box 3.1) and is being piloted in 22 MPA sites.

ENV/EPOC/WPBWE(2015)1/REV1
44
Box 3.1 The 7 key steps of the MPA Dashboard
1. Defining and quantifying the MPA’s long-term goals (responsibility, expected results and targets to be reached in 15 years’ time).
2. Defining indicators to achieve the expected results identified in step 1.
3. Analysis and summary of the monitoring systems implemented in the MPA and those to be developed to calculate the indicators identified in step 2.
4. Analysis and summary of the databases and reference standards used by the manager to secure the data of the monitoring systems identified in step 3.
5. Implementing, upgrading or securing the IT tools used to analyse and process data to facilitate indicator calculation.
6. Review and audit of the dashboard developed by the manager following the fi ve steps above (analysis of inconsistencies, gaps, needs, costs, etc.).
7. Developing communication interfaces to report on the dashboard results to decision-makers, users, the general public (pictures, pictograms).
Source: http://www.aires-marines.com/Ressources/Marine-protected-areas-dashboard.
91. To evaluate management effectiveness of three MPAs in the Calamianes Islands, Philippines,
Garces et al (2013) used twenty-three indicators: six biophysical indicators that largely measured the status
of capture fisheries and coastal habitats; eight socioeconomic indicators that assessed the economic status
and the perceptions of coastal communities; and nine governance indicators that measured the various
facets of MPA management37
.
92. With regard to reporting, MPA managers should aim to (UNEP-WCMC, 2007):
Develop long-term and reliable databases and integrated information systems
Coordinate and standardise data collection among individual MPAs within a defined region so
that managers can compare data over time and sites.
Maximise data access, analysis and reporting to support public processes.
Build flexibility into systems to manage for change and new technologies.
93. Examples of databases with information on MPAs include MAPAMED and HELCOM38
and the
MPA Inventory in the U.S., administered by NOAA.39
In other areas, procedures to harmonise monitoring
37
The majority of the indicators were developed by the World Conservation Unions (IUCN) World Commission on
Protected Areas (WCPA) and the World Wide Fund for Nature (WWF) in a joint initiative aimed at improving the
management of MPAs (Pomeroy et al., 2004; Ehler et al., 2002).
38 http://www.medpan.org/en/mediterranean-mpa-status http://www.helcom.fi/action-areas/marine-protected-
areas/data-and-maps/
39 http://marineprotectedareas.noaa.gov/dataanalysis/mpainventory/
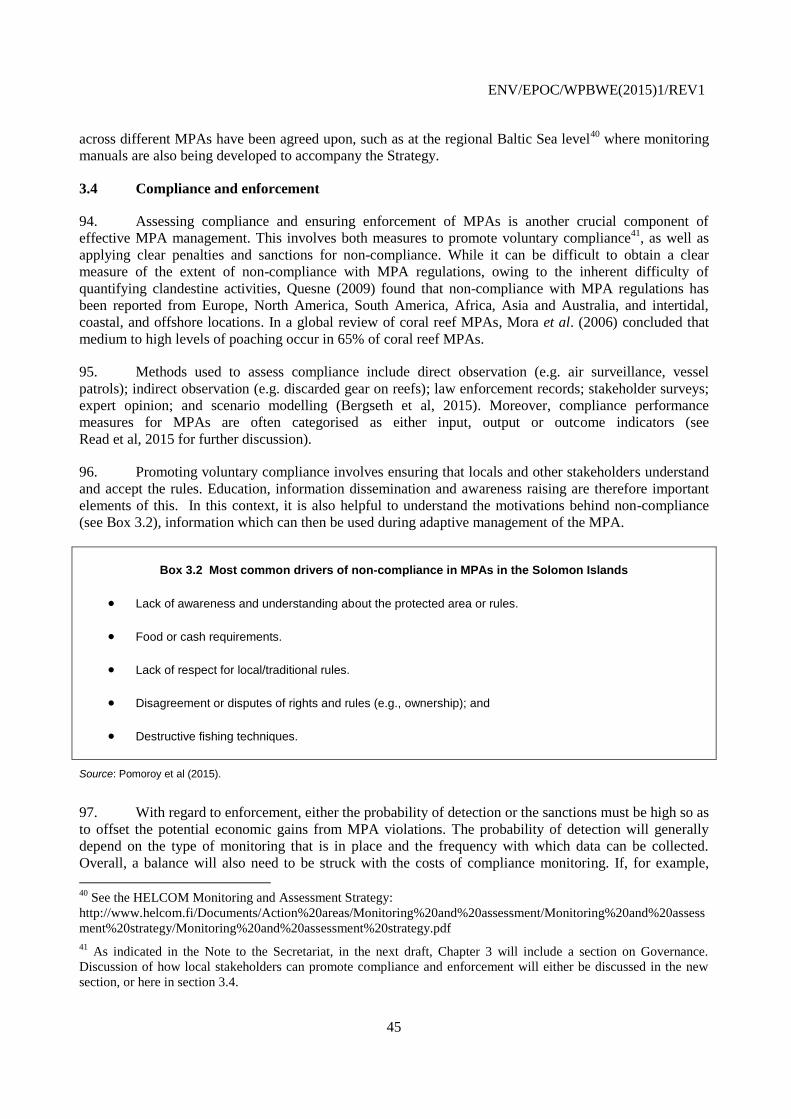
ENV/EPOC/WPBWE(2015)1/REV1
45
across different MPAs have been agreed upon, such as at the regional Baltic Sea level40
where monitoring
manuals are also being developed to accompany the Strategy.
3.4 Compliance and enforcement
94. Assessing compliance and ensuring enforcement of MPAs is another crucial component of
effective MPA management. This involves both measures to promote voluntary compliance41
, as well as
applying clear penalties and sanctions for non-compliance. While it can be difficult to obtain a clear
measure of the extent of non-compliance with MPA regulations, owing to the inherent difficulty of
quantifying clandestine activities, Quesne (2009) found that non-compliance with MPA regulations has
been reported from Europe, North America, South America, Africa, Asia and Australia, and intertidal,
coastal, and offshore locations. In a global review of coral reef MPAs, Mora et al. (2006) concluded that
medium to high levels of poaching occur in 65% of coral reef MPAs.
95. Methods used to assess compliance include direct observation (e.g. air surveillance, vessel
patrols); indirect observation (e.g. discarded gear on reefs); law enforcement records; stakeholder surveys;
expert opinion; and scenario modelling (Bergseth et al, 2015). Moreover, compliance performance
measures for MPAs are often categorised as either input, output or outcome indicators (see
Read et al, 2015 for further discussion).
96. Promoting voluntary compliance involves ensuring that locals and other stakeholders understand
and accept the rules. Education, information dissemination and awareness raising are therefore important
elements of this. In this context, it is also helpful to understand the motivations behind non-compliance
(see Box 3.2), information which can then be used during adaptive management of the MPA.
Box 3.2 Most common drivers of non-compliance in MPAs in the Solomon Islands
Lack of awareness and understanding about the protected area or rules.
Food or cash requirements.
Lack of respect for local/traditional rules.
Disagreement or disputes of rights and rules (e.g., ownership); and
Destructive fishing techniques.
Source: Pomoroy et al (2015).
97. With regard to enforcement, either the probability of detection or the sanctions must be high so as
to offset the potential economic gains from MPA violations. The probability of detection will generally
depend on the type of monitoring that is in place and the frequency with which data can be collected.
Overall, a balance will also need to be struck with the costs of compliance monitoring. If, for example,
40
See the HELCOM Monitoring and Assessment Strategy:
http://www.helcom.fi/Documents/Action%20areas/Monitoring%20and%20assessment/Monitoring%20and%20assess
ment%20strategy/Monitoring%20and%20assessment%20strategy.pdf
41 As indicated in the Note to the Secretariat, in the next draft, Chapter 3 will include a section on Governance.
Discussion of how local stakeholders can promote compliance and enforcement will either be discussed in the new
section, or here in section 3.4.

ENV/EPOC/WPBWE(2015)1/REV1
46
costs of continuous monitoring are prohibitively high, this can be done more strategically instead so as to
target specific activities, time periods or individuals that are believed to have the greatest negative impact.
Thus, enforcement efforts may be higher during e.g. peak tourism seasons or periods of high market values
(NOAA, 2005).
98. Sanctions can include criminal penalties, civil penalties, catch and vessel seizures, and permit
sanctions. Despite the obvious need for sanctions however, some MPAs in the Mediterranean for example,
have never imposed these (up to 30% in N. Africa and EU1). Sanctions have been imposed gradually after
a period of information in around a 40% of the MPAs (MedPan, 2013). Sanctions can range to reflect the
magnitude of the violation. For repeat offenders, the maximum penalty has often been issued in the U.S.
for the pending violation. In a case of repeat violators illegally trawling for shrimp in the Tortugas Shrimp
Sanctuary, the respondents were fined a penalty of USD 25,000 (the maximum authorised penalty at that
time). The same maximum penalty was imposed as a result of a violation occurring in an area closed to
surf clamming, because of two prior violations of the Magnuson-Stevens Act (NOAA, 2005).
99. Costs of MPA management tend to be higher with multiple zone MPAs, partly due to the
additional complexities associated with enforcement. As discussed in Chapter 2, zoning enforcement of the
GBRMP in Australia, for example, represented 32% of total expenditure in 2004. One challenge in multi-
zone MPAs is that it can sometimes be difficult to know where the boundaries lie. Traditional methods
include markers on shorelines, in-water markers in areas that are relatively shallow and low energy, and
maps at key access points or in park publications. Studies from the Mediterranean have found however that
only 1 of every 3 MPAs boundaries are marked at all (MedPan, 2013). Advances in technology can help in
this context: To help recreational fishers keep track of their position in Parks Victoria in Australia, the
agency introduced a recreational fishing guide app for mobile phones in 2013. This uses the geolocational
ability to show fishers whether they are in a no-take zone (red warning message), close to one (orange
message), or safely clear from one (green message).
100. Overall however, insufficient enforcement has been cited as an important reason for lack of MPA
effectiveness (Agardy, 2011; Edgar, 2014). In 15 MPAs in Italy for example, only 3 were identified as
having high levels of enforcement (Guidetti et al, 2008). Sufficient budgeting of resources for surveillance
and enforcement is an important element of this (Agardy, 2011). The emergence of new technical options
to ensure the surveillance and enforcement of remote maritime areas (Brooke et al., 2010; Game et al.,
2009) can help to enhance effectiveness and reduce the costs. Recent initiatives to use satellite data (e.g. in
the Galapagos), massive data processing and advanced software to detect illegal behaviour of shipping
vessels may play a big role in boosting enforcement. Examples include initiatives by Oceana with Google,
and by the Pew Charitable Trusts in cooperation with the UK Satellite Catapult Centre.

ENV/EPOC/WPBWE(2015)1/REV1
47
References
Agardy (2011). Mind the gap: Addressing the shortcomings of marine protected areas through large scale
marine spatial planning. Marine Policy 35.
Alder (1996). Cost and Effectiveness of Education and Enforcement. Environmental Management 20 (4).
Bergseth et al. (2015). Measuring and monitoring compliance in no-take marine reserves. Fish and
Fisheries. 16 (2).
Boeker (2012). Marine Protected Areas in the 21st Century – breakthrough or static? Master’s Dissertation.
Bryant,D., L. Burke, J. McManus, M. Spalding (1998). Reefs at Risk: A Map-Based Indicator of Potential
Threats to the Worlds Coral Reefs (World Resources Institute, Washington, DC; International
Center for Living Aquatic Resource Management, Manila; and United Nations Environment
Programme - World Conservation Monitoring Centre, Cambridge.
Burke et al. (2011). Reefs at Risk Revisited WRI http://www.wri.org/publication/reefs-risk-revisited.
Claudet, J., P. Guidetti, D. Mouillot, N.T. Shears, and F. Micheli. (2011). Ecology – Ecological effects of
marine protected areas: conservation, restoration, and functioning. In: Marine Protected Areas: A
Multidisciplinary Approach. Cambridge University Press. Cambridge. 37-71.
Edgar et al. (2014). Global conservation outcomes depend on marine protected areas with five key
features. Nature 506.
Garces et al. (2013). Evaluating the management effectiveness of three marine protected areas in the
Calamianes Islands, Palawan Province, Philippines: Process, selected results and their implications
for planning and management. Ocean and Coastal Management 81: 49-57.
Green et al. (2014). Designing marine reserves for fisheries management, biodiversity conservation and
climate change adaptation. Coastal Management 42 (2).
Guidetti et al. (2008). Italian marine reserve effectiveness: Does enforcement matter? Biological
Conservation 141: 6 9 9 –7 0 9.
Halpern et al. (2008). A Global Map of Human Impacts on Marine Ecosystems. Science 319.
Hein et al. (2015). Assessing baseline levels of coral health in a newly established marine protected area in
a global scuba diving hotspot. Marine Environmental Research.
Hockings et al. (2000). Evaluating Effectiveness: A Framework for Assessing Marine Protected Areas.
IUCN WCPA Best Practice Guidelines. No. 6. Gland Switzerland.
IUCN (2007). Establishing Marine Protected Area Networks: Making it Happen.
Kelaher et al. (2015). Strengthened enforcement enhances marine sanctuary performance Global Ecology
and Conservation 3. 503–510.
Klein CJ, Ban NC, Halpern, BS, Beger M, Game ET, et al. (2010). Prioritizing Land and Sea Conservation
Investments to Protect Coral Reefs. PLoS ONE 5(8): e12431. doi:10.1371/journal.pone.0012431.

ENV/EPOC/WPBWE(2015)1/REV1
48
Mazor, Giakoumi, Kark, and Possingham (2014). Large-scale conservation planning in a multinational
marine environment: cost matters. Ecological Applications 24:1115–1130.
Maxwell et al. (2014). Pragmatic approaches for effective management of pelagic marine protected areas.
Endangered Species Research 26: 59–74.
McCook, L. J., T. Ayling, M. Cappo, J. H. Choat, R. D. Evans, D. M. De Freitas, M. Heupel, T. P. Hughes,
G. P. Jones, B. Mapstone, H. Marsh, M. Mills, F. J. Molloy, C. R. Pitcher, R. L. Pressey, G. R. Russ,
S. Sutton, H. Sweatman, R. Tobin, D. R. Wachenfeld, and D. H. Williamson. (2010). Adaptive
management of the Great Barrier Reef: a globally significant demonstration of the benefits of
networks of marine reserves. Proceedings of the National Academy of Sciences 107:18278-18285.
http://dx.doi.org/10.1073/pnas.0909335107.
MedPan (2013). Surveillance and the enforcement of regulations in Marine Protected Areas in the
Mediterranean (Preliminary Results).
http://www.medpan.org/documents/10180/0/Summary+of+the+surveillance+study/bcd82e61-8009-43f2-
bcdf-aa170e8a6287.
MedPan (2014). Monitoring for Managing Mediterranean MPAs: Workshop Proceedings.
http://www.medpan.org/documents/10180/0/Proceedings+of+the+2014+MedPAN+workshop/b98dd997-
6942-4e55-a867-e06eaed0ecf1.
NOAA, (2005). Enforcing U.S. Marine Protected Areas
http://marineprotectedareas.noaa.gov/pdf/publications/enforcement.pdf.
OECD (2010). Paying for Biodiversity: Enhancing the Cost-Effectiveness of Payments for Ecosystem
Services. OECD Publishing.
Pomeroy, R.S., J.E. Parks, and L.M. Watson. (2004). How is your MPA doing? A Guidebook of Natural
and Social Indicators for Evaluating Marine Protected Area Management Effectiveness. Gland,
Switzerland and Cambridge, UK.
Pomeroy, R.S., L.M. Watson, J.E. Parks, G.A. Cid. (2005). How is your MPA doing? A methodology for
evaluating the management effectiveness of marine protected areas. Ocean and Coastal
Management, 48: 485–502.
Pomeroy, P., J Parks, K Flower, M Guidote, H Govan, and S Atkinson (2015). Status and needs to build
capacity for local compliance and community-supported enforcement of marine resource rules and
regulations in the Coral Triangle region. Coastal Management, 43 (3).
Pompa et al. (2011). Global distribution and conservation of marine mammals. PNAS.
Puotinen ML (1994). Designing effective base-line monitoring programs for the Great Barrier Reef Marine
Park, Queensland, Australia. Coast Management 22: 391−398.
Quesne (2009). Are flawed MPAs any good or just a new way of making old mistakes? ICES J. Marine
Science 66 (1): 132-136.
Read et al. (2015). Using compliance data to improve marine protected area management. Marine Policy
60, 119-127.

ENV/EPOC/WPBWE(2015)1/REV1
49
Roberts, C.M. et al. (2002). Marine biodiversity hotspots and conservation priorities for tropical reefs.
Science 295, 1280-1284.
Selig, E.R. and J.F. Bruno. (2010). A Global Analysis of the Effectiveness of Marine Protected Areas in
Preventing Coral Loss. PLoS ONE 5(2): 1-7.
Spalding et al. (2014). Attaining Aichi Target 11: How well as marine ecosystem, services covered by
MPA’s? http://www.nature.org/ourinitiatives/habitats/oceanscoasts/wpc-discussion-paper-aichi-
target-11.pdf.
Stelzenmüller, V. and J.K. Pinnegar. (2011). Fisheries – Monitoring fisheries effects of marine protected
areas: current approaches and the need for integrated assessments. In: Marine Protected Areas: A
Multidisciplinary Approach. Cambridge University Press. Cambridge. 168-189.
Worm, B., E.B. Barbier, N. Beaumont, J.E. Duffy, C. Folke, B.S. Halpern, J.B.C. Jackson, H.K. Lotze, F.
Micheli, S.R. Palumbi, E. Sala, K.A. Selkoe, J.J. Stachowicz, and R. Watson. (2006). Impacts of
biodiversity loss on ocean ecosystem services. Science 214: 787-790.

ENV/EPOC/WPBWE(2015)1/REV1
50
Annex Table 3.1. Goals of different MPAs
MPA Goals References
Aching Reef Flat Preserve (Guam) To protect nursery area for juvenile animals located in mangroves and seagrass beds.
Pomeroy et al. 2004
Baltic Sea Protected Areas To protect the environment from human perturbations Helcom 2008
Banc D'Arguin National Park (Mauritania)
To protect seagrass beds and mudflats that act as nursery and rearing grounds for numerous species.
Pomeroy et al. 2004
Bancho Chinchorro Bioshpere Preserve (Mexico)
To protect the country’s largest reef formation. Pomeroy et al. 2004
Bird Island (CNMI) To protect coral reefs, dive sites and caves, and sea bird nest colonies. Pomeroy et al. 2004
Bunaken National Park (Indonesia) To protect coral communities, diversity, abundance, essential habitat, sea turtle and dugong populations.
Pomeroy et al. 2004
Cebu Island (Philippines) To sustain fisheries, maintain diverse coral habitat and to ensure intact food chain.
Laffoley 2008
Channel Islands MPAs (US) Address biodiversity, socioeconomic well-being, fisheries, natural and cultural features, and public education
Davis and Lopez 2004
EU Marine Strategy Framework To achieve Good Ecological Status of waters
Far Eastern Federal Marine Preserve (Russian Federation)
To protect coastal marine islands and over 2700 species. Pomeroy et al. 2004
Florida's Aquatic Preserves System (US)
To protect Florida's coastal resources by using education, resource management, research, monitoring, and partnerships.
Davis and Lopez 2004
Galapagos Island Marine Reserve (Ecuador)
To reduce conflicts between uses, principally tourism, fishing and scientific research; protect marine biodiversity; and promote sustainable uses.
Castrehon and Charles, 2013
Great Barrier Reef, Australia 1. To protect and restore the Reef’s biodiversity; 2. To safeguard the reef’s heritage values; 3. Ensure use of the Region is ecologically sustainable and the socioeconomic benefits derived from the Reef are maintained.
GBRMA (website)
Hol Chan Marine Reserve (Belize) To protect unique channel formations, fish resources, and habitat. Pomeroy et al. 2004
Kimbe Bay Marine Protected Area (PNG)
To conserve marine biodiversity and natural resources and to address local marine resource management needs.
Laffoley 2008
Lenger Island Marine Protected Area (Micronesia)
To protect spawning and aggregation sites, a turtle hatchery, diverse species, and a World War II Base.
Pomeroy et al. 2004
Loreto Bay National Park (Mexico) To protect diversity of species. Pomeroy et al. 2004
Mafia Island Marine Park (Tanzania)
To protect diverse species, habitat, and species aggregations. Pomeroy et al. 2004
Annex Table 3.1 continued next page.

ENV/EPOC/WPBWE(2015)1/REV1
51
Annex Table 3.1. Goals of different MPAs
(continued)
MPA Goals References
Mediterranean Marine Mammals Sanctuary
To conserve marine mammals and habitat from negative impacts. Scovazzi 2004
Michigan's Underwater Preserves System (US)
To protect and preserve shipwrecks and stimulate local economy through tourism.
Davis and Lopez 2004
Miramare Marine Protected Area (Italy)
To promote education and research about reproductive biology of species and water quality.
Pomeroy et al. 2004
Ngemelis (Palau) To protect a diverse habitat. Pomeroy et al. 2004
North Carolina's Primary and Secondary Nursery Areas (US)
To protect nursery areas that support juvenile seafood species. Davis and Lopez 2004
Oregon's Natural and Conservation Management Units (US)
To protect essential habitats and preserve natural resources in dynamic habitats.
Davis and Lopez 2004
Palau Protected Areas Network (Micronesia)
To protect biodiversity, important habitats and vulnerable resources essential to stability.
Laffoley 2008
Piti Bomb Holes Preserve (Guam) To protect habitat for marine mammals. Pomeroy et al. 2004
Saguency-St. Lawrence Marine Preserve (Canada)
To protect feeding grounds for numerous protected species. Pomeroy et al. 2004
Sasanhaya Fish Reserve (CNMI) To protect coral features, dive sites, and World War II wrecks. Pomeroy et al. 2004
Sian Ka'an Biosphere Reserve (Mexico)
To protect coral habitats. Pomeroy et al. 2004
Tubbataha Reef National Marine Preserve (Philippines)
To protect nesting sites and pristine reef habitat. Pomeroy et al. 2004
Upper Gulf of California and Colorado River Delta Biosphere Reserve (Mexico)
To protect marine and coastal habitats, dunes, and deserts. Pomeroy et al. 2004
Washington's Aquatic Reserves (US)
To conserve and enhance aquatic resources, enhance biodiversity, foster stakeholder representation, and increase educational and research opportunities.
Davis and Lopez 2004
Network of Marine Protected Areas on the Pacific Coast of Canada
1) To protect and maintain marine biodiversity, ecological representation and special natural features. 2) To contribute to the conservation and protection of fishery resources and their habitats. 3) To maintain and facilitate opportunities for tourism and recreation. 4) To contribute to social, community, and economic certainty and stability. 5) To conserve and protect traditional use, cultural heritage and archaeological resources. 6) To provide opportunities for scientific research, education and awareness.
http://www.dfo-mpo.gc.ca/oceans/planning/marineprotection-protectionmarine/bc-mpa/visionsandgoals-eng.html
Source: Adapted from Boeker, 2012.

ENV/EPOC/WPBWE(2015)1/REV1
52
4. SUSTAINABLE FINANCING OF MARINE PROTECTED AREAS
101. While the number and coverage of MPAs has increased over the last few decades, a frequently
cited challenge has been their inability to secure sufficient and sustainable financing. This significantly
undermines their ability to achieve their management objectives and MPAs have therefore sometimes been
described as ‘paper parks’ (Gelcich et al., 2013; Thur, 2010)42
. For an MPA to be effective, it is important
to understand the financing needs associated with their design and implementation (see discussion in
Chapter 2 on the costs of MPAs), to identify the possible sources of finance that may be available to
support the MPA, and consequently to develop sustainable financing strategies that will be able to mobilise
sufficient resources in both the short and longer term.
4.1 Financing instruments and approaches
102. Domestic government budgets and international donor assistance have formed the bulk of
protected area financing worldwide (IUCN, 2006a). This holds true when looking only at MPAs as well
(see Table 4.1). Other sources of finance include user fees, fines, debt swaps, biodiversity prospecting,
trust funds, and donations. More novel financing sources either underway or being explored include marine
PES, marine biodiversity offsets, and blue carbon finance. Each of these is discussed below.
42
For example, in a study of 83 MPAs worldwide, Balmford et al (2004) found that, on average, the funding shortfall
was approximately one-half of requirements (median value of USD 2,698 per km2 per year). A similar study by
Gravestock, Roberts, and Bailey (2008) on the financing requirements of 79 MPAs in 36 countries found that median
15% and 74% funding increases were required to meet minimum and ideal requirements, respectively.

ENV/EPOC/WPBWE(2015)1/REV1
53
Table 4.1. Financing of MPAs: Selected examples
MPA Financing sources
Mariana Trench, United States McCrea-Strub et al., 2011
Government allocations (91%) National NGO donors (6%) Local NGO donors (3%)
Papahanaumokuakea, United States McCrea-Strub et al., 2011
Government allocations (95%) National NGO donors (4%) Local NGO donors (1%)
California MPA network, United States (establishment) Gleason et al., 2013
NGO donors (51%) State government allocations (49%) [Over a 7 year process. Does not include staff or in-kind contributions.]
4 MPAs, Mexico Gonzalez-Montagut, 2003
National Commission of Protected Areas - CONANP (55%) Other public and international sources, civil society, academia, private industry (24%) Protected Areas Fund - FANP (12%) European Commission (5%) Entrance fees (3%)
Seaflower, Colombia McCrea-Strub et al., 2011
Multilateral donors (33%) Regional government allocations (19%) International NGO donors (11%) National voluntary donations (6%) National NGO donors (2%) Bilateral government donations (1%) Government allocations (1%) Local NGO donors (< 1%)
Saba, Netherlands Antilles (establishment) McCrea-Strub et al., 2011
Government allocations (69%) National NGO donors (21%)
Saba, Netherlands Antilles (operating) Morris, 2002
Entry fees (50%) Souvenir sales (32%) Local voluntary donations, etc. (17%)
Menai Bay, Tanzania Lindhejm, 2003
NGO donors (90%) Government allocations (10%)
Misali, Tanzania Lindhejm, 2003
International donors (NGOs, foreign development agencies, etc.) (84%) Entry fees (15%) Government allocations (1%)
Chumbe Island, Tanzania (establishment) McCrea-Strub et al., 2011
Private investment (49%) Bilateral government (26%) Bilateral voluntary donations (24%) Multilateral donors (< 1%) International NGO donors (< 1%)
Chumbe Island, Tanzania (operating) Lindhejm, 2003
Tourism entrance fees (90%) International donors (10%)
Mnemba, Tanzania Lindhejm, 2003
Entry fees (85%) Government allocations (15%)
Jozani Chwaka, Tanzania Lindhejm, 2003
International donors (GEF, foreign agencies, NGOs) (70%) Entry fees (25%) Government allocations (5%)
Nha Trang Bay, Vietnam McCrea-Strub et al., 2011
International donors (52%) Bilateral government donations (38%) Government allocations (6%) Local voluntary donations, etc. (5%)
Table 4.1 continued next page.

ENV/EPOC/WPBWE(2015)1/REV1
54
Table 4.1. Financing of MPAs: Selected examples
(continued)
4 MPAs, Sabah, Malaysia PE Research, 2010
Government allocations (80%) International donors (11%) Fees and charges (8%) Fines (< 2%, no data)
Sugud Islands (SIMCA), Malaysia PE Research, 2010
NGO donors (46%) Entry fees (30%) Concessions (25%)
Pilar, Philippines Butardo-Toribio, Alino, and Guiang, 2013
Municipality (59%) Outside grants (37%) Barangay (2%) Community (1%) MPA collections (1%)
Villahermosa, Philippines Butardo-Toribio, Alino, and Guiang, 2013
Community (30%) Outside grants (28%) Barangay (27%) Municipality (8%) NGA (Bureau of Agriculture and Fisheries Resources, etc.) (4%) Province (2%) MPA collections (1%)
Bibilik, Philippines Butardo-Toribio, Alino, and Guiang, 2013
Municipality (46%) Outside grants (44%) Barangay (5%) Province (3%) NGA (Department of Natural Resources, Coast Guard, etc.) (2%)
Tambunan, Philippines Butardo-Toribio, Alino, and Guiang, 2013
Municipality (59%) Outside grants (37%) NGA (Department of Natural Resources, Coast Guard, etc.) (2%) Barangay (1%)
Talisay, Philippines Butardo-Toribio, Alino, and Guiang, 2013
Outside grants (59%) Community (36%) Municipality (4%) Barangay (2%)
MISTTA, Philippines Butardo-Toribio, Alino, and Guiang, 2013
Municipality (59%) Outside grants (30%) Barangay (8%) NGA (3%)
4.1.1. Government budgets
103. National government funding tends to be the primary source of finance for MPAs in developed
countries. In developing countries, government funding also plays a major, albeit perhaps smaller, role, as
governments often have more pressing priorities (Thur, 2010). Government budget allocations for MPAs
are, however, often insufficient to cover total costs. A 2012 report to the Auditor General of Canada, for
example, stated that budget cuts and ‘insufficient resources’ impede Canada’s ability to meet its MPA
targets (OAGC, 2012). In Australia, in 2002 the Great Barrier Reef Marine Park Authority estimated that
actual management costs were approximately twice the budget (Ban et al., 2011). Similarly, the U.S.
Papahanamokukea Marine National Monument management plan provided funding estimates for desired
outcomes, but noted that these estimates are “sometimes substantially above current budget allocations”
(Papahanamokukea, 2008). Sabah Parks in Malaysia received 80% (4.2 million Malaysian ringgits) of its
funding from the state government to manage four marine parks (Table 4.1), but still reported a 13%
(740,000 ringgit) gap between revenues and expenditures in 2009 and a predicted shortfall of 10 million

ENV/EPOC/WPBWE(2015)1/REV1
55
ringgits over the following five years43
(PE Research, 2010). In the Caribbean, most governments are
subject to chronic budgetary shortfalls44
, and the most financially secure MPAs do not primarily depend on
government grants (Reid-Grant and Bhat, 2009).
104. Conservation budgets in both developing and developed countries have tended to stagnate or
decrease in recent years, especially when the government is under strain (IUCN, 2006a; Thur, 2010; Hunt,
2013). Given the public good characteristics associated with marine ecosystem service benefits, national
government funding should continue to be an important contributor to MPA budgets in both developed and
developing countries. Valuation studies and CBA should help to make the case to Ministries of Finance
that greater investment in MPAs is needed. However, broader finance portfolios for MPAs should be
developed, including those that are based on the polluter pays approach.
4.1.2. Donor funding
105. Many MPAs in developing countries rely on bilateral and multilateral donors for financial
support, including from national foreign aid agencies, multilateral banks and agencies such as the GEF and
the World Bank, as well as private donors, philanthropic foundations, NGOs, and communities. Donor
funding is normally part of a wider portfolio of finance, and tends to support establishment costs, training,
and other forms of capacity building necessary to set up an MPA, as well as to put frameworks in place for
them to become financially self-sufficient. Donor funding is generally not intended to support on-going,
long-term expenses of MPAs (IUCN, 2006a; IUCN, 2006b; Erdmann et al., 2003; McClanahan, 1999).
106. The Global Environment Facility (GEF), for example, contributes about USD 100 million
annually to the protection of marine ecosystems (Reid-Grant and Bhat, 2009) and has supported more than
1000 MPAs worldwide. In Samoa for example, a GEF grant was used to establish a sequence of multiple
district-level MPAs. Revenues from charges and fines were used post-grant to seed a trust fund
(WWF, 2005). Funding such as that by the GEF is clearly limited however (donors pledged
USD 1.3 billion towards the biodiversity focal area for the GEF-6 replenishment period) and for protected
areas is targeted to those areas that are globally significant, based on vulnerability and irreplaceability
criterion (GEF, 2014).
4.1.3. Trust funds and debt-for-nature swaps
107. Several MPAs have established trust funds to help ensure a more long-term sustainable, source of
finance. Three types of trust funds exist: endowment funds, which maintain a capital base while paying
only interest; sinking funds, which use both capital and interest and are thus eventually extinguished; and
revolving funds, which are designed to be continuously replenished.
108. In Belize, a Protected Area Conservation Trust (PACT) was established in 1996, funded
principally via a conservation fee on visitors to Belize upon departure and a 20% commission from cruise
ship passengers (Drumm et al. 2011). In Mexico, a remnant worth USD 16.5 million from a
USD 25 million GEF grant was used to capitalise a Protected Areas endowment fund in 1997. This grew to
USD 42 million in 2003 following several donations. Interest from the fund, along with federal allocations,
entrance fees, and a European Commission grant, was channelled annually to various protected areas,
including four marine parks (Gonzalez-Montagut, 2003). In Mauritania, an endowment fund BACOMAB
was established in 2009 to finance the conservation of the Banc d'Arguin and other Mauritanian coastal
43
This was partly because the parks were unable to retain a large enough proportion of revenues raised from user
fees.
44 Government allocations to the Montego Bay Marine Park in Jamaica for example decreased from JMD 1.2 million
in 1998 to less than JMD 100,000 in 2004.

ENV/EPOC/WPBWE(2015)1/REV1
56
and marine protected areas. It’s capital will be invested for perpetuity on capital markets and only the
interest will be used to finance marine and coastal protected areas. The Mauritanian government made an
initial contribution to BACOMAB during 2010-2011 by mobilizing € 1.5 million of revenues from the
fisheries agreement with the European Union. AFD and FFEM have contributed an additional €2.5 million
and €1 million respectively. BACOMAB’s funding objective is to reach €35 million by 2016. Other
funding sources to be explored include:
Contributions from the oil and gas sectors through voluntary compensations or fees attached to
concessions.
Fiscal mechanisms such as a share of fines for fishing infractions or of fishing licences; part of
tourism related taxes, environmental fees or licences for industries with possible impacts on
marine ecosystems, or a tax on the use of ecosystem services.
Carbon finance, in particular related to the sequestration of carbon in marine ecosystems such as
sea grass beds in the Banc d’Arguin (“blue carbon”).45
109. The Mesoamerican Barrier Reef (MAR) Fund46
is an example of a pooled fund, with
contributions from Mexico, Belize, Honduras, and Guatemala. Its central focus is on 14 MPAs in the
Mesoamerican Reef ecoregion, which contains the largest barrier reef system in the Western Atlantic.
110. In Kiribati, the government’s approach to ensuring the long-term financing of the Phoenix Islands
Protected Area (PIPA) is based on the purchase of ‘reverse fishing licenses’ by charitable donors. The goal
is to capitalise an endowment fund, at a level that would generate an income stream sufficient to cover the
operating and management costs of the trust, and the foregone revenues from fishing associated with the
closure or restriction of activities within the PIPA region in Kiribati. The funding target was $25 million,
with an interim target of $13.5 million by 2014, based on 25% of the PIPA area under no-take-zone area.
The protected area also receives the support of the “PAS: Phoenix Islands Protected Area (PIPA)” project
(GEF: $870,200, co-finance: $1.7 million) implemented by UNEP. An endowment fund is also being
developed for the Bird’s Head Seascape in West Papua.
111. A Global Conservation Fund (GCF) was also established in 2001 in which about USD 13 million
(of a total of USD 65 million) has been invested in Important Marine Regions (Bonham et al, 2014). The
GCF was made possible by a grant from the Gordon and Betty Moore Foundation and has leveraged more
than USD 200 million.
112. Debt-for-nature swaps entail the reallocation of a developing country’s funds from repayment of
debts to natural resource protection. Debt swaps and trust funds have often been used in conjunction. The
U.S. government funded the purchase of USD 19 million of Philippine debt in 1992, of which 17 million
was used to set up the Foundation for the Philippine Environment endowment fund (ADB, 2011). NGOs
have also been active in this field. In 2015, TNC brokered a USD 31 million swap between the Seychelles,
its Paris Club creditors, and South Africa to finance marine conservation and climate adaptation, capitalise
an endowment fund, and repay impact investors over a twenty year timeframe. The marine conservation
component includes the creation and management of over 400,000 km2 of new MPAs (TNC, 2015).
Similarly, Jamaica was able to create a trust fund for its National Parks through a direct swap with TNC,
although the interest is not sufficient for all of its protected areas (Reid-Grant and Bhat, 2009).
45
http://www.ffem.fr/webdav/site/ffem/shared/ELEMENTS_COMMUNS/U_ADMINISTRATEUR/3-
PROJETS/fiches-communication/CMR%201165%2001_BACOMAB%20-%20Biodiversity%20UK.pdf
http://www.afd.fr/webdav/shared/PORTAILS/PUBLICATIONS/PLAQUETTES/AFD-aires-marines-VA.pdf
46 http://www.marfund.org/

ENV/EPOC/WPBWE(2015)1/REV1
57
4.1.4. User fees
113. User fees are collected from resource users, including tourists, who chose to access a service or
facility. These types of fees are already being applied in a number of MPAs worldwide (see Table 4.3) and
are set at various levels depending on their purpose (e.g. cost recovery vs. visitor management to reduce
congestion and/or ecological damage), type (e.g. general entrance fees, diving/snorkeling or research fees)
and the prevailing local socio-economic characteristics of the region (e.g. number of visitors, income
levels). Though tourism revenues, for example, can also be unreliable due to the inherently volatile nature
of the industry, which fluctuates with the state of the global economy, natural disasters, political turmoil,
and other considerations (Erdmann et al., 2003; PE Research, 2010), revenues can be sizable.
114. Indeed, some MPAs have been mostly or entirely financed via user fees. Malaysia’s Kota
Kinabalu National Park, for example, raises approximately 80% of its operating expenses from user fees
(ADB, 2011). The Bonaire Marine Park in the Netherlands Antilles had, as of 2010, self-financed all
operations since 1992 through dive entrance fees, boat entrance fees, and mooring fees (Forest Trends,
2010; Thur, 2010). A 2005 raise in Bonaire’s annual fees to USD 25 and 10 for divers and non-divers,
respectively, created a revenue stream conservatively estimated at USD 760,000, far higher than the 2002
operating budget of USD 270,000. The surplus was used for the nearby Washington-Slagbaai terrestrial
park, which also provides upstream ecological benefits to the marine park (Thur, 2010). In the Philippines,
the Gilotongan Marine Reserve appeared to meet all its funding needs through tourism fees, in fact
realising a profit on the order of USD 85,000 in 2012 (MSR, 2012).47
115. Scope may thus exist for wider application of user fees into MPA finance portfolios, though they
must be well designed. One challenge cited for expanding the scope of user fees to other marine parks is
that there are not always easily-defined entry points at which to charge the fee. At the Bunaken Marine
Park, a dual fee/ticket system was used which worked effectively in an open access MPA that has no single
entry point. The fee is charged per person for an annual waterproof tag. Tags are individually numbered to
prevent illegal resale and data from the receipts are entered into a database to help prevent corruption and
to gather tourist statistics.
116. Social acceptability of a fee has been another issue, as there can be a perception that everyone
should have access to natural areas free of charge. Visitors generally accept the imposition of entry fees if
they are made aware that revenues are intended for MPA management. Raising awareness and ensuring
transparency are therefore important (IUCN, 2004; ADB, 2011). Users should be consulted to determine
the level of fee they are willing to pay, sufficient user numbers must exist (ADB, 2011), and the fee should
be targeted at the correct tier of visitor, e.g. international vs. domestic tourists, as the former may have a
higher ability and willingness to pay. Many MPAs charge domestic residents reduced fees, or no fees at all,
including Belize (Hol Chan and Half Moon Caye), Ecuador (Galápagos), Egypt (Ras Mohammed), Kenya,
Netherlands Antilles (Saba), Philippines (Tubbataha and Gilutungan), Tanzania, Thailand, and the US
(Hanauma Bay).
117. Revenues that are retained at park level are more effective at generating funding sources. In many
cases, revenues collected at MPA sites are largely allocated to central agencies and do not return to the
MPA, creating a disincentive for generating new revenues and increasing instability (Emerton and
Tessema, 2001; IUCN, 2006b; Reid-Grant and Bhat, 2009). For example, Malindi Marine Park in Kenya
could potentially self-generate 20% of its operating costs, but revenue was returned to the Kenya Wildlife
Service (IUCN, 2004), and Kisite Marine National Park in Kenya earned revenues from tourism that are
more than seven times higher than its operating budget, but still suffered from a lack of sufficient finance
as all revenues were centrally retained (IUCN, 2006a). Sabah Parks’ four marine parks raised
47
Though the authors caution that this is atypical, and that hidden and unaccounted costs may have existed.

ENV/EPOC/WPBWE(2015)1/REV1
58
approximately 2.1 million ringgits in 2009 from entrance fees, 39% of total revenues and 35% of total
expenditure; however, only 20% was retained at park level, with the rest allocated to the Indonesian
government, partly as compensation for security services (PE Research, 2010).
118. Diving or research fees are generally set higher than regular entrance fees. Divers have paid as
much as EUR 120 per day in Mediterranean marine protected areas (IUCN, 2006b). Zanzibar’s Misali
Island Conservation Area charged staggered entry rates of USD 5 per day for internationals, 20 for large
boats, 200 for filming, and 50 per week for research (Lindhjem, 2003). Cousin Island Special Reserve in
the Seychelles also covered its 2002 operating costs of USD 209,520 through visitor revenue totalling
279,860, collected from daily fees of USD 25, 300, and 450 for foreign tourists, photographers, and film
crews, and USD 800 per quarter for research crews, respectively (WWF, 2005).
119. Some fee increases have caused divers to move to equivalent sites outside the MPA, resulting in
decreased funding to the management authority (IUCN, 2004), while others have caused visitor numbers to
increase, as divers seek well-managed areas (van Beukering et al., 2006) (Table 4.2)
Table 4.2. Examples of MPA user fees
Site Fee Notes Reduced visitation
State MPAs, Australia $2/day, max $6 Opposition by tourism industry due to lack of notification
Yes, at local use sites in Tasmania
Abrolhos & Fernando de Noronha, Brazil
$4.25/day Retained by env. agency; 50% to parks
No
Ras Mohammed, Egypt $5 (foreigners)
$1.20 (locals) No
Red Sea, Egypt $2/day (diving, snorkeling) Initial fee $5, lobbying reduced to $2
Yes, caused shift to nearby non-fee areas
Bunaken, Indonesia
$0.20/day (locals)
$5/day (foreigners)
$17/year (foreigners)
80% park, 10% each local/national govts
No
Koror State, Palau $15/fortnight (diving) Raises $1m/year, enough for all costs
Soufriere, St. Lucia $4/day, $12/year (diving)
$1/day (snorkeling) Support has increased No, numbers increased
Source: Adapted from van Beukering et al., 2006.
120. For MPAs in Chile, revenues from tourism are not sufficient to finance running costs and
enforcement. For example, Lafken Mapu Lahual, one of the largest multiple use MPAs in continental
Chile, could only achieve around 10% of running costs, in the most favorable conditions, under current
management scenarios (Gelcich et al. 2013).
121. Other types of user fees also exist. In Israel for example, a marine environmental protection fee is
levied on ships calling at Israeli ports and oil unloading platforms. This fee varies according to the size of
the ship and the amount of oil, with the revenues going to the Marine Pollution Prevention Fund (OECD,
2011).

ENV/EPOC/WPBWE(2015)1/REV1
59
122. Mooring buoy fees are another potential source of revenue (WWF, 2005). Reid-Grant and Bhat
(2009) suggest that the Montego Bay Marine Park in Jamaica could realise significant savings by passing
through the costs of deployment and maintenance of mooring buoys to hoteliers and other individuals that
use the buoys.
4.1.5 Taxes and fines
123. Taxes and fines are another means of raising finance for MPAs. Taxes have been defined as
compulsory unrequited payments to general government48
(OECD, 2009), though revenues from taxes can
also be earmarked. Belize for example charges all departing visitors a USD 3.75 fee and takes a 20%
commission on all cruise ship passenger fees, both of which are applied to the Protected Areas
Conservation Trust (PACT, 2010). Recreational operations such as cruise ships, tourism, and local
industries are logical initial targets. In 2001, Switzerland’s Hotelplan group established a 3 EUR fee for
patrons of their Mediterranean tourism packages to support cetacean and sea turtle conservation projects in
the region (IUCN, 2006b)., and the U.S. Dingell-Johnson Sport Fish Restoration Program charges excise
taxes on a variety of fishing equipment (10% on fishing supplies; 3% on electric outboard motors; and an
additional tax on small boat fuel) to fund sport fishery projects throughout the nation (TNC, 2012). Such
taxes can also be partially earmarked to MPAs if appropriate.
124. Where fishing is allowed in MPA boundaries, revenue generated from license fees can be used to
fund MPA management activities. In cases where licenses are not accompanied by entry limits, the fees
can be set higher to appropriately capture economic rents (ADB, 2011). Berau Marine Conservation Area
in Indonesia charges one-year fishing permits ranging from IDR 10,000 to IDR 109,500 for local boats,
and USD 54-247 for foreign boats, depending on tonnage and the type of boat; other taxes from the
fisheries sector amounted to IDR 112 million in 2006 (MSR, 2010). Some municipalities in the Philippines
earn considerable amounts from taxes applied to coastal resources such as fish that are exported from the
area (ADB, 2011).
125. In response to declining salmon stocks, Iceland implemented levies on both rod and commercial
salmon fishing licenses in 2006. Revenue ($16.6 million in 2008) is invested in wild salmon management
programmes for stock and habitat improvement (WWF, 2009). In Alaska, salmon fishermen in some areas
have voted to institute a 2 or 3% tax on themselves through the state budget to fund stock enhancement
programmes. Proceeds are returned to regional aquaculture associations, incorporated as private non-
profits, which operate hatcheries for stock supplementation (Knapp, Roheim, and Anderson, 2007). Where
MPAs are expected to create spillover effects or to improve the health of fish stocks, this approach could
be replicated, with tax revenues being directed to MPA management.
126. A tax credit system can also be developed, in which private entities’ payments towards
conservation can be claimed against their tax payments (ADB, 2011).
127. MPAs with nearby boat traffic may also generate revenue by collecting fines from ships violating
restrictions by e.g. running aground on reefs (MSR, 2012) or fishing illegally. Apo Reef Natural Park in
the Philippines collects fines from apprehended fishing vessels, which are deposited into the Integrated
Protected Areas Fund, though their contributions to MPA management costs have not been quantified.
48
They are unrequited in the sense that benefits provided by the government to taxpayers are not normally in
proportion to payments.
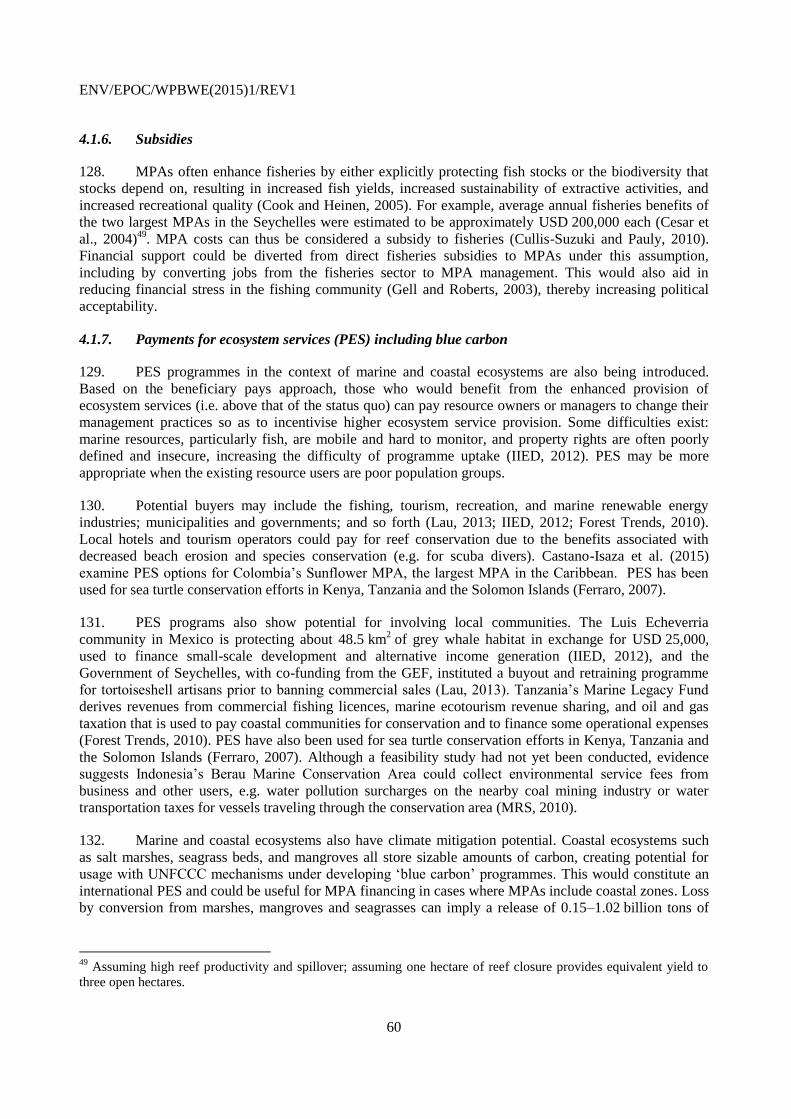
ENV/EPOC/WPBWE(2015)1/REV1
60
4.1.6. Subsidies
128. MPAs often enhance fisheries by either explicitly protecting fish stocks or the biodiversity that
stocks depend on, resulting in increased fish yields, increased sustainability of extractive activities, and
increased recreational quality (Cook and Heinen, 2005). For example, average annual fisheries benefits of
the two largest MPAs in the Seychelles were estimated to be approximately USD 200,000 each (Cesar et
al., 2004)49
. MPA costs can thus be considered a subsidy to fisheries (Cullis-Suzuki and Pauly, 2010).
Financial support could be diverted from direct fisheries subsidies to MPAs under this assumption,
including by converting jobs from the fisheries sector to MPA management. This would also aid in
reducing financial stress in the fishing community (Gell and Roberts, 2003), thereby increasing political
acceptability.
4.1.7. Payments for ecosystem services (PES) including blue carbon
129. PES programmes in the context of marine and coastal ecosystems are also being introduced.
Based on the beneficiary pays approach, those who would benefit from the enhanced provision of
ecosystem services (i.e. above that of the status quo) can pay resource owners or managers to change their
management practices so as to incentivise higher ecosystem service provision. Some difficulties exist:
marine resources, particularly fish, are mobile and hard to monitor, and property rights are often poorly
defined and insecure, increasing the difficulty of programme uptake (IIED, 2012). PES may be more
appropriate when the existing resource users are poor population groups.
130. Potential buyers may include the fishing, tourism, recreation, and marine renewable energy
industries; municipalities and governments; and so forth (Lau, 2013; IIED, 2012; Forest Trends, 2010).
Local hotels and tourism operators could pay for reef conservation due to the benefits associated with
decreased beach erosion and species conservation (e.g. for scuba divers). Castano-Isaza et al. (2015)
examine PES options for Colombia’s Sunflower MPA, the largest MPA in the Caribbean. PES has been
used for sea turtle conservation efforts in Kenya, Tanzania and the Solomon Islands (Ferraro, 2007).
131. PES programs also show potential for involving local communities. The Luis Echeverria
community in Mexico is protecting about 48.5 km2 of grey whale habitat in exchange for USD 25,000,
used to finance small-scale development and alternative income generation (IIED, 2012), and the
Government of Seychelles, with co-funding from the GEF, instituted a buyout and retraining programme
for tortoiseshell artisans prior to banning commercial sales (Lau, 2013). Tanzania’s Marine Legacy Fund
derives revenues from commercial fishing licences, marine ecotourism revenue sharing, and oil and gas
taxation that is used to pay coastal communities for conservation and to finance some operational expenses
(Forest Trends, 2010). PES have also been used for sea turtle conservation efforts in Kenya, Tanzania and
the Solomon Islands (Ferraro, 2007). Although a feasibility study had not yet been conducted, evidence
suggests Indonesia’s Berau Marine Conservation Area could collect environmental service fees from
business and other users, e.g. water pollution surcharges on the nearby coal mining industry or water
transportation taxes for vessels traveling through the conservation area (MRS, 2010).
132. Marine and coastal ecosystems also have climate mitigation potential. Coastal ecosystems such
as salt marshes, seagrass beds, and mangroves all store sizable amounts of carbon, creating potential for
usage with UNFCCC mechanisms under developing ‘blue carbon’ programmes. This would constitute an
international PES and could be useful for MPA financing in cases where MPAs include coastal zones. Loss
by conversion from marshes, mangroves and seagrasses can imply a release of 0.15–1.02 billion tons of
49
Assuming high reef productivity and spillover; assuming one hectare of reef closure provides equivalent yield to
three open hectares.

ENV/EPOC/WPBWE(2015)1/REV1
61
carbon dioxide50
. Mangroves and seagrasses support fish habitats and increase fish production, stabilise
shorelines, filter land-based pollution, and influence and shelter the fish populations of nearby reefs, and
reefs in turn act as wave and current breakers and erosion protectors for coastal ecosystems. In Kenya, for
example, the Mikoko Pamoja community-based mangrove conservation project has been certified for entry
into the voluntary carbon market, and it is expected that one-third of funds generated – about USD 4,000 –
will be used for mangrove conservation (AGEDI, 2014).
133. Studies are also beginning to investigate the carbon sequestration capacity of marine species
(Lutz and Martin, 2014). Grazers such as otters, dugongs, and sea turtles and their predators maintain and
increase the health and carbon storage capacity of seagrass and kelp beds; marine vertebrates, especially
large marine vertebrates, stimulate phytoplankton production, fish productivity, and carbon uptake; and
food chain processes transport carbon away from the surface of the ocean. The carbon service value of sea
otter influence on kelp beds has been estimated at USD 205-408 million (one-time payment), or USD 16–
33 million (one-time payment invested at 8% return) (Wilmers et al., 2012), while that of marine life in the
high seas has been estimated at USD 148 billion (Lutz and Martin, 2014; Rogers et al., 2014).
4.1.8. Marine bioprospecting
134. The biological diversity of reefs and of marine environments may provide opportunities for
collecting marine bioprospecting fees, especially under the CBD’s Nagoya Protocol on Access to Genetic
Resources. In 1992, the U.S. National Cancer Institute paid the Coral Reef Foundation $2.9 million for reef
samples to be used in cancer research (Spurgeon and Aylward, 1992). Costa Rica’s National Biodiversity
Institute (INBio) is permitted to undertake bioprospecting in protected areas in collaboration with academia
and private enterprise, with the stipulation that 10% of research budgets and 50% of any future royalties be
donated to the ministry for conservation. In 2006, INBio entered into an agreement to be paid $6,000 per
year by a biotech company for two natural resource-based materials, one of which was a protein derived
from a marine organism (WWF, 2009). Similarly, a $30,000 agreement between a pharmaceutical
company and Fiji’s Verata District helped to sustain marine conservation work in the area (WWF, 2005).
4.1.9. Marine biodiversity offsets
135. Coastal development, such as urban expansion, port development to support exporting industries,
and the development of seabed mining, can adversely impact biodiversity and habitats. Biodiversity offsets
in the marine context could be explored in such cases. Based on the polluter pays approach, any excess
damage caused after the application of the mitigation hierarchy would need to be compensated by
restoration elsewhere. Such restoration efforts could be targeted to areas where new MPAs need to be
developed. An example of an offset programme applied in the coastal context can be found in the
Australian province of Queensland that instituted a fish habitat offsetting policy in 2002 (Queensland
Government, 2002)51
. Other examples exist often involving coastal habitats such as eelgrass and inter-tidal
reefs (Dickie et al., 2013).
136. Dickie et al. (2013) and Dickie (2014) suggest further applications, for example allowing marine
development such as a pipeline or cable to be placed in a sensitive area to avoid an expensive re-routing,
and compensating any residual damage by recreating habitat several times greater than that damaged for a
much lower cost. Marine renewable energy installations, such as for tidal and wave generation, may also
be appropriate candidates for offsets, especially as attention to the ocean’s potential for renewable energy
generation continues to increase. Similarly, offsets could be applied to oil and gas drilling and exploration,
50
Lavery PS, Mateo M-Á, Serrano O, Rozaimi M. Variability in the Carbon Storage of Seagrass Habitats and Its
Implications for Global Estimates of Blue Carbon Ecosystem Service. PLOS ONE2013;8(9):
51 Absorbed into the Queensland Environmental Offsets Policy of 2014.

ENV/EPOC/WPBWE(2015)1/REV1
62
or to deep seabed mining, and sections of coral reefs expected to be damaged by development could be
removed, stored, and then transplanted to protected areas, or funding could be directly allocated to reef
restoration. Combining several offsets could create a substantial contribution to a new, or existing, MPA.
137. Belize has recently produced a framework for marine and coastal offsets (Belize Coastal Zone
Management Authority & Institute and Australia-Caribbean Coral Reef Collaboration 2014).
4.1.10. Private sector partnerships
138. Partnerships with the private sector may take several forms, ranging from direct corporate social
responsibility-based investments to collaborations between private entities and NGOs or protected rea
management bodies, although it should be noted that the private sector may not always offer long-term
funding (Erdmann et al., 2003).
139. In the Philippines, a corporation partnered with an NGO to fund parts of a management
programme for the Verde Island Passage MPA network (ADB, 2011), while in Indonesia, Misool Eco
Resort established and maintains a 1,220 km2 MPA, including two separate no-take areas totaling 828 km
2,
through tourism revenue, institutional donors, and partnerships with local communities and other industries
(Misool Baseftin, n.d.; Forest Trends, 2010).
140. MPAs can also earn revenues by charging concession fees for the sole right to operate inside their
boundaries, thereby delegating some aspects of management to the private sector or NGOs. Alternatively,
private sector entities with an economic interest in preserving the MPA – e.g. tour operators depending on
MPA quality – may consider cost-sharing arrangements with the publicly funded MPA management body.
These approaches can aid in day-to-day operations by providing patrol and monitoring assistance,
maintenance, or other day-to-day duties that can be completed at lower cost by tour operators, in return for
service improvements or concessions from the management body (Emerton and Tessema, 2001).
141. To ensure transparency and long-term security, public-private partnerships may formalise their
legal and financial agreements, such as was done in California for the Marine Life Protection Initiative
through a binding agreement and a jointly managed endowment fund (Living Oceans Society, 2012).
Private operators have also become involved in the management of the Great Barrier Reef MPA through a
variety of mechanisms: resorts provide rangers, commercial fishers pay mooring fees, dive operators
monitor illegal fishing, and so forth (CFA, 2003). The Great Barrier Reef Marine Park Authority
administers the Eye on the Reef monitoring and stewardship program in collaboration with scientists,
tourism operators, park rangers, and other users (Great Barrier Reef Marine Park Authority, 2014), and
tourism operators are building their capacity to undertake starfish management through diver training, in
conjunction with the Australian Government’s Reef Trust programme (Government of Australia, 2014).
Similarly, protection for the Jardines de la Reina national park in Cuba was supported by a public-private
venture between the Government of Cuba and a private company operating a catch-and-release fishing
camp, whose best interest was to ensure the area remained pristine (Morris, 2002).
142. Several similar agreements exist in the Sulu-Sulawesi Seas Marine Ecoregion. The Gilutongan
Marine Sanctuary in the Philippines entered into an agreement with a private firm in 2007 to market and
manage the sanctuary’s 20-meter buffer zone, in which the local municipality was entitled to receive a total
of 18 million Philippine pesos over three years. The agreement was renewed in 2011, and was still in place
as of 2012 (MSR, 2012). In Malaysia, the Sabah Wildlife Department has outsourced the management of
an MPA to a private company, in which the firm pays the state 60,000 ringgits per year and is required to
invest in conservation and protection, in exchange for tourism rights (PE Research, 2010). Lastly, in
Indonesia, the North Sulawesi Watersports Association (NSWA) provides in-kind support to the Bunaken
Marine National Park. Dive operators have sponsored a range of programmes aiding park management,

ENV/EPOC/WPBWE(2015)1/REV1
63
including education scholarships for locals, handicraft sales that create extra sources of income, and
conservation education activities. Operators also regularly participate in beach and reef cleanups, fish
monitoring, enforcement activities, and other management operations, resulting in significant savings for
the management authority (Erdmann et al., 2003).
143. In some cases, the private sector may be able to drive the creation of new MPAs (Box 4.1).
Box 4.1 Chumbe Island Coral Park
Chumbe Island Coral Park, comprised of a 22 hectare coral island and part of a fringing reef, was gazetted by the Government of Zanzibar in 1994 as a protected area following an investment proposal by a private entity, Chumbe Island Coral Park Ltd. (CHICOP), which was allocated management rights. Establishment costs were initially estimated at USD 200,000, with payback expected to begin after three years at an internal rate of return of 27%, but a three-year delay and unexpected administrative difficulties caused cost overruns which resulted in a final establishment outlay of USD 1.2 million, in addition to a significant amount of volunteer work. Approximately 36% of this outlay was funded by various donors, with the rest funded privately by the project initiator. CHICOP developed eco-tourism facilities which as of 2006 were sufficient to cover recurrent management costs – but not capital payback – at an occupancy rate of 30-40%.
CHICOP has pursued unconventional approaches for operational and business development goals. Local fishers were retrained as park rangers, and in addition to patrolling the island, have rescued over 160 vessels with between 2-16 fishermen since 1994, likely saving several lives. As private employees, rangers are unarmed, and ‘enforce by informing’ local fishers on the value of the protected area. Spillover catches have indeed been reported, enhancing local support for the park. Today, Chumbe Island is one of the most biodiverse reefs in the region.
With respect to business development, as a small company, traditional marketing costs to leverage the tourism market would have been prohibitive. Instead, CHICOP applied for and won several international environmental awards, providing marketing exposure equivalent to USD 10 million.
CHICOP’s example provides insight into some enabling conditions that aid in effectively engaging the private sector, including the existence of an attractive investment climate and little competition from large, donor-funded projects. Furthermore, tourism, fishing, and other uses often coexist in the same area, resulting in a need to negotiate, and CHICOP’s small, local nature may have afforded them an advantage over a central authority in this regard, due to co-dependencies between it and the local communities.
Sources: IUCN, 2006a; Lindhjem, 2003; Riedmiller, 2003.
144. Engaging industries such as oil and gas, or others aiming to meet corporate social responsibility
requirements is another option for sourcing funding for MPAs (MSR, 2012; PE Research, 2010). For
example, in 2008 the Malaysian infrastructure conglomerate YTL Corporation Berhad donated more than
MYR 700,000 raised from a climate change fundraising event to Reef Check Malaysia, a reef monitoring
non-profit. In 2010, it launched a fellowship of $2 million to be donated from 2010 to 2014 for
community-based conservation programmes in Asia. In its first year, it identified 22 outreach campaigns in
the Coral Triangle to be conducted by YTL fellows (YTL Community, 2010).
4.2 Developing a Finance Strategy for MPAs52
145. Given the severe finance shortage across many MPAs, greater efforts are needed to secure the
resources that are required to ensure effective MPA management. Developing an MPA Financing Strategy
52
This section will be substantially revised in the next draft.

ENV/EPOC/WPBWE(2015)1/REV1
64
can help to identify needs and structure the required steps to do this. At a minimum, an MPA Finance
Strategy should be composed of:
1. an assessment of financing needs (see Chapter 2);
2. identification of stakeholders, including the polluters and the beneficiaries (and at what scale –
local/regional/global);
3. assessment of different finance sources available for MPAs (see section 4.1), and which offer the
greatest potential and long-term source of revenue, given the socio-economic and other
characteristics in the area.
146. According to the French National Strategy for the Creation and Management of Marine Protected
Areas, the estimated annual costs for an MPA network covering 20% of French waters will amount to
around €170 million by 2020 (Table 4. 3). Based on current financing principles for MPAs in France, the
majority of this will be financed by the Government (around €110 million). Other funding sources will be
considered for the remaining amount, including taxation of activities that affect the sea or coast, and
earmarking of charges levied for the occupation of the public domain.
Table 4.3 Estimated cost of the MPA network in French waters
Estimated annual cost for the marine area network (20% by 2020)
Surveillance (monitoring and control) 70.3
Studies, expert assessment 37.6
Interventions 36.3
Awareness raising 25.8
Total 170
Source: Source:http://www.developpement-durable.gouv.fr/IMG/pdf/13148-1_Strategie-nationale-aires-marines-protegees_GB-2.pdf.
147. The identification of the polluters (i.e. those causing adverse impacts to the existing or proposed
MPA) can help to determine whether mechanisms are in place to internalise the externalities and whether
there is additional scope for additional taxes and fines to help address these. Part of the revenues obtained
from such instruments could be earmarked for MPA management. The beneficiaries of MPAs can include
a larger numbers of stakeholders including up to the global level. Examples include international tourism
benefits from biodiversity conservation, habitat for endangered and migratory species, replenishing fish
stock for commercial fisheries, carbon sequestration and mitigation of natural disasters and impacts related
to climate change. User fees and international payments for ecosystem services can be considered as
additional means to mobilise finance for MPAs.
148. Despite the finance challenge for MPAs, few examples exist of MPA finance strategies. A few
exceptions include a financing scoping exercise in the Sulu-Sulawesi Seas Marine Ecoregion - Indonesia
(Starling Resources, 2010) and a Finance Strategy and Plan in Belize (see Box 4.2).

ENV/EPOC/WPBWE(2015)1/REV1
65
Box 4.2 Sustainable Finance Strategy and Plan for the Belize Protected Area System
A study was undertaken in 2011 for the Government of Belize to help develop a finance strategy for the national protected area system. This consisted of the following components:
Financial Analysis – needs and gaps
Review of existing financial mechanisms (e.g. PACT, government budget, development aid, debt for nature swaps)
Market analysis of revenue generating options
Enabling conditions (e.g. legal, institutional, barriers)
Prefeasibility of revenue generating options
Scenario analysis (projections for revenue and expenditures)
Financial plan/strategy (including recommendations and timeline)
Source: Drumm et al (2011).
149. Spergel and Moye (2004) have developed a list of feasibility criteria for the finance mechanisms
as indicated below:
Financial
How much money will actually be needed each year to support the particular marine conservation programs and activities that are envisaged?
How much revenue is likely to be generated each year by the new financing mechanisms?
Will the revenues generated be worth the cost of setting up the new system of user fees, taxes, debt-for-nature swaps, or trust funds?
Could the revenues vary substantially from year to year depending on global and national economic, political, and natural conditions?
How will a highly variable revenue flow affect the conservation programs that the financial mechanism is intended to pay for?
What other sources of funds might be available, either on a long-term or a one-time basis?
Legal
Can the proposed financing mechanisms be established under the country’s current legal system? Some legal systems do not recognize concepts such as easements or development rights. In other legal systems, there may be a constitutional prohibition against earmarking tax revenues or fees for specific purposes.
Will new legislation be required in order to establish the proposed financing mechanism?
How difficult and time-consuming will it be to pass such legislation?
Could the new financing mechanism be established under current legislation, by simply issuing an administrative or executive order?

ENV/EPOC/WPBWE(2015)1/REV1
66
Administrative
In the particular country, how difficult will it be to administer, enforce, collect, or implement a particular type of user fee, tax, or quota and trading system?
Will it be too complicated or costly to administer?
Are there enough trained people (or how difficult will it be to train enough people) to administer and enforce the system?
Will implementing the particular user fee, tax, or quota depend too much on the discretion of individual officials and therefore present too many opportunities for corruption?
Can safeguards be devised to limit potential problems?
How difficult will it be to collect, verify and maintain the data upon which a particular user fee, tax or trading system is based? For example, how difficult will it be to keep track of the amount of fish that are caught each day or each month by particular individuals, communities, or commercial fishing vessels; or the number of people who visit an MPA, or who use particular products or ecological services provided by the MPA?
Social
What will be the social impacts of implementing a particular system of generating revenues for conservation?
Who will pay, and what is their willingness and capacity to pay?
Will the new financing mechanism be perceived as equitable and legitimate?
Political
Is there government support for introducing the new financing mechanism?
Can the government be relied upon to spend the new revenues only for the purposes intended, or is there a strong likelihood that the money may end up being used for other purposes?
Can this be monitored and ensured by the courts or the media or NGO “watch-dog” groups or particular user groups or an independent board of directors or an international agency?
Environmental
What will be the environmental impact of implementing the new financing mechanism? For example, for tourism-based mechanisms, will the desire to increase revenues from tourism compromise conservation objectives or exceed the carrying capacity of the MPA?
150. IUCN-WCPA (2008) suggest several main components of sustainable financing strategies:
sharing responsibilities with stakeholders to build support and ownership; building diverse funding
portfolios; improving financial administration; comprehensively addressing all costs and benefits;
instituting transparent governance; creating an enabling framework by overcoming market, price, and
policy distortions; and building capacity to use financial tools and mechanisms.

ENV/EPOC/WPBWE(2015)1/REV1
67
Table 4.4. Financing marine conservation and sustainable use
FINANCING MECHANISM (source of revenue)
Government Revenue Allocations
Direct Allocations from Government Budgets (Government budget revenues)
Government Bonds and Taxes Earmarked for Conservation (Investors, Tax payers)
Lottery Revenues (Gamblers)
Premium-Priced Motor Vehicle License Plates (Vehicle owners)
Wildlife Stamps (Postal Customers, Hunters, Fishers)
Debt Relief (Donors, Government, NGOs)
Grants and Donations
Bilateral and Multilateral Donors (Donor agencies)
Foundations (Individuals, Corporations)
Nongovernmental organizations NGOs (NGO members and supporters)
Private Sector (Investors)
Conservation Trust Funds (Multi-source)
Tourism Revenues
Protected Area Entry Fees (Visitors to parks)
Diving and Yachting Fees (Divers, Boaters)
Tourism-Related Operations of Protected Area (Agencies Tourism operators, Tourists)
Airport Passenger Fees and Cruise Ship Fees, Taxes and Fines (Tourists, Cruise lines)
Hotel Taxes (Hotel clients)
Voluntary Contributions by Tourists and Tourism Operators (Tourism operators, Tourists)
Real Estate and Development Rights
Purchases or Donations of Land and/or Underwater Property (Property owners, Donors)
Conservation Easements (Property owners, Donors)
Real Estate Tax Surcharges for Conservation (Property owners, Donors)
Tradable Development Rights and Wetland Banking (Property developers)
Conservation Concessions (Conservation investors)
Fishing Industry Revenues
Tradable Fishing Quotas (Commercial fishers)
Fish Catch and Services Levies (Commercial fishers)
Eco-Labeling and Product Certification (Seafood producers, Wholesalers, retailers and end-use purchasers
of ornamental tropical fish and corals)
Fishing Access Payments (Governments, Associations of and/or Individual fishers)
Recreational Fishing License Fees and Excise Taxes (Recreational fishers)
Fines for Illegal Fishing (Fishers)
Energy and Mining Revenues
Oil Spill Fines and Funds (Energy companies, Donors)
Royalties and Fees from Offshore Mining and Oil and Gas (Energy and mining companies)
Right-of-Way Fees for Oil and Gas Pipelines and Telecommunications Infrastructure
(Private companies)
Hydroelectric Power Revenues (Power producers)
Voluntary contributions by Energy Companies (Energy companies)
For-Profit Investments Linked to Marine Conservation
Private Sector Investments Promoting Biodiversity Conservation (Private investors)
Biodiversity Prospecting (Pharmaceutical companies)
Source: Spergel and Moye (2004).

ENV/EPOC/WPBWE(2015)1/REV1
68
References
ADB (2011), Comprehensive Action Plans of the Sulu-Sulawesi Marine Ecoregion, Asian Development
Bank.
AGEDI (2014), Building Blue Carbon Projects – An Introductory Guide, Abu Dhabi Global
Environmental Data Initiative, GRID-Arendal, Norway.
Balmford, A. et al. (2004). The worldwide costs of marine protected areas, PNAS, 101/26, pp. 9694-9697.
Ban, N., and C. Klein (2009), “Spatial socioeconomic data as a cost in systematic marine conservation
planning”, Conservation Letters, Vol. 2, pp. 206-215.
Ban, N. et al. (2011), “Promise and problems for estimating management costs of marine protected areas”,
Conservation Letters, Vol. 4, pp. 241-252.
Beck, M. et al. (2004), “New tools for marine conservation: the leasing and ownership of submerged
lands”, Conservation Biology, Vol. 18/5, pp. 1214-1223.
Belize Coastal Zone Management Authority & Institute and Australia-Caribbean Coral Reef Collaboration
2014, Marine and coastal biodiversity offsets framework for Belize, GBRMPA, Townsville.
Brady, M., and W. Staffan (2009), “Fixing problems in fisheries – integrating ITQs, CBM and MPAs in
management”, Marine Policy, Vol. 33, pp. 258-263.
Butardo-Taribio, M., P. Alino, and E. Guiang (2009), Cost-Benefit Study of Marine Protected Areas,
USAID.
Castano-Isaza et al. (2015). Valuing beaches to develop payment for ecosystem services schemes in
Colombia’s Seaflower marine protected area. Ecosystem Services.
CCIF (n.d.), Financing a Network of Marine Protected Areas in Southeast Asia.
Cesar, H. et al. (2004), Evaluation of the Socio-Economic Impacts of Marine Ecosystem Degradation in
the Seychelles.
CFA (2003), Conservation Finance Guide, Conservation Finance Alliance.
CFA (2008), Rapid Review of Conservation Trust Funds, Conservation Finance Alliance.
Cook, G., and J. Heinen (2005), “On the uncertain costs and tenuous benefits of marine reserves: a case
study of the Tortugas Ecological Reserve, South Florida, USA”, Natural Areas Journal, Vol. 25/4,
pp. 390-396.
Cullis-Suzuki, S., and D. Pauly (2010), “Marine protected area costs as “beneficial” fisheries subsidies: a
global evaluation”, Coastal Management, Vol. 38, pp. 113-121.
Day, J., D. Laffoley, and K. Zicshka (2015), “Marine protected area management”, in Worboys et al.
(eds.), Protected Area Governance and Management, Chapter 20, ANU Press, Canberra.
De Groot, R. et al. (2002), “Global estimates of the value of ecosystems and their services in monetary
units”, Ecosystem Services, Vol. 1, pp. 50-61.

ENV/EPOC/WPBWE(2015)1/REV1
69
Dickie, I. et al. (2013), Marine Biodiversity Offsetting – UK Scoping Study, Report to The Crown Estate.
Dickie, I., (2014), Developments in the use of economics for coastal and marine programmes and
schemes”, Economics for the Environment Consultancy, London.
Drumm et al. (2011). Sustainable Finance Strategy and Plan for the Belize Protected Area System.
Emerton, S., and Y. Tessema (2001), “Marine protected areas: the case of Kisite Marine National Park and
Mpunguti Marine National Reserve, Kenya”, IUCN Eastern Africa Regional Programme.
Emerton, S. (2003), “Covering the economic costs of Marine Protected Areas: extending the concept of
financial diversity and sustainability”, Workshop on Building a Diverse Portfolio to Sustainably
Finance Marine Protected Area (MPA) Networks, 5th World Parks Congress, Durban, South Africa.
Erdmann, M. et al. (2003), Developing a diversified portfolio of sustainable financing options for Bunaken
Marine National Park”, Proceedings of the Vth World Parks Congress, Sustainable Finance Stream,
Durban, South Africa.
Ferraro, P. (2007), A Global Survey of Sea Turtle Payment Incentive Programs. A Report to the Southwest
Fisheries Science Center, National Marine Fisheries Service.
Forest Trends (2010), Payments for Ecosystem Services: Getting Started in Marine and Coastal
Ecosystems: A Primer, Forest Trends.
GEF (2014). The GEF-6 Biodiversity Strategy.
Gelcich, S. et al. (2012). “Territorial user rights for fisheries as ancillary instruments for marine coastal
conservation in Chile”, Conservation Biology, Vol. 26/6, pp. 1005-1015.
Gelcich, S. et al. (2013). “Financing marine protected areas through visitor fees: insights from tourists’
willingness to pay in Chile”, AMBIO, Vol. 42, pp. 975-984.
Gell, F. and Roberts, C. (2003). The Fishery Effects of Marine Reserves and Fishery Closures, World
Wildlife Fund.
Gleason, M. et al (2014). “Designing a network of marine protected areas in California: achievements,
costs, lessons learned, and challenges ahead”, Ocean & Coastal Management, Vol. 74, pp. 90-101.
Gonzalez-Montagut, R. (2003), “Developing a diversified portfolio to finance marine protected areas in
Mexico”, Proceedings of the Vth World Parks Congress, Sustainable Finance Stream, Durban, South
Africa.
Govan, H. et al. (2009), Status and Potential of Locally-Managed Marine Areas in the South Pacific,
SPREP/WWF/WorldFish-Reefbase/CRISP.
Government of Australia (2015), Reef 2050 Long-Term Sustainability Plan, Commonwealth of Australia.
Government of Australia (2014), Reef Trust Investment Strategy Initiative Design and Phase 1 Investment
2014-15, Commonwealth of Australia.
Government of Scotland (2013), The Scottish Marine Protected Area Projects, Final Report.

ENV/EPOC/WPBWE(2015)1/REV1
70
Gravestock, P., C. Roberts, and A. Bailey (2008), “The income requirements of marine protected areas”,
Ocean & Coastal Management, Vol. 51/3, pp. 272-283.
Great Barrier Reef Marine Park Authority (2014), Annual Report 2013-14, Australian Government.
Hunt, C. (2013), “Benefits and opportunity costs of Australia’s Coral Sea marine protected area: a
precautionary tale”, Marine Policy, Vol. 39, pp. 352-360.
IIED (2012), Payments for Coastal and Marine Ecosystem Services: Prospects and Principles, International
Institute for Environment and Development.
IUCN (2004), Managing Marine Protected Areas: A Toolkit for the Western Indian Ocean, IUCN Eastern
African Regional Programme.
IUCN (2006a), Sustainable Financing of Protected Areas: A Global Review of Challenges and Options.
IUCN (2006b), Sustainable Financing Sources for Protected Areas in the Mediterranean.
IUCN-WCPA (2008), Establishing Marine Protected Area Networks – Making it Happen, IUCN World
Commission on Protected Areas.
Knapp, G., C. Roheim, and J. Anderson (2007), The Great Salmon Run: Competition Between Wild and
Farmed Salmon, TRAFFIC North America, World Wildlife Fund.
Laffoley, D., and G. Grimsditch (2009), The Management of Natural Coastal Carbon Sinks, IUCN.
Lau, W. (2013), “Beyond carbon: conceptualizing payments for ecosystem services in blue forests on
carbon and other marine and coastal ecosystem services”, Ocean and Coastal Management, 83, pp.
5-14.
Leathwick, J. et al. (2008), “Novel methods for the design and evaluation of marine protected areas in
offshore waters”, Conservation Letters, Vol. 1, pp. 91-102.
Leisher, C. et al. (2012), “Measuring the benefits and costs of community education and outreach in
marine protected areas”, Marine Policy, Vol. 36, pp. 1005-1011.
Lindhjem, H. (2003), Sustainable Financing of Marine Protected Areas in Zanzibar, World Bank.
Living Oceans Society (2012), Sustainable Financing Options for a Marine Protected Area Network in
British Columbia.
Lutz, S., and A. Martin (2014), Fish Carbon: Exploring Marine Vertebrate Carbon Services, GRID-
Arendal, Norway.
Marine Conservation Institute (2015), MPAtlas, Seattle, WA. Accessed on June 23, 2015 from
http://www.mpatlas.org.
McCrea-Strub, A. et al. (2011), “Understanding the cost of establishing marine protected areas”, Marine
Policy, 35 (1): 1-9.
McClanahan, T. (1999), “Is there a future for coral reef parks in poor tropical countries?”, Coral Reefs, 18,
pp. 321-325.

ENV/EPOC/WPBWE(2015)1/REV1
71
Misool Baseftin (n.d.), Misool Baseftin, Misool Eco Resort’s Marine Conservation Initiative.
Morris, B. (2002), Transforming Coral Reef Conservation in the 21st Century.
MSR (2010). An Initial Sustainable Financing Scoping Exercise for MPAs in the Sulu-Sulawesi Seas
Marine Ecoregion – Indonesia, Mazars Starling Resources, Indonesia.
MSR (2012). An Initial Scoping Exercise for Sustainable Financing of MPAs in the Sulu-Sulawesi Seas
Marine Eco-Region, Version 2 – Draft. Mazars Starling Resources, Indonesia.
Ngedebuul Conservation and Resource Planning Team (2012). The People of Kayangel and the Kayangel
Protected Areas Network Five Year Management Plan.
OAGC (2012), “Chapter 3: Marine protected areas”, in Report of the Commissioner of the Environment
and Sustainable Development, Office of the Auditor General of Canada.
OECD (2011). Environmental Performance Review of Israel, OECD Publishing, Paris.
Papahanaumokukea Marine National Monument (2008), Management Plan.
PE Research (2010), Feasibility Assessment of Marine Protected Areas Sustainable Financing Mechanisms
for the Multi-national Seascape of the Sulu Sulawesi Seas Marine Ecoregion (SSME), Final Report,
Planning and Economic Consultants.
Queensland Government (2002), Marine Fish Habitat Offset Policy.
PACT (2010), About Pact. Accessed on July 5, 2015, from http://www.pactbelize.org/AboutPACT.aspx.
Reid-Grant, K., and M. Bhat (2009), “Financing marine protected areas in Jamaica: an exploratory study”,
Marine Policy, 33, pp. 128-136.
Riedmiller, S. (2003), “Private sector investment in marine protected areas – experience of the Chumbe
Island Coral Park in Zanzibar/Tanzania”, Proceedings of the Vth World Parks Congress, Sustainable
Finance Stream, Durban, South Africa.
Rogers, A. et al. (2014), The High Seas and Us: Understanding the Value of High-Seas Ecosystems,
Global Ocean Commission.
Sanchirico, N., K. Cochran, and P. Emerson (2002), Marine Protected Areas: Economic and Social
Implications, Resources for the Future.
Schirmer, J., A. Casey, and N. Mazur (2004), Socio-economic impact of the proposed Cod Grounds
Marine Protected Area, Department of the Environment and Heritage, Commonwealth of Australia.
Starling Resources (2010). An initial sustainable financing scoping exercise for MPAs in the Sulu-
Sulawesi Seas Marine Ecoregion – Indonesia.
Smith, M. et al. (2010), Political economy of marine reserves: understanding the opportunity costs, PNAS,
Vol. 107/43.
Spurgeon, J., and B. Aylward (1992), “The economic value of ecosystems: 4 – Coral reefs”, Gatekeeper
Series, No. LEEC GK 92-03, IIED.

ENV/EPOC/WPBWE(2015)1/REV1
72
TNC (2001), Funding Protected Areas in the Wider Caribbean, The Nature Conservancy.
TNC (2012), Monies for Marine Conservation, The Nature Conservancy.
TNC (2015), Debt Swap to Finance Marine Conservation in the Seychelles, The Nature Conservancy,
Arlington, VA. Accessed on April 14, 2015 from
http://www.nature.org/newsfeatures/pressreleases/debt-swap-to-finance-marine-conservation-in-the-
seychelles.xml
UNEP-WCMC (2008), National and Regional Networks of Marine Protected Areas: A Review of
Progress, UNEP-WCMC, Cambridge.
Van Beukering, P. et al. (2006), The Economic Value of the Coral Reefs of Saipan, Commonwealth of the
Northern Mariana Islands.
Wilmers, C. et al. (2012), “Do trophic cascades affect the storage and flux of atmospheric carbon? An
analysis of sea otters and kelp forests”, Frontiers in Ecology and the Environment, Vol. 10, pp. 409-
415.
Wood, L. (2007), MPA Global: A database of the world's marine protected areas, Sea Around Us Project,
UNEP-WCMC & WWF. Accessed on June 23, 2015 from http://www.mpaglobal.org.
World Bank (2006), Scaling Up Marine Management: The Role of Marine Protected Areas.
WWF (2005), Marine Protected Areas: Benefits and Costs for Islands, World Wildlife Fund.
WWF (2009), Guide to Conservation Finance, World Wildlife Fund.
YTL Community (2010), YTL Corp Contributes US$2 million to “YTL Fellowship for a Rare Planet”.
Accessed on July 5, 2015 from
http://www.ytlcommunity.com/beta/juli/commnews/shownews.asp?newsid=54045&category=top