Enhancing the Signal of Lateral Flow Immunoassays by Using ...
13
Sensors and Materials, Vol. 27, No. 7 (2015) 549–561 MYU Tokyo S & M 1090 * Corresponding author: e-mail: [email protected], [email protected] 549 ISSN 0914-4935 © MYU K.K. Enhancing the Signal of Lateral Flow Immunoassays by Using Different Developing Methods Jia Li 1 , David McMillan 2 and Joanne Macdonald 1,3,* 1 Inflammation and Healing Research Cluster, Genecology Research Centre, School of Science and Engineering, University of the Sunshine Coast, Queensland 4558, Australia 2 Inflammation and Healing Research Cluster, School of Sports and Health Science, University of the Sunshine Coast, Queensland 4558, Australia 3 Division of Experimental Therapeutics, Columbia University, New York, NY, USA (Received February 5, 2015; accepted June 18, 2015) Key words: nucleic acid lateral flow, sandwich immunoassay, gold nanoparticles Lateral flow immunoassay devices are potential biosensors for point-of-care diagnostics. However, these devices are limited by low analytical sensitivity when coupled with a visual colorimetric signal. Here, we analyzed key parameters related to nucleic acid lateral flow performance and related this to the analytical theory behind lateral flow functionality. In particular, we predicted a set of different physical running methods to optimize the assay signal intensity by ensuring higher binding of the signal molecules to the DNA. We found that a double-run method improved the assay signal intensity on average by approximately 50%, and a fully absorbed conjugate pad method came close to the double-run signal efficacy at high DNA concentrations. Our results demonstrate that even when the signal molecule is supplied in excess, a significant proportion of analytes bind to the detection antibody in a colorless complex. The lowest detection limits achieved were 0.1 picomole for detection using an anti-Cy5 antibody and 0.01 picomole for the detection using an anti-Texas Red antibody. Our double-run method improvement is generic, does not require additional reagents and equipment, reduces assay costs compared to the fully absorbed method, and is applicable to other lateral flow immunoassays. 1. Introduction Lateral flow immunoassay devices meet the World Health Organization (WHO) criteria for point-of-care diagnostics, as they are affordable, sensitive, specific, user-friendly, rapid and robust, equipment-free, and deliverable to end users (ASSURED). (1) However, achieving low analytical sensitivity with a visual colorimetric signal is one of the limitations of these devices. For sandwich lateral flow immunoassays that use a hapten and antibody
-
Upload
khangminh22 -
Category
Documents
-
view
1 -
download
0
Transcript of Enhancing the Signal of Lateral Flow Immunoassays by Using ...

Sensors and Materials, Vol. 27, No. 7 (2015) 549–561MYU Tokyo
S & M 1090
*Corresponding author: e-mail: [email protected], [email protected]
549
ISSN 0914-4935 © MYU K.K.
Enhancing the Signal of Lateral Flow Immunoassays by Using Different Developing Methods
Jia Li1, David McMillan2 and Joanne Macdonald1,3,*
1Inflammation and Healing Research Cluster, Genecology Research Centre, School of Science and Engineering, University of the Sunshine Coast, Queensland 4558, Australia
2Inflammation and Healing Research Cluster, School of Sports and Health Science, University of the Sunshine Coast, Queensland 4558, Australia
3Division of Experimental Therapeutics, Columbia University, New York, NY, USA
(Received February 5, 2015; accepted June 18, 2015)
Key words: nucleic acid lateral flow, sandwich immunoassay, gold nanoparticles
Lateral flow immunoassay devices are potential biosensors for point-of-care diagnostics. However, these devices are limited by low analytical sensitivity when coupled with a visual colorimetric signal. Here, we analyzed key parameters related to nucleic acid lateral flow performance and related this to the analytical theory behind lateral flow functionality. In particular, we predicted a set of different physical running methods to optimize the assay signal intensity by ensuring higher binding of the signal molecules to the DNA. We found that a double-run method improved the assay signal intensity on average by approximately 50%, and a fully absorbed conjugate pad method came close to the double-run signal efficacy at high DNA concentrations. Our results demonstrate that even when the signal molecule is supplied in excess, a significant proportion of analytes bind to the detection antibody in a colorless complex. The lowest detection limits achieved were 0.1 picomole for detection using an anti-Cy5 antibody and 0.01 picomole for the detection using an anti-Texas Red antibody. Our double-run method improvement is generic, does not require additional reagents and equipment, reduces assay costs compared to the fully absorbed method, and is applicable to other lateral flow immunoassays.
1. Introduction
Lateral flow immunoassay devices meet the World Health Organization (WHO) criteria for point-of-care diagnostics, as they are affordable, sensitive, specific, user-friendly, rapid and robust, equipment-free, and deliverable to end users (ASSURED).(1) However, achieving low analytical sensitivity with a visual colorimetric signal is one of the limitations of these devices. For sandwich lateral flow immunoassays that use a hapten and antibody

550 Sensors and Materials, Vol. 27, No. 7 (2015)
detection system, the analytical sensitivity is reported to be improved through the use of enzyme substrates,(2) dual-gold nanoparticle conjugates,(3) thermal contrast,(4) and changes to the device architecture.(5) While each of these methods improved the signal intensity and analytical sensitivity, they also increased the complexity of the detection system. Here, we examined the parameters surrounding the improved performance of lateral flow immunoassays(6,7) using synthetic Rift Valley Fever viral DNA as the model system. The nucleic acid lateral flow (NALF) immunoassay model was selected because this emerging point-of-care technology can be coupled with nucleic acid amplification processes for improved detection sensitivity.(8) The parameters examined included buffer composition, buffer pH, antibody coverage on the gold nanoparticles (GNPs), and membrane type. In particular, we examined the relationship between the colorimetric signal intensity and the different physical lateral flow running methods. Our results show that, in our model, a second application of signal molecules enhances the visual colorimetric signal of the assay. We also demonstrate that the colorimetric signal is enhanced in a one-step assay when the signal molecules are supplied in excess, and discuss the theoretical basis of these one-step and two-step assay improvements. We show that through judicious assay design, improved signal quality can be obtained despite limiting particular reagent quantities. Our assay modifications are generic and thus applicable to any lateral flow immunoassay system.
2. Materials and Methods
2.1 Oligonucleotides and antibodies NALF detection was performed on synthetic dual-labeled DNA encoding a segment of the Rift Valley Fever virus L gene (5’ TGCTAGGCTAAGACCAGTAAGCAAAGTCAGGCTTAGATTTAGGGA 3’; Genbank accession number NC_014397.1, nucleotides 6287–6331). The DNA was dual-labeled with either 5’56-FAM/3’3CY5Sp (FAM = carboxyfluorescein) or 5’56-FAM/3’3Texas Red-XN, and purified by HPLC (high-performance liquid chromatography) (Integrated DNA Technologies, Inc., Coralville, USA). Hapten/antibody detection of dual labels used monoclonal anti-Cy5 antibody (Sapphire Bioscience Pty. Ltd., Waterloo, NSW, Australia) and monoclonal anti-Texas Red antibody (Invitrogen Corporation, Carlsbad, CA, USA) at the test zone. The monoclonal anti-fluorescein antibody (Roche Diagnostics Australia Pty. Ltd., Castle Hill, NSW, Australia) was conjugated to the GNPs. In addition, the polyclonal rabbit anti-mouse antibody (Sapphire Bioscience Pty. Ltd., Waterloo, NSW, Australia) was deposited at the control zone.
2.2 Preparation of GNP conjugates The anti-fluorescein antibody was coupled to GNPs (40 nm, 20 OD) using the InnovaCoat® GOLD 10× Multi Explorer labeling kit (BioNovus Life Sciences, Cherrybrook, NSW, Australia). Briefly, reagents (GNPs, antibody diluent, reaction buffer, and quencher) were thawed to room temperature, and 12 μL of antibody (diluted to 0.05, 0.1, and 0.2 mg/ml, respectively, using the diluent provided) was mixed with 42

Sensors and Materials, Vol. 27, No. 7 (2015) 551
μL of reaction buffer. The mixture (45 μL) was used to resuspend a vial of InnovaCoat GOLD nanoparticles, followed by incubation for 10 min before the addition of 5 μL of quencher, resulting in a final 20 OD solution (50 μL) of antibody and gold nanoparticle conjugates. The conjugates were washed twice with the corresponding running buffer by centrifugation at 7000 × g for 6 min, before resuspension to the original (50 μL) volume. The conjugates served as the signal molecule (red in color), which allowed the immuno-sandwich complex to be visualized by the naked eye. Conjugates were stored at 4 °C when not in use.
2.3 Preparation of NALF strips Conjugate and sample pads (Millipore, Billerica, MA, USA) were blocked with blocking solution (1% polyvinyl alcohol, 20 mM Tris base, pH 7.4) for 30 min and dried at room temperature for 2 h. The two pads were then impregnated in one of the following running buffers: TBS-T [20 mM Tris-HCl, 150 mM NaCl, 0.05% Tween 20, pH 7.5], TENTC [50 mM Tris, 1 mM EDTA, and 0.15 M NaCl, 0.05% Tween 20, 2% casein, pH 8.0], boric running buffer [100 mM H3BO3, 1% BSA, 0.05% Tween 20, pH 7.5], and borate running buffer [100 mM H3BO3, 100 mM Na2B4O7, 1% BSA, 0.05% Tween 20] with pH adjusted to 7.0, 7.5, 8.0, 8.4, 8.8, or 9.2. Pads were soaked in buffer for 30 min and dried at room temperature overnight. Assembled devices (6.1 × 0.3 cm2) consisted of the treated sample pad (1.5 cm), the treated conjugate pad (0.6 cm), a nitrocellulose membrane (2.5 cm), and an absorbent pad (1.5 cm) (Millipore, Billerica, MA, USA) on an adhesive backing card (Lohmann Corporation, Hebron, KY, USA), with a 0.1 cm overlap between components. The nitrocellulose membranes tested were Hi-Flow Plus HF120 and HF135 (Millipore, Billerica, MA, USA), which have a pore size of 12 μm with flow rates of 120 and 135 s/4 cm respectively; the UniSart® CN95 (Sartorius Stedim Biotech, Concord, CA, USA), which has a pore size of 15 μm with a flow rate of 95 s/4 cm; and the UniSart® CN140 and CN150, which have a pore size of 8 μm with flow rates of 140 and 150 s/4 cm, respectively. Detection antibodies (either anti-Cy5 antibody, 1.9 mg/ml; or anti-Texas Red antibody, 1 mg/ml) were pipetted (0.4 µL) onto the test zone of the nitrocellulose membrane. Rabbit anti-mouse antibody (1 mg/ml in 50% glycerol) was pipetted (0.4 µL) at the control zone. Test and control antibodies were spotted 0.5 cm apart and dried at room temperature for 45 min.
2.4 NALF strip running procedure Five different running assay methods were compared for efficiency as follows.(1) Single-run method: the GNP conjugate (2 μL) was pipetted onto the conjugate
pad, and the resultant NALF strip was dipped for 15 min into a mixture containing 100 μL of running buffer and 1 μL of single-stranded synthetic DNA (varying concentrations).
(2) Double-run method: the GNP conjugate (1 μL) was pipetted onto the conjugate pad before exposure to the dual-labeled DNA as above. The strip was subsequently dipped into a mixture containing 100 µL of running buffer and 1 μL of single-

552 Sensors and Materials, Vol. 27, No. 7 (2015)
stranded synthetic DNA (varying concentrations). An additional 1 µL of GNP conjugate was pipetted onto the conjugate pad once the running buffer reached the bottom of the absorbent pad. The strip was developed for 15 min.
(3) Preincubation method I: DNA (1 µL) and the GNP conjugate (2 μL) were pre-mixed and pipetted onto the conjugate pad. The NALF strip was then dipped into 100 µL of running buffer for 15 min.
(4) Preincubation method II: the NALF strip was dipped for 15 min into a mixture containing 1 µL of DNA, 2 μL of GNP conjugate and 100 µL of running buffer.
(5) Fully absorbed conjugate pad method: the conjugate pad was impregnated with 10 μL of GNP conjugate (this volume had been predetermined to saturate the conjugate pad with respect to the size dimension of 0.7 × 0.3 cm2) and dried at room temperature overnight. The pad was assembled into a NALF strip and dipped for 15 min into a mixture containing 100 μL of running buffer and 1 μL of single-stranded synthetic DNA (varying concentrations).
All experiments were performed in duplicate and repeated at least twice to demonstrate consistency of results.
2.5 NALF strip image analysis The reacted NALF strips were dried overnight, imaged using the MultiDoc-ItTM Digital Imaging System (Upland, CA, USA), and analyzed using ImageJ software (National Institutes of Health, MD, USA). Image brightness/contrast and color balance were auto-adjusted. The background was subtracted against negative-control NALF strips, and the spot intensity was reported as mean gray value. Results were normalized to percentage signal intensity to account for day-to-day variation. Statistical differences between percentage signal intensities were analyzed using a one-way ANOVA followed by a Tukey multiple comparisons test with 95% confidence interval (Prism6, GraphPad Software, Las Jolla, CA, USA).
3. Results and Discussion
3.1 Lateralflowimmunoassayparameterstudies Our lateral flow immunoassay was based on a hapten-antibody detection system. A single-stranded DNA analyte was dual-labeled with FAM and either Cy5 or Texas Red. The analyte was captured by anti-Cy5 (or anti-Texas Red) antibodies and detected via anti-fluorescein antibody-labeled gold nanoparticles [Fig. 1(a)]. The appearance of both the test and control dots indicated a positive result, and the control dot served to validate the lateral flow immunoassay [Fig. 1(a)]. To achieve a better lateral flow immunoassay performance, we studied the parameters that were considered to be important for improving the analytical sensitivity, such as the running buffer, buffer pH, coverage of the anti-fluorescein antibody on the GNPs, and the nitrocellulose membrane type. These parameter studies were performed using 0.1 μM and 1 μM DNA. The 1 μM DNA concentration was shown to give the optimal signal intensity within the concentration range of 10 to 0.001 μM in our preliminary studies. The selected 0.1 and 1 μM DNA concentrations aimed to demonstrate the lateral flow immunoassay performance at low and high DNA concentrations. In all the experiments, the sample and conjugate pads

Sensors and Materials, Vol. 27, No. 7 (2015) 553
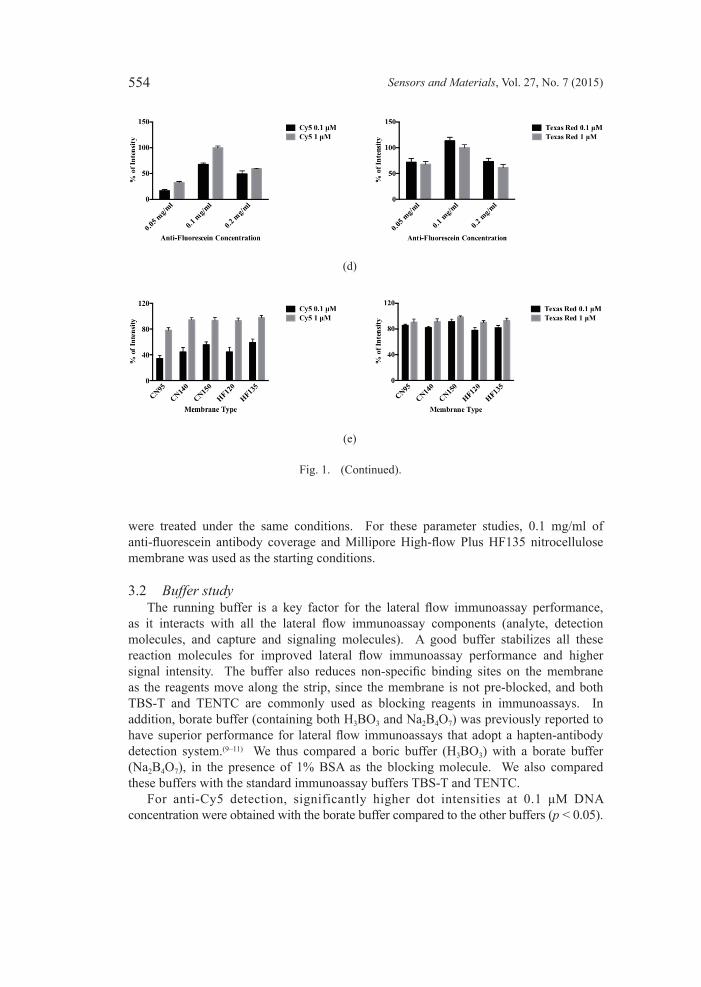
Fig. 1. (Color online) Lateral flow immunoassay parameter studies for anti-Cy5 and anti-Texas Red detections. (a) Lateral flow immunoassay detection system based on hapten-antibody interaction. (b) Buffer study results. (c) Buffer pH study results. (d) Anti-fluorescein coverage on GNP study results. (e) Membrane study results. Conjugate and sample pads were blocked and absorbed with different running buffers prior to the assembly of the NALF strip. NALF strips were assembled using different nitrocellulose membranes, and GNP conjugates with different anti-fluorescein antibody coverage were pipetted onto the conjugate pad. The strips were subsequently dipped into mixtures that contain the respective running buffer and DNA (0.1 or 1 μM) and developed using the double-run method. (See Figs. 1(d) and 1(e) on next page.)
(a)
(b)
(c)
554 Sensors and Materials, Vol. 27, No. 7 (2015)
were treated under the same conditions. For these parameter studies, 0.1 mg/ml of anti-fluorescein antibody coverage and Millipore High-flow Plus HF135 nitrocellulose membrane was used as the starting conditions.
3.2 Buffer study The running buffer is a key factor for the lateral flow immunoassay performance, as it interacts with all the lateral flow immunoassay components (analyte, detection molecules, and capture and signaling molecules). A good buffer stabilizes all these reaction molecules for improved lateral flow immunoassay performance and higher signal intensity. The buffer also reduces non-specific binding sites on the membrane as the reagents move along the strip, since the membrane is not pre-blocked, and both TBS-T and TENTC are commonly used as blocking reagents in immunoassays. In addition, borate buffer (containing both H3BO3 and Na2B4O7) was previously reported to have superior performance for lateral flow immunoassays that adopt a hapten-antibody detection system.(9–11) We thus compared a boric buffer (H3BO3) with a borate buffer (Na2B4O7), in the presence of 1% BSA as the blocking molecule. We also compared these buffers with the standard immunoassay buffers TBS-T and TENTC. For anti-Cy5 detection, significantly higher dot intensities at 0.1 μM DNA concentration were obtained with the borate buffer compared to the other buffers (p < 0.05).
(e)
(d)
Fig. 1. (Continued).

Sensors and Materials, Vol. 27, No. 7 (2015) 555
At the DNA concentration of 1 μM, TENCT and borate buffers generated significantly higher dot intensities than the other two buffers (p < 0.05) [Fig. 1(b)]. For the anti-Texas Red detection, the borate buffer similarly demonstrated the best performance compared to the other buffers tested for both 0.1 and 1 μM DNA concentrations (p < 0.05) [Fig. 1(b)]. The borate buffer was chosen for the next parameter study.
3.3 Buffer pH studyProteins are very sensitive to pH change; our detection system involves hapten and antibody interaction, and thus we studied the effect of buffer pH on the lateral flow immunoassay performance. For both the anti-Cy5 and anti-Texas Red detection, pH conditions at 8.4, 8.8, and 9.2 gave significantly higher relative dot intensities at both 0.1 and 1 μM DNA concentrations compared to the lower pHs (p < 0.05). In addition, the pH 8.8 was significantly improved compared to pH 9.2 and pH 8.0 at 0.1 μM for the anti-Cy5 detection [Fig. 1(c)]. Therefore, borate buffer at pH 8.8 was used in subsequent studies.
3.4 Anti-fluoresceinantibodycoverageonGNPstudy Since part of the detection system was associated with the binding of anti-fluorescein/GNPs to the FAM linked to the 5’ end of DNA, the next study explored the optimal density of anti-fluorescein antibodies on the GNPs. For the anti-Cy5 detection, 0.1 mg/ml anti-fluorescein antibody coverage showed significantly better performance than the 0.05 and 0.2 mg/ml coverage at both the 0.1 and 1 μM DNA concentrations (p < 0.05) [Fig. 1(d)]. Similarly, the greatest dot intensity was observed at 0.1 mg/ml when anti-Texas Red antibody was used (p < 0.05) [Fig. 1(d)]. Overall, the 0.1 mg/ml anti-fluorescein antibody gave the best coverage, as it demonstrated a good balance between low binding chance due to low coverage (0.05 mg/ml) and steric hindrance effect due to high coverage (0.2 mg/ml).(12) The 0.1 mg/ml anti-fluorescein antibody coverage was used for the next parameter study.
3.5 Membrane type study The nitrocellulose membrane serves as an open matrix for the immunoassay operation, yet the pore size and the flow rate have been reported to be the critical factors related to the analytical sensitivity.(6,13,14) In this research, we used two different types of nitrocellulose membrane, i.e., Millipore Hi-Flow Plus and Satorius UniSart®. We also conducted experiments using nitrocellulose membranes with different flow rates for each brand. The Millipore Hi-Flow Plus membrane has a pore size of 12 μm with flow rates of 120 and 135 s/4 cm for HF120 and HF135, respectively. The Satorius UniSart® CN95 has a pore size of 15 μm with a flow rate of 95 s/4 cm. The Satorius UniSart® CN140 and CN150 both have a pore size of 8 μm with flow rates of 140 and 150 s/4 cm, respectively. For the anti-Texas Red detection, there was no significant difference between the performances of any membranes (p < 0.05). For the anti-Cy5 detection, there was no significant difference between most of the membranes, except the HF135 consistently performed better than the CN95 at both 0.1 μM and 1 μM DNA concentrations [Fig. 1(e)]. Because the HF135 consistently performed well under all the conditions tested, it was used in further studies.
556 Sensors and Materials, Vol. 27, No. 7 (2015)
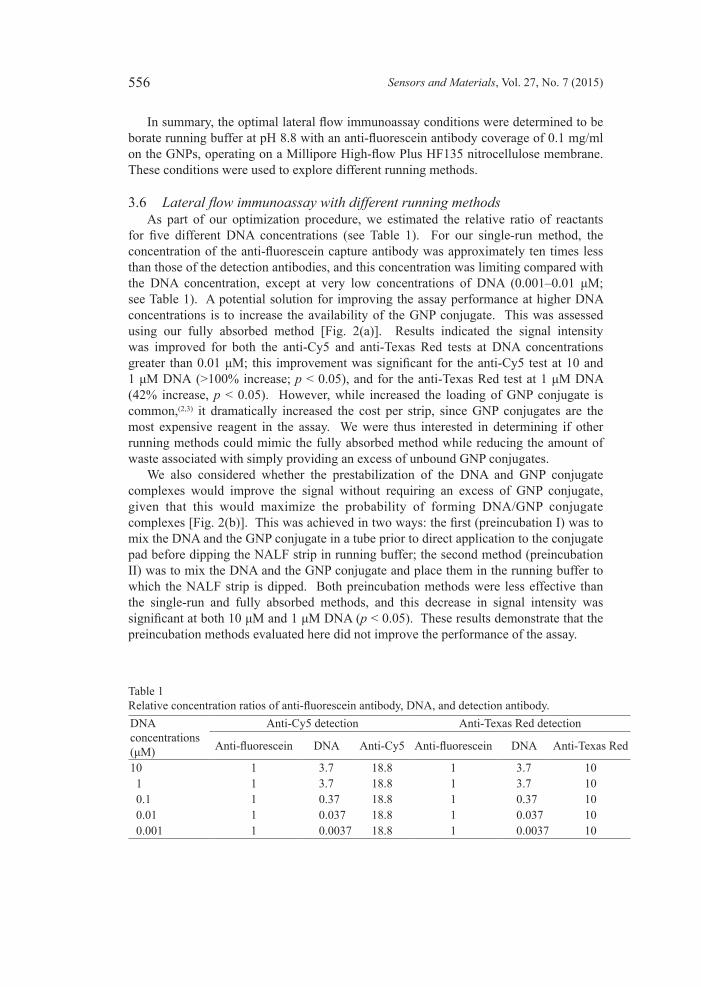
In summary, the optimal lateral flow immunoassay conditions were determined to be borate running buffer at pH 8.8 with an anti-fluorescein antibody coverage of 0.1 mg/ml on the GNPs, operating on a Millipore High-flow Plus HF135 nitrocellulose membrane. These conditions were used to explore different running methods.
3.6 Lateralflowimmunoassaywithdifferentrunningmethods As part of our optimization procedure, we estimated the relative ratio of reactants for five different DNA concentrations (see Table 1). For our single-run method, the concentration of the anti-fluorescein capture antibody was approximately ten times less than those of the detection antibodies, and this concentration was limiting compared with the DNA concentration, except at very low concentrations of DNA (0.001–0.01 μM; see Table 1). A potential solution for improving the assay performance at higher DNA concentrations is to increase the availability of the GNP conjugate. This was assessed using our fully absorbed method [Fig. 2(a)]. Results indicated the signal intensity was improved for both the anti-Cy5 and anti-Texas Red tests at DNA concentrations greater than 0.01 μM; this improvement was significant for the anti-Cy5 test at 10 and 1 μM DNA (>100% increase; p < 0.05), and for the anti-Texas Red test at 1 μM DNA (42% increase, p < 0.05). However, while increased the loading of GNP conjugate is common,(2,3) it dramatically increased the cost per strip, since GNP conjugates are the most expensive reagent in the assay. We were thus interested in determining if other running methods could mimic the fully absorbed method while reducing the amount of waste associated with simply providing an excess of unbound GNP conjugates. We also considered whether the prestabilization of the DNA and GNP conjugate complexes would improve the signal without requiring an excess of GNP conjugate, given that this would maximize the probability of forming DNA/GNP conjugate complexes [Fig. 2(b)]. This was achieved in two ways: the first (preincubation I) was to mix the DNA and the GNP conjugate in a tube prior to direct application to the conjugate pad before dipping the NALF strip in running buffer; the second method (preincubation II) was to mix the DNA and the GNP conjugate and place them in the running buffer to which the NALF strip is dipped. Both preincubation methods were less effective than the single-run and fully absorbed methods, and this decrease in signal intensity was significant at both 10 μM and 1 μM DNA (p < 0.05). These results demonstrate that the preincubation methods evaluated here did not improve the performance of the assay.
Table 1Relative concentration ratios of anti-fluorescein antibody, DNA, and detection antibody.DNAconcentrations(μM)
Anti-Cy5 detection Anti-Texas Red detection
Anti-fluorescein DNA Anti-Cy5 Anti-fluorescein DNA Anti-Texas Red
10 1 3.7 18.8 1 3.7 10 1 1 3.7 18.8 1 3.7 10 0.1 1 0.37 18.8 1 0.37 10 0.01 1 0.037 18.8 1 0.037 10 0.001 1 0.0037 18.8 1 0.0037 10

Sensors and Materials, Vol. 27, No. 7 (2015) 557
Fig. 2. (Color online) Theoritical illustrations (i) and results of lateral flow immunoassay obtained by different running methods for anti-Cy5 (ii) and anti-Texas Red (iii) detections. (a) Comparison between single-run and fully absorbed conjugate pad methods. (b) Comparison between single-run and preincubation methods. (c) Comparison between single-run, fully absorbed conjugate pad, and double-run methods. (See Fig. 2(c) on next page.)
(a)
(b)
(i)
(ii) (iii)
(ii) (iii)
(i)

558 Sensors and Materials, Vol. 27, No. 7 (2015)
Given the lack of improvement using the preincubation methods, we considered whether a two-step assay might improve performance. In particular, we hypothesized that a second application of the GNP conjugate may result in additional binding of DNA that failed to bind the GNP conjugate in the initial migration. The double-run method showed a consistent increase in signal intensity (22–122% for anti-Cy5 detection and 28–41% for anti-Texas Red detection) compared to the single-run method for all detectable DNA concentrations; this improvement was significant at 1 μM DNA concentrations (p < 0.05). These results suggest that even when the GNP conjugate is in excess, some DNA molecules escape capture by the GNP conjugate and bind to the detection antibody, forming a colorless complex. We also observed that optimal signal intensity was obtained when the three immunoassay components (detection antibody, capture antibody, and analyte) were at equimolar ratios (see Table 1 and Fig. 2); for the anti-Cy5 detection, this was 10 µM DNA, whereas for the anti-Texas Red detection, this was 1 µM DNA. The double-run method dot intensity was either equal or lower in dot intensity to the fully absorbed method at higher DNA concentrations (10 μM and 1 μM) but had higher intensities at lower DNA concentrations (0.01 μM or less). However, these differences were not consistently significant between the anti-Texas Red and anti-Cy5 tests (p < 0.05). Taken together, these results demonstrate that by judicious assay design, improved signal quality can be obtained despite limiting reagent quantities. Importantly, the double-run
(c)
Fig. 2. (Continued)
(i)
(ii) (iii)

Sensors and Materials, Vol. 27, No. 7 (2015) 559
method uses 1/5 GNP conjugates compared with the amount used in the fully absorbed method, with improved performance at lower DNA concentrations, regardless of the underlying target antibodies. Previous strategies to improve lateral flow immunoassay performance have included adopting a two-step assay for enzymatic colorimetric signal generation or pre-stabilization of reactants.(2,15,16) Our results showed a dot intensity increase similar to that obtained by Parolo et al.,(2) who demonstrated a 3- or 4-fold intensity increase by adopting a two-step assay using an enzymatic colorimetric signal, although their system also increased the analytical sensitivity by an order of magnitude. Changing the strip architecture resulted in a 2- or 3-fold change in signal intensity.(5) Others have employed methods involving dual-gold nanoparticle conjugates(3) or thermal contrast enhancement that requires a laser and an infrared temperature gun.(4) In contrast, the enhancement that we describe is advantageous, as it does not require any extra reagents or equipment. Additionally, while a two-step assay may be cumbersome in point-of-care situations, one benefit of decreasing the GNP quantity is the marked reduction in assay cost. This reduction in cost could be particularly useful when performing large numbers of assays, such as during the screening phase of research and development projects. For all the running methods, the detection limits were 0.1 μM (0.1 picomole) for FAM/Cy5 dual-labeled DNA and 0.01 μM (0.01 picomole) for FAM/Texas Red dual-labeled DNA. The anti-Texas Red assay consistently generated higher signal intensities than the anti-Cy5 assay, presumably due to differences in the affinity between antigen and antibody pairs.(10)
4. Conclusions
Optimal nucleic acid lateral flow performance requires a complex interplay between critical parameters, such as buffer composition, buffer pH, coverage of anti-fluorescein antibody on GNPs, and nitrocellulose membrane type. We found that the optimal conditions for NALF strips were borate running buffer at pH 8.8 and an anti-fluorescein coverage of 0.1 mg/ml on GNPs. We also showed that there was no difference in assay performance between nitrocellulose membrane types. We then examined the relationship between different lateral flow immunoassay running methods and analytical signal intensities. Our results showed that the double-run method enhanced the signal intensity, and the fully absorbed conjugate pad method approximated the double-run assay efficacy up to 1 μM DNA concentrations. The detection limits were 0.1 and 0.01 picomole for FAM/Cy5 and FAM/Texas Red dual-labeled DNA, respectively. The double-run method showed a consistent signal intensity increase for both of the anti-Cy5 (22–122%) and anti-Texas Red (28–41%) detections against all detectable DNA concentrations (0.001 to 10 μM). The method does not require extra reagents or equipment, reduces assay costs, and can be applied to virtually any other lateral flow immunoassay.

560 Sensors and Materials, Vol. 27, No. 7 (2015)
Acknowledgements
This work was funded by the Queensland Government, Department of Science, Information Technology, Innovation and the Arts (DSITIA, Australia), and an internal HDR grant (University of the Sunshine Coast, Australia). We thank Professor John Bartlett for support and advice.
References
1 D. Mabey, R. W. Peeling, A. Ustianowski and M. D. Perkins: Nat. Rev. Microbiol. 2 (2004) 231.
2 C. Parolo, A. de la Escosura-Muñiz and A. Merkoçi: Biosens. Bioelectron. 40 (2013) 412. 3 D. H. Choi, S. K. Lee, Y. K. Oh, B. W. Bae, S. D. Lee, S. Kim, Y. B. Shin and M. G. Kim:
Biosens. Bioelectron. 25 (2010) 1999. 4 Z. Qin, W. C. Chan, D. R. Boulware, T. Akkin, E. K. Butler and J. C. Bischof: Angew. Chem.
Int. Ed. Engl. 51 (2012) 4358. 5 C. Parolo, M. Medina-Sanchez, A. de la Escosura-Muniz and A. Merkoci: Lab Chip. 13 (2013)
386. 6 O. F. Brendan: Lateral Flow Immunoassay, eds. C. W. Raphael and Y. T. Harley (Humana
Press, New York, 2009) Chap. 1. 7 I. Safenkova, A. Zherdev and B. Dzantiev: Anal. Bioanal. Chem. 403 (2012) 1595. 8 J. Li and J. Macdonald: Biosens. Bioelectron. C 64 (2014) 196. 9 M. Blažková, M. Koets, P. Rauch and A. Amerongen: Eur. Food Res. Technol. 229 (2009)
867. 10 P. Noguera, G. A. Posthuma-Trumpie, M. van Tuil, F. J. van der Wal, A. de Boer, A. P. H. A.
Moers and A. van Amerongen: Anal. Bioanal. Chem. 399 (2011) 831. 11 C. Suarez-Pantaleon, J. Wichers, A. Abad-Somovilla, A. van Amerongen and A. Abad-
Fuentes: Biosens. Bioelectron. 42 (2013) 170. 12 J. Aveyard, M. Mehrabi, A. Cossins, H. Braven and R. Wilson: Chem. Commun. (2007)
4251. 13 A. H. Michael, A. A. Charlene and M. Richard: IVD Technology (1996). 14 J. L. Tonkinson and B. A. Stillman: Front. Biosci. 7 (2002), c1. 15 Y. He, S. Zhang, X. Zhang, M. Baloda, A. S. Gurung, H. Xu, X. Zhang and G. Liu: Biosens.
Bioelectron. 26 (2011) 2018. 16 D. B. Wang, B. Tian, Z. P. Zhang, J. Y. Deng, Z. Q. Cui, R. F. Yang, X. Y. Wang, H. P. Wei and X.
E. Zhang: Biosens. Bioelectron. 42 (2013) 661.
About the Authors
Jia Li did her undergraduate degree at the University of Sydney, Australia, working on the structure activity relationships of carborane phosphonium salts for boron neutron capture therapy (BNCT). She then went to England for a research project about onco-protein-protein interactions at the University of Leeds. She is now doing a PhD at the University of the Sunshine Coast under Dr. Joanne Macdonald’s supervision. Her PhD project involves developing rapid and novel virus detection biosensors towards point-of-care.

Sensors and Materials, Vol. 27, No. 7 (2015) 561
Dr. David McMillan obtained his PhD in 1999 from the University of Wollongong, NSW, Australia. He is a molecular and clinical microbiologist with research interests in pathogenesis, diagnostics, and vaccinology.
Dr. Joanne Macdonald’s research focuses on the molecular engineering of advanced devices, including a DNA automaton able to play tic-tac-toe against a human opponent, and a molecular calculator able to add and multiply small numbers. She is jointly appointed as a Senior Lecturer in Molecular Engineering at the University of the Sunshine Coast in Australia and Assistant Professor in Clinical Medical Sciences at Columbia University in New York, USA. She received her PhD in Virology in 2003 from the University of Queensland, Australia.