Adsorption and Diffusion of Li on Pristine and Defective Graphene

Analyst
PAPER
Publ
ishe
d on
04
Oct
ober
201
3. D
ownl
oade
d by
UN
IVE
RSI
TA
CA
TT
OL
ICA
SA
CR
O C
UO
RE
on
18/1
1/20
13 1
1:02
:47.
View Article OnlineView Journal | View Issue
aInterdisciplinary Laboratories for Advanced
41, Brescia, Italy. E-mail: sangalet@dmf.
unicatt.it/ilamp; Fax: +39 030 2406742; TelbDipartimento di Matematica e Fisica, Univ
Musei 41, Brescia, ItalycCentro de Fısica de Materiales (CSIC/UPV
Manuel de Lardizabal 5, E-20018 San SebadElettra Sincrotrone Trieste S.C.p.A., s.s.14
Cite this: Analyst, 2013, 138, 7392
Received 19th June 2013Accepted 3rd October 2013
DOI: 10.1039/c3an01209c
www.rsc.org/analyst
7392 | Analyst, 2013, 138, 7392–739
Enhancing the sensitivity of chemiresistor gas sensorsbased on pristine carbon nanotubes to detect low-ppbammonia concentrations in the environment
Federica Rigoni,ab Silvia Tognolini,ab Patrizia Borghetti,bc Giovanni Drera,ab
Stefania Pagliara,ab Andrea Goldonid and Luigi Sangaletti*ab
The possibility of using novel architectures based on carbon nanotubes (CNTs) for a realistic monitoring of
the air quality in an urban environment requires the capability tomonitor concentrations of polluting gases
in the low-ppb range. This limit has been so far virtually neglected, as most of the testing of new ammonia
gas sensor devices based on CNTs is carried out above the ppm limit. In this paper, we present single-wall
carbon nanotube (SWCNT) chemiresistor gas sensors operating at room temperature, displaying an
enhanced sensitivity to NH3. Ammonia concentrations in air as low as 20 ppb have been measured, and
a detection limit of 3 ppb is demonstrated, which is in the full range of the average NH3 concentration
in an urban environment and well below the sensitivities so far reported for pristine, non-functionalized
SWCNTs operating at room temperature. In addition to careful preparation of the SWCNT layers,
through sonication and dielectrophoresis that improved the quality of the CNT bundle layers, the low-
ppb limit is also attained by revealing and properly tracking a fast dynamics channel in the desorption
process of the polluting gas molecules.
1. Introduction
Since the discovery by Iijima in 1991,1 carbon nanotubes (CNTs)have attracted great interest among researchers. CNTs areknown to interact with many gas molecules that, depending ontheir reducing or oxidizing properties, may inject or extractelectrons from the CNTs, resulting in a detectable electricalsignal. These effects could be exploited to prepare gas sensorsfor polluting or hazardous molecules. With respect tocommercial electrochemical sensors for environmental moni-toring (mostly based on metal oxides), CNTs show a higherphysical and chemical stability, better transport of charge to theelectrodes and a wide range of possible architectures andoperational features that make them a unique system for gasdetection. A large body of studies have reported the response ofCNTs to many gases, in particular to ammonia and nitrogendioxide,2 as prototypes of reducing and oxidizing gas, respec-tively. Many CNT-based gas sensor devices have been tested sofar, showing that CNTs are a promising class of materials for thedevelopment of gas sensors.3–14
Materials Physics (I-LAMP), via dei Musei
bs.unicatt.it; Web: http://centridiricerca.
: +39 030 2406716
ersita Cattolica del Sacro Cuore, via dei
-EHU) – Materials Physics Center, Paseo
stian, Spain
Km. 163.5, 34149, Trieste, Italy
9
Here we shall focus on the possibility of CNT sensors tomonitor concentrations of ammonia ([NH3]) in the low-ppbrange. Rather than being a mere case-study, the choice ofammonia as a polluting gas is rooted on a solid scienticbackground demonstrating the need to reach a widespreadmonitoring of ammonia concentration and uxes15 as a keypoint to reduce the hazards for human health and vegetation.Indeed, the widespread use of ammonia and its derivatives asagricultural nitrogen fertilizers has substantially increasedammonia emissions to the atmosphere, leading to a wide rangeof different environmental problems.16–19 These include theeutrophication of semi-natural ecosystems, acidication ofsoils, formation of ne particulate matter in the atmosphereand alteration of the global greenhouse balance. Actually, agrowing body of investigations20–23 is highlighting the relevantrole played by ammonia as a precursor of secondary neparticulate (PM10 and PM2.5), which represents a serious threatto human health. Ammonia could be hence used as a localmarker of secondary particulate formation, allowing indirectcontrol of particulate emission sources.
In spite of this, the detection of ammonia atmosphericconcentrations in urban areas has been so far widely over-looked, since its average levels are usually low, i.e. in the 20–30ppb range, as recently discussed by Chiesa et al.24 For realisticoutdoor [NH3] monitoring in an urban environment, chemir-esistor gas sensors (CGSs) should provide a sensitivity wellbelow the ppm scale, hopefully at the ppb level. So far, manyCNT-based architectures have been proposed (from FET to CNT
This journal is ª The Royal Society of Chemistry 2013

Paper Analyst
Publ
ishe
d on
04
Oct
ober
201
3. D
ownl
oade
d by
UN
IVE
RSI
TA
CA
TT
OL
ICA
SA
CR
O C
UO
RE
on
18/1
1/20
13 1
1:02
:47.
View Article Online
bundles, and from aligned CNT layers to CNT decorated orfunctionalized with single molecules and nanoparticles5,12,13,25),following a systematic investigation in testing chambers.However, little attention has been paid to the capability of thesesensors to measure sub-ppm [NH3] in air.
In this study, we present a sequence of strategies leading toan enhancement of the sensitivity to NH3 of single-walledcarbon nanotubes (SWCNTs) thin layers operating at roomtemperature (RT). Ammonia concentrations in air as low as20 ppb have been measured and a detection limit of 3 ppb isdemonstrated, which is in the range of the average NH3
concentration in urban environments, and is well below thesensitivities so far reported for pristine CNTs, operating in air atroom temperature.25 The sensitivity improvement is enabled bycareful preparation of the CNT bundle layers, i.e. by minimizingthe lm thickness or by removing loosely bound agglomerates.These processes allowed us to track a fast dynamics channel inthe CNT–NH3 interaction, otherwise missed by conventionalgas sensors based on oxide nanoparticles, that enables thedetection of small transients in the gas concentration in thelow-ppb range.
In our study, the choice of SWCNTs rather than multi-walledCNTs (MWCNTs) is motivated by the need to reduce thecomplexity of gas–nanostructure interactions as much aspossible, and focus only on the device sensitivity. ThereforeSWCNTs were chosen, to avoid considering multiple wall effectsin the interaction of polluting gas with CNTs. Differencesbetween the response mechanisms upon ammonia absorptionof SWCNTs with respect to MWCNTs are discussed in ref. 8.
Fig. 1 Scheme of the circuit for the electrical measurements. A constant voltageVc ¼ 5 V is applied across the chemical gas sensor, connected in series with a loadresistor RL¼ 5.6 kU. By monitoring the voltage Vout across the sensor, its resistancewas measured.
2. Experimental methods2.1 Device preparation and electrical measurements
CNT-based chemical resistors were prepared by drop casting4 ml of a SWCNT dispersion in a solution containing water,sodium hydroxide and sodium lauryl sulphate (CarboLex Inc.)onto a ceramic substrate with interdigitated Pt electrodes.Alumina plates (10 � 15 mm2) with Pt interdigitated ngerelectrodes were selected (Electronics Design Center, CaseWestern Reserve University, Cleveland, Ohio) for electricalmeasurements. Sonication of the devices was carried out inacetone for 45 minutes.
Dielectrophoresis assisted deposition started with dropcasting 4 ml of SWCNT dilution on the alumina substrate.During the solvent evaporation a constant voltage of 5 V (withan offset of 2 V) was applied between the interdigitated elec-trodes while an ac current at 1 MHz was owing, following theindications of Suehiro et al.26
All sensors, including humidity and temperature sensors,were mounted on a specically designed circuit board con-nected to a personal computer through a National InstrumentPCIe-6251 data acquisition board. Gas exposure was carried outeither in a sensor test chamber or in the lab. The testingchamber was selected mainly for the sensor calibration, whilemost of the [NH3] measurements were carried out in the labo-ratory atmosphere, which provides an environment closer to thenal destination of the sensors, although signal uctuations
This journal is ª The Royal Society of Chemistry 2013
can be larger with respect to the measurements carried out inthe sealed, testing chamber.
The gas mixing system is equipped with three mass-owcontrollers (MFCs). Two low-ow MFCs were used for control-ling the analyte ow rate (47.1� 1.2 ppm for NH3, diluted in dryair) and a high-owMFC was used for further dilution in dry air.
The measurements outside the testing chamber were carriedout in air. In this case, the gas concentration was measured witha calibrated, commercially available, chemiresistor gas sensor(Figaro, Mod. TGS 2602). Calibration was available for ammoniaconcentrations above 1 ppm. The reliability of this sensor cali-bration curve was cross-checked bymeasurements in the testingchamber with the calibrated MFCs.
The sample resistance (RS) upon gas exposure with respect tothe baseline resistance (R0) was measured according to theelectrical scheme shown in Fig. 1. For the electrical measure-ment, a constant voltage (Vc ¼ 5 V) was applied across a loadresistor RL (5.6 kU for SWCNT based sensor and 33 kU for thecommercial one) which was connected in series with thechemiresistor gas sensor (CGS). By monitoring the voltageacross the sensor (Vout), we obtained the value of the resistanceRs, using the formula Rs ¼ VoutRL/(Vc � Vout).
2.2 Sample characterization
The samples were characterized by micro-Raman and X-rayphotoemission spectroscopies, as well as by scanning electronmicroscopy (SEM).
Micro-Raman data were collected on the CGS device with aRenishaw-Invia system, equipped with a 633 nm laser source. A1800 lines per mm grating was used and the laser light wasfocussed onto the sample with a 50� objective.
SEM measurements were carried out with a Hitachi TM3000table-top microscope.
XPS data were collected with a VG-Scienta spectrometer anda twin anode X-ray source. The Al ka line at hn ¼ 1486.6 eV wasused to excite the sample. The analyser was operated in trans-mission mode with a pass energy of 200 eV, yielding an overallresolution of 1.2 eV. For the XPS analysis, samples were
Analyst, 2013, 138, 7392–7399 | 7393
Analyst Paper
Publ
ishe
d on
04
Oct
ober
201
3. D
ownl
oade
d by
UN
IVE
RSI
TA
CA
TT
OL
ICA
SA
CR
O C
UO
RE
on
18/1
1/20
13 1
1:02
:47.
View Article Online
prepared by drop casting 1 ml of CNT solution on a referencesilicon wafer, previously cleaned in an ultrasonic bath.
3. Results and discussion3.1 CNT layer characterization
The structural properties of the CNTs have been characterizedby Raman spectroscopy. The Raman spectrum (Fig. 2) shows thetypical peaks of SWCNT:27 the radial breathing mode (RBM,inset of Fig. 2) at 170 cm�1, the G-band (with the G� and G+
contributions, at 1570 cm�1 and 1590 cm�1 respectively) andthe D-band at 1320 cm�1. From the frequency of the RBM, wecan estimate the diameter of the nanotube using the equationuRBM ¼ A/dt + B, where dt is the tube diameter and A and B areexperimental parameters. For bundles of SWCNTs typicalparameters are A ¼ 234 cm�1 and B ¼ 10 cm�1.28 Using thesevalues in the equation reported above, with uRBM z 170 cm�1,we obtain dt z 1.5 nm. The difference in the shape of theG-band reects a more metallic character of drop-cast SWCNTand a more semiconducting character of SWCNT of the sampleprepared by the dielectrophoresis method. This result is inaccordance with other studies.29
The XPS-based elemental analysis of the CNT lm wascarried out on a thin lm deposited on a Si wafer. Namely, 1 mlof the solution was drop cast on a silicon wafer, and aer thesolvent evaporation, the XPS analysis was carried out. Asexpected, the results of XPS (data not shown here) indicate thepresence of Na and, to a minor extent, S ascribed to sodiumhydroxide and sodium lauryl sulphate in the CNT dispersion.No traces of other contaminants have been detected within theelemental sensitivity of the XPS probe (about 0.5%).
To complete the sample characterization, we wish tomention that, in addition to ammonia, the CGSs were alsotested against NO2, acetone and ethyl alcohol exposures. Amongthese, NO2 is a typical interfering gas in the environment. Thepresent sensors have been found sensitive to NO2 (with theexpected resistivity decrease upon exposure) but not to acetone
Fig. 2 Raman spectra of SWCNTs deposited on alumina substrates by drop-casting (red solid line) and dielectrophoresis (gray dashed line). Inset: spectralweight in the RBM region.
7394 | Analyst, 2013, 138, 7392–7399
and ethyl alcohol. A discussion on interference effects on CGSsprepared with the same SWCNTs on plastic substrates can befound in ref. 24.
3.2 Response enhancement
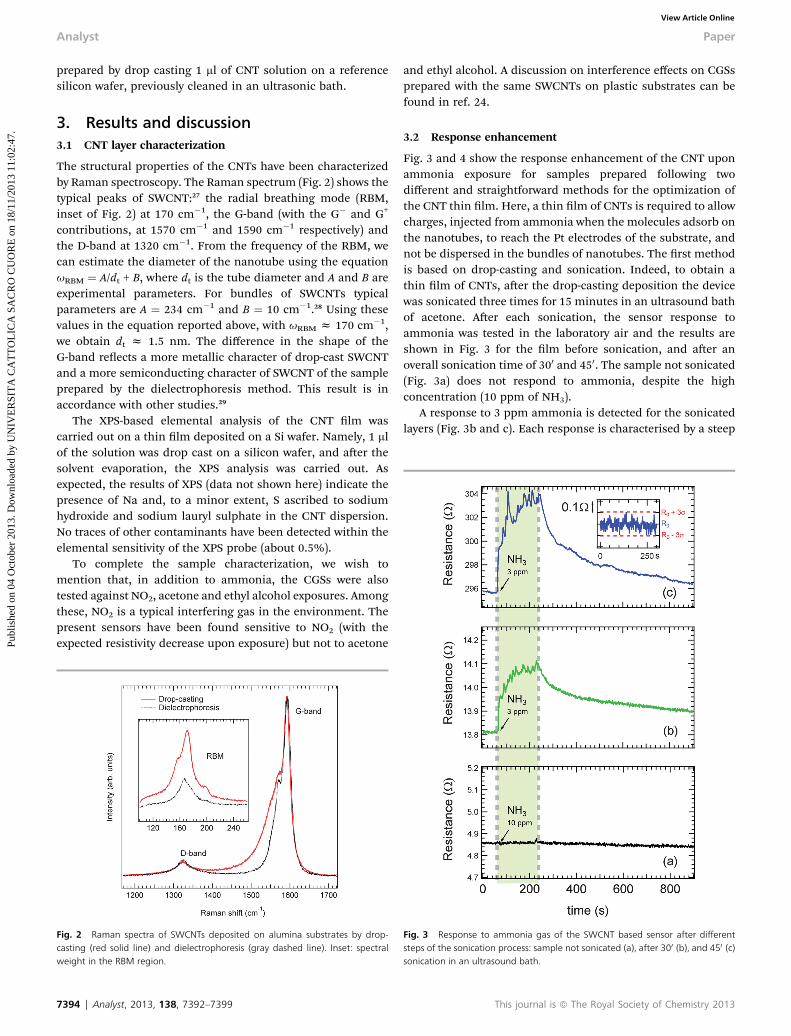
Fig. 3 and 4 show the response enhancement of the CNT uponammonia exposure for samples prepared following twodifferent and straightforward methods for the optimization ofthe CNT thin lm. Here, a thin lm of CNTs is required to allowcharges, injected from ammonia when the molecules adsorb onthe nanotubes, to reach the Pt electrodes of the substrate, andnot be dispersed in the bundles of nanotubes. The rst methodis based on drop-casting and sonication. Indeed, to obtain athin lm of CNTs, aer the drop-casting deposition the devicewas sonicated three times for 15 minutes in an ultrasound bathof acetone. Aer each sonication, the sensor response toammonia was tested in the laboratory air and the results areshown in Fig. 3 for the lm before sonication, and aer anoverall sonication time of 300 and 450. The sample not sonicated(Fig. 3a) does not respond to ammonia, despite the highconcentration (10 ppm of NH3).
A response to 3 ppm ammonia is detected for the sonicatedlayers (Fig. 3b and c). Each response is characterised by a steep
Fig. 3 Response to ammonia gas of the SWCNT based sensor after differentsteps of the sonication process: sample not sonicated (a), after 300 (b), and 450 (c)sonication in an ultrasound bath.
This journal is ª The Royal Society of Chemistry 2013
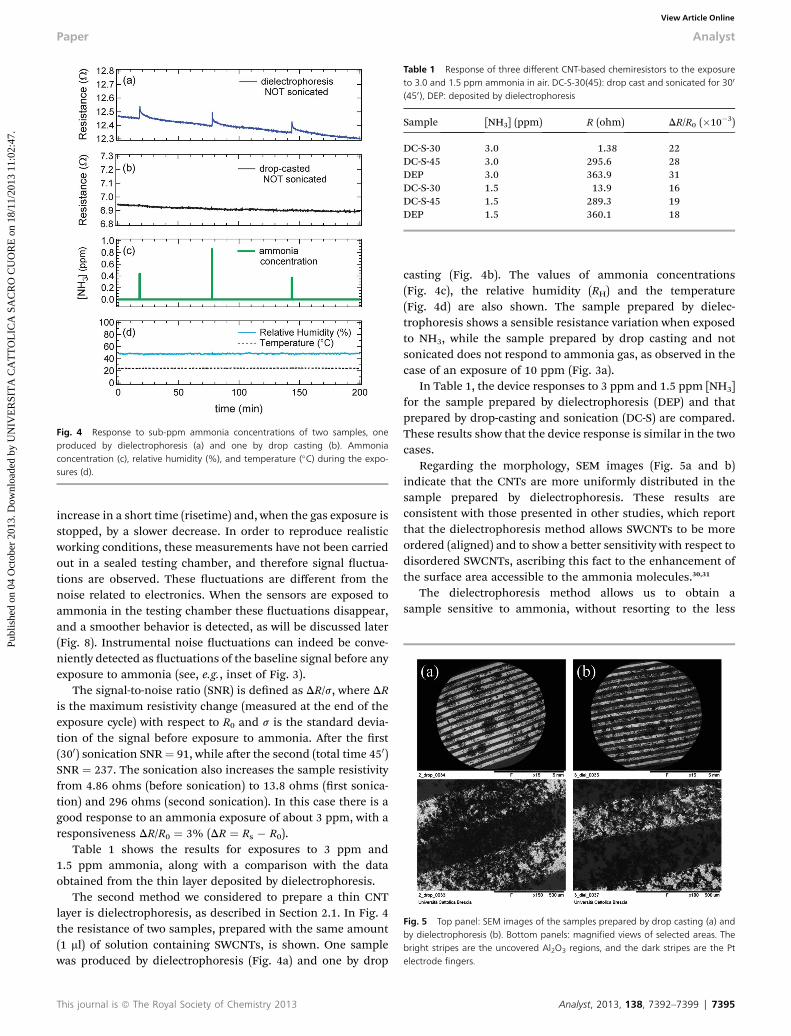
Fig. 4 Response to sub-ppm ammonia concentrations of two samples, oneproduced by dielectrophoresis (a) and one by drop casting (b). Ammoniaconcentration (c), relative humidity (%), and temperature (�C) during the expo-sures (d).
Table 1 Response of three different CNT-based chemiresistors to the exposureto 3.0 and 1.5 ppm ammonia in air. DC-S-30(45): drop cast and sonicated for 300
(450), DEP: deposited by dielectrophoresis
Sample [NH3] (ppm) R (ohm) DR/R0 (�10�3)
DC-S-30 3.0 1.38 22DC-S-45 3.0 295.6 28DEP 3.0 363.9 31DC-S-30 1.5 13.9 16DC-S-45 1.5 289.3 19DEP 1.5 360.1 18
Fig. 5 Top panel: SEM images of the samples prepared by drop casting (a) andby dielectrophoresis (b). Bottom panels: magnified views of selected areas. Thebright stripes are the uncovered Al2O3 regions, and the dark stripes are the Ptelectrode fingers.
Paper Analyst
Publ
ishe
d on
04
Oct
ober
201
3. D
ownl
oade
d by
UN
IVE
RSI
TA
CA
TT
OL
ICA
SA
CR
O C
UO
RE
on
18/1
1/20
13 1
1:02
:47.
View Article Online
increase in a short time (risetime) and, when the gas exposure isstopped, by a slower decrease. In order to reproduce realisticworking conditions, these measurements have not been carriedout in a sealed testing chamber, and therefore signal uctua-tions are observed. These uctuations are different from thenoise related to electronics. When the sensors are exposed toammonia in the testing chamber these uctuations disappear,and a smoother behavior is detected, as will be discussed later(Fig. 8). Instrumental noise uctuations can indeed be conve-niently detected as uctuations of the baseline signal before anyexposure to ammonia (see, e.g., inset of Fig. 3).
The signal-to-noise ratio (SNR) is dened as DR/s, where DRis the maximum resistivity change (measured at the end of theexposure cycle) with respect to R0 and s is the standard devia-tion of the signal before exposure to ammonia. Aer the rst(300) sonication SNR¼ 91, while aer the second (total time 450)SNR ¼ 237. The sonication also increases the sample resistivityfrom 4.86 ohms (before sonication) to 13.8 ohms (rst sonica-tion) and 296 ohms (second sonication). In this case there is agood response to an ammonia exposure of about 3 ppm, with aresponsiveness DR/R0 ¼ 3% (DR ¼ Rs � R0).
Table 1 shows the results for exposures to 3 ppm and1.5 ppm ammonia, along with a comparison with the dataobtained from the thin layer deposited by dielectrophoresis.
The second method we considered to prepare a thin CNTlayer is dielectrophoresis, as described in Section 2.1. In Fig. 4the resistance of two samples, prepared with the same amount(1 ml) of solution containing SWCNTs, is shown. One samplewas produced by dielectrophoresis (Fig. 4a) and one by drop
This journal is ª The Royal Society of Chemistry 2013
casting (Fig. 4b). The values of ammonia concentrations(Fig. 4c), the relative humidity (RH) and the temperature(Fig. 4d) are also shown. The sample prepared by dielec-trophoresis shows a sensible resistance variation when exposedto NH3, while the sample prepared by drop casting and notsonicated does not respond to ammonia gas, as observed in thecase of an exposure of 10 ppm (Fig. 3a).
In Table 1, the device responses to 3 ppm and 1.5 ppm [NH3]for the sample prepared by dielectrophoresis (DEP) and thatprepared by drop-casting and sonication (DC-S) are compared.These results show that the device response is similar in the twocases.
Regarding the morphology, SEM images (Fig. 5a and b)indicate that the CNTs are more uniformly distributed in thesample prepared by dielectrophoresis. These results areconsistent with those presented in other studies, which reportthat the dielectrophoresis method allows SWCNTs to be moreordered (aligned) and to show a better sensitivity with respect todisordered SWCNTs, ascribing this fact to the enhancement ofthe surface area accessible to the ammonia molecules.30,31
The dielectrophoresis method allows us to obtain asample sensitive to ammonia, without resorting to the less
Analyst, 2013, 138, 7392–7399 | 7395
Analyst Paper
Publ
ishe
d on
04
Oct
ober
201
3. D
ownl
oade
d by
UN
IVE
RSI
TA
CA
TT
OL
ICA
SA
CR
O C
UO
RE
on
18/1
1/20
13 1
1:02
:47.
View Article Online
reproducible sonication process. However, the R0 value issimilar for both samples and the sensitivities of the two samplesto the same analyte concentration are comparable. Bothmethods have the nal goal of making the CNT bundle distri-bution more uniform. In the case of sonication, fragments ofbundles loosely attached to the substrate are likely to detach,leaving on the sample only the fragments with a rm contactand therefore allowing better draining of the injected carriersthrough the electrodes. This can explain the lack of responseobserved in the sample prepared by drop-casting and notsonicated. The dielectrophoresis method has shown to yieldmore uniformly distributed bundles, avoiding the formation oftoo large, loosely bound, aggregates during the depositionstage. The transport mechanism within each bundle is thenassumed to be regulated by percolation mechanisms, as dis-cussed by Battie et al.32
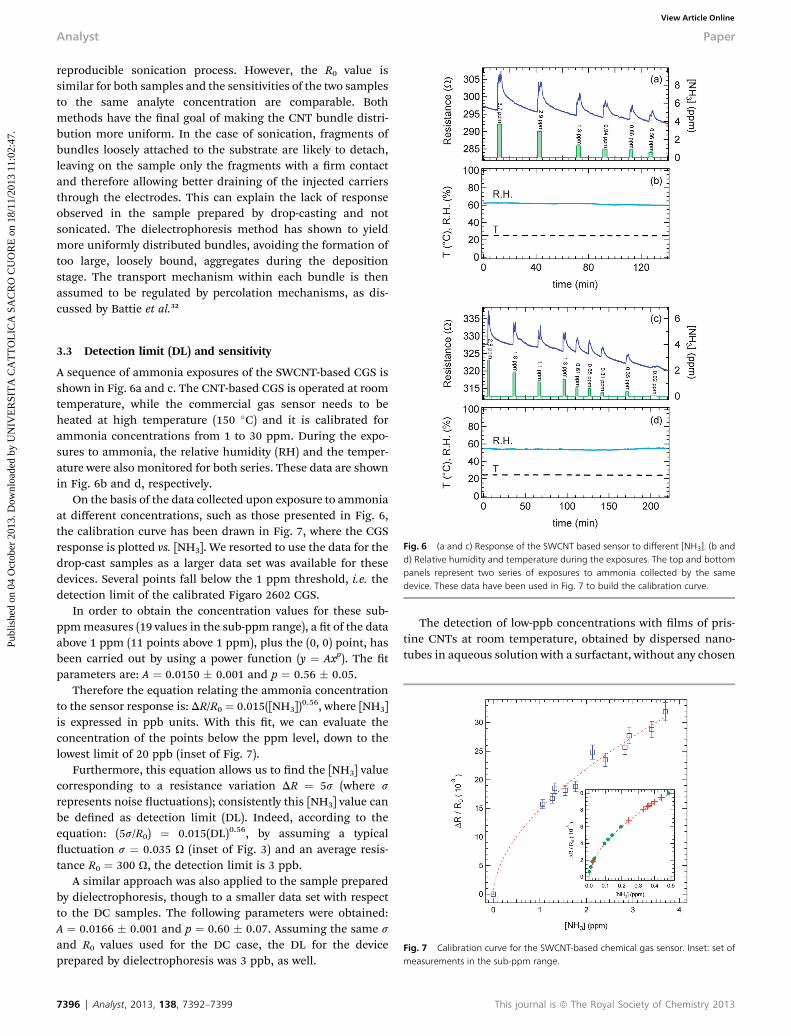
Fig. 6 (a and c) Response of the SWCNT based sensor to different [NH3]. (b andd) Relative humidity and temperature during the exposures. The top and bottompanels represent two series of exposures to ammonia collected by the samedevice. These data have been used in Fig. 7 to build the calibration curve.
Fig. 7 Calibration curve for the SWCNT-based chemical gas sensor. Inset: set ofmeasurements in the sub-ppm range.
3.3 Detection limit (DL) and sensitivity
A sequence of ammonia exposures of the SWCNT-based CGS isshown in Fig. 6a and c. The CNT-based CGS is operated at roomtemperature, while the commercial gas sensor needs to beheated at high temperature (150 �C) and it is calibrated forammonia concentrations from 1 to 30 ppm. During the expo-sures to ammonia, the relative humidity (RH) and the temper-ature were also monitored for both series. These data are shownin Fig. 6b and d, respectively.
On the basis of the data collected upon exposure to ammoniaat different concentrations, such as those presented in Fig. 6,the calibration curve has been drawn in Fig. 7, where the CGSresponse is plotted vs. [NH3]. We resorted to use the data for thedrop-cast samples as a larger data set was available for thesedevices. Several points fall below the 1 ppm threshold, i.e. thedetection limit of the calibrated Figaro 2602 CGS.
In order to obtain the concentration values for these sub-ppmmeasures (19 values in the sub-ppm range), a t of the dataabove 1 ppm (11 points above 1 ppm), plus the (0, 0) point, hasbeen carried out by using a power function (y ¼ Axp). The tparameters are: A ¼ 0.0150 � 0.001 and p ¼ 0.56 � 0.05.
Therefore the equation relating the ammonia concentrationto the sensor response is: DR/R0 ¼ 0.015([NH3])
0.56, where [NH3]is expressed in ppb units. With this t, we can evaluate theconcentration of the points below the ppm level, down to thelowest limit of 20 ppb (inset of Fig. 7).
Furthermore, this equation allows us to nd the [NH3] valuecorresponding to a resistance variation DR ¼ 5s (where s
represents noise uctuations); consistently this [NH3] value canbe dened as detection limit (DL). Indeed, according to theequation: (5s/R0) ¼ 0.015(DL)0.56, by assuming a typicaluctuation s ¼ 0.035 U (inset of Fig. 3) and an average resis-tance R0 ¼ 300 U, the detection limit is 3 ppb.
A similar approach was also applied to the sample preparedby dielectrophoresis, though to a smaller data set with respectto the DC samples. The following parameters were obtained:A ¼ 0.0166 � 0.001 and p ¼ 0.60 � 0.07. Assuming the same s
and R0 values used for the DC case, the DL for the deviceprepared by dielectrophoresis was 3 ppb, as well.
7396 | Analyst, 2013, 138, 7392–7399
The detection of low-ppb concentrations with lms of pris-tine CNTs at room temperature, obtained by dispersed nano-tubes in aqueous solution with a surfactant, without any chosen
This journal is ª The Royal Society of Chemistry 2013
Paper Analyst
Publ
ishe
d on
04
Oct
ober
201
3. D
ownl
oade
d by
UN
IVE
RSI
TA
CA
TT
OL
ICA
SA
CR
O C
UO
RE
on
18/1
1/20
13 1
1:02
:47.
View Article Online
functionalization is a remarkable forward step in the explora-tion of detection limits of CNT-based sensors. So far, pptsensitivity has been demonstrated in an inert atmosphereunder UV irradiation.33 The present study was carried out in thelab environment, i.e. not inside a testing chamber, which ismuch closer to the nal destination of the CNTs sensors. As forthe sub-ppm detection limit, a detection of 50 ppb ammoniadiluted in Ar has been reported for CNTs functionalized withpolyaniline,34 while a DL ¼ 200 ppb ammonia in dry air wasachieved with Pt-decorated CNTs operating at 200 �C.35 To thebest of our knowledge, the present results represent the lowestammonia concentration so far attained in air with pristineCNTs. This also shows that, starting from samples preparedaccording to the procedures described in this study, lowerdetection limits can be expected by further doping or func-tionalization of the CNTs.
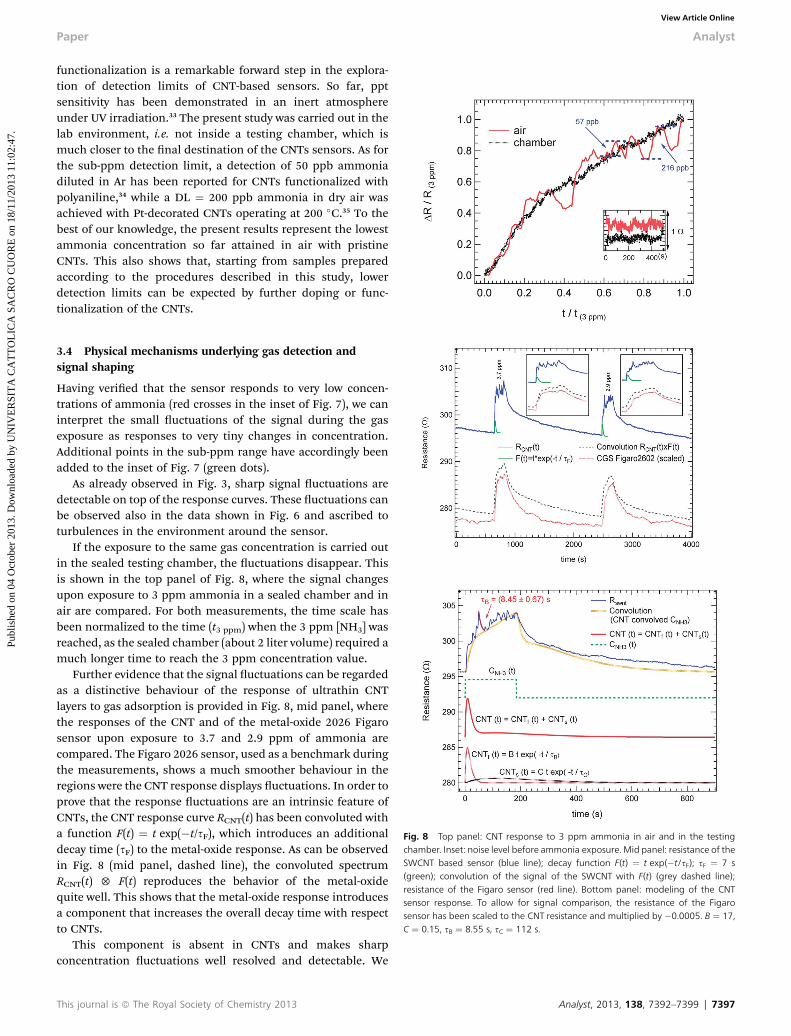
Fig. 8 Top panel: CNT response to 3 ppm ammonia in air and in the testingchamber. Inset: noise level before ammonia exposure. Mid panel: resistance of theSWCNT based sensor (blue line); decay function F(t) ¼ t exp(�t/sF); sF ¼ 7 s(green); convolution of the signal of the SWCNT with F(t) (grey dashed line);resistance of the Figaro sensor (red line). Bottom panel: modeling of the CNTsensor response. To allow for signal comparison, the resistance of the Figarosensor has been scaled to the CNT resistance and multiplied by �0.0005. B ¼ 17,C ¼ 0.15, sB ¼ 8.55 s, sC ¼ 112 s.
3.4 Physical mechanisms underlying gas detection andsignal shaping
Having veried that the sensor responds to very low concen-trations of ammonia (red crosses in the inset of Fig. 7), we caninterpret the small uctuations of the signal during the gasexposure as responses to very tiny changes in concentration.Additional points in the sub-ppm range have accordingly beenadded to the inset of Fig. 7 (green dots).
As already observed in Fig. 3, sharp signal uctuations aredetectable on top of the response curves. These uctuations canbe observed also in the data shown in Fig. 6 and ascribed toturbulences in the environment around the sensor.
If the exposure to the same gas concentration is carried outin the sealed testing chamber, the uctuations disappear. Thisis shown in the top panel of Fig. 8, where the signal changesupon exposure to 3 ppm ammonia in a sealed chamber and inair are compared. For both measurements, the time scale hasbeen normalized to the time (t3 ppm) when the 3 ppm [NH3] wasreached, as the sealed chamber (about 2 liter volume) required amuch longer time to reach the 3 ppm concentration value.
Further evidence that the signal uctuations can be regardedas a distinctive behaviour of the response of ultrathin CNTlayers to gas adsorption is provided in Fig. 8, mid panel, wherethe responses of the CNT and of the metal-oxide 2026 Figarosensor upon exposure to 3.7 and 2.9 ppm of ammonia arecompared. The Figaro 2026 sensor, used as a benchmark duringthe measurements, shows a much smoother behaviour in theregions were the CNT response displays uctuations. In order toprove that the response uctuations are an intrinsic feature ofCNTs, the CNT response curve RCNT(t) has been convoluted witha function F(t) ¼ t exp(�t/sF), which introduces an additionaldecay time (sF) to the metal-oxide response. As can be observedin Fig. 8 (mid panel, dashed line), the convoluted spectrumRCNT(t) 5 F(t) reproduces the behavior of the metal-oxidequite well. This shows that the metal-oxide response introducesa component that increases the overall decay time with respectto CNTs.
This component is absent in CNTs and makes sharpconcentration uctuations well resolved and detectable. We
This journal is ª The Royal Society of Chemistry 2013 Analyst, 2013, 138, 7392–7399 | 7397
Analyst Paper
Publ
ishe
d on
04
Oct
ober
201
3. D
ownl
oade
d by
UN
IVE
RSI
TA
CA
TT
OL
ICA
SA
CR
O C
UO
RE
on
18/1
1/20
13 1
1:02
:47.
View Article Online
ascribe the effect introduced through the F(t) to the differentcharge carrier path to the electrodes in the two cases. While forCNTs the charge transfer to the electrodes is allowed by the thinCNT layer, suitably treated using either sonication or dielec-trophoresis methods, in the metal-oxide sensor the inter-graincharge transfer before reaching the electrodes may alter theresponse time, introducing capacitive effects at the grainborder. The typical resistivity variations DR for the uctuationsof the CNT signal correspond to concentrations in the 15–150ppb range, matching the lowest value here detected uponammonia exposure (20 ppb, Fig. 6). As an example, in Fig. 8, toppanel, the ammonia concentration values (57 ppb and 216 ppb)related to a couple of signal uctuations are also indicated.
The signal uctuations observed in the CNT response toammonia exposure are ascribed to a fast recovery time allowingfor the detection of small concentrations in the ppb range.These signal uctuations on top of the response curve also havetheir own characteristic time for signal rise and decay. Bypicking up several of these uctuations we have estimated theaverage decay time by exponential tting (one of these tting isshown in Fig. 8, bottom panel) which was 8.55 � 0.17 seconds.With this information, we can also model the response of theCNT sensor to a constant analyte exposure with a function likeCNT(t) ¼ CNTf(t) + CNTs(t) ¼ Bt exp(�t/sB) + Ct exp(�t/sC). Therst part (CNTf(t)) accounts for a quick decay of the signal, whilethe second part is added to account for much slower decayprocesses, and aims to model the slow recovery of the signalaer gas exposure at room temperature.
Through a convolution of this function with the rectangularfunction CNH3
(t) accounting for ammonia exposure, the overallfeatures of the CNT response have been reproduced, as shownin Fig. 8, bottom panel, where the thick line is the result of theconvolution CNT(t) 5 CNH3
(t). This line approximates well therising of the signal over the exposure time and the slow decay torecover the initial resistance R0. Deviations with respect to theinitial R0 value can be ascribed to a partial modelling of the slowdesorption processes, which are related either to chemisorp-tions or trapping of the molecules within the CNT bundles.
Indeed, the presence of an apparently irreversible behaviorin the response of the CNT to gas exposure has been discussedin detail by Strano et al.36 Based on the present results as well ason the discussion proposed in the literature, we rationalize ourndings as follows. Upon exposure to a polluting gas (hereammonia) the leading edge of the signal is provided by aconvolution of a fast-response with the concentration prole.The fast response time is extracted from the signal uctuationsthat are detected on top of a monotonically rising signal. Anadditional slow-response contribution is also present anddetectable during the signal attenuation. The differencebetween the fast and the slow signal could be ascribed todifferent paths of the injected charge from the CNT surface tothe electrodes, the fast signal being related to the CNT con-tacting the electrodes, and the slow signal to transport inbundled CNTs before reaching the electrode. A signature ofirreversible interactions, on the time scale of the presentmeasurements, is nally ascribed to the partial recovery of theoverall signal on a typical time scale of 103 seconds.
7398 | Analyst, 2013, 138, 7392–7399
3.5 Potential applications
The present results indicate many applications in the eld ofenvironmental monitoring, including medical applications,where a specic low-ppb sensitivity is required.15 Furthermore,prospective applications in diffusemonitoring can be envisageddue to the low cost that allows for the implementation ofmonitoring grids.
If properly developed, the CNT-based CGS could represent avalid alternative to the measurement techniques so far devel-oped for both concentration and ux measurements (active andpassive measurements based on chemical or spectrometricprinciples of measurement). Passive measurements are basedon the diffusion (according to Fick's law) of an atmospheric gasthrough a diffusive medium that contains a substance thatreacts with ammonia (see, e.g., ref. 37). The signicant advan-tage of this monitoring approach is the relatively low cost of thesample analyses which allows us to develop a relatively densemonitoring grid. The main disadvantage is the concentrationreadout, which typically occurs once in a week. In turn, severalanalyzers with hourly data acquisition frequency and even lessthan 1 ppb of resolution are available nowadays.38–41 However,these analyzers have a relatively high cost that should makethem unsuitable for a very dense monitoring grid.
In addition to low-cost, the CNT-based CGS could feature (i)low energy consumption, as CNTs can operate at environmentaltemperature and do not need devices such as aspiration pumpsand ventilation systems, showing a reduced environmentalimpact with respect to traditional monitoring technologies,even considering the low quantities of (environmentallyfriendly) materials involved; (ii) the elimination of off-linechemical analysis.
4. Conclusions
By revealing a fast dynamics channel, so far virtually neglected,in the gas desorption process, we have been able to push thedetection limit of a CNT-based CGS down to 3 ppb. This resultwas obtained on SWCNT bundle layers carefully prepared andselected by dielectrophoresis-assisted deposition or by sonica-tion of layers deposited by drop casting. We ascribe theenhanced sensitivity to the removal of loose agglomerates withpoor electrical contacts and to more efficient transport ofcarriers, transferred to the CNT bundles upon interaction withthe reducing NH3 molecules, from the topmost SWCNTs to theunderlying electrodes. These facts allowed us to track the fastdynamics processes, otherwise missed in conventional oxide-based nanostructured gas sensors, where the grain boundariesbetween nanoparticles are thought to introduce a capacitivecomponent in the response that can average out the response toquick transients of the analyte concentration.
In perspective, this result makes the CNT-based CGS quiteinteresting to produce low cost, high sensitivity, chemiresistorgas sensors for environmental monitoring of sub-ppm ammoniaconcentrations. The low-cost is required for the implementationof dense grids that can provide a consistent mapping of thepolluting gas distribution over a determined area, operating in a
This journal is ª The Royal Society of Chemistry 2013
Paper Analyst
Publ
ishe
d on
04
Oct
ober
201
3. D
ownl
oade
d by
UN
IVE
RSI
TA
CA
TT
OL
ICA
SA
CR
O C
UO
RE
on
18/1
1/20
13 1
1:02
:47.
View Article Online
continuous mode. The high sensitivity is required for a realisticmonitoring of environmental pollution, which oen spans thesub-ppm range rather than the much better known 1–1000 ppmtesting range of most chemiresistor gas sensors.
Acknowledgements
A.G. would like to thank the European projects COST ACTIONEuNetAir (no. TD1105). L.S. acknowledges M. Chiesa and G.Gerosa for helpful discussions on ammonia monitoringsystems and related environmental problems.
Notes and references
1 S. Iijima, Nature, 1991, 354, 56.2 P. G. Collins, K. Bradley, M. Ishigami and A. Zettl, Science,2000, 287, 1801.
3 A. Goldoni, L. Petaccia, L. Gregoratti, B. Kaulich, A. Barinov,S. Lizzit, A. Laurita, L. Sangaletti and R. Larciprete, Carbon,2004, 42, 2099.
4 S. Chopra, K. McGuire, N. Gothard, A. M. Rao and A. Pham,Appl. Phys. Lett., 2003, 83, 2280.
5 T. Someya, J. Small, P. Kim, C. Nuckolls and J. T. Yardley,Nano Lett., 2003, 3, 877.
6 J. Li, Y. Lu, Q. Ye, M. Cinke, J. Han and M. Meyyappan, NanoLett., 2003, 3, 929.
7 J. P. Novak, E. S. Snow, E. J. Houser, D. Park, J. L. Stepnowskiand R. A. McGill, Appl. Phys. Lett., 2003, 83, 4026.
8 F. Picaud, C. Girardet and A. M. Rao, J. Appl. Phys., 2009, 105,014315.
9 P. Vichchulada, P. Q. Zhang and M. D. Lay, Analyst, 2007,132, 719.
10 D. R. Kauffman and A. Star, Angew. Chem., 2008, 47, 6550.11 M. Penza, R. Rossi, M. Alvisi, M. A. Signore and E. Serra,
J. Phys. D: Appl. Phys., 2009, 42, 072002.12 T. Zhang, S. Mubeen, N. V. Myung and M. A. Deshusses,
Nanotechnology, 2008, 19, 332001.13 A. Goldoni, L. Petaccia, S. Lizzit and R. Larciprete, J. Phys.:
Condens. Matter, 2010, 22, 013001.14 M. Penza, R. Rossi, M. Alvisi and E. Serra, Nanotechnology,
2010, 21, 105501.15 B. Timmer, W. Olthuis and A. van den Berg, Sens. Actuators,
B, 2005, 107, 666.16 A. H. W. Beusen, A. F. Bouwman, P. S. C. Heuberger, G. Van
Drecht and K. W. Van Der Hoek, Atmos. Environ., 2008, 42,6067.
17 V. P. Aneja, W. H. Schlesinger and J. W. Erisman, Nat.Geosci., 2008, 1, 409.
18 M. A. Sutton, J. W. Erisman, F. Dentener and D. Moeller,Environ. Pollut., 2008, 156, 583.
19 J. W. Erisman, A. Bleeker, J. Galloway and M. A. Sutton,Environ. Pollut., 2007, 150, 140.
This journal is ª The Royal Society of Chemistry 2013
20 G. M. Marcazzan, S. Vaccaro, G. Valli and R. Vecchi, Atmos.Environ., 2001, 35, 4639.
21 G. M. Marcazzan, M. Ceriani, G. Valli and R. Vecchi, Sci.Total Environ., 2003, 317, 137.
22 B. H. Baek, V. P. Aneya and Q. Tong, Environ. Pollut., 2004,129, 89.
23 A. Charron, R. M. Harrison and P. Quincey, Atmos. Environ.,2007, 41, 1960.
24 M. Chiesa, F. Rigoni, M. Paderno, P. Borghetti, G. Gagliotti,M. Bertoni, A. Ballarin Denti, L. Schiavina, A. Goldoni andL. Sangaletti, J. Environ. Monit., 2012, 14, 1565.
25 G. Jimenez-Cadena, J. Riu and F.-X. Rius, Analyst, 2007, 132,1083.
26 J. Suehiro, G. Zhou and M. Hara, J. Phys. D: Appl. Phys., 2003,36, L109.
27 M. S. Dresselhaus, G. Dresselhaus, R. Saito and A. Jorio,Phys. Rep., 2005, 409, 47.
28 M. Milnera, J. Kurti, M. Hulman and H. Kuzmany, Phys. Rev.Lett., 2000, 84, 1324.
29 R. Krupke, F. Hennrich, H. v. Lohneysen and M. M. Kappes,Science, 2003, 301, 344.
30 M. Lucci, P. Regoliosi, A. Reale, A. Di Carlo, S. Orlanducci,E. Tamburri, M. L. Terranova, P. Lugli, C. Di Natale,A. D'Amico and R. Paolesse, Sens. Actuators, B, 2005, 111–112, 181.
31 M. L. Terranova, M. Lucci, S. Orlanducci, E. Tamburri,V. Sessa, A. Reale and A. Di Carlo, J. Phys.: Condens. Matter,2007, 19, 225004.
32 Y. Battie, L. Gorintin, O. Ducloux, P. Thobois, P. Bondavalli,G. Feugnet and A. Loiseau, Analyst, 2012, 137, 2151.
33 G. Chen, T. M. Paronyan, E. M. Pigas and A. R. Harutyunyan,Sci. Rep., 2012, 2, 343.
34 T. Zhang, M. B. Nix, B. Y. Yoo, M. A. Deshusses andN. V. Myung, Electroanalysis, 2006, 18, 1153.
35 M. Penza, R. Rossi, M. Alvisi, G. Cassano, M. A. Signore,E. Serra and R. Giorgi, Sens. Actuators, B, 2008, 135, 289.
36 C. Y. Lee and M. S. Strano, Langmuir, 2005, 21, 5192.37 M. A. Sutton, B. Miners, Y. S. Tang, C. Milford, G. P. Wyers,
J. H. Duyzer and D. Fowler, J. Environ. Monit., 2001, 3,446.
38 A. Pogany, A. Mohacsi, S. K. Jones, E. Nemitz, A. Varga,Z. Bozoki, Z. Galbacs, T. Weidinger, L. Horvath andG. Szabo, Atmos. Environ., 2010, 44, 1490.
39 M. M. Twigg, E. House, R. Thomasa, J. Whitehead,G. J. Phillips, D. Famulari, D. Fowler, M. W. Gallagher,J. N. Cape, M. A. Sutton and E. Nemitz, Agricultural andForest Meteorology, 2011, 151, 1488.
40 M. Norman, C. Spirig, V. Wolff, I. Trebs, C. Flechard,A. Wisthaler, R. Schnitzhofer, A. Hansel and A. Neel,Atmos. Chem. Phys., 2009, 9, 2635.
41 J. Hodgkinson and R. P. Tatam,Meas. Sci. Technol., 2013, 24,012004.
Analyst, 2013, 138, 7392–7399 | 7399
Copyright © 2022 FDOKUMEN