ENHANCING BUSINESS OPPORTUNITY IDENTIFICATION PROCESSES IN ZIMBABWE'S MANUFACTURING SECTOR: THE CASE...
23
ENHANCING BUSINESS OPPORTUNITY IDENTIFICATION PROCESSES IN ZIMBABWE’S MANUFACTURING SECTOR: THE CASE OF BULAWAYO’S MANUFACTURING SECTOR Samuel M. Gumbe* Isaac Chaneta** ABSTRACT The manufacturing sector in Zimbabwe plays a critical role in the economic development of the country like employment creation, contributing to the country’s GDP and saving and generating foreign exchange. It is for this reason the Government of Zimbabwe (GoZ) has crafted a number of programmes aimed at rejuvenating it since it started to decline in the late 1980s.However the programmes seem to have benefitted foreign competitors as the sector experienced further decline resulting in the country becoming a net importer, capacity utilisation in the sector declining and unemployment rising as firms closed shop. This study sought to establish why the sector is failing to identify opportunities that are presented in the government initiated programmes thereby allowing foreign competition to benefit at their expense. The study sought responses from top managers of the sampled 68 manufactures from Bulawayo. The sample was drawn from the 16 sub-sectors that constitute the Zimbabwe’s manufacturing sector. Study findings reveal that the sampled firms have weaknesses in the way the scan the environment. The study is concluded by proffering relevant recommendations. Key words: Environmental scanning; economic development; agricultural sector; manufacturing sector; opportunities. *Faculty of Commerce, University of Zimbabwe ** Faculty of Commerce, University of Zimbabwe
Transcript of ENHANCING BUSINESS OPPORTUNITY IDENTIFICATION PROCESSES IN ZIMBABWE'S MANUFACTURING SECTOR: THE CASE...
�������������������� ���������� ����������������������������������
�������������������� ������������������������
�������������������� ���
ENHANCING BUSINESS OPPORTUNITY
IDENTIFICATION PROCESSES IN ZIMBABWE’S
MANUFACTURING SECTOR: THE CASE OF
BULAWAYO’S MANUFACTURING SECTOR
Samuel M. Gumbe*
Isaac Chaneta**
ABSTRACT
The manufacturing sector in Zimbabwe plays a critical role in the economic development
of the country like employment creation, contributing to the country’s GDP and saving
and generating foreign exchange. It is for this reason the Government of Zimbabwe
(GoZ) has crafted a number of programmes aimed at rejuvenating it since it started to
decline in the late 1980s.However the programmes seem to have benefitted foreign
competitors as the sector experienced further decline resulting in the country becoming a
net importer, capacity utilisation in the sector declining and unemployment rising as
firms closed shop. This study sought to establish why the sector is failing to identify
opportunities that are presented in the government initiated programmes thereby allowing
foreign competition to benefit at their expense. The study sought responses from top
managers of the sampled 68 manufactures from Bulawayo. The sample was drawn from
the 16 sub-sectors that constitute the Zimbabwe’s manufacturing sector. Study findings
reveal that the sampled firms have weaknesses in the way the scan the environment. The
study is concluded by proffering relevant recommendations.
Key words: Environmental scanning; economic development; agricultural sector;
manufacturing sector; opportunities.
*Faculty of Commerce, University of Zimbabwe
** Faculty of Commerce, University of Zimbabwe
�������������������� ���������� ����������������������������������
�������������������� ������������������������
�������������������� ���
Introduction
Morris, Kuratko and Covin (2008) acknowledge that the business environment in the
21stcentury has been characterized by a high turbulence mainly driven by rapid
technological improvements. These improvements have seen customer tastes rapidly
changing in any given period of time; markets being fragmented and competition in
industries intensifying as firms jockey for market share and preference from suppliers of
both inputs and labour. Morris, Kuratko and Covin (ibid) argue that survival and growth
in this era is based on the firms’ and their managers’ ability to develop competitive
advantage based on their ability to adapt to change, rather than acquisitions and mergers
as was previously the trend. The authors identified five key capabilities namely:
• adaptability;
• flexibility;
• speed;
• aggression; and
• innovation.
This argument implies that firms’ survival and growth has to be through internal
initiatives or organic means through innovation. Sarkar, Echambadi and Harrison (2001 p
702) argue that only firms that are pro-active are the ones that will be able to develop the
above mentioned capabilities. Sarkar, Echambadi and Harrison (ibid) assert that the
proactive approach considers that individuals and organisations shape their environments
through their actions. Miller and Friesen (1978 p 923) posit that pro-activeness is
achieved through scanning the environment to seek opportunities and taking pre-emptive
action against the identified opportunities.
Prior to the year 1990 Zimbabwe’s manufacturing sector played a critical role in
contributing to the economy’s Gross Domestic Product (GDP) and export earnings. The
sector contributed an average of 23,3percent during the period 1980-1989, (Mlambo
1997). However by the end of the 1980s, the manufacturing sector was under strain as

�������������������� ���������� ����������������������������������
�������������������� ������������������������
�������������������� ���
evidenced by a decline of its contribution to GDP to 20,5percent from the previously
mentioned 23,3percent (Mlambo ibid and UNDP Zimbabwe, 2010).
Hawkins and Ndhlela (2009) and UNDP Zimbabwe (2010) attribute this decline to
shortages of foreign currency as the manufacturing sector was not exporting enough to
generate foreign currency that could be used to import inputs for the sector. UNDP
Zimbabwe, (ibid) also cites investor uncertainty, due to the GoZ’s socialist rhetoric, and
an overvalued Zimbabwe dollar which made the country’s exports uncompetitive, as the
causes of the poor performance of the manufacturing sector. Hawkins and Ndhlela (2009)
and UNDP Zimbabwe (2008) also argue that the Zimbabwean manufacturers had lost
their ability to compete internationally after 15 years of isolation and protection during
the UDI era and that they were also to some extent reluctant, to export as they could
make profit on the domestic market where they were protected from imports through a
punitive tariff regime which was only second to India in the world.
Mlambo (ibid) also adds a political dimension to the reasons for the manufacturing
sector’s decline in performance at the end of the 1980’s. He argues that Zimbabwe also
faced destabilisation from the then apartheid regime in South Africa and RENAMO in
Mozambique which hindered its trade. He further argues that the domestic market’s
disposable income was shrinking in real terms due to rising inflation which rose from
8,6percent in 1980 to 17,9percent in 1983.
These developments left the GoZ with no option but to adopt the IMF initiated Economic
Structural Adjustment Programme (ESAP) in 1991 as a way of rejuvenating the economy
(Hawkins and Ndhlela, 2009).
It is against this background that this study seeks to assess if the methods used by
Bulawayo manufacturers are effective to render the manufacturers as pro-active.
Background to the Study

�������������������� ���������� ����������������������������������
�������������������� ������������������������
�������������������� ���
ESAP was envisaged to last only five years after which the economy was expected to
grow to prosperity and the manufacturing sector was expected to expand rapidly and
create more job opportunities (Mlambo 2000 p 110).
According to UNDP Zimbabwe (2010) and Hawkins and Ndhlela (2009) ESAP sought to
achieve an economic rejuvenation by implementing the following:
• dismantling import controls through removal of tariffs and
• liberalising (opening up) the economy to allow foreign investment and
competition.
The authors agree that the programme was a failure and it marked the demise of the
manufacturing sector. The reasons proffered for the poor performance of ESAP by all the
cited authors are the 1991/92 and 1994/95 droughts, the dismantling of the tariff regime
and the liberalisation (opening up of the economy to foreign competition)
The droughts had a negative impact on agriculture upon which the manufacturing sector
depended for inputs and foreign exchange. Riddel (1990) posits that Zimbabwe’s
manufacturing and agricultural sectors are heavily interdependence that by 1980,
agriculture accounted for 60percent of the inputs used in manufacturing, while agriculture
consumed 44percent of the manufacturing sector’s output.
Dismantling of import tariffs and liberalisation of the economy is also cited as the cause
of ESAP’s failure (Hawkins and Ndhlela 2009). The extent of ESAP’s failure is reflected
in the First Merchant Bank’s (FMB, 1993) annual report which states that the
manufacturing sector’s output fell by 19,8percent in 1993, with the hardest hit sub-sectors
being transport equipment, -36percent; textiles and ginning, -26,6percent; petroleum and
chemicals, -24,4percent and lastly the foodstuffs, -11, 1percent.
On the other hand, the national statistics indicate that by June 1993, 11percent of the
working population was employed in the formal sector, the lowest level since 1970. The
highest casualty of the effects of ESAP and the drought were the textiles sector which
saw a decline of firms by 1994 from 280 to193, with one firm (Cone Textiles),
employing 6000 employees closing down (ZIMPREST, 1997).
�������������������� ���������� ����������������������������������
�������������������� ������������������������
�������������������� ���
After such a dismal performance, the GoZ was left with no option but to abandon ESAP
in 1996 and adopted Zimbabwe Programme for Economic and Social Transformation
(ZIMPREST). The programme sought to redress the ills that had been created by ESAP.
The programme was also supported by the revised industrial policy document which
placed high emphasis on indigenisation through the promotion of Small to Medium Scale
Enterprises, SMEs (UNDP 2010). However ZIMPREST also failed due to two main
reasons (Raftopoulos 2009).
The author posits that the year 2000 saw two developments that were to have a negative
impact on Zimbabwe’s economy in general and the manufacturing sector specifically.
These were the birth of Zimbabwe’s strongest opposition party since 1980, the
Movement for Democratic Change (MDC) and the Fast Track Land Redistribution
Programme (FTLRP) respectively.
Raftopoulos (ibid) contends that the GoZ suspected the commercial farmers (the majority
of whom were white) of financially supporting the MDC hence adopted the FTLRP,
which at times was violent, settling black people on previously white owned commercial
farms, thus cutting off the MDC’s umbilical cord.
The effect of this was a decline in agricultural output which in turn starved the
manufacturing sector of inputs. Riddel (1990) argues that by 1980, Zimbabwe’s
agricultural sector supplied 60 percent of manufacturing sector inputs and that 95 percent
of these were sourced from the commercial farms. Such a dependence on commercial
farms therefore meant that disturbances on the commercial farms would have serious
consequences on the manufacturing sector.
The farm invasions were also accompanied by parliamentary elections in 2000 and 2005
and presidential elections in 2002. The results of these elections were heavily disputed
resulting in the country being isolated by the international community (Besada and
Moyo, 2008). The World Bank had in October 2000 announced that it would not extend
loans to Zimbabwe (ibid). These developments left the Zimbabwean manufacturing

�������������������� ���������� ����������������������������������
�������������������� ������������������������
�������������������� ���
sector with no sources of the needed foreign currency with which to import inputs. These
developments left the manufacturing sector in a decline, which resulted in serious food
shortages, cost-push and demand-pull induced inflation as cost of inputs rose due to
scarcity, while on the other hand shortages of products on the market raised prices. The
Zimbabwean economy then fell into a period of hyperinflation, which was last officially
recorded at 231 million percent in July 2008(Besada and Moyo, 2008), characterized by
“brain drain” of skilled personnel to neighboring countries, United Kingdom, Australia
and Canada (World Bank, 2008), low agricultural and manufacturing industry output, and
other related shortages (RBZ 2006).
These developments drastically affected the agricultural sector and subsequently the
manufacturing sector as shown by Table1.1 and Table 1.2 on the next page:
Table 1.1 Maize, Wheat and Soya bean Production Trends from 1999 to 2008
Maize Wheat Soya bean
Year Area Output (t)
Yield (kg/ha
Area Output (t)
Yield (kg/ha
Area Output (t) Yield (kg/ha
1999 1 477 990
1 606 588
1 087 47 438 260 909 5 500 52 931 120 685 2 280
2000 1 373 117
1 619 651
1 180 42 551 229 775 5 400 60 650 135 417 2 233
2001 1 239 988
1 526 328
1 231 37 269 197 526 5 300 64 009 140 793 2 200
2002 1 327 854
604 758 455 39 000 195 000 5 000 51 282 84 441 1 647
2003 1 352 368
1 058 786
783 40 809 122 427 3 000 25 390 41 197 1 623
2004 1 493 810
1 686 151
1 129 70 585 247 048 3 500 49 572 85 827 1 731
2005 1 729 867
915 366 529 65 454 229 089 3 500 41 871 56 730 1 355
2006 1 712 999
1 484 839
867 67 201 241 924 3 600 47 137 70 273 1 491
2007 1 445 800
952 600 659 60 000 180 000 3 000 69 900 112 300 1 607
2008 1 724 844
435 160 250 51 000 132 600 2 600 72 311 48 320 670
Source: Ministry of Agriculture, Mechanisation and Irrigation Development (2009).

�������������������� ���������� ����������������������������������
�������������������� ������������������������
�������������������� ���
Table 1.2 Decline in manufacturing output
2004 2005 2006 2007
Output (Zim$ 000) 6 500 000 5 100 000 4 000 000 3 800 000
% Decline - 21 17 5
Source: CZI, 2009
Faced with hyperinflation, the GoZ in August 2006 directed that prices be reversed to
June 2006 levels as it attempted to contain pressure from consumers who could not cope
with the hyperinflation (Makochekanwa, 2007). This directive put a further strain on the
manufacturing sector resulting in its further decline. The Zimbabwe Industrial
Development Policy (ZIDP) 2011-2015 (Ministry of Industry and Commerce, 2012) says
that between 2006 and 2008 the manufacturing sector declined by a total of 73,3 percent,
capacity utilisation fell to 5 percent in 2008 and manufacturing sector’s contribution to
GDP fell from a peak of 23 percent in the 1990’s to 12 percent in 2008.
Other measures introduced to improve manufacturing sector performance
In 1997 the GoZ introduced the Export Processing Zones (EPZs) whose main objective
was to stimulate and promote the country’s exports and create employment (UNDP,
2010). However, the performance of the EPZ was not satisfactory and the issuing of
licenses to applicants was stopped in November 2006, UNDP (ibid).
In 2003 the GoZ faced a shrinking manufacturing base of an annual decline of 20 percent
(CZI, 2009), high unemployment levels formal employment shrinking from 1,4 million in
1998 to 998000 in 2004 (Raftopoulos, 2009) and a hyperinflationary economy of 623
percent in January 2004 (CSO, 2004), put in place a raft of support facilities mainly
through the Reserve Bank of Zimbabwe (RBZ). These facilities were meant to boost the
performance of the country’s manufacturing sector however they seem not to have a
significant effect on the sector as by 2008 capacity utilisation stood at 5 percent and GDP
contribution stood at 12 percent (Ministry of Industry and Commerce, 2012).

�������������������� ���������� ����������������������������������
�������������������� ������������������������
�������������������� ��
In its budgetary statement of January 2009, the GoZ adopted the multi-currency system
which saw the economy getting back on its feet as firms started to import goods for resale
in response to demand stimulated by availability of hard currencies like the US$ and the
South African Rand. CZI survey (2009) acknowledges the significant role played by the
multi-currency policy in stimulating manufacturing sector’s performance which by June
2009 was operating at 32, 3 from a low of below 10 percent capacity utilization. The
survey report also notes that the sector grew by 110 percent in 2009 compared to an
annual decline rate of 28 percent in 2007.
However in 2013 the sectors’ capacity utilisation dropped to 38% (CZI, 2013). On the
other hand National Social Security Authority (nssa) also reported that a total of 711
companies in Zimbabwe closed shop between 2011 and 2013 while as at end of July
2013 149 firms from Bulawayo had lodged liquidation applications with the Bulawayo
High Court (nssa, 2013).
Statement of the problem
The government of Zimbabwe recognises the important role that the country’s
manufacturing sector plays in its economy. This is demonstrated by the number of policy
initiatives that the government has put in place; however the initiatives have not achieved
the intended results because the sectors’ players have not been able to effectively scan the
environment for opportunities.
Hypothesis
The study proposes that firms in Zimbabwe’s manufacturing sector, particularly those
operating in Bulawayo, do not use effective methods in scanning the environment for
business opportunities hence their failure to excel in the face of foreign competition.
Research objectives
The study sought to establish:
• if the manufacturing sector players in Bulawayo scan their environment for
opportunities;
�������������������� ���������� ����������������������������������
�������������������� ������������������������
�������������������� ��
• the methods that are used by Bulawayo manufacturers to scan the environment;
and
• recommend ways of improving the environmental scanning processes that are
being used.
Literature Review
Environment Scanning/ Opportunity Identification
Van Aardt and Van Aardt (1997) define an opportunity as the difference between the
desired and the prevailing situation. They further argue that an opportunity that is worth
pursuing by a firm is one which should:
• be sustainable and profitable;
• have a relative advantage over existing ones;
• be compatible with society’s values and beliefs;
• not inflict injuries to potential buyers; and
• be easy to communicate the benefits.
Barringer and Bluedorn (1999 p 423) define environmental scanning as the managerial
activity of learning about events and trends in the organisation’s environment. They
argue that scanning is important for managers in that it helps them identify opportunities,
assists managers in developing and maintaining successful innovation strategies and
facilitates risk taking as it lowers uncertainty in the eyes of management.
Covin (1991), Kanter (1988) and Zumd (1983) agree that learning about the environment
is a result of collecting and analysing information, thus one’s level of knowledge of
environment depends on the amount and quality of information possessed and how he/she
analyses it. Shane and Venkataraman (2000) support this assertion when he argues that
ability to identify opportunities is a result of prior knowledge that one possesses about the
market being served. He further argues that this information can be obtained by firms
from suppliers, distributors, competitors, customers etc. This means businesses need to
create relationships with people outside their organisations in order for them to access
this prior knowledge. This brings into perspective the social network theory as argued

�������������������� ���������� ����������������������������������
�������������������� ������������������������
�������������������� ����
by Powell, Koput and Smith-Doerr (1996 p 118) who postulate that entrepreneurial or
opportunity information does not exclusively reside inside firms but that it is found in
interstices between firms, universities, research laboratories, suppliers and customers.
This means that firm managers need not rely solely on internal sources when scanning the
environment but that they should also make use of external sources.
Hitt et al. (2001) identify several benefits of these external networks over and above
opportunity detection, these include resources and capabilities required to compete and
learning new capabilities. The authors argue that a firm can exploit complementary
resources of its partners in the network to its benefit like a biotechnology firm that makes
use of pharmacies in its network to distribute and market (commercialise) its new
products. In this case, a firm would have used external networks to leverage its
capabilities and resources. Hitt et al. (ibid) further argue that firms can use external
networks to create alliances which can help them learn new capabilities which can help
them compete effectively in new markets without first owning prerequisite resources or
skills. Thompson, Strickland and Gamble (2010 p 167) cite the example of Ford Motor
Corporation of United States of America and Mazda of Japan, as an alliance that allowed
the two firms access to new technologies and markets in foreign countries.
Barringer and Bluedorn, (1999) also provide another dimension to opportunity
identification when they posit that locus of planning greatly contributes to the process.
Locus of planning refers to the extent to which managers involve lower level employees
in the planning process, a process that inherently requires scanning the environment. The
authors argue that firms that involve lower levels (deep locus of control) tend to be
effective in opportunity identification than those that have a shallow locus of control
(only involve management). Shane and Venkataraman (2000) justify this effectiveness in
opportunity identification to information asymmetry which posits that people at any
given point in time, do not possess the same information. Including people from different
backgrounds enhances analysis of given scenarios thereby identifying opportunities that
may easily be overlooked by people sharing the same background. In this case
management and workers scanning the environment together prove useful to the
organisation. The information asymmetry concept can also be used to explain why

�������������������� ���������� ����������������������������������
�������������������� ������������������������
�������������������� ����
external networks are also equally effective in assisting organisations detect
opportunities.
Research methodology
Research design
Leedy (2005 p 41) posits that designing a research is influenced by how it seeks to
acquire knowledge. Thomas (2003 p 1) posits that research can assume a quantitative or
qualitative approach depending on what the study seeks to establish.
Glesne and Peshkin (1992 p 6) define quantitative research as seeking explanations and
predictions that will generalise to other persons and places.
Denzin and Lincoln (1994 p 2) define qualitative approach as multi-method in focus,
involving an interpretive and naturalistic approach to its subject matter. They assert that
qualitative researchers study things in their natural settings, attempting to make sense of,
or interpret phenomena in terms of meanings people bring to them. The authors affirm
that the approach uses a variety of empirical materials like case study, personal
experience, introspective, life story, interview, observation, historical, interactional, and
visual texts that describe routine and problematic moments and meanings in people’s
lives.
This study’s objective is to establish if Harare’s manufacturing sector is using effective
environmental scanning processes, thus making it a case study which is a qualitative
approach.
Study population
Population is defined by Shajahan (2009 p 244) as the group of individuals under study
or the aggregate of all objects-inanimate or animate. Thus the population of this study is
the manufacturers in Bulawayo. According to the Confederation of Zimbabwe Industries
(2012), this population is made up of 16 sub sectors (strata) namely: Bakers; Battery;
Plastic, Packaging and Rubber; Pharmaceuticals; Chemicals; Leather and Allied; Car
Assemblers; Building (including Construction); Grain Millers and Tobacco; Electric
Appliances Manufacturers; Engineering and Steel; Printing and Publishing; Textiles and
Clothing; Paints and inks; Timber Processors (Including Furniture) and Food, Dairy and
Beverages.
�������������������� ���������� ����������������������������������
�������������������� ������������������������
�������������������� ����
Sampling and sample size
Shajahan (2009 p 244) defines a sample as a finite sub-set selected from the entire
population. Kumar (2005 p 164) argues that at times it is difficult, if not impossible, to
investigate all elements in a population, hence the need to identify elements that are
representative enough of the population (sample). The process of arriving at a sample is
referred to as sampling design (Shajahan, ibid and Kumar, ibid) which requires the
researcher to identify the population, the sampling unit or where the sample is drawn
from (for example geographically) and the sampling frame or source lists (where each
sample element is identified).
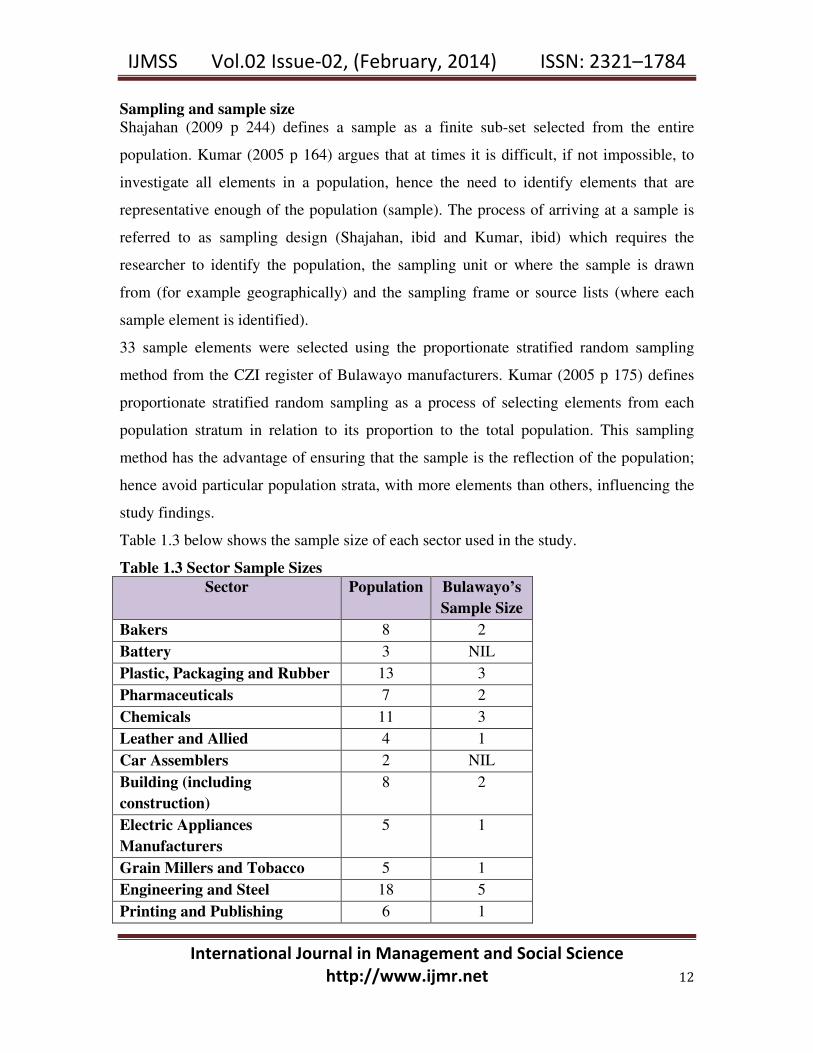
33 sample elements were selected using the proportionate stratified random sampling
method from the CZI register of Bulawayo manufacturers. Kumar (2005 p 175) defines
proportionate stratified random sampling as a process of selecting elements from each
population stratum in relation to its proportion to the total population. This sampling
method has the advantage of ensuring that the sample is the reflection of the population;
hence avoid particular population strata, with more elements than others, influencing the
study findings.
Table 1.3 below shows the sample size of each sector used in the study.
Table 1.3 Sector Sample Sizes
Sector Population Bulawayo’s
Sample Size
Bakers 8 2
Battery 3 NIL
Plastic, Packaging and Rubber 13 3
Pharmaceuticals 7 2
Chemicals 11 3
Leather and Allied 4 1
Car Assemblers 2 NIL
Building (including
construction)
8 2
Electric Appliances
Manufacturers
5 1
Grain Millers and Tobacco 5 1
Engineering and Steel 18 5
Printing and Publishing 6 1
�������������������� ���������� ����������������������������������
�������������������� ������������������������
�������������������� ����
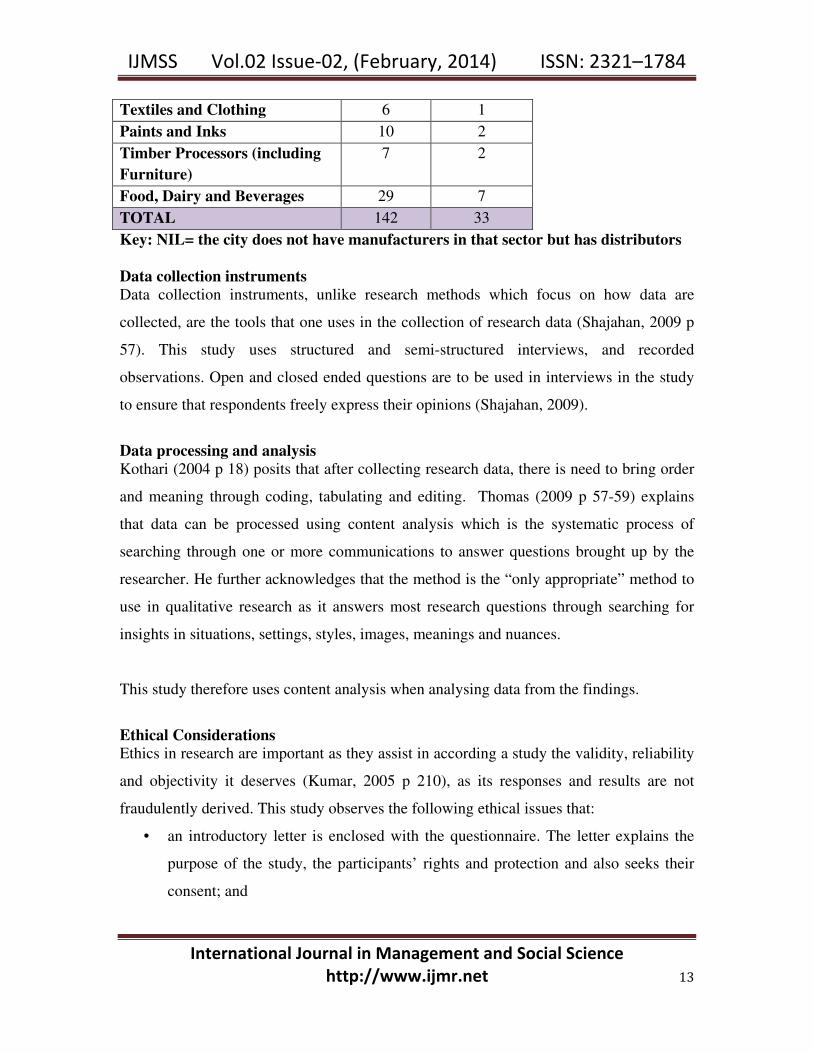
Textiles and Clothing 6 1
Paints and Inks 10 2
Timber Processors (including
Furniture)
7 2
Food, Dairy and Beverages 29 7
TOTAL 142 33
Key: NIL= the city does not have manufacturers in that sector but has distributors
Data collection instruments
Data collection instruments, unlike research methods which focus on how data are
collected, are the tools that one uses in the collection of research data (Shajahan, 2009 p
57). This study uses structured and semi-structured interviews, and recorded
observations. Open and closed ended questions are to be used in interviews in the study
to ensure that respondents freely express their opinions (Shajahan, 2009).
Data processing and analysis
Kothari (2004 p 18) posits that after collecting research data, there is need to bring order
and meaning through coding, tabulating and editing. Thomas (2009 p 57-59) explains
that data can be processed using content analysis which is the systematic process of
searching through one or more communications to answer questions brought up by the
researcher. He further acknowledges that the method is the “only appropriate” method to
use in qualitative research as it answers most research questions through searching for
insights in situations, settings, styles, images, meanings and nuances.
This study therefore uses content analysis when analysing data from the findings.
Ethical Considerations
Ethics in research are important as they assist in according a study the validity, reliability
and objectivity it deserves (Kumar, 2005 p 210), as its responses and results are not
fraudulently derived. This study observes the following ethical issues that:
• an introductory letter is enclosed with the questionnaire. The letter explains the
purpose of the study, the participants’ rights and protection and also seeks their
consent; and

�������������������� ���������� ����������������������������������
�������������������� ������������������������
�������������������� ����
• no rewards are offered to the participants except the undertaking that the results of
the study will be made available to them on request at the end of the study.
Findings and discussion
Response Rate
The response rate was of 88%. The high response rate is attributed to the fact that
questionnaires were hand-delivered to the respondents who were then followed up after a
week to collect the completed questionnaires. Where a respondent had not completed the
questionnaire, the researcher would agree with the concerned respondent on the day of
follow up and collection. Thus the constant follow up and the nature of respondents
(senior managers) contributed to the high response rate.
Johnson and Owens (2009 p 127) argue that a response rate of at least 60% in a
questionnaire survey is good and acceptable for contributions to refereed journal articles.
Nulty (2008 p 308) agrees with the argument but goes further to state that a response rate
of between 60% and 70% is more favourable. Thus, the overall response rate in this study
is above the minimum threshold of 60% rendering the study findings reliable.
Profile of respondents
Respondents in this study were senior managers in the sampled Bulawayo firms that are
in the manufacturing sector.21% of the respondents said that they had been senior
managers for a period of five (5) or less yearswhile41% stated that they had been in
senior management position for a period of between five (5) and 10 years. However 38%
of the respondents stated that they had been senior managers for a period of more than 10
years. This means that the majority of respondents are highly experienced senior
managers with more than five (5) years’ experience in their positions, thus their responses
are deemed reliable.
This section sought to establish the strategic management practices in the sampled
manufacturing firms drawn from Bulawayo.

�������������������� �
���������
Respondents were asked if their organisations had strate
above shows that 86% of respondents said that they had strategic plan dcuments while
14% said that they did not have any.
Strategic plan documents are an important indicator of whether organisations are pro
actively engaging in scan
environment is important in that it enables organisations to identify opportunities that
they can exploit for purposes of growing their businesses. Besides opportunities, the
process also allow
competitive. The strategic plan document acts as a guide to organisations as it outlines
what actions the organisation will take to reach their objectives. Thus organisations that
operate
in the case of organisations they will find themselves out of business.
Respondents who said they had strategic plan documents were asked if their
organisations held formal str
they held formal strategic planning sessions.
�������������������� �
�������������������� ������������������������
������������� ����������� �������������
Respondents were asked if their organisations had strate
above shows that 86% of respondents said that they had strategic plan dcuments while
14% said that they did not have any.
Strategic plan documents are an important indicator of whether organisations are pro
actively engaging in scan
environment is important in that it enables organisations to identify opportunities that
they can exploit for purposes of growing their businesses. Besides opportunities, the
process also allow
competitive. The strategic plan document acts as a guide to organisations as it outlines
what actions the organisation will take to reach their objectives. Thus organisations that
operate without that document are like ships without compasses and are bound to crash,
in the case of organisations they will find themselves out of business.
Respondents who said they had strategic plan documents were asked if their
organisations held formal str
they held formal strategic planning sessions.
�������������������� �
�������������������� ������������������������
���� ����������� �������������
Respondents were asked if their organisations had strate
above shows that 86% of respondents said that they had strategic plan dcuments while
14% said that they did not have any.
Strategic plan documents are an important indicator of whether organisations are pro
actively engaging in scanning the environment in which they are operating. Scanning the
environment is important in that it enables organisations to identify opportunities that
they can exploit for purposes of growing their businesses. Besides opportunities, the
process also allows organisations to mitigate their threats for purposes of remaining
competitive. The strategic plan document acts as a guide to organisations as it outlines
what actions the organisation will take to reach their objectives. Thus organisations that
without that document are like ships without compasses and are bound to crash,
in the case of organisations they will find themselves out of business.
Respondents who said they had strategic plan documents were asked if their
organisations held formal strategic planning sessions. All of the respondents recorded that
they held formal strategic planning sessions.
��
�������������������� ���������
�������������������� ������������������������
�������������������
���� ����������� �������������
Respondents were asked if their organisations had strate
above shows that 86% of respondents said that they had strategic plan dcuments while
14% said that they did not have any.
Strategic plan documents are an important indicator of whether organisations are pro
ning the environment in which they are operating. Scanning the
environment is important in that it enables organisations to identify opportunities that
they can exploit for purposes of growing their businesses. Besides opportunities, the
s organisations to mitigate their threats for purposes of remaining
competitive. The strategic plan document acts as a guide to organisations as it outlines
what actions the organisation will take to reach their objectives. Thus organisations that
without that document are like ships without compasses and are bound to crash,
in the case of organisations they will find themselves out of business.
Respondents who said they had strategic plan documents were asked if their
ategic planning sessions. All of the respondents recorded that
they held formal strategic planning sessions.
��
��� !�
�� ����������������������������
�������������������� ������������������������
�������������������
���� ����������� ��������������
Respondents were asked if their organisations had strate
above shows that 86% of respondents said that they had strategic plan dcuments while
Strategic plan documents are an important indicator of whether organisations are pro
ning the environment in which they are operating. Scanning the
environment is important in that it enables organisations to identify opportunities that
they can exploit for purposes of growing their businesses. Besides opportunities, the
s organisations to mitigate their threats for purposes of remaining
competitive. The strategic plan document acts as a guide to organisations as it outlines
what actions the organisation will take to reach their objectives. Thus organisations that
without that document are like ships without compasses and are bound to crash,
in the case of organisations they will find themselves out of business.
Respondents who said they had strategic plan documents were asked if their
ategic planning sessions. All of the respondents recorded that
they held formal strategic planning sessions.
�"
!�
�������������������������
�������������������� ������������������������
��������������������
Respondents were asked if their organisations had strategic plan
above shows that 86% of respondents said that they had strategic plan dcuments while
Strategic plan documents are an important indicator of whether organisations are pro
ning the environment in which they are operating. Scanning the
environment is important in that it enables organisations to identify opportunities that
they can exploit for purposes of growing their businesses. Besides opportunities, the
s organisations to mitigate their threats for purposes of remaining
competitive. The strategic plan document acts as a guide to organisations as it outlines
what actions the organisation will take to reach their objectives. Thus organisations that
without that document are like ships without compasses and are bound to crash,
in the case of organisations they will find themselves out of business.
Respondents who said they had strategic plan documents were asked if their
ategic planning sessions. All of the respondents recorded that
�"
�������������������������
�������������������� ������������������������
gic plan documents. Figure 1.1
above shows that 86% of respondents said that they had strategic plan dcuments while
Strategic plan documents are an important indicator of whether organisations are pro
ning the environment in which they are operating. Scanning the
environment is important in that it enables organisations to identify opportunities that
they can exploit for purposes of growing their businesses. Besides opportunities, the
s organisations to mitigate their threats for purposes of remaining
competitive. The strategic plan document acts as a guide to organisations as it outlines
what actions the organisation will take to reach their objectives. Thus organisations that
without that document are like ships without compasses and are bound to crash,
in the case of organisations they will find themselves out of business.
Respondents who said they had strategic plan documents were asked if their
ategic planning sessions. All of the respondents recorded that
������������������������������
�������������������� ������������������������
���
documents. Figure 1.1
above shows that 86% of respondents said that they had strategic plan dcuments while
Strategic plan documents are an important indicator of whether organisations are pro
ning the environment in which they are operating. Scanning the
environment is important in that it enables organisations to identify opportunities that
they can exploit for purposes of growing their businesses. Besides opportunities, the
s organisations to mitigate their threats for purposes of remaining
competitive. The strategic plan document acts as a guide to organisations as it outlines
what actions the organisation will take to reach their objectives. Thus organisations that
without that document are like ships without compasses and are bound to crash,
Respondents who said they had strategic plan documents were asked if their
ategic planning sessions. All of the respondents recorded that
�����
���
documents. Figure 1.1
above shows that 86% of respondents said that they had strategic plan dcuments while
Strategic plan documents are an important indicator of whether organisations are pro-
ning the environment in which they are operating. Scanning the
environment is important in that it enables organisations to identify opportunities that
they can exploit for purposes of growing their businesses. Besides opportunities, the
s organisations to mitigate their threats for purposes of remaining
competitive. The strategic plan document acts as a guide to organisations as it outlines
what actions the organisation will take to reach their objectives. Thus organisations that
without that document are like ships without compasses and are bound to crash,
Respondents who said they had strategic plan documents were asked if their
ategic planning sessions. All of the respondents recorded that

�������������������� ���������� ����������������������������������
�������������������� ������������������������
�������������������� ����
Formal planning sessions are important in that they allow participants to be aware of the
organisation’s expectations and intentions, secure buy-in from participants hence their
commitment and most importantly for the plan to be as objective as possible.
Carrying out the process informally results in organisations not taking the resultant
document seriously and believing that it is a formality that it must be in place lest they
are viewed as not progressive.
Therefore notwithstanding the seemingly small number of firms not engaging in formal
strategic planning the consequences of not doing so cannot be brushed aside.
The researcher sought to establish if the the employees in organisations that had strategic
plan documentswere familiar with the contents of the documents. Figure 1.2on the next
page shows that 64% of respondents stated that employees were very familiar with the
contents of the strategic plan documents while 32% of the respondents said that they were
fairly familiar. However 4% of the respondents recorded that the were not familiar with
the contents of the strategic plan documents.
Figure 1.2: Employee familiarity with strategic plan Employees who are familiar with the contents of their firms’ strategic plan are an asset to
their organisations as they will be able to make decisions that keep the organisation
#����
$�%&�&����"�
$�&����
$�%&�&������
!�'�$�%&�&�����
��������������
� �������������!

�������������������� ���������� ����������������������������������
�������������������� ������������������������
�������������������� ����
focused on the set goals or identified opportunities. In this case employees are most likely
going to keep the organisation on the chosen course.
The researcher sought to establish the participants in the formal strategic planning
sessions in the respondent organsations. Figure 1.3on the next page shows that 68% of
the respondents said that in their organisations, both management and employees
participated in the strategic planning process while 24% of the respondentssaid that only
the senior executives and middle managers were the participants. However 8% of the
respondents stated that it was only senior executives who participated in the process.
����������������������������� �
The quality of a strategic plan document is a function of who contributed to its birth as
advocated by Barringer and Bluedorn (1999) in their locus of planning theory. The
authors argue that organisations who practice deep locus of planning- involve
management and employees- are bound to come up with more relevant and useful
strategic plan documents than those who leave the task solely to management. The
researcher agrees with this argument as managers are constantly sharing information
among themselves to the extent that they have almost similar views on challenges facing
organisations and the resultant solutions. This is commonly referred to as “group think”.
To counter the negative effects of “group think” requires bringing in other views from
employees who are on the ground and have firsthand experience with the challenges
� �� "�
������������
�
� ����������������
��!&����(�) '&#��
��!&����(�) '&#����!*�%&**���%�!�+���
��',�%�!�+�%�!'��!*��%-������
�������������������� ���������� ����������������������������������
�������������������� ������������������������
�������������������� ���
facing the organisation. The result of having these two groups who have asymmetrical
information is a thorough and objective analysis of issues leading to a rich strategic plan
document.
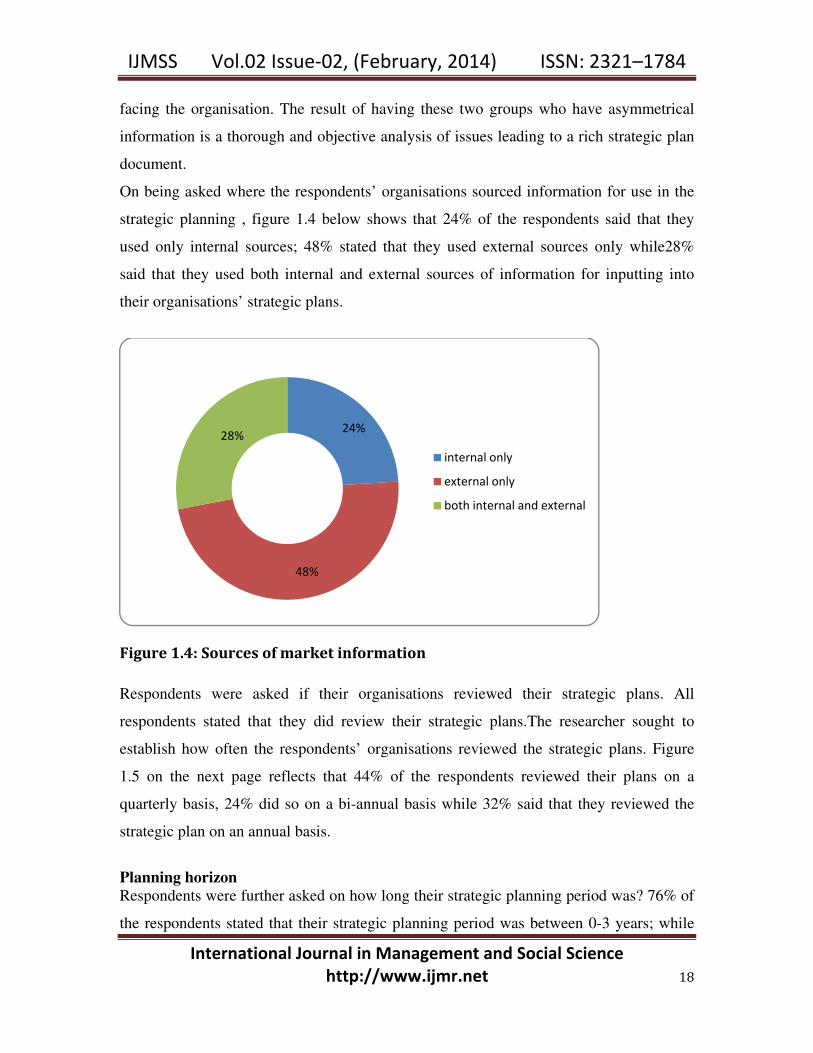
On being asked where the respondents’ organisations sourced information for use in the
strategic planning , figure 1.4 below shows that 24% of the respondents said that they
used only internal sources; 48% stated that they used external sources only while28%
said that they used both internal and external sources of information for inputting into
their organisations’ strategic plans.
���������������� �����������������������
Respondents were asked if their organisations reviewed their strategic plans. All
respondents stated that they did review their strategic plans.The researcher sought to
establish how often the respondents’ organisations reviewed the strategic plans. Figure
1.5 on the next page reflects that 44% of the respondents reviewed their plans on a
quarterly basis, 24% did so on a bi-annual basis while 32% said that they reviewed the
strategic plan on an annual basis.
Planning horizon
Respondents were further asked on how long their strategic planning period was? 76% of
the respondents stated that their strategic planning period was between 0-3 years; while
��
��
��
&!'��!����!��
�('��!����!��
��',�&!'��!����!*��('��!��

�������������������� ���������� ����������������������������������
�������������������� ������������������������
�������������������� ���
24% of the respondents said that they had a strategic planning period was over 10 years.
However, there were no respondents whose strategic planning period was between 4-6
years and 7-10 years.
Planning horizons are critical in determining the environmental factors that planners will
focus on as they develop their plans. Thompson, Strickland and Gamble (2010) argue that
organisations that have short planning horizon tend to focus on environmental factors that
will affect them in the short term ignoring those factors that are on the horizon
(emerging) but will affect the organisation in the long term. However a too long planning
horizon has the effect of rendering the plan ineffective and unrealistic as they become too
futuristic. Thus short planning horizons leave out long term opportunities and threats,
while relatively long planning horizons allow for accommodating both short and long
term opportunities and threats.
���������������������������� �
Strategic plans are drawn based on developments in the business environment. However
these developments are not constant therefore, the need to constantly check if the
organisation’s strategic plan is still in tandem with environmental developments. Where
they are not, organisations should make necessary adjustments to remain relevant in the
. ��'��������
,��$�����������
�!! ��������
�������������
�
��������!���� ���
�������������������� ���������� ����������������������������������
�������������������� ������������������������
�������������������� ����
environment. Strategic plans are guides to an organisation’s operations in the dynamic
environment, hence the need to reflect on the progress in strategic plan implementation.
There also exists the need to assess whether the organisation is making progress towards
its set objectives.
These benefits can only be achieved if organisations engage in strategic plan reviews.
However the timing of the review is of great essence. Where reviews are delayed or not
done at all, the consequences are that the strategic plan is overtaken by events rendering it
irrelevant. Over and above that, organisations may have gone off course resulting in
delayed remedial action and in some instances a great deal of irreparable damage (eg. in
the form of losses or lost market share) would have been inflicted on the organisation.
Therefore review of strategic plans on a regular basis cannot be overemphasized.
Thompson Strickland and Gamble (2010) concur with this assertion recommending that it
should be done on a quarterly basis.
Conclusions
Data analysis done in the previous section reveals the overall opportunity identification
processes used by the sampled Bulawayo manufacturers has some few flaws. These few
flaws though put the firms at risk of overlooking or missing opportunities that could
make their businesses even more competitive. The correlation of this conclusion is that
flawed environmental scanning processes can also hamper firms from identifying or
anticipate threats that may render them uncompetitive.
To their credit though, the majority of sampled manufacturers though show that they are involving all employee levels in scanning the environment and this has the positive effect on the level of awareness of the contents of the strategic plan by all employees.
Recommendations
• that they raise their planning horizon to at least five (5) years and not more than
seven years from the current three (3) years. This will allow them to incorporate
long term environmental factors with a potential to impact on their operations.
However for the few firms whose planning horizon is beyond 10 years they
should shorten the planning horizon to the above mentioned time frames;

�������������������� ���������� ����������������������������������
�������������������� ������������������������
�������������������� ����
• that they review their strategic plans at least on a quarterly basis so as keep
abreast with the environmental changes that may take place; and
• that they make use of both the internal and external sources of market information
to be able to carry out effective and relevant SWOT analysis.
REFERENCES
1. Barringer, B. R and Bluedorn, A. C. (1999) ‘The Relationship between Corporate Entrepreneurship and Strategic Management’.Strategic Management Journal.Vol. 20. pp. 421-444.
2. Besada, H. and Moyo, N. (2008), ‘Zimbabwe in Crisis: Mugabe’s Policies and Failures’. The Centre for International Governance Innovation
3. Confederation of Zimbabwe Industries (CZI) (2008) Manufacturing Survey
4. Confederation of Zimbabwe Industries (CZI) (2009) Manufacturing Survey
5. Confederation of Zimbabwe Industries (CZI) (2011) Manufacturing Survey
6. Confederation of Zimbabwe Industries (CZI) (2013); the Annual CZI Manufacturing Sector Survey
7. Confederation of Zimbabwe Industries (CZI) Manufacturing Survey 2012.
8. Confederation of Zimbabwe Industries website.www.czi.co.zw; accessed 12 February 2013.
9. Covin, J. G. (1991) “Entrepreneurial versus Conservative Firms: A Comparison of Strategies and Performance”, Journal of Management Studies, 28, pp. 439-462.
10. First Merchant Bank’s (FMB) Quarterly Guide (1993)
11. Glesne, C. and Peshkin, A. (1992).Becoming Qualitative Researchers. Thousand Oaks, CA: Sage.
12. Hawkins, A, M “The Rhodesian Economy under Sanctions”, in Rhodesia Journal of Economics (August 1967).
13. Hawkins, A.M and Ndhlela, D (2008) Working Paper 6: United Nations Development Programme, Comprehensive Economic Recovery in Zimbabwe: A Discussion Document
14. Hitt, M. A., Ireland, R.D., Camp, S. M. and Sexton, D. L. Strategic Entrepreneurship: Entrepreneurial Strategies for Wealth Creation. Strategic Management Journal Vol.22No.6/7 Special Issue (June-July) pp. 479-491.

�������������������� ���������� ����������������������������������
�������������������� ������������������������
�������������������� ����
15. Johnson, T and Owens, L (2009) “Survey Response Rate in Professional Literature”, American Association for Public Opinion Research- Section on Survey Research Methods, pp. 127-133.
16. Kanter, R.M. (1989). When Giants Learn to Dance.Simon and Schuster, New York.
17. Kothari, C. R. (2004). Research Methodology: Methods and Techniques. New Age International Publishers
18. Kumar, R. (2005). Research Methodology- A Step by Step Guide for Beginners. Sage Publications
19. Leedy, P. D. (2005). Practical Research- Planning and Design.Pearson Prentice Hall.
20. Leedy, P. D. (2010). Practical Research- Planning and Design. Macmillan Publishing
21. Makochekanwa, A. (2007), ‘A dynamic enquiry into the causes of hyperinflation in Zimbabwe. University of Pretoria working paper.
22. Mlambo, A. S., Pangeti, E.S., and Phimister, I (2000) Zimbabwe: A History of Manufacturing 1890-1995. University of Zimbabwe Publications
23. Mlambo, A.S (1997).The Economic Structural Adjustment Program: The Case of Zimbabwe. University of Zimbabwe Publication
24. National Social Security Authority (nssa) Bulawayo Regional Employer Closures and Registrations Report (2013)
25. Nulty, D.D.; (2008) “The Adequacy of Response Rates to Online and Paper Surveys.”Assessment& Evaluation in Higher Education, Vol. 33, No. 3 June 2008 pp. 301-314
26. Powell, W.W., Koput, K.W., and Smith-Doerr, L. (1996).Inter-organisational Collaborations and the Locus of Innovation: Networks of Learning in Biotechnology. Administrative Science Quarterly 41: p 116-145.
27. Raftopoulos, B and Mlambo, A.S (2009) Becoming Zimbabwe: A History from the Pre-colonial Period to 2008. Weaver Press
28. Riddell, R (1990) Manufacturing Africa: Performance Prospects of Seven Countries in Sub-Saharan African. London, Currey.
29. Shajahan, S. (2009).Research Methods for Management (Texts and Cases).Jaico Publishing House.
�������������������� ���������� ����������������������������������
�������������������� ������������������������
�������������������� ����
30. Shane, S. and Venkataraman, S. (2000) The Promise of Entrepreneurship as a Field of Research. Academy of Management Review, Vol.25 No. 1 p217-226
31. Thompson, A.A., Strickland, A.J., and Gamble, J.A., (2010) Crafting and Executing Strategy. McGraw Hill
32. United Nations Development Programme (UNDP), Zimbabwe: Manufacturing Industry, Economic Recovery and Poverty Reduction, (2010)
33. Van Aardt I and Van Aardt C. (1997) Entrepreneurship and New Venture Management.South Africa, International Thompson Publishing.
34. Zimbabwe Industrial Development Policy: 2011-2015. (2012). Ministry of Industry and Commerce.
35. ZIMPREST (1996-2000). Government of Zimbabwe.
36. Zumd, R. (1983) “The Effectiveness of External Information Channels in Facilitating Innovation within Software Development Groups.” MIS Quarterly, 7, pp. 43-47.