Chemistry of Hydrogen Peroxide Formation and Elimination in ...
Upload
independentCategory
view
2download
0
Journal of Hazardous Materials, 27 (1991) 273-285 Elsevier Science Publishers B.V., Amsterdam
273
Enhancement of organic vapor incineration using hydrogen peroxide
C. David Cooper*, Christian A. Clausenb, Doug Tomlinb, Mike Hewett” and Al Martinez” “Civil and Environmental Engineering Department, and bCh.emistry Department, University of Central Florida, Orlando, Florida 32816-0450 (USA)
(Received October 1,199O; accepted in revised form March 5,199l)
Abstract
Incineration of dilute mixtures of volatile organic compounds ( VOCs ) in air was studied in an externally heated quartz tube reactor. Dilute solutions of hydrogen peroxide in water were injected into the flowing air stream at various molar ratios of H20, to VOCs. A number of trials were made to determine global destruction kinetics for two VOCs - heptane and isopropenol. Temperatures studied ranged from 637°C to 700°C and residence times varied from 0.26 to 0.94 seconds. It was shown that H,O, definitely increased the rate of destruction of the primary organics. However, at the residence times and temperatures studied, both organic intermediates and CO persisted. A surprising experimental result was that position of the HeOe injector relative to the reaction zone made a dramatic difference in the results.
Introduction
Incineration of waste gases and liquids has long been used as an accepted means of destroying volatile organic compounds (VOCs ) .The main advantage of incineration is the positive destruction of toxic or otherwise hazardous ma- terials. Disadvantages include cost and possible air pollutant emissions includ- ing products of incomplete destruction (PICs), such as VOC intermediates or CO, as well as NO,. The use of lower than flame temperatures for the thermal oxidation of VOCs is quite common and has been practiced extensively.
Hydrogen peroxide has long been used as an oxidizer in water and waste- water applications. However, only recently has the use of hydrogen peroxide (H,O,) been studied in conjunction with waste incineration. It has been re- ported that researchers in West Germany injected HzOz into the flue gases of a pilot scale municipal solid waste incinerator and observed over 99.5% de- struction of gaseous dioxins and furans at 200-250°C [ 11.
It has long been known that in flame combustion, there are free radicals
0304-3694/91/$03.50 0 1991- Elsevier Science Publishers B.V.

274
present which are essential to the hydrocarbon oxidation via a chain-branch- ing mechanism [ 21. Howard and others [ 3 ] reported the importance of water vapor in the combustion of CO. Several years ago, the authors postulated that injection of H,O, into hot gases might result in “extra” free radicals even in the absence of flames. The “extra” radicals could initiate chain-branching ox- idation reactions more quickly. The potential benefits are more rapid destruc- tion (smaller equipment), more complete destruction (less pollutant emis- sions ), and/or lower temperatures (fuel savings and/or lower NO, emissions ).
A common model used to describe VOC incinerators is that of a first order reaction occurring in an idealized plug flow reactor (PFR) . Mathematically, if the gas temperature is constant (both radially and longitudinally), then the fraction of organic compounds remaining at the exit of the PFR is given by:
c -_=e -kt
co (1)
where C denotes the exit concentration of VOC, C, the inlet concentration of VOC, t the residence time of gases in the PFR (which equals L/u, where u is the average gas velocity, and L the length of the reactor), and K a global, first order reaction rate constant.
The rate constant is usually represented by an Arrhenius model, i.e.:
k&&W
where It, denotes the pre-exponential factor, E the activation energy, ideal gas law constant (in J/mol K), and T the absolute temperature.
(2) R the
There have been mathematical models proposed for predicting the tempera- ture required to achieve a certain destruction percentage [4,5], or for predict- ing the global kinetic constant, k [ 61, If the reactor is not isothermal then equation (1) is not valid, but other techniques are available for analyzing re- actor performance [ 71.
One of the simplest models for hydrocarbon oxidation is that of a global oxidation of the hydrocarbon to CO and HZ0 with subsequent oxidation of CO to CO,. In the presence of excess oxygen, the stoichiometry is:
C,H, +0,+&O+ (n/2)H,O (3)
mCO+0~+mCO~ (4)
Similar approaches have been used by others. Mellor [ 81 reported having used reaction (3) with an infinite forward rate in conjunction with a detailed kinetic model of a gas turbine combustor.
Senkan [ 91 correctly and succinctly articulates the role of and the need for fundamental chemical kinetic research in modeling the complex processes that occur in an incinerator. In the long run, there is, in fact, no substitute for fundamental theory supported by experimental data. However, such funda-
275
mental work is expensive and time consuming. Sometimes simplistic global modeling can be of use to operators, designers and to researchers.
The high temperature oxidation reactions that occur in flames are multi- step, free-radical based chain-branch reactions. At flame temperatures, even water molecules break apart into OH radicals, and 0 and H atoms. At lower temperatures, water does not break apart so readily, and has less effect on the oxidation reactions. However, HzOz likely does form radicals at lower temper- atures, perhaps splitting at the O-O bond to create OH radicals, or splitting at an OH bond to create H atoms and HO2 radicals [lo].
Global models are greatly simplified representations of complex oxidation reaction kinetics. Lee and others [4,5] used a quartz tube incinerator and re- ported global kinetic data for a number of organic compounds from which they proposed statistical correlations for predicting the temperature required for destruction of organic vapors in an afterburner.
Their predicted temperature depends on nine variables including auto-ig- nition temperature, molecular weight, molecular structure, and residence time (in a plug flow reactor). Cooper [6] used a pilot-scale, fuel-fired afterburner, and proposed a simplified model for predicting the global kinetics of VOC incineration.
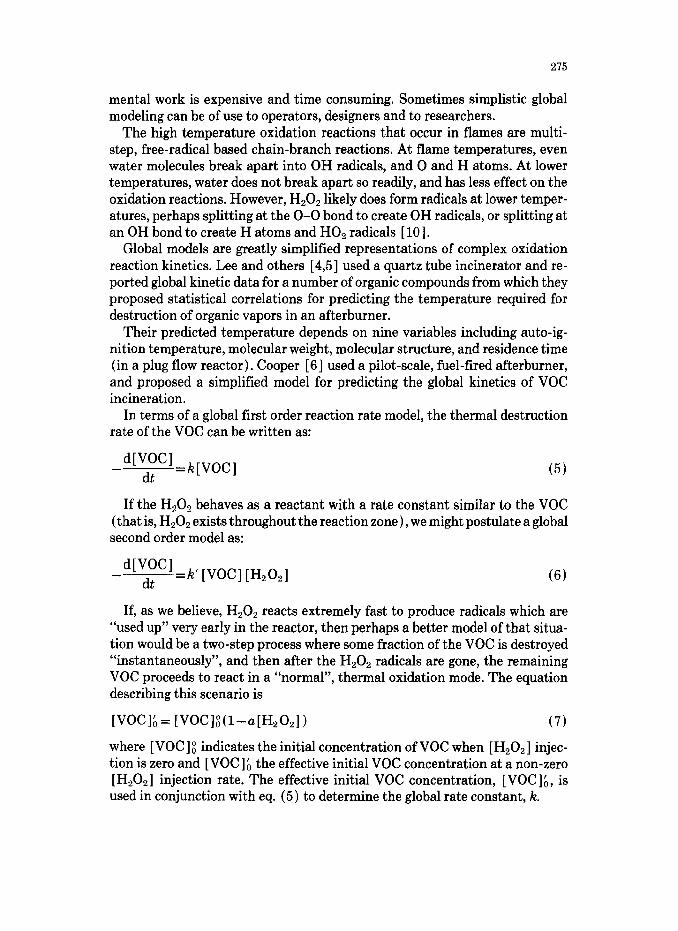
In terms of a global first order reaction rate model, the thermal destruction rate of the VOC can be written as:
- d[V,OC1=k[VoC] If the HzOz behaves as a reactant with a rate constant similar to the VOC
(that is, H202 exists throughout the reaction zone), we might postulate a global second order model as:
d[;cl =A’ [VOC] [H,O,]
If, as we believe, H,O, reacts extremely fast to produce radicals which are “used up” very early in the reactor, then perhaps a better model of that situa- tion would be a two-step process where some fraction of the VOC is destroyed “instantaneously”, and then after the H202 radicals are gone, the remaining VOC proceeds to react in a “normal”, thermal oxidation mode. The equation describing this scenario is
[VOC]b= [VOC];(l-a[H,O,]) (7)
where [ VOC] g indicates the initial concentration of VOC when [ H,02] injec- tion is zero and [ VOC ] b the effective initial VOC concentration at a non-zero [H202] injection rate. The effective initial VOC concentration, [VOC];, is used in conjunction with eq. (5) to determine the global rate constant, k.
276
Experimental equipment and methods
The experimental system consisted of several components. The reactor was a 200 cm long, 6 mm OD, 4 mm ID, quartz tube, externally heated in a Lindberg tube furnace, similar to a system used by other investigators in the past [ 4,111. A network of calibrated rotameters provided precise and reasonably accurate air flow controls. A dual saturator system allowed for producing saturated VOC- in-air concentrations [ 121 which could be diluted to a desired inlet concentra- tion. A Fisher (Antek) GC (with a FID) and a Thermoelectron Model 48 CO analyzer were used to measure the VOC and CO concentrations respectively.
A schematic diagram of the experimental equipment is presented in Fig. 1. House air was filtered through activated carbon and glass wool. Periodic checks with the GC showed that no detectable organics remained in the air stream. A fraction of the air was passed through a pair of ice-bath bubblers to saturate it with VOC vapor. The saturated air was recombined with the bypass air thus diluting the VOC in air to a desired concentration. This blending and dilution prevented any condensation of the VOC vapor and resulted in a stream of air (with about 1000 ppm VOC) flowing at a desired rate. A syringe pump was used to inject a dilute water solution of hydrogen peroxide dropwise at con- trolled rates to achieve different concentrations of H,O, in the final gas stream. The H,Oz solution passed through a fine syringe needle positioned coaxially in a pre-heated section of the quartz tube (see Fig. 2) and was swept into and evaporated by the flowing gas. The gas stream then continued through the externally heated, quartz tubular flow reactor.
In each set of constant temperature experiments, gas residence time in the tubular reactor was controlled by adjusting gas flow rate. Tests at several dif- ferent residence times were made. On exiting the reactor, the gases were im- mediately quenched and diluted with a measured flow rate of air. Inlet and outlet concentrations of the parent VOC were measured by gas chromato- graphy (GC ) . Several PICs were noticed on the GC recording, but were not identified by mass spectrometry owing to a limited budget for such GC/MS analytical work. Outlet CO concentrations were also measured but are not re- ported in this paper. Volatile organic compound conversions were analyzed versus residence times using a first order model to establish the global kinetics.
At each temperature, six gas flow rates (six residence times in the reactor) were used to establish concentration “profiles.” Four or five different temper- atures were studied with each VOC in order to estimate the “apparent” or “global” activation energy and pre-exponential factor for each compound. Fi- nally, five different concentrations of enhancer were used for each VOC at each temperature and residence time. Thus, the overall experimental design in- volved approximately 300 individual experiments measuring entering and ex- iting concentrations of VOC, and exiting CO for each organic that was tested.

GAS CHROMATOGRAPH
MANIFOLD7
QUENCH STREAM SYRINGE PUMP
DILUTION STREAM
SOLVENT-IN-AIR- STREAM
I /
/ ; ‘OLFFILTER ;;;zkCOOLING C65” SAT”RAToR
Fig. 1. Simplified schematic flow diagram.
TUBE FURNACE EXTERIOR WALL
BEGINNING OF HEATED ZONE
HEATING
cl20 0
Fig. 2. Reactor entrance showing H,Oz injector position.
278
Many more experiments were done to establish proper operating ranges of parameters, and to establish the precision of the data.
Results
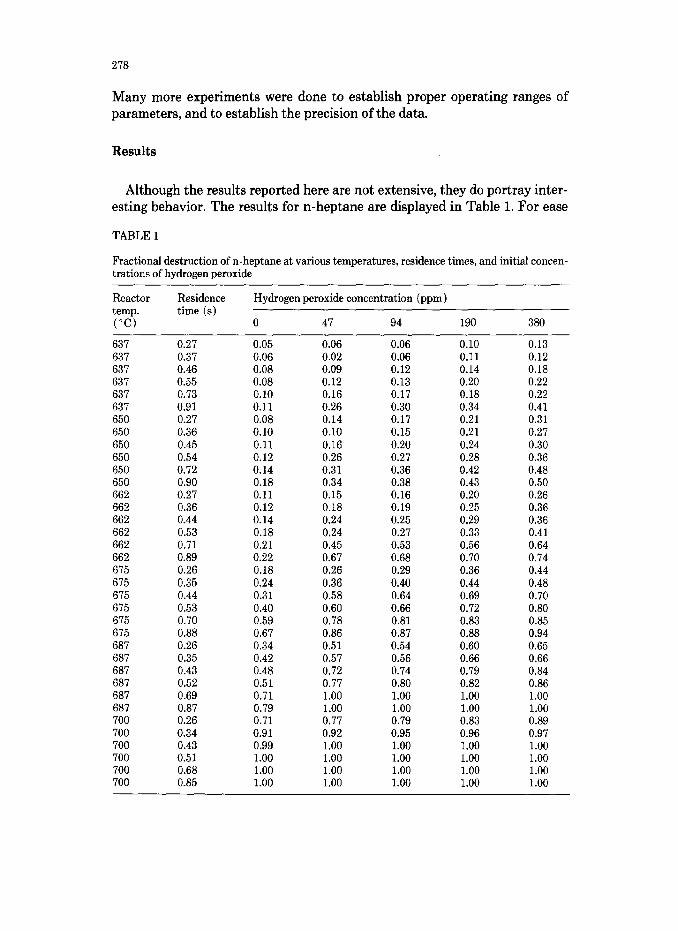
Although the results reported here are not extensive, they do portray inter- esting behavior. The results for n-heptane are displayed in Table 1. For ease
TABLE 1
Fractional destruction of n-heptane at various temperatures, residence times, and initial concen- trations of hydrogen peroxide
Reactor temp. (“C)
Residence time (s)
Hydrogen peroxide concentration (ppm)
0 47 94 190 380
637 637 637 637 637 637 650 650 650 650 650 650 662 662 662 662 662 662 675 675 675 675 675 675 687 687 687 687 687 687 700 700 700 700 700 700
0.05 0.06 0.06 0.02 0.08 0.09
0.27 0.37 0.46 0.55 0.73 0.91 0.27 0.36 0.45 0.54 0.72 0.90 0.27 0.36 0.44 0.53 0.71 0.89 0.26 0.35 0.44 0.53 0.70 0.88 0.26 0.35 0.42 0.57 0.43 0.48 0.72
0.08 0.12 0.10 0.16 0.11 0.26 0.08 0.14 0.10 0.10 0.11 0.16 0.12 0.26 0.14 0.31 0.18 0.34 0.11 0.15 0.12 0.18 0.14 0.24 0.18 0.24 0.21 0.45 0.22 0.67 0.18 0.26 0.24 0.36 0.31 0.58 0.40 0.60 0.59 0.78 0.67 0.86 0.34 0.51
0.52 0.51 0.69 0.71 0.87 0.79 0.26 0.71 0.34 0.91 0.43 0.99 0.51 1.00 0.68 1.00 0.85 1.00
0.77 1.00 1.00 0.77 0.92 1.00 1.00 1.00 1.00
0.06 0.06 0.12 0.13 0.17 0.30 0.17 0.15 0.20 0.27 0.36 0.38 0.16 0.19 0.25 0.27 0.53 0.68 0.29 0.40 0.64 0.66 0.81 0.87 0.54 0.56 0.74 0.80 1.00 1.00 0.79 0.95 1.00 1.00 1.00 1.00
0.10 0.11 0.14 0.20 0.18 0.34 0.21 0.21 0.24 0.28 0.42 0.43 0.20 0.25 0.29 0.33 0.56 0.70 0.36 0.44 0.69 0.72 0.83 0.88 0.60 0.66 0.79 0.82 1.00 1.00 0.83 0.96 1.00 1.00 1.00 1.00
0.13 0.12 0.18 0.22 0.22 0.41 0.31 0.27 0.30 0.36 0.48 0.50 0.26 0.36 0.36 0.41 0.64 0.74 0.44 0.48 0.70 0.80 0.85 0.94 0.65 0.66 0.84 0.86 1.00 1.00 0.89 0.97 1.00 1.00 1.00 1.00

279
0, 0 50 loo 150 2oa 250 300 350 400
pprn H202
Fig. 3. Fractional destruction of n-heptane as a function of time, temperature and initial H,O, concentration. (m) 65O”C, 0.27 s; (+ ) 65O”C, 0.9 s; (*) 675”C, 0.26 s, and (0) 675”C, 0.87 s.
2.5
2
Actual Residence Time (set)
Fig. 4. Calculation of global rate constant for n-heptane destruction at 675°C and various concen- trations of H,O,. (m) 0 ppm; ( + ) 47 ppm; (*) 94 ppm; (0 ) 190 ppm; and ( x ) 380 ppm.
of plotting the results, the fractional destruction (l-C/C,) was used, where C represents the concentration of VOC. For temperatures between 637°C and 700°C the fractional destruction of n-heptane increased with increasing amounts of HzOz, from no effect (when injecting pure distilled water) to over 300% increase (observed when a 1.5% solution of H,O, in distilled water was used). The effect is greater at shorter residence times as shown in Fig. 3. This large effect of H202 limited the upper temperature to which we could operate and achieve measurable fractional destructions with our equipment. Below 637°C somewhat anomalous behavior was observed, perhaps indicating a change in reaction mechanism. Such behavior has been observed in the past [41.
In analyzing our experimental results, no H,O, concentrations were ob- served exiting the reactor even at the shortest residence times, therefore eq. (6 ) was discarded. Global first order rate constants were calculated per eq. (5) as shown in Fig. 4. The slopes of the lines in Fig. 4 do change somewhat for n- heptane with H202, indicating that perhaps the model of an instantaneous HzOz effect followed by the “normal” oxidation reactions is not perfect. How- ever, with isopropanol it seemed more clear that the H,O, is producing OH (or other) radicals which are initiating the VOC combustion and are short lived (see Fig. 5). Arrhenius plots were made, and Hz02 apparently decreased the
280
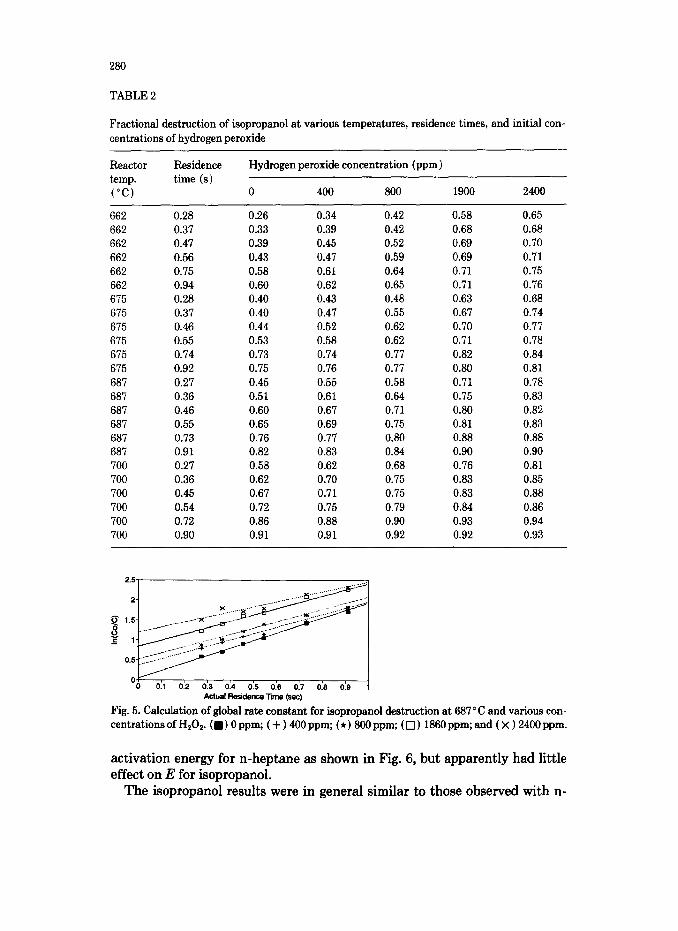
TABLE 2
Fractional destruction of isopropanol at various temperatures, residence times, and initial con- centrations of hydrogen peroxide
Reactor temp. (“C)
662 662 662 662 662 662 675 675 675 675 675 675 687 687 687 687 687 687 700 700 700 700 700 700
Residence time (5)
0.28 0.37 0.47 0.56 0.75 0.94 0.28 0.37 0.46 0.55 0.74 0.92 0.27 0.36 0.46 0.55 0.73 0.91 0.27 0.36 0.45 0.54 0.72 0.90
Hydrogen peroxide concentration (ppm)
0 400 800 1900 2400
0.26 0.34 0.42 0.58 0.65 0.33 0.39 0.42 0.68 0.68 0.39 0.45 0.52 0.69 0.70 0.43 0.47 0.59 0.69 0.71 0.58 0.61 0.64 0.71 0.75 0.60 0.62 0.65 0.71 0.76 0.40 0.43 0.48 0.63 0.68 0.40 0.47 0.55 0.67 0.74 0.44 0.52 0.62 0.70 0.77 0.53 0.58 0.62 0.71 0.78 0.73 0.74 0.77 0.82 0.84 0.75 0.76 0.77 0.80 0.81 0.45 0.55 0.58 0.71 0.78 0.51 0.61 0.64 0.75 0.83 0.60 0.67 0.71 0.80 0.82 0.65 0.69 0.75 0.81 0.83 0.76 0.77 0.80 0.88 0.88 0.82 0.83 0.84 0.90 0.90 0.58 0.62 0.68 0.76 0.81 0.62 0.70 0.75 0.83 0.85 0.67 0.71 0.75 0.83 0.88 0.72 0.75 0.79 0.84 0.86 0.86 0.88 0.90 0.93 0.94 0.91 0.91 0.92 0.92 0.93
2.5,
Actual Residence Time (SW)
Fig. 5. Calculation of global rate constant for isopropanol destruction at 687°C and various con- centrations of H,Os. ( n ) 0 ppm; ( + ) 400 ppm; (*) 800 ppm; ( 0 ) 1860 ppm; and ( x ) 2400 ppm.
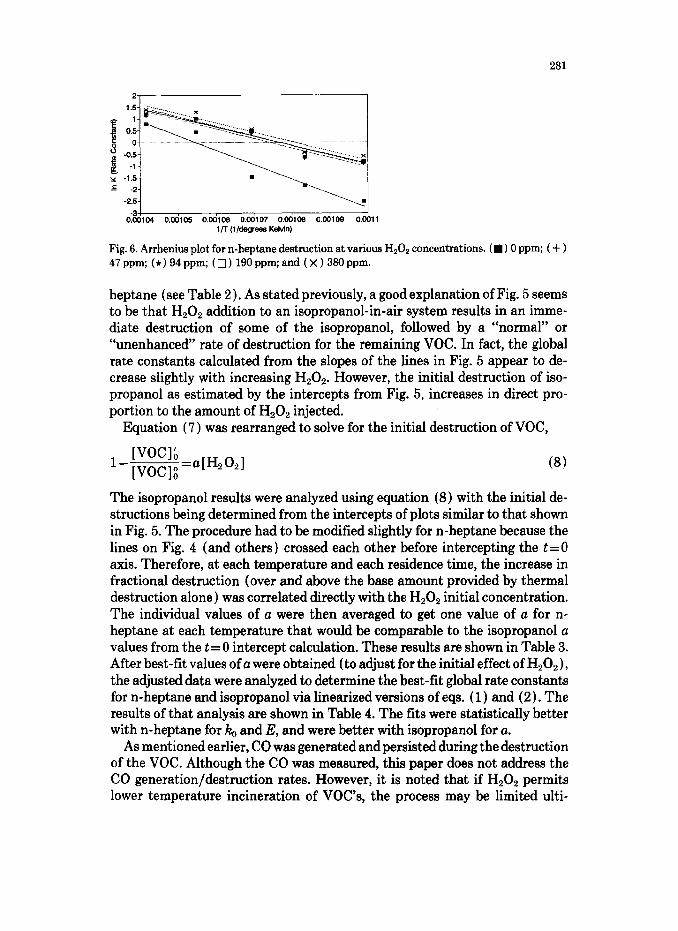
activation energy for n-heptane as shown in Fig. 6, but apparently had little effect on E for isopropanol.
The isopropanol results were in general similar to those observed with n-
281
.1.5- -2-
.2.5- 4 I
0:&104 O.WlO5 0.00106 0.00107 0.00100 0.00109 O.Wll l~T(l/degreesKeivin)
Fig. 6. Arrhenius plot for n-heptane destruction at various H,Oz concentrations. (W) 0 ppm; ( + ) 47 ppm; (*) 94 ppm; ( q ) 190 ppm; and ( x ) 380 ppm.
heptane (see Table 2). As stated previously, a good explanation of Fig. 5 seems to be that H,O, addition to an isopropanol-in-air system results in an imme- diate destruction of some of the isopropanol, followed by a “normal” or “unenhanced” rate of destruction for the remaining VOC. In fact, the global rate constants calculated from the slopes of the lines in Fig. 5 appear to de- crease slightly with increasing H202. However, the initial destruction of iso- propanol as estimated by the intercepts from Fig. 5, increases in direct pro- portion to the amount of H,O, injected.
Equation (7) was rearranged to solve for the initial destruction of VOC,
1 [voclb=a[H,O,] - [VOC]$
The isopropanol results were analyzed using equation (8) with the initial de- structions being determined from the intercepts of plots similar to that shown in Fig. 5. The procedure had to be modified slightly for n-heptane because the lines on Fig. 4 (and others) crossed each other before intercepting the t=O axis. Therefore, at each temperature and each residence time, the increase in fractional destruction (over and above the base amount provided by thermal destruction alone) was correlated directly with the H202 initial concentration. The individual values of a were then averaged to get. one value of a for n- heptane at each temperature that would be comparable to the isopropanol a values from the t= 0 intercept calculation. These results are shown in Table 3. After best-fit values of a were obtained (to adjust for the initial effect of H,O,), the adjusted data were analyzed to determine the best-fit global rate constants for n-heptane and isopropanol via linearized versions of eqs. (1) and (2). The results of that analysis are shown in Table 4. The fits were statistically better with n-heptane for b and E, and were better with isopropanol for a.
As mentioned earlier, CO was generated and persisted during the destruction of the VOC. Although the CO was measured, this paper does not address the CO generation/destruction rates. However, it is noted that if H202 permits lower temperature incineration of VOC’s, the process may be limited ulti-
284
determined to be most effective was shown previously in Fig. 2. The effective- ness of the Hz02 might be linked to the temperature of introduction for the H,O, (see Table 5).
This research has potential usefulness to commercial hazardous waste in- cinerator (or even solid waste incinerator) operators. For an existing inciner- ator that is not meeting standards for destruction of toxics, the introduction of H,O, into the post flame gases may be an economical way to achieve a better destruction efficiency. An injection nozzle and pumping system is a relatively easy retrofit, and might even allow operation at a lower temperature (thus reducing NO, formation). It is recognized that even a small addition of water solutions of H,O, would require some small additional fuel consumption to maintain the same operating temperature and compensate for the heat needed for vaporizing the water.
It should be mentioned that work is underway at UCF to study the enhance- ment effects of ozone on VOC destruction. Also, we plan to extend the H,O, work to other VOCs (including chlorinated VOCs).
Conclusions
The introduction of H202 into a hot air stream with premixed VOC vapors clearly enhances the VOC oxidation. This enhancement occurs for at least two VOCs over the range of temperatures and residence times typical of VOC in- cinerators. Carbon monoxide is produced as one of the products of incomplete combustion and likely is more difficult to destroy than many of the VOCs. It is possible that H,O, injection may prove to be a commercially economical way to provide destruction of certain hazardous organics, but more study is needed to quantify all the benefits and costs.
Acknowledgements
This work was a joint project involving the faculty and graduate students, and the equipment and laboratories of the Civil and Environmental Engineer- ing Department, and the Department of Chemistry, University of Central Florida. The work was sponsored by the Gulf Coast Hazardous Substance Re- search Center (GCHSRC) using funds provided by the U.S. Environmental Protection Agency. The opinions expressed herein are those of the authors and do not necessarily reflect the views of the GCHSRC or the U.S. EPA.
References
1 Anonymous, Hydrogen peroxide destroys dioxins, Chem. Eng., 97( 1) (1990) 21. 2 J.N. Bradley, Flame and Combustion Phenomena, Methuen and Co., Ltd., London, 1969.
285
3 J.B. Howard, G.C. Williams and D.H. Fine, Kinetics of carbon monoxide oxidation in post- flame gases, Fourteenth Symposium (Int.) on Combustion, The Combustion Institute, Pitts- burg, PA, 19’73, p. 975.
4 K.C. Lee, J.L. Hansen and D.C. Macauley, Predictive model of the time-temperature re- quirements for thermal destruction of dilute organic vapors, 72nd Annual Meeting of the Air Pollution Control Association, Paper No. 79-10.1, Cincinnati, OH, June 24-29,1979.
5 KC. Lee, N. Morgan, J.L. Hansen and G.M. Whipple, Revised model for the prediction of the time-temperature requirements for thermal destruction of dilute organic vapors and its usage for predicting compound destructability. 75th Annual Meeting of the Air Pollution Control Association, Paper No. 82-5.3, New Orleans, LA, June 20-25,1982.
6 C.D. Cooper, F.C. Alley and T.J. Overcamp, Hydrocarbon vapor incineration kinetics, En- viron. Prog., 1 (1982) 129.
7 C.D. Cooper and F.C. Alley, Kinetic analysis of a non-isothermal reactor, AIChE J., 27 (1981) 1039.
8 A.M. Mellor, Current kinetic modeling techniques for continuous flow combustors, In: Emis- sions from Continuous Combustion Systems, W. Cornelius and W.G. Agnew (Eds.), Plenum Press, New York, NY, 1972, p. 23.
9 SM. Senkan, Thermal destruction of hazardous wastes, Environ. Sci. Technol., 22 (4) (1988) 368.
10 W.C. Schumb, C.N. Satterfield and R.L. Wentworth, Hydrogen Peroxide, ACS Monograph Series, Reinhold Pub. Co., New York, NY, 1968.
11 W.A. Rubey and R.A. Carnes, Design of a tubular reactor instrumentation assembly for con- ducting thermal decomposition studies. Rev. Sci. Instrum., 56( 9) (1985) 1795.
12 J.M. McKelvey and H.E. Hoelscher, Apparatus for preparation of very dilute gas mixtures, Anal. Chem., 29(l) (1957) 123.
Copyright © 2022 FDOKUMEN