
Enhanced microarray performance using low complexity representations of the transcriptome
7
Enhanced microarray performance using low complexity representations of the transcriptome Gae ¨lle Rondeau, Michael McClelland, Toan Nguyen, Rosana Risques 1 , Yipeng Wang, Martin Judex 2 , Ann H. Cho and John Welsh* Sidney Kimmel Cancer Center, 10835 Altman Row, San Diego, CA 92121, USA, 1 Department of Pathology, University of Washington, Box 357705, 1959 NE Pacific Ave HSB K-081, Seattle, WA 98195, USA and 2 Klinikum rechts der Isar, III. Medizinische Klinik, Ismaningerstrasse 22, 81675 Mu ¨nchen, Germany Received February 16, 2005; Revised May 10, 2005; Accepted May 29, 2005 ABSTRACT Low abundance mRNAs are more difficult to examine using microarrays than high abundance mRNAs due to the effect of concentration on hybridization kinetics and signal-to-noise ratios. This report des- cribes the use of low complexity representations (LCRs) of mRNA as the targets for cDNA microarrays. Individual sequences in LCRs are more highly rep- resented than in the mRNA populations from which they are derived, leading to favorable hybridization kinetics. LCR targets permit the measurement of abundance changes that are difficult to measure using oligo(dT) priming for target synthesis. An oligo(dT)-primed target and three LCRs detect twice as many differentially regulated genes as could be detected by the oligo(dT)-primed target alone, in an experiment in which serum-starved fibroblasts res- ponded to the reintroduction of serum. Thus, this tar- get preparation strategy considerably increases the sensitivity of cDNA microarrays. INTRODUCTION cDNA and oligonucleotide microarrays are convenient for identifying changes in mRNA abundances (1–3). The propor- tion of transcripts that can be detected and measured and the accuracy of measurements of changes in transcript abundance determine the kinds of problems that can be addressed using microarrays. The abundance of a transcript can fall well below one copy per cell, on average, such as in cases where a tran- script is rare but biologically active, in cases where a message has a brief transcription window, such as during cell cycle, or in complex clinical samples where cells with high expression are mixed with cells with low expression or no expression. However, sensitivities in the range of one or a few transcripts per mammalian cell are difficult to achieve routinely, and experimental noise at the lower limits of sensitivity complic- ates the quantitative assessment of changes in gene expression. While the measurement of changes in relatively abundant transcripts is appropriate for certain goals, such as in the clas- sification of cancer types (4–9), greater sensitivity and accur- acy is often desirable, if not necessary, such as in surveys for changes in individual transcript abundances that are important in diseases, or when analysis is hampered by missing data (10). This report describes a strategy for improving microarray performance by using subsets, or low complexity representa- tions (LCRs), of the transcriptome as microarray targets. There are several methods for producing LCRs (11–14). Here, we use arbitrarily primed PCR applied to oligo(dT)-primed first strand cDNA to generate LCRs. In contrast to a random pri- mer, most of the positions in an arbitrary primer are specified, but its sequence need not be chosen on the basis of homology, as would be the case with a specific PCR primer. Arbitrarily primed PCR amplifies the sequences between sites in a DNA template where an arbitrary primer or a pair of arbitrary pri- mers find approximate matches on opposite strands in close proximity. The complex class of transcripts participates in this reaction more often than the less complex class of abundant transcripts due to these requirements. As a result, arbitrary sets of rare transcripts become highly represented in the reaction product. The sequence of the arbitrary primers, the character- istics of arbitrary priming sites, their distance from one another and the characteristics of the sequences that they flank deter- mine the sequences that are amplified and the extent of their amplification. Different primers result in the amplification of different subsets of the original mRNA sequence space, including different transcripts and different parts of mRNA isoforms. Sequences amplify reproducibly such that, when two different mRNA populations are compared, differences in expression can be detected (15). Lower complexity, over- representation of sequences from the class of rare transcripts, *To whom correspondence should be addressed. Tel: +1 858 450 5990; Fax: +1 858 450 3251; Email: [email protected] Ó The Author 2005. Published by Oxford University Press. All rights reserved. The online version of this article has been published under an open access model. Users are entitled to use, reproduce, disseminate, or display the open access version of this article for non-commercial purposes provided that: the original authorship is properly and fully attributed; the Journal and Oxford University Press are attributed as the original place of publication with the correct citation details given; if an article is subsequently reproduced or disseminated not in its entirety but only in part or as a derivative work this must be clearly indicated. For commercial re-use, please contact [email protected] Nucleic Acids Research, 2005, Vol. 33, No. 11 e100 doi:10.1093/nar/gni095 Published online June 24, 2005 by guest on September 2, 2014 http://nar.oxfordjournals.org/ Downloaded from
-
Upload
independent -
Category
Documents
-
view
0 -
download
0
Transcript of Enhanced microarray performance using low complexity representations of the transcriptome
Enhanced microarray performance using lowcomplexity representations of the transcriptomeGaelle Rondeau, Michael McClelland, Toan Nguyen, Rosana Risques1,
Yipeng Wang, Martin Judex2, Ann H. Cho and John Welsh*
Sidney Kimmel Cancer Center, 10835 Altman Row, San Diego, CA 92121, USA, 1Department of Pathology,University of Washington, Box 357705, 1959 NE Pacific Ave HSB K-081, Seattle, WA 98195, USA and 2Klinikumrechts der Isar, III. Medizinische Klinik, Ismaningerstrasse 22, 81675 Munchen, Germany
Received February 16, 2005; Revised May 10, 2005; Accepted May 29, 2005
ABSTRACT
Low abundance mRNAs are more difficult to examineusing microarrays than high abundance mRNAsdue to the effect of concentration on hybridizationkinetics and signal-to-noise ratios. This report des-cribes the use of low complexity representations(LCRs) of mRNA as the targets for cDNA microarrays.Individual sequences in LCRs are more highly rep-resented than in the mRNA populations from whichthey are derived, leading to favorable hybridizationkinetics. LCR targets permit the measurement ofabundance changes that are difficult to measureusing oligo(dT) priming for target synthesis. Anoligo(dT)-primed target and three LCRs detect twiceas many differentially regulated genes as could bedetected by the oligo(dT)-primed target alone, in anexperiment in which serum-starved fibroblasts res-ponded to the reintroduction of serum. Thus, this tar-get preparation strategy considerably increases thesensitivity of cDNA microarrays.
INTRODUCTION
cDNA and oligonucleotide microarrays are convenient foridentifying changes in mRNA abundances (1–3). The propor-tion of transcripts that can be detected and measured and theaccuracy of measurements of changes in transcript abundancedetermine the kinds of problems that can be addressed usingmicroarrays. The abundance of a transcript can fall well belowone copy per cell, on average, such as in cases where a tran-script is rare but biologically active, in cases where a messagehas a brief transcription window, such as during cell cycle, orin complex clinical samples where cells with high expressionare mixed with cells with low expression or no expression.
However, sensitivities in the range of one or a few transcriptsper mammalian cell are difficult to achieve routinely, andexperimental noise at the lower limits of sensitivity complic-ates the quantitative assessment of changes in gene expression.While the measurement of changes in relatively abundanttranscripts is appropriate for certain goals, such as in the clas-sification of cancer types (4–9), greater sensitivity and accur-acy is often desirable, if not necessary, such as in surveys forchanges in individual transcript abundances that are importantin diseases, or when analysis is hampered by missing data (10).
This report describes a strategy for improving microarrayperformance by using subsets, or low complexity representa-tions (LCRs), of the transcriptome as microarray targets. Thereare several methods for producing LCRs (11–14). Here, weuse arbitrarily primed PCR applied to oligo(dT)-primed firststrand cDNA to generate LCRs. In contrast to a random pri-mer, most of the positions in an arbitrary primer are specified,but its sequence need not be chosen on the basis of homology,as would be the case with a specific PCR primer. Arbitrarilyprimed PCR amplifies the sequences between sites in a DNAtemplate where an arbitrary primer or a pair of arbitrary pri-mers find approximate matches on opposite strands in closeproximity. The complex class of transcripts participates in thisreaction more often than the less complex class of abundanttranscripts due to these requirements. As a result, arbitrary setsof rare transcripts become highly represented in the reactionproduct. The sequence of the arbitrary primers, the character-istics of arbitrary priming sites, their distance from one anotherand the characteristics of the sequences that they flank deter-mine the sequences that are amplified and the extent of theiramplification. Different primers result in the amplification ofdifferent subsets of the original mRNA sequence space,including different transcripts and different parts of mRNAisoforms. Sequences amplify reproducibly such that, whentwo different mRNA populations are compared, differencesin expression can be detected (15). Lower complexity, over-representation of sequences from the class of rare transcripts,
*To whom correspondence should be addressed. Tel: +1 858 450 5990; Fax: +1 858 450 3251; Email: [email protected]
� The Author 2005. Published by Oxford University Press. All rights reserved.
The online version of this article has been published under an open access model. Users are entitled to use, reproduce, disseminate, or display the open accessversion of this article for non-commercial purposes provided that: the original authorship is properly and fully attributed; the Journal and Oxford University Pressare attributed as the original place of publication with the correct citation details given; if an article is subsequently reproduced or disseminated not in its entirety butonly in part or as a derivative work this must be clearly indicated. For commercial re-use, please contact [email protected]
Nucleic Acids Research, 2005, Vol. 33, No. 11 e100doi:10.1093/nar/gni095
Published online June 24, 2005 by guest on Septem
ber 2, 2014http://nar.oxfordjournals.org/
Dow
nloaded from
and differential selection of isoforms and family memberssuggested that LCRs may be useful for measuring changesin the abundances of rare transcripts that are difficult tomeasure accurately using cDNA microarrays. In previouswork, LCRs made using arbitrary priming methods (11,13)allowed the measurement of abundance changes in transcriptsthat were difficult to detect using oligo(dT)-primed reverse-transcribed targets applied to nylon membrane cDNA arrays(16,17). Here, this approach is adapted to glass slide microar-rays. Individual LCRs can detect one-third to one-half of alltranscripts, and three different LCRs used in combination withan oligo(dT)-primed target can detect 80% of all genes rep-resented on a cDNA microarray. The number of differentiallyregulated genes that can be detected and measured using threeLCRs together with oligo(dT)-primed targets is �2-foldhigher than can be detected and measured using oligo(dT)-primed targets alone.
MATERIALS AND METHODS
Cell lines and RNA preparation
Human fibroblast from ATCC (CRL 2091) were grownto �80% confluence in 150 cm dishes in DMEM with 10%fetal bovine serum (heat inactivated at 56�C for 30 min,Omega scientific), and with 200 U/ml penicillin and200 mg/ml streptomycin. For serum starvation, cells weregrown in media containing 0.01% serum for 48 h as describedpreviously (3), and then were treated with 10% serum for 0(i.e. no serum), 1 and 4 h. Cells were washed with ice-coldphosphate-buffered saline, and total RNA was prepared usingan RNeasy Mini Kit (Qiagen, Valencia, CA). RNA concen-tration was determined spectroscopically, and integrity wasassessed qualitatively by agarose gel electrophoresis.
LCR preparation
LCRs were prepared using RNA arbitrarily primed PCR(11,16,17). Reverse transcription was performed on 5 mgtotal RNA using an oligo(dT)20-VN primer (Genosys Biotech-nologies, The Woodlands, TX). The reactions contained50 mM Tris–HCl, pH 8.3, 75 mM KCl, 3 mM MgCl2,20 mM DTT, 0.2 mM each dNTP, 0.5 mM primer and 20 UM-MuLV reverse transcriptase (Promega, Madison, WI), in afinal volume of 200 ml. Reverse transcription was performedat room temperature for 15 min, followed by 37�C for 1 h.Reactions were stopped by heating for 5 min in boiling waterand cooling on ice. cDNA was diluted to 3 ng/ml with distilledwater prior to the PCRs.
Primers synthesized by Genosys Biotechnologies used togenerate LCRs were (in 50–30 orientation) pm13 (CAGTGG-GAG + AGTGAGCAC), pm14 (ACGAAGAAG + AGGGC-ACCAC), pm19 (RRRGACAGTG), pm20 (RRRCTGCGCT),pm21 (CAGAGGTRRR), pm22 (AACGGCGRRR), pm23(AACGGCGACR), pm24 (GGGTGTGTAR), pm25 (GGT-GAACGRR), pm28 (RTCCCCGCGA), pm29 (RRATGC-CACT), pm30 (RRTTCGGAAG), pm31 (TCCGATGCTG),pm32 (TGACGTCCGATGCTG), pm33 (GTGACAGACA),pm34 (AACTGGTGACAGACA), pm35 (TGCGAAGGG-GCACCA), pm36 (AACTGGAACTAGGGGCACCA), pm37(AGGGGCACCA) and pm38 (TGCGAAGGGGCACCA).
Diluted cDNA (25 ml) was mixed with an equal volume of2· PCR mixture containing 20 mM Tris–HCl, pH 8.3, 20 mMKCl, 6 mM MgCl2, 0.35 mM each dNTP, 2 mM each primer,2 mCi [a-32P]dCTP (ICN, Irvine, CA) and 0.5 U/ml AmpliTaqDNA polymerase Stoffel fragment (Applied Biosystems,Foster City, CA). Thermocycling used 3 min at 94�C followedby 35 cycles of 94�C for 1 min, 35�C for 1 min and 72�C for2 min. Product was purified using a QIAquick PCR Puri-fication Kit (Qiagen) and examined for repeatability onsequencing-style polyacrylamide gels. For fluorescent dyelabeling, 1 mg of RNA arbitrarily primed PCR product wasmixed with 12 mg of random hexamer and boiled for 5 min at95�C. Reactions were performed at 37�C overnight in 50 mlof buffer containing 10 mM Tris–HCl, pH 7.4, 5 mM MgCl2,7.5 mM DTT, 0.025 mM dATP, dCTP, dGTP and 0.009 mMdTTP, 0.014 mM Cy3- or Cy5-linked dUTP (Amersham,Arlington Heights, IL) and 10 U of exonuclease-free Klenow(New England Biolabs Inc., Beverly, MA). The targets werepurified with QIAquick PCR Purification Kit (Qiagen).Labeling was checked by spectrophotometry at 550 and650 nm for Cy3 and Cy5, respectively.
Microarray preparation
Human cDNA clones (I.M.A.G.E) (Research Genetics/Invitrogen) were grown overnight in 96 well plates, insertswere amplified using vector-specific primers and purifiedusing multiscreen filter plates (Millipore, Billerica, MA).Each amplified cDNA was combined 1:1 with dimethyl sulfox-ide for arraying as described previously (18) and printed ontoUltra-GAPS coated glass microscope slides (Corning Inc.LifeSciences, Acton, MA) using an OmniGrid 100 printer(Genomic Solutions Ann Arbor, MI) at 40–60% relative humid-ity. Printed slides were UV cross-linked (250 mJ), baked for 3 hat 80�C and stored at room temperature in a desiccator.
Hybridization and washes
After incorporation of fluorescent nucleotides, the LCR andoligo(dT)-primed targets were lyophilized and brought to afinal volume of 45 ml in 25% formamide, 5· SSC, 0.1% SDSand blocking agent [poly(A)15, yeast tRNA and COT-1 DNA].The target was heated for 5 min at 95�C, centrifuged briefly,and immediately applied to the slide in a hybridization cham-ber. The chambers were submerged in a 42�C water bathovernight. The slides were washed for 30 min at 42�C in a2· SSC, 0.1% SDS solution and two times for 30 min at roomtemperature in 0.1· SSC, 0.1% SDS and in 0.1· SSC solu-tions, sequentially. Fluorescence intensities were measuredusing a ScanArray5000 (Hewlett Packard) laser scanner.
Real-time RT–PCR
Real-time PCRs were performed in a solution containingSybrGreen I, 0.35 mM 6-ROX (Molecular Probes, EugeneOR), 0.2 mM dNTP, 1· PCR buffer (Qiagen), 4 mM MgCl2,5 mM each primer and 0.025 U of HotStartTaq DNA poly-merase (Qiagen), using an ABI PRISM 7900HT SequenceDetector. Thermocycling was performed with an initial10 min incubation at 95�C followed by 50 cycles of 95�Cfor 15 s, 60�C for 1 min and 72�C for 30 s. This cycling reactionwas followed with 2 min at 95�C, 15 s at 60�C and 15 s at 95�C.A standard curve for each gene was prepared with a four point
e100 Nucleic Acids Research, 2005, Vol. 33, No. 11 PAGE 2 OF 7
by guest on September 2, 2014
http://nar.oxfordjournals.org/D
ownloaded from
dilution series. Each measurement was made in duplicate.Measurements were normalized to an internal glyceraldehyde-3-phosphate dehydrogenase RNA. Oligonucleotide primersused are described in the Supplementary Table 1.
RESULTS
LCRs select and amplify subsets of mRNA sequences
With nylon membrane arrays, it had been shown that LCRsselect and amplify subsets of the mRNA represented in anoligo(dT)-primed target (16,17). To demonstrate this effectusing microarrays, total RNA was isolated from growinghuman fibroblasts, followed by target synthesis using anchoredoligo(dT) priming or RNA arbitrarily primed PCR to makean LCR. These were compared by hybridization to a glassslide cDNA microarray containing several thousand humangene sequences. The two target preparation methods resultedin different sequence-specific signal intensities (Figure 1). Inmany cases, the LCR-derived signal exceeded the oligo(dT)-target-derived signal and vice versa. This suggested that LCRscould be used to enhance signals for some transcripts onmicroarrays, consistent with previous studies using LCRs astargets for cDNA arrays printed on nylon membranes (16,17).
LCRs can detect differential gene regulation
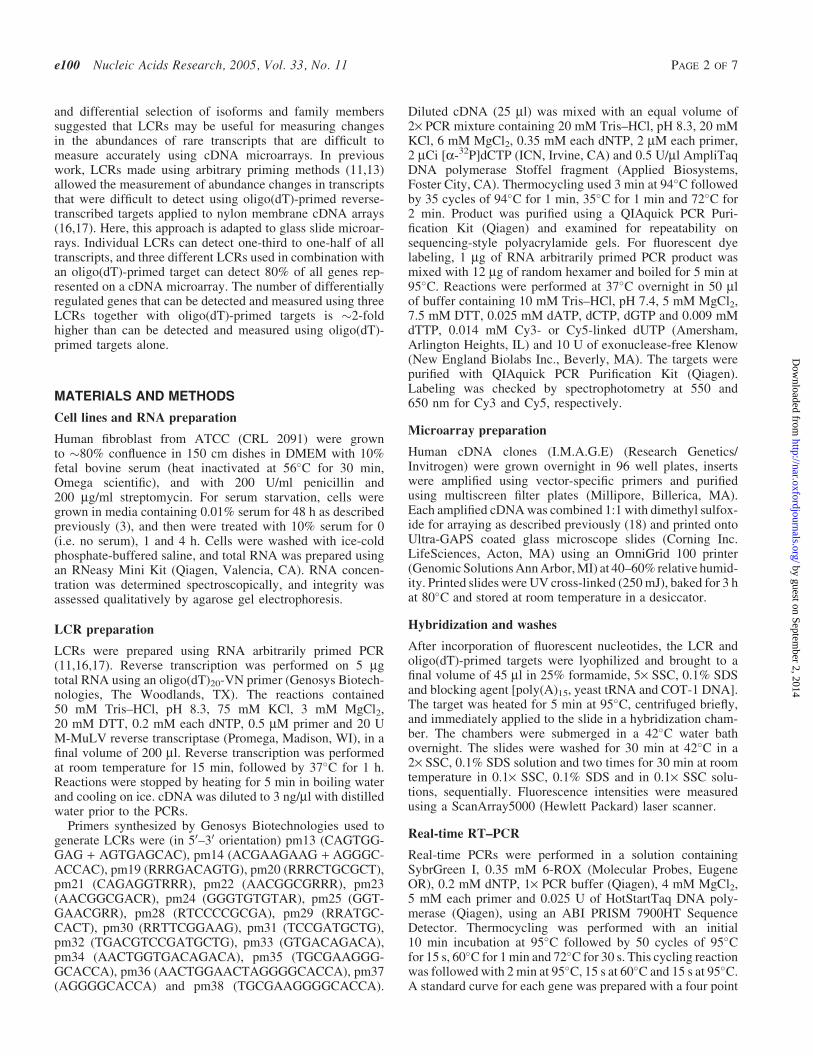
The differential amplification of sequences in an LCR, whencompared with an oligo(dT)-primed target or with differentLCRs, suggested that LCRs could be used to detect differentialgene expression in cases where the signal from an oligo(dT)-primed target is too weak to be useful. However, first, it wasnecessary to demonstrate that LCRs could, indeed, be used astargets for microarrays to measure differential gene expres-sion. Transcripts having altered abundances 4 h after the addi-tion of serum to serum-starved fibroblasts were measured bymicroarray analysis of an LCR target (LCR pm22), and thesemeasurements were compared with real-time RT–PCR meas-urements. Each microarray contained three identical subarrays
of 4621 spotted probes, 3770 of which were human genesequences, and the rest of which were controls of varioussorts, including 96 Salmonella sequences that served as neg-ative controls for non-specific signals. Analyses were per-formed using the limma package in BioConductor and theR programming environment (19–21). Fluorescence intensitymeasurements from human and control gene sequences wereadjusted using background subtraction, print-tip loess normal-ization and scaling between reciprocal dye-swap pairs ofchips. MA plots were constructed [M = log2R � log2G;A = (log2R + log2G)/2] on the background subtracted, nor-malized and scaled channel intensities for visual inspection ofthe data (Supplementary Table 2 and Supplementary Figure 1a).Real-time RT–PCR was performed for 17 transcripts thatshowed an apparent change in abundance in the microarrayexperiment, and had a modified t-statistic with P < 0.05 (21).Primers for real-time RT–PCR spanned splice junctions toavoid amplification from unspliced mRNA or from possiblegenomic contamination. Agreement between the two quant-itation methods was observed, with Pearson’s correlationr = 0.90 (Figure 2). This indicated that LCRs can be usedas targets for microarrays to discover mRNA abundancechanges. Data have been deposited in the NCBI Gene Expres-sion Omnibus (GEO) (http://www.ncbi.nlm.nih.gov/geo)(GEO GSE2655).
LCRs detect differential gene regulation notdetected by oligo(dT)-primed targets
The enrichment of certain sequences in LCRs and thedepletion of others suggested that LCRs might be used todetect differential gene regulation for genes that are normallydifficult to study using only an oligo(dT)-primed target, due
Figure 1. LCRs enhance subsets of mRNA sequences. Comparison betweenoligo(dT) and an LCR target on a microarray. The LCM target (red) displaysdifferent sequence representation than the oligo(dT) target (green), which isseen as different ratios of red and green false coloring of fluorescence signalintensity.
Figure 2. LCR targets can detect differential gene regulation. LCR pm22 targetwas prepared from RNA from serum-starved and starved-refed fibroblasts 4 hafter refeeding, and analyzed using microarrays. Differentially regulated genesdetected by the LCR were quantified using real-time RT–PCR. This figureshows that the log2 ratios (M) of transcripts from the two methods correlate welland confirms that LCRs reliably report differential transcript abundance. Axislabel ‘M.LCR’ is the average log2 ratio of the normalized channel intensities, I,for the 4 and 0 h treatments, i.e. M.LCR = log2(It=4/It=0), reported by the LCRtarget, and ‘M.Real-time RT–PCR’ is the log2 of the corresponding ratioreported by real-time RT–PCR. Pearson’s correlation, r, is shown.
PAGE 3 OF 7 Nucleic Acids Research, 2005, Vol. 33, No. 11 e100
by guest on September 2, 2014
http://nar.oxfordjournals.org/D
ownloaded from
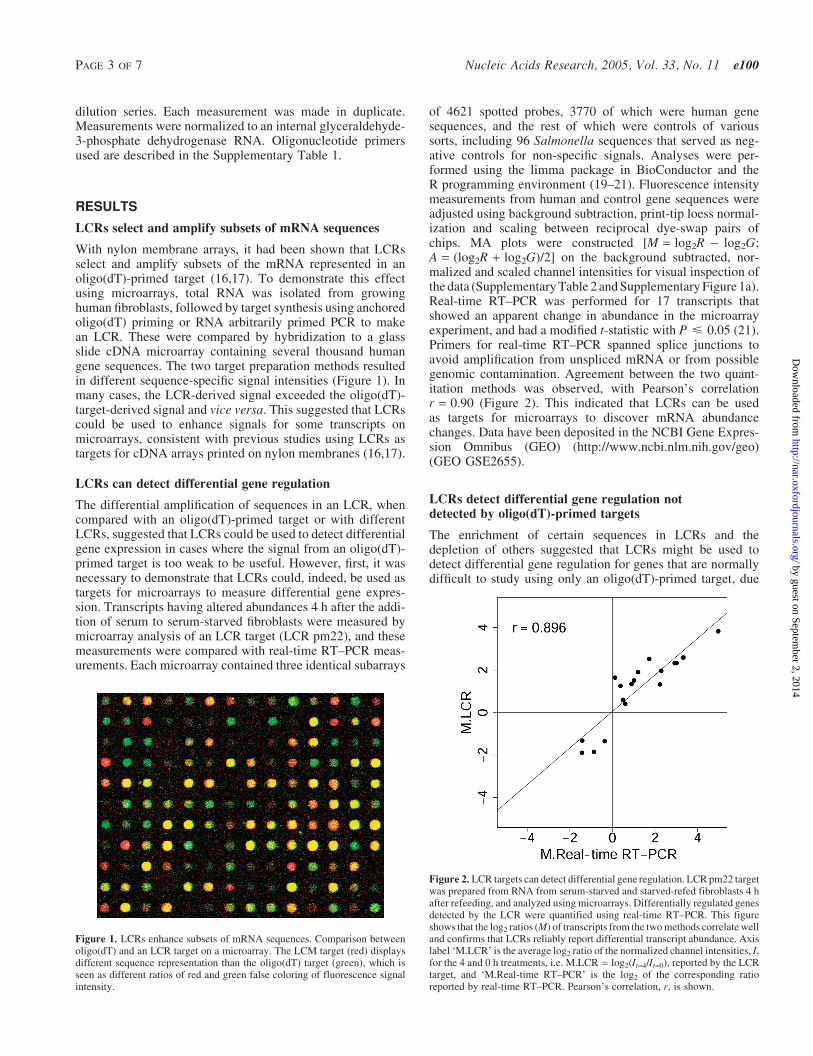
to their low representation in the mRNA population. TotalRNA was harvested from serum-starved fibroblasts beforeand 1 h after the reintroduction of serum. Two replicatebiological experiments and the corresponding reciprocaldye-swap experiments were performed for each probe type.Every scanner ‘channel’ corresponded to an independentlysynthesized LCR, such that four microarrays represent resultsfrom eight independent LCRs. This design was chosen so thatvariance in LCR preparation could be explored, but in usualpractice, the dye-swap replicates would comprise technicalreciprocal labeling, as is commonly done. LCRs were madeusing the arbitrary sequence oligonucleotide primers pm19,pm22 and pm28. Oligo(dT)-primed and LCR targets werelabeled with Cye dyes and hybridized to microarrays todetect genes that were differentially regulated between thetwo biological conditions. LCRs made using RAP–PCR arereproducible, as shown in Figure 3. Intensities for eachgene were determined from each microarray, with print-tiploess normalization and scaling between chips. Two intensityvectors were generated by averaging, gene-by-gene, one arrayfrom each biological replicate and its reciprocal from the otherbiological replicate, and the log2 of the resulting averages wereplotted as scatter plots. Figure 3 shows that correlations ofr > 0.94 were achieved for all four target types. Similar ana-lysis of any of the three subarrays gave correlations r > 0.95for all target types. Analysis of single biological replicates (i.e.from a single pair of chips) gave correlations of r > 0.95 forall but pm28, which gave r = 0.93 and r = 0.91 for the twobiological replicates, respectively. Background subtractionincreased scatter due to variance in the background, itself,particularly for lower signals, but had only a minor effecton the overall correlation (r > 0.93) (data not shown). IfRAP–PCR amplified sequences only according to theoccurrence of a partial match between the arbitrary primerand its target, and no other efficiency terms were involved,
one may expect that subsets of mRNA sequences would besampled, but that their representation in the final productwould remain unchanged relative to their representation inan oligo(dT)-primed target. This is not the case, however.Scatter plots between different LCRs are not concentratedalong the diagonal, and correlations are below r = 0.65 forall pairwise comparisons between LCRs, and between LCRsand the oligo(dT)-primed targets (Supplementary Figure 2).Combined, these observations indicate that the large differ-ences between the oligo(dT)-primed targets and the LCR tar-gets result from reproducible differences in the sequencerepresentations contained within the LCR targets, and notfrom variance intrinsic to the LCRs. Thus, LCR synthesiscan be simple and robust, and can detect differential generegulation when hybridized to microarrays.
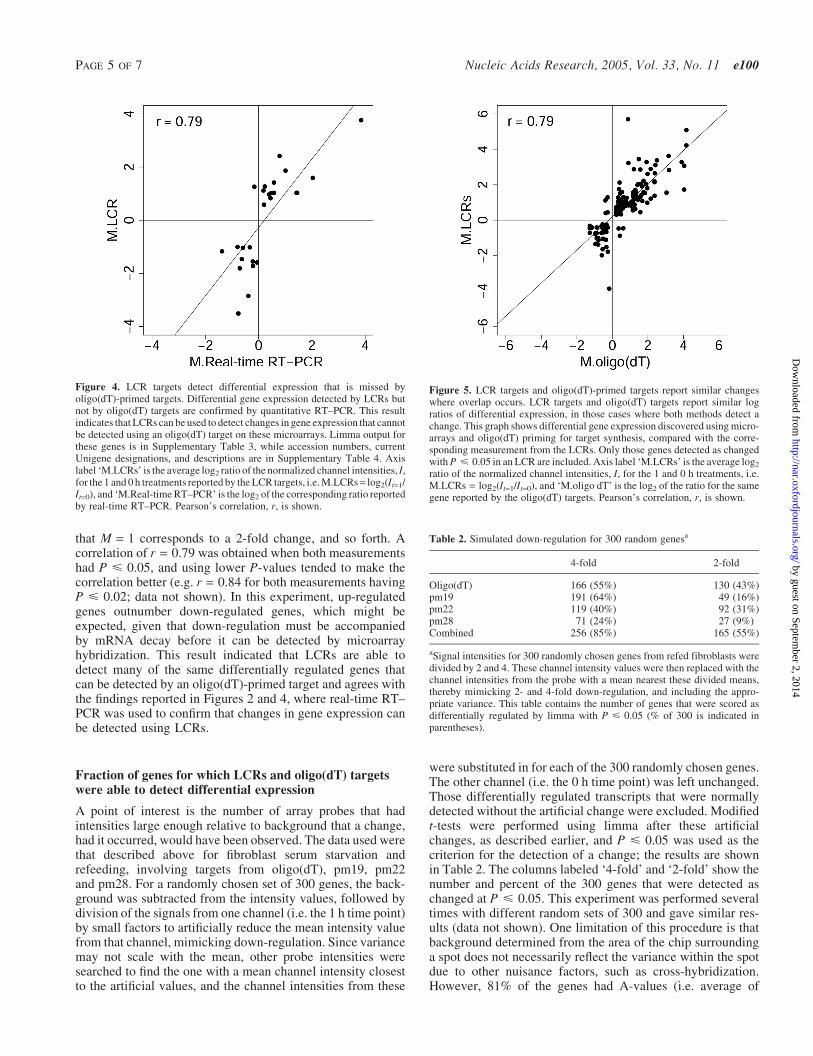
LCR targets can detect changes in transcript levels that aremissed by oligo(dT)-primed targets. The modified t-statisticsand associated P-values calculated for the four target types,using limma, BioConductor and R (19–21) as described above(Supplementary Table 2), were used to assess differential generegulation in response to introduction of serum to serum-starved fibroblasts (see Table 1). Using P < 0.05 as a thresh-old, the oligo(dT) target detected changes in 325 transcriptsout of the 3770 represented on the chip, and 213 of these wereunique to the oligo(dT) target, while the remaining 112 werealso detected as changes by one or more of the LCR targets.The three LCRs, combined, detected changes in 416 tran-scripts, 304 of which were missed by the oligo(dT) target.LCRs from pm19, pm22 and pm28 contributed 123, 149and 41 of these 304 changes, respectively, with some overlap.Figure 4 shows the correlation between those mRNA abund-ance changes detected only by the LCRs and the samechanges measured by quantitative RT–PCR. High Pearson’scorrelation (r = 0.79) indicates that LCRs are able to detectdifferential gene expression that is largely invisible tooligo(dT)-derived targets. When the changes in these tran-scripts measured using oligo(dT)-derived targets were com-pared with the real-time RT–PCR measurements, correlationwas lower (r = 0.55), as would be expected from their higherP-values. Individual gene results, accession numbers anddescriptions are available in Supplementary Tables 3 and 4.
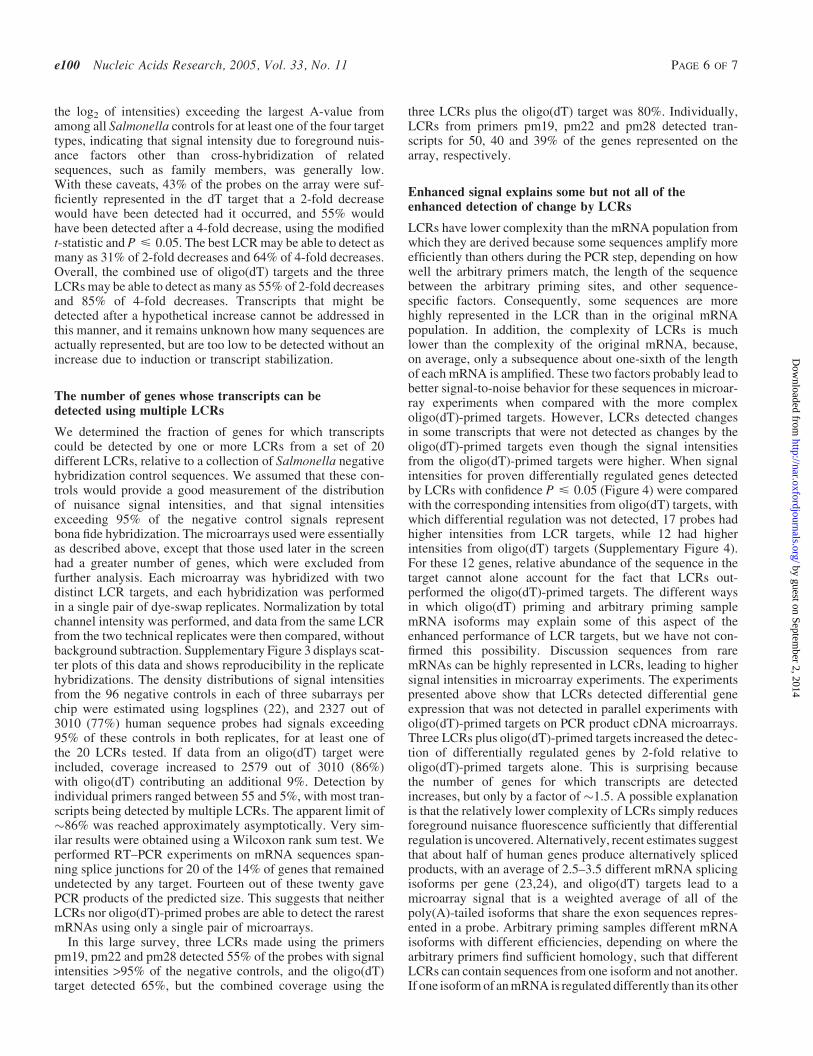
Further confirmation that LCRs reliably report differentialgene regulation can be seen in the comparison of changes inexpression reported by LCR targets with those reported byoligo(dT) targets for those cases where both target typesreported changes. Figure 5 shows the correlation betweenM-values calculated for these transcripts. Recall that M isthe log2 of the ratio of normalized channel intensities, such
Figure 3. Reproducibility. Scatter plots of average intensities from technicaland biological replicates. Each average was calculated from loess adjusted,normalized intensities from dye-swap replicate microarrays, one from eachbiological replicate. (a) oligo(dT) target, (b) LCR pm19, (c) LCR pm22,(d) LCR pm28.
Table 1. Detection of differential regulation by oligo(dT) and LCR targetsa
P-value threshold 0.05All changes detected 629Detected with more than one target 121Detected by oligo(dT) target and possibly by LCR targets 325Detected only by oligo(dT) target 213Detected by LCR targets and possibly by oligo(dT) target 416Detected by LCR targets only 304Detected by oligo(dT) target and one or more LCR targets 112
aDifferential gene expression detected by an oligo(dT) target and three LCRtargets, comparing serum-starved fibroblasts before and 1 h after reintroductionof serum.
e100 Nucleic Acids Research, 2005, Vol. 33, No. 11 PAGE 4 OF 7
by guest on September 2, 2014
http://nar.oxfordjournals.org/D
ownloaded from
that M = 1 corresponds to a 2-fold change, and so forth. Acorrelation of r = 0.79 was obtained when both measurementshad P < 0.05, and using lower P-values tended to make thecorrelation better (e.g. r = 0.84 for both measurements havingP < 0.02; data not shown). In this experiment, up-regulatedgenes outnumber down-regulated genes, which might beexpected, given that down-regulation must be accompaniedby mRNA decay before it can be detected by microarrayhybridization. This result indicated that LCRs are able todetect many of the same differentially regulated genes thatcan be detected by an oligo(dT)-primed target and agrees withthe findings reported in Figures 2 and 4, where real-time RT–PCR was used to confirm that changes in gene expression canbe detected using LCRs.
Fraction of genes for which LCRs and oligo(dT) targetswere able to detect differential expression
A point of interest is the number of array probes that hadintensities large enough relative to background that a change,had it occurred, would have been observed. The data used werethat described above for fibroblast serum starvation andrefeeding, involving targets from oligo(dT), pm19, pm22and pm28. For a randomly chosen set of 300 genes, the back-ground was subtracted from the intensity values, followed bydivision of the signals from one channel (i.e. the 1 h time point)by small factors to artificially reduce the mean intensity valuefrom that channel, mimicking down-regulation. Since variancemay not scale with the mean, other probe intensities weresearched to find the one with a mean channel intensity closestto the artificial values, and the channel intensities from these
were substituted in for each of the 300 randomly chosen genes.The other channel (i.e. the 0 h time point) was left unchanged.Those differentially regulated transcripts that were normallydetected without the artificial change were excluded. Modifiedt-tests were performed using limma after these artificialchanges, as described earlier, and P < 0.05 was used as thecriterion for the detection of a change; the results are shownin Table 2. The columns labeled ‘4-fold’ and ‘2-fold’ show thenumber and percent of the 300 genes that were detected aschanged at P < 0.05. This experiment was performed severaltimes with different random sets of 300 and gave similar res-ults (data not shown). One limitation of this procedure is thatbackground determined from the area of the chip surroundinga spot does not necessarily reflect the variance within the spotdue to other nuisance factors, such as cross-hybridization.However, 81% of the genes had A-values (i.e. average of
Figure 4. LCR targets detect differential expression that is missed byoligo(dT)-primed targets. Differential gene expression detected by LCRs butnot by oligo(dT) targets are confirmed by quantitative RT–PCR. This resultindicates that LCRs can be used to detect changes in gene expression that cannotbe detected using an oligo(dT) target on these microarrays. Limma output forthese genes is in Supplementary Table 3, while accession numbers, currentUnigene designations, and descriptions are in Supplementary Table 4. Axislabel ‘M.LCRs’ is the average log2 ratio of the normalized channel intensities, I,for the 1 and 0 h treatments reported by the LCR targets, i.e. M.LCRs= log2(It=1/It=0), and ‘M.Real-time RT–PCR’ is the log2 of the corresponding ratio reportedby real-time RT–PCR. Pearson’s correlation, r, is shown.
Figure 5. LCR targets and oligo(dT)-primed targets report similar changeswhere overlap occurs. LCR targets and oligo(dT) targets report similar logratios of differential expression, in those cases where both methods detect achange. This graph shows differential gene expression discovered using micro-arrays and oligo(dT) priming for target synthesis, compared with the corre-sponding measurement from the LCRs. Only those genes detected as changedwith P < 0.05 in an LCR are included. Axis label ‘M.LCRs’ is the average log2
ratio of the normalized channel intensities, I, for the 1 and 0 h treatments, i.e.M.LCRs = log2(It=1/It=0), and ‘M.oligo dT’ is the log2 of the ratio for the samegene reported by the oligo(dT) targets. Pearson’s correlation, r, is shown.
Table 2. Simulated down-regulation for 300 random genesa
4-fold 2-fold
Oligo(dT) 166 (55%) 130 (43%)pm19 191 (64%) 49 (16%)pm22 119 (40%) 92 (31%)pm28 71 (24%) 27 (9%)Combined 256 (85%) 165 (55%)
aSignal intensities for 300 randomly chosen genes from refed fibroblasts weredivided by 2 and 4. These channel intensity values were then replaced with thechannel intensities from the probe with a mean nearest these divided means,thereby mimicking 2- and 4-fold down-regulation, and including the appro-priate variance. This table contains the number of genes that were scored asdifferentially regulated by limma with P < 0.05 (% of 300 is indicated inparentheses).
PAGE 5 OF 7 Nucleic Acids Research, 2005, Vol. 33, No. 11 e100
by guest on September 2, 2014
http://nar.oxfordjournals.org/D
ownloaded from
the log2 of intensities) exceeding the largest A-value fromamong all Salmonella controls for at least one of the four targettypes, indicating that signal intensity due to foreground nuis-ance factors other than cross-hybridization of relatedsequences, such as family members, was generally low.With these caveats, 43% of the probes on the array were suf-ficiently represented in the dT target that a 2-fold decreasewould have been detected had it occurred, and 55% wouldhave been detected after a 4-fold decrease, using the modifiedt-statistic and P < 0.05. The best LCR may be able to detect asmany as 31% of 2-fold decreases and 64% of 4-fold decreases.Overall, the combined use of oligo(dT) targets and the threeLCRs may be able to detect as many as 55% of 2-fold decreasesand 85% of 4-fold decreases. Transcripts that might bedetected after a hypothetical increase cannot be addressed inthis manner, and it remains unknown how many sequences areactually represented, but are too low to be detected without anincrease due to induction or transcript stabilization.
The number of genes whose transcripts can bedetected using multiple LCRs
We determined the fraction of genes for which transcriptscould be detected by one or more LCRs from a set of 20different LCRs, relative to a collection of Salmonella negativehybridization control sequences. We assumed that these con-trols would provide a good measurement of the distributionof nuisance signal intensities, and that signal intensitiesexceeding 95% of the negative control signals representbona fide hybridization. The microarrays used were essentiallyas described above, except that those used later in the screenhad a greater number of genes, which were excluded fromfurther analysis. Each microarray was hybridized with twodistinct LCR targets, and each hybridization was performedin a single pair of dye-swap replicates. Normalization by totalchannel intensity was performed, and data from the same LCRfrom the two technical replicates were then compared, withoutbackground subtraction. Supplementary Figure 3 displays scat-ter plots of this data and shows reproducibility in the replicatehybridizations. The density distributions of signal intensitiesfrom the 96 negative controls in each of three subarrays perchip were estimated using logsplines (22), and 2327 out of3010 (77%) human sequence probes had signals exceeding95% of these controls in both replicates, for at least one ofthe 20 LCRs tested. If data from an oligo(dT) target wereincluded, coverage increased to 2579 out of 3010 (86%)with oligo(dT) contributing an additional 9%. Detection byindividual primers ranged between 55 and 5%, with most tran-scripts being detected by multiple LCRs. The apparent limit of�86% was reached approximately asymptotically. Very sim-ilar results were obtained using a Wilcoxon rank sum test. Weperformed RT–PCR experiments on mRNA sequences span-ning splice junctions for 20 of the 14% of genes that remainedundetected by any target. Fourteen out of these twenty gavePCR products of the predicted size. This suggests that neitherLCRs nor oligo(dT)-primed probes are able to detect the rarestmRNAs using only a single pair of microarrays.
In this large survey, three LCRs made using the primerspm19, pm22 and pm28 detected 55% of the probes with signalintensities >95% of the negative controls, and the oligo(dT)target detected 65%, but the combined coverage using the
three LCRs plus the oligo(dT) target was 80%. Individually,LCRs from primers pm19, pm22 and pm28 detected tran-scripts for 50, 40 and 39% of the genes represented on thearray, respectively.
Enhanced signal explains some but not all of theenhanced detection of change by LCRs
LCRs have lower complexity than the mRNA population fromwhich they are derived because some sequences amplify moreefficiently than others during the PCR step, depending on howwell the arbitrary primers match, the length of the sequencebetween the arbitrary priming sites, and other sequence-specific factors. Consequently, some sequences are morehighly represented in the LCR than in the original mRNApopulation. In addition, the complexity of LCRs is muchlower than the complexity of the original mRNA, because,on average, only a subsequence about one-sixth of the lengthof each mRNA is amplified. These two factors probably lead tobetter signal-to-noise behavior for these sequences in microar-ray experiments when compared with the more complexoligo(dT)-primed targets. However, LCRs detected changesin some transcripts that were not detected as changes by theoligo(dT)-primed targets even though the signal intensitiesfrom the oligo(dT)-primed targets were higher. When signalintensities for proven differentially regulated genes detectedby LCRs with confidence P < 0.05 (Figure 4) were comparedwith the corresponding intensities from oligo(dT) targets, withwhich differential regulation was not detected, 17 probes hadhigher intensities from LCR targets, while 12 had higherintensities from oligo(dT) targets (Supplementary Figure 4).For these 12 genes, relative abundance of the sequence in thetarget cannot alone account for the fact that LCRs out-performed the oligo(dT)-primed targets. The different waysin which oligo(dT) priming and arbitrary priming samplemRNA isoforms may explain some of this aspect of theenhanced performance of LCR targets, but we have not con-firmed this possibility. Discussion sequences from raremRNAs can be highly represented in LCRs, leading to highersignal intensities in microarray experiments. The experimentspresented above show that LCRs detected differential geneexpression that was not detected in parallel experiments witholigo(dT)-primed targets on PCR product cDNA microarrays.Three LCRs plus oligo(dT)-primed targets increased the detec-tion of differentially regulated genes by 2-fold relative tooligo(dT)-primed targets alone. This is surprising becausethe number of genes for which transcripts are detectedincreases, but only by a factor of �1.5. A possible explanationis that the relatively lower complexity of LCRs simply reducesforeground nuisance fluorescence sufficiently that differentialregulation is uncovered. Alternatively, recent estimates suggestthat about half of human genes produce alternatively splicedproducts, with an average of 2.5–3.5 different mRNA splicingisoforms per gene (23,24), and oligo(dT) targets lead to amicroarray signal that is a weighted average of all of thepoly(A)-tailed isoforms that share the exon sequences repres-ented in a probe. Arbitrary priming samples different mRNAisoforms with different efficiencies, depending on where thearbitrary primers find sufficient homology, such that differentLCRs can contain sequences from one isoform and not another.If one isoform of an mRNA is regulated differently than its other
e100 Nucleic Acids Research, 2005, Vol. 33, No. 11 PAGE 6 OF 7
by guest on September 2, 2014
http://nar.oxfordjournals.org/D
ownloaded from
isoforms, the difference is less likely to be obscured by theweighted average signal from all of the other isoforms fromthe gene. However, we do not have a quantitative estimate of theextent of this effect on LCR performance.
These experiments used microarrays constructed withcDNA sequences having average lengths of �1000, 2.4-foldshorter than the average human transcript (25,26), and theproducts in these LCRs have a median length of �400 nt.Thus, about half of the amplified products for a typicalmRNA in an LCR contain sequences that are not representedin the clone from which the corresponding array probe wasprepared. This suggests that microarrays could be tailored tomatch the sequences represented in the LCRs, thereby furtherimproving the performance by a factor of �2. Microarrayswith genes represented in specific LCRs could be printed onseparate arrays or isolated in separate hybridization chamberson the same slide to improve throughput and efficiency. Theuse of oligonucleotide arrays may reduce, and in some caseseliminate, ambiguities that are certain to arise from LCRs dueto interference between mRNA isoforms and close genefamily members. Thus, the use of LCRs opens up severalavenues for increasing the sensitivity of cDNA microarraysfor identifying differential gene regulation.
SUPPLEMENTARY MATERIAL
Supplementary Material is available at NAR Online.
ACKNOWLEDGEMENTS
The authors thank Mr Sidney Kimmel, Ms Eileen Haag andMr Ira Lechner for their generous support. This work wasfunded by grants to J.W. (R33 CA091358) from the NationalInstitutes of Health and to M.M. (R01 CA68822-13 andDAMD17-03-1-0022) from the National Institutes of Healthand theUSDepartment ofDefense.G.R.waspartially supportedby a fellowship from Association pour la Recherche contre leCancer (ARC). M.J. was partially supported by a fellowshipfrom Deutsche Gesellschaft fuer Naturforscher Leopoldina(BMBF-LPD 9901/8-62). Funding to pay the Open Accesspublication charges for this article was provided by a giftfrom Mr Sidney Kimmel.
Conflict of interest statement. None declared.
REFERENCES
1. Schena,M., Shalon,D., Davis,R.W. and Brown,P.O. (1995) Quantitativemonitoring of gene expression patterns with a complementary DNAmicroarray. Science, 270, 467–470.
2. Lockhart,D.J., Dong,H., Byrne,M.C., Follettie,M.T., Gallo,M.V.,Chee,M.S., Mittmann,M., Wang,C., Kobayashi,M., Horton,H. andBrown,E.L. (1996) Expression monitoring by hybridization tohigh-density oligonucleotide arrays. Nat. Biotechnol., 14, 1675–1680.
3. Iyer,V.R., Eisen,M.B., Ross,D.T., Schuler,G., Moore,T., Lee,J.C.,Trent,J.M., Staudt,L.M., Hudson,J.,Jr, Boguski,M.S. et al. (1999) Thetranscriptional program in the response of human fibroblasts to serum.Science, 283, 83–87.
4. Golub,T.R., Slonim,D.K., Tamayo,P., Huard,C., Gaasenbeek,M.,Mesirov,J.P., Coller,H., Loh,M.L., Downing,J.R., Caligiuri,M.A. et al.(1999) Molecular classification of cancer: class discovery and classprediction by gene expression monitoring. Science, 286, 531–537.
5. Bhattacharjee,A., Richards,W.G., Staunton,J., Li,C., Monti,S., Vasa,P.,Ladd,C., Beheshti,J., Bueno,R., Gillette,M. et al. (2001) Classification ofhuman lung carcinomas by mRNA expression profiling reveals distinctadenocarcinoma subclasses. Proc. Natl Acad. Sci. USA, 98, 13790–13795.
6. Ramaswamy,S., Tamayo,P., Rifkin,R., Mukherjee,S., Yeang,C.H.,Angelo,M., Ladd,C., Reich,M., Latulippe,E., Mesirov,J.P. et al. (2001)Multiclasscancerdiagnosis using tumorgene expressionsignatures.Proc.Natl Acad. Sci. USA, 98, 15149–15154.
7. Armstrong,S.A., Staunton,J.E., Silverman,L.B., Pieters,R., denBoer,M.L., Minden,M.D., Sallan,S.E., Lander,E.S., Golub,T.R. andKorsmeyer,S.J. (2002) MLL translocations specify a distinct geneexpression profile that distinguishes a unique leukemia. Nature Genet.,30, 41–47.
8. Shipp,M.A., Ross,K.N.,Tamayo,P., Weng,A.P., Kutok,J.L., Aguiar,R.C.,Gaasenbeek,M., Angelo,M., Reich,M., Pinkus,G.S. et al. (2002) Diffuselarge B-cell lymphoma outcome prediction by gene-expression profilingand supervised machine learning. Nature Med., 8, 68–74.
9. Ramaswamy,S., Ross,K.N., Lander,E.S. and Golub,T.R. (2003) Amolecular signature of metastasis in primary solid tumors. Nature Genet.,33, 49–54.
10. Troyanskaya,O., Cantor,M., Sherlock,G., Brown,P., Hastie,T.,Tibshirani,R., Botstein,D. and Altman,R.B. (2001) Missing valueestimation methods for DNA microarrays. Bioinformatics, 17,520–525.
11. Welsh,J., Chada,K., Dalal,S.S., Cheng,R., Ralph,D. and McClelland,M.(1992)ArbitrarilyprimedPCR fingerprinting of RNA.NucleicAcids Res.,20, 4965–4970.
12. McClelland,M., Ralph,D., Cheng,R. and Welsh,J. (1994) Interactionsamong regulators of RNA abundance characterized using RNAfingerprinting by arbitrarily primed PCR. Nucleic Acids Res., 22,4419–4431.
13. Liang,P. and Pardee,A.B. (1992) Differential display of eukaryoticmessenger RNA by means of the polymerase chain reaction. Science, 257,967–971.
14. Vos,P., Hogers,R., Bleeker,M., Reijans,M., van de Lee,T., Hornes,M.,Frijters,A., Pot,J., Peleman,J., Kuiper,M. and Zabeau,M. (1995) AFLP:a new technique for DNA fingerprinting. Nucleic Acids Res., 23,4407–4414.
15. Ralph,D., McClelland,M. and Welsh,J. (1993) RNA fingerprinting usingarbitrarily primed PCR identifies differentially regulated RNAs in minklung (Mv1Lu) cells growth arrested by transforming growth factor beta 1.Proc. Natl Acad. Sci. USA, 90, 10710–10714.
16. Trenkle,T., Welsh,J., Jung,B., Mathieu-Daude,F. and McClelland,M.(1998) Non-stoichiometric reduced complexity probes for cDNA arrays.Nucleic Acids Res., 26, 3883–3891.
17. Trenkle,T., Welsh,J. and McClelland,M. (1999) Differential displayprobes for cDNA arrays. Biotechniques, 27, 554–560562, 564.
18. Hegde,P., Qi,R., Abernathy,K., Gay,C., Dharap,S., Gaspard,R.,Hughes,J.E., Snesrud,E., Lee,N. and Quackenbush,J. (2000) A conciseguide to cDNA microarray analysis. Biotechniques, 29, 548–550552–544,556 passim.
19. Smyth,G.K. and Speed,T. (2003) Normalization of cDNA microarraydata. Methods, 31, 265–273.
20. Smyth,G.K., Yang,Y.H. and Speed,T. (2003) Statistical issues in cDNAmicroarray data analysis. Methods Mol. Biol., 224, 111–136.
21. Smyth,G.K. (2004) Linear Models and Empirical Bayes Methods forAssessing Differential Expression in Microarray Experiments. Stat. Appl.Genet. Mol. Biol., 3, Article 3.
22. Kooperberg,C. and Stone,C.J. (1991) A Study of Logspline DensityEstimation. Comput. Stat. Data Anal., 12, 327–347.
23. Kim,H., Klein,R., Majewski,J. and Ott,J. (2004) Estimating rates ofalternative splicing in mammals and invertebrates. Nature Genet., 36,915–916; author reply 916–917.
24. Brett,D., Pospisil,H., Valcarcel,J., Reich,J. and Bork,P. (2002)Alternative splicing and genome complexity. Nature Genet., 30, 29–30.
25. Lander,E.S., Linton,L.M., Birren,B., Nusbaum,C., Zody,M.C.,Baldwin,J., Devon,K., Dewar,K., Doyle,M., FitzHugh,W. et al. (2001)Initial sequencing and analysis of the human genome. Nature, 409,860–921.
26. Venter,J.C., Adams,M.D., Myers,E.W., Li,P.W., Mural,R.J.,Sutton,G.G., Smith,H.O., Yandell,M., Evans,C.A., Holt,R.A. et al.(2001) The sequence of the human genome. Science, 291,
1304–1351.
PAGE 7 OF 7 Nucleic Acids Research, 2005, Vol. 33, No. 11 e100
by guest on September 2, 2014
http://nar.oxfordjournals.org/D
ownloaded from