Enhanced biological performance of intensive sea bream ( Sparus aurata) larviculture in the presence...
19
Ž . Aquaculture 204 2002 45–63 www.elsevier.comrlocateraqua-online Enhanced biological performance of intensive sea ž / bream Sparus aurata larviculture in the presence of phytoplankton with long photophase Nikos Papandroulakis a, ) , Pascal Divanach a , Maroudio Kentouri a,b a Aquaculture Department, Institute of Marine Biology of Crete, P.O. Box 2214, GR71003, Heraklion, Crete, Greece b Biology Department, UniÕersity of Crete, Crete, Greece Received 18 May 2000; received in revised form 13 December 2000; accepted 31 March 2001 Abstract Ž Sea bream larvae were reared under intensive conditions either with pseudo-green water . Ž . technique or without clear water technique the addition of phytoplankton in the rearing tanks, under 24- or 18-h photophases. Phytoplankton presence in the rearing medium resulted in 44 "17% survival and individuals of 2.0 "0.2 mg wet weight after 20 days of rearing. With the clear water method, both survival and growth decreased to 16 "6% and 1.1 "0.2 mg, respec- Ž . tively. The daily consumption rate as milligram of carbon consumed per milligram body carbon at the beginning of exogenous feeding was 0.5 day y1 for all experimental conditions. At later stages, individuals reared with phytoplankton present had a daily consumption rate of about 0.7 day y1 , while those reared with the clear water technique presented consumption rates from 1.0 Ž . y1 Ž . for 24-h photophase to 1.9 day for 18-h photophase . The mean food assimilation efficiency Ž . Ž of the larvae, expressed as a Food Conversion Index FCI , was between 6.3 "1.4 for 18-h . Ž . photophase and 8.2 "1.2 for 24-h photophase for the individuals reared in the presence of Ž phytoplankton. For larvae reared using the clear water technique, FCI was between 12.8 "2.4 for . Ž . 24-h photophase and 20.1 "5.3 for 18-h photophase . q 2002 Elsevier Science B.V. All rights reserved. Keywords: Sea bream; Larvae; Consumption; Phytoplankton; Photophase ) Corresponding author. Tel.: q 30-81-346860; fax: q 30-81-241882. Ž . E-mail address: [email protected] N. Papandroulakis . 0044-8486r02r$ - see front matter q 2002 Elsevier Science B.V. All rights reserved. Ž . PII: S0044-8486 01 00643-3
-
Upload
independent -
Category
Documents
-
view
4 -
download
0
Transcript of Enhanced biological performance of intensive sea bream ( Sparus aurata) larviculture in the presence...
Ž .Aquaculture 204 2002 45–63www.elsevier.comrlocateraqua-online
Enhanced biological performance of intensive seaž /bream Sparus aurata larviculture in the presence
of phytoplankton with long photophase
Nikos Papandroulakis a,), Pascal Divanach a, Maroudio Kentouri a,b
a Aquaculture Department, Institute of Marine Biology of Crete, P.O. Box 2214, GR71003,Heraklion, Crete, Greece
b Biology Department, UniÕersity of Crete, Crete, Greece
Received 18 May 2000; received in revised form 13 December 2000; accepted 31 March 2001
Abstract
ŽSea bream larvae were reared under intensive conditions either with pseudo-green water. Ž .technique or without clear water technique the addition of phytoplankton in the rearing tanks,
under 24- or 18-h photophases. Phytoplankton presence in the rearing medium resulted in44"17% survival and individuals of 2.0"0.2 mg wet weight after 20 days of rearing. With theclear water method, both survival and growth decreased to 16"6% and 1.1"0.2 mg, respec-
Ž .tively. The daily consumption rate as milligram of carbon consumed per milligram body carbonat the beginning of exogenous feeding was 0.5 dayy1 for all experimental conditions. At laterstages, individuals reared with phytoplankton present had a daily consumption rate of about 0.7dayy1, while those reared with the clear water technique presented consumption rates from 1.0Ž . y1 Ž .for 24-h photophase to 1.9 day for 18-h photophase . The mean food assimilation efficiency
Ž . Žof the larvae, expressed as a Food Conversion Index FCI , was between 6.3"1.4 for 18-h. Ž .photophase and 8.2"1.2 for 24-h photophase for the individuals reared in the presence of
Žphytoplankton. For larvae reared using the clear water technique, FCI was between 12.8"2.4 for. Ž .24-h photophase and 20.1"5.3 for 18-h photophase . q 2002 Elsevier Science B.V. All rights
reserved.
Keywords: Sea bream; Larvae; Consumption; Phytoplankton; Photophase
) Corresponding author. Tel.: q30-81-346860; fax: q30-81-241882.Ž .E-mail address: [email protected] N. Papandroulakis .
0044-8486r02r$ - see front matter q2002 Elsevier Science B.V. All rights reserved.Ž .PII: S0044-8486 01 00643-3
( )N. Papandroulakis et al.rAquaculture 204 2002 45–6346
1. Introduction
Larval rearing of sea bream, a species of high economic interest in the Mediterraneanregion, is performed using a variety of methods ranging from extensive to hyperinten-sive in the presence or absence of phytoplankton. In the last decade, several improve-
Ž .ments in the quality of live prey offered to the larvae Lavens et al., 1995 and theŽ .rearing methods Divanach et al., 1998 have been made and employed in the rearing
process. Although all successful methods of rearing involve the use of phytoplankton,the reasons for this are still uncertain.
Phytoplankton appears to play an important role during the rearing of the early stagesŽ .of several species Divanach et al., 1998; Oie et al., 1997; Holmejford et al., 1993 .
Several hypothesis have been put forward to explain the role of phytoplankton in theŽstabilization and improvement of the rearing medium and its direct Moffatt, 1981;
. ŽReitan et al., 1993; Van der Meeren, 1991 or indirect nutritional effect Tamaru et al.,.1993 . Recently, phytoplankton has been reported as being a protecting agent, ant-
Ž .agonistic towards pathogenic bacteria Kennedy et al., 1998; Stoettrup et al., 1995 .The larval stage is regarded as the most critical phase during the rearing of marine
fish. Growth and survival depend to a great extent on food availability and environmen-tal conditions during the rearing. The food consumption rate and assimilation efficiencyare determining parameters for establishing successful methodologies of larval rearingfor aquaculture purposes. The consumption rate depends on food availability and the
Ž .developmental stage of the individual Houde and Schekter, 1980; Kentouri, 1985 ,Ž .while assimilation efficiency is dependent on the quality of diet Houde, 1996 and the
Ž .development of the digestive system of the larvae Sarasquete et al., 1995 .In the present study, the influence of phytoplankton on the growth performance of sea
bream larvae reared under intensive conditions was examined, emphasizing the foodconsumption rate and the assimilation efficiency of the individuals. In addition, two light
Ž .regimes 18- and 24-h photophases were applied in order to investigate potentialdifferences in the performance of the reared populations.
2. Materials and methods
2.1. Experimental conditions of larÕal rearing
The experiments were conducted at the intensive hatchery of the aquaculture facilitiesŽ .of the Institute of Marine Biology of Crete IMBC , Greece.
Ž .Larval rearing was performed under two photophases 18 and 24 h using twoŽ .techniques: the so-called Apseudo-greenB Divanach et al., 1998; Papandroulakis, 2000
Ž .and AclearB water Coves and Gasset, 1993; Kentouri et al., 1993 , which differs in thequality of the rearing medium. In the former, 8–10 l of phytoplankton Chlorella
Ž .minutissima culture Sanmartin et al., 1995 at the exponential phase was added twicedaily, in order to maintain the rearing medium at a concentration of 750"200=103
cells mly1. Each condition was performed in duplicate.Eight groups were created using eggs from broodstock kept in IMBC, which spawned
naturally under ambient environmental conditions. The groups, indicated as 24G ,A,BŽ .18G , 24C , and 18C G: pseudo-green, C: clear; A, B, the replicates , wereA,B A,B A,B

( )N. Papandroulakis et al.rAquaculture 204 2002 45–63 47
placed in 500-l cylindro-conical tanks. Rearing started with an initial density of about100 eggs ly1 and lasted for a period of 20 days.
Ž .The conditions during the endogenous stage egg and prelarval were similar for allŽ . Žgroups. Natural seawater 40 psu, at 17"18C , filtered through mechanical 20 and 5
. Ž .mm porosity and biological polyethylene thongs substrates, was used. ContinuousŽ . Žwater renewal ranging between 30%rh and 40%rh and light aeration provided by.wooden diffusers were provided in the tanks in order to ensure the homogenous
distribution of the populations. The light intensity during endogenous stage was 1–2mmol sy1 my2 at the water surface of the tanks.
The actual experimental conditions were established 4 days post-hatching, whenlarvae began exogenous feeding. Temperature was increased to 19"18C during this
Ž .stage as these ranges are considered optimal for sea bream Polo et al., 1991 . WaterŽ .renewal was limited to 2% daily in all the tanks and was recirculated 10–15%rh using
an airlift pump, creating a gentle vertical convection current from the tank bottom. Forthe groups reared using the Apseudo-greenB technique, water renewal was achieved bythe addition of phytoplankton, while for the ones reared using the AclearB technique, by
Žthe addition of filtered seawater. Light intensity lamps Philips, Par 38 EC Flood 308,. y1 y2120 W varied from 12 to 17 mmol s m at the water surface. The duration of
photophase was controlled with programmed switches. Tanks used for the rearing with18-h photophase were equipped with coverings that maintain a light intensity at the
y1 y2 Žsurface of the tanks -0.01 mmol s m during the dark phase measurements weremade with a quantum sensor SKP 216 QrSKP 200 H by Hansatech, accuracy 0.01
y1 y2 .mmol s m . After day 7, the rearing tanks were equipped with a skimmer in orderto keep the water surface free from lipids and to allow successful swim bladder inflationŽ .Chatain and Ounais Guschemann, 1991 .
Ž .Larvae were successively fed on i enriched rotifers until they reached 5 mm length;Ž .ii a mixed diet of rotifers and Instar I Artemia when the larvae were between 5 and 6
Ž .mm in total length; iii rotifers and enriched Instar II Artemia after the larvae reached 6mm in total length.
Ž .The rotifer Brachionus plicatilis a wild strain from Crete was mass-produced atŽ .IMBC Bengoa Ruigomez et al., 1995 . Prior to distribution to the larvae, rotifers were
Ž .enriched with C. minutissima and commercial products Selco, INVE, Belgium , in 70-lcylindro-conical tanks for 12 h at a density of 3,000–5,000 individuals mly1. Artemia
Ž .sp. was a commercial strain EG, INVE . Instar I was used within 6 h after hatching,Ž .while Instar II was enriched with commercial products Selco, INVE in 800-l cylindro-
conical tanks for 24 h at a density of 300,000 individuals ly1.ŽThe concentration of rotifers in the larval tanks was adjusted 4 times daily 0800,
. y11200, 1600 and 2000 h , to 5 individuals ml on the 1st day of feeding and to 7individuals mly1, thereafter. The concentration of Artemia, both Instar I and II, wasadjusted, twice daily, to 1 individual mly1.
2.2. Controlled parameters
For the whole rearing period, temperature and dissolved oxygen were monitored dailyin each tank. The concentration of ammonia and nitrite was monitored weekly using the
( )N. Papandroulakis et al.rAquaculture 204 2002 45–6348
Ž .technology developed by Moschou et al. 2000 . Additionally, the concentration ofbacteria in the water column of the rearing tanks was monitored every 2nd day after
Ž .sampling, preservation Daley and Hobbie, 1975 and subsequent measuring usingŽ .fluorescence microscopy Porter and Feig, 1980; Velji and Albright, 1993 .
The growth of fish in terms of total length was measured daily on samples of 20individuals from each tank, taken randomly from the entire water column and observedunder stereoscope. Wet weight of the larvae was measured every 4 days on samples of20 individuals taken from the entire water column of the tank. Prior to weighing, larvae
Ž .were kept for a period of 3–4 h according to size in beakers with filtered seawaterŽ .zooplankton-free in order to ensure complete stomach evacuation. Wet weight was
Ž .measured using a Mettler AT balance accuracy of 10 mg , after transferring individuallarvae in pre-weighed, weighing boats where any moisture was removed with absorbentpaper.
The daily consumption of both individual larvae and total group was estimated basedon the zooplankton available daily for consumption together with the daily larval
Ž .population Papandroulakis et al., 2000 as described briefly below.The concentration of prey in the larval tank was measured under a stereoscope on
Ž .sub-samples taken at three places within the water column Kentouri et al., 1994 . Thezooplankton available daily to the larvae was estimated by subtracting from the totalpopulation introduced, the remaining population in the tank, as well as the losses due to
Ž . Žwater renewal measured after collection and mortality as estimated from sedimentary.plankton . Zooplankton mortality data were further corrected based on the expected
Žmortality, which for rotifers after 24 h in the absence of fish larvae, and under the same.conditions as in the rearing , was 13% under clear water conditions and about 5% under
Ž .pseudo-green water conditions Papandroulakis, 2000 .The daily larval population in each tank was estimated at the end of the experimental
period. Every day, dead larvae were removed from the tanks and counted. Thesemeasurements were transformed into percentages of the total counted mortality. At theend of the experiment, when the actual mortality was known after counting the entirepopulation, these percentages were used for the calculation of daily mortality, thusgiving an estimate of the larval population.
Individual consumption was computed after dividing the total daily consumption withthe corresponding larval population in the tank. In order to better estimate consumptionand to avoid possible mistakes, the daily values were transformed using a 3rd daymoving average, i.e. for day k, the value considered was the average of the values of
Ž .days ky1, k and kq1 Diggle, 1992 . The same analysis was applied on both a groupand individual basis.
In order to establish a common variable for food consumption and larval growth,Žcarbon content was measured for each prey type using a carbon analyzer Calanus,
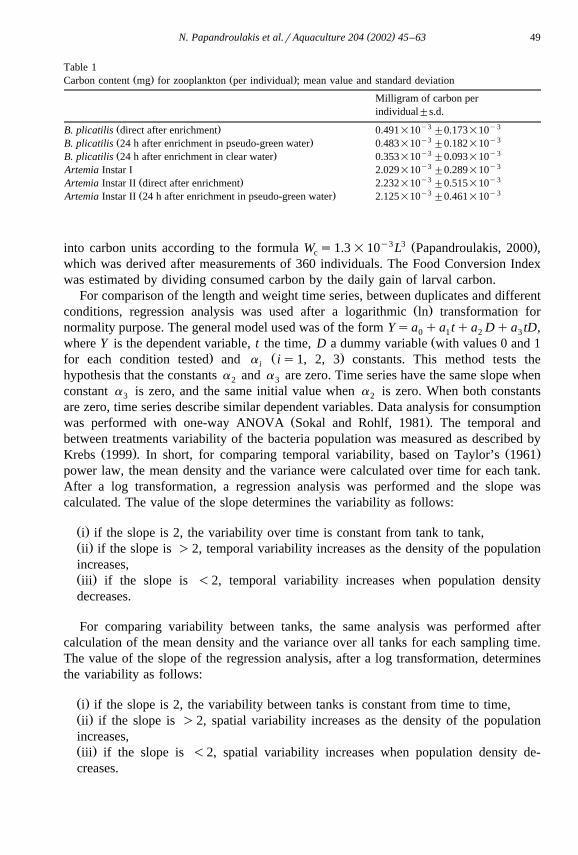
.UniQuant, Finland . The values obtained from a sample size of 100 individuals perŽ .organism were used afterwards in the required calculations Table 1 . Rotifers present
differences in carbon content directly after enrichment and after remaining for 24 h inclear water conditions, while there is no difference in the presence of phytoplankton. Forthe former case, the mean of the two values was taken as the carbon equivalent perindividual. The larval carbon content was estimated after transforming the body length
( )N. Papandroulakis et al.rAquaculture 204 2002 45–63 49
Table 1Ž . Ž .Carbon content mg for zooplankton per individual ; mean value and standard deviation
Milligram of carbon perindividual"s.d.
y3 y3Ž .B. plicatilis direct after enrichment 0.491=10 "0.173=10y3 y3Ž .B. plicatilis 24 h after enrichment in pseudo-green water 0.483=10 "0.182=10y3 y3Ž .B. plicatilis 24 h after enrichment in clear water 0.353=10 "0.093=10y3 y3Artemia Instar I 2.029=10 "0.289=10y3 y3Ž .Artemia Instar II direct after enrichment 2.232=10 "0.515=10y3 y3Ž .Artemia Instar II 24 h after enrichment in pseudo-green water 2.125=10 "0.461=10
y3 3 Ž .into carbon units according to the formula W s1.3=10 L Papandroulakis, 2000 ,c
which was derived after measurements of 360 individuals. The Food Conversion Indexwas estimated by dividing consumed carbon by the daily gain of larval carbon.
For comparison of the length and weight time series, between duplicates and differentŽ .conditions, regression analysis was used after a logarithmic ln transformation for
normality purpose. The general model used was of the form Ysa qa tqa Dqa tD,0 1 2 3Žwhere Y is the dependent variable, t the time, D a dummy variable with values 0 and 1
. Ž .for each condition tested and a is1, 2, 3 constants. This method tests thei
hypothesis that the constants a and a are zero. Time series have the same slope when2 3
constant a is zero, and the same initial value when a is zero. When both constants3 2
are zero, time series describe similar dependent variables. Data analysis for consumptionŽ .was performed with one-way ANOVA Sokal and Rohlf, 1981 . The temporal and
between treatments variability of the bacteria population was measured as described byŽ . Ž .Krebs 1999 . In short, for comparing temporal variability, based on Taylor’s 1961
power law, the mean density and the variance were calculated over time for each tank.After a log transformation, a regression analysis was performed and the slope wascalculated. The value of the slope determines the variability as follows:
Ž .i if the slope is 2, the variability over time is constant from tank to tank,Ž .ii if the slope is )2, temporal variability increases as the density of the populationincreases,Ž .iii if the slope is -2, temporal variability increases when population densitydecreases.
For comparing variability between tanks, the same analysis was performed aftercalculation of the mean density and the variance over all tanks for each sampling time.The value of the slope of the regression analysis, after a log transformation, determinesthe variability as follows:
Ž .i if the slope is 2, the variability between tanks is constant from time to time,Ž .ii if the slope is )2, spatial variability increases as the density of the populationincreases,Ž .iii if the slope is -2, spatial variability increases when population density de-creases.
( )N. Papandroulakis et al.rAquaculture 204 2002 45–6350
3. Results
During the autotrophic stages, dissolved oxygen, ammonia and nitrite concentrationsremained homogenous for all groups, ranging respectively between 7.0"0.2, 0.2"0.1,and 0.6"0.1 mg ly1. Temperature was kept within the specified ranges, and only forgroup 18G exhibited an increase up to 218C on the 2nd and 3rd day post-hatching.B
After the beginning of exogenous feeding, the abiotic conditions were similar for allgroups. Temperature was kept within the specified ranges, oxygen concentration variedbetween 6.0 and 7.0 mg ly1, and ammonia and nitrite concentration ranged between 0and 2 and 0.5–3 mg ly1, respectively, in all tanks.
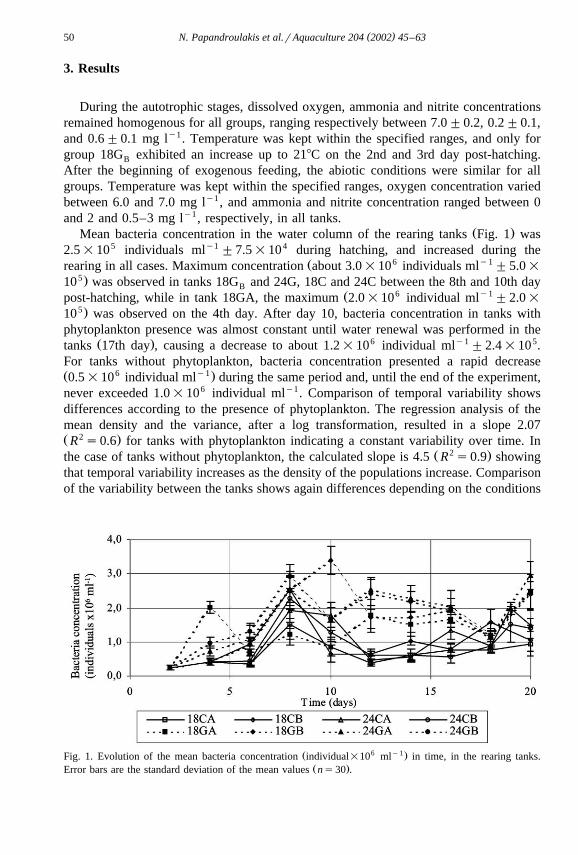
Ž .Mean bacteria concentration in the water column of the rearing tanks Fig. 1 was2.5=105 individuals mly1 "7.5=104 during hatching, and increased during the
Ž 6 y1rearing in all cases. Maximum concentration about 3.0=10 individuals ml "5.0=5.10 was observed in tanks 18G and 24G, 18C and 24C between the 8th and 10th dayB
Ž 6 y1post-hatching, while in tank 18GA, the maximum 2.0=10 individual ml "2.0=5.10 was observed on the 4th day. After day 10, bacteria concentration in tanks with
phytoplankton presence was almost constant until water renewal was performed in theŽ . 6 y1 5tanks 17th day , causing a decrease to about 1.2=10 individual ml "2.4=10 .
For tanks without phytoplankton, bacteria concentration presented a rapid decreaseŽ 6 y1.0.5=10 individual ml during the same period and, until the end of the experiment,never exceeded 1.0=106 individual mly1. Comparison of temporal variability showsdifferences according to the presence of phytoplankton. The regression analysis of themean density and the variance, after a log transformation, resulted in a slope 2.07Ž 2 .R s0.6 for tanks with phytoplankton indicating a constant variability over time. In
Ž 2 .the case of tanks without phytoplankton, the calculated slope is 4.5 R s0.9 showingthat temporal variability increases as the density of the populations increase. Comparisonof the variability between the tanks shows again differences depending on the conditions
Ž 6 y1.Fig. 1. Evolution of the mean bacteria concentration individual=10 ml in time, in the rearing tanks.Ž .Error bars are the standard deviation of the mean values ns30 .
( )N. Papandroulakis et al.rAquaculture 204 2002 45–63 51
tested. In the presence of phytoplankton, variability increases when densities of theŽ 2 .bacteria populations are high slopes1.6; R s0.7 . In comparison, variability de-
creases when densities of the bacteria populations are low in the absence of phytoplank-Ž 2 .ton slopes2.4; R s0.8 .
3.1. Daily consumption
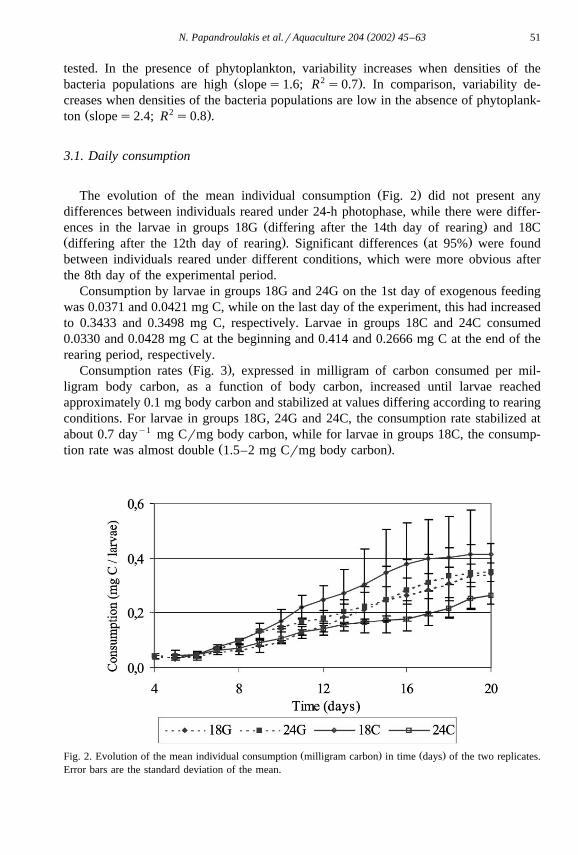
Ž .The evolution of the mean individual consumption Fig. 2 did not present anydifferences between individuals reared under 24-h photophase, while there were differ-
Ž .ences in the larvae in groups 18G differing after the 14th day of rearing and 18CŽ . Ž .differing after the 12th day of rearing . Significant differences at 95% were foundbetween individuals reared under different conditions, which were more obvious afterthe 8th day of the experimental period.
Consumption by larvae in groups 18G and 24G on the 1st day of exogenous feedingwas 0.0371 and 0.0421 mg C, while on the last day of the experiment, this had increasedto 0.3433 and 0.3498 mg C, respectively. Larvae in groups 18C and 24C consumed0.0330 and 0.0428 mg C at the beginning and 0.414 and 0.2666 mg C at the end of therearing period, respectively.
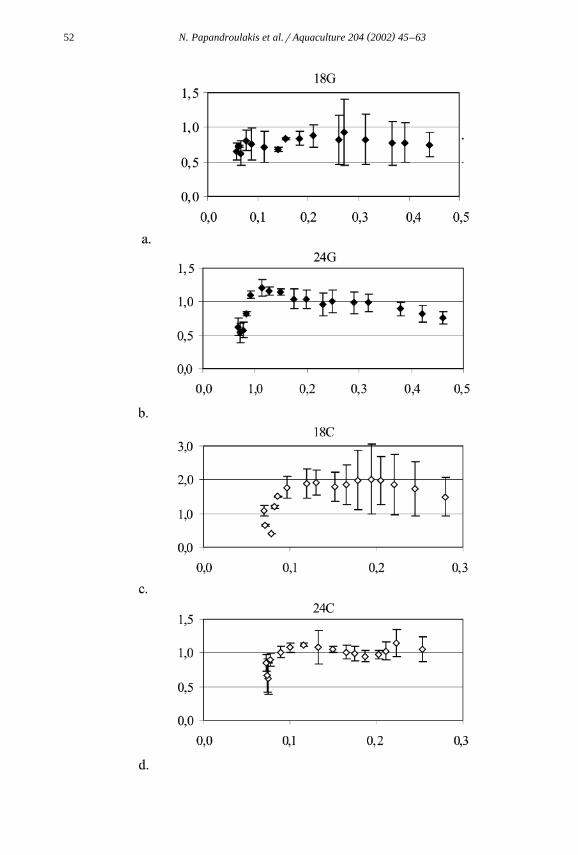
Ž .Consumption rates Fig. 3 , expressed in milligram of carbon consumed per mil-ligram body carbon, as a function of body carbon, increased until larvae reachedapproximately 0.1 mg body carbon and stabilized at values differing according to rearingconditions. For larvae in groups 18G, 24G and 24C, the consumption rate stabilized atabout 0.7 dayy1 mg Crmg body carbon, while for larvae in groups 18C, the consump-
Ž .tion rate was almost double 1.5–2 mg Crmg body carbon .
Ž . Ž .Fig. 2. Evolution of the mean individual consumption milligram carbon in time days of the two replicates.Error bars are the standard deviation of the mean.
( )N. Papandroulakis et al.rAquaculture 204 2002 45–6352
( )N. Papandroulakis et al.rAquaculture 204 2002 45–63 53
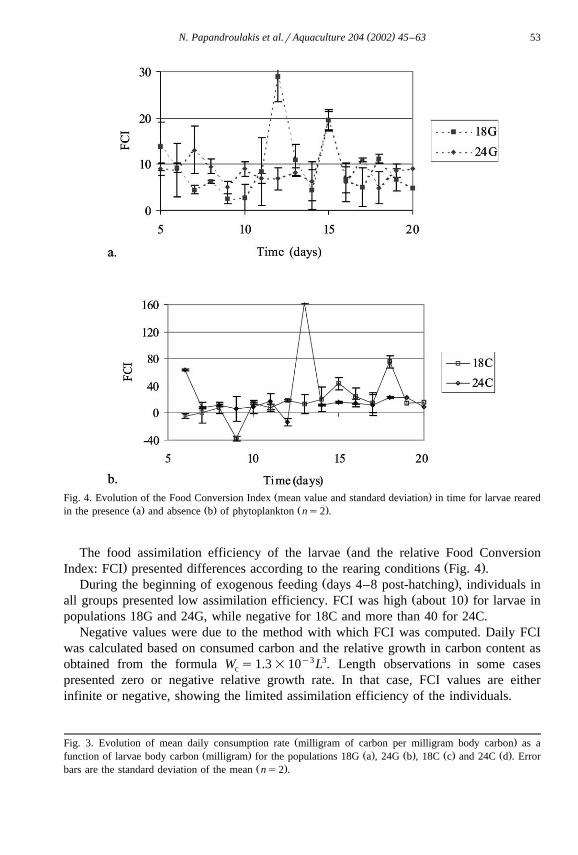
Ž .Fig. 4. Evolution of the Food Conversion Index mean value and standard deviation in time for larvae rearedŽ . Ž . Ž .in the presence a and absence b of phytoplankton ns2 .
ŽThe food assimilation efficiency of the larvae and the relative Food Conversion. Ž .Index: FCI presented differences according to the rearing conditions Fig. 4 .
Ž .During the beginning of exogenous feeding days 4–8 post-hatching , individuals inŽ .all groups presented low assimilation efficiency. FCI was high about 10 for larvae in
populations 18G and 24G, while negative for 18C and more than 40 for 24C.Negative values were due to the method with which FCI was computed. Daily FCI
was calculated based on consumed carbon and the relative growth in carbon content asobtained from the formula W s1.3=10y3L3. Length observations in some casesc
presented zero or negative relative growth rate. In that case, FCI values are eitherinfinite or negative, showing the limited assimilation efficiency of the individuals.
Ž .Fig. 3. Evolution of mean daily consumption rate milligram of carbon per milligram body carbon as aŽ . Ž . Ž . Ž . Ž .function of larvae body carbon milligram for the populations 18G a , 24G b , 18C c and 24C d . Error
Ž .bars are the standard deviation of the mean ns2 .
()
N.P
apandroulakiset
al.rA
quaculture204
200245
–63
54
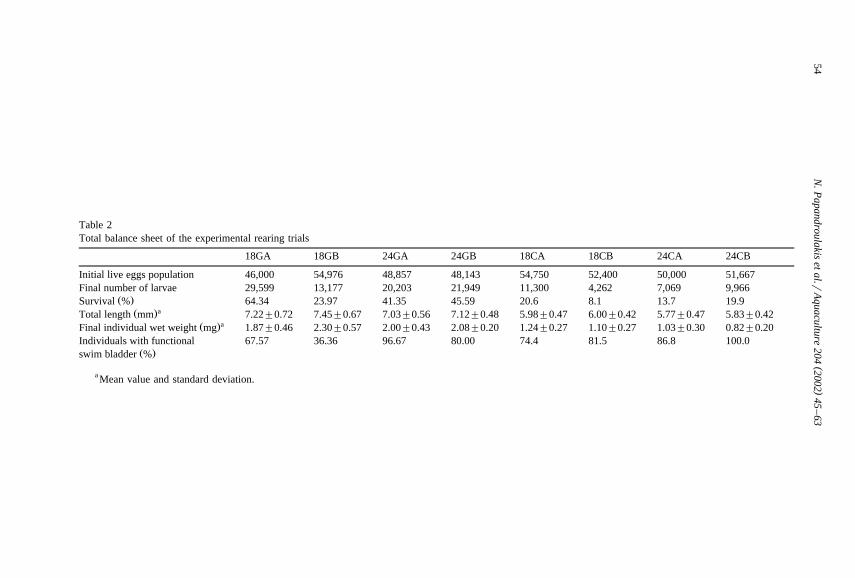
Table 2Total balance sheet of the experimental rearing trials
18GA 18GB 24GA 24GB 18CA 18CB 24CA 24CB
Initial live eggs population 46,000 54,976 48,857 48,143 54,750 52,400 50,000 51,667Final number of larvae 29,599 13,177 20,203 21,949 11,300 4,262 7,069 9,966
Ž .Survival % 64.34 23.97 41.35 45.59 20.6 8.1 13.7 19.9aŽ .Total length mm 7.22"0.72 7.45"0.67 7.03"0.56 7.12"0.48 5.98"0.47 6.00"0.42 5.77"0.47 5.83"0.42
aŽ .Final individual wet weight mg 1.87"0.46 2.30"0.57 2.00"0.43 2.08"0.20 1.24"0.27 1.10"0.27 1.03"0.30 0.82"0.20Individuals with functional 67.57 36.36 96.67 80.00 74.4 81.5 86.8 100.0
Ž .swim bladder %
a Mean value and standard deviation.
( )N. Papandroulakis et al.rAquaculture 204 2002 45–63 55
Between the 7th and the 11th day, FCI for larvae in groups 18G, 24G and 24C hadŽ .low values around 5–7 , while for larvae of 18C, the FCI presented negative values.
Ž .When Artemia was supplied to larvae for the first time after day 11 post-hatching , theFCI increased, resulting in high values for all groups. In the last period of theexperiment, FCI stabilized to values between 10 and 20 for all groups.
3.2. Biological performance
Except for group 18G , egg hatching and prelarval survival was good and at the endB
of this stage was 75–85%. Group 18G exhibited increased mortality on days 2 and 3BŽ .post-hatching , probably due to thermal shock, resulting in a survival on day 4 of about65%.
During the endogenous prelarval stage, the diameter of the oil droplet decreased byŽ .50%. Absorption of the oil droplet i.e. not observed under stereoscope was different
according to the conditions tested. For the individuals of the groups 24G, oil dropletlasted until day 10 post-hatching and day 9 for the groups 18G, while for 24C and 18C,until day 7.
Survival and growth performance of the larvae at the end of the experimental periodŽ .Table 2 varied according to the rearing conditions. Survival ranged from 8.1% to64.3%. In groups 18G and 24G, almost 80% of the total observed mortality occurred by
Ž .the 10th day post-hatching . In contrast, groups 18C and 24C presented an almostconstant mortality rate during the entire rearing period.
3.2.1. Growth performance
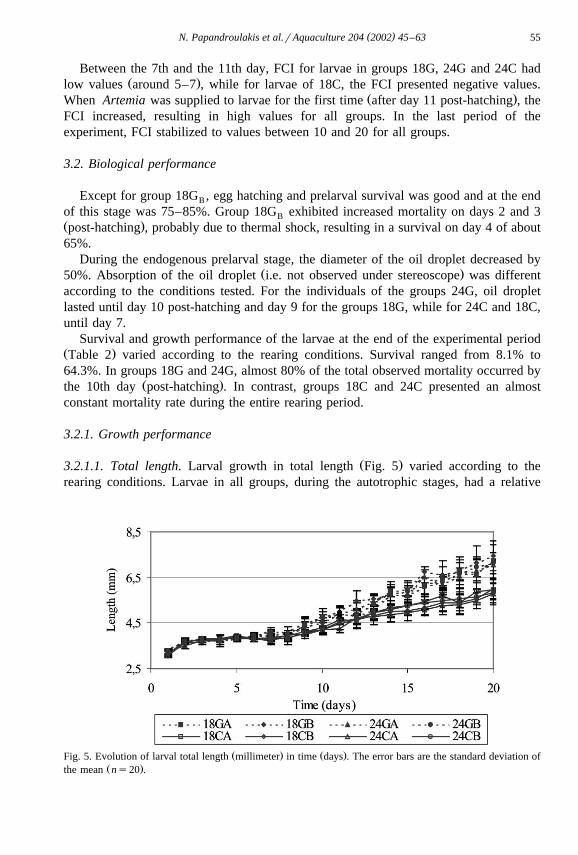
Ž .3.2.1.1. Total length. Larval growth in total length Fig. 5 varied according to therearing conditions. Larvae in all groups, during the autotrophic stages, had a relative
Ž . Ž .Fig. 5. Evolution of larval total length millimeter in time days . The error bars are the standard deviation ofŽ .the mean ns20 .
( )N. Papandroulakis et al.rAquaculture 204 2002 45–6356
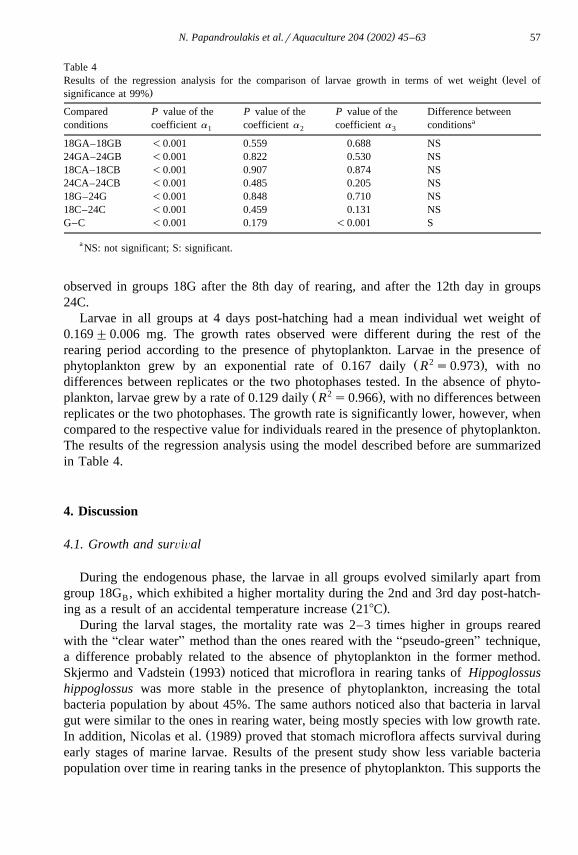
Table 3ŽResults of the regression analysis for the comparison of larvae growth in terms of total length level of
.significance at 99%
Compared P value of the P value of the P value of the Difference betweenaconditions coefficient a coefficient a coefficient a conditions1 2 3
18GA–18GB -0.001 0.820 0.304 NS24GA–24GB -0.001 0.559 0.931 NS18CA–18CB -0.001 0.531 0.261 NS24CA–24CB -0.001 0.787 0.318 NS18G–24G -0.001 0.433 0.128 NS18C–24C -0.001 0.542 0.328 NSG–C -0.001 0.016 -0.001 S
a NS: not significant; S: significant.
growth rate of about 8–9%. From the time of hatching to 4 days post-hatching, thelarvae grew from 3.19"0.10 to 3.71"0.12 mm in total length. The growth rates weredifferent during the rest of the rearing period according to the presence of phytoplank-ton. Larvae in the presence of phytoplankton grew by an exponential rate of 0.043 dailyŽ 2 .R s0.968 , with no differences between replicates or the two photophases. In the
Ž 2 .absence of phytoplankton, larvae grew at a rate of 0.029 daily R s0.950 , with nodifferences between replicates or the two photophases, but significantly lower than theformer case. The results of the regression analysis using the model described before aresummarized in Table 3.
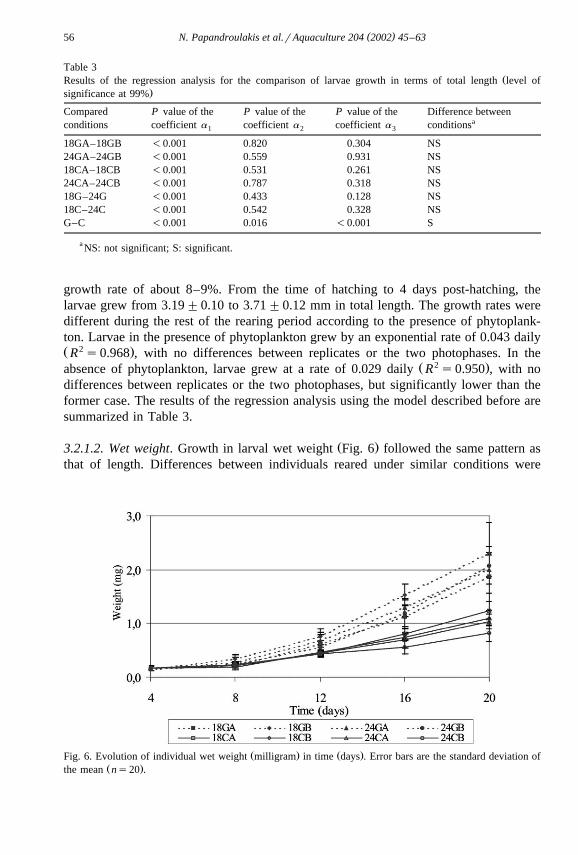
Ž .3.2.1.2. Wet weight. Growth in larval wet weight Fig. 6 followed the same pattern asthat of length. Differences between individuals reared under similar conditions were
Ž . Ž .Fig. 6. Evolution of individual wet weight milligram in time days . Error bars are the standard deviation ofŽ .the mean ns20 .
( )N. Papandroulakis et al.rAquaculture 204 2002 45–63 57
Table 4ŽResults of the regression analysis for the comparison of larvae growth in terms of wet weight level of
.significance at 99%
Compared P value of the P value of the P value of the Difference betweenaconditions coefficient a coefficient a coefficient a conditions1 2 3
18GA–18GB -0.001 0.559 0.688 NS24GA–24GB -0.001 0.822 0.530 NS18CA–18CB -0.001 0.907 0.874 NS24CA–24CB -0.001 0.485 0.205 NS18G–24G -0.001 0.848 0.710 NS18C–24C -0.001 0.459 0.131 NSG–C -0.001 0.179 -0.001 S
a NS: not significant; S: significant.
observed in groups 18G after the 8th day of rearing, and after the 12th day in groups24C.
Larvae in all groups at 4 days post-hatching had a mean individual wet weight of0.169"0.006 mg. The growth rates observed were different during the rest of therearing period according to the presence of phytoplankton. Larvae in the presence of
Ž 2 .phytoplankton grew by an exponential rate of 0.167 daily R s0.973 , with nodifferences between replicates or the two photophases tested. In the absence of phyto-
Ž 2 .plankton, larvae grew by a rate of 0.129 daily R s0.966 , with no differences betweenreplicates or the two photophases. The growth rate is significantly lower, however, whencompared to the respective value for individuals reared in the presence of phytoplankton.The results of the regression analysis using the model described before are summarizedin Table 4.
4. Discussion
4.1. Growth and surÕiÕal
During the endogenous phase, the larvae in all groups evolved similarly apart fromgroup 18G , which exhibited a higher mortality during the 2nd and 3rd day post-hatch-B
Ž .ing as a result of an accidental temperature increase 218C .During the larval stages, the mortality rate was 2–3 times higher in groups reared
with the Aclear waterB method than the ones reared with the Apseudo-greenB technique,a difference probably related to the absence of phytoplankton in the former method.
Ž .Skjermo and Vadstein 1993 noticed that microflora in rearing tanks of Hippoglossushippoglossus was more stable in the presence of phytoplankton, increasing the totalbacteria population by about 45%. The same authors noticed also that bacteria in larvalgut were similar to the ones in rearing water, being mostly species with low growth rate.
Ž .In addition, Nicolas et al. 1989 proved that stomach microflora affects survival duringearly stages of marine larvae. Results of the present study show less variable bacteriapopulation over time in rearing tanks in the presence of phytoplankton. This supports the
( )N. Papandroulakis et al.rAquaculture 204 2002 45–6358
Ž . Ž .suggestion by Kennedy et al. 1998 and Stoettrup et al. 1995 that phytoplankton actsas a stabilizer of the rearing medium.
Ž .While relative growth rate in terms of total length was small about 1% for allgroups until the total absorption of the oil droplet, the relative growth rate in wet weightin the presence of phytoplankton was twice that observed in the absence of it. Duringthis period, larvae utilize energy from exogenous feeding and the oil droplet reserves in
Ž .order to meet their requirements Guyot et al., 1993 . As reported by Divanach andŽ .Kentouri 1983 , the time for the complete absorption of the oil droplet by sea bream
larvae is dependent on exogenous food quality, a conclusion also made by Roennestad etŽ .al. 1992 for Scophthalmus maximus larvae. Results of the present study show that
individuals reared in the presence of phytoplankton preserve their endogenous reserves2–3 days longer, indicating a better quality of exogenous food. This is supported by
Ž .Scott and Baynes 1979 , who reported the role of phytoplankton to be a preservationŽ .agent of zooplankton, and also by our data Papandroulakis, 2000 . Growth perfor-
mance, both in terms of total length and wet weight, was better in the presence ofphytoplankton during the period after the total absorption of the oil droplet.
4.2. Food consumption–assimilation efficiency
Total consumption and consumption rate, as calculated during the study, presenteddifferences according to the method of rearing. Food consumption by sea bream larvae
Žhas been studied in the past Tandler and Mason, 1984; Kentouri, 1985; Ounais.Guschemann, 1989; Yufera et al., 1993 by applying different methodologies. The
Žmethodology used in the present study has also been used elsewhere Reitan et al., 1993;.Van der Meeren, 1995; Papandroulakis et al., 2000 , and presents advantages and
disadvantages. Measurement of consumption on a population level allows the estimationof daily rates, thus avoiding bias related to the specific condition of each individual. It isdependent, however, on the accurate knowledge of the larvae and zooplankton popula-tion in the tanks. During this study, zooplankton concentration was estimated utilizing a
Ž .sampling method with an accuracy of about 90% Kentouri et al., 1994 , whilezooplankton mortality was estimated by collecting the sedimented organisms from thetank bottom. Although mistakes could be introduced by the estimation of mortality, datawere corrected based on the expected mortality of the rotifer population under eachrearing condition.
ŽAt the beginning of exogenous feeding, an individual sea bream larvae body carbon.0.06 mg consumes 0.02–0.04 mg C, i.e. 40–80 rotifers, while at a total length of 7 mm
Ž .body carbon 0.45 mg , consumption increases 10 times. These results are similar toŽ .those reported by Kentouri 1985 .Ž .Daily consumption rate as carbon consumed per larvae body carbon is low at the
beginning of exogenous feeding as individuals have not yet fully developed theirŽ .swimming and hunting activities Kentouri, 1985 . Daily consumption rates increased as
the larvae grew, then reached an equilibrium value. Stabilization of consumption rateoccurs when lipid reserves are exhausted and individuals are entirely dependent uponexogenous feeding. For individuals reared in the presence of phytoplankton, the equilib-rium value is between 0.65 and 0.80 dayy1. Under Aclear waterB conditions, consump-
( )N. Papandroulakis et al.rAquaculture 204 2002 45–63 59
tion rate has a higher equilibrium value, between 0.92 and 1.19 dayy1 for individualsreared with 24-h photophase, and from 1.08 to 1.89 dayy1 for those reared under the18-h light regime. Similar results for food consumption rates of sea bream reared in thepresence of phytoplankton, both the values and the pattern of change according to body
Ž .size, were reported by Yufera et al. 1993 . According to data presented by KentouriŽ .1985 , consumption rates by individuals reared under extensive conditions are stable at
y1 Ž .around 0.8 day . Houde and Zastrow 1993 , studying 22 taxonomic groups of larvaein nature, estimated the consumption rate to be about 0.6 dayy1 at 208C. Highconsumption rates, comparable with those presented here for individuals reared in the
Ž .clear water method, have been reported by Yufera et al. 1995 for individuals reared onmicro-encapsulated diets. Higher consumption rates under clear water conditions indi-cate the inefficiency of the larvae to utilize exogenous food, thus requiring larger foodquantities to meet their energy requirements. Opposite findings were reported by Oie et
Ž .al. 1997 in the rearing of S. maximus, with higher consumption rates for individualsreared in the presence of phytoplankton than for ones reared in its absence. Theconsumption rate of optic hunters like sea bream is affected by the light conditionsŽ .McMahon and Holanov, 1995 . Phytoplankton in the rearing medium affects thephysical conditions in the tank as it increases the light absorption and scattering of lightŽ .Utne, 1997 . It may, however, enhance visual contrast thus allowing the better visibility
Ž .of the prey organisms Naas et al., 1992; Utne-Palm, 1999 . Our experimental data donot allow a conclusion on the exact role of phytoplankton on the consumption rate of seabream, and further experimentation is required.
The difference in consumption rates between larvae under AclearB water rearingŽ .conditions higher in the 18- than in the 24-h photophase could be attributed to the food
quality in relation to the feeding behavior of the larvae. In the absence of phytoplankton,Ž .rotifers have a relatively lower carbon Oie et al., 1997; Papandroulakis, 2000 and lipid
Ž .content Reitan et al., 1993 than in phytoplankton presence. Sea bream larvae are opticŽhunters and therefore unable to consume during the dark phase Kentouri, 1985; Tandler
.and Helps, 1985; Chatain and Ounais Guschemann, 1991 . After 6 h without food, theindividuals reared under 18-h photophase, consumed increased quantities of zooplanktonin order to cover the energy required, a behavior normally associated with starvation and
Ž .refeeding Kentouri, 1985 . In contrast, individuals reared in the presence of phytoplank-ton do not present similar behavior due to the constant high energetic value of thezooplankton under these conditions. The consumption rates of larvae reared with thepseudo-green water method and 24-h photophase is slightly higher than those rearedwith 18 h of light. This reflects the longer feeding activity of the larvae reared undercontinuous photophase. Growth performance, however, is enhanced with 18-h pho-tophase, a result that can be explained when considering the energy budget of the larvae.Growth of the individuals depends on available energy, resulting from the subtraction of
Žthe energy needed for maintenance from the assimilated energy Houde and Schekter,. Ž .1983; Zonneveld, 1992 . When active hunting, swimming , individuals have a higher
Ž .maintenance cost Houde and Schekter, 1983; Torres et al., 1996 . Thus, rearing undercontinuous illumination increases the maintenance cost of the larvae, which utilize alarger part of the assimilated energy than their counterparts reared under 18-h pho-tophase, resulting in a different growth performance.
( )N. Papandroulakis et al.rAquaculture 204 2002 45–6360
Larvae assimilation efficiency followed a general trend for all groups. At theŽbeginning of exogenous feeding when their digestion capacity is limited Sarasquete et
.al., 1995 , food assimilation is low. As individuals adapt to the rotifer diet, assimilationŽ .efficiency is improved. When a new diet Artemia nauplii is introduced, larvae undergo
a second adaptation period, resulting again in low efficiency of food assimilation.Although this is a general trend, there are differences according to the rearing condi-tions. During the first adaptation period, larvae reared with the pseudo-green watermethod have an FCI of about 10, while those reared with the clear water method have
Ž .60 or negative population 18C . The mean FCI of the experimental period is 2–3 timeshigher for larvae reared with clear water method than the ones reared with thepseudo-green one. Results of the assimilation efficiency of larvae with phytoplankton
Ž .presence are comparable to the ones presented by Kentouri 1985 . In nature, theŽ .assimilation efficiency of fish larvae is, according to Houde and Zastrow 1993 , about
0.65, resulting in an FCI of about 1.5. This result reflects the qualitative difference ofthe food that larvae consume in nature in comparison with the food supplied underrearing conditions. Improved food assimilation efficiency in phytoplankton presence has
Ž .been reported for sea bass larvae by Cahu et al. 1998 , who concluded that phytoplank-ton acts as a triggering mechanism, activating the production of peptic enzymes.
In conclusion, the results show that phytoplankton promotes not only the biologicalŽ .performance of the reared individuals in terms of growth and survival but also the
efficiency of the larvae to assimilate their food.
Acknowledgements
We wish to express our thanks to the staff of the intensive hatchery of theAquaculture Department of IMBC for their technical assistance during the trials, Dr. K.Lika for her assistance in the statistical analysis and two unknown reviewers forvaluable comments on the manuscript. We would also like to thank Mrs. M. De Wildefor her advice on the English language.
References
Bengoa Ruigomez, M.V., Sanmartin, M., Hatziathanasiou, A., Divanach, P., Kentouri, M., 1995. On the use ofbloom strategy in large volume phytoplankton culture for initiation of rapid mass production of Bra-
Ž . Ž .chionus plicatilis Muller . In: Castelli, F.O., Calderer, A.R. Eds. , Proceed. 5th Nat. Congr. Aquacult.Universitat de Barcelona Publ., Barcelona, pp. 109–113.
Cahu, C.L., Zambonino-Infante, J.L., Peres, A., Quazuguel, P., Le-Gall, M.M., 1998. Algal addition in seaŽ . Ž .bass Dicentrarchus labrax larvae rearing: effect on digestive enzymes. Aquaculture 161 1–4 , 479–489.
Chatain, B., Ounais Guschemann, N., 1991. Determination of larval mass rearing standards in the sea breamŽ .Sparus aurata. In: Lavens, P., Sorgeloos, P., Jaspers, E., Ollevier, F. Eds. , LARVI ’91, vol. 15, pp.
314–315.Ž .Coves, D., Gasset, E., 1993. Gilthead seabream Sparus aurata intensive larva rearing in closed systems.
Proceeding of the World Aquaculture ’93. Spec. Publ. Eur. Aquacult. Soc., vol. 19, p. 342.
( )N. Papandroulakis et al.rAquaculture 204 2002 45–63 61
Daley, R.J., Hobbie, J.E., 1975. Direct counts of aquatic bacteria by modified epifluorescence technique.Limnol. Oceanogr. 20, 875–882.
Diggle, J.P., 1992. Time Series a Biostatistical Introduction. Oxford Univ. Press, New York, 272 pp.Divanach, P., Kentouri, M., 1983. Influence des conditions trophiques initiales sur la resorption des reserves´ ´
lipidiques, la croissance et la survie des larves de daurade Sparus aurata en elevage extensif. Aquaculture35, 43–55.
Divanach, P., Papandroulakis, N., Kentouri, M., 1998. Bases de techniques de l’evage larvaire de la dauradeŽ .Sparus aurata . Proceedings of the Conference ABordeaux Aquaculture 1998B held in Bordeaux, France,from 7 to 8 October, pp. 107–114iir.
Guyot E., Connes R. et Diaz J.P., 1993. Resorption des reserves vitellines et passage de l’endotrophie a´ ´ `Ž .l’exotrophie chez la larve de Daurade Sparus aurata nourrie et a jeun. In: Barnabe G. Kestemont P.` ´
Ž .Eds. Production, Environment and Quality. Bordeaux Aquaculture 1992. E.A.S. Spec. Pub. 18, 213-226Holmejford, I., Gulbrandsen, J., Lein, I., Refstie, T., Leger, P., Harboe, T., Huse, I., Sorgeloos, P., Bolla, S.,
Olsen, I., Reitan, K.I., Vadstein, O., Oie, G., Danielsberg, A., 1993. An intensive approach to atlanticŽ .halibut fry production. J. World Aquacult. Soc. 24 2 , 275–284.
Houde, E.D., 1996. Evaluating stage-specific survival during the early life of fish. Proceedings of anInternational Workshop, Yokohama, Japan. Survival Strategies in Early Life Stages of Marine Resource,A.A. Balkema, Rotterdam, pp. 51–66.
Houde, E.D., Schekter, R.C., 1980. Feeding by marine fish larvae: developmental and functional responses.Ž .Environ. Biol. Fishes 5 4 , 315–334.
Houde, E.D., Schekter, R.C., 1983. Oxygen uptake and comparative energetics among eggs and larvae of threesubtropical marine fishes. Mar. Biol. 72, 283–293.
Houde, E.D., Zastrow, C.E., 1993. Ecosystem- and taxon-specific dynamic and energetics properties of larvalŽ .fish assemblages. Bull. Mar. Sci. 53 2 , 290–335.
Kennedy, S.B., Tucker, J.W., Neidig, C.L., Vermeer, G.K., Cooper, V.R., Jarrell, J.L., Sennet, D.G., 1998.Bacterial management strategies for stock enhancement of warmwater marine fish: a case study with
Ž . Ž .common snook Centropomus undecimalis . Bull. Mar. Sci. 62 2 , 573–588.Kentouri, M., 1985. Comportement larvaire de 4 Sparides mediterraneens en elevage: Sparus aurata, Diplodus´ ´ ´
Ž .sargus, Lithognathus mormyrus, Puntazzo puntazzo Poissons teleosteens . These de doctorat es Sciences.´ ´ ´ ` `Universite de Sciences et Techniques du Languedoc, Montpellier, 492 pp.´
Kentouri, M., Divanach, P., Papandroulakis, N., Stefanakis, S., 1993. Biological performance of intensivelyŽ .reared sea bream Sparus aurata larvae in a pilot closed system. Proceeding of the World Aquaculture
’93. Spec. Publ. Eur. Aquacult. Soc., vol. 19, p. 396.Kentouri, M., Divanach, P., Thomson, M., Papandroulakis, N., Cross, T., 1994. A comparison of rotifer
Ž .Brachionus plicatilis sampling methods in marine larval rearing tanks. Book of Abstracts ABordeauxAquaculture ’94B. European Aquaculture Society, Special Publication, vol. 21, pp. 110–111.
Krebs, C.J., 1999. Ecological Methodology. 2nd edn. Addison-Wesley Educational Publishers, Menlo Park,620 pp.
Ž .Lavens, P., Sorgeloos, P., Dhert, P., Devresse, B., 1995. Larval foods. In: Bromage, N.R., Roberts, R.J. Eds. ,Broodstock Management and Egg and Larval Quality. Blackwell, Oxford, pp. 373–397.
McMahon, T.E., Holanov, S.H., 1995. Foraging success of largemouth bass at different light intensities:implications for time and depth of feeding. J. Fish Biol. 46, 759–767.
Moffatt, N.M., 1981. Survival and growth of northern anchovy larvae on low zooplankton densities as affectedŽ .by the presence of a Chlorella bloom. In: Lasker, R., Sherman, K. Eds. , The Early Life History of Fish:
Recent Studies, vol. 178, pp. 475–480.Moschou, E.A., Azpiroz Lasarte, U., Fouskaki, M., Chaniotakis, N.A., Papandroulakis, N., Divanach, P.,
2000. Direct electrochemical flow analysis system for simultaneous monitoring of total ammonia andnitrite in seawater. Aquacult. Eng. 22, 255–268.
ŽNaas, K.E., Næss, T., Harboe, T., 1992. Enhanced first feeding of halibut larvae Hippoglossus hippoglossus.L. in green water. Aquaculture 105, 143–156.
Nicolas, J.L., Robic, E., Ansquer, D., 1989. Bacterial flora associated with a trophic chain consisting ofmicroalgae, rotifers and turbot larvae: influence of bacteria in larvae survival. Aquaculture 83, 237–248.
ŽOie, G., Makridis, P., Reitan, K.I., Olsen, Y., 1997. Protein and carbon utilization of rotifers Brachionus. Ž .plicatilis in first feeding of turbot larvae Scophthalmus maximus L. . Aquaculture 153, 103–122.
( )N. Papandroulakis et al.rAquaculture 204 2002 45–6362
Ounais Guschemann, N., 1989. Definition d’un modele d’elevage larvaire intensif pour la daurade Sparusauratus. These de docteur. Universite d’aix Marseille II, Marseilles, 180 pp.` ´
Papandroulakis, N., 2000. Influence of the rearing conditions on growth and food consumption of sea breamŽ .Sparus aurata during the early developmental stages. Mathematical simulations. PhD Thesis. University
Ž .of Crete, Heraklion, 196 pp. in Greek, with English abstract .Papandroulakis, N., Markakis, G., Divanach, P., Kentouri, M., 2000. Feeding requirements of sea bream
Ž .Sparus aurata larvae under intensive rearing conditions. Development of a fuzzy logic controller forfeeding. Aquacult. Eng. 21, 285–299.
Polo, A., Yufera, M., Pascual, E., 1991. Effects of temperature on egg and larval development of Sparusaurata L. Aquaculture 92, 367–375.
Porter, K.G., Feig, Y.S., 1980. The use of DAPI for identifying and counting aquatic microflora. Limnol.Ž .Oceanogr. 25 5 , 943–948.
Reitan, K.I., Rainuzzo, J.R., Oie, G., Olsen, Y., 1993. Nutritional effects of algal addition in first-feeding ofŽ .turbot Scophthalmus maximus L. larvae. Aquaculture 118, 257–275.
Roennestad, I., Fyhn, H.J., Gravningen, K., 1992. The importance of free amino acids to the energyŽ .metabolism of eggs and larvae of turbot Scophthalmus maximus . Mar. Biol. 114, 517–525.
Sanmartin, M., Bengoa Ruigomez, M.V., Hatziathanasiou, A., Divanach, P., Kentouri, M., 1995. On the use ofŽ .submarine light tubes in large volume intensive Chlorella sp. Beyenick culture. Definition of the
Ž .optimum number of lamps per unit of volume. In: Castelli, F.O., Calderer, A.R. Eds. , Proceed. 5th Nat.Congr. Aquacult. Universitat de Barcelona Publ., Barcelona, pp. 104–108.
Sarasquete, M.C., Polo, A., Yufera, M., 1995. Histology and histochemistry of the development of thedigestive system of larval gilthead seabream, Sparus aurata L. Aquaculture 130, 79–92.
Scott, A.P., Baynes, S.M., 1979. The effect of unicellular algae on survival and growth of turbot larvaeŽ . Ž .Scophthalmus maximus L. . In: Halver, J.E., Tiews, K. Eds. , Finfish Nutrition and Fishfeed Technology.Proceeding of a World Symposium, Hamburg, 20–23 June 1978, vol. 1, Heenemann Verlagsgesellschaft,Berlin, pp. 423–433.
Skjermo, J., Vadstein, O., 1993. The effect of microalgae on skin and gut bacterial flora of halibut larvae. In:Ž .Reinertsen, H., Dahle, L.A., Jørgensen, L., Tvinnereim, K. Eds. , Fish Farming Technology. Balkema,
Rotterdam, pp. 61–67.Sokal, R.R., Rohlf, F.J., 1981. Biometry. 2nd edn. Freeman, New York, 859 pp.Stoettrup, J.G., Gravningen, K., Norsker, N.H., 1995. The role of different algae in the growth and survival of
Ž .turbot larvae Scophthalmus maximus L. in intensive rearing systems. ICES Mar. Sci. Symp. 201,173–186.
Tamaru, C.S., Murashige, R., Lee, C.S., 1993. The paradox of using background phytoplankton during thelarval culture of striped mullet, Mugil cephalus L. Aquaculture 119, 167–174.
Tandler, A., Helps, S., 1985. The effects of photoperiod and water exchange rate on growth and survival ofŽ .gilthead sea bream Sparus aurata, Linnaeus; Sparidae from hatching to metamorphosis in mass rearing
systems. Aquaculture 48, 71–82.Ž . Ž .Tandler, A., Mason, C., 1984. The use of super 14 C labelled rotifers Brachionus plicatilis in larvae of
Ž .gilthead seabream Sparus aurata : measurements of the effect of rotifer concentration, the lighting regimeand seabream larval age on their rate of rotifer ingestion. World Mar. Soc., Spec. Publ. 8, 241–259.
Taylor, L.R., 1961. Aggregation, variance and the mean. Nature 189, 732–735.Torres, J.J., Brightman, R.I., Donnelly, J., Harvey, J., 1996. Energetics of larval red drum, Sciaenops
ocellatus: Part I. Oxygen consumption, specific dynamic action, and nitrogen excretion. Fish. Bull. 94,756–765.
Utne, A.C.W., 1997. The effect of turbidity and illumination on the reaction distance and search time of themarine planktivore Gobiusculus flaÕescens. J. Fish Biol. 50, 926–938.
Utne-Palm, A.C., 1999. The effect of prey mobility, prey contrast, turbidity and spectral composition on thereaction distance of Gobiusculus flaÕescens to its planktonic prey. J. Fish Biol. 54, 1244–1258.
Ž .Van Der Meeren, T., 1991. Algae as first food for cod larvae Gadus morhua L. : filter feeding or ingestion byaccident? J. Fish Biol. 39, 225–237.
ŽVan der Meeren, T., 1995. Feed consumption and gut evacuation in atlantic halibut Hippoglossus hippoglos-.sus L. larvae. E.A.S. Spec. Publ. 24, 381–384.
Velji, M.I., Albright, L.J., 1993. Improved sample preparation for enumeration of aggregated aquatic substrate

( )N. Papandroulakis et al.rAquaculture 204 2002 45–63 63
Ž .bacteria. In: Kemp, P.F., Sherr, B.F., Sherr, E.B., Cole, J.J. Eds. , Handbook of Methods in AquaticMicrobial Ecology. Lewis Publ., London, pp. 139–142.
Yufera, M., Pascual, E., Polo, A., 1993. First results on feeding rates of gilthead seabream Sparus aurataŽ .larvae reared in the laboratory. In: Walther, B.T., Fyhn, H.J. Eds. , Physiological and Biochemical
Aspects of Fish Development. University of Bergen, Norway, pp. 160–166.Ž .Yufera, M., Fernandez-Diaz, C., Pascual, E., 1995. Feeding rates of gilthead seabream Sparus aurata , larvae
on microcapsules. Aquaculture 134, 257–268.Zonneveld, C., 1992. Animal energy budgets: A dynamic approach. PhD Thesis. Vrije Universiteit, Amster-
dam, 119 pp.