
“Energy Saving in Fisheries”” (ESIF) FISH/2006/17 LOT3
425
Report Number C002/08 1 of 425 “Energy Saving in Fisheries ” ” (ESIF) FISH/2006/17 LOT3 – – Final Report B. van Marlen (editor, coauthors listed below) Report number C002/08 Location IJmuiden Client: European Commission Rue de la Loi 200, Brussels, Belgium Publication Date: 13/03/2009 Disclaimer This report has been prepared under contract FISH/2007/17 – LOT 3 by Wageningen IMARES. It does not necessarily reflect the view of the European Commission and in no way anticipates the Commission’s future policy in this area.
-
Upload
khangminh22 -
Category
Documents
-
view
0 -
download
0
Transcript of “Energy Saving in Fisheries”” (ESIF) FISH/2006/17 LOT3
Report Number C002/08 1 of 425
““EEnneerrggyy SSaavviinngg iinn FFiisshheerriieess”” ((EESSIIFF)) FFIISSHH//22000066//1177 LLOOTT33 ––FFiinnaall RReeppoorrtt
B. van Marlen (editor, co4authors listed below)
Report number C002/08
Location IJmuiden Client: European Commission
Rue de la Loi 200, Brussels, Belgium
Publication Date: 13/03/2009
Disclaimer This report has been prepared under contract FISH/2007/17 – LOT 3 by Wageningen IMARES. It does not necessarily reflect the view of the European Commission and in no way anticipates the Commission’s future policy in this area.

Report Number C002/08 2 of 425
• Wageningen IMARES conducts research providing knowledge necessary for the protection, harvest and
usage of marine and costal areas. • Wageningen IMARES is a knowledge and research partner for governmental authorities, private industry
and social organisations for which marine habitat and resources are of interest. • Wageningen IMARES provides strategic and applied ecological investigation related to ecological and
economic developments. List of authors: Name Member
state
Organisation Acronym
Th. Thøgersen
H. Frost
DK Institute of Food and Resource Economics (“Fødevareøkonomisk
Institut” 4 FOI), Faculty of Life Sciences, University of Copenhagen,
Rolighedsvej 25, 1958 Frederiksberg C (Copenhagen)
FOI
B. Vincent
M. Planchot
C. Brigaudeau
D. Priour
F. Daurès
FR French research institute for the exploitation of the sea (“Institut
français de recherche pour l'exploitation de la mer” 4 IFREMER). Head
Office: 155 rue Jean4Jacques Rousseau, 92138 Issy4les4Moulineaux,
France. Lorient Branch address : 8 rue François Toullec, 56100 Lorient
IFREMER
P. Le Floc'h FR Université Européenne de Bretagne 4 UBO UMR AMURE, 12 rue de
Kergoat – C.S. 93837, 29238, Brest Cedex 3
UBO4UMR4AMURE
D. Rihan
L. Costello
IRL Irish Sea Fisheries Board, Fisheries Development Division (“An Bord
Iascaigh Mhara”4 BIM), P.O. Box 12, Crofton Road, Dun Laoghaire, Co.
Dublin
BIM
A. Sala
G. Messina
A. Lucchetti
E. Notti
F. De Carlo
V. Palumbo
IT National Research Council (“Consiglio Nazionale delle Ricerche” 4 CNR) 4
Institute of Marine Sciences 4 Marine Fishery Section (“Istituto Scienze
Marine” 4 ISMAR), Largo Fiera della Pesca, 60125 Ancona
CNR4ISMAR
L. Malvarosa
P. Accadia
IT Università degli studi di Salerno 4 Istituto Ricerche Economiche per la
Pesca e l’Acquacoltura (IREPA) 4 Onlus. Via S. Leonardo (Trav. Migliaro),
84131 Salerno
IREPA
P. Salz NL Framian Ltd., Achterburg 9, 2641 LA Pijnacker Framian
J. Powell NL Agricultural Economics Research Institute (“Landbouw Economisch
Instituut” 4 LEI) B.V., P.O. Box 29703, 2502 LS The Hague
LEI
J. van Vugt
L. de Vries
NL Netherlands Organisation for Applied Scientific Research TNO 4 Built
Environment and Geosciences 4 Business Unit: Structures and Safety.
Visiting Address: Van Mourik Broekmanweg 6, 2628 XE Delft
TNO4CMC
B. van Marlen (editor) NL Institute for Marine Resources and Ecosystem Studies (Wageningen
IMARES) Ltd., P.O. Box 68, 1970 AB IJmuiden
IMARES
K. van Craeynest BE Institute for Agricultural and Fisheries Research 4 Sea Fisheries
Department (“Instituut voor Landbouw4 en Visserijonderzoek”4 ILVO),
Ankerstraat 1, B48400 Oostende
ILVO
K. Arkley
S. Metz
UK Sea Fish Industry Authority, (SEAFISH), 18 Logie Mill, Logie Green
Road, Edinburgh, EH7 4HS
SEAFISH

Report Number C002/08 3 of 425
© 2007 Wageningen IMARES Wageningen IMARES is a cooperative
research organisation formed by
Wageningen UR en TNO. We are registered
in the Dutch trade record
Amsterdam nr. 34135929,
BTW nr. NL 811383696B04.
The Management of IMARES is not responsible for resulting damage, as well as for
damage resulting from the application of results or research obtained by IMARES,
its clients or any claims related to the application of information found within its
research. This report has been made on the request of the client and is wholly the
client's property. This report may not be reproduced and/or published partially or in
its entirety without the express written consent of the client.
A_4_3_24V4

Report Number C002/08 4 of 425
Contents
Contents ............................................................................................................................ 4
Summary for non4specialists.............................................................................................. 14
Executive Summary .......................................................................................................... 15
Assignment ...................................................................................................................... 19
Quality Assurance ............................................................................................................. 19
1 Introduction and objectives of the study ................................................ 20
1.1 European fisheries ........................................................................................ 20
1.2 Employment ................................................................................................. 22
1.3 Resources.................................................................................................... 22
1.4 Energy costs ................................................................................................ 22
1.5 EU4response ................................................................................................. 23
2 Segments under study......................................................................... 24
3 Catalogue of fishing vessel and gear characteristics .............................. 26
4 Economic evaluation............................................................................ 31
4.1 Methodology................................................................................................. 31 4.1.1 Role of energy for individual fleet segments ........................................ 31 4.1.2 Break4even analysis ........................................................................... 31 4.1.3 Factors determining energy efficiency................................................. 32 4.1.4 Economic potential for technological improvement .............................. 32 4.1.5 Scenarios for future fuel prices .......................................................... 32 4.1.6 Economic consequences of technical4operational adaptations............... 32
4.2 Role of fuel costs4 EU4wide overview ............................................................... 33 4.2.1 Coverage ......................................................................................... 33
4.3 Denmark ...................................................................................................... 34 4.3.1 Role of energy for individual fleet segments ........................................ 34 4.3.2 Break4even analysis ........................................................................... 37
4.3.2.1 Gillnetter 0412m.................................................................................. 37 4.3.2.2 Demersal trawler 12424m .................................................................... 38 4.3.2.3 Demersal trawler 24440m .................................................................... 38
4.3.3 Factors determining energy efficiency................................................. 39 4.3.4 Economic potential for technological improvement .............................. 42 4.3.5 Scenarios for future fuel prices .......................................................... 42 4.3.6 Economic consequences of technical adaptations ............................... 43
4.3.6.1 Conclusions........................................................................................ 47
4.4 France ......................................................................................................... 48

Report Number C002/08 5 of 425
4.4.1 Role of energy for individual fleet segments ........................................ 48 4.4.2 Break4even analysis ........................................................................... 50
4.4.2.1 Passive gear < 12m............................................................................ 50 4.4.2.2 Demersal trawlers 12424 meters .......................................................... 51
4.4.3 Factors determining energy efficiency................................................. 52 4.4.3.1 Passive gear <12m............................................................................. 52 4.4.3.2 Demersal trawlers 12424m .................................................................. 53
4.4.4 Economic potential for technological improvement .............................. 54 4.4.5 Scenarios for future fuel prices .......................................................... 55 4.4.6 Economic consequences of technical adaptations ............................... 55 4.4.7 List of national studies 4 publications related to fuel efficiency in fisheries ........................................................................................... 57
4.5 Ireland ......................................................................................................... 58 4.5.1 Role of energy for individual fleet segments ........................................ 58 4.5.2 Break4even analysis ........................................................................... 61
4.5.2.1 Segment 1 Inshore < 12 metres .......................................................... 61 4.5.2.2 Demersal Trawlers 12424m.................................................................. 62 4.5.2.3 Demersal Trawlers 24440m.................................................................. 63 4.5.2.4 Pelagic Trawlers 24440m..................................................................... 63 4.5.2.5 Pelagic Trawlers > 40m ...................................................................... 64
4.5.3 Factors determining energy efficiency................................................. 65 4.5.4 Economic potential for technological improvement .............................. 68 4.5.5 Scenarios for future fuel prices .......................................................... 69 4.5.6 Economic consequences of technical adaptations ............................... 69
4.5.6.1 Reference vessel 14 Ireland .................................................................. 69 4.5.6.2 Reference vessel 2 4 Ireland ................................................................. 72 4.5.6.3 Reference vessel 3 – Ireland ................................................................ 75
4.5.7 List of national studies 4 publications related to fuel efficiency in fisheries ........................................................................................... 78
4.6 Italy ......................................................................................................... 79 4.6.1 Role of energy for individual fleet segments ........................................ 79 4.6.2 Break4even analysis ........................................................................... 82
4.6.2.1 Bottom trawlers 24440m Loa ............................................................... 82 4.6.2.2 Pelagic trawlers 24440m Loa ............................................................... 83 4.6.2.3 Beam trawlers (“rapido”) 24440m Loa ................................................... 83 4.6.2.4 Passive gear <12m Loa ...................................................................... 84
4.6.3 Factors determining energy efficiency................................................. 85 4.6.4 Economic potential for technological improvement .............................. 88 4.6.5 Scenarios for future fuel prices .......................................................... 89 4.6.6 Economic consequences of technical adaptations ............................... 90
4.6.6.1 Bottom trawlers 24440m Loa ............................................................... 90 4.6.6.2 Pelagic trawlers 24440m Loa ............................................................... 92 4.6.6.3 List of national studies 4 publications related to fuel efficiency in fisheries ............................................................................................. 94
4.7 The Netherlands ........................................................................................... 95 4.7.1 Role of energy for individual fleet segments ........................................ 95 4.7.2 Break4even analysis ........................................................................... 96
4.7.2.1 Beam trawlers 12424m........................................................................ 96 4.7.2.2 Beam trawlers 24440m........................................................................ 98 4.7.2.3 Beam trawlers 40m and larger............................................................. 98
4.7.3 Factors determining energy efficiency................................................. 99 4.7.4 Economic potential for technological improvement ............................ 101 4.7.5 Scenarios for future fuel prices ........................................................ 102 4.7.6 Economic consequences of technical adaptations ............................. 102
4.7.6.1 List of national studies 4 publications related to fuel efficiency in

Report Number C002/08 6 of 425
fisheries ....................................................................................................... 107
4.8 Belgium...................................................................................................... 108 4.8.1 Role of energy for individual fleet segments ...................................... 108 4.8.2 Break4even analysis ......................................................................... 109
4.8.2.1 Large beam trawlers ......................................................................... 109 4.8.2.2 Eurobeamers.................................................................................... 110
4.8.3 Factors determining energy efficiency............................................... 111 4.8.4 Economic potential for technological improvement ............................ 111 4.8.5 Scenarios for future fuel prices ........................................................ 112 4.8.6 Economic consequences of technical adaptations ............................. 113
4.8.6.1 List of national studies 4 publications related to fuel efficiency in fisheries ........................................................................................... 115
4.9 United Kingdom .......................................................................................... 116 4.9.1 Role of energy for individual fleet segments ...................................... 116 4.9.2 Break4even analysis ......................................................................... 119
4.9.2.1 Beam trawl 24440m........................................................................... 119 4.9.2.2 Demersal trawl seine 12424m ............................................................ 119 4.9.2.3 Demersal trawl seine 24440m ............................................................ 120 4.9.2.4 Demersal trawl seine over 40m.......................................................... 121 4.9.2.5 Pelagic trawl over 40m...................................................................... 122
4.9.3 Factors determining energy efficiency............................................... 123 4.9.4 Economic potential for technological improvement ............................ 124 4.9.5 Scenarios for future fuel prices ........................................................ 124 4.9.6 Economic consequences of technical adaptations ............................. 125
4.9.6.1 Demersal trawl seine 12424m: ........................................................... 125 4.9.6.2 Demersal trawl seine 24440m: ........................................................... 128 4.9.6.3 List of national studies 4 publications related to fuel efficiency in fisheries ........................................................................................... 129
5 Collection of data from national projects ............................................. 130
5.1 General ...................................................................................................... 130
5.2 Information from current national projects..................................................... 130 5.2.1 Netherlands (IMARES) ...................................................................... 130
5.2.1.1 Current national projects ................................................................... 130 5.2.1.2 Adaptations to beam trawls to reduce drag (NL) .................................. 130 5.2.1.3 Alternative stimulation (pulse trawls) to replace tickler chains in flatfish beam trawls ........................................................................... 131 5.2.1.4 Outrigger for flatfish beam trawl......................................................... 137
5.2.2 Belgium (ILVO) ................................................................................ 139 5.2.2.1 Current national projects ................................................................... 139 5.2.2.2 Alternative beam trawl ....................................................................... 140 5.2.2.3 Application of outrigger trawls on beam trawlers ................................. 141 5.2.2.4 Project alternative fisheries................................................................ 142
5.2.3 UK (SEAFISH) .................................................................................. 143 5.2.3.1 Biofuels for the fishing industry. ......................................................... 143 5.2.3.2 Biofuels for the Fishing Industry (December 2007)............................... 143 5.2.3.3 Containerised biodiesel batch production plant (February 2008) ........... 145 5.2.3.4 Single vs. twin rig trawling ................................................................. 146 5.2.3.5 Fuel Additives ................................................................................... 165 5.2.3.6 Industry testing of fuel line magnetic devices....................................... 166 5.2.3.7 Fuel line magnets .............................................................................. 166 5.2.3.8 Modified exhaust systems.................................................................. 166 5.2.3.9 Industry testing of innovative lubricating oil technologies ...................... 166 5.2.3.10 Lubricating oil additives ..................................................................... 166

Report Number C002/08 7 of 425
5.2.3.11 Beamers switching to out4rigging........................................................ 167 5.2.3.12 A demonstration of “OUTRIGGER TRAWLING” in the SW of England on MFV Admiral Gordon .................................................................... 167 5.2.3.13 Electro fishing for razor clams ........................................................... 167 5.2.3.14 Net drag reduction ............................................................................ 167 5.2.3.15 Reducing drag in towed fishing gears4fishing trials to evaluate the performance of a trawl constructed from T90 (‘turned mesh’) netting.... 167 5.2.3.16 First results from a pilot study ‘North Sea fishing trials using the Eliminator trawl’ ................................................................................ 168
5.2.4 Ireland (BIM).................................................................................... 169 5.2.4.1 Outline Specification of Green Trawler (produced by Promara for BIM)... 169
5.2.5 France (IFREMER) ............................................................................ 199 5.2.5.1 Project: Semi individual energetic diagnostic for Brittany trawlers ......... 199 5.2.5.2 Project: “Grand Largue”..................................................................... 200
5.2.6 Italy (CNR) ...................................................................................... 202 5.2.6.1 Estimation of fishing effort and fuel consumption ................................. 202 5.2.6.2 Replacement of Italian “Rapido” trawling by new light Mediterranean beam trawl ....................................................................................................... 205
6 Analysis of potential fishing gear and vessel design and engineering topics .............................................................................................. 208
6.1 General ...................................................................................................... 208
6.2 Numerical simulations of fishing gear ........................................................... 208 6.2.1 Methodology................................................................................... 208
6.2.1.1 Optimisation process......................................................................... 208 6.2.1.2 Numerical simulations........................................................................ 209
6.2.2 First study ...................................................................................... 209 6.2.2.1 Reference: case 0............................................................................. 209 6.2.2.2 Optimisation: Case 1 ......................................................................... 211 6.2.2.3 Optimisation: Case 2 ......................................................................... 213 6.2.2.4 Synthesis ......................................................................................... 216
6.2.3 Second study.................................................................................. 216 6.2.3.1 Numerical simulations........................................................................ 216 6.2.3.2 Reference: Case 0 ............................................................................ 217 6.2.3.3 Optimisation: Case 1 ......................................................................... 219 6.2.3.4 Synthesis ......................................................................................... 221
6.2.4 Conclusions.................................................................................... 222
6.3 Effects of door attack angle on the trawl gear behaviour................................ 222
6.4 Energy performance evaluation of fishing vessels by simulation...................... 225 6.4.1 Principles and features of the integrated energy systems model (in Dutch: Geïntegreerde Energie Systemen, abbreviated GES). ............ 225 6.4.2 Initial appraisal of potential fuel savings through GES4analysis ............. 230
6.5 Technical and operational adaptations studied by nation ................................ 230
6.6 France ....................................................................................................... 234 6.6.1 Reference design: OTB, 24440 m ..................................................... 234
6.6.1.1 Vessel .............................................................................................. 234 6.6.1.2 Gear ................................................................................................ 235 6.6.1.3 Operational profile............................................................................. 235 6.6.1.4 Evaluation of the state of technology .................................................. 236 6.6.1.5 Catch ............................................................................................... 236 6.6.1.6 Energy performance.......................................................................... 236
6.6.2 Adaptations under study – Adaptation No 1: Redesign of complete gear .............................................................................................. 239
6.6.2.1 Short description of Adaptation No 1 .................................................. 239

Report Number C002/08 8 of 425
6.6.2.2 Effects of Adaptation No 1................................................................. 240 6.6.3 Adaptations under study – Adaptation No 2: Reducing steaming speed............................................................................................. 241
6.6.3.1 Short description of Adaptation No 2 .................................................. 241 6.6.3.2 Effects of Adaptation No 4................................................................. 241
6.6.4 Summary table of adaptations for reference vessel FR....................... 242 6.6.5 References ..................................................................................... 242
6.7 Ireland 243 6.7.1 Reference design 1: OTB, 12424m ................................................... 243
6.7.1.1 Vessel .............................................................................................. 243 6.7.1.2 Gear ................................................................................................ 244 6.7.1.3 Operational profile............................................................................. 244 6.7.1.4 Evaluation of the state of technology .................................................. 245 6.7.1.5 Catch ............................................................................................... 246 6.7.1.6 Energy performance.......................................................................... 246
6.7.2 Adaptations under study – Adaptation No 1: Gear modifications.......... 248 6.7.2.1 Effects of Adaptation No 1................................................................. 249
6.7.3 Adaptations under study – Adaptation No 2: Reverting to single rig ..... 249 6.7.3.1 Effects of Adaptation No 2................................................................. 250
6.7.4 Adaptations under study – Adaptation No 3: Converting to seine netting ........................................................................................... 251
6.7.4.1 Effects of Adaptation No 3................................................................. 251 6.7.5 Adaptations under study – Adaptation No 4: Reduction in steaming speed............................................................................................. 252
6.7.5.1 Effects of Adaptation No 4................................................................. 252 6.7.6 Adaptations under study – Adaptation No 5: Optimising bollard pull..... 253
6.7.6.1 Effects of Adaptation No 5................................................................. 254 6.7.7 Adaptations under study – Adaptation No 6: Fitting a fuel meter.......... 254
6.7.7.1 Effects of Adaptation No 6................................................................. 255 6.7.8 Adaptations under study – Adaptation No 7: Fouling – hull cleaning system........................................................................................... 256
6.7.8.1 Effects of Adaptation No 7................................................................. 257 6.7.9 Adaptations under study – Adaptation No 8: Engine maintenance........ 258
6.7.9.1 Effects of Adaptation No 8................................................................. 258 6.7.10 Summary Table of Adaptations for Reference Vessel ......................... 259 6.7.11 References ..................................................................................... 259 6.7.12 Reference design 2: OTB, 24440 m .................................................. 260
6.7.12.1 Vessel .............................................................................................. 260 6.7.12.2 Gear ................................................................................................ 261 6.7.12.3 Operational profile............................................................................. 262 6.7.12.4 Evaluation of the state of technology .................................................. 262 6.7.12.5 Catch ............................................................................................... 263 6.7.12.6 Energy performance.......................................................................... 263
6.7.13 Adaptations under study – Adaptation No 1: Gear modifications – doors and trawls......................................................................................... 265
6.7.13.1 Short description of Adaptation No 1: Gear modifications..................... 265 6.7.13.2 Effects of Adaptation No 1................................................................. 266
6.7.14 Adaptations under study – Adaptation No 2: Dynex warps .................. 266 6.7.14.1 Short description of Adaptation No 2: Trawl warps .............................. 266
6.7.15 Adaptations under study – Adaptation No 3: Reverting to single rig ..... 267 6.7.15.1 Short description of Adaptation No 3: Reverting to single rig ................ 267 6.7.15.2 Effects of Adaptation No 4................................................................. 269
6.7.16 Adaptations under study – Adaptation No 5: Optimising bollard pull..... 270 6.7.16.1 Effects of Adaptation No 5................................................................. 270
6.7.17 Adaptations under study – Adaptation No 6: Fitting a fuel meter.......... 271 6.7.17.1 Effects of Adaptation No 6................................................................. 271

Report Number C002/08 9 of 425
6.7.18 Adaptations under study – Adaptation No 7: Fouling – hull cleaning system........................................................................................... 273
6.7.18.1 Effects of Adaptation No 7................................................................. 273 6.7.19 Adaptations under study – Adaptation No 8: Engine maintenance........ 274
6.7.19.1 Effects of Adaptation No 8................................................................. 274 6.7.20 Adaptations under study – Adaptation No 9: Replacing auxiliary engine............................................................................................ 275
6.7.20.1 Short description of Adaptation No 9: Auxiliaries and generators .......... 275 6.7.20.2 Effects of Adaptation No 9: Auxiliaries and generators ......................... 276
6.7.21 Adaptations under study – Adaptation No 10: Fuel quality................... 276 6.7.21.1 Short description of Adaptation No 10: Checking fuel quality ................ 276 6.7.21.2 Effects of Adaptation No 10: Checking fuel quality ............................... 276
6.7.22 Summary Table of Adaptations for Reference Vessel ......................... 277 6.7.23 References ..................................................................................... 277 6.7.24 Reference design 3: OTM/PTM, 24440 m .......................................... 278
6.7.24.1 Vessel .............................................................................................. 278 6.7.24.2 Gear ................................................................................................ 279 6.7.24.3 Operational profile............................................................................. 280 6.7.24.4 Evaluation of the state of technology .................................................. 280 6.7.24.5 Catch ............................................................................................... 281 6.7.24.6 Energy performance.......................................................................... 281
6.7.25 Adaptations under study – Adaptation No 1: Dynex warps .................. 283 6.7.25.1 Short description of Adaptation No 1: Dynex warps ............................. 283 6.7.25.2 Effects of Adaptation No 1................................................................. 284
6.7.26 Adaptations under study – Adaptation No 2: Hexagonal mesh trawls ... 284 6.7.26.1 Short description of Adaptation No 2: Hexagonal mesh trawls .............. 284 6.7.26.2 Effects of Adaptation No 2................................................................. 285
6.7.27 Adaptations under study – Adaptation No 3: T90 or square mesh codends ......................................................................................... 285
6.7.27.1 Short description of Adaptation No 3: T90 or square mesh codends..... 285 6.7.27.2 Effects of Adaptation No 3................................................................. 285 6.7.27.3 Short description of Adaptation No 4 .................................................. 286 6.7.27.4 Effects of Adaptation No 4................................................................. 286
6.7.28 Adaptations under study – Adaptation No 5: Optimising bollard pull..... 287 6.7.28.1 Short description of Adaptation No 5 .................................................. 287 6.7.28.2 Effects of Adaptation No 5................................................................. 287
6.7.29 Adaptations under study – Adaptation No 6: Fitting a fuel meter.......... 288 6.7.29.1 Short description of Adaptation No 6 .................................................. 288 6.7.29.2 Effects of Adaptation No 6................................................................. 288
6.7.30 Adaptations under study – Adaptation No 7: Fouling – hull cleaning system........................................................................................... 290
6.7.30.1 Short description of Adaptation No 7 .................................................. 290 6.7.30.2 Effects of Adaptation No 7................................................................. 290
6.7.31 Adaptations under study – Adaptation No 8: Engine maintenance........ 292 6.7.31.1 Short description of Adaptation No 8 .................................................. 292 6.7.31.2 Effects of Adaptation No 8................................................................. 292
6.7.32 Adaptations under study 4 Adaptation No. 9: Fitting a nozzle ............... 293 6.7.32.1 Short description of Adaptation No 9: Fitting a nozzle .......................... 293 6.7.32.2 Effects of Adaptation No 9: Fitting a high efficiency nozzle ................... 293
6.7.33 Adaptations under study – Adaptation No 10: Hull appendages........... 294 6.7.33.1 Short description of Adaptation No 10: Hull appendages...................... 294 6.7.33.2 Effects of Adaptation No 10: Hull appendices...................................... 294
6.7.34 Summary Table of Adaptations for Reference Vessel. ........................ 295 6.7.35 References ..................................................................................... 295
6.8 Italy 296 6.8.1 Reference design: OTB, 24440 m ..................................................... 296

Report Number C002/08 10 of 425
6.8.1.1 Vessel .............................................................................................. 296 6.8.1.2 Gear ................................................................................................ 297 6.8.1.3 Operational profile............................................................................. 298 6.8.1.4 Evaluation of the state of technology .................................................. 300 6.8.1.5 Catch ............................................................................................... 300 6.8.1.6 Energy performance.......................................................................... 301
6.8.2 Adaptations under study – Adaptation No 1....................................... 302 6.8.2.1 Short description of Adaptation No 1 .................................................. 302 6.8.2.2 Effects of Adaptation No 1................................................................. 305
6.8.3 Adaptations under study – Adaptation No 2....................................... 308 6.8.3.1 Short description of Adaptation No 2 .................................................. 308 6.8.3.2 Effects of Adaptation No 2................................................................. 309
6.8.4 Adaptations under study – Adaptation No 3: Installing a controllable pitch propeller (CPP)...................................................... 314
6.8.4.1 Short description of Adaptation No 3 .................................................. 314 6.8.4.2 Effects of Adaptation No 3................................................................. 314
6.8.5 Reference design: OTM, 24440 m..................................................... 316 6.8.5.1 Vessel .............................................................................................. 316 6.8.5.2 Gear ................................................................................................ 317 6.8.5.3 Operational profile............................................................................. 318 6.8.5.4 Evaluation of the state of technology .................................................. 319 6.8.5.5 Catch ............................................................................................... 319 6.8.5.6 Energy performance.......................................................................... 319 6.8.5.7 Short description of Adaptation No 4 .................................................. 321 6.8.5.8 Effects of Adaptation No 4................................................................. 325 6.8.5.9 Short description of Adaptation No 5 .................................................. 331 6.8.5.10 Effects of Adaptation No 5................................................................. 331 6.8.5.11 Short description of Adaptation No 6 .................................................. 331 6.8.5.12 Effects of Adaptation No 6................................................................. 331 6.8.5.13 Effects of Adaptation No 6................................................................. 331 6.8.5.14 Short description of Adaptation No 7 .................................................. 332 6.8.5.15 Effects of Adaptation No 7................................................................. 332 6.8.5.16 Short description of Adaptation No 8 .................................................. 332 6.8.5.17 Effects of Adaptation No 8................................................................. 332 6.8.5.18 Short description of Adaptation No 9 .................................................. 333
6.8.6 Hull cleaning can help to reduce the water resistance of the vessel..... 333 6.8.6.1 Effects of Adaptation No 9................................................................. 333
6.8.7 Summary table of adaptations for reference vessels IT ...................... 334 6.8.8 References ..................................................................................... 334
Netherlands 336 6.8.9 Reference design: TBB, 24440 m...................................................... 336
6.8.9.1 Vessel .............................................................................................. 336 6.8.9.2 Gear ................................................................................................ 337 6.8.9.3 Operational profile............................................................................. 337 6.8.9.4 Evaluation of the state of technology .................................................. 339 6.8.9.5 Catch ............................................................................................... 340 6.8.9.6 Energy performance.......................................................................... 340
6.8.10 Adaptations under study – Adaptation No 1: HydroRig........................ 340 6.8.10.1 Short description of Adaptation No 1 .................................................. 340 6.8.10.2 Effects of Adaptation No 1................................................................. 341
6.8.11 Adaptations under study – Adaptation No 2 – Pulse Trawl................... 343 6.8.11.1 Short description of Adaptation No 2 .................................................. 343 6.8.11.2 Effects of Adaptation No 2................................................................. 343
6.8.12 Adaptations under study – Adaptation No 3: Larger fixed propeller in a nozzle ......................................................................................... 344
6.8.12.1 Short description of Adaptation No 3 .................................................. 344

Report Number C002/08 11 of 425
6.8.12.2 Effects of Adaptation No 3................................................................. 344 6.8.13 Adaptations under study – Adaptation No 4: Lower steaming speed.... 345
6.8.13.1 Short description of Adaptation No 4 .................................................. 345 6.8.13.2 Effects of Adaptation No 4................................................................. 346
6.8.14 Adaptations under study – Adaptation No 5: Lower towing speed........ 347 6.8.14.1 Short description of Adaptation No 5 .................................................. 347 6.8.14.2 Effects of Adaptation No 5................................................................. 347
6.8.15 Summary Table of Adaptations for Reference Vessel NL .................... 348 6.8.16 References ..................................................................................... 348
6.8.16.1 Gear design and engineering studies .................................................. 348
6.9 Belgium...................................................................................................... 350 6.9.1 Reference design: TBB 24440 m....................................................... 350
6.9.1.1 Vessel .............................................................................................. 350 6.9.1.2 Gear ................................................................................................ 351 6.9.1.3 Operational profile............................................................................. 352 6.9.1.4 Evaluation of the state of technology .................................................. 352 6.9.1.5 Catch ............................................................................................... 352 6.9.1.6 Energy performance.......................................................................... 352
6.9.2 Adaptations under study – Adaptation No 1: Trawls in Dyneema™ ...... 354 6.9.2.1 Short description of Adaptation No 1 .................................................. 354 6.9.2.2 Effects of Adaptation No 1................................................................. 354
6.9.3 Adaptations under study – Adaptation No 2 – Chain matrix vs. tickler chain beam trawl............................................................................. 355
6.9.3.1 Short description of Adaptation No 2 .................................................. 356 6.9.3.2 Effects of Adaptation No 2................................................................. 356
6.9.4 Adaptations under study – Adaptation No 3 – Wheels replacing trawl shoes .............................................................................................. 357
6.9.4.1 Short description of Adaptation No 3 .................................................. 357 6.9.4.2 Effects of Adaptation No 3................................................................. 357
6.9.5 Adaptations under study – Adaptation No 4: Lower towing speed........ 358 6.9.5.1 Short description of Adaptation No 4 .................................................. 358 6.9.5.2 Effects of Adaptation No 4................................................................. 358
6.9.6 Adaptations under study – Adaptation No 5 – Outrigger gear replacing beam trawls ................................................................................. 359
6.9.6.1 Short description of Adaptation No 5 .................................................. 360 6.9.6.2 Effects of Adaptation No 5................................................................. 360
6.9.7 Adaptations under study – Adaptation No 6 – Additional wind power.... 361 6.9.7.1 Short description of Adaptation No 6 .................................................. 361 6.9.7.2 Effects of Adaptation No 6................................................................. 361
6.9.8 Summary Table of Adaptations for Reference Vessel ......................... 362 6.9.9 References ..................................................................................... 362
6.10 United Kingdom .......................................................................................... 363 6.10.1 Reference design: OTB, 124 24 m .................................................... 363
6.10.1.1 Fishing Gear ..................................................................................... 364 6.10.1.2 Operational profile............................................................................. 365 6.10.1.3 Evaluation of the state of technology .................................................. 365 6.10.1.4 Catch ............................................................................................... 365 6.10.1.5 Energy performance.......................................................................... 366
6.10.2 Adaptations under study – Fishing gear related measures – reduction of the fishing gear’s towing resistance ........................................... 367 6.10.3 Adaptations under study – Adaptation No 1: Towing warp specification368
6.10.3.1 Short description of Adaptation No 1 .................................................. 368 6.10.4 Adaptations under study – Adaptation No 2: Sweep/bridle arrangements ................................................................................. 369
6.10.4.1 Short description of Adaptation No 2 .................................................. 369

Report Number C002/08 12 of 425
6.10.5 Adaptations under study – Adaptation No 3: Trawl doors.................... 370 6.10.5.1 Short description of Adaptation No 3 .................................................. 370
6.10.6 Adaptations under study – Adaptation No 4: Trawl design and construction .............................................................................................. 371
6.10.6.1 Short description of Adaptation No 4 .................................................. 371 6.10.7 Adaptations under study – Adaptation No 5: Vessel and vessel operation related measures ............................................................. 375
6.10.7.1 Short description of Adaptation No 5 .................................................. 375 6.10.8 Adaptations under study – Adaptation No 5: Vessel and vessel operation related measures ......................................................................... 376
6.10.8.1 Maintaining engine efficiency.............................................................. 376 6.10.8.2 Alternative fuels ................................................................................ 377 6.10.8.3 Reducing Operating Speed: ............................................................... 378 6.10.8.4 Hull condition/maintenance ................................................................ 379 6.10.8.5 Sail Assisted Propulsion..................................................................... 382
6.10.9 Improvements relating to fishing vessel design and engineering:......... 383 6.10.9.1 The fishing vessel propeller (design and maintenance) ......................... 383 6.10.9.2 Propeller design................................................................................ 383 6.10.9.3 Propeller maintenance....................................................................... 384 6.10.9.4 Propeller nozzles .............................................................................. 385 6.10.9.5 Hull design ....................................................................................... 386 6.10.9.6 Propulsion units/engines.................................................................... 387 6.10.9.7 Fuel flowmeter systems – application and benefits relating to fuel efficiency: ....................................................................................................... 389
6.10.10 Summary Table of Adaptations for Reference Vessel.................. 390 6.10.11 References ............................................................................. 390 6.10.12 Reference design: OTB, 24440 m.............................................. 391
6.10.12.1 Vessel .................................................................................... 391 6.10.12.2 Gear....................................................................................... 392 6.10.12.3 Operational profile................................................................... 393 6.10.12.4 Evaluation of the state of technology ........................................ 394 6.10.12.5 Catch ..................................................................................... 394 6.10.12.6 Energy performance................................................................ 394
6.10.13 Adaptations under study – Adaptation No 1: Fishing gear related measures – reduction of the fishing gear’s towing resistance .............................................................................. 396
6.10.13.1 Short description of Adaptation No 1 ........................................ 396 6.10.13.2 Effects of Adaptation No 1 ....................................................... 397
6.10.14 Adaptations under study – Adaptation No 2: Reduction of engine rpm........................................................................................ 397
6.10.14.1 Short description of Adaptation No 2 ........................................ 397 6.10.14.2 Effects of Adaptation No 2 ....................................................... 398
6.10.15 Adaptations under study – Adaptation No 3: Reduction of steaming and fishing speed by 10%.......................................... 398
6.10.15.1 Short description of Adaptation No 3 ........................................ 398 6.10.15.2 Effects of Adaptation No 3 ....................................................... 398
6.10.16 Adaptations under study – Adaptation No 4: Hull cleaning........... 399 6.10.16.1 Short description of Adaptation No 4 ........................................ 399 6.10.16.2 Effects of Adaptation No 4 ....................................................... 399
6.10.17 Summary Table of Adaptations for Reference Vessel.................. 400
6.11 Catalogue of available technical solutions to improve energy efficiency ........... 400 6.11.1 General .......................................................................................... 400 6.11.2 Vessel design ................................................................................. 401 6.11.3 Propulsion systems ......................................................................... 401 6.11.4 Efficiency of the onboard energy consumers ..................................... 405 6.11.5 Alternative energy sources............................................................... 405

Report Number C002/08 13 of 425
6.11.6 Fishing gear design for greater energy efficiency............................... 405 6.11.7 Fishing tactics................................................................................. 407 6.11.8 References ..................................................................................... 407
7 Synthesis of techno4economic evaluation ............................................ 408
7.1 Summary of economic analysis of technological adaptations .......................... 408
7.2 Performance in 200446 and in 2008............................................................. 408
7.3 Impact of technological improvements.......................................................... 408
7.4 Ranking of technological solutions................................................................ 411
8 Conclusions and recommendations .................................................... 412
8.1 Conclusions................................................................................................ 412
8.2 Recommendations ...................................................................................... 412
9 References ....................................................................................... 413
9.1 Gear design and engineering studies ............................................................ 413
10 Annexes ........................................................................................... 414
10.1 Annex 1: DynamiT simulations of fishing gears by IFREMER............................ 415
10.2 Annex 2: General description and technical features of the fuel consumption
system....................................................................................................... 416
10.3 Annex 3: Gear codes and descriptions.......................................................... 424
11 Referees and Authors ........................................................................ 425

Report Number C002/08 14 of 425
Summary for non4specialists Project “Energy Saving in Fisheries” (ESIF) aimed at investigating potential technical and operational methods to address the need to reduce energy consumption and associated costs in European fisheries. The study started with an inventory of potential technical solutions and ongoing projects in the participating member states. The economic performance of selected fleet segments was analysed with emphasis on the role of energy costs. This economic analysis considered aspects such as: break4even fuel price, factors determining energy efficiency, the economic potential for technological improvement and scenarios for future outlook related to possible develop4ment of fuel price. Finally, the economic feasibility of proposed technological adaptations was assessed. On4going national and international research projects show the possibilities of saving energy by reducing the drag of towed fishing gears, changing the design of gear and components, using alternative ways to stimulate fish to be captured, as well as replacement by alternative gear types, including static gears. Some of these projects involved the collection of new data on the detailed breakdown of energy consumption using newly developed fuel measurement devices onboard commercial vessels, e.g. in Italy. A number of so4called ‘reference vessels’ were selected by fleet segment for which detailed technical information was collected, often by personally contacting vessel owners. For each of these cases a range of technical adaptations were analysed using an integrated energy systems model. This computer model simulates fuel consumption, efficiencies of the installation, and power used in various operational modes, such as: steaming to and from fishing grounds, shooting and hauling fishing gear, towing fishing gear, and harbour operation. By using this model the percentage change in fuel consumption was calculated for each proposed technical or operational adaptation, relative to the base line vessel operation (i.e. prior to any adaptation). The technical adaptations cons4idered were i.a.: redesigned fishing gears including all their components to reduce drag, applying alternative stimulation in fishing gears to replace heavy bottom chafing material, optimising propeller design, improving hull shape. Also operational changes have been analysed such as: reducing steaming and towing speeds or cleaning hulls more frequently. The percentage reduction in fuel consumption, with estimates of investment costs for new technology or changed procedures and effects on vessel productivity (landings per unit of effort) were used in an economic model to appraise the economic feasibility of the proposed adaptations and the overall effect on profitability. The study showed that individual technological adaptations offer energy savings mostly in the range of 5420%, with a few exceptions going as high as 40% for beam trawlers. In view of the diversity of vessels, gears and fisheries it is not possible to generalize how much savings could be achieved with a completely new fuel efficient design. However, it is most likely that economical investments in such new fuel efficient design are not feasible, as otherwise they would certainly have taken place during the period of high fuel prices. Some segments perform so strongly that they remain profitable even at fuel prices reached in the first half of 2008, between 100 and 140 US$/barrel Brent and up to 0.75 €/liter at the level of the fleet. This applies particularly to passive gears <12m in France and Italy (but not in Denmark) and the (large) pelagic trawlers in the UK, Ireland and in Italy. For almost all other segments for which technical adaptations have been proposed, the break4even fuel price after the adaptation remains (far) below the 2008 fuel price, which implies that these adaptations will improve the economic performance somewhat, but they will not solve the structural problem, which must be sought by raising productivity. The techno4economic analysis shows that for many highly fuel price sensitive fleets, improvement in economic performance can only be achieved through a mix of technical adaptations aimed at reducing fuel use and adaptations aimed at increasing earnings from catches. This implies that the size of the fleets will have to be reduced proportionately in order to ensure that the effective pressure of stocks does not increase.

Report Number C002/08 15 of 425
Executive Summary Project
Project “Energy Saving in Fisheries” (ESIF) aimed at investigating potential technical and operational methods to address the need to reduce energy consumption and associated costs in European fisheries. The study started with an inventory of potential technical solutions and ongoing projects in the participating nations. Examples are given on a national basis of current research projects on reducing the drag of towed fishing gears, potential changes in gear design, components and fish stimulation, as well as replacement by alternative gear types, including static gears. Collection of new data and information on detailed breakdown of energy consump4tion has been carried out by new fuel measurement devices on board commercial vessels, e.g. in Italy. The collection of data included the measurement of energy consumption during vessel operations in different working conditions (sailing to and from the fishing ground, fishing operations or fish processing). The integrated energy systems (GES) model was adapted for fishing vessels and data collected for input from a total of nine reference vessels cases in the participating nations. A total of 57 technical and operational adapt4ations were selected for these vessels and analysed using this model. These technical and operational adaptations featured: redesigned fishing gears including all their components to reduce drag (e.g. light material warps, more efficient otterboards, reduction in netting twine area, use of thinner twines, use of T90 meshes, hydro4dynamically shaped beams in beam trawls), changing from twin to single rigs, converting from trawling to seining or from beam trawls to outrigger trawls, applying alternative stimulation of fish in gears to become susceptible to capture (electric pulses of manipulation of the water flow inside the net) to replace heavy bottom chafing material, optimising propeller design (e.g. using a propeller nozzle, enlarging propeller diameter where possible), improving hull shape, adding a bulbous bow if not fitted, but also of operational nature such as: use of fuel meters, reducing steaming and towing speeds, maintaining engines properly, cleaning hulls more frequently. The percentage change in energy consumption found, estimates of additional investments needed, and effects on catches and earnings were derived as inputs for an economic evaluation. Country FR NL BE IT UK IRL
# vessels 1 1 1 2 2 3
# cases 3 8 6 9 11 28
The economic performance of a number of selected fleet segments was analysed. For the economic evaluation, the role of fuel use and costs is presented for the participating European member states in this project for a number of relevant fleet segments, using active as well as passive gears. The following aspects were taken into account: the role of energy for individual fleet segments, break4even analysis, factors determining energy efficiency, economic potential for technological improvement, scenarios for future fuel prices, as well as the economic consequences of technical adaptations. The results can be read of the tables below, in spite of potent4ially considerable savings in fuel consumption, in many cases economic losses can not be eliminated. Table 741: Summary of energy efficiency and role of potential savings
Fuel price (€/tonne) MS / gear Size
(m) 2004�6 Break�even
2004�6
2008
Range of
potential
savings
(%)
BE fuel price at
estimated
investment
(€/tonne)
Belgium
Beam trawl 12424 407 333 650 n/a n/a
Beam trawl 24440 407 271 650 5450% 1254300
Denmark
Gillnet <12 450 0 711 n/a
Demersal trawl 12424 409 0 646 5430%
Demersal trawl 24440 388 129 613 5430% 1244162

Report Number C002/08 16 of 425
Fuel price (€/tonne) MS / gear Size
(m) 2004�6 Break�even
2004�6
2008
Range of
potential
savings
(%)
BE fuel price at
estimated
investment
(€/tonne)
France
Passive gears <12 310 2816 547 n/a N/a
Demersal trawl 12424 310 437 547 15% 489
Ireland
All inshore 362 514 594
Demersal trawl 12424 362 202 594 8421% 2194256
Demersal trawl 24440 362 476 594 5420% 4984595
Pelagic trawl >40 362 291 594
Pelagic trawl 24440 362 1584 594 5425% 176042120
Italy
Bottom trawl 24440 478 273 739 8.5% 515
Pelagic trawl 24440 417 1444 739
Beam trawl 12424 446 415 739
Passive gears <12 481 2500 739
Netherlands
Beam trawl 12424 344 119 695 n/a
Beam trawl 24440 338 263 683 7440% 04327
Beam trawl >40 337 292 680 n/a
United K.
Beam trawl 24440 372 331 650
Demersal trawl/seine 12424 372 240 650 5415% 2054256
Demersal trawl/seine 24440 372 398 650 10% 442
Demersal trawl/seine >40 372 105 650 n/a
Pelagic trawl >40 443 3896 650 n/a
Table 742: Evaluation of the performance at 200446 and 2008 fuel price Country Gear Length
(m)
B�E fuel
price /
price 2004�
6
(€/tonne)
Performance
2004�6
B�E fuel
price /
price 2008
(€/tonne)
Performance
2008
Denmark Gillnet <12 0.00 Loss 0.00 Loss
Denmark Demersal tr. 12424 0.00 Loss 0.00 Loss
United K. Dem. trawl/seine >40 0.28 Loss 0.16 Loss
Denmark Demersal tr. 24440 0.33 Loss 0.21 Loss
Netherlands Beam trawl 12424 0.35 Loss 0.17 Loss
Ireland Demersal tr. 12424 0.56 Loss 0.34 Loss
Italy Bottom trawl 24440 0.57 Loss 0.37 Loss
United K. Dem. trawl/seine 12424 0.65 Loss 0.37 Loss
Belgium Beam trawl 24440 0.67 Loss 0.42 Loss
Netherlands Beam trawl 24440 0.78 Loss 0.39 Loss
Ireland Pelagic tr. >40 0.80 Loss 0.49 Loss
Belgium Beam trawl 12424 0.82 Loss 0.51 Loss
Netherlands Beam trawl >40 0.87 Loss 0.43 Loss
United K. Beam trawl 24440 0.89 Loss 0.51 Loss

Report Number C002/08 17 of 425
Country Gear Length
(m)
B�E fuel
price /
price 2004�
6
(€/tonne)
Performance
2004�6
B�E fuel
price /
price 2008
(€/tonne)
Performance
2008
Italy Beam trawl 12424 0.93 B4E 0.56 Loss
United K. Dem. trawl/seine 24440 1.07 B4E 0.61 Loss
Ireland Demersal tr. 24440 1.31 Profit 0.80 Loss
France Demersal tr. 12424 1.41 Profit 0.80 Loss
Ireland All inshore 1.42 Profit 0.87 Loss
Italy Pelagic trawl 24440 3.46 Profit 1.95 Profit
Ireland Pelagic tr. 24440 4.38 Profit 2.67 Profit
Italy Passive gears <12 5.20 Profit 3.38 Profit
United K. Pelagic trawl >40 8.79 Profit 5.99 Profit
France Passive gears <12 9.08 Profit 5.15 Profit
Note: Loss / profit is assumed at 4/+ 10% of the break4even price from the real fuel price. B4E is within this range. Table 743: Impact of technological improvements in the most optimistic scenario Country Gear Length
(m)
Perform
ance
2004�6
Perform
ance
2008
Highest
BE fuel
price
(€/tonne)
Performance at best technological
improvement
Denmark Demersal trawl 12424 Loss Loss 0 Losses remain for 200446
Denmark Demersal trawl 24440 Loss Loss 162 Losses remain for 200446
United K. Dem. trawl 12424 Loss Loss 256 Losses remain for 200446
Ireland Demersal trawl 12424 Loss Loss 256 Losses remain for 200446
Belgium Beam trawl 24440 Loss Loss 300 Losses remain for 200446
Netherlands Beam trawl 24440 Loss Loss 327 BE in 200446, loss in 2008
Italy Bottom trawl 24440 Loss Loss 515 BE in 200446, loss in 2008
United K. Demersal trawl 24440 B4E Loss 442 Profit in 200446, loss in 2008
France Demersal trawl 12424 Profit Loss 489 Profit in 200446, BE in 2008
Ireland Demersal trawl 24440 Profit Loss 595 Profit in 200446, BE in 2008
Ireland Pelagic trawl 24440 Profit Profit 2120 Overall profit, even without adaptations
Conclusions and Recommendations Conclusions
If is assumed that 200446 break4even price within +/410% of the realized price would mean that the segment was operating at approximately break4even level, than 14 out of 24 segments were operating at a loss, while 8 were making profit. The level of performance does not seem to be related to gear type or vessel size The situation in 200446 shows that there was need for improvement of performance among many different types of vessels and gears, many of them requiring an energy efficiency improvement by at least 25450%. The increase of fuel price in the first 8 months of 2008 has produced further deterioration of economic perform4ance. It is estimated that 19 out of the 24 segments were making (significant) losses under those conditions. For

Report Number C002/08 18 of 425
many of those segments, an energy improvement by at least 50% would be required to allow them to deal with the extremely high fuel price. The extent of possible improvements of the energy efficiency by technological and/or operational improvements ranged between 5% and 30%. In case of five segments (demersal trawlers 12424m in Denmark, UK and Ireland, 24440m in Denmark and beam trawlers in Belgium) the proposed technical adaptations are not even sufficient to eliminate the losses which these segments faced in 200446, not to speak of the much higher fuel price in 2008. For two segments (Dutch beam trawlers 24440m and Italian bottom trawlers 24440m) the technical improvements could be introduced to eliminate the losses of 200446. However, these improvements are still not sufficient to off4set the high fuel price of 2008. Finally, three segments of demersal trawlers (UK 24440m, Italy 24440m and France 12424m) could improve their performance and reach approximately break4even level under the 2008 conditions. These segments showed already quite good performance in 200446. The Irish pelagic trawlers 24440m are very profitable, even under the 2008 conditions, so that the need for further technological improvement is not essential for their survival. Ranking technological and/or operational improvements in terms of energy savings is barely possible on the basis of this study, if at all. A large overlap was found when ranking was tried according to criteria such as: litres of fuel / kg fish, fuel costs as % of income, or litres / kW4day. Recommendations
The techno4economic analysis shows that for many fleets, which are highly fuel dependent, improvement of economic performance can be only achieved by a mix of technical and operational adaptations aimed at reduction of fuel intensity and adaptations aimed at increasing earnings from catches (CPUE). The latter adaptations imply evidently that the size of the fleets would have to be reduced proportionately so that the effective pressure of stocks does not increase.

Report Number C002/08 19 of 425
Assignment EU contract SI2.477247, Energy Saving in Fisheries” (ESIF)
Quality Assurance IMARES utilises an ISO 9001:2000 certified quality management system (certificate number: 08602420044AQ4ROT4RvA). This certificate is valid until 15 December 2009. The organisation has been certified since 27 February 2001. The certification was issued by DNV Certification B.V. The last certification inspection was held the 16422 of May 2007. Furthermore, the chemical laboratory of the Environmental Division has NEN4AND4ISO/IEC 17025:2000 accreditation for test laboratories with number L097. This accreditation is valid until 27 March 2009 and was first issued on 27 March 1997. Accreditation was granted by the Council for Accreditation, with the last inspection being held on the 12th of June 2007.
Report Number C002/08 20 of 425
1 Introduction and objectives of the study
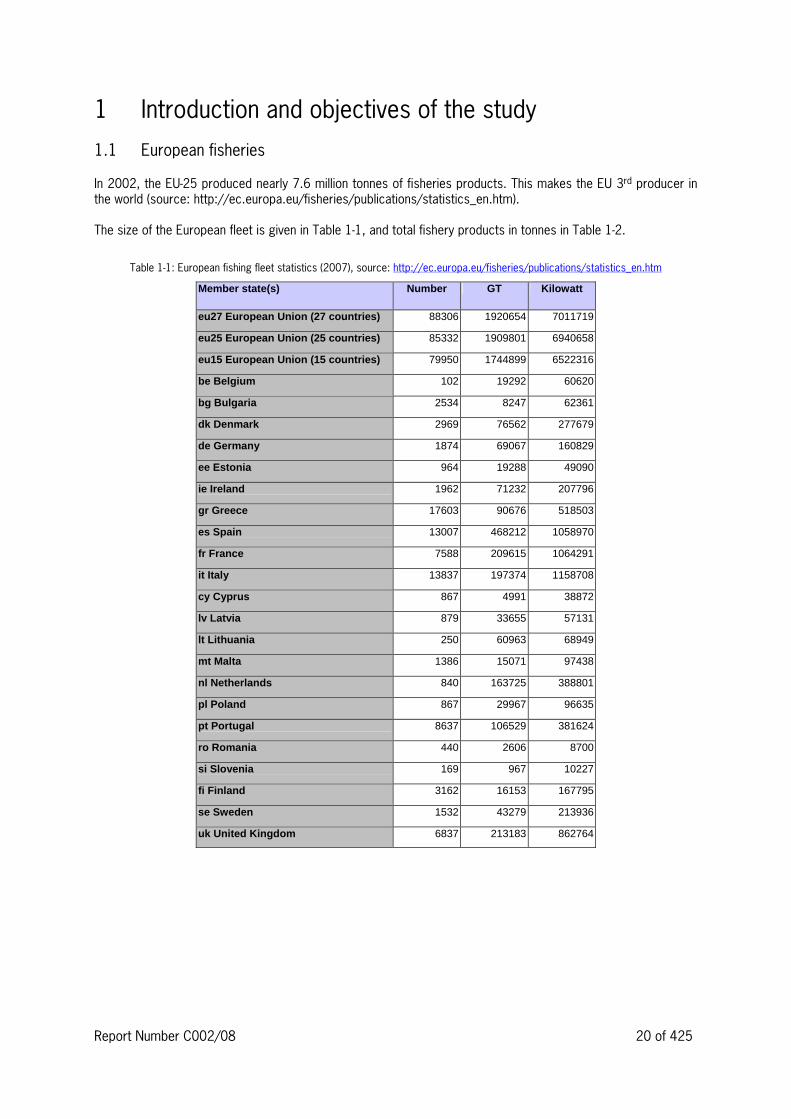
1.1 European fisheries In 2002, the EU425 produced nearly 7.6 million tonnes of fisheries products. This makes the EU 3rd producer in the world (source: http://ec.europa.eu/fisheries/publications/statistics_en.htm). The size of the European fleet is given in Table 141, and total fishery products in tonnes in Table 142.
Table 141: European fishing fleet statistics (2007), source: http://ec.europa.eu/fisheries/publications/statistics_en.htm
Member state(s) Number GT Kilowatt
eu27 European Union (27 countries) 88306 1920654 7011719
eu25 European Union (25 countries) 85332 1909801 6940658
eu15 European Union (15 countries) 79950 1744899 6522316
be Belgium 102 19292 60620
bg Bulgaria 2534 8247 62361
dk Denmark 2969 76562 277679
de Germany 1874 69067 160829
ee Estonia 964 19288 49090
ie Ireland 1962 71232 207796
gr Greece 17603 90676 518503
es Spain 13007 468212 1058970
fr France 7588 209615 1064291
it Italy 13837 197374 1158708
cy Cyprus 867 4991 38872
lv Latvia 879 33655 57131
lt Lithuania 250 60963 68949
mt Malta 1386 15071 97438
nl Netherlands 840 163725 388801
pl Poland 867 29967 96635
pt Portugal 8637 106529 381624
ro Romania 440 2606 8700
si Slovenia 169 967 10227
fi Finland 3162 16153 167795
se Sweden 1532 43279 213936
uk United Kingdom 6837 213183 862764

Report Number C002/08 21 of 425
Table 142: EU catches 2006, source: http://ec.europa.eu/fisheries/publications/statistics_en.htm
Member state(s) Total fishery products (tonnes)
eu27 European Union (27 countries) 5315393
eu25 European Union (25 countries) 5301183
eu15 European Union (15 countries) 4777989
be Belgium 22519
bg Bulgaria 7545
cz Czech Republic 4646
dk Denmark 867844
de_tot Germany (including ex-GDR) 279040
ee Estonia 86881
ie Ireland 210670
gr Greece 98112
es Spain 710897
fr France 582846
it Italy 312047
cy Cyprus 2098
lv Latvia 140389
lt Lithuania 153111
lu Luxembourg (Grand-Duché) -
hu Hungary 7543
mt Malta 1348
nl Netherlands 433235
at Austria 360
pl Poland 123067
pt Portugal 229094
ro Romania 6664
si Slovenia 1133
sk Slovakia 2979
fi Finland 146288
se Sweden 269255
uk United Kingdom 615780

Report Number C002/08 22 of 425
1.2 Employment The total of people directly involved in the fisheries and aquaculture in Europe is well over 400000 (Table 143).
Table 143: Employment in EU fisheries, fish processing and aquaculture, 200242003, source: http://ec.europa.eu/fisheries/publications/statistics_en.htm
Area/Employment Fisheries Fish processing Aquaculture Total
North Sea 15100 35100 1600 51800
Baltic 17200 33500 3700 54000
North East Atlantic 82900 55800 40100 179000
Mediterranean 89800 16300 11800 118000
Total 205000 140700 57200 402800
1.3 Resources Many fish stocks are in a declining state (ICES, 2006) causing a decrease of fishing opportunities, whilst running costs of fishing vessels are increasing due to increasing price of fuel. These two jeopardize the profitability of fishing operations (Anon., 2006; Beare and McKenzie, 2006), and many companies are at present on the verge of bankruptcy.
1.4 Energy costs In recent years there is increased unease within the fishing industry due to the increased prices of fuel (Figure 141) which, coupled to the shortage in income due to the poor state of the fish resources, has led to many fishing enterprises to economic collapse or close to it. Most affected are beam trawlers, with demersal trawlers and pelagic trawlers following (Table 144).
0
0.1
0.2
0.3
0.4
0.5
0.6
0.7
2000 2001 2002 2003 2004 2005 2006 2007
year
fue
l p
rice
in
€/
ltr
Belgium
Denmark
France
Italy
Ireland
Netherlands
Figure 141: Recent development in fuel prices (source: STECF AER 2008)
Report Number C002/08 23 of 425
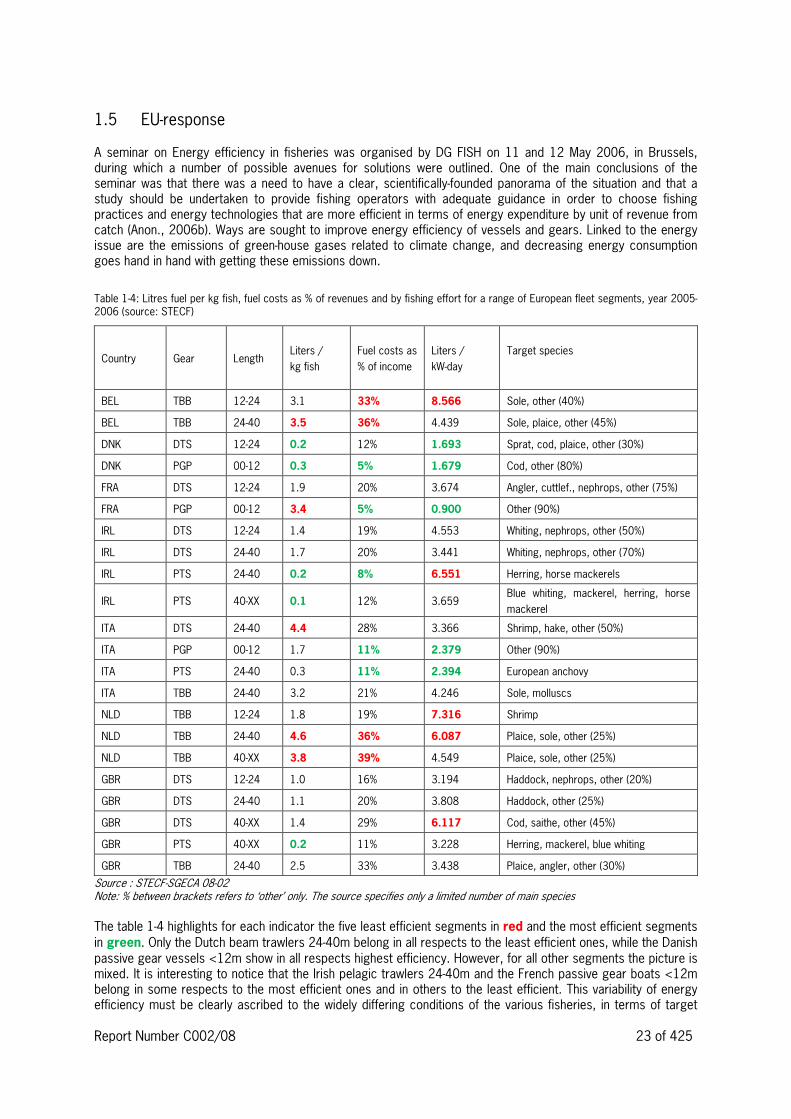
1.5 EU4response A seminar on Energy efficiency in fisheries was organised by DG FISH on 11 and 12 May 2006, in Brussels, during which a number of possible avenues for solutions were outlined. One of the main conclusions of the seminar was that there was a need to have a clear, scientifically4founded panorama of the situation and that a study should be undertaken to provide fishing operators with adequate guidance in order to choose fishing practices and energy technologies that are more efficient in terms of energy expenditure by unit of revenue from catch (Anon., 2006b). Ways are sought to improve energy efficiency of vessels and gears. Linked to the energy issue are the emissions of green4house gases related to climate change, and decreasing energy consumption goes hand in hand with getting these emissions down.
Table 144: Litres fuel per kg fish, fuel costs as % of revenues and by fishing effort for a range of European fleet segments, year 200542006 (source: STECF)
Country Gear Length Liters /
kg fish
Fuel costs as
% of income
Liters /
kW4day
Target species
BEL TBB 12424 3.1 33% 8.566 Sole, other (40%)
BEL TBB 24440 3.5 36% 4.439 Sole, plaice, other (45%)
DNK DTS 12424 0.2 12% 1.693 Sprat, cod, plaice, other (30%)
DNK PGP 00412 0.3 5% 1.679 Cod, other (80%)
FRA DTS 12424 1.9 20% 3.674 Angler, cuttlef., nephrops, other (75%)
FRA PGP 00412 3.4 5% 0.900 Other (90%)
IRL DTS 12424 1.4 19% 4.553 Whiting, nephrops, other (50%)
IRL DTS 24440 1.7 20% 3.441 Whiting, nephrops, other (70%)
IRL PTS 24440 0.2 8% 6.551 Herring, horse mackerels
IRL PTS 404XX 0.1 12% 3.659 Blue whiting, mackerel, herring, horse
mackerel
ITA DTS 24440 4.4 28% 3.366 Shrimp, hake, other (50%)
ITA PGP 00412 1.7 11% 2.379 Other (90%)
ITA PTS 24440 0.3 11% 2.394 European anchovy
ITA TBB 24440 3.2 21% 4.246 Sole, molluscs
NLD TBB 12424 1.8 19% 7.316 Shrimp
NLD TBB 24440 4.6 36% 6.087 Plaice, sole, other (25%)
NLD TBB 404XX 3.8 39% 4.549 Plaice, sole, other (25%)
GBR DTS 12424 1.0 16% 3.194 Haddock, nephrops, other (20%)
GBR DTS 24440 1.1 20% 3.808 Haddock, other (25%)
GBR DTS 404XX 1.4 29% 6.117 Cod, saithe, other (45%)
GBR PTS 404XX 0.2 11% 3.228 Herring, mackerel, blue whiting
GBR TBB 24440 2.5 33% 3.438 Plaice, angler, other (30%)
Source : STECF4SGECA 08402 Note: % between brackets refers to ‘other’ only. The source specifies only a limited number of main species The table 144 highlights for each indicator the five least efficient segments in red and the most efficient segments in green. Only the Dutch beam trawlers 24440m belong in all respects to the least efficient ones, while the Danish passive gear vessels <12m show in all respects highest efficiency. However, for all other segments the picture is mixed. It is interesting to notice that the Irish pelagic trawlers 24440m and the French passive gear boats <12m belong in some respects to the most efficient ones and in others to the least efficient. This variability of energy efficiency must be clearly ascribed to the widely differing conditions of the various fisheries, in terms of target

Report Number C002/08 24 of 425
species, fishing areas, gear and vessels used, etc. The variability of energy efficiency of individual vessels is even much higher, than indicated by segment averages (see scatter diagrams in chapter 3). Call FISH/2006/17 stated in “Description of the tasks of each Lot” the following: 2.2.3. Lot 3: Energy efficiency of fishing operations by the Community fishing fleet
The study was divided into the following Terms of Reference (ToR) and tasks:
• ToR1: compilation of the existing knowledge on energy consumption and energy efficiency on board fishing vessels, with tasks:
o Task 1.1: Inventory of energy efficiency in terms of catch per unit of energy used o Task 1.2: Collection of economic data o Task 1.3: Assessment of the present role of fuel costs
• ToR2: collection of new, detailed information by fishery (métier) and by type of vessel, with tasks: o Task 2.1: Selection of most promising areas o Task 2.2: Collection of data from national projects o Task 2.3: New data collection at sea o Task 2.4: Numerical simulations of fishing gear geometry and drag
• ToR3: compilation of current technological solutions to improve energy efficiency, with tasks: o Task 3.1: Analysis of potential fishing vessel design and engineering topics
� Task 3.1a: Selection of topics for further study � Task 3.1b: Energy performance evaluation of fishing vessels by simulation
o Task 3.2: Analysis of potential fishing gear design and engineering topics � Task 3.2a: Ways to decrease gear drag by fishing gear design optimisation � Task 3.2b: Ways to decrease gear drag by hydrodynamical optimisation � Task 3.2c: Ways to decrease gear drag by alternative stimulation � Task 3.2d: Ways to decrease gear drag by decreasing ground contact � Task 3.2e: Ways to decrease gear drag by gear replacement
• ToR4: analysis of the information gathered, so as to provide fishing operators with a guide to assess the practical consequences, especially the economic ones, of adopting different alternatives to increase energy efficiency, with tasks:
o Task 4.1: Ranking practices in terms of energy efficiency o Task 4.2: Identify possible areas of action to increase energy efficiency o Task 4.3: Evaluation of scenarios in economic terms o Task 4.4: Analysis of short and long term consequences of energy4efficient practices
This report gives the intermediate state of progress in this project on a task by task basis, an evaluation of the project performance, and a work programme for the remaining of the project.
2 Segments under study The following fleet segments were considered for further study and communicated with the Commission.
Table 241: Table of segments and metiers considered for further study
Nation Segment # Gear inputs
(GES�analyses)
Ref
vessel
Vessel inputs
Gear Length vessels species
NL TBB 12424 50 shrimps 4 4
TBB 12424 160 Flatfish,
shrimps
(eurocutters)
Tactics eg
fishing grounds
and steaming
distance?
4
TBB 24445 100 flatfish Drag reduction
(beam shapes,
wheels),
Alternatives:
2000 hp Simulation of
lower drag beam
trawl, pulse trawl,
speed

Report Number C002/08 25 of 425
Nation Segment # Gear inputs
(GES�analyses)
Ref
vessel
Vessel inputs
Gear Length vessels species
pulse trawl
(DEGREE), gear
replacement
(outrigger)
reductions,
propeller design.
BE TBB 12424
(eurocutters)
30440 flatfish and
shrimps
Electrified
shrimp trawl?
4
TBB 24445 50460 flatfish Drag reduction
replacement
(outrigger),
tactics
1300 hp Simulation of low
drag trawls, and
outriggers
UK TBB 12424 20430 flatfish Gear drag
reduction
300 hp Bio4fuels,
additives
TBB 24440 50 flatfish Gear drag
reduction
80041100
hp
Bio4fuels,
additives
OTB 12424 300 Nephrops Drag reduction,
twin trawls,
80041100
hp
Bio4fuels,
additives
OTB 24440 80490 White fish Drag reduction,
twin trawls,
700 hp Bio4fuels,
additives
IT OTM (for
some
vessels
mixed with
purse seine)
24440 68 (data at
31.12.2006)
Sardines
anchovies
Pair to single
trawl
80041000 Hull form and
length effect on
fuel, bulbous or
axe bow, prop.
diameter, fixed
vs controlled
pitch props
OTB 24440 341 Mixed
demersal
species
Drag
optimisation
(DEGREE)
80041000 idem
TBB 12424 47 flatfish Light beam
trawls for rapido
(DEGREE)
4004700
FR Passive gear <12 1236 Mixed fish Gear
replacements?
~130
OTB 12424 450
Mixed fish
Nephrops
Drag reduction
and redesign
(DynamiT), twin
trawls, regional
study
~400
OTM 12424 91
Mixed fish ~300
DK OTB (not in
DCR)
12424 32434 Mixed
demersal,
Nephrops
none ~75 BRT none, only
economic
analyses
OTB (not in
DCR)
24440 22 Mixed
demersal,
Nephrops,
whitefish
none 220 (1124
400) BRT
idem
OTM + seine 12424
97 Nephrops none ~330 idem
OTM + seine 24440 93 sprat,
sandeels
none ~580 idem
TBB 12424 26 flatfish none idem
TBB 24440 6 flatfish none idem
IE OTB 12424 223 Mixed Single v.s. twin ~600 Green trawler,

Report Number C002/08 26 of 425
Nation Segment # Gear inputs
(GES�analyses)
Ref
vessel
Vessel inputs
Gear Length vessels species
demersal,
Nephrops
trawl hull shape, prop,
operational
char’s, tank
testing, design
spec’s,
investment costs,
withy industry
(yards & marine
engineers)
24440 60 idem idem 800 idem TBB: Beam trawl; OTB: Otter Trawl Bottom; OTM: Otter Trawl Midwater
3 Catalogue of fishing vessel and gear characteristics For the segments mentioned above an inventory was made of the mean vessel and gear characteristics using DCR4data listing: country, a segment description, Loa range, power range, gear type, main target species, gear dimensions, e.g beam width, net circumference, headline length, footrope length, siderope length, codend mesh size, average fishing speed, average yearly fishing effort, average yearly landings, average LPUE, average fuel consumption per year, and average LPUE per unit of energy used (Table 341). The Average LPUE per unit energy varies among segments, and stationary gear are not always performing better than towed gears in this respect. It should also ne noted that there is a great variety of vessel and gear types and dimensions used, and making general statements is not easily justifiable.

Report Number C002/08 27 of 425
Table 341: Catalogue of fishing vessel and gear characteristics
Coun
try
Segment
description
Loa
range
(m)
Power
range
(kW)
Gear
type Main target species
Gear
code
Beam
width
(m)
Circumfe
r4ence
Headline
length
(m)
Footrop
e length
(m)
Siderop
e length
(m)
Coden
d
mesh
size
(mm)
Average
fishing
speed
(kts)
Average
yearly
fishing
effort
per
vessel
(1000
kW*days
or days)
Average
yearly
landings
(tonnes)
per
vessel
Average
LPUE
(tonnes/
1000 kW4
day;
kg/day)
Average
fuel
consump
tion per
year
(*1000
ltr) per
vessel
Average
LPUE per
unit
energy
(kg/ltr)
DK
Gillnetters
<12m <12
70
(30:
180) Gill net
Cod, plaice, sole,
turbot GNS n/a n/a n/a n/a n/a
>130
(gill
net) n/a
8 (1000
kW4days);
114
(days) 30
3.78;
264
kg/day 10 3.02
DK
Demersal
trawlers 124
24m 12424
235
(120:
800)
Bottom
Trawl
Cod, haddock, saithe,
plaice, sand eel,
Norway pout, Norway
lobster OTB n/a
different
types
different
types
different
types
different
types >100 344
42 (1000
kW4days);
179
(days) 253
6.03;
1416
kg/day 114 2.22
DK
Demersal
trawlers 244
40m 24440
559
(400:
1000)
Bottom
Trawl
Cod, haddock, saithe,
plaice, anglerfish, sand
eel, Norway pout,
Norway lobster, prawn OTB n/a
different
types
different
types
different
types
different
types > 100 344
138
(1000
kW4days);
247
(days) 629
4.56;
2549
kg/day 516 1.22
NL
Beam trawlers
12424m 12424 211
Beam
trawl brown shrimps TBB 9 n/a 8.5 25 2.5 21.7 97 4.47 162 0.60
NL
Beam trawlers
24440m 24440 1471
Beam
trawl sole, plaice, other TBB 12 n/a 11.5 30 6.5 144.87 242 1.67 1045 0.23
NL
Beam trawlers
>40m >40 1471
Beam
trawl sole, plaice, other TBB 12 n/a 11.5 30 7 304.63 465 1.53 1570 0.30
NL
Pelagic trawlers
>40m >40 5434
Pelagic
trawl
Herring, mackerel,
horse mackerel,
sardinella OTM n/a
30004
10000
2004
250
2004
250 5 n/a 25480 n/a n/a n/a

Report Number C002/08 28 of 425
Coun
try
Segment
description
Loa
range
(m)
Power
range
(kW)
Gear
type Main target species
Gear
code
Beam
width
(m)
Circumfe
r4ence
Headline
length
(m)
Footrop
e length
(m)
Siderop
e length
(m)
Coden
d
mesh
size
(mm)
Average
fishing
speed
(kts)
Average
yearly
fishing
effort
per
vessel
(1000
kW*days
or days)
Average
yearly
landings
(tonnes)
per
vessel
Average
LPUE
(tonnes/
1000 kW4
day;
kg/day)
Average
fuel
consump
tion per
year
(*1000
ltr) per
vessel
Average
LPUE per
unit
energy
(kg/ltr)
UK
Beam trawlers
24440m 24440 778
Beam
trawl sole, plaice, monkfish TBB 10 21 10 18 0.5 80 5 159 247
1.56
tonnes/
1000 kW4
day 744 0.33
UK
Demersal
trawlers and
seiners 12424m 12424 270
Bottom
Trawl or
Seine
haddock, monkfish,
cod, whiting, nephrops OTB n/a 40 44 48 2 120 3 33 147
4.46
tonnes/
1000 kW4
day 192 0.77
UK
Demersal
trawlers and
seiners 24440m 24440 647
Bottom
Trawl or
Seine
haddock, monkfish,
cod, whiting OTB n/a 50 46 50 6 120 3.5 155 538
3.47
tonnes/
1000 kW4
day 637 0.83
UK
Demersal
trawlers and
seiners >40m >40 1817
Bottom
Trawl or
Seine
haddock, monkfish,
cod, whiting OTB n/a 64 50 55 12 120 3.5 459 1,904
4.15
tonnes/
1000 kW4
day 2,399 0.77
UK
Pelagic trawlers
>40m >40 4244
Pelagic
trawl
mackerel, herring, blue
whiting OTM n/a 400 250 250 130 50 5 416 10,891
26.18
tonnes/
1000 kW4
day 602 10
BE
Beam trawlers
12424m 12424
220.6
5
Beam
trawl Brown shrimps TBB 8 n/a 34 83 2.44 246 0.34
BE
Beam trawlers
24440m 24440 882.6
Beam
trawl sole, plaice, other TBB 12 n/a 216 293 1.36 1045 0.28

Report Number C002/08 29 of 425
Coun
try
Segment
description
Loa
range
(m)
Power
range
(kW)
Gear
type Main target species
Gear
code
Beam
width
(m)
Circumfe
r4ence
Headline
length
(m)
Footrop
e length
(m)
Siderop
e length
(m)
Coden
d
mesh
size
(mm)
Average
fishing
speed
(kts)
Average
yearly
fishing
effort
per
vessel
(1000
kW*days
or days)
Average
yearly
landings
(tonnes)
per
vessel
Average
LPUE
(tonnes/
1000 kW4
day;
kg/day)
Average
fuel
consump
tion per
year
(*1000
ltr) per
vessel
Average
LPUE per
unit
energy
(kg/ltr)
FR
Passive gears <
12m <12 200
Gillnet/t
rammel
monk,hake, mulet, sole,
plaice … n/a n/a 5000 n/a n/a
504
300 n/a 23 20 13 23 0.87
FR
Bottom trawlers
12424m 12424 450
Bottom
trawl
monk, hake, whiting,
megrim, plaice, skate,
nephrops … OTB n/a 30450 20440 20450 60 70490 3.5 76 120 25 283 0.42
EI
Inshore
vessels<12m <12
31.62
65 Pots Crab, Lobster, Whelk FPO n/a n/a n/a n/a n/a n/a 4 23 5.75 11 2.09
EI
Dredgers 24 4
40m 24440
329.5
04 Dredges Scallops DRB
10 x
10
dred
ges n/a n/a n/a n/a 4.5 n/a 8 n/a 86.7 0.09
EI
Demersal
Trawlers 124
24m 12424
279.4
9 Trawls
Nephrops, Whiting,
Herring, monkfish OTB n/a 35 72 120 n/a 2.5 41 152 3.71 201 0.76
EI
Demersal
Trawlers 24 to
40m 24440
676.6
6 Trawls
Nephrops, Monkfish,
Haddock, Whiting OTB n/a 90 32 39 n/a 2.6 122 279 2.29 467 0.60
EI
Pelagic
Trawlers 244
40m 24440
741.3
84
Pair &
Single
Pelagic
Trawls
Mackerel, Herring,
Hose Mackerel, Blue
Whiting
OTM
/PTM n/a 1228 151 151 109 5 92 2350 25.54 517 4.55
EI
Pelagic
Trawlers > 40m >40
1691.
65
Pair &
Single
Pelagic
Trawls
Mackerel, Herring,
Hose Mackerel, Blue
Whiting
OTM
/PTM n/a 2000 172 172 127 5 262 6770 25.84 841 8.05

Report Number C002/08 30 of 425
Coun
try
Segment
description
Loa
range
(m)
Power
range
(kW)
Gear
type Main target species
Gear
code
Beam
width
(m)
Circumfe
r4ence
Headline
length
(m)
Footrop
e length
(m)
Siderop
e length
(m)
Coden
d
mesh
size
(mm)
Average
fishing
speed
(kts)
Average
yearly
fishing
effort
per
vessel
(1000
kW*days
or days)
Average
yearly
landings
(tonnes)
per
vessel
Average
LPUE
(tonnes/
1000 kW4
day;
kg/day)
Average
fuel
consump
tion per
year
(*1000
ltr) per
vessel
Average
LPUE per
unit
energy
(kg/ltr)
IT Passive gears
<12m <12
204
450
Gillnets,
trammel
nets,
Traps
Cuttlefish, mantis
shrimps, sole, sparids,
gastropods
GNS,
GTR,
FPO
n/a n/a 5000 5000 143 704
140 n/a 180 days 4.5 2 kg/hr 10.8 0.42
IT Beam trawlers
12424m 12424 1000
Rapido
trawl Sole, murex, flatfish RT
4x4
m 4x0.8m2 n/a n/a n/a 52 547 150 days 33 10 kg/hr 190 0.17
IT Bottom trawlers
24440m 24440 1000
Bottom
trawl
Hake, nephrops,
flatfish, shrimp,
cuttlefish, mantis
shrimps, sole
OTB n/a 45450m2 50460 60470 6 40 344 150 days 31.5 9 kg/hr 140 0.23
IT Pelagic trawlers
24440m 24440 1100
Pelagic
trawl Anchovy, sardine, mugil OTM n/a 264 m2 30 30 25 20 3.544.5 150 days 375
150
kg/hr 165 2.27

Report Number C002/08 31 of 425
4 Economic evaluation
4.1 Methodology For the economic evaluation, the role of fuel use and costs is presented for the participating Member States for a number of relevant fleet segments, using active as well as passive gears. Each country chapter is composed of six analytical sections:
1. Role of energy for individual fleet segments 2. Break4even analysis 3. Factors determining energy efficiency 4. Economic potential for technological improvement 5. Scenarios for future fuel prices 6. Economic consequences of technical adaptations
4.1.1 Role of energy for individual fleet segments
This section presents an overview of the average situation in the years 200442006. A three4year average was selected to present a more ‘structural’ picture and to avoid coincidental fluctuations of one single year. Furthermore, consistent economic data are available. Data on 2007 will only be available by the end of 2008 or the beginning of 2009. Tables are presented that show technical parameters for the whole fleet segment as well as averages per vessel. Graphics show the development of each segment over the past 10 years (depending on availability). Finally, a figure is included showing the development of the fuel price between 2000 and mid 2008.
4.1.2 Break4even analysis
A break4even analysis shows situations where revenues are equal to costs, or in other words net profit is equal to zero. Such situation may be achieved by changing one of the main indicators, in our case the price of fuel, the costs of fuel and the catch per unit of effort (CPUE), which is a measure of productivity. A simple model was constructed for this purpose, which also accounts for the changes in crew remuneration. If a segment realized on average profit, the break4even fuel price will be higher than the actual fuel price of 200442006. On the other hand, if the segment was making a loss, the fuel price would have to fall to a lower level in order to eliminate that loss. Most importantly, the calculated break4even price can be compared to the present fuel price (2008) to assess whether the segment can be expected to make a profit or a loss, assuming that all other things remain equal (ceteris paribus assumption). Changes in fuel price will often lead to a different remuneration of the crew, as that is related to fuel costs in some countries. The break4even fuel costs generate in principle the same results as the break4even fuel price. Evidently a change in fuel costs can be also achieved or caused by a change in fuel use, i.e. in energy efficiency or level of effort. Finally, break4even performance can be achieved by a change in productivity, i.e. catch per unit of effort (either in physical or in financial terms). This does not affect the fuel consumption nor fuel costs. This calculation is relevant mainly for the later stages of the analysis when the feasibility and constraints of technical adaptations is analysed. E.g. adaptations of gear to reduce fuel consumption may also affect the productivity (CPUE). Comparing the present productivity with the break4even productivity shows the margin available, or the constraints imposed. This is again particularly relevant for segments which already faced a loss in the base line period 200442006.

Report Number C002/08 32 of 425
4.1.3 Factors determining energy efficiency
Fuel efficiency can be defined as: Litres fuel / kg of fish and/or Fuel costs as % of value of landings. Although the value of landings depends on the market value of the targeted species, which is not affected by energy efficiency, it is the level of energy costs in relation to the revenues which lead to technical adaptations. Determining factors can be: type of gear, vessel size (GT), engine size (kW) and possibly vessel age, and engine age, assuming that age and efficiency are related. The section does not only present average values of energy efficiency for each segment but also scatter diagrams to show the dispersion of individual vessels around that average. The scatter diagrams show that the fuel efficiency differs also strongly between individual vessels within the same segment.
4.1.4 Economic potential for technological improvement
The section on economic potential for technical change presents preliminary calculations on maximum possible investments in hull or engine and on trade off between fuel savings and productivity. Introducing technical4operational adaptations to reduce fuel consumption should lead to lower annual costs. However, part of these savings may be off4set by a decrease in productivity. The maximum allowable decrease of CPUE is shown in the column ‘Trade4off with CPUE’. However, if such decrease of CPUE would occur, there would be no funds available to finance the required investments. Assuming that the productivity would remain at the original level, despite the implemented technical4operational adaptations, the potential savings on fuel costs could be used for investments in the required equipment. The level of such investments depends on the savings, the interest rate and the duration of the depreciation of the capital goods. The calculation presents two examples – maximum investment in hull (which would be depreciated over 40 years) and maximum investment in engine (depreciation period 10 years). The calculated amounts can be interpreted as a value of which would be repaid over the given period from the savings on fuel costs. These amounts can be compared to the investments required in reality, as indicated in other sections of the report.
4.1.5 Scenarios for future fuel prices
The price of fuel may rise or fall in the future, which is unpredictable, although the general expectation is that fuel oil will become more expensive. This section presents a scenario analysis of the consequences of changes of the fuel prices of +50%, +75% and +100% (in comparison to the 200446 fuel price) on main economic indicators: gross value added, crew share (remuneration of labour) and net profit (remuneration of capital). The scenarios show how economically viable the segments will be should such changes occur and should the assumed fuel price remain structurally at that level. These scenarios show also to which extent the segment will be resilient to fuel price changes after the implementation of some proposed technical4operational adaptations.
4.1.6 Economic consequences of technical4operational adaptations
This section presents an economic analysis of the technical4operational adaptations proposed for each segment. Each adaptation leads to fuel savings estimated with the Integrated Energy Systems (In Dutch: “Geïntegreerde Energie Systemen, abbreviated: GES) model. These fuel savings are then interpreted within the overall economic performance of the segment. It must be stressed that the results need to be interpreted with care, in view of the large scatter in fuel efficiency among various vessels within one segment. At the end of each section by member state a table is given explaining technical4operational adaptations in which the results of the economic analysis is summarised. Categories are explained below.

Report Number C002/08 33 of 425
• Technical information – gives the information which follows from the technical analysis regarding fuel savings, estimated investment and possible impact on CPUE.
• Calculated consequences – reflect the results of the economic model, taking the expected fuel savings into
account. o BE (maximum) investment is the amount which could be spent on the technical adaptations and
which would completely off4set the fuel savings. The capital costs (depreciation) would increase approximately by the amount of lower fuel costs (in some cases also adapted for change in crew remuneration). The performance of the segment would not improve. Evidently there would be a lower level of CO2 emissions.
o The break4even fuel price (BE PFU) can be compared to the fuel price of 2008 (first 648 months). The BE PFU depends on the level of required investments. Therefore two calculations are presented: BE PFU at estimated investment (if available) and BE PFU at 50% of the maximum investment. If any of these BE PFUs is higher than the actual fuel price in 2008, it means that the expected level of required investments is too high and the proposed adaptation is consequently economically unfeasible.
o Parallel to the BE PFU, also the BE CPUE (catch per unit of effort) is calculated. Technical adaptations may lead to a lower productivity. Lower revenues may then partly off4set the gains in fuel savings. The new CPUE must not fall below the critical level of BE CPUE, calculated again for two investment levels – estimated investment (if available) and investment of 50% of the maximum level.
• Economic indicators per vessel (and for the segment total) – summarize the new situation after full imple4
mentation of the proposed technical4operational adaptations. The capital costs have been adapted to the estimated investments (given under technical information) and only if these investments are not known the 50% BE4investment has been used.
4.2 Role of fuel costs4 EU4wide overview The economic analysis presented in the country chapters is based on the STECF4SGECA report 08402 (Anon., 2008). This report presents data on economic performance of a major part of the EU fishing fleets until 2006. On the basis of these data an overview of the role of the fuel costs in EU fisheries is provided below. The data on 2005 are relatively more complete than on 2006 and therefore used for the following overview.
4.2.1 Coverage
The fleet segments for which data in 2005 is sufficiently complete in the SGECA report represent approximately 75480% of the EU fishing fleets.
Table 441: Coverage
Indicator Fleet included in SGECA, 2005 Fleet register, jan 2006 Number of vessels 52,557 89,666 Total kW (1000) 5,477 7,287 Total GT (1000) 1,604 2,034 Source fleet register: EC, SFP in figures, 2006 edition
This fleet realized a production value of almost € 7.3 bln, the total fuel costs amounting to about €1.3 bln. For the first 648 months of 2008, the fuel price was approximately 40% higher than in 2005, which implies a net increase of fuel costs of about € 510 mln, assuming that the total effort remained approximately constant. Impact of the fuel price rise can be seen particularly when distinguishing the size of fleets according to the share of fuel costs as percentage of revenues

Report Number C002/08 34 of 425
Table 442: Fuel costs as percentage of revenues in 2005 and 2008
Item Situation 2005 Fuel price up by 40% (2008)
>30% 10�30% <10% >30% 10�30% <10%
Revenues (mln €) 449 5,014 1,800 2,068 4,577 620
Number of vessels 1,984 23,788 25,785 8,039 37,737 6,782
Total GT (1000) 161 1,242 201 576 968 60
Total kW (1000) 597 3,654 1,216 1,846 3,135 486
Total employment 5,792 83,864 50,032 31,176 96,901 11,611 Source: 2005 data: SGECA 08402, 2008 data – own estimation. Fleet and employment are assumed constant
Table 442 shows that by 2008 four times as many vessels could probably be categorised in the situation where fuel costs represents more than 30% of their revenues. On the other hand the number of vessels for which fuel costs remained below 10% of their revenues dropped from almost 26,000 to less than 7,000. These figures illustrate the extent of the effects of the rise in fuel price and the urgency to find technical adaptations to reduce fuel costs structurally as soon as possible.
4.3 Denmark
4.3.1 Role of energy for individual fleet segments
The Danish fleet segments chosen for investigation are among the segments with the highest fuel consumption in proportion to the landing value. Among those, the demersal trawlers 12424m are, in general, the largest fleet segment in the Danish fleet. The three selected segments covers a little less than 50% in term of number of vessels, but less than 25% in terms of catch value and engine power of the national Danish figures, see Table 443 for the whole fleet segment and Table 444 for the average vessel of each fleet segment. The calculations are based on samples of vessels in each segment. The figures for the individual vessels are aggregated to segment level by use of a weighting procedure taking into account to which extent the vessels are representative in the segment. The weights are fixed by the statistical division of the Danish Institute of Food and Resource Economics (FOI). The fleet segments are defined according to the DCR regulations (Commission Regulation (EC) no 1639/2001 Appendix IV, OJ L 222 17.8.2001). The gillnetters 0412m are straightforward, while the demersal trawlers 12424m and the demersal trawlers 24440m are defined as vessels using trawl gear with a landing value of herring, mackerel and industrial species not exceeding 20% of the total landing value. This is done to ensure that the segments are representative to the gear and vessel adaptations investigated by reference vessels. In this project, technical reference vessel studies are not undertaken by Denmark and results from the UK reference vessel are therefore used. The segmentation ensures that Danish demersal trawlers are comparable with the English demersal trawlers in terms of size, engine power, gross tonnage and main target species. The average number of vessels above 12m in the Danish fleet 200442006 was 1167, but this number has declined to around 800 in 2008 which is a decline at around 30%. The relative decline in number of vessels in the selected fleet segments is approximately the same as the decline of the total Danish fleet.
Table 443: Summary of technical parameters, average 200442006 (segment totals)
Fleet segment
Number of
vessels
Total engine
power
(1000 kW)
Total crew Total effort
(1000 kW4days)
Fuel use
(1000 litre)
Gillnetter 0412m 249 17 213 1,976 2,595 Demersal trawler 12424m 218 51 389 9,211 24,915 Demersal trawler 24440m 35 19 155 4,683 17,487

Report Number C002/08 35 of 425
Table 444: Summary of technical parameters, average 200442006 (average per vessel)
Fleet segment
Engine power
(kW)
Crew Effort
(1000 kW4days)
Fuel use
(1000 litre)
Gillnetter 0412m 70 1 8 10 Demersal trawler 12424m 235 2 42 114 Demersal trawler 24440m 559 5 138 516 The gillnetters below 12m using static gear are operated by one person who is also the owner. The trips are short, but because of frequent steaming to and from the fishing grounds relative to the “fishing time” of the vessels the fuel use is relatively high and constitutes around 6% of the landing value. For the small trawlers in the segment 12424m the fuel use constitutes 16% of the landing value, while it is even higher with 23% for the segment 24440m, see Table 445 for the whole segment and Table 446 for the average vessels in each of the segments. All the selected segments are running with negative net profit (gross revenue minus all costs including depreciation and interest payments). It should be noted that the figures are extracted from the vessel accounts which implies that the figures are affected by the fishermen’s recorded figures for depreciation and interest payments. These differ from the socio4economic figures based on opportunity costs that are lower. For the gillnetters the negative profit constitutes around 27% of the gross revenue, while the figures for the trawlers are 12% and 15% respectively. These figures show a structural problem that is not attributable to fuel costs alone. It should be noted that the crew share for gillnetters are computed using opportunity wages (skilled worker). As the owner is also the crew the net profit and the crew share are both allotted to the same person implying that the economic performance for these vessels should be interpreted carefully. For the trawlers the crew share is the actual payment (including social costs) to the crew apart from the skipper owner, who is remunerated by use of opportunity wages.
Table 445: Summary of the economic parameters, average 200442006 (segment totals, 1000 €)
Fleet segment Value of landings Fuel costs Crew share1 Gross value
added
Net profit
Gillnetter 0412m 18,517 1,155 12,151 10,403 45,054 Demersal Trawler 12424m 59,602 9,701 27,485 31,673 46,496 Demersal trawler 24440m 30,398 6,614 10,859 15,007 42,398
1. Including skipper/owner
Table 446: Summary of the economic parameters, average 200442006 (average per vessel, 1000 €)
Fleet segment Value of landings Fuel costs Crew share1 Gross value
added
Net profit
Gillnetter 0412m 75 5 49 42 420
Demersal trawler 12424m 277 45 127 147 429
Demersal trawler 24440m 909 198 321 453 460 1. Including skipper/owner The development over time in catch value, fuel costs and fuel use is pictured in Figure 441. For gillnets, the use of fuel has decreased from 3.5 million litres to 2.0 million litres (43%) mainly because of a reduction in the number of vessels in the period from 296 vessels in 2000 to 240 vessel in 2006 (19%). The increase in fuel price and the decrease of vessel even out the differences in fuel costs. The tendency for demersal trawl 12424m is the same as for the gillnetters. The fuel consumption decreased by 40% as a consequence of reduced number of vessels at 40%, the fuel costs decreased with 48% and the catch value with 53%. On segment level the fuel consumption for demersal trawlers 24440m fluctuates considerably from year to year. The problem is that the segment is not well defined, since the type of gear together with the length is used to define the segment. While it is difficult to change the length of a vessel, it is easy to change the type of gear and

Report Number C002/08 36 of 425
therefore the size of the segment changes frequently. From 2000 to 2001, an increase in the number of vessels of the segment took place. If, therefore, 2001 is used as basis for assessment of the development a decrease in catch value use of fuel and fuel costs has taken place also for this segment but not as much as for the other segments.
Figure 441: Trends in value of landings and fuel use, (segment totals)
The fuel costs constitute a considerable percentage of the total variable costs for trawlers and the change in fuel therefore off4set the economic performance of the fleet. In 2008, heavy fuel oil was 35% cheaper than diesel oil. Most vessels use diesel oil, but some vessels with older engines use heavy fuel oil. The development in fuel price presented in Figure 442 is based on diesel oil and the level is therefore an overestimate of the fuel price for an average vessel. The fuel prices have increased 58% from the baseline 2004406 to 2008, while there has been a 100% increase from 2000 to 2008.
Figure 442: Development of fuel price in €/l, 200042008 (first 648 months)
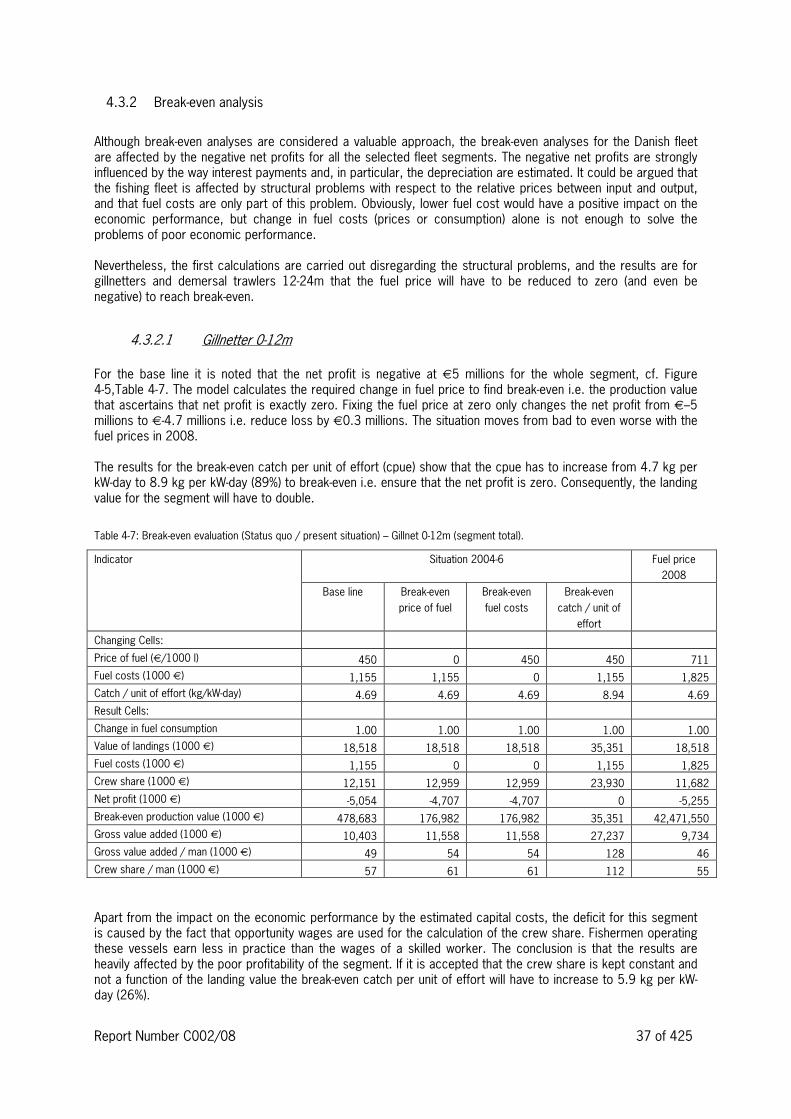
Report Number C002/08 37 of 425
4.3.2 Break4even analysis
Although break4even analyses are considered a valuable approach, the break4even analyses for the Danish fleet are affected by the negative net profits for all the selected fleet segments. The negative net profits are strongly influenced by the way interest payments and, in particular, the depreciation are estimated. It could be argued that the fishing fleet is affected by structural problems with respect to the relative prices between input and output, and that fuel costs are only part of this problem. Obviously, lower fuel cost would have a positive impact on the economic performance, but change in fuel costs (prices or consumption) alone is not enough to solve the problems of poor economic performance. Nevertheless, the first calculations are carried out disregarding the structural problems, and the results are for gillnetters and demersal trawlers 12424m that the fuel price will have to be reduced to zero (and even be negative) to reach break4even.
4.3.2.1 Gillnetter 0412m For the base line it is noted that the net profit is negative at €5 millions for the whole segment, cf. Figure 445,Table 447. The model calculates the required change in fuel price to find break4even i.e. the production value that ascertains that net profit is exactly zero. Fixing the fuel price at zero only changes the net profit from €–5 millions to €44.7 millions i.e. reduce loss by €0.3 millions. The situation moves from bad to even worse with the fuel prices in 2008. The results for the break4even catch per unit of effort (cpue) show that the cpue has to increase from 4.7 kg per kW4day to 8.9 kg per kW4day (89%) to break4even i.e. ensure that the net profit is zero. Consequently, the landing value for the segment will have to double.
Table 447: Break4even evaluation (Status quo / present situation) – Gillnet 0412m (segment total).
Indicator Situation 200446 Fuel price
2008
Base line Break4even
price of fuel
Break4even
fuel costs
Break4even
catch / unit of
effort
Changing Cells:
Price of fuel (€/1000 l) 450 0 450 450 711 Fuel costs (1000 €) 1,155 1,155 0 1,155 1,825 Catch / unit of effort (kg/kW4day) 4.69 4.69 4.69 8.94 4.69 Result Cells: Change in fuel consumption 1.00 1.00 1.00 1.00 1.00 Value of landings (1000 €) 18,518 18,518 18,518 35,351 18,518 Fuel costs (1000 €) 1,155 0 0 1,155 1,825 Crew share (1000 €) 12,151 12,959 12,959 23,930 11,682 Net profit (1000 €) 45,054 44,707 44,707 0 45,255 Break4even production value (1000 €) 478,683 176,982 176,982 35,351 42,471,550 Gross value added (1000 €) 10,403 11,558 11,558 27,237 9,734 Gross value added / man (1000 €) 49 54 54 128 46 Crew share / man (1000 €) 57 61 61 112 55 Apart from the impact on the economic performance by the estimated capital costs, the deficit for this segment is caused by the fact that opportunity wages are used for the calculation of the crew share. Fishermen operating these vessels earn less in practice than the wages of a skilled worker. The conclusion is that the results are heavily affected by the poor profitability of the segment. If it is accepted that the crew share is kept constant and not a function of the landing value the break4even catch per unit of effort will have to increase to 5.9 kg per kW4day (26%).
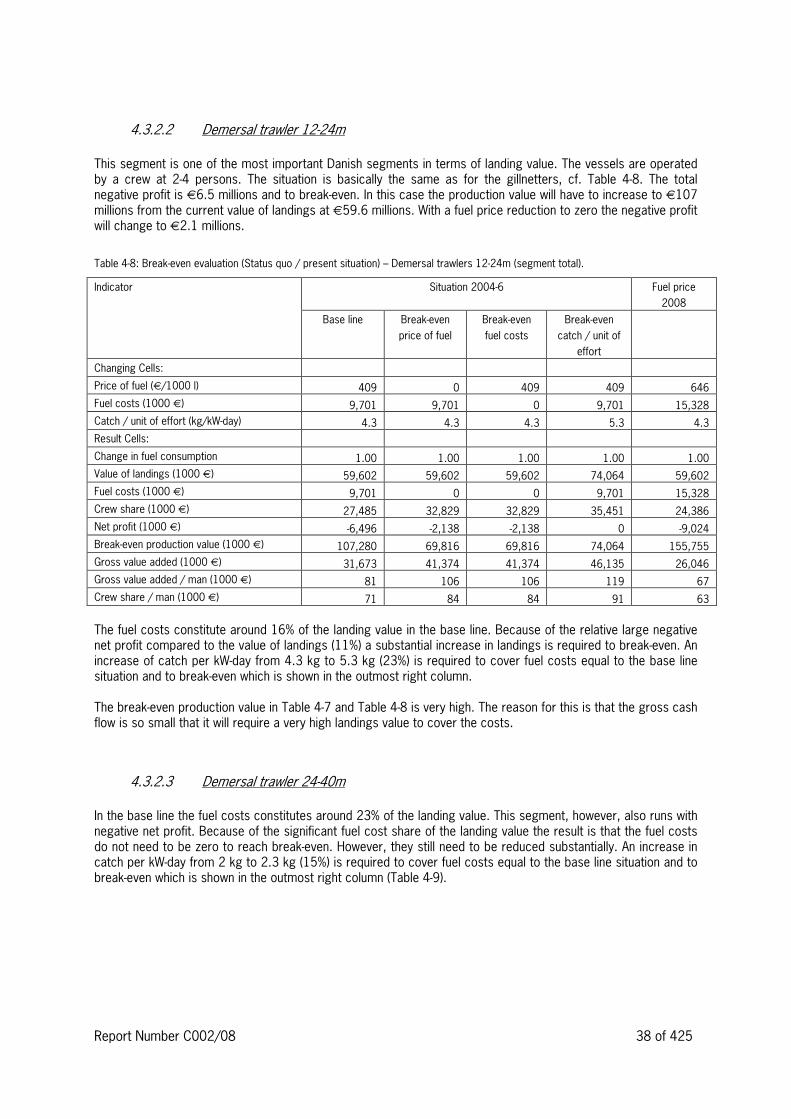
Report Number C002/08 38 of 425
4.3.2.2 Demersal trawler 12424m This segment is one of the most important Danish segments in terms of landing value. The vessels are operated by a crew at 244 persons. The situation is basically the same as for the gillnetters, cf. Table 448. The total negative profit is €6.5 millions and to break4even. In this case the production value will have to increase to €107 millions from the current value of landings at €59.6 millions. With a fuel price reduction to zero the negative profit will change to €2.1 millions.
Table 448: Break4even evaluation (Status quo / present situation) – Demersal trawlers 12424m (segment total).
Indicator Situation 200446 Fuel price
2008
Base line Break4even
price of fuel
Break4even
fuel costs
Break4even
catch / unit of
effort
Changing Cells:
Price of fuel (€/1000 l) 409 0 409 409 646 Fuel costs (1000 €) 9,701 9,701 0 9,701 15,328 Catch / unit of effort (kg/kW4day) 4.3 4.3 4.3 5.3 4.3 Result Cells: Change in fuel consumption 1.00 1.00 1.00 1.00 1.00 Value of landings (1000 €) 59,602 59,602 59,602 74,064 59,602 Fuel costs (1000 €) 9,701 0 0 9,701 15,328 Crew share (1000 €) 27,485 32,829 32,829 35,451 24,386 Net profit (1000 €) 46,496 42,138 42,138 0 49,024 Break4even production value (1000 €) 107,280 69,816 69,816 74,064 155,755 Gross value added (1000 €) 31,673 41,374 41,374 46,135 26,046 Gross value added / man (1000 €) 81 106 106 119 67 Crew share / man (1000 €) 71 84 84 91 63 The fuel costs constitute around 16% of the landing value in the base line. Because of the relative large negative net profit compared to the value of landings (11%) a substantial increase in landings is required to break4even. An increase of catch per kW4day from 4.3 kg to 5.3 kg (23%) is required to cover fuel costs equal to the base line situation and to break4even which is shown in the outmost right column. The break4even production value in Table 447 and Table 448 is very high. The reason for this is that the gross cash flow is so small that it will require a very high landings value to cover the costs.
4.3.2.3 Demersal trawler 24440m In the base line the fuel costs constitutes around 23% of the landing value. This segment, however, also runs with negative net profit. Because of the significant fuel cost share of the landing value the result is that the fuel costs do not need to be zero to reach break4even. However, they still need to be reduced substantially. An increase in catch per kW4day from 2 kg to 2.3 kg (15%) is required to cover fuel costs equal to the base line situation and to break4even which is shown in the outmost right column (Table 449).

Report Number C002/08 39 of 425
Table 449: Break4even evaluation (Status quo / present situation) – Demersal trawlers 24440m (segment total).
Indicator Situation 200446 Fuel price
2008
Base line Break4even
price of fuel
Break4even
fuel costs
Break4even
catch / unit of
effort
Changing Cells:
Price of fuel (€/1000 l) 388 129 388 388 613 Fuel costs (1000 €) 6,614 6,614 2,202 6,614 10,451 Catch / unit of effort (kg/kW4day) 2.0 2.0 2.0 2.3 2.0 Result Cells: Change in fuel consumption 1.00 1.00 1.00 1.00 1.00 Value of landings (1000 €) 30,398 30,398 30,398 34,810 30,398 Fuel costs (1000 €) 6,614 2,202 2,202 6,614 10,451 Crew share (1000 €) 10,859 12,873 12,873 12,873 9,107 Net profit (1000 €) 42,398 0 0 0 44,483 Break4even production value (1000 €) 43,220 30,398 30,398 34,810 68,254 Gross value added (1000 €) 15,007 19,420 19,420 19,420 11,171 Gross value added / man (1000 €) 97 125 125 125 72 Crew share / man (1000 €) 70 83 83 83 59
4.3.3 Factors determining energy efficiency
The average vessels age is rather high for all fleet segments and range from 30437 years of age, see Table 4410. The age of the engine is not known but often 10 years is mentioned as the lifetime for an engine. Therefore most engines are expected to be produced later than the mid 90’s. It is noticed and expected that the fuel cost share of the landings value is lower for gillnetters than for trawlers. Furthermore the fuel efficiency, measured as fuel use per catch volume, for gillnetters are 445 times higher than for the large demersal trawlers. However, because of the current structural problems of the Danish fleet with too many segments running with deficit, any reduction in fuel costs may alleviate these problems but not solve them. The alleviation of the economic deficit with respect to fuel cost reduction will have the larger effect of the demersal trawlers 24440m.
Table 4410: Fuel efficiency
Fleet segment Litres/kg Fuel costs
as % of
value
Gear Vessel
size (GT)
Engine
size
(kW)
Average
vessel
age
Average
engine
age
Gillnetter 0412m 0.35 6% Set gillnet 7 70 31 n.a. Demersal trawler 12424m
1.13 16% Bottom otter
trawl 43 235 37 n.a. Demersal trawler 24440m
1.56 23% Bottom otter
trawl 178 559 30 n.a. To show the variation in fuel consumption four scatter plots have been produced for a sample of vessels in each of the three fleet segments, as shown in Figure 443 4 Figure 445. For each vessel the fuel use of the vessels has been plotted against landings in weight and value and effort in terms of kW4days. The last diagram shows the energy efficiency in terms of fuel use per catch volume against engine size. The sample is from year 2005. Not surprisingly, the use of fuel increases with the size of the landings. But it is noticeable that the variance is rather high for gillnetters, while it is smaller for trawlers. Comparing vessels, by inspection of the scatter diagrams, with the same landings volume or value, the use of fuel can differ with a factor of 3 for gillnetters while

Report Number C002/08 40 of 425
it is around 2 for trawlers. This picture may be influenced by the uncertainty with respect to catches not least for gillnetters, but a look at the fuel use as a function of effort shows the same picture. Another interesting observation is that the use of fuel in proportion to landing value for demersal trawlers has a tendency to increase with increasing engine size, indicating that smaller demersal trawlers have a comparative advantage to larger vessels in terms of energy efficiency. Without entering into too detailed conclusions, there seem to be room for improvement in the use of fuel. However, detailed vessel characteristics, in particular about the engines and the propulsion systems, are required to provide more specific guidance as to how improvement can be accomplished.
Figure 443: Gillnetters <12m 4 Energy efficiency of individual vessels in 2005

Report Number C002/08 41 of 425
F
Figure 444: Trawlers 12424m 4 Energy efficiency of individual vessels in 2005
Figure 445: Trawlers 24440m 4 Energy efficiency of individual vessels in 2005

Report Number C002/08 42 of 425
4.3.4 Economic potential for technological improvement
Adaption leading to reduction in the use of energy will compensate the fishermen for some of the costs due to higher fuel prices. Adaptations in most circumstances have a cost and if the costs exceed the gain in form of energy reductions, the project shall not be carried out. On the other hand, if the expected long term gains from the energy reduction exceed the investment costs, the modification should be carried out. Table 4411 shows the scenario, where investments reduce the fuel consumption by 20% and the table show how big the investments maximum should be in order to have zero profit. Since the Danish gillnetters and demersal trawlers are operating under deficits, even an investment cost of zero will not allow the fishermen to have zero profit, but only reduce the deficit. Therefore the maximum investment costs, which is allowed in order to make the fishermen better off than before the investment is estimated by comparing net profits before and after the investment. Annual investment costs are depending on the lifetime of the investment. A new engine is for example assumed to have a life time of 10 years, while investments in hull is expected to have a life time of 40 years. This will affect the depreciation period and thereby the annual costs of investment. This section deals with the results of the model when the fuel price is reduced from present situation (2004406 or 2008) with for example a 20% improvement in fuel efficiency. The model calculates the maximum investments that could be carried out and be achieved with technological adjustments subject to the restriction that the economic performance must not be worse compared to the initial situation, cf. Table 4411. Further the model calculates the possible reduction in catch per unit effort by the reduction in fuel saving to “break4even” with the initial economic situation. Finally it is investigated what the break4even fuel price and costs are. In the Danish case this is zero because the initial situation shows high negative profits for the chosen fleet segments. Table 4411 shows the possible annual cost savings i.e. possible savings in capital costs and the investments from the cost savings applied on investments in hull and in engine respectively. The calculations are performed for 2004406 and 2008 price levels. Because of the higher prices in 2008 a 20% reduction naturally leads to the possibility of higher investments.
Table 4411: Potential of 20% fuel savings (average per vessels)
Fleet segment Break4even
fuel price
(€/l)
Break4even
fuel costs
(1000 €)
Trade4off with
CPUE
(TOR)
Change in capital
costs (1000 €)
Maximum
investment in hull
(1000 €)
Maximum
investment in
engine (1000 €)
20044
6 2008
20044
6 2008
20044
6 2008
20044
6 2008
Gillnetter 0412m 0 0 0.99 0.98 0.3 0.7 4 10 2 5
Dem. trawler 124
24m 0 0 0.97 0.95 4 10 60 150 29 73
Dem. trawler 244
40m 161 64 0.96 0.93 21 52 313 782 153 382
4.3.5 Scenarios for future fuel prices
Fuel prices have increased approximately 58% from the average price in the period 200442006 to the first 9 month of 2008. Table 4412 and Table 4413 show three sensitivity analysis of the economic consequences of an 50%, 75% and 100% fuel price increase for the segments compared to the baseline level from 200442006. Fuel price increases from 504100% will lower the gross value added with 6411% for gillnetters, with 15431% for trawlers 12424m and with 22440% for trawlers 24440m. The percentage change in profit in Table 4413 should be interpreted with care, since a small baseline profit can result in very high percentage changes. The Danish gillnetters are expected to have a positive gross value added at 9.5 million € with a 75% increase in fuel price, but after rents, depreciation and salaries, the segment is expected to have a total net profit at €411,5 millions, which is a decrease of 5%.

Report Number C002/08 43 of 425
The Danish demersal trawlers 12424m are expected to have a positive gross value added at €24.4 millions with a 75% increase in fuel price, but after rents, depreciation and salaries, the segment is expected to have a total net profit at €49,8 millions, a decrease of 50% relative to the €46.5 millions in the baseline period. The Danish demersal trawlers 24440m are expected to have a positive gross value added at €8,6 millions with a 75% increase in fuel price, but after rents, depreciation and salaries, the segment is expected to have a total net profit at €45,0 millions, a decrease of 112% relative to the €42.4 millions in the baseline period. The sensitivity analysis shows that the demersal trawlers are affected substantially by the increasing fuel prices and adaptations reducing fuel consumption in fisheries should be focused at the demersal trawler segments and not to the same degree at gillnetters.
Table 4412: Absolute consequences of fuel price change (1000 €, segment total)
Fleet segment Scenario 1: PFU+50% Scenario 2: PFU+75% Scenario 3: PFU+100%
Gross
value
added
Crew
share Net profit
Gross
value
added
Crew
share Net profit
Gross
value
added
Crew
share Net profit
Gillnetter 0412m 9,826 11,747 45,227 9,537 11,545 45,314 9,249 11,343 45,400
Dem. trawler 124
24m 26,822 24,814 48,675 24,397 23,478 49,765 21,972 22,142 410,854
Dem.l trawler 244
40m 11,700 9,349 44,195 10,047 8,594 45,094 8,393 7,839 45,992
Table 4413: Relative consequences of fuel price change (% of the baseline situation)
Fleet segment Scenario 1: PFU+50% Scenario 2: PFU+75% Scenario 3: PFU+100%
Gross
value
added
Crew
share Net profit
Gross
value
added
Crew
share Net profit
Gross
value
added
Crew
share Net profit
Gillnetter 0412m 46% 43% 43% 48% 45% 45% 411% 47% 47%
Dem. trawler 124
24m 415% 410% 434% 423% 415% 450% 431% 419% 467%
Dem.l trawler 244
40m 422% 414% 475% 433% 421% 4112% 444% 428% 4150%
4.3.6 Economic consequences of technical adaptations
The selected reference vessel with respect to technical adaptations is a 21m modern stern trawler from the UK fleet. This vessel is larger than the average vessel in the Danish segment 12424m, but assumed to be comparable to the Danish vessels in the 24440m category. Therefore for the 12424m vessels the estimated investment costs based on the reference vessel are scaled down with 30% and kept for the 24440m vessels. Towing warp Optimising towing warp specification to operational requirements i.e. ensuring warp specification is matched to vessel power, trawl and trawl doors can result in drag reductions and subsequent fuel savings. In this case, the reduction of fuel consumption can be estimated at 5% for an estimated investment at €17,000 for an average Danish demersal trawler 12424m. Trawl doors Replacing the trawl doors allows reduction in the overall drag of the gear by adjusting the size of the gear to the towing capacity of the fishing vessel. The reduction of fuel consumption can be estimated at 10% for an estimated investment at €2,850. Normal replacement costs are assumed to be 70% of this and the extra investment corresponds to approximately €2,000.
Report Number C002/08 44 of 425
Trawl design Modifying the design of a net by using different mesh configurations and construction can reduce the fuel consumption of a fishing vessel by 15%, for an estimated investment at €12.000. The expected extra costs of replacement is estimated to €4000 Other adaptations have also been suggested, for example improving the maintenance of the hull or the propeller, which would save 5%. Since the vessel hull and propeller for most Danish vessels already are maintained each year, this adaption is not included in the calculations. Another adaption, which already is implemented in most of the Danish demersal trawlers, is the propeller nozzle. The different economic results are summarised in Table 4412. The table shows the baseline adjusted to 2008 level for the fuel prices. The estimated savings and corresponding investments for each of the adaptations, and for the total, are included in the upper part of the table and the economic consequences calculated by the model are shown in the lower part for a number of indicators. The estimated fuel cost savings e.g. for all adaptations at 30% lead to an increase in net profit at only 10% (€441,000 to €437,000 per vessel). The explanation is that annual capital costs will increase and that the crew is remunerated after fuel is deducted from the landing value in our calculations. That implies that the crew will gain from the decrease in fuel cost and vice versa. Compared to the baseline the investments would pay off, because increase in annual capital costs (from €49,000 to €54,000 per vessel) is lower than the estimated fuel costs savings. The “allowed” change in catch per unit of effort (CPUE) in order to make the profit zero (BE4CPUE) depends of the changes in capital cost (CAC) and the reduction in fuel consumption (CFC). If the effect of the increase in capital costs is higher than the effect of the reduction in fuel consumption, the CPUE must increase in order to increase the value of landings to an amount that makes the profit zero. The CPUE must in this case be increased, since the Danish demersal trawlers are making negative profits. However, if the decrease in CFC is high enough to offset both the increase in capital costs and the negative profit, then the reduction in CPUE is allowed to decrease in order to break4even. This is the case if new trawl doors or trawl design are adapted to the demersal trawler 12424 m, while implementing towing warp specification will require CPUE to increase in order to break4even. The conclusion is the same for demersal trawlers 24440m. For the demersal trawlers 24440m the economic results of the estimated fuel savings and investments are, generally, the same as for the other trawl segment. The investments pay off as the net profit increases (from €4130,000 per vessel to €485,000 per vessel), see Table 4415. The potential of the fuel savings would increase if the crew remuneration system is changed. With the current system the crew share increases with 16% if a 30% fuel reduction is accomplished.

Report Number C002/08 45 of 425
Table 4414: Technical adaptations of demersal trawlers 12424m, (average per vessels, Economic indicators in 1000€)
Indicator Technical adaptations (See Chapter 7)
Base line
(with 2008 fuel price level) Towing
warp
Trawl
doors
Trawl
design
Total
evaluation
Technical information
Fuel saving in % to annual fuel use 4 5% 10% 15% 30%
Estimated investments (1000 €) 4 17 2 4 23
Estimated impact on CPUE (%) 4 4 4 4 �
Calculated consequences
Maximum (BE) investments (1000 €) 4 7.8 15.5 23.3 46.5
PFU 2008 (€/1000 l) 650 650 650 650 650
BE PFU (at estimated investment) 0 0 0 0 0
BE PFU (at 50% of BE4investment) 4 4 4 4 4
CPUE 200442006 (kg/kW4day) 4.3 4.3 4.3 4.3 4.3
BE CPUE (at estimated investment) 5.7 5.8 5.6 5.6 5.6
BE CPUE (at 50% BE4investment) 4 4 4 4 4
Economic indicators (per vessel)
Value of landings 273 273 273 273 273 Fuel costs 70 67 63 60 49 Other variable costs 36 36 36 36 36 Repair and maintenance 29 29 29 29 29 Fixed costs 18 18 18 18 18 Crew share 112 114 116 118 123 Capital costs 49 52 49 50 54 Net profit 441 443 439 437 437 Gross cash flow 8 9 11 12 17 Gross value added 119 123 126 130 140
Economic indicators (segment total)
Value of landings 59,602 59,602 59,602 59,602 59,602 Fuel costs 15,328 14,561 13,795 13,029 10,729 Other variable costs 7,885 7,885 7,885 7,885 7,885 Repair and maintenance 6,410 6,410 6,410 6,410 6,410 Fixed costs 3,934 3,934 3,934 3,934 3,934 Crew share 24,386 24,808 25,231 25,653 26,919 Capital costs 10,684 11,438 10,772 10,861 11,705 Net profit 49,024 49,434 48,424 48,169 47,979 Gross cash flow 1,660 2,004 2,348 2,693 3,725 Gross value added 26,046 26,813 27,579 28,345 30,645

Report Number C002/08 46 of 425
Table 4415: Technical adaptations of demersal trawlers 24440m, (average per vessels, Economic indicators in 1000€)
Technical adaptations (See Chapter 7)
Base line
(2008
level) Towing
warp
Trawl
Doors
Trawl
design
Total
evaluation
Technical information
Fuel saving in % to annual fuel use 4 5% 10% 15% 30%
Estimated investments (1000 €) 4 22.5 2.5 5.5 30.5
Estimated impact on CPUE (%) 4 4 4 4 �
Calculated consequences
Maximum investments to make the technical adaption
feasible (1000 €)
4 40.4 80.9 121.3 242.6
PFU 2008 (€/1000 l) 613 613 613 613 613
BE PFU (at estimated investment) (€/1000 l) 129 124 141 149 162
BE PFU (at 50% of BE4investment) (€/1000 l) 4 4 4 4 4
CPUE 200442006 (kg/kW4day) 2.0 2.0 2.0 2.0 2.0
BE CPUE (at estimated investment) 2.6 2.6 2.5 2.5 2.4
BE CPUE (at 50% BE4investment) 4 4 4 4 4
Economic indicators (per vessel)
Value of landings 880 880 880 880 880 Fuel costs 303 287 272 257 212 Other variable costs 108 108 108 108 108 Repair and maintenance (1000 €) 101 101 101 101 101 Fixed costs 44 44 44 44 44 Crew share 264 271 278 284 305 Capital costs 190 193 190 190 194 Net profit 4130 4125 4114 4106 485 Gross cash flow 60 68 76 84 109 Gross value added 323 339 354 369 414
Economic indicators (segment total) Value of landings 30,398 30,398 30,398 30,398 30,398 Fuel costs 10,451 9,928 9,406 8,883 7,316 Other variable costs 3,740 3,740 3,740 3,740 3,740 Repair and maintenance 3,501 3,501 3,501 3,501 3,501 Fixed costs 1,536 1,536 1,536 1,536 1,536 Crew share 9,107 9,346 9,584 9,823 10,538 Capital costs 6,547 6,652 6,558 6,573 6,690 Net profit 44,483 44,304 43,926 43,657 42,922 Gross cash flow 2,064 2,348 2,632 2,916 3,768 Gross value added 11,171 11,694 12,216 12,739 14,306

Report Number C002/08 47 of 425
4.3.6.1 Conclusions Three observations can be made. Firstly, the Danish fleet segments are running with economic deficits for 200442006. Expected gains in fuel efficiency can alleviate some of the deficit but not solve the problems. Secondly, the number of active vessels in the Danish fleet has decreased by around 30% from 200442006 until 2008. Apart from the vessel group above 24m the reduction in the various segments has been of the same size as the reduction in the whole fleet. As the landing value has not decreased with 30% in the same period, there is reason to believe that the economic performance of the fleet has improved despite the increase in fuel prices by 58% in the same period. Further there is reason to believe that the vessels withdrawn from active fishing are the vessels with the worst fuel efficiency. Thirdly, the large trawlers 24440m are hit hardest by the increase in the fuel prices as the fuel costs constitute around 23% of the landing value (200442006). On the other hand, because of the high fuel costs in proportion to the landing value, this segment is also benefitting the most from different adaptations to save energy. It is also the segment that can sustain the highest investments in fuel saving devices. While a 30% reduction in fuel costs with and estimated investment cost at €30,000 per vessel will improve the economic performance of this segment with 35% it will not help the trawler segment 12424m to the same extent as the increase in profit is only 10% at an estimated 30% fuel reduction with an estimated investment of €23,000 per vessel.

Report Number C002/08 48 of 425
4.4 France
4.4.1 Role of energy for individual fleet segments
In the French case, economic and landings data were available exclusively for fishing vessels registered in the Brittany region and informed from data bases managed by the Regional Economic Observatory of Fisheries in Brittany. 1,480 vessels were registered in the fishing fleet in this region (the average between 200342005), representing 40% of the total fleet belonging to the North Sea, the Channel and the Atlantic coast (NSCA coast). Results are given for two segments 4 units less than 12m in length using passive gears (netters, liners, and potters) and demersal trawlers 12424m. Both segments have been considered in order to analyse the role of energy on economic performance indicators. Bookkeeping databases provide landings value, operating and financial costs. During the study period, from 200342005, 540 units under 12m used passive methods and 281 exploited fisheries with demersal trawl, 60% with simple trawl and 40% with twin trawl. The share of both segments is 50% of the total fleet in Brittany. Demersal trawlers 12424m registered in Brittany represented 57% of this segment at the national level (NSCA coast) and passive units less than 12m contributed to 43% in the French fleet for this class average from 2003 to 2005 (Table 4416, Table 4417).
Table 4416: Summary of technical parameters, average 200342005 (segment totals)
Fleet segment
Number of
vessels
Total engine
power
(1000 kW)
Total crew Total effort
(1000 kW4days)
Fuel use
(1000 litres)
Passive gears < 12m 540 68 1,009 12,418 12,444 Demersal trawlers 12424m 281 91 1,329 21,428 81,363
Table 4417: Summary of technical parameters, average 200342005 (average per vessel)
Fleet segment
Engine power
(kW)
Crew Effort
(1000 kW4days)
Fuel use
(1000 litres)
Passive gears < 12m 125 1.9 22.9 23 Demersal trawlers 12424m 323 4.7 76.2 283 In the French context, a special regime was implemented in 2004, called “Fund for the prevention of risks to fishing” (European Union, 2006). This regime was conceived to limit the consequences of the energy price on fleets’ profitability1. Here, results are presented without this special regime as subsidies were implemented exclusively for the years 2005 and 2006 (Table 4418 and Table 4419). Passive units under 12m are double in number, of demersal trawlers, as the latter contribute to 67% of total value landings, considering both segments. However, fuel costs are 6.5 times higher for trawlers compared to small vessels. Consequently, gross value added (GVA) is very close, only 1.5 times higher for the bigger boats. The differences in net profit, in favour of passive units, are rooted in institutional problems, specifically for the smaller fishing vessels. Indeed, the share system in the artisanal sector is applied to boats above 12m and, more randomly, for smaller units. Frequently labour costs correspond to social costs in bookkeeping databases when the skipper4owner is the only member of the crew. Consequently, net profit is higher for the smallest units (30.2 k€ per vessel). The difference is more significant for fuel costs, explaining a weaker gap in terms of GVA (three times higher for trawlers).
1 The impact of the special regime to limit the rising trend of fuel cost has been more significant for demersal trawlers. The improvement in economic performance is due to a large extent to subsidies for trawlers, which are much more dependent on fuel (+4% in gross value added and +45% in net profit, considering average results). For instance, GVA has been improved by 500 €/vessel for passive units < 12 meters, and by 8700 €/vessel for demersal trawlers.

Report Number C002/08 49 of 425
Table 4418: Summary of the economic parameters, average 200342005 (segment totals, 1000 €)
Fleet segment Value of
landings
Fuel costs Crew share Gross value
added
Net profit
Passive gear < 12m 67,683 3,854 19,239 45,335 16,311 Demersal trawlers 12424m 140,375 25,223 55,360 68,995 5,393
Table 4419: Summary of the economic parameters, average 200342005 (average per vessel, 1000 €)
Fleet segment Value of
landings
Fuel costs Crew share Gross value
added
Net profit
Passive gear < 12m 125.3 7.1 35.6 84.0 30.2 Demersal trawlers 12424m 499.6 89.8 197.0 245.5 19.2
Figure 446 shows trends of value landings and fuel use. Fuel consumption has been maintained at similar levels between 2000 and 2005 for smaller boats, around 12 million litres. As far as trawlers are concerned, a decreasing trend is noticeable as fuel consumption was approximately 100 million litres in 2000 and 80 million in 2005, corresponding to a sharp increase in fuel price during this period.
Passive gear less < 12 meters - Segment total
0
10
20
30
40
50
60
70
80
2000 2001 2002 2003 2004 2005
mln
Euro
0
4,000
8,000
12,000
16,000
1000
litre
s
Value of landings Fuel costs Fuel use (1000 l)
Demersal trawlers 12-24 m - Segment total
0
50
100
150
200
2000 2001 2002 2003 2004 2005
mln
Euro
0
20,000
40,000
60,000
80,000
100,000
120,000
1000
lirer
s
Value of landings Fuel costs Fuel use (1000 l)
Figure 446: Trends in value of landings and fuel use, (segment totals)
Figure 447 shows the evolution of fuel price paid by fishermen, depicting an increase of 90%, from 0.31 €/litre in 2000 to 0.59 €/litre during the first 9 months in 2008. Usually, fuel costs appear as the most important variable cost for fishing units, specifically for vessels using mobile gear (trawling). Traditionally, fuel expenses are paid commonly by skipper4owner and crew members. Hence, every time this input price soars, labour remuneration drops. For this reason, fishermen’s behaviour can be influenced in a context of strong variations of fuel price. From 1998 to 2005, fuel price increased by 10% a year. On the other hand, its rising trend could have enhanced a contrasted evolution between fishing techniques (passive versus mobile) in 2000 and more particularly in 2005 due to the higher dependence of demersal trawlers on fuel compared to passive boats.

Report Number C002/08 50 of 425
France
0.000
0.100
0.200
0.300
0.400
0.500
0.600
0.700
2000 2001 2002 2003 2004 2005 2006 2007 2008
Figure 447: Development of fuel price in €/l until 2008 (first 9 months), Source: Coopérative Maritime du Pays4Bigouden
4.4.2 Break4even analysis
4.4.2.1 Passive gear < 12m It is not surprising that fishing vessels using exclusively passive gear are less sensitive to fuel cost, compared to trawlers. The break4even price of fuel scenario shows that passive units could be profitable at a fuel price of 2.18 € per litre (Table 4420). It must be emphasised that results from bookkeeping can be considered as biased in measuring short4term performance of fishing boats in certain circumstances. This is the case with smaller boats where non4wage labour is a major input (Boncoeur et al., 2004). It is then recommended that labour and owner revenues be separated, in terms of wages; for instance to consider a full wage for a single fisherman or to reallocate crew payments according to various positions for crew members (as a skipper4owner or a worker). Consequently, net profit can be artificially increased for the smallest passive units, particularly for a single man on board, fishermen not being paid from labour revenue but mainly from net profit (here estimated to 16,311 k€ for total segment). The second simulation is based on a change in fuel use, assuming a constant price for fuel (0.31 €/litre). All things being equal, fuel quantity could increase from 12,432 tonnes to 87,748 tonnes, with a fuel price of 0.31 €/litre. However, it is not relevant to assume an increase in fuel use with no change in landings value for this segment, due to a low dependence on fuel cost compared to trawlers. The third scenario is based on a decrease in catch per unit of effort by 34%, leading to a similar trend in landings value. During the first trimester 2008 year, fuel price (constant €, 2005) has soared by 76% compared to the mean price during the study period 200342005.
Table 4420: Break4even evaluation (Status quo / present situation) – passive gears < 12m (segment total)
Indicator Situation 200345 Fuel price
2008
Base line Break4even
price of fuel
Break4even
fuel costs
Break even
catch / unit of
effort
Changing Cells:
Price of fuel (€/tonne) 310 2,186 310 310 547
Fuel costs (1000 €) 3,854 3,854 27,202 3,854 6,807
Catch / unit of effort (tonne) 0,907 0.907 0.907 0.594 0.907
Result Cells:

Report Number C002/08 51 of 425
Indicator Situation 200345 Fuel price
2008
Base line Break4even
price of fuel
Break4even
fuel costs
Break even
catch / unit of
effort
Change in fuel consumption 1 1 1 1 1
Value of landings 67,683 67,683 67,683 44,334 67,683
Fuel costs 3,853 27,202 27,202 3,853 6,807
Crew share 19,239 12,201 12,201 12,201 18,349
Net profit 16,311 0 0 0 14,248
Break even production value 36,659 67,682 67,682 44,334 38,916
Gross value added 45,335 21,986 21,986 21,986 42,382
Gross value added / man 44,9 21.8 21.8 21.8 42.0
Crew share / man 19,1 12.1 12.1 12.1 18.2
4.4.2.2 Demersal trawlers 12424 meters The first scenario (break4even price of fuel) shows the maximum price potentially supported by demersal trawlers 12424m, of 0.44 €, for which the net profit would be reduced to zero. Fuel costs would rise by 41% (compared to the base line) in the second simulation, inducing a sharp decline in crew share (49%). Finally, GVA is cut by 15%. In the third simulation, a decline of CPUE of 7.4% is observed. Fuel costs are similar to base line but landings value decreases in the same magnitude as fuel costs. In the present circumstances, with a mean price of 0.547 €/litre, demersal trawlers are penalized due to their strong dependence on fuel consumption, resulting in a negative net profit. The break4even price of fuel is higher than fuel price observed during the first trimester 2008 (constant €, 2005).
Table 4421: Break4even evaluation (Status quo / present situation) – demersal trawlers 12424m (segment total, Economic indicators 1000 €)
Indicator Situation 200345 Fuel price
2008
Base line Break4even
price of fuel
Break4even
fuel costs
Break even
catch / unit of
effort
Changing Cells:
Price of fuel (€/tonne) 310 437 310 310 547
Fuel costs (1000 €) 25,222 25,222 35,610 25,222 44,554
Catch / unit of effort (tonne) 1.587 1.587 1.587 1.470 1.587
Result Cells:
Change in fuel consumption 1 1 1 1 1
Value of landings 140,375 140,375 140,375 129,988 140,375
Fuel costs 25,223 35,610 35,610 25,223 44,554
Crew share 55,359 50,366 50,366 50,366 46,066
Net profit 5,393 0 0 0 44,644
Break even production value 114,089 140,376 140,376 129,989 175,122
Gross value added 68,995 58,608 58,608 58,608 49,664
Gross value added / man 51.9 44.1 44.1 44.1 37.4
Crew share / man 41.6 37.9 37.9 37.9 34.7
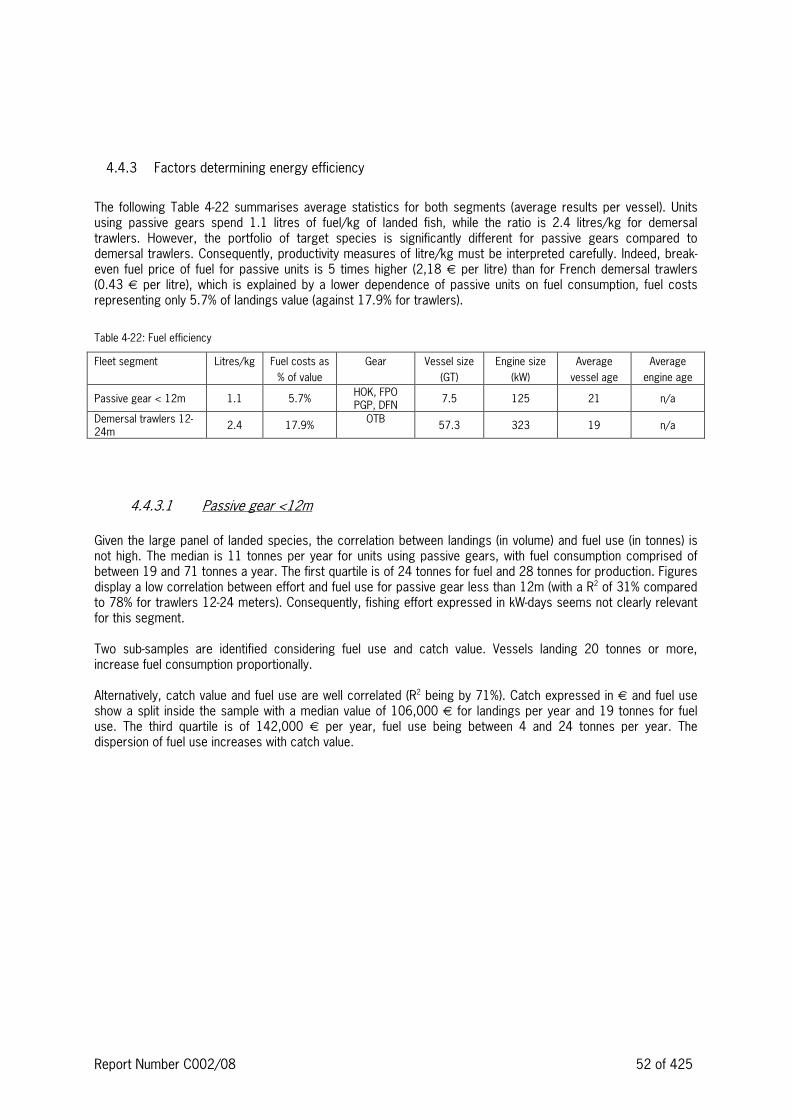
Report Number C002/08 52 of 425
4.4.3 Factors determining energy efficiency
The following Table 4422 summarises average statistics for both segments (average results per vessel). Units using passive gears spend 1.1 litres of fuel/kg of landed fish, while the ratio is 2.4 litres/kg for demersal trawlers. However, the portfolio of target species is significantly different for passive gears compared to demersal trawlers. Consequently, productivity measures of litre/kg must be interpreted carefully. Indeed, break4even fuel price of fuel for passive units is 5 times higher (2,18 € per litre) than for French demersal trawlers (0.43 € per litre), which is explained by a lower dependence of passive units on fuel consumption, fuel costs representing only 5.7% of landings value (against 17.9% for trawlers).
Table 4422: Fuel efficiency
Fleet segment
Litres/kg Fuel costs as
% of value
Gear Vessel size
(GT)
Engine size
(kW)
Average
vessel age
Average
engine age
Passive gear < 12m 1.1 5.7% HOK, FPO PGP, DFN
7.5 125 21 n/a
Demersal trawlers 12424m
2.4 17.9% OTB
57.3 323 19 n/a
4.4.3.1 Passive gear <12m
Given the large panel of landed species, the correlation between landings (in volume) and fuel use (in tonnes) is not high. The median is 11 tonnes per year for units using passive gears, with fuel consumption comprised of between 19 and 71 tonnes a year. The first quartile is of 24 tonnes for fuel and 28 tonnes for production. Figures display a low correlation between effort and fuel use for passive gear less than 12m (with a R2 of 31% compared to 78% for trawlers 12424 meters). Consequently, fishing effort expressed in kW4days seems not clearly relevant for this segment. Two sub4samples are identified considering fuel use and catch value. Vessels landing 20 tonnes or more, increase fuel consumption proportionally. Alternatively, catch value and fuel use are well correlated (R2 being by 71%). Catch expressed in € and fuel use show a split inside the sample with a median value of 106,000 € for landings per year and 19 tonnes for fuel use. The third quartile is of 142,000 € per year, fuel use being between 4 and 24 tonnes per year. The dispersion of fuel use increases with catch value.

Report Number C002/08 53 of 425
Fuel use and catch volume
0
10
20
30
40
50
60
70
80
0 20 40 60 80 100
Volume of catch (tonnes)
Fuel use
(to
nnes
)
Fuel use and catch value
0
10
20
30
40
50
60
70
80
0 100 200 300 400
Value of catch (1000 €)
Fuel use
(to
nnes
)
Fuel use / catch value and engine size
0.00
0.05
0.10
0.15
0.20
0.25
0.30
0.35
0.40
0 50 100 150 200 250
Engine size (kW)
Fuel u
se /
cat
ch v
alue
(tonnes
/10
00€)
Fuel use and fishing effort
0
10
20
30
40
50
60
70
80
0 10 20 30 40 50
Fishing effort (kW-days)
Fuel u
se (to
nnes
)
Figure 448: Passive gear <12m 4 Energy efficiency of individual vessels
4.4.3.2 Demersal trawlers 12424m
Fuel use is highly correlated with catch (in volume and value), and fishing effort, with a R² of 84%, 79% and 77% respectively. Consequently, the efficiency of demersal trawling is largely based on energy needs. Only a few fishing units display better performance, increasing catch value without an increase in fuel use. The median result is 101 tonnes per year, with a fuel consumption of 265 tonnes. The third quartile is 184 tonnes of landings and 441 tonnes of fuel used. Catch expressed in € and fuel use show a split sample with a median value of 473,000 € for landings and 265 tonnes per year for fuel use. The first quartile is of 656,000 € per year and fuel use comprised of between 441 and 589 tonnes per year. Combining effort (defined in term of kW and days at sea) and fuel use, the figure below displays a stronger homogeneity for trawlers with a median effort of 70 kW*Days (1000) compared to vessels using passive gears. The ratio of fuel use/catch value is not correlated with engine power. Productivity measures based on engine size (from kW) are irrelevant for both segments (R² = 37% for trawlers).

Report Number C002/08 54 of 425
Fuel use and catch volume
0
100
200
300
400
500
600
700
0 50 100 150 200 250 300
Volume of catch (tonnes)
Fuel u
se (to
nnes)
Fuel use and catch value
0
100
200
300
400
500
600
700
0 200 400 600 800 1000 1200
Value of catch (1000 €)
Fuel u
se (to
nnes)
Fuel use / catch value and engine size
0.00
0.20
0.40
0.60
0.80
1.00
0 100 200 300 400 500 600 700
Engine size (kW)
Fuel
use
/ catc
h v
alue
(tonnes
/10
00€)
Fuel use and fishing effort
0
100
200
300
400
500
600
700
0 50 100 150 200
Fishing effort (kW-days)
Fuel
use
(to
nnes
)
Figure 449: Demersal trawlers 12424m – Fuel use and catch value of individual vessels
4.4.4 Economic potential for technological improvement
Initially, a change in fuel consumption of 10% was used for passive units and 20% for demersal trawlers. High fuel costs lead to modifications in economic results for different fishing methods. In this way, technical change might be accelerated in favour of demersal trawlers with the objective of reducing fuel consumption, considering a higher potential for technological improvements in the propelling system, hull design and fishing gears. For instance, it is assumed that a change in capital costs due to potential fuel savings will result in a better net profit. In this case, annual depreciation allowances will be augmented due to a reduction in fuel costs. These deprec4iation costs can be preserved for a new vessel (hull), or an engine replacement. The discounted value of depreciation costs is presented according to fuel prices (the mean price in 200342005 and the mean price in 2008). Obviously, the higher the energy price, the larger the potential fuel savings. The maximum investment in hull (new vessel) would be 7,500 € for passive gears and 140,200 € for trawlers, considering the mean fuel price during the period 200342005. If the potential gain is invested in a new engine, the discounted value of fuel savings would grow to 69,000 € for trawlers, and only 3,700 € for passive gears. In the French case, it is interesting to compare these figures with subsidies received by fishermen in 2006. Bottom trawlers belonging to the 20425m segment registered in Brittany received a fuel subsidy of 34,000 € from a special regime (Observa4toire Economique des Pêches, 2007). In this case, there is no serious incentive for fishermen to invest in new technological possibilities with a fuel saving device, nor a change in the catching technique. Hence, the impact of fuel costs has to be questioned taking public choices into account.

Report Number C002/08 55 of 425
Table 4423: Potential of fuel savings (average per vessels)
Fleet segment
Break4even
fuel price
(€/l)
Break4even
fuel costs
(1000 €)
Trade4off with
CPUE
(TOR)
Change in
capital costs
Maximum
investment in
hull
Maximum
investment in
engine
200345 200345 20034
5
2008 20034
5
2008 20034
5
2008 20034
5
2008
Passive gear <12m 1 2.43 50.3 0.99 0.990 0.5 1.7 7.5 13.2 3.7 6.4 Demersal trawlers 12424 m 2
0.55 121 0.96 0.937 9.3 16.4 140.2 248 69 121.1
1 Change in fuel consumption 0.9
2 Change in fuel consumption 0.8
4.4.5 Scenarios for future fuel prices
We test here the consequences with an increase in fuel price of 50%, 75% or 100% on the gross value added, crew share and net profit. The impact of the increasing fuel price is significant for demersal trawlers, GVA decreasing by 27% and 37 % respectively when the fuel price increases by 50% and 100%. No significant change is observed for passive gears, due to their relative non4sensitiveness with regard to fuel use. Net profit is largely affected for trawlers, meaning a less attractive activity for future investments.
Table 4424: Absolute consequences of fuel price change (1000 €, segment total)
Fleet segment Scenario 1: PFU+50% Scenario 2: PFU+75% Scenario 3: PFU+100%
Gross
value
added
Crew
share
Net
profit
Gross
value
added
Crew
share
Net
profit
Gross
value
added
Crew
share
Net
profit
Passive gear <12m 43,402 18,656 14,96 42,444 18,367 14,291 41,473 18,074 13,613 Demersal trawlers 12424m 56,383 49,296 41,155 50,078 46,265 44,429 43772 43,233 47,703
Table 4425: Relative consequences of fuel price change (% of the baseline situation)
Fleet segment Scenario 1: PFU+50% Scenario 2: PFU+75% Scenario 3: PFU+100%
Gross
value
added
Crew
share
Net
profit
Gross
value
added
Crew
share
Net
profit
Gross
value
added
Crew
share
Net
profit
Passive gear <12m 44% 43% 48% 46% 45% 412% 49% 46% 417% Demersal trawlers 12424m 418% 411% 4121% 427% 416% 4182% 437% 422% 4243%
4.4.6 Economic consequences of technical adaptations
The fishing gear of this reference vessel consists of two demersal twin trawls. The design of these trawls is standard. Each is made of two panels (lower and upper) with a minimum of netting sections, simple cutting rates and a minimum of different mesh sizes and twine diameter in order to simplify maintenance. The netting materials used do not take advantage of higher tenacity fibres: standard PE is used. The total netting surface (for 2 trawls) is 153 m². Doors were found to be adapted to the trawls, but more efficient doors could have been used in this initial design. Adaptations made to reduce fuel consumption are described hereafter.

Report Number C002/08 56 of 425
Several modifications have been made: • The netting material: using higher tenacity fibres Breiztop allows a reduction of 25% to 30% of twine
diameter for identical traction resistance. The netting weight also decreases by 25% to 30% and finally the cost can remain almost constant. However, in case of friction on the seabed (belly parts), diminishing the twine diameter can be rejected by the skipper. This modification leads to lower drag and lower fuel consumption. In the upper part, 5 mm PE twine was replaced by 3 mm Breiztop twine in the wings, the square and the top belly.
• The mesh size increase: in certain parts of the trawl (upper sections), in accordance with the skipper, the mesh size can be increased. The consequence is to improve the filtration and decrease the drag. In the upper panel 60 mm wing meshes were replaced by 100 mm meshed. In the square and top belly, 60 mm meshes were replaced by 75 mm meshes.
• If some parts of the netting are found to be ineffective (slack meshes for instance), cutting rates and/or number of meshes are slightly modified in accordance with the skipper.
• 3.13 m² doors were replaced by 2.25 m² doors with the same weight. • Ground gear weight in the water was decreased by about 10%.
During the optimisation process, the fishing gear geometry (door distance, wing distance, vertical opening) was kept constant. Thus we could suppose the fishing potential was also maintained at constant. The fishing efficiency was then tested at sea aboard the trawler and was found satisfactory. Table 4426 presents estimated results due to technical adaptations in gears for trawlers, assuming potential fuel savings of 15%. In this case, fishermen have to invest an amount of 16 k€, expecting a decrease of 15% in fuel costs (from 158 k€ to 135 k€). However, break4even price fuel would be lower than fuel price in 2008. A potential fuel savings of 15% and estimated investment involve a negative net profit of 7 k€, but an increase in crew share.
Table 4426: Technical adaptations of segment Demersal trawlers 12424 meters, (average per vessels, Economic indicators 1000)
Indicator Technical adaptations (See Chapter 6)
Base line
Adapt. 1 Adapt. 2 Adapt. 3 Adapt. 4
Technical information
Fuel saving in % to annual fuel use 15%
Estimated investments (1000 €) 16
Estimated impact on CPUE (%) 0%
Calculated consequences
BE (Maximum) investment (1000 €) 60.7
PFU 2008 (€/l) 547
BE PFU (at estimated investment) 489
BE PFU (at 50% of BE4investment) 466
CPUE 200442006 (kg/kW4day) 1.587
BE CPUE (at estimated investment) 1.632
BE CPUE (at 50% BE4investment) 1.650
Economic indicators (per vessel)
Value of landings 501 501
Fuel costs 158 135
Other variable costs 58 58
Repair and maintenance 52 52
Fixed costs 54 54

Report Number C002/08 57 of 425
Indicator Technical adaptations (See Chapter 6)
Base line
Adapt. 1 Adapt. 2 Adapt. 3 Adapt. 4
Crew share 164 175
Capital costs 29 33
Net profit 416.5 47
Gross cash flow 55 25
Gross value added 177 200
Economic indicators (segment total)
Value of landings 140,375 140,375
Fuel costs 44,554 37,870
Other variable costs 16,363 16,363
Repair and maintenance 14,628 14,628
Fixed costs 15,165 15,165
Crew share 46,066 49,279
Capital costs 8,242 8,242
Net profit 4 4,644 42,088
Gross cash flow 15,599 7,068
Gross value added 49,664 56,347
4.4.7 List of national studies 4 publications related to fuel efficiency in fisheries
Brook, A.4M., Price, R., Sutherland, D., et al. (2004) Oil prices developments: drivers, economic consequences and policy responses, OECD, Economics Department Working papers, No.412, 51p.
Boncoeur J., Daurès F., Guyader O., Martin A., Le Floc’h P., Thébaud O., 2004, Comparing bookkeeping and field survey methods for assessing fishing fleets economic performance. A case study of Brittany fishing fleet (France), IIFET, Japan.
IFREMER (2007) Synthèse des flottilles de pêche 2005 – Flotte de Mer du Nord – Manche – Atlantique, Système d’Informations Halieutiques, 54p.
Le Floc’h, P., Daurès, F., Bihel, J., et al. (2007a) Analyzing fishermen behaviour face to increasing energy costs – A French case study, ICES Annual Science Conference, 17421 September, Helsinki, 15p.
Le Floc’h, P., Daurès, F., Brigaudeau, C., Bihel, J. (2007b),A comparison of economic performance in the fisheries sector: A short4 and long4term perspective”, Marine Policy, In Press, Corrected Proof, Available online 23 October 2007
Travers M. (2006), Impact du prix du gazole sur la consommation de carburant des flottilles chalutières de Bretagne4sud : identification de groupes de réaction, Working Papers Series, D1442006, www.gdr4Amure.fr
European Union. (2006), State aid No C 9/2006 (ex NN 85/2005) – Fund for the prevention of risks to fishing invitation to submit comments pursuant to Article 88(2) of the EC Treaty
Observatoire Economique Régional des Pêches de Bretagne. (2007), Résultat des flottilles artisanales 2005/2006, 53 pages.

Report Number C002/08 58 of 425
4.5 Ireland
4.5.1 Role of energy for individual fleet segments
The segments reported in this chapter represent approximately 85% of the Irish Fishing Fleet. Table 4427 and Table 4428 summarise the main technical parameters for the inshore, demersal trawlers and pelagic trawler segments. Absent are the beam trawlers, dredgers, and static gear vessels greater than 12m as the information for these segments is limited or as is in the case of the beam trawl the number of vessels in the segment is small and decreasing. For the purposes of this report all inshore vessels are grouped together regardless of fishing method. The inshore sector, accounting for approximately 70% of the fleet, and 40% of employment, is a diverse segment, consisting of traditional currachs, open decked punts and larger half4decked boats with an average of 1059 vessels per annum over the period 2004 to 2006 on the fleet register. The majority of vessels in this segment are engaged in potting for lobster and brown crab, interspersed with gillnetting or trawling for high value demersal species. The majority of the smaller punts and currachs are owner operated, with seasonal casual labour. The larger vessels 10412m may have up to 4 crew although usually only when trawling or gillnetting. Fuel consumption is generally low in this segment, particularly where small outboard engines are used, with the segment as a whole consuming approximately 12.1m litres, accounting for 10% of the total fleet consumption. The demersal trawler segments 4 more commonly referred to collectively as the whitefish fleet – are comprised of single and twin4rig demersal trawlers, targeting commercial whitefish species and Nephrops. There has been contraction in these segments due to a whitefish decommissioning scheme introduced in 2005. Further contraction is ongoing in 2008 with the introduction of a new decommissioning scheme, which will remove a further 40450 vessels > 18m from the demersal segments. These two segments form about 20% of the Irish fleet and collectively account for > 50% of total fuel consumption amounting to 55M litres. The two pelagic fleet segments account for less than 2% of the fleet, but over 44% of the tonnage and kW. This segment accounts for 1.6% of the fleet and 7.4% of employment, with average crew sizes of 12 per vessel. Fuel consumption over the period 200442006 was approximately 20M litres, representing 19% of the total fleet consumption.
Table 4427: Summary of technical parameters, average 200442006 (segment totals)
Fleet segment
Number of vessels
Total engine
power
(1000 kW)
Total crew Total effort
(1000 kW4days)
Fuel use
(1000 litre)
All Inshore 1,059 35.2 1,953 4,570 12,109
Demersal trawler 12 4
24 174 47.67 796 7,110 34,972
Demersal trawler 24 –
40 45 28.29 378 5,530 21,008
Pelagic trawler 24 – 40 12 8.7 101 1,080 6,205
Pelagic trawler > 40 17 43.01 218 4,370 14,299

Report Number C002/08 59 of 425
Table 4428: Summary of technical parameters, average 200442006 (average per vessel)
Fleet segment
Engine power
(kW) Crew
Effort
(1000 kW4days)
Fuel use
(1000 litre)
All Inshore 33 2 4 11
Demersal trawler12 424 274 5 41 201
Demersal trawler 24 –
40 624 8 122 467
Pelagic trawler 24 – 40 745 8 92 517
Pelagic trawler > 40 1925 13 262 841
Table 4429 and Table 4430 summarise the economic parameters for the chosen fleet segments. All estimates of fishing costs, value of landings, and profitability are derived from economic surveys carried out under the Data Collection Regulations (EC Regulation 1639/2001). In the main, financial data for vessels over 12 metres have been verified by a certified accountant and are assumed to be accurate. However, due to the voluntary nature of the surveys, the sample sizes for each segment vary from year to year, and are not necessarily representative of their segments. In addition, fuel consumption is not directly recorded, but is an estimate based on the product of the total fuel cost and the average fuel prices for that given year. The sample size in the inshore segment is small compared to the actual number of vessels so the figures should be treated with caution. The total fuel bill for the segment is thought to be an underestimation of the total cost to the inshore segment as figures are based on sales of marine diesel and exclude the large percentage of smaller boats that operate with outboard petrol engines. In addition these vessels do not enjoy the VAT and excise duty exemption available to users of marine diesel and therefore fuel usage is hard to ascertain. Based on the available data the average monthly fuel cost per vessel over the period 200442006 was estimated at €350. On average, fuel accounted for 51% of operational costs for vessels in this segment. The baseline data for the period 2004 42006 shows this sector making a small net profit. The 12424m demersal segment comprises a wide range of vessels targeting a mixture of demersal species and Nephrops and earnings and costs vary widely between vessels. The estimated average monthly fuel bill for the 12424m segment over the period was estimated at ~€6,000 per vessel but for some of the larger vessels in this segment monthly fuel costs can be as high as €12,500415000. Currently this segment is working at a net loss although the anecdotal indications are that many vessels within this segment still operate profitably despite the increase in fuel prices. On average, fuel accounted for 43% of operational costs. Average wages over the period 200442006 are estimated at €28,000. The 24440m demersal trawler segment has also quite a wide range of vessels targeting a wide range of demersal species. Many of the older vessels in this segment have been decommissioned and the age profile is decreasing over time. This segment is currently working at a net profit. On average, fuel accounted for 57% of operational costs of these vessels and the average monthly fuel bill was ~€14,000 per vessel over the period 200442006 but for some of the larger vessels in this segment this could be as high as €30,000436,000 per month. Average wages in 200442006 are estimated at €27,000 similar to the other demersal sector. Both the pelagic fleet segments are characterised by fairly modern vessels, and in the > 40m segment over €250 million of private investment has been made over the last 5 years to modernise this fleet. This has meant that capital costs are high, which may somewhat explain the net loss reported in Table 4418 in a segment associated with high revenues. The other fixed costs for the larger pelagic vessels are currently over 50% higher than for the smaller pelagic 24440m vessels. The 24440m segment is currently making a reasonable net profit. Fuel costs accounted for 43% of operational costs in the period 200442006, with average monthly vessel costs of €25,000 per vessel. Average wages in 200442006 are estimated at €80,000, although this has been reducing significantly over the period.

Report Number C002/08 60 of 425
Table 4429: Summary of the economic parameters, average 200442006 (segment totals, 1000 €)
Fleet segment Value of landings Fuel costs Crew share Gross value added Net profit
All Inshore 85,210 9,461 23,859 29,667 2,718
Demersal trawler12 424 67,101 12,666 21,891 25,554 43,347
Demersal trawler 24 –
40 38,257 7,608 12,225 17,182 1,441
Pelagic trawler 24 – 40 29,462 2,247 10,061 18,084 4,780
Pelagic trawler > 40 44,360 5,178 13,301 20,578 4670
Table 4430: Summary of the economic parameters, average 200442006 (average per vessel, 1000 €)
Fleet segment Value of landings Fuel costs Crew share Gross value added Net profit
All Inshore 80.46 8.93 22.52 28.01 2.56
Demersal trawler12 424 386 72.79 125.81 146.86 419.24
Demersal trawler 24 –
40 856 169.07 271.67 381.81 32.03
Pelagic trawler 24 – 40 2,455 187.27 838.44 1,506.99 398.35
Pelagic trawler > 40 2,609 304.61 782.38 1,210.46 439.43
There has been a trend within the fishing industry to become more targeted in their fishing activity in an attempt to offset rising fuel costs. This can be inferred from Figure 4410, where fuel usage exhibits a downward trend for all segments except for the demersal trawler 24440m segment, which has remained relatively stable. However, Figure 4410 does not take into account the important factor of changing fleet structures over the reference period. As mentioned above, the whitefish fleet has contracted due to a decommissioning scheme, which may partly contribute to the apparent decline in both the value of landings and fuel usage. Data quality may also be a factor as value of landings are based on actual fishing income as stated on the economic survey forms, and not official landings for that segment, thus if the sample is not representative of the segments, the trend values may be over or under estimated.
Inshore
0
10
20
30
40
50
60
2004 2005 2006
mln
Euro
0
2,000
4,000
6,000
8,000
10,000
12,000
14,000
16,000
18,000
1000
litres
Value of landings Fuel costs Fuel use (1000 l)
Demersal 24-40m
0
5
10
15
20
25
30
35
40
45
2004 2005 2006
mln
Euro
0
5,000
10,000
15,000
20,000
25,000
30,000
1000
litrer
s
Value of landings Fuel costs Fuel use (1000 l)
Pelagic 24-40m
0
5
10
15
20
25
30
35
2004 2005 2006
mln
Euro
0
1,000
2,000
3,000
4,000
5,000
6,000
7,000
8,000
1000
litres
Value of landings Fuel costs Fuel use (1000 l)

Report Number C002/08 61 of 425
Pelagic >40m
0
10
20
30
40
50
60
2004 2005 2006m
ln E
uro
0
5,000
10,000
15,000
20,000
25,000
1000
litres
Value of landings Fuel costs Fuel use (1000 l)
Figure 4410: Trends in value of landings and fuel use, (segment totals)
Figure 4411 below shows the development of fuel prices in Ireland over the period 2000 until the first six months of 2008. These prices are net of VAT and excise duty. As in all countries fuel prices in Ireland have shown a steady rise since 2003, with the exception of a brief period of recovery in the last 6 months of 2006, when international oil prices fell from approximately $75/barrel to $50/barrel. The current price of €0.594/litre is approximately 61% higher than in the period 200442006.
Figure 4411: Development of fuel price in € until 2008 (first 648 months)
4.5.2 Break4even analysis
4.5.2.1 Segment 1 Inshore < 12 metres The data for this segment are based on a small sample size so the data should be treated with caution. The baseline data shows a net profile for this sector but as these boats are manned by a single skipper/owner and do not work a traditional share system in many cases, the crew costs are difficult to estimate. Therefore the crew share of 40% of revenues is thought to be an over estimate and the sector is actually more profitable than indicated. Fuel costs are approximately 11% of the value of landings for this sector. Table 4431 shows that the sector was operating at a profit based on 200442006 fuel prices. At the current price of €0.594 the segment is now working at a net loss. Whether this is actually the case is debatable as recent indications from a national “sentinel” vessel project collecting economic data on this segment that commenced in 2007, indicates that vessels are still profitable and given there low fuel consumption are reasonably resilient to fuel price increases.
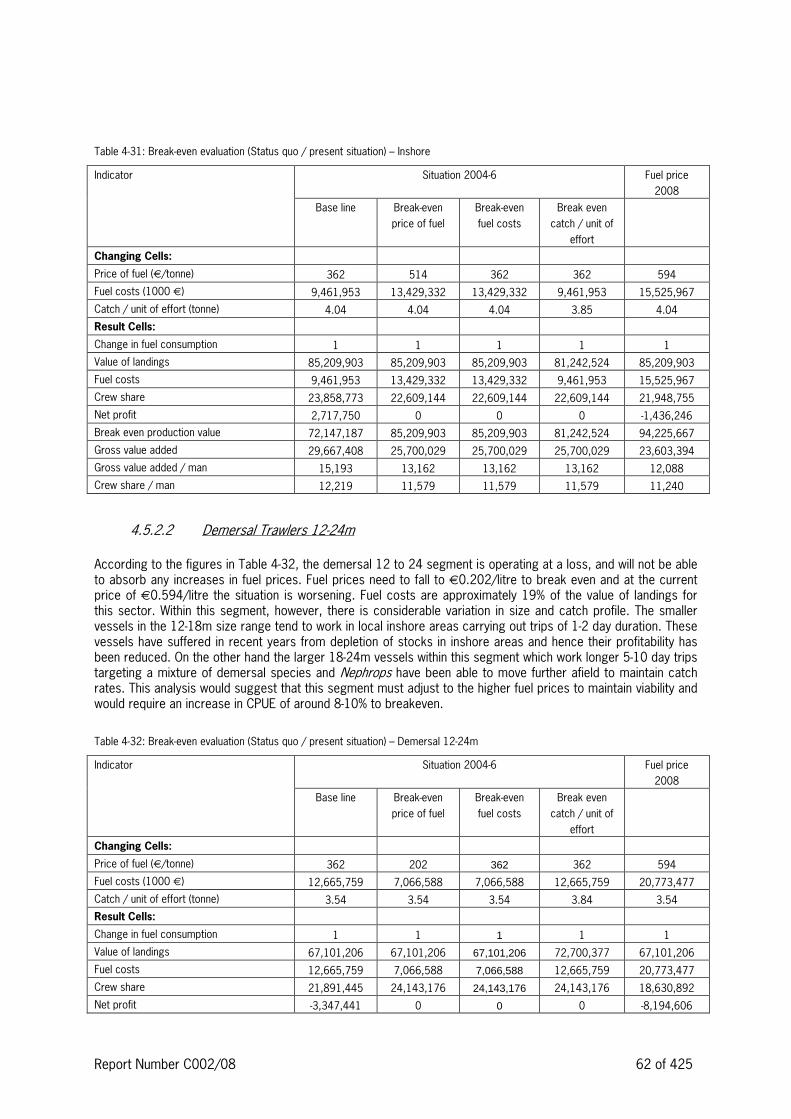
Report Number C002/08 62 of 425
Table 4431: Break4even evaluation (Status quo / present situation) – Inshore
Indicator Situation 200446 Fuel price
2008
Base line Break4even
price of fuel
Break4even
fuel costs
Break even
catch / unit of
effort
Changing Cells:
Price of fuel (€/tonne) 362 514 362 362 594
Fuel costs (1000 €) 9,461,953 13,429,332 13,429,332 9,461,953 15,525,967
Catch / unit of effort (tonne) 4.04 4.04 4.04 3.85 4.04
Result Cells:
Change in fuel consumption 1 1 1 1 1
Value of landings 85,209,903 85,209,903 85,209,903 81,242,524 85,209,903
Fuel costs 9,461,953 13,429,332 13,429,332 9,461,953 15,525,967
Crew share 23,858,773 22,609,144 22,609,144 22,609,144 21,948,755
Net profit 2,717,750 0 0 0 41,436,246
Break even production value 72,147,187 85,209,903 85,209,903 81,242,524 94,225,667
Gross value added 29,667,408 25,700,029 25,700,029 25,700,029 23,603,394
Gross value added / man 15,193 13,162 13,162 13,162 12,088
Crew share / man 12,219 11,579 11,579 11,579 11,240
4.5.2.2 Demersal Trawlers 12424m According to the figures in Table 4432, the demersal 12 to 24 segment is operating at a loss, and will not be able to absorb any increases in fuel prices. Fuel prices need to fall to €0.202/litre to break even and at the current price of €0.594/litre the situation is worsening. Fuel costs are approximately 19% of the value of landings for this sector. Within this segment, however, there is considerable variation in size and catch profile. The smaller vessels in the 12418m size range tend to work in local inshore areas carrying out trips of 142 day duration. These vessels have suffered in recent years from depletion of stocks in inshore areas and hence their profitability has been reduced. On the other hand the larger 18424m vessels within this segment which work longer 5410 day trips targeting a mixture of demersal species and Nephrops have been able to move further afield to maintain catch rates. This analysis would suggest that this segment must adjust to the higher fuel prices to maintain viability and would require an increase in CPUE of around 8410% to breakeven.
Table 4432: Break4even evaluation (Status quo / present situation) – Demersal 12424m
Indicator Situation 200446 Fuel price
2008
Base line Break4even
price of fuel
Break4even
fuel costs
Break even
catch / unit of
effort
Changing Cells:
Price of fuel (€/tonne) 362 202 362 362 594
Fuel costs (1000 €) 12,665,759 7,066,588 7,066,588 12,665,759 20,773,477
Catch / unit of effort (tonne) 3.54 3.54 3.54 3.84 3.54
Result Cells:
Change in fuel consumption 1 1 1 1 1
Value of landings 67,101,206 67,101,206 67,101,206 72,700,377 67,101,206
Fuel costs 12,665,759 7,066,588 7,066,588 12,665,759 20,773,477
Crew share 21,891,445 24,143,176 24,143,176 24,143,176 18,630,892
Net profit 43,347,441 0 0 0 48,194,606

Report Number C002/08 63 of 425
Indicator Situation 200446 Fuel price
2008
Base line Break4even
price of fuel
Break4even
fuel costs
Break even
catch / unit of
effort
Break even production value 83,574,943 67,101,206 67,101,206 72,700,377 129,673,595
Gross value added 25,553,972 31,153,143 31,153,143 31,153,143 17,446,253
Gross value added / man 32,090 39,121 39,121 39,121 21,908
Crew share / man 27,490 30,318 30,318 30,318 23,396
4.5.2.3 Demersal Trawlers 24440m According to the figures in Table 4433 the demersal 24 to 40 segment is able to absorb a moderate increase in fuel prices before becoming unprofitable, with a break even fuel cost of €0.476/litre. With, however, the increase in fuel price in 2008 this segment is now working at a net loss. Fuel costs are approximately 20% of the value of landings for this sector although this varies considerable depending on vessel size and can be as high as 40%. Quota restrictions have also reduced the earnings of these vessels in recent years making increasing higher fuel costs harder to offset and thus seeing a proportional higher reduction in crew wages compared to the inshore and 12424m demersal trawler segment.
Table 4433 : Break4even evaluation (Status quo / present situation) – Demersal 24440m
Indicator Situation 200446 Fuel price
2008
Base line Break4even
price of fuel
Break4even
fuel costs
Break even
catch / unit of
effort
Changing Cells:
Price of fuel (€/tonne) 362 476 362 362 594
Fuel costs (1000 €) 7,608,305 9,992,273 9,992,273 7,608,305 12,478,601
Catch / unit of effort (tonne) 2.19 2.19 2.19 2.05 2.19
Result Cells:
Change in fuel consumption 1 1 1 1 1
Value of landings 38,527,320 38,527,320 38,527,320 36,143,352 38,527,320
Fuel costs 7,608,305 9,992,273 9,992,273 7,608,305 12,478,601
Crew share 12,225,247 11,282,636 11,282,636 11,282,636 10,299,552
Net profit 1,441,357 0 0 0 41,503,245
Break even production value 33,058,611 38,527,320 38,527,320 36,143,352 46,560,241
Gross value added 17,181,617 14,797,650 14,797,650 14,797,650 12,311,321
Gross value added / man 45,414 39,113 39,113 39,113 32,541
Crew share / man 32,313 29,822 29,822 29,822 27,223
4.5.2.4 Pelagic Trawlers 24440m According to the figures in Table 4434 the pelagic 24 to 40 segment is highly profitable even at 2008 prices and will be able to withstand a big increase in fuel prices and a decrease in CPUE of 25% before becoming unprofitable. The break even fuel cost is €1.584/litre well above the current price of €0.594. Fuel costs are relatively low at approximately 8% of the value of landings for this sector currently and even allowing for the increase in fuel costs in 2008 this is still only at 12%. The vessels in this segment have the benefit of having similar quotas to larger pelagic vessels with reduced operating costs but have relatively good quota allocations that have remained stable over the period.

Report Number C002/08 64 of 425
Table 4434 : Break4even evaluation (Status quo / present situation) – Pelagic 24440m
Indicator Situation 200446 Fuel price
2008
Base line Break4even
price of fuel
Break4even
fuel costs
Break even
catch / unit of
effort
Changing Cells:
Price of fuel (€/tonne) 362 1,584 362 362 594
Fuel costs (1000 €) 2,247,288 9,831,297 9,831,297 2,247,288 3,685,842
Catch / unit of effort (tonne) 33.45 33.45 33.45 24.84 33.45
Result Cells:
Change in fuel consumption 1 1 1 1 1
Value of landings 29,462,087 29,462,087 29,462,087 21,878,078 29,462,087
Fuel costs 2,247,288 9,831,297 9,831,297 2,247,288 3,685,842
Crew share 10,061,259 7,257,465 7,257,465 7,257,465 9,529,428
Net profit 4,780,216 0 0 0 3,873,492
Break even production value 16,793,836 29,462,087 29,462,087 21,878,078 18,285,187
Gross value added 18,083,895 10,499,886 10,499,886 10,499,886 16,645,341
Gross value added / man 179,641 104,304 104,304 104,304 165,351
Crew share / man 99,946 72,094 72,094 72,094 94,663
4.5.2.5 Pelagic Trawlers > 40m According to the figures in Table 4435, the pelagic over 40m segment is operating at a loss, and will not be able to absorb any increases in fuel prices. Fuel prices need to fall to €0.291/litre to break even. Fuel costs are approximately 12% of the value of landings for this sector currently and at 2008 fuel costs this has increased to around 19%. This segment consists of a small number of highly sophisticated vessels, many of which are less than 5 years old and therefore capital costs are high. This segment does have the advantage of having relatively stable fishing entitlements and have already shown signs of adapting to increasing fuel costs by decreasing steaming distances to land fish, adopting fuel efficient gears and optimising shore operations to reduce fuel consumption. However, it should be noted that two operators within this segment have reduced the size of their vessels to reduce costs and other operators are considering this option as well. The motivation for this is clearly illustrated in the economic analysis for the 24440m pelagic segment shown in Table 4434, which shows the smaller 24440m pelagic vessels to be highly profitable.
Table 4435: Break4even evaluation (Status quo / present situation) – Pelagic 24440m
Indicator Situation 200446 Fuel price
2008
Base line Break4even
price of fuel
Break4even
fuel costs
Break even
catch / unit of
effort
Changing Cells:
Price of fuel (€/tonne) 362 291 362 362 594
Fuel costs (1000 €) 5,178,450 4,163,574 4,163,574 5,178,450 8,493,325
Catch / unit of effort (tonne) 34.51 34.51 34.51 35.30 34.51
Result Cells:
Change in fuel consumption 1 1 1 1 1
Value of landings 44,360,038 44,360,038 44,360,038 45,374,913 44,360,038
Fuel costs 5,178,450 4,163,574 4,163,574 5,178,450 8,493,325

Report Number C002/08 65 of 425
Indicator Situation 200446 Fuel price
2008
Base line Break4even
price of fuel
Break4even
fuel costs
Break even
catch / unit of
effort
Crew share 13,300,533 13,645,041 13,645,041 13,645,041 12,175,270
Net profit 4670,367 0 0 0 42,859,979
Break even production value 46,195,628 44,360,038 44,360,038 45,374,913 53,415,043
Gross value added 20,577,834 21,592,709 21,592,709 21,592,709 17,262,959
Gross value added / man 94,250 98,898 98,898 98,898 79,067
Crew share / man 60,918 62,496 62,496 62,496 55,765
4.5.3 Factors determining energy efficiency
Table 4436 shows Key Performance Indicators of litres fuel/kg of fish and Fuel costs as a % of value of landings for the different segments. The values indicate the different catch composition with the inshore sector targeting small volumes of high value species and the pelagic segments targeting high volumes of low value species. The fuel costs as a % of value for the inshore vessels and the pelagic segments are much lower than the demersal segments, suggesting that these segments are not as fuels intensify or reliant on fuel and therefore more able to absorb higher fuel costs. The > 40m pelagic segment is the most modern sector of the Irish fleet and therefore should have more efficient engines than the other segments but there are signs that some of the owners in this segment are looking at reducing vessel size and hp to reduce costs. There is a big difference in the engine size between these two segments given there quota allocations are fairly similar, supporting the rationale for decreasing vessel size.
Table 4436 : Fuel efficiency
Fleet segment
Litres/kg Fuel costs
as % of
value
Gear Vessel size
(GT)
Engine size
(kW)
Average
vessel age
Average
engine age
All Inshore 1.42 11 FPO 4.2 33 23 Na
Demersal trawler 12 4
24 1.39
19 OTB 94 274 26 Na
Demersal trawler 24 –
40 1.74
20 OTB 251 624 19 Na
Pelagic trawler 24 – 40 0.17 8 OTM/PTM 346 745 19 Na
Pelagic trawler > 40 0.09 12 OTM/PTM 1925 2581 9 Na
Figure 4412 to Figure 4416 show scatter plots for individual vessels from each segment of the following:
• Fuel costs vs. Catch value • Fuel costs vs. Catch Volume • Fuel use vs. Effort • Litres/kg of fuel vs. Engine size
As these plots show there is considerably variation within segments between vessels reflecting the lack of homogeneity between vessels.

Report Number C002/08 66 of 425
Figure 4412: Inshore 4 Energy efficiency of individual vessels
Figure 4413: Demersal Trawlers 12424m 4 Energy efficiency of individual vessels

Report Number C002/08 67 of 425
Figure 4414: Demersal trawlers 24440m4 Energy efficiency of individual vessels
Figure 4415: Pelagic Trawlers 24440m – Energy efficiency of individual vessels

Report Number C002/08 68 of 425
Figure 4416: Pelagic Trawlers >40m – Energy efficiency of individual vessels
4.5.4 Economic potential for technological improvement
Table 4437 shows the level of investment achievable with a 20% reduction of fuel costs per vessel per segment. With higher fuel prices in 2008 the level of investment increases proportionally. It is interesting to note that at the BE fuel price with a 20% reduction in fuel costs, the inshore, demersal 24440m and the pelagic 24440m segments still would breakeven at the 2008 price of €0.594/litre.
Table 4437: Potential of 20% fuel savings (average per vessels)
Fleet segment
Break4even
fuel price
(€/l)
Trade4off with
CPUE
(TOR)
Change in capital
costs
Maximum investment in
hull
Maximum investment in
engine
20044
6
2008 200446 2008 200446 2008 200446 2008
All Inshore 642 98% 96% 1,224 2,009 18,418 30,222 9,010 14,784
Demersal Trawlers 12 4
24 253 96% 94% 8,704 14,275 130,958 214,787 64,060 105,066
Demersal Trawlers 24
– 40 595 96% 94% 20,294 33,285 305,352 500,817 149,367 244,981
Pelagic Trawlers 24 –
40 1,980 98% 97% 24,282 39,826 365,359 599,236 178,720 293,124
Pelagic Trawlers > 40 364 98% 96% 41,253 67,322 620,708 1,012,951 303,627 495,498

Report Number C002/08 69 of 425
4.5.5 Scenarios for future fuel prices
As Table 4438 and Table 4439 suggest all segments except for the 24440m pelagic vessels will all make a net loss with even a 50% increase in fuel prices. The current price of €0.594 represents a 61% over the average 200442006 price. Thus were prices to increase further the economic viability of the demersal trawler segments is highly debatable without a big increase in CPUE but in fact clearly most of the segments would struggle to maintain viability with a 75% increase in fuel costs over the 200442006 price level. This is further reflected in the large reductions in crew share, which would undoubtedly make fishing unattractive as an occupation, particularly for the smaller demersal vessels. As indicated in previous tables the inshore and pelagic segments seem most able to absorb increasing fuel prices. This is probably as a result of the fact that many of these vessels have fairly stable catch profiles and can therefore adapt quicker to rising costs while still landing similar volumes of fish. The inshore segment, tend to be more targeted in their activities, fishing only for short periods of time and with relatively low fuel consumption. The figures in these tables suggest that if the current trend for increasing prices continues the likelihood in the Irish industry is a move towards smaller inshore vessels or targeting of pelagic species. Whether the current licensing regime within Ireland will allow this is questionable but it should be borne in mind.
Table 4438: Absolute consequences of fuel price change (1000 €, segment total)
Fleet segment Scenario 1: PFU+50% Scenario 2: PFU+75% Scenario 3: PFU+100%
Gross
value
added
Crew
share
Net
profit
Gross
value
added
Crew
share
Net
profit
Gross
value
added
Crew
share
Net
profit
All Inshore 24,936 22,369 4523 22,571 21,624 42,143 20,205 20,879 43,764
Demersal Trawlers 124
24
19,221 19,344 47,134 16,055 18,071 49,027 12,888 16,798 410,920
Demersal Trawlers 244
40
13,377 10,721 4858 11,475 9,969 42,009 9,573 9,217 43159
Pelagic Trawlers 24440 16,960 9,646 4,072 16,398 9,438 3,717 15,836 9,230 3,364
Pelagic Trawlers > 40 17,989 12,422 42,381 16,694 11,982 43,236 15,399 11,543 44,091
Table 4439: Relative consequences of fuel price change (% of the baseline situation)
Fleet segment Scenario 1: PFU+50% Scenario 2: PFU+75% Scenario 3: PFU+100%
Gross
value
added
Crew
share
Net
profit
Gross
value
added
Crew
share
Net
profit
Gross
value
added
Crew
share
Net
profit
All Inshore 416% 46% 4119% 424% 49% 4179% 432% 412% 4238%
Demersal 12 424 425% 412% 4113% 437% 417% 4170% 450% 423% 4226%
Demersal 24 – 40 422% 412% 160% 433% 418% 4239% 444% 425% 4319%
Pelagic 24440 46% 44% 415% 49% 46% 422% 412% 48% 430%
Pelagic > 40 413% 47% 4255% 419% 410% 4383% 425% 413% 4510%
4.5.6 Economic consequences of technical adaptations
4.5.6.1 Reference vessel 14 Ireland Reference vessel one is a demersal trawler of 22.65 m with 522 kW fishing an average of 175 days per year for mixed demersal species and Nephrops. Table 4440 below summarises the details of the technical adaptations that have been identified and the likely fuel savings, estimated investment costs and changes in CPUE resulting.

Report Number C002/08 70 of 425
Table 4440: Summary of effects on fuel savings, investment costs, and landings for adaptations studied
No Adaptation Potential Fuel Saving (%) Investment Costs (€) Effect on LPUE (%)
1 Gear Modifications – doors & trawls 6413.5 17,500 None
2 Reverting to single rig 10421 24,000 416
3 Converting to Seine Netting 25 68,500 425 to 430
4 Reduction in Steaming Speed 145 None None
5 Optimising Bollard Pull 142 100041500 None
6 Fitting a Fuel Meter 10412 120043100 None
7 Hull cleaning 245 7,500 None
8 Engine Maintenance 548 None None
Table 4441 below gives the predicted economic improvements of adopting four of investments for the 12424m demersal segment. Due to time constraints all of the adaptations could not be run through the model. The complete analysis will be carried out at a later date.
Table 4441: Technical adaptations of Segment Demersal 12424m (average per vessels, Economic indicators 1000€)
Technical adaptations (See Chapter 6) Indicator Base line
Adapt. 1 Adapt. 2 Adapt. 3 Adapt. 4
Technical information
Gear
Modifications
Reverting to single
rig Fitting a fuel meter Basic Maintenance
Fuel saving in % to annual fuel
use 13.5 21 12 7.9
Estimated investments (1000
€) 17.5 24 3.1 0
Estimated impact on CPUE (%) 0 416 0 0
Calculated consequences
BE (Maximum) investment
(1000 €) 9.64 12.51 8.57 5.64
PFU 2008 (€/l) 0.594 0.594 0.594 0.594 0.594
BE PFU (at estimated
investment) 0.202 0.234 0.256 0.23 0.219
BE PFU (at 50% of BE4
investment)
CPUE 200442006 (kg/kW4day) 3.54 3.54 3.54 3.54 3.54
BE CPUE (at estimated
investment) 4.26 4.12 4.03 4.13 4.18
BE CPUE (at 50% BE4
investment)
Economic indicators (per
vessel)
Value of landings 385.64 385.64 385.64 385.64 385.64
Fuel costs 117.15 103.3 89.55 105 109.96
Other variable costs 60.69 60.69 60.69 60.69 60.69
Repair and maintenance 47.98 47.98 47.98 47.98 47.98
Fixed costs 57.31 57.31 57.31 57.31 57.31

Report Number C002/08 71 of 425
Technical adaptations (See Chapter 6) Indicator Base line
Adapt. 1 Adapt. 2 Adapt. 3 Adapt. 4
Crew share 107.97 107.97 119.97 107.97 110.87
Capital costs 40.29 40.29 40.29 40.29 40.29
Net profit 445.76 437.5 429.26 438.5 441.45
Gross cash flow 45.46 8.39 10.14 6.69 41.17
Gross value added 102.5 116.38 130.1 114.59 109.7
Economic indicators (segment total)
Value of landings in 67,101 67,101 67,101 67,101 67,101
Fuel costs 20,384 17,696 15,582 18,281 19,132
Other variable costs 10,561 10,561 10,561 10,561 10,561
Repair and maintenance 8,348 8,348 8,348 8,348 8,348
Fixed costs 9,972 9,972 9,972 9,972 9,972
Crew share 18,787 19,758 19,907 19,633 19,291
Capital costs 7,010 7,011 7,011 7,010 7,010
Net profit 47,962 46,518 45,092 46,704 47,213
Gross cash flow 4951 766 2,731 306 4203
Gross value added 17,835 20,251 13,010 19,939 19,087
Adaptation 1 – Gear modifications The results in Table 4426 indicate the following:
• The BE (Maximum investment) is 41% below the estimated investment costs of reverting to single rig trawling for this vessel with the expected fuel savings.
• BE CPUE (at estimated investment) is 3% lower than the baseline BE CPUE. • Net profit per vessel is increased by 18%. • Be PFU is increased by 14%. • Gross cash flow does not meet capital costs.
On the basis of these results, while the projected fuel savings with this adaptation increase net profit and decrease breakeven cpue, the fact that the estimated investment is much higher than the BE maximum investment would suggest this adaptation is not economically viable. Adaptation 2 4 Reverting to single rig trawling The results in Table 4426 indicate the following:
• The BE (Maximum investment) is 48% below the estimated investment costs of reverting to single rig trawling for this vessel with the expected fuel savings.
• BE CPUE (at estimated investment) is 5% lower than the baseline BE CPUE but there is an estimated 16% reduction in CPUE as a result of reverting to single rig trawling.
• Net profit per vessel is increased by 36%. • Be PFU is increased by 21%. • Gross cash flow does not meet capital costs.
On the basis of these results, while there are improvements with this adaptation in net profit the fact that the estimated investment is much higher than the BE maximum investment would suggest this has only limited benefits, particularly as the reduction in CPUE at BE (maximum investment) is lower than the anticipated reduction in CPUE as a result of adopting this adaptation.

Report Number C002/08 72 of 425
Adaptation 3 4 Fitting a Fuel Meter The results in Table 4426 indicate the following:
• The BE (Maximum investment) is above the estimated investment costs of installing a fuel meter for this vessel with the expected fuel savings.
• BE CPUE (at estimated investment) is 3% lower than the baseline BE CPUE. • Net profit per vessel is increased by 16%. • BE PFU is increased by 12%. • Gross cash flow does not meet capital costs.
On the basis of these results, given that the estimated investment is much lower than the BE maximum investment the installation of a fuel meter seems economically worthwhile to implement, particularly there is an increase in net profit and a higher BE Fuel price. Adaptation 4 4 Basic engine maintenance The results in Table 4426 indicate the following:
• There are no investment costs estimated with this adaptation. • BE CPUE (at estimated investment) is 2% lower than the baseline BE CPUE. • Net profit per vessel is increased by 16%. • BE PFU is increased by 9%. • Gross cash flow does not meet capital costs.
On the basis of these results, given that there are no estimated investment costs associated with this adaptation and the small increase in net profit and BE fuel price, it would seem economically worthwhile to implement this adaptation.
4.5.6.2 Reference vessel 2 4 Ireland Reference vessel two is a demersal trawler of 37.05m with 736 kW fishing an average of 240 days per year for mixed demersal species and deepwater species. Table 4442 below summarises the details of the technical adaptations that have been identified and the likely fuel savings, estimated investment costs and changes in CPUE resulting.
Table 4442: Summary of effects on fuel savings, investment costs, and landings for adaptations studied
No Adaptation Potential Fuel Saving (%) Investment Costs (€) Effect on LPUE (%)
1 Gear Modifications – doors & trawls 5411 26,000 None
2 Dynex Warps 15420 50,000 None
3 Reverting to single rig 24430 26,000 Reduction by 25%
4 Reduction in Steaming Speed 4.5 None None
5 Optimising Bollard Pull 4 100041500 None
6 Fitting a Fuel Meter 10 120043100 None
7 Hull cleaning 145 7,500 None
8 Engine Maintenance 547 None None
9 Replacing Auxiliary engine 15 30,000 None
10 Fuel Quality 0.541 1,000 None

Report Number C002/08 73 of 425
Table 4443 below gives the predicted economic improvements of adopting these investments for the 24440m demersal segment. Due to time constraints all of the adaptations could not be run through the model. The complete analysis will be carried out at a later date.
Table 4443: Technical adaptations of Segment Demersal 24440m (average per vessels, Economic indicators 1000€)
Indicator Technical adaptations (See Chapter 6)
Base line
Adapt. 1 Adapt. 2 Adapt. 3 Adapt. 4
Technical information
Gear
modifications Dynex Warps
Reducing
steaming speed
Replacing aux.
Engine
Fuel saving in % to annual fuel
use 11 20 4.5 15
Estimated investments (1000 €) 26 50 0 30
Estimated impact on CPUE (%) 0 0 0 0
Calculated consequences
BE (Maximum) investment (1000
€) 18.31 33.,29 7.49 24.96
PFU 2008 (€/l) 0.594 0.594 0.594 0.594 0.594
BE PFU (at estimated investment) 0.476 0.534 0.595 0.498 0.56
BE PFU (at 50% of BE4investment)
CPUE 200442006 (kg/kW4day) 2.19 2.19 2.19 2.19 2.19
BE CPUE (at estimated
investment) 2.33 2.25 2.19 2.3 2.22
BE CPUE (at 50% BE4investment)
Economic indicators (per
vessel)
Value of landings 849.87 849.87 849.87 849.87 849.87
Fuel costs 277.3 246.8 221.84 264.82 235.71
Other variable costs 113.08 113.08 113.08 113.08 113.08
Repair and maintenance 76.74 76.74 76.74 76.74 76.74
Fixed costs 115.51 115.51 115.51 115.51 115.51
Crew share 228.88 240.94 250.81 233.81 245.33
Capital costs 78.11 78.12 78.12 78.11 78.12
Net profit 433.41 414.97 0.12 425.86 48.26
Gross cash flow 38.36 56.8 71.89 45.91 63.5
Gross value added 273.59 304.09 329.05 286.06 315.18
Economic indicators (segment
total)
Value of landings 38,527 38,527 38,257 38,257 38,257
Fuel costs 12,478 11,106 9,983 11,917 10,606
Other variable costs 5,086 5,086 5,086 5,086 5,086
Repair and maintenance 3,453 3,453 3,453 3,453 3,453
Fixed costs 5,198 5,198 5,198 5,198 5,198
Crew share 10,300 10,842 11,286 10,522 11,040

Report Number C002/08 74 of 425
Indicator Technical adaptations (See Chapter 6)
Base line
Adapt. 1 Adapt. 2 Adapt. 3 Adapt. 4
Capital costs 3,515 3,515 3,515 3,515 3,515
Net profit 41,503 4674 5 41,163 4371
Gross cash flow 2,012 2,842 3,251 2,081 2,874
Gross value added 12,311 13,684 14,807 12,872 14,183
Adaptation 1 – Gear modifications The results in Table 4443 indicate the following:
• The BE (Maximum investment) is 30% below the estimated investment costs of carrying our gear modifications for this vessel with the expected fuel savings.
• BE CPUE (at estimated investment) is 3% lower than the baseline BE CPUE. • Net profit per vessel is increased by 55%. • Be PFU is increased by 11%. • Gross cash flow does not meet capital costs (43%).
On the basis of these results, while the projected fuel savings with this adaptation increase net profit, increase BE fuel price and decrease breakeven CPUE, the fact that the estimated investment is much higher than the BE maximum investment would suggest this adaptation is not economically viable. Adaptation 2 4 Dynex™ warps The results in Table 4443 indicate the following:
• The BE (Maximum investment) is 34% below the estimated investment costs of carrying our gear modifications for this vessel with the expected fuel savings.
• BE CPUE (at estimated investment) is 6% lower than the baseline BE CPUE. • Net profit per vessel is increased and becomes positive. • Be PFU is increased by 20%. • Gross cash flow does not meet capital costs (19%).
On the basis of these results, with the replacement of wire warp with Dynex rope there is a large increase in net profit and in fact net profit becomes positive. There is a 20% increase in the BE FPU and increases BE FPU above the current 2008 fuel price but the BE (maximum investment) is still lower than the estimated investment costs so economically this adaptation is not worth implementing. Adaptation 3 4 Reducing steaming speed The results in Table 4443 indicate the following:
• There are no investment costs estimated with this adaptation. • BE CPUE (at estimated investment) is 1% lower than the baseline BE CPUE. • Net profit per vessel is increased by 23%. • BE PFU is increased by 4%. • Gross cash flow does not meet capital costs.

Report Number C002/08 75 of 425
On the basis of these results, given that there are no estimated investment costs associated with this adaptation and the small increase in net profit and BE fuel price, it would seem economically worthwhile to implement this adaptation. Adaptation 4 4 Replacing the auxiliary engine The results in Table 4443 indicate the following:
• BE (Maximum investment) is 17% below the estimated investment needed to complete the adapt4ation with the expected fuel savings.
• BE CPUE (at estimated investment) is 5% lower than the baseline BE CPUE with no estimated reduction in CPUE estimated.
• BE PFU is increased by 15%. • Net profit per vessel is increased by 75%. • Gross cash flow does not meet capital costs (18%)
On the basis of these results, replacing the auxiliary engine results in a large increase in net profit. There is a 15% increase in the BE FPU but the BE (maximum investment) is still lower than the estimated investment costs so economically this adaptation is not worth implementing.
4.5.6.3 Reference vessel 3 – Ireland Reference vessel three is a pair pelagic trawler of 37.05m with 2030kW fishing an average of 70 days per year for pelagic species. Table 4444 below summarises the details of the technical adaptations that have been identified and the likely fuel savings, estimated investment costs and changes in CPUE resulting.
Table 4444: Summary of effects on fuel savings, investment costs, and landings for adaptations studied
No Adaptation Potential Fuel Saving (%) Investment Costs (€) Effect on LPUE (%)
1 Dynex Warps 10 35,000 Possible small
increase
2 Hexagonal Mesh Trawls 25 65,000475,000 Possible small
increase
3 T90 or Square Mesh codends 8410 35,000445,000 None
4 Reduction in Steaming Speed 6 None None
5 Optimising Bollard Pull 2.2 100041500 None
6 Fitting a Fuel Meter 3410 120043100 None
7 Hull cleaning 145 7,500 None
8 Engine Maintenance 548 None None
9 Fitting a Nozzle 18 (2.5% for this vessel) 35,000 Increase in bollard pull
10 Hull Appendages 5 Not known None
Table 4445 below gives the predicted economic improvements of adopting these investments for the 24440m pelagic segment.

Report Number C002/08 76 of 425
Table 4445: Technical adaptations of Segment Pelagic 24440m (average per vessels, Economic indicators 1000€)
Indicator Technical adaptations (See Chapter 6)
Base line
Adapt. 1
Adapt. 2
Adapt. 3 Adapt. 4
Technical information
Dynex Warps
Hexagonal mesh
trawl Fitting a Nozzle Hull Appendages
Fuel saving in % to annual fuel
use 10 25 18 5
Estimated investments (1000
€) 35 75 35 Not known
Estimated impact on CPUE (%) Not known Not known Not known 0
Calculated consequences
BE (Maximum) investment
(1000 €) 19.91 49.78 35.84 9.96
PFU 2008 (€/l) 0.594 0.594 0.594 0.594 0.594
BE PFU (at estimated
investment) 1.58 1.76 2.12 1.93
BE PFU (at 50% of BE4
investment) 1.68
CPUE 200442006 (kg/kW4day) 33.45 33.45 33.45 33.45 33.45
BE CPUE (at estimated
investment) 26.47 20.22 25.42 25.72
BE CPUE (at 50% BE4
investment) 26.23
Economic indicators (per
vessel)
Value of landings 2,455 2,455 2,455 2,455 2,455
Fuel costs 307.15 276.44 230.37 251.87 291.83
Other variable costs 265.43 265.43 265.43 265.43 265.43
Repair and maintenance 237.6 237.6 237.6 237.6 237.6
Fixed costs 257.88 257.88 257.88 257.88 257.88
Crew share 794.12 805.47 822.51 814.56 799.83
Capital costs 270.2 270.2 270.22 270.21 270.21
Net profit 322.79 342.14 371.18 357.63 332.5
Gross cash flow 592.82 612.18 641.21 627.66 602.67
Gross value added 1387.11 141.78 146.39 144.24 140.25
Economic indicators (segment total)
Value of landings 29,462 29,462 29,462 29,462 29,462
Fuel costs 3,686 3,317 2,764 3,022 3,502
Other variable costs 3,185 3,185 3,185 3,185 3,185
Repair and maintenance 2,851 2,851 2,851 2,851 2,851
Fixed costs 3,095 3,095 3,095 3,095 3,095
Crew share 9,529 9,657 9,870 9,775 9,598
Capital costs 3,242 3,243 3,243 3,242 3,242

Report Number C002/08 77 of 425
Indicator Technical adaptations (See Chapter 6)
Base line
Adapt. 1
Adapt. 2
Adapt. 3 Adapt. 4
Net profit 3,873 4,106 4,454 4,292 3,990
Gross cash flow 7,116 7,357 7,697 7,534 7,232
Gross value added 16,645 17,014 17,567 17,309 16,830
Adaptation 1 – Dynex Warps The results in Table 4445 indicate the following:
• The BE (Maximum investment) is 43% below the estimated investment costs of carrying our gear modifications for this vessel with the expected fuel savings.
• BE CPUE (at estimated investment) is 24% lower than the baseline BE CPUE. • Net profit per vessel is increased by 6%. • Be PFU is increased by 10%. • Gross cash flow does meet capital costs.
On the basis of these results, with the replacement of wire warp with dynex rope there is a large increase in net profit and. There is a 10% increase in the BE FPU but the BE (maximum investment) is still lower than the estimated investment costs so economically this adaptation is not worth implementing. Adaptation 2 4 Hexagonal mesh trawl The results in Table 4445 indicate the following:
• The BE (Maximum investment) is 33% below the estimated investment costs of replacing an existing trawl with a hexagonal mesh trawl for this vessel with the expected fuel savings.
• BE CPUE (at estimated investment) is 4% lower than the baseline BE CPUE. • Net profit per vessel is increased by 13%. • Be PFU is increased by 13%. • Gross cash flow does meet capital costs.
On the basis of these results, while there is a large increase in net profit with this adaptation the fact that the estimated investment costs are much higher than the BE maximum investment would suggest that this adaptation economically is not worth implementing. Adaptation 3 4 Fitting a Nozzle The results in Table 4445 indicate the following:
• The BE (Maximum investment) is above the estimated investment costs of fitting a nozzle to this vessel with the expected fuel savings.
• BE CPUE (at estimated investment) is 3% lower than the baseline BE CPUE. • Net profit per vessel is increased by 10%. • Be PFU is increased by 18%. • Gross cash flow does meet capital costs.
On the basis of these results, given that the estimated investment is much lower than the BE maximum invest4ment the installation of a nozzle seems economically worthwhile to implement, particularly as there is an increase in net profit and a higher BE Fuel price.

Report Number C002/08 78 of 425
Adaptation 4 4 Removal / Streamlining of Appendages The results in Table 4445 indicate the following:
• The investment costs for this adaptation are not known. • BE CPUE (at 50% of the maximum investment costs) is 1% lower than the baseline BE CPUE. • Net profit per vessel is increased by 3%. • Be PFU (at 50% of the maximum investment) is increased by 5%. • Gross cash flow does meet capital costs.
On the basis of these results, it would seem the removal or streamlining of unwanted appendages form the hull is economically worthwhile although no investment costs are available and the savings are modest.
4.5.7 List of national studies 4 publications related to fuel efficiency in fisheries
Studies Completed Fuel Efficiency and Bollard Pull Tests mfvs “Cisemair” and “Boy Jason”. Study carried out for BIM by Promara Ltd., Cork April 2006.
Development of Alternative Shaft Generator Designs (Project: “Flexigen”). National Study with Promara Ltd, Cork, Ireland
Economic Analysis of the potential for using Copper based antifouling on Fishing vessels. Repeort for BIM August 2007.
Rihan, D. (2004). Case Study 2. A comparison of twin4Rig Trawling and Single Rig Trawling in terms of Relative Fishing Efficiency. In: Thomsen, B., Revill, A., Rihan, D. and Eigaard, O. (Eds) Report of Efficiency and Productivity in Fish Capture Operations. Report of the ICES4FAO Working Group on Fishing Technology and Fish Behaviour (WGFTFB), ICES Fisheries Technology Committee ICES CM 2004/B:05, Ref. ACE. 20423 April 2004, Gdynia, Poland. ICES WGFTFB Report 2004pp 189.
Studies Ongoing Testing of rope warps as opposed to wire warp on Pelagic Trawlers to reduce fuel consumption. National Study. Inshore Sentinel Vessel Programme in support of the Data Collection Regulation. Fuel data recording project on different sectors of the Irish Fishing Fleet.

Report Number C002/08 79 of 425
4.6 Italy
4.6.1 Role of energy for individual fleet segments
Bottom trawlers 24440m: the segment made up of vessels operating with bottom otter trawlers and a Loa between 24 and 40 metres represents a 2% of the total Italian fishing fleet if considering the number of vessels in the period 200442006. This percentage increases to 11% and 23% if considering the engine power installed and the gross tonnage respectively. These vessels have, indeed, an average engine power of 409 kW and an average size of 138 GT. The total employment is equal to about 2,000 people. On average, each vessel operates with 6 crewmen and uses about 280,000 litres of fuel for fishing operations. Pelagic trawlers 24440m: the segment made up of vessels operating in pair with pelagic trawlers (only in the Adriatic sea) and a Loa between 24 and 40 metres represents 0.3% of the total Italian fishing fleet if considering the number of vessels. This percentage increases to 2% and 1% if considering the engine power installed and the gross tonnage respectively. The average size of pair pelagic trawlers with 24440m Loa is less than 100 GT, and the engine power per vessel is 415 kW. The total employment is equal to 314 people. On average, 7 people are employed on vessels of this type and the fuel consumption is about 180,000 litres per vessel. Beam trawlers 12424m: vessels belonging to this fleet segment operate with a special beam trawl called “rapido”, where beams are provided with teeth helping in dragging. The name “rapido”, which means quick, is used as the speed is fundamental for the proper use of this fishing technique. These vessels with a Loa between 12 and 24m, represent a 0.5% of the total Italian fishing fleet if considering the number of vessels. This percentage increases to 2% if considering the engine power installed or the gross tonnage. On average, each vessel has a size of around 50 GT and an engine power of 280 kW. Total employment is equal to about 260 persons. As far as the fuel consumption, the yearly use for this fleet segment is about 84 million litres that means about 160,000 litres per vessel per annum. Passive gears <12m: this segment is made up of small scale vessels (Loa less than 12m) and by long4liners <12 m. This segment represents most of the Italian fishing fleet: more than 9,500 vessels corresponding to 63% of the total fleet. If considering the dimension of these vessels (less than 2 GT), the relevance of this segment on the national fleet decrease to 9% and to 21% in terms of gross tonnage and engine power installed on4board respectively. Both the number of people employed and the level of fuel used are very low on vessels of this type: fishing operations are made, on average, by only one person and using not more than 9,000 litres per annum.
Table 4446:Summary of technical parameters, average 200442006 (segment totals)
Fleet
Segment
Number of vessels Total engine power
(1000 kW)
Total crew Total effort
(1000 kW4days)
Fuel use
(1000 litre)
Bottom trawlers
24440m
332 135.617 2,051 25,089 93,217
Pelagic trawlers
24440m
44 18.125 314 1,758 7,799
Beam trawlers
12424m
72 20.038 259 2,930 11,513
Passive gears
<12m
9,502 251.330 14,156 33,292 84,225

Report Number C002/08 80 of 425
Table 4447: Summary of technical parameters, average 200442006 (average per vessel)
Fleet
Segment
Engine power
(kW)
Crew Effort
(1000 kW4days)
Fuel use
(1000 litre)
Bottom trawlers
24440m
408.895 6 75.646 281.1
Pelagic trawlers
24440m
415.074 7 40.260 178.6
Beam trawlers
12424m
279.602 4 40.878 160.7
Passive gears
<12m
26.450 1 3.504 8.9
Bottom trawlers 24440m: the average value of landings of bottom trawlers 24440m Loa for the period under analysis (200442006) is about 160 million €, equal to about 480,000 €/vessel. The average price is rather high (7.75 €/kg) compared to the other fleet segments. For this type of vessels, fuel costs represent 28% of income (130,000 €/vessel). The bottom trawlers and beam trawlers are the fleet segments consuming the greatest amount of fuel for fishing operations, especially for dragging operations. Labour cost per vessel is, on average, equal to 121,000 €/annum. This segment has produced a value added equal to more than 80 million € per annum during the period 200442006. The high incidence of operational costs and capital costs (depreciation and interest costs are equal to about 25% of the value of landings) have resulted in a negative performance for the segment. An average net profit of 4338,000 €s, corresponding to a loss of 1,000 €/vessel, has been registered in the period 200442006. Pelagic trawlers 24440m: the segment represented by the pelagic pair trawlers (44 vessels on average) has produced, through the period under analysis, an average annual income (value of landings) of more than 22 million €. The value per vessel is equal to 513,000 €s. As this segment is characterised by a very low price (2.16 €/kg on average), due to a low commercial value of its target species (anchovies and sardines), the high income per vessel is a consequence of the very high level of catches per unit of effort (25 kg/GT*days). Fuel costs per vessel, representing a 15% of the value of landings, are around 76,000 €, and the crew share per vessel is about 180,000 €s per vessel per annum. The economic performance for this fleet segment is positive for more than 3 million € net profit, equivalent to about 78,000 €s per vessel. Beam trawlers 12424m: vessels operating with “rapido” (a typical Italian beam trawl) have produced, on average, in the period 200442006, more than 15 millions € (about 212,000 €/vessel). Among the fleet segments analysed, this is the most fuel consuming, fuel costs representing 31% of the value of landings. Each vessel spends, on average, 66,000 €s per annum for fuel. Operational costs have been so high, in the period under analysis, to cause a negative economic performance for this segment. A loss of 209 million € for the beam trawlers, corresponding to a negative profit of about 3,000 €/vessel/annum, has been registered. Passive gears <12m: the fleet segment contributing the most to the Italian fish production both in terms of weight (17% of total catches) and in terms of value (26% of total income) is represented by vessels operating with passive gears. Each one of these vessels produced, on average, 38,000 €/annum. Very low levels of fuel consumption (11% of the value of landings) and capital costs (10% of the value of landings, vis4à4vis 25% for bottom trawlers and “rapido”) have allowed a positive economic performance for this fleet segment with about 110 million € net profit, equivalent to about 11,500 €/vessel.
Table 4448: Summary of the economic parameters, average 200442006 (segment totals, 1000 €)
Fleet segment Value of landings Fuel costs Crew share Gross value added Net profit
Bottom trawlers 24440 157,161 43,305 40,223 80,303 4 338
Pelagic trawlers 24440 22,406 3,314 7,815 15,151 3,403
Beam trawlers 12424 15,213 4,745 3,926 7,484 4 209
Passive gears <12 366,108 39,279 109,327 256,996 109,906

Report Number C002/08 81 of 425
Table 4449: Summary of the economic parameters, average 200442006 (average per vessel, 1000 €)
Fleet segment Value of landings Fuel costs Crew share Gross value added Net profit
Bottom trawlers 24440 473.85 130.57 121.28 242.12 4 1.02
Pelagic trawlers 24440 513.11 75.90 178.98 346.98 77.94
Beam trawlers 12424 212.28 66.22 54.78 104.43 4 .91
Passive gears <12 38.53 4.13 11.51 27.05 11.57
In the last decade, the trend of the fuel price in Italy has been characterised by an increasing course. In 1996 it was equal to 0.234 €/litre, while in 2007 the price was more than doubled (0.550 €/litre) registering an increase of 135%. The fuel price estimated for 2008 on the first 8 months data shows a further increase of around 35% reaching the value of 0.739 €/litre. The highest growth rates have been registered in the period 1999/2000, with an increase of 55%, and in the period 2004/2005, when the price of fuel increased from 0.380 €/litre to 0.513 €/litre (+35%). In Italy, the fuel price is not depending on the fishing techniques adopted by vessels. If a difference among segments exists (as reported in the tables below), this is due to small differences in fuel price registered at regional level (higher prices can be paid, generally, in fishing ports farther from refineries). Bottom trawlers 24440m: the increase in fuel price has been very high, in the period 200442006, for bottom trawlers 24440m (+74%). The increase in fuel costs has caused a reduction in the fishing activity (a 15% less in fishing days) and then in the fuel consumption (429%). Nevertheless, the fuel saving has not been sufficient to offset the effect of the increase in fuel price. Actually, the fuel costs have registered an increase of 24% in the period 200442006. Pelagic trawlers: as for vessels operating with pelagic pair trawlers, the increase in fuel price (+55% from 2004 to 2006) has been lower than that registered for the bottom trawlers. In this case, from 2004 to 2005, the increase in fuel price produced a marked decrease in fuel consumption (439%) as a consequence of a reduction in fishing activity. This caused a reduction in the production of around 32%. In 2006, notwithstanding the constant increase of the fuel price, fishermen were able to cover the additional costs due to the increasing fuel price by an increase in landings price. Indeed, fishing days registered an increase of 31%, and consequently fuel costs registered an increase of 165%. However, the increase of the volume of landings associated to the increase in landings price (+58%) was able to counterbalance the negative effect of the rising fuel costs. Beam trawlers 12424m: for the segment represented by vessels operating with “rapido”, in the period 200442006, a negative trend for all economic indicators is registered. Indeed, the increase in fuel price (+60%) was so high to deteriorate the economic results of this fleet segment. The fishing days were decreased, and consequently also the volume of catch. Notwithstanding the decrease in fuel costs, the stability of the price of fish affected negatively the value of production (433%). Passive gears <12m: the increase in fuel price affected at a lower extent the economic performance of the vessels fishing with passive gears. The increase in fuel costs (+58%) caused a low reduction in fishing activity (47%), and hence in catches. However, as happened for pelagic trawlers, also for these vessels the increase in the fish price (+17%) was able to offset the increase in fuel costs (5%).
Figure 4417: Trends in value of landings and fuel use, (segment totals)

Report Number C002/08 82 of 425
Italy
0,000
0,200
0,400
0,600
0,800
1996199719981999200020012002200320042005200620072008
€/li
tre
Figure 4418: Development of fuel price in €/ltr until 2008 (first 648 months)
4.6.2 Break4even analysis
4.6.2.1 Bottom trawlers 24440m Loa The average net profit registered in the period 200442006 for bottom trawlers 24440m is negative. This net loss of 338,000€ is estimated to reach more than 15 million € in 2008 when the fuel price would equal 0.739 €/litre. As a consequence, the break4even point for each of the economic variables considered in the break4even analysis has been overcome. The maximum level of fuel price to produce non4negative profit is 0.473 €/litre, which is 1.20% lower than the current price and 55.58% lower than the 2008 price. The reduction in fuel price determines a reduction in fuel costs and then an increase in profit. Alternatively, the decrease in fuel costs can be obtained by reducing fuel consumption by the same percentages. Starting from the baseline situation, the fuel cost should decrease from 43.3 to 42.8 million € to eliminate losses. An increase in net profit or decrease in net loss can be produced also by an improvement in productivity. In this case, catch per unit of effort should rise at least 0.37% to have non4negative profit.
Table 4450: Break4even evaluation (Status quo / present situation) – bottom trawlers 24440m Loa (segment total)
Indicator Situation 200446 Fuel price
2008
Base line Break4even
price of fuel
Break4even
fuel costs
Break even
catch / unit of
effort
Changing Cells:
Price of fuel (€/1000 litre) 478.72 472.95 478.72 478.72 739.00
Fuel costs (1000 €) 43,305.42 43,305.42 42,783.18 43,305.42 43,305.42
Catch / unit of effort (tonne) 0.808 0.808 0.808 0.811 0.808
Result Cells:
Change in fuel consumption 1.00 1.00 1.00 1.00 1.00
Value of landings 157,161.11 157,161.11 157,161.11 157,683.35 157,161.11
Fuel costs 43,305.42 42,783.18 42,783.18 43,305.42 66,849.97
Crew share 40,223.39 40,407.89 40,407.89 40,407.89 31,905.48
Net profit 4337.74 0.00 0.00 0.00 415,564.38
Break even production value 158,293.82 157,161.11 157,161.11 157,683.35 234,487.25
Gross value added 80,302.57 80,824.81 80,824.81 80,824.81 56,758.02

Report Number C002/08 83 of 425
Gross value added / man 39.15 39.40 39.40 39.40 27.67
Crew share / man 19.61 19.70 19.70 19.70 15.55
4.6.2.2 Pelagic trawlers 24440m Loa Compared to the bottom trawlers, the break4even analysis for pelagic trawlers 24440m shows very different results. In the period 200442006, the economic performance of vessels operating with pair pelagic trawlers was positive as net profit of more than 3 million € were registered. For this fleet segment, the increase in fuel price foreseen for 2008 would produce a decrease in net profit of around 45% compared to the current value. The break4even fuel price estimated in 1.144 €/litre is 174% higher than the baseline price and 54% higher than the 2008 price. The same results are obtained by analysing the break4even fuel cost. This large gap between the baseline price and the break4even price is justified by the low incidence of fuel costs on the value of production. However, the fuel price as well as the fuel consumption should not rise more than 174% of the current levels to produce positive profit. In other words, fuel costs should not increase more than 9.077 million €. On the production side, given the current level of fuel price and fuel consumption, CPUE should not decrease more than 26% to maintain non4negative profit.
Table 4451: Break4even evaluation (Status quo / present situation) – pelagic trawlers 24440m Loa (segment total)
Indicator Situation 200446 Fuel price
2008
Base line Break4even
price of fuel
Break4even
fuel costs
Break even
catch / unit of
effort
Changing Cells:
Price of fuel (€/1000 litre) 417.87 1,144.37 417.87 417.87 739.00
Fuel costs (1000 €) 3,314.43 3,314.43 9,076.84 3,314.43 3,314.43
Catch / unit of effort (tonne) 5.887 5.887 5.887 4.373 5.887
Result Cells:
Change in fuel consumption 1.00 1.00 1.00 1.00 1.00
Value of landings 22,405.99 22,405.99 22,405.99 16,643.57 22,405.99
Fuel costs 3,314.43 9,076.84 9,076.84 3,314.43 5,861.55
Crew share 7,815.46 5,456.52 5,456.52 5,456.52 6,772.75
Net profit 3,403.47 0.00 0.00 0.00 1,899.06
Break even production value 12,846.17 22,405.99 22,405.99 16,643.57 15,832.01
Gross value added 15,151.41 9,388.99 9,388.99 9,388.99 12,604.28
Gross value added / man 48.18 29.86 29.86 29.86 40.08
Crew share / man 24.85 17.35 17.35 17.35 21.54
4.6.2.3 Beam trawlers (“rapido”) 24440m Loa The results of the break4even analysis for beam trawlers 24440m are very similar to those obtained for the bottom4trawlers. As well as for that fleet segment, also the fleet segment “rapido” has registered a negative economic performance in the period 200442006. The average net loss for this fleet segment was almost 210,000 €. The increase in fuel price foreseen for 2008 would produce a net loss of more than 2 million €. In order to perform non4negative profit, the break4even analysis shows that the fuel price should decrease at least by 7% (from 0.446 to 0.415 €/litre of fuel) compared to the baseline price, and 44% (from 0.739 to 0.415 €/litre of fuel) compared to the 2008 price. The same percentages applied to fuel consumption would produce identical results. Independently on the control variable, the fuel costs should be reduced at 4.411 million €, as the break4even fuel costs indicates. Alternatively, the non4negative profit goal can be achieved by increasing

Report Number C002/08 84 of 425
productivity. In this case, CPUE should be improved of 2.24% (from 1,384 to 1.415 tonne) compared to the baseline situation.
Table 4452: Break4even evaluation (Status quo / present situation) – beam trawlers(“rapido”)124 24m Loa (segment total)
Indicator Situation 200446 Fuel price
2008
Base line Break4even
price of fuel
Break4even
fuel costs
Break even
catch / unit of
effort
Changing Cells:
Price of fuel (€/1000 litre) 446.38 414.94 446.38 446.38 739.00
Fuel costs (1000 €) 4,745.46 4,745.46 4,411.22 4,745.46 4,745.46
Catch / unit of effort (tonne) 1.384 1.384 1.384 1.415 1.384
Result Cells:
Change in fuel consumption 1.00 1.00 1.00 1.00 1.00
Value of landings 15,213.43 15,213.43 15,213.43 15,547.67 15,213.43
Fuel costs 4,745.46 4,411.22 4,411.22 4,745.46 7,856.29
Crew share 3,926.03 4,051.38 4,051.38 4,051.38 2,759.31
Net profit 4208.88 0.00 0.00 0.00 42,152.99
Break even production value 15,997.63 15,213.43 15,213.43 15,547.67 30,750.11
Gross value added 7,484.14 7,818.38 7,818.38 7,818.38 4,373.31
Gross value added / man 28.93 30.22 30.22 30.22 16.90
Crew share / man 15.18 15.66 15.66 15.66 10.67
4.6.2.4 Passive gear <12m Loa In the period 200442006, the fishing fleet using passive gears has registered a positive net profit of almost 110 million €. Therefore the break4even fuel price ensuring a non4negative net profit is higher than the current price. However, as well as for the pelagic trawlers, the break4even analysis carried out for those vessels shows that they are less affected by changes in fuel price than others. This is due to the low incidence of fuel costs on the value of landings (0.002 litres of fuel per kg of fish). Consequently, the strong increase of fuel price estimated for 2008 can produce a less than 13% decrease in net profit. Non4negative net profit are ensured if the fuel price is lower than 2.500 €/litre. The level of fuel costs producing negative profit is at more than 200 million €. This level can be reached either by an increase in fuel price at the amount reported above or by an increase in fuel consumption of more than 400% compared to the baseline and 238% compared to the 2008 situation. Negative profit can be also produced by a reduction in productivity of at least 45%.
Table 4453: Break4even evaluation (Status quo / present situation) – passive gears <12m Loa (segment total)
Indicator Situation 200446 Fuel price
2008
Base line Break4even
price of fuel
Break4even
fuel costs
Break even
catch / unit of
effort
Changing Cells:
Price of fuel (€/1000 litre) 480.46 2,500.57 480.46 480.46 739.00
Fuel costs (1000 €) 39,279.20 39,279.20 204,429.45 39,279.20 39,279.20
Catch / unit of effort (tonne) 1.382 1.382 1.382 0.758 1.382
Result Cells:
Change in fuel consumption 1.00 1.00 1.00 1.00 1.00
Value of landings 366,108.15 366,108.15 366,108.15 200,957.90 366,108.15

Report Number C002/08 85 of 425
Fuel costs 39,279.20 204,429.45 204,429.45 39,279.20 60,415.58
Crew share 109,326.55 54,082.64 54,082.64 54,082.64 102,256.28
Net profit 109,906.35 0.00 0.00 0.00 95,840.24
Break even production value 112,294.44 366,108.15 366,108.15 200,957.90 123,228.13
Gross value added 256,996.15 91,845.90 91,845.90 91,845.90 235,859.77
Gross value added / man 18.15 6.49 6.49 6.49 16.66
Crew share / man 7.72 3.82 3.82 3.82 7.22
4.6.3 Factors determining energy efficiency
• Fuel efficiency can be defined as: Litres fuel / kg of fish and/or Fuel costs as % of value of landings. • Determining factors can be: Gear, Vessel size (GT), Engine size (kW), Vessel age, Engine age. • This can be summarized in the following table. The table below shows the fuel efficiency of the selected segments. The most fuel efficient segments are pelagic trawlers and vessels using passive gears, with a fuel efficiency indicator equal to 0.001 and 0.002 litre/kg of landed fish respectively. Instead, vessels using bottom otter trawls and vessels using “rapido” are less efficient in the use of fuel. These fleet segments consume 0.004 litre of fuel for each kg of landed fish. This is confirmed also by the indicator measuring the incidence of fuel costs on the total value of production. This indicator equals 28% for bottom trawlers and 31% for “rapido”. The efficiency in the fuel consumption is clearly affected by the gear used. Indeed, vessels using passive gears do not need to make long trips and to change place frequently when they are fishing (in many cases, as in the case of pots and traps, the fuel is consumed just to reach the fishing ground, usually not so far from the shore), while other fishing techniques, like bottom otter trawl and “rapido”, need to make broad movements in the sea, both to reach fishing grounds (often very distant from the shore) and to fish. Moreover, the Italian beam trawlers need an high speed to be efficient, affecting in this way the fuel consumption. The most fuel efficient segment is the pair pelagic trawler, with a fuel consumption per kg of fish equal to 0.001 litre/kg of fish landed. For this segment, indeed, the incidence of fuel costs on the total value of landings is about 15%.
Table 4�54: Fuel efficiency
Fleet
Segment
Litres/kg Fuel
costs as
% of value
Gear Vessel size
(GT)
Engine size
(kW)
Average
vessel age
Average
engine age
Bottom trawlers 244
40m
0.004 28% bottom otter
trawl
138.2 408.9 22
Pelagic trawlers 244
40m
0.001 15% pair pelagic trawl 97.3 415.1 20
Beam trawlers 124
24m
0.004 31% “rapido” 53.2 279.6 28
Passive gears
<12m
0.002 11% pots and traps,
long4line,
trammel nets and
gillnets
1.8 26.5 31

Report Number C002/08 86 of 425
Fuel use and catch valume
0
50000
100000
150000
200000
250000
300000
350000
400000
450000
0 50 100 150 200 250
Volume of catch (tonnes)
Fuel u
se (litres
)
Fuel use and catch value
0
50000
100000
150000
200000
250000
300000
350000
400000
450000
0 200 400 600 800 1000 1200
Value of catch (1000 €)
Fuel u
se (litres
)
Fuel use / catch value and engine size
0
200000
400000
600000
800000
1000000
1200000
1400000
0 200 400 600 800 1000
Enigne size (kW)
Fuel u
se /
cat
ch value (litre
s/€)
Fuel use and fishing effort
0
50000
100000
150000
200000
250000
300000
350000
400000
450000
0 50000 100000 150000 200000 250000
Fishing effort (kW-days)
Fuel u
se (litres
)
Figure 4419: Bottom trawlers 24440m Loa 4 Energy efficiency of individual vessels (y4axis – x4axis) – or something else?
Fuel use and catch valume
0
50000
100000
150000
200000
250000
300000
0 100 200 300 400 500 600 700 800
Volume of catch (tonnes)
Fuel u
se (litres
)
Fuel use and catch value
0
50000
100000
150000
200000
250000
300000
0 200 400 600 800 1000 1200
Value of catch (1000 €)
Fuel u
se (litres
)
Fuel use / catch value and engine size
0
50000
100000
150000
200000
250000
300000
350000
400000
450000
500000
0 200 400 600 800 1000
Enigne size (kW)
Fuel u
se /
cat
ch value (litre
s/€)
Fuel use and fishing effort
0
50000
100000
150000
200000
250000
300000
0 50000 100000 150000 200000
Fishing effort (kW-days)
Fuel u
se (litres
)
Figure 4420: Pelagic trawlers 24440m Loa 4 Energy efficiency of individual vessels (y4axis – x4axis) – or something else?

Report Number C002/08 87 of 425
Fuel use / catch value and engine size
0
100000
200000
300000
400000
500000
600000
700000
800000
0 200 400 600 800 1000 1200
Enigne size (kW)
Fuel u
se /
cat
ch value (litre
s/€)
Fuel use and fishing effort
0
50000
100000
150000
200000
250000
0 50000 100000 150000 200000
Fishing effort (kW-days)
Fuel u
se (litres
)
Fuel use and catch value
0
50000
100000
150000
200000
250000
0 200 400 600 800 1000
Value of catch (1000 €)
Fuel u
se (litres
)
Fuel use and catch valume
0
50000
100000
150000
200000
250000
0 50 100 150 200 250 300 350
Volume of catch (tonnes)
Fuel u
se (litres
)
Figure 4421: Beam trawlers(“rapido”)124 24m Loa 4 Energy efficiency of individual vessels (y4axis – x4axis) – or something else?
Fuel use and catch valume
0
10000
20000
30000
40000
50000
60000
70000
0 10 20 30 40 50 60 70
Volume of catch (tonnes)
Fuel u
se (litres
)
Fuel use and catch value
0
10000
20000
30000
40000
50000
60000
70000
0 50 100 150 200 250 300
Value of catch (1000 €)
Fuel u
se (litres
)
Fuel use / catch value and engine size
0
200000
400000
600000
800000
1000000
1200000
0 50 100 150 200 250 300 350
Enigne size (kW)
Fuel u
se /
cat
ch value (litre
s/€)
Fuel use and fishing effort
0
10000
20000
30000
40000
50000
60000
70000
0 10000 20000 30000 40000 50000
Fishing effort (kW-days)
Fuel u
se (litres
)
Figure 4422: Passive gears <12m Loa 4 Energy efficiency of individual vessels (y4axis – x4axis) – or something else?

Report Number C002/08 88 of 425
4.6.4 Economic potential for technological improvement
Results of the simulations on the possible fuel savings coming from technological improvements are reported in the following table. A 20% saving in fuel consumption has been simulated. For bottom trawlers, the break4even fuel price increases from 0.47 €/litre estimated on the current situation to 0.59 €/litre when a 20% fuel saving is realised. As reported above, a reduction in fuel consumption of 1.20% is enough to produce non4negative profit when fuel price is that registered in the period 200442006. In this case, a 20% fuel saving produces positive profit and a margin for fuel price to increase maintaining positive profit up to 0.59. However this level of fuel price is lower than 0.74, the fuel price estimated for 2008. Therefore, this reduction in fuel consumption is not high enough to produce positive profit at 2008 price. In order to have an improvement in the economic performance by the reduction in fuel use, CPUE should not fall by more than 6% at the 200442006 fuel price, and 9% at 2008 price. To the same end, the maximum investment in hull should be 336,000 € at the current fuel price and 519,000 € at the 2008 price. Alternatively, if the technological improvement determining the reduction in fuel consumption is related to the engine, the maximum investments should be 137 and 212,000 € respectively. These investments will produce an increase in capital costs of around 17,000 and 26,000 €s per vessel respectively. As a consequence of a 20% fuel saving, the break4even fuel price for pelagic trawlers would change from 1.14 to 1.43 €/litre. This level for fuel price is around 240% higher than the baseline price and more than 90% higher than the 2008 price. In this case, the possible reduction in CPUE due to the technological improvement producing the fuel saving should not be more than 3% to avoid a deterioration of the baseline economic performance. If considering the performance associated to the 2008 fuel price, CPUE should not be reduced more than 5%. When CPUE is not affected by the technological improvement, a maximum investment of 179,000 € in hull and 73,000 € in engine is economically acceptable if considering the 200442006 fuel price. Instead, at the 2008 fuel price, the maximum investment rises to 316,000 € in hull and 129,000 € in engine. For beam trawlers the break4even fuel price growths from 0.41 to 0.52 €/litre as a consequence of the reduction in fuel consumption. This price is higher than the fuel price registered in the baseline period, but lower than the price estimated for 2008. Starting from a negative economic performance for this fleet segment, a 20% fuel saving can reduce fuel costs and produce positive profit at the baseline fuel price. However, when the fuel price rises to 0.74 €/litre, as in 2008, the decrease in fuel use is not enough to compensate the increasing costs due to fuel price, and the economic performance will still be negative. The trade4off between fuel efficiency and productivity shows that CPUE should not decrease by more than 6% to maintain the current economic performance, and 10% to maintain the 2008 economic outcome. If considering the 200442006 fuel price, the average investments per vessel can be at most equal to 165,000 € for improvements in hull and 67,000 €s for new engines. At the 2008 fuel price, these amounts rise to 273,000 € for investments in hull and 111,000 € in engine. Finally, the scenario of fuel saving for vessels operating with passive gears would change the break4even fuel price from 2.50 to 3.13 €/litre. A so high margin for fuel price depends on the low incidence of fuel costs on the value of landings for those vessels. This fleet segment shows the lowest trade4off between fuel efficiency and production efficiency. In this case, in order to keep the economic situation as it is now, CPUE should not be reduced by more than 2% at 200442006 fuel price, and 3% at 2008 fuel price. Given the low capital share of small scale vessels, a 20% saving in the fuel consumption can be implemented if the additional investments are at most 11,000 € in hull and 4,5000 € in engine if considering the baseline period. Based on the 2008 fuel price, the maximum investment should not be higher than 17,000 € in hull and 7,000 € in engine. These investments will produce an increase in capital costs of around 550 and 850 €s respectively.
Table 4455: Potential of 20% fuel savings (average per vessels)
Fleet segment Break4even
fuel price
(€/l)
Break4even
fuel costs
(1000 €)
Trade4off with
CPUE
(TOR)
Change in capital
costs
Maximum
investment in hull
Maximum
investment in
engine
200446 2008 200446 2008 200446 2008 200446 2008

Report Number C002/08 89 of 425
Bottom trawlers
24440m
0.59 128.99 0.94 0.91 16.89 26.07 336.2
6
519.0
9
137.2
5
211.8
7
Pelagic trawlers
24440m
1.43 207.87 0.97 0.95 8.97 15.86 178.5
3
315.7
2
72.87 128.8
7
Beam trawlers 124
24m
0.52 61.55 0.94 0.90 8.28 13.70 164.7
9
272.8
2
67.26 111.3
5
Passive gears
<12m
3.13 21.51 0.98 0.97 0.55 0.85 10.96 16.85 4.47 6.88
4.6.5 Scenarios for future fuel prices
Even if all fleet segments are negatively affected by an increase in fuel price, those starting from a negative performance and showing a high incidence of fuel costs on the value of production, like bottom trawlers and beam trawlers, are affected more than others. For the bottom trawlers a 50% increase in fuel price produces a reduction in gross value added of around 27%. This percentage rises to 40% for an increase in fuel price of 75%, and almost 54% when the fuel price is double the current value. Net loss for this fleet segment would change from 338,000 € to 14 million € in the first scenario, 21 in the second scenario, and 28 in the third one. Crew share also would decrease producing very damaging effects from a social point of view. The reduction for this variable would be at least of 19%, as reported in the less negative scenario. Very similar results are registered in the simulations for the beam trawlers. In this case, the deterioration of gross value added and crew share results worse than the bottom trawlers ones. Pelagic trawlers and vessels operating with passive gears, which are characterised by a lower incidence of fuel costs on the production value, are less affected by changes in fuel price. Starting from a positive economic performance in the period 200442006, both fleet segments would still produce positive net profits even when the fuel price increases by 100%. However, the simulations show significant reductions in net profits, particularly for the pelagic trawlers. Actually, for this fleet segment, increasing fuel price would produce a decrease in net profit varying from 29% in the scenario 1 to 58% in scenario 3. Relevant reductions can be seen also for crew share which decreases by 11% in the first scenario, and almost 22% in the third one. The same percentages of deterioration estimated for the passive gear vessels confirm that this fleet segment is the most energy efficient. Net profit would decrease at most by 24% when the fuel price is equal to twice the current one. Under the same hypothesis, crew share would be reduced by 12% and gross value added by 15%.
Table 4456: Absolute consequences of fuel price change (1000 €, segment total)
Fleet segment Scenario 1: PFU+50% Scenario 2: PFU+75% Scenario 3: PFU+100%
Gross
value
added
Crew
share
Net profit Gross
value
added
Crew
share
Net profit Gross
value
added
Crew
share
Net profit
Bottom trawlers
24440m
58,650 32,574 414,341 47,824 28,749 421,342 36,997 24,924 428,344
Pelagic trawlers
24440m
13,494 7,137 2,425 12,666 6,798 1,935 11,837 6,459 1,446
Beam trawlers 124
24m
5,111 3,036 41,692 3,925 2,591 42,433 2,739 2,146 43,175
Passive gears
<12m
237,357 102,757 96,836 227,537 99,472 90,301 217,717 96,187 83,766
Table 4457: Relative consequences of fuel price change (% of the baseline situation)
Fleet segment Scenario 1: PFU+50% Scenario 2: PFU+75% Scenario 3: PFU+100%
Gross Crew Net profit Gross Crew Net profit Gross Crew Net profit

Report Number C002/08 90 of 425
value
added
share (net loss) value
added
share (net loss) value
added
share (net loss)
Bottom trawlers 244
40m
426.96% 419.02% (4146.16
%)
440.45% 428.53% (6219.24
%)
453.93% 438.04% (8292.32
%)
Pelagic trawlers 244
40m
410.94% 48.68% 428.76% 416.41% 413.02% 443.14% 421.88% 417.36% 457.52%
Beam trawlers 124
24m
431.70% 422.67% (709.89%) 447.56% 434.00% (1064.83
%)
463.41% 445.33% (1419.78
%)
Passive gears
<12m
47.64% 46.01% 411.89% 411.46% 49.01% 417.84% 415.28% 412.02% 423.78%
4.6.6 Economic consequences of technical adaptations
4.6.6.1 Bottom trawlers 24440m Loa Adaptation 1: The first adaptation, applied to the reference vessel defined as “bottom trawlers 24440m”, consists in a new design for the Italian bottom trawl. This new design, which includes a new high strength material and larger meshes in net areas, should determine a reduction in fuel consumption. The new material is a polyethylene fibre (Dyneema, commercially called Rubitech©). More details can be found in Section 5.8.2.1. Adaptation 2: The second adaptation also deals with the reference vessel belonging to the fleet segment “bottom trawlers 24440m”. This adaptation consists in towing multiple trawl rigs. This fishing method already practiced in many other countries has been only recently introduced in Italy. In a number of Italian fisheries, an increase in catch rates is expected by this adaptation. More details can be found in Section 5.8.3.1. Adaptation 3: The reference vessel is fitted with a fixed pitch propeller (FPP). Fitting a controllable pitch propeller (CPP) was investigated as an alternative.
Table 4458: Technical adaptations of bottom trawlers 24440m Loa (average per vessels)
Indicator Technical adaptations (See Chapter 6)
Base line
Adapt. 1 Adapt. 2 Adapt. 3
Technical information
Fuel saving in % to annual fuel use 9 0 4.5
Estimated investments (1000 €) 1.5 3 30
Estimated impact on CPUE (%) 45 30 0
Calculated consequences
BE (Maximum) investment (1000 €) 37.67 30.88
PFU 2008 (€/l) 0.739 0.739
BE PFU (at estimated investment) 0.515 0.473
BE PFU (at 50% of BE4investment)
CPUE 200442006 (kg/kW4day) 0.808 0.808
BE CPUE (at estimated investment) 0.793 0.811
BE CPUE (at 50% BE4investment)
Economic indicators (per vessel)
Value of landings in 1000 € 473.85 473.85 473.85
Fuel costs 130.57 119.47 124.69

Report Number C002/08 91 of 425
Indicator Technical adaptations (See Chapter 6)
Base line
Adapt. 1 Adapt. 2 Adapt. 3
Other variable costs 56.06 56.06 56.06
Repair and maintenance 24.66 24.66 24.66
Fixed costs 20.45 20.45 20.45
Crew share 121.28 125.20 123.35
Capital costs 121.86 122.15 125.55
Net profit 41.02 5.87 40.91
Gross cash flow 120.84 128.02 124.64
Gross value added 242.12 253.22 247.99
Economic indicators (segment
total)
Value of landings in 1000 € 157,161 157,161 157,161
Fuel costs 43,305 39,624 41,357
Other variable costs 18,595 18,595 18,595
Repair and maintenance 8,177 8,177 8,177
Fixed costs 6,781 6,781 6,781
Crew share 40,223 41,524 40,912
Capital costs 40,417 40,512 41,641
Net profit 4338 1,948 4302
Gross cash flow 40,079 42,460 41,339
Gross value added 80,303 83,984 82,251
Adaptation 1: The technological adaptation described above would produce a decrease in fuel consumption of 9% with an investment cost estimated in 1,500 € per vessel. Moreover, the use of the new fishing net for bottom trawlers should not determine any change in productivity, i.e. CPUE would not decline. The effects of this improvement on the economic indicators are reported in the table above. Value of landings is not affected by this adaptation as the CPUE is constant. Instead, a decrease in fuel costs from around 130 to 120,000 € per vessel is registered as a consequence of the fuel saving. The necessary investment to implement this improvement would produce an unimportant increase in capital costs. As a consequence, the overall effect on the economic performance is particularly positive. The net result per vessel would change from a loss of 1,000 € to a profit of almost 6,000. A positive result is registered also in terms of crew share which increases from 121 to 125,000 € per vessel. The break4even investment cost, which indicates the maximum feasible cost for the implementation of the specific technological adaptation, equals 37,670 € per vessel. As this value is very much higher than the estimated investment, the technical improvement can be considered very convenient from an economic point of view. In order to maintain the profitability of this investment, CPUE should not fall below 0.793. However, the technical adaptation would not produce any changes in productivity. Notwithstanding these positive results, it should be highlighted that the analysis is based on the fuel price registered in the period 200442006. When considering the 2008 fuel price, the good effects of this adaptation are not sufficient to produce a positive economic performance for the bottom trawlers. Actually, the break4even fuel price for a vessel modified with the suggested improvement is equal to 0.515 €/litre. As this level is lower than 0.739 €/litre, the fuel price estimated for 2008, the economic performance would still be negative also using the new fishing net. Adaptation 2: The second adaptation cannot be simulated as changes in fuel consumption are not produced. An increase in landings of around 30% at the same level of fishing effort can be very useful in reducing effort and then fuel consumption where fisheries are managed by quota system. This is not the case for Mediterranean fisheries.
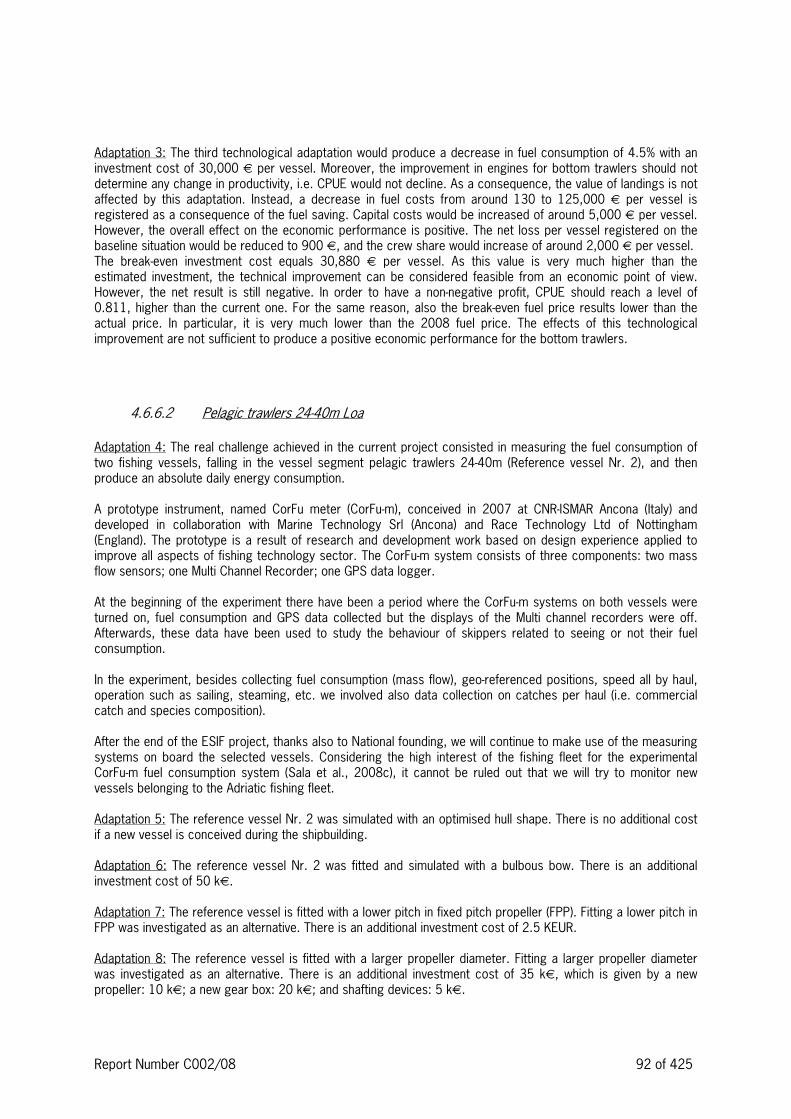
Report Number C002/08 92 of 425
Adaptation 3: The third technological adaptation would produce a decrease in fuel consumption of 4.5% with an investment cost of 30,000 € per vessel. Moreover, the improvement in engines for bottom trawlers should not determine any change in productivity, i.e. CPUE would not decline. As a consequence, the value of landings is not affected by this adaptation. Instead, a decrease in fuel costs from around 130 to 125,000 € per vessel is registered as a consequence of the fuel saving. Capital costs would be increased of around 5,000 € per vessel. However, the overall effect on the economic performance is positive. The net loss per vessel registered on the baseline situation would be reduced to 900 €, and the crew share would increase of around 2,000 € per vessel. The break4even investment cost equals 30,880 € per vessel. As this value is very much higher than the estimated investment, the technical improvement can be considered feasible from an economic point of view. However, the net result is still negative. In order to have a non4negative profit, CPUE should reach a level of 0.811, higher than the current one. For the same reason, also the break4even fuel price results lower than the actual price. In particular, it is very much lower than the 2008 fuel price. The effects of this technological improvement are not sufficient to produce a positive economic performance for the bottom trawlers.
4.6.6.2 Pelagic trawlers 24440m Loa Adaptation 4: The real challenge achieved in the current project consisted in measuring the fuel consumption of two fishing vessels, falling in the vessel segment pelagic trawlers 24440m (Reference vessel Nr. 2), and then produce an absolute daily energy consumption. A prototype instrument, named CorFu meter (CorFu4m), conceived in 2007 at CNR4ISMAR Ancona (Italy) and developed in collaboration with Marine Technology Srl (Ancona) and Race Technology Ltd of Nottingham (England). The prototype is a result of research and development work based on design experience applied to improve all aspects of fishing technology sector. The CorFu4m system consists of three components: two mass flow sensors; one Multi Channel Recorder; one GPS data logger. At the beginning of the experiment there have been a period where the CorFu4m systems on both vessels were turned on, fuel consumption and GPS data collected but the displays of the Multi channel recorders were off. Afterwards, these data have been used to study the behaviour of skippers related to seeing or not their fuel consumption. In the experiment, besides collecting fuel consumption (mass flow), geo4referenced positions, speed all by haul, operation such as sailing, steaming, etc. we involved also data collection on catches per haul (i.e. commercial catch and species composition). After the end of the ESIF project, thanks also to National founding, we will continue to make use of the measuring systems on board the selected vessels. Considering the high interest of the fishing fleet for the experimental CorFu4m fuel consumption system (Sala et al., 2008c), it cannot be ruled out that we will try to monitor new vessels belonging to the Adriatic fishing fleet. Adaptation 5: The reference vessel Nr. 2 was simulated with an optimised hull shape. There is no additional cost if a new vessel is conceived during the shipbuilding. Adaptation 6: The reference vessel Nr. 2 was fitted and simulated with a bulbous bow. There is an additional investment cost of 50 k€. Adaptation 7: The reference vessel is fitted with a lower pitch in fixed pitch propeller (FPP). Fitting a lower pitch in FPP was investigated as an alternative. There is an additional investment cost of 2.5 KEUR. Adaptation 8: The reference vessel is fitted with a larger propeller diameter. Fitting a larger propeller diameter was investigated as an alternative. There is an additional investment cost of 35 k€, which is given by a new propeller: 10 k€; a new gear box: 20 k€; and shafting devices: 5 k€.

Report Number C002/08 93 of 425
Table 4459: Technical adaptations of pelagic trawlers 24440m Loa (average per vessels)
Indicator Technical adaptations (See Chapter 6)
Base line
Adapt. 4 Adapt. 5 Adapt. 6 Adpat. 7 Adpat. 8
Technical information
Fuel saving in % to annual fuel use 10 22 6 0.9 4
Estimated investments (1000 €) 5.5 50 2.5 35
Estimated impact on CPUE (%) 0 0 0 0 0
Calculated consequences
BE (Maximum) investment (1000 €) 19.98 53.56 3.28 14.57
PFU 2008 (€/l) 0.739 0.739 0.739 0.739
BE PFU (at estimated investment) 1.259 1.193 1.152 1.150
BE PFU (at 50% of BE4investment)
CPUE 200442006 (kg/kW4day) 5.887 5.887 5.887 5.887
BE CPUE (at estimated investment) 4.310 4.370 4.371 4.422
BE CPUE (at 50% BE4investment)
Economic indicators (per vessel)
Value of landings in 1000 € 513.11 513.11 513.11 513.11 513.11
Fuel costs 75.90 68.31 71.35 75.22 72.87
Other variable costs 55.96 55.96 55.96 55.96 55.96
Repair and maintenance 19.59 19.59 19.59 19.59 19.59
Fixed costs 14.68 14.68 14.68 14.68 14.68
Crew share 178.98 182.09 180.84 179.26 180.22
Capital costs 90.06 91.29 92.57 90.36 94.36
Net profit 77.94 81.19 78.12 78.04 75.43
Gross cash flow 168.00 172.48 170.69 168.40 169.79
Gross value added 346.98 354.57 351.53 347.66 350.01
Economic indicators (segment
total)
Value of landings in 1000 € 22,406 22,406 22,406 22,406 22,406
Fuel costs 3,314 2,983 3,116 3,285 3,182
Other variable costs 2,444 2,444 2,444 2,444 2,444
Repair and maintenance 856 856 856 856 856
Fixed costs 641 641 641 641 641
Crew share 7,815 7,951 7,897 7,828 7,870
Capital costs 3,932 3,986 4,042 3,946 4,121
Net profit 3,403 3,545 3,411 3,408 3,294
Gross cash flow 7,336 7,532 7,453 7,354 7,414
Gross value added 15,151 15,483 15,350 15,181 15,284
Adaptation 4: This technological adaptation for pelagic trawlers 24440m would produce a decrease in fuel consumption of 10% with an investment cost estimated in 5,500 € per vessel. Moreover, the use of the new electronic fuel measurement system does not produce any change in productivity. The new system would reduce

Report Number C002/08 94 of 425
fuel costs of 7,500€ per vessel, and increase capital costs of around 1,300€. This would determine a positive effect on net profit, increasing from 3,403 to 3,545,000 €, and on crew share, increasing from 7,815 to 7,951,000 €. The break4even investment cost, which indicates in this simulation the maximum feasible cost for the implementation of new electronic equipments, is around 20,000 € per vessel. As this value is almost four times the estimated investment, the technical improvement can be considered convenient from an economic point of view. In order to maintain the profitability of this investment, CPUE should not fall below 4.310. However, the technical adaptation would not produce any changes in productivity. The break4even fuel price, estimated at 1.259 €/litre, is higher than the price foreseen for 2008. Therefore, for this fleet segment the risk of negative profits due to an increase in fuel price is very low. However, this adaptation can be useful for a further reduction in this type of risk. Adaptation 5: This adaptation is not simulated as it is based on new vessels. The simulations should be based on the hypothesis of a replacement of the entire fleet. In this case, investment costs for the implementation of this adaptation should be equal to the value of a new fleet. Adaptation 6: This technological adaptation would produce a decrease in fuel consumption of 6% with a cost of 50,000 € per vessel. Also this technological improvement would not produce any change in productivity. The modification of the hull would reduce fuel costs of around 4,500€ per vessel. The associated increase in capital costs would be of just 2,500€ per vessel. In this case, the positive effect of the adaptation is estimated in 180€ per vessel on net profit, and in less than 1.000€ on crew share. The break4even investment cost, associated in this simulation to the maximum investment in hull, is 53.56 thousand € per vessel. This value is just above the estimated investment. Therefore, the investment is economically acceptable, but the advantages produced would be very limited. The break4even CPUE is estimated at 4.370, while the break4even fuel price is 1.193€/litre. Like the other adaptations, productivity should not be affected by this technological improvement. As the fuel price for 2008 is estimated at 0.739€/litre, there is not a risk of negative profit for this fleet segment. Adaptation 7: This technological adaptation for pelagic trawlers 24440m would produce a decrease in fuel consumption of less than 1% with an investment cost estimated in 2,500 € per vessel. The improvement of the engine would not produce any change in productivity. The new engine would not have a significant effect neither on fuel costs nor on capital costs. As a consequence, also the positive effect on net profit and crew share is very low. Nevertheless, the break4even investment cost, estimated in 3,280€ per vessel, is higher than the investment cost. Therefore, the technical improvement is feasible from an economic point of view. The break4even CPUE should not fall below 4.371 to have a positive profit. However, the technical adaptation would not produce any changes in productivity. The break4even fuel price, estimated at 1.152 €/litre, is higher than the price foreseen for 2008. Adaptation 8: This technological adaptation would produce a decrease in fuel consumption of 4% with an investment cost estimated in 35,000 € per vessel. The improvement in the vessel engine would not produce change in productivity, but a reduction of around 3,000€ per vessel in fuel costs. Notwithstanding, the increase in capital costs due to the new investment is of 4,300€. This would determine a negative effect on net profit, decreasing from 3,403 to 3,294 thousand €, while crew share shows a very low increase. The negative effect produced by this adaptation is highlighted also by the break4even investment cost. As this indicator, estimated in 14.570€, is lower than the cost of the new investment, this adaptation is not profitable.
4.6.6.3 List of national studies 4 publications related to fuel efficiency in fisheries 4

Report Number C002/08 95 of 425
4.7 The Netherlands
4.7.1 Role of energy for individual fleet segments
The Dutch beam trawl fleet is generally divided into three segments based primarily on the size of the vessels in question, the segments are beam trawlers (TBB) 12424m, TBB 24440m and TBB 40m and larger. Combined, the segments account for approximately 60% of the total fuel consumption for the national fishery. Table 4460 and 6.2 present a summary of the principle technical characteristics of the segments for years 2004 to 2006, the latest year for which data is complete. Table 4461 refers to averages per vessel. From the tables it is clear that the largest beam trawlers use the most fuel absolutely and per vessel. On average, those ships have engines which are around twice as powerful as the TBB 24440 segment and over eight times as powerful as the TBB 12424 segment. As a group, they consume three times the amount of fuel as the segment beam trawlers 24440 and five times as much as the beam trawlers 12424 segment. Although the beam trawlers 12424 dominate in terms of the number of vessels, they consume the least fuel by far per ship.
Table 4460: Summary of technical parameters, average 200442006 (segment totals)
Fleet segment Number of vessels Total engine power
(1000 kW)
Total crew Total effort
(1000 kW4days)
Fuel use
(1000 litre) TBB 12424m 195 37.556 507 4,232 31,644 TBB 24440m 49 45.956 246 7,147 51,544 TBB >40m 95 159.615 588 28,940 149,712
Table 4461: Summary of technical parameters, average 200442006 (average per vessel)
Fleet segment Engine power
(kW)
Crew Effort
(1000 kW4days)
Fuel use
(1000 litre)
TBB 12424m 192.59 3 21.70 162 TBB 24440m 937.88 5 144.87 1045 TBB >40m 1680.16 6 304.63 1570 As can be seen in the following Table 4462 and Table 4463 average net profits for each of the segments are negative. Fuel costs clearly consume a large percentage of the value of landings in each segment, reaching a high of around 40% in the case of segment TBB >40 compared to 20% for segment TBB 12424 and 36% for TBB 24440.
Table 4462: Summary of the economic parameters, average 200442006 (segment totals, 1000 €)
Fleet segment Value of landings Fuel costs Crew share Gross value added Net profit TBB 12424m 56,277 10,856 19,648 25,929 44,037 TBB 24440m 47,614 17,152 11,397 17,265 42,377 TBB >40m 126,955 50,133 27,708 42,953 44,220
Table 4463: Summary of the economic parameters, average 200442006 (average per vessel, 1000 €)
Fleet segment Value of landings Fuel costs Crew share Gross value added Net profit TBB 12424m 289 56 100 133 421 TBB 24440m 972 350 233 352 449 TBB >40m 1336 528 291 452 444

Report Number C002/08 96 of 425
Figure 4423 shows that overall fuel use in the larger segments has consistently fallen, while use in segment beam trawlers 12424 rose until around 2004, fell for around a year, and then began to rise again in last year. A large%age of the total decline in fuel use can be attributed to the decline in the number of vessels in each segment. In addition, the average use of fuel per vessel has also declined, although not as much as overall fuel use. About 25% of the vessels (especially large beam trawlers) have installed fuelm s and cruise control which together have reduced fuel use in those vessels by about 10%. Figure 4424 dramatically demonstrates the recent increase in fuel prices. The average price of fuel for the first six months of 2008 is approximately double the average for years 2004 to 2006.
Figure 4423: Trends in value of landings and fuel use, (segment totals)
Figure 4424: Development of fuel price in €/ltr , 20042008 (first 6 months)
4.7.2 Break4even analysis
In this section, break4even analyses are performed in order to determine the effect of fuel prices on the performance of a segment. Three scenarios will be presented: determination of the break4even price for fuel; determination of the break4even costs of fuel (these two scenarios are very closely related); and, determination of a break4even catch per unit of effort. The results of these scenarios will be presented for the three segments identified above.
4.7.2.1 Beam trawlers 12424m As can be seen in the first column of Table 4464, the segment beam trawl 12424m made on average a net loss of 4 million € in the period 200442006. The column “Breakeven price of fuel” shows that, all other things equal, the fuel price needs to decline significantly for this sector to break4even, specifically, it needs to reach 119 € per thousand litres, a decline of 65%. In other words, at a price of 119 € per thousand litres, net profit would be zero. The third column shows a similar calculation in terms of fuel costs, fuel costs would have to fall from 10,856 € to 3,740 €. Another way to for this segment to break4even would be to increase the catch per unit of effort, where effort is defined as kW multiplied by the number of days a sea. To break4even, the catch per unit of effort would have to increase from 4.34 to 4.89 or around 12%. Finally, the last columns shows that the doubling of the average fuel prices for the first six months of 2008 compared to the average for 200442006, implies that the price of fuel is currently about six times higher than the break4even price found in column two. As expect, all

Report Number C002/08 97 of 425
else equal, the higher price also negatively impact net profits and gross value added as well. They are, respectively, negative 10 million and 14.8 million €.
Table 4464: Break4even evaluation (Status quo / present situation) – TBB 12424m (segment total, Economic indicators 1000€)
Indicator Situation 200446 Fuel price
2008
Base line
Break4even
price of fuel
Break4even
fuel costs
Break4even
catch / unit of
effort
Changing Cells:
Price of fuel (€/tonne) 344 119 344 344 695
Fuel costs (1000 €) 10,856 3,740 3,740 10,856 21,926
Catch / unit of effort (tonne) 4.34 4.34 4.34 4.89 4.34
Result Cells:
Change in fuel consumption 1 1 1 1 1
Value of landings 56,277 56,277 56,277 63,392 56,277
Fuel costs 10,856 3,740 3,740 10,856 21,926
Crew share 19,648 22,726 22,726 22,726 14,856
Net profit -4,037 0 0 0 -10,319
Break4even production value 70,813 56,277 56,276 63,392 118,395
Gross value added 25,929 33,045 33,045 33,045 14,859
Gross value added / man 51 65 65 65 29
Crew share / man 39 45 45 45 29

Report Number C002/08 98 of 425
4.7.2.2 Beam trawlers 24440m The segment beam trawl 24440m made on average a net loss of 2.3 million € in the period 200442006. As before, taking all other costs and revenues as constant, the fuel price in this segment should decline from 338 € per thousand litres to 263 € per thousand litres, a decline of 22%. The total fuel costs in this sector would then decline from 17.1 million to 13.3 million €. Assuming fuel prices stay at their current level, the segment should increase its catch per unit of effort by 8% in order to break4even. This would increase the total value of production of the sector to 51.4 million €. The increase in fuel prices for 2008 means that price of fuel is currently over 2.5 times the break4even fuel price, the result is that net profits have decreased to negative 13 million €.
Table 4465: Break4even evaluation (Status quo / present situation) – TBB 24440m (segment total, Economic indicators 1000€)
Indicator Situation 200446 Fuel price
2008
Base line Break4even
price of fuel
Break4even
fuel costs
Break4even
catch / unit of
effort
Changing Cells:
Price of fuel (€/tonne) 338 263 338 338 682
Fuel costs (1000 €) 17,152 13,354 13,354 17,152 34,646
Catch / unit of effort (tonne) 1.55 1.55 1.55 1.67 1.55
Result Cells:
Change in fuel consumption 1 1 1 1 1
Value of landings 47,614 47,614 47,614 51,411 47,614
Fuel costs 17,152 13,354 13,354 17,152 34,646
Crew share 11,397 12,818 12,818 12,818 4,852
Net profit -2,377 0 0 0 -13,326
Break4even production value 57,593 47,614 47,614 51,411 1,670,802
Gross value added 17,265 21,062 21,062 21,062 -230
Gross value added / man 70 86 86 86 -1
Crew share / man 46 52 52 52 20
4.7.2.3 Beam trawlers 40m and larger The segment beam trawlers 40m and larger had an average net loss of 4.2 million € in the period 200442006. For this segment to break4even the price of fuel should decline by 13.3% from 337 € per thousand litres of fuel to 292 € per thousand litres. The total fuel costs for this segment would then decline from 50 million € to 43.5 million €. If the fuel price remains at its current level the catch per unit of effort should increase with 5% for the segment to break4even. The current fuel price in 2008 is around twice the break4even price of fuel, such a price would put net profits at negative 37 million €.

Report Number C002/08 99 of 425
Table 4466: Break4even evaluation (Status quo / present situation) – TBB >40m (segment total, Economic indicators 1000€)
Indicator Situation 200446 Fuel price
2008
Base line Break4even
price of fuel
Break4even
fuel costs
Break4even
catch / unit of
effort
Changing Cells:
Price of fuel (€/tonne) 337 292 337 337 680
Fuel costs (1000 €) 50,133 43,532 43,532 50,133 101,269
Catch / unit of effort (tonne) 1.36 1.36 1.36 1.43 1.36
Result Cells:
Change in fuel consumption 1 1 1 1 1
Value of landings 126,955 126,955 126,955 133,556 126,955
Fuel costs 50,133 43,532 43,532 50,133 101,269
Crew share 27,708 30,089 30,089 30,089 9,264
Net profit -4,220 0 0 0 -36,913
Break4even production value 145,589 126,955 126,955 133,556 -1,062,431
Gross value added 42,953 49,553 49,553 49,553 -8,183
Gross value added / man 73 84 84 84 -14
Crew share / man 47 51 51 51 16
4.7.3 Factors determining energy efficiency
There are several methods of defining fuel efficiency, namely, litres of fuel used per kilogram fish caught and fuel costs as percentage of the value of fish caught. Factors that will influence these figures include the size of the vessel, engine size and the age of the vessel and engine. However, given the large variance within segments, as shown in the figures below, it is difficult to generalize fuel efficiency even at the segment level.
Table 4467: Fuel efficiency
Fleet
segment
Litres/kg Fuel costs as
% of value
Gear Vessel size
(GT)
Engine size
(kW)
Average
vessel age
Average
engine age TBB 12424 1.7 19.3% TBB 61.5 192.6 33.89 10.07 TBB 24440 4.7 36.0% TBB 243.5 931.5 24.89 10.41 TBB >40 3.8 39.5% BTT 468.8 1,674.3 14.25 11.05 Finally, the scatter diagrams illustrate the variance within segments.

Report Number C002/08 100 of 425
Fuel use and catch valume
0
50
100
150
200
250
300
350
400
450
500
0 50 100 150 200 250
Volume of catch (tonnes)
Fuel u
se (to
nnes
)
Fuel use and catch value
0
50
100
150
200
250
300
350
400
450
500
0 200 400 600 800 1000 1200 1400
Value of catch (1000 €)
Fuel u
se (to
nnes
)
Fuel use / catch value and engine size
0
200
400
600
800
1000
1200
1400
1600
1800
280 285 290 295 300 305
Enigne size (kW)
Fuel u
se /
cat
ch value
(tonnes
/10
00€)
Fuel use and fishing effort
0
50
100
150
200
250
300
350
400
450
500
0 10 20 30 40 50 60 70
Fishing effort (kW-days)
Fuel u
se (to
nnes
)
Figure 4425: Beam trawlers 12424m 4 Energy efficiency of individual vessels
Fuel use and catch valume
0
500
1000
1500
2000
2500
0 100 200 300 400 500
Volume of catch (tonnes)
Fuel u
se (to
nnes
)
Fuel use and catch value
0
500
1000
1500
2000
2500
0 500 1000 1500 2000 2500 3000 3500
Value of catch (1000 €)
Fuel u
se (to
nnes
)
Fuel use / catch value and engine size
0
200
400
600
800
1000
1200
1400
0 500 1000 1500 2000 2500 3000
Enigne size (kW)
Fuel u
se /
cat
ch value
(tonnes
/10
00€)
Fuel use and fishing effort
0
500
1000
1500
2000
2500
0 100 200 300 400 500 600
Fishing effort (kW-days)
Fuel u
se (to
nnes
)
Figure 4426: Beam trawlers 24440m 4 Energy efficiency of individual vessels

Report Number C002/08 101 of 425
Fuel use and catch valume
0
500
1000
1500
2000
2500
3000
0 200 400 600 800 1000
Volume of catch (tonnes)
Fuel u
se (to
nnes
)
Fuel use and catch value
0
500
1000
1500
2000
2500
3000
0 500 1000 1500 2000 2500 3000 3500
Value of catch (1000 €)
Fuel u
se (to
nnes
)
Fuel use / catch value and engine size
0
200
400
600
800
1000
1200
0 1000 2000 3000 4000 5000
Enigne size (kW)
Fuel u
se /
cat
ch value
(tonnes
/10
00€)
Fuel use and fishing effort
0
500
1000
1500
2000
2500
3000
0 200 400 600 800 1000
Fishing effort (kW-days)
Fuel u
se (to
nnes
)
Figure 4427: Beam trawlers >40 4 Energy efficiency of individual vessels
4.7.4 Economic potential for technological improvement
A technology that increases fuel efficiency, while all else remained equal, would clearly cause fuel costs to decrease and thereby yield greater net profits. In this section the effects of a hypothetical 20% fuel savings technology are presented. An increase in fuel efficiency due to technological change would increase the potential break4even price of fuel. However, in comparison to the average 200442006 fuel prices in each of the segments, an increase in fuel efficiency will not be enough to raise the break4even price above the average fuel prices 200442006 for beam trawlers 12424 and 24440. This can be seen in the first column of Table 4468 below, recall that the 200442006 average price of fuel for each of the segments was about 340 €. A 20% reduction in fuel use will lower the break4even price to 148, 329 and 365 € for segments TBB 12424, 24440 and >40m respectively. Clearly, the only segment which would achieve a price below the “real” price is the segment >40m, fuel prices in the other two segments will still be too high to break4even. Table 4468 also shows the maximum investment in the hull and the engine which is allowed before the savings of the lower energy use are offset by the higher capital costs (of the increased investments). In essence, the table shows the highest amount that a technological change can cost and still be economical. The comparison between the 200442006 averages and 2008 prices shows, not surprisingly, that investments in 2008 can be much higher and still cover the costs of an investment.

Report Number C002/08 102 of 425
Table 4468: Potential of 20% fuel savings (average per vessels)
Fleet
segment
Break4even
fuel price
(€/l)
Break4even
fuel costs
(1000 €)
Trade4off with CPUE
(TOR)
Change in capital
costs
Maximum
investment in hull
Maximum
investment in
engine
200446 2008 200446 2008 200446 2008 200446 2008 TBB 12424m 148 3,740 .96 .92 6.32 12.8 95.0 192 46.5 93.9 TBB 24440m 329 13,354 .93 .85 43.8 88.5 659.2 1,332 322.5 651.4 TBB >40m 365 43,532 .92 .84 67.5 136.3 1,015 2,051 496.6 1,003
4.7.5 Scenarios for future fuel prices
Table 4469 shows the consequences of three scenarios in which the price of fuel increases by 50%, 75% and 100%. The scenarios chosen are conservative in that they actually under estimate the increases in fuel prices experienced during the first six months of 2008. The story the tables tell is a consistently bleak one, net profits in all segments are negative and large. Gross value added and crew share fall precipitously as well, and gross valued added is actually negative in the last scenario in the case of trawlers larger than 40m! The results of Table 4470 speak for themselves, net profits fall dramatically across the table. Similarly, both gross value added and crew share fall at levels that can be expected to profoundly disrupt the sector. Of course, recent events confirm the potential for large increases in fuel prices to lead to unrest in fisheries.
Table 4469: Absolute consequences of fuel price change (1000 €, segment total)
Fleet
segment
Scenario 1: PFU+50% Scenario 2: PFU+75% Scenario 3: PFU+100%
Gross
value
added
Crew
share
Net profit Gross
value
added
Crew
share
Net profit Gross
value
added
Crew
share
Net profit
TBB 12424 20,502 17,300 47,117 17,788 16,127 48,657 15,074 14,953 410,197 TBB 24440 8,689 8,189 47,744 4,401 6,584 410,427 113 4,980 413,111 TBB >40 17,886 18,667 420,246 5,353 14,146 428,258 47,181 9,626 436,272
Table 4470: Relative consequences of fuel price change (% of the baseline situation)
Fleet Scenario 1: PFU+50% Scenario 2: PFU+75% Scenario 3: PFU+100%
segment Gross
value
added
Crew
share
Net profit Gross
value
added
Crew
share
Net profit Gross
value
added
Crew
share
Net profit
TBB 12424 421% 412% 476% 431% 418% 4114% 442% 424% 4153% TBB 24440 450% 428% 4226% 475% 442% 4339% 499% 456% 4452% TBB >40 458% 433% 4380% 488% 449% 4570% 4116% 465% 4759%
4.7.6 Economic consequences of technical adaptations
The economic effects of eight technological adaptations to a beam trawler of the class 24440m were examined, The main economic impacts of each adaptation are briefly discussed below. Comparisons were done in relation4ship to 2008 fuel prices with all other variables kept constant at 200442006 level. Adaptation 1. The first adaptation is a reduction in gear drag resulting from the use of a hydrofoil and lighter chains. Potential fuel savings were estimated to be 7.3% while costs were estimated to be 10,000 € per ship and the impact on landings per unit of effort were estimated to be 75% of the original landings. Two analyses were conducted, one without the reduction in landings per unit of effort and the other including the reduction.

Report Number C002/08 103 of 425
Adaptation 1a: Without the reduction in catch per unit of effort, this adaptation results in a slight improvement in net profit. The increase in fuel savings is large enough to offset higher capital costs. Correspondingly, the break4even price of fuel can be higher and catch per unit of effort can be lower than the base case. Adaptation 1b: Demonstrates the very negative consequences of a 25% reduction in catch per unit of effort. The increase pushes net profits significantly lower and results in an unrealistically low break4even price of fuel. This is clearly not an economical adaptation. Adaptation 2: The second adaption concerns a pulse trawl operating at lower towing speeds. The potential savings in fuel are enormous, estimated to be somewhere between 35 and 45% (the analysis was conducted assuming savings of 40%). Again, the analysis is run using both without and with the reduction in catch per unit of effort. Adaptation 2a: Without the change in catch per unit of effort, the adaptation has a positive effect on net profits (although not enough to raise profits above zero). The interesting feature of this scenario is the fact that a very large decrease in fuel consumption more than offsets the high initial investment costs. The analysis as it stands is pessimistic because it includes the high annual costs of running the new machinery; these costs are expected to decrease with experience. Adaptation 2b: Inclusion of the estimated reduction in landings of 22.5% renders this adaptation economically unfeasible. Net revenues fall further and the break4even price of fuel goes to zero. Adaptation 3a: The adaptation involves a change in the propeller diameter and use of “std” gear, and results in fuel savings of 8.61% given an investment of 96,350 € per ship. Impacts on landing are unknown and assumed to be zero thereby overestimating the positive impact of this adaptation. A decrease in fuel consumption of 8.61% more than offsets the higher capital costs needed to implement the adaptation, making this a “profitable” adaptation or better said, an adaptation resulting in fewer losses. This is reflected in the lower catch per unit needed to break4even in comparison to the base case. Adaptation 3b: The adaptation is as 3a, but replaces “std” gear with “HydroRig”. Impacts on landings are unknown and assumed to be zero, thereby overestimating the positive impact of this adaptation. This adaptation results in even greater estimated fuel savings and, consequently, even greater financial improvements than 3a. Both of these adaptations appear to be economically viable. Adaptation 4a: This adaptation involves a reduction in steaming speed using “std” gear. The small increase in fuel savings (0.87%) does not offset the reduction in catch per unit of effort. This can be seen by the resulting reduction in net revenues. Adaptation 4b: The same as 4a, but the reduction is accomplished using “HydroRig” and an investment. The slightly larger reduction in fuel use in comparison to 4a is accomplished with an investment of 10,000 €. The economic results for 4a and 4b are similar, both lead to slightly greater losses. However, if fuel prices were to rise significantly, even these small reductions in fuel consumption could be economical. Adaptation 5a: The same as 4a except that towing speed is reduced using “std” gear. The improvement has very significant positive economic impacts. The improvements can be seen in smaller net losses, a smaller break4even catch per unit of effort, and a higher break4even price for fuel. Adaptation 5b: Is the same a 5a except it involves “HydroRig” and a small investment. This adaptation is even more economical than 5a. The larger savings in fuel consumption more than offset the small investment needed. Net profits improve remarkably and break4even profits and catch per unit of effort rise and fall accordingly.

Report Number C002/08 104 of 425
Table 4471: Technical adaptations of Segment 24440m, (Economic indicators in 1000€)
Indicator Technical adaptations (See Chapter 6)
Base line
Adapt. 1a Adapt. 1b Adapt. 2a Adapt. 2b
Technical information
Fuel saving in % to annual fuel use 7.3 7.3 40 40
Estimated investments (1000 €) 10 10 440 440
Estimated impact on CPUE (%) 0 75 0 77.5
Calculated consequences
BE (Maximum) investment (1000 €) 32.3 32.3 177.0 177.0
PFU 2008 (€/l) 683
BE PFU (at estimated investment) 263 280 28 199 0
BE PFU (at 50% of BE4investment)
CPUE 2008 (kg/kW4day) 2.24
BE CPUE (at estimated investment) 2.16 2.16 2.03 2.03
BE CPUE (at 50% BE4investment)
Economic indicators (per vessel)
Value of landings 972 972 729 972 753
Fuel costs 707 655 655 424 424
Other variable costs 75 75 75 78 78
Repair and maintenance 83 83 83 83 83
Fixed costs 112 112 112 112 112
Crew share 99 118 27 205 123
Capital costs 168 170 170 258 258
Net profit 4272 4242 4394 4188 4352
Gross cash flow 4104 471.4 4223 70.2 466.6
Gross value added 44.69 47 4196 275 56
Economic indicators (segment total)
Value of landings 47,614 47,614 35,710 47,614 36,901
Fuel costs 34,646 32,117 32,117 20,788 20,788
Other variable costs 3,658 3,658 3,658 3,808 3,808
Repair and maintenance 4,067 4,067 4,067 4,067 4,067
Fixed costs 5,472 5,472 5,472 5,472 5,472
Crew share 4,852 5,798 1,344 10,037 6,029
Capital costs 8,244 8,344 8,344 12,658 12,658
Net profit -13,326 -11,843 -19,292 -9,217 -15,921
Gross cash flow 45082 43499 410949 3442 43263
Gross value added 4230 2299 49604 13479 2766

Report Number C002/08 105 of 425
Table 4471 continued Technical adaptations (See Chapter 6)
Base line
Adapt. 3a Adapt. 3b Adapt. 4a Adapt. 4b
Technical information
Fuel saving in % to annual fuel use 8.61 15.35 0.87 0.94
Estimated investments (1000 €) 96.35 96.35 0 10
Estimated impact on CPUE (%) n/a n/a 97.5 97.5
Calculated consequences
BE (Maximum) investment (1000 €) 38.1 67.9 3.8 4.2
PFU 2008 (€/l) 683
BE PFU (at estimated investment) 263 254 275 242 239
BE PFU (at 50% of BE4investment)
CPUE 2008 (kg/kW4day) 2.24
BE CPUE (at estimated investment) 2.20 2.12 2.23 2.24
BE CPUE (at 50% BE4investment)
Economic indicators (per vessel)
Value of landings in 1000 € 972 972 972 947 947
Fuel costs 707 646 599 701 700
Other variable costs 75 75 75 75 75
Repair and maintenance 83 83 83 83 83
Fixed costs 112 112 112 112 112
Crew share 99 122 140 92 92
Capital costs 168 188 188 168 170
Net profit 4272 4254 4224 4283 4285
Gross cash flow 4104 465.6 435.8 4115 4115
Gross value added 44.69 56 104 423 422
Economic indicators (segment total)
Value of landings in 1000 € 47,614 47,614 47,614 46,424 46,424
Fuel costs 34,646 31,663 29,328 34,345 34,321
Other variable costs 3,658 3,658 3,658 3,658 3,658
Repair and maintenance 4,067 4,067 4,067 4,067 4,067
Fixed costs 5,472 5,472 5,472 5,472 5,472
Crew share 4,852 5,968 6,842 4,519 4,528
Capital costs 8,244 9,211 9,211 8,224 8,344
Net profit -13,326 -12,425 -10,964 -13,882 -13,967
Gross cash flow -5,082 -3,215 -1,753 -5,638 -5,623
Gross value added -230 2,753 5,088 -1,119 -1,094
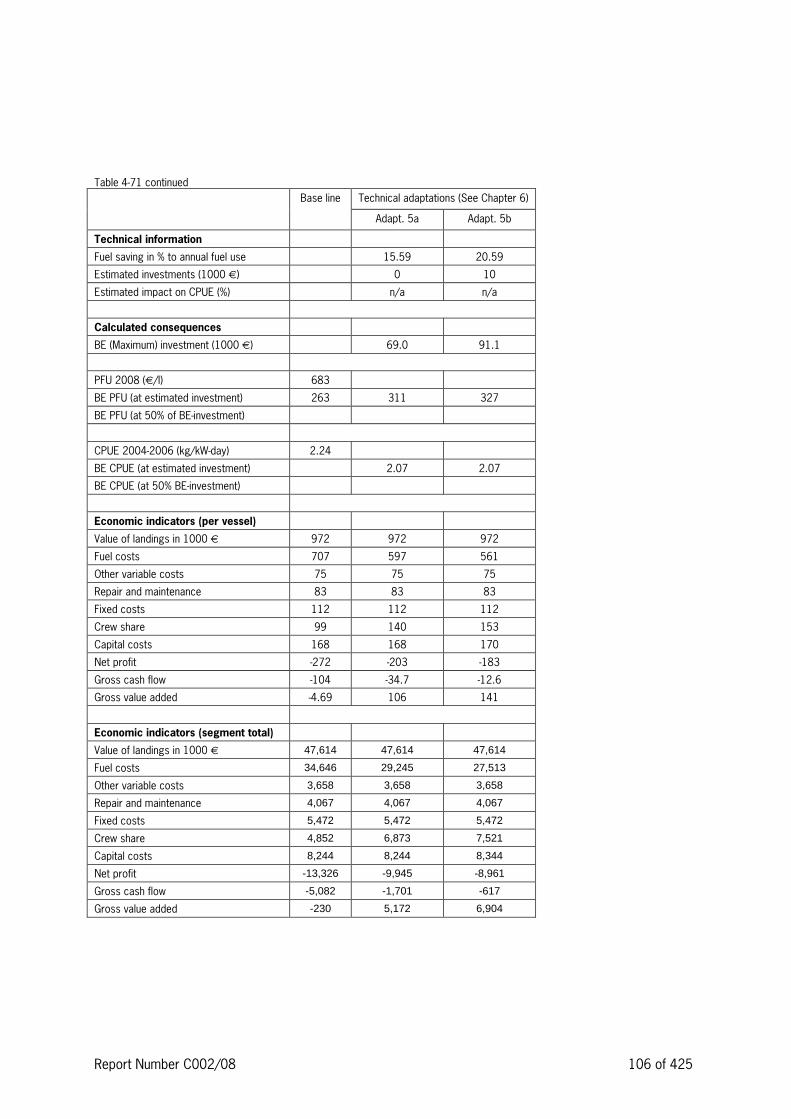
Report Number C002/08 106 of 425
Table 4471 continued Technical adaptations (See Chapter 6)
Base line
Adapt. 5a Adapt. 5b
Technical information
Fuel saving in % to annual fuel use 15.59 20.59
Estimated investments (1000 €) 0 10
Estimated impact on CPUE (%) n/a n/a
Calculated consequences
BE (Maximum) investment (1000 €) 69.0 91.1
PFU 2008 (€/l) 683
BE PFU (at estimated investment) 263 311 327
BE PFU (at 50% of BE4investment)
CPUE 200442006 (kg/kW4day) 2.24
BE CPUE (at estimated investment) 2.07 2.07
BE CPUE (at 50% BE4investment)
Economic indicators (per vessel)
Value of landings in 1000 € 972 972 972
Fuel costs 707 597 561
Other variable costs 75 75 75
Repair and maintenance 83 83 83
Fixed costs 112 112 112
Crew share 99 140 153
Capital costs 168 168 170
Net profit 4272 4203 4183
Gross cash flow 4104 434.7 412.6
Gross value added 44.69 106 141
Economic indicators (segment total)
Value of landings in 1000 € 47,614 47,614 47,614
Fuel costs 34,646 29,245 27,513
Other variable costs 3,658 3,658 3,658
Repair and maintenance 4,067 4,067 4,067
Fixed costs 5,472 5,472 5,472
Crew share 4,852 6,873 7,521
Capital costs 8,244 8,244 8,344
Net profit -13,326 -9,945 -8,961
Gross cash flow -5,082 -1,701 -617
Gross value added -230 5,172 6,904

Report Number C002/08 107 of 425
4.7.6.1 List of national studies 4 publications related to fuel efficiency in fisheries Depestele, J., H. Polet, H. Stouten, K. Van Craeynest, E. Vanderperren, and B. Verschueren, 2007. Is there a way out for the beam trawler fleet with rising fuel prices? ICES CM 2007/ M:06
Heijer, W.M. den & B. Keus (2005) Bestaande vistuigen als mogelijk alternatief voor de boomkor. Rapport RIKZ 2001.037 (Existing gears as a possible alternative for beam trawl)
Klok, A., K. Taal and J.W. de Wilde, 2006. Praktijkproef pulskor: Uitkomsten en economische haalbaarheid. Interim rapport LEI. (Practice trial pulse beam trawl)
Oostenbrugge, Hans van, Rik Beukers, Kees Taal, 2008. De economische positie van de kottervisserij en de effecten van de hoge olieprijs. Interim rapport LEI.
Salz, P., E. Hoefnagel, M. Bavinck, L. Hoex, J. Bokhorst, A. Blok. en J. Quaedvlieg, 2008. Maatschappelijke gevolgen van de achteruitgang in de visserij (Social impact of the decline in the fishery sector), Den Haag, LEI, 2008, Rapport 20084020; ISBN /EAN 97849048615424649

Report Number C002/08 108 of 425
4.8 Belgium
4.8.1 Role of energy for individual fleet segments
The Belgian fisheries fleet is divided into 3 segments, large beam trawlers (TBB, 24440 m and > 662 kW), small beam trawlers or eurobeamers (TBB, < 24 m and < 221 kW) and a third class containing intermediary beam trawlers (a declining group of older vessels), otter trawlers and gillnetters. Due to the nature of their fishery, beam trawlers are suffering most from the increasing fuel prices. Therefore, only the first two segments will be considered in the framework of this study. Table 4472 presents a summary of the main technical characteristics of the segments for years 2004 to 2006, the latest year for which data is complete. Table 4417 refers to averages per vessel.
Table 4472: Summary of technical parameters, average 200442006 (segment totals)
Fleet segment Number of vessels Total engine power
(1000 kW)
Total crew Total effort
(1000 kW4days)
Fuel use
(1000 litre)
TBB, 24440m 50 45 293 10.896 52.600
TBB, 12424m 56 12 123 1.915 13.881
Table 4473: Summary of technical parameters, average 200442006 (average per vessel)
Fleet segment Engine power
(kW)
Crew Effort
(1000 kW4days)
Fuel use
(1000 litre)
TBB, 24440m 892 5,8 216 1.045
TBB, 12424m 214 2,2 34 246
The net profit of both segments is negative (Table 4474, Table 4475). For the large beam trawlers, 33% of the landings is spent on fuel costs and 24% for the eurobeamers.
Table 4474: Summary of the economic parameters, average 200442006 (segment totals, 1000 €)
Fleet segment Value of landings Fuel costs Crew share Gross value added Net profit
TBB, 24440m 65225 21391 19258 25638 47149
TBB, 12424m 23461 5645 7017 10481 41028
Table 4475: Summary of the economic parameters, average 200442006 (average per vessel, 1000 €)
Fleet segment Value of landings Fuel costs Crew share Gross value added Net profit
TBB, 24440m 1295 425 383 509 4142
TBB, 12424m 416 100 125 186 418
Figure 4428 shows that in both segments fuel consumption has continuously decreased from 2002 till now. This decrease reflects a reduction of the number of vessels over this period. In spite of this decrease in fuel consumption, rising fuel prices have caused fuel costs to increase. Figure 4429 demonstrates the recent increase in fuel prices. After reaching a minimum of 0,25 € in 2002, the fuel price has risen a staggering 160% to 0,65 € over a six year period.

Report Number C002/08 109 of 425
Figure 4428: Trends in value of landings and fuel use, (segment totals)
Figure 4429: Development of fuel price in €/ltr until 2008 (first 648 months)
4.8.2 Break4even analysis
In this section, break4even analyses are performed in order to determine the effect of fuel prices on the performance of a segment. Three scenarios will be presented: determination of the break4even price for fuel; determination of the break4even costs of fuel (these two scenarios are very closely related); and, determination of a break4even catch per unit of effort. The results of these scenarios will be presented for both segments identified above.
4.8.2.1 Large beam trawlers As a segment, the large beam trawlers made an average net loss of 7 million € over the period 200442006 (Table 4476). The break4even fuel price analysis (column 2) shows that the fuel price needs to drop to 271 € per thousand litres (4 34%) for the segment to reach break4even. At the current fuel prices, an increase in fuel efficiency of 34% (column 3) or an increase of catch efficiency of 16% (column 4) would be needed for the segment to reduce its net losses to zero. With the 2008 fuel price of 650 € per thousand litres (column 5), the net losses of the segment increase to 20 million €. At this point, the variable costs exceed the revenues. In other words, at the current fuel price, it would make more sense for the large beam trawlers to stay in port than to go out fishing.

Report Number C002/08 110 of 425
Table 4476: Break4even evaluation (Status quo / present situation) – Large beam trawlers (segment total)
Indicator Situation 200446 Fuel price
2008
Base line Break4even
price of fuel
Break4even
fuel costs
Break even
catch / unit of
effort
Changing Cells:
Price of fuel (€/tonne) 407 271 407 407 650
Fuel costs (1000 €) 21.390 14.242 14.242 21.390 34.190
Catch / unit of effort (tonne) 1,458 1,458 1,458 1,685 1,458
Result Cells:
Change in fuel consumption 1 1 0,66 1 1
Value of landings 65.225 65.225 65.225 75.369 65.225
Fuel costs 21.391 14.242 14.242 21.391 34.190
Crew share 19.258 19.258 19.258 22.254 19.258
Net profit 47.149 0 0 0 419.948
Break even production value 106.925 65.225 65.225 75.369 na
Gross value added 25.638 32.787 32.787 35.782 12.838
Gross value added / man 88 112 112 122 44
Crew share / man 66 66 66 76 66
4.8.2.2 Eurobeamers As a segment, the large beam trawlers made an average net loss of 1 million € over the period 200442006 (Table 4477). The break4even fuel price analysis (column 2) shows that the fuel price needs to drop to 333 € per thousand litres (4 18%) for the segment to reach break4even. At the current fuel prices, an increase in fuel efficiency of 18% (column 3) or an increase of catch efficiency of 6% (column 4) would be needed for the segment to reduce its net losses to zero. With the 2008 fuel price of 650 € per thousand litres (column 5), the net losses of the segment increase to 4,4 million €. Contrary to the large beam trawlers, the landings remain higher than the variable costs. In order to break even, the segment would have to raise its production value by 148%. With the present state of fish stocks, this is hardly possible.
Table 4477: Break4even evaluation (Status quo / present situation) – Eurobeamers (segment total)
Indicator Situation 200446 Fuel price
2008
Base line
Break4even
price of fuel
Break4even
fuel costs
Break even
catch / unit of
effort
Changing Cells:
Price of fuel (€/tonne) 407 333 407 407 650
Fuel costs (1000 €) 5.645 4.617 4.617 5.645 9.023
Catch / unit of effort (tonne) 2,338 2,338 2,338 2,484 2,338
Result Cells:
Change in fuel consumption 1 1 0,82 1 1
Value of landings 23.461 23.461 23.461 24.927 23.461

Report Number C002/08 111 of 425
Indicator Situation 200446 Fuel price
2008
Base line
Break4even
price of fuel
Break4even
fuel costs
Break even
catch / unit of
effort
Fuel costs 5.645 4.617 4.617 5.645 9.023
Crew share 7.017 7.017 7.017 7.455 7.017
Net profit 41.028 0 0 0 44.405
Break even production value 27.725 23.461 23.461 24.927 68.845
Gross value added 10.481 11.509 11.509 11.947 7.103
Gross value added / man 85 93 93 97 58
Crew share / man 57 57 57 60 57
4.8.3 Factors determining energy efficiency
• Fuel efficiency can be defined as: Litres fuel / kg of fish and/or Fuel costs as % of value of landings. • Determining factors can be: Gear, Vessel size (GT), Engine size (kW), Vessel age, Engine age. • This can be summarized in the following table. Table 4478 illustrates the fuel efficiency for both segments. In spite of the large differences in size and power between both segments, there is little difference in the amount of fuel spent to catch one kg of fish. Nonetheless, the eurobeamers appear to use less fuel in comparison to the landing value. This is due to a higher average fish price caused by a higher proportion of sole in the catch composition.
Table 4478: Fuel efficiency
Fleet
segment
Litres/kg Fuel costs as
% of value
Gear Vessel size
(GT)
Engine size
(kW)
Average
vessel age
Average
engine age
TBB, 24440m 3,31 33 % TBB 319 892 19 na
TBB, 12424m 3,10 24 % TBB 76 214 29 na
4.8.4 Economic potential for technological improvement
This section deals with the results of the model when the CFC factor is reduced from 1.0 (present situation) to for example 0.8, i.e. 20% improvement in fuel efficiency can be achieved with technological adjustments. The different estimates presented until this section were calculated with the assumption that there were no change in the fuel consumption pattern. If we assume that the vessels may improve their fuel efficiency by 20% with several technological adjustments, the segments break even at higher fuel prices (338 and 416 € per thousand litres respectively) and the net losses of the eurobeamers are turned into a profit at the 200442006 fuel price (Table 4423). However, both break4even fuel prices are still lower than the current fuel price of 650 € per thousand litres. The fuel savings by a 20% increase in fuel efficiency can pay off an investment that is required to achieve this increase (Table 4479). The maximum investment in the hull or the engine that can be financed by the fuel cost

Report Number C002/08 112 of 425
reduction is calculated. It is clear that at the higher 2008 fuel price, the savings are higher and the maximum investment is higher, enabling the vessel owner to contemplate major modifications to the vessel (e.g. gear changes).
Table 4479: Potential of 20% fuel savings (average per vessels)
Fleet
segment
Break4
even fuel
price
(€/l)
Break4
even fuel
costs
(1000 €)
Trade4off with CPUE
(TOR)
Change in capital
costs
(1000 €)
Maximum
investment in hull
(1000 €)
Maximum
investment in
engine (1000 €)
200446 2008 200446 2008 200446 2008 200446 2008
TBB, 244
40m
338 14.242 93 % 90 % 59,9 95,7 901,3 1440,6 440,9 704,7
TBB, 124
24m
416 4.617 95 % 92 % 14,0 22,5 211,4 337,8 103,4 165,3
4.8.5 Scenarios for future fuel prices
The previous calculations have been based on the 200442006 average fuel price of 407 € per thousand litres. Since then, fuel prices have risen considerably to 650 € per thousand litres over the first half of 2008. In order to evaluate the future economic performance of both segments, 3 scenarios are set up based on a fuel price increases of 50%, 75% and 100% . The 2008 fuel price corresponds to an increase of 60%. Results of these scenarios are presented in Table 4480 and Table 4481. It is clear for both segments that net losses will increase dramatically under all three scenarios. Unlike many counties, the Belgian crew share is calculated solely on the landings without a correction for the fuel costs. Hence, the crew share does not change under the different scenarios.
Table 4480: Absolute consequences of fuel price change (1000 €, segment total)
Fleet
segment
Scenario 1: PFU+50% Scenario 2: PFU+75% Scenario 3: PFU+100%
Gross
value
added
Crew
share
Net profit Gross
value
added
Crew
share
Net profit Gross
value
added
Crew
share
Net profit
TBB, 244
40m
14.942 19.258 417.844 9.595 19.258 423.192 4.247 19.258 428.540
TBB, 124
24m
7.658 7.017 43.850 6.247 7.017 45.261 4.836 7.017 46.673
Table 4481: Relative consequences of fuel price change (% of the baseline situation)
Fleet segment Scenario 1: PFU+50% Scenario 2: PFU+75% Scenario 3: PFU+100%
Gross
value
added
Crew
share
Net profit Gross
value
added
Crew
share
Net profit Gross
value
added
Crew
share
Net profit
TBB, 24440m 442 % 4 4150 % 463 % 4 4224 % 483 % 4 4299 %
TBB, 12424m 427 % 4 4275 % 440 % 4 4412 % 454 % 4 4549 %
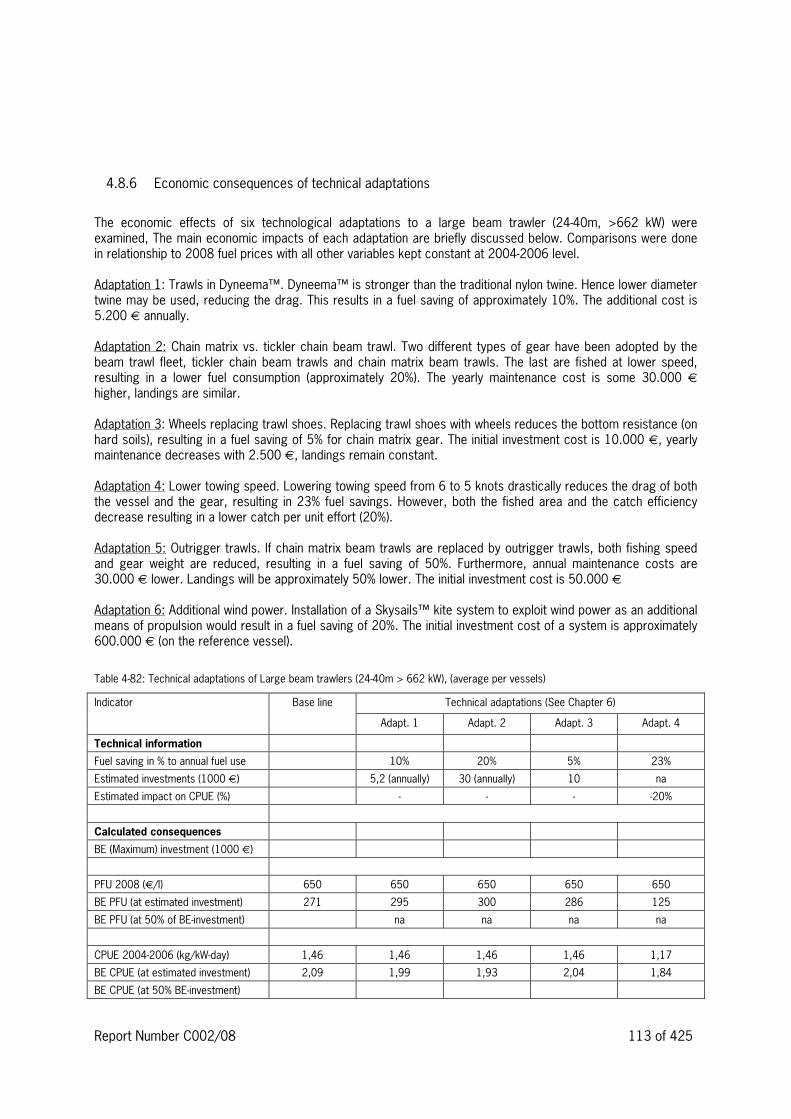
Report Number C002/08 113 of 425
4.8.6 Economic consequences of technical adaptations
The economic effects of six technological adaptations to a large beam trawler (24440m, >662 kW) were examined, The main economic impacts of each adaptation are briefly discussed below. Comparisons were done in relationship to 2008 fuel prices with all other variables kept constant at 200442006 level. Adaptation 1: Trawls in Dyneema™. Dyneema™ is stronger than the traditional nylon twine. Hence lower diameter twine may be used, reducing the drag. This results in a fuel saving of approximately 10%. The additional cost is 5.200 € annually. Adaptation 2: Chain matrix vs. tickler chain beam trawl. Two different types of gear have been adopted by the beam trawl fleet, tickler chain beam trawls and chain matrix beam trawls. The last are fished at lower speed, resulting in a lower fuel consumption (approximately 20%). The yearly maintenance cost is some 30.000 € higher, landings are similar. Adaptation 3: Wheels replacing trawl shoes. Replacing trawl shoes with wheels reduces the bottom resistance (on hard soils), resulting in a fuel saving of 5% for chain matrix gear. The initial investment cost is 10.000 €, yearly maintenance decreases with 2.500 €, landings remain constant. Adaptation 4: Lower towing speed. Lowering towing speed from 6 to 5 knots drastically reduces the drag of both the vessel and the gear, resulting in 23% fuel savings. However, both the fished area and the catch efficiency decrease resulting in a lower catch per unit effort (20%). Adaptation 5: Outrigger trawls. If chain matrix beam trawls are replaced by outrigger trawls, both fishing speed and gear weight are reduced, resulting in a fuel saving of 50%. Furthermore, annual maintenance costs are 30.000 € lower. Landings will be approximately 50% lower. The initial investment cost is 50.000 € Adaptation 6: Additional wind power. Installation of a Skysails™ kite system to exploit wind power as an additional means of propulsion would result in a fuel saving of 20%. The initial investment cost of a system is approximately 600.000 € (on the reference vessel).
Table 4482: Technical adaptations of Large beam trawlers (24440m > 662 kW), (average per vessels)
Indicator Technical adaptations (See Chapter 6)
Base line
Adapt. 1 Adapt. 2 Adapt. 3 Adapt. 4
Technical information
Fuel saving in % to annual fuel use 10% 20% 5% 23%
Estimated investments (1000 €) 5,2 (annually) 30 (annually) 10 na
Estimated impact on CPUE (%) 4 4 4 420%
Calculated consequences
BE (Maximum) investment (1000 €)
PFU 2008 (€/l) 650 650 650 650 650
BE PFU (at estimated investment) 271 295 300 286 125
BE PFU (at 50% of BE4investment) na na na na
CPUE 200442006 (kg/kW4day) 1,46 1,46 1,46 1,46 1,17
BE CPUE (at estimated investment) 2,09 1,99 1,93 2,04 1,84
BE CPUE (at 50% BE4investment)
Report Number C002/08 114 of 425
Indicator Technical adaptations (See Chapter 6)
Base line
Adapt. 1 Adapt. 2 Adapt. 3 Adapt. 4
Economic indicators (per vessel)
Value of landings in 1000 € 1.296 1.296 1.296 1.296 1.037
Fuel costs 679 611 543 645 523
Other variable costs 107 107 107 107 107
Repair and maintenance 159 165 191 157 159
Fixed costs 95 95 95 95 95
Crew share 383 383 383 383 306
Capital costs 269 269 269 271 269
Net profit 4369 4334 4292 4362 4423
Gross cash flow 4100 465 423 491 4154
Gross value added 255 317 359 292 152
Economic indicators (segment
total)
Value of landings in 1000 € 65.225 65.225 65.225 62.225 52.180
Fuel costs 34.190 30.771 27.352 32.481 26.327
Other variable costs 5.378 5.378 5.378 5.378 5.378
Repair and maintenance 8.016 8.293 9.617 7.883 8.016
Fixed costs 4.802 4.802 4.802 4.802 4.802
Crew share 19.258 19.258 19.258 19.258 15.407
Capital costs 13.528 13.528 13.528 13.630 13.528
Net profit 419.948 416.806 414.711 418.208 421.278
Gross cash flow 46.420 43.278 41.183 44.578 7.750
Gross value added 12.838 15.980 18.075 14.681 7.657
Table 3481 continued Indicator Technical adaptations (See Chapter 6)
Base line
Adapt. 5 Adapt. 6
Technical information
Fuel saving in % to annual fuel use 50% 20%
Estimated investments (1000 €) 50 600
Estimated impact on CPUE (%) 450% 4
Calculated consequences
BE (Maximum) investment (1000 €)
PFU 2008 (€/l) 650 650 650
BE PFU (at estimated investment) 271 na 241
BE PFU (at 50% of BE4investment)
CPUE 200442006 (kg/kW4day) 1,46 0,73 1,46
BE CPUE (at estimated investment) 2,09 1,51 2,01
BE CPUE (at 50% BE4investment)
Economic indicators (per vessel)
Value of landings in 1000 € 1.296 648 1.296
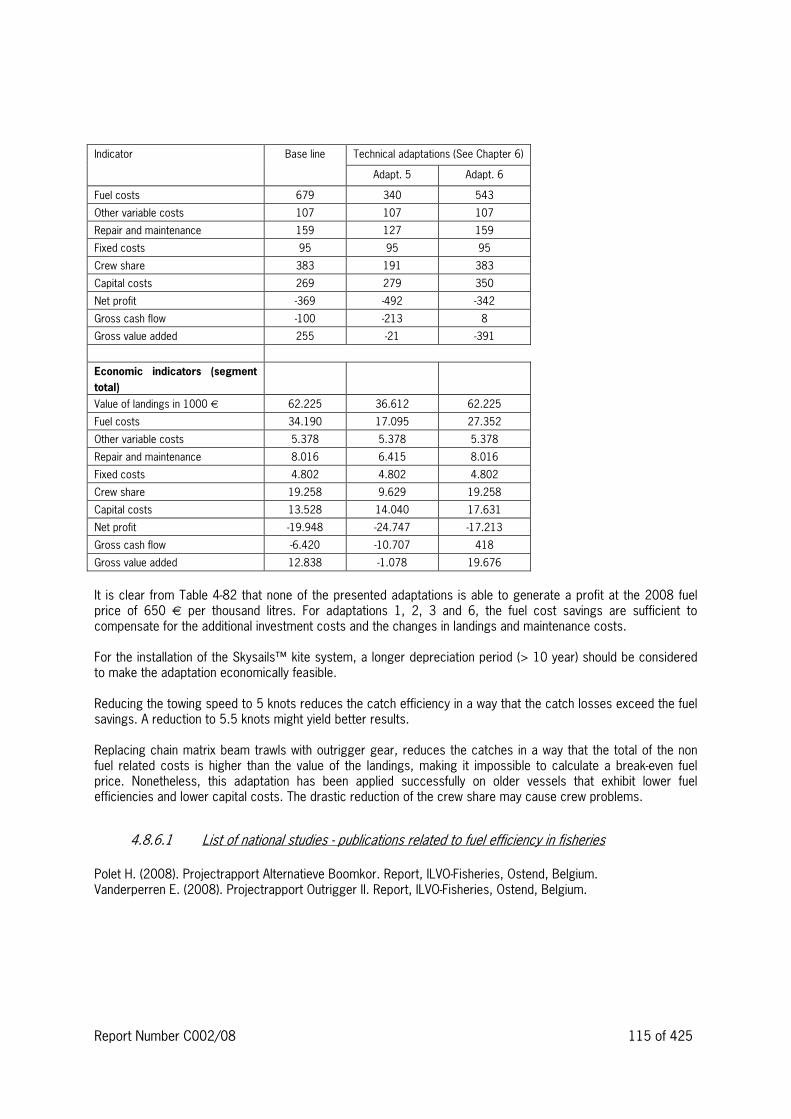
Report Number C002/08 115 of 425
Indicator Technical adaptations (See Chapter 6)
Base line
Adapt. 5 Adapt. 6
Fuel costs 679 340 543
Other variable costs 107 107 107
Repair and maintenance 159 127 159
Fixed costs 95 95 95
Crew share 383 191 383
Capital costs 269 279 350
Net profit 4369 4492 4342
Gross cash flow 4100 4213 8
Gross value added 255 421 4391
Economic indicators (segment
total)
Value of landings in 1000 € 62.225 36.612 62.225
Fuel costs 34.190 17.095 27.352
Other variable costs 5.378 5.378 5.378
Repair and maintenance 8.016 6.415 8.016
Fixed costs 4.802 4.802 4.802
Crew share 19.258 9.629 19.258
Capital costs 13.528 14.040 17.631
Net profit 419.948 424.747 417.213
Gross cash flow 46.420 410.707 418
Gross value added 12.838 41.078 19.676
It is clear from Table 4482 that none of the presented adaptations is able to generate a profit at the 2008 fuel price of 650 € per thousand litres. For adaptations 1, 2, 3 and 6, the fuel cost savings are sufficient to compensate for the additional investment costs and the changes in landings and maintenance costs. For the installation of the Skysails™ kite system, a longer depreciation period (> 10 year) should be considered to make the adaptation economically feasible. Reducing the towing speed to 5 knots reduces the catch efficiency in a way that the catch losses exceed the fuel savings. A reduction to 5.5 knots might yield better results. Replacing chain matrix beam trawls with outrigger gear, reduces the catches in a way that the total of the non fuel related costs is higher than the value of the landings, making it impossible to calculate a break4even fuel price. Nonetheless, this adaptation has been applied successfully on older vessels that exhibit lower fuel efficiencies and lower capital costs. The drastic reduction of the crew share may cause crew problems.
4.8.6.1 List of national studies 4 publications related to fuel efficiency in fisheries Polet H. (2008). Projectrapport Alternatieve Boomkor. Report, ILVO4Fisheries, Ostend, Belgium. Vanderperren E. (2008). Projectrapport Outrigger II. Report, ILVO4Fisheries, Ostend, Belgium.

Report Number C002/08 116 of 425
4.9 United Kingdom The five segments selected for this study are: • beam trawlers 24440m, • demersal trawlers and seiners 12424m, • demersal trawlers and seiners 24440m, • demersal trawlers and seiners over 40m, • pelagic trawlers over 40m. The different indicators describing the fleet were estimated from the data collected for the Economic Survey of the UK Fishing Fleet. Some assumptions were made: • when data are missing for a particular boat, they are replaced by the average of the segment; • annual fuel consumptions are estimated by dividing the annual fuel costs by the mean fuel price observed
by SEAFISH in different UK ports; • the “pelagic trawl over 40m” segment is only described for 2006, as no data were available for 2004 and
2005.
4.9.1 Role of energy for individual fleet segments
The five segments represented an average of 682 vessels and 2,906 crew between 2004 and 2006. This constitutes only 11% of the vessels and 22% of the fishermen registered in the UK fishing fleet during this period. However, their total capacity account for 67% of the UK fishing gross tonnage. Due to fuel4intensive fishing method, these segments present also high level of fuel use (see Table 4483 and Table 4484).
Table 4483: Summary of technical parameters, average 200442006 (segment totals)
Fleet segment
Number of
vessels
Total engine
power
(1000 kW)
Total crew Total effort
(1000 kW4days)
Fuel use
(1000 litre)
Beam trawl 24440m 56 44 291 8,932 41,925 Demersal trawl seine 12424m 479 129 1,340 16,014 91,818 Demersal trawl seine 24440m 107 69 747 16,586 68,134 Demersal trawl seine over 40m 12 22 192 5,510 27,990 Pelagic trawl over 40m 28 119 336 11,637 16,864
Table 4484: Summary of technical parameters, average 200442006 (average per vessel)
Fleet segment
Engine power
(kW)
Crew Effort
(1000 kW4days)
Fuel use
(1000 litre) Beam trawl 24440m 778 5.2 159 744 Demersal trawl seine 12424m 270 2.8 33 192 Demersal trawl seine 24440m 647 7.0 155 637 Demersal trawl seine over 40m 1817 16.4 459 2,399 Pelagic trawl over 40m 4,244 12.0 416 602 The aggregated landings for these five segments were €533 million per year over the 200442006 period, representing approximately 64% of the value landed by the UK fleet over the same period. With an average of €92 millions per year, they also account for 83% of the total fuel expenditure for the UK fishing fleets (see Table 4485). For three of our segments (beam trawlers 24440m, demersal trawlers and seiners 12424m, demersal trawlers and seiners 24440m), the average net profits per vessel were at the limit of profitability between 2004 and 2006, with respectively an average net profit of 4€39,000 per vessel for the beam trawlers, of 4€15,000 per vessel for the demersal trawlers 12424m and of €11,000 per vessel for the demersal trawlers 24440m.

Report Number C002/08 117 of 425
The demersal trawlers over 40m show a level of deficit more important with an average net profit of 4€378,000 per vessel. Even with high fuel prices, the large pelagic trawlers remain largely profitable with an average net profit of €2.1 millions (see Table 4486).
Table 4485: Summary of the economic parameters, average 200442006 (segment totals, 1000 €)
Fleet segment Value of
landings
Fuel costs Crew share Gross value
added
Net profit
Beam trawl 24440m 41,359 15,408 9,377 10,967 41,074 Demersal trawl seine 12424m 162,670 33,762 51,134 56,999 47,210 Demersal trawl seine 24440m 110,369 24,984 28,869 37,050 1,175 Demersal trawl seine over 40m 40,447 10,135 11,905 12,379 44,414 Pelagic trawl over 40m 178,043 7,474 27,590 110,780 48,806
Table 4486: Summary of the economic parameters, average 200442006 (average per vessel, 1000 €)
Fleet segment Value of
landings
Fuel costs Crew share Gross value
added
Net profit
Beam trawl 24440m 734 274 166 175 439 Demersal trawl seine 12424m 339 70 107 119 415 Demersal trawl seine 24440m 1,031 233 270 346 11 Demersal trawl seine over 40m 3,467 869 1,020 1,061 4378 Pelagic trawl over 40m 6,359 267 985 3,956 2,134 From 2000 to 2002, the annual fuel price slightly decreased from €281 per tonne to €232 per tonne. Between 2003 and 2006, the annual fuel prices has almost doubled in UK ports, from €235 per tonnes in 2003 to €443 per tonne in 2006. On an annual basis, it remained stable in 2007 at a level of €445 per tonne (see Fig. 2). However, these annual prices hide a high intra4annual variability: the weekly fuel price fluctuated between €391 per tonne and €493 per tonne during 2006, between €344 per tonne and €565 per tonne during 2007. With an annual fuel price which could reach €650 per tonne in 2008, the fuel price would have almost tripled in UK since 2003. In the meantime, the four segments for which data are available from 2004 and 2006 have slightly decreased their fuel use during this period, mitigating the rise of fuel price (Figure 4431). This decrease is mainly explained by a reduction of the days at sea spent by the different segments.

Report Number C002/08 118 of 425
Beam trawl 24-40m
0
10
20
30
40
50
2004 2005 2006
mln
Euro
0
10,000
20,000
30,000
40,000
50,000
1000
litres
Value of landings Fuel costs Fuel use (1000 l)
Demersal trawl seine 12-24m
0
50
100
150
200
250
2004 2005 2006
mln
Euro
75,000
80,000
85,000
90,000
95,000
100,000
1000
litres
Value of landings Fuel costs Fuel use (1000 l)
Demersal trawl seine over 40m
0
20
40
60
80
100
120
140
2004 2005 2006
mln
Euro
0
10,000
20,000
30,000
40,000
50,000
60,000
70,000
80,000
1000
litres
Value of landings Fuel costs Fuel use (1000 l)
Demersal trawl seine over 40m
0
10
20
30
40
50
60
2004 2005 2006
mln
Euro
0
5,000
10,000
15,000
20,000
25,000
30,000
35,000
1000
litres
Value of landings Fuel costs Fuel use (1000 l)
Figure 4430: Trends in value of landings and fuel use, (segment totals)
United Kingdom
0.000
0.100
0.200
0.300
0.400
0.500
0.600
0.700
2000 2001 2002 2003 2004 2005 2006 2007 2008
Figure 4431: Development of fuel price in €/ltr until 2008 (first 648 months)

Report Number C002/08 119 of 425
4.9.2 Break4even analysis
4.9.2.1 Beam trawl 24440m During the period under study, the beam trawlers present a slight deficit which could be reduced by a decrease in fuel price to €331 per tonne. An increase in fuel efficiency by 11% (against average of 200446) would allow the segment to reach the break4even point. An improvement of 40% would be required against the fuel price observed in December 2007. By increasing their catch per unit of effort ratio of 4%, these trawlers would reach the equilibrium with an average fuel price of €372 per tonne (see Table 4487).
Table 4487: Break4even evaluation (Status quo / present situation) – Beam Trawl 24440m (segment total, Economic indicators 1000€)
Indicator Situation 200446 Fuel price
2008
Base line
Break4even
price of fuel
Break4even
fuel costs
Break even
catch / unit of
effort
Changing Cells:
Price of fuel (€/tonne) 372 331 372 372 650
Fuel costs (1000 €) 15,408 15,408 13,726 15,408 26,954
Catch / unit of effort (tonne) 1.555 1.555 1.555 1.618 1.555
Result Cells:
Change in fuel consumption 1.000 1.000 0.891 1.000 1.000
Value of landings 41,359 41,359 41,359 43,041 41,359
Fuel costs 15,408 13,726 13,726 15,408 26,954
Crew share 9,377 9,985 9,985 9,985 5,205
Net profit 41,074 0 0 0 48,448 Break even production value 51,799 41,359 41,359 43,041 70,702 Gross value added 10,968 12,650 12,650 12,650 4579 Gross value added / man 37.7 43.4 43.4 43.4 42.0 Crew share / man 32.2 34.3 34.3 34.3 17.9 With a break4even price of fuel at €331 per tonne, the 2008 fuel price of €650 per tonne increases the deficit of this segment to approximately 4€8.4 million. It also lowers the gross value added of the segment at a negative level of 4€579,000. At this level of fuel price, the segment would have to increase its production value by 71% to break even, which is almost impossible considering the current state of the different resources targeted by these vessels.
4.9.2.2 Demersal trawl seine 12424m With an average deficit of 4€15,000 per year and vessel, this segment could reach the equilibrium with a decrease in fuel price to €240 per tonne. The last time SEAFISH recorded the monthly fuel price at a such level was February 2004. An increase in fuel efficiency by 35% (against average of 200446) would allow the segment to reach the break4even point. An improvement of 56% would be required against the fuel price observed in December 2007. Their profitability rely less on a decrease in fuel costs than in the improvement of their fishing efficiency catch per unit

Report Number C002/08 120 of 425
of effort. With an increase of their catch per unit of effort of 7%, this segment would reach equilibrium with an average fuel price of €372 per tonne (see Table 4488).
Table 4488: Break4even evaluation (Status quo / present situation) – Demersal trawl seine 12424m (segment total, Economic indicators 1000€)
Indicator Situation 200446 Fuel price
2008
Base line
Break4even
price of fuel
Break4even
fuel costs
Break even
catch / unit of
effort
Changing Cells:
Price of fuel (€/tonne) 372 240 372 372 650
Fuel costs (1000 €) 33,762 33,762 21,813 33,762 59,063.6
Catch / unit of effort (tonne) 3.150 3.150 3.150 3.382 3.150
Result Cells:
Change in fuel consumption 1.000 1.000 0.646 1.000 1.000
Value of landings 162,670 162,670 162,670 174,620 162,670
Fuel costs 33,763 21,813 21,813 33,763 59,064
Crew share 51,134 55,875 55,875 55,875 41,098
Net profit 47,210 0 0 0 422,474 Break even production value 202,894 162,670 162,670 174,620 425,843 Gross value added 56,999 68,948 68,948 68,948 31,698 Gross value added / man 28.6 34.6 34.6 34.6 15.9 Crew share / man 25.7 28.0 28.0 28.0 20.6
This segment is in the same situation than the beam trawlers 24440m: already facing deficit during the reference period (4€7.2 million), the increase of the fuel price has worsened the situation (4€22.5 million). Nevertheless the gross value added generated by the segment is still positive, although it has been reduced by 45%. This segment would have to double its production value to break even at the 2008 fuel price.
4.9.2.3 Demersal trawl seine 24440m With a slight benefit over the period, the demersal trawlers and seiners are close to the break4even price of fuel estimated by our model at a level of €398 per tonne. They can therefore tolerate a fuel costs increase of 7% before showing deficit. However, facing the fuel price observed in December 2007 they would require an improvement in fuel efficiency of 27%. With a decrease of their fishing efficiency by only 2%, they would also face deficit (see Table 4489).

Report Number C002/08 121 of 425
Table 4489: Break4even evaluation (Status quo / present situation) – Demersal trawl seine 24440m (segment total, Economic indicators 1000€)
Indicator Situation 200446 Fuel price
2008
Base line
Break4even
price of fuel
Break4even
fuel costs
Break even
catch / unit of
effort
Changing Cells:
Price of fuel (€/tonne) 372 398 372 372 650
Fuel costs (1000 €) 24,984 24,984 26,759 24,984 43,707
Catch / unit of effort (tonne) 3.615 3.615 3.615 3.557 3.615
Result Cells:
Change in fuel consumption 1.000 1.000 1.071 1.000 1.000
Value of landings 110,369 110,369 110,369 108,594 110,369
Fuel costs 24,984 26,759 26,759 24,984 43,707
Crew share 28,869 28,269 28,269 28,269 22,539
Net profit 1,175 0 0 0 411,218 Break even production value 104,856 110,369 110,369 108,594 221,654 Gross value added 37,050 35,275 35,275 35,275 18,327 Gross value added / man 49.6 47.2 47.2 47.2 24.5 Crew share / man 38.6 37.8 37.8 37.8 30.2 The increase of the fuel price has reversed the situation for the demersal trawlers and seiners 24440m. The profitable position of €1.2 million during the reference period has been turned into a €11.2 million deficit. In the same time the gross value added has almost been divided by 2 and the crew share has diminished by 22%. The segment would have to double its production value to break even at the 2008 fuel price.
4.9.2.4 Demersal trawl seine over 40m These trawlers face a totally different situation: at €105 per tonne, the break4even price of fuel is way behind the prices recorded since 2000. Their profitability rely less on a decrease in fuel costs than in the improvement of their fishing efficiency catch per unit of effort. According to our model, this segment should increase its fishing efficiency by 18% to eliminate its deficit with an average fuel price of €372 per tonne (see Table 4490).

Report Number C002/08 122 of 425
Table 4490: Break4even evaluation (Status quo / present situation) – Demersal trawl seine over 40m (segment total, Economic indicators 1000€)
Indicator Situation 200446 Fuel price
2008
Base line
Break4even
price of fuel
Break4even
fuel costs
Break even
catch / unit of
effort
Changing Cells:
Price of fuel (€/tonne) 372 105 372 372 650
Fuel costs (1000 €) 10,135 10,135 2,866 10,135 17,729
Catch / unit of effort (tonne) 4.008 4.008 4.008 4.728 4.008
Result Cells:
Change in fuel consumption 1.000 1.000 0.283 1.000 1.000
Value of landings 40,447 40,447 40,447 47,716 40,447
Fuel costs 10,135 2,866 2,866 10,135 17,729
Crew share 11,905 14,760 14,760 14,760 8,922
Net profit 44,414 0 0 0 49,026 Break even production value 69,314 40,447 40,447 47,716 272,537 Gross value added 12,379 19,648 19,648 19,648 4,785 Gross value added / man 64.6 102.5 102.5 102.5 25.0 Crew share / man 62.1 77.0 77.0 77.0 46.5 Already facing deficit during the reference period, the increase of the fuel price between 2006 and 2008 has just worsened the financial position of the segment. The deficit has more than doubled, while the gross value added has decreased by 61%. The value of the production should be multiplied by 4 if the segment would have to break even at the 2008 fuel price.
4.9.2.5 Pelagic trawl over 40m The large pelagic trawlers segment presents a different picture. Their fuel efficiency is far much better than the four other segments. The fuel price would have to reach €3,896 per tonne to annul the profit of the segment. With a decrease of their fishing efficiency by 33%, they would reach the break even point (see Table 4491).

Report Number C002/08 123 of 425
Table 4491: Break4even evaluation (Status quo / present situation) – Pelagic trawl over 40m (segment total, Economic indicators 1000€)
Indicator Situation 200446 Fuel price
2008
Base line
Break4even
price of fuel
Break4even
fuel costs
Break even
catch / unit of
effort
Changing Cells:
Price of fuel (€/tonne) 443 3,896 443 443 650
Fuel costs (1000 €) 7,474 7,474 65,698 7,474 10,961.9
Catch / unit of effort (tonne) 29.938 29.938 29.938 20.147 29.938
Result Cells:
Change in fuel consumption 1.000 1.000 8.790 1.000 1.000
Value of landings 178,043 178,043 178,043 119,819 178,043
Fuel costs 7,474 65,698 65,698 7,474 10,962
Crew share 27,590 18,172 18,172 18,172 27,026
Net profit 48,806 0 0 0 45,883
Break even production value 87,356 178,043 178,043 119,819 27,257 Gross value added 110,780 52,556 52,556 52,556 107,292 Gross value added / man 329.7 156.4 156.4 156.4 319.3 Crew share / man 82.1 54.1 54.1 54.1 80.4 Based on the available data for 2006, we can assume that their profitability is not threatened by a further price increase and relies more on healthy fish stocks than on low fuel costs. This assumption is confirmed when the model is adjusted to the 2008 fuel price: compared to the reference period, the different indicators are fairly affected. The profit only diminishes by 6% and the gross value added is reduced by 3%.
4.9.3 Factors determining energy efficiency
• Fuel efficiency can be defined as: Litres fuel / kg of fish and/or Fuel costs as % of value of landings. • Determining factors can be: Gear, Vessel size (GT), Engine size (kW), Vessel age, Engine age. • This can be summarized in the following table. Different variables can explain the energy efficiency of the different segment. Considering Table 4492, the type of gear and the age seem to be the most important factors explaining the amount of fuel necessary to catch one kg of fish.
Table 4492: Fuel efficiency
Fleet segment
Litres/kg Fuel costs as
% of value
Gear Vessel size
(GT)
Engine size
(kW)
Average
vessel age
Average
engine age Beam trawl 24440m 3.0 37% Beam trawl 201 778 32 n/a
Demersal trawl seine 12424m 1.3 16%
Demersal
trawl or seine 83 270 25 n/a
Demersal trawl seine 24440m 1.2 23%
Demersal
trawl or seine 269 647 20 n/a
Demersal trawl seine over 40m 1.3 25%
Demersal
trawl or seine 988 1817 20 n/a
Pelagic trawl over 40m 0.1 4% Pelagic trawl 1,863 4,244 9 n/a

Report Number C002/08 124 of 425
4.9.4 Economic potential for technological improvement
This section deals with the results of the model when the fuel consumption factor is reduced from 1.0 (present situation) to for example 0.8, i.e. 20% improvement in fuel efficiency can be achieved with technical4operational adjustments. The different estimates presented until this section were calculated with the assumption that there were no change in the fuel consumption pattern. If we assume that the vessels may improve their fuel efficiency by 20% with several technological adjustments, they will be able to face higher fuel price before showing a deficit (see Table 4493). A 20% improvement in fuel efficiency would also give the opportunity either to replace the engine or to improve the design of the hull for all the fleets, especially for the demersal trawlers exceeding 40 meters. The rise of fuel price between the reference period and 2008 increased the maximum investment a vessel could sustain after a 20% improvement in fuel efficiency.
Table 4493: Potential of 20% fuel savings (average per vessels)
Fleet segment
Break4even
fuel price
(€/l)
Trade4off with CPUE
(TOR)
Change in capital
costs
(1000 €)
Maximum
investment
in hull
(1000 €)
Maximum
investment
in engine
(1000 €)
200446 2008 200446 2008 200446 2008 200446 2008
Beam trawl 24440m 414 0.925 0.870 34.9 61.1 525.7 919.6 257.1 449.8 Demersal trawl seine 12424m 375 0.966 0.927 8.5 14.9 127.9 223.7 62.6 109.4
Demersal trawl seine 24440m 497 0.939 0.921 30.9 54.1 465.1 813.6 227.5 398.0
Demersal trawl seine over 40m 131 0.982 0.912 105.5 184.6 1,587.4 2,777.0 776.5 1,358.4
Pelagic trawl over 40m 4,870 0.992 0.988 44.8 65.6 673.4 987.6 329.4 483.1
4.9.5 Scenarios for future fuel prices
The different estimates produced in the previous sections were based on a mean fuel price of €372 per tonne. The annual mean fuel price was €443 in 2006 and €445 in 2007. Starting at a level of €360 in January 2007, the monthly prices recorded by SEAFISH rose frequently to exceed €400 per tonne between March and April 2007 and €500 per tonne between October and November 2007. In December 2007, the mean fuel price was estimated at a level of €548 per tonne, representing an increase of 47% compared to the mean price for the period 200442006. The prices observed in 2008 until September may lead to an average annual fuel price of €650 per tonnes, corresponding to an increase of 75% compared to the mean price for the period 200442006. Comparing the evolution of fuel prices in UK and the following table, we can conclude that the major part of the segments under study, except the pelagic trawlers, are currently facing deficit. Even if the fuel price only increased by 50%, the beam and demersal trawlers would have been showing deficit (see Table 4494 and Table 4494). However, the pelagic boats may not still be affected by such increase in fuel prices.

Report Number C002/08 125 of 425
Table 4494: Absolute consequences of fuel price change (1000 €, segment total)
Fleet segment Scenario 1: PFU+50% Scenario 2: PFU+75% Scenario 3: PFU+100%
Gross
value
added
Crew
share
Net profit Gross
value
added
Crew
share
Net profit Gross
value
added
Crew
share
Net profit
Beam trawl 24440m 3,264 6,594 45,994 4588 5,202 48,454 44,440 3,810 410,915
Demersal trawl seine 12424m 40,117 44,438 417,395 31,677 41,090 422,487 23,236 37,742 427,579
Demersal trawl seine 24440m 24,558 24,645 47,094 18,312 22,534 411,228 12,066 20,422 415,362
Demersal trawl seine over 40m 7,312 9,915 47,491 4,778 8,920 49,030 2,245 7,925 410,568
Pelagic trawl over 40m 107,043 26,986 45,674 105,174 26,683 44,107 103,306 26,381 42,541
Table 4495: Relative consequences of fuel price change (% of the baseline situation)
Fleet segment Scenario 1: PFU+50% Scenario 2: PFU+75% Scenario 3: PFU+100%
Gross
value
added
Crew
share
Net profit Gross
value
added
Crew
share
Net profit Gross
value
added
Crew
share
Net profit
Beam trawl 24440m 470% 430% 4458% 4105% 445% 4687% 4140% 459% 4916%
Demersal trawl seine 12424m 430% 413% 4141% 444% 420% 4212% 459% 426% 4477%
Demersal trawl seine 24440m 434% 415% 4704% 451% 422% 41056% 467% 429% 41408%
Demersal trawl seine over 40m 441% 417% 470% 461% 425% 4105% 482% 433% 4139
Pelagic trawl over 40m 43% 42% 46% 45% 43% 410% 47% 44% 413%
4.9.6 Economic consequences of technical adaptations
The technologists identified several adaptations which could reduce the fuel consumption for two segments: demersal trawl seine 12424m and demersal trawl seine 24440m (Chapter 4).
4.9.6.1 Demersal trawl seine 12424m: Adaptation 1: consists in optimising the towing warp specification to operational requirements i.e. ensuring that the warp specification is matched to vessel power; trawl and trawl doors. This can result in drag reductions and subsequent fuel savings. In this case, the reduction of fuel consumption can be estimate at 5%, for an estimated investment of €25,500. Adaptation 2: Replacing the trawl doors allows reducing the overall drag of the gear by adjusting the size of the gear to the towing capacity of the fishing vessel. The reduction of fuel consumption can be estimate at 10%, for an estimated investment of €6,250. Adaptation 3: Modifying the design of a net by using different mesh configurations and construction can reduce the fuel consumption of a fishing vessel by 15%, for an estimated investment of €12,700. Adaptation 4: estimates the benefit of different maintenance options. Overall, improving the maintenance of the hull or the propeller could each help to save 5% of the fuel use, for an estimated annual cost of €3,500.

Report Number C002/08 126 of 425
The different economic indicators relevant for every adaptation are summarised in the table 14. From an economic point of view, the adaptation 1 is not interesting: the investments needed to implement it (€25,500 per vessel) are higher than what could be repaid by the level of fuel savings (€18,300 per vessel). The three other adaptations are more promising: at the 2008 fuel price, the reduction in fuel costs is always sufficient to offset the investment cost necessary to implement the adaptation. However, none of them is sufficient to compensate the rise in fuel price at the 2008 level. Even if the price of fuel had been stable between the reference period and 2008, these adaptations wouldn’t have reversed the deficit situation of this segment. The most promising adaptation (adapt. 3) would only allow the break even fuel price to increase from €240 per tonne to €256 per tonne, which is still far from the fuel price of €372 per tonne observed during the reference period. As stated before, the profitability of this segment relies less on a decrease in fuel costs than on the improvement of its fishing efficiency in terms of catch per unit of effort.
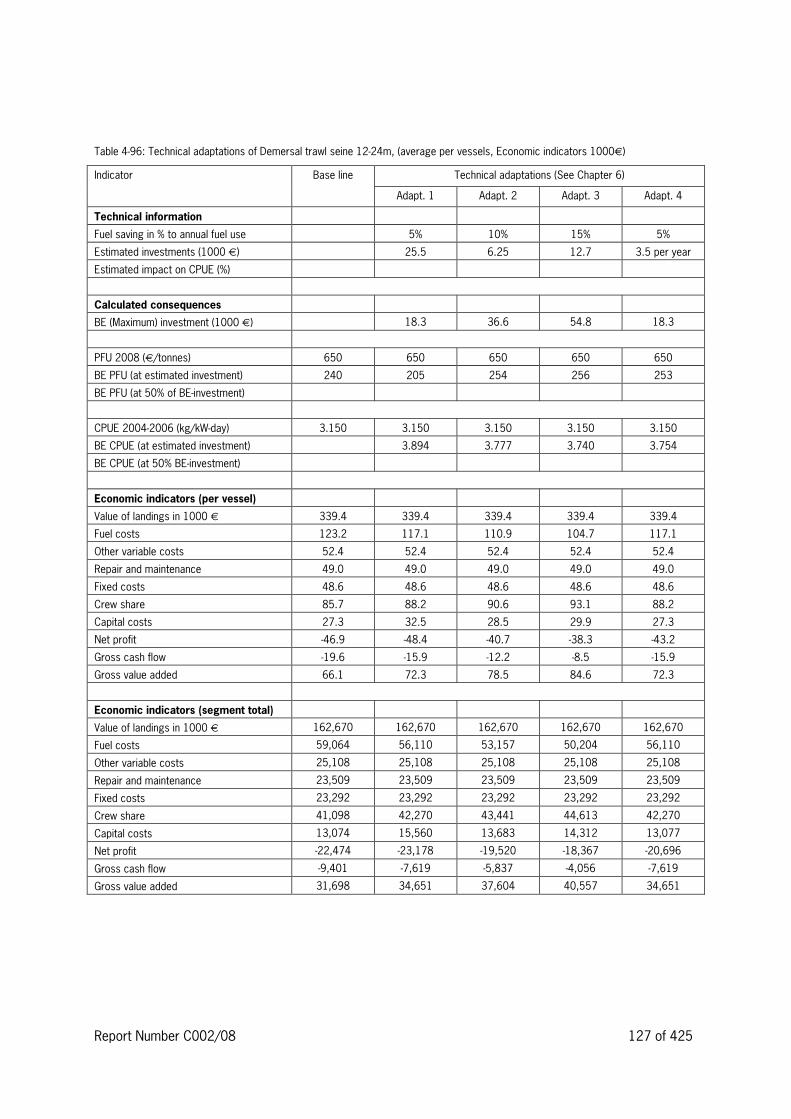
Report Number C002/08 127 of 425
Table 4496: Technical adaptations of Demersal trawl seine 12424m, (average per vessels, Economic indicators 1000€)
Indicator Technical adaptations (See Chapter 6)
Base line
Adapt. 1 Adapt. 2 Adapt. 3 Adapt. 4
Technical information
Fuel saving in % to annual fuel use 5% 10% 15% 5%
Estimated investments (1000 €) 25.5 6.25 12.7 3.5 per year
Estimated impact on CPUE (%)
Calculated consequences
BE (Maximum) investment (1000 €) 18.3 36.6 54.8 18.3
PFU 2008 (€/tonnes) 650 650 650 650 650
BE PFU (at estimated investment) 240 205 254 256 253
BE PFU (at 50% of BE4investment)
CPUE 200442006 (kg/kW4day) 3.150 3.150 3.150 3.150 3.150
BE CPUE (at estimated investment) 3.894 3.777 3.740 3.754
BE CPUE (at 50% BE4investment)
Economic indicators (per vessel)
Value of landings in 1000 € 339.4 339.4 339.4 339.4 339.4
Fuel costs 123.2 117.1 110.9 104.7 117.1
Other variable costs 52.4 52.4 52.4 52.4 52.4
Repair and maintenance 49.0 49.0 49.0 49.0 49.0
Fixed costs 48.6 48.6 48.6 48.6 48.6
Crew share 85.7 88.2 90.6 93.1 88.2
Capital costs 27.3 32.5 28.5 29.9 27.3
Net profit 446.9 448.4 440.7 438.3 443.2
Gross cash flow 419.6 415.9 412.2 48.5 415.9
Gross value added 66.1 72.3 78.5 84.6 72.3
Economic indicators (segment total)
Value of landings in 1000 € 162,670 162,670 162,670 162,670 162,670
Fuel costs 59,064 56,110 53,157 50,204 56,110
Other variable costs 25,108 25,108 25,108 25,108 25,108
Repair and maintenance 23,509 23,509 23,509 23,509 23,509
Fixed costs 23,292 23,292 23,292 23,292 23,292
Crew share 41,098 42,270 43,441 44,613 42,270
Capital costs 13,074 15,560 13,683 14,312 13,077
Net profit 422,474 423,178 419,520 418,367 420,696
Gross cash flow 49,401 47,619 45,837 44,056 47,619
Gross value added 31,698 34,651 37,604 40,557 34,651

Report Number C002/08 128 of 425
4.9.6.2 Demersal trawl seine 24440m: Adaptation 1: focussed on the reduction of the fishing gear towing resistance. In terms of overall gear drag, considering the seine netting mode of operation, a realistic estimate of reduction in fuel consumption as a result of incorporating the measures identified would be ~10%.
Table 4497: Technical adaptations of Demersal trawl seine 24440m, (average per vessels, Economic indicators 1000€)
Indicator Base line Technical adaptations (See Chapter 6)
Adapt. 1 Adapt. 2 Adapt. 3 Adapt.4
Technical information
Fuel saving in % to annual fuel use 10%
Estimated investments (1000 €) ?
Estimated impact on CPUE (%)
Calculated consequences
BE (Maximum) investment (1000 €) 132.9
PFU 2008 (€/tonnes) 650 650
BE PFU (at estimated investment)
BE PFU (at 50% of BE4investment) 442
CPUE 200442006 (kg/kW4day) 3.615 3.615
BE CPUE (at estimated investment)
BE CPUE (at 50% BE4investment) 4.099
Economic indicators (per vessel)
Value of landings in 1000 € 1,031.5 1,031.5
Fuel costs 408.5 367.6
Other variable costs 181.2 181.2
Repair and maintenance 127.2 127.2
Fixed costs 143.3 143.3
Crew share 210.6 224.5
Capital costs 65.5 79.0
Net profit 4104.8 491.3
Gross cash flow 439.4 412.3
Gross value added 171.3 212.1
Economic indicators (segment total)
Value of landings in 1000 € 110,369 110,369
Fuel costs 43,707 39,336
Other variable costs 19,385 19,385
Repair and maintenance 13,613 13,613
Fixed costs 15,337 15,337
Crew share 22,539 24,017
Capital costs 7,006 8,452
Net profit 411,218 49,771
Gross cash flow 44,211 41,318
Gross value added 18,327 22,698

Report Number C002/08 129 of 425
The adaptation 1 could only be feasible if the maximum investment would not exceed €132,900 per vessel. Without adaptation the segment would break even at a fuel price of €398 per tonne. The model estimation shows an increase in the break even fuel price to €442 per tonne when considering the adaptation 1. However, this price is still far from the current level in fuel prices around UK (€650 per tonne). Even if the adaptation was implemented, it wouldn’t offset the recent rise in fuel price. A combined increase in catch efficiency would be necessary to allow the segment to break even.
4.9.6.3 List of national studies 4 publications related to fuel efficiency in fisheries Two recent national studies can be related to our subject: H Curtis, K Graham, T Rossiter (2006) ‘Options for improving fuel efficiency in the UK Fishing Fleet’ SEAFISH, United Kingdom, The Impact of the Increase of the Oil Price in European Fisheries: Impact on the UK Fishing Fleet, project no. IP/B/PECH/ST/20054142, p 3.

Report Number C002/08 130 of 425
5 Collection of data from national projects
5.1 General The allocated budget did not allow extensive trials at sea on commercial fishing vessels, and it was therefore decided to link into existing national research projects, and feed the information resulting from these into a cohesive data analysis and economic evaluation. The following national projects supplied such data.
5.2 Information from current national projects
5.2.1 Netherlands (IMARES)
5.2.1.1 Current national projects A range of activities are being carried out to improve economy of beam trawling, e.g. by reducing the drag of beam trawls in The Netherlands by reshaping the beams, use of wheels instead of beam trawl shoes, redesigning the nets; by changing into ottertrawls fished from the booms (‘outrigging’); and by using alternative stimulation (‘pulse trawl’). Information gathered in these national projects is summarised in this section.
5.2.1.2 Adaptations to beam trawls to reduce drag (NL) Practical trials with alternative beam and trawl shoe shapes were carried out in the Netherlands instigated by the “Task Force Sustainable North Sea Fisheries” on four vessels, ranging in installed engine powers of around 2000 hp in 2006 and 2007. Four different variations were studied: 1. Wheels replacing the conventional trawl shoe construction 2. Spoilers attached to the beam with additional changes 3. “Fly4Beam” – a replacement of the circular pipe with a fixed hydrofoil construction 4. “Sum4wing” 4 a replacement of the circular pipe and trawl shoes with a fixed hydrofoil construction that could
run off4bottom with only a leader touching bottom
Figure 541: Wheel to replace beam trawl shoe Figure 542: Spoiler
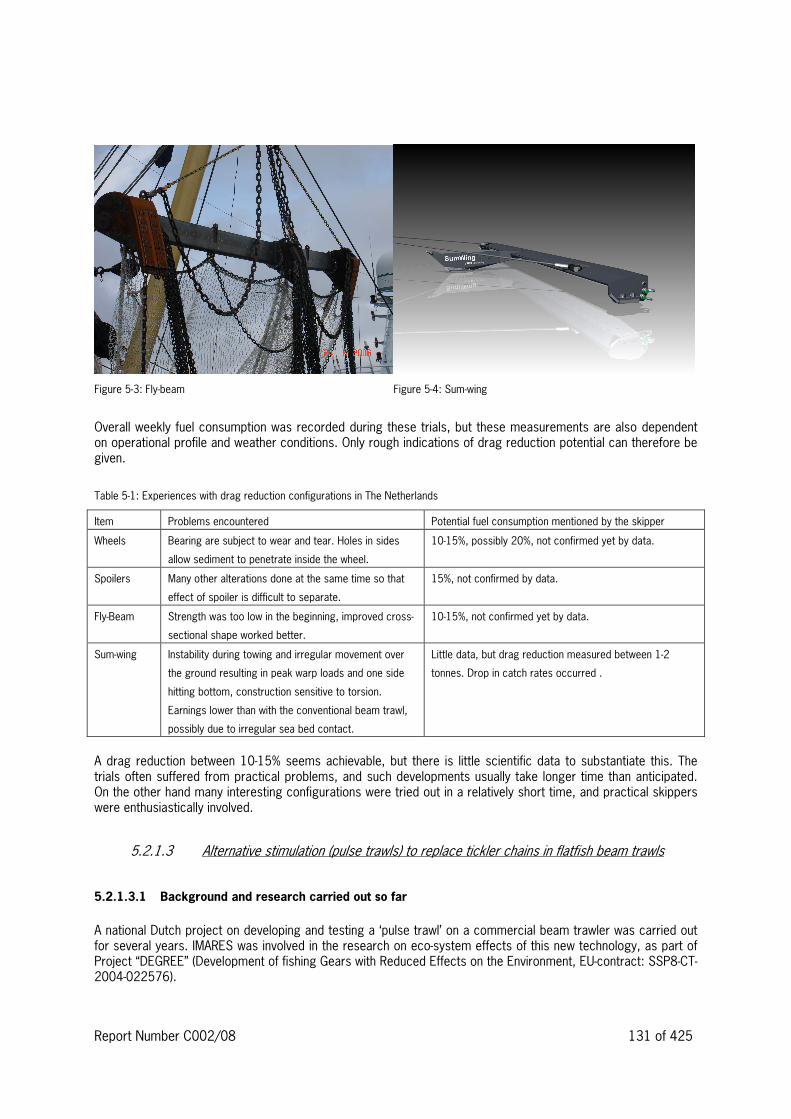
Report Number C002/08 131 of 425
Figure 543: Fly4beam Figure 544: Sum4wing
Overall weekly fuel consumption was recorded during these trials, but these measurements are also dependent on operational profile and weather conditions. Only rough indications of drag reduction potential can therefore be given.
Table 541: Experiences with drag reduction configurations in The Netherlands
Item Problems encountered Potential fuel consumption mentioned by the skipper
Wheels Bearing are subject to wear and tear. Holes in sides
allow sediment to penetrate inside the wheel.
10415%, possibly 20%, not confirmed yet by data.
Spoilers Many other alterations done at the same time so that
effect of spoiler is difficult to separate.
15%, not confirmed by data.
Fly4Beam Strength was too low in the beginning, improved cross4
sectional shape worked better.
10415%, not confirmed yet by data.
Sum4wing Instability during towing and irregular movement over
the ground resulting in peak warp loads and one side
hitting bottom, construction sensitive to torsion.
Earnings lower than with the conventional beam trawl,
possibly due to irregular sea bed contact.
Little data, but drag reduction measured between 142
tonnes. Drop in catch rates occurred .
A drag reduction between 10415% seems achievable, but there is little scientific data to substantiate this. The trials often suffered from practical problems, and such developments usually take longer time than anticipated. On the other hand many interesting configurations were tried out in a relatively short time, and practical skippers were enthusiastically involved.
5.2.1.3 Alternative stimulation (pulse trawls) to replace tickler chains in flatfish beam trawls
5.2.1.3.1 Background and research carried out so far
A national Dutch project on developing and testing a ‘pulse trawl’ on a commercial beam trawler was carried out for several years. IMARES was involved in the research on eco4system effects of this new technology, as part of Project “DEGREE” (Development of fishing Gears with Reduced Effects on the Environment, EU4contract: SSP84CT420044022576).

Report Number C002/08 132 of 425
Beam trawls are intensively used in the North Sea fisheries of the Netherlands, Belgium, Germany, and the United Kingdom. These gears are fished with relatively heavy groundgear and relatively high towing speed (e.g. 6.5 to 7.0 kts) and are causing substantial mortality and possible changes in the species composition of invertebrates (Anon., 1988, 1995; Jennings and Kaiser, 1998; Lindeboom and De Groot, 1998; Kaiser and De Groot, 2000; Fonteyne and Polet; 2002; Piet et al., 2000). A study revealed that the penetration depth of beam trawls varies between 1 and 8 cm, depending on the type of gear and substrate (Paschen et al., 2000). Apart from the fact that these trawls are energy intensive, there is growing concern about the impact of fishing on marine eco4systems, and particularly on the benthic fauna. Electrical stimuli evoke reactions in fish ranging from a startling response to narcosis (McBary, 1956). In freshwater direct current can be used to attract fish by forced swimming (anodic attraction). Research on electrical or pulse stimulation in beam trawling was carried out extensively from 1970, in the Netherlands (De Groot and Boonstra, 1970, 1974; Agricola, 1985; Van Marlen, 2000), Belgium (Vanden Broucke, 1973), Germany (Horn, 1976) and the United Kingdom (Horton, 1984). In seawater a pulsing electric field can be utilised to chase flatfish, in particular sole (Solea vulgaris L.) out of the sea bed. An array of electrodes can be used to replace tickler chains in beam trawls (De Groot and Boonstra, 1970, 1974). The possibility of size selection was raised, as longer fish were expected to react more strongly (Stewart, 1975), although not clearly confirmed later by experiments (Stewart, 1978, Agricola, 1985). The primary motive at that time was to save fuel by decreasing gear drag, and the potential for using this technique for catching shrimps and flatfish was shown. In spite of the development of various prototypes introduction in commercial practice never happened (Van Marlen, 1997). At present a main objective is to reduce the impact of ground gear on the sea bed. Any successful new stimulation technique should offer adequate catch levels on target species, sound economics, a decrease in by4catch levels, similar chances of survival for escaping and discarded animals, and no effect on the reproductive capabilities of the species affected. Wageningen IMARES (former RIVO) became again involved in 1998 in a research and development programme started by the Ministry of Agriculture, Nature and Fisheries. A pulse trawl with a beam length of 7 m produced by a private company was extensively tested in that year. These trials resulted in sole catches of the same magnitude and lower catches of plaice (Pleuronectes platessa L.) and benthos. These promising results led to follow4up experiments in 1999 with a modified gear. The first objective was to improve the catches of plaice, appraise the effect of towing speed, compare the warp loads of both gears, and appraise the effect of the electrical stimulation on short4term fish survival. The second objective was to further improve the catching performance of the net attached to the beam of the pulse trawl, and to collect more data on short4term survival, also of benthic animals (Van Marlen, et al., 1999; Van Marlen, et al., 2000; Van Marlen, et al., 2001a, 2001b). Beam trawling for flatfish is an efficient fishing method, but it requires a high level of energy input, due to the high gear drag and towing speeds, and affects benthic fauna (De Groot and Lindeboom, 1998). This has led to research on alternatives, such as electrical stimulation, initially aimed at reducing gear drag and fuel consump4tion. Prototype gears were developed for shrimps and flatfish fisheries, but until the present day a commercial application did not emerge (VandenBroucke, 1973; Boonstra and De Groot, 1970, 1974; Stewart, 1975, 1977; Horn, 1976; Horton, 1984; Agricola, 1985; Van Marlen, et al., 1997). Fishing with electricity was banned in the European Union (EU) in 1988. The reason for this was fear of increasing catch efficiency in a time when the discrepancy between the state of the resources and the ever increasing fishing effort became problematic. In the late 1990s the development of beam trawling with electrical stimulation was continued, but now the focus was on reducing adverse ecosystem effects (Van Marlen, et al., 2001a). Recently with the rise of fuel costs the attention was directed to energy saving through gear drag and towing speed reduction, while keeping the advantages in eco4system terms. Wageningen IMARES became involved in an existing trilateral cooperation between a private company (Verburg4Holland Ltd.), the Dutch Fishermen’s Federation and the Ministry of Agriculture, Nature and Food Quality in 1998. A series of trials were conducted onboard FRV “Tridens” on a 7 m prototype electrified beam trawl, called ‘pulse’ trawl, resulting in sole (Solea vulgaris L.) catches matching those of conventional tickler chain beam trawls, plaice catches being reduced by about 50%, and benthos catches reduced by 40%. These results stimulated further work. Extended trials were carried out in October4November 1999 (Van Marlen, et al., 1999; Van Marlen, et al., 2000).

Report Number C002/08 133 of 425
A study on differences between a conventional 7 m tickler chain gear and the 7 m prototype electrical gear in direct mortality of invertebrates living on and in the sea bed was conducted in June 2000 onboard FRV “Tridens” and RV “Zirfaea”. Benthos samples were taken from the Oyster grounds prior to fishing, and from trawl tracks caused by the two gear types. The direct mortality calculated from densities in these samples was lower for an assembly of 15 taxa for the pulse trawl, indicating the potential of electrical fishing to reduce effects on benthic communities (Van Marlen, et al., 2001). After these experiments it was decided to develop a prototype for 12 m beam length, being the most common value in the Dutch fleet. Technical trials with the new prototype were carried out in November4December 2001 onboard FRV “Tridens”, and continued in 2002 and 2003, resulting in catch rates for sole and plaice equalling those of conventional 12 m gear. Recently the bycatch and discarding of undersized fish, particularly plaice (Pleuronectes platessa L.) gained attention. Comparative studies were undertaken in 2005 on FRV “Tridens” on the differences in catches and on differences in survival of undersized sole and plaice between a 12 m pulse beam trawl and a conventional 12 m tickler chain beam trawl (Van Marlen et al., 2005a, b). A higher survival rate for plaice, but not for sole, was found for the pulse trawl, while the level of blood parameters (glucose, free fatty acids, cortisol, and lactate) and the changes over time in blood samples taken from both species showed no significant differences between both stimulation techniques. In the fall of 2004 it was concluded that the 12 m prototype was technically ready for a series of long4term trials on a commercial fishing vessel. The Motor Fishing Vessel (MFV) UK153 “Lub Senior” was outfitted with a complete system of two pulse trawls and cable winches. A series of experiments was carried out on the UK 153 in the period between October 2005 and March 2006 and compared to the performance of similar beam trawlers fishing with the conventional gear type in the same period, and on the same fishing grounds in the North Sea, on the Dutch Continental Shelf. The MFV UK153 was outfitted with a complete system of two pulse trawls and winches with feeding cables. Nine trips in total were undertaken. Five trips were used to make actual catch comparisons with a second vessel (Van Marlen et al., 2006). The European Commission requested ICES in November 2005 to evaluate the possible effect of the use of pulse4trawl electrical fishing gear to target plaice and sole in beam4trawl fisheries: a. What change in fishing mortality could be expected following the adoption of such gear in the commercial
fishery, assuming unchanged effort measured in kW4days at sea? b. What effect would such a widespread introduction have in terms of (i) the mixture of species caught; (ii) the
size of fish caught? c. What, if any, effects would such introduction have on non4target species in the marine ecosystems where this
gear was deployed? The following ICES Conclusion was articulated after discussions in working groups of experts and advisory committees in 2006: “The available information shows that the pulse trawl gear could cause a reduction in catch rate (kg/hr) of undersized sole, compared to standard beam trawls. Catch rates of sole above the minimum landing size from research vessel trials were higher but the commercial feasibility study suggested lower catch rates. Plaice catch rates decreased for all size classes. No firm conclusions could be drawn for dab, turbot, cod and whiting but there was a tendency for lower catch rates. The gear seems to reduce catches of benthic invertebrates and lower trawl path mortality of some in4fauna species. Because of the lighter gear and the lower towing speed, there is a considerable reduction in fuel consumption and the swept area per hour is lower. There are indications that the gear could inflict increased mortality on target and non4target species that contact the gear but are not retained.
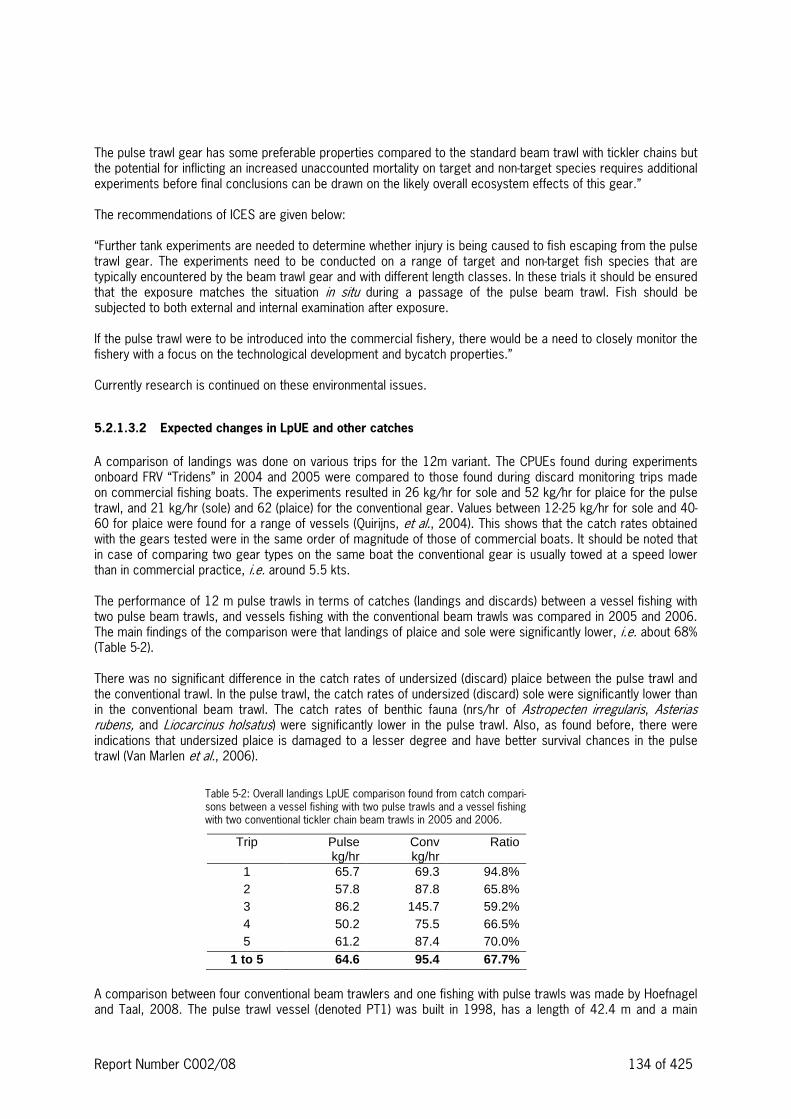
Report Number C002/08 134 of 425
The pulse trawl gear has some preferable properties compared to the standard beam trawl with tickler chains but the potential for inflicting an increased unaccounted mortality on target and non4target species requires additional experiments before final conclusions can be drawn on the likely overall ecosystem effects of this gear.” The recommendations of ICES are given below: “Further tank experiments are needed to determine whether injury is being caused to fish escaping from the pulse trawl gear. The experiments need to be conducted on a range of target and non4target fish species that are typically encountered by the beam trawl gear and with different length classes. In these trials it should be ensured that the exposure matches the situation in situ during a passage of the pulse beam trawl. Fish should be subjected to both external and internal examination after exposure. If the pulse trawl were to be introduced into the commercial fishery, there would be a need to closely monitor the fishery with a focus on the technological development and bycatch properties.” Currently research is continued on these environmental issues.
5.2.1.3.2 Expected changes in LpUE and other catches
A comparison of landings was done on various trips for the 12m variant. The CPUEs found during experiments onboard FRV “Tridens” in 2004 and 2005 were compared to those found during discard monitoring trips made on commercial fishing boats. The experiments resulted in 26 kg/hr for sole and 52 kg/hr for plaice for the pulse trawl, and 21 kg/hr (sole) and 62 (plaice) for the conventional gear. Values between 12425 kg/hr for sole and 40460 for plaice were found for a range of vessels (Quirijns, et al., 2004). This shows that the catch rates obtained with the gears tested were in the same order of magnitude of those of commercial boats. It should be noted that in case of comparing two gear types on the same boat the conventional gear is usually towed at a speed lower than in commercial practice, i.e. around 5.5 kts. The performance of 12 m pulse trawls in terms of catches (landings and discards) between a vessel fishing with two pulse beam trawls, and vessels fishing with the conventional beam trawls was compared in 2005 and 2006. The main findings of the comparison were that landings of plaice and sole were significantly lower, i.e. about 68% (Table 542). There was no significant difference in the catch rates of undersized (discard) plaice between the pulse trawl and the conventional trawl. In the pulse trawl, the catch rates of undersized (discard) sole were significantly lower than in the conventional beam trawl. The catch rates of benthic fauna (nrs/hr of Astropecten irregularis, Asterias rubens, and Liocarcinus holsatus) were significantly lower in the pulse trawl. Also, as found before, there were indications that undersized plaice is damaged to a lesser degree and have better survival chances in the pulse trawl (Van Marlen et al., 2006).
Table 542: Overall landings LpUE comparison found from catch compari4sons between a vessel fishing with two pulse trawls and a vessel fishing with two conventional tickler chain beam trawls in 2005 and 2006.
Trip Pulse kg/hr
Conv kg/hr
Ratio
1 65.7 69.3 94.8% 2 57.8 87.8 65.8% 3 86.2 145.7 59.2% 4 50.2 75.5 66.5% 5 61.2 87.4 70.0%
1 to 5 64.6 95.4 67.7%
A comparison between four conventional beam trawlers and one fishing with pulse trawls was made by Hoefnagel and Taal, 2008. The pulse trawl vessel (denoted PT1) was built in 1998, has a length of 42.4 m and a main

Report Number C002/08 135 of 425
engine of 2000 hp. The PT1 was compared with the average of the four reference beam trawl vessels (denoted BT1, …, BT4). All these vessels were in the class of 2000 hp main engine power and with lengths about 41 m, and thus comparable in size and power as can be seen in the table below.
Table 543: Characteristics of the vessels (From Hoefnagel and Taal, 2008)
Vessels in % PT1 4 Reference Difference
Length 42.40 m 41.44 m +2 m
GT 508 ton 466 ton +9 ton
hp 2000 hp 2224 hp 410 hp
Year hull 1998 1991 47 Years
Year engine 1999 1995 44 Years The performance of 12 m pulse trawls in terms of catches and earnings between the vessel fishing with two pulse beam trawls (PT1), and four vessels fishing with the conventional beam trawls (BT1, …BT4) were also analysed by Hoefnagel and Taal, 2008.
Figure 545: Gross revenue in € per week in 2006 (From Hoefnagel and Taal, 2008)
It appeared that the pulse trawl vessel managed to improve her catch efficiency over the year 2006 due to gained experience with the new technique. The Gross Revenue per week was for the BT4vessels on average 29780 € and for the pulse trawl 23087 €, a ratio of 0.775 (Hoefnagel and Taal, 2008).
5.2.1.3.3 Expected changes in fuel consumption
The pulse beam trawls are fished with a lower speed than the conventional tickler chain beam trawl, e.g. 5.5. kts v.s. 647 kts, resulting in a considerable fuel and associated fuel cost reduction.

Report Number C002/08 136 of 425
Warp load measurements were done during the development of the pulse trawl at certain stages. For the 7m variant these measurements resulted in the values in Table 544 below (Van Marlen et al., 2001).
Table 544: Mean warp loads v.s. towing speeds of 7m gears measured onboard FRV “Tridens” in 1999. (P = pulse trawl, C =
conventional trawl)
Speed (kts)
mean P mean C
2 0.8 1.8 3 1.41 2.1 4 2.01 2.46 4 2.66 3.36 4 2.28 3.38 4 2.14 2.8 4 2.48 2.93 5 2.43 3.13
A linear regression (Load = a * Speed + b) on these values resulted in a ratio in warp load of about 0.75 for the pulse trawl at speeds of 5.5 v.s. 6.5 kts, which are commonly used values.
Table 545: Results of linear regression of mean warp loads of 7m gears measured onboard FRV “Tridens” in April 1999.
Gear a b Load Speed C 0.5309 0.7541 4.20495 6.5 P 0.6314 -0.3414 3.1313 5.5 Ratio E/C 0.74467
The fuel consumption per week on average for the four BT4vessels was 34277 liters, and for the pulse trawl PT4boat 18885 liters, a ratio of 0.551 (Hoefnagel and Taal, 2008). This value can be used as a proxy for the energy saving potential of the 12 m pulse trawl, mainly caused by its lower drag and towing speed. The pulse beam trawls are fished with 5.5. kts vs. 647 kts for the conventional beam trawls.

Report Number C002/08 137 of 425
Figure 546: Fuel consumption in liters per week, year 2006, BT = conventional Beam Trawl, PT = Pulse Trawl (From Hoefnagel and Taal, 2008)
5.2.1.4 Outrigger for flatfish beam trawl
5.2.1.4.1 General
An ‘outrigger’ system consists of two small nets, each spread by two otterboards or trawls doors, operated from the booms, to replace beam trawls (Figure 547).
Table 546: Fuel consumption of Dutch beam trawlers as a function of installed engine power
Engine power (hp) Fuel consumption per week (ltr)
1350 24000
1592 28800
1659 30000
2000 36000

Report Number C002/08 138 of 425
Figure 547: Outrigger system used on Dutch beam trawlers in 2006.
5.2.1.4.2 Results
Practical experiments with the outrigger4system were carried out in the Netherlands instigated by the “Task Force Sustainable North Sea Fisheries” on four vessels in 2006, ranging in installed engine powers between 1350 and 2000 hp. A total of 57 weekly fishing trips were carried out in the period between February – October 2006. The spread of this gear is larger than of two beam trawls (i.e. 24 m) reaching 30450 m in total (15425 m per gear) with an average of 36 m (stdev=7.3, n=57). The warp is split in two pieces of 60 m length in front of the doors. The otterboards were Thyborøn type 80 inch Multi Perfect Special, 400 kg each. The towing speed was considerably lower than that of beam trawls, i.e. 3.1 kts (stdev=0.23, n=57) instead of 647 kts. The cod4end mesh size was 804100 mm. The mean haul duration was 3 hours (stdev=0.3 uur, n=57). This gear runs lighter over the sea bed, resulting together with the lower towing speed in a reduction of fuel consumption i.e. 12 tonnes per week on average, (stdev=3.4, n=57), compared to about 29 tonnes per week for the conventional beam trawl.
Table 547: Mean catches and earnings (Euro, kg) of four outriggers compared to conventional beam trawlers in 2006 (Week 18445). Boldface is significant difference (t4test, difference ≠0, n=15); Positive differences in black (outrigger>conventional), Positive differences in red.
outrigger conventional difference difference
(%)
outrigger conventional difference difference
(%)
Euro/
week
total catch €17,64 €31,477 €13,836 56 Kg/week 5672 7162 1490 79
sole €1,162 €15,050 €13,888 8 75 1061 986 7
plaice €6,380 €7,182 €802 89 3026 3275 249 92
brill & turbot €2,093 €5,946 €3,853 35 175 711 536 25
prawns €6,298 €1,349 €4,949 467 1277 321 956 398
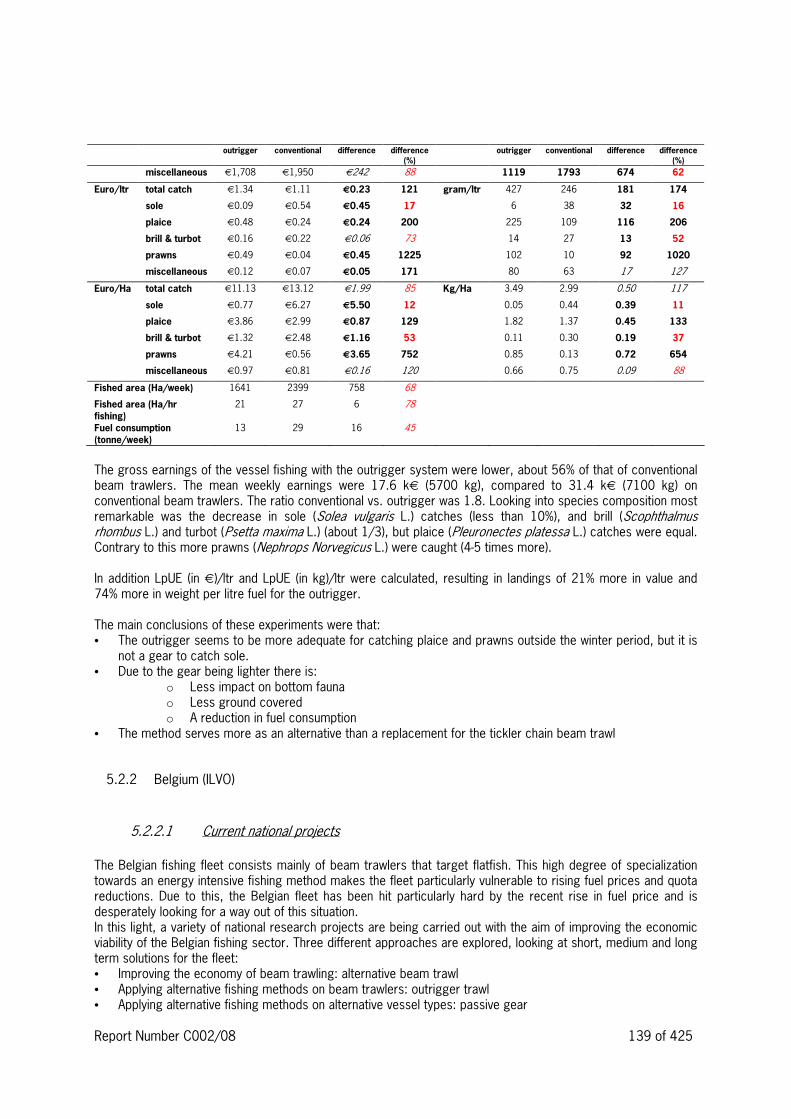
Report Number C002/08 139 of 425
outrigger conventional difference difference
(%)
outrigger conventional difference difference
(%)
miscellaneous €1,708 €1,950 €242 88 1119 1793 674 62
Euro/ltr total catch €1.34 €1.11 €0.23 121 gram/ltr 427 246 181 174
sole €0.09 €0.54 €0.45 17 6 38 32 16
plaice €0.48 €0.24 €0.24 200 225 109 116 206
brill & turbot €0.16 €0.22 €0.06 73 14 27 13 52
prawns €0.49 €0.04 €0.45 1225 102 10 92 1020
miscellaneous €0.12 €0.07 €0.05 171 80 63 17 127
Euro/Ha total catch €11.13 €13.12 €1.99 85 Kg/Ha 3.49 2.99 0.50 117
sole €0.77 €6.27 €5.50 12 0.05 0.44 0.39 11
plaice €3.86 €2.99 €0.87 129 1.82 1.37 0.45 133
brill & turbot €1.32 €2.48 €1.16 53 0.11 0.30 0.19 37
prawns €4.21 €0.56 €3.65 752 0.85 0.13 0.72 654
miscellaneous €0.97 €0.81 €0.16 120 0.66 0.75 0.09 88
Fished area (Ha/week) 1641 2399 758 68
Fished area (Ha/hr
fishing)
21 27 6 78
Fuel consumption
(tonne/week)
13 29 16 45
The gross earnings of the vessel fishing with the outrigger system were lower, about 56% of that of conventional beam trawlers. The mean weekly earnings were 17.6 k€ (5700 kg), compared to 31.4 k€ (7100 kg) on conventional beam trawlers. The ratio conventional vs. outrigger was 1.8. Looking into species composition most remarkable was the decrease in sole (Solea vulgaris L.) catches (less than 10%), and brill (Scophthalmus rhombus L.) and turbot (Psetta maxima L.) (about 1/3), but plaice (Pleuronectes platessa L.) catches were equal. Contrary to this more prawns (Nephrops Norvegicus L.) were caught (445 times more). In addition LpUE (in €)/ltr and LpUE (in kg)/ltr were calculated, resulting in landings of 21% more in value and 74% more in weight per litre fuel for the outrigger. The main conclusions of these experiments were that: • The outrigger seems to be more adequate for catching plaice and prawns outside the winter period, but it is
not a gear to catch sole. • Due to the gear being lighter there is:
o Less impact on bottom fauna o Less ground covered o A reduction in fuel consumption
• The method serves more as an alternative than a replacement for the tickler chain beam trawl
5.2.2 Belgium (ILVO)
5.2.2.1 Current national projects The Belgian fishing fleet consists mainly of beam trawlers that target flatfish. This high degree of specialization towards an energy intensive fishing method makes the fleet particularly vulnerable to rising fuel prices and quota reductions. Due to this, the Belgian fleet has been hit particularly hard by the recent rise in fuel price and is desperately looking for a way out of this situation. In this light, a variety of national research projects are being carried out with the aim of improving the economic viability of the Belgian fishing sector. Three different approaches are explored, looking at short, medium and long term solutions for the fleet: • Improving the economy of beam trawling: alternative beam trawl • Applying alternative fishing methods on beam trawlers: outrigger trawl • Applying alternative fishing methods on alternative vessel types: passive gear

Report Number C002/08 140 of 425
5.2.2.2 Alternative beam trawl In a series of sea trials, a variety of adaptations to beam trawls were evaluated. The adaptations are aimed at reducing fuel consumption and environmental impact of beam trawling: • Wheels replacing the conventional shoe construction (fuel saving) • Large meshes in the back of the trawl (fuel saving) • T490 and square mesh cod4end (bycatch reduction) • Benthos escape panel (bycatch reduction)
300mm
200mm
120mm
Figure 548: Large meshes in the upper panel of the trawl
Figure 549: Wheels applied in the O489 beam trawl configuration

Report Number C002/08 141 of 425
The majority of the sea trials were performed on board O489, a 1200 hp beam trawler that fishes a beam trawl with chain matrix. These experiments yielded a reduction in fuel consumption of approximately 10% (with chain matrix) for similar catch values. One part of the alternative beam trawl configuration, the wheels, is now commonly used within the Belgian beam trawl fleet. When fishing on hard substrates, using the wheels results into a 5% fuel reduction. Moreover the wear on the gear is lower, reducing repair costs. On soft (muddy) substrates, the wheels sink into the substrate, increasing the drag of the gear and the fuel consumption.
5.2.2.3 Application of outrigger trawls on beam trawlers In this project, the feasibility of the (seasonal) application of outrigger trawls (with otter boards) on beam trawl vessels is investigated. These trawls are fished at lower speeds (3 kts) compared tot beam trawls (5 kts with chain matrix up to 7 kts with tickler chains), resulting in reduced fuel consumption. Due to the higher horizontal spread of the otter boards, however, a similar area can be fished. Outrigger trawls are less effective in catching flatfish, particularly sole. In a series of sea trials, catch composition, fuel consumption and safety issues were evaluated on different vessels (from 300 hp eurobeamers up to 1200 hp) and fishing grounds.
Figure 5410: Outrigger trawl
Figure 5411: Launching the otter boards from the derricks

Report Number C002/08 142 of 425
After some initial problems, practical and safety issues concerning the launch of otter boards from a single point (top of the derricks) could be solved. Furthermore fuel savings ranging from 40 up to 70% could be achieved when fishing the outrigger trawls compared to beam trawling. The catch composition changes, with markedly less sole being caught. In the trials, a few trips successfully focused on catching rays and nephrops. In general, the catch value is less (due to the absence of highly priced sole), but this is more then compensated by the fuel savings.
5.2.2.4 Project alternative fisheries This project is aimed at the introduction of a commercial hook and line fishery in the Belgian fleet. Like most passive gears, fuel consumption is limited in the hook and line fishery, moreover, these gears have little impact on the sea floor and benthic invertebrates and tend to be quite selective (in comparison to trawling).
Figure 5412: Hand lines
In an initial series of experiments, three hook and line fisheries (longlines, handlines and jiggers) were tested on a typical beam trawler (300 hp eurobeamer). None of these proved successful, vessel characteristics (difficult to handle, noisy) and crew inexperience were identified as the main causes for this failure.
Figure 5413: Catamaran set netter
In a second stage of the project, longlines and handlines were tested on board 2 set netters (up to 12 m catamaran type vessels) during the summer season (as an alternative to set nets for sole that are more success4

Report Number C002/08 143 of 425
ful in winter). These tests proved highly successful, revenues per day at sea were in the same order as a typical eurobeamer. However, in comparison with a eurobeamer the set netters are restricted to approximately half the days at sea (due to regulations, weather and tidal conditions). This was partly compensated by the improved cost structure, lower maintenance costs (1% compared to 7%), fuel costs (5% compared to 25%) and investment costs result in a higher proportion of the revenues going to profits and wages.
5.2.3 UK (SEAFISH)
In this section, we summarise the objectives and the achievement of several national projects relevant for the ESIF project. A specific webpage have been added to SEAFISH website, in order to provide full access to the different reports: http://www.seafish.org/b2b/info.asp?p=291.
5.2.3.1 Biofuels for the fishing industry. A three year project looking at the practical and economic feasibility of Biofuels as a fuel source for the fishing industry is currently underway in the UK. Results from this €1.1M project will be shared with this project. This project covers a number of related areas of work. This is currently ongoing, some of the work has been completed and reported and some is still in progress.
5.2.3.2 Biofuels for the Fishing Industry (December 2007) This report details work carried out to investigate the performance of biofuels in marine diesel engines, relative to the use of fossil petrodiesel. The scope of work ultimately included: 1. The installation of a dynamometer test facility, equipped to run diagnostic and simulated operational duty
cycles on marine diesel engines. 2. The leasing of a ~30 feet long fishing vessel, Ma Gandole, equipped for shell fish operations, to provide a
dedicated platform for the testing of biodiesel under real operating conditions at sea, based from Newlyn. 3. The fabrication of a 400 litre biodiesel batch production plant to produce self4manufactured biodiesel for
testing in the dynamometer test facility and the project fishing vessel. 4. Use of the dynamometer test facility to test a range of diesel additives, proposed for adoption by the UK
fishing fleet to reduce diesel fuel consumption and reduce costs. The dynamometer test facility was successfully installed, commissioned and brought into an operational state. It featured a Perkins marine diesel engine that had already seen operational service rather than a new engine as this was considered to provide a better analogue for actual in service engines of the UK sub410m fleet. The project suffered setbacks through major engine failures, one of which was attributed to the age of the engine that occurred shortly after the commissioning phase was thought to be complete, and another right at the end of the testing programme supported. Despite these setbacks, the report demonstrates that repeatable and reliable results were obtained from the dynamometer test facility. This document reports sea trials of Ma Gandole using bio4diesel meeting the BS EN 14214 biodiesel standard and self4manufactured biodiesel that did not, as well as sea trials with the engine running on BS590 fossil diesel. No operational problems were encountered with Ma Gandole’s engine when operating on biodiesel. The vessel did encounter operational problems over the project but these were not attributable to the fuel (for example, gearbox malfunction). No significant change in fuel consumption between fossil diesel and biodiesel was observable from the test run data.

Report Number C002/08 144 of 425
This document reports the results of tests on red diesel fuel additives, benchmarking these against identical test cycles with fossil diesel alone. The test cycle used simulated a trawler operating a 20 hour 40 minute excursion from Newlyn and within this involved 3, 4 hour long trawl stages. Seven additives were subjected to the trials. The results of this phase of the work indicate that there is no significant effect of any of the additives tested on the fuel consumption of the test engine through the test cycle used. If the results from the tests are considered typical of real duty cycles, then use of additives would increase operating costs for fisherman as they would have to pay for the additive as well as for the fuel. The test cycles adopted for this work ultimately were found to be very demanding on the test engine, especially for the biodiesels tested. As was consistent with the project rationale of minimal intervention when switching fuels, no engine modifications were made to the test engine between comparative trials between different fuels, other than those required as part of normal engine maintenance, e.g. top up of engine oil. Fuel consumption expressed in terms of litres / kWh of useful work provided indicated 14.5% higher fuel consumption than fossil diesel for the BS 14214 biodiesel and 19.3% higher fuel consumption for the self4manufactured fuel. With these figures and if the price of biodiesel is taken to be pegged to the price of fossil diesel for which it is a competing substitute (which is likely as it is dominated by the automotive fuel market as well as Government regulation), there would be no cost benefit to fisherman in switching to biodiesel. The exception to this observation is if biodiesel is self4manufactured by fishermen with control over local feedstocks at a much lower cost. This is why a self4manufacturing facility ultimately featured in the project scope. Under a maximum power test involving a full throttle setting and set points spanning the range of engine speeds, the engine produced less torque across the range with the biodiesels than with fossil diesel, as expected due to the lower calorific value of biodiesel in comparison to fossil diesel. In testing with the day trawler cycle initially used for the additives testing, approximately 2.2% of the disparity between fossil diesel and BS 14214 biodiesel fuel consumption could not be explained by the reduced calorific value of the biodiesel; for the self4manufactured biodiesel this figure was 4.3%. In the case of the BS 14214 biodiesel, this is attributed to engine timing settings that while being optimal for fossil diesel are sub4optimal for the biodiesel with its slightly different fuel ignition characteristics. Under the very demanding testing regime specifically imposed by the trawl stages of the day trawler cycle, the differences in fuel characteristics emerge in increased fuel consumption figures or equivalently slightly lower engine efficiency figures. During the test cycle stages with more moderate engine loading, the test engine had higher efficiency when running on biodiesel. This is attributed to the distinctions in ignition characteristics being overwhelmed by the superior lubricity of biodiesel fuels, widely reported in the biodiesel literature. With either of the biodiesels tested, the engine was able to support an identical fishing operational performance. Under the prolonged extremely high duty of the trawl stages of the day trawler test cycle, the test engine exhibited progressive deterioration in performance when run with the self4manufactured biodiesel. However the testing was completed successfully and the engine delivered the required performance using the fuel – but not without problems. After the test had completed, the engine was stripped down and had been found to have suffered a piston ring fracture in one cylinder and piston rings seized in their grooves in two other cylinders. This outcome is attributed to the fuel’s different ignition characteristics in comparison to fossil diesel. This difference is not great, but its significance and consequences are much more pronounced when the engine is operating at very close to full load at the specified engine speed. In an engine optimally timed for fossil diesel, the ignition characteristics of the self manufactured fuel lead to irregular combustion pressures. Irregular combustion pressures are the frequently cited reason for piston ring fractures. A piston ring fracture allows combustion gas by4pass into the crankcase. The evidence recorded in the data logged during the testing and the remaining problems identified upon strip down are corollaries of this event. It is worth noting that even after the phase of engine deterioration experienced (it is identifiable in the data recorded), the self manufactured biodiesel still recorded the highest engine efficiency figure for the simulated return trip to port. In the context of the project objective of examining the efficacy of biofuels for use in the fishing industry, the testing on the self manufactured biodiesel ultimately provided extremely useful information. In terms of engine
Report Number C002/08 145 of 425
performance, self4manufactured biodiesel should provide a competent fuel for skippers of fishing vessels, but even in a very well maintained engine, skippers must not expect that they can push their engines quite as hard as they could, over the durations that they do using fossil diesel, without relatively minor engine modifications to take account for specific variances in fuel properties that become more apparent when the engines are run at high loads for long durations, the engine timing being an obvious example. Unfortunately, these findings still require confirmation through continued testing. Increased fuel consumption or engine performance problems with this fuel observed in the especially demanding tests on the test rig were not observed in trials at sea, where fuel consumption figures were highly variable and no engine problems were encountered. This confirms that environmental conditions and typical operating duties are significant determinants of fuel consumption at sea, as was recognised at the outset of the project. It is particularly unfortunate and frustrating for the project team that equipment installed on Ma Gandole to measure the in4situ engine performance did not survive the wet environment below deck long enough to provide any reliable data. However, it is clear that actual duty cycles must be measured. It is only with this information that a definitive picture of the relative fuel performance will emerge. The facilities at Holman’s Test Mine created to support this project remain operational and the project staff now has permanent employment within the University. Therefore the capacity exists to undertake further work relating to marine fuels, and the priority research objective is engine performance testing following actual boat duty cycles, not test cycles that are so close to the maximum power curves that they push the engine toward destruction. It is hoped that with the continuing support of the Sea Fish Industry Authority for this work, reliable in4situ engine performance curves for trawling and potting boats in the ~10m class will be obtained and permit conclusive results on the relative performance of these fuels to emerge, that support the central finding of the work thus far: This project has successfully demonstrated the technical viability of bio4diesel as a fuel for fishing vessels. The practical issues surrounding relatively small scale production of bio4diesel from low cost sources have been explored such that effective practical support can be provided to any elements of the fishing industry that wish to consider this option.
5.2.3.3 Containerised biodiesel batch production plant (February 2008) This report details work carried out in assembly of a prototype containerised batch production plant that is portable and suited to deployment quayside to support fishermen that wish to self manufacture biodiesel. The biodiesel batch plant has a maximum production capacity of approximately 210,000 litres per annum when working one shift and approximately 420,000 litres per annum with 24 hour working. It is set up for an alkali catalysed (sodium hydroxide) tranesterification process that uses a pressurised reaction vessel and elevated reaction temperatures. These conditions make the reaction faster and produce bio4diesel of higher yield and purity in comparison to the process in similar plants where the reaction occurs at atmospheric pressure. Another key advantage of the plant design is that it uses a solid washing agent called magnesol that adsorbs remnant reactants, catalyst and many reaction by4products from the fuel after it has been separated out from the other product of the reaction (glycerol). This is not to say that difficulties were not encountered with the use of a solid washing agent: it proved necessary to carefully control and monitor the filtration process used to remove the pregnant magnesol from the fuel. Other similar batch reactors frequently wash the fuel with water that then requires discharge. This increases the scope of pollution control permitting and sets a requirement for water supply and drainage infrastructure (reducing portability), not present in the plant that has been designed. The infrastructure requirements comprise the provision of: i) a 32 amp, 3 phase power supply, ii) adequate exclusions of unauthorised personnel, iii) adequate movement areas for materials handling and iv) suitable mechanised handling equipment (a fork lift). The containerised reactor unit is self4bunded to contain inevitable spillages that occur while processing the fuel, and it

Report Number C002/08 146 of 425
is recommended that it be deployed with a sister container unit used to provide safe and secure storage of feedstock oils, reagents and other consumable items. Within this document the design is fully specified, the production process is outlined and the costs of production are presented. The measures to control risks appraised through a formal risk assessment translate into operational procedures that are detailed within Appendix 1: Operational Procedures and Appendix 2: Plant Maintenance. The reactor vessel is considered a pressure vessel and in the context of UK legislation and therefore must be inspected and insured accordingly. Options for handling co4products and waste products of the process are presented. While the plant has been successful in realising many of the design objectives, material handling and filtration problems were experienced with the prototype and these were exacerbated during cold weather. Production experience with the plant allowed estimation of the cost of production. Before taking into account the value of labour (estimated at around 5 per litre), the production cost per litre of biodiesel produced was at least 23 pence per litre when feedstock was locally obtained free of charge, and at least 53 pence per litre when commercially sourced recovered vegetable oil was used. Fishermen could readily be trained to use the existing plant as it exists in its prototype state at the time of writing; improvements to the process and the plant equipment have been identified as being desirable to implement in the first design revision before this stage.
5.2.3.4 Single vs. twin rig trawling
5.2.3.4.1 Background
BIM and SEAFISH are conducting economic and field research into the relative efficiency of the twin trawling method. Parameters such a fuel consumption drag, spread, gear costs and overall economic performance will be assessed. This project includes some joint work between Partner 6 (SEAFISH) and Partner 7 (BIM). The work conducted so far by SEAFISH has concentrated on the gear design, including scale modelling and Flume Tank testing of a twin trawl set4up for comparison with a single trawl rig achieving the same ground coverage. Some preliminary sea trials have been carried out by BIM which will be reported under their section. Included here is an outline of the methodology to be used for full4scale testing and information resulting from the gear development stages of the initial project which includes some results from Flume Tank testing. Within the ESIF project an examination of the method of twin4rig trawling was compared to standard single4rig trawls by SFIA and BIM. This follows on from a study carried out in 2004 by BIM (Rihan, 2004) that attempted to ascertain whether by returning to traditional single4rig trawling or indeed other methods such as seining that economic viability can be maintained by offsetting a reduction in fishing efficiency with a reduction in operating costs. This study concentrated on the twin4rig monkfish fishery and showed that a return to single rig did considerably reduce operating costs and fuel consumption although there were a number of caveats associated with the operational paarameters of the gears used, the species targeted and the vessel operations. In the earlier BIM study the twin4rig trawls together had more than 1.5 times the footrope length of the single trawl used whereas in this study the twintrawls are excatly a half size of the single trawl, thus giving equal footrope lengths, giving a more realistic estimation of relative fishing efficiency between twin4rig and single4rig gear. These trials involved Flume Tank Testing carried out in the SFIA Tank in Hull, engineering trials using gear monitoring systems to measure swept area and fuel consumption with twin and single rigs at full4scale on board a commercial fishing vessel and catch comparison trials. The second and third phases were carried out by BIM with technical support from SFIA.

Report Number C002/08 147 of 425
5.2.3.4.2 Aims/Objectives
To compare the fuel efficiency and catching performance of a single trawl with that of a half size, twin4trawl system achieving the same swept area, (door/wingend spreads) and sweep angles. This will be achieved in three stages: • Modelling and Flume Tank testing • Fishing gear performance trials • Commercial fishing trials To demonstrate the fuel efficiency; target catch; by4catch and discard reduction benefits of the half4size twin4trawl system when compared to a single net used in a targeted Nephrops fishery.
5.2.3.4.3 Modelling and flume tank testing
Three models at 1:8 scale, based on commercial net designs (Stuart Nets), were constructed for Flume Tank (FT) evaluation carried out by SEAFISH during 2006 (Arkley, 2006). The models represented 1 x ~20 fathom single trawl rig and 2 x half4size (~10 fathom) twin trawls for comparison. Representative door designs/sizes and sweep/bridle arrangements were selected to compare the two systems at matched door/wingend spreads and bridle angles. Rigging arrangements were identified to produce the most practical and efficient gear parameters compatible with the two systems. The information resulting from the FT tests was used to guide the setting4up of the full4scale elements of the project. The results from these tests are given below:

Report Number C002/08 148 of 425
Figure 5414: Single4rig vs. twin rig set4up
Having the same door spreads, and being towed at the same speeds, the trawls in the two systems will have the same ground coverage/swept area, i.e. the two smaller twin trawls will equate to the larger single trawl.

Report Number C002/08 149 of 425
Figure 5415: Single Net Arrangement – Case 1
30fthm sweep length
341’
θ
½ door spread:
133
30 fthm sweeps + 28’ spreaders (208’)
Sin θ = O/H =19/133 θ =8.2º This predicted bridle angle is less than required (~10º) This produces an estimated door spread of 97’ Re4calculating using a bridle angle of 10 º: Sin 10º =O/H =O/133 O=133 Sin 10 º O= ½ wingend spread O=133 x 0.17365 Wingend spread = ~46’ 46/95 = ~48% headline length. To get closer to the desired bridle angle (~10º) and wingend spread (40% headline length), sweep length will have to be reduced. (Suggested 20fthm.)
Assuming wingend spread at 40% of headline length 40% x 94’8’’ = ~38’
19’
133

Report Number C002/08 150 of 425
Figure 5416: Single Net Arrangement – Case 2
20fthm sweep length
281’
θ
½ door spread:
133’
20 fthm sweeps + 28’ spreaders (148’)
Assuming same wingend spread (38’) and bridle angle (8.2º), the reduced sweep length produces a door spread of ~80’.
Assuming wingend spread at 40% of headline length 40% x 94’8’’ = ~38’
19’
133
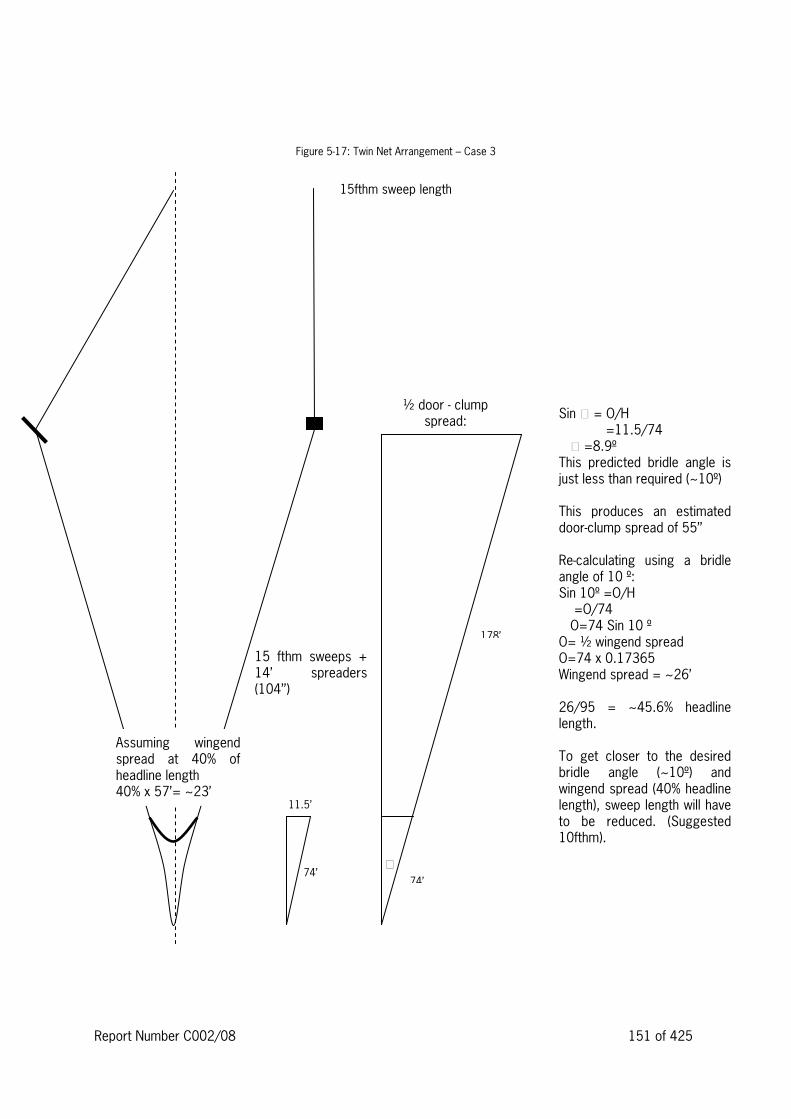
Report Number C002/08 151 of 425
Figure 5417: Twin Net Arrangement – Case 3
15fthm sweep length
178’
θ
½ door 4 clump spread:
74’
15 fthm sweeps + 14’ spreaders (104’’)
Sin θ = O/H =11.5/74 θ =8.9º This predicted bridle angle is just less than required (~10º) This produces an estimated door4clump spread of 55’’ Re4calculating using a bridle angle of 10 º: Sin 10º =O/H =O/74 O=74 Sin 10 º O= ½ wingend spread O=74 x 0.17365 Wingend spread = ~26’ 26/95 = ~45.6% headline length. To get closer to the desired bridle angle (~10º) and wingend spread (40% headline length), sweep length will have to be reduced. (Suggested 10fthm).
Assuming wingend spread at 40% of headline length 40% x 57’= ~23’
11.5’
74’

Report Number C002/08 152 of 425
Figure 5418: Twin Net Arrangement – Case 4
10fthm sweep length
148’
θ
½ door 4 clump spread:
74’
10fthm sweeps + 14’ spreaders (74’)
Assuming same wingend spread (23’) and bridle angle (8.9º), the reduced sweep length produces a door4clump spread of ~46’
Assuming wingend spread at 40% of headline length 40% x 57’= ~23’
11.5’
74’

Report Number C002/08 153 of 425
5.2.3.4.4 Flume Tank Tests:
Table 548: Results of flume tank tests 4 Net: 20fthm prawn trawl 4 single rig
Net: 20fthm prawn trawl – single rig
Warp Loads (Kg)
Rig Warp:Depth Speed
(k) Port Stbd
Door
Spread (Ft)
(heel)
Wing�end
Spread (Ft)
(bottom
wing)
Headline Ht
(Ft) Total load (Kg) Comments
3:1 (4) 2.25
(52) ~579 ~599 73.5 33 ~8 ~1178
3:1 (4) 2.25
(52) ~589 ~686 ~91 ~38 ~7 ~1275
6’ ‘V’ Doors Warp:~13’ @1:1 20fthm single sweeps (120’) Spread settings calculated @ 2.34m simulating 3:1 warp:depth ratio in 25fthm Assuming predicted spread of ~80’ at doors and ~38’ at wingends
Doors changed to 6’6’’ ‘V’ door (9)
Net under spread (~35% of headline) Doors at ~92% of predicted spread Increasing warp out to 6.5:1 (2) increased door spread to ~76’ and wingends to ~34’ Net better shape4reduced slack in top crown, wingend spread at 40% of headline – acceptable configuration Bridle angle:~9º

154 of 425 Report Number C002/08
Table 549: Results of flume tank tests 4 Net: 2 x 10fthm prawn trawls 4 twin rig
Net: 2 x 10fthm prawn trawls – twin rig
Warp Loads (Kg)
Rig Warp:Depth Speed
(k) P M S
Door
Spread (Ft)
(heel)
Wing�end
Spread (Ft)
(bottom
wing)
Headline Ht
(Ft) Total load (Kg) Comments
3:1 (4) 2.25
(52) 328 358 328 ~88 ~22 ~5 ~1014
3:1 (4) 2.25
(52) 297 415 261 ~104 ~30 <4 ~973
4’9’’ ‘V’ Doors (165kg) (3) Warp:~13’ @1:1 10fthm single sweeps (60’) Clump weight 179kg Assuming predicted spread of ~90’ at doors and ~23’ at wingends Clump reduced by ~40% to ~107kg
Middle warp shortened by ~6’8’’ Gear reasonably square and open Wingend spread at ~38.5% of headline length Clump down, doors stable, good contact at wingends Bridle angle:~8.5º Doors unstable 4 clump off bottom, gear overspread at doors compared to previous rig. Inside wings pulling ahead of outside resulting in net distortion More weight in clump required

Report Number C002/08 155 of 425
Table 5410: Results of flume tank tests 4 Net: 2 x 10fthm prawn trawls 4 twin rig
Net: 2 x 10fthm prawn trawls – twin rig
Warp Loads (Kg)
Rig Warp:Depth Speed
(k) P M S
Door
Spread (Ft)
(heel)
Wing�end
Spread (Ft)
(bottom
wing)
Headline Ht
(Ft) Total load (Kg) Comments
3:1 (4) 2.25
(52) 328 312 328 ~88 ~21.5 ~5.5 ~968
4’9’’ ‘V’ Doors (165kg) (3) Warp:~13’ @1:1 10fthm single sweeps (60’) Assuming predicted spread of ~90’ at doors and ~23’ at wingends Clump weight ~145kg Clump reduced by ~20% of original weight (~179kg) Middle warp shortened by ~1’to 7’8’’
3:1 (4) 2.25
(52) 323 369 271 ~92 ~21 ~5.5 ~963
Drag reduction from ~1.1t in single rig to ~0.97t in twin rig ~12% reduction from ~20% reduction in clump weight Doors stable, clump down, nets square, no distortion More weight now on middle warp increasing door spread

156 of 425 Report Number C002/08
Table 5411: Results of flume tank tests 4 Net: 2 x 10fthm prawn trawls 4 twin rig
Net: 2 x 10fthm prawn trawls – twin rig
Warp Loads (Kg)
Rig Warp:Depth Speed
(k) P M S
Door
Spread (Ft)
(heel)
Wing�end
Spread (Ft)
(bottom
wing)
Headline Ht
(Ft) Total load (Kg) Comments
3:1 (4) 2.25
(52) 369 343 287 ~105 ~23 ~4.75 ~998
5’2’’ ‘V’ Doors (161kg) (5) Warp:~13’ @1:1 10fthm single sweeps (60’) Assuming predicted spread of ~90’ at doors and ~23’ at wingends Clump weight ~145kg Clump reduced by ~20% of original weight (~179kg) Middle warp ~8’4’’short
More spread achieved Doors more difficult to shoot Further shortening of middle warp by~8’’ to bring gear square Clump down Wingend spread at 40% headline Bridle angle:~10º Note: to achieve a baseline bridle angle of ~10º and wingend spread at 40% headline length would require use of the larger 5’2’’ doors

5.2.3.4.5 Results of the flume tank tests
Check runs carried out to compare towing loads:
Rig settings as per initial single rig set4up: Door spread: 86’ Wingend spread: 36’ (~38% headline length) Headline height: 7.5’ Port load: ~609kg Stbd load: ~645kg Middle: NA Total: ~1254kg (~1.25t)
Rig settings as per twin rig set4up using 4’9’’ ‘v’ doors and clump weight at ~179kg, middle warp shortened by~7’8’’: Door spread: 92’ Wingend spread: 21’ (~37% headline length) Headline height: 5.5’ Port load: ~323kg Stbd load: ~271kg Middle: ~369kg Total: ~963kg (~0.96t)
Single rig total load: 1.25t Twin rig total load: 0.96t From 1:8 scale model tests in the FT the twin trawl rig load ~23% lower than that of the single rig. Recommendations from FT testing: The suggested arrangements to be used in the instrumented engineering sea trials are as follows: Warp: depth ratio: 3:1 (25 – 30fthm depth) Towing speed: 2.25 – 2.5k The trial nets should be measured prior to testing to establish headline length, footrope length and overall length of net (measured along selvedge line from wing end to codend). This will aid in calculating gear parameters as a check against instrument readings. Single rig trawl (~20fthm): ‘V’ door: 6’6’’ (~292kg) Split bridles (spreaders): 5.0fthm (30’) Single sweeps: 20fthm (120’) Floatation: 15 x 8’’ floats

158 of 425 Report Number C002/08
Aim to achieve wingend spread equivalent to ~40% headline length (For the nets under test this was ~38’) Aim to achieve door spread equivalent to ~ 2 x wingend spread (For the nets under test this was equivalent to ~80’) Bridle angles should be in the range of 8º410º Twin rig trawl (2 x ~10fthm): ‘V’ door: 4’9’’ (~165kg) Clump weight: ~145kg (~90% of door weight) Split bridles (spreaders): 2.5fthm (15’) Single sweeps: 10fthm (60’) Floatation: 7 x 8’’ floats Aim to achieve wingend spread equivalent to ~40% headline length (For the nets under test this was ~23’) Aim to achieve door 4 clump spread equivalent to ~ 2 x wingend spread (For the nets under test this was equivalent to ~46’) Bridle angles should be in the range of 8°410° It is recommended that additional door sizes should be made available to cover situations that may arise if predicted parameters are not achievable with the arrangements initially outlined. For example an intermediate door size (~5’) may be required to get closer to the desired gear parameters.
5.2.3.4.6 Fishing gear performance trials
The aim of this exercise was to establish the rigging requirements to achieve the desired door spread, wingend spread and bridle angle etc. (as identified from calculation and the FT testing), that was compatible with the two gear systems and practical for the chartered vessel. They also allowed effective comparison of the single trawl with the two half4size twin4trawls. Prior to the trials commencing gear technologists from SFIA and BIM measured the vessels existing twin4rig gear in order to facilitate construct the full size gears. This was carried out in June 2006 as reported in Arkley (2006). The trials were carried out on board the 11m/150hp vessel “Aaron4H” (Figure 5419) fishing out of the port of Courtmacsherry on the south4west coast of Ireland. This vessel works a three wire twin rig with a two barrelled winch system working day trips and fishing around 1004150 days per year. It is considered representative of inshore vessels in the size range of 10414m from both the UK and Ireland that target Nephrops and mixed demersal species.

Report Number C002/08 159 of 425
Figure 5419: Picture of the trials vessel – MFV “Aaron4H”
The main specifications of this vessel are given below in Table 5412.
Table 5412: Main particulars of the reference vessel
Item Value
Year built 1996
Length over all (m) 10.8
Breadth (moulded, m) 4.6
Moulded Depth (m) 2.0
Main engine power (kW) Gardiner 6LXB 150hp/65.5kw
Gearbox Mekanord Marine 3:1 reduction
Tonnage (GT) 13.94
Main target species Nephrops, mixed demersal
5.2.3.4.7 Gear
Table 5413 summarises the main parameters of the fishing gear used. The single trawl was constructed to be excatly twice the size of the two twin4rig trawls.
Table 5413: Main particulars of fishing gear of the reference vessel
Item Twin�rig Single�rig
Net manufacturer Stuart Nets Stuart Nets
Otter boards (type, size, and weight) 4ft 6’ Dunbar Vee Doors ~98kg 5ft Dunbar Vee Doors ~144kg
Centre Clump Chain Clump ~ 120kg
Main gear dimensions (circumference, beam width, (m)) 2 x 312 x 80mm 622 x 80mm
Headline length (m) 2 x 17.97m x 14mm
combination
35.94m x 14mm combination

160 of 425 Report Number C002/08
Item Twin�rig Single�rig
Footrope length (m) 2 x 22.48m x 6” & 8” discs
spaced 12” & 18” apart rigged
on 16mm wire
44.96m x 6” & 8” discs spaced
12” & 18” apart rigged on 16mm
wire
Fishing line 2 x 22.84m x 14mm
combination
45.68m x 14mm combination
Floats 7 x 8” floats each net 15 x 8”
Cod4end mesh size (mm) 80mm x 4mm single PE each net
with lifting bag
80mm x 4mm single PE with
lifting bag
Bridles 71.7m x 20mm combination 45m x 20mm combination
5.2.3.4.8 Gear parameters
Originally the trials were due to take place in summer 2007 but the vessel suffered an engine and gearbox breakdown that delayed the trials until 2008. Thus the engineering trials carried out on the “Aaron4H” over a 6 day period in May 2008. Following an initial test it was found as anticipated in the Flume Tank tests that a larger set of doors would be needed to spread the single trawl and for subsequent trials a set of heavier 5ft Dunbar vee doors were used. Every effort was made to reduce variability with trials tows carried out over the same ground under similar tidal conditions. Operations with and against the tidal flow were conducted and gear parameters measured over a range of towing speeds, water depths and warp to depth ratios. The gear parameters of the twin and single rigs were measured using Scanmar gear sensors. In addition a Floscan7500/7600 Multifunction Fuel Meter was fitted giving a combined digital LCD Engine Hour read out, Tachometer, Fuel Flowmeter, and Fuel Totalizer in a single 343/8" diameter instrument. The main gear parameters, towing speed information, warp:depth ratio and fuel consumption recorded are summarised in Table 5414.
Table 5414: Recorded Gear Parameters for the Single and Twin Rig Gears
Recorded Parameters Single Rig Twin Rig
Av. Net Speed (knots) 2.46 2.44
Warp Length (m) 183 228.75
Depth (m) 75 75
Bridle Length (m) 72 45
Warp/Depth Ratio 2.44:1 3.05:1
Av. Door Spread (m) 40.5 45.84
Av. Wingend Spread (m) 10.42 2 x 6.525 = 13.05
Av. Headline Height (m) 2.08 1.14
Bridle Angle 10º 10.5º
Av. Fuel consumption (l/hr) 20 20.75
From the gear parameters measured from both the single and twin4rig gear an estimate was made of the relative fishing efficiency in terms of swept areas and volumes, defined as follows: Swept Area Net = Wingend spread * speed Swept Volume Net = Wingend spread * headline height Swept Area Doors = Door spread * speed The results are summarised in Table 5415 below.
Table 5415: Estimates of Relative Fishing Efficiency with Single and Twin Rig Gear
Item Single Rig Twin Rig % Difference (single vs.
twin)
Swept Area Net (m²) 25.63 31.84 419%
Swept Volume Net (m³) 21.67 14.88 +46%
Swept Area Doors (m²) 99.63 112.,76 412%

Report Number C002/08 161 of 425
One of the objectives of these engineering trials was to match as far as possible the results from the model simulations and flume tank tests and to ensure that the swept area of the nets and doors were the same for both rigs and that the swept volume of the twin rig nets was half that of the single net. This, however, was not achieved as shown in Table 5415 in that the effective net and door swept area of the twin4rig was increased by 19% and 12% respectively. This was felt due to the fact that the vessel had difficulty in spreading the single rig trawl even with the larger doors than used with the twin4rig despite variations in the warp:depth ratio to try to counteract this. As a compromise it was decided to keep the bridle angles with both gears as similar as possible which meant increasing the bridle length with the twin rig to around1.5 times the length of the single rig and not twice the length as planned. The swept volume of the single rig net was found to be 46% more than the twin4rig trawls, which was close to the 50% simulated in the model and in the Flume Tank.
5.2.3.4.9 Commercial fishing trials
The main aim of this element of the project was to ascertain whether there was any fuel efficiency; target catch; by4catch and discard reduction benefits of the half4size twin4trawl system when compared to the single net used in a targeted Nephrops fishery. At the outset there were two options identified to complete this task: • To carry out the trial under an alternate tow procedure whereby the single and twin trawl arrangements are
swapped every haul. This was felt to be impractical, time consuming and ultimately prohibitively expensive in terms of vessel charter time and ‘down ‘time and was discarded.
• To carry out a period of fishing, say 243 days with one gear type before swapping and repeating the exercise with the second gear type. This pattern is then repeated over as long a period as possible. To be a realistic comparison variables have to be kept to a minimum. For example very similar fishing, tidal and weather conditions have to be maintained. This is very difficult to achieve. Down time is reduced but the effect of the variables such as weather, tide and catch availability can still strongly influence the results. This option was chosen as being the most appropriate.
5.2.3.4.10 Discussion of results
Catch comparison trials were carried out over a 16 day period during May4August 2008. It had been hoped to carry out this anaylsis over a longer period but this was not possible in the time available. In addition to the tow duration, towing speed, rpm and fuel conusmption, data on retained catch and fuel consumption was also collected routinely. Economic data on fuel costs and landed values were collected for each day and this was extrapolated to the individual tow level. It had been intended to record data on discards but it was found they were negligible in this fishery at the time of the trials and therefore was not subsequently collected. Data was collected from 21 tows with the twin4rig and 20 tows from the single rig. For the purpose of this study, the assessment of twin4rigging against single rigging was expressed by the following three measurments:
• fuel efficiency expressed as fuel costs as a % of gross earnings; • catch expressed in terms of gross earnings per hour (€/hr); and • cpue expressed in (kg/hr).
Table 5416 below shows the summary statistics for the three variables for both gears.
Table 5416: Summary Statistics for variables Single Rig (SR) and Twin Rig (TR)
Item Number of observations Mean Standard Deviation
SR Gross/Hour 20 66.15 30.88
TR Gross/Hour 21 72.27 32.96
SR Fuel as % of earnings 20 11.26 1.12
TR Fuel/as % of earnings 21 11.23 1.64
SR CPUE 20 25.56 11.10
TR CPUE 21 23.56 10.49

162 of 425 Report Number C002/08
Given this vessel only works day trips comprising 243 tows per day , it was decided to use gross earnings/hour towed to compare the relative efficiencies of the two gear types. This is a measure of performance used commonly by fishing skippers. Figure 5420 show the difference in gross earnings/hour by gear type over the number of trial tows and suggests little difference between the two gear types allowing for natural variation in catch per tow.
Figure 5420: Gross earnings/hour towed for both gear types
Gross earnings as a % of fuel costs per tow were used as an indicator of fuel efficiency for the two gear types. This is accepted as a reasonable performance indicator and again the curves suggest little difference between the two gears.
Figure 5421: Fuel as a % of gross earnings for both gear types
CPUE in kg/hour towed was also calculated for each tow as shown in Figure 5421 below. Again, except for several tows there would appear to be reasonable correlation between the two gears.

Report Number C002/08 163 of 425
Figure 5422: below shows a boxplot of the twin and single rig gears with
Boxplots for each of the three variables are shown below in Figure 5422, Figure 5423 and Figure 5424.
Boxplot of TR Gross/Hour, SR Gross/Hour
0
50
100
150
200
TR Gross/Hour SR Gross/Hour
Eur
o
Figure 5422: Boxplot of Gross hour for Twin Rig (TR) and Single Rig (SR)
Boxplot of TR Fuel/hour, SR Fuel/hour
6
8
10
12
14
16
TR Fuel/hour SR Fuel/hour
Figure 5423: Boxplot of Fuel/Hour for Twin Rig (TR) and Single Rig (SR)

164 of 425 Report Number C002/08
Boxplot of TR CPUE, SR CPUE
0
10
20
30
40
50
60
TR CPUE SR CPUE
Figure 5424: Boxplot of CPUE for Twin Rig (TR) and Single Rig (SR)
From the boxplots it can be seen that for all comparisons of the variables for the single rig and twin rig demonst4rated similar spreads of data with closely related mean values, see Table 5417 for values. An analysis of the two means was carried out using a student t4test. The null hypothesis stated that there was no statistically significant difference between the means of the gross/hour, fuel/hour and CPUE for single and twin rig gears The results (Table 5417) lead us to accept the null hypothesis; with alpha set at 0.05, the t4tests were not significantly different with all p4values > 0.05 indicating the gears were fishing similarly of the trial period.
Table 5417: Summary of t4test for three variables tested
Item
Degrees of
freedom
Pooled standard
deviation
Difference of
means
Standard error of
difference T statistic
P4value (two4
sided)
Gross/Hour 39 31.964 46.126 9.987 40.613 0.5432
Fuel/Hour 39 1.414 0.028 0.442 0.062 0.9506
CPUE 39 10.794 1.996 3.372 0.592 0.5574
5.2.3.4.11 Catch composition
An analysis was also carried out of the catch compositions from the two gear types as given the indicative extra headline height acheivable with the single rig it was expected that the roundfish catch (in this case haddock and whiting) would be higher than with the twin rig. Conversely it was expected that the twin rig would have a higher proportion of species such as Nephrops, megrim and sole.
Twin4rig Single Rig
Figure 5425: Catch composition of the twin4rig and single rig gears
The results showed that the single rig caught almost three times the amount of roundfish compared to the twin4rig, while the twin4rig caught over 2.5 times the amount of Nephrops. The difference between other species was less significant.

Report Number C002/08 165 of 425
5.2.3.4.12 Conclusions
Based on the findings of this study, there seems little advantage of one gear over the other in terms of fuel or catching efficiency. Any differences in earnings reflect the different catch composition that results when reverting to single4rig trawling from twin4rigging and vice versa. In this respect there is no doubt that when Nephrops are the main target species the twin4rig has a significant advantage over the single rig but the single rig will also catch a significant amount more roundfish than the twin rig due to the increased headline height, which in this study balanced the loss of Nephrops earnings. There are, however, subtle differences in the catch composition. The twin4rig is almost twice as efficient at catching sole as the single4rig and given the value of this species even small increases in catches are important to a vessel of this size and this was the skipper’s viewpoint. He also indicated that he found the twin4rig much easier to manoeuvre and also made the point that during times of the year he concentrated his operations in the night time when Nephrops and sole catches are highest and when roundfish catches with this type of low opening trawl would be at the lowest. For these reasons he preferred the twin4rig. In terms of relative efficiency it was found difficult to completely match the results from the model simulation and flume tank tests. Using twice the bridle length with the single rig compared to the twin4rig as calculated in th simulation, in the full scale trials gave bridle angles of over 18º, which was over twice that of the single rig. To achieve equivalent bridle angles the bridle lengths of the twin4rig had to be adjusted to around 60% of the single rig. This was felt largely due to the fact that the single rig was much harder to spread and required bigger trawl doors. The skipper felt that the single trawl would have to be reduced in size to achieve closer spreads to the twin4rig. In terms of fuel efficiency there was little or no difference between the two gear types. Fuel consumption for both gears were not statistically different when calculated in terms of % of gross earnings. Unlike the previous study carried out by BIM there were no other obvious advantages wih working a single rig compared to the twin rig in this case. There was no loss in time in working the twin rig, no saving in terms of maintenance and repair costs, nor was there any sign of extra wear and tear on the vessel as had been found previously on larger vessels. In all respects this vessel could work either gear equally as efficiently. The equivalence of the gears tested though make it difficult to conclude or extrapolate to the fleet level as had originally intended but it would appear on the basis of the results that for this size class of vessel, provided the basic parameter of the twin4rig gear not being over sized there is no economic or biological reason for vessels to change to single rig gear.
5.2.3.4.13 References
Arkley, K. (2006). Gear deatils for mfv “Aaron4H”. SEAFISH Report 27 June 2006. Rihan, D. (2004). Case Study 2. A comparison of twin4Rig Trawling and Single Rig Trawling in terms of Relative Fishing Efficiency. In: Thomsen, B., Revill, A., Rihan, D. and Eigaard, O. (Eds) Report of Efficiency and Productivity in Fish Capture Operations. Report of the ICES4FAO Working Group on Fishing Technology and Fish Behaviour (WGFTFB), ICES Fisheries Technology Committee ICES CM 2004/B:05, Ref. ACE. 20423 April 2004, Gdynia, Poland. ICES WGFTFB Report 2004pp 189.
5.2.3.5 Fuel Additives A program of research into commonly available fuel additives is about to commence. The purpose of the research will be to better inform the decision making of fishermen. Additives and their effects are numerous and this research will provide fishermen with objective information which they will be able to apply to their respective circumstances. Regenatec believe that with the vessel’s engine in appropriate mechanical health and the use of PPO together with additives now developed would result in satisfactory technical performance with superior environmental
166 of 425 Report Number C002/08
credentials. Regenatec’s work with Oxford Brookes University, Brunel University, Millbrook as well as with various fuel additive manufacturers and existing commercial vehicle customers further back up this view.
5.2.3.6 Industry testing of fuel line magnetic devices For many years now magnets have been sold to fishermen with the promise of fuel savings. The theory is that when the fuel is exposed to a magnetic field prior to combustion the ions in the fuel are aligned into straight chains which burn more efficiently as the oxygen can mix with the fuel better. This project will investigate the science behind the devices and also test the devices on board fishing vessels. A methodology of bollard pulls and sea diaries will be employed. It was the intention to test all of the fuel saving devices, on fishing vessels from around the country, fitted with fuel flow meters. Due to the amount of variables encountered by fishing vessels whilst operating at sea (tide, wind, seabed type, catch rates, drag) and the problems encountered with the calibration and accuracy of the fuel flow meters. It is extremely difficult to evaluate changes in fuel usage at sea resulting from the use of one of these devices/products. The only way to accurately measure any changes when applying these measures is to use a test bed engine where any variables are minimised and can be closely monitored. As part of the larger ‘Biofuels for the fishing Industry’ project, a test cell was setup using a marine diesel engine and dynamometer. This has proved to be the ideal facility for testing the fuel saving measures. During tests the facility has proven to achieve results with a high level of repeatability.
5.2.3.7 Fuel line magnets The intention is to test two types of magnets at the test cell facility. Straight/Permanent magnets, these are simply magnets which clamp around the fuel lines. The system supposedly works by standardising the molecules in the fuel giving a more efficient burn. The second system is an electro magnet system which is powered by an external means and can vary the frequency of the magnet fields in order to optimise fuel savings.
• Straight/Permanent Magnets – These have been supplied by Ethos MaxPower who has supplied 3 super Maxpower units. The testing for these magnets is scheduled to be carried out during the first two weeks in May with a report submitted by Mid June.
• Electro Magnets – The intention is to tests two manufacturers systems. The first one is supplied by Energy 21, who also supplied a fuel additive. The testing on this system is currently being carried out (week commencing 10th March 2008). The second system is supplied by Enersol the tests on this system are due to commence on the 1st April 2008. Report on these tests to be submitted by mid June 2008.
5.2.3.8 Modified exhaust systems
• Vortex Exhaust system – Two bespoke exhaust systems have been made by Vortex Exhausts for the test cell engine. This system works by aiding the removal of exhaust gases from the engine enabling a cleaner burn to be achieved. The claimed fuel saving is in excess of 12.5%. The tests on these two exhausts will be carried out during the last week of March.
5.2.3.9 Industry testing of innovative lubricating oil technologies Similar to additives and magnetic devices, fishermen are being contacted by salesmen pushing a new fuel saving lubricating product. The theory is sound, however fishermen are poorly informed on the science and the practical aspects of these technologies. This project will see scientifically robust tests of these products taking place and the results being presented to fishermen in a format they can understand.
5.2.3.10 Lubricating oil additives Lube Oil – This will be the final test to be carried out in by the test cell facility. Due to the way the oil works in coating the internal components of the engine only one oil can be tested. SEAFISH have approached a manufacturer (Belzona) and would look to test their product towards the end of May 08.

Report Number C002/08 167 of 425
5.2.3.11 Beamers switching to out4rigging Work has taken place in the Netherlands and Belgium with the help of SEAFISH technologists to swap beam trawls for outrigged otter trawls. The results of the trials to date have given hope for further development of this technology in the UK. Working with local fleets in the SW of England this project will look to apply gear tech solutions to different target species fisheries. This project is very similar to that carried out by Partner 5, ILVO and has some connections with the Belgian researchers involved.
5.2.3.12 A demonstration of “OUTRIGGER TRAWLING” in the SW of England on MFV Admiral Gordon
As part of Sea Fish Industry Authority’s strategic priorities of responsible sourcing, improved sales revenue and cost reduction, SEAFISH funded a project to demonstrate to the UK Beam trawler fleet an alternative fishing method known as “Outrigger”. The “Outrigger “fishing method replaces the heavy 4 m beams normally towed by the fishing vessel, with two demersal trawls towed from the derricks, each with its own set of trawl doors. Beam trawlers in Holland and Belgium have used this method with reported cuts in fuel consumption by as much as 50% for the Dutch vessels whilst initial results from Belgium have shown up to 70% reduction in fuel consump4tion. This method if successful could be adopted by suitable vessels at limited expenditure and with minimal alterations to the vessels. The trials involved the use of Scanmar trawl geometry equipment to establish the gear parameters and to optimise the fishing performance of the gear. In order to compare the fuel consumption of the vessel working Outrigger gear against the standard 4 m beams with chain mats, fuel flow meters were fitted to the vessel and catch samples taken.
5.2.3.13 Electro fishing for razor clams This project will see SEAFISH working with inshore fishermen from Wales who are seeking to demonstrate that electro fishing for razor clams is both environmentally and economically viable. This is likely to be a 3 year project. This project is ‘work in progress’ and as such at this stage there is no further information to report.
5.2.3.14 Net drag reduction A three year program of research commenced in 2007 which aims to utilize and develop new technologies which will reduce the overall drag of fishing nets whilst retaining their overall efficiency. Two projects have been completed that can be considered under this heading. The second project examining the performance of the ‘Eliminator’ trawl was primarily aimed at evaluating the gears potential as a means of reducing cod catches in mixed demersal goundfish fisheries. As such there is little or no reference to energy saving in this report. However, it is included here as the trawl design is also considered as having potential for reducing the overall drag of the gear, and hence could result in fuel savings. The idea could be further developed with these other potential attributes in mind.
5.2.3.15 Reducing drag in towed fishing gears4fishing trials to evaluate the performance of a trawl constructed from T90 (‘turned mesh’) netting
This report describes a demonstration trial of a single4rig, demersal whitefish ‘Rockhopper’ trawl constructed entirely of T90 or ‘turned mesh’ netting. This is the first time that T90 technology has been used in this way in the UK. The trawl used for this trial was designed and constructed by Icelandic trawl manufacturer, Fjardanet which has been pioneering this technology for a number of years. Descriptions of the fishing gear used are included. The report describes some background to the development work and the concept of T90 technology. Eight days of commercial fishing trials were carried out in January 2008 using the Shetland based vessel Mizpah operating on local fishing grounds about 50 miles NE of Lerwick. Despite being hampered by poor weather a total of 21 hauls were completed.

168 of 425 Report Number C002/08
The aim of the trials was to evaluate the performance of the T90 trawl with reference to fuel savings as a result of the reduced netting drag associated withthis technology. This was done by measuring the main gear performance parameters and comparing them with those of the vessel’s existing gear of the same general dimensions. Some catch sampling was undertaken to examine other reported attributes of T90 trawls such improved catch rates, size selection and catch quality. From a gear performance perspective the T90 trawl compared well with the vessel’s own trawl. The information gathered on the fuel efficiency aspects of the gear however did not show any significant benefits from the T90 trawl despite indications that the netting drag had been considerably reduced, e.g. ~20%. This may be due to the fact that the contribution of net drag can be relatively low in the whole operational profile of the trawler, and therefore this needs to be analysed in more detail. The findings from the catch data were inconclusive. There were some indications of larger size ranges of some species being caught and retained by the T90 trawl but the findings did not appear to bear out the findings and experiences of the Icelandic fishermen to the same extent. There was more loss of marketable size grades of some species, particularly whiting associated with the T90 trawl. This was thought to be as a result of the more consistent mesh opening noted throughout the T90 trawl. The positive side of this was that there were no discards recorded. There was no noticeable difference in catch quality detected. The results showed that the combination of the T90 trawl fitted with a conventional diamond mesh codend of the same mesh size produced the best commercial results. The results were insufficient to draw any firm conclusions on the overall effectiveness of the T90 trawl and a number of proposals for further work have been highlighted.
5.2.3.16 First results from a pilot study ‘North Sea fishing trials using the Eliminator trawl’ This study reports on the first known testing of a new design of trawl gear (known as the Eliminator trawl) in European waters. This pilot study has been undertaken during the first week of December 2007 to compare the fish catches from a new trawl design, the ‘Eliminator trawl’, to the fish caught in a typical industry whitefish trawl (described here as the control trawl). The pilot study was undertaken in the North Sea (off the Yorkshire coast) using two charter commercial fishing vessels. One vessel towed the Eliminator trawl, while the other towed the industry control trawl. Both vessels towed along parallel tracks in close proximity for the same duration. A total of twelve commercial4length hauls were obtained. The results from these paired4hauls indicate that the Eliminator trawl can be used to selectively target haddock and whiting in a mixed demersal fishery. Very few other species were caught in the Eliminator trawl and the catches were consistently dominated by whiting and haddock. This was not the case with the control trawl. Catches of whiting in the Eliminator trawl appeared to be skewed to the right, with a greater proportion of larger fish being caught than smaller fish (when compared to the control trawl). Overall, catches of haddock in the Eliminator trawl were around 75% of the catches from the control trawl, with no obvious length relationship. Catches of cod (all lengths) in the Eliminator trawl were around 90% less than the quantity caught in the control trawl. The Eliminator trawl also caught 83% less unwanted fish (normally discarded) of a variety of other species including gadoids, rays, flatfish and gurnards. This pilot study has demonstrated that the Eliminator may have considerable potential as a management tool to aid cod recovery or facilitate cod avoidance in mixed European demersal fisheries. There are likely benefits to be derived from further work aimed at improving the performance of the Eliminator trawl and for a range of complementary studies, all of which are described in this document.

Report Number C002/08 169 of 425
5.2.4 Ireland (BIM)
5.2.4.1 Outline Specification of Green Trawler (produced by Promara for BIM)
5.2.4.1.1 General
This specification together with a General Arrangement drawing describe a concept fishing vessel equipped for fishing with twin4rigged trawls, single rig or as a pair trawler. This concept vessel is designed to incorporate the highest level of efficiency available in a practical form for use in the Irish fishing fleet. This concept, however, does not necessarily follow the design restrictions currently imposed by rules and regulations both nationally and at EU level but strictly on design principles to maximise fuel efficiency. A typical trawler spends more than 20% of its time in transit to or from the fishing grounds and a similar portion of its time “dodging” in bad weather or moving fishing grounds at sea. Only 40% of its time is spent trawling. As quota restrictions become tighter and fuel costs spiral it is likely that fishing time will further reduce and therefore the propulsion equipment aboard fishing vessels in the future must be equally efficient when steaming as when trawling. The concept vessel is based on the capabilities, carrying capacity of a typical Irish trawler, which makes up a large part of the Irish demersal fleet. The vessel specifications are thus based on a trawler targeting traditional demersal species and Nephrops, as well as pelagic species such as Albacore tuna, mackerel, herring and sprat seasonally. Deck Machinery, electronic equipment, ventilation are all dimensioned in line with current specifications of existing Irish vessels and adequate for fishing in the North Atlantic. Hold capacity is identical and layout is designed with movable steel partitions and trunking(s) to deck level. The purpose of this specification is to provide the basis for more detailed plans of a “Green” trawler to be developed with a recognised boat yard and costed. The main novel features of the concept vessel include:
1. highly efficient hull shape 2. large propeller aperture with free flow to propeller 3. steering nozzle to minimise drag and maximise hull form 4. cruiser stern to minimise drag 5. engine orientation reversed to fit hull shape 6. efficient electro4hydraulic equipment
The vessel construction is designed to be certified by a recognised organisation and all equipment to be installed to be type approved. All of the component parts of this concept vessel are already in service. The unique feature in this vessel is that they are brought together to create a very fuel4efficient vessel at moderate extra cost.
5.2.4.1.2 Vessel Description
The primary design feature is to develop a very efficient hull form. This will be by necessity longer than current convention with a fine entry, longer length, narrower beam, efficient flowing lines, bulbous bow and contoured stern. This will provide an easily driven hull that can reduce propulsion and fuel consumption and increase transit speed. The propeller and its aperture will have an open flow of water with as little turbulence as possible. The propeller will be controllable pitch operating in a high efficiency nozzle. The hull is to be built in steel with two continuous decks – Main deck and shelter deck. The hull shape to be constructed with a round bilge construction and bulbous bow, narrow stern4skeg, fared stem and cruiser stern with very open flow to the propeller. Below main deck the hull is to be subdivided into about five watertight compartments: forepeak, thrusters/sonar room, insulated fish hold section, engine room with main engine connected to propeller in steering nozzle and aft4peak with tanks. On the main deck the hull to be arranged with forepeak, fish handling deck and handling deck abaft. Wheelhouse on a raised section just abaft midships to be constructed in aluminium and with 360° visibility. The vessel will have a power4take4off on main propulsion plant for a shaft driven alternator. The main hydraulic system will be driven by electric4driven4pump4units. To supply electric power, the vessel is fitted with two auxiliary gensets and a shaft generator. One genset is to be a silenced harbour set.

170 of 425 Report Number C002/08
Main dimensions Length overall 27.8 m Registered Length “L” 23.97 m Breadth moulded 8.00 m Depth midships 6.45 m Frame spacing 500 mm Estimated GT 267 GT Capacities Vessel to have the following carrying approximate capacities: Fuel Oil 25 tonnes Freshwater 5 tonnes Forepeak 0.8 tonnes Lubricating oil, storage 2 tonnes Hyrdualic Oil storage 2 tonnes Fish Hold 150 m³ Accommodation The vessel is to be arranged for a crew of seven in one x 1 man and 2 x 3 man cabins. Other arrangements may be considered but comfort is important, Accommodation on main deck to consist of the following rooms:
• Mess room able of accommodating 7 people • Galley • 14man cabin • Two three man cabins • 2 toilet/shower rooms
Hull Shell plating to be specified in accordance with Maritime rules. Indicative plate thickness is shown below. Keel Plate 25.0 mm Bottom Plating 10.0 mm Bilge Plating 10.0 mm Side Plating to main deck 7.0 mm Side Plating to shelter deck 7.0 mm Bulwarks 7.0 mm Stern Plating 10.0 mm Stem Plating 10.0 mm Engine foundations to be an integrated part of the bottom structure. The engine foundations to be of a strong construction and suitable for the proposed main engine. Fish Hold The fish hold outer boundaries, below main deck, are to be lined with 5mm steel plate (7mm at bottom). The sides and below deck4head are to be slot4welded to bulb4flat. The aft and forward bulkheads are to be arranged with horizontal stiffeners, welded to bulkhead stiffeners. The Lining plates are then to be slot4welded to horizontals, with reduced contact with engine room bulkheads. In way of fish hold flooring, angle bar profiles are to be welded on the tank4top, with lining mounted on angle bar flats. Drain channels to be arranged in the bottom lining. Bilge wells are to be built into bottom lining at the aft end. Upon completion of the lining, all areas to be pressure and tightness tested. Voids are to be foamed with expandable injection foam, quality 50kg/m³. The purpose of this is to provide an insulated hold capable of carrying bulk fish or boxed fish. Double Bottom Two double bottom tanks for fuel oil to be arranged below the fish hold.
Report Number C002/08 171 of 425
Main Deck The forecastle area will be arranged as a store with a bulkhead and access doors. Three main winches are to be arranged on the main deck. Bilge wells and automatic pumping will be arranged at port and starboard aft, midships and forward. Shelter Deck The Shelter Deck will be of aluminium and extend from bow to stern and will be watertight for stability purposes. Landing hatches and hatches for shooting and hauling fishing equipment will be fitted. In addition a hatch will be arranged in way of each net4drum above the aft shelter deck to allows nets to be taken below for repair. Fish Receiving Hopper A fish receiving hopper to be built into vessels below shelter deck construction. Rudder Arrangement A steering nozzle type rudder to be fabricated and fitted and approved by Class. The steering nozzle to have stern and heel bearing. A stuffing box to be fitted below the steering gear. Stainless steel liners on the rudder stock and bronze bushings to be fitted in the rudder well. Helm Angle will be 25º to port and starboard. This is sufficient to provide manoeuvrability. Larger helm angles means that the propeller is not working in ideal conditions in the nozzle causing vibration. Assuming a maximum speed of 12 knots, the steering gear will have a capacity of 6 tonnes4metres. This includes an allowance for surge loads and bearing friction. Rudder stock diameter would be 300cm, tiller diameter 170mm, lower pintle diameter 135mm. A bow thruster of 160hp to be also fitted for manoeuvrability in port. Fishing Equipment/Deck Machinery The following is an estimated package and would be subject to modification depending on the vessel owners proposed fishing operations. Main items:
• 3 x 15 tonnes split winches, storage capacity of 2000m x 20mmø warp • 2 x 10 tonnes split net drums • 1 x 8 tonne Gilsen winch • 1 x Anchor windlass
The complete system powered by three electro4hydraulic pumps of 50 kW capacity. The main hydraulic systems to be high pressure, approximately 190 Bar. System to consist of the electrical driven main pumps as described above. Remote control power packs are also to be electrical driven. Motors to be 440V, 50Hz, as the ships main electrical system. Propulsion Machinery All machinery shall of first class marine type approved. The installation to be laid out for easy maintenance. All foundations to be strong to limit vibration. All machinery parts to be classed and certified. Main engine to be mounted with chockfast Orange or equivalent, approved by Class, between engine and engine foundations. Torsional analysis of the complete propulsion plant to be carried out by engine supplier. A high speed main engine of 750kW to be fitted. Supplier to depend on owners preference. The main engine to be mounted in the engine room with then output facing forward. The main engine to be mounted in such a way as to allow a “V” drive to be fitted at the forward end of the engine room. The CPP pushrod and pitch control equipment to be incorporated in the output shaft. With the vessel to be equipped with a 750kW engine and 2400mm propeller diameter, optimum shaft rpm is approximately 190 rpm. Bollard Pull is expected to be around 12 tonnes subject to propeller design. This hull design will have a natural hull speed related to its waterline length “LWL”. The power required to reach this hull speed will be low. The shape will also reduce the power required to exceed this hull speed. Power Plant Up to three prime movers will be installed to drive generators, all controlled by a Power Management System (PMS). These will supply a central switchboard from which all loads aboard are powered, The PMS will monitor and anticipate loads so that the correct generating capacity is available at all times and so improving fuel economy. The vessel may also be designed with the feasibility to change fuel to MGO (Marine Gas Oil), MDO

172 of 425 Report Number C002/08
(Marine Diesel Oil) or IFO180. This will necessitate including storage, treatment and combustion facilities on board to use these less expensive fuels. Switchboards Main switchboards on board will be dead4fronted with rear closed. All switches and fuses to have access from the front. Switchboards to be laid out for parallel running of the alternators for changeover only. Socket for shore supply to be arranged as 10KW. Battery sets on board as follows:
• 1 x Battery 400Ah, emergency lighting • 1 x Battery 140Ah, radios • 1 x Battery 220 Ah, Aux 1 Start • 1 x Battery 220Ah Aux 2 start • 4 x Battery 220Ah, Main engine start.
On set of battery chargers to be delivered and fitted for each battery group. Class & Authorities The vessel to be built and to be fully certified by a recognised organisation. All required certification to be provided, Vessel is also able to comply with the requirements of Irish Department of Transport rules for steel trawlers taking into account the expected requirements of incoming legislation (COC for 16424m vessels). Drawings A sketch of the hull is attached to this outline specification in Figure 5426. The vessels features include a high length to beam ratio and a fine entry to the bow. The bow flare begins above the maximum design draft and is larger than normal for the size and type of vessel. The parallel mid4body is short and the aft section rises from a point close to the forward end of the engine room with a narrow4skeg housing and a relatively long propeller shaft. The cruiser stern is immersed by a small amount with the vessel in her light4ship depart4port trim.
Figure 5426: Outline General Arrangement for Green Trawler (produced by Promara Ltd., Cork, Ireland)

Report Number C002/08 173 of 425
Model Tests Introduction The following report describes towing tank tests on the green trawler design in comparison to a traditional Irish demersal trawler with similar dimensions, identical engine power and hold capacity. These model tests were designed to investigate the resistance and powering characteristics over a range of speeds. The tests were designed to (a) test that the design concept was fuel efficient; and (b) to determine the potential for increased fuel efficiency if certain regulatory restrictions on fishing vessel design parameters were lifted. The work was commissioned by BIM and Noel O’Regan of Promara, who witnessed the tests. The tests were conducted in the towing tank operated by Southampton Solent University by the Wolfson Unit. Models Models were constructed in wood and GRP, at a scale of 1:16, in accordance with drawings supplied by Promara, produced by Ian Paton of SC McAllister & Co Ltd. The vessels’ principal dimensions are presented in Table 5418, and lines plans of the hull forms are shown in Figure 5427 and Figure 5428.
Table 5418: Principal dimensions
All dimensions in metres Design A – Standard trawler Design B – Green trawler
Length overall 23.2 27.8
Length between perpendiculars 18.7 24.0
Length registered 19.8 23.97
Moulded beam 8.2 8.0
Moulded depth 6.45 6.45
Engine power (kw) 750 750 (fixed)
Hold capacity (m³) 150 150 (fixed)
GT 224 267 (estimated) Design A is the existing trawler designed with a registered length of 19.8 metres, to avoid regulations which would be imposed for vessels of 20 metres or greater. It is representative of contemporary “rulebeater” designs, with a wide beam and full, deep hull to maximise the volume and fishing capacity. Design B is the “green trawler” design, developed by Ian Paton, in conjunction with Promara, with the aim of providing the same fishing capacity, but with the length restriction relaxed to 24 metres. It therefore has a registered length of 23.97 metres. The beam was reduced to the minimum commensurate with stability requirements. The models did not include any appendages. Bilge keels were fitted to Design A to model those on the existing vessel. They comprised a series of flat plates, set in a 60° V configuration, but with short plates fitted alternately on each side of the keel, rather than a more conventional solid V shaped bilge keel. The keel was fitted on a diagonal. Following flow visualisation tests, alternative bilge keels were fitted, at the same longitudinal location and of the same depth, and aligned to the local flow. These were of conventional solid 30° V section. Design B was fitted with conventional flat plate keels, of the same depth as those on Design A, with a length in proportion to the relative registered lengths. They were located on a diagonal drawn, on the body plan, though the 4.5m waterline at the centreline, at 40 degrees to the horizontal. Following flow visualisation tests, solid V section keels were fitted at the same longitudinal location and of the same depth, and aligned to the local flow. Test Facility The tests were conducted in the towing tank at Southampton Solent University. The tank is 60m long, by 3.6m wide, by 1.8m deep. The towing mechanism and instrumentation were supplied and operated by the Wolfson Unit. The tank is equipped with a wave maker capable of generating sea states with waves of significant heightup to 3 metres at a scale of 1:16.

174 of 425 Report Number C002/08
Resistance Test Technique The models were ballasted to their appropriate displacement and centre of gravity position, and towed from this point using a mechanism that allowed freedom to heave and pitch. To ensure consistent boundary layer conditions, the model was fitted with standard turbulence inducing studs, 2.5 mm high x 3.2 mm diameter. The model resistance data were corrected to allow for the resistance of the studs, and the region of laminar flow ahead of them. The corrected model resistance data were extrapolated to full scale using the 1957 ITTC Model4Ship Correlation Line. An addition of 0.0004 was made to the full4scale skin friction coefficient to allow for surface roughness of the full scale craft. Measurements were made of resistance, trim and heave change from static at the tow point. Resistance Test Conditions And Results The Tank Tests were completed in two test conditions at a range of speeds
– Port departure – full fuel/no catch – Fishing ground departure – low fuel/full hold
The tested loading conditions are presented in Table 5419. In the case of both models, the loading conditions were prepared for the vessels as designed with bar keels, and with shell plating. These were not included on the model drawings, or on the models, which were built to the moulded lines supplied. The models were ballasted to the specified loading conditions, but these differences resulted in the test draughts being different from the draughts calculated for the vessels. The draughts listed in Table 5419 are as tested.
Table 5419: Loading conditions
The scaled results are shown in the following figures: Figure 5429: Design A. Variation of effective power with speed Figure 5430: Design A. Variation of resistance with speed Figure 5431: Design A. Variation of heave and trim with speed Figure 5432: Design B. Variation of effective power with speed Figure 5433: Design B. Variation of resistance with speed Figure 5434: Design B. Variation of heave and trim with speed Figure 5435: Comparison of resistance for the two designs. Depart port condition Figure 5436: Comparison of resistance for the two designs. Depart grounds condition Figure 5437: Design B, depart grounds condition. Variation of resistance, trim and heave with LCG location. Figure 5438: Variation of specific residuary resistance with volume Froude number The EHP and resistance data include the drag of all appendages fitted for the tests, hull windage and hull roughness. Photographs of the model under test are shown in Figure 5441, Figure 5442, Figure 5443, Figure 5444. The wetted area and residuary resistance data are supplied to enable re4scaling of the data to provide powering predictions for other vessels of similar hull form. Flow Visualisation Tests Visualisation of the flow over the hull was achieved using a paint and oil splatter technique, with a test run in the depart port condition at 10 knots. The models were removed from the tank and streamlines were drawn on the models in the region of the bilge keels. The resulting streamlines are presented in terms of their position around

Report Number C002/08 175 of 425
the girth of the hull, from the centreline in the absence of the bar keel, in Figure 5438. The locations are also shown of the various bilge keels tested. Photographs of the flow at the stern of both models are presented for comparison in Figure 5447. The paint streaks which indicate the flow direction are not present at the stern, where there is a region of weak flow, or possibly separated flow. Photographs of the flow over the bulbous bow region of each hull are presented in Figure 5448. The strong downward component of the flow is clearly apparent in both cases. Seakeeping Tests Each model was tested briefly in head seas, in simulated JONSWAP spectra with a range of significant heights and periods. Most of the tests were conducted in sea states with a modal period of 6 seconds, representing steep waves such as may be generated over a relatively short fetch, and in some sea states of 7 and 8 seconds period. Measurements were made of wave height, resistance, pitch and heave at the LCG. The scaled resistance data are presented inFigure 5435, together with the calm water resistance for comparison. The heave and pitch data are presented as response amplitude operators (RAOs), to non4dimensionalise their values with respect to wave height, in Table 5420 and Figure 5440. The towing tank is relatively short for seakeeping tests, and the number of wave encounters therefore is less than would normally be used for precise predictions. Nevertheless, the data are adequate for the comparative purposes required in this project.
Table 5420: Seakeeping test results. All tests with aligned bilge keels fitted.
Propeller Calculations Using the Wolfson Unit’s Propeller Design Program, a suitable propeller pitch was calculated for each hull to investigate further the potential fuel savings or speed increase offered by the alternative design. The calculations were based on a controllable pitch Kaplan type nozzle propeller. An installed power of 750 kW and a propeller diameter of 2.5 metres were assumed in each case, with wake fraction and thrust deduction factors derived from the Wolfson Unit’s Power Prediction Program. The results are presented in Table 5421. A number of cases were considered for comparison: Design A with keels as built, Design B with non4aligned keels, and Design B with aligned keels.

176 of 425 Report Number C002/08
Table 5421: Propeller design calculation results
Discussion These vessels, being of very full form for their length, have relatively high resistance characteristics but this is a characteristic of most fishing vessels designs. This is principally due to high residuary resistance, and various aspects of this have been demonstrated in these tests. The photographs of the models under test show the extreme wave system which develops at the higher speeds on both designs. Flow visualisation revealed a region of weak, or possibly separated flow under the stern, resulting from the adverse pressure gradient in that region. Transom immersion adds significantly to the resistance. All of these aspects of the resistance are lower for the green trawler (“Design B”) than for Design A. Design A, as built, has bilge keels which add significantly to the resistance, as shown in Figure 5430. Their segmented configuration and poor alignment to the flow combine to add up to 15% to the naked hull resistance. The addition is variable because the alignment of the keels to the flow varies with speed. Figure 5431 shows that the heave of the vessel with these bilge keels fitted is negligible, although the naked hull heaved down 0.5 metre at 11 knots. The keels therefore generate considerable lift because of their alignment across the local flow, with an associated penalty of substantial induced drag. Design B was tested with conventional flat plate keels. These added up to 20% to the naked hull resistance, as is evident in Figure 5433. The keels increased the bow down trim of the model by almost 0.5 degree at 10 knots, and inspection of Figure 5437 indicates that such a trim change alone can account for over 10% increase in resistance. The remaining increase is due to the induced drag of the keels resulting from their misalignment. Although the added resistance is a greater percentage of the naked hull resistance than for Design A, the actual increase in resistance was lower, 4.5kN at 10 knots for Design B compared with 5.5kN for Design A. The tests with correctly aligned keels demonstrate that keels of equivalent size can be fitted with little or no resistance penalty. This fact was demonstrated on both models. On Design B, tests were also conducted in the depart grounds condition, where the keels would not have been precisely aligned, and the resistance penalty remained negligible. See Figure 5433. To align the keels accurately requires a flow visualisation test on a model, but the fuel saving achieved over a modest period would justify the expense of such a model test. Tests on the bow thruster on Design A showed no significant resistance penalty. The data points are presented onFigure 5430. In general they lie within the scatter of the experimental data. Whilst it is usual to measure a small resistance penalty with unfaired bow thruster orifices, the resistance of the hull is very high in this case, and any differences are negligible in comparison. Both designs showed similar trim and heave behaviour, although Design B heaved down a little less than Design A, indicating that the wave trough amidships was relatively smaller. For both designs, the resistance in the depart grounds condition was greater than in the depart port condition. The differences were considerable at the higher speeds. This is particularly noticeable when the specific residuary resistance characteristics are compared, in Figure 5438, where the data have been normalised with respect to displacement. This may be due to less favourable LCG location and trim, and undoubtedly includes a penalty for greater transom immersion. The effect of LCG variation was investigated for Design B in the depart grounds condition. Tests were conducted at 8 and 10 knots, for a range of LCG locations varying from the design location to 1.5 metres further aft. The
Report Number C002/08 177 of 425
optimum LCG proved to be about 1 metre aft of the design location for this displacement. The resistance penalty at 8 knots is small, but at 10 knots is 11.5%. The comparison of the resistance of the two hulls in Figure 5435 reveals that extremely effective gains could be made in terms of fuel economy, if the regulatory constraints were relaxed to permit hulls similar to Design B. The naked hull resistance of Design B is 59% lower than that of design A at 10 knots in the depart port condition. The bilge keels as fitted to Design A further increase its resistance, and a comparison of Design B with correctly aligned keels reveals that its resistance is 62% lower than that of Design A with keels as built. To express this difference in terms of the penalty, Design A has more than twice the resistance of Design B, and will use more than twice the fuel, at 10 knots. At lower and higher speeds the differences are not quite so great, but remain very large. Similar differences are maintained in the depart grounds condition, with Design A having twice the resistance of Design B at 10 knots. These comparisons can be refined by considering the results of the propeller design calculations. In the first case the maximum speeds derived with the optimum propeller pitch were 10.0 and 9.3 knots for the two loading conditions tested. Design B could achieve speeds of 11.7 and 10.8 knots with non4aligned bilge keels, and speeds of 11.9 and 11.0 with aligned keels. These speed increases are quite modest because the resistance increases very rapidly with speed. The power reduction offered by design B is more dramatic, being in line with the resistance comparisons. Design B offers power savings of 57% and 48% in the two loading conditions, with non4aligned keels. With the keels correctly aligned these savings increase to 62% and 54%. In the sea states tested, the added resistance was greater for Design A than Design B at all speeds, so the difference in their fuel consumption would be greater when operating in waves. In all of the sea states, Design A exhibited substantially greater pitch motions than Design B, and in the sea states of 6 seconds period, the difference was approximately a factor of 2 at all speeds. This probably is the reason for the greater increase in resistance. In the longer waves the difference was less pronounced. The heave data show that neither model exhibited consistently greater heave than the other. Conclusions From the tank testing it has been shown that very substantial fuel savings can be realised if the regulations which encourage designs of restricted length were relaxed. Savings of 30% on fuel consumption could be achieved with relatively modest length increases. To achieve these savings, however, will require an increase in tonnage of 18% and therefore additional building costs. Savings of 10 to 20% could be achieved by aligning the bilge keels on new vessels, or replacing non4aligned keels on existing vessels. This process will require model testing, but the costs of such experiments are likely to be recovered within a fraction of the life of the vessel. Bow thruster fairings are unlikely to provide significant fuel savings on these types of vessel but subtle design changes to fairings over bow thrusters potentially will yield drag savings. It is estimated that the Gross Tonnage of the Green Trawler will be 267 4 270 GT. The Gross Tonnage of the reference trawler (Design A) is 224 GT, a difference of 46GT for a vessel with the same KW and effective fishing power but with a higher degree of fuel efficiency as indicated. This shows indicates that many current fishing vessel designs constrained are not fuel efficient. In many cases this is due to the fact that fishermen have sacrificed fuel efficiency for carrying capacity and greater towing power but also due to constraints imposed by regulations. The concept of “Green Tonnage” is felt something that should be considered by the EU and Member States whereby allow vessel owners would be allowed additional GTs for new builds over and above existing limits without being penalised. This would be strictly on the basis that the effective fishing power and carrying capacity are not altered or could even be reduced by a factor. This is along the lines of the provisions of Article 8 of EU regulation No 1483/2003, which allows additional tonnage for sfaety on board, working conditions, hygiene and product quality. This obviously needs to explore further as there has been difficulties with the implementation of Article 8 but the work on the Green trawler indicates that to be more fuel efficient vessels should be less constricted by arbitray rules that force them to be built as short boxy vessels and fishermen should be encouraged to look at general boat buliding principles, rather than fishing efficiency and carrying capacity.

178 of 425 Report Number C002/08
Figure 5427: Lines Plan 4 Design A (Standard whitefish trawler)

Report Number C002/08 179 of 425
Figure 5428: Lines Plan 4 Design B (Green Trawler)

180 of 425 Report Number C002/08
Figure 5429: Design A 4 Variation of effective power with speed

Report Number C002/08 181 of 425
Figure 5430: Design A 4 Variation of resistance with speed

182 of 425 Report Number C002/08
Figure 5431: Design A 4 Variation of heave and trim with speed

Report Number C002/08 183 of 425
Figure 5432: Design B 4 Variation of effective power with speed

184 of 425 Report Number C002/08
Figure 5433: Design B 4 Variation of resistance with speed
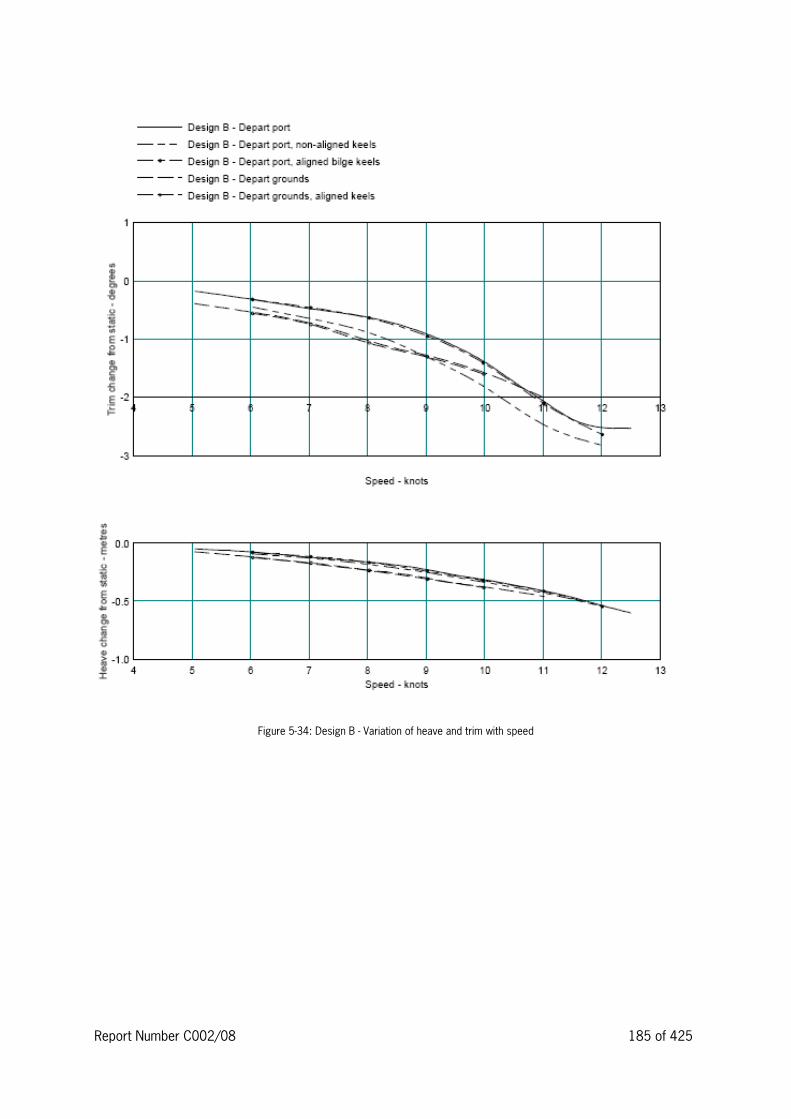
Report Number C002/08 185 of 425
Figure 5434: Design B 4 Variation of heave and trim with speed

186 of 425 Report Number C002/08
Figure 5435: Comparison of resistance for the two designs. Depart port condition

Report Number C002/08 187 of 425
Figure 5436: Comparison of resistance for the two designs. Depart grounds condition.

188 of 425 Report Number C002/08
Figure 5437: Design B, depart griunds conditions. Variation of resistance, trim and heave with LCG location

Report Number C002/08 189 of 425
Figure 5438: Variation of specific residuary resistance with volume Froude number

190 of 425 Report Number C002/08
Figure 5439: Bilge keel locations and their relationship to the local streamlines

Report Number C002/08 191 of 425
Figure 5440: Compairosn of the pitch and heave characteristics of the two designs

192 of 425 Report Number C002/08
Figure 5441: Design A 4 Depart port

Report Number C002/08 193 of 425
Figure 5442: Design A – Depart grounds

194 of 425 Report Number C002/08
Figure 5443: Design B 4 Depart Port

Report Number C002/08 195 of 425
Figure 5444: Design B 4 Depart grounds

196 of 425 Report Number C002/08
Figure 5445: Design A as fitted with bilge keels
Figure 5446: Design B as fitted with bilge keels

Report Number C002/08 197 of 425
Figure 5447: Flow visalisation at the stern

198 of 425 Report Number C002/08
Figure 5448: Flow visualisation at the bow

Report Number C002/08 199 of 425
5.2.5 France (IFREMER)
5.2.5.1 Project: Semi individual energetic diagnostic for Brittany trawlers
5.2.5.1.1 General
This project aims at offering very short term solutions to face the oil price rising. It is dedicated to trawlers for whom profitability is particularly sensitive to oil price. It is based on a system of voluntary participation of fishermen, followed by a selection of the cases in order to have a good representativity of the different fleet segments and metiers.
5.2.5.1.2 Methodology
The first step consists in collecting data from the selected fisherman : trawl and rigging design, average opening values. This step is based on exchanges that can be long sometimes. Then a simulation, using DynamiT, is done in order to get an accurate reference point. Then, through other exchanges with the fisherman, different optimisation options are proposed and discussed. New simulations are done to evaluate the potential drag reduction of optimised trawl gear. The method used to optimize the selected trawl gears is based on different options : • from numerical simulation, we observe the trawl shape and eventually decide to reduce number of meshes in
particular parts of the net in order to avoid slack meshes, • the use of higher tenacity material constituting the nettings (PE has been replaced by Breiztop (Le Drezen)
top in a number of cases), • increase the mesh size in particular part of the net (upper panel), • reduce the twine diameter in selected parts of the net (uppers parts), • once the net has been optimised, the door size can usually be reduced in order to decrease their drag. A
second chance to reduce the door drag is to choose a more efficient type (wooden doors replaced by Polyfoil (Morgère) doors for instance). At this stage some problems can be found concerning the door weight that may become too low in smaller size.
• in a low number of cases, the initial fishing gear did not have its “nominal” openings because of bad adjustments (door and/or rigging). In this cases, the same openings and potential fishing capabilities can be obtained with much smaller optimised trawl, which greatly amplifies the drag reduction.
• the optimised net geometry is always kept the same compared to the initial net in order to avoid an increase of fishing capabilities.
The work can be stopped at this stage and ends with an optimised trawl gear design available for the fisherman. When the fishermen decide to build the trawl resulting from optimisation study, a measurement survey can be organised to verify theoretical drag reduction are in good agreement with real observation. The ultimate step is to validate the fishing efficiency of the new gear, with is a task for the fishermen. A committee constituted by representatives of fishermen’s organisations, net makers, door makers and also fishermen has been established. Meetings are planned to get input from the equipment providers, from the fishermen, also to evaluate the work done and eventually reorient some actions if needed.
5.2.5.1.3 Some results
The table on the next page shows typical results obtained form this project :

200 of 425 Report Number C002/08
Table 5422: Results of Brittany Trawler project
Case study Trawler length
(m)
Drag reduction New trawl gear
price (€)
Fuel savings
(litres/year) (2)
Amortization time
(month)
1 11.24 14 % 7 700 (1) 5 040 40
2 12 8.8 % 5920 5 200 29
3 17.5 11 % 15 000 (1) 43 560 9
4 17.7 18 % 9 600 52 800 5
5 18.5 7.26 % 8 950 29 000 8
6 20.4 18 % 8 400 73 000 3
7 22 25 % 15 750* 52 500 8
8 24.96 20 % 16 000* 104 761 4 (1) Includes a set of adapted new doors; (2)To calculate the fuel consumption savings from the drag reduction, we have assumed the average trawlgear drag represents a consummation of about 2/3 of the total fuel consumption. 1/3 is supposed to be consumed by steaming, hull resistance in fishing operations, hydraulics, freezing systems.
Regarding this table, only one case has been validated at sea with good results (theoretical drag reduction comparable to measurements). These trials were undertaken aboard RV “Gwen Drez” (IFREMER) with all measurement facilities, which give an important advantage compared to measurements made onboard profess4sional vessels. Fishing efficiency was validated onboard a commercial trawler. A second case has been postponed for meteorological reasons. Two other cases will be validated at sea during the next months.
5.2.5.1.4 Some conclusions
In the middle of the project life, from the 35 study cases planned at the beginning, it has been decided to focus on only 17 cases, as they would be representative of the potential fuel savings that can be obtained with such methodology. Trials aboard commercial fishing vessels are not easy to realise and plan as “science” must be combined with real fishing operations. Moreover, space is often limited on small vessels. A good dialogue between the fisherman, the person in charge of optimisation and design, the net and door makers is vital for success of the operation. Numbers of fishermen have started to improve their fishing gear in order to reduce fuel consumption. This explains why the drag reduction potential is rather low in certain cases and rather important for other.
5.2.5.2 Project: “Grand Largue”
The ongoing project “Grand Largue” is led by the French company Avel Vor (http://www.avel4vor.fr/). The responsible person is P.Y. Glorennec. The objective of this project is to reduce the fuel consumption aboard fishing vessels by means of reintroducing sail propulsion. It considers that the free wind energy must be used by systems automatically controlled and optimised: automatic adjustment of sails, automatic adaptation of main engine power and optimised computer4assisted steering. Mast, sails are standard equipments and command will be made by electro4hydraulics systems. Naval architects, ship building society, engineering society, sail makers, and fishing companies are involved in this project. A 16m trawler will be equipped during the project and tested to assess the feasibility and effective fuel savings, among which a sailing rig (Figure 5449) the project leader estimates that on average 30% fuel savings can be achieved. The philosophy of the “GrandLargue” project can be summarised as follows: when the skippers decides to head for a direction, a computer will tell him whether the use of sails is interesting or not. If the wind is suitable, the sails will be automatically adjusted and the motor will adapt itself in order to have maximum energy efficiency.

Report Number C002/08 201 of 425
Figure 5449: Primary sketch of trawler equipped with automatic sail propulsion system.
202 of 425 Report Number C002/08
5.2.6 Italy (CNR)
5.2.6.1 Estimation of fishing effort and fuel consumption
5.2.6.1.1 Introduction
A preliminary, fundamental, step toward fishery forecasting for management purposes would thus be the set up of an automated Fishery Observing System (FOS). Typically the fishery sector was and it is still considered as user of information and products derived from research activity and its role as data source has been largely ignored (Simpson, 1994). In the framework of the MFSTEP4project (Mediterranean Forecast System: Toward Environmental Predictions) an innovative system to collect fish catches information has been realized and tested by Participant 10 (CNR4ISMAR). In particular, a Fishery Observing System (FOS) has been set up on some fishing vessels of the pelagic, otter trawling and purse seine fleet of the Adriatic Sea. Data collection started in August 2003 and it is still ongoing. In this pilot application the species selected is mainly anchovy (Engraulis encra4sicolus, Linnaeus), one of the most important commercial species, being the target of an important fishery in the northern and central Adriatic Sea with an annual catch fluctuating, at present, between 20,000 and 30,000 tonnes (Santojanni et al., 2003). The Adriatic Sea was chosen among the Mediterranean fishing areas for anchovy for three important reasons: it is the principal fishing area for this species, it is a continental basin (so relatively easy to monitor and with limited lateral advection), it is covered by regional and shelf MFSTEP models.
5.2.6.1.2 Anchovy fishery in the Adriatic Sea
Anchovy (Engraulis encrasicolus) caught by the Italian Adriatic fishing fleet represents 90% of the total catch in the Adriatic Sea and 24% of the total Mediterranean catch (Santojanni et al., 2003; Cingolani et al., 2004). The value of Adriatic anchovy landed catches was estimated at about 35 MECU in 1998. The importance of this species is thus obvious. The Italian fishing fleet for small pelagic fishes is distributed all along the Adriatic coast and two kinds of fishing gear are currently used: mid water pelagic trawl nets towed by two vessels (volante in Italian) and light attraction purse seines (lampara in Italian). The same fishing gear catches anchovy (Engraulis encrasicolus L.) but also 15 sardine (Sardina pilchardus Walb.) and to a lesser extent other pelagic fish such as sprat (Sprattus sprattus L.), horse mackerel (Trachurus spp.) and mackerel (Scomber spp.). The volante is mainly used in the northern and central Adriatic. At present approximately 70 pairs of fishing vessels use this gear; but there are wide variations in size and engine power. Bigger lampara vessels (25 boats) operate in the Central Adriatic, south of Ancona. Here it is almost common for a fishing vessel to switch from a lampara during the summer season (when there are favourable weather conditions for this fishing technique) to a pelagic trawl for the remaining part of the year. During the lampara fishing season (April/May–November) some fishing vessels registered in southern Adriatic move into the Central Adriatic increasing the lampara fishing fleet up to a total of about 50/55 boats. Smaller lampara (17 boats) operate in the Gulf of Trieste. Anchovy fishery experienced a sudden collapse in 1987, when only 700 tons were landed. Evidence from assessments suggests that the collapse was caused by very low recruitment. This was probably due to environmental factors determining the level of recruitment (Santojanni et al., 2006). Since then, total annual catches of anchovy have increased but complete recovery did not occur.
5.2.6.1.3 Fishery Observing System (FOS)
The development of the FOS was based on the need to obtain all possible data without impacting too much on the fishing activity (condition necessary in order to obtain fishermen’s collaboration). The FOS, in its last version, consists mainly of three components: an electronic logbook (EL), a GPS and a temperature and pressure recorder. The core component of FOS is the EL, in particular this is a computer with a touch screen as user interface. Catch data are put in by means of a dedicated software, programmed to be as user friendly as possible, where only the essential information are required for input. Information regarding the species are required, too. They are indicated by the software and for each species the skipper enters only the total catch for

Report Number C002/08 203 of 425
haul, an estimate of the mean size of individuals in the catch (this information is required only for anchovy and sardine) and the discards (in terms of catches and size). A CMC Electronics Smart GPS antenna is connected with and powered by the EL. Thus every time the EL is switched on, the GPS is as well and GPS records are stored every time catch records are. Position, date, time and speed are recorded every minute. Catch and effort data were used to estimate an abundance index (CPUE – Catch per Unit of Effort). Considering that catch records were gathered by different fishing vessels with different technical characteristics and operating on different fish densities, a standardized value of CPUE was calculated. A spatial and temporal average CPUE map was obtained together with a monthly mean time series in order to characterise the variability of anchovy abundance during the period of observation (October 2003 – August 2005). The fishing effort is identified as its catching capacity and could be quantified by the product of the fishing power (as better explained below) of that vessel and the time spent fishing. Most studies have found that fishing power is highly correlated with engine power, however crew size, age, tonnage, the gear used and the technological creep have also been found to be important factors affecting fishing power. Therefore, the definition of effort itself may not be straightforward. However, in this case, data will be available to estimate all the elements of the fishing effort identification. This especially applies to the gear data and the activity data, which will be available from GPS.
5.2.6.1.4 Coriolis Fuel Mass Flow Measuring System (CorFu�m)
In the current project, the real challenge will consist in measuring the fuel consumption of fishing vessels, and then produce an absolute daily energy consumption. A prototype instrument, named CorFu meter (CorFu4m), conceived at CNR4ISMAR Ancona (Italy) and developed in collaboration with Marine Technology Srl (Ancona) and Race Technology Ltd of Nottingham (England). The prototype is a result of research and development work based on design experience applied to improve all aspects of fishing technology sector. The CorFu4m system consists of three components.
1. two mass flow sensors. The sensors use the Coriolis measuring principle, which permit to operate independently of the fluid’s physical properties, such as viscosity and density. It is an economical alternative to conventional volume flowmeters;
2. one Multi Channel Recorder; 3. one GPS data logger.
Two measurement systems, to run on two boats of pair trawlers, have been ordered and contacts with the fishermen made for installation onboard. However, two GPS data loggers arrived before the other parts and preliminary tests of the GPS data collection were made ashore in the middle of March 2008. The selected vessels range in 90041000 hp with Loa of 25435m. The general characteristics of the investigated ships were obtained from papers on board or from the Classification Society Register. One of the two pair (named PB024AM, Table 5424) falls within the DCR activity of IREPA (Participant 11). The difference between the two vessels is mainly in propeller design, fixed v.s. controllable pitch (see Table 5423 and Table 5424). The area usually covered by both the vessels, and then the investigated area, spans over the entire Central and Northern Adriatic Sea. The current experiment has been set up in three phases: 1) systems fitting; 2) skipper behaviour monitoring; and 3) operational data collection. During the first phase (March4April), the two fishing vessels will be progressively equipped with the CorFu4m measuring systems. After the first phase, there will be a period (second phase) where the CorFu4m system will be turned on, fuel consumption and GPS data collected but the displays of the Multi channel recorders will be off. Afterwards, these data will be used to study the behaviour of skippers related to seeing or not seeing their fuel consumption. In a third phase (May4September), data will be analysed and the methodology refined. During this phase, data collection will continue using the same fishing vessels for the entire duration of the project, but the data set used for the analysis, spans over the period April–October. We plan to download fuel consumption and GPS data monthly.

204 of 425 Report Number C002/08
In the experiment, besides collecting fuel consumption (mass flow), geo4referenced positions, speed all by haul, operation such as sailing, steaming, etc. we will also collect data on catches per haul (commercial, discards, species composition and possibly lengths). After the end of the ESIF project, thanks also to national funding, we will continue to make use of the measuring systems onboard the selected vessels. Considering the high interest of the fishing fleet for the experimental CorFu4m fuel consumption system, it cannot be ruled out that we will try to monitor new ships belonging to the fishing fleet of Northern Adriatic. MFSTEP4FOS data will be merged with current fuel consumption measurement. Such results will permit a posteriori quantification of their performance in terms of energy efficiency of catch per unit of primary energy spent, which will be also split among the different fishing operations: steaming, searching and catching. Gear performances and drag will be measured separately on short cruises, using a SCANMAR system to measure the gear performance e.g. door spread, horizontal and vertical net opening net; electronic load cells to measure the warp loads; underwater force sensors inserted just in front of the wing4ends to measure the net drag ahead of the wing tips. All the instruments will be linked by RS232/485 serial ports to a personal computer, which automatically will control the data acquisition and will provide the correct functioning of the system in real time through an appropriately developed program.
Table 5423: Characteristics of the first investigated vessel and respective main engine.
Vessel’s characteristics
Name PB01�N (Acronym)
Type of fishing Pelagic trawling
Length overall [m] 27.00 Loa
Length between perpendiculars [m] 20.55 Lbp
Beam [m] 7.00 B
Gross Registered Tonnage 104.12 GRT
Net Registered Tonnage 37.23 NRT
Gross International Tonnage 139 GT
Net International Tonnage 41 NT
Main engine characteristics
Builder Yanmar
Engine power [kW] 671 P[kW]
Engine power [hp] 900 P[hp]
Propeller design Controllable pitch
Crew 7 E

Report Number C002/08 205 of 425
Table 5424: Characteristics of the second investigated vessel and respective main engine.
Vessel’s characteristics
Name PB02�AM (Acronym)
Type of fishing Pelagic trawling
Length overall [m] 28.95 Loa
Length between perpendiculars [m] 24.32 Lbp
Beam [m] 6.86 B
Gross Registered Tonnage 117.71 GRT
Net Registered Tonnage 4 NRT
Gross International Tonnage 112 GT
Net International Tonnage 4 NT
Main engine characteristics
Builder Mitsubishi
Engine power [kW] 940 P[kW]
Engine power [hp] 701 P[hp]
Propeller design Fixed
Crew 7 E
5.2.6.2 Replacement of Italian “Rapido” trawling by new light Mediterranean beam trawl
5.2.6.2.1 Rationale
In the Mediterranean Sea different types of beam trawl are being used. Provençal (from the Southeast of France) “gangui” and Catalan (NW Spain) “ganguils”, Greek “kankava” for sponges, Italian “rapido” for the sole and Sicilian “gangamo” for prawns and sea urchins are the most common examples. The rapido (Figure 5450) is a sort of beam trawl, used in the Adriatic Sea for fishing flatfish in muddy inshore areas. The gear consists of a box dredge of 34m wide and 170 kg weight, rigged with teeth of 547 cm long and a lower leading edge and net bag to collect the catch (Giovanardi et al., 1998). An inclined wooden board is fitted to the front of the metallic frame to act as depressor, keep the gear in contact with the seabed and, even more, press it on to the bottom to facilitate the penetration of the teeth in the sediment. A single vessel may tow four rapido’s simultaneously. The towing speed is about 647 knots and the fuel expenses are amongst the highest part of the running costs.

206 of 425 Report Number C002/08
CODEND
MOUTH
CHAINS
TRAWL NET
SKID
CHAINS
TEETH
WOODEN PLANK
d)
Figure 5450: a) Commercial rapido trawl used in GSA 17; b) particular of the inclined wooden board fitted in front of the metallic frame act as depressor; c) teeth; d) scheme of rapido trawl.
In the Adriatic Sea, the rapido fishery is forbidden within the 34miles limit and closed as all other trawling during 45 days in summerin order to protecte juvenile fish and increase their recruitment. In the Mediterranean rapido fisheries switching to light beam trawl gears may cause lower fuel consumption as well as fewer collateral impacts and meet ecological performance standards. Such gear replacement was considered to be a potential tool in the framework of the DEGREE4project (SSP84CT420044022576), which produc4ed incremental reductions in the energy saving and environmental impacts of such fishery, however the new beam trawl design still requires some further development to render them suitable for full commercial application.
5.2.6.2.2 Field work
In the framework of the DEGREE4project (SSP84CT420044022576), Participant 10 (CNR4ISMAR) conducted the development of three different light beam trawl prototypes. In order to substitute the rapido with a fuel saving and less impacting Belgian design in Adriatic waters, the possibility was initially examined of transferring existing beam trawl designs to the Mediterranean fisheries, where these have not been tried yet. This transfer of techn4ology has improved the efficiency of the current fishing gear development and research and avoided duplication of work. The work necessitated a trans4national transfer of knowledge between North4Europe and the Mediterranean. In 2006, Participant 10 (CNR4ISMAR) jointly collaborated with ILVO (Belgium) and CEFAS (England) in the develop4ment of a chain matrix beam trawl and a tickler chain beam trawl. Afterwards in 2007 the design of the tickler chain beam trawl has been changed further in an attempt to improve the catch performance. In 2006 and 2007, comparative sea trials of commercial rapido and light beam trawls were carried out on the Italian research vessel RV “G. Dallaporta” (810 kW at 1650 rpm; Length Over All 35.30 m and Gross Tonnage 285 GT). Sea trials were conducted in the course of two fishing cruises during different periods of the year on two different fishing grounds of the Central Adriatic normally exploited by local fishermen. The first cruise took place from 04/09/06 to 14/09/06 at about 20 m of depth, approximately 10415 nm off Ancona, and the second from 08/05/07 to 12/05/07 in an area ca. 5 nm North of Ancona, at a depth of about 15 m. During each haul two rapido or two beam trawls were towed. The two type of gears were alternated daily. The purpose of this task will be to simultaneously quantify and compare the fuel consumption and catches in terms of commercial species and discards from the rapido and beam trawls.

Report Number C002/08 207 of 425
Figure 5451: Different prototypes of the light beam trawls tested in the Adriatic Sea. a) Chain matrix beam trawl tested in 2006; b) first release of tickler chain beam trawl tested in 2006; c) second release of tickler chain beam trawl tested in 2007.
Commercial practice was followed with regard to trawling speed and tow time. Gear performance was measured on all hauls using electronic load cells to measure the warp loads. By means of the instrumentation mounted on this vessel, it was possible to measure some additional parameters. In particular a Doppler Log was used to measure the instant vessel speed in relation to the sea bed, a torsiometer measured the engine revolutions, the shaft torque, the shaft power and the fuel consumption of the main vessel engine. The ship is also equipped with an echosounder to measure the sea bottom depth and with a GPS to determine the vessel’s position. All instruments were linked via RS232/485 serial ports to a laptop which automatically controlled data acquisition and provided for correct real time system functioning through customized software. The main goal of these measurements was to obtain detailed, real time data on gear performance and to calculate vessel speed and tow duration (i.e. the time between optimum gear behaviour and the time when speed was reduced to recover the warp).
5.2.6.2.3 Preliminary results
The field work for this task will be completed with a third sea cruise planned for September 2008 to further improve the efficiency of the tickler chain beam trawl. Even if the data analysis has been just started and will be finished in the third year of the DEGREE project (200842009), some preliminary and qualitative results can be drawn: • the sea trials conducted so far supplied evidence that in the Adriatic Sea the rapido trawl targeting common
sole was characterised by multi4species catches; • the towing speed, towing forces, and fuel consumption of the light beam trawls were always lower than found
for the rapido. Therefore a noticeable fuel saving might be expected from switching to these beam trawls; • the first prototype of the chain matrix beam trawl was inefficient and replaced by a tickler chain beam trawl; • the Italian door manufacture “Grilli” sas and Participant 10 (CNR4ISMAR) patented the experimental beam
trawl (Patent Deposit nr. MC2007U000024); • nowadays, around 10 trawlers of the Central and Southern Adriatic coasts are commercially using the tickler
chain beam trawl.

208 of 425 Report Number C002/08
6 Analysis of potential fishing gear and vessel design and engineering topics
6.1 General A number of partners worked on fishing gear design and modification topics, and various partners worked on fishing vessel design and operational topics, i.e.: Partner 1 (IMARES), Partner 2 (TNO), Partner 6 (SEAFISH), Partner 7 (BIM), and Partner 10 (CNR4ISMAR). Partner 6 (SEAFISH) input includes Alternative energy sources and has concentrated on bio4fuels. Data collection is covered in the section: Bio4fuels for the Fishing Industry.
6.2 Numerical simulations of fishing gear The work was done by IFREMER, who in this chapter presents two optimisation cases related bottom trawls. The objective was to be able to propose immediate adaptations concerning the trawl gear in order to reduce fuel consumption and associated costs. The first case concerns a 54 m trawler with 1500 kW engine power operating in West Scotland. The second case concerns a 24 m trawler with around 600 kW operating in the British Channel. The objectives of these two studies are:
• to describe a methodology to optimise an existing trawl gear using a trawl simulation software • to evaluate the mean potential of drag reduction and the effect on fuel consumption.
6.2.1 Methodology
In the following lines, we will call “Reference case” or Case 0, the trawl gear model chosen as starting point towards the optimisation. The drag decrease will be compared to the drag of this original design and expressed relatively to this Case 0. Concerning fuel consumption, in case of unavailable data regarding scatter in consumption rates, we may assume that during trawling operation, 90 to 95% of the consumption is due to the trawl gear drag, and on average depends on the distance between fishing grounds and the home port, about 2/3 of fuel is used in towing the fishing gear. The vessel considered in this study operates in West Scotland.
6.2.1.1 Optimisation process The methodology we use is detailed below:
1. Estimation by simulation of the energy consumption for the reference case: total hydrodynamic drag and drag by component (doors, netting, cables).
2. Modification of certain parts of the net to reduce its netting surface and consequently its drag: reduction
of the twine diameter constituting meshes by the use of stronger materials and increase of mesh size in order to reduce netting surface once again.
3. The drag reduction subsequent to that of the netting surface results in a fishing gear which is over4
spread by its doors, as they have become proportionally too big. Thus, the next step consists in reducing the door size so as to fit them to the netting surface. The criteria are to get a new trawl gear with same a geometry in order to maintain the fishing capability constant.
4. Finally, the drag reduction is investigated component by component.
For step 2, cutting rates are kept constant.
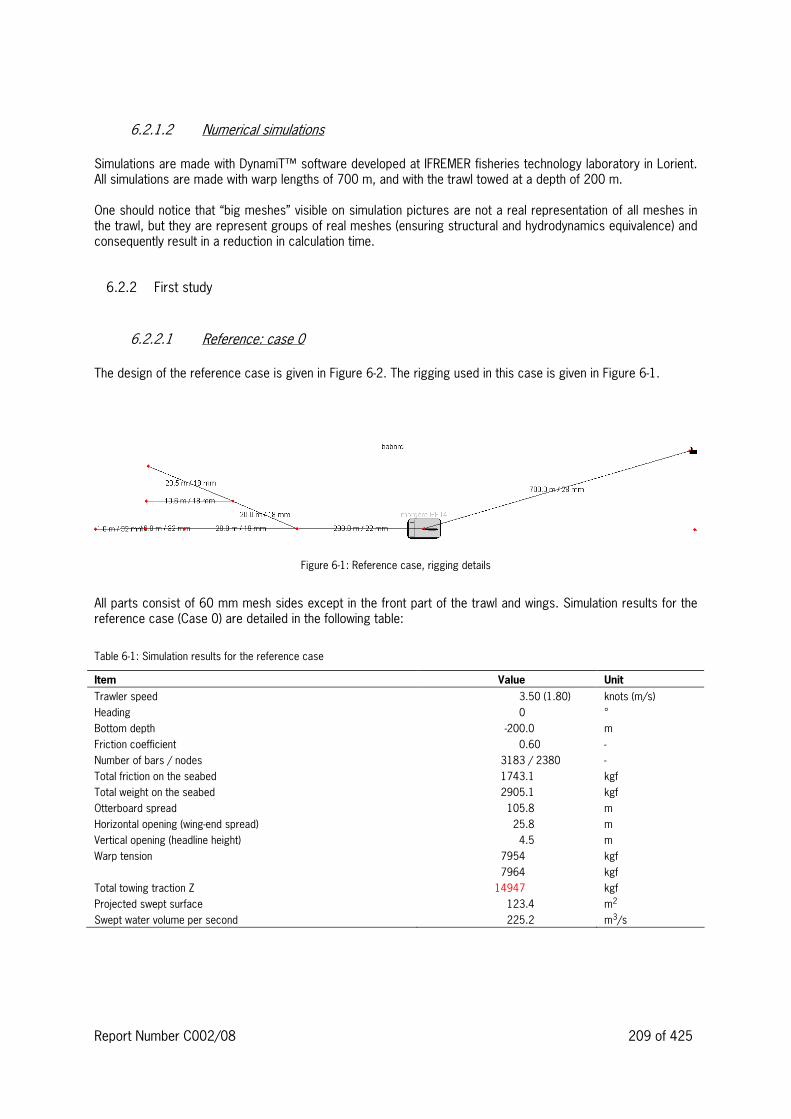
Report Number C002/08 209 of 425
6.2.1.2 Numerical simulations Simulations are made with DynamiT™ software developed at IFREMER fisheries technology laboratory in Lorient. All simulations are made with warp lengths of 700 m, and with the trawl towed at a depth of 200 m. One should notice that “big meshes” visible on simulation pictures are not a real representation of all meshes in the trawl, but they are represent groups of real meshes (ensuring structural and hydrodynamics equivalence) and consequently result in a reduction in calculation time.
6.2.2 First study
6.2.2.1 Reference: case 0 The design of the reference case is given in Figure 642. The rigging used in this case is given in Figure 641.
Figure 641: Reference case, rigging details
All parts consist of 60 mm mesh sides except in the front part of the trawl and wings. Simulation results for the reference case (Case 0) are detailed in the following table:
Table 641: Simulation results for the reference case
Item Value Unit
Trawler speed 3.50 (1.80) knots (m/s)
Heading 0 °
Bottom depth 4200.0 m
Friction coefficient 0.60 4
Number of bars / nodes 3183 / 2380 4
Total friction on the seabed 1743.1 kgf
Total weight on the seabed 2905.1 kgf
Otterboard spread 105.8 m
Horizontal opening (wing4end spread) 25.8 m
Vertical opening (headline height) 4.5 m
Warp tension 7954
7964
kgf
kgf
Total towing traction Z 14947 kgf
Projected swept surface 123.4 m2
Swept water volume per second 225.2 m3/s

210 of 425 Report Number C002/08
Figure 642: Reference trawl design

Report Number C002/08 211 of 425
Figure 643: View of the reference trawl
The tension to be taken into account is in red (Figure 643) and will be used to compare with optimisation results (towing force on Z axis).
6.2.2.2 Optimisation: Case 1 The first modifications of the netting parts are listed hereafter: � The first wing part is replaced by 100 mm meshing Breztop™ instead of 75 mm. � All the following parts of the upper panel are changed to 75 mm Breztop instead of 60 mm. � The lower panel meshing is increased to 75 mm instead of 60 mm to the middle of the belly, the rest (to the
codend) is not modified. These changes in the mesh sides also go with a decrease in twine diameter using a stronger product. This leads to a 26% reduction of twine surface area (from 309 m² to 228 m²).

212 of 425 Report Number C002/08
Figure 644: Trawl design for optimisation Case 1

Report Number C002/08 213 of 425
Simulation results are given below:
Table 642: Simulation results for optimised Case 1 with PF14 door (too big)
Item Value Unit
Trawler speed 3.50 (1.80) knots (m/s)
Heading 0 °
Bottom depth 4200.0 m
Friction coefficient 0.60 4
Number of bars / nodes 3188 / 2384 4
Total friction on the seabed 2157.8 kgf
Total weight on the seabed 3596.3 kgf
Otterboard spread 130.2 m
Horizontal opening (wing4end spread) 30.2 m
Vertical opening (headline height) 4.3 m
Warp tension 6887
6916
kgf
kgf
Total towing traction Z 12912 kgf
Projected swept surface 142.2 m2
Swept water volume per second 261.8 m3/s
The effect of diminishing the netting drag with the same doors leads to an overspread of the wings (about 23% more spread than for the reference case). In order to keep the trawl geometry about constant, the door size is decreased: PF11 are used instead of PF14. The results of this new simulation are presented in the table below.
Table 643: Simulation results for optimised Case 1 with PF11
Item Value Unit
Trawler speed 3.50 (1.80) knots (m/s)
Heading 0 °
Bottom depth 4200.0 m
Friction coefficient 0.60 4
Number of bars / nodes 3188 / 2384 4
Total friction on the seabed 1824.8 kgf
Total weight on the seabed 3041.3 kgf
Otterboard spread 108.3 m
Horizontal opening (wing4end spread) 26.2 m
Vertical opening (headline height) 5.2 m
Warp tension 6309 kgf
Total towing traction Z 6311 / 11790 kgf
Projected swept surface 139.4 m2
Swept water volume per second 256.3 m3/s
We have more or less the same geometry than for Case 0 with PF11 doors. The drag of the trawl gear is about 21% smaller than for reference case (Case 0). For such a twine diameter reduction in the upper panel, we may find a lower upward force of the net applied on the ground gear. Consequently, the gear may have more friction on the seabed. Thus, it would be interesting to reduce the gear weight in water.
6.2.2.3 Optimisation: Case 2 The modifications versus the reference case are listed below : � Netting in upper wing parts is replaced by 100 mm (instead of 75 mm) and diameter is decreased. � Lower wings remain in 75 mm mesh size. � Upper panel is in 75 mm with decreased diameter for upper part and in 60 mm for lower part.

214 of 425 Report Number C002/08
� Belly parts are unchanged. We obtain the design given in Figure 645. The netting twine surface area reduction is about 29% compared to the reference case and 4% compared to previous optimised Case 1. For Case 2, with PF14 we got the following results:
Table 644: Simulation results for Case 2 with PF14
Item Value Unit
Trawler speed 3.50 (1.80) knots (m/s)
Heading 0 °
Bottom depth 4200.0 m
Friction coefficient 0.60 4
Number of bars / nodes 3183 / 2380 4
Total friction on the seabed 2161.8 kgf
Total weight on the seabed 3603.0 kgf
Otterboard spread 129.5 m
Horizontal opening (wing4end spread) 30.2 m
Vertical opening (headline height) 4.2 m
Warp tension 6900
6930
kgf
kgf
Total towing traction Z 12939 kgf
Projected swept surface 138.2 m2
Swept water volume per second 254.5 m3/s
As for the previous Case 1, door size is decreased so as to fit with the geometry of the initial design, leading to the results below:
Table 645: Simulation results for Case 2 with PF11
Item Value Unit
Trawler speed 3.50 (1.80) knots (m/s)
Heading 0 °
Bottom depth 4200.0 m
Friction coefficient 0.60 4
Number of bars / nodes 3183 / 2380 4
Total friction on the seabed 1847.2 kgf
Total weight on the seabed 3078.7 kgf
Otterboard spread 105.5 m
Horizontal opening (wing4end spread) 25.7 m
Vertical opening (headline height) 5.0 m
Warp tension 6313
6302
kgf
kgf
Total towing traction Z 11783 kgf
Projected swept surface 134.5 m2
Swept water volume per second 246.7 m3/s

Report Number C002/08 215 of 425
Figure 645: Trawl design for optimised Case 2

The results achieved for Case 2 with PF11 show more or less the same geometry than those for the reference case. We get a 11783 kgf drag for the trawl gear at 3.5 knots, which is about 21% lower than for reference case and more or less the same drag reduction than for Case 1. The remark done for Case 1 about the behaviour of ground gear remains valid.
6.2.2.4 Synthesis The two tables below give the main results for the reference case and optimised cases:
Table 646: Synthesis of simulations for reference and optimised cases
Case Towing
speed
(knots)
Total towing force 2
(kgf)
Door drag
(kgf)
Net drag
(kgf)
Cable (warps,
sweeps, bridles)
drag (kgf)
Case 0
3.5 14947 16.5% 79.0% 4.5%
Case 1
3.5 11790
savings: 21 %
17.3% 76.4% 6.2%
Case 2 3.5 11783
savings: 21 %
The gear geometry results are presented below. The theoretical catching efficiency should be at least equal to the one of Case 0.
Table 647: Gear dimensions and swept volume for the three cases compared
Case Towing speed
(knots)
Vertical opening
(m)
Wing tip distance
(m)
Filtered volume
(m3/s)
Case 0 3.5 4.5 25.8 225.2
Case 1
3.5 5.2 26.2 256.3
(+14%)
Case 2 3.5 5.0 25.7 246.7
(+9%)
6.2.3 Second study
The trawler considered in this study is 24 m long and usually fishes in the British Channel and North Sea. Target species are cod, whiting, red mullet and other benthic species.
6.2.3.1 Numerical simulations All simulations are made with warp length of 280 m for a depth of 100 m and a semi pelagic rigging. One will notice that “big meshes” visible on simulation pictures are not realistic but they are equivalent to real meshes (structural and hydrodynamics equivalence) and allow a consequent reduction in calculation time.
2 Which must not be confused with the tension in the warp: the drag is the horizontal force component in the warp which must be overcome by the propeller thrust.

Report Number C002/08 217/425
6.2.3.2 Reference: Case 0 The design of the reference case is given on Figure 647. The rigging used in this case is given Figure 646. Doors are PF10 with a weight in water of 1300 kg.
Figure 646: Reference case, rigging details
All parts consist of 60 mm mesh sides except in the back part of the trawl where 45 mm mesh sides are used. Simulation results for case 0 are detailed below:
Table 648: Simulation results for the reference case
Item Value Unit
Trawler speed 3.50 (1.80) knots (m/s)
Heading 0 °
Bottom depth 4100.0 m
Friction coefficient 0.60 4
Number of bars / nodes 1410 / 1084 4
Total friction on the seabed 595.5 kgf
Total weight on the seabed 992.5 kgf
Otterboard spread 67.5 m
Horizontal opening (wing4end spread) 16.3 m
Vertical opening (headline height) 3.3 m
Warp tension 3277
3282
kgf
kgf
Total towing traction Z 6106 kgf
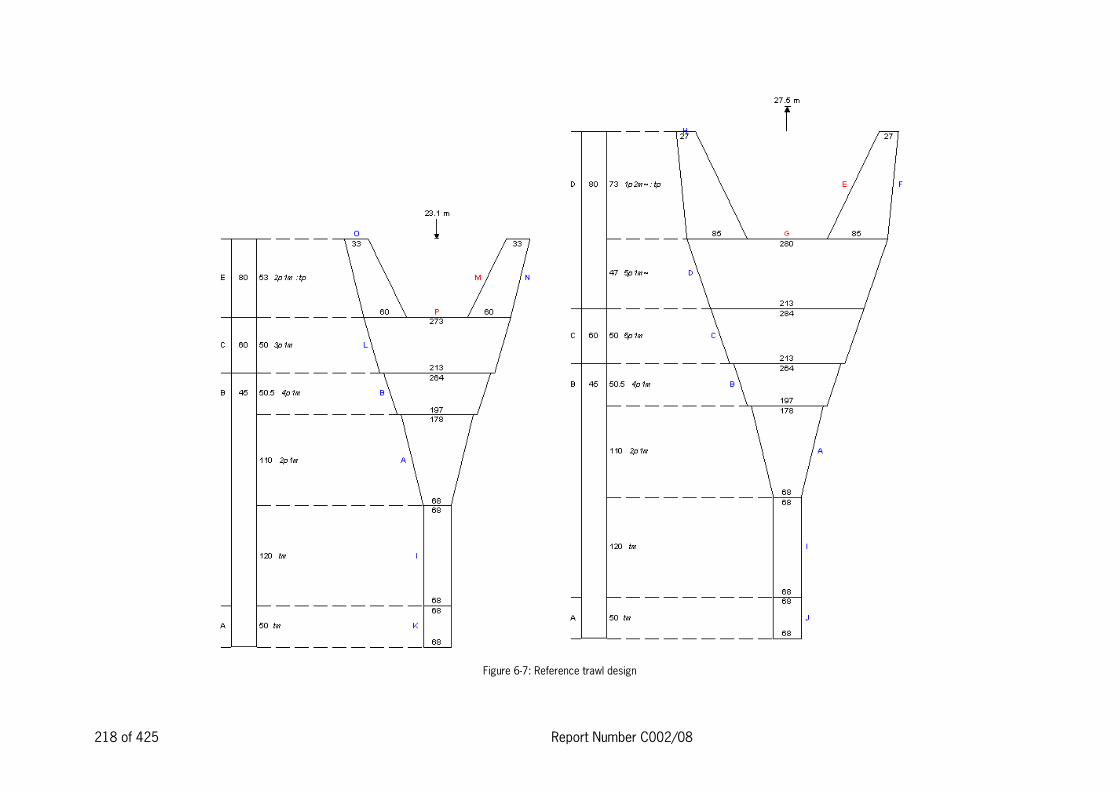
218 of 425 Report Number C002/08
Figure 647: Reference trawl design

Report Number C002/08 219/425
Figure 648: View of the reference trawl
The tension to be taken into account is in red (Figure 648) and will be used to compare with optimisation results (towing force on Z axis).
6.2.3.3 Optimisation: Case 1 The first modifications of the netting parts are listed hereafter: � Previously used Argon 3 mm diameter is replaced by Breiztop 2 mm. � Previously used Argon 4 mm diameter is replaced by Breiztop 3 mm � Upper part of wings are changed to 500 m mesh side polyamid 12 mm in diameter. These changes in the mesh sides also go with twine diameter decrease using stronger product. This leads to a 24% reduction of twine surface area.

220 of 425 Report Number C002/08
Figure 649: Trawl design for optimisation Case 1

Report Number C002/08 221/425
Simulation results are given hereafter:
Table 649: Simulation results for optimised Case 1 with PF14 door (too big)
Item Value Unit
Trawler speed 3.50 (1.80) knots (m/s)
Heading 0 °
Bottom depth 4100.0 m
Friction coefficient 0.60 4
Number of bars / nodes 1410 / 1084 4
Total friction on the seabed 733.5 kgf
Total weight on the seabed 1222.4 kgf
Otterboard spread 77.6 m
Horizontal opening (wing4end spread) 17.4 m
Vertical opening (headline height) 3.0 m
Warp tension 2897
2902
kgf
kgf
Total towing traction Z 5383 kgf
The total drag is reduced by 11.8% compared to Case 0. The effect of reducing the netting drag with the same doors leads to an overspread of the wings (about 7% more spread than for the reference case). In order to keep the trawl geometry about constant, the door size is decreased: PF8 are used instead of PF10. The results of this new simulation are presented in the table below, the drag reduction with the smaller doors is 17%.
Table 6410: Simulation results optimised case 1 with PF11
Item Value Unit
Trawler speed 3.50 (1.80) knots (m/s)
Heading 0 °
Bottom depth 4100.0 m
Friction coefficient 0.60 4
Number of bars / nodes 1410 / 1084 4
Total friction on the seabed 614.2 kgf
Total weight on the seabed 1023.6 kgf
Otterboard spread 69.5 m
Horizontal opening (wing4end spread) 16.5 m
Vertical opening (headline height) 3.2 m
Warp tension 2722
2725
kgf
kgf
Total towing traction Z 5061 kgf
We have more or less the same geometry as for Case 0 with PF11 doors. The drag of the trawl gear is about 21% smaller than for reference case (Case 0). For such a twine diameter reduction in the upper panel, we may find a lower upward force of the net applied on the ground gear. Consequently, the gear may have more friction on the seabed. Thus, it would be interesting to reduce the gear weight in water.
6.2.3.4 Synthesis The two tables below give the main results for initial and optimised cases:

222 of 425 Report Number C002/08
Table 6411: Synthesis of simulations for reference and optimised cases
Case Towing
speed
(knots)
Total towing force 3
(kgf)
Door drag
(kgf)
Net drag
(kgf)
Cable (warps,
sweeps, bridles)
drag (kgf)
Case 0
3.5 6106 1574 (26%) 4120 (67%) 7%
Case 1
3.5 5061
gain: 17 %
1368 (27%) 3239 (64%) 9%
The results in terms of gear geometry are presented below. The theoretical catching efficiency should be at least equal to the one of Case 0.
Table 6412: Gear dimensions for the two cases compared
Case Towing speed
(knots)
Vertical opening
(m)
Wing tip distance
(m)
Case 0 initial 3.5 3.3 16.3
Case 1
3.5 3.2 16.5
6.2.4 Conclusions
It is important to remark that about 2/3 of the fuel, depending of the exploitation profile of the vessel, used aboard a trawler is consumed only to tow the fishing gear. Consequently, any first attempt to reduce fuel consumption should address the trawl gear. Concerning the fuel used to tow the trawl, about 1/3 is used to tow the doors (depending on the trawl and door design, this can be verified on tables given in these optimisation examples). This fully justifies current studies undertaken by Morgère and IFREMER to optimize the doors, in order to reduce their drag and increase their lift efficiency. Recent results point to multi4foil doors with about 15% less drag. Finally, for a average trawl gear, that is not too old (where drag reduction potential would be even higher) and that has not been optimised recently, a drag reduction potential using gear optimisation of about 15% to 20% can be reached. The optimisation process must be undertaken with participation and agreement of the skipper, other4wise the net design could be rejected or modified once aboard.
6.3 Effects of door attack angle on the trawl gear behaviour. In this chapter, we consider the effects of changing the door attack angle by modification of the adjustment of bracket and backstrops. The effect of such modifications on door behaviour is driven by the relationship of lift and drag coefficients as a function of the angle of attack. Doors that are designed with several foils generally have lift and drag coefficients as shown in Figure 6410. The general behaviour of such curves is a tendency for the lift coefficient to reach a maximum at an angle between 35° and 45°, depending on door type. The efficiency coefficient, calculated from the ratio of lift coefficient divided by drag coefficient generally decreases with attack angle, except for very particular door designs. In the
3 Which must not be confused with the tension in the warp: the drag is the horizontal force component in the warp which must be overcome by the propeller thrust.

Report Number C002/08 223/425
example below, the maximum lift coefficient is reached at the attack angle of 43°. On the other hand, doors of a simpler design (with no foil or plate for instance) have their maximum lift coefficient at a lower angle of attack, around 25°. We present here after the effect on trawl geometry and towing force of changing the angle of attack of doors. This must be considered as an example as the behaviour of the trawl gear depends on many parameters such as the door size compared the trawl considered, the warp angle, the fishing depth, and of course the door characteristics. The doors considered have the hydrodynamic characteristics presented in Figure 6410 below. Their weight in water is 130 kgf, their surface is 1.25 m². They are used to spread a single two panel bottom trawl of 31 m headrope and 56 m² twine surface area. The fishing ground is 120 m deep and towing speed is 3 knots. Simulations (Figure 6411) were done for each case and results are presented in Table 6413. Note that these simulations have not been validated by tank or sea trials, but are generally considered valid for common applications.
Multi foil doors
0.00
0.20
0.40
0.60
0.80
1.00
1.20
1.40
1.60
1.80
2.00
25 30 35 40 45 50
Attack angle
Hyd
roco
effic
ient
s
Cd
Cl
Cl/Cd
Figure 6410: General aspect of hydrodynamic coefficients of multifoil doors

224 of 425 Report Number C002/08
Figure 6411: View of trawl, sweeps, doors and warps of the trawl gear taken as example. (DynamiT calculation).
Table 6413: Simulation results for differents attack angles
Attack angle (°) Total tension (kgf) Door distance (m) Wing distance (m) Vertical opening (m) Filtered volume (m3/s)
30 2075.00 29.60 11.10 3.40 45.90
35 2114.00 33.30 12.00 3.10 46.00
43 2206.00 37.00 13.00 2.80 45.90
48 2200.00 33.00 11.90 3.10 45.60
First observation is that the towing tension increases with the angle of attack. This is due to 1) the door drag increase and 2) the door spread increase (upto 43°) and consequently the net spread increases and net drag increases. But is it important to notice the total drag increase does not grow faster than the spread increase (upto 43°). Notice 43° is the point where the ration lift / drag coefficient is maximum. We can thus conclude that a door should be used at this maximum efficiency point of 43°. Notice the filtered volume of water per second is not affected by door spread modification as the vertical opening decreases when the wing distance increases. Now we examine the ratio “swept surface / towing force”. This consideration is of importance as the towing force, at a given speed, is directly linked the fuel consumption. The third column of Table 6414 can be seen as the ratio “fishing potential per fuel litre”. This potential being considered as 1 for the door attack angle of 43°, we can observe how this ratio is affected by door attack angle at lower efficiency (i.e. lower Cl/Cd). For instance, if the door is badly adjusted and works with an attack angle of 30°, the fishing potential, for one litre of fuel, will decrease by 15%). The simple considerations only address benthic fishes, Nephrops …, and generally fish that are herd by doors and sweeps.
Table 6414: Ratio swept surface / towing force for different door attack angles
Attack angle (°) Ratio : Swept surface (door distance) / Total tension Ratio base 43 °
30 0.0143 0.85
35 0.0158 0.94
43 0.0168 1.00
48 0.0150 0.89

Report Number C002/08 225/425
We can conclude from this example that the adjustment of doors is an important factor. It allows maximizing the fishing potential per unit of energy.
6.4 Energy performance evaluation of fishing vessels by simulation
6.4.1 Principles and features of the integrated energy systems model (in Dutch: Geïntegreerde Energie Systemen, abbreviated GES).
The prediction models are based on first4principles (i.e. physical relationships), semi4empirical data and supplier input and have been verified with empirical data. The models were developed by TNO. Details of these models are kept confidential. Model descriptions developed within the project are explained here. An overview of technical components for which quantitative prediction models are available at Partner 2 (TNO) is shown in the table below. First principle means following physical laws, e.g. Newton’s Law.
Table 6415: Overview of technical components for which quantitative prediction models are available
Item Model Variables include
Vessel design
hull shape model Hydrodynamic comined resistance models, semi4emperical
speed, length, draft, beam
hull shape model Holtrop (systematic empirical series)
speed, length, draft, beam, use of bulbous or axe bows
hull shape model Fishpow (systematic empirical series)
speed, length, draft, beam
Propulsion systems
Engine First principles, semi4empirical all supplier specs
Shaft First principles diameter, length, nominal loss
Diesel electric system components
First principles (incl. switchboards, converters, etc)
all supplier specs
Gear box systems First principles gear ratio, nominal loss
Propeller B4series (systematic empirical series)
diameter, hull clearance, shape and number of blades
Propeller with nozzle Ka4series (systematic empirical series)
diameter, hull clearance, shape and number of blades, nozzle
Propeller Design curves (KT,KQ, J diagrams) Advance speed, RPM, pitch, diameter
Controlled pitch propeller Design curves (KT,KQ, J diagrams) Advance speed, RPM, pitch, diameter + pitch controller
On board energy consumers
Auxiliary engines First principles, semi4empirical all supplier specs
Freezing or cooling plants First principles, basic cooling specs
Winches First principles electric motor motor specs, winch diameter
Blocks First principles diameters, line angles
Gear
Warps First principles diameter, length, number (double or single)
Connecting chains First principles chain diameter, chain length
Blocks First principles size, weight

226 of 425 Report Number C002/08
Trawl shoes First principles size
Beam First principles width, height, diameter
Tickler chains First principles chain diameter, seperated in length groups and numbers
Roller gear First principles diameter, weight
Sprout First principles number of chains, chain diameter, configuration
Figure 6412: Example of a propulsion train for a beam trawler modelled in GES
The model of the propulsion system consists of several conponents that are depicted in Figure 6412, an example for a beam trawler. Starting from a fuel tank connections are made through a main engine, propeller shaft, propeller, fishing gear with drag vs. speed relationship and hull characteristics, also with a drag vs. speed relationship. A suit of different engines, propellers, etc., can be taken from a library as with their own characteristics. The model is very versatile and components and connections can be easily changed.

Report Number C002/08 227/425
Figure 6413: GES model for a beam trawl split in components
In the case of a beam trawl the drag vs. speed relationship is derived from its components (Figure 6413). Here warps, sprout, beam, trawl shoes, and tickler chains are represented separately, and each of these components can de changed in dimensions, Cd, bottom friction, etc. This enables a very versatile system in which many variations can be worked through in a short time. For otter and pelagic trawls such a detailed model was not used, but often in these cases a so called ‘working point’ (i.e. one point of the curve where speed and drag are known) was sufficient and a general drag vs. speed curve was fitted through this point to derive the drags at other speeds. In other cases a complete speed4 drag curve could be given from actual drag measurements at full scale, or from simulations using programs like DynamiT. Another major source of input affecting the energy consumption is what we call the ‘operational profile’ of a vessel, the distribution of time over various operational modes (e.g. steaming, shooting and hauling gears, fishing, searching, laying in harbour, etc.) with their corresponding sailing or towing speeds over a complete year. An example of such input is given in Figure 6414 below. This profile may vary from vessel to vessel depending on the location and thus distance to cover from home port to fishing grounds, but also behaviour by the skipper (e.g. sailing and/or fishing with full speed).

228 of 425 Report Number C002/08
Figure 6414: Example input of an operational profile in GES (BIM OTM 24440m)
The GES4program produces a number of outputs, of which some examples are given below. The yearly total fuel consumption is graphically represented in Figure 6415 for all operational modes or conditions lumped together.
TOTAL FUEL CONSUMPTION [ton/year]
0
50
100
150
200
250
300
350
400
450
AB
C 6
DX
C, t
ank_
1
0
50
100
150
200
250
300
350
400
450
Sum (conditions)
Cumulative fuel consumption [ton/year]
Title:Barapemdez2, Technology:2008Run date:07-10-2008/08:37:59Input file:COMOutput file:Results.csvResults file:ResultsOutput.csv
Figure 6415: Example of yearly total fuel consumption (FR segment OTB: 24440m)
The efficiency of the installation in various operational modes is depicted in Figure 6416 below. In this case we see that fishing and steaming have similar values, while gear handling is much less efficient. Depending on the time used for these activities one can expect them to affect the total energy consumption over a complete year.

Report Number C002/08 229/425
Figure 6416: Example output of efficiencies in various operational modes in GES (BIM OTM 24440m)
Figure 6417: Example output of greenhouse gas emissions in various operational modes in GES (BIM OTM 24440m)
Another interesting output is strongly related to energy consumption, i.e. the emission of green4house gases by the main engine. A split over various operational modes is given in Figure 6417. In merchant shipping more

230 of 425 Report Number C002/08
stringent regulations concerning these emissions are to be expected to come into force from 2011, and fisheries will probably not stay unregulated concerning this aspect long after that.
6.4.2 Initial appraisal of potential fuel savings through GES4analysis
Partner 2 (TNO) provided a first order estimate of fuel savings potential for various components for a 2000 hp beam trawler. This is based on deriving the fuel consumption per component by decomposing the energy flows. Interactions between various components have been ignored at this stage. Therefore hard conclusions cannot be derived from it at present. Based on the estimated impact from contributions by potential technologies a pre4selection can be made. The table below shows the overall fuel saving in case of a 5% efficiency improvement of various individual compo4nents during the fishing operation:
Table 6416: Potential fuel savings
Component Potential fuel saving
Hull resistance 0.10%
Engine 2.78%
Gearbox 0.07%
Propeller 1.15%
Fishing line 0.01%
Trawl shoes 0.10%
Tickler chains 0.18%
Roller gear 0.10%
Ground gear 0.05%
Beam 0.08%
Net 0.40%
Technical descriptions and data were collected for the selected potential technologies. Part of the description required is quantitative data of technical performance expressed in terms of energy production or consumption. They are dependant on design and/or product specifications.
6.5 Technical and operational adaptations studied by nation For a range of segments a reference vessel was selected, depending on the willingness of skippers to supply detailed information. Some segments are covered by more than one vessel, from various nations, enabling comparison. A number of adaptations were then selected by nation based on data availability and expert judgement on the likely success. These adaptations are given in Table 6417 below. They vary from technical modifications in gears, in fishing vessels, to vessel design studies (e.g. ‘Green trawler’ in Ireland), and operational variations, mostly reductions in steaming and towing speeds.

Report Number C002/08 231/425
Table 6417: Overview of technical and operational adaptations studied by nation
France: OTB, 24440 m, 441 kW (600 hp) No Adaptation Potential Fuel Saving (%) Investment Costs (€) Effect on LPUE (%)
1 Redesign of complete gear 14.8 16000 none
2a Reduction steaming speed using std
gear
0.47 4 n/a
2b Reduction steaming speed using low
drag gear
0.56 16000 n/a
Ireland: OTB, 12424 m, 515 kW (700 hp) No Adaptation Potential Fuel Saving (%) Investment Costs (€) Effect on LPUE (%)
1 Gear Modifications – doors & trawls 6413.5 17,500 none
2 Reverting to single rig 10421 24,000 416
3 Converting to Seine Netting 25 68,500 425 to 430
4 Reduction in Steaming Speed 145 none none
5 Optimising Bollard Pull 142 100041500 none
6 Fitting a Fuel Meter 10412 120043100 none
7 Hull cleaning 245 7,500 none
8 Engine Maintenance 548 none none
Ireland: OTB, 24440 m, 736 kW (1000 hp) No Adaptation Potential Fuel Saving (%) Investment Costs (€) Effect on LPUE (%)
1 Gear Modifications – doors & trawls 5411 26,000 none
2 Dynex Warps 15420 50,000 none
3 Reverting to single rig 24430 26,000 Reduction by 25%
4 Reduction in Steaming Speed 4.5 none none
5 Optimising Bollard Pull 4 100041500 none
6 Fitting a Fuel Meter 10 120043100 none
7 Hull cleaning 145 7,500 none
8 Engine Maintenance 547 none none
9 Replacing Auxiliary engine 15 30,000 none
10 Fuel Quality 0.541 1,000 none
Ireland: OTM/PTM, 24440 m, 1471 kW (2000 hp) No Adaptation Potential Fuel Saving (%) Investment Costs (€) Effect on LPUE (%)
1 Dynex Warps 10 35,000 Possible small
increase
2 Hexagonal Mesh Trawls 25 65,000475,000 Possible small
increase
3 T90 or Square Mesh codends 8410 35,000445,000 none
4 Reduction in Steaming Speed 6 none none
5 Optimising Bollard Pull 2.2 100041500 none
6 Fitting a Fuel Meter 3410 120043100 none
7 Hull cleaning 145 7,500 none
8 Engine Maintenance 548 none none
9 Fitting a Nozzle 18 (2.5% for this vessel) 35,000 Increase in bollard pull
10 Hull Appendages 5 not known none

232 of 425 Report Number C002/08
Italy: OTB, 24440 m, 446 kW (606 hp); OTM, 24440 m, 819 kW (1114 hp) No Adaptation Potential Fuel Saving (%) Investment Costs (€) Effect on LPUE (%)
1 Gear drag reduction by redesigned
fishing gear (Reference Vessel 1)
9 1500 none
2 Replacing single by twin trawl
(Reference Vessel 1)
none 3000 +30
3 Replacing a FPP by a CPP
(Reference Vessel 1)
4.5 30000 none
4 Fuel measurement system
(Reference Vessel 2)
10 5500 none
5 Optimized hull shape
(Reference Vessel 2)
22 Applicable only in new
vessels: no major costs
none
6 Bulbous bow
(Reference Vessel 2)
6 50000 none
7 Lower pitch in FPP
(Reference Vessel 2)
0.9 2500 none
8 Larger propeller diameter
(Reference Vessel 2)
4 35000 none
9 Hull cleaning
(Reference Vessel 2)
1.8 1500 none
Netherlands: TBB, 24440 m, 1471 kW (2000 hp) No Adaptation Potential Fuel Saving (%) Investment Costs (€) Effect on LPUE (%)
1 Gear drag reduction through hydrofoil
and lighter chains
7.3 10000 75
2 Pulse trawl at lower towing speed 35 to 45, take 40 440000, with an
estimated yearly costs of
150000
77.5
3a Larger propeller diameter in FPP with
nozzle using std gear
8.61 96350 (smaller FPP +
nozzle costing 78800
n/a
3b Larger propeller diameter in FPP with
nozzle using HydroRig
15.35 96350 (smaller FPP +
nozzle costing 78800) +
10000
n/a
4a Reduction steaming speed using std
gear
0.87 4 97.5
4b Reduction steaming speed using
HydroRig
0.94 10000 97.5
5a Reduction towing speed using std gear 15.59 4 n/a
5b Reduction towing speed using HydroRig 20.59 10000 n/a
Belgium: TBB, 24440 m, 956 kW (1300 hp) No Adaptation Potential Fuel Saving (%) Investment Costs (€) Effect on LPUE (%)
1 Trawls in Dyneema 10 5200 annually none
2 Chain matrix vs. tickler chain 20 30000 annually none
3 Wheels replacing trawl shoes 5 (observed for chain matrix),
16 (calculated for tickler chains)
10000 none
4 Lower towing speed 23 none 420/430
5 Outrigger gear 50 50000 448
6 Additional Wind Power 20 600000 or less none

Report Number C002/08 233/425
United Kingdom: OTB, 12424 m, 480 kW (653 hp) No Adaptation Potential Fuel Saving (%) Investment Costs (€) Effect on LPUE (%)
1 Dynex warps 5 25500 none
2 Sweep bridle adjustments 4 4 4
3 Door optimisation 10 6250 none
4 Reducing net drag by 6% 15 12700 n/a
5 Replacing MDO by HFO 46.7 4 none
6 Hull cleaning 5 3500 none
7 Steaming speed reduction 24.8 none n/a
United Kingdom: OTB, 24440 m, 670 kW (911 hp) No Adaptation Potential Fuel Saving (%) Investment Costs (€) Effect on LPUE (%)
1 Lower gear drag 10 n/a n/a
2 Lower engine rpm 10.3 none n/a
3 Steaming and Fishing speed 10% lower 12.8 none n/a
4 Hull cleaning 0.8 3500 none

234 of 425 Report Number C002/08
6.6 France Segment (gear, length, power): OTB, 24440 m, 441 kW (600 hp) Participant: IFREMER Author(s): B. Vincent, J. van Vugt
6.6.1 Reference design: OTB, 24440 m
6.6.1.1 Vessel
Figure 6418: Picture of the reference vessel (Vessel ID deleted)
Table 6418: Main particulars of the reference vessel
Item Value
Year built 2005
Length over all (m) 24.90
Breadth (moulded, m) 7.8
Depth (m) 3.75
Mean draft (m) 3
Main engine power (kW) 441
Main target species Whiting, pollack, coalfish, cod, monkfish …
Main particulars of the reference vessel are given in the table above.

Report Number C002/08 235/425
6.6.1.2 Gear
Table 6419: Main particulars of fishing gear of the reference vessel
Item Value
Gear code (e.g. TBB, OTB, OTM, …) OTB
Type description Twin trawl towed with 3 warps
Otter boards (type, size, and weight) Previously 3.13 m², 650 kg Thyboron, now
PFV2 Morgère 2.25 m², 650 kg
Main gear dimensions (circumference, beam width, (m)) Initially 153 m² of twine
Headline length (m) 19.6
Footrope length (m) 26.5
Cod end mesh size (mm) 50
Comments 4
The vessel operates a 34warp twin4trawl system with main dimensions given above.
6.6.1.3 Operational profile
Table 6420: Time split over operational modes for the base line
Operational mode Percentage of time %
Steaming to and from fishing grounds 5% (20 h at 10 knots)
Shooting and hauling gears 15% (0.5 h per tow of 4.5 hours)
Fishing 60%
Searching 0 %
Time in harbour 20%
Table 6421: Operational profile for the base line and adaptation (redesigned gear)
Name Duration Distance Velocity
[4] [hrs] [nm] [kn]
Harbour 2040.00 2.04 0.00
Steaming to fishing ground 210.00 2100 10.00
Shooting gears 315.00 904.05 2.87
Fishing 5670.00 16272.9 2.87
Hauling gears 315.00 904.05 2.87
Steaming to harbour 210.00 2100 10.00
Harbour operation 0.00 0 0.00
The operational profile used in the GES4analysis is given above.

236 of 425 Report Number C002/08
6.6.1.4 Evaluation of the state of technology The fishing gear of this reference vessel consists of bottom twin trawls. The design of these trawls is very standard. Each is made of two panels (lower and upper) with a minimum of netting sections, simple cutting rates and minimum of different mesh sizes and twine diameters in order to simplify maintenance. The Higher tenacity fibres are not used, but as netting material standard PE is used. The total twine surface area (for 2 trawls) is 153 m². Doors where found to be adapted to the trawls, but more efficient doors could have been used in this initial design.
6.6.1.5 Catch The average catch weight per haul is about 200 kg for a 4.5 hours haul.
6.6.1.6 Energy performance
Figure 6419: Energy model in GES
The ship is run with a Controllable Pitch Propeller (CPP).
6.6.1.6.1 Fuel consumption
The simulated fuel consumption for the initial design is 421 tonnes per year, considering the exploitation profile taken into account, which is a bit less than the value announced by the fishing company (about 500 tonnes).

Report Number C002/08 237/425
TOTAL FUEL CONSUMPTION [ton/year]
0
50
100
150
200
250
300
350
400
450
AB
C 6
DX
C, t
ank_
1
0
50
100
150
200
250
300
350
400
450
Sum (conditions)
Cumulative fuel consumption [ton/year]
Title:Barapemdez2, Technology:2008Run date:07-10-2008/08:37:59Input file:COMOutput file:Results.csvResults file:ResultsOutput.csv
Figure 6420: Total yearly fuel consumption
FUEL CONSUMPTION [ton/year]
0
50
100
150
200
250
300
350
400
Har
bour
Ste
amin
g to
fish
ing
grou
nd
Fre
e ge
ars
Fis
hing
Pul
l gea
rs
Ste
amin
g to
harb
our
Har
bour
ope
ratio
n
ABC 6DXC, tank_1
Title:Barapemdez2, Technology:2008Run date:07-10-2008/08:37:59Input file:COMOutput file:Results.csvResults file:ResultsOutput.csv
Figure 6421: Yearly fuel consumption in the various operational modes

238 of 425 Report Number C002/08
6.6.1.6.2 Efficiencies – Output of GES�model runs
The efficiencies when steaming are higher than when fishing as can be seen from the figure below.
Efficiency [-]
0
0.02
0.04
0.06
0.08
0.1
0.12
0.14
0.16
0.18
0.2
Har
bour
Ste
amin
g to
fish
ing
grou
nd
Fre
e ge
ars
Fis
hing
Pul
l gea
rs
Ste
amin
g to
harb
our
Har
bour
ope
ratio
n
Efficiency [-]Title:Barapemdez2, Technology:2008Run date:07-10-2008/08:37:59Input file:COMOutput file:Results.csvResults file:ResultsOutput.csv
Figure 6422: Efficiency of the installation by operational mode
6.6.1.6.3 Energy distribution – Output of GES�model runs
The energy when steaming is mostly used by the propeller, and when fishing by towing the gear over the sea bed.

Report Number C002/08 239/425
Operational Profile, Required Power [kW]
0
20
40
60
80
100
120
Har
bour
; 204
0 hr
/yr
Ste
amin
g to
fish
ing
grou
nd; 2
10 h
r/yr
Fre
e ge
ars;
315
hr/y
r
Fis
hing
; 567
0 hr
/yr
Pul
l gea
rs; 3
15hr
/yr
Ste
amin
g to
harb
our;
210
hr/
yr
Har
bour
ope
ratio
n;0
hr/y
r
Hotel_load
Gears
Propellers
Title:Barapemdez2, Technology:2008Run date:07-10-2008/08:37:59Input file:COMOutput file:Results.csvResults file:ResultsOutput.csv
Figure 6423: Required power of the installation by operational mode
6.6.2 Adaptations under study – Adaptation No 1: Redesign of complete gear
6.6.2.1 Short description of Adaptation No 1 Adaptations made to reduce the fuel consumption are described hereafter. For a detailed methodology, see Section 5.2 4 Numerical simulations of fishing gear, where two additional optimisation cases are described. Several modifications were made to the initial gear design:
• The netting material: using higher tenacity fibres Breiztop allows a reduction of 25% to 30% of twine diameter for identical traction resistance. The netting weight also decreases by 25% to 30% and finally the cost can remain almost constant. However, in case of friction on the seabed (belly parts), diminishing the twine diameter can be rejected by the skipper. This modification leads to lower drag and lower fuel consumption. In the upper part, 5 mm PE twine was replace by 3 mm Breiztop twine in the wings, the square and the top belly.
• The mesh size increase: in certain parts of the trawl (upper sections), in accordance with the skipper, the mesh size can be increased. The consequence is to improve the filtration and decrease the drag. In the upper panel 60 mm wing meshes were replaced by 100 mm meshed. In the square and top belly, 60 mm meshes were replaced by 75 mm meshes.
• If some parts of the netting are found to be ineffective (slack meshes for instance), cutting rates and/or number of meshes are slightly modified in accordance with the skipper.
• 3.13 m² doors were replaced by 2.25 m² doors with same weight. • Ground gear weight in the water was decreases by about 10%.

240 of 425 Report Number C002/08
6.6.2.2 Effects of Adaptation No 1 The effects on the towing resistance of the modifications described are presented in the figure below.
0
2000
4000
6000
8000
10000
12000
1.5 2 2.5 3 3.5 4 4.5 5
Towing speed (knots)
kgF
Initial design
Optimised design
doors off bottom
Figure 6424: Drag vs. speed relationship for the initial design and the optimised design
Different towing speeds were simulated and the calculated resistance of the initial fishing gear and the modified gear are given in Figure 6424 plotted against towing speed. It must be noticed that for high speeds (higher than 3.5 knots), for the simulated depth and warp/length ratio, the doors lift off4bottom. For the average towing speed used by the skipper, the relative drag difference is about 18% between the initial and the new design.
6.6.2.2.1 Effect on energy consumption (% change) – Output of GES�model runs
Table 6422: Fuel consumption and gaseous emissions for base line (initial design) and Adaptation 1 (optimised design)
Item Initial design Optimised design % reduction
Fuel [ton/yr] 421.07 358.66 14.82
CO2 [ton/yr] 1318.67 1121.94 14.92
SOx [ton/yr] 8.42 7.17 14.83
NOx [ton/yr] 28.73 25.96 9.63
HC [ton/yr] 1.42 1.36 4.25
CO [ton/yr] 2.94 2.97 41.00
The reduction in fuel consumption by this adaptation is 14.82% as can be seen from the table above. The emissions can also be reduced substantially.

Report Number C002/08 241/425
6.6.2.2.2 Investment required for the adaptation (* 1000 €)
The cost for the optimised design for this vessel is estimated at about 16000 € (2 trawls, 1 pair of doors, no clump).
6.6.2.2.3 Effect on income (LPUE, landings per unit of effort)
During the optimisation process, the fishing gear geometry (door distance, wing distance, vertical opening) was kept constant. Therefore we can assume that the fishing capacity of the net will also remain constant. The fishing efficiency was tested at sea aboard the trawler and was found satisfactory. For this adaptation we therefore can work with LPUE being unchanged.
6.6.3 Adaptations under study – Adaptation No 2: Reducing steaming speed
6.6.3.1 Short description of Adaptation No 2 Apart from changing the gear design to reduce gear drag one can aim at altering the speed with which the vessel sails to and from the fishing grounds. As the power4speed relationship of a ship can be very steep in the range of speeds used for steaming, a small decrease may lead to a substantial reduction of power needed, and thus savings. In fact most of the adaptations under study are based on speed reductions or involve speed reductions. Steaming with lower speed means that more time is needed to reach the port of destination. This may affect the selling price of fish. In addition it likely influences the time left for fishing, and thus will have a negative bearing on income. The balance between savings on one hand and loss of income on the other determines the economic effect of this measure. Nevertheless in practice many skippers report reverting to steaming at slower speeds and dropping some fishing time.
6.6.3.2 Effects of Adaptation No 4
6.6.3.2.1 Effect on energy consumption (% change) – Output of GES�model runs
As the power4speed relationship is mostly steep in the range of steaming speeds considerably fuel savings may result. We calculated the effect of slowing down when steaming from 10.0 to 9.0 kts for both the initial design and the optimised design.
Table 6423: Fuel consumption and gaseous emissions for base line (initial design) and Adaptation (optimised design) when reducing the steaming speed from 10 to 9 knots
Item Initial design 10 kts Initial design 9 kts % reduction
Fuel [ton/yr] 421.07 419.08 0.47
CO2 [ton/yr] 1318.67 1312.40 0.48
SOx [ton/yr] 8.42 8.38 0.46
NOx [ton/yr] 28.73 28.65 0.29
HC [ton/yr] 1.42 1.42 40.02
CO [ton/yr] 2.94 2.94 40.13
Item Optimised design 10 kts Optimised design 9 kts % reduction
Fuel [ton/yr] 358.66 356.65 0.56
CO2 [ton/yr] 1121.94 1115.68 0.56
SOx [ton/yr] 7.17 7.13 0.52

242 of 425 Report Number C002/08
NOx [ton/yr] 25.96 25.88 0.30
HC [ton/yr] 1.36 1.36 0.01
CO [ton/yr] 2.97 2.97 40.11
The effect seems small however, only 0.47% for the initial design and 0.56% for the new design (Table 6423).
6.6.3.2.2 Investment required for the adaptation (* 1000 €)
No other costs than the 16000 € (2 trawls, 1 pair of doors, no clump) for the new gear if this is used.
6.6.3.2.3 Effect on income (LPUE, landings per unit of effort)
There may be some time loss for fishing. Here the effect is assumed to be negligible.
6.6.4 Summary table of adaptations for reference vessel FR
A summary of effects is given in the table below for this reference vessel and the adaptations investigated. It should be noted that the results are depending on the yearly operational profile of the vessel. Based on various scenarios of fuel price, and taking account the effect on landings and consequently earnings, the overall economic viability of these solutions are appraised (See Chapter Error! Reference source not found.).
Table 6424: Summary of effects on fuel savings, investment costs, and landings for adaptations studied
No Adaptation Potential Fuel Saving (%) Investment Costs (€) Effect on LPUE (%)
1 Redesign of complete gear 14.8 16000 none
2a Reduction steaming speed using std
gear
0.47 4 n/a
2b Reduction steaming speed using low
drag gear
0.56 16000 n/a
6.6.5 References
Jean Valère Vilebas, Séverine Farruga, Benoît Vincent, Etude semi personnalisée des trains de pêche des chalutiers bretons, 2008.

Report Number C002/08 243/425
6.7 Ireland Segment (gear, length, power): OTB, 12424m, 515 kW (700 hp) Participant: BIM Author(s): D. Rihan, J. van Vugt
6.7.1 Reference design 1: OTB, 12424m
6.7.1.1 Vessel
Figure 6425: Picture of the reference vessel (Vessel4ID deleted)
Table 6425: Main particulars of the reference vessel
Item Value
Year built 2003
Length over all (m) 22.65
Breadth (moulded, m) 7.7
Moulded Depth (m) 4.2
Moulded draft (m) 3.15
Main engine power (kW) Caterpillar 3508B DI4T1 638Kw derated to
522Kw
Gearbox Mekanord Marine 43041HS 5.78:1 reduction
Tonnage (GT) 201
Main target species Monkfish, megrim, hake, Nephrops
This vessel as shown in Figure 5419 and described in Table 5412 is a relatively new vessel built in 2003. It is designed as a twin4rig trawler although the deck layout allows easy conversion to Scottish seining. The vessel is constructed with a transom stern and raked soft nose stem, bulbous bow, bulbous stern, ballast keel, round bilge hull and insulated dry fish hold with refrigeration. A three4quarter length steel nd aluminium shelter deck is fitted and the vessel has accommodation for a maximum crew of 7. The fish catch is taken in over the stern and a conveyor system transports the fish to a processing area.

244 of 425 Report Number C002/08
The vessel is powered by a Caterpillar 3508 B DI4TA engine developing 638 kW (derated to 522 kW) and driving a 2.18 m 44bladed controllable pitch propeller in a fixed nozzle through a 5.87:1 reduction gearbox with 3 Power take offs generating 1050 Nm to drive the hydraulics. This gives the vessel a top speed of around 11 knots at 85% maximum continuous rating (mcr). The vessel has a calculated bollard pull of ~ 15.4 tonnes (measured at 13.1 tonnes @ 3.5 knots). Two 120 kW Cummins 6CT Auxiliary engine drives a 108 kW alternator for the refrigeration and as harbour generators. For added manoeuvrability the vessel also has a 4 blade bow thruster producing 1 tonne open water thrust.. The deck machinery includes 3 split trawl winches rated @ 15 tonnes/20m/min pull 1st layer and with a capacity for 2000 m x 20 mm warp and 2 split net drums mounted aft with similar characteristics. The vessel also has a gilsen winch with 5.5. tonne @ 30 m/min pull, a power block with a 28” rockhopper sheave and a net sounder winch for a headline transducer. The fish room has a capacity of 136 m³ and insulated to a depth of 75 mm. The refrigeration is operated by an electronically driven compressor to maintain a temperature of 42 ºC. An ice machine capable of making 2 tonnes/day is also fitted.
6.7.1.2 Gear
Table 6426: Main particulars of fishing gear of the reference vessel
Item Value
Gear code (e.g. TBB, OTB, OTM, …) OTB
Type description Twin4rig demersal
Otter boards (type, size, and weight) Morgere PF8 2.8 X 1.6 850kg
Centre Clump Morgere 1000kg
Main gear dimensions (circumference, beam width, (m)) 550 x 100mm
Headline length (m) 72m
Footrope length (m) 120m
Cod4end mesh size (mm) 100mm x 6mm single
Bridles 140m x 38mm combination rope (2kg/m)
Comments 4
Table 5413 gives the main parameters of the fishing gear used. This vessel uses a three warp twin4rig towing double bosom footrope trawls with 60 mm rubber disc footropes mounted on 18 mm wire with 226 g lead weights placed every 300 cm. Floatation consists of 27 x 203 mm deepwater floats with an estimated weight of each trawl around 450 kg. The vessel usually fishes in depths of 200 m4600 m.
6.7.1.3 Operational profile Table 6427 shows the operational profile split between steaming, fishing, shooting and hauling gear, time in harbour and searching or dodging weather.
Table 6427: Time split over operational modes
Operational mode Percentage of time %
Steaming to and from fishing grounds 11
Shooting and hauling gears 23
Fishing 55
Searching Negligible
Dodging Negligible
Time in harbour 11
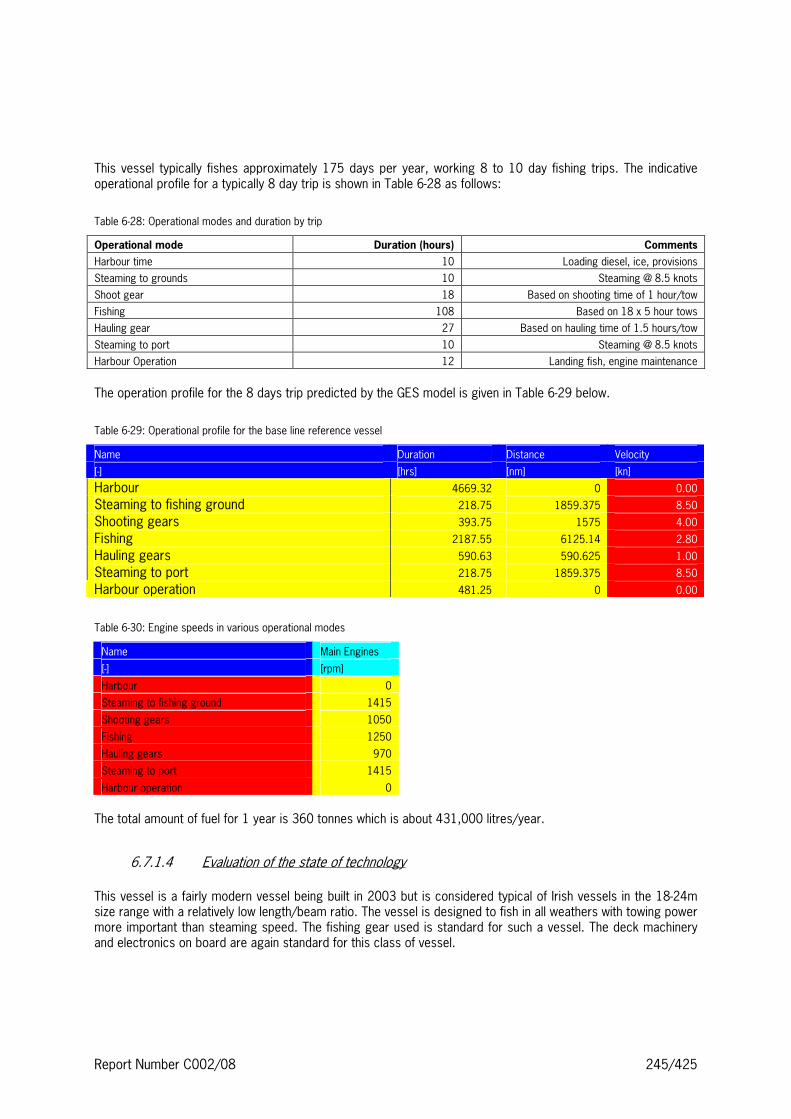
Report Number C002/08 245/425
This vessel typically fishes approximately 175 days per year, working 8 to 10 day fishing trips. The indicative operational profile for a typically 8 day trip is shown in Table 6428 as follows:
Table 6428: Operational modes and duration by trip
Operational mode Duration (hours) Comments
Harbour time 10 Loading diesel, ice, provisions
Steaming to grounds 10 Steaming @ 8.5 knots
Shoot gear 18 Based on shooting time of 1 hour/tow
Fishing 108 Based on 18 x 5 hour tows
Hauling gear 27 Based on hauling time of 1.5 hours/tow
Steaming to port 10 Steaming @ 8.5 knots
Harbour Operation 12 Landing fish, engine maintenance
The operation profile for the 8 days trip predicted by the GES model is given in Table 6429 below.
Table 6429: Operational profile for the base line reference vessel
Name Duration Distance Velocity
[4] [hrs] [nm] [kn]
Harbour 4669.32 0 0.00
Steaming to fishing ground 218.75 1859.375 8.50
Shooting gears 393.75 1575 4.00
Fishing 2187.55 6125.14 2.80
Hauling gears 590.63 590.625 1.00
Steaming to port 218.75 1859.375 8.50
Harbour operation 481.25 0 0.00
Table 6430: Engine speeds in various operational modes
Name Main Engines
[4] [rpm]
Harbour 0
Steaming to fishing ground 1415
Shooting gears 1050
Fishing 1250
Hauling gears 970
Steaming to port 1415
Harbour operation 0
The total amount of fuel for 1 year is 360 tonnes which is about 431,000 litres/year.
6.7.1.4 Evaluation of the state of technology This vessel is a fairly modern vessel being built in 2003 but is considered typical of Irish vessels in the 18424m size range with a relatively low length/beam ratio. The vessel is designed to fish in all weathers with towing power more important than steaming speed. The fishing gear used is standard for such a vessel. The deck machinery and electronics on board are again standard for this class of vessel.

246 of 425 Report Number C002/08
6.7.1.5 Catch This vessel targets mixed demersal species mainly monkfish, megrim and hake fishing in 200m4400m depth. The vessel also targets nephrops at certain time of the year. The vessel had average landings of €1.34million in the period 200442006, which is felt to be high for the sector.
6.7.1.6 Energy performance
6.7.1.6.1 Fuel consumption
The average fuel consumption for this vessel over is approximately 500,000 – 650,000 litres per year using around 27,000 litres for an average 8 day trip. The measured fuel consumption by activity based on data supplied over the course of 6 trips is given in Table 6431:
Table 6431: Engine load, propeller pitch, speed and fuel consumption as a function of operational mode
Activity RPM Pitch Speed (knots) Fuel Consumption
(l/hr)
Steaming 1415 90 2.6 115
Shooting 1050 90 4 62
Towing 1250 90 2.6 82
Hauling 970 40 0 48
Dodging (bad weather) 920 40 0.5 27
6.7.1.6.2 Efficiencies – Output of GES�model runs
Efficiency [-]
0
0.02
0.04
0.06
0.08
0.1
0.12
Har
bour
Ste
amin
g to
fish
ing
grou
nd
Sho
otin
g ge
ars
Fis
hing
Hau
ling
gear
s
Ste
amin
g to
por
t
Har
bour
ope
ratio
n
Efficiency [-]Title:Twin Rig Trawler, Technology:2008Run date:16-10-2008/11:26:27Input file:COMOutput file:Results.csvResults file:ResultsOutput.csv
Figure 6426: Efficiency of the installation by operational mode for the base line

Report Number C002/08 247/425
The efficiency while steaming is highest than whilst towing and when hauling gear the vessel is at its least efficient (Figure 6426). This is due to the fact that when hauling the vessel uses all three PTO’s from the main engine to power the hydraulics thus reducing efficiency.
6.7.1.6.3 Energy distribution – Output of GES�model runs
Fuel consumption in tonnes/year is highest while fishing with much lower values for steaming and gear handling (Figure 6427). This is due to the fact that the vessel spends ~55% of the time trawling, which equates to around 256 tonnes of fuel per year.
FUEL CONSUMPTION [ton/year]
0
50
100
150
200
250
300
Har
bour
Ste
amin
g to
fish
ing
grou
nd
Sho
otin
g ge
ars
Fis
hing
Hau
ling
gear
s
Ste
amin
g to
por
t
Har
bour
ope
ratio
n
Caterpillar 3508B DI-TA, tank_1
Title:Twin Rig Trawler, Technology:2008Run date:16-10-2008/11:46:44Input file:COMOutput file:Results.csvResults file:ResultsOutput.csv
Figure 6427: Yearly fuel consumption on various operational modes for the reference vessel
Table 6464 shows the yearly fuel consumption and gaseous emissions for the reference vessel based on an extrapolation from 8 day fishing trips.
Table 6432: Fuel consumption and gaseous emissions for base line reference vessel
Item Base line consumption
Fuel [ton/yr] 360.03
CO2 [ton/yr] 1131.69
SOx [ton/yr] 7.20
NOx [ton/yr] 22.99
HC [ton/yr] 0.51
CO [ton/yr] 1.29
Figure 6428 shows the yearly operational profile and required kW of this vessel by operational parameter.

248 of 425 Report Number C002/08
Operational Profile, Required Power [kW]
0
20
40
60
80
100
120
140
160
180
200
Har
bour
; 466
9.32
hr/y
r
Ste
amin
g to
fish
ing
grou
nd; 2
18.7
5hr
/yr
Sho
otin
g ge
ars;
393.
75 h
r/yr
Fis
hing
; 218
7.55
hr/y
r
Hau
ling
gear
s;59
0.62
5 hr
/yr
Ste
amin
g to
por
t;21
8.75
hr/
yr
Har
bour
ope
ratio
n;48
1.25
hr/
yr
Hotel_load
Gears
Propellers
Title:Twin Rig Trawler, Technology:2008Run date:16-10-2008/13:28:58Input file:COMOutput file:Results.csvResults file:ResultsOutput.csv
Figure 6428: The required power of the vessel by operational mode.
6.7.2 Adaptations under study – Adaptation No 1: Gear modifications
For all fishing vessels matching the gear to the optimum working conditions of the vessel and engine are important to maximise fuel efficiency. This is particularly the case for trawlers when you consider that whilst towing, the majority of fuel (~95%) is used to tow the fishing gear with only a very small proportion (5%) actually propelling the vessel. This means that gear drag is one of the main elements which should be reduced to save fuel. The trawl doors and nets cause the greatest fuel consumption and so present the greatest opportunity for gain by reducing their size and drag. Trawls constitute around 60% of the overall drag so any reductions in trawl size or drag are worthwhile. Over recent years there has been significant work into developing fuel efficient trawl designs through reducing drag by decreasing twine surface area and high tenacity/low drag materials for the construction of headline and footropes. Quantification of exact savings that can be made, however, are fairly approximate given that accurate measuring of drag can be problematic. Engineering Trials carried out by SEAFISH in the UK demonstrated reductions in drag and increase in mouth opening of standard trawl designs through the use of lighter twines (Ward et al., 2005). These modifications gave reductions in fuel of around 6% and are felt achievable for this reference vessel. Historic data collected during gear test trials from Irish vessels similar to this reference vessel indicate potential savings from reducing trawl size of around 10415%. Anecdotal evidence from one vessel suggests a saving of 400 litres per day when using a trawl with a headline constructed in 8mm Dynex™ rope. This equates to a saving of ~13% for this reference vessel. Trawl doors are the second largest component constituting around 25% of overall gear drag but are often fished inefficiently by fishermen either being rigged incorrectly too heavy or big for the vessel and gear used or with a high angle of attack leading to high drag. While new door designs are continually coming on the market with claims of improved fuel efficiency in terms of increased spreading force for lower drag although these claims are often only backed up with theoretical or flume tank testing and it is left to the fishermen to optimise door set4up, which can be difficult. Little practical data exists for this reference vessel or other similar vessels but manufacturers claim savings of 10425% are achievable through new door designs.

Report Number C002/08 249/425
6.7.2.1 Effects of Adaptation No 1
6.7.2.1.1 Effect on energy consumption (% change) – Output of GES�model runs
The gear drag force is reduced with 4.5% and 10%. The results are given in Table 6433.
Table 6433: Effect on fuel consumption and gaseous emissions of applying fishing gears with 4.5% and 10% less drag
Gear reduction Base line Gear 4.5% Gear 10% Fuel reduction gear 4.5% Fuel reduction gear 10%
Fuel [ton/yr] 360.03 342.20 321.41 4.95 10.73
CO2 [ton/yr] 1131.69 1075.49 1009.95 4.97 10.76
SOx [ton/yr] 7.20 6.84 6.43 4.95 10.73
NOx [ton/yr] 22.99 21.71 20.45 5.59 11.05
HC [ton/yr] 0.51 0.51 0.50 0.22 0.75
CO [ton/yr] 1.29 1.28 1.27 0.85 1.15
Given it would be difficult to estimate the reductions that could be achieved through a combination of changes to trawl designs and doors, a modest target of 10% reduction in fishing gear drag can be reasonably assumed. This would save ~10% on fuel used while trawling for this reference vessel. These benefits can, though, be lost through simply increasing towing speed unnecessarily, having too high an angle of attack on your trawl doors, loading the footrope with chain or having too many floats on the headline. The fuel savings predicted by GES are 5% and 10.7% for gear drag 4.5% and 10% lower, the latter value being in agreement with estimates.
6.7.2.1.2 Investment required for the adaptation (* 1000 €)
Costs for replacement doors and trawls for this vessel are estimated as follows: Doors €7,500 Trawl €10,000 Total investment €17,500
6.7.2.1.3 Effect on income (LPUE, landings per unit of effort)
No effect on LPUE.
6.7.3 Adaptations under study – Adaptation No 2: Reverting to single rig
A study carried out by BIM in 2003 (Rihan, 2004) looked at the differences in fishing or catching efficiency, fuel consumption and overall profitability of reverting from twin4rigging to single rigging observed on two Irish vessels, very similar to this reference vessel. Both vessels found by reverting to a single trawl that fuel consumption reduced. In the case of one of the vessels fuel consumption reduced from an average of 3,800 litres/day, with the twin4rig gear to 3,000 litres/day with a single trawl, equating to a reduction in fuel consumption of approx4imately 21%. On the other vessel the difference was around 10% with a reduction from 3,100 litre/day to 2,800 litres/day.

250 of 425 Report Number C002/08
The findings suggest that, for this sector of the Irish fleet a return to single4rig trawling has some obvious advantages, particularly in terms of fuel and other cost savings but there will be a corresponding loss of earnings, which from the results from these two vessels averages out at 16%. Extrapolating from the fuel savings and the indicative reduction in gear and crew costs showed the reduction in gross earnings to be almost negated on vessel A. This vessel has remained single trawling. Results from vessel B showed savings not as high compared to the reduction in earnings, due largely to lower fuel costs and higher prices for monkfish at the time of the first part of the study. The owner of this vessel was less convinced about the benefits of single trawling at the time and the vessel reverted back to twin4rigging at the beginning of 2002. Subsequently the vessel switched to single trawling during the summer months in 2002 and 2003 when monkfish are generally less prolific on the grounds and intends doing the same in 2004, targeting megrim and hake which currently have less quota restraints. The differences in earnings also reflect the different strategies adopted by the vessels when reverting to single4rig trawling, and in this respect there is no doubt that when monkfish are the main target species the twin4rig has a significant advantage over the single rig. The over reliance on this species, however, raises serious questions and it is fully accepted by all of the operators in the twin4rig sector that there is a need to diversify to other species.
6.7.3.1 Effects of Adaptation No 2
6.7.3.1.1 Effect on energy consumption (% change) – Output of GES�model runs
Based on the figures from this study a reduction in fuel consumption of between 10421% are anticipated for this class of vessel when moving from twin to single rig trawling. The output from GES confirms this range at the top end with a saving of 15.62% (Table 64133).
Table 6434: Effect on fuel consumption and gaseous emissions of changing from a twin to a single rig
Item Twin rig Single rig Fuel reduction %
Fuel [ton/yr] 360.03 303.81 15.62
CO2 [ton/yr] 1131.69 954.43 15.66
SOx [ton/yr] 7.20 6.08 15.62
NOx [ton/yr] 22.99 19.38 15.71
HC [ton/yr] 0.51 0.50 1.42
CO [ton/yr] 1.29 1.27 1.36
6.7.3.1.2 Investment required for the adaptation (* 1000 €)
The investment costs for reverting to single rig trawling equate to the following: 2 x single rig trawls €10,000 1 x set of tarwl doors €10,000 Bridles €4,000 Total investment €24,000
6.7.3.1.3 Effect on income (LPUE, landings per unit of effort)
Based on the study below income, reverting to single rig trawling would result in a loss of income of ~16% depending on the catching strategy adopted by the vessel.

Report Number C002/08 251/425
6.7.4 Adaptations under study – Adaptation No 3: Converting to seine netting
Seine netting is regarding as being a more fuel efficient method than trawling and a typical 20424m seine net vessel would have annual fuel consumption of around 225,0004250,000 litres annually based on data supplied from two seiners of 368Kw and 408kW fishing between 1864213 days at sea respectively. This compares to the annual fuel consumption of this reference vessel of around 500,0004650,000 litres. This equates to a saving of fuel of around 50% although the two vessels referred to are not fully comparable with the reference vessel and the saving could be expected to be in the region of 25%.
6.7.4.1 Effects of Adaptation No 3
6.7.4.1.1 Effect on energy consumption (% change) – Output of GES�model runs
Based on available data it is reasonable to assume that converting to seining with result in a reduction in fuel consumption of around 25%.
6.7.4.1.2 Investment required for the adaptation (* 1000 €)
Seine net rope reels/seine winch €40,000 Seine net €10,000 Seine Rope (30 coils) €18,500 Total investment €68,500
6.7.4.1.3 Effect on income (LPUE, landings per unit of effort)
Converting to seine netting would result in a totally different catch composition to the reference vessel and therefore it is difficult to accurately the effect on LPUE. Seiners tend to target mostly lower value species such as haddock and whiting with smaller volumes of cod, hake and mixed flatfish and given the method is restricted to daylight hours the actual fishing time is a lot less. Based on figures available for Irish seine net vessels it is reasonable to anticipate a reduction in income of around 25�30%.

252 of 425 Report Number C002/08
6.7.5 Adaptations under study – Adaptation No 4: Reduction in steaming speed
Fuel consumption and speed data from this vessel were measured with the engine rpm fixed for each curve and the pitch increased for each recorded point (O’Regan, 2006). The curves in Figure 6429 clearly demonstrate how the most efficient combination of pitch and rpm can significantly reduce fuel consumption for the same vessel speed. If this vessel runs at 8 knots it can burn between 40 and 90 litres per hour depending on rpm and pitch settings chosen. If we increase the required speed to 10 knots the fuel consumption can be reduced from 140 to 120 litres per hour by reducing rpm from 1,600 to 1,500 and increasing pitch.
Figure 6429: Fuel consumption as a function of rpm setting and speed
6.7.5.1 Effects of Adaptation No 4
6.7.5.1.1 Effect on energy consumption (% change) – Output of GES�model runs
Based on the figures from this study a reduction in fuel consumption of around 14% could be achieved for this class of vessel when steaming at full speed. It is estimated that the vessel steams for around 11% of the time. Using the GES model and reducing steaming speed from 1415 rpm to 1200 rpm to achieve a speed of 8.5 knots, the yearly fuel reduction was found to be 1.1% (Table 6435) based on the operating profile of the vessel. This is slightly lower than the % savings found by SEAFISH in the UK, that report savings for similar classes of vessel of between 245% (Curtis et al., 2006).
160
150
140
Fuel C
onsumption l/hr
130
120
110
100
90
80
70
1,600 rpm
60
1,500 rpm
50
1,400 rpm
40
1,300 rpm
30
1,200 rpm
20
10
Speed knots 0 5 6 7 8 9 10 11

Report Number C002/08 253/425
Table 6435: Effect on fuel consumption and gaseous emissions of running the main engine at lower rpm
Item Base line
Diesel speed 1200 rpm instead of
1415 rpm Fuel reduction
Fuel [ton/yr] 360.03 356.06 1.10
CO2 [ton/yr] 1131.69 1119.31 1.09
SOx [ton/yr] 7.20 7.12 1.10
NOx [ton/yr] 22.99 23.07 40.36
HC [ton/yr] 0.51 0.48 5.77
CO [ton/yr] 1.29 1.24 3.32
6.7.5.1.2 Investment required for the adaptation (* 1000 €)
The investment costs are zero.
6.7.5.1.3 Effect on income (LPUE, landings per unit of effort)
No effect on LPUE.
6.7.6 Adaptations under study – Adaptation No 5: Optimising bollard pull
Like speed, fuel consumption can be matched to the optimal bollard pull of your vessel. Bollard Pull is an indication of the maximum towing force that your vessel can exert. It is generally measured at Zero knots. Thrust decreases as vessel speed rises so the pull available at towing speed is generally lower than measured bollard pull. To illustrate the fuel saving that can be made, trials from this reference vessel were conducted (O’Regan, 2006); Fuel consumption and bollard pull measured with the engine rpm fixed for each curve shown in Figure 6430 and the pitch increased in steps for each recorded point. The graph clearly demonstrates how the most efficient combination of pitch and rpm can significantly reduce fuel consumption. If this vessel wants 8 tonnes bollard pull it can burn between 60 & 100 litres per hour depending on rpm & pitch settings.
Figure 6430: Fuel consumption as a function of rpm setting and bollard pull
160
150
140
Fuel C
onsumption l/hr
130
120
110
100
90
80
70
1,600 rpm
1,500 rpm
60
50
1,400 rpm
40
1,300 rpm
30
1,200 rpm
20
10
0 2 4 6 8 10 12 14
Bollard Pull (tones)

254 of 425 Report Number C002/08
6.7.6.1 Effects of Adaptation No 5
6.7.6.1.1 Effect on energy consumption (% change) – Output of GES�model runs
Based on the figures from this study a reduction in fuel consumption of around 10% could be achieved for this class of vessel but this figure should be treated with extreme caution as the bollard pull needed to haul gear will vary depending on operational and environmental factors and the tests were done at zero knots. In GES an optimum was found. The speed of the engine is changed from 1250 rpm to 1114 rpm, with propeller pitch changing. Using the GES model and optimizing the engine speed from 1250 rpm to 1114 rpm and controlling the pitch the model predicts a small fuel reduction of only 0.7% (Table 6436). The output from the model and the tests carried out suggest a power management system for controlling propeller pitch and motor rpm together can optimize fuel consumption.
Table 6436: Effect on fuel consumption and gaseous emissions of running the main engine at a somewhat higher rpm while fishing
Item Base line Fishing Diesel speed 1114 rpm instead of 1250 rpm Reduction %
Fuel [ton/yr] 360.03 357.53 0.70
CO2 [ton/yr] 1131.69 1123.86 0.69
SOx [ton/yr] 7.20 7.15 0.70
NOx [ton/yr] 22.99 25.46 410.73
HC [ton/yr] 0.51 0.45 11.80
CO [ton/yr] 1.29 1.36 45.56
6.7.6.1.2 Investment required for the adaptation (* 1000 €)
The investment costs are zero, except for the cost of a marine engineer/naval architect to carry out an accurate set of bollard pull tests, which would be in the region of €100041500.
6.7.6.1.3 Effect on income (LPUE, landings per unit of effort)
No effect on LPUE.
6.7.7 Adaptations under study – Adaptation No 6: Fitting a fuel meter
Anecdotal reports from fishing skippers suggest that through fitting a fuel meter, indicative savings in fuel consumption of approximately 10% can be made. Modern fuel meters indicate fuel consumption per hour and with an input from a GPS can indicate the fuel consumption per nautical mile. Once calibrated properly, fuel meters will provide reasonably accurate real4time data and will facilitate control of optimal throttle settings and monitoring of engine problems.

Report Number C002/08 255/425
6.7.7.1 Effects of Adaptation No 6
6.7.7.1.1 Effect on energy consumption (% change) – Output of GES�model runs
Based on the figures from this study a reduction in fuel consumption of around 10% could be achieved for this class of vessel based on indicative results and anecdotal information from fishing skippers. This is based on changes in skipper behaviour resulting from awareness of fuel use at various operational settings that such a fuel meter enhances mostly leading to more efficient steaming and fishing speeds through optimisation of pitch and rpm. For a constant fishing speed of 2.87 kts the main engine rpm is increased from 950 to 1400 rpm in the GES4model run. The corresponding fuel consumption is given in Figure 6431 below. Propeller pitch is controlled to keep the towing speed at 2.87 kts.
Fuel consumption for fishig with 2.87 kts
135
136
137
138
139
140
141
142
143
144
145
950 1000 1050 1100 1150 1200 1250 1300 1350 1400
rpm
l/hr
Figure 6431: Fuel consumption when trawling at a constant speed of 2.87 knots.
For a low engine speed in this case the fuel consumption is high. If we compare the fuel reduction with the low engine speed the following reduction curve in Figure 6432 is found. For the same fishing speed (2.87 kts) we found a potential fuel saving of about 12%, leading to the conclusion that a optimum power management system is advantageous in the case of CPP propellers. In reality, however, given factors such as tides, weather, ground conditions and the behaviour of the fishermen it is difficult for any vessel to towed consistently at the same speed.

256 of 425 Report Number C002/08
Fishing speed is 2.87 kts
0
2
4
6
8
10
12
14
16
18
950 1050 1150 1250 1350 1450 1550
% r
educ
tion
Figure 6432: % fuel reduction at different rpm when towing at a constant speed of 2.87 knots
Based on the figures from this study a reduction in fuel consumption of around 10%412% could be achieved for this class of vessel based on the model output, indicative results and anecdotal information from fishing skippers.
6.7.7.1.2 Investment required for the adaptation (* 1000 €)
The investment costs are around €1200 to €3100 for fitting an accurate fuel monitoring system.
6.7.7.1.3 Effect on income (LPUE, landings per unit of effort)
No effect on LPUE.
6.7.8 Adaptations under study – Adaptation No 7: Fouling – hull cleaning system
For vessels that steam long distances to and from fishing grounds, correct hull maintenance procedures will certainly be repaid in speed and fuel economy. An increase in resistance of over 30% has been noticed on boats that have heavy fouling, and in some cases the hull has become so heavily encrusted that 30% more power and hence fuel is required to maintain normal steaming or towing speed. From tests done on this reference vessel, following hull cleaning and painting the vessel showed gains in speed and fuel economy. At normal steaming rpm the speed increased by 2.9 knots, and fuel consumption decreased by 1.5 litre/hour and at maximum rpm a increase in speed of 2.1 knots was achieved. This equates to a decrease in fuel consumption of around 5% per year. The use of more effective anti fouling can also lead to fuel savings but over a long term period ~ 10415 years. Some of these antifouling that use self4polishing technology are not particularly applicable to fishing vessels as they do not travel quickly enough but newer anti fouling made from copper or copper4nickel alloys have been shown to have a high resistance to bio4fouling. Copper4nickel anti fouling has proven performance in reducing bio4

Report Number C002/08 257/425
fouling from sea water pipe work and intake screens, water boxes and for cladding of offshore structures and in recent years has begun to be used on the hulls of vessels. Such paints are not proven yet for fishing vessels but reports from merchant vessel suggest that hulls coated with copper or copper alloy shown any minimal corrosion after 14 months or more, reducing the need to slip the vessel frequently. Over the long term it has been found that the hulls of vessels moored for extended periods fouling eventually does build up but it is not strongly adherent as with other antifouling and can be easily removed. According to Powell (2002), on boat hulls, experience suggests that a self4cleaning mechanism exists with copper based anti4fouling at between 348 knots which is within the range that fishing vessels similar to the reference vessel normally operate at. It is therefore felt that this technology may be an option for fishing vessels that over a longer term will save fuel.
6.7.8.1 Effects of Adaptation No 7
6.7.8.1.1 Effect on energy consumption (% change) – Output of GES�model runs
Based on the results of trials carried out a saving in fuel of around 5% per year can be expected from proper hull maintenance. This is based on the vessel being slipped every year. Additional savings maybe achievable with copper based anti fouling but this is as yet unproven. No actual data is available on the rate of growth on the hull of this vessel, but taking the hull roughness for the baseline ship to be 200 microns and the roughness after cleaning is taken as 130 micron and with growth at 280 micron this gives a difference between a cleaned hull and a dirty hull of about 0.28% in fuel consumption for this specific operational profile (See Table 6437).
Table 6437: Effect on fuel consumption and gaseous emissions of increasing the surface roughness
Baseline 200 micron
Cleaning 130
micron
Growth 280
micron
% Reduction
cleaning
% Reduction
growing
Fuel [ton/yr] 360.03 359.49 360.52 0.15 �0.13
CO2 [ton/yr] 1131.69 1129.97 1133.22 0.15 40.14
SOx [ton/yr] 7.20 7.19 7.21 0.15 40.13
NOx [ton/yr] 22.99 22.95 23.02 0.17 40.15
HC [ton/yr] 0.51 0.51 0.51 0.09 40.08
CO [ton/yr] 1.29 1.28 1.29 0.08 40.07
Figure 6433 below shows for a steaming speed of 8.5 kts there is a potential fuel saving of about 2% and at 10 kts this is increased to 2.6%.
Steaming
0
0.5
1
1.5
2
2.5
3
130 180 230 280
Skin roughness [micron]
%
Increased % fuel 8.5 kts
Increased % fuel 10 kts
Figure 6433: % reduction in fuel at different steaming speeds with increasing hull roughness

258 of 425 Report Number C002/08
6.7.8.1.2 Investment required for the adaptation (* 1000 €)
Cost estimates for dry4docking, hull preparation and hull treatment are estimated at around €7,500 for this vessel. Costs for using copper based anti4fouling increase to around €40,000 in year 1, but then are reduced to around €5,000 for the next 10415 year period.
6.7.8.1.3 Effect on income (LPUE, landings per unit of effort)
No effect on LPUE.
6.7.9 Adaptations under study – Adaptation No 8: Engine maintenance
Manufacturers recommend a maintenance schedule to maintain efficiency and reliability. Service intervals should be adhered to rigorously. A poorly maintained engine will run less efficiently with detrimental effect on fuel consumption. The essential areas to maintain are the fuel system, compression pressures, air and turbo4charging system but even the smallest leaks should be attended too immediately. The following faults in Table 6438 lead to the indicative additional fuel consumption shown below:
Table 6438: Added fuel consumption by main engine malfunctions
Area Added Fuel consumption
Dirty Air Intake Filter 2.0g/kWh
Dirty Air Cooler 2.0g/kWh
Dirty Turbocharger 4.0g/kWh
Worn Injector Nozzles 2.0g/kWh
Worn Injection Pump 4.0g/kWh
Low calorific value of fuel 1.2g/kWh
Water in fuel (0.5%) 1.0g/kWh
Total Fuel Penalty 16.2g/kWh
A combination of all the above faults will add 16g/kWh to the vessels fuel consumption, which equates to 9.5 litres per hour saving for this reference vessel or ~ 36,000 litres in a year (5% saving on total fuel consumption). Other engine room problems can also cause increased fuel consumption. These include restriction in flow of air to the engine, restrictions in exhaust outlet pipes, poor cooling of turbocharged air and worn cylinders. These faults can easily double the fuel penalty above and reduce reliability considerably.
6.7.9.1 Effects of Adaptation No 8
6.7.9.1.1 Effect on energy consumption (% change) – Output of GES�model runs
Based on available data it is reasonable to assume that basic engine maintenance will result in a saving of ~5% per year for this reference vessel. The GES model predicts a reduction of 7.97% for this vessel and operational profile when the nominal specific fuel consumption is reduced by 16.2 g/kWh (Table 6439).

Report Number C002/08 259/425
Table 6439: Effect on fuel consumption and gaseous emissions of changing the nominal specific fuel consumption of the engine with 16.2 g/kWh
[ton/yr] Base line Reduction engine 16.2 g/kWh %
Fuel [ton/yr] 360.03 331.33 7.97 CO2 [ton/yr] 1131.69 1041.18 8.00 SOx [ton/yr] 7.20 6.63 7.97 NOx [ton/yr] 22.99 22.99 0.00 HC [ton/yr] 0.51 0.51 0.00 CO [ton/yr] 1.29 1.29 0.00 Therefore based on the available data and the model output it is reasonable to assume that basic engine maintenance will result in a saving of ~5%�8% per year for this reference vessel
6.7.9.1.2 Investment required for the adaptation (* 1000 €)
Basic maintenance should already be included in the vessels normal operating costs although additional costs may be incurred if the frequency is increased. No actual figures are available.
6.7.9.1.3 Effect on income (LPUE, landings per unit of effort)
No effect on LPUE.
6.7.10 Summary Table of Adaptations for Reference Vessel
Table 6440 provides a summary of the indicative savings based on the results available and the outputs from the GES model.
Table 6440: Summary of effects on fuel savings, investment costs, and landings for adaptations studied
No Adaptation Potential Fuel Saving (%) Investment Costs (€) Effect on LPUE (%)
1 Gear Modifications – doors & trawls 6413.5 17,500 none
2 Reverting to single rig 10421 24,000 416
3 Converting to Seine Netting 25 68,500 425 to 430
4 Reduction in Steaming Speed 145 none none
5 Optimising Bollard Pull 142 100041500 none
6 Fitting a Fuel Meter 10412 120043100 none
7 Hull cleaning 245 7,500 none
8 Engine Maintenance 548 none none
6.7.11 References
Curtis, H.C., Graham, K., and Rossiter T. (2006). Options for Improving Fuel Efficiency in the UK Fishing Fleet. SEAFISH October 2006. 47pp.
O’Regan, N., (2006). Survey Report of Sea Trials carried out by BIM aboard the mfv “Cisemair” and Boy Jason” . BIM Report. April 2006.
Rihan, D. (2004). Case Study 2. A comparison of twin4Rig Trawling and Single Rig Trawling in terms of Relative Fishing Efficiency. In: Thomsen, B., Revill, A., Rihan, D. and Eigaard, O. (Eds) Report of Efficiency and Productivity in Fish Capture Operations. Report of the ICES4FAO Working Group on Fishing Technology and Fish

260 of 425 Report Number C002/08
Behaviour (WGFTFB), ICES Fisheries Technology Committee ICES CM 2004/B:05, Ref. ACE. 20423 April 2004, Gdynia, Poland. ICES WGFTFB Report 2004pp 189.
Ward, N., Montgomerie M., and Lart, W., (2005). Fuel efficiency trials using Jackson trawls with reduced twine diameter on MFV Challenge II. SEAFISH Report No. 578. 31pp.
Segment (gear, length, power): OTB, 36m, 736 kW (1000 hp) Participant: BIM Author(s): D. Rihan, J. van Vugt
6.7.12 Reference design 2: OTB, 24440 m
6.7.12.1 Vessel
Figure 6434: Picture of the reference vessel
Table 6441: Main particulars of the reference vessel
Item Value
Year built 2003
Length over all (m) 37.05
Breadth (moulded, m) 10
Depth main deck (m) 4.2
Depth shelter deck 6.5
Depth forecastle deck 8.8
Scantling draft (m) 5
Main engine power (kW) MAN B&W Alpha 8L21/31 700Kw
Gearbox AMG 28 E56V O28 5.56:1 reduction
Tonnage (GT) 507
Main target species Haddock, whiting, monkfish, megrim

Report Number C002/08 261/425
This vessel as shown in Figure 6434 and described in Table 6441 is a relatively new vessel built in 2003. It is designed as a deepwater trawler with the capability of twin4rig trawling. The vessel is constructed with two continuous decks, main deck and shelter deck, and with a long forecastle and boat decks. The hull shape is of a round bilge construction with a bulbous bow and stern keg, flared stem and transom stern. The fishing deck is arranged with a 3 trawl winches forward, 2 double sweepline winches forward, 2 double bobbin tracks leading from the winches and fat leading into a single trawl ramp at the stern. Balconies are situatred either side of the tarwlramp at the stern to allow acces to the centre clump weight when used. The fish catch is emptied onto the processing deck through two codend hatches.The vessel has acccmmodation for a crew of 11. The vessel is powered by a MAN B&W Alpha Diesel 8L21/31 engine developing 700 kW and driving a 3.1 m 44 bladed controllable pitch propeller in a fixed nozzle through a 5.57:1 reduction gearbox with a primary Power take off driving 6 x 110 kW/3 x 400v/50Hz/1460rpm hydraulic pumps. This gives the vessel a top speed of of around 13 knots at 85% mcr. The vessel has a calculated bollard pull of ~ 41.8 tonnes. A 3412 DITA Caterpillar auxiliary engine drives a 500 kW alternator for the refrigeration and main electric power supply. A 3306 Caterpillar engine drive a 160 kW alternator used as a harbour generator. For added manoeuvrability the vessel also has a 4 blade bow thruster producing 250 hp. The deck machinery includes 3 split trawl winches rated @ 31.7 tonnes/209m/min pull 1st layer and with a capacity for 4010 m x 26 mm warp and 2 split net drums mounted at rated @ 22.2 tonnes/26m/min pull 1st layer. The vessel also has 2 x sweepline winches with 17.4 tonnes @ 29 m/min pull and two gilson winches with similar characteristics. The fish room is split into a fresh hold with a capacity of 170 m³ and a freezer hold with a capacity of 85 m³ . The refrigeration is operated by electronically driven compressors to maintain a temperature of in the fresh hold of 42ºC and of 430ºC in the freezer hold. Two ice machine capable of making 2.5 tonnes/day are also fitted, along with tanks for storing fish livers.
6.7.12.2 Gear Table 6442 describes the main parameters of the fishing gear used.
Table 6442: Main particulars of fishing gear of the reference vessel
Item Value
Gear code (e.g. TBB, OTB, OTM, …) OTB
Type description Single4rig demersal
Otter boards (type, size, and weight) Poly4ice Viking B 3.23 x 2.57 1600kg
Main gear dimensions (circumference, beam width, (m)) 650 x 130mm
Headline length (m) 32m
Footrope length (m) 39m
Cod4end mesh size (mm) 100mm x 6mm single
Bridles 55m x 28mm wire & 19mm chain
90m x 30mm wire
Comments 4
This vessel uses a single rig rockhopper footrope trawls with 406 mm rubber discs packed with 203 mm discs. The footrope is mounted on 18 mm wire. Floatation consists of 150 x 203 mm deepwater floats with an estimated weight of each trawl around 1,700 kg. The vessel usually fishes in depths of 200 m4600 m on rough ground. The vessel has only recently reverted to fishing with one single trawl, previously fishing with 2 of the above trawls with a 2200 kg clump weight.

262 of 425 Report Number C002/08
6.7.12.3 Operational profile Table 6443 shows the operational profile split between steaming, fishing, shooting and hauling gear, time in harbour and searching or dodging weather.
Table 6443: Time split over operational modes
Operational mode Percentage of time %
Steaming to and from fishing grounds 19
Shooting and hauling gears 21
Fishing 39
Searching 8
Dodging 1
Time in harbour 12
This vessel typically fishes approximately 240 days per year, working 10 day fishing trips. The indicative operational profile for a typically 10 day trip is shown in Table 6444 as follows:
Table 6444: Operational modes and duration by trip
Operational mode Duration (hours) Comments
Harbour time 12 Diesel, ice, provisions
Steaming to grounds 26 Steaming @ 9 knots
Shoot gear 26 Based on shooting time of 1 hour 15 minutes/tow
Fishing 108 Based on 20 x ~5 hour tows
Hauling gear 30 Based on hauling time of 1.5 hours/tow
Steaming to port 26 Steaming @ 9 knots
Harbour Operation 20 Landing fish, engine maintenance
The operation profile for a 10 day trip predicted by the GES model is given in Table 6445: Table 6445: Operational profile for the base line reference vessel Name Duration Distance Velocity
[4] [hrs] [nm] [kn]
Harbour 3192.00 0 0.00
Steaming to fishing ground 624.00 6864 11.00
Shooting 624.00 3120 5.00
Fishing 2400.00 7200 3.00
Hauling 720.00 360 0.50
Steaming to harbour 624.00 6864 11.00
Harbour operation 576.00 0 0.00
6.7.12.4 Evaluation of the state of technology This vessel is quite modern being built in 2003 and is one of the larger Irish vessels in this length category. The vessel is designed to fish in all weathers and also has a freezing system on board. The fishing gear used is standard for such a vessel. The deck machinery and electronics on board are again standard for this class of vessel, although the vessel has heavy winches as it was designed originally to fish in deep waters ~ 700m.

Report Number C002/08 263/425
6.7.12.5 Catch This vessel targets mixed demersal species mainly haddock, monkfish, megrim and squid at Rockall fishing in 200 m4400 m depth as well as deepwater species in 700 m41100 m depth. The vessel had average landings of €1.6 million in the period 200442006 landing in excess of 365 tonnes.
6.7.12.6 Energy performance
6.7.12.6.1 Fuel consumption
The average annual fuel consumption for this vessel over the period 200442006 was around 1,819,422 litres based on consumption of between 50,000 – 55,000 litres per 10 day trip. The measured fuel consumption by activity based on data supplied over the course of a typical trip is given in Table 6446.
Table 6446: Engine load, propeller pitch, speed and fuel consumption as a function of operational mode
Activity RPM Pitch Speed (knots) Fuel Consumption
(l/hr)
Steaming 850 90 11 220
Shooting 650 90 5 168
Towing 800 90 3.0 180
Hauling 550 0 0 155
Dodging (bad weather) n/a n/a n/a n/a
When towing two trawls in deepwater deeper than 700m, the fuel consumption can be as high as 230l/hr 4 260l/hr.
Table 6447: Fuel consumption and gaseous emissions for base line reference vessel
Item Base line consumption
Fuel [ton/yr] 607.08
CO2 [ton/yr] 1908.11
SOx [ton/yr] 12.14
NOx [ton/yr] 34.71
HC [ton/yr] 0.86
CO [ton/yr] 2.22

264 of 425 Report Number C002/08
FUEL CONSUMPTION [ton/year]
0
50
100
150
200
250
300
350
400
Har
bour
Ste
amin
g to
fish
ing
grou
nd Sho
otin
g
Fis
hing
Hau
ling
Ste
amin
g to
harb
our
Har
bour
ope
ratio
n
MAN B&W Alpha 8L21/31, tank_1
Title:Demersal Trawler, Technology:2008Run date:23-10-2008/09:00:11Input file:COMOutput file:Results.csvResults file:ResultsOutput.csv
Figure 6435: Yearly fuel consumption on various operational modes for the reference vessel
The yearly fuel consumption for fishing is about 341 ton. For steaming is the fuel consumption 2*100=200 ton the total consumption in this case is 670 ton. This ship consumed relative much fuel for steaming.
6.7.12.6.2 Efficiencies – Output of GES�model runs
Efficiency [-]
0
0.02
0.04
0.06
0.08
0.1
0.12
0.14
0.16
0.18
0.2
Har
bour
Ste
amin
g to
fish
ing
grou
nd Sho
otin
g
Fis
hing
Hau
ling
Ste
amin
g to
harb
our
Har
bour
ope
ratio
n
Efficiency [-]Title:Demersal Trawler, Technology:2008Run date:23-10-2008/09:00:11Input file:COMOutput file:Results.csvResults file:ResultsOutput.csv
Figure 6436: Efficiency of the installation by operating mode for the baseline

Report Number C002/08 265/425
The efficiency while steaming is higher than while towing, and when hauling gear the vessel is at its least efficient mode. This is due to the fact that when hauling the vessel uses all six hydraulic pumps from the main engine to power the hydraulics thus reducing efficiency. The efficiency for the fishing operation is low comparing with steaming, but that is also found for other vessels (Figure 6436).
6.7.12.6.3 Energy distribution – Output of GES�model runs
Operational Profile, Required Power [kW]
0
50
100
150
200
250
300
350
400
Har
bour
; 319
2 hr
/yr
Ste
amin
g to
fish
ing
grou
nd; 6
24 h
r/yr
Sho
otin
g; 6
24 h
r/yr
Fis
hing
; 240
0 hr
/yr
Hau
ling;
720
hr/
yr
Ste
amin
g to
harb
our;
624
hr/
yr
Har
bour
ope
ratio
n;57
6 hr
/yr
Hotel_load
Gears
Propellers
Title:Demersal Trawler, Technology:2008Run date:23-10-2008/09:00:11Input file:COMOutput file:Results.csvResults file:ResultsOutput.csv
Figure 6437: The required power of the vessel by operational mode.
Figure 6437 shows the yearly operational profile and required kW of this vessel by operational parameter. The ship’s resistance steaming power for 11 kts is about 350 kW. The engine power is about 700 kW and the needed fuel power is 1.8 MW. During fishing the power needed to propel the ship (6.3 kW) is negligible in comparison with the power needed to tow the gear (142kW). When towing two trawls in deepwater deeper than 700m, the skipper of the vessel has reported that fuel consumption can be as high as 230l/hr 4 260l/hr, although these are only estimated figures. It should be noted that given the high fuel consumption when towing two nets in deepwater that this vessel subsequently reverted back to towing just one single net to keep fuel consumption less than 200l/hr.
6.7.13 Adaptations under study – Adaptation No 1: Gear modifications – doors and trawls
6.7.13.1 Short description of Adaptation No 1: Gear modifications The adaptations or measures for reducing fuel consumption for this reference vessel are the same as those described for the 12424m demersal trawler described in the previous section and thus the savings in fuel achievable through modifications or optimising performance of trawls and trawl doors are similar for this vessel. It is interesting to note during trials in deepwater fisheries > 900m on board a 27m Irish vessel when towing a rockhopper trawl with a reduced twine surface area (12%) and ground gear of 30m compared to 37m a reduction
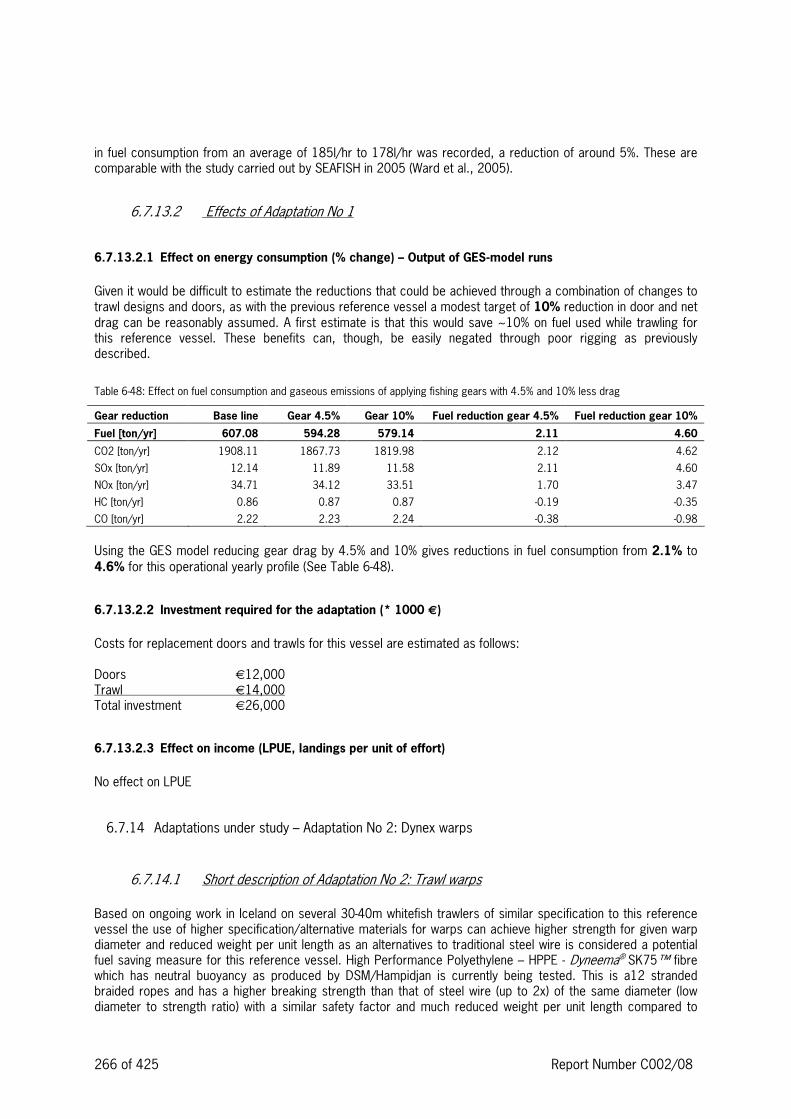
266 of 425 Report Number C002/08
in fuel consumption from an average of 185l/hr to 178l/hr was recorded, a reduction of around 5%. These are comparable with the study carried out by SEAFISH in 2005 (Ward et al., 2005).
6.7.13.2 Effects of Adaptation No 1
6.7.13.2.1 Effect on energy consumption (% change) – Output of GES�model runs
Given it would be difficult to estimate the reductions that could be achieved through a combination of changes to trawl designs and doors, as with the previous reference vessel a modest target of 10% reduction in door and net drag can be reasonably assumed. A first estimate is that this would save ~10% on fuel used while trawling for this reference vessel. These benefits can, though, be easily negated through poor rigging as previously described.
Table 6448: Effect on fuel consumption and gaseous emissions of applying fishing gears with 4.5% and 10% less drag
Gear reduction Base line Gear 4.5% Gear 10% Fuel reduction gear 4.5% Fuel reduction gear 10%
Fuel [ton/yr] 607.08 594.28 579.14 2.11 4.60
CO2 [ton/yr] 1908.11 1867.73 1819.98 2.12 4.62
SOx [ton/yr] 12.14 11.89 11.58 2.11 4.60
NOx [ton/yr] 34.71 34.12 33.51 1.70 3.47
HC [ton/yr] 0.86 0.87 0.87 40.19 40.35
CO [ton/yr] 2.22 2.23 2.24 40.38 40.98
Using the GES model reducing gear drag by 4.5% and 10% gives reductions in fuel consumption from 2.1% to 4.6% for this operational yearly profile (See Table 6448).
6.7.13.2.2 Investment required for the adaptation (* 1000 €)
Costs for replacement doors and trawls for this vessel are estimated as follows: Doors €12,000 Trawl €14,000 Total investment €26,000
6.7.13.2.3 Effect on income (LPUE, landings per unit of effort)
No effect on LPUE
6.7.14 Adaptations under study – Adaptation No 2: Dynex warps
6.7.14.1 Short description of Adaptation No 2: Trawl warps Based on ongoing work in Iceland on several 30440m whitefish trawlers of similar specification to this reference vessel the use of higher specification/alternative materials for warps can achieve higher strength for given warp diameter and reduced weight per unit length as an alternatives to traditional steel wire is considered a potential fuel saving measure for this reference vessel. High Performance Polyethylene – HPPE 4 Dyneema® SK75™ fibre which has neutral buoyancy as produced by DSM/Hampidjan is currently being tested. This is a12 stranded braided ropes and has a higher breaking strength than that of steel wire (up to 2x) of the same diameter (low diameter to strength ratio) with a similar safety factor and much reduced weight per unit length compared to

Report Number C002/08 267/425
steel wire – up to one4sixth of the weight in air and 1/40th of the weight in water. Less warp weight will reduce towing and hauling power requirements resulting in less fuel consumption. In the Icelandic trials the vessel “Vestmannaey VE4444” is using 4000 metres of 23mm dynex rope as warps instead of 26mm wire as previously used with a reduction in total weight of 2 tonnes compared to 12 tonnes for wire warp. The lower weight means that there is less load on the winches. Fuel consumption for this vessel has reportedly decreased from 1654170l/hr to 140l/hr (Anon, 2007).
6.7.14.1.1 Effect on energy consumption (% change) – Output of GES�model runs
Taking the results of the Icelandic trials the use of Dynex warps could potential create fuel savings of 15420% although this is based on results from a short trial on a similar vessel. Based on the information from Hampidajan • Warp diameter 23mm Dynex at 0.3kg/m x 1000m (in air) • Warp diameter 26mm Dyform Wire at 3.08kg/m x 1000m (in air) • Warp diameter 18mm Dynex at 0.2kg/m x 400m replacing 1.45kg/m No assessment was made using the GES model.
6.7.14.1.2 Investment required for the adaptation (* 1000 €)
This material has the disadvantage of having high cost compared to steel wire and its durability and lifespan as yet unproven. The projected costs for replacing the traditional warp with dynex warp for this vessel are estimated as follows: Steel wire cost – 2000m x 26mm: @ €5.50/m = €11,000 Replacement cost 2 x 1000fthm for 23mm Dynex Rope @ ~€25/m = €50,000 Some additional investment cost would be incurred in running block replacement/modification to be compatible with the new materials (no information available).
6.7.14.1.3 Effect on income (LPUE, landings per unit of effort)
No anticipated effect on LPUE.
6.7.15 Adaptations under study – Adaptation No 3: Reverting to single rig
6.7.15.1 Short description of Adaptation No 3: Reverting to single rig This reference vessel previously either fished in deepwater > 700m for species such as orange roughy, black scabbard and grenadier towing a single rockhopper trawl or used a twin4rig to fish for mixed whitefish species at Rockall. In the last two years the vessel has reverted back to towing one of the twin4rig nets to reduce fuel consumption and with reduced quotas for deepwater species does not participate in this fishery any longer. Reverting to one net has shown a considerable reduction in fuel consumption from 260l/hr with the twin4rig and in deepwater to 1804200 l/hr with the single net. The vessel has had to increase the size of the trawl doors but is now towing with considerable less load on the engine than previously ~ 50%.

268 of 425 Report Number C002/08
6.7.15.1.1 Effect on energy consumption (% change) – Output of GES�model runs
Based on the anecdotal information supplied by the skipper fuel consumption on reverting to single rig trawling has been reduced by 24430%.
6.7.15.1.2 Investment required for the adaptation (* 1000 €)
The investment costs for reverting to single rig trawling equate to the following: 1 x single rig trawls €14,000 1 x set of trawl doors €12,000 Total investment €26,000
6.7.15.1.3 Effect on income (LPUE, landings per unit of effort)
Based on information from the skipper LPUE has been reduced by around 25% when fishing with one net but that species composition has changed with more squid and roundfish species such as haddock and saithe in his catch. Adaptations under study – Adaptation No 4: Reduction in steaming speed Although not completely comparable the results reported for the first reference vessel are considered relevant for this vessel. These tests indicated a saving of 14% for this vessel when steaming if rpm and pitch were optimised (O’Regan, 2006). In the following figure the fuel consumption is given for different diesel engine speeds (rpm) with constant vessel speed.
Fuel consumption by constant ship speed
50
70
90
110
130
150
750 800 850 900 950 1000
rpm
kg/h
r Steaming 8 kts
Steaming 10 kts
Figure 6438: Fuel consumption as a function of rpm setting and speed

Report Number C002/08 269/425
% fuel consumption by constant ship speed
0
10
20
30
40
750 800 850 900 950 1000
rpm
%
% 8 kts
% 10 kts
Figure 6439: Fuel consumption as a function of rpm setting and speed
If the engine speed setting by using a CP propeller is not correct, the fuel consumption can variate for the same ship speed with more than 20 %. Therefore a power management system is recommended.
6.7.15.2 Effects of Adaptation No 4
6.7.15.2.1 Effect on energy consumption (% change) – Output of GES�model runs
Based on the figures from this study a reduction in fuel consumption of around 14% could be achieved for this class of vessel. It is estimated this vessel steams for around 19% of the time.
Table 6449: Effect on fuel consumption and gaseous emissions of applying fishing gears with 4.5% and 10% less drag
Item Baseline Steaming 10 kts Steaming 8 kts % Reduction 10 kts % Reduction 8kts
Fuel [ton/yr] 607.08 559.60 519.94 7.82 14.35
CO2 [ton/yr] 1908.11 1758.31 1633.21 7.85 14.41
SOx [ton/yr] 12.14 11.19 10.40 7.82 14.35
NOx [ton/yr] 34.71 32.65 31.83 5.93 8.31
HC [ton/yr] 0.86 0.87 0.86 40.84 0.61
CO [ton/yr] 2.22 2.25 2.30 41.59 43.85
For the operation profile is the diesel speed for all the operational conditions reduced with 10%. For instance the steaming diesel speed is reduced from 850 rpm to 765 rpm. See the following table for all the diesel engine speed settings.

270 of 425 Report Number C002/08
Table 6450: Operational profile for slow running engine
Name Basic Engine speed EngineSpeed
[-] [rpm] [rpm]
Harbour 0 0
Steaming to fishing ground 850 765
Shooting 650 585
Fishing 800 720
Hauling 550 495
Steaming to harbour 850 765
Harbour operation 0 0 The engine speed is reduced by 10% and using the GES model the yearly fuel reduction was found to be 4.6% (Table 6451) based on the operating profile of the vessel. This is equivalent to the percentage savings found by SEAFISH in the UK, who reported savings between 245% for similar vessel classes (Curtis et al., 2006).
Table 6451: Effect on fuel consumption and gaseous emissions of running the main engine at lower rpm
Item Base line
Diesel speed 90% rpm instead of
100% rpm % Fuel reduction
Fuel [ton/yr] 607.08 579.31 4.57
CO2 [ton/yr] 1908.11 1820.71 4.58
SOx [ton/yr] 12.14 11.59 4.57
NOx [ton/yr] 34.71 38.27 410.26
HC [ton/yr] 0.86 0.73 15.97
CO [ton/yr] 2.22 2.40 48.22
6.7.15.2.2 Investment required for the adaptation (* 1000 €)
The investment costs are zero.
6.7.15.2.3 Effect on income (LPUE, landings per unit of effort)
No effect on LPUE.
6.7.16 Adaptations under study – Adaptation No 5: Optimising bollard pull
Although again not completely comparable the results reported for the first reference vessel are considered relevant for this vessel with respect to optimising bollard pull. These tests indicated a saving of around 10% for this vessel when trawling if rpm and pitch were optimised (O’Regan, 2006).
6.7.16.1 Effects of Adaptation No 5
6.7.16.1.1 Effect on energy consumption (% change) – Output of GES�model runs
Based on the figures from this study a reduction in fuel consumption of around 10% could be achieved for this class of vessel but this figure should be treated with extreme caution as the bollard pull needed to haul gear will vary depending on operational and environmental factors.

Report Number C002/08 271/425
Using the GES model, optimizing the engine speed from 800 rpm to 581 rpm and controlling the pitch the prediction is a small fuel reduction of around 4% (Table 6452). It is found that at this speed the propeller works near the point of maximum efficiency. The output from the model and the tests carried out suggest that using a power management system for controlling propeller pitch and motor rpm together would enable optimizing fuel consumption.
Table 6452: Effect on fuel consumption and gaseous emissions of running the main engine at a somewhat higher rpm while fishing
Item Base line Fishing Diesel speed 589 rpm instead of 800 rpm Reduction %
Fuel [ton/yr] 607.08 581.94 4.14
CO2 [ton/yr] 1908.11 1828.38 4.18
SOx [ton/yr] 12.14 11.64 4.14
NOx [ton/yr] 34.71 42.62 422.79
HC [ton/yr] 0.86 0.75 13.66
CO [ton/yr] 2.22 2.75 424.22
6.7.16.1.2 Investment required for the adaptation (* 1000 €)
The investment costs are zero, except for the cost of a marine engineer/naval architect to carry out an accurate set of bollard pull tests, which would be in the region of €100041500.
6.7.16.1.3 Effect on income (LPUE, landings per unit of effort)
No effect on LPUE.
6.7.17 Adaptations under study – Adaptation No 6: Fitting a fuel meter
Anecdotal reports from fishing skippers suggest that through fitting a fuel meter, indicative savings in fuel consumption of approximately 10% can be made. Modern fuel meters indicate fuel consumption per hour and with input from a GPS navigation system one can indicate the fuel consumption per nautical mile. Once calibrated properly, fuel meters will provide reasonably accurate real4time data and will facilitate control of optimal throttle settings and monitoring of engine problems.
6.7.17.1 Effects of Adaptation No 6
6.7.17.1.1 Effect on energy consumption (% change) – Output of GES�model runs
Based on the figures from this study a reduction in fuel consumption of around 10% could be achieved for this class of vessel based on indicative results and anecdotal information from fishing skippers. This is based on changes in skipper behaviour resulting from awareness of fuel use at various operational settings that such a fuel meter enhances mostly leading to more efficient steaming and fishing speeds through optimisation of pitch and rpm. For a constant fishing speed of 3 kts the main engine rpm was changed from 750 to 1000 rpm in the GES4model run. The corresponding fuel consumption is given in the figure below. Propeller pitch is controlled to keep the towing speed at 3 kts.

272 of 425 Report Number C002/08
Fuel consumption by constant ship speed
120
130
140
150
160
170
750 800 850 900 950 1000
rpm
kg/h
r
Fishing 3 kts
Figure 6440: Fuel consumption as a function of engine rpm
For a high engine rpm fuel consumption is also high in this case (Figure 6440). If we compare the fuel reduction with the low engine speed the following reduction curve can be obtained.
% fuel consumption by constant ship speed 3 kts
0
5
10
15
20
750 800 850 900 950 1000
rpm
%
% 3 fuelconsumption
Figure 6441: Percentage fuel saving as a function of main engine rpm
For the same fishing speed (3 kts) we found a potential fuel saving of about 15%, leading to the conclusion that a optimum power management system is advantageous in the case of controllable pitch (CP) propellers. Using about 950 rpm the maximum engine power is obtained and the reduction in fuel consumption is 12% comparing with the fuel consumption at 760 rpm.
6.7.17.1.2 Investment required for the adaptation (* 1000 €)
The investment costs are around €1200 to €3100 for fitting an accurate fuel monitoring system.
6.7.17.1.3 Effect on income (LPUE, landings per unit of effort)
No effect on LPUE.

Report Number C002/08 273/425
6.7.18 Adaptations under study – Adaptation No 7: Fouling – hull cleaning system
For vessels that steam long distances to and from fishing grounds, correct hull maintenance procedures will certainly be repaid in speed and fuel economy. An increase in resistance of over 30% has been noticed on boats that have heavy fouling, and in some cases the hull has become so heavily encrusted that 30% more power and hence fuel is required to maintain normal steaming or towing speed. From tests done on the previous reference vessel, following hull cleaning and painting the vessel showed gains in speed and fuel economy. At normal steaming rpm the speed increased by 2.9 knots, and fuel consumption decreased by 1.5 litre/hour and at maximum rpm a increase in speed of 2.1 knots was achieved (O’Regan, 2006). This equates to a decrease in fuel consumption of around 5% per year.
6.7.18.1 Effects of Adaptation No 7
6.7.18.1.1 Effect on energy consumption (% change) – Output of GES�model runs
Based on the results of trials carried out a saving in fuel of around 5% per year can be expected from proper hull maintenance. This is based on the vessel being slipped every year. Additional savings maybe achievable with copper based anti4fouling but this is as yet unproven. We have no data on the roughness produced by an anti4fouling coating on the hull at this moment, but variation of the hull roughness from 130 micron until 280 micron is calculated. The baseline had 200 micron. 130 micron is taken for the situation when the hull is cleaned and 280 micron is assumed for a fouled hull (Table 6453).
Table 6453: Effect on fuel consumption and gaseous emissions of increasing the surface roughness
Item
Baseline
200 micron
Cleaned
130 micron
Fouled
280 micron
% Reduction
130 micron
% Reduction
280 micron
Fuel [ton/yr] 607.08 604.35 609.51 0.45 �0.40
CO2 [ton/yr] 1908.11 1899.53 1915.77 0.45 40.40
SOx [ton/yr] 12.14 12.09 12.19 0.45 40.40
NOx [ton/yr] 34.71 34.54 34.87 0.49 40.45
HC [ton/yr] 0.86 0.87 0.86 40.06 0.06
CO [ton/yr] 2.22 2.22 2.22 0.05 40.06
% fuel consumption
0
0.5
1
1.5
2
2.5
130 150 170 190 210 230 250 270
micron roughness
%
Figure 6442: Relationship between fuel consumption increase and hull roughness factor

274 of 425 Report Number C002/08
The fuel consumption for steaming from cleaning the hull is about 2.2%. The fuel reduction resulting from cleaning the hull is about 0.45+0.4 is 0.95% for an operational year because of the lower fishing speed.
6.7.18.1.2 Investment required for the adaptation (* 1000 €)
Cost estimates for dry4docking, hull preparation and hull treatment are estimated at around €10,500 for this vessel.
6.7.18.1.3 Effect on income (LPUE, landings per unit of effort)
No effect on LPUE.
6.7.19 Adaptations under study – Adaptation No 8: Engine maintenance
Manufacturers recommend a maintenance schedule to maintain efficiency and reliability. Service intervals should be adhered to rigorously. A poorly maintained engine will run less efficiently with detrimental effect on fuel consumption. The essential areas to maintain are the fuel system, compression pressures, air and turbo4charging system but even the smallest leaks should be attended too immediately. The following faults lead to the indicative additional fuel consumption shown below:
Table 6454: Added fuel consumption by main engine malfunctions
Area Added Fuel consumption
Dirty Air Intake Filter 2.0 g/kWh
Dirty Air Cooler 2.0 g/kWh
Dirty Turbocharger 4.0 g/kWh
Worn Injector Nozzles 2.0 g/kWh
Worn Injection Pump 4.0 g/kWh
Low calorific value of fuel 1.2 g/kWh
Water in fuel (0.5%) 1.0 g/kWh
Total Fuel Penalty 16.2 g/kWh
A combination of all the above faults will add 16.2 g/kWh to the vessels fuel consumption, which equates to 9.5 litres per hour saving for this reference vessel or ~36,000 litres in a year (5% saving on total fuel consumption). Other engine room problems can also cause increased fuel consumption. These include restriction in flow of air to the engine, restrictions in exhaust outlet pipes, poor cooling of turbocharged air and worn cylinders. These faults can easily double the fuel penalty above and reduce reliability considerably.
6.7.19.1 Effects of Adaptation No 8
6.7.19.1.1 Effect on energy consumption (% change) – Output of GES�model runs
Based on available data it is reasonable to assume that basic engine maintenance will result in a saving of ~5% per year for this reference vessel. The GES model predicts a reduction of 7.3% for this vessel and operational profile when the nominal specific fuel consumption is reduced by 16.2 g/kWh (Table 6455).

Report Number C002/08 275/425
Table 6455: Effect on fuel consumption and gaseous emissions of changing the nominal specific fuel consumption of the engine with 16.2 g/kWh
[ton/yr] Base line Reduction engine 16.2 g/kWh %
Fuel [ton/yr] 607.08 562.78 7.30
CO2 [ton/yr] 1908.11 1768.42 7.32
SOx [ton/yr] 12.14 11.26 7.30
NOx [ton/yr] 34.71 34.71 0.00
HC [ton/yr] 0.86 0.86 0.00
CO [ton/yr] 2.22 2.22 0.00
6.7.19.1.2 Investment required for the adaptation (* 1000 €)
Basic maintenance should already be included in the vessels normal operating costs although additional costs may be incurred if the frequency is increased. No actual figures are available.
6.7.19.1.3 Effect on income (LPUE, landings per unit of effort)
No effect on LPUE.
6.7.20 Adaptations under study – Adaptation No 9: Replacing auxiliary engine
6.7.20.1 Short description of Adaptation No 9: Auxiliaries and generators Cargo ships operating at constant speed for all of their time at sea were ideal for fitting shaft driven alternators. Fishing vessels are different because of varying speed and load. Fishing vessels similar to this reference vessel also have relatively large engines and when they are run at max rpm and reduced pitch to maintain alternator frequency they waste fuel. The auxiliaries fitted aboard are often too big and so are often inefficient at low load. Matching the auxiliary to the real power requirement can save fuel. Two auxiliaries of different sizes can create an efficient installation. Alternatively one Irish vessel similar to this reference vessel has replaced his auxiliary engine by installing a hydraulic pump in front of the main engine which runs a generator that can work at variable rpm. This system has resulted in a saving of 500 litres per day, a saving of around 15% (rawdon, pers. Comm.).
A similar system is currently being explored by partner 7 in developing a prototype flexible shaft generator (“flexigen”) (O’Regan 2007). From work carried out on board fishing vessels it has been found that ways of dropping main engine rpm are required to reduce fuel. On most vessels including this reference vessel this requires an auxiliary be run at all times, even for light loads under passage. The load generated on passage comprises only services and bridge equipment but the advantage of the shaft generator is lost because it must have a fixed rpm. On some vessels the ratio of pulleys off the engine can be changed but there is still only one rpm at which it can be used. The system can also be designed to run, as is the case on this reference vessel, at 50 or 60 Hz and so a floating frequency can be allowed between the two but this allows a very limited range of rpm and adds to the building costs. The prototype flexigen system being looked at allows power to be generated at any rpm and then manipulates it to a steady output of 220 volt and 50 Hz. This facility would be very efficient, particularly for larger vessels were power requirements are high, particularly during fishing operations. A small parasitic load on the engine would allow the auxiliary engine to be shut down and allow rpm to be dropped to a level at which the vessel becomes fuel efficient. Research carried out in conjunction with a company specialising in manufacture of generators and alternators has shown this to be technically feasible although it has not be tested as yet on a fishing vessel. There are some drawbacks relating to the size of the unit required and heat dissipation from rotating and static parts, making the unit more suitable for larger vessels. The estimated savings
276 of 425 Report Number C002/08
with the flexigen system are in the region of 15420% when the vessel is steaming and towing although this is based on model testing.
6.7.20.2 Effects of Adaptation No 9: Auxiliaries and generators
6.7.20.2.1 Effect on energy consumption (% change) – Output of GES�model runs
On the basis of reports from one vessel, replacing the auxiliary engine with a hydraulic generator system can give savings of around 15%. On this vessel daily fuel consumption has been reduced from 3,500 litres per day to 3,000 litres per day.
6.7.20.2.2 Investment required for the adaptation (* 1000 €)
The cost of replacing the auxiliary engine with this system are in the order of €30,000, although some of these costs are offset against the annual maintenance costs for the auxiliary engine replaced.
6.7.20.2.3 Effect on income (LPUE, landings per unit of effort)
No effect on LPUE.
6.7.21 Adaptations under study – Adaptation No 10: Fuel quality
6.7.21.1 Short description of Adaptation No 10: Checking fuel quality One of the standards used for defining fuel is BS3046/1 and the calorific value of this fuel is 42,700 kilo Joules per kg. If this calorific value falls, fuel consumption goes up. Fuel quality is difficult to predict or control but monitoring fuel quality is essential to protect machinery. Poor fuel can lead to blockage of filters and sludging of tanks. It can cause carbon and other deposits and engine wear, leading to increased fuel consumption and loss of power. Having a fine filtration and a water separation system aboard will be of benefit and is relatively simple and cost effective. Many companies will analyse fuel samples for vessels and will give the precise particle count and water level. Samples can be taken using simple kits that are easy to use and which are simply return to the test kit supplier to do the analysis. This is a worthwhile exercise, particularly if a vessel changes oil suppliers. This is applicable for all vessels but particularly for larger vessels with high fuel consumption like this reference vessel.
6.7.21.2 Effects of Adaptation No 10: Checking fuel quality
6.7.21.2.1 Effect on energy consumption (% change) – Output of GES�model runs
Indicative savings of 2% in fuel consumption are felt reasonable for this reference vessel with regular monitoring for fuel quality and water content. A variation of 0.3% is possible and is linear with the calorific quality giving a fuel saving of 2,188 litres (Table 6456).

Report Number C002/08 277/425
Table 6456: Effect on fuel consumption and gaseous emissions of checking fuel quality
[ton/yr] Base line Checking fuel quality %
Fuel [ton/yr] 607.08 608.90 �0.30
CO2 [ton/yr] 1908.11 1913.84 40.30
SOx [ton/yr] 12.14 12.18 40.30
NOx [ton/yr] 34.71 34.92 40.60
HC [ton/yr] 0.86 0.87 40.60
CO [ton/yr] 2.22 2.23 40.60
6.7.21.2.2 Investment required for the adaptation (* 1000 €)
The cost of performing 4 fuel analyses per year is estimated at €1000.
6.7.21.2.3 Effect on income (LPUE, landings per unit of effort)
No effect on LPUE.
6.7.22 Summary Table of Adaptations for Reference Vessel
Table 6457: Summary of effects on fuel savings, investment costs, and landings for adaptations studied
No Adaptation Potential Fuel Saving (%) Investment Costs (€) Effect on LPUE (%)
1 Gear Modifications – doors & trawls 5411 26,000 none
2 Dynex Warps 15420 50,000 none
3 Reverting to single rig 24430 26,000 Reduction by 25%
4 Reduction in Steaming Speed 4.5 none none
5 Optimising Bollard Pull 4 100041500 none
6 Fitting a Fuel Meter 10 120043100 none
7 Hull cleaning 145 7,500 none
8 Engine Maintenance 547 none none
9 Replacing Auxiliary engine 15 30,000 none
10 Fuel Quality 0.541 1,000 none
6.7.23 References
Anon., (2007). Dynex Trawl Warps – a stroke of genius. Hampidjan’ Newsletter about fishing and fishing technology. December 2007.
Curtis, H.C., Graham, K., and Rossiter T. (2006). Options for Improving Fuel Efficiency in the UK Fishing Fleet. SEAFISH October 2006. 47pp.
O’Regan, N., (2007). Promara “Flexigen” Powerdrive Specifications. Report for BIM. June 2006. O’Regan, N., (2006). Survey Report of Sea Trials carried out by BIM aboard the mfv “Cisemair” and Boy Jason” . BIM Report. April 2006.
Rihan, D. (2004). Case Study 2. A comparison of twin4Rig Trawling and Single Rig Trawling in terms of Relative Fishing Efficiency. In: Thomsen, B., Revill, A., Rihan, D. and Eigaard, O. (Eds) Report of Efficiency and Productivity in Fish Capture Operations. Report of the ICES4FAO Working Group on Fishing Technology and Fish
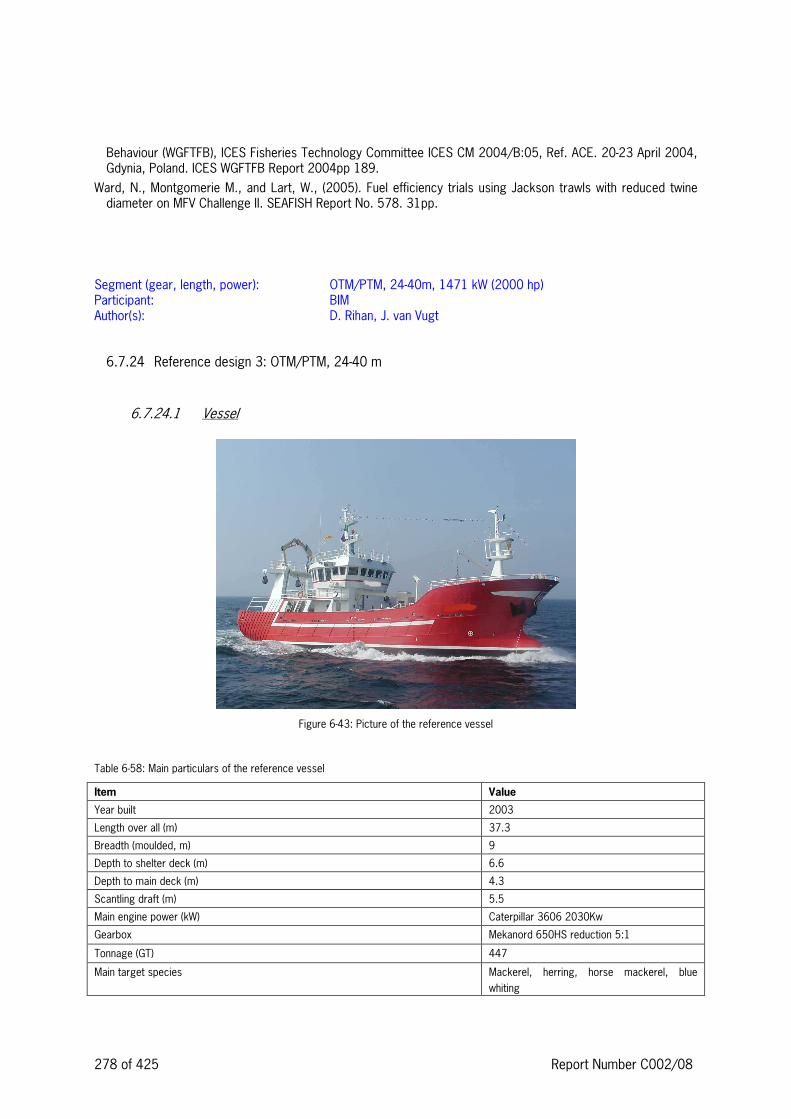
278 of 425 Report Number C002/08
Behaviour (WGFTFB), ICES Fisheries Technology Committee ICES CM 2004/B:05, Ref. ACE. 20423 April 2004, Gdynia, Poland. ICES WGFTFB Report 2004pp 189.
Ward, N., Montgomerie M., and Lart, W., (2005). Fuel efficiency trials using Jackson trawls with reduced twine diameter on MFV Challenge II. SEAFISH Report No. 578. 31pp.
Segment (gear, length, power): OTM/PTM, 24440m, 1471 kW (2000 hp) Participant: BIM Author(s): D. Rihan, J. van Vugt
6.7.24 Reference design 3: OTM/PTM, 24440 m
6.7.24.1 Vessel
Figure 6443: Picture of the reference vessel
Table 6458: Main particulars of the reference vessel
Item Value
Year built 2003
Length over all (m) 37.3
Breadth (moulded, m) 9
Depth to shelter deck (m) 6.6
Depth to main deck (m) 4.3
Scantling draft (m) 5.5
Main engine power (kW) Caterpillar 3606 2030Kw
Gearbox Mekanord 650HS reduction 5:1
Tonnage (GT) 447
Main target species Mackerel, herring, horse mackerel, blue
whiting

Report Number C002/08 279/425
This vessel as shown in Figure 6443 and described in Table 6458 is a relatively new vessel built in 2003. It is designed as a pelagic trawler with the capability of converting to demersal trawling. The vessel is constructed in steel with two decks, a forecastle deck, and a deckhouse in three heights, including the wheelhouse located aft of the midship. The hull shape is of a round bilge construction with a bulbous bow and stern keg, flared stem and transom stern. It has a flat transom stern with the bottom of the hull under the aft body built with relatively dead rise and curvature to avoid slamming. The vessel has accommodation for a crew of 8. Pelagic fish are pumped aboard, while demersal fish can be taken in over the stern of the vessel. The vessel is powered by a Caterpillar 3606 engine developing 2030 kW (derated to 1119 kW) and driving a 2.9 m diameter 44bladed controllable pitch propeller in a fixed nozzle through a 5.05:1 reduction gearbox with a primary power take off generating 800 kW to drive 6 x 110 kW x 400V/50Hz/1460rpm hydraulic pumps. The vessel has a top speed of around 11 knots at 85% maximum continuous rating (mcr). The vessel has a calculated bollard pull of ~ 21.5 tonnes, measured at 19.5 tonnes at 3.5 knots. A 3412C TA Caterpillar Auxiliary engine drives a 500 kW alternator for the refrigeration and main electric power supply. A 3306B TA Caterpillar engine drives a 122 kW alternator used as a harbour generator. For added manoeuvrability the vessel also has a 4 blade 1.2 m bow thruster producing 250 hp. The deck machinary includes 3 split trawl winches rated @ 32 tonnes/30.5m/min pull 1st layer and with a capacity for 3555 m x 26 mm warp and 2 split net drums mounted aft rated @ 20 tonnes/25.4m/min pull 1st layer. In addition the vessel has a single net drum rated @ 40 tonnes, 26.6 m/min for handling large pair pelagic trawls and a further single net drum rated at 20.8 tonnes, 25.5 m/min.The vessel also has a 6 tonne, 35.5 m/min net sounder winch with a capacity of 3000 m x 11 mm wire and powered by a 45 kW /380v/50Hz hydraulic pump. The vessel is fitted with 4 x RSW tanks with a capacity of 600 m³ and a fresh hold with a capacity of 300 m³.
6.7.24.2 Gear Table 6459 describes the main parameters of the fishing gear used.
Table 6459: Main particulars of fishing gear of the reference vessel
Item Value
Gear code (e.g. TBB, OTB, OTM, …) PTM
Type description Pair pelagic trawl
Wingend weights 3000kg
Main gear dimensions (circumference, beam width, (m)) 151 x 127m
Headline length (m) 151m
Footrope length (m) 151m
Siderope (m) 127m
Cod4end mesh size (mm) 40mm
Bridles 80m x 28mm & 32mm Dynex rope
Comments
This vessel uses pair pelagic trawls for targeting pelagic species. The vessel’s partner ship is a sister ship. The trawls are towed with no doors with the distance between the two vessels used to spread the trawl. Heavy weights of around 3 tonnes per side are mounted on the wingends of the trawl opening the trawl vertically. The headline has no floats, but is constructed in Dynex™ rope which is naturally buoyant. In recent years Irish pelagic vessels have replaced the bridles with Dynex rope bridles, which allow the vessels to spread further apart decreasing the turbulence at the mouth of the trawl. This gear is towed at upwards of 4 .5 knots.

280 of 425 Report Number C002/08
6.7.24.3 Operational profile Table 6460 shows the operational profile split between steaming, fishing, shooting and hauling gear, searching for fish, dodging weather or time spent in harbour, most of which is spent discharging fish.
Table 6460: Time split over operational modes
Operational mode Percentage of time %
Steaming to and from fishing grounds 40
Shooting and hauling gears 5
Fishing 14
Searching 26
Dodging 1
Time in harbour 15
This vessel typically fishes approximately 70 days per year, working normally 243 day fishing trips not including harbour time, except when fishing tuna when trip length can be up to 8410 days. The indicative operational profile for a typically 3 day trip is shown in Table 6461 as follows:
Table 6461: Operational modes and duration by trip
Operational mode Duration (hours) Comments
Harbour time 1 Diesel, ice, provisions
Steaming to grounds 17 Steaming @ 10 knots
Fishing and Shooting gear 12 Based on 4 x ~3 hour tows including shooting
Hauling gear 4 Hauling & Processing fish
Searching 22 Searching for fish
Steaming to port 17 Steaming @ 10 knots fully laden
Harbour Operation 12 Landing fish, engine maintenance
The yearly operation profile for this vessel based on a 20 x 3 typical day trips as predicted by the GES model is given in Table 6462.
Table 6462: Operational profile for the base line reference vessel
Name Duration Distance Velocity
[4] [hrs] [nm] [kn]
Harbour 4796.00 0 0.00
Steaming to fishing ground 680.00 8160 12.00
Fishing 2400.00 1200 5.00
Hauling 96.00 48 0.50
Searching 528.00 4224 8.00
Harbour operations 260.00 0 0.00
6.7.24.4 Evaluation of the state of technology The vessel is a fairly modern vessel being built in 2003 but given the average age of vessels in this sector is considered representative. The vessel is designed to fish in all weathers. The catch is stored in RSW tanks. The vessel is built to be able to target demersal species with twin4rig trawls and has a dry hold for storing fresh fish. The vessel is fitted with a full suite of electronics and also a highly sophisticated autotrawl system designed specifically for pair trawling operations.

Report Number C002/08 281/425
6.7.24.5 Catch This vessel targets pelagic species mainly mackerel, herring, horse mackerel and blue whiting. The vessel also targets albacore tuna in the summer months. Average catches in the period 200442006 for this vessel were ~€3.1 M.
6.7.24.6 Energy performance
6.7.24.6.1 Fuel consumption
The average fuel consumption for this vessel over the period 200442006 was around 500,000 litres or ~7,000 litres per day. The measured fuel consumption by operation for the vessel is given in Table 6463 as follows:
Table 6463: Engine load, propeller pitch, speed and fuel consumption as a function of operational mode
Activity RPM Pitch Speed (knots) Fuel Consumption
(l/h)
Steaming 850 n/a 12 350
Shooting n/a n/a n/a n/a
Towing 800 n/a 5 280
Hauling n/a n/a n/a n/a
Dodging (bad weather) 800 n/a 8 265
6.7.24.6.2 Efficiencies – Output of GES�model runs
Efficiency [-]
0
0.05
0.1
0.15
0.2
0.25
Har
bour
Ste
amin
g to
fish
ing
grou
nd
Fis
hing
Hau
ling
Sea
rchi
ng
Har
bour
ope
ratio
nsEfficiency [-]
Title:Palagic Trawler, Technology:2008Run date:22-10-2008/12:49:54Input file:COMOutput file:Results.csvResults file:ResultsOutput.csv
Figure 6444: Efficiency of the installation by operational mode for the base line

282 of 425 Report Number C002/08
Figure 6444 shows the engine efficiencies for this vessel. The efficiency of the engine during fishing is low compared to when steaming. When searching engine speed was taken at 800 rpm instead of 850 rpm as used for steaming, and lowered speed at 8 kts instead of 12 kts as anecdotally this was found to be normal practice on this class of vessel.
6.7.24.6.3 Energy distribution – Output of GES�model runs
Fuel consumption in tonnes/year is highest while fishing with much lower values for steaming and searching (Figure 6445). This is due to the fact that the vessel tows large trawls, at a high towing speed. Fuel consumption when fishing equates to around 419 tonnes of fuel per year.
FUEL CONSUMPTION [ton/year]
0
50
100
150
200
250
300
350
400
450
Har
bour
Ste
amin
g to
fish
ing
grou
nd
Fis
hing
Hau
ling
Sea
rchi
ng
Har
bour
ope
ratio
ns
Caterpillar 3606, tank_1
Title:Palagic Trawler, Technology:2008Run date:22-10-2008/12:49:54Input file:COMOutput file:Results.csvResults file:ResultsOutput.csv
Figure 6445: Yearly fuel consumption on various operational modes for the reference vessel
Table 6464 shows the yearly fuel consumption and gaseous emissions for the reference vessel based on an extrapolation from 3 day fishing trips.
Table 6464: Fuel consumption and gaseous emissions for base line reference vessel
Item Base line consumption
Fuel [ton/yr] 624.09
CO2 [ton/yr] 1957.38
SOx [ton/yr] 12.48
NOx [ton/yr] 43.22
HC [ton/yr] 1.53
CO [ton/yr] 3.67

Report Number C002/08 283/425
Operational Profile, Required Power [kW]
0
100
200
300
400
500
600
700
Har
bour
; 479
6 hr
/yr
Ste
amin
g to
fish
ing
grou
nd; 6
80 h
r/yr
Fis
hing
; 240
0 hr
/yr
Hau
ling;
96
hr/y
r
Sea
rchi
ng; 5
28hr
/yr
Har
bour
oper
atio
ns; 2
60hr
/yr
Hotel_load
Gears
Propellers
Title:Palagic Trawler, Technology:2008Run date:22-10-2008/12:49:54Input file:COMOutput file:Results.csvResults file:ResultsOutput.csv
Figure 6446 : The required power of the vessel by operational mode.
Figure 6446 shows the yearly operational profile and required kW of this vessel by operational parameter. The required steaming power (591 kW) for this vessel is relative high comparing with the fishing operation (23 kW ship + 270 kW fishing) but based on the yearly profile the fuel consumption is mostly used for fishing (419 tonnes/year) with the steaming consumption 155 tonnes/year (See Figure 6446).
6.7.25 Adaptations under study – Adaptation No 1: Dynex warps
6.7.25.1 Short description of Adaptation No 1: Dynex warps Similar to the previous 24440m reference vessel, replacing steel wire with Dynex™ warps has been tested in pelagic fisheries in Iceland as a fuel efficiency initiative. Using Dynex warps can reduce the weight on board by 20 to 25 tonnes and when using Dynex, all of the squaring power of the doors goes into spreading the gear, while during trawling with conventional gear a great deal of the squaring power goes into separating the warps. This means that in the case of single boat pelagic trawling door size can be reduced, while for pair trawling the spread between the vessels can be increased, which improves fishing efficiency by reducing the turbulence at the mouth of the trawl created by the wake of the vessels. When fishing on the surface it is possible to shoot much more warp that could be done with steel wire, making it possible to keep the trawl high in the water column at a slow towing speed, reducing drag and therefore fuel consumption, and with less potential to scare marks of fish away from the path of the trawl.

284 of 425 Report Number C002/08
6.7.25.2 Effects of Adaptation No 1
6.7.25.2.1 Effect on energy consumption (% change) – Output of GES�model runs
Results from one equivalent vessel suggest fuel savings in the region of 10% with Dynex warp based on replacing 600m x 32mm steel warp with the equivalent length of 32mm Dynex rope. Based on the information from Hampidajan • Warp diameter 32mm Dynex at 0.391kg/m x 600m (in water) • Warp diameter 32mm Dyform Wire at 15.97kg/m x 600m (in water) This is a reduction in weight of 75% in water.
6.7.25.2.2 Investment required for the adaptation (* 1000 €)
This material has the disadvantage of having high cost compared to steel wire and its durability and lifespan as yet unproven. The projected costs for replacing the traditional warp with Dynex warp for this vessel are estimated as follows: Steel wire cost – 2 x 600m x 32mm: @ €7.50/m = €9,000 Replacement cost 2 x 600fthm for 32mm Dynex Rope @ ~€30/m = €35,000 Some additional investment cost would be incurred in running block replacement/modification to be compatible with the new materials (no information available).
6.7.25.2.3 Effect on income (LPUE, landings per unit of effort)
Probably none although could possible increase catching efficiency for the reasons mentioned above.
6.7.26 Adaptations under study – Adaptation No 2: Hexagonal mesh trawls
6.7.26.1 Short description of Adaptation No 2: Hexagonal mesh trawls The use of pelagic trawls with hexagonal meshes in their fore part compared to standard diamond meshes has been shown to reduce fuel consumption by 15425%. The use of hexagonal mehs allows the use of larger meshes in the wings, square and the first panel in the belly sheet. This reference vessel uses a conventional 151 x 127 m pelagic trawl with 25.6 m full mesh in the wings, square with 12.8 m full4mesh in the first panel of the belly. With an equivalent hexagonal mesh trawl the meshes in the wings and square can be increased to 38.4 m with 19.2 m hexagonal meshes in the first panel in the belly. For one equivalent vessel the reporting saving in fuel consumption with this trawl is almost 25% mainly due to the fact that towing pitch is reduced from 70% to 60%. Gear monitoring equipment on this hexagonal trawl has shown to 30% more opening at the aft of the trawl increasing and improving water flow and reducing drag. These figures are based observations from fishing skippers so are approximate. Flume tank testing has shown that the same vertical opening can be achieved with a hexagonal trawl with approximtaely 10% smaller mouth circumference (Anon., 2006).
Report Number C002/08 285/425
6.7.26.2 Effects of Adaptation No 2
6.7.26.2.1 Effect on energy consumption (% change) – Output of GES�model runs
Based on flume tank testing and observations from fishermen fuel savings of 15�25% are estimated. This is based on an equivalent hexagonal mesh trawl. However, as has been seen in the past there has been tendency by pelagic fishermen to use such modifications to simply increase the size of trawl being used and negating any potential fuel savings with increased catches.
6.7.26.2.2 Investment required for the adaptation (* 1000 €)
The cost for a hexagonal trawl for this reference vessel is estimated at €50,000475,000.
6.7.26.2.3 Effect on income (LPUE, landings per unit of effort)
This has not been measured.
6.7.27 Adaptations under study – Adaptation No 3: T90 or square mesh codends
6.7.27.1 Short description of Adaptation No 3: T90 or square mesh codends In recent years most pelagic trawlers in Ireland and Scotland have replaced conventional diamond mesh codends with T90 or latterly square mesh codends. This modification improves flow through the codend, keeping meshes open under increasing load and reduces drag.
6.7.27.2 Effects of Adaptation No 3
6.7.27.2.1 Effect on energy consumption (% change) – Output of GES�model runs
Based on flume tank testing and observations from fishermen savings of 8�10% are estimated.
6.7.27.2.2 Investment required for the adaptation (* 1000 €)
A T90 or square mesh codend for this reference vessel would cost in the region of €35,000440,000.
6.7.27.2.3 Effect on income (LPUE, landings per unit of effort)
No figures available.
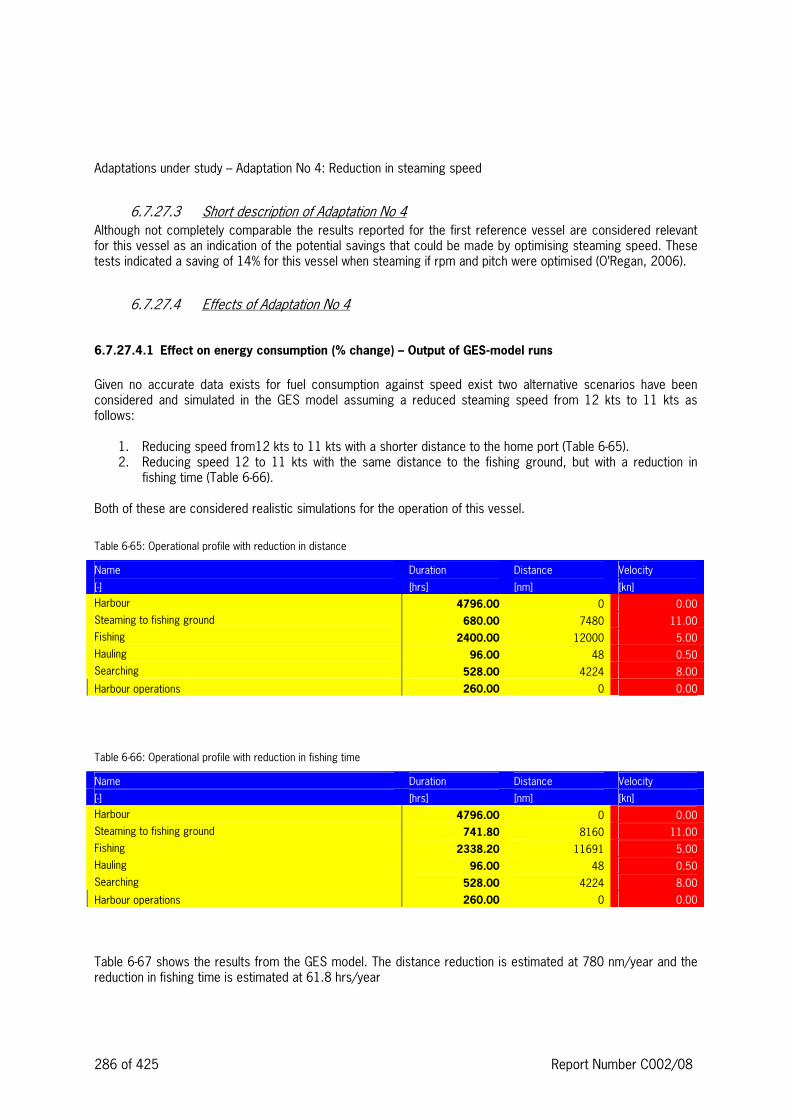
286 of 425 Report Number C002/08
Adaptations under study – Adaptation No 4: Reduction in steaming speed
6.7.27.3 Short description of Adaptation No 4 Although not completely comparable the results reported for the first reference vessel are considered relevant for this vessel as an indication of the potential savings that could be made by optimising steaming speed. These tests indicated a saving of 14% for this vessel when steaming if rpm and pitch were optimised (O’Regan, 2006).
6.7.27.4 Effects of Adaptation No 4
6.7.27.4.1 Effect on energy consumption (% change) – Output of GES�model runs
Given no accurate data exists for fuel consumption against speed exist two alternative scenarios have been considered and simulated in the GES model assuming a reduced steaming speed from 12 kts to 11 kts as follows:
1. Reducing speed from12 kts to 11 kts with a shorter distance to the home port (Table 6465). 2. Reducing speed 12 to 11 kts with the same distance to the fishing ground, but with a reduction in
fishing time (Table 6466). Both of these are considered realistic simulations for the operation of this vessel.
Table 6465: Operational profile with reduction in distance
Name Duration Distance Velocity
[4] [hrs] [nm] [kn]
Harbour 4796.00 0 0.00
Steaming to fishing ground 680.00 7480 11.00
Fishing 2400.00 12000 5.00
Hauling 96.00 48 0.50
Searching 528.00 4224 8.00
Harbour operations 260.00 0 0.00
Table 6466: Operational profile with reduction in fishing time
Name Duration Distance Velocity
[4] [hrs] [nm] [kn]
Harbour 4796.00 0 0.00
Steaming to fishing ground 741.80 8160 11.00
Fishing 2338.20 11691 5.00
Hauling 96.00 48 0.50
Searching 528.00 4224 8.00
Harbour operations 260.00 0 0.00
Table 6467 shows the results from the GES model. The distance reduction is estimated at 780 nm/year and the reduction in fishing time is estimated at 61.8 hrs/year
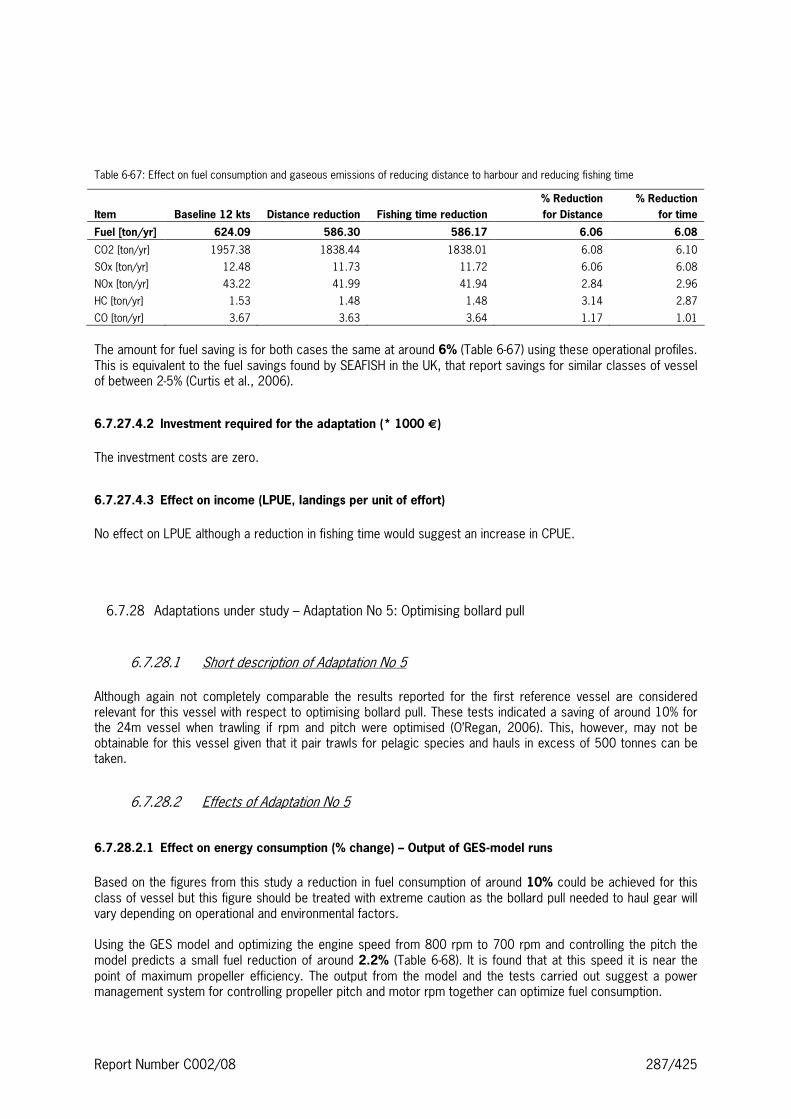
Report Number C002/08 287/425
Table 6467: Effect on fuel consumption and gaseous emissions of reducing distance to harbour and reducing fishing time
Item Baseline 12 kts Distance reduction Fishing time reduction
% Reduction
for Distance
% Reduction
for time
Fuel [ton/yr] 624.09 586.30 586.17 6.06 6.08
CO2 [ton/yr] 1957.38 1838.44 1838.01 6.08 6.10
SOx [ton/yr] 12.48 11.73 11.72 6.06 6.08
NOx [ton/yr] 43.22 41.99 41.94 2.84 2.96
HC [ton/yr] 1.53 1.48 1.48 3.14 2.87
CO [ton/yr] 3.67 3.63 3.64 1.17 1.01
The amount for fuel saving is for both cases the same at around 6% (Table 6467) using these operational profiles. This is equivalent to the fuel savings found by SEAFISH in the UK, that report savings for similar classes of vessel of between 245% (Curtis et al., 2006).
6.7.27.4.2 Investment required for the adaptation (* 1000 €)
The investment costs are zero.
6.7.27.4.3 Effect on income (LPUE, landings per unit of effort)
No effect on LPUE although a reduction in fishing time would suggest an increase in CPUE.
6.7.28 Adaptations under study – Adaptation No 5: Optimising bollard pull
6.7.28.1 Short description of Adaptation No 5 Although again not completely comparable the results reported for the first reference vessel are considered relevant for this vessel with respect to optimising bollard pull. These tests indicated a saving of around 10% for the 24m vessel when trawling if rpm and pitch were optimised (O’Regan, 2006). This, however, may not be obtainable for this vessel given that it pair trawls for pelagic species and hauls in excess of 500 tonnes can be taken.
6.7.28.2 Effects of Adaptation No 5
6.7.28.2.1 Effect on energy consumption (% change) – Output of GES�model runs
Based on the figures from this study a reduction in fuel consumption of around 10% could be achieved for this class of vessel but this figure should be treated with extreme caution as the bollard pull needed to haul gear will vary depending on operational and environmental factors. Using the GES model and optimizing the engine speed from 800 rpm to 700 rpm and controlling the pitch the model predicts a small fuel reduction of around 2.2% (Table 6468). It is found that at this speed it is near the point of maximum propeller efficiency. The output from the model and the tests carried out suggest a power management system for controlling propeller pitch and motor rpm together can optimize fuel consumption.

288 of 425 Report Number C002/08
Table 6468: Effect on fuel consumption and gaseous emissions of running the main engine at a somewhat higher rpm while fishing
Item Base line Fishing Diesel speed 700 rpm instead of 800 rpm Reduction %
Fuel [ton/yr] 624.09 610.62 2.16
CO2 [ton/yr] 1957.38 1915.37 2.15
SOx [ton/yr] 12.48 12.21 2.16
NOx [ton/yr] 43.22 48.83 412.98
HC [ton/yr] 1.53 1.30 14.86
CO [ton/yr] 3.67 3.84 44.63
6.7.28.2.2 Investment required for the adaptation (* 1000 €)
The investment costs are zero, except for the cost of a marine engineer/naval architect to carry out an accurate set of bollard pull tests, which would be in the region of €100041500.
6.7.28.2.3 Effect on income (LPUE, landings per unit of effort)
No effect on LPUE.
6.7.29 Adaptations under study – Adaptation No 6: Fitting a fuel meter
6.7.29.1 Short description of Adaptation No 6 Anecdotal reports from fishing skippers suggest that through fitting a fuel meter, indicative savings in fuel consumption of approximately 10% can be made. Modern fuel meters indicate fuel consumption per hour and with an input from a GPS can indicate the fuel consumption per nautical mile. Once calibrated properly, fuel meters will provide reasonably accurate real4time data and will facilitate control of optimal throttle settings and monitoring of engine problems.
6.7.29.2 Effects of Adaptation No 6
6.7.29.2.1 Effect on energy consumption (% change) – Output of GES�model runs
Based on the figures from this study a reduction in fuel consumption of around 10% could be achieved for this class of vessel based on indicative results and anecdotal information from fishing skippers. This is based on changes in skipper behaviour resulting from awareness of fuel use at various operational settings that such a fuel meter enhances mostly leading to more efficient steaming and fishing speeds through optimisation of pitch and rpm. For a constant fishing speed of 5 kts the main engine rpm is increased from 700 to 800 rpm in the GES4model run. The corresponding fuel consumption is given in Figure 6447 below. Propeller pitch is controlled to keep the towing speed at 5 kts.

Report Number C002/08 289/425
Fuel comsumption 5 kts fishing
168
169
170
171
172
173
174
175
176
680 700 720 740 760 780 800 820
rpm
kg/h
r
Figure 6447: Fuel consumption as a function of engine rpm
For a high engine rpm fuel consumption is high in this case (Figure 6448). If we compare the fuel reduction with the low engine speed the following reduction curve can be obtained.
% fuel consumption fishing
0
0.5
1
1.5
2
2.5
3
3.5
680 700 720 740 760 780 800 820
rpm
%
Figure 6448 : Percentage fuel saving as a function of main engine rpm
For the same fishing speed 5 kts the GES model predicted a potential fuel saving of about 3%, leading to the conclusion that an optimum power management system is advantageous in the case of CP propellers.
6.7.29.2.2 Investment required for the adaptation (* 1000 €)
The investment costs are around €1200 to €3100 for fitting an accurate fuel monitoring system.

290 of 425 Report Number C002/08
6.7.29.2.3 Effect on income (LPUE, landings per unit of effort)
No effect on LPUE.
6.7.30 Adaptations under study – Adaptation No 7: Fouling – hull cleaning system
6.7.30.1 Short description of Adaptation No 7 For vessels that steam long distances to and from fishing grounds, correct hull maintenance procedures will certainly be repaid in speed and fuel economy. An increase in resistance of over 30% has been noticed on boats that have heavy fouling, and in some cases the hull has become so heavily encrusted that 30% more power and hence fuel is required to maintain normal steaming or towing speed. From tests done on reference vessel 1, following hull cleaning and painting the vessel showed gains in speed and fuel economy. At normal steaming rpm the speed increased by 2.9 knots, and fuel consumption decreased by 1.5 litre/hour and at maximum rpm a increase in speed of 2.1 knots was achieved. This equates to a decrease in fuel consumption of around 5% per year.
6.7.30.2 Effects of Adaptation No 7
6.7.30.2.1 Effect on energy consumption (% change) – Output of GES�model runs
Based on the results of trials carried out a saving in fuel of around 5% per year can be expected from proper hull maintenance. This is based on the vessel being slipped every year. Additional savings maybe achievable with more efficient anti fouling but this is as yet unproven. In the GES model a corresponding hull roughness of 3.3cm is equivalent to increasing fuel consumption by 1.5 litres/hour for constant steaming speed rpm (850 rpm) with no change to the pitch of the cpp (See Figure 6449). The simulation gave a reduction in steaming speed of 1.2kts (See Figure 6450).
Fuel consumption heavy fouling
188190192194196198200202204206
0 5000 10000 15000 20000 25000 30000 35000
micron
kg/h
r
Figure 6449: Fuel consumption against degress of hull fouling

Report Number C002/08 291/425
Speed reduction heavy fouling
10.8
11
11.2
11.4
11.6
11.8
12
12.2
0 5000 10000 15000 20000 25000 30000 35000
micron
kts
Figure 6450: Corresponding reductionin speed as a result of fouling
No actual data is available on the rate of growth on the hull of this vessel, but taking the hull roughness for the baseline ship to be 200 microns and the roughness after cleaning is taken as 130 micron and with growth at 280 micron this gives a difference between a cleaned hull and a dirty hull of about 0.28% in fuel consumption for this specific operational profile (See Table 6469).
Table 6469: Effect on fuel consumption and gaseous emissions of increasing the surface roughness factor stepwise from 1 to 4
Increased roughness factor Baseline 200 micron 130 micron 280 micron
% Reduction
130 micron
% Reduction
280 micron
Fuel [ton/yr] 574.53 571.40 577.32 0.54 �0.49
CO2 [ton/yr] 1801.11 1791.25 1809.89 0.55 40.49
SOx [ton/yr] 11.49 11.43 11.55 0.54 40.49
NOx [ton/yr] 43.22 43.09 43.33 0.29 40.26
HC [ton/yr] 1.53 1.52 1.53 0.28 40.25
CO [ton/yr] 3.67 3.67 3.68 0.14 40.12
The fuel reduction from fouling to cleaning predicted by the GES model is about 1.03% for this operational year profile.
6.7.30.2.2 Investment required for the adaptation (* 1000 €)
Cost estimates for dry4docking, hull preparation and hull treatment are estimated at around €7,500 for this vessel. Costs for using copper based anti4fouling increase to around €40,000 in year 1, but then are reduced to around €5,000 for the next 10415 year period.
6.7.30.2.3 Effect on income (LPUE, landings per unit of effort)
No effect on LPUE.

292 of 425 Report Number C002/08
6.7.31 Adaptations under study – Adaptation No 8: Engine maintenance
6.7.31.1 Short description of Adaptation No 8 Manufacturers recommend a maintenance schedule to maintain efficiency and reliability. Service intervals should be adhered to rigorously. A poorly maintained engine will run less efficiently with detrimental effect on fuel consumption. The essential areas to maintain are the fuel system, compression pressures, air and turbo4charging system but even the smallest leaks should be attended too immediately. The following faults lead to the indicative additional fuel consumption shown below:
Table 6470: Added fuel consumption by main engine malfunctions
Area Added Fuel consumption
Dirty Air Intake Filter 2.0 g/kWh
Dirty Air Cooler 2.0 g/kWh
Dirty Turbocharger 4.0 g/kWh
Worn Injector Nozzles 2.0 g/kWh
Worn Injection Pump 4.0 g/kWh
Low calorific value of fuel 1.2 g/kWh
Water in fuel (0.5%) 1.0 g/kWh
Total Fuel Penalty 16.2 g/kWh
A combination of all the above faults will add 16.2 g/kWh to the vessels fuel consumption, which equates to 9.5 litres per hour saving for this reference vessel or ~36,000 litres in a year (5% saving on total fuel consumption). Other engine room problems can also cause increased fuel consumption. These include restriction in flow of air to the engine, restrictions in exhaust outlet pipes, poor cooling of turbocharged air and worn cylinders. These faults can easily double the fuel penalty above and reduce reliability considerably.
6.7.31.2 Effects of Adaptation No 8
6.7.31.2.1 Effect on energy consumption (% change) – Output of GES�model runs
Based on available data it is reasonable to assume that basic engine maintenance will result in a saving of ~5% per year for this reference vessel.
Table 6471: Effect on fuel consumption and gaseous emissions of changing the nominal specific fuel consumption of the engine with 16.2 g/kWh
[ton/yr] Base line Reduction engine 16.2 g/kWh %
Fuel [ton/yr] 624.09 574.53 7.94
CO2 [ton/yr] 1957.38 1801.11 7.98
SOx [ton/yr] 12.48 11.49 7.94
NOx [ton/yr] 43.22 43.22 0.00
HC [ton/yr] 1.53 1.53 0.00
CO [ton/yr] 3.67 3.67 0.00
Theoretically we find a reduction of 7.9% using the GES4model for this vessel and operational profile when the nominal specific fuel consumption is reduced with 16.2 g/kWh (Table 6439).
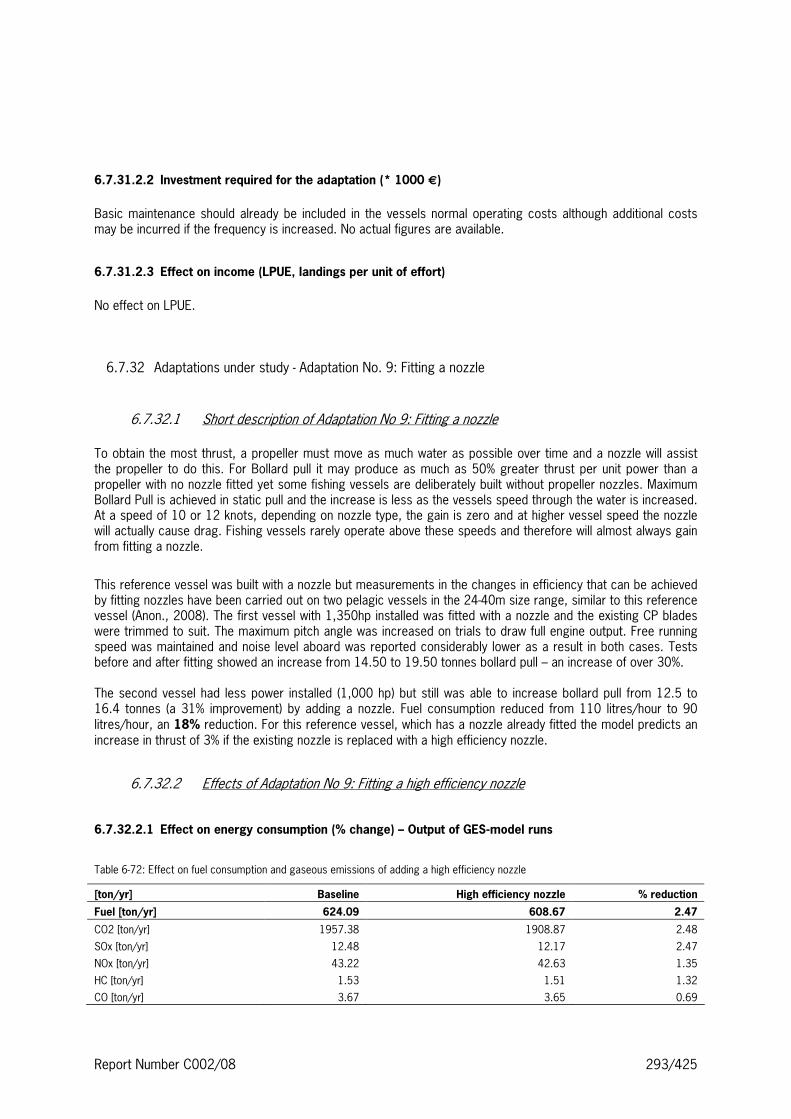
Report Number C002/08 293/425
6.7.31.2.2 Investment required for the adaptation (* 1000 €)
Basic maintenance should already be included in the vessels normal operating costs although additional costs may be incurred if the frequency is increased. No actual figures are available.
6.7.31.2.3 Effect on income (LPUE, landings per unit of effort)
No effect on LPUE.
6.7.32 Adaptations under study 4 Adaptation No. 9: Fitting a nozzle
6.7.32.1 Short description of Adaptation No 9: Fitting a nozzle To obtain the most thrust, a propeller must move as much water as possible over time and a nozzle will assist the propeller to do this. For Bollard pull it may produce as much as 50% greater thrust per unit power than a propeller with no nozzle fitted yet some fishing vessels are deliberately built without propeller nozzles. Maximum Bollard Pull is achieved in static pull and the increase is less as the vessels speed through the water is increased. At a speed of 10 or 12 knots, depending on nozzle type, the gain is zero and at higher vessel speed the nozzle will actually cause drag. Fishing vessels rarely operate above these speeds and therefore will almost always gain from fitting a nozzle.
This reference vessel was built with a nozzle but measurements in the changes in efficiency that can be achieved by fitting nozzles have been carried out on two pelagic vessels in the 24440m size range, similar to this reference vessel (Anon., 2008). The first vessel with 1,350hp installed was fitted with a nozzle and the existing CP blades were trimmed to suit. The maximum pitch angle was increased on trials to draw full engine output. Free running speed was maintained and noise level aboard was reported considerably lower as a result in both cases. Tests before and after fitting showed an increase from 14.50 to 19.50 tonnes bollard pull – an increase of over 30%. The second vessel had less power installed (1,000 hp) but still was able to increase bollard pull from 12.5 to 16.4 tonnes (a 31% improvement) by adding a nozzle. Fuel consumption reduced from 110 litres/hour to 90 litres/hour, an 18% reduction. For this reference vessel, which has a nozzle already fitted the model predicts an increase in thrust of 3% if the existing nozzle is replaced with a high efficiency nozzle.
6.7.32.2 Effects of Adaptation No 9: Fitting a high efficiency nozzle
6.7.32.2.1 Effect on energy consumption (% change) – Output of GES�model runs
Table 6472: Effect on fuel consumption and gaseous emissions of adding a high efficiency nozzle
[ton/yr] Baseline High efficiency nozzle % reduction
Fuel [ton/yr] 624.09 608.67 2.47
CO2 [ton/yr] 1957.38 1908.87 2.48
SOx [ton/yr] 12.48 12.17 2.47
NOx [ton/yr] 43.22 42.63 1.35
HC [ton/yr] 1.53 1.51 1.32
CO [ton/yr] 3.67 3.65 0.69

294 of 425 Report Number C002/08
The GES model predicts fitting a high efficiency nozzle potentially could yield savings of 2.5% for this reference vessel.
6.7.32.2.2 Investment required for the adaptation (* 1000 €)
The cost of fitting a nozzle for this vessel would be in the region of €35,000, although this would be dependent on whether the propeller, shaft and rudder would have to be changed. Costs could be as high as €65,000.
6.7.32.2.3 Effect on income (LPUE, landings per unit of effort)
Probably none although the vessel will increase bollard pull and maybe able to tow a bigger trawl at a faster towing speed.
6.7.33 Adaptations under study – Adaptation No 10: Hull appendages
6.7.33.1 Short description of Adaptation No 10: Hull appendages
The drag of the basic hull is only part of the overall drag of your vessel. All fishing boats have additional appendages attached to the hull. These include bow thrusters, bilge keels, transducer mounts, cooling water pipes and the rudder itself. In many cases appendages are fitted to maximise simplicity, keep capital cost low and for robustness but with little thought or understanding of the impact on drag and therefore fuel consumption. Bilge keels cause drag but they can only be properly aligned to the water flow for one loading condition calculated by modelling and tank testing. A compromise position can be found to make them more efficient over a range of loading conditions. Sonar pipes with supporting steelwork cause major drag and having a retractable sonar pipe that closes flush to the hull surface when not in use would be beneficial. Bow thruster tunnels also cause major drag and this can be minimised by fitting fairings to reduce drag. For pelagic vessels with high powered sonar and echo4sounders with large transducers this problem can be exacerbated and increase in drag can be up to 20% (Sterling and Klaka, 2006).
6.7.33.2 Effects of Adaptation No 10: Hull appendices The ship resistance is increased with 20%.
6.7.33.2.1 Effect on energy consumption (% change) – Output of GES�model runs
Table 6473: Effect on fuel consumption and gaseous emissions of making hull appendages more hydrodynamic
[ton/yr] Baseline Bow truster reduction % reduction
Fuel [ton/yr] 624.09 592.86 5.00
CO2 [ton/yr] 1957.38 1859.12 5.02 SOx [ton/yr] 12.48 11.86 5.00 NOx [ton/yr] 43.22 42.10 2.60 HC [ton/yr] 1.53 1.49 2.65 CO [ton/yr] 3.67 3.63 1.22 Fuel savings of 5�10% are estimated through the removal or making appendages more hydrodynamic, but no accurate figures exist at present.
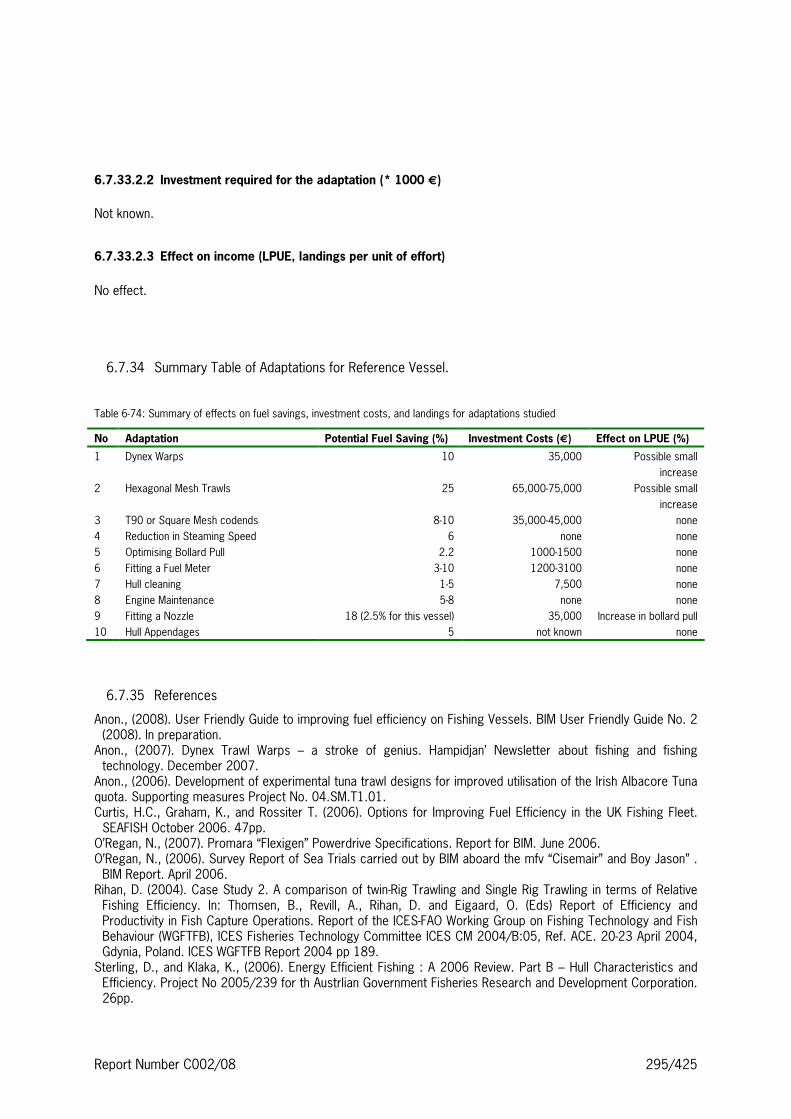
Report Number C002/08 295/425
6.7.33.2.2 Investment required for the adaptation (* 1000 €)
Not known.
6.7.33.2.3 Effect on income (LPUE, landings per unit of effort)
No effect.
6.7.34 Summary Table of Adaptations for Reference Vessel.
Table 6474: Summary of effects on fuel savings, investment costs, and landings for adaptations studied
No Adaptation Potential Fuel Saving (%) Investment Costs (€) Effect on LPUE (%)
1 Dynex Warps 10 35,000 Possible small
increase
2 Hexagonal Mesh Trawls 25 65,000475,000 Possible small
increase
3 T90 or Square Mesh codends 8410 35,000445,000 none
4 Reduction in Steaming Speed 6 none none
5 Optimising Bollard Pull 2.2 100041500 none
6 Fitting a Fuel Meter 3410 120043100 none
7 Hull cleaning 145 7,500 none
8 Engine Maintenance 548 none none
9 Fitting a Nozzle 18 (2.5% for this vessel) 35,000 Increase in bollard pull
10 Hull Appendages 5 not known none
6.7.35 References
Anon., (2008). User Friendly Guide to improving fuel efficiency on Fishing Vessels. BIM User Friendly Guide No. 2 (2008). In preparation.
Anon., (2007). Dynex Trawl Warps – a stroke of genius. Hampidjan’ Newsletter about fishing and fishing technology. December 2007.
Anon., (2006). Development of experimental tuna trawl designs for improved utilisation of the Irish Albacore Tuna quota. Supporting measures Project No. 04.SM.T1.01. Curtis, H.C., Graham, K., and Rossiter T. (2006). Options for Improving Fuel Efficiency in the UK Fishing Fleet. SEAFISH October 2006. 47pp.
O’Regan, N., (2007). Promara “Flexigen” Powerdrive Specifications. Report for BIM. June 2006. O’Regan, N., (2006). Survey Report of Sea Trials carried out by BIM aboard the mfv “Cisemair” and Boy Jason” . BIM Report. April 2006.
Rihan, D. (2004). Case Study 2. A comparison of twin4Rig Trawling and Single Rig Trawling in terms of Relative Fishing Efficiency. In: Thomsen, B., Revill, A., Rihan, D. and Eigaard, O. (Eds) Report of Efficiency and Productivity in Fish Capture Operations. Report of the ICES4FAO Working Group on Fishing Technology and Fish Behaviour (WGFTFB), ICES Fisheries Technology Committee ICES CM 2004/B:05, Ref. ACE. 20423 April 2004, Gdynia, Poland. ICES WGFTFB Report 2004 pp 189.
Sterling, D., and Klaka, K., (2006). Energy Efficient Fishing : A 2006 Review. Part B – Hull Characteristics and Efficiency. Project No 2005/239 for th Austrlian Government Fisheries Research and Development Corporation. 26pp.

296 of 425 Report Number C002/08
6.8 Italy First Segment (gear, length, power): OTB, 24440m, 446 kW (606 hp) Participant: CNR4ISMAR Author(s): Antonello Sala, Gaetano Messina, Alessandro Lucchetti, Emilio Notti, Francesco De Carlo, Vito Palumbo, Hans van Vugt.
6.8.1 Reference design: OTB, 24440 m
6.8.1.1 Vessel
Figure 6451: Bottom trawler (OTB 24440 m), picture of the reference vessel Nr. 1.
Looking at the Mediterranean inshore trawlers, the largest fleet is the Italian one with nearly 5000 vessels, 2400 of them less than 15 m in length. This is followed by the Spanish fleet with 1300 vessels and the Greek fleet with 400 vessels while the French fleet comprised 200 vessels in 1990 (source FAO. In 2004, 990 bottom trawl vessels were active in Adriatic demersal fisheries, with a gross tonnage of 29,145 GRT and an engine power of 171890 kW, representing a quota of 23% of the total fleet in terms of number and 53% in terms of GRT. In the same year, 35224 tons of fish, around 30% of total landings, for a value of 196 M € were produced by this fleet segment (Spagnolo and Accadia, 2006). Under the European research project “Development of fishing Gears with Reduced Effects on the Environment” (SSP84CT420044022576) a review of current gears and Italian commercial vessels have been made by CNR4ISMAR through consultation with fishermen, netmakers and trawl door manufacturers Figure 6452. Then using this information, CNR4ISMAR created a database of current gears and vessels. This initial benchmarking exercise has provided an inventory of current gears being used and an understanding of current fishing practices.

Report Number C002/08 297/425
PiemontePiemontePiemontePiemontePiemontePiemontePiemontePiemontePiemonte
Valle d'AostaValle d'AostaValle d'AostaValle d'AostaValle d'AostaValle d'AostaValle d'AostaValle d'AostaValle d'Aosta
LiguriaLiguriaLiguriaLiguriaLiguriaLiguriaLiguriaLiguriaLiguria
VenetoVenetoVenetoVenetoVenetoVenetoVenetoVenetoVeneto
ToscanaToscanaToscanaToscanaToscanaToscanaToscanaToscanaToscana
UmbriaUmbriaUmbriaUmbriaUmbriaUmbriaUmbriaUmbriaUmbria
LazioLazioLazioLazioLazioLazioLazioLazioLazioMoliseMoliseMoliseMoliseMoliseMoliseMoliseMoliseMolise
CampaniaCampaniaCampaniaCampaniaCampaniaCampaniaCampaniaCampaniaCampania PugliaPugliaPugliaPugliaPugliaPugliaPugliaPugliaPuglia
CalabriaCalabriaCalabriaCalabriaCalabriaCalabriaCalabriaCalabriaCalabria
SiciliaSiciliaSiciliaSiciliaSiciliaSiciliaSiciliaSiciliaSicilia
SardegnaSardegnaSardegnaSardegnaSardegnaSardegnaSardegnaSardegnaSardegna
Ranges for HPMeans
673 to 932 (4)524 to 673 (4)500 to 524 (1)
Figure 6452: Inventory of the Italian bottom trawler. Range for the Engine power [hp] found during the review.
The first reference vessel (Table 6475) is a standard trawler commonly used in the Italian demersal fleet (Figure 6451a). The power is around 606 hp (440 kW), there is no regulation limiting the engine power in Italy. The trawl used by this vessel has a fishing circle (or circumference) of 31.20 m, which is the product of 60 mm x 520, respectively the stretched mesh size and number of the meshes in the first trawl netting panel. The vessel is relatively new, it was built in 2002. The vessel is fitted with a conventional fixed pitch propeller (FPP) of 1.80 m diameter. On the vessel a gear box of 5.42 of ratio is installed.
Table 6475: Main particulars of the reference vessel Nr. 1: OTB 24440 m.
Item Value
Year built 2002
Length over all (m) 24.5
Breadth (moulded, m) 5.40
Depth (m) 2.60
Mean draft (m) 2.10
Main engine power (kW) 440
Main target species Mixed demersal fisheries (flatfish, sole, hake,
cuttlefish, nephrops, mantis shrimps, red
mullet, shrimps, etc).
6.8.1.2 Gear The size of trawls operated by fishing vessels depends on the engine power and towing pull available, the design and the construction of the gear, the vessel's size and the handling space and arrangements aboard. Nets which are actively towed by the main boat engine and consisting of a cone4 or pyramid4shaped body (as trawl body) closed at the back by a codend and which can extend at the opening by the wings. The main characteristics of the trawl used by the first reference vessel (OTB, 24440 m) are: i) traditional Mediterranean two4faces trawl; ii) entirely manufactured with Raschel knotless4PA netting; iii) large amount of slack in the bottom panel, which is usual in Italian trawl design; iv) the wings are built from two/three panels, which have bar cutting along the fishing and floatline and in the selvedge opposed to the one4panel wings in the traditional style Italian trawl. This change has been introduced to increase the bosom height as well as the horizontal

298 of 425 Report Number C002/08
opening of the trawl. Some other important characteristics are reported in Table 6476 and Figure 6453. Horizontal opening is either obtained by otter boards of variable shape and size. Such nets are traditionally towed on the bottom (bottom trawl net). Various type of bottom trawls are used by the different Mediterranean fleets. They are generally designed more according to the practice than to targeted species. However, two main categories can be recognized: Mediterranean and “Atlantic” shapes. The first ones have low vertical opening, essentially using sweeplines and sometimes small bridles. The second ones have generally a more large vertical opening, sometimes due to the addition of lateral panel. In few cases larger lateral panel and fork rig are used to obtain higher vertical opening for the catch of midwater fishes. The most of Mediterranean trawls are made by the fishermen themselves using only basic rules of cutting and mounting, while Atlantic trawls are made following more advanced rules and drawing designs.
Table 6476: Main particulars of fishing gear used by the reference vessel Nr. 1 (OTB 24440 m).
Item Value
Gear code (e.g. TBB, OTB, OTM, …) OTB (24440 m)
Type description Conventional demersal otterboard trawls
Otter boards (type, size, and weight) 170 x 110 cm; 270 kg
Main gear dimensions (circumference, beam width, (m)) Fishing circle: 31.20 m
(520 meshes; 60 mm of mesh size)
Headline length (m) 51.20 m
Footrope length (m) 65.20 m
Codend mesh size (mm) 40 mm
Comments None
6.8.1.3 Operational profile Using our vessels and gears inventory and following communication with individual fishermen, we retrieved useful information of two conventional Mediterranean reference vessels (falling in the length classes: OTB 24440 m and OTM 24440 m), their associated fishing gears and the main fishing operations information (i.e. time of steaming, gear handling, fishing, etc.). For the length classes OTM 24440 m, more detailed information of the operational mode have been collected by means of two experimental fuel monitoring systems and GPS data loggers installed on board two fishing vessels. In Table 6477 has been reported the divisions calculated on a yearly basis and taken for the GES4analyses. Both bottom and semi4pelagic pair trawlers are operational for around 1804200 days at sea per year. When at fishing grounds, the bottom trawling operation is a continuous sequence of setting out the gear from aboard, towing the net (usually for between one and three hours) and then hauling back the net, emptying the catch from the codend and setting out again for the next tow. There is therefore no time spent on searching operations for bottom trawlers (Table 6477). Normally the operations of setting and retrieving the net take place over the stem.

Report Number C002/08 299/425
96 56
104 52
29 44
47 64
148 100
107 107
35
250
250
20
442
442
394
394
75
165
48
SP
13
87
4
2 2
40
2 2
SS
24
110
48
55
240
50 50
15
30
30 64
42 60
83 100
MeshNum.
Meshsize[mm]
240
AN
AN
2N 2B
3N 2B
3N 2B
AN
AN
2N 2B
AN
AN AN AN
46.5 m
13055
165
Strengthening bag
PA # 120 mm48
28 35 28 80
80
134
60.3 m
AN
1N 2B
ANAN
1N 2B
1N 2B
23.1
m
PA
Kno
tless
PA Knotted
PA Knotless
PA
Kno
tted
LinearDensity[RTex]
1500
1500
1800
1800
1800
1800
1800
1800
3600
1800
1800
7500
9000 - Ø = 5mm
9000 - Ø = 5mm
7500 56 140
240 240
91
75 75
56
43.3 m
29.5 m
AN
MeshNum.
LinearDensity[RTex]
Meshsize[mm]
C
SS
SP
18005535
95
AN
1N2T
3 x 1B2T
95
3 x 1B2T
1N2T
210/42
1N 2B 8000 - Ø = 4mm 80 87
130
5 passi
9 passi
342
342
287287
45 60 1800 2N 2B
114 52 1800 3N 2B
96 52 1800 3N 2B
75
40
6N 2B
84
95
3600 46 190
12N 2B 4500 52 371
PA
Kno
tless
Figure 6453: Traditional Italian bottom trawl used by the reference vessel Nr. 1 (OTB 24440 m).
Table 6477: Time split over operational modes for the first reference vessel (OTB 24440 m).
Operational mode Percentage of time %
Steaming to and from fishing grounds 2.7%
Shooting and hauling gears 7.5%
Fishing 29.1%
Searching 0.0%
Time in harbour during the working period 51.1%
Time in harbour during the Closed season 9.6%
Total 100%

300 of 425 Report Number C002/08
The following operational profile is used in the GES4runs.
Table 6478: Operational profile for the base line reference vessel, segment OTB 24440m
Name Duration Distance Velocity
[4] [hrs] [nm] [kn]
Harbour 5205.00 0.0 0.00
Steaming to fishing ground 740.63 7776.5625 10.50
Fishing 2444.06 8603.1 3.52
Searching 370.31 3888.2813 10.50
6.8.1.4 Evaluation of the state of technology Energy saving has been a subject of research since the 1970s oil crisis, leading to several studies aimed at improving vessel design and power consumption. Special attention has been given to hull resistance and tests in model basins. Benefits were identified from using bulbous bows in small fishing vessels, leading to a reduction in fuel consumption of 15–30% during sailing (Kasper, 1983; Messina and Corsini, 1997). Gains in propulsive efficiency between 10 and 17% during free navigation were also attained using ducted propellers in trawlers (Basañez, 1975). Large savings in fuel consumption (up to 28%) could also be obtained from this type of propeller by towing at lower speeds (O’Dogherty et al., 1981). In addition to vessel design, special attention has also been given to vessel operations. Efficient ship operation is required for long4term fuel economy of the vessel, and entails selecting the best route, draft and trim; adequate maintenance of the hull and machinery; and a rational exploitation of the available systems by well4trained crews. The choice of the best running point (that is, the vessel’s operating speed that maximizes cash flow), both in trawling and in free navigation, is a major contribution toward energy savings and must be continuously adjusted according to vessel requirements. Trawlers are among the most fuel4demanding fishing vessels. This is due to the high towing resistance associated with the gears; the netting drag alone typically accounts for 60% of the total gear resistance (Wileman, 1984). Reducing the netting surface by using larger meshes in the net forepart (wings and square) may significantly reduce net drag without affecting the trawl mouth area and thus the catch efficiency. Other possibilities for reducing the net drag have also been recently investigated, such as the use of knotless netting and thinner twine. Sala et al. (2005) compared the drag of twin trawls made of polyethylene twine with traditional Italian bottom trawls, and reported an increment in fuel consumption of around 6% to annual base and conversely an increase in estimated impact on CPUE of +30%.
6.8.1.5 Catch Bottom trawling fisheries in the Mediterranean are essentially multispecies (Sala et al., 2008a; Stewart, 2002). Monospecific fisheries are very rare and are largely limited to deep shrimp fisheries on muddy slope bottoms. The high marketability of small fish in many countries encourages the targeting of the juvenile fraction of some species, often in violation of laws regarding minimum sizes. Bottom trawling in the Mediterranean is characterised by the high number of species that are commercialised. Otter trawl fishers attempt to achieve as great a catch as possible for their effort and to capture anything that is legally marketable and available in the path of the trawl (Laevastu and Favourite, 1988). Demersal fish (also called groundfish) stocks have traditionally provided the economically most important catches for human consumption. Bottom trawl catches are generally highly multi4specific; however, despite the complexity of multispecies catches, there is a well defined series of target species which in biomass or in economic terms

Report Number C002/08 301/425
constitute an important basis of production. In the Mediterranean sea these are dominated by roundfish (European hake Merluccius merluccius, the red mullet Mullus barbatus, the blue whiting Micromesistius poutassou, the whiting Merlangius merlangus, the Pagellus spp., the bogue Boops boops, the picarels Spicara spp.), flatfish species (the common sole Solea solea, some rays, the turbot Psetta maxima, the brill Scophtalmus rhombus, the anglerfishes Lophius spp. etc.) several Crustaceans (the Norway lobster Nephrops norvegicus, the giant red shrimp Aristaeomorpha foliacea, the red shrimp Aristeus antennatus, the mantis shrimp Squilla mantis, the Caramote prawn Melicertus kerathutrus, the deepwater rose shrimp Parapenaeus longirostris etc.), several Cephalopods (the shortfin squid Illex coindetii, the european squid Loligo vulgaris, the common cuttlefish Sepia officinalis, the little squid Alloteuthis media, the curled octopus Eledone spp) which form the target of fisheries that today are generally conducted with fishing fleets of larger vessels. Moreover several species have a local commercial importance (Sala et al., 2008a).
6.8.1.6 Energy performance
6.8.1.6.1 Fuel consumption
Recent oil price increases have brought renewed attention to energy4saving methods in the fishing industry (Leblanc, 2005), including the use of alternative fuels and lubricants (such as bio4diesel and bio4lubricants). However, due to constraint on new constructions and lack of public support, the major opportunities for reducing fuel consumption are chiefly related to improving vessel operation rather than commissioning new energy saving vessels. Fuel4efficient gear design continues to be a top priority for improving the efficiency of the existing fishing fleet (European Commission, 2006). A typical bottom trawler spends a great part of fishing trip actually towing the fishing gear. During the towing, the drag of the vessel is low compared to the drag of the gear. The gear drag therefore has a large effect upon the overall fuel consumption of the vessels. The fuel costs for a typical trawler can be 50% of the total expenses on a fishing trip (Wileman, 1984). Wileman (1984) made an analysis on how the individual components of the gear (trawl wire, doors, netting, floats and footrope gear) contribute to its overall drag. This analysis showed that, for a typical trawler, nearly 60% of the total gear drag is contributed by the netting. Wileman and Hansen (1988) investigated in the flume tank the effect on the drag of models of a demersal trawl for the Danish industrial fishery, when reducing the netting area by larger meshes, thinner yarns or knotless netting in different parts of the trawl. Tests showed that a drag reduction of 25% was achieved. Verhulst and Jochems (1993) made a series of tests where the polyamide ropes in the front part of a large Dutch pelagic trawl were replaced by ropes of high strength material (Dyneema SK 60). These tests showed that it was possible to obtain a towing speed about 10% higher for the same engine power. The mouth area was at the same time increased by 25%. Tests also showed, however, that the low flexibility and high stiffness of the new material could lead to broken meshes when the material was used in areas of the trawl with high loads. Parente et al. (2008) and Sala et al. (2002; 2008b) established that through appropriate modifications in the trawl design was possible to maintain previous ability to catch species and to consume less fuel at the same commercial trawling speed. The economic evaluation showed potential increases in the net cash flow (NCF) of up to 27% over the range of operational navigation and trawling speeds (Parente et al., 2008).
6.8.1.6.2 Efficiencies – Output of GES�model runs
The table below gives the base line consumption of this boat towing the traditional fishing gear at a speed of 4.2 kts.

302 of 425 Report Number C002/08
Table 6479: Fuel consumption and gaseous emissions for base line, segment OTB 24440m
Item
Base line consumption at 4.2 kts towing speed with
traditional 32 m2 fishing gear
Fuel [ton/yr] 239.11
CO2 [ton/yr] 751.51
SOx [ton/yr] 4.78
NOx [ton/yr] 21.44
HC [ton/yr] 0.29
CO [ton/yr] 1.00
6.8.2 Adaptations under study – Adaptation No 1
6.8.2.1 Short description of Adaptation No 1 The first adaptation apply to the first reference vessel (OTB 24440 m) and implemented the results obtained in the research project “Development of Fuel Saving Bottom Trawl” financed by the EC Commission. Results are available in Sala (2002) and Sala et al. (2008b). This research aimed at the development of bottom trawl designs, for the Italian fisheries, with reduced fuel consumption. The new designs include the use of a new high strength material and the use of larger meshes in net areas where no negative effect on the catching power is foreseen. It was essential that the new designs combine the features of large headline heights and good contact between the footrope and the seabed, with a low towing resistance. A typical traditional trawl, commercially used in Italy, was selected as a basis for the development of the new design (Figure 6454). This trawl became the reference (traditional trawl) to which the changes introduced in the new design were compared throughout the study. A model of the traditional trawl was firstly constructed. The geometry and towing resistance were measured in a flume tank for different riggings. Netting yarn diameters and breaking loads were measured in laboratory for all types of netting used in the traditional trawl. Based on the results from the flume tank tests made on the traditional trawl, a second model of an experimental trawl was designed with the aim of obtaining a larger vertical opening and a lower towing resistance. A mathematical model was used to estimate the effect on towing resistance when the netting area was reduced in different parts of the trawl. To reduce the netting area of the experimental trawl, a high strength polyethylene fiber (Dyneema, commercially called Rubitech©) was tested. This fibre has a higher strength than polyamide or polyethylene. The intention was to reduce the mesh bar diameter while keeping the netting strength constant. Based on the results from the flume tank tests, full scale trawls were designed and constructed. Knotted Rubitech©, was used in the wing section of the Italian experimental trawl (Figure 6455). Sea trials were made on a research vessel to measure the engineering performance of the trawls. During these tests a towed underwater camera was used to make a visual inspection of the trawls. The results from the sea trials and the flume tank tests show that it is possible to design trawls with up to 30% less fuel consumption and up to 40% more headline height in the Italian fisheries, when larger mesh sizes, new high strength materials and reshaped wings are introduced. Comparison of the results from the sea trials and the flume tank tests show that it is very difficult to accurately model in the flume tank trawl sections where the highly flexible polyamide netting is used. An inspection of the knotted Rubitech© netting after the commercial tests on the Italian experimental trawl showed that the stability of the knots in this type of netting was not sufficient to keep the meshes rightly shaped. Further product development is necessary before such material could be commercially used in the Italian fisheries.

Report Number C002/08 303/425
Figure 6454: Design of the Mediterranean traditional bottom trawl.

304 of 425 Report Number C002/08
Figure 6455: Design of the experimental trawl.

Report Number C002/08 305/425
6.8.2.2 Effects of Adaptation No 1
6.8.2.2.1 Effect on energy consumption (% change) – Output of GES�model runs
As the intention was to compare the performances of Total Warp Drag (TWD) and Fuel Consumption (FC) according to testing conditions, the relationship, with the other concerned parameters, were firstly analyzed by means of GLM analysis. To correlate TWD and FC parameters with the Towing Speed (TS), a dummy variable (Draper and Smith, 1966) was added as an independent variable in regression equations: it was given a value of +1 when the data were collected with a counter current and a value of –1 with a favourable current. The constant of Dummy in the regression model value represents an estimate of the current speed, to be added or subtracted to the TS in order to obtain the water speed to the gear. Zeroing this term, the relationship between the parameter TWD and FC Vs TS in absence of any current, was obtained. The analysis showed that a linear dependence upon Towing Speed (TS) was reasonably accurate, but a better approximation was achieved by correlating the drag with the square of the TS. The second result of this analysis was that the other independent variable to be considered in the equation was the Trawl Mouth Opening (TMO). The use of further variables did not substantially improve the approximation of data. To be able to compare TWD and FC for the two trawls without having to condition on value of covariates TMO and TS, we must be able to assume that the regression of TWD and FC on TS and TMO is the same for all two Trawl Types (TT). This assumption of equality (homogeneity) of regression slopes can be tested by fitting a model containing main effects of TT, TMO and TS, as well as the TT*TMO and TT*TS interaction. The interaction terms provide the test of the null hypothesis of equal slopes. Finally, had there been evidence of heterogeneity or inequality of regressions, we could estimate a model incorporating separate slopes. The separate slopes estimates could be reconstructed from parameter estimates from the interaction model originally fitted, since this is the same overall model as the separate slopes model, but there are easier ways to obtain the individual slope estimates. Specifying the main effect of Trawl Type (TT), the interactions of TT*TMO and TT*TS, without the main effects TMO and TS, fits the same nested model as one with TT, TMO4 and TS4within4TT effects, and the TT*TMO and TT*TS parameter estimates will give the simple slope estimates within each level of TT (traditional and experimental). All the statistical procedures were performed using the SPSS Rel. 10.05 software package. Therefore the models have been simplified for an easy utilization in the GES model. The models below give both TWD and FC in function of TS when both the trawls have an equal mouth surface of 32 m2, which means a Horizontal Net Opening of 16 m and a Vertical Net Opening of 2 m.
Traditional trawl: 2TWD 195.12 190.79 TS= + ⋅ 2FC 18.19 3.85 TS= + ⋅
Experimental trawl: 2TWD 633.295 150.39 TS= + ⋅ 2FC 27.93 2.79 TS= + ⋅ The resultant values and graphs are given in Table 6480 and Figure 6456. Considering an operational towing speed for a typical OTB (24440 m) of around 4.0044.25 kts, we obtained a decrease in the drag of about 2104290 kg and correspondently a decrease in the fuel consumption of about 749 [l/h] (Table 6480).

306 of 425 Report Number C002/08
Table 6480: Total Warp Drag (TWD[kg]) and Fuel Consumption (FC[l/h]) results obtained on the Italian traditional (TRAD) and experimental trawls (EXP). TS[kn]: Towing Speed. TWD and FC were analyzed when both the trawls have an equal mouth surface (TMO): Horizontal Net Opening of 16 m; Vertical Net Opening: 2 m give a trawl mouth opening TMO of 32 m2.
TWD[kg] FC
TS TRAD EXP Diff. TRAD EXP Diff.
3.00 1912 1987 74.58 52.83 53.02 0.19
3.25 2210 2222 11.46 58.84 57.37 -1.47
3.50 2532 2476 -56.71 65.33 62.08 -3.26
3.75 2878 2748 -129.94 72.31 67.13 -5.18
4.00 3248 3040 -208.21 79.76 72.53 -7.23
4.25 3641 3350 -291.53 87.70 78.27 -9.42
4.50 4059 3679 -379.90 96.11 84.37 -11.74
4.75 4500 4027 -473.33 105.01 90.82 -14.20
1500
2000
2500
3000
3500
4000
4500
5000
2.50 3.00 3.50 4.00 4.50 5.00
TS[kn]
TW
D[k
g]
TRAD EXP
40
50
60
70
80
90
100
110
2.50 3.00 3.50 4.00 4.50 5.00
TS[kn]
FC
[lt/h
r]
TRAD EXP
(a)
(b)
Figure 6456: Comparison of the model results obtained on the Italian traditional (TRAD) and experimental trawls (EXP). (a) TWD[kg]: Total Warp Drag; (b) Fuel Consumption (FC[l/h]. TWD and FC were analyzed at different Towing Speed (TS[kn]) and when both the trawls have an equal mouth surface of 32 m2: Horizontal Net Opening of 16 m; Vertical Net Opening: 2 m.

Report Number C002/08 307/425
Table 6481: Fuel consumption and gaseous emissions for the base line 32 m2 gear (traditional) and the replacing trawl (experimental) with a towing speed of 3.52 kts
Item at 3.52 kts Traditional 32 m2 Experimental 32m2 % reduction
Fuel [ton/yr] 168.70 164.94 2.23
CO2 [ton/yr] 529.10 517.23 2.24
SOx [ton/yr] 3.37 3.30 2.23
NOx [ton/yr] 20.77 20.72 0.26
HC [ton/yr] 0.26 0.26 0.65
CO [ton/yr] 1.29 1.31 41.32
At this towing speed (3.52 kts) and operational profile the GES4model predicts only 2.23% fuel reduction. A similar run was done with a towing speed of 4.2 kts, leading to the operational profile as given below.
Table 6482: Operational profile for the base line reference vessel, segment OTB 24440m
Name Duration Distance Velocity
[4] [hrs] [nm] [kn]
Harbour 5205.00 0 0.0
Steaming to fishing ground 740.63 7776.5625 10.50
Fishing 2444.06 10265.063 4.20
Searching 370.31 3888.2813 10.50
Table 6483: Fuel consumption and gaseous emissions for the base line 32 m2 gear (traditional) and the replacing trawl (experimental) with a towing speed of 3.52 kts
Item at 4.2 kts Traditional 32 m2 Experimental 32m2 % reduction
Fuel [ton/yr] 239.11 219.55 8.18
CO2 [ton/yr] 751.51 689.78 8.21
SOx [ton/yr] 4.78 4.39 8.18
NOx [ton/yr] 21.44 21.03 1.94
HC [ton/yr] 0.29 0.28 3.25
CO [ton/yr] 1.00 1.05 45.58
Now we find 8.18% fuel reduction for this towing speed (4.2 kts), which compares well with the 9.42% found in the measurements (at 4.25 kts).
6.8.2.2.2 Investment required for the adaptation (* 1000 €)
The Rubitech© material tests showed that the knotted Rubitech© netting, as it was produced, was suitable for use in fishing gear. The yarn thickness of the final netting was appropriate to obtain substantial fuel savings in the trawl. Therefore the knotted Rubitech© netting showed good properties to be able to replace the polyamide in the Mediterranean trawls. On the basis of an operation profile for a typical Italian commercial bottom trawler (OTB, 24440 m) reported in Table 6477, the yearly savings in fuel use estimated, based on fuel consumption values and hours fishing per year, is around 9% (Table 6484). The cost of the netting material and other extra estimated investments to realize the experimental trawl was also reported. The yearly fuel saving, both in volume and in cost, is substantial high, but the costs achieved to produce the experimental trawl with high strength material require an extra investment of about 1.5 KEuro. Assuming that the catching power is equal or slightly below for the experimental trawl and a fuel cost of 0.6

308 of 425 Report Number C002/08
Euro/l, the payback time for the investment necessary to realize a the experimental trawl that includes the new high strength material, will be less than 2 months.
Table 6484: Technical adaptation Nr. 1 of segment OTB (24440 m).
Technical information Value
Fuel saving in % to annual fuel use 9%
Estimated investments (1000 €) 1.5
Estimated impact on CPUE(%) 45%
6.8.2.2.3 Effect on income (LPUE, landings per unit of effort)
During the sea trials carried out on board a research vessel, the total catch of the experimental trawl resulted 5% less of that of the trawl used by the commercial vessel, but the difference resulted not statistically significant (p=0.620, Table 6484). The catch of Norway lobster (Nephrops norvegicus) and adult hake (Merluccius merluccius) was respectively 11% and 6% less. Much greater was the difference for the juvenile hake: 27%. Mackerel (Scomber scombrus) on the contrary, was caught by the experimental trawl in much higher quantity. The total catch comparison between the standard and the experimental trawls, showed larger catches for the experimental trawl. This was caused mainly by the bigger catch of mackerel (4 times that of the traditional trawl). Another species caught more abundantly by the experimental trawl was the spottail mantis shrimp (Squilla mantis). Final tests on a commercial vessel were carried out to compare the fishing power of the experimental trawl to that of the traditional trawl. Both the experimental and the traditional trawls showed comparable catch rates.
6.8.3 Adaptations under study – Adaptation No 2
6.8.3.1 Short description of Adaptation No 2 This second adaptation also deals with the first reference vessel (OTB 24440 m). The adaptation implemented the results obtained in the research project “Environmental impact reduction of the Italian bottom trawling: twin trawls experiment” financed by the EC Commission through the Marche Regional Authority (Sala et al., 2005). Towing multiple trawl rigs is not a new idea. Such fishing method could be in various forms and it has been practic¬ed in a number of countries, but has recently been adapted in Italy for the catching of prawns, shrimps, flatfish, hake and cuttlefish (Sala et al., 2005). Italian bottom trawlers found this multi4rig system very efficient when trawling in shallow waters, they tow up to two trawls using the same doors but with shorter bridles. This work describes a project which was carried out in 2004405 to transfer twin trawls technology from Europe to the demersal trawl fisheries in Italy. The objectives of this project were to investigate if the introduction of this trawling technology would achieve the above described objectives of improved catching efficiency, effective conservation characteristics, and enhanced product quality. Italian twin trawling does not involve booms or outriggers, and the gear is towed by two wires in a more conventional method (Figure 6457). The principle involves one vessel towing maximum two nets, thus increasing the swept area by a large margin, and offering a significant increase in catches of certain species over conventional single trawl systems (Figure 6457).

Report Number C002/08 309/425
Figure 6457: Twin4rig trawling: 2 warp twin rig.
Sala et al. (2005) experiments have shown that the towing drag of both a certain twin trawls system (Figure 6458) and a traditional Italian bottom trawl (see Figure 6453 for details) with a comparable swept area was around 4.9 tons at 4.2 knots (Table 6485). The fuel consumption on both single and twin trawling operations during the same fishing period was thus the same (Table 6485), but there was a increase of at least 30% in catch rates. Such increased catch rates of twin trawls system it should be not a conservation concern if the fisheries
would be managed with individual vessel quotas (Sala et al., 2005). Higher catch rates would result in shorter trips and higher quality of landed fish, which is a growing priority in the industry. However, we consider that the practice of twin trawling could pose a potential threat to stocks due to the sizeable increases in catch efficiency. At a time when only a small number of Italian vessels are presently operating twin trawls, we consider that it may be appropriate to not undermine the principles of effort management and the enforcement of quota and landings restrictions. Actually, vessels from other EU Member States are undertaking multiple trawls in certain fisheries, for example Danish and Belgian vessels fishing for Nephrops in the North Sea. It is for each Member State to regulate its own fishing industry in the absence of relevant Community legislation. Therefore, before such practice becomes widespread and before a greater number of Italian vessel owners
invest in the necessary technology, proposals would need to be developed and agreed by all EU
Member States and the European Commission (Sala et al., 2005). Adaptation 2: This second adaptation also deals with the first reference vessel (bottom trawlers 24440m). The adaptation implemented the results obtained in the research project “Environmental impact reduction of the Italian bottom trawling: twin trawls experiment” financed by the EC Commission through the Marche Regional Authority (Sala et al., 2005). Towing multiple trawl rigs is not a new idea. Such fishing method could be in various forms and it has been practiced in a number of countries, but has recently been adapted in Italy for the catching of prawns, shrimps, flatfish, hake and cuttlefish (Sala et al., 2005). Italian bottom trawlers found this multi4rig system very efficient when trawling in shallow waters, they tow up to two trawls using the same doors but with shorter bridles.
6.8.3.2 Effects of Adaptation No 2
6.8.3.2.1 Effect on energy consumption (% change) – Output of GES�model runs
The statistical approach to compare the performances of the twin trawls and the traditional Italian bottom trawl system was the same followed in the project “Development of Fuel Saving Bottom Trawl” (Sala, 2002; Sala et al., 2008b), see for details Adaptation Nr. 1. The models below give both TWD and FC in function of TS when both the trawls have an equal mouth surface of 50 m2, which means a Horizontal Net Opening of 25 m and a Vertical Net Opening: 2 m.

310 of 425 Report Number C002/08
Traditional trawl: 2TWD 975.4 332.5 TS= − + ⋅ 2FC 9.83 3.54 TS= + + ⋅
Experimental trawl: 2TWD 3196.0 95.71 TS= + + ⋅ 2FC 54.05 1.03 TS= + + ⋅ The resultant values and graphs are reported in Table 6485 and Figure 6459. Considering an operational towing speed for a typical twin trawls system of around 4.20 kts, we obtained substantial identical drag (4.9 tons) and correspondently an identical fuel consumption of about 72 [l/h] (Table 6485).

Report Number C002/08 311/425
395
78 78
13 13
236
284
59
ABAB
1N-3B
1N-2B
4
AN AN
6
AB
70
94
72
83
45
5N-2BAN
5N-2B
AN
59
284
249
1N-4B
AB
13
6363
81 81
31381 81
13
1N-4B
AB
1N-2B
4
1N-2B
1N-4B
15070
13352
226441894
Line
ar d
ensi
ty
Mes
h op
enin
g
Mes
h nu
m.
226 44
150 70
133 52
44 226
52 133
70 150
4.20 2.20
9.45
0.40 0.40 0.40
2.202.80
13.55
0.50 0.50
208
208
114
AN
1894
112 AN
102
PA #90
Strengthening bag
Sacco
44
208
208
1144174 43.50
Mat
eria
l
[tex] [mm][-]
PE
PA
[-] [mm][tex]
PE
[-] [mm] [tex]
PE
10.00
27.361894
1894
1894
1894
1894 1894
1894
Mes
h op
enin
g
Line
ar d
ensi
ty
Mat
eria
l
Mes
h nu
m.
Mes
h op
enin
g
Line
ar d
ensi
ty
Mat
eria
l
Mes
h n.
1894
28.3 m 35.3 m
Figure 6458: Design of the experimental 2 warp twin trawls.

312 of 425 Report Number C002/08
Table 6485: Total Warp Drag (TWD[kg]) and Fuel Consumption (FC[l/h]) results obtained on the Italian traditional (TRAD) and twin trawls (TWIN). TS[kn]: Towing Speed. TWD and FC were analyzed when both the trawls have an equal mouth surface (TMO): Horizontal Net Opening of 25 m; Vertical Net Opening: 2 m give a trawl mouth opening TMO of 50 m2.
TWD[kg] FC
TS TRAD TWIN Diff. TRAD TWIN Diff.
3.25 2537 4207 1670 47.24 64.91 17.67
3.50 3098 4368 1271 53.22 66.65 13.43
3.75 3700 4542 841 59.63 68.51 8.88
4.20 4890 4884 -6 72.30 72.19 -0.12
0
1000
2000
3000
4000
5000
6000
3.00 3.20 3.40 3.60 3.80 4.00 4.20 4.40 4.60
TS[kn]
TW
D[k
g]
TRAD TWIN
35
40
45
50
55
60
65
70
75
80
85
3.00 3.20 3.40 3.60 3.80 4.00 4.20 4.40 4.60
TS[kn]
FC
[lt/h
r]
TRAD TWIN
(a)
(b)
Figure 6459: Comparison of the model results obtained on the Italian traditional (TRAD) and twin trawls (TWIN). (a) TWD[kg]: Total Warp Drag; (b) Fuel Consumption (FC[l/h]. TWD and FC were analyzed when both the trawls have an equal mouth surface (TMO): Horizontal Net Opening of 25 m; Vertical Net Opening: 2 m give a trawl mouth opening TMO of 50 m2.
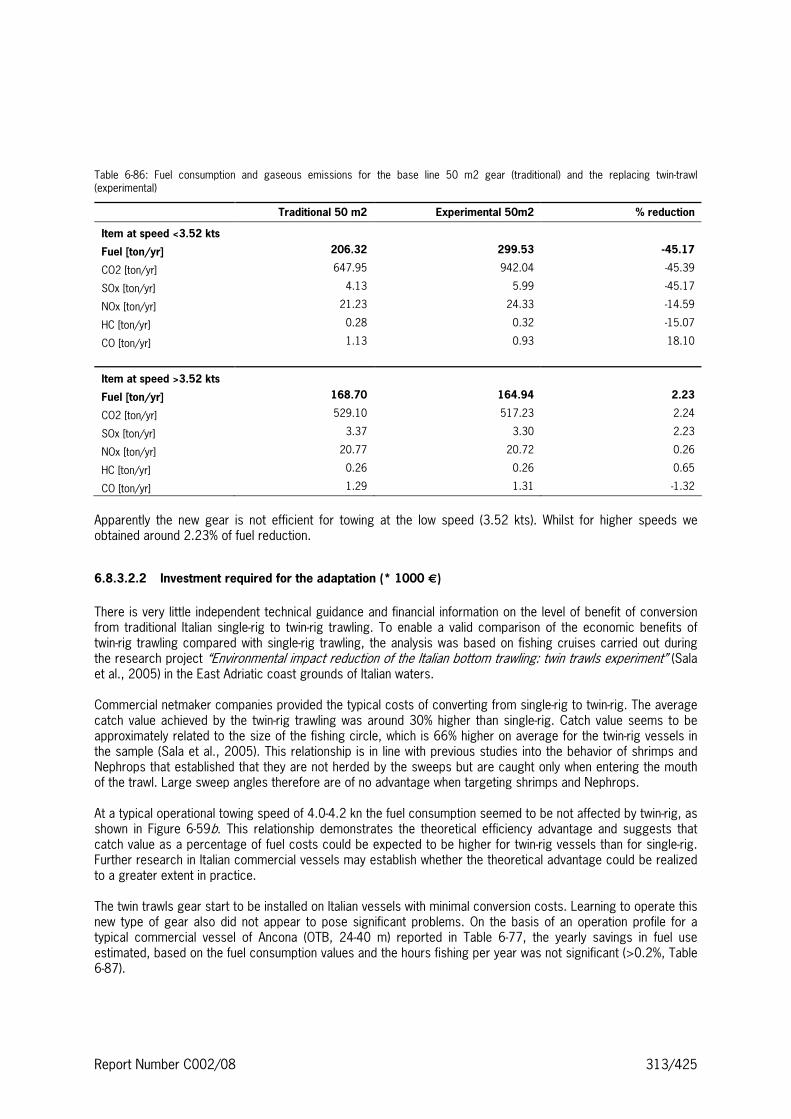
Report Number C002/08 313/425
Table 6486: Fuel consumption and gaseous emissions for the base line 50 m2 gear (traditional) and the replacing twin4trawl (experimental)
Traditional 50 m2 Experimental 50m2 % reduction
Item at speed <3.52 kts
Fuel [ton/yr] 206.32 299.53 �45.17
CO2 [ton/yr] 647.95 942.04 445.39
SOx [ton/yr] 4.13 5.99 445.17
NOx [ton/yr] 21.23 24.33 414.59
HC [ton/yr] 0.28 0.32 415.07
CO [ton/yr] 1.13 0.93 18.10
Item at speed >3.52 kts
Fuel [ton/yr] 168.70 164.94 2.23
CO2 [ton/yr] 529.10 517.23 2.24
SOx [ton/yr] 3.37 3.30 2.23
NOx [ton/yr] 20.77 20.72 0.26
HC [ton/yr] 0.26 0.26 0.65
CO [ton/yr] 1.29 1.31 41.32
Apparently the new gear is not efficient for towing at the low speed (3.52 kts). Whilst for higher speeds we obtained around 2.23% of fuel reduction.
6.8.3.2.2 Investment required for the adaptation (* 1000 €)
There is very little independent technical guidance and financial information on the level of benefit of conversion from traditional Italian single4rig to twin4rig trawling. To enable a valid comparison of the economic benefits of twin4rig trawling compared with single4rig trawling, the analysis was based on fishing cruises carried out during the research project “Environmental impact reduction of the Italian bottom trawling: twin trawls experiment” (Sala et al., 2005) in the East Adriatic coast grounds of Italian waters. Commercial netmaker companies provided the typical costs of converting from single4rig to twin4rig. The average catch value achieved by the twin4rig trawling was around 30% higher than single4rig. Catch value seems to be approximately related to the size of the fishing circle, which is 66% higher on average for the twin4rig vessels in the sample (Sala et al., 2005). This relationship is in line with previous studies into the behavior of shrimps and Nephrops that established that they are not herded by the sweeps but are caught only when entering the mouth of the trawl. Large sweep angles therefore are of no advantage when targeting shrimps and Nephrops. At a typical operational towing speed of 4.044.2 kn the fuel consumption seemed to be not affected by twin4rig, as shown in Figure 6459b. This relationship demonstrates the theoretical efficiency advantage and suggests that catch value as a percentage of fuel costs could be expected to be higher for twin4rig vessels than for single4rig. Further research in Italian commercial vessels may establish whether the theoretical advantage could be realized to a greater extent in practice. The twin trawls gear start to be installed on Italian vessels with minimal conversion costs. Learning to operate this new type of gear also did not appear to pose significant problems. On the basis of an operation profile for a typical commercial vessel of Ancona (OTB, 24440 m) reported in Table 6477, the yearly savings in fuel use estimated, based on the fuel consumption values and the hours fishing per year was not significant (>0.2%, Table 6487).

314 of 425 Report Number C002/08
The figures in Table 6487 are indicative costs of buying twin4rig two4wire systems when switching from a single4rig system. These figures would be typical for a 24440 m x 440 kW vessel. If it were not possible to split the existing doors an extra investment of 5 k€ would be made on the cost of the new doors.
Table 6487: Technical adaptation Nr. 2 of segment OTB (24440 m).
Technical information Value
Fuel saving in % to annual fuel use 0.2%
Estimated investments (1000 €) 3.0
Estimated impact on CPUE(%) 30%
6.8.3.2.3 Effect on income (LPUE, landings per unit of effort)
As compared to a single trawl, twin trawls have been found to improve substantially the catch rate. The increases in catches of hakes, shrimps and prawns appear to be greater than for other species, suggesting some species4specific advantage in that fishery. While improvement to catch efficiency in itself should not be viewed as a negative impact – it is only right that any business should seek to make its operating methods more effective – the relationship between fishing power and effort control does offer cause for concern. Effort control as a tool for securing the future sustainability of stocks relies on effective enforcement of quota uptake and landings restrictions. Fishing effort is the product of the fishing activity of the fishing unit and its fishing power. Controlling fishing days does not fully control the fishing power of the gear and therefore significant increases in the operation of multiple trawls risk undermining the effectiveness of effort controls.
6.8.4 Adaptations under study – Adaptation No 3: Installing a controllable pitch propeller (CPP)
6.8.4.1 Short description of Adaptation No 3 The reference vessel is fitted with a fixed pitch propeller (FPP). Fitting a controllable pitch propeller (CPP) was investigated as an alternative.
6.8.4.2 Effects of Adaptation No 3
6.8.4.2.1 Fuel consumption – Output of GES�model runs
The optimum engine speed is about 1300 rpm, the GES4model was run with a fishing speed of 4.2 kts for the 32 m2 traditional (Figure 6454) and experimental (Figure 6455) trawl, resulting:
Table 6488: Fuel consumption and gaseous emissions for a fixed and controllable pitch propeller for 32 m2 trawls (traditional vs. experimental)
Item at 4.2 kts Traditional 32 m2 + FPP Experimental 32m2 + FPP % reduction
Fuel [ton/yr] 239.11 219.55 8.18
CO2 [ton/yr] 751.51 689.78 8.21
SOx [ton/yr] 4.78 4.39 8.18
NOx [ton/yr] 21.44 21.03 1.94
HC [ton/yr] 0.29 0.28 3.25
CO [ton/yr] 1.00 1.05 45.58

Report Number C002/08 315/425
Item at 4.2 kts Traditional 32 m2 + CPP Experimental 32m2 + CPP
Fuel [ton/yr] 228.47 209.49 8.31
CO2 [ton/yr] 718.16 658.33 8.33
SOx [ton/yr] 4.57 4.19 8.31
NOx [ton/yr] 16.57 15.62 5.75
HC [ton/yr] 0.34 0.33 2.57
CO [ton/yr] 0.78 0.78 0.27
Item at 4.2 kts Traditional 32 m2 CPP for FPP Experimental 32m2 CPP for FPP
Fuel % difference 4.45 4.58
CO2 % 4.44 4.56
SOx % 4.45 4.58
NOx % 22.70 25.71
HC % 415.36 416.18
CO % 21.72 26.05
For a fixed pitch propeller (FPP) the fuel reduction for the experimental trawl in comparison with the traditional trawl is 8.18%, for a controllable pitch propeller (CPP) the fuel reduction for the experimental trawl in comparison with the traditional trawl is 8.31%, while for the traditional trawl the fuel reduction by using a CPP is 4.45%, and for the experimental trawl the fuel reduction by using a CPP is 4.58%.
Table 6489: Technical adaptation Nr. 3 of segment OTB (24440 m).
Technical information Value
Fuel saving in % to annual fuel use 4.5
Estimated investments (1000 €) 30
Estimated impact on CPUE(%) none

316 of 425 Report Number C002/08
Segment (gear, length, power): OTM, 24440 m, 819 kW (1114hp) Participant: CNR4ISMAR Author(s): Antonello Sala, Gaetano Messina, Alessandro Lucchetti, Emilio Notti, Francesco De Carlo, Vito Palumbo, Hans van Vugt.
6.8.5 Reference design: OTM, 24440 m
6.8.5.1 Vessel
Figure 6460: Semi4pelagic pair4boat trawling (OTM 24440 m), reference vessel Nr. 2 on the right of the picture.
A description of the Italian fleet and fishing gears used is given in the section on the first reference vessel in segment OTB, 24440m. The second reference vessel (Table 6490) is a semi4pelagic trawler operating in the Adriatic pair4trawling fleet (Figure 6460). The power is around 1114 hp (809 kW). The trawl used by this vessel has a fishing circle at the first trawl netting panel of 278.52 m. The vessel was built in 1996. The vessel is fitted with a controllable pitch propeller (CPP) of 2.00 m diameter and a gear box of 5.42 of ratio. The Italian fishing fleet for small pelagic fishes is distributed all along the Adriatic coast and two kinds of fishing gear are currently used: semi4pelagic trawl nets towed by two vessels (volante trawl, in Italian) and light attraction purse seines (lampara trawl, in Italian). The same fishing gear catches anchovy (Engraulis encrasicolus L.) but also sardine (Sardina pilchardus Walb.) and to a lesser extent other pelagic fish such as sprat (Sprattus sprattus L.), horse mackerel (Trachurus spp.) and mackerel (Scomber spp.). The volante is mainly used in the Northern and Central Adriatic. At present approximately 70 couples of fishing vessels use this gear; but there are wide variations in size and engine power. Bigger lampara vessels (25 boats) operate in the Central Adriatic, south of Ancona. Here it is almost common for a fishing vessel to switch from lampara during the summer season (when there are favourable weather conditions for this fishing technique) to pelagic trawl for the remaining part of the year. During the lampara fishing season (April/May–November) some fishing vessels registered in Southern Adriatic move into the Central Adriatic increasing the lampara fishing fleet up to a total of about 50/55 boats. Smaller lampara (17 boats) operate in the Gulf of Trieste.

Report Number C002/08 317/425
Table 6490: Main particulars of the reference vessel Nr. 2: OTM 24440 m.
Item Value
Year built 1996
Length over all (m) 27.00
Breadth (moulded, m) 7.00
Depth (m) 3.10
Mean draft (m) 2.50
Main engine power (kW) 809
Main target species Small pelagics (anchovies, sardine, mackerel,
horse mackerel, etc).
6.8.5.2 Gear The second reference vessel (OTM, 24440 m) operates in pair with another boat having similar characteristics. The trawl used is semi4pelagic and usually it is much larger than a bottom trawl (mean length from the wings to the codend is about 60470 m) and designed and rigged to fish in midwater (Table 6491). The front parts are usually made with very large meshes (ropes are not widely used), which herd the targeted fish inwards so that they can be overtaken by smaller meshes in the aft trawl sections (Figure 6461). The horizontal opening is maintained by towing the net by two boats. Floats on the headline and weights on the groundrope often maintain the vertical opening. Two big weights (about 300 kg each) are joined to the end of lower wings in order to keep quickly deep the groundrope. Modern large midwater trawls, however, are rigged in such a way that floats are not required, relying on downward forces from weights to keep the vertical opening during fishing. An eco4sounder is essential tool to detect fish concentration ahead the trawler and the trawl path and trawl depth can be adjusted accordingly. A sonar is often used in order to identify small schools of pelagic fish at high distance from the boat. Trawl winches installed on deck control the trawling wires and store them. Net drums are common tools to handle midwater trawls onboard vessels. Towing speed commonly used is around 4 knots. Since 1988 closing fishing season concerning semi4pelagic (and bottom) trawling is applied to mid4water pair trawlers during summer (about 45 days of closing season between July and September). Closing fishing season is not applied for the purse seiners. Fishing activity is suspended during week4ends.
Table 6491: Main particulars of fishing gear used by the reference vessel Nr. 2 (OTM 24440 m).
Item Value
Gear code (e.g. TBB, OTB, OTM, …) OTM (24440 m)
Type description Conventional semi4pelagic pair4boat trawl
Otter boards (type, size, and weight) No otterboards used
Main gear dimensions (circumference, beam width, (m)) Fishing circle: 278.52 m
(422 meshes; 660 mm of mesh size)
Headline length (m) and Footrope length (m) 59 m
Siderope length (m) 35 m
Codend mesh size (mm) 20 mm
Comments None

318 of 425 Report Number C002/08
Flapper
Strengthening
bag
Traditional Italian Pelagic pair-boat trawl
Netting Joining
Figure 6461: Traditional Italian pelagic pair4boat trawl used by the reference vessel Nr. 2 (OTM 24440 m).
6.8.5.3 Operational profile Using our vessels and gears inventory and following communication with individual fishermen, we retrieved useful information of two conventional Mediterranean reference vessels (falling in the length classes: OTB 24440 m and OTM 24440 m), their associated fishing gears and the main fishing operations information (i.e. time of steaming, gear handling, fishing, etc.). For the length classes OTM 24440 m, more detailed information of the operational mode have been collected by means of two experimental fuel monitoring systems and GPS data loggers installed on board two fishing vessels, as described below. In Table 6492 has been reported the divisions calculated on a yearly basis and taken for the GES4analyses. Both bottom and semi4pelagic pair trawlers are operational for around 1804200 days at sea per year. When at fishing grounds, the bottom trawling operation is a continuous sequence of setting out the gear from aboard, towing the net (usually for between one and three hours) and then hauling back the net, emptying the catch from the codend and setting out again for the next tow. There is therefore no time spent on searching operations for bottom trawlers. Normally the operations of setting and retrieving the net take place over the stem.
Table 6492: Time split over operational modes for the second reference vessel (OTM 24440 m).
Operational mode Percentage of time %
Steaming to and from fishing grounds 8.6%
Shooting and hauling gears 3.2%
Fishing 9.7%
Searching 4.3%
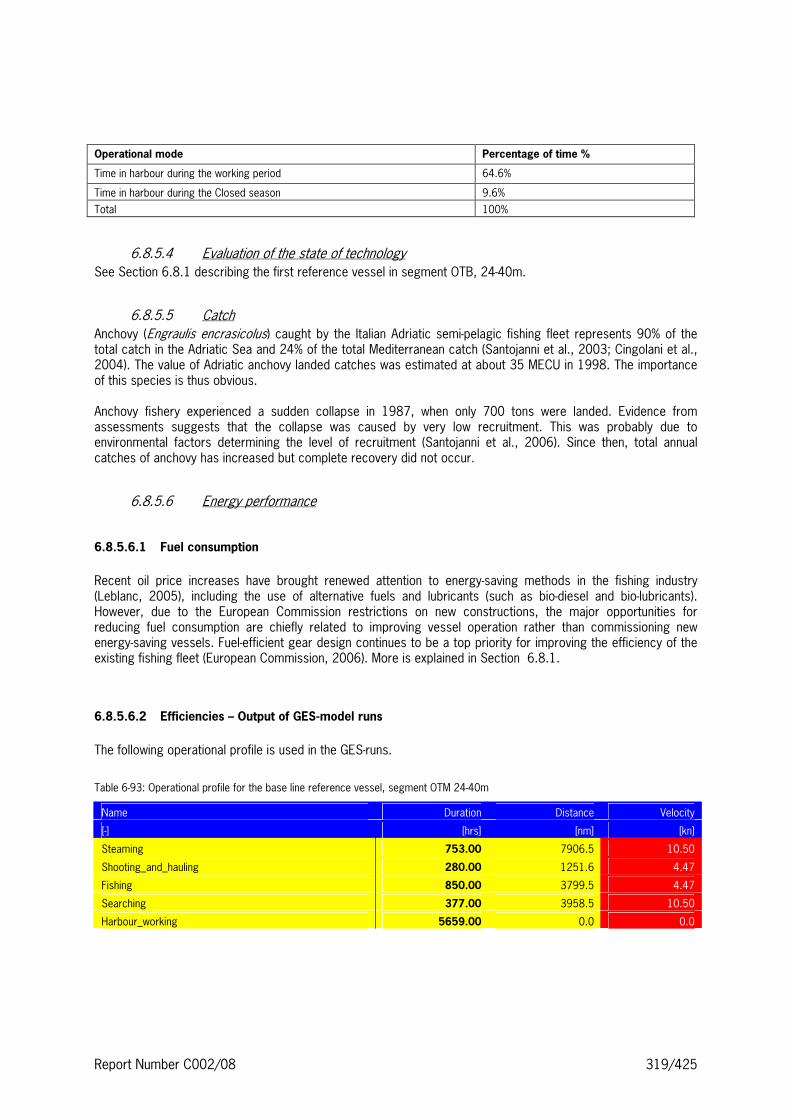
Report Number C002/08 319/425
Operational mode Percentage of time %
Time in harbour during the working period 64.6%
Time in harbour during the Closed season 9.6%
Total 100%
6.8.5.4 Evaluation of the state of technology See Section 6.8.1 describing the first reference vessel in segment OTB, 24440m.
6.8.5.5 Catch Anchovy (Engraulis encrasicolus) caught by the Italian Adriatic semi4pelagic fishing fleet represents 90% of the total catch in the Adriatic Sea and 24% of the total Mediterranean catch (Santojanni et al., 2003; Cingolani et al., 2004). The value of Adriatic anchovy landed catches was estimated at about 35 MECU in 1998. The importance of this species is thus obvious. Anchovy fishery experienced a sudden collapse in 1987, when only 700 tons were landed. Evidence from assessments suggests that the collapse was caused by very low recruitment. This was probably due to environmental factors determining the level of recruitment (Santojanni et al., 2006). Since then, total annual catches of anchovy has increased but complete recovery did not occur.
6.8.5.6 Energy performance
6.8.5.6.1 Fuel consumption
Recent oil price increases have brought renewed attention to energy4saving methods in the fishing industry (Leblanc, 2005), including the use of alternative fuels and lubricants (such as bio4diesel and bio4lubricants). However, due to the European Commission restrictions on new constructions, the major opportunities for reducing fuel consumption are chiefly related to improving vessel operation rather than commissioning new energy4saving vessels. Fuel4efficient gear design continues to be a top priority for improving the efficiency of the existing fishing fleet (European Commission, 2006). More is explained in Section 6.8.1.
6.8.5.6.2 Efficiencies – Output of GES�model runs
The following operational profile is used in the GES4runs.
Table 6493: Operational profile for the base line reference vessel, segment OTM 24440m
Name Duration Distance Velocity
[4] [hrs] [nm] [kn]
Steaming 753.00 7906.5 10.50
Shooting_and_hauling 280.00 1251.6 4.47
Fishing 850.00 3799.5 4.47
Searching 377.00 3958.5 10.50
Harbour_working 5659.00 0.0 0.0

320 of 425 Report Number C002/08
Table 6494: Fuel consumption and gaseous emissions for base line, segment OTM 24440m
Item Base line consumption
Fuel [ton/yr] 169.38
CO2 [ton/yr] 445.61
SOx [ton/yr] 3.39
NOx [ton/yr] 7.55
HC [ton/yr] 4.55
CO [ton/yr] 47.20
FUEL CONSUMPTION [ton/year]
0
10
20
30
40
50
60
70
80
90
100
Ste
amin
g
Sho
otin
g_an
d_ha
ulin
g
Fis
hing
Sea
rchi
ng
Har
bour
_wor
king
Har
bour
_clo
sed_
seas
onYanmar, tank_1
Title:OTM semi pelagic, Technology:2008Run date:08-10-2008/13:53:24Input file:COMOutput file:Results.csvResults file:ResultsOutput.csv
Figure 6462: Yearly fuel consumption in various operational modes for the base line, segment OTM 24440m
Most fuel is spent in the fishing condition as can be seen from the figure above.

Report Number C002/08 321/425
Efficiency [-]
0
0.05
0.1
0.15
0.2
0.25
Ste
amin
g
Sho
otin
g_an
d_ha
ulin
g
Fis
hing
Sea
rchi
ng
Har
bour
_wor
king
Har
bour
_clo
sed_
seas
on
Efficiency [-]Title:OTM semi pelagic, Technology:2008Run date:08-10-2008/13:53:24Input file:COMOutput file:Results.csvResults file:ResultsOutput.csv
Figure 6463: Efficiency of the installation by operational mode for the base line, segment OTM 24440m
The steaming and searching conditions are almost equal in terms of efficiencies, while fishing and gear handling are lower. This ship has a relative high efficiency for steaming compared with fishing, which is normal for these ships.
6.8.5.7 Short description of Adaptation No 4 The real challenge achieved in the current project consisted in measuring the fuel consumption of two fishing vessels, falling in the vessel segment OTM 24440 m (Reference vessel Nr. 2), and then produce an absolute daily energy consumption. A prototype instrument, named CorFu meter (CorFu4m), conceived in 2007 at CNR4ISMAR Ancona (Italy) and developed in collaboration with Marine Technology Srl (Ancona) and Race Technology Ltd of Nottingham (England). The prototype is a result of research and development work based on design experience applied to improve all aspects of fishing technology sector. The CorFu4m system consists of three components. General description and complete technical features of all parts may be found in Annex :
1. two mass flow sensors (Figure 6464a). The sensors use the Coriolis measuring principle (see Annex for details), which permit to operate independently of the fluid’s physical properties, such as viscosity and density. It is an economical alternative to conventional volume flowmeters;
2. one Multi Channel Recorder (Figure 6464b); 3. one GPS data logger (Figure 6464c).

322 of 425 Report Number C002/08
Figure 6464: CorFu4m system mounted onboard the selected semi4pelagic Adriatic fishing vessels: (a) mass flow sensors for the measurement of fuel consumption; (b) multi channel recorder mounted on the vessel’s bridge for the visualization of the fuel consumption; (c) GPS data logger for the GPS data collection.
At the beginning of 2008, two measurement systems, to run on two boats of pair trawlers, have been ordered and contacts with the fishermen made for installation onboard. However, two GPS data loggers arrived before the other parts and preliminary test of the GPS data collection made ashore at the middle of March. The selected vessels range in 90041200 hp with Loa of around 25435m (Table 5423 and Table 6496). The general characteristics of the investigated ships were obtained from papers on board or from the Classification Society Register. One of the two pair (named PB024AM, Table 6496) falls within the DCR activity of IREPA (Participant 11). Difference between the two vessels is mainly in propeller design, controllable pitch (PB014NA) Vs. fixed (PB024AM), see for details Table 5423 and Table 6496. The area usually covered by both the vessels, and then the investigated area, spans over the entire Central and Northern Adriatic Sea. The current experiment has been articulated in three phases: 1) systems fitting; 2) skipper behaviour monitoring; and 3) operational data collection and analysis. During the first phase (March4April), the two fishing vessels were progressively equipped with the CorFu4m measuring systems (Figure 6465). After the first phase, there have been a period (second phase) where the CorFu4m systems on both vessels were turned on, fuel consumption and GPS data collected but the displays of the Multi channel recorders were off. Afterwards, these data have been used to study the behaviour of skippers related to seeing or not their fuel consumption. In a third phase (May4October), data have been analysed and the methodology refined. During this phase, data collection continued using the same fishing vessels for the entire duration of the project, but the data set used for the analysis, spans over the period May–July. A huge amount of data have been collected, every fortnight we downloaded the fuel consumption and GPS data for a total of 50 Mb/day. Gear performances and drag have been measured separately on short cruises, using SCANMAR system to measure the gear performance e.g. door spread, horizontal and vertical net opening net; electronic load cells to measure the total warp loads (Figure 6466). All the instruments have been linked by RS232/485 serial ports to a personal computer, which automatically controlled the data acquisition and provided the correct functioning of the system in real time through an appropriately developed program. In the experiment, besides collecting fuel consumption (mass flow), geo4referenced positions, speed all by haul, operation such as sailing, steaming, etc. we involved also data collection on catches per haul (i.e. commercial catch and species composition). After the end of the ESIF project, thanks also to National founding, we will continue to make use of the measuring systems on board the selected vessels. Considering the high interest of the fishing fleet for the experimental CorFu4m fuel consumption system (Sala et al., 2008c), it cannot be ruled out that we will try to monitor new vessels belonging to the Adriatic fishing fleet.
(a) (b) (c)

Report Number C002/08 323/425
Figure 6465: Mass flow sensors for the measurement of fuel consumption mounted onboard one of the selected semi4pelagic Adriatic fishing vessel.
5000
5250
5500
5750
6000
6250
6500
6750
3.00 3.50 4.00 4.50 5.00 5.50 6.00
TS[kn]
TW
D[k
g]
TWD[kg] = 548.7·TS[kn] + 3574.4
Figure 6466: Results obtained on the Italian traditional. TWD[kg]: Total Warp Drag; TS[kn]: Towing speed.

324 of 425 Report Number C002/08
Table 6495: Characteristics of the first investigated vessel and respective main engine.
Vessel’s characteristics
Name PB01�NA (Acronym)
Type of fishing Pelagic trawling
Length OverAll [m] 27.00 Loa
Length Between Perpendiculars [m] 20.55 Lbp
Beam [m] 7.00 B
Gross Registered Tonnage 104.12 GRT
Net Registered Tonnage 37.23 NRT
Gross International Tonnage 139 GT
Net International Tonnage 41 NT
Main engine characteristics
Builder Yanmar
Engine power [kW] 809 P[kW]
Engine power [hp] 1114 P[hp]
Propeller design Controllable pitch
Crew 7 E
Table 6496: Characteristics of the second investigated vessel and respective main engine.
Vessel’s characteristics
Name PB02�AM (Acronym)
Type of fishing Pelagic trawling
Length OverAll [m] 28.95 Loa
Length Between Perpendiculars [m] 24.32 Lbp
Beam [m] 6.86 B
Gross Registered Tonnage 117.71 GRT
Net Registered Tonnage 4 NRT
Gross International Tonnage 112 GT
Net International Tonnage 4 NT
Main engine characteristics
Builder Mitsubishi
Engine power [kW] 940 P[kW]
Engine power [hp] 1294 P[hp]
Propeller design Fixed
Crew 7 E

Report Number C002/08 325/425
The data collected and the measuring devices of the CorFu4m system are as follows. The main parameters registered are reported in Table 6497:
- Data collection at the system level onboard: 100 ms - Data exported by the CorFu4m to PC: 1 s - Data collection at the database level: 10 s - Data collected:
1. Fuel Consumption [l/h] (Analogic value); 2. Fuel Consumption [l/Day] (Digital value); 3. Vessel Speed, Geographic Coordinates; 4. Duration of each fishing operation (i.e. Cables recovery; Entrance in the harbour; Exit from the
harbour; Hauling; Sailing back; Sailing departing; Searching; Shooting; Trawling, etc.); 5. Catch per haul (Species level);
Table 6497: Parameters registered by the CorFu4m system during each fishing operation.
Parameter Description Acronyms
Time duration Duration of the fishing operation T[h]
Fuel rate Actual average fuel consumption rate q[l/h]
Fuel consumption Total fuel consumption Q[l]
Vessel speed Average vessel speed S[kn]
6.8.5.8 Effects of Adaptation No 4
6.8.5.8.1 Effect on energy consumption (% change) – Output of GES�model runs
The main objective of this adaptation was to identify the fuel4economy potential for Italian trawlers by changing the vessel’s operating conditions. Semi4pelagic trawlers were chosen for study since they spend most of their time searching the fish schools and steaming to4 and from4 the fishing grounds as well as Italian semi4pelagic trawls (volante trawls) usually offer a wide basis for gear modifications (Buglioni et al., 2006). A typical round trip for a semi4pelagic trawler consists of several operating situations for different engine loadings, we characterized some important operations as reported in Table 6499. The performance of both the monitored vessels (PB014NA and PB024AM) have been evaluated at the different operations of the fishing trip (Table 6499). This allowed for a full characterization of the average trip for each vessel (Figure 6469). The second set of data permitted to estimate the mean fuel consumption rate (q[l/h]) performances during the trawling operations. Semi4pelagic vessels usually operate at two different RPM conditions: lower RPM in shallow water and higher RPM in deeper waters (Table 6498 and Figure 6469).
Table 6498. Operational parameter mean fuel rate q[l/h] obtained during the trawling operations in Shallow (SWH) and Deep (DWH) water hauls at the correspondent mean RPM and vessel speed S[kn].
RPM S [kn] q [l/h] RPM S [kn] q [l/h]SWH 1480 4.41 118.54 1180 4.54 130.00DWH 1540 4.32 135.08 1185 4.41 136.66
PB01-NA PB02-AM

326 of 425 Report Number C002/08
Table 6499: Characterization of the different operations during an usual semi4pelagic commercial trawling trip.
Fishing operation Description Acronyms
Miscellaneous Net repairing, waiting for setting the gear, and other unforeseen events MIX
Exit from the harbour Harbour manoeuvres and conditioned navigation inside the harbour at the start of the
daily fishing trip EXT
Sailing departing Travel between the harbour and the fishing grounds DEP
Gear setting Gear setting operations just before the gear shooting
(SPEED IS REDUCING FROM THE NAVIGATION SPEED 10 KN TO 0 KN) SET
Gear shooting
Gear at sea, towing cables releasing
(SPEED INCREASES FROM 0 TO 7 KN FOR ALL THE CABLES RELEASING. AT THE END, SPEED DECREASES
UNTIL REACHING THE TRAWLING SPEED)
SHO
Trawling Trawling operations out and out
(STEADY SPEED 444.2 KN AND FIXED RPM) TRA
Towing cables recovery Gear setting operations just before the gear shooting
(SPEED IS REDUCING FROM THE TRAWLING SPEED TO 0, SPEED HAS A HEADWAY/STERNWAY COURSE) REC
Gear hauling Gear hauling operations
(SPEED VARIES BETWEEN 0 AND 3 KN) HAL
Fish schools searching Navigation between the fishing grounds: searching the fish schools
(VARIABLE SPEED) SEA
Sailing back Travel between the last fishing grounds and the harbour BAK
Entrance in the harbour Harbour manoeuvres and conditioned navigation inside the harbour at the end of the daily
fishing trip ENT
Table 64100 presents how a reduction in the navigation speed alone leads to a decrease in fuel rate of up to 21% for this phase. A valuable outcome of this experiment was that, after having installed the fuel monitoring systems CorFu4m on board the selected vessels, the skippers reduced the navigation speed of 1.0 kn: from 11.0 kn to 10.0 kn, leads to a significant improvement in fuel consumption in the short4term of about 34% (Table 64100, Figure 6467). This benefit was obtained without the need of major changes in overall vessel technology. Fishing vessels with a controllable pitch propeller have an optimum combination of pitch and propeller revolutions for each operating situation, leading to optimum specific engine fuel consumption. On the basis of the fuel consumption monitoring, just after the second phase (skipper behaviour monitoring) the PB014NA’s skipper optimised the vessel4operating situation through propeller pitch variation, although this is not the best procedure to optimize both specific fuel consumption and engine efficiency.

Report Number C002/08 327/425
Table 64100: Operational parameter mean fuel rate q[l/h] for both the monitored vessel PB014NA and PB024AM obtained during the navigation and searching (DEP, SEA, BAK) operations through vessel speed S[kn]. dq[l/h] and dq%[l/h] are the estimated “incremental fuel saving” and the “incremental ratio of the fuel saving in percentage” respectively.
S [kn] q [l/h] dq [l/h] dq %[l/h] q [l/h] dq [l/h] dq %[l/h]10.0 84.22 - - 89.69 - -10.5 97.82 13.59 16.14% 104.21 14.52 16.19%11.0 112.81 15.00 17.81% 120.23 16.02 17.87%11.5 129.29 16.47 19.56% 137.84 17.61 19.63%12.0 147.31 18.02 21.40% 157.11 19.27 21.49%
PB01-NA PB02-AM
12
13
14
15
16
17
18
19
20
21
10.0 10.5 11.0 11.5 12.0 12.5
S [kn]
dq[l/
h]
PB02-AM
PB01-NA
Figure 6467: Estimated incremental fuel saving dq[l/h] for both the monitored vessel PB014NA and PB024AM obtained during the navigation and searching (DEP, SEA, BAK) operations through vessel speed S[kn].
Figure 6468 pertains the total fuel consumption per day (Q[l/day]), the variation strongly depend on the navigation (steaming and searching operations) phase. Table 64101 reports the mean fuel consumption (Q[l]) obtained in each fishing operation in a typical 14day trip. On the contrary of the bottom trawling (see Parente et al., 2008), in the semi4pelagic fisheries we detected that the duration of the navigation phase varied substantially, since it depends heavily on the strategy adopted by the skipper (such as the distance from the coast and time of navigation among fishing grounds, as dictated by the abundance of target species). In particular, considering both the vessels (PB014NA and PB024AM) the navigation time averages for 51454% (which is the sum of DEP, SEA, BAK operations) of the daily commercial trip (40445% for steaming and 9411% for searching), and data showed that the time spent in trawling (TRA) is just 24427% then it is relatively low when compared to navigation. As such, the fuel consumed in navigation will be around 603 and 662 litres for the PB014NA and PB024AM respectively, and will be substantially higher compared to trawling 403 litres (PB014NA) and 437 litres (PB024AM) (Table 64101). However, also the trawling phase emerges to be a significant phase for fuel reduction efforts. As for the bottom trawl, simple changes at the semi4pelagic trawl level (such as steeper cuttings in the wings and

328 of 425 Report Number C002/08
bellies, and mesh size increases in the respective net sections) demonstrate a potential fuel reductions of up to 18420% (Sala 2002; Sala et al., 2008b; Parente et al., 2008, Verhulst and Jochems, 1993).
Table 64101: Mean fuel consumption (Q[l]) parameter of the two monitored vessels under different working conditions (see Table 6497 for acronyms).
Q[l] REC ENT EXT HAL MIX SET BAK DEP SEA SHO TRA Total
PC01-NA 12.6 9.7 11.4 27.7 12.5 10.1 211.0 282.2 109.5 39.1 403.1 1129.0
PC02-AM 8.7 6.3 2.4 32.9 13.3 7.6 258.6 253.3 150.1 35.0 436.8 1205.1
700
800
900
1000
1100
1200
1300
1400
1500
22/04/08 12/05/08 01/06/08 21/06/08 11/07/08 31/07/08 20/08/08 09/09/08 29/09/08
Date
Q[l/
Day
]
HULL CLEAN
closed
HULL CLEANED
Figure 6468: Operational parameter daily fuel consumption Q[l/Day], obtained during the monitored period (April4September 2008). Points contained in the ellipse represent values after the hull cleaning carried out during the closed fishing season.

Report Number C002/08 329/425
PB01-NA
0
50
100
150
200
0 2 4 6 8 10 12 14S [kn]
q[l/
h]
TRA BAK DEP SEA REC HAU SHO
DWH
SWH
PB02-AM
0
50
100
150
200
0 2 4 6 8 10 12 14S [kn]
q[l/
h]
TRA BAK DEP SEA REC HAL SHO
DWH
SWH
Figure 6469: Monitored vessel PB014NA and PB024AM: operational parameter fuel rate q[l/h] through vessel speed S[kn], obtained during different fishing operations. Thick lines correspond to two different fishing grounds: Deep Water Hauls, DWH; and Shallow Water Hauls, SWH. Acronyms of the operational parameters are reported in Table 6497.

330 of 425 Report Number C002/08
This adaptation demonstrated that significant optimisation in fuel consumption can be obtained in the short4term for two Italian coastal fish trawlers. Fuel savings of up to 5410% were obtained by bringing the navigation speed close to the ‘critical speed’ (Table 64103).
6.8.5.8.2 Investment required for the adaptation (* 1000 €)
The investment for one complete CorFu4m system, which is made up of two mass flow sensors one Multi Channel Recorder, including the electric and mechanic fitting works with installation and system tests is estimated at 5.55 KEUR. The costs in details are reported in Table 64102 below:
Table 64102: CorFu4m investment costs for a commercial fishing vessel.
Description Qty
Nr.
Cost Unit.
[k€]
Total Cost
[k€]
Mass flow sensors (Mod. Promass 40E DN 8 3/8") 2 1.96 3.92
Multi Channel Recorder (Mod. Ecograph T RSG30) 1 1.01 1.01
Electric fitting 1 0.38 0.38
Mechanic fitting 1 0.24 0.24
Total 5.55
Table 64103: Technical adaptation Nr. 3 of segment OTM 24440 m.
Technical information
Fuel saving in % to annual fuel use 10%
Estimated investments (*1000 €) 5.55
Estimated impact on CPUE(%) None
6.8.5.8.3 Effect on income (LPUE, landings per unit of effort)
LPUE is not affected by installing the fuel monitoring system.

Report Number C002/08 331/425
6.8.5.9 Short description of Adaptation No 5 The reference vessel Nr. 2 was simulated with an optimised hull shape. There is no additional cost if a new vessel is conceived during the shipbuilding.
6.8.5.10 Effects of Adaptation No 5
6.8.5.10.1 Fuel consumption – Output of GES�model runs
Table 64104: Technical adaptation Nr. 3 of segment OTM (24440 m).
Technical information Value
Fuel saving in % to annual fuel use 22
Estimated investments (1000 €) No major
costs
Estimated impact on CPUE(%) none
6.8.5.11 Short description of Adaptation No 6 The reference vessel Nr. 2 was fitted and simulated with a bulbous bow. There is an additional investment cost of 50 k€.
6.8.5.12 Effects of Adaptation No 6
6.8.5.12.1 Fuel consumption – Output of GES�model runs
A simulation was run with reference vessel Nr. 2 fitted with a bulbous bow. There is an additional investment cost of 50 k€. The baseline resistance is replaced with a resistance bulb model. The resistance is first tuned to the ship resistance curve.
6.8.5.13 Effects of Adaptation No 6
Table 64105: Effect on fuel consumption and gaseous emissions of fitting a bulb
Item Baseline Baseline Bulb % Reduction
Fuel [ton/yr] 189.12 177.23 6.29
CO2 [ton/yr] 492.97 464.78 5.72
SOx [ton/yr] 3.78 3.54 6.29
NOx [ton/yr] 7.94 7.75 2.40
HC [ton/yr] 5.47 4.90 10.48
CO [ton/yr] 54.84 50.07 8.69
The transverse bulb area is 0.8 m2. The reduction in fuel consumption caused by this bulb is about 6%.

332 of 425 Report Number C002/08
Table 64106: Technical adaptation Nr. 3 of segment OTM (24440 m).
Technical information Value
Fuel saving in % to annual fuel use 6
Estimated investments (1000 €) 50
Estimated impact on CPUE(%) none
6.8.5.14 Short description of Adaptation No 7 The reference vessel is fitted with a lower pitch in fixed pitch propeller (FPP). Setting a lower pitch in this FPP was investigated as an alternative. There is an additional investment cost of 2.5 k€.
6.8.5.15 Effects of Adaptation No 7
6.8.5.15.1 Fuel consumption – Output of GES�model runs
Item Controllable pitch propeller Fixed propeller Emission reduction %
Fuel [ton/yr] 169.38 161.70 4.53
CO2 [ton/yr] 445.61 432.18 3.01
SOx [ton/yr] 3.39 3.23 4.53
NOx [ton/yr] 7.55 7.90 44.52
HC [ton/yr] 4.55 1.61 64.74
CO [ton/yr] 47.20 46.24 2.04
The CP propeller is not optimally controlled, so a reduction of 4.5% in fuel consumption is possible to control the ship speed with the diesel engine!
Table 64107: Technical adaptation Nr. 3 of segment OTM (24440 m).
Technical information Value
Fuel saving in % to annual fuel use 0.9
Estimated investments (1000 €) 2.5
Estimated impact on CPUE(%) none
6.8.5.16 Short description of Adaptation No 8 The reference vessel is fitted with a larger propeller diameter. Fitting a larger propeller diameter was investigated as an alternative. There is an additional investment cost of 35 k€, which is given by a new propeller: 10 k€; a new Gear box: 20 k€; and Shafting devices: 5 k€.
6.8.5.17 Effects of Adaptation No 8
6.8.5.17.1 Fuel consumption – Output of GES�model runs

Report Number C002/08 333/425
The reference vessel is fitted with a larger propeller diameter. The standard diameter for the baseline is 2.00 m. The propeller is replaced with 2.05 m and 2.10 m diameter.
Table 64108: Effect on fuel consumption and gaseous emissions of enlarging propeller diameter from 2.00 to 2.05 and 2.10 m
Item Baseline 2.00 diameter 2.05 diameter 2.10 diameter % reduction 2.05 % reduction 2.10
Fuel [ton/yr] 169.38 162.44 153.66 4.09 9.28
CO2 [ton/yr] 445.61 427.79 404.87 4.00 9.14
SOx [ton/yr] 3.39 3.25 3.07 4.09 9.28
NOx [ton/yr] 7.55 7.34 7.01 2.89 7.15
HC [ton/yr] 4.55 4.31 4.03 5.30 11.51
CO [ton/yr] 47.20 45.12 42.64 4.42 9.67
A 4.1% reduction in fuel consumption is possible with the 2.05 m diameter propeller instead of the standard propeller, and a 9.3% reduction when taking 2.10 m. It should be noted that we did not check whether these larger propeller would cavitate. The clearance between the propeller tips and the hull must be 0.2*diameter propeller, and tip speed of the propeller less than 36 m/s.
Table 64109: Technical adaptation Nr. 3 of segment OTM (24440 m).
Technical information Value
Fuel saving in % to annual fuel use 4
Estimated investments (1000 €) 35
Estimated impact on CPUE(%) none
6.8.5.18 Short description of Adaptation No 9
6.8.6 Hull cleaning can help to reduce the water resistance of the vessel.
6.8.6.1 Effects of Adaptation No 9
6.8.6.1.1 Fuel consumption – Output of GES�model runs
We have no data on the roughness produced by an anti4fouling coating on the hull at this moment, but variation of the hull roughness from 130 micron to 280 micron is used in the calculations. The baseline was assumed to have a roughness of 200 micron, while 130 micron is when cleaned and 280 micron is assumed for the fouled condition.
Table 64110: Effect on fuel consumption and gaseous emissions of cleaning the hull
Increased roughness factor
Baseline
200 micron 130 micron 280 micron
% Reduction
130 micron
% Reduction
280 micron
Fuel [ton/yr] 169.38 167.70 170.86 0.99 �0.88
CO2 [ton/yr] 445.61 441.42 449.31 0.94 40.83
SOx [ton/yr] 3.39 3.35 3.42 0.99 40.88
NOx [ton/yr] 7.55 7.50 7.60 0.66 40.56
HC [ton/yr] 4.55 4.49 4.62 1.47 41.32
CO [ton/yr] 47.20 46.64 47.71 1.19 41.07

334 of 425 Report Number C002/08
Between 280 micron and 130 micron roughness is a fuel saving of 1.8% was found.
6.8.7 Summary table of adaptations for reference vessels IT
The effect of adaptations under study on fuel savings, investment costs and landings (earnings) is given in the table below. Based on various scenarios of fuel price, and taking account the effect on landings and consequently earnings, the overall economic viability of these solutions are appraised (See Chapter Error! Reference source not found.).
Table 64111: Summary of effects on fuel savings, investment costs, and landings for adaptations studied
No Adaptation Potential Fuel Saving (%) Investment Costs (€) Effect on LPUE (%)
1 Gear drag reduction by redesigned
fishing gear (Reference Vessel 1)
9 1500 none
2 Replacing single by twin trawl
(Reference Vessel 1)
none 3000 +30
3 Replacing a FPP by a CPP
(Reference Vessel 1)
4.5 30000 none
4 Fuel measurement system
(Reference Vessel 2)
10 5500 none
5 Optimized hull shape
(Reference Vessel 2)
22 Applicable only in new
vessels: no major costs
none
6 Bulbous bow
(Reference Vessel 2)
6 50000 none
7 Lower pitch in FPP
(Reference Vessel 2)
0.9 2500 none
8 Larger propeller diameter
(Reference Vessel 2)
4 35000 none
9 Hull cleaning
(Reference Vessel 2)
1.8 1500 none
6.8.8 References
Basañez J, 1975. Resultados obtenidos en arrastreros com helices en tobera. Canal de experiencias hidrodinamicas, El Pardo. Publicación núm. 53. Madrid, p. 21.
Buglioni G, Lucchetti A, Sala A, 2006. Development of single4boat pelagic trawl for a responsible management of the marine resources. Final Report to the Marche Regional Authority, Fishery and Hunt directorate, (Project SFOP n. 03 MI 020505): 37 pp.
Cingolani N, Santojanni A, Arneri E, Belardinelli A, Colella S, Donato F, Giannetti G, Sinovcic G, Zorica B, 2004: Anchovy (Engraulis encrasicolus, L.) stock assessment in the Adriatic Sea: 1975–2003, 2004, Paper presented at the GFCM4SAC Working Group on Small Pelagic Species, 2004.
Draper NR, Smith H, 1966. Applied regression analysis. Wiley, New York: 407 pp. European Commission, 2006. Communication from the Commission on Improving the Economic Situation in the Fishing Industry—COM (2006) 103.
Kasper E, 1983. Model tests of application of bulbous bows to fishing vessels. In: Paper No. III42 Presented at the International Symposium on Ship Hydrodynamics and Energy Saving. Canal de experiencias hidrodinamicas, El Pardo, p. 13.
Laevastu T, Favorite F, 1988. Fishing and stock fluctuations. Fishing News Books Ltd, Farnham, U.K. 239 pp.

Report Number C002/08 335/425
Leblanc MJ, 2005. De´monstration sur l’utilisation de biodiésel et de biolubrifiants en mécanique marine (BioPêche). Rapport final de project. Centre Collégial de Transfert de Technologie des Pêches (CCTTP), p. 23.
Messina G, Corsini P, 1997. A fuel consumption based method to measure the fishing effort. Report CE project 97/0073 – Final Report: 193 pp.
O’Dogherty P, Nuñez, JF, Carlier M, O’Dogherty M, 1981. Nuevas tendencies en el proyeto de buques pesqueros. Canal de experiencias hidrodinamicas, El Pardo. Publicación n. 67. Madrid, p. 12.
Parente J, Fonseca P, Henriques V, Campos A, 2008. Strategies for improving fuel efficiency in the Portuguese trawl fishery. Fisheries Research 93: 1174124.
Sala A, 2002. Development of fuel saving bottom trawl. Report of the ICES Fisheries Technology Committee Working Group on Fishing Technology and Fish Behaviour, Séte (France), ICES CM 2002/B.01: 53 pp.
Sala A, Buglioni G, Lucchetti A, Cosimi G, Palumbo V, 2005. Environmental impact reduction of the Italian bottom trawling: twin trawls experiment. Final Report to the Marche Regional Authority, Fishery and Hunt directorate, (Project SFOP n. 03 MI 210604 Bis): 97 pp.
Sala A, Lucchetti A, Piccinetti C, Ferretti M, 2008a. Size selection by diamond4 and square4mesh codends in multi4species Mediterranean demersal trawl fisheries. Fisheries Research, 93: 8–21.
Sala A, Hansen K, Lucchetti A, Palumbo V, 2008b. Energy saving trawl in Mediterranean demersal fisheries. In Guedes Soares & Kolev (eds) Ocean Engineering and Coastal Resources. Taylor & Francis Group, London, ISBN 97840441544552347: 9614964.
Sala A, Lucchetti A, Palumbo V, Giuliani G, 2008c. Technological innovations for the Energy saving in fishery. The Fishery News Sheet, 05: 647 (in Italian).
Santojanni A, Arneri E, Barry C, Belardinelli A, Cingolani N, Giannetti G, Kirkwood G, 2003. Trends of anchovy (Engraulis encrasicolus, L.) biomass in the northern and central Adriatic, Sci. Mar., 67(3), 327–340.
Santojanni A, Arneri E, Bernardini V, Cingolani N, Di Marco M, Russo A, 2006. Effects of 10 environmental variables on recruitment of anchovy in the Adriatic Sea, Clim. Res.
Spagnolo M, Accadia P, 2006. Socio4economic indicators for the Adriatic Sea demersal fisheries. IIFET 2006 Portsmouth Proceedings.
Stewart, PAM, 2002. A review of studies of fishing gear selectivity in the Mediterranean. FAO COPEMED, 57 pp. Verhulst N, Jochems J, 1993. Final Confidential report for the project TE41.102 hp NET'92 research project financed by the Commission of the European Communities within the frame of the EEC research programme in the fisheries sector ( "FAR" ).
Wileman D, 1984. Project “Oilfish”. Investigation of the Resistance of Trawl Gear. The Danish Institute of Fisheries Technology, p. 42.
Wileman D, Hansen K, 1988. Estimation of the drag of trawls of known geometry. The Danish Institute of Fisheries Technology and Aquaculture.

336 of 425 Report Number C002/08
Netherlands Segment (gear, length, power): TBB, 24440 m, 1471 kW (2000 hp) Participant: IMARES, TNO4CMC Author(s): B. van Marlen, J. van Vugt
6.8.9 Reference design: TBB, 24440 m
6.8.9.1 Vessel
Figure 6470: Picture of the reference vessel (Vessel ID deleted)
Table 64112 : Main particulars of the reference vessel Item Value
Year built 1987
Length over all (m) 42.10
Breadth (moulded, m) 8.50
Depth (m) 4.60
Mean draft (m) 4.00
Main engine power (kW) 1471
Main target species Plaice, sole, turbot, dab, etc.
Reference vessel No 1 is a conventional beam trawler commonly used in the Dutch fleet and built in 1987. Her power is limited to 2000 hp (1471 kW), according to EU Regulation 850/88. Normally conventional tickler chain beam trawls are used. The maximum beam length (gear width) is 12 m. A new Wärtsilä main engine was installed in 2004. The skipper has actively reduced energy consumption by adapting the gears and slowing down, both while steaming and towing. The vessel is fitted with a conventional fixed pitch propeller (FPP) of 3.0 m diameter with a nozzle.

Report Number C002/08 337/425
6.8.9.2 Gear Table 64113 Main particulars of fishing gear of the reference vessel Item Value
Gear code (e.g. TBB, OTB, OTM, …) TBB
Type description Conventional beam trawls with tickler chains
Otter boards (type, size, and weight) n/a
Main gear dimensions (circumference, beam width, (m)) 12
Headline length (m) 11.5
Footrope length (m) 26
Cod end mesh size (mm) 100?
Comments None
In the baseline condition conventional tickler chain 12 m beam trawls were used, with 9 tickler chains running from the trawls shoes of 23 mm diameter, 7 net tickler chains of 13 mm, and 4 additional ticklers (24, 2*18 and 16 mm). At the centre of the footrope a roller of 650 kg and length 7.80 m is used in the center. To improve the catch of sole a ‘sole4flap’ was used to avoid escapement underneath the footrope. The total weight of a convent4ional beam trawl is estimated at 1500 kgf.
6.8.9.3 Operational profile A range of vessels supplied data in a cooperation scheme with IMARES, called the ‘F4project’. These data were analysed to retrieve relative times of steaming, gear handling and fishing for two segments (24440 m and > 40 m), resulting in the following division (See table below).
Table 64114: Distribution of operations within sea trips in the Dutch fleet
Weighted averages
rounded to 100%
fishing steaming floating total
L = 24 4 40m (9 boats,
151 trips)
60 10 30 100.0
L > 40 m (12 boats,
274 trips)
54.5 12 33.5 100.0
Data was collected over a number of years (200242007) on commercial beam trawlers, but the variation was not large in recent years, as can be seen in the figures below.

338 of 425 Report Number C002/08
Time spent fishing, steaming and floating (24-40 m)
0%
20%
40%
60%
80%
100%
2002 2003 2004 2005 2006 2007
Year
%
f ish_pct steam_pct f loat_pct
Figure 6471: Division of time as a function of operational mode for 200242007 and the range of vessels with Loa = 24 – 40 m.
Time spent fishing, steaming and floating (>40 m)
0%
20%
40%
60%
80%
100%
2003 2004 2005 2006 2007
Year
%
f ish_pct steam_pct f loat_pct
Figure 6472: Division of time as a function of operational mode for 200242007 and the range of vessels with Loa > 40 m.
The following division was calculated on a yearly basis and taken for the GES4analyses. The base line operational profile of a Dutch beam trawler was determined by TNO, and compares well with the data given above.

Report Number C002/08 339/425
Table 64115: Operational profile for the base line
Name Duration Distance Velocity
[4] [hrs] [nm] [kn]
Harbour 4404.00 44.04 0.01
Steaming to fishing ground 198.00 2079 10.50
Shooting gears 198.00 693 3.50
Fishing 3366.00 21879 6.50
Hauling gears 198.00 693 3.50
Steaming to harbour 198.00 2079 10.50
Harbour operation 198.00 1.98 0.01
6.8.9.3.1 Efficiencies – Output of GES�model runs for the base line reference vessel
For this profile we find the following results:
Efficiency [-]
0
0.02
0.04
0.06
0.08
0.1
0.12
0.14
0.16
0.18
0.2
Har
bour
Ste
amin
g to
fish
ing
grou
nd
Fre
e ge
ars
Fis
hing
Pul
l gea
rs
Ste
amin
g to
harb
our
Har
bour
ope
ratio
n
Efficiency [-]Title:FD 281, Technology:2008Run date:06-10-2008/13:20:23Input file:COMOutput file:Results.csvResults file:ResultsOutput.csv
Figure 6473: Efficiency of the installation by operational mode for the base line
This ship has a relative high efficiency in the fishing mode compared with the steaming mode.
6.8.9.4 Evaluation of the state of technology The vessel is deemed to have a reasonably modern state of technology, representative for the segment of Loa 24440m although her Loa is slightly larger, with an engine power of 1471 kW (2000 hp).

340 of 425 Report Number C002/08
6.8.9.5 Catch Figures over 2007 were supplied by the skipper, showing a range of target species, mainly flatfish (plaice, sole, turbot and dab). The overall Gross Earnings were in order of magnitude of 3 M€.
6.8.9.6 Energy performance
6.8.9.6.1 Fuel consumption
Anecdotal information was provided by the skipper. The trip duration is often taken at 9 days. The fuel consumption was about 66000 litre per nine day trip, some 300 ltr/h. The total yearly fuel consumption lies in the order of magnitude of 1.4 M litre, and the skipper aims to reduce this with 0.4 M litres. The towing speed was about 6.4 kts, and the steaming speed 11 kts. The calculation of the base line case with the operational profile given in Table 64115 gives a yearly fuel consumption of 1027.56 tonnes (1 tonne = 100 kg). Using the factor 1 ltr = 0.835 kg fuel, we find a yearly consumption of 1.231 M litre, a bit lower than the skipper reported.
6.8.10 Adaptations under study – Adaptation No 1: HydroRig
6.8.10.1 Short description of Adaptation No 1 The gear of this vessel was adapted to lower drag and speed, using an hydrofoil for deflecting the flow downward and producing a lift force, designed by the skipper himself (Figure 6474).
Figure 6474: First design of HydroRig tested in June 2008

Report Number C002/08 341/425
The normal tickler chain arrangement was altered in a sort of light chain mat attached with four ‘shark teeth’ to the belly. A centre trawl shoe was added, but the three shoes were reduced in weight and width. The footrope was also made lighter and the heavy bosom roller taken out. Fishing with this modification is done with a reduced towing speed. In addition the speed while steaming to and from the fishing grounds was reduced with 0.5 kts. The gear is still under development and new versions are under test in the fall of 2008 in the Dutch project HydroRig.
6.8.10.2 Effects of Adaptation No 1
6.8.10.2.1 Efficiencies – Output of GES�model runs
For the modified HydroRig4gear the results are as follows:
Efficiency [-]
0
0.02
0.04
0.06
0.08
0.1
0.12
0.14
0.16
0.18
0.2
Har
bour
Ste
amin
g to
fish
ing
grou
nd
Fre
e ge
ars
Fis
hing
Pul
l gea
rs
Ste
amin
g to
harb
our
Har
bour
ope
ratio
n
Efficiency [-]Title:FD 281, Technology:2008Run date:06-10-2008/13:59:21Input file:COMOutput file:Results.csvResults file:ResultsOutput.csv
Figure 6475: Efficiency of the installation by operational mode for Adaptation 1
The efficiency of the installation for fishing is higher.
6.8.10.2.2 Effect on energy consumption (% change) – Output of GES�model runs
Anecdotal information about the performance of the first design was provided by the skipper in July 2008. The trip duration was 9 days. The fuel consumption using the first design of the HydroRig went back from about 66000 litre to about 44000 litre (ratio 0.667), from some 300 ltr/h to about 200 ltr/h. The total yearly fuel consumption in conventional beam trawling lies in the order of magnitude of 1.4 M litre, and the skipper aims to reduce this with 0.4 M litres. The engine runs at a lower r.p.m. about 1304150 less, with lower cylinder pressure, requiring adjustments to the blower. A cruise control was installed. The towing speed was dropped from about 6.4 to about 5.3 kts, and the steaming speed to 10.5 kts.

342 of 425 Report Number C002/08
In a later report after the first series of trials with the new version of the HydroRig in September 2008, the following records were given by the skipper. Based on a five day week trip the fuel used is in the order of magnitude of 20000 litre, while conventional vessels operate at present in the range of 30000 litre per week. This would again mean a ratio of fuel consumption of 0.667. Logbook data for the reference vessel in 2007 resulted in the following operational profile:
Table 64116: Time division over activities in 2007 for the reference vessel
Operational profile reference vessel 2007 minutes days (24 h) percentage Steaming 29685.00 20.6 5.6% Estimated time shooting and hauling gears at 15% 36032.25 25.0 6.9% Fishing 204182.75 141.8 38.8% Port, weekends, bad weather, holidays 255700 177.6 48.6% 525600.0 365.0 100.0%
Table 64117: Operational profile of Dutch reference vessel
Name Duration Distance Velocity
[4] [hrs] [nm] [kn]
Harbour 4266.12 42.6612 0.01
Steaming 490.56 5150.88 10.50
Shooting and hauling gears 604.44 2115.54 3.50
Fishing 3398.88 22092.72 6.50
The table below shows the comparison of the base line situation with the HydroRig gear without any reduction in fishing speed.
Table 64118: Fuel consumption and gaseous emissions for base line and HydroRig
Item Base line consumption HydroRig consumption % reduction
Fuel [ton/yr] 1075.62 997.10 7.30
CO2 [ton/yr] 2788.41 2540.86 8.88
SOx [ton/yr] 21.51 19.94 7.30
NOx [ton/yr] 49.17 44.66 9.19
HC [ton/yr] 35.72 36.17 41.25
CO [ton/yr] 312.52 311.60 0.30
For this operational profile the HydroRig gives a fuel reduction of 7.3% when the towing speed is kept the same.
6.8.10.2.3 Investment required for the adaptation (* 1000 €)
The additional investment of modifying existing trawls into the HydroRig4version is estimated at 10000 € for hydrofoils, placed over a conventional beams (Personal communication, Roelof van Urk, VCU4TCD, Sep 2008).
6.8.10.2.4 Effect on income (LPUE, landings per unit of effort)
The skipper reported lower catches and earnings, but reminded that the gear is still in its developing phase. In the time of trials the earnings were in the order of magnitude of 75% of those reached on conventional beam trawlers.

Report Number C002/08 343/425
6.8.11 Adaptations under study – Adaptation No 2 – Pulse Trawl
6.8.11.1 Short description of Adaptation No 2 The background of the pulse trawl system is described in the section on alternative stimulation above. The adaptation consist of a complete system of two winches with feeding cables, connected to pulse trawls. These trawls feature a container with underwater electronics, an array of electrodes in the belly of the net in front of the footrope, and an adjusted net behind it.
6.8.11.2 Effects of Adaptation No 2
6.8.11.2.1 Effect on energy consumption (% change) – Output of GES�model runs
Warp load measurements were done during the development of the pulse trawl at certain stages as explained above. For a 7 m variant these measurements resulted in a reduction in drag of about 25% (See Chapter 6 Collection of data from national projects). The fuel consumption per week on average for the four BT4vessels was 34277 liters, and for the pulse trawl PT4boat 18885 liters, a ratio of 0.551 or a change of 444.9% (Hoefnagel and Taal, 2008, See Chapter 6). This value can be used as a proxy for the energy saving potential of the 12 m pulse trawl, mainly caused by its lower drag and towing speed. The pulse beam trawls are fished with 5.5. kts vs. 647 kts for the conventional beam trawls. The following operational profile is used for studying a reduction of fishing speed from 6.5 to 5.5 kts.
Table 64119: Operational profile for effect of fishing speed
Name Duration Distance Velocity
[4] [hrs] [nm] [kn]
Harbour 4266.12 0 0.0
Steaming 490.56 5150.88 10.50
Shooting and hauling gears 604.44 2115.54 3.50
Fishing 3398.88 18693.84 5.50
For the pulse trawl the gear resistance was reduced with 25% as indicated by the measurements given in Section 5.2.1.3.
Table 64120: Effect on fuel consumption and gaseous emissions of introducing a pulse trawl system at a towing speed of 5.5 kts
[ton/yr]
Base line
6.5 kts
Pulse Trawl
5.5kts
Pulse Trawl
% reduction
Fuel 1075.62 703.48 34.60
CO2 2788.41 1796.26 35.580
SOx 21.51 14.07 34.60
NOx 49.17 39.51 19.65
HC 35.72 23.01 35.57
CO 312.52 222.54 28.79

344 of 425 Report Number C002/08
If the gear is replaced by a pulse trawl configuration than a reduction in fuel consumption of 34.6% is predicted using the GES model, which is lower than the figures reported by Hoefnagel and Taal, 2008.
6.8.11.2.2 Investment required for the adaptation (* 1000 €)
The investment in a complete system for pulse trawling, including winches and feeding cables, with installation and system tests is estimated at 440000 €, with an estimated yearly costs of 150000 € in depreciation, interest and maintenance and repair, minus a saving in existing gear costs of about 20% due to the lower towing speed (Hoefnagel and Taal, 2008).
6.8.11.2.3 Effect on income (LPUE, landings per unit of effort)
A comparison of landings was done on various trips for the 12 m variant and described above. The performance of 12 m pulse trawls in terms of catches (landings and discards) between a vessel fishing with two pulse beam trawls, and vessels fishing with the conventional beam trawls was compared in 2005 and 2006. The main findings of the comparison were that landings of plaice and sole were significantly lower, i.e. about 68% (See Chapter 6). However the pulse trawl vessel managed to improve her catch efficiency over the year 2006 due to gained experience with the new technique. The Gross Revenue per week was for the BT4vessels on average 29780 € and for the pulse trawl 23087 €, a ratio of 0.775 (Hoefnagel and Taal, 2008, See Chapter 6).
6.8.12 Adaptations under study – Adaptation No 3: Larger fixed propeller in a nozzle
6.8.12.1 Short description of Adaptation No 3 Applying a larger propeller diameter helps to improve her efficiency. The possibility depends of course on the clearances the existing propeller has in the aperture. The reference vessel has a fixed pitch propeller (FPP) in a nozzle. A nozzle is a specially shaped duct around the propeller, that increases the propeller efficiency, thus providing more thrust for the same engine power delivered to the propeller shaft. We increased the diameter of the propeller from 3.0 m to 3.4 m (as indicated possible by the skipper) to study the effect. Note that we did not check cavitation on the new propeller.
6.8.12.2 Effects of Adaptation No 3
6.8.12.2.1 Effect on energy consumption (% change) – Output of GES�model runs
Table 64121: Effect on fuel consumption and gaseous emissions of increasing propeller diameter from 3.0 to 3.4 m
[ton/yr] Base line
HydroRig
3.0 m
Base line
3.4 m
HydroRig
3.4 m
HydroRig
3.0 m
% change
Base line
3.4 m
% change
HydroRig
3.4 m
%
reduction
Fuel 1075.62 997.10 983.05 910.49 7.30 8.61 15.35
CO2 2788.41 2540.86 2496.81 2294.70 8.88 10.46 17.71
SOx 21.512 19.94 19.6611 18.21 7.30 8.61 15.35
NOx 49.17 44.66 43.05 41.15 9.19 12.45 16.31
HC 35.719 36.17 29.60 27.07 41.25 17.13 24.21
CO 312.52 311.60 324.57 312.63 0.30 43.86 40.035

Report Number C002/08 345/425
The results are given in Table 64121 for the various alternatives in comparison with the base line situation. Increasing the diameter of the propeller from 3.0 to 3.4 m improve fuel consumption by 8.61% for the base line situation, and for the HydroRig by 15.35%.
6.8.12.2.2 Investment required for the adaptation (* 1000 €)
A telephone call was made to the company Van Voorden Ltd. in The Netherlands, supplying many propellers for the Dutch fishing industry (Personal communication: A. Bijer, Van Voorden Ltd., Zaltbommel, The Netherlands, tel.: + 31 418 571 200). This resulted in the prices and ratios given below.
Table 64122: Prices for propellers given by Van Voorden Ltd., Oct 2008
Item
diameter in
m
price
( * 1000 € )
ratio for
increase in
diameter
price of FPP +
nozzle
( * 1000 € )
ratio for
increase in
diameter for
FPP + nozzle
FPP 3 36.800 1.24 78.800
FPP 3.4 45.550 1.22
nozzle 3 42.000 1.21 96.350
nozzle 3.4 50.800
Item diameter in m ratio
(FPP+nozzle)/FPP 3 2.14
(FPP+nozzle)/FPP 3.4 2.12
6.8.12.2.3 Effect on income (LPUE, landings per unit of effort)
In this case it is assumed that LPUE is not affected by installing a larger propeller, although with the higher towing power a higher towing speed may be obtained.
6.8.13 Adaptations under study – Adaptation No 4: Lower steaming speed
6.8.13.1 Short description of Adaptation No 4
Apart from changing the gear design or the stimulating (pulse trawl) one can also aim at altering the speed with which the vessel sails to and from the fishing grounds. As the power4speed relationship of a ship can be very steep in the range of speeds used for steaming, a small decrease may lead to a substantial reduction of power needed, and thus savings. In fact most of the adaptations under study are based on speed reductions or involve speed reductions. Steaming with lower speed means that more time is needed to reach the port of destination. This may affect the selling price of fish. In addition it likely influences the time left for fishing, and thus will have a negative bearing on income. The balance between savings on one hand and loss of income on the other determines the economic

346 of 425 Report Number C002/08
effect of this measure. Nevertheless in practice many skippers report reverting to steaming at slower speeds and dropping some fishing time.
6.8.13.2 Effects of Adaptation No 4
6.8.13.2.1 Effect on energy consumption (% change) – Output of GES�model runs
As the power4speed relationship is mostly steep in the range of steaming speeds considerably fuel savings may result. We calculated the effect of slowing down when steaming from 11.0 to 10.0 kts.
Table 64123: Operational profile for effect of steaming speed
Name Duration Distance Velocity
[4] [hrs] [nm] [kn]
Harbour 4266.12 0 0.0
Steaming 490.56 5396.16 11 4 10
Shooting and hauling gears 604.44 2115.54 3.50
Fishing 3398.88 22092.72 6.50
Table 64124: Effect on fuel consumption and gaseous emissions of reducing steaming speed from 11 to 10 kts
Steaming 11�10
kts
Base line
11 kts
Base line
10 kts
HydroRig
11 kts
HydroRig
10 kts
Reduction
base line %
Reduction
HydroRig %
Fuel [ton/yr] 1080.77 1071.33 1002.25 992.81 0.87 0.94
CO2 [ton/yr] 2798.58 2779.77 2551.02 2532.21 0.67 0.74
SOx [ton/yr] 21.62 21.43 20.04 19.86 0.88 0.90
NOx [ton/yr] 49.06 49.31 44.54 44.79 40.51 40.56
HC [ton/yr] 36.16 35.39 36.61 35.83 2.13 2.13
CO [ton/yr] 315.51 310.10 314.58 309.17 1.71 1.72
6.8.13.2.2 Investment required for the adaptation (* 1000 €)
None.
6.8.13.2.3 Effect on income (LPUE, landings per unit of effort)
Some skippers decide to skip the last tow. Less fishing time may mean that income from catches is lost. A way of calculating the effect is to work out the extra time needed to get to the fishing grounds and back to port and multiply this with the average landed value per unit of time. Assuming weekly earnings of 80000 € based on 40 hauls, i.e. 2000 € per haul, than dropping the last haul would mean an earnings ratio of 78000/80000 = 0.975 for the lower speed. On the other hand some believe that skippers can adjust haul duration slightly to comp4ensate the effect.

Report Number C002/08 347/425
6.8.14 Adaptations under study – Adaptation No 5: Lower towing speed
6.8.14.1 Short description of Adaptation No 5
Apart from changing the gear design or the stimulating (pulse trawl) one can also aim at altering the speed with which the vessel tows her fishing gears. In fact most of the adaptations under study are based on speed reductions or involve speed reductions. For towed gears on the sea bed a reduction in towing speed may lead to a higher downward force and more friction on the bottom, as the lifting effect from gear drag diminishes. Therefore reducing towing speed is often accompanied by altering the weight of the gears to avoid gear fasteners.
6.8.14.2 Effects of Adaptation No 5
6.8.14.2.1 Effect on energy consumption (% change) – Output of GES�model runs
The following operational profile is used for studying a reduction of fishing speed from 6.5 to 5.5 kts.
Table 64125: Operational profile for effect of fishing speed
Name Duration Distance Velocity
[4] [hrs] [nm] [kn]
Harbour 4266.12 0 0.0
Steaming 490.56 5150.88 10.50
Shooting and hauling gears 604.44 2115.54 3.50
Fishing 3398.88 18693.84 5.50
For the pulse trawl the gear resistance was reduced with 25% as indicated by the measurements given in Chapter 4
Table 64126: Effect on fuel consumption and gaseous emissions of reducing fishing speed from 6.5 to 5.5 kts
[ton/yr] Base line
Base line
5.5 kts
HydroRig
5.5 kts
Pulse Trawl
5.5kts
Base line
% reduction
HydroRig
% reduction
Pulse Trawl
% reduction
Fuel 1075.62 907.89 854.10 703.48 15.59 20.59 34.60
CO2 2788.41 2280.27 2141.52 1796.26 18.22 23.20 35.580
SOx 21.51 18.16 17.08 14.07 15.59 20.59 34.60
NOx 49.17 41.00 39.97 39.51 16.61 18.72 19.65
HC 35.72 34.97 32.76 23.01 2.10 8.29 35.57
CO 312.52 300.81 285.59 222.54 3.75 8.62 28.79
If only the fishing speed is reduced from 6.5 to 5.5 kts a fuel reducing of 15.6% is possible (base line in Table). For the HydroRig lowering fishing speed as well leads to a decrease of 20.6% in fuel consumption. If the gear is replaced by a pulse trawl configuration than a reduction in fuel consumption of 34.6% is possible.

348 of 425 Report Number C002/08
6.8.14.2.2 Investment required for the adaptation (* 1000 €)
None. Lower towing speed might reduce costs for repair and maintenance of the gears, as lower speed means lower forces in and abrasion of the netting.
6.8.14.2.3 Effect on income (LPUE, landings per unit of effort)
An effect is that less ground is covered during a haul which may result in lower catches, but on the other hand ground contact may be firmer leading to a stronger stimulation for groundfish. In addition fish quality is likely to improve as fish is pressed to the netting with reduced force, which may lead to higher prices in the auction. These are two counteracting mechanisms, making a precise prediction difficult. It is assumed in the calculations that there is no effect on LPUE. In addition when looking at pulse trawling this system is designed to operate at a reduced towing speed of about 5.5 kts.
6.8.15 Summary Table of Adaptations for Reference Vessel NL
No Adaptation Potential Fuel Saving (%) Investment Costs (€) Effect on LPUE (%)
1 Gear drag reduction through hydrofoil
and lighter chains
7.3 10000 75
2 Pulse trawl at lower towing speed 35 to 45, take 40 440000, with an
estimated yearly costs of
150000
77.5
3a Larger propeller diameter in FPP with
nozzle using std gear
8.61 96350 (smaller FPP +
nozzle costing 78800
n/a
3b Larger propeller diameter in FPP with
nozzle using HydroRig
15.35 96350 (smaller FPP +
nozzle costing 78800) +
10000
n/a
4a Reduction steaming speed using std
gear
0.87 4 97.5
4b Reduction steaming speed using
HydroRig
0.94 10000 97.5
5a Reduction towing speed using std gear 15.59 4 n/a
5b Reduction towing speed using HydroRig 20.59 10000 n/a
6.8.16 References
6.8.16.1 Gear design and engineering studies Agricola, J.B., 1985. Experiments on electrical stimulation of flatfish in beamtrawling during 1984. ICES CM 1985/B:36.
Boonstra, G.P., and Groot, S.J. de, 1974. The development of an electrified shrimp trawl in the Netherlands. J. Cons. int. Explor. Mer. 35 (2): 1654170.
Broucke, G. Vanden, 1973. Further investigations on electrical fishing. ICES C.M. 1973/B:14. Fonteyne, R. and Polet, H., 2002. Reducing the benthos by4catch in flatfish beam trawling by means of technical modifications. Fisheries Research 55, 2194230.
Groenewold, S. and Fonds, M., 2000. Effects on benthic scavengers of discards and damaged benthos produced by beam4trawl fishery in the southern North Sea. ICES Journal of marine Science 57, no. 5, 139541406.
Groot, S.J. de, and Boonstra, G.P., 1970. Preliminary notes on the development of an electrical tickler chain for sole (Solea solea L.). ICES C.M. 1970/B:4.
Report Number C002/08 349/425
Hoefnagel, E. and Taal K., 2008. The economic performance and the environmental impact of the Pulse trawl in comparison to the conventional Beam trawl (Report EU4project DEGREE WP 5.1, March 2008).
Horn, W., 1976. Rationalization of sole fisheries by means of electrified beam trawls. In: Coun. Meet. ICES/B:7, Report of the Working Group on Research on Engineering Aspects of Fishing Gear, Vessels and Equipment.
Horton, R.S., 1984. Trials of the electric beam trawling system on MFV Zuiderkruis, summer 1983. SEAFISH Report IR 1180.
Jennings, S., and Kaiser, M.J., 1998. The Effects of Fishing on Marine Ecosystems. Adv. Mar. Biol. 34, 2214233. Kaiser and De Groot (editors), 2000, Effects of fishing on non4target species and habitats: biological, conservation and socio4economic issues. ISBN 0463240535540, 399 p.
Lindeboom H.J. and Groot, S.J. de (Eds.), 1998. The effects of different types of fisheries on the North Sea and Irish Sea benthic eco4systems. EU4project AIR24CT9441664 (IMPACT4II), Final Report ISSN 092343210, 404p.
Marlen, B. van, 1997. Alternative stimulation in fisheries. Final Report EU4project AIR34CT9441850, June 1997 Marlen, B. van, Lavieren, H. van, Piet, G.J., and Duijn, J.B. van, 1999. Catch comparison of a prototype 7 m electrical beam trawl and a conventional tickler chain beam trawl. RIVO internal report 99.006b, April 1999.
Marlen, B. van, 2000. Technical modifications to reduce the by4catches and impacts of bottom gears on non4target species and habitats. In: Kaiser and De Groot (editors), 2000, Effects of fishing on non4target species and habitats: biological, conservation and socio4economic issues. ISBN 0463240535540, p 2534268.
Marlen, B van, A.R. Boon, L.G. Oschatz, J.B van Duijn, M. Fonds, 2000. Experiments in 1999 on a 7 m beam trawl with electrical stimulation. RIVO4report C028/01, May 2001
Marlen, B. van, Bergman, M.J.N., Groenewold, S., and Fonds, M., 2001b. Research on diminishing impact in demersal trawling – The experiments in The Netherlands, ICES CM 2001/R:09
Marlen, B. van, Ybema, M.S., Kraayenoord, A., Vries, M. de en Rink, G., 2005. Catch comparison of a 12 m pulse beam trawl with a conventional tickler chain beam trawl. RIVO4Report C043b/05
Marlen, B. van, Vis, J.W. van de, Groeneveld, K., Groot, P.J., Warmerdam, M.J.M., Dekker, R., Lambooij, E., Kals, J., Veldman, M. and Gerritzen, M.A., 2005. Survival and physical condition of sole and plaice caught with a 12 m pulse beam trawl and a conventional tickler chain beam trawl. RIVO4report Nr. C044b/05
Marlen, B. van, Grift, R., O. van Keeken, M.S. Ybema, R. van Hal, 2006. Performance of pulse trawling compared to conventional beam trawling. RIVO4report Nr. C014/06
Marlen, B. van, Vis, H. v.d., Haan, D. de, Burggraaf, D., Heul, J. van der, Terlouw, A., 2007. The effect of pulse stimulation on biota – Research in relation to ICES advice – Progress report with preliminary results. IMARES Report No C098/07.
Quirijns, F.J., Pastoors, M.A. en Densen van, W.L.T., 2004. Catch and Effort data of plaice (and sole) in the North Sea: bringing different data sources together. Working document presented to ICES WGNSSK 2004.
Smaal, A.C., and E. Brummelhuis, 2005. Explorative studies of the impact of an electric fishing field on macro4benthos. RIVO Report No. C089b/05, pp 15.
Stewart, P.A.M., 1975. Catch selectivity by electrical fishing systems. J. Cons. int. Explor. Mer, 36 (2): 1064109. Stewart, P.A.M., 1978. Comparative Fishing for Flatfish using a Beam Trawl fitted with Electric Ticklers. Scottish Fisheries Research Report 11, ISSN 030848022, 10p.
Stralen, M.R. van, 2006. The pulse trawl – Developing alternative fishing gear for flatfish fisheries using an electrical stimulus – A summary. marinX4report 2005.26, pp 25.

350 of 425 Report Number C002/08
6.9 Belgium Segment (gear, length, power): TBB, 244404m, 956 kW (1300 hp) Participant: ILVO Author(s): K. Van Craeynest, J. van Vugt
6.9.1 Reference design: TBB 24440 m
6.9.1.1 Vessel
Figure 6476: Picture of the reference vessel (Vessel ID deleted)
Table 64127: Main particulars of the reference vessel
Item Value
Year built 2001
Length over all (m) 37.83
Breadth (moulded, m) 8.50
Depth (m) 4.70
Main engine power (kW) 938
Main target species Sole, plaice
The reference vessel is a conventional 37.83 m beam trawler equipped with a 1300 hp main engine. Built in 2001, it is one of the latest additions to the Belgian beam trawl fleet. The vessel has a conventional layout with 2 heavy outriggers on the front of the vessel, a large open working area in front of the wheelhouse and accommodation at the back. The 1300 hp diesel engine is coupled to a 6.3:1 reduction gearbox turning a 3.2 m diameter propeller fitted in a matching nozzle. The main particulars of the reference vessel are listed in Table 64127.

Report Number C002/08 351/425
6.9.1.2 Gear
cod-end
lazy decky
bridle
trawlhead
beam
headline
tickler chains
net tickler chains
groundrope
flatfish beam trawling - the tickler chain beam trawl
H. Polet - RVZ
chainmatrix
trawl headbeam
bridle
net
Figure 2: Tickler chain beam trawl (left) and chain matrix beam trawl (right)
Table 64128: Main particulars of fishing gear of the reference vessel
Item Value
Gear code (e.g. TBB, OTB, OTM, …) TBB
Type description Conventional beam trawls with tickler chains
Otter boards (type, size, and weight) n/a
Main gear dimensions (circumference, beam width, (m)) 11
Headline length (m) 11.2
Footrope length (m) 33
Cod end mesh size (mm) 80
Comments Large mesh netting is applied in the back of
the net in order to reduce drag
The vessel operates tickler chain beam trawls (V4nets, Figure 2) rigged to 11 m beams. The trawls are equipped with 6 tickler chains (18 mm) and 13 net tickler chains (11 mm). The cod end mesh size is 80 mm (sole is the main target species) and larger mesh netting is applied in the back of the net in order to reduce drag. The total weight (in air) of a single beam trawl is 6.5 tonnes. Alternatively, chain matrix beam trawls (R4nets, Figure 2) may be used.

352 of 425 Report Number C002/08
6.9.1.3 Operational profile Based on historical rights, the Belgian beam trawl fleet has access to fish quota spread over a variety of fishing grounds. Due to this, the reference vessel is operating in different areas throughout the year: Bay of Biscay, Irish Sea, Celtic Sea, Bristol Channel, English Channel, Southern and Central part of the North Sea. Catches are often landed in foreign ports to avoid wasting time and fuel steaming to distant grounds. Typically, the vessel will make 10 day trips, spending 3 days in harbour between trips. The vessel operates at a steaming speed of 10 kts, using 160 l/hr. Nowadays, fishing speed is 6 kts, before the sharp rise in oil prices, steaming speed was 11kts and fishing speed was 7 kts. On an average fishing day, 8 to 9 tows are made, with hauling and shooting times taking 15 to 20 min. The resulting operational profile is shown in Table 3.
Table 64129: Time split over operational modes
Operational mode Percentage of time%
Steaming to and from fishing grounds (including searching) 18
Shooting and hauling gears 9
Fishing 73
Table 64130: Operational profile for the base line reference vessel
Name Duration Distance Velocity
[4] [hrs] [nm] [kn]
Harbour 2560 0 0.0
Steaming to fishing ground 565 5650 10.0
Shooting gears 265 1590 6.0
Fishing 4540 27240 6.0
Hauling gears 265 1590 6.0
Steaming to port 565 5650 10.0
Harbour operation 0 0 0
6.9.1.4 Evaluation of the state of technology The reference vessel is one of the more modern representatives of the large beam trawlers in the Belgian fleet. It has a propulsion train with a modern diesel engine and a large diameter propeller (with matching nozzle) which should result in a better fuel economy compared to older vessels in the fleet. Next to this, the vessel is equipped with a fuel economy meter and cruise control, enabling the skipper to optimize fishing and steaming speed for increased fuel economy.
6.9.1.5 Catch In 2007, sole (31%), plaice (23%), rays (12%), monkfish (4%) and cod (4%) made up the bulk of the catch weight. In value, the importance of sole in the revenues is even more pronounced. A variety of 30 other species makes up the remaining 26% of the catch.
6.9.1.6 Energy performance
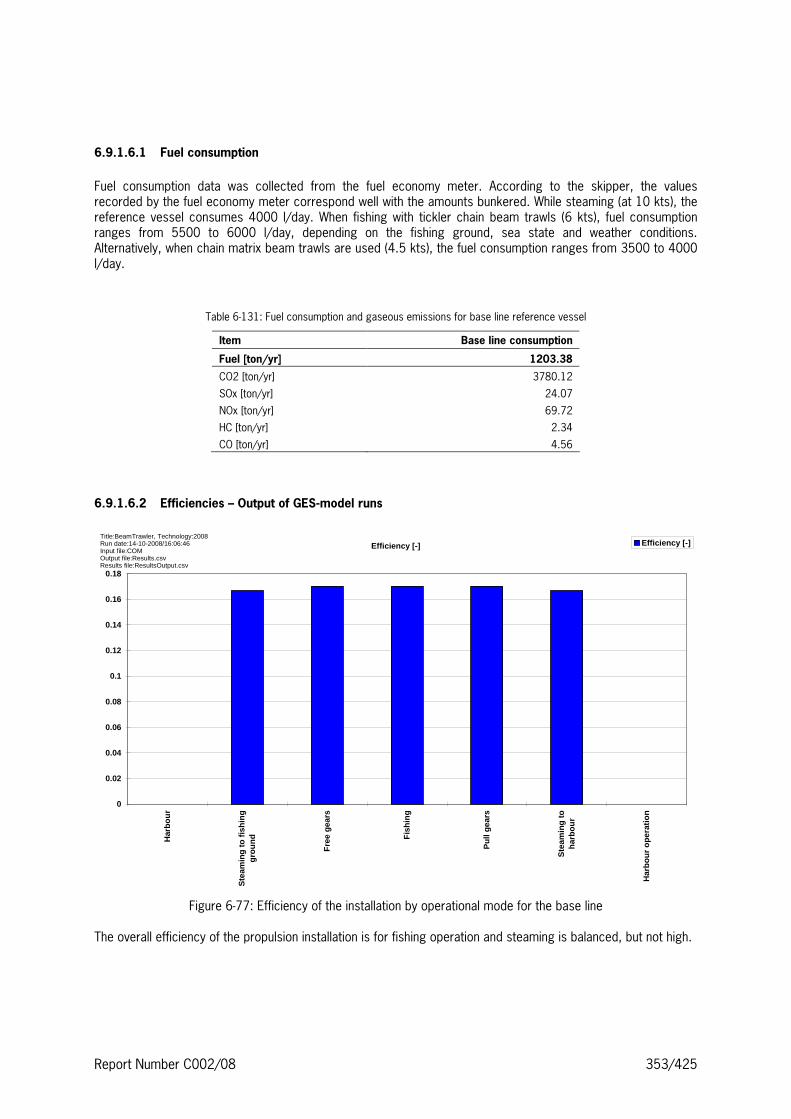
Report Number C002/08 353/425
6.9.1.6.1 Fuel consumption
Fuel consumption data was collected from the fuel economy meter. According to the skipper, the values recorded by the fuel economy meter correspond well with the amounts bunkered. While steaming (at 10 kts), the reference vessel consumes 4000 l/day. When fishing with tickler chain beam trawls (6 kts), fuel consumption ranges from 5500 to 6000 l/day, depending on the fishing ground, sea state and weather conditions. Alternatively, when chain matrix beam trawls are used (4.5 kts), the fuel consumption ranges from 3500 to 4000 l/day.
Table 64131: Fuel consumption and gaseous emissions for base line reference vessel
Item Base line consumption
Fuel [ton/yr] 1203.38
CO2 [ton/yr] 3780.12
SOx [ton/yr] 24.07
NOx [ton/yr] 69.72
HC [ton/yr] 2.34
CO [ton/yr] 4.56
6.9.1.6.2 Efficiencies – Output of GES�model runs
Efficiency [-]
0
0.02
0.04
0.06
0.08
0.1
0.12
0.14
0.16
0.18
Har
bour
Ste
amin
g to
fish
ing
grou
nd
Fre
e ge
ars
Fis
hing
Pul
l gea
rs
Ste
amin
g to
harb
our
Har
bour
ope
ratio
n
Efficiency [-]Title:BeamTrawler, Technology:2008Run date:14-10-2008/16:06:46Input file:COMOutput file:Results.csvResults file:ResultsOutput.csv
Figure 6477: Efficiency of the installation by operational mode for the base line
The overall efficiency of the propulsion installation is for fishing operation and steaming is balanced, but not high.

354 of 425 Report Number C002/08
6.9.1.6.3 Energy distribution – Output of GES�model runs
Operational Profile, Required Power [kW]
0
50
100
150
200
250
300
350
400
450
500
Har
bour
; 256
0 hr
/yr
Ste
amin
g to
fish
ing
grou
nd; 5
65 h
r/yr
Fre
e ge
ars;
265
hr/y
r
Fis
hing
; 454
0 hr
/yr
Pul
l gea
rs; 2
65hr
/yr
Ste
amin
g to
harb
our;
565
hr/
yr
Har
bour
ope
ratio
n;0
hr/y
r
Hotel_load
Gears
Propellers
Title:BeamTrawler, Technology:2008Run date:14-10-2008/16:06:46Input file:COMOutput file:Results.csvResults file:ResultsOutput.csv
Figure 6478: Required power of the installation by operational mode for the base line
The power consumption is highest when fishing. Under fishing conditions, the majority of the power is required for towing the gear, the vessel itself only uses a limited amount of power.
6.9.2 Adaptations under study – Adaptation No 1: Trawls in Dyneema™
6.9.2.1 Short description of Adaptation No 1 The traditional nylon netting material in the trawl was replaced with Dyneema™. This material exhibits a higher breaking force and a higher abrasion resistance. Hence, smaller diameter twine can be used and the trawl will consist of less netting material (70% weight reduction in netting material). This results in a reduction of the hydrodynamic drag of the netting material.
6.9.2.2 Effects of Adaptation No 1
6.9.2.2.1 Effect on energy consumption (% change) – Output of GES�model runs
Average fuel use per day was collected from the fuel economy meter. Baseline data was gathered from 18 different trips to three different fishing grounds (Irish Sea, Celtic Sea, Liverpool Bay, North Sea and Bay of Biscay) over a one year period (August 2007 to July 2008). An average fuel consumption of 5420 l/day with a standard deviation of 5% was observed over all trips. There were some differences between fishing grounds: 5315 l/day in Liverpool Bay, 5450 l/day in the Celtic Sea and 5590 l/day in the Bay of Biscay. Average warp loads were 6.7 tonnes with a standard deviation of 7% (per gear).

Report Number C002/08 355/425
After replacing the nylon netting with Dyneema™, the average fuel consumption per day dropped to 4940 l/day with average warp loads of 5.9 tonnes with a standard deviation of 6%, a drop of 11.9%. The data was collected over a series of four trips in the North Sea and the Celtic Sea (August 2008 to September 2008). There was no significant difference in fishing speed between the baseline trips and the Dyneema™ trips. If all baseline trips are included, a reduction of 8.8% in fuel consumption is observed.
Table 64132: Effect on fuel consumption and gaseous emissions of applying fishing gears with 12% less drag
Gear reduction Base line Gear with drag �12% % reduction
Fuel [ton/yr] 1203.38 1053.66 12.44
CO2 [ton/yr] 3780.12 3310.02 12.44
SOx [ton/yr] 24.07 21.07 12.44
NOx [ton/yr] 68.72 59.92 12.80
HC [ton/yr] 2.34 2.04 12.82
CO [ton/yr] 4.56 3.88 14.77
By taking only the propulsion installation into account the fuel reduction is about 12.4% for a gear resistance reduction of 12%.
6.9.2.2.2 Investment required for the adaptation (* 1000 €)
The price of Dyneema netting (56 €/kg) is markedly higher then that of nylon (8 €/kg). However, part of the price difference is compensated by a 70% weight reduction. The additional cost for Dyneema gear is 2600 € per trawl (5200 € for the two gears of the reference vessel).
6.9.2.2.3 Effect on income (LPUE, landings per unit of effort)
The skipper did not observe any differences in catch volume or catch composition.
6.9.3 Adaptations under study – Adaptation No 2 – Chain matrix vs. tickler chain beam trawl
Figure 3: Chain matrix beam trawl (rigged with roller gear (left), shooting (right))
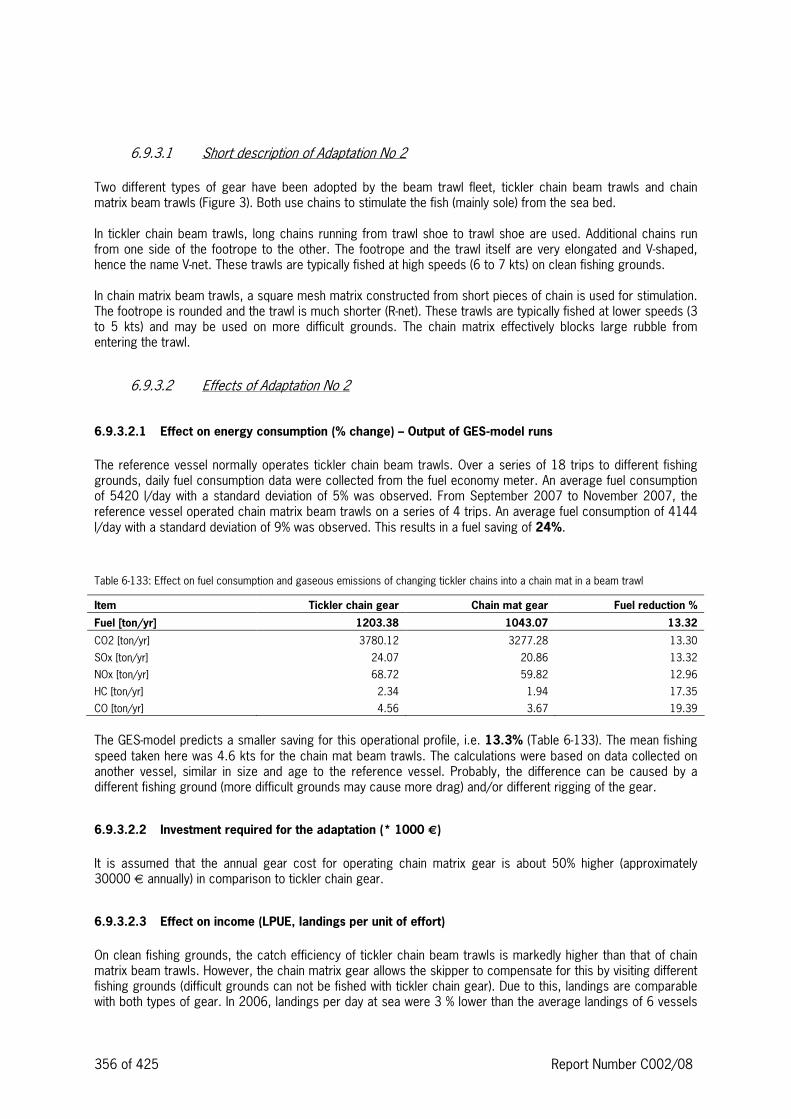
356 of 425 Report Number C002/08
6.9.3.1 Short description of Adaptation No 2 Two different types of gear have been adopted by the beam trawl fleet, tickler chain beam trawls and chain matrix beam trawls (Figure 3). Both use chains to stimulate the fish (mainly sole) from the sea bed. In tickler chain beam trawls, long chains running from trawl shoe to trawl shoe are used. Additional chains run from one side of the footrope to the other. The footrope and the trawl itself are very elongated and V4shaped, hence the name V4net. These trawls are typically fished at high speeds (6 to 7 kts) on clean fishing grounds. In chain matrix beam trawls, a square mesh matrix constructed from short pieces of chain is used for stimulation. The footrope is rounded and the trawl is much shorter (R4net). These trawls are typically fished at lower speeds (3 to 5 kts) and may be used on more difficult grounds. The chain matrix effectively blocks large rubble from entering the trawl.
6.9.3.2 Effects of Adaptation No 2
6.9.3.2.1 Effect on energy consumption (% change) – Output of GES�model runs
The reference vessel normally operates tickler chain beam trawls. Over a series of 18 trips to different fishing grounds, daily fuel consumption data were collected from the fuel economy meter. An average fuel consumption of 5420 l/day with a standard deviation of 5% was observed. From September 2007 to November 2007, the reference vessel operated chain matrix beam trawls on a series of 4 trips. An average fuel consumption of 4144 l/day with a standard deviation of 9% was observed. This results in a fuel saving of 24%.
Table 64133: Effect on fuel consumption and gaseous emissions of changing tickler chains into a chain mat in a beam trawl
Item Tickler chain gear Chain mat gear Fuel reduction %
Fuel [ton/yr] 1203.38 1043.07 13.32
CO2 [ton/yr] 3780.12 3277.28 13.30
SOx [ton/yr] 24.07 20.86 13.32
NOx [ton/yr] 68.72 59.82 12.96
HC [ton/yr] 2.34 1.94 17.35
CO [ton/yr] 4.56 3.67 19.39
The GES4model predicts a smaller saving for this operational profile, i.e. 13.3% (Table 64133). The mean fishing speed taken here was 4.6 kts for the chain mat beam trawls. The calculations were based on data collected on another vessel, similar in size and age to the reference vessel. Probably, the difference can be caused by a different fishing ground (more difficult grounds may cause more drag) and/or different rigging of the gear.
6.9.3.2.2 Investment required for the adaptation (* 1000 €)
It is assumed that the annual gear cost for operating chain matrix gear is about 50% higher (approximately 30000 € annually) in comparison to tickler chain gear.
6.9.3.2.3 Effect on income (LPUE, landings per unit of effort)
On clean fishing grounds, the catch efficiency of tickler chain beam trawls is markedly higher than that of chain matrix beam trawls. However, the chain matrix gear allows the skipper to compensate for this by visiting different fishing grounds (difficult grounds can not be fished with tickler chain gear). Due to this, landings are comparable with both types of gear. In 2006, landings per day at sea were 3 % lower than the average landings of 6 vessels

Report Number C002/08 357/425
operating chain matrix beam trawls (this falls within the standard deviation of 11%). However, switching from tickler chain beam trawls to chain matrix gear will require the skipper to adapt his fishing tactics (working different fishing grounds). It will take time to gain the knowledge and experience needed to efficiently operate the new gears. The wear on chain matrix gear is higher, resulting in higher maintenance costs.
6.9.4 Adaptations under study – Adaptation No 3 – Wheels replacing trawl shoes
Figure 4: Roller gear (tickler chain beam trawl (left) and chain matrix beam trawl (right))
6.9.4.1 Short description of Adaptation No 3 The trawl shoes of the beam trawl are fitted with wheels. In this way, the sliding resistance of the traditional sole plate is replaced with the (theoretically) lower rolling resistance of the wheels. The system appeared to work well on hard soils, but results on soft soils were unsatisfactory. Different configurations (single large wheel; large wheel with one or two smaller wheels; two large wheels) were tested to resolve this issue, with limited success. During one trip, a comparison experiment was set up on board of the reference vessel, with a traditional beam trawl on the starboard side and roller gear on the port side (both tickler chain gear). Next to the reference vessel, 10 more vessels have tested roller gear in combination with chain matrix gear over a period from August 2006 till now. Several vessels have adopted the roller gear and continued to use it after the test phase.
6.9.4.2 Effects of Adaptation No 3
6.9.4.2.1 Effect on energy consumption (% change) – Output of GES�model runs
On the reference vessel, lower warp loads were observed for the roller gear (6 tonnes) in comparison to the traditional gear (7.1 tonnes) when fishing on hard soils, a difference of 15.5%. This reduction in resistance should result in a reduction of fuel consumption of 11% (estimate). However, it was observed that on soft soils, resistance was higher. This may be explained by the wheels sinking deeper into the mud than the traditional sole plates that have a larger surface area.

358 of 425 Report Number C002/08
The other vessels (all operating chain matrix gear) reported an average fuel saving of 5% on hard soils.
Table 64134: Effect on fuel consumption and gaseous emissions of changing trawl shoes into wheels in a beam trawl
Item Base line with trawl shoes Wheels (�15.5% drag) Fuel reduction %
Fuel [ton/yr] 1203.38 1011.40 15.95
CO2 [ton/yr] 3780.12 3177.27 15.95
SOx [ton/yr] 24.07 20.23 15.95
NOx [ton/yr] 68.72 58.10 15.45
HC [ton/yr] 2.34 1.95 16.52
CO [ton/yr] 4.56 3.73 18.06
The GES model calculates a fuel reduction of 16% based on the observed 15.5% drag reduction. It is assumed that this calculated reduction gives a better approach than the estimated 11% reduction mentioned above.
6.9.4.2.2 Investment required for the adaptation (* 1000 €)
The investment cost for adapting traditional gear with wheels is approximately 10000 €, this includes both materials and labour costs.
6.9.4.2.3 Effect on income (LPUE, landings per unit of effort)
Catch comparison experiments on board the reference vessel showed different catch losses for different species of fish: sole (410%); plaice, turbot and brill (45%); ray (no loss). The other vessels reported similar to slightly higher catches with the roller gear. Another interesting aspect of the roller gear is that it exhibits lower wear and lasts longer than traditional sole plates, reducing maintenance costs.
6.9.5 Adaptations under study – Adaptation No 4: Lower towing speed
6.9.5.1 Short description of Adaptation No 4 A reduction in towing speed from 6 to 5 and 4.5 kts was studied.
6.9.5.2 Effects of Adaptation No 4
6.9.5.2.1 Effect on energy consumption (% change) – Output of GES�model runs
In the operational profile in GES the fishing speed was reduced from 6 kts to 4.5 kts and 5 kts with results given below.

Report Number C002/08 359/425
Table 64135: Effect on fuel consumption and gaseous emissions of lowering towing speed of a beam trawl
Item Baseline
Speed reduction to
4.5kts
Speed reduction to
5kts
Reduction % for
4.5 kts
Reduction % for
5kts
Fuel [ton/yr] 1203.38 808.28 928.66 32.83 22.83
CO2 [ton/yr] 3780.12 2539.31 2917.66 32.82 22.82
SOx [ton/yr] 24.07 16.17 18.57 32.83 22.83
NOx [ton/yr] 68.72 53.45 55.73 22.22 18.91
HC [ton/yr] 2.34 1.46 1.73 37.47 26.28
CO [ton/yr] 4.56 3.10 3.38 31.85 25.85
The fuel consumption can be reduced ranging from about 22% (5 kts) to 32% (4.5 kts) for this vessel and operational profile. The model does not include the effect of the chains sinking into the soil at higher speeds which may result in higher resistance.
6.9.5.2.2 Investment required for the adaptation (* 1000 €)
None
6.9.5.2.3 Effect on income (LPUE, landings per unit of effort)
The effect on landings will be twofold. Firstly, a lower towing (fishing) speed results in a smaller area fished per day. It is assumed that this will result in smaller landings and the decrease in landings should be proportional to the area reduction. Secondly, the catch efficiency of tickler chain beam trawls is speed dependent. It has been shown that reducing speed results in lower catch efficiency (mainly for sole). This may be solved by redesigning the trawl (shorter and lighter chains and a more R4shaped net). The skipper will have to make a trade off between fuel savings and catch losses when selecting an optimum fishing speed.
6.9.6 Adaptations under study – Adaptation No 5 – Outrigger gear replacing beam trawls
Figure 5: Shooting outrigger gear

360 of 425 Report Number C002/08
6.9.6.1 Short description of Adaptation No 5 Beam trawls are replaced with two sets of otter trawl gear, which are shot from the outriggers. The general layout of the vessel remains the same, the configuration of the warps and location of the catch handling do not change. This adaptation requires less investment than converting a beam trawler for twinrigging from its stern. However, the horizontal net opening (15 to 20 m) is limited by the length of the outriggers. The outrigger gear is fished at lower speeds (2.5 to 3 kts) than tickler chain (6 to 7 kts) or chain matrix (4 to 5 kts) beam trawls. Furthermore, the outrigger gear is much lighter than beam trawl gears. The reduced fishing speed and gear weight result in a lower fuel consumption. Use of the outrigger gear is restricted to cleaner fishing grounds (especially in comparison to chain matrix beam trawls) and is less effective at catching sole (main target species for Belgian fleet). A variety of adaptations have been tested to improve the catch efficiency for sole.
6.9.6.2 Effects of Adaptation No 5
6.9.6.2.1 Effect on energy consumption (% change) – Output of GES�model runs
On average, both participating vessels consumed 2000 l/day with outrigger gear (3 kts). This results in a fuel saving of 70% for the vessel that used to operate tickler chain beam trawls (7 kts) and a fuel saving of 50% for the vessel that used to operate chain matrix beam trawls (4.5 kts). For the reference vessel, 2000 ltr/day represents a fuel saving of 63% from the baseline conditions. The results when running GES correspond well to these values, as can be seen from the table below where a fuel saving of 60.48% was found.
Table 64136: Effect on fuel consumption and gaseous emissions of replacing beam trawls by outrigger trawls
Item Baseline Outrigger % Reduction outrigger
Fuel [ton/yr] 1203.38 475.57 60.48
CO2 [ton/yr] 3780.12 1491.80 60.54
SOx [ton/yr] 24.07 9.51 60.48
NOx [ton/yr] 68.72 51.37 25.25
HC [ton/yr] 2.34 0.87 62.72
CO [ton/yr] 4.56 3.25 28.76
6.9.6.2.2 Investment required for the adaptation (* 1000 €)
The investment cost for adapting outrigger gear is approximately 50000 €, this includes trawls, trawl doors and modifications to the vessel and the outriggers.
6.9.6.2.3 Effect on income (LPUE, landings per unit of effort)
Landings of vessels operating outrigger gear are different both in amounts and in composition. During the test phase, ray (35%), plaice (15%), sole (10%), whiting (7%) and dogfish (6%) made up the bulk of the catch weight when targeting flatfish. Alternatively, Norway lobster may be targeted successfully with outrigger gear. The value of the landings dropped to 3150 € per day at sea, a reduction of 51% in comparison to the reference vessel. The wear on the outrigger gear is low in comparison to beam trawls, resulting in lower maintenance costs.

Report Number C002/08 361/425
6.9.7 Adaptations under study – Adaptation No 6 – Additional wind power
6.9.7.1 Short description of Adaptation No 6 The technical feasibility and potential fuel savings of the installation of a SkySails™ kite system on board the reference vessel were evaluated. For this purpose, a SkySails™ engineer joined the vessel for a trip in the Bay of Biscay. It was concluded that this type of vessel is generally suitable for being retrofitted with the SkySails™ kite system, although some modifications to the system are required due to the design and operation of the vessel. An evaluation of potential fuel savings was made based on prevailing weather conditions on different fishing grounds. During trawling and with appropriate wind forces, the SkySails™ kite system can be used on approximately 50% of the courses.
6.9.7.2 Effects of Adaptation No 6
6.9.7.2.1 Effect on energy consumption (% change) – Output of GES�model runs
An evaluation of potential fuel savings was made based on prevailing weather conditions on different fishing grounds. It was concluded that in areas with strong winds like Liverpool Bay, the Central North Sea, the German Bight and the Southern Coast of Ireland, a reduction of 20% in fuel consumption on an annual basis is feasible. In coastal waters and the Bay of Biscay, wind conditions are less favourable, resulting in lower fuel savings. Based on the forward driving force of 80 kN under standard conditions (provided by Skysails™), the GES model was used to calculate potential annual fuel savings under different conditions. The results were in line with the savings calculated by Skysails™. From these calculations it is clear that feeble wind conditions drastically reduce fuel savings.
Table 64137: Effect on fuel consumption and gaseous emissions when using the Skysails™ kite (calculations are for fishing only)
Item Base line Sail 100m^2 % reduction
Fuel [ton/yr] 1203.38 1174.35 2.41
CO2 [ton/yr] 3780.12 3689.01 2.41
SOx [ton/yr] 24.07 23.49 2.41
NOx [ton/yr] 68.72 66.69 2.95
HC [ton/yr] 2.34 2.28 2.45
CO [ton/yr] 4.56 4.40 3.33
6.9.7.2.2 Investment required for the adaptation (* 1000 €)
The investment cost of a complete SkySails kite system suitable for the reference vessel is estimated at 500000 € (this figure is strongly vessel dependent), with an additional installation cost of 100000 € (this includes minor modifications to the reference vessel).
6.9.7.2.3 Effect on income (LPUE, landings per unit of effort)
The effect on landings is expected to be limited, some difference may be observed from changing fishing tactics in order to maximise fuel savings (visiting different fishing grounds, adapting courses to wind direction).

362 of 425 Report Number C002/08
6.9.8 Summary Table of Adaptations for Reference Vessel
Table 64138: Summary of effects on fuel savings, investment costs, and landings for adaptations studied
No Adaptation Potential Fuel Saving (%) Investment Costs (€) Effect on LPUE (%)
1 Trawls in Dyneema 10 5200 annually none
2 Chain matrix vs. tickler chain 20 30000 annually none
3 Wheels replacing trawl shoes 5 (observed for chain matrix),
16 (calculated for tickler chains)
10000 none
4 Lower towing speed 23 none 420/430
5 Outrigger gear 50 50000 448
6 Additional Wind Power 20 600000 or less none
6.9.9 References
Anon. (2007). Skysails for Fish Trawlers. Report, Skysails, Hamburg, Germany. Paschen M., Richter U., Köpnick W. (2000). Trapese Trawl Penetration in the Seabed. Report, University of Rostock, Rostock, Germany.
Polet H. (2008). Projectrapport Alternatieve Boomkor. Report, ILVO4Fisheries, Ostend, Belgium. Vanderperren E. (2008). Projectrapport Outrigger II. Report, ILVO4Fisheries, Ostend, Belgium.

Report Number C002/08 363/425
6.10 United Kingdom Segment (gear, length, power): OTB, 12424 m, 480 kW Participant: SEAFISH Author(s): K. Arkley, J. van Vugt
6.10.1 Reference design: OTB, 124 24 m
Figure 6479: Reference vessel – OTB 12 – 24m (Vessel ID deleted)
This reference design is one of the more modern examples of a demersal stern trawler designed and rigged to operate single and twin4rig trawl gear in this sector of the UK fleet. The vessel has a registered length of 20.15 m and a moulded depth of 4.20 m. A double4chine hull produces a draft of 4.3 m. A semi4bulbous bow, concave raked stem and strongly flared bow section produce a 7m beam. The vessel has a fairly conventional layout with a watertight full4width deckhouse separating the forward catch4handling area from the net4handling area at the transom. A steel constructed non4watertight deck shelter covers the working area aft of the deckhouse to the transom. The area forward of the deckhouse is constructed in aluminium alloy. Below main deck the vessel layout follows standard form of forepeak and chain locker, fish room, engine room and accommodation. A combined galley and mess deck, shower/toilet and gear compart4ments are situated on main deck level. The vessel is powered by a turbocharged diesel engine developing 480 kW coupled to a 7.46:1 reduction gearbox turning a 1900 mm diameter propeller fitted in a matching propulsion nozzle. The main engine is used primarily for propulsion but is also capable of driving a duplicate hydraulic system as backup to the main hydraulic system. Two auxiliary engines are used to drive the main generators, one of which is used for battery charging.

364 of 425 Report Number C002/08
Table 64139: Main particulars of reference vessel No 1 UK
Item Value
Length over all (m) 21.5
Breadth (moulded, m) 7.0
Mean draft (m) 4.3
Depth (moulded, m) 4.2
Main engine power (kW) 480
Main target species Mixed groundfish/Nephrops
6.10.1.1 Fishing Gear Two main gear types are used covering the split of trawling activities targeting a range of groundfish species and Nephrops (prawns). The whitefish are targeted using a single4rig four4panel high4lift net rigged on a ‘rockhopper’ groundgear consisting of 16 in – 18 in rubber discs for operating on rough ground. The trawl is attached to 3 m2 trawl doors weighing ~527 kg (in air) by 20 fthm split bridles and 20 fthm single sweeps. The net achieves a headline height of ~24ft. A three4drum, 25 t core pull rated trawl winch, located forward on the main deck handles the trawl warps for both the single and twin4trawl operations. Each drum holds 400 fthm of 20 mm steel core trawl wire. The trawl nets are stored and handled from two 10 t split net drums arranged side4by4side on the quarterdeck leading to shooting and hauling hatches in the transom. Other gear handling equipment includes a deck crane and fleeting winch mounted on the trawl gantry. The catch (codend) is taken onboard on the starboard side by a combined anchor/Gilson winch through a hatch under a square framed codend gantry. The catch is released into a reception hopper.
Table 64140: Main particulars of fishing gear of the reference vessel
Item Value
Gear code (OTB…) OTB – Demersal otter trawl
Type description 1. Single4rig high lift whitefish rockhopper trawl.
2. Twin4rigged prawn scraper trawls rigged on 6in 4 8in rubber disc footrope.
Otter boards (type, size, and weight) Net Systems – Hi4Lift 3m2
Weight in air: ~527kg
Main gear dimensions (circumference, beam
width, (m))
148ft footrope rigged on ~100ft of 16in/18in hoppers. Headline height of
~24ft. 20fthm split bridles and 20fthm single sweep connected to trawl doors
by 5fthm chain.
180ft footrope rigged on 6in – 8in rubber disc footrope. 40fthm split bridles
and 20fthm single sweep (rubbered legs)
Headline length (m)
Footrope length (m) 1. 148ft/45m / 2. 180ft/55m
Cod end mesh size (mm) 1. 120mm / 2. 80mm

Report Number C002/08 365/425
6.10.1.2 Operational profile The vessel is designed to operate primarily in coastal waters but with the capability of working on offshore grounds. This reference vessel operates for ~75% of its operating time targeting demersal whitefish species using a single rig, high lift rockhopper trawl on grounds off the east coast of the UK and ranging as far afield as Shetland and the Norwegian sector. For the remaining 25% of the time, the vessel targets Nephrops predom4inantly on the east coast of the UK using typical prawn/scraper style trawls in a three4warp twin4rig mode. The reference vessel normally operates an average of 8 day trips spending 36 hours in harbour between trips unless unforeseen circumstances such as breakdowns and/or repairs increase harbour time. The vessel operates at a steaming speed of 849 kts with the main engine running at 1550 rpm using ~58 litres of fuel per hour (l/h). Fishing grounds are normally within 24 hours steaming time of the homeport. Fishing speed is a maximum of 3 kts (1335 rpm) burning ~55 l/h. Average fishing time is 4 – 5 tows of 4 hours duration each day with hauling and shooting times taking ~1 hour.
Table 64141: Time split over operational modes
Operational mode Percentage of time
Steaming to and from fishing grounds ~20% for whitefish 4 ~48hrs
~10% for Nephrops 4 ~24hrs
Shooting and hauling gears ~1hr/tow –
Fishing ~70% 4 4x4hr tows/day x 6days
Searching ~10%
Time in harbour ~36 hrs/trip
Table 64142: Operational profile for the base line reference vessel
Name Duration Distance Velocity
[4] [hrs] [nm] [kn]
Harbour 36.00 0.0 0.0
Steaming to fishing ground 24.00 247.2 10.30
Shooting gears 0.00 0 3.00
Fishing 100.00 300 3.00
Hauling gears 0.00 0 3.00
Steaming to port 24.00 247.2 10.30
Harbour operation 8.00 0.0 0.0
The operational profile is based on a sequence of 192 hours. For a year profile 8760 hours are used.
6.10.1.3 Evaluation of the state of technology As previously described, this reference vessel is one of the more modern representatives of this size class in the UK fleet. As a result it is well designed and equipped with a relatively high level of technology. It is hoped that if savings can be demonstrated with reference vessel with this level of technology, then the potential for fuel saving with older, less well designed and equipped vessels will be greater.
6.10.1.4 Catch Target species for the whitefish (groundfish) fishery: cod, haddock, whiting, saithe, monkfish, plaice, sole.

366 of 425 Report Number C002/08
The other target fishery is prawns (Nephrops norvegicus) with a limited bycatch of cod, haddock, whiting and a range of flatfish species.
6.10.1.5 Energy performance
6.10.1.5.1 Fuel consumption
The fuel consumption while steaming is ~58 litres/hour, and while fishing~55 litres/hour.
FUEL CONSUMPTION [ton/year]
0
50
100
150
200
250
Har
bour
Ste
amin
g to
fish
ing
grou
nd
Fre
e ge
ars
Fis
hing
Pul
l gea
rs
Ste
amin
g to
harb
our
Har
bour
ope
ratio
n
Caterpillar 3412C - TA, tank_1
Title:Demersal Trawler, Technology:2008Run date:14-10-2008/11:55:09Input file:COMOutput file:Results.csvResults file:ResultsOutput.csv
Figure 6480: Yearly fuel consumption on various operational modes for the reference vessel
The fuel consumption is for this operational profile for steaming about 48% of the fishing operation.
6.10.1.5.2 Efficiencies – Output of GES�model runs

Report Number C002/08 367/425
Efficiency [-]
0
0.05
0.1
0.15
0.2
0.25
Har
bour
Ste
amin
g to
fish
ing
grou
nd
Fre
e ge
ars
Fis
hing
Pul
l gea
rs
Ste
amin
g to
harb
our
Har
bour
ope
ratio
n
Efficiency [-]Title:Demersal Trawler, Technology:2008Run date:14-10-2008/11:55:09Input file:COMOutput file:Results.csvResults file:ResultsOutput.csv
Figure 6481: Efficiency of the installation by operational mode for the base line
For the fishing operations is the efficiency comparing with steaming lower. This is normal for fishing ships.
6.10.2 Adaptations under study – Fishing gear related measures – reduction of the fishing gear’s towing resistance
The following is a list of options/measures relating to fishing gear which if applied/adopted could provide fuel savings. Most if adopted on their own will only achieve relatively small savings. The intention is to identify as many areas of potential savings which when applied in combination could produce significant savings. An examination of how much of the overall towing resistance of the gear is due to the different individual components produces a breakdown as shown below for a typical single boat bottom trawling operation:
Table 64143: Estimated drag contribution by gear component (figures in red are maxima)
Item % of total drag
Warps 5% – 8%
Trawl doors 20% – 35%
Sweeps/bridles 4% – 12%
Footrope/groundgear 10% – 20%
Netting 58% – 75%
Floatation 3% – 7%

368 of 425 Report Number C002/08
6.10.3 Adaptations under study – Adaptation No 1: Towing warp specification
6.10.3.1 Short description of Adaptation No 1 Optimising towing warp specification to operational requirements i.e. ensuring warp specification is matched to vessel power; trawl and trawl doors can result in drag reductions and subsequent fuel savings. Use of higher specification wire/rope can maintain strength/wear characteristics with reduced diameter. Reducing warp diameter (by a small amount e.g. 2mm) with resultant weight and surface area reduction reduces drag. Use of higher specification/alternative materials for warps can achieve higher strength for given warp diameter and reduced weight per unit length – Alternatives to traditional steel wire e.g. High Performance Polyethylene – HPPE 4 .(Example: Dyneema®/Dynex™/ Dynex Dux 75™ as produced by DSM/Hampidjan. This is a Dyneema®
SK75 fibre which has neutral buoyancy. Dynex™/ Dynex Dux 75™ 12 stranded braided ropes have a higher breaking strength than that of steel wire (up to 2x) of the same diameter (low diameter to strength ratio) with a similar safety factor and much reduced weight per unit length compared to steel wire – up to one4sixth of the weight 4 Dynex® warp of 20mm weighs ~0.3kg/m compared to ~1.8 kg/m for steel wire. Less warp weight will reduce towing and hauling power requirements resulting in less fuel consumption. Less towing power will be required to tow the warps through the water and winch load is greatly reduced. Reduced winch loads could result in less powerful winch requirements. Where autotrawl systems are used there will be added benefit associated with the lighter warp during towing and hauling. Life expectancy is also claimed to be up to twice that of steel wire.
6.10.3.1.1 Effects of towing warp specification
This material has been developed for both pelagic and demersal trawl applications producing options for reductions in trawl door size which can have additional fuel saving benefits. Alternative warp material to be applied to TNO model: • Warp diameter 20mm Dynex at 0.3kg/m x 400m replacing 1.8kg/m • Warp diameter 18mm Dynex at 0.2kg/m x 400m replacing 1.45kg/m No trials data to date but commercial experiences have demonstrated fuel savings of up to 7.5% with increased life expectancy of the warps compared to steel wire.
6.10.3.1.2 Effect on energy consumption (% change) – Output of GES�model runs
Conservative estimate to be applied for this adaptation: fuel saving of 5%.
6.10.3.1.3 Investment required for Improved Towing Warp specification (* 1000 €)
This material has the disadvantage of having high cost compared to steel wire, (up to 4x). Steel wire cost – 20mm: ~£4.40/m (€5.59/m) Replacement cost 3x 400fthm for three winch drums at 4x steel wire cost: ~€25.5k Some additional investment cost would be incurred in running block replacement/modification to be compatible with the new materials (no information available).

Report Number C002/08 369/425
6.10.3.1.4 Effect on income (LPUE, landings per unit of effort)
This is assumed to be negligible.
6.10.4 Adaptations under study – Adaptation No 2: Sweep/bridle arrangements
6.10.4.1 Short description of Adaptation No 2 Sweep/bridle function is to help achieve the desired gear parameters and to produce a herding function where required for the target species. The type, length, weight and make4up should be selected to achieve this without producing excessive drag. Sweep and bridle arrangements should be selected to match the trawl design, the target species and ground type. Sweep length should be determined in combination with trawl design/size, trawl door size and bridle angle required, which in turn is influenced by target species. The type of sweep used will be influenced by ground type and target species with the aim of achieving optimum catching efficiency for minimum drag. Often sweep lengths far in excess of what is required for the target species are used to achieve desired net geometry (spread and headline height) which could otherwise be achieved using smaller trawl doors. Similarly, bridle choice is influenced by net design, ground type and target species.
The same approach of optimising material specification as applied to the towing warps can be applied to sweeps and bridles; use of neutrally buoyant HPPE materials for headline bridles and/or for sweeps where no ground contact is required)
6.10.4.1.1 Effects of modified sweep/bridle arrangements
No trials data to date. This adaptation with contribute to the reduction in overall weight of the gear when used in combination with other drag reduction measures. This becomes more significant where long sweep/bridle arrangements are incorporated in the gear set4up. It has the additional benefit of reduced wear and longer life expectancy compared to conventional materials.
6.10.4.1.2 Effect on energy consumption (% change) – Output of GES�model runs
No data on effects of this change alone, but should be considered in combination with other gear options.
6.10.4.1.3 Investment required for Modified Sweep/Bridle Arrangements (* 1000 €)
Replacement cost for existing bridle and sweep arrangements based on 40 fthm combination wire/rope split bridles and 20fthm single sweeps assuming adaptation costs at 4 x conventional cost:~ €5k
6.10.4.1.4 Effect on income (LPUE, landings per unit of effort)
Not available.

370 of 425 Report Number C002/08
6.10.5 Adaptations under study – Adaptation No 3: Trawl doors
6.10.5.1 Short description of Adaptation No 3 The trawl doors constitute the second largest component of overall drag in the fishing gear system. The aim is to optimise the efficiency of the trawl door in terms of achieving the required spreading force with as little drag as possible whilst maintaining the doors stability. The process would involve:
• Correct selection of door size, weight and type to match gear size, target fishery, fishing conditions (depth, towing speed, seabed type) and vessel towing capabilities; understanding the relationships between the weight of the boards, heel angle, warp length: depth ratio and effect of ground contact on door performance;
• Optimisation of door set4up and rigging in relation to rest of gear (bridle/sweep arrangement, type of groundgear etc.); understanding towing point and backstrap adjustments and their effect on door performance; angle of attack; backstrap arrangements; sweep/bridle arrangements, (angle, lengths and type).
• Adoption of more efficient trawl door designs; New trawl door designs continually coming on to the market with claims of improved efficiency in terms of spreading performance and reduced drag and hence improved fuel efficiency. Where these claims can be substantiated, new door designs should be considered as an option for reducing gear drag. Main improvements arise from producing stable door designs that can operate at low angles of attack necessary to reduce drag. Developments in both pelagic and demersal sectors are producing door designs capable of achieving substantial door area reductions whilst maintaining or increasing spreading capabilities. New lightweight construction materials (composite construction) and multi4foil/slot configurations are being developed, particularly for pelagic applications.
6.10.5.1.1 Effects of trawl door modifications
Optimisation of door set4up and rigging in relation to the rest of the gear can only be established through practical exercise. No actual data available for this vessel. For this reference vessel which is currently using one of the more recently developed trawl door designs, improvements in door performance may not be significant.
6.10.5.1.2 Effect on energy consumption (% change) – Output of GES�model runs
Claims of fuel savings in the region of 25% have been made for some of these latest door designs when compared to standard patterns such as ‘V’ doors. A conservative estimate to be applied for this adaptation to the reference vessel would be a fuel saving of ~10% if door size can be reduced.
6.10.5.1.3 Investment required for the trawl door modifications (* 1000 €)
Cost of replacing trawl doors: ~+30% on existing door, i.e. 4 6.25 k€
6.10.5.1.4 Effect on income (LPUE, landings per unit of effort)
Unkown.

Report Number C002/08 371/425
6.10.6 Adaptations under study – Adaptation No 4: Trawl design and construction
6.10.6.1 Short description of Adaptation No 4 The netting itself constitutes ~60% of the overall drag of a trawl system therefore it is logical to look to this area for drag reductions to improve fuel efficiency. Over recent years there has been a lot of attention placed on the development of more fuel efficient trawl designs, i.e. designs with less twine surface area and hence less drag. This has involved a lot of work on improving construction materials and alternative netting configurations. Consideration of these developments alone and/or in combination has been demonstrated to achieve significant savings in terms of drag reductions resulting in fuel savings. The development of high performance Polyethylene (HPPE) materials has produced lower diameter twines used for the construction of netting without compromising strength or life expectancy. These materials tend to be more expensive than traditional twines/netting but the higher specification can result in a cost effective alternative. These thinner materials can be used for whole trawl construction or restricted to the areas of the trawl that are least vulnerable to damage if strength/abrasion is an issue. Twine diameter reductions of up to 50% can be implemented using some of the higher specification materials such as Dyneema® Twine construction itself should be considered when trying to achieve savings. Differences in construction can produce twines/netting better suited for particular applications or specific areas of a trawl. For example twines can be produced with most of the filaments concentrated in the outer layers or mantle to produce high abrasion resistance. These will have larger diameters for a given breaking strength. Others can have the main strength concentrated in the core producing higher strength to diameter ratios. Other considerations are limiting the use of double netting; whether ‘ hard’ or ‘soft’ netting is best suited; single or double knotted netting etc. all of these relatively minor considerations can influence overall drag of the netting material.
Considering netting construction, alternative mesh configurations and constructions can be used to alter netting drag. Lighter netting can be used in combination with selvedge ropes and other reinforcing methods to maintain overall strength characteristics of the trawl whilst taking advantage of the reduced drag;
o Knotless netting e.g. Ultracross™ and other constructions have been demonstrated to produce up to 7% fuel savings when used in whole trawl construction. The greatest benefits of this approach are seen when replacing relatively small mesh sizes (shrimp trawls). Replacing standard knotted netting in 60mm mesh with knotless netting of the same mesh size can produce drag reductions in excess of 20%.
o T90 or turned mesh netting is a relatively recent development used for whole trawl construction. This uses conventional netting turned through 90º. Extensive commercial trawl production in Iceland using this concept has demonstrated fuel savings as a result of the fact that ~30440% less netting material is required to produce a trawl compared to the equivalent sized conventional net. This configuration can also be used for part trawl construction e.g. bellies, codends and extension sections. It has been used successfully in the belly sections of Norwegian and Danish shrimp trawls and is also utilised in pelagic trawls to improve mesh opening and water flow.
o The T90 configuration is also between 10 and 20% stronger (knot strength) than convention4ally rigged netting which potentially allows the use of lighter twines in combination with this mesh configuration.
o Use of alternative mesh shapes: square mesh, hexagonal mesh can be used to produce increased and consistent mesh opening which aids water flow through the trawl. These mesh shapes are often best used in combination with knotless mesh construction.
Increased mesh size, particularly in combination with lighter twine/netting material can also have a significant effect on drag. More gear designs are being introduced with much increased mesh sizes in certain areas of the

372 of 425 Report Number C002/08
gear which do not compromise catching efficiency for the target species. It has been estimated that fuel savings of up to 10% could be achieved by doubling mesh sizes in upper and side panels of certain trawl designs e.g. those targeting shrimp and prawns where relatively small mesh sizes are traditionally used.
The frame/mounting arrangements used in trawl construction can also benefit from higher specification materials to reduce the overall weight of the gear. The same high specification materials used for the netting construction can be used to replace the traditional wire and combination wire materials currently used. The benefits are the reduced weight and diameter for the same strength and wear characteristics. The positive buoyancy of these materials can also assist with the floatation of the trawl, potentially reducing the number of conventional floats required. The use of conventional spherical floats attached to the headline of trawls can have a significant affect on drag, particularly at higher trawling speeds. Methods of reducing this drag are continually being sought. Some of the options are:
o Use of Floatrope; similar in principle to floatline used on static gear but on a much larger scale – 42mm – 135mm with buoyancy ranging from 0.38 kg/m to 4.33 kg/m. This can be used in combination with and/or used to replace existing headline floats.
o Flexible ‘kites’ or foils can be used to replace conventional floats: these are not new technologies but have not been popular in the UK. They have proved more popular in the US with types like ‘Flex4Kites’ which are basically canvas panels positioned strategically along the headline of the trawl and angled to produce lift which in contrast to conventional spherical floats increases with speed without any significant increase in drag. Other models such as the French designed ‘Aeroplane®’ which is a bi4plane structure consisting of a series of canvas pockets attached to the centre section of the headline can produce considerable lift and are easy to rig and operate. A 1.5m long ‘Aeroplane®’ produces a lifting force in the region of 128kg at 3.5k which is equivalent to ~35 x 200mm floats and drag is reduced to only 1/3 of the lift. These devices have the added benefit of being ‘net drum friendly’.
o Further research is ongoing into the use of kites or foils to produce headline lift. Developments such as rigid kites constructed from synthetic composite materials to be used in combination with conventional round floats have the potential for significantly reducing trawl drag. Floats filled with polyurethane foam have been developed in Scandinavia for use in relatively shallow water. This is a detachable system using a small number of relatively large foam filled floats in which it is claimed that one float will replace 16 conventional ones with a considerable weight saving.
Ground gear varies considerably depending on numerous factors. However, there are a number of ways in which savings can be made. The main determining factor in relation to choice of ground gear is the nature of the seabed over which the gear is to be towed. But even within the constraints imposed by this factor savings can be made just by considering the weight of the gear in relation to the amount of ground contact required for a particular target species. Questions should be asked such as; could the required degree of ground contact be achieved through an adjustment to the rigging of the gear, (balance of tensions within the system) rather than relying on physical weight? Reducing drag with regard to the ground gear is the same as for the other factors discussed; it is a matter of balance within the overall trawl system. Additional to this there have been some innovations that have been introduced to help this process. Shearing or ‘plate’ ground gear has been developed by Danish and Norwegian gear technologists as a means of reducing the drag of conventional ‘rockhopper’ ground gear arrangements. The way that conventional ‘rockhopper’ ground gear is rigged means that the discs positioned other than in the centre bosom section of the footrope are orientated at a large angle to the direction of tow – up to 90º for those discs in the wing sections. This orientation creates a lot of resistance to both water flow and direct movement over the ground. By replacing the wing section hopper discs with rectangular plates, the overall drag of the groundgear can be reduced (~4%) and the plates have the additional benefit of assisting with the horizontal spread of the gear (increased by ~13%) compared to ‘rockhopper’ ground gear. The rigging of the plate gear can also be adjusted to control the degree of ground contact which also helps by reducing the requirement for excessively heavy ground gear in order to maintain ‘hard’ ground contact. This type of gear is being used by Norwegian and Danish fishermen and recently

Report Number C002/08 373/425
there have been reports of a number of French trawlers using this concept targeting monkfish on hard ground with good success. Development continues with this technique.
New trawl designs are being developed with the aim of reducing the overall netting area whilst maintaining catching efficiency. The following are some examples:
o Coverless trawls – Initial developments of this type of trawl design were made primarily as a means of reducing non4target bycatches of finfish species in targeted Nephrops fisheries. Removing the cover or square section from the top half of the trawl improved the trawls ability to avoid higher swimming species like haddock and whiting without compromising the Nephrops catch. The reduced twine surface area associated with the removal of the cover can be further enhanced by modifications to the wing sections where further netting area can be reduced. This all helps to reduce the drag of the trawl. Other trawl design modifications based on this idea are possible resulting in further reductions in netting area. The coverless design is in use in the UK Nephrops fishery and there have been recent trials conducted by Norwegians and Danish gear technologists to test a shrimp trawl with a deeply cut4back top sheet to reduce the volume of netting which allows the use of smaller trawl doors resulting in a significant reduction in the power required to tow the trawl and subsequent fuel savings.
o Duplex/Triplex trawls – these designs work on the principle of modifying the overall shape of the trawl to improve the catching efficiency to best suit the behaviour of the main species being targeted. For example, for species swimming very close to the seabed a trawl design which maximises horizontal spread whilst maintaining a relatively low headline height will be more effective. Examples of this type of design have been developed for Canadian shrimp fisheries. With these designs the aim is to increase the horizontal mouth opening of the trawl resulting in a greater area of the seabed being covered over time and thereby potentially increasing catch rates. This reduces the fuel consumed per kg of fish harvested. The increased footrope spread is achieved alongside a reduced headline height. This enhanced trawl geometry for targeting shrimp can be achieved with minimal or no corresponding increases in hydrodynamic drag. In comparative terms these modified trawl designs can have significantly less drag than a standard trawl having a comparable opening (wingend spread). In some instances the increased footrope spread can be comparable to that achieved by a twin trawl set4up for a given power. The Duplex/Triplex terminology comes from the fact that these designs have extra wide bosum sections running into multiple, (two or three) codends. The Canadian experience showed that a trawler with a given horsepower could tow a much larger Triplex trawl compared to a traditional trawl design with a single codend. The new designs produced greater catching efficiency as a result of the improved mouth geometry. The mouth opening of a standard trawl is triangular in shape with rounded corners with the maximum headline height at the centre of the net. This results in most of the catch being taken at the centre of the standard trawl. In contrast, the mouth geometry of the Triplex trawl is more like a rectangle with rounded corners, which provides a more uniform catching potential across the full width of the footrope.
6.10.6.1.1 Effects of trawl design and construction
Considering the reduction of twine surface area of a trawl by way of reducing twine diameter, UK trials (SEAFISH, 2005) demonstrated a significant reduction in drag and increase in mouth opening compared with a standard trawl when rigged with the same size doors, bridle lengths and flotation. The drag of the trawl constructed in lighter twine (~1mm reduction in twine diameter), was reduced by 6% with an increase in the mouth opening of 11%. Based on this 6% saving in drag and fuel consumption for the lighter trawl, the skipper has the option to choose an increase in speed from 3.00 to 3.15 knots. Alternatively, if the skipper is prepared to restrict the mouth opening of the modified trawl to that of the standard trawl (by reducing door size and flotation), the drag will reduce by more then 6% compared with the standard trawl at 3.00 knots and may be between 6% and 14 %.

374 of 425 Report Number C002/08
Since the trials were carried out, new twine materials have become available, (as previously identified), which would allow further practical reductions in twine diameters and hence the potential for further fuel savings. French trials using thinner twine construction for netting panels in the belly and other sections of a trawl have reduced trawl drag resulting in the use of smaller trawl doors enabling a saving of 14% in fuel consumption. Canadian trials comparing two identical trawls, one constructed in standard braided PE twine the other in similar strength, reduced diameter high tenacity braided polythene produced significant reductions in drag in the order of 11%. The Triplex trawl showed fuel consumption reductions per kg of catch harvested in the region of 13%. Adaptations such as those involving changes to the actual trawl construction, (changes in mesh size or configuration), may have impacts on catching efficiency. The impacts of individual changes may also change when used in combination with others as a result of the interaction and interdependency of the different gear components. There is no information available on the effects of the combined use of these adaptations applied to the type of gear used by the reference vessel. It may not be practical to incorporate multiple adaptations in one gear type at one time. For the purposes of this project it would be reasonable to suggest that if some of the measures were applied to the reference vessel, an estimate of potential fuel savings could be made.
6.10.6.1.2 Effect on energy consumption (% change) – Output of GES�model runs
Based on adaptations to reduce twine surface area and the drag of the net itself and the assumption that a reduction in door size and drag can be made, it is reasonable to estimate a reduction in fuel consumption for the reference vessel of the order of 15%. If it can be demonstrated that more of the measures identified can be used practically, in combination, without detrimental impact on catching efficiency, then this estimate could be in excess of 25%. Using the GES4model the gear resistance is reduced with 6%, and the fishing speed kept at 3kts.
Table 64144: Effect on fuel consumption and gaseous emissions of applying fishing gears with 6% less drag
Gear drag reduction Base line Gear reduction 6% % reduction
Fuel [ton/yr] 346.09 330.58 4.48
CO2 [ton/yr] 1086.63 1037.78 4.50
SOx [ton/yr] 6.92 6.61 4.48
NOx [ton/yr] 28.78 28.69 0.31
HC [ton/yr] 0.65 0.62 4.03
CO [ton/yr] 1.70 1.72 41.06
The reduction of the reference vessel is for an operational yearly profile in the order of 4.5%. The gear resistance is reduced with 6%, fishing speed is increased from 3.0 kts to 3.15 kts

Report Number C002/08 375/425
Table 64145: Effect on fuel consumption and gaseous emissions of applying fishing gears with 6% less drag
Gear reduction Base line Gear reduction
6%, 3kts
Gear reduction
6%, 3.15kts Reduction for 3kts Reduction for 3.15kts
Fuel [ton/yr] 346.09 330.58 337.24 4.48 2.56
CO2 [ton/yr] 1086.63 1037.78 1058.75 4.50 2.57
SOx [ton/yr] 6.92 6.61 6.74 4.48 2.56
NOx [ton/yr] 28.78 28.69 28.71 0.31 0.27
HC [ton/yr] 0.65 0.62 0.63 4.03 2.27
CO [ton/yr] 1.70 1.72 1.71 41.06 40.45
The reduction for this adaptation of the reference vessel is for an operational yearly profile in the order of 2.5%.
6.10.6.1.3 Investment required for trawl design and construction (* 1000 €)
To incorporate full range of measures identified would require full gear replacement. Estimate replacement gear cost would be standard cost +50%. Standard gear replacement cost: ~ £10k 4 €12.7k
6.10.6.1.4 Effect on income (LPUE, landings per unit of effort)
Unknown, assumed equal.
6.10.7 Adaptations under study – Adaptation No 5: Vessel and vessel operation related measures
6.10.7.1 Short description of Adaptation No 5 The following is a list of options/measures/adaptations relating to fishing vessel design, engineering and operation which if applied/adopted could provide fuel savings. Most if adopted on their own will only achieve relatively small savings. The intention is to identify as many areas of potential savings which when applied in combination could produce significant savings. Understanding where energy is expended in a fishing vessel is the first step to addressing the problem of energy efficiency and identifying what aspects can be influenced by the vessel operator (skipper), the vessel designer/builder or the engineer. For relatively small, slow speed trawlers only about 1/3 of the energy generated by the engine reaches the propeller and only 1/3 of this is actually spent on the useful work such as pulling the trawl. The energy losses are split between exhaust heat and radiation (~38%), cooling water (~27%), friction (~1%), propeller losses (~24%) and useful thrust (~10%). The energy reaching the propeller is split as follows:
• ~35% used to turn the propeller; • ~27% to overcome wave resistance; • ~18% to overcome skin friction; • ~17% to overcome resistance from the wake and propeller wash against the hull; • ~3% to overcome air resistance.

376 of 425 Report Number C002/08
On this basis, the main areas where energy losses can be minimised can be identified and split into the two main categories:
• Improvements relating to fishing vessel operation; • Improvements relating to fishing vessel design and engineering.
When prioritising areas for improving fuel efficiency it is worth considering the major causes of fuel inefficiency in order of priority as identified by previous R&D in this field:
• People – namely the vessel operator/skipper; • Propellers – incorrect diameter and/or pitch; • Engines – mismatched to the gearbox and/or propeller; • Engine unsuitability or misapplication.
The skipper or vessel operator is the most significant factor in the system. Any advantages to be gained by the application of technical improvements and/or innovations can be nullified without corresponding changes to operational practices or behaviour.
6.10.8 Adaptations under study – Adaptation No 5: Vessel and vessel operation related measures
6.10.8.1 Maintaining engine efficiency Maintaining vessels engines at peak efficiency can provide savings in both fuel economy and repairs. A large part of preventive maintenance is simply having a regular inspection routine. The engine manufacturer’s maintenance programme should be followed and complicated, (other than routine) mechanical work should be entrusted to qualified personnel. Main areas for attention:
• Engine room ventilation: Oxygen (air) is an essential requirement for combustion and so the engine must receive adequate and constant clean air flow. Air intakes should be clear and not obstructed by stowed fishing gear and/or equipment. Improper engine room ventilation can cause high temperatures on engine parts and excessive engine deposits. Lack of adequate air supply can result in a reduction in hp and engine operating efficiency (common and serious problem).
• Prevent engine overheating: Each gallon fuel burnt is turned into heat of which ~1/3 is converted into usable power, the remaining 2/3 is disposed of through the cooling system. Overheating can increase engine wear and fuel consumption.
• Fuel temperature: Diesel engines are also sensitive to fuel temperature changes. Fuel can heat up in the tanks via the return feed resulting in a small loss of power, about 1% per 6ºC above 65ºC.
• Use of ‘Clean’ fuel: Low4quality fuels with high sulphur content can lead to high carbon deposits resulting in lower engine temperatures and a significant loss of power. Poor fuel quality can have serious implications for fuel injectors. First signs of injector problems are usually increased fuel consumption and loss of power.
• Lubrication: Lubrication requirements of diesel engines are more exacting than those of other engine types.
6.10.8.1.1 Effects of maintaining engine efficiency
Not having a regular inspection routine and/or maintenance programmes can have detrimental effects on vessel performance, vessel safety and fuel consumption.

Report Number C002/08 377/425
6.10.8.1.2 Effect on energy consumption (% change) – Output of GES�model runs
The effect on fuel consumption is variable depending on which aspect(s) of the routine maintenance are adhered to/ignored and the frequency of the maintenance.
6.10.8.1.3 Investment required for maintaining engine efficiency (* 1000 €)
This should be included in the vessels normal operating costs. Increased frequency of maintenance programme may incur additional cost – no figures available.
6.10.8.1.4 Effect on income (LPUE, landings per unit of effort)
None.
6.10.8.2 Alternative fuels
There are a number of reasons to consider the use of bio4diesel in fishing vessels. For many members of the public the primary consideration would be the environmental benefits. The combustion products of bio4diesel are an improvement on those of red diesel in environmental terms but for bio4diesel to constitute a realistic alternative to red diesel it has to offer an economic benefit. This economic benefit does not have to come solely from savings in fuel costs, but may also be derived from enhanced prices for fish certified as caught using biodiesel. Research has demonstrated that bio4diesel is a technically feasible direct substitute for red diesel in engines typical of the smaller class (10 metre) of fishing vessels. However, theory predicts that the lower calorific value will result in increased fuel consumption relative to red diesel. Security of supply for the fishing industry can only be achieved if the industry has control of adequate production capacity. Furthermore, there is no benefit in having available capacity without a sufficiency of feedstock. In order to avoid competition with the road transport fuel industry, the fishing industry will need to utilise less favourable feedstock that would be unlikely to economically yield fuel that complies with current regulations/standards (BS EN14214). In terms of dynamic performance, fishing operations using marine diesels are less demanding of fuel quality than many road diesel engines. In contrast to automotive applications, marine diesels are operated at high load for prolonged periods and one result from recent research is that if this high load setting is too extreme, engine condition can deteriorate when no engine timing adjustments are made to allow for the new fuel. (Clifford, et al, 2008). Another alternative fuel source is Heavy fuel Oil (HFO), however this would not be applicable to the reference vessel(s) as conversion is only suitable for larger engines above 745kW (1000hp).Reference: SEAFISH Fact Sheet, Reducing Fuel Costs by Converting to Burning Heavy Fuel Oil
6.10.8.2.1 Effects of alternative fuels
If HFO (Heavy Fuel Oil) is used instead of MDO (Marine Diesel Oil) the fuel consumption is increased.

378 of 425 Report Number C002/08
Table 64146: Effect on fuel consumption and gaseous emissions of applying fishing gears with 11.9% less drag
Gear reduction Base line HFO instead of MDO % reduction
Fuel [ton/yr] 346.09 369.45 �6.75
CO2 [ton/yr] 1086.63 1105.45 41.73
SOx [ton/yr] 6.92 29.56 4327.00
NOx [ton/yr] 28.78 32.80 413.96
HC [ton/yr] 0.65 0.74 413.96
CO [ton/yr] 1.70 1.94 413.96
The fuel consumption is increased with 6.7% if HFO is used, but the SOx production is increased with more than 325%!
6.10.8.2.2 Effect on energy consumption (% change) – Output of GES�model runs
A reduction of 6.75% was found in GES.
6.10.8.2.3 Investment required for use of alternative fuels (* 1000 €)
Not available
6.10.8.2.4 Effect on income (LPUE, landings per unit of effort)
Not available
6.10.8.3 Reducing Operating Speed:
Speed is the most important factor to influence fuel consumption. As a vessel moves through the water energy is expended in making waves alongside and behind the vessel. This is known as wave4making resistance. As speed increases the wave4making resistance increases disproportionately to the increase in speed. Hull resistance changes are more significant than the change in efficiency of the engine. To double the vessel speed would mean burning more than double the amount of fuel and conversely, a small decrease in speed can result in a large decrease in the power requirement. As a rough guide, a 10% increase in speed results in a 40% increase in wave4making resistance for displacement vessels such as trawlers. Generally speaking, all other factors being equal, if the vessel displacement is increased by 10%, then the wave4making resistance will increase by 10%. At higher speeds, in addition to the energy loss to counter wave4 resistance, the engine may not be operating at its most efficient, particularly at engine speeds approaching maximum rpm. The easiest and least expensive action a skipper can take to save fuel, particularly whilst steaming, is to reduce engine speed (revolutions) and this can be achieved at no additional direct cost. It has been demonstrated that most vessels operate most efficiently at ¾ throttle. Beyond this setting it takes a lot more power and fuel to gain a little extra speed. Vessel speed during fishing operations may be constrained by other parameters such as optimum trawling speeds.
Estimates for recommended maximum operating speeds related to a vessels hull resistance can be made. This would not necessarily be the optimum speed. The optimum speed would be a compromise made by the skipper to balance the savings made by speed reduction and cost incurred by remaining at sea longer or spending less time fishing. The optimum speed for a particular situation would be the speed that results in the savings made on fuel as a result of slowing down, exactly compensating for the losses associated with late arrival. This is not a straightforward decision as numerous factors are involved, not least the value placed on the skipper’s and crew’s time.

Report Number C002/08 379/425
6.10.8.3.1 Effects of reducing operating speeds
Actual savings are difficult to predict as a result of all the factors involved. Reducing engine speed from maximum rpm results in:
• Operations taking longer; • Efficiency of engine changes but consumes less fuel; • Hull resistance drops significantly; • Propeller efficiency changes.
Saving fuel through speed reduction requires two principle conditions:
• Knowledge – being aware of the gains to be made by reducing speed; • Restraint – being prepared to reduce speed well below the vessel’s capabilities.
When considering speed reduction as a means of reducing fuel consumption it is worth remembering that the factor of real interest is the quantity of fuel used to travel a fixed distance, or the fuel consumption per nautical mile (nm), on the assumption that all fishing operations require the vessel to travel from port to the fishing grounds. Consumption per nm shows not only how engine performance changes with speed, but also propeller and hull interactions that are not evident from per hour consumption rates.
6.10.8.3.2 Effect on energy consumption (% change) – Output of GES�model runs
Table 64147: Effect on fuel consumption and gaseous emissions of reducing steaming speed from 10.3 to 8 kts
Gear reduction Base line Speed reduction % reduction
Fuel [ton/yr] 346.09 260.39 24.76
CO2 [ton/yr] 1086.63 817.15 24.80
SOx [ton/yr] 6.92 5.21 24.76
NOx [ton/yr] 28.78 27.38 4.87
HC [ton/yr] 0.65 0.45 30.15
CO [ton/yr] 1.70 1.61 5.43
The GES4simulation showed that the effect of reducing the steaming speed from 10.3 kts to 8 kts is saving a lot of fuel, about 24.8%, because the steaming time is about 48% of the sea time.
6.10.8.3.3 Effect on income (LPUE, landings per unit of effort)
Saving fuel by reducing speed will inevitably have its drawbacks; in most cases the penalty faced by the skipper is time. The decision has to be made as to whether the savings in fuel offset any potential losses as a result of the lost time. This could be loss of fishing time, loss of time off between trips or even direct commercial (financial) loss as a result of missing markets.
6.10.8.4 Hull condition/maintenance Frictional resistance or skin friction is the second most significant form of resistance following wave4making resistance. It is a measure of the energy required to overcome the resistance of the water over the hull’s surface. It affects faster vessels more than slower ones and can be reduced by steaming at slower speeds. Skin friction depends on the smoothness of the underwater surface of the hull and therefore can be controlled to some extent by the vessel operator/skipper by maintaining the vessel hull in its cleanest and smoothest condition.

380 of 425 Report Number C002/08
The process of reducing frictional resistance starts at the design and construction stage. The operator/skipper may have some influence or input during these phases to try to optimise the design with hull resistance in mind, but it is during the normal operation/maintenance of the vessel where the skipper can have more impact. The maintenance of a clean, smooth hull surface is not easy to achieve, and generally becomes more difficult and expensive with the increase in size of the vessel where docking and slipway time is involved. There are a number of pointers that can assist a skipper/operator when considering the matter of hull finish;
o It is very difficult and expensive to restore a badly degraded hull, skimping on maintenance in this area is therefore false economy;
o With new vessels it is important to ensure that the hull is in the best condition possible as it will require a lot of time, effort and expense to correct problems retrospectively.
The amount of attention spent on hull maintenance, like most measures, is best determined by balancing the pros and cons relating to the specific operation undertaken and the prevailing conditions and operational patterns. It should be commensurate with:
o The speed of the vessel (hull condition is more important for faster vessels); o The growth rate of fouling on the hull or deterioration of hull surface; o Cost of fuel; o Cost of maintenance.
As examples; any vessels which travel significant distances to their fishing grounds or whose operations incur relatively large amounts of steaming time whilst on the grounds would benefit significantly from ensuring hull condition is maintained in top condition. On the other hand, a slow speed trawler operating inshore in close vicinity to its home port may not benefit to the same degree form improved hull condition. Hull fouling has been found to reduce the free4running speed of a trawler operating close to its home port by 3k but did not affect the trawling speed or fuel consumption while actually fishing. The significant expenditure required to maintain the hull in clean condition could not be justified in this case. The way in which water flows around the hull influences skin friction and means that the most important areas of the vessel’s hull are the forward section and the propeller. With this in mind, the option of partial hull treatment could be considered as an option. Treating the forward quarter of the vessel’s hull produces approximately 1/3 of the benefits gained from the whole hull. Attention to the propeller requires a relatively small amount of effort but can produce significant gains. Propeller fouling accumulated over several months has been shown to result in a 10% increase in fuel consumption just to maintain the same operating speed.
6.10.8.4.1 Effects of hull condition/maintenance
There are two main factors influencing frictional resistance:
o Hull roughness – results from age deterioration, poor maintenance, poor surface prior to painting. Generally speaking, hull roughness is more of a problem with steel hulls which are prone to corrosion. Wooden and GRP hulls will experience an increase in hull roughness over time, mainly due to damage and the build up of old paint layers. The principal causes of hull roughness:
� Corrosion (steel hulls) 4 caused by failure of cathodic protection systems; or inadequate anti4corrosive paints;
� Poor paint finish – caused by inadequate hull preparation prior to painting; poor paint application; paint application under unsuitable conditions (weather); A fairly typical paint roughness of 250 microns will increase the friction by about 2.5%. The effect on engine power depends on what proportion of total drag is taken up by friction which in turn depends on ship speed, hull shape etc., but may typically result in a 1% increase in required power.
� Blistering/flaking – as a result of poor surface preparation; build up of old anti4fouling; poor quality paints;
� Mechanical damage – berthing impacts, cable/equipment chafing; beach landing etc.

Report Number C002/08 381/425
The rate of increase of hull roughness tends to increase with vessel age. It has been estimated that for larger steel vessels, the increase in power needed to maintain the same operational speed due to hull roughness is approximately 1% per year, i.e. for a 10 year old vessel it will require ~10% more fuel to maintain the same speed as when it was launched. This loss can be minimized by regular hull maintenance and regular replacement of sacrificial anodes and anti4corrosion paint.
o Marine fouling – results from growth of marine organisms over hull surface e.g. weed, barnacles etc. This can be more of a problem to operators than hull roughness. The problem of weed and shellfish growth on vessel hulls is influenced by the mode of operation; effectiveness of any anti4fouling treatments; local environmental conditions, e.g. water temperature. Anti4fouling paints work by slowly releasing small amounts of toxins which inhibits the growth of the marine organisms that attach themselves to the vessel’s hull. There are numerous types on the market, some more effective than others. Copper4nickel based anti4fouling treatments are being considered as alternatives to the traditional treatments. These are considered to be environmentally friendly. Their main drawback is cost compared to other types and as a result payback periods can be long. The more expensive options tend to incorporate self4polishing components which become more effective over time and have a longer life expectancy, typically ~2 years compared to most anti4fouling coatings which loose their toxicity to marine growth after ~12 months.
All vessels have additions to the underwater hull, normally termed as appendages. These include bilge keels, transducer mounts, cooling water pipes and the rudder itself can be classed as an appendage. Any appendages attached to the hull will also affect the water flow and hence frictional resistance. The total, drag of such appendages can easily add up to ~20% of the bare hull drag. Most of these appendages will be unavoidable being part of the vessels equipment. However, redundant appendages are often left attached and will only add to the hull resistance and are best removed when no longer functioning. Similarly, more consideration of the resistance impacts of retro4fitted appendages should be taken; e.g. fitting an aerofoil section rudder instead of a flat4plate rudder; recessing/fairing bolt heads etc. and adding external cooling water pipes.
6.10.8.4.2 Effect on energy consumption (% change) – Output of GES�model runs
It has been demonstrated that a 24m vessel following hull cleaning and painting achieved significant gains in speed and fuel economy in the order of ~3k increase in speed and reduction in fuel consumption of ~1.5l/hr at normal steaming rpm. (BIM trial)
An increase in friction as a result of marine growth can be in the order of 50% if the paint system is not well maintained. Barnacles are in the order of 5000 microns high and therefore excessive build up should not be allowed to occur. Estimates of increases of 7% in fuel consumption after one month and up to 44% after six months have been quoted. This can be reduced significantly by the application of anti4fouling paints and/or regular hull cleaning where it is practical. Self4polishing anti4fouling paints can result in fuel savings of up to 10% but tend to be more effective on vessels operating at higher steaming speeds in order to get the best out of the self4polishing attributes.
Table 64148: Effect on fuel consumption and gaseous emissions of hull cleaning
Gear reduction Base line Ship cleaning % reduction
Fuel [ton/yr] 346.09 342.21 1.12
CO2 [ton/yr] 1086.63 1074.45 1.12
SOx [ton/yr] 6.92 6.84 1.12
NOx [ton/yr] 28.78 28.71 0.27
HC [ton/yr] 0.65 0.64 1.46
CO [ton/yr] 1.70 1.69 0.64

382 of 425 Report Number C002/08
For the reference vessel 5% fuel saving as a result of regular hull maintenance has been estimated initially. Running GES showed that when the hull is cleaned from hull roughness 200 micron to 130 micron a fuel reduction of 1.12% is possible.
6.10.8.4.3 Investment required for maintaining hull condition (* 1000 €)
Cost estimates for dry4docking, hull preparation and hull treatment: €3.5k This would be carried out annually under most circumstances, with a maximum period between maintenance of 2 years.
6.10.8.4.4 Effect on income (LPUE, landings per unit of effort)
Unknown, assumed no effect.
6.10.8.5 Sail Assisted Propulsion
Considerable fuel savings have been demonstrated by using sail power as auxiliary propulsion. Small vessels undertaking relatively long trips have recorded savings as high as 80%. Specific circumstances are required to make motor sailing a viable technology in terms of weather conditions, vessel design, operational requirements/constraints, crew ability and attitude. The limit of practical sail size for most moderately sized fishing vessels will be in the order of 30m2 which would produce ~1000N thrust equating to ~6% contribution to the required power. Kites as wind propulsion are a relatively new technology and are being considered more and more as viable options. However, their application to trawling vessels is still limited.
6.10.8.5.1 Effects of sail assisted propulsion
The introduction of sails to a fishing vessel (or any vessel for that matter), puts additional requirements on the vessel with respect to rigging, stability, deck layout, space etc. Sail propulsion while a vessel is actually trawling would only be practical with traditional sail technology while the wind direction was coming from the vessels stern direction. For typical sails with the wind on the beam, the force required to resist the sideways motion would require an extremely large keel area. This would make it practically impossible to operate at the slow speeds required for trawling. Additional ballast and/or ballast keels may be required to maintain stability. On any fishing vessel, sails will hinder the working arrangements on deck and deck space will inevitably be lost to accommodate the mast(s) and associated rigging and sail storage. The design of a sailing rig for a working fishing vessel should be kept as simple as possible with the minimum amount of rigging. Sailing is a skill in itself and to be effective the crew must be proficient and willing ‘sailors’. This is not considered to be a commercially viable option for the reference vessel.
6.10.8.5.2 Effect on energy consumption (% change) – Output of GES�model runs
Sails can result in large fuel savings, depending on prevailing conditions. Figures in the order of 5% for variable conditions to as high as 80% for small vessels on long journeys with beam winds have been achieved. These figures are obviously dependant on factors such as crew ability, vessel design, sail size and design.
6.10.8.5.3 Investment required for sail assisted propulsion (* 1000 €)
Considerable structural alterations would be required to adapt reference vessel. No information on costs available.

Report Number C002/08 383/425
6.10.8.5.4 Effect on income (LPUE, landings per unit of effort)
Unknown, assumed no effect.
6.10.9 Improvements relating to fishing vessel design and engineering:
This section deals with the more technical fuel efficiency measures that would require relatively major investment in new equipment and/or modification of existing equipment. These would be best considered when a vessel operator is considering investing in a new build and/or undertaking a major overhaul of an existing vessel. Three main areas are examined:
1. The propeller; 2. Hull design; 3. Propulsion units/Engines.
6.10.9.1 The fishing vessel propeller (design and maintenance)
6.10.9.2 Propeller design Correct propeller design is critical to successful operation of a trawler. The propeller translates the engine power into thrust to overcome the resistance of the vessel and to provide towing power. Propeller design and specification has a direct influence on fuel efficiency. Poor propeller design is the most frequent single contributor to fuel inefficiency. It is a complicated and specialist area and should be entrusted to qualified and experienced professionals. The first step in assessing the suitability of an installed propeller for a particular vessel and engine arrangement is comparative observation – does the vessel perform as well as others of similar power and design? The propeller may be incorrectly specified if:
• Engine fails to achieve designed rpm and is over4loaded; • Engine exceeds designed rpm at full throttle, over4revs and is under4loaded; • The propeller is over4loaded and shows signs of cavitation and surface erosion.
6.10.9.2.1 Effects of propeller design
A fixed pitch propeller can only be designed to absorb full power at one design point. There are two basic extremes of propeller design and performance. The propeller can be designed to achieve maximum amount of pull whilst towing (towing propeller) or designed to give maximum thrust for full speed (free4running propeller). Normally a propeller design strikes a balance between these two extremes. This compromise depends on the operational requirements and demands of the fishery in which the vessel is to operate. Vessels undertaking a lot of steaming will require better free4running capabilities than those operating in inshore waters and requiring most of their effort concentrated in the towing of the gear. A propeller designed to give maximum thrust at a point between towing and free4running is known as a compromise propeller. Some fishing operations require the propeller to give a pull below that which is available from a propeller designed for maximum free4running speed and in this case the free4running design point would be the best choice. Overloading of the engine as the result of the installation of a propeller with too much pitch is the most common source of fuel inefficiency. It is important to remember that it is excessive load on a diesel engine not rpm that dictates fuel consumption.

384 of 425 Report Number C002/08
The installation of a propeller with too small a diameter or insufficient pitch can result in engine under4loading. Small changes to propeller pitch can be made by specialist re4pitching usually carried out by the original propeller manufacturer. Another option is the use of a controllable–pitch (CP) propeller. This enables the propeller to be operated efficiently while towing and free4running. This option requires more skill and experience to establish the correct pitch setting for varying conditions. Setting of incorrect pitch can result in significantly increased fuel consumption. A well designed and correctly operated CP propeller can result in fuel savings of up to 15% when compared with a fixed4pitch propeller Many fishing vessels find themselves operating under conditions differing from those which they were originally designed for and the propellers may not be optimal for the new operating conditions. Considerable fuel savings, improved towing capabilities, and/or improved steaming speeds can be achieved by modifying or replacing the existing propeller with a new one to an optimised design for the new operating conditions. The propeller has the first call on the power available from the engine. When there are other power demands from take4offs, e.g. pumps, generators etc., then the total power demand on the engine may be in excess of its rated power and cause overheating if the propeller has been designed to take maximum load in that area of engine operation. It must be remembered that the propeller is only one item in the propulsion package and due account must be taken of the other contributors when designing a propeller.
6.10.9.2.2 Effect on energy consumption (% change) – Output of GES�model runs
A well designed and correctly operated CP propeller can result in fuel savings of up to 15% when compared with a fixed4pitch propeller.
6.10.9.2.3 Investment required for optimising propeller design (* 1000 €)
No information available.
6.10.9.2.4 Effect on income (LPUE, landings per unit of effort)
No effect on LPUE assumed.
6.10.9.3 Propeller maintenance Propeller efficiency can be significantly reduced by poor condition of the blades as a result of damage, fouling, corrosion and erosion (cavitation). Highly loaded propellers are more sensitive to surface condition. Roughness and damage – damage to the outer regions of the propeller blade, particularly on the leading edge of the forward (low4pressure) face, can promote cavitation and erosion of the blade itself thus leading to even more roughening of the surface. Trailing edge damage such as bending can result in under or overloading at the designed shaft speed. This can have a serious effect on both engine condition and fuel efficiency. Fouling – Marine growth on propellers has more of an effect on efficiency than roughness. The surface area of a propeller is very small relative to the hull area, and proportionately greater savings can be made per man4hour of effort exerted through regular propeller maintenance.

Report Number C002/08 385/425
6.10.9.3.1 Effect on energy consumption (% change) – Output of GES�model runs
On large propellers, roughness can account for increases in fuel consumption of 4% after as little as 12 month’s service. US Naval trials demonstrated that weed growth on propellers accounted for an increase in fuel consumption of ~10% after a period of only 7.5 months. For reference vessel an estimated increase in fuel consumption in the region of 5% would not be unreasonable.
6.10.9.3.2 Investment required for propeller maintenance (* 1000 €)
This would normally be covered under general annual hull maintenance. Dry4docking or slipping the vessel specifically for propeller maintenance at estimated cost of €2k.
6.10.9.3.3 Effect on income (LPUE, landings per unit of effort)
Expected to ne none.
6.10.9.4 Propeller nozzles
Towing efficiency can be substantially improved by fitting a nozzle. A nozzle is a short close fitting duct enclosing a propeller, slightly tapered with an aerofoil cross4section.
6.10.9.4.1 Effects of propeller nozzle
As a propeller blade turns in water it creates high4pressure areas behind and low4pressure areas in front of each blade. The pressure differential created produces the force to drive the vessel forward through the water. As water escapes from the high4pressure to the low4pressure side of the blades, losses occur at the blade tips reducing the forward motion. The close4fitting duct shape of the nozzle reduces these losses and hence increases thrust. In addition, the water flowing around the nozzle produces a lift force with a component parallel to the line of the propeller shaft – in a similar way to the lift produced by the wing of an aeroplane. The water flowing around the propeller interacts with the aerofoil cross4section of the nozzle resulting in a low4pressure area on the inside of the nozzle and high4pressure on the outside. The tapered shape of the nozzle helps to translate this force into forward thrust. This component can be as much as 40% of the total thrust from the propeller and nozzle combined. This effect is most significant at low speed. At high speeds (above 9k), the nozzle can generate more drag than thrust and therefore can have a negative effect on fuel efficiency. Careful consideration should be made when retro4fitting a nozzle. The vessel may have been designed to take an open propeller and as such the propeller aperture may be insufficient to accommodate a nozzle to match the installed propulsion unit.
6.10.9.4.2 Effect on energy consumption (% change) – Output of GES�model runs
The benefits of a nozzle are thus increased towing power or improved fuel efficiency. A correctly chosen and installed nozzle can result in an increase in towing force of about 25 – 30%. For trawlers this benefit can result in the following operational changes:
• Trawling can be carried out with the same gear, at the same speed but at lower rpm thus allowing fuel saving. The savings should be slightly less than the thrust gain, ~20%;

386 of 425 Report Number C002/08
• Fishing can be conducted with the same gear at a faster trawling speed – no fuel saving but potentially increased catching performance;
• Larger gear can be used fishing at the same towing speed. The downside or negative aspects of the use of a nozzle are:
• Loss of maneuverability; • Loss of power when going astern; • Relatively expensive installation; • Possibility of cavitation within the nozzle.
For the reference vessel, a correctly specified nozzle compatible with the overall propulsion system should provide fuel reductions in the region of 15% compared to vessel without a nozzle.
6.10.9.4.3 Investment required for propeller nozzle (* 1000 €)
No cost information available. Estimated payback time for retro4fitted nozzle in the region of 1.5 – 2 years.
6.10.9.4.4 Effect on income (LPUE, landings per unit of effort)
Assumed none.
6.10.9.5 Hull design
When considering overall hull form or shape (lines) this is a fixed parameter than can not normally be changed easily post construction. However, addressing the background factors that determine the design parameters of modern fishing vessels will go a long way to addressing the issues of effective power, propulsion requirements and fuel efficiency. The vessel’s proportions are important in this respect. Generally speaking, vessel design has changed considerably over recent years to take account of Regulatory changes. 90% of the UK fishing vessels today are less than 15m in length and are built to be ‘rule beaters’, to either circumvent licensing requirements/build standards and MCA requirements. This has resulted in fishing vessels being built with increased beam dimensions relative to their length, i.e. the length: beam ratios have decreased. The resultant increase in resistance associated with these changes has led to significant increases in fuel costs associated with these vessel designs. There are also implications for propulsive efficiency related to water flow around the propeller, steering, stability and working conditions.
6.10.9.5.1 Effects of hull design
There are two aspects of hull design that affect fuel efficiency. The underwater hull shape at the stern, in the vicinity of the propeller, affects the water flow in and around the propeller. The overall hull shape, (lines) affects the vessel’s resistance and hence its power requirements and fuel consumption. In general, a long, thin vessel is easier to propel through the water than a short fat one. Power curves can give a good indication of the influence of hull form on performance. For short, fat vessels the curve is steeper and the maximum reasonable speed (beyond which fuel consumption becomes excessive) is around 15% slower than that for a long thin vessel. In an ideal situation the propeller should operate in an area of smooth flowing undisturbed water. In practice this is almost impossible to achieve because of the construction of the hull. In other words, structures such as the deadwood, propeller post, skeg just ahead of the propeller interrupt the water flow. To improve performance

Report Number C002/08 387/425
these structures should be designed and constructed to minimize disturbance to the water flow. This can be achieved by:
• Ensuring an adequate distance between the propeller and the deadwood, (at least 0.27 x propeller diameter);
• Fairing the deadwood to produce a thin smooth trailing edge. Vessels with fine bow sections producing a narrow angle of entry (cutting effect) have lower wave resistance. In principle, the surface of the hull should not be at an angle greater than 15 to 20º relative to the centre line – this is often impossible to follow with the requirement to produce vessels with fatter and fuller forms necessary for particular applications. For relatively slow vessels such as trawlers, a flat transom stern is often the most practical design from the point of view of the fishing operation and space; however, it presents higher resistance characteristics when compared to a cruiser style stern.
6.10.9.5.2 Effect on energy consumption (% change) – Output of GES�model runs
Macduff Ship Design (UK) in conjunction with CTO, the tank testing facility in Gdansk, Poland have been researching hull forms in an attempt to find design solutions to the continuing increase in the cost of fuel. By going back to first principles and examining all aspects of ship design, they are developing new hull forms for fishing vessels which are capable of achieving increased free4running speeds, decreased power requirements (~40%), increased towing capabilities and improved sea4keeping qualities. The approach taken includes examining the close relationship between ballast and the vessels beam dimension. Increased beam has allowed reduction in the amount of internal ballast required but without increasing the overall displacement, even with larger designs. The increased beam allows for a finer hull form below the waterline improving water flow into a larger diameter propeller. This coupled with a new modified bow section all contribute to the improved fuel efficiency achievable with the new design.
6.10.9.5.3 Investment required in relation to hull design (* 1000 €)
Not available here.
6.10.9.5.4 Effect on income (LPUE, landings per unit of effort)
Not known.
6.10.9.6 Propulsion units/engines
Fuel economy of a fishing vessel is invariably based on the size and type of engine installed. Previous discussions regarding the fuel savings to be made by operating at slower speeds will not apply if the engine installed has been poorly specified in the first place. When a vessel is operating at reduced speed, its engine is often being underused. Under these circumstances it may be better to install a smaller engine to be operated at ~75480% of maximum continuous rating (MCR) as the most efficient service engine speed, in order to achieve the same reduced vessel speed. This choice could reduce capital cost, fuel consumption and also reduce maintenance costs.

388 of 425 Report Number C002/08
6.10.9.6.1 Effects of propulsion units
For larger fishing vessels operating mobile gears, the power requirements are more dependant on the actual gear used and the amount of time spent steaming. Where fishing vessels are concerned compromises are invariably the order of the day. Smaller diesel engines are normally aspirated (simplicity and cost). Larger engines may be turbocharged to maximize efficiency and save weight and can be up to 15% more fuel efficient than a normally aspirated engine of the same power. In order to maintain fuel efficiency a turbocharger should be driven hard. Where an engine is to be operated at intermediate or reduced loads, then a normally aspirated engine may be a better choice. Electronically controlled engines can produce fuel savings when compared to their mechanically controlled equivalents. The diagnostic capabilities associated with electronically controlled engines allow more consistent performance and can reduce repair bills through preventative maintenance. The electronic controls co4ordinate and enhance fuel delivery, air supply and other engine functions, meaning that diesel consumption can be lower than with a comparable mechanically controlled engine. A recent development aimed at the larger classes of demersal trawlers (30 – 60m) operating auto4trawl (automatic winch control) systems, is a facility incorporated into the Norwegian SCANTROL iSYM (Intelligent Symmetry Control) system known as the TrawlPull feature. The feature is used to quickly adjust the engine power required to tow the gear under varying towing conditions. The iSYM system calculates the force being used to pull the trawl through the water from tensions in the trawl warps through the autotrawl system. This also takes into account water depth and trawl door spread. Once the correct towing power for particular circumstances has been established through experience, it is used as the reference point for adjusting the engine power when towing in changing tides and weather conditions. This technology has been demonstrated to produce fuel savings in ~35 vessels. Reference SCANTROL 4 Scandinavian Control Systems, AS, Norway.
6.10.9.6.2 Effect on energy consumption (% change) – Output of GES�model runs
Diesel Electric propulsion systems are estimated to produce ~10% fuel savings over the lifetime of the unit compared to a conventional propulsion package. However, further investigation is required on these systems as fuel efficient alternatives for trawlers. Cruise control systems provide automatic correlation of vessel speed and engine rpm to ensure optimum revs at all times to control fuel consumption. Propulsion units supplied with this facility coupled to fuel flow measurement systems have been demonstrated to be very effective as a means of controlling fuel consumption.
6.10.9.6.3 Investment required in relation to propulsion units (* 1000 €)
Not available here.
6.10.9.6.4 Effect on income (LPUE, landings per unit of effort)
Not known.

Report Number C002/08 389/425
6.10.9.7 Fuel flowmeter systems – application and benefits relating to fuel efficiency:
A fuel flowmeter can provide an operator with a means of monitoring fuel consumption rate and relating that consumption directly and instantly to the operating modes of the vessel and machinery. This allows better fuel management relating to operations.
6.10.9.7.1 Effects of fuel flowmeter systems
A diesel engine converts the fuel injected into the cylinders into heat, pressure and mechanical energy and so an accurate fuel flowmeter has the potential to serve as a horse4power meter fitted to the engine shaft, assuming that the engine is under load, (specific fuel consumption will vary with load). A fuel flowmeter can act as a fault diagnostic device when showing excess fuel consumption for a particular operating mode. For example it could indicate faulty and/or leaking injectors and pipes, propeller damage or in the longer term even increased hull resistance as a result of fouling. In combination with engine tachometer and ship speed log, a fuel flowmeter can be a very valuable asset where a vessel has a controllable pitch propeller. This type of meter can indicate to the skipper the best engine rpm and propeller pitch settings for optimum efficiency during the various operations of the vessel and fishing gear.
6.10.9.7.2 Effect on energy consumption (% change) – Output of GES�model runs
Intelligent use of flow meters can produce financial savings on fuel consumption, which in most cases will recover the capital cost of the system over a relatively short time. The situations where the most significant savings can be made are:
• Reduction of free4running speed, particularly when a vessel has a large installed power for its size; • When a vessel is fitted with a controllable pitch propeller.
6.10.9.7.3 Investment required in relation to fuel flowmeter systems (* 1000 €)
Further information to be included – awaiting report
6.10.9.7.4 Effect on income (LPUE, landings per unit of effort)
Not available here.

390 of 425 Report Number C002/08
6.10.10 Summary Table of Adaptations for Reference Vessel
Table 64149: Summary of effects on fuel savings, investment costs, and landings for adaptations studied
No Adaptation Potential Fuel Saving (%) Investment Costs (€) Effect on LPUE (%)
1 Dynex warps 5 25500 none
2 Sweep bridle adjustments 4 4 4
3 Door optimisation 10 6250 none
4 Reducing net drag by 6% 15 12700 n/a
5 Replacing MDO by HFO 46.7 4 none
6 Hull cleaning 5 3500 none
7 Steaming speed reduction 24.8 none n/a
6.10.11 References

Report Number C002/08 391/425
Segment (gear, length, power): OTB, 24440 m, 670 kW (911 hp) Participant: SEAFISH Author: K. Arkley, J. van Vugt
6.10.12 Reference design: OTB, 24440 m
6.10.12.1 Vessel
Figure 6482: Reference vessel for segment OTB 24 4 40m (Vessel ID deleted)
This vessel is a relatively new design of white4fish vessel built to operate as a single/twin4rig trawler/pair seiner. The 28 m long vessel has a beam of 8.6 m with a moulded depth of 4.0 m and a draft of 5.0 m. This space accommodates a 160 m3 capacity chilled fish room with a flake ice machine and slurry ice plant. The vessel design features a round bilge hull form with bulbous bow and stern skeg, flared soft nose stem and transom stern. The vessel has fully enclosed shelter decks and all fishing operations are carried out over the stern. The codend retrieval hatch is centred between twin trawl tracks (Table 64150). Below the main deck the hull is subdivided into five watertight compartments – forepeak, tank section with port and starboard deep fuel tanks, insulated fish room, engine room and aft peak housing fuel and lube oil tanks. The main deck layout consists of a forward winch room with a fish handling system arranged along the starboard side. The flake and slurry ice machinery is situated on the portside forward of the accommodation section. The main accommodation section consists of three twin berth, ensuite cabins situated amidships with a twin berth ensuite skippers cabin at shelter deck level under the wheelhouse. A large mess deck/day lounge and galley are also situated on this level. A central catch hopper aftside is flanked by an engineering store on one side and a gear store on the other.

392 of 425 Report Number C002/08
The vessel has a well equipped wheelhouse with all an aftside console for controlling deck machinery. The vessel is powered by a 670 kW main engine driving a 2800 mm 44bladed propeller in a fixed nozzle through an 8.5:1 reduction gearbox. This enables the vessel to achieve a top speed of 11.5 knots (at 90% load). The vessel has a bollard pull of ~18 tonnes which equates to ~20kg per unit of main engine horsepower (900). Two 164 kW auxiliary engines drive 130 kW generators and the compressors for the slurry and flake ice plants. The deck machinery includes three split trawl winches housed in a winch room situated forward on the main deck. Two outer winches rated at 15 tonnes are used for single and/or twin rig trawling. The third centre winch is rated at 25 tonnes and used when twin rig trawling and for seining. For trawling the winches are spooled with 24 mm wire on the outer drums and 28 mm on the middle drum. For seining/pair seining the centre winch is also spooled with 50 mm diameter seine rope. The trawl wires have direct leads under the wheel house floor to hanging blocks suspended within the full width stern gantry. The nets are store and handled from two large split net drums mounted abaft the accommodation casing at shelter deck level at the head of the twin trawl tracks. These lead to the hauling and shooting openings across the transom. These can be sealed off in poor weather to give protection to the crew when working on deck in heavy weather. Other gear handling equipment/machinery includes two 104tonne bagging winches mounted towards the transom stern on the shelter deck. These are used to ease handling of the net (pair seine) during hauling and shooting. The codend is lifted centrally at the transom by a 5.5 tonne Gilson through the stern gantry and received into a reception hopper. Further net handling assistance is provided by a long4reach landing crane mounted on top of the stern gantry.
Table 64150: Main particulars of the reference vessel
Item Value
Length over all (m) 28.35
Breadth (moulded, m) 8.6
Mean draft (m) 5.0
Depth (moulded, m) 4.0
Main engine power (kW) 670
Main target species Mixed groundfish
6.10.12.2 Gear The gear described here is that used in the pair seining operation. Two net types are used to take account of the different fishing ground conditions encountered. A large seine net rigged on 250 feet of 12/14 inch discs for working relatively clean ground. This net has 750 x 6.25 inch meshes in the fishing circle producing a high headline height to target a range of groundfish species. Twine diameter in the main body of the net is ~3 mm, with codends constructed in 110 mm mesh size x 5mm (double) twine diameter. For rougher ground operations the vessel works a hopper pair seine rigged with 16/18 inch hoppers on a more tightly spaced groundgear of 150 feet in length. This net has a fishing circle of 580 x 8 inch meshes (Table 64151).

Report Number C002/08 393/425
Table 64151: Main particulars of fishing gear of the reference vessel
Item Value
Gear code (OTB…) Demersal pair seine
Type description clean ground disc net; hard ground hopper net
Otter boards (type, size, and weight) NA
Main gear dimensions (circumference, beam width, (m)) 750 x 6.25 inch; 580 x 8.0 inch
Headline length (m) 4
Footrope length (m) 250 ft; 150 ft
Cod end mesh size (mm) 110
6.10.12.3 Operational profile For this reference vessel seining operations are reviewed. Seining differs from towing a net at certain speed in the sense that the long seining ropes are hauled in with steps of differing speeds. while the vessel is at anchor or progressing slowly, then finally the net is heaved in quickly, but closing also. As these boats are fishing in pair we have two sets of towing boats and one taking in the gear. Fishing operations take place mainly in the North Sea ranging from Shetland waters out to the Norwegian grounds such as Bergen and Egersund Banks. Trip lengths are normally 6 days. Operations when seining vary depending on time of year. The operation is predominantly one which takes place in daylight and therefore this dictates the number of tows in each 24 hour period. The normal range of sets is between 4 and 9. Each set or cycle will be ~2 hours consisting of ~ 1 hour fishing time and ~ half an hour for hauling and half an hour for shooting. The pair seining operation will be slightly different being similar to a pair trawling operation (Table 64152).
Table 64152: Time split over operational modes
Operational mode Percentage of time
Steaming to and from fishing grounds 48 hours/~20 4 30%
Shooting and hauling gears 1 hour
Fishing Average 7 sets over year – 2hours /set
including hauling and shooting 4 ~60 4 70%
dependant on time of year.
Searching ~10%
Time in harbour 36 hours
Table 64153: Operational profile for the base line reference vessel
Name Duration Distance Velocity
[4] [hrs] [nm] [kn]
Harbour 48.00 0.0 0.0
Steaming to fishing ground 24.00 240 10.00
Shooting gears 28.80 86.4 3.00
Fishing 28.80 115.2 4.00
Hauling gears 14.40 43.2 3.00
Steaming to port 24.00 240 10.00
Harbour operation 0.00 0 0.0
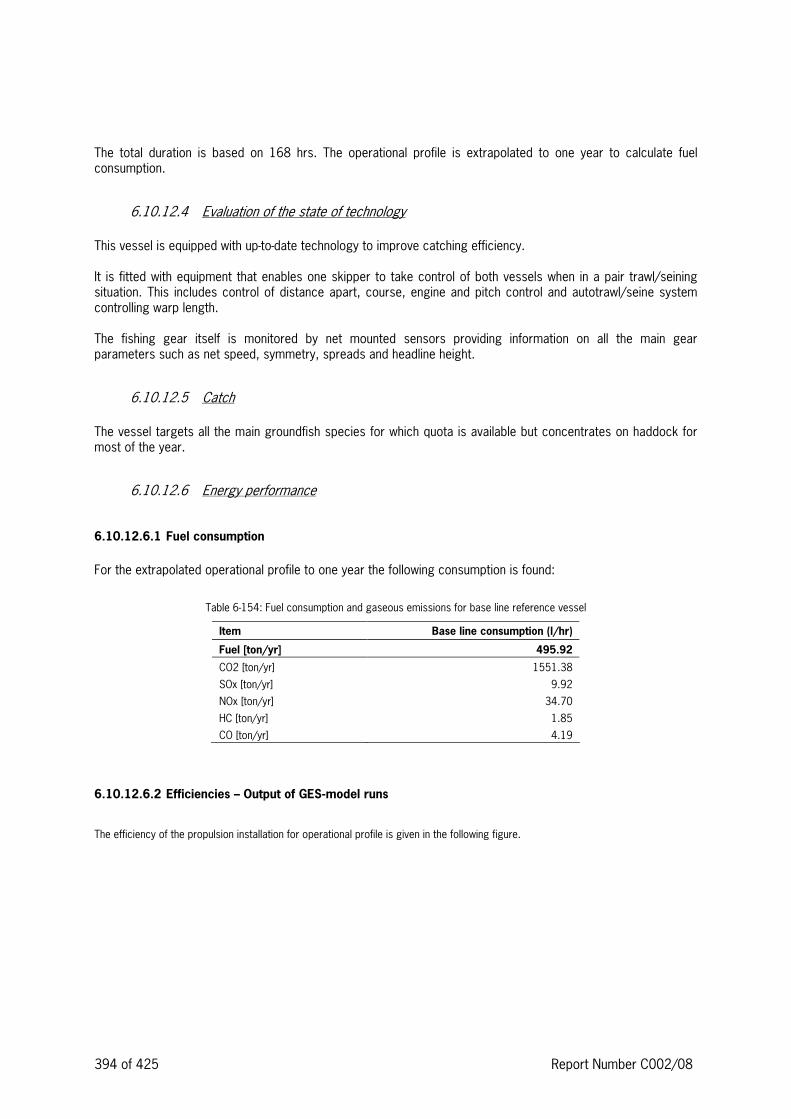
394 of 425 Report Number C002/08
The total duration is based on 168 hrs. The operational profile is extrapolated to one year to calculate fuel consumption.
6.10.12.4 Evaluation of the state of technology This vessel is equipped with up4to4date technology to improve catching efficiency. It is fitted with equipment that enables one skipper to take control of both vessels when in a pair trawl/seining situation. This includes control of distance apart, course, engine and pitch control and autotrawl/seine system controlling warp length. The fishing gear itself is monitored by net mounted sensors providing information on all the main gear parameters such as net speed, symmetry, spreads and headline height.
6.10.12.5 Catch The vessel targets all the main groundfish species for which quota is available but concentrates on haddock for most of the year.
6.10.12.6 Energy performance
6.10.12.6.1 Fuel consumption
For the extrapolated operational profile to one year the following consumption is found:
Table 64154: Fuel consumption and gaseous emissions for base line reference vessel
Item Base line consumption (l/hr)
Fuel [ton/yr] 495.92
CO2 [ton/yr] 1551.38
SOx [ton/yr] 9.92
NOx [ton/yr] 34.70
HC [ton/yr] 1.85
CO [ton/yr] 4.19
6.10.12.6.2 Efficiencies – Output of GES�model runs
The efficiency of the propulsion installation for operational profile is given in the following figure.

Report Number C002/08 395/425
Efficiency [-]
0
0.05
0.1
0.15
0.2
0.25H
arbo
ur
Ste
amin
g to
fish
ing
grou
nd
Fre
e ge
ars
Fis
hing
Pul
l gea
rs
Ste
amin
g to
harb
our
Har
bour
ope
ratio
n
Efficiency [-]Title:Demersal Seiner/Trawler, Technology:2008Run date:13-10-2008/13:43:36Input file:COMOutput file:Results.csvResults file:ResultsOutput.csv
Figure 6483: Efficiency of the installation by operational mode for the base line
The lowest efficiency is found for the installation for handling fishing gear, the highest when steaming to and from the fishing grounds. This is a normal for the examined fishing vessels.
6.10.12.6.3 Energy distribution – Output of GES�model runs
The propeller power is only needed for obtaining ship speed. The gear power during fishing is must higher than the ship speed power, also is the efficiency of the installation not optimal compared to the steaming condition, but that is the case for all the fishing vessels.

396 of 425 Report Number C002/08
Operational Profile, Required Power [kW]
0
50
100
150
200
250
Har
bour
; 48
hr/y
r
Ste
amin
g to
fish
ing
grou
nd; 2
4 hr
/yr
Fre
e ge
ars;
28.
8hr
/yr
Fis
hing
; 28.
8 hr
/yr
Pul
l gea
rs; 1
4.4
hr/y
r
Ste
amin
g to
harb
our;
24
hr/y
r
Har
bour
ope
ratio
n;0
hr/y
r
Hotel_load
Gears
Propellers
Title:Demersal Seiner/Trawler, Technology:2008Run date:13-10-2008/13:43:36Input file:COMOutput file:Results.csvResults file:ResultsOutput.csv
Figure 6484: Required power in kW of the installation by operational mode for the base line
6.10.13 Adaptations under study – Adaptation No 1: Fishing gear related measures – reduction of the fishing gear’s towing resistance
6.10.13.1 Short description of Adaptation No 1 The adaptations or measures for reducing fuel consumption for this reference vessel are the same as those described for the OTB 12 4 24m class of demersal trawler in the previous section. In most circumstances the outcomes described will be very similar. When considering the reduction of overall towing resistance of the fishing gear for this reference vessel, the same approach can be applied. The only difference that would be evident when compared to the 12424m reference vessel would be as a result of the 24 4 40 m reference vessel operating in the seine netting mode. In this operation, without the use of trawl doors, the scope for reducing the overall drag of the gear would most likely be reduced. In seining, the warps used in trawling are replaced by seine rope which relies on its inherent weight and relatively large diameter for its catching effectiveness in the fish herding/capture process. To this end, the most recent trend in this type of fishing has been to increase the diameter of seine ropes to improve catching efficiency for certain target species. This has countered the opportunity for reducing the overall drag of the gear with regard to the components connecting the net to the vessel. In terms of the actual net design and construction itself, theoretically, the same adaptations as identified for the trawl gear could be used for the seine net. However, it is fair to say that in practical terms, very little work has been carried out to test the adaptations described for the 12424m reference vessel, (such as T90 technology), in a seine netting application. The use of lighter, higher specification materials for the framing of the seine net could still be applied.

Report Number C002/08 397/425
Other adaptations such as headline kites to replace conventional floats may not be practical as a result of the lower towing speeds used in seine netting. In terms of overall gear drag, considering the seine netting mode of operation, a realistic estimate of reduction in fuel consumption as a result of incorporating the measures identified would be ~10%. The vessel and vessel operation related measures/adaptations described for the 12 424m reference vessel can be applied to the 24 – 40m reference vessel. Using the GES4model four adaptations were run: a reduction of gear drag by 10%, a reduction of engine rpm, a reduction in both steaming and fishing speeds by 10%, and the effect of hull cleaning.
6.10.13.2 Effects of Adaptation No 1
6.10.13.2.1 Effect on energy consumption (% change) – Output of GES�model runs
For a reduction in gear resistance of 10% the following reduction in fuel consumption is found.
Table 64155: Effect on fuel consumption and gaseous emissions of applying fishing gears with 10% less drag
Gear reduction Base line Gear drag reduction of 10% % reduction
Fuel [ton/yr] 495.92 471.13 5.00
CO2 [ton/yr] 1551.38 1473.38 5.03
SOx [ton/yr] 9.92 9.42 5.00
NOx [ton/yr] 34.70 33.76 2.72
HC [ton/yr] 1.85 1.81 2.23
CO [ton/yr] 4.19 4.17 0.59
The model predicts a decrease in fuel consumption of 5% with this adaptation.
6.10.13.2.2 Investment required for the adaptation (* 1000 €)
Unknown.
6.10.13.2.3 Effect on income (LPUE, landings per unit of effort)
Unknown.
6.10.14 Adaptations under study – Adaptation No 2: Reduction of engine rpm.
6.10.14.1 Short description of Adaptation No 2 The ship speed is controlled by a CPP controller. The motor speed for fishing and steaming is held constantly at 1200 rpm. A reduction in fuel consumption can be found when using lower engine speeds: for steaming at 10 kts the optimum engine speed is 919 rpm, and for fishing at 3 kts 952 rpm. These values were used in the GES4simulation.

398 of 425 Report Number C002/08
6.10.14.2 Effects of Adaptation No 2
6.10.14.2.1 Effect on energy consumption (% change) – Output of GES�model runs
Table 64156: Effect on fuel consumption and gaseous emissions of applying engine speed (rpm) reduction
Gear reduction Base line Lower engine rpm % reduction
Fuel [ton/yr] 495.92 444.87 10.29
CO2 [ton/yr] 1551.38 1396.89 9.96
SOx [ton/yr] 9.92 8.90 10.29
NOx [ton/yr] 34.70 36.42 44.94
HC [ton/yr] 1.85 0.86 53.39
CO [ton/yr] 4.19 2.06 50.94
For this ship a reduction of 10.3% is possible by using better power management of the engine speed (rpm) in combination with the CPP.
6.10.14.2.2 Investment required for the adaptation (* 1000 €)
None.
6.10.14.2.3 Effect on income (LPUE, landings per unit of effort)
Unknown.
6.10.15 Adaptations under study – Adaptation No 3: Reduction of steaming and fishing speed by 10%
6.10.15.1 Short description of Adaptation No 3 See Section on first UK reference, OTB 12424m vessel above.
6.10.15.2 Effects of Adaptation No 3
6.10.15.2.1 Effect on energy consumption (% change) – Output of GES�model runs
The effect of a reduction of fishing and steaming speed with 10% is given below using the operational profile in the following table.

Report Number C002/08 399/425
Table 64157: Operational profile for the base line reference vessel
Name Duration Distance Velocity
[4] [hrs] [nm] [kn]
Harbour 48.00 0.0 0.0
Steaming to fishing ground 24.00 216 9.00
Shooting gears 28.80 77.76 2.70
Fishing 28.80 103.68 3.60
Hauling gears 14.40 38.88 2.70
Steaming to port 24.00 216 9.00
Harbour operation 0.00 0 0.0
Table 64158: Effect on fuel consumption and gaseous emissions of reducing steaming and fishing speed by 10%
Gear reduction Base line Operational speed reduction % reduction
Fuel [ton/yr] 495.92 432.66 12.76
CO2 [ton/yr] 1551.38 1352.31 12.83
SOx [ton/yr] 9.92 8.65 12.76
NOx [ton/yr] 34.70 32.32 6.88
HC [ton/yr] 1.85 1.75 5.57
CO [ton/yr] 4.19 4.13 1.35
If steaming and fishing speed are reduced with 10% the reduction in fuel consumption is about 12.76%.
6.10.15.2.2 Investment required for the adaptation (* 1000 €)
None.
6.10.15.2.3 Effect on income (LPUE, landings per unit of effort)
Likely smaller catch due to loss in fishing time and towing speed.
6.10.16 Adaptations under study – Adaptation No 4: Hull cleaning
6.10.16.1 Short description of Adaptation No 4 Hull cleaning is described in Section 6.10.1 for the 12414m boat.
6.10.16.2 Effects of Adaptation No 4
6.10.16.2.1 Effect on energy consumption (% change) – Output of GES�model runs

400 of 425 Report Number C002/08
Table 64159: Effect on fuel consumption and gaseous emissions of hull cleaning
Gear reduction Base line Hull cleaning % reduction
Fuel [ton/yr] 495.92 491.75 0.84
CO2 [ton/yr] 1551.38 1538.24 0.85
SOx [ton/yr] 9.92 9.83 0.84
NOx [ton/yr] 34.70 34.55 0.45
HC [ton/yr] 1.85 1.85 0.30
CO [ton/yr] 4.19 4.19 0.02
If the hull is cleaned leading to a hull roughness reduction from 200 micron to 130 micron a fuel reduction of 0.84% is possible.
6.10.16.2.2 Investment required for the adaptation (* 1000 €)
See above.
6.10.16.2.3 Effect on income (LPUE, landings per unit of effort)
None
6.10.17 Summary Table of Adaptations for Reference Vessel
Table 64160: Summary of effects on fuel savings, investment costs, and landings for adaptations studied
No Adaptation Potential Fuel Saving (%) Investment Costs (€) Effect on LPUE (%)
1 Lower gear drag 10 ? n/a
2 Lower engine rpm 10.3 none n/a
3 Steaming and Fishing speed 10% lower 12.8 none n/a
4 Hull cleaning 0.8 3500 none
6.11 Catalogue of available technical solutions to improve energy efficiency
6.11.1 General
Using the information collected and analysed in the sections above, a list of technical solutions with theoretical background where applicable is given below split in: vessel design, propulsion systems, efficiency of the onboard energy consumers, alternative energy sources, fishing gear design for greater energy efficiency, fishing tactics. A summary table is given at the end of each section with: a short description of the adaptation, its potential fuel saving in %, the investment costs in €, and relevant comments.

Report Number C002/08 401/425
6.11.2 Vessel design
A fishing vessel is a complex technical system operating at very different modes, i.e. steaming to and from fishing grounds, searching for fish, shooting and hauling fishing gears, towing gears, and processing catches onboard. In this respect fishing vessels differ greatly from merchant vessels designed to carry cargo from one port to another and a more or less constant sailing speed. Fishing vessels earn their existence by catching marine organisms, processing these catches and bringing them to the fish auction where they are sold. Any change in technology or operation will likely affect the earning capacity of a fishing boat. Crucial here is the operational profile which means the time intervals for each operational mode. E.g. when changing fishing grounds times to travel and fish may alter, thus affecting energy consumption and income. The design of fishing vessels is often restricted in terms of size or tonnage, main engine power, size of gears, and even days4at sea. Regulations may therefore stimulate the construction of vessels that are not optimal in terms of energy use. The study on the so4called ‘green trawler’ concept given in Chapter 6.7 in Ireland illustrates this point. The steaming operation is often carried out at higher speeds (around 10 knots) than fishing (around 346 knots), and the resistance of the vessel’s hull is very different in both conditions. While steaming the resistance is high, but at towing speed relatively low, and in this case the dominating drag is that of the fishing gear. Vessel design to improve energy consumption depends very large on the operational profile. In the examples given in this report energy savings are sought in reducing the drag of the hull in the steaming condition, e.g. by optimising the shape of the hull (vessel lines plan), or adding a bulbous bow to decrease wave making resistance. Hull shape also determines the inflow of water into the propeller disc, which affects propeller efficiency. The literature contains standardised methods to calculate the resistance of ships in case towing tanks tests are not available (Holtrop and Mennen, 1982; Holtrop, 1984). These methods are used in the technical analysis in Chapter 5. Sea4keeping performance determines additional drag due to ship motions and living and working conditions onboard, the latter also related to safety issues. Hull shape affects sea4keeping performance and should be considered in a proper design. In this study we did not explore this aspect. Table 64161 below gives the outcome from our technical analyses concerning vessel design topics, with savings between 6 – 22 % and investment costs between 30000 – 600000 €.
Table 64161: Vessel design topics studied
Adaptation Potential Fuel
Saving (%)
Investment
Costs (€)
Comments
Optimized hull shape 22 unknown IT 606 hp boat
Bulbous bow 6 50000 IT 606 hp boat
Additional Wind Power 20 600000 SkySails arrangement, BE 1300 hp
vessel
6.11.3 Propulsion systems
A typical power train on a fishing vessel consists of a main engine, gear box, propeller shaft, and propeller (either with fixed pitch or controllable variable pitch). For onboard energy consumers additional auxiliary engines are commonly installed.

402 of 425 Report Number C002/08
The technology of marine diesel engines is well developed and expectations in improving efficiency in the future are limited to about 5% at most (personal communication with engine manufactures). Out analyses show that about 50% of the energy content (enthalpy) of the fuel oil used is dissipated through internal heat and frictional losses in the engine itself. Heat recovery might give a somewhat better efficiency of the total system. We did not go into this aspect in this report. Other losses comprise of frictional losses in the gear box and propeller shaft, and losses through the efficiency of the propeller in generating thrust (the forward force driving the boat), which are in the order of magnitude of 25%. Variables in the propeller determining efficiency are: propeller diameter, shape and number of blades, pitch setting, number of revolutions, and the inflow of water at the stern of the vessel. Propeller technology is advanced through many design studies and tests in so4called cavitation tunnels. So4called open water propeller characteristics, without the effect of the vessel’s hull, are determined for classes of propeller shape, e.g. the Wageningen B4series of propellers, a commonly used design for which computational polynomials are published (Oosterveld and Van Oossanen, 1975).
Figure 6485: Open water propeller diagram with P/D = 0.7
Shows a typical open water propeller diagram, in which The thrust coefficient is expressed in the form:
and the torque coefficient:

Report Number C002/08 403/425
whereas the propeller efficiency ηo is:
Further: T = Thrust in N, Q = Torque in Nm, N = number of revolutions of the propeller in revs/s, D = propeller diameter in m, Vo = vessel speed in m/s,
J = advance coefficient = Vo /n . D,
P = propeller pitch. Important is to realise that the propeller efficiency is depending on the advance coefficient and reaches a maximum, in this case at J ~ 0.57. From this diagram one can see that at lower J values, e.g. while towing gear, the propeller efficiency is lower than maximum (Figure 6485). In the case of a vessel operating at various different speeds such as a fishing boat, a fixed pitch propeller can not be optimal for both the steaming and fishing condition, but is always a compromise.
Figure 6486: Open water propeller diagram for various P/D ratios
Most open water diagrams are given for a range of P/D4values (Figure 6486). A ship’s propeller works in the flow of the aft part of a ship’s hull. The entrance speed in the propeller disc is lower due to the wake effect. This is expressed in the so4called wake fraction wN as follows:

404 of 425 Report Number C002/08
In which: VA = water flow speed at propeller disc without the propeller installed in m/s,
VS = vessel speed in m/s,
Vo = open water propeller speed in m/s,
In addition the presence of the rotating propeller affects the flow around the hull as water particles are accelerated at the aft part of the hull and pressure being built up, causing a larger resistance of the hull than without the propeller being present. This effect is given in the thrust deduction fraction as follows:
In which: T = Thrust in N, R = Ship resistance in N, Both the wake and thrust deduction factor are dependent on the shape of the hull, but estimates are often used when towing tank tests are not available. The propeller must match the torque en number of revolutions of the engine at a favourable working point. We found cases were apparently this match was sub4optimal, leading to room for improvements in efficiency. Adding a nozzle improves propeller efficiency and examples are calculated for the Irish 2000 hp reference vessel case given in Chapter 6.7. We have investigated the efficiency of the propulsion system in different operational modes for the references vessels under study. A typical range is from 0.01 to 0.22 which is quite low (See Chapter 6). Many fishing vessels are fitted with controllable pitch or CP propellers which can be set at optimal pitch for each condition. Often these are combined with a nozzle for higher efficiency. A downside is that this technology is more complex and more expensive and also more vulnerable to damage. We have investigated the effect of enlarging the diameter of the propeller for some reference cases resulting in better efficiency, but also costs for replacement (Chapter 6). The range of energy savings is between 1 4 15% with investments between 1500 435000 € (Table 64162).
Table 64162: Propulsion systems topics studied
Adaptation Potential Fuel
Saving (%)
Investment
Costs (€)
Comments
Larger propeller diameter 4 4 15 2500435000 Based on IT 606 and NL 2000 hp vessels
Fitting a Nozzle 18 35000 IRL 2000 hp boat
Optimising Bollard Pull 1.5 4 4 1500 IRL cases
Replacing a FPP by a CPP 4.5 30000 IT 606 vessel

Report Number C002/08 405/425
6.11.4 Efficiency of the onboard energy consumers
The data of reference vessel did not contain much information on auxiliary engines and their use. Nevertheless, one case could be quantified, e.g. the 1000 hp vessel from Ireland, for which the results are given below with a savings percentage of 15% at 30000 investment (Table 64163).
Table 64163: Onboard energy consumer topics studied
Adaptation Potential Fuel
Saving (%)
Investment
Costs (€)
Comments
Replacing Auxiliary engine 15 30000 IRL 1000 hp boat
6.11.5 Alternative energy sources
In the time frame given we could only look at some trends. SEAFISH studied bio4fuels (Chapter X), but the conclusions are not hopeful. In the recent future great changes are not to be expected, but some developments are interesting, e.g. the application of hydrogen fuel cells (for relatively small powers, Anon., 2008b), and diesel electric drives. Design studies of tugs with a combined fuel cell and diesel engine generator propulsion system are presently undertaken (Anon., 2008a). It is, however, to be expected that the marine diesel engine will play a major role in propelling vessels in the coming decades, be it that more strict regulations concerning gaseous emissions will come into force from 1 January 2010 (Anon., 2008c). The use of liquified natural gas (LNG) is under study by ship yards as a replacement of diesel oil for passenger cruise liners (Äimälä, 2008). It would be advisable to undertake design studies for fishing vessels using alternative fuels, but out of scope of this study. We looked at the effect of improving fuel quality and replacing marine diesel oil (MDO) by heavy fuel oil (HFO). Using sail power is already mentioned in the vessel design topics list. The effect is modest (between 14 6.7%), but the investments not too high (Table 64164).
Table 64164: Alternative energy topics studied
Adaptation Potential Fuel
Saving (%)
Investment
Costs (€)
Comments
Fuel Quality 0.75 1000 UK 653 hp vessel
Replacing MDO by HFO 6.7 4 IRL 1000 hp vessel, engines may foul
quicker and pre4heating installation might
be needed
6.11.6 Fishing gear design for greater energy efficiency
A suite of measures can be taken to decrease the energy consumption by fishing gears. Most of them are aimed at reducing the towing resistance of the gear, often combined with reducing sea bed impact. Any change in gear will likely affect its catching performance, and thus the ability of earning income from the fishing operation. Therefore this affect must always be taken into account when advocating energy savings through changes in fishing gear, as the savings must outweigh the alterations in catching performance to be economically viable.

406 of 425 Report Number C002/08
A towed gear mostly consists of a number of gear components running from the vessel to the codend of the net where the catch is collected (Figure 6487).
Figure 6487: Diagram of otter trawl with components
Gear drag can be reduced by reducing the dimensions of various gear components, such as warps, bridles, footrope arrangement, netting. The drag of netting can be reduced by choosing smaller twine thicknesses (e.g. by applying stronger twine material such as Dyneema™) and larger mesh sizes in net panels. Often such changes go hand in hand, with lower net drag smaller doors can be deployed to reach the same net spread, a multiplying effect to save energy. Simulation software can be used in the design phase to project the savings potential as was done for the French cases, showing an energy savings potential of 20% (See Chapter 5.2). Many gears use heavy components running over the sea bed, such as beam trawls fitted with chain mats of tickler chains, to stimulate their target species to become susceptible to capture. Other techniques can be deployed with the same objective, such as electric pulse fields or using hydrodynamics. The development of the electric pulse trawl in The Netherlands is an example for which adequate data was available, also on the effect on catches and fuel consumption (See Chapter ). Another example is the development of the so4called ‘HydroRig’ (See Chapter ). Apart from reducing drag by gear component one can change to other gear types altogether. Examples are given of replacing beam trawls by otter trawls (‘outriggers’, see Chapter xx and Table 64165).
Table 64165: Fishing gear design and replacement topics studied
Adaptation Potential Fuel
Saving (%)
Investment
Costs (€)
Comments
Modified gear design including optimized
components (e.g. doors)
5 4 25 1500 4 75000 Highest investment for hexagonal mesh
trawls, IRL 2000 hp
Gear replacement 15 4 50 3000 4 68500 Highest investment for converting to
seine netting, IRL 700 hp, highest
savings for outrigger trawls, BE, 1300
hp, but at 48% lower LpUE
Dynex Warps 5 4 15 25500 4 50000 Based on IRL cases, estimates not
analysed in GES

Report Number C002/08 407/425
6.11.7 Fishing tactics
Tactical changes involve changes in location of fishing grounds, reducing steaming and/or towing speed, more regular maintenance of vessel hull and engines. For many reference cases such tactical moves were calculated, including their likely effect on earnings due to a loss in fishing time. These measures are often not very expensive and the result can be promising. We found a savings percentage range of 0.5 – 25 % in reducing steaming speed, 15 to 40% for lower fishing speeds, between 6.5411% for fitting a fuel meter (associated with lower operational speeds), 548% for engine maintenance and 0.8 to 5% for regular hull cleaning. The range of investments was large with the pulse trawl system for beam trawling at maximum of 590000 € (Table 64166).
Table 64166: Fishing tactics topics studied
Adaptation Potential Fuel
Saving (%)
Investment
Costs (€)
Comments
Reduction in Steaming Speed 0.5 4 25 10000 4 16000 Highest savings found for UK 653 vessel,
may affect fishing time and LpUE
Reduction towing speed 15 4 40 10000 4 590000 Highest investment and savings for the
pulse beam trawl NL 2000 hp vessel
towed at lower speed, also lower LpUE
could result.
Fitting a Fuel Meter 6.5 4 11 3100 4 5500 Based on IRL cases and IT 606 hp vessel
Engine Maintenance 5 4 8 none Based on IRL cases
Hull cleaning 0.8 4 5 1500 4 7500 Based on IRL and UK cases, IT 606 hp
boat
6.11.8 References
Anonymous, 2008a. Offshore Ship Designers ontwerpt vrijwel emissieloze havensleepboot (Offshore Ship Designers design an almost emission free harbour tug), SWZ/MARITIME, Year 18 June 2008, p 10.
Anonymous, 2008b. First fuel cell passenger ship unveiled in Hamburg. Fuel Cells Bulletin, October 2008, p 445 Anonymous, 2008c. IMO Adopts Revised Regulations on Ship Emissions, SWZ/MARITIME, Year 18 November 2008.
Holtrop, J. An Approximate Power Prediction Method, International Shipbuilding Progress, Vol. 89, 1982. Holtrop, J., 1984. A Statistical Reanalysis of Resistance and Propulsion Data, International Shipbuilding Progress, Vol. 31, 1984.
Oosterveld, M.W.C. and Oossanen. P. van, 1975. Further Computer4Analyzed Data of Wageningen B4Screw Series. I.S.P., Vol. 22, No. 251, July 1975. N.M.S.B., Report No. 479.
Äimälä, V., 2008. LNG Fuel Concept for Cruise Ships. SWZ/MARITIME, Year 18 January 2008, p 446.

408 of 425 Report Number C002/08
7 Synthesis of techno4economic evaluation
7.1 Summary of economic analysis of technological adaptations Table 741 presents a summary of the economic analysis of the proposed technological adaptations along with an evaluation of their financial feasibility. The table compares four levels of fuel prices for all segments analysed in the report, although, including those for which technological improvements have not been identified:
a. Price in 200446 b. Break4even price for 200446 situation c. Price in 2008 d. Break4even price after implementation of the technical adaptations.
7.2 Performance in 200446 and in 2008 Comparison of the actual fuel price in 200446 with the break4even fuel price, which would have been required in that period, shows to which extent the segment was making profits or losses. If is assumed that 200446 break4even price within +/410% of the realized price would mean that the segment was operating at approximately break4even level, than 14 out of 24 segments were operating at a loss, while 8 were making profit (Table 742). The level of performance does not seem to be related to gear type or vessel size. Small Danish gillnetters show extremely poor results, while large UK pelagic trawlers were very profitable. UK and Irish demersal trawlers of 12424m were making losses while similar vessels in France were still performing satisfactorily. Some of the beam4trawl segments in Belgium, UK and the Netherlands, which are highly energy intensive, still show ratio of break4even price/200446 price of 0.840.9, being among the segments making the lowest loss. The situation in 200446 shows that there was need for improvement of performance among many different types of vessels and gears, many of them requiring an energy efficiency improvement by at least 25450%. The increase of fuel price in the first 8 months of 2008 has produced further deterioration of economic perform4ance. It is estimated that 19 out of the 24 segments were making (significant) losses under those conditions. For many of those segments, an energy improvement by at least 50% would be required to allow them to deal with the extremely high fuel price.
7.3 Impact of technological improvements Impact of technological improvements has been evaluated for eleven segments in six countries. It concerns demersal trawlers, pelagic trawlers and beam trawlers in the vessel classes of 12424m and 24440m. The extent of possible improvements of the energy efficiency ranges mostly between 5% and 30%. Table 743 summarizes the results, assuming that the highest optimum energy savings could be achieved (most optimistic scenario), which would lead to the lowest possible break4even price for fuel. Such scenario may not lead to maximum energy savings, but reflects the optimum combination of lower fuel costs in relation to required investments. In case of five segments (demersal trawlers 12424m in Denmark, UK and Ireland, 24440m in Denmark and beam trawlers in Belgium) the proposed technical adaptations are not even sufficient to eliminate the losses which these segments faced in 200446, not to speak of the much higher fuel price in 2008. For two segments (Dutch beam trawlers 24440m and Italian bottom trawlers 24440m) the technical improvements could be introduced to eliminate the losses of 200446. However, these improvements are still not sufficient to off4set the high fuel price of 2008.

Report Number C002/08 409/425
Finally, three segments of demersal trawlers (UK 24440m, Italy 24440m and France 12424m) could improve their performance and reach approximately break4even level under the 2008 conditions. These segments showed already quite good performance in 200446. The Irish pelagic trawlers 24440m are very profitable, even under the 2008 conditions, so that the need for further technological improvement is not essential for their survival.
Table 741: Summary of energy efficiency and role of potential savings
Fuel price (€/tonne) MS / gear Size
(m) 2004�6 Break�even
2004�6
2008
Range of
potential
savings
(%)
BE fuel price at
estimated
investment
(€/tonne)
Belgium
Beam trawl 12424 407 333 650 n/a n/a
Beam trawl 24440 407 271 650 5450% 1254300
Denmark
Gillnet <12 450 0 711 n/a
Demersal trawl 12424 409 0 646 5430%
Demersal trawl 24440 388 129 613 5430% 1244162
France
Passive gears <12 310 2816 547 n/a N/a
Demersal trawl 12424 310 437 547 15% 489
Ireland
All inshore 362 514 594
Demersal trawl 12424 362 202 594 8421% 2194256
Demersal trawl 24440 362 476 594 5420% 4984595
Pelagic trawl >40 362 291 594
Pelagic trawl 24440 362 1584 594 5425% 176042120
Italy
Bottom trawl 24440 478 273 739 8.5% 515
Pelagic trawl 24440 417 1444 739
Beam trawl 12424 446 415 739
Passive gears <12 481 2500 739
Netherlands
Beam trawl 12424 344 119 695 n/a
Beam trawl 24440 338 263 683 7440% 04327
Beam trawl >40 337 292 680 n/a
United K.
Beam trawl 24440 372 331 650
Demersal trawl/seine 12424 372 240 650 5415% 2054256
Demersal trawl/seine 24440 372 398 650 10% 442
Demersal trawl/seine >40 372 105 650 n/a
Pelagic trawl >40 443 3896 650 n/a

410 of 425 Report Number C002/08
Table 742: Evaluation of the performance at 200446 and 2008 fuel price
Country Gear Length
(m)
B�E fuel
price /
price
2004�6
(€/tonne)
Performance
2004�6
B�E fuel
price /
price 2008
(€/tonne)
Performance
2008
Denmark Gillnet <12 0.00 Loss 0.00 Loss
Denmark Demersal tr. 12424 0.00 Loss 0.00 Loss
United K. Dem. trawl/seine >40 0.28 Loss 0.16 Loss
Denmark Demersal tr. 24440 0.33 Loss 0.21 Loss
Netherlands Beam trawl 12424 0.35 Loss 0.17 Loss
Ireland Demersal tr. 12424 0.56 Loss 0.34 Loss
Italy Bottom trawl 24440 0.57 Loss 0.37 Loss
United K. Dem. trawl/seine 12424 0.65 Loss 0.37 Loss
Belgium Beam trawl 24440 0.67 Loss 0.42 Loss
Netherlands Beam trawl 24440 0.78 Loss 0.39 Loss
Ireland Pelagic tr. >40 0.80 Loss 0.49 Loss
Belgium Beam trawl 12424 0.82 Loss 0.51 Loss
Netherlands Beam trawl >40 0.87 Loss 0.43 Loss
United K. Beam trawl 24440 0.89 Loss 0.51 Loss
Italy Beam trawl 12424 0.93 B4E 0.56 Loss
United K. Dem. trawl/seine 24440 1.07 B4E 0.61 Loss
Ireland Demersal tr. 24440 1.31 Profit 0.80 Loss
France Demersal tr. 12424 1.41 Profit 0.80 Loss
Ireland All inshore 1.42 Profit 0.87 Loss
Italy Pelagic trawl 24440 3.46 Profit 1.95 Profit
Ireland Pelagic tr. 24440 4.38 Profit 2.67 Profit
Italy Passive gears <12 5.20 Profit 3.38 Profit
United K. Pelagic trawl >40 8.79 Profit 5.99 Profit
France Passive gears <12 9.08 Profit 5.15 Profit
Note: Loss / profit is assumed at 4/+ 10% of the break4even price from the real fuel price. B4E is within this range.

Report Number C002/08 411/425
Table 743: Impact of technological improvements in the most optimistic scenario
Country Gear Length
(m)
Perform
ance
2004�6
Perform
ance
2008
Highest
BE fuel
price
(€/tonne)
Performance at best technological
improvement
Denmark Demersal trawl 12424 Loss Loss 0 Losses remain for 200446
Denmark Demersal trawl 24440 Loss Loss 162 Losses remain for 200446
United K. Dem. trawl 12424 Loss Loss 256 Losses remain for 200446
Ireland Demersal trawl 12424 Loss Loss 256 Losses remain for 200446
Belgium Beam trawl 24440 Loss Loss 300 Losses remain for 200446
Netherlands Beam trawl 24440 Loss Loss 327 BE in 200446, loss in 2008
Italy Bottom trawl 24440 Loss Loss 515 BE in 200446, loss in 2008
United K. Demersal trawl 24440 B4E Loss 442 Profit in 200446, loss in 2008
France Demersal trawl 12424 Profit Loss 489 Profit in 200446, BE in 2008
Ireland Demersal trawl 24440 Profit Loss 595 Profit in 200446, BE in 2008
Ireland Pelagic trawl 24440 Profit Profit 2120 Overall profit, even without adaptations
7.4 Ranking of technological solutions In practice it would be desirable to identify specific technological improvements which would be applicable to many different segments and demonstrate which of these improvements is most effective, i.e. to rank them in terms of energy savings. However, this is barely possible on the basis of this study, if at all, for the following reasons. Table 144 shows that ranking of the current energy performance of the segments depends on the criteria used. Each criterion contains its own logic and relevance for different analytical purposes. • For an economic analysis relation of fuel costs to revenues shows how sensitive the fleet is to changes of the
fuel price and to policy incentives (e.g. fuel tax) in this respect. • From environmental perspective, energy use per kW4day or year and the related CO2 emissions are of
importance. • For the purposes of public dialogue an indicator like liters of fuel per kilo of fish is easy to communicate. Table 744 shows how much the ranking from these three perspectives overlaps.
Table 744: Most and least efficient segments (total of 22 segments)
Segment Litres of fuel / kg fish Fuel costs as % of
income
Litres / kW�day
Most efficient
• Ireland, PTS >40m 1 7 11
• France, PGP <12m 18 1 1
Least efficient
• Netherlands, TBB 24440m 22 21 18
• Netherlands, TBB 24440m 20 22 16
• Belgium TBB 12424m 16 18 22
Table 144 and Table 744 show that introduction of technological improvements takes place under very different and consequently incomparable conditions, which make ranking of the initial situation already difficult.

412 of 425 Report Number C002/08
Furthermore, a technological adaptation which may be very effective for one segment may not be necessarily relevant for another one. An extreme example is that turning a large beam trawler into a gillnetter does not seem to be an interesting proposition. Specific adaptation of one type of bottom trawl may not be feasible in another type. At best the present report may generate new ideas which than have to be tested in practice.
8 Conclusions and recommendations
8.1 Conclusions
If is assumed that 200446 break4even price within +/410% of the realized price would mean that the segment was operating at approximately break4even level, than 14 out of 24 segments were operating at a loss, while 8 were making profit. The level of performance does not seem to be related to gear type or vessel size The situation in 200446 shows that there was need for improvement of performance among many different types of vessels and gears, many of them requiring an energy efficiency improvement by at least 25450%. The increase of fuel price in the first 8 months of 2008 has produced further deterioration of economic perform4ance. It is estimated that 19 out of the 24 segments were making (significant) losses under those conditions. For many of those segments, an energy improvement by at least 50% would be required to allow them to deal with the extremely high fuel price. The extent of possible improvements of the energy efficiency by technological and/or operational improvements ranged between 5% and 30%. In case of five segments (demersal trawlers 12424m in Denmark, UK and Ireland, 24440m in Denmark and beam trawlers in Belgium) the proposed technical adaptations are not even sufficient to eliminate the losses which these segments faced in 200446, not to speak of the much higher fuel price in 2008. For two segments (Dutch beam trawlers 24440m and Italian bottom trawlers 24440m) the technical improvements could be introduced to eliminate the losses of 200446. However, these improvements are still not sufficient to off4set the high fuel price of 2008. Finally, three segments of demersal trawlers (UK 24440m, Italy 24440m and France 12424m) could improve their performance and reach approximately break4even level under the 2008 conditions. These segments showed already quite good performance in 200446. The Irish pelagic trawlers 24440m are very profitable, even under the 2008 conditions, so that the need for further technological improvement is not essential for their survival. Ranking technological and/or operational improvements in terms of energy savings is barely possible on the basis of this study, if at all. A large overlap was found when ranking was tried according to criteria such as: litres of fuel / kg fish, fuel costs as % of income, or litres / kW4day.
8.2 Recommendations The techno4economic analysis shows that for many fleets, which are highly fuel dependent, improvement of economic performance can be only achieved by a mix of technical and operational adaptations aimed at reduction of fuel intensity and adaptations aimed at increasing earnings from catches (CPUE). The latter adaptations imply evidently that the size of the fleets would have to be reduced proportionately so that the effective pressure of stocks does not increase.

Report Number C002/08 413/425
9 References
9.1 Gear design and engineering studies Anon., 2008. STECF4SGECA 02408, Annual Economic Report 2008, Copenhagen, 21425 April 2008 Agricola, J.B., 1985. Experiments on electrical stimulation of flatfish in beamtrawling during 1984. ICES CM 1985/B:36.
Boonstra, G.P., and Groot, S.J. de, 1974. The development of an electrified shrimp trawl in the Netherlands. J. Cons. int. Explor. Mer. 35 (2): 1654170.
Broucke, G. Vanden, 1973. Further investigations on electrical fishing. ICES C.M. 1973/B:14. Fonteyne, R. and Polet, H., 2002. Reducing the benthos by4catch in flatfish beam trawling by means of technical modifications. Fisheries Research 55, 2194230.
Groenewold, S. and Fonds, M., 2000. Effects on benthic scavengers of discards and damaged benthos produced by beam4trawl fishery in the southern North Sea. ICES Journal of marine Science 57, no. 5, 139541406.
Groot, S.J. de, and Boonstra, G.P., 1970. Preliminary notes on the development of an electrical tickler chain for sole (Solea solea L.). ICES C.M. 1970/B:4.
Hoefnagel, E. and Taal K., 2008. The economic performance and the environmental impact of the Pulse trawl in comparison to the conventional Beam trawl (Report EU4project DEGREE WP 5.1, March 2008).
Horn, W., 1976. Rationalization of sole fisheries by means of electrified beam trawls. In: Coun. Meet. ICES/B:7, Report of the Working Group on Research on Engineering Aspects of Fishing Gear, Vessels and Equipment.
Horton, R.S., 1984. Trials of the electric beam trawling system on MFV Zuiderkruis, summer 1983. SEAFISH Report IR 1180.
Jennings, S., and Kaiser, M.J., 1998. The Effects of Fishing on Marine Ecosystems. Adv. Mar. Biol. 34, 2214233. Kaiser and De Groot (editors), 2000, Effects of fishing on non4target species and habitats: biological, conservation and socio4economic issues. ISBN 0463240535540, 399 p.
Lindeboom H.J. and Groot, S.J. de (Eds.), 1998. The effects of different types of fisheries on the North Sea and Irish Sea benthic eco4systems. EU4project AIR24CT9441664 (IMPACT4II), Final Report ISSN 092343210, 404p.
Marlen, B. van, 1997. Alternative stimulation in fisheries. Final Report EU4project AIR34CT9441850, June 1997 Marlen, B. van, Lavieren, H. van, Piet, G.J., and Duijn, J.B. van, 1999. Catch comparison of a prototype 7 m electrical beam trawl and a conventional tickler chain beam trawl. RIVO internal report 99.006b, April 1999.
Marlen, B. van, 2000. Technical modifications to reduce the by4catches and impacts of bottom gears on non4target species and habitats. In: Kaiser and De Groot (editors), 2000, Effects of fishing on non4target species and habitats: biological, conservation and socio4economic issues. ISBN 0463240535540, p 2534268.
Marlen, B van, A.R. Boon, L.G. Oschatz, J.B van Duijn, M. Fonds, 2000. Experiments in 1999 on a 7 m beam trawl with electrical stimulation. RIVO4report C028/01, May 2001
Marlen, B. van, Bergman, M.J.N., Groenewold, S., and Fonds, M., 2001b. Research on diminishing impact in demersal trawling – The experiments in The Netherlands, ICES CM 2001/R:09
Marlen, B. van, Ybema, M.S., Kraayenoord, A., Vries, M. de en Rink, G., 2005. Catch comparison of a 12 m pulse beam trawl with a conventional tickler chain beam trawl. RIVO4Report C043b/05
Marlen, B. van, Vis, J.W. van de, Groeneveld, K., Groot, P.J., Warmerdam, M.J.M., Dekker, R., Lambooij, E., Kals, J., Veldman, M. and Gerritzen, M.A., 2005. Survival and physical condition of sole and plaice caught with a 12 m pulse beam trawl and a conventional tickler chain beam trawl. RIVO4report Nr. C044b/05
Marlen, B. van, Grift, R., O. van Keeken, M.S. Ybema, R. van Hal, 2006. Performance of pulse trawling compared to conventional beam trawling. RIVO4report Nr. C014/06
Marlen, B. van, Vis, H. v.d., Haan, D. de, Burggraaf, D., Heul, J. van der, Terlouw, A., 2007. The effect of pulse stimulation on biota – Research in relation to ICES advice – Progress report with preliminary results. IMARES Report No C098/07.
Quirijns, F.J., Pastoors, M.A. en Densen van, W.L.T., 2004. Catch and Effort data of plaice (and sole) in the North Sea: bringing different data sources together. Working document presented to ICES WGNSSK 2004.
Smaal, A.C., and E. Brummelhuis, 2005. Explorative studies of the impact of an electric fishing field on macro4benthos. RIVO Report No. C089b/05, pp 15.
Stewart, P.A.M., 1975. Catch selectivity by electrical fishing systems. J. Cons. int. Explor. Mer, 36 (2): 1064109. Stewart, P.A.M., 1978. Comparative Fishing for Flatfish using a Beam Trawl fitted with Electric Ticklers. Scottish Fisheries Research Report 11, ISSN 030848022, 10p.
Stralen, M.R. van, 2006. The pulse trawl – Developing alternative fishing gear for flatfish fisheries using an electrical stimulus – A summary. marinX4report 2005.26, pp 25.

414 of 425 Report Number C002/08
10 Annexes

Report Number C002/08 415/425
10.1 Annex 1: DynamiT simulations of fishing gears by IFREMER
Case 2
Case 2
Case 0

416 of 425 Report Number C002/08
10.2 Annex 2: General description and technical features of the fuel consumption system
Function and system design of the Coriolis Mass Flow Measuring System

Report Number C002/08 417/425

418 of 425 Report Number C002/08

Report Number C002/08 419/425

420 of 425 Report Number C002/08

Report Number C002/08 421/425
General description of the GPS Data Logger
The GPS Data Logger utilised (named DL1) is a state of the art, highly robust, compact "black box" data logging system. Put in the simplest terms, it stores a wide range of vehicle data for later analysis on a computer - the system does not include an in-vehicle display. The Logger was initially designed for autosport applications including drag racers, single seater racing cars, rally cars or road cars - however it is also ideal for use on power boats, go karts and motorbikes. It is also an ideal platform for use in the auto industry for car testing of all types, from long term monitoring to competitor benchmarking.
The DL1 can store data from a number of sources including its built in high accuracy GPS and accelerometers, wheel speeds, shaft speeds, engine speeds, temperatures, pressures, lap times, sector times etc. The DL1 comes packaged with an excellent data analysis package for Windows. The software allows super accurate track mapping, user defined channels, powerful graphing and allows direct comparison of up to 10 data sets (races) simultaneously with almost unlimited laps. One of the key features of the Logger is its built in high accuracy GPS system - this gives the advantages over other data loggers in 2 key areas - greatly improved track maps and far more accurate speed data.
Conventional data loggers require a "closed circuit" to enable them to calculate the track map; the shape of the track is estimated from a combination of the lateral acceleration and speed. This works adequately in some situations but it becomes increasingly inaccurate for long tracks and impossible for open circuits, motorbikes or boats. In contrast, the GPS will produce high accuracy track maps in almost any situation.
422 of 425 Report Number C002/08
While speed is probably the most important parameter that anyone wants to measure using the data logging system, it is also the most inaccurate in a "conventional" system. The normal way to measure speed is to simply attach a pickup to a wheel to detect how fast it is rotating - but the rolling circumference of a tyre changes by 4% just with wear and temperature. Even worse, the error increases significantly under race conditions where the tyre is under load - typically the tyre slips by up to 20% under hard braking going into a corner. Measuring speed using GPS is now common practice in high-end systems - under typical conditions speed error is well under 1%. Some of the most noteworthy features include:
- Built in GPS. The new GPS unit is based on high accuracy GPS3 technology and calculates position and speed 10 times every second. The measurements from the GPS and accelerometers are combined to calculate very high accuracy positions and speeds at 100 times a second.
- Built in accelerometers. Built in 2-axis accelerometer with 2g full scale (optional 10g full scale). Logging to compact flash memory. Compact flash memory is robust, economical and ideal for use in data logging products. The advantages of using compact flash memory include incredibly fast download times (using a suitable card reader) and huge storage capacities.
- 8 analogue inputs. The DL1 has 8 very high accuracy analogue inputs. One of these inputs is connected to the DL1 power supply input to measure the battery voltage; the other 7 are available for connection to external sensors. All the inputs are 12-bit accuracy (4096 different levels), 3 of the external inputs have a maximum input of 12v, the remaining 4 have a maximum input of 5v.
- 2 RPM inputs. The DL1 has 2 RPM inputs, only one of which can be used at any one time. One input is designed to be connected to "high level" sources, such as the HT leads or the ignition coil. The other input is designed for low level signals such as a feed from the ECU.
- 4 wheel/shaft speed inputs. The DL1 features 4 totally independent wheel/shaft speed inputs. These can be used to measure the speed of all four wheels, or slip ratios across a torque converter for example.
- Serial data (RS232) input. The serial port can be configured to accept data from an external source - possible examples are data from the engine management unit, OBDii or CAN data (with a suitable adapter).
- Serial data (RS232) output. As well as logging the data to compact flash it is also available from the serial port. We are already working on a dashboard unit which will accept and display this data.
- Lap beacon input. For some applications it is desirable to use a lap beacon, so we have included a dedicated input for it. This channel can also be used as a general-purpose digital input if required.
- Small and tough. It's the most compact logger in it's class, at just 110mm x 75mm x 30mm (4.3" x 3" x 1.2") it can be fitted into the smallest single seater, motorbike or go kart. The DL1 is housed in a 2mm thick aluminium enclosure and carbon fibre end panels for very high impact resistance.
- Simple operation. A single button to start or stop logging, it's as simple as that! If the button is inaccessible from the drivers seat then a remote button and status indicator can be added if required.
- Power supply requirements. The power supply to the DL1 data logger can be taken directly from the vehicles 12v supply, or it can be powered from it's own battery if required. The power supply is smoothed and regulated within the DL1 ensuring its performance is highly robust and stable.
- Testing. Very high reliability is ensured by calibrating, temperature testing and vibration testing each unit on an individual basis. Autosport applications make tremendous demands on electronic systems and we take great care to make sure our products are up to the task. All the connections to the units are vibration proof, high strength, screw terminals to ensure that connections do not fail at the critical time.

Report Number C002/08 423/425
- Powerful. The 2 processors in the DL1 are the very latest generation RISC processor that features both higher speed operation and flash upgradability.

424 of 425 Report Number C002/08
10.3 Annex 3: Gear codes and descriptions
Code Description
MB Mobile gears
TBB Beam trawl
DTS Demersal trawl and demersal seiner
OTB Bottom trawl
STB Single trawl
PTB Paired trawl
TTB Twin trawl
MTB Other multirig trawl
FTB Four4panels trawl
HTB High4opening trawl
DSS Danish and Scottish seiners
SDN Danish seiners
SSC Scottish seiners
DTP Polyvalent
PTS Pelagic trawls and seiners
OTM Pelagic trawl
PEL Pelagic seiner and purse seiner
PPS Polyvalent
DRB Dredges
DRH Hydraulic dredge
DRO Other dredges
MGP Polyvalent mobile gears
MGO Other mobile gears
PG Passive gears
FGL Fixed gears and lines
FGN Fixed nets
FTN Trammel nets
FEN Entangling nets
GIN Gill nets
HOK Gears using hooks
LON Longlines
LONSUR Surface longlines
LONBOT Bottom longlines
LONMID Mid4waterlines
HOO Other gears using hooks
HOT Troll line
HOP Pole line with live bait
HOW Pole line without live bait
DFN Drift nets and fixed nets
DNE Drift nets
FPO Pots and traps
FPT Fish traps, including trap nets and pound nets
FPC Crustaceans pots with possible subdivision by target species
PGP Polyvalent passive gears
PGO Other passive gears
PVG Polyvalent gears
PMP Combining mobile & passive gears
NOL Vessels with no license

Report Number C002/08 425/425
11 Referees and Authors Rapport C002/08 Project Number: 4391500901 This report has been professionally prepared by Wageningen IMARES. The scientific validity of this report has been internally tested and verified by another researcher and evaluated by the Scientific Team at Wageningen IMARES. Approved: Dr. ir. T.P. Bult Signature: Date: 27/02/2009 Number of copies: 4 Number of pages 425 Number of tables: 291 Number of graphs: 171 Number of appendix attachments: 3