Energy-report-Friuli-Venezia-Giulia--Italy.pdf - Interreg Central ...
46
Friuli-Venezia Giulia Energy Report Version n°0.3/2019 DELIVERABLE D.T2.2.2
-
Upload
khangminh22 -
Category
Documents
-
view
1 -
download
0
Transcript of Energy-report-Friuli-Venezia-Giulia--Italy.pdf - Interreg Central ...

Friuli-Venezia Giulia Energy Report Version n°0.3/2019
DELIVERABLE D.T2.2.2

1
PP7 - PP EEE
PP5 - PP APE FVG
PP6 - PP RAFVG
D.T2.2.2: Deliverable
A.T2.2 State-of-the-art regional report
drafting
Issued by: Partner n° 5 – Partner APE FVG
Reviewed by: Partner n° 7 – Partner EEE
Version date: 22.11.2019
Revision 0.3
Circulation RE – Restricted to PP
Document History
Date Version Description of Changes
18.06.2019 v 0.1 Document issued by PP n°7
02.10.2019 v 0.2 First draft by PP n°5
22.11.2019 v 0.3 Draft revision by PP n°5
Partners involved

2
Interreg CENTRAL EUROPE
Priority: 2. Cooperating on low-carbon strategies in CENTRAL EUROPE
Specific
objective:
2.2 To improve territorial based low-carbon energy planning
strategies and policies supporting climate change mitigation
Acronym: PROSPECT2030
Title: PROmoting regional Sustainable Policies on Energy and Climate
change mitigation Towards 2030
Index
number: CE1373
Lead
Partner: Piemonte Region
Duration: 01.04.2019 30.09.2021
3
Table of contents 1. EXECUTIVE SUMMARY ............................................................................................... 4 2. INTRODUCTION ....................................................................................................... 6 2.1. General description of the region ................................................................................ 6 2.1.1 Geographical situation ....................................................................................... 6 2.1.2 Settlement structure ......................................................................................... 7 2.1.3 Demographic structure and development ................................................................. 9 3. Infrastructure ...................................................................................................... 14 3.1. Energy related infrastructure ................................................................................... 14 3.1.1 Electricity grid infrastructure............................................................................. 14 3.1.2 Gas grid infrastructure ..................................................................................... 15 3.1.3 District heat infrastructure ............................................................................... 16 3.2. Mobility and transport related infrastructure ................................................................ 17 3.2.1 Rail network ................................................................................................. 17 3.2.2 Road network ............................................................................................... 19 3.2.3 Aviation and waterways infrastructure .................................................................. 20 4. Transport ............................................................................................................ 21 4.1. Basic data and modal split ...................................................................................... 21 4.2. Road transport .................................................................................................... 21 4.2.1 Motor vehicles by type and fuel .......................................................................... 21 4.2.2 Passenger cars by fuel, kilometre and fuel performance ............................................. 22 4.2.3 Passenger- and tonnes kilometres ........................................................................ 23 4.3. Rail transport ..................................................................................................... 24 4.3.1 Passenger and tonnes kilometres......................................................................... 24 4.3.2 Development of passenger and goods transports ...................................................... 24 4.4. Air and waterway transport ..................................................................................... 24 5. Energy status ....................................................................................................... 25 5.1. Energy in the European and national context ................................................................ 25 5.1.1. Simplified energy balance of EU 28 ......................................................................... 25 5.1.2. Simplified national balance .................................................................................. 26 5.1.3. National electricity fuel mix disclosure ..................................................................... 27 5.1.4. Time series of national final energy consumption ........................................................ 29 5.1.5. Energy prices – status quo and development 2005 to 2017 .............................................. 31 5.2. Regional energy demand ........................................................................................ 34 5.2.1. Regional energy demand by fuel and sector ............................................................... 34 5.3. Regional energy supply .......................................................................................... 36 5.3.1. Regional generation by source, capacity and output ..................................................... 36 5.3.2. Energy storage .................................................................................................. 39 5.3.3. Regional key technologies for supply ....................................................................... 39 5.4. Regional demand-supply balance and development potentials ............................................ 40 5.4.1. Regional balance and self-supply rates ..................................................................... 40 5.4.2. Energy efficiency potentials .................................................................................. 41 5.4.3. Resource potentials ............................................................................................ 41 5.4.4. Technology potentials ......................................................................................... 42 6. CO2 Emissions ....................................................................................................... 43 7. Key figures and bottom line of the situation ................................................................. 43 8. CONCLUSIONS ....................................................................................................... 44
4
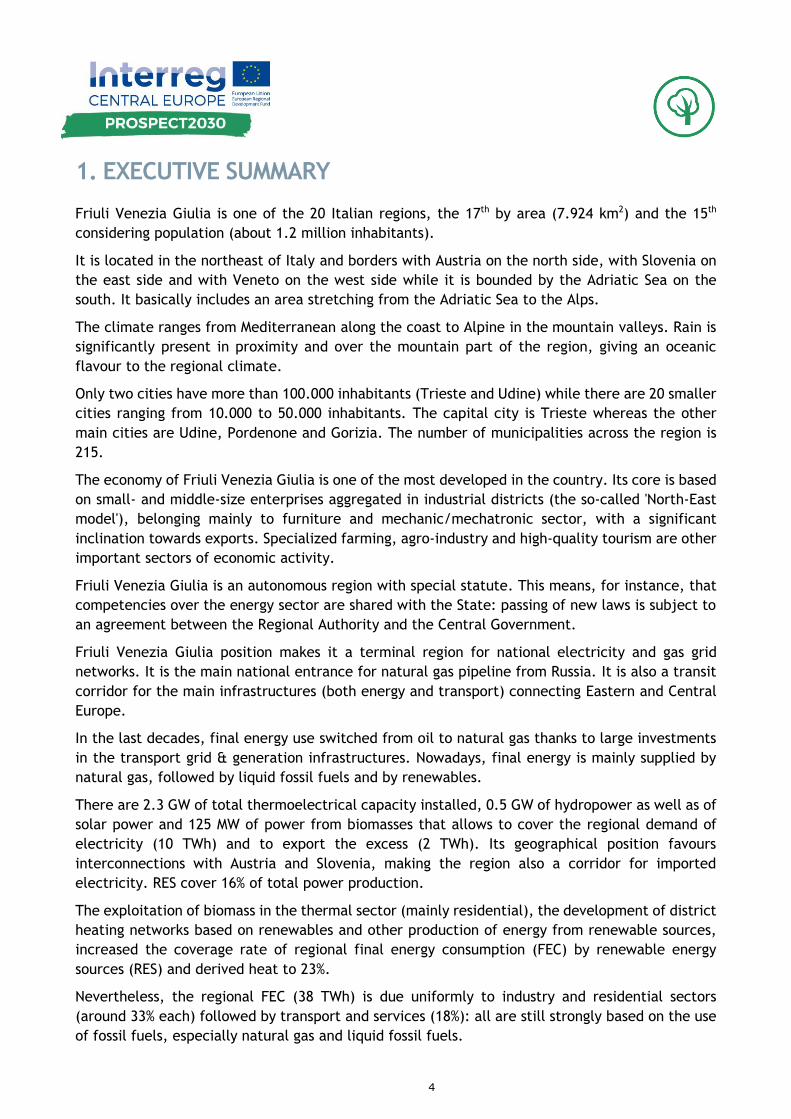
1. EXECUTIVE SUMMARY
Friuli Venezia Giulia is one of the 20 Italian regions, the 17th by area (7.924 km2) and the 15th
considering population (about 1.2 million inhabitants).
It is located in the northeast of Italy and borders with Austria on the north side, with Slovenia on
the east side and with Veneto on the west side while it is bounded by the Adriatic Sea on the
south. It basically includes an area stretching from the Adriatic Sea to the Alps.
The climate ranges from Mediterranean along the coast to Alpine in the mountain valleys. Rain is
significantly present in proximity and over the mountain part of the region, giving an oceanic
flavour to the regional climate.
Only two cities have more than 100.000 inhabitants (Trieste and Udine) while there are 20 smaller
cities ranging from 10.000 to 50.000 inhabitants. The capital city is Trieste whereas the other
main cities are Udine, Pordenone and Gorizia. The number of municipalities across the region is
215.
The economy of Friuli Venezia Giulia is one of the most developed in the country. Its core is based
on small- and middle-size enterprises aggregated in industrial districts (the so-called 'North-East
model'), belonging mainly to furniture and mechanic/mechatronic sector, with a significant
inclination towards exports. Specialized farming, agro-industry and high-quality tourism are other
important sectors of economic activity.
Friuli Venezia Giulia is an autonomous region with special statute. This means, for instance, that
competencies over the energy sector are shared with the State: passing of new laws is subject to
an agreement between the Regional Authority and the Central Government.
Friuli Venezia Giulia position makes it a terminal region for national electricity and gas grid
networks. It is the main national entrance for natural gas pipeline from Russia. It is also a transit
corridor for the main infrastructures (both energy and transport) connecting Eastern and Central
Europe.
In the last decades, final energy use switched from oil to natural gas thanks to large investments
in the transport grid & generation infrastructures. Nowadays, final energy is mainly supplied by
natural gas, followed by liquid fossil fuels and by renewables.
There are 2.3 GW of total thermoelectrical capacity installed, 0.5 GW of hydropower as well as of
solar power and 125 MW of power from biomasses that allows to cover the regional demand of
electricity (10 TWh) and to export the excess (2 TWh). Its geographical position favours
interconnections with Austria and Slovenia, making the region also a corridor for imported
electricity. RES cover 16% of total power production.
The exploitation of biomass in the thermal sector (mainly residential), the development of district
heating networks based on renewables and other production of energy from renewable sources,
increased the coverage rate of regional final energy consumption (FEC) by renewable energy
sources (RES) and derived heat to 23%.
Nevertheless, the regional FEC (38 TWh) is due uniformly to industry and residential sectors
(around 33% each) followed by transport and services (18%): all are still strongly based on the use
of fossil fuels, especially natural gas and liquid fossil fuels.

5
From the environmental point of view, the energy demand is responsible for CO2 generation around
8.4 Mt per year, largely related to industrial sector and followed in equal parts by transport and
residential sectors.

6
2. INTRODUCTION
2.1. General description of the region
2.1.1 Geographical situation
Friuli Venezia Giulia is an autonomous region located in the extreme northeast of Italy. It shares
borders with Slovenia to the east, Austria to the north, Veneto region on the west and it is bounded
by the Adriatic Sea on the south.
The regional territory covers an area of 7.924 km2 and is composed of two historical-geographical
regions with different cultural characteristics: Friuli, which includes the provincial areas of Udine,
Pordenone and Gorizia and Venezia Giulia, which includes the provincial area of Trieste and a part
of the Gorizia area.
The region represents only 2.6% of the national territory and this makes it last but four out of the
twenty regions of Italy. Nevertheless, it has a thriving industrial sector and a well-developed
tertiary sector.
Fig. 1- Friuli Venezia Giulia in the national territory and its provincial areas
The climate ranges from Mediterranean along the coast (2235 dd) to Alpine in the mountain valleys (4736 dd). Rain is significantly present in proximity and over the mountain part of the region, giving an oceanic flavour to the regional climate.
The region in surrounded by high mountains, the highest one is Monte Coglians (Forni Avoltri), whose summit is 2.780 meters above sea level. The regional territory includes many different natural landscape and ecosystems: alpine, pre-alpine, hilly, high plain, resurgence belt, low plain, karst, coastal areas and lagoons. This is due to the differences in local climate zones and soil types.
7
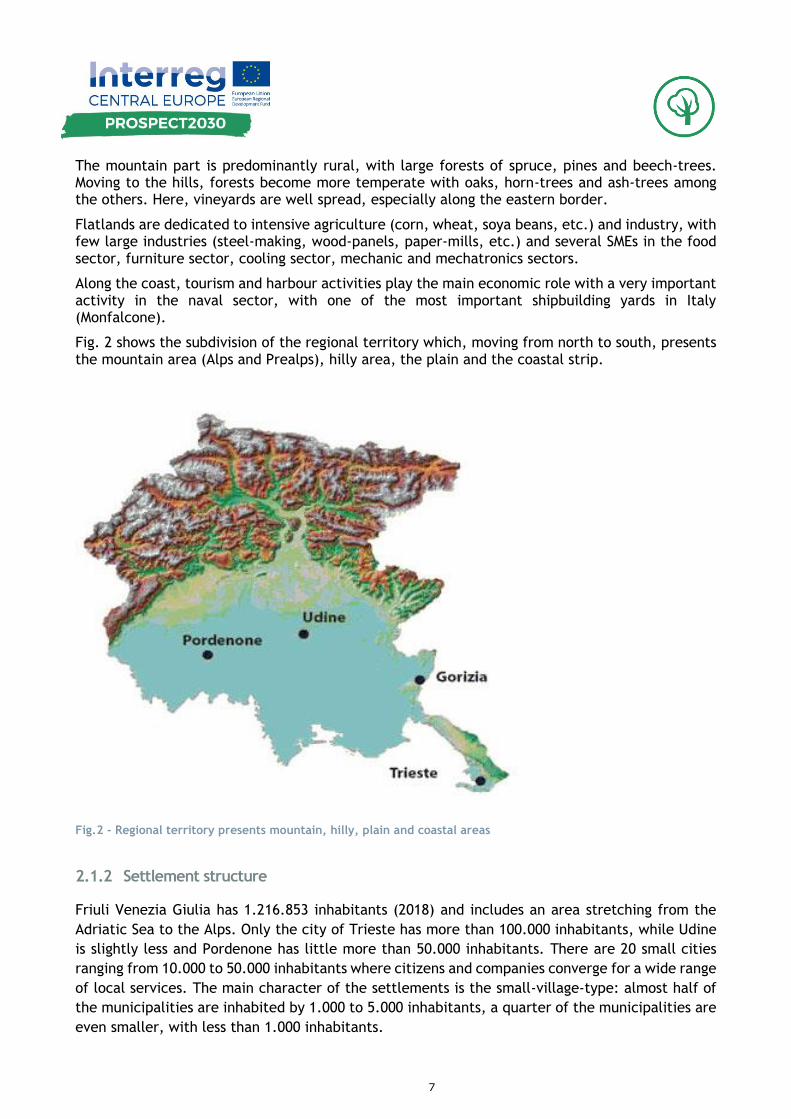
The mountain part is predominantly rural, with large forests of spruce, pines and beech-trees. Moving to the hills, forests become more temperate with oaks, horn-trees and ash-trees among the others. Here, vineyards are well spread, especially along the eastern border.
Flatlands are dedicated to intensive agriculture (corn, wheat, soya beans, etc.) and industry, with few large industries (steel-making, wood-panels, paper-mills, etc.) and several SMEs in the food sector, furniture sector, cooling sector, mechanic and mechatronics sectors.
Along the coast, tourism and harbour activities play the main economic role with a very important activity in the naval sector, with one of the most important shipbuilding yards in Italy (Monfalcone).
Fig. 2 shows the subdivision of the regional territory which, moving from north to south, presents the mountain area (Alps and Prealps), hilly area, the plain and the coastal strip.
Fig.2 - Regional territory presents mountain, hilly, plain and coastal areas
2.1.2 Settlement structure
Friuli Venezia Giulia has 1.216.853 inhabitants (2018) and includes an area stretching from the
Adriatic Sea to the Alps. Only the city of Trieste has more than 100.000 inhabitants, while Udine
is slightly less and Pordenone has little more than 50.000 inhabitants. There are 20 small cities
ranging from 10.000 to 50.000 inhabitants where citizens and companies converge for a wide range
of local services. The main character of the settlements is the small-village-type: almost half of
the municipalities are inhabited by 1.000 to 5.000 inhabitants, a quarter of the municipalities are
even smaller, with less than 1.000 inhabitants.

8
Figure 5 shows the regional territory divided into 215 municipal territories.
Fig. 3 - The 215 Municipalities of the region
Table 1 provides an overview of the settlement structure of FVG which is also shown in figure 4.
Settlement structure - 2016 National Regional
Area (km²) 302.072,8 7.862,3
Population (thousands) 60589,4 1221,2
Number of municipalities (total) 7.960 216
Municipalities with inhabitants (number)
216
> 1.000.000
-
500.000 to <= 1.000.000
-
100.000 to < 500.000
1
50.000 to < 100.000
2
10.000 to < 50.000
20
5.000 to < 10.000
38
1.000 to < 5.000
102
< 1.000
53
Table 1 - National and regional settlement structure

9
Fig. 4 - Municipalities by number of inhabitants
2.1.3 Demographic structure and development
Population development
The population has remained fairly stable during the years due to positive net migration flows,
even if there has been a slow decline in the last few years.
Table 2 shows an increase in population at national level, while at regional level there was an
increase up to 2010, followed by a slight decrease in the following years.
Population development National Regional
2003 57.130.506 1.191.588
2005 57.875.753 1.204.718
2010 59.190. 143 1.234.079
2015 60.795.612 1.227.122
2018 60.483.973 1.216.853
Table 2 - National and regional population development
Figure 5 shows demographic trends across Italian regions: an increase is registered in the central-
northern regions and a decrease in the south.

10
Fig. 5 Demographic trends over Italian regions
FVG´s population density is lower than national: the regional indicator is 155 inhabitants / km²,
while the national one is 200 inhabitants / km².
Households
At national, as well as at regional level, the number of households is increasing but at the same
time the size of households is decreasing. Currently, the average size of a household is 2,32 persons
at national level and 2,17 persons at regional level.
Data about the number of families are shown in Table 3, while Fig.5 illustrates the trend of number
of regional households.
Fig. 6 shows the average size of households both at national and regional level.
Number of households National Regional
2003 22.876.102 495.700
2005 23.600.370 523.000
2010 25.175.793 551.200
2015 25.853.547 559.600
2018 26.081.199 561.100
Table 3 - Number of households at national and regional level

11
Fig. 6 - Development of households regional
Fig. 7 - Average size of households at national and regional level
2.1.1 Regional economy
The regional economy is described here on the basis of four parameters:
Average Income of households
Gross domestic product (GDP)
Gross value added (GVA)
Number of employees
12
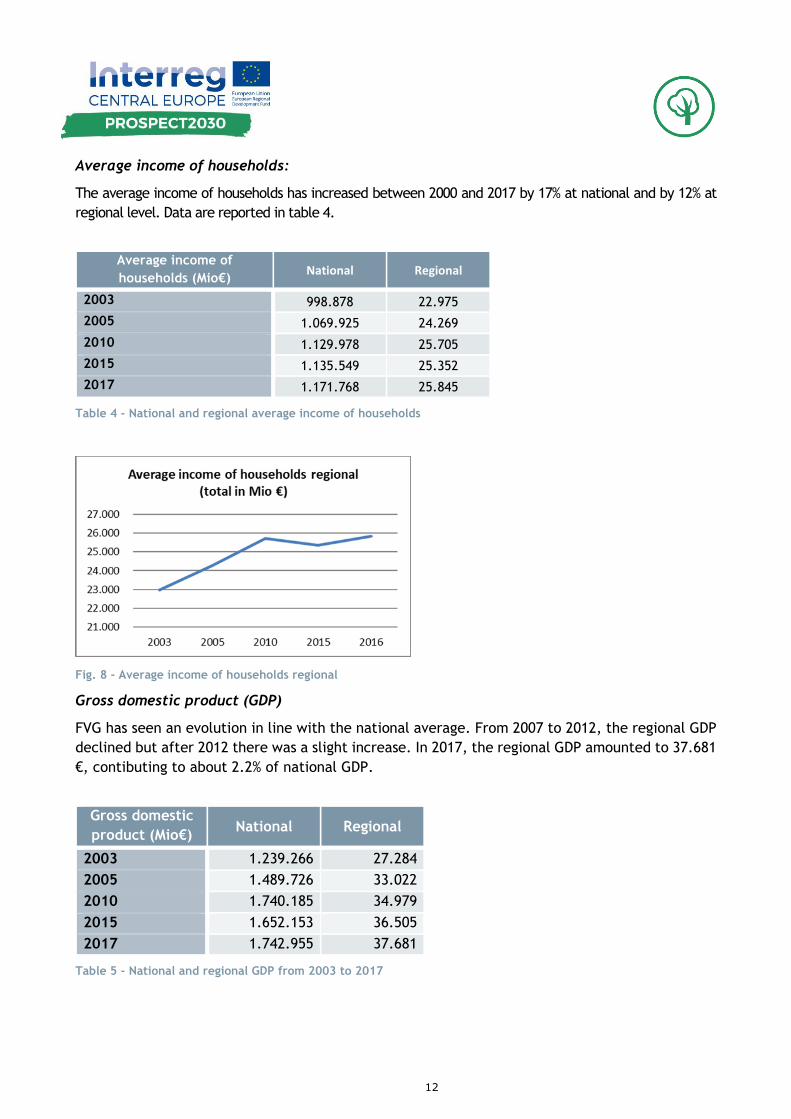
Average income of households:
The average income of households has increased between 2000 and 2017 by 17% at national and by 12% at
regional level. Data are reported in table 4.
Average income of
households (Mio€) National Regional
2003 998.878 22.975
2005 1.069.925 24.269
2010 1.129.978 25.705
2015 1.135.549 25.352
2017 1.171.768 25.845
Table 4 - National and regional average income of households
Fig. 8 - Average income of households regional
Gross domestic product (GDP)
FVG has seen an evolution in line with the national average. From 2007 to 2012, the regional GDP
declined but after 2012 there was a slight increase. In 2017, the regional GDP amounted to 37.681
€, contibuting to about 2.2% of national GDP.
Gross domestic
product (Mio€) National Regional
2003 1.239.266 27.284
2005 1.489.726 33.022
2010 1.740.185 34.979
2015 1.652.153 36.505
2017 1.742.955 37.681
Table 5 - National and regional GDP from 2003 to 2017

13
Fig. 9 - National and regional trend of GDP
Gross value added
GVA - Gross Value Added is the measure of the value of goods and services produced in an area,
industry or sectors of an economy. Unlike the GDP, it is mostly available also for the sectors active
in an area.
Fig. 10 gives a comparative overview on the GVA at national and regional level.
Fig. 10 - Sectoral share in national and regional GVA
Services are the main important contributor for GDP, both at national and regional level.
Commercial, retail, banking and services in general became the most important drivers of growth.
Industry is the only sector that is on average higher compared to national GDP. The core businesses
include furniture, electric appliances and agri-food.
The rate of employees by sector reflects the distribution of GVA.

14
Fig. 11 - Employees by sector at national and regional level
3. Infrastructure
3.1. Energy related infrastructure
3.1.1 Electricity grid infrastructure
At transmission grid level the TSO is Terna - Rete Elettrica Nazionale which is operating the 380
kV grid (marked in red in Fig. 12) and the 220 kV grid (marked in green).
At distribution grid level, there are four grid operators (DSOs):
E-Distribuzione
Idroelettrica Valcanale
SECAB Società Cooperativa
Soc. Coop. Idroelettrica di Forni di Sopra
The bigger DSO is E-Distribuzione, which is operating almost the whole electric distribution system,
while the remaining three are operating only at the local level.

15
Fig. 12 - Electricity grid infrastructure: 220 kV (green) and 380 kV (red)
3.1.2 Gas grid infrastructure
There is only one gas grid operator in the region, which is Snam Rete Gas. As it can be seen in Fig.
13, the pipeline is differentiated between a main grid (marked in red) and a secondary one
(marked in green). Although the region is well served, some areas are still not connected to the
gas pipeline, especially in certain mountain areas.

16
Fig. 13 - Gas grid infrastructure: main (red) and secondary (green) pipelines
3.1.3 District heat infrastructure
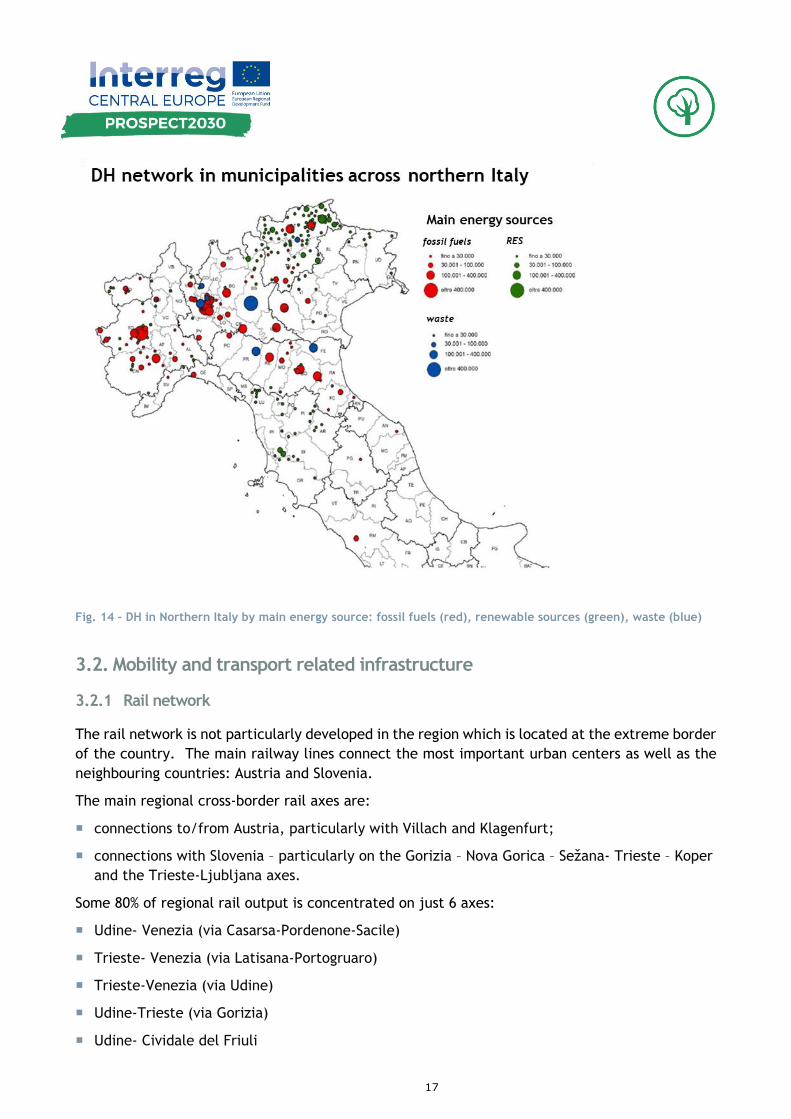
On the Italian territory, the grid development is mainly distributed across the northern regions.
At national level all three power sources (fossil fuels, waste and RES) are present, while in Friuli
Venezia Giulia region the main source is represented by RES (biomass). Due to the large availability
of wood in the northern area of the region which is rich in forests, most facilities are localized
there as it is displayed in Fig. 14
17
Fig. 14 - DH in Northern Italy by main energy source: fossil fuels (red), renewable sources (green), waste (blue)
3.2. Mobility and transport related infrastructure
3.2.1 Rail network
The rail network is not particularly developed in the region which is located at the extreme border
of the country. The main railway lines connect the most important urban centers as well as the
neighbouring countries: Austria and Slovenia.
The main regional cross-border rail axes are:
connections to/from Austria, particularly with Villach and Klagenfurt;
connections with Slovenia – particularly on the Gorizia – Nova Gorica – Sežana- Trieste – Koper
and the Trieste-Ljubljana axes.
Some 80% of regional rail output is concentrated on just 6 axes:
Udine- Venezia (via Casarsa-Pordenone-Sacile)
Trieste- Venezia (via Latisana-Portogruaro)
Trieste-Venezia (via Udine)
Udine-Trieste (via Gorizia)
Udine- Cividale del Friuli

18
Casarsa della Delizia- Portogruaro
Fig. 15 Rail network in Friuli Venezia Giulia
Fig. 16 - Railway network: fundamental line (blue) and complementary line (light blue)
Figures 15 and 16 show the development of the railway network across the regional territory.
19
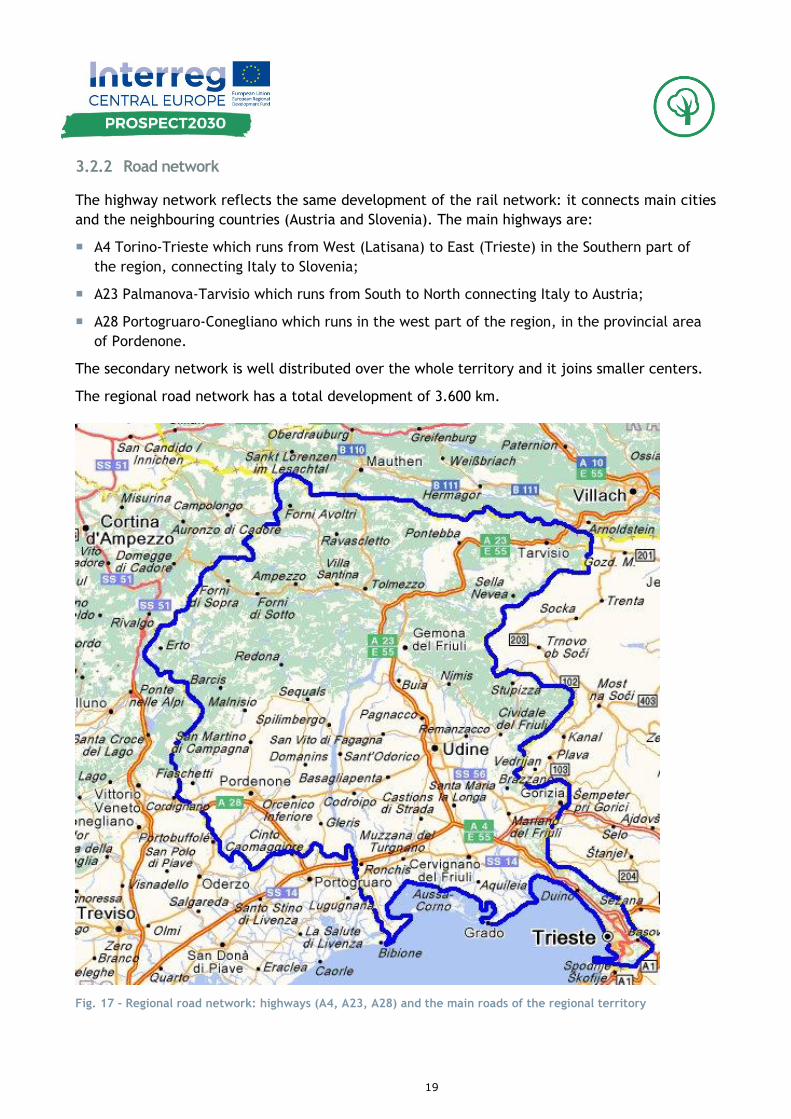
3.2.2 Road network
The highway network reflects the same development of the rail network: it connects main cities
and the neighbouring countries (Austria and Slovenia). The main highways are:
A4 Torino-Trieste which runs from West (Latisana) to East (Trieste) in the Southern part of
the region, connecting Italy to Slovenia;
A23 Palmanova-Tarvisio which runs from South to North connecting Italy to Austria;
A28 Portogruaro-Conegliano which runs in the west part of the region, in the provincial area
of Pordenone.
The secondary network is well distributed over the whole territory and it joins smaller centers.
The regional road network has a total development of 3.600 km.
Fig. 17 - Regional road network: highways (A4, A23, A28) and the main roads of the regional territory
20
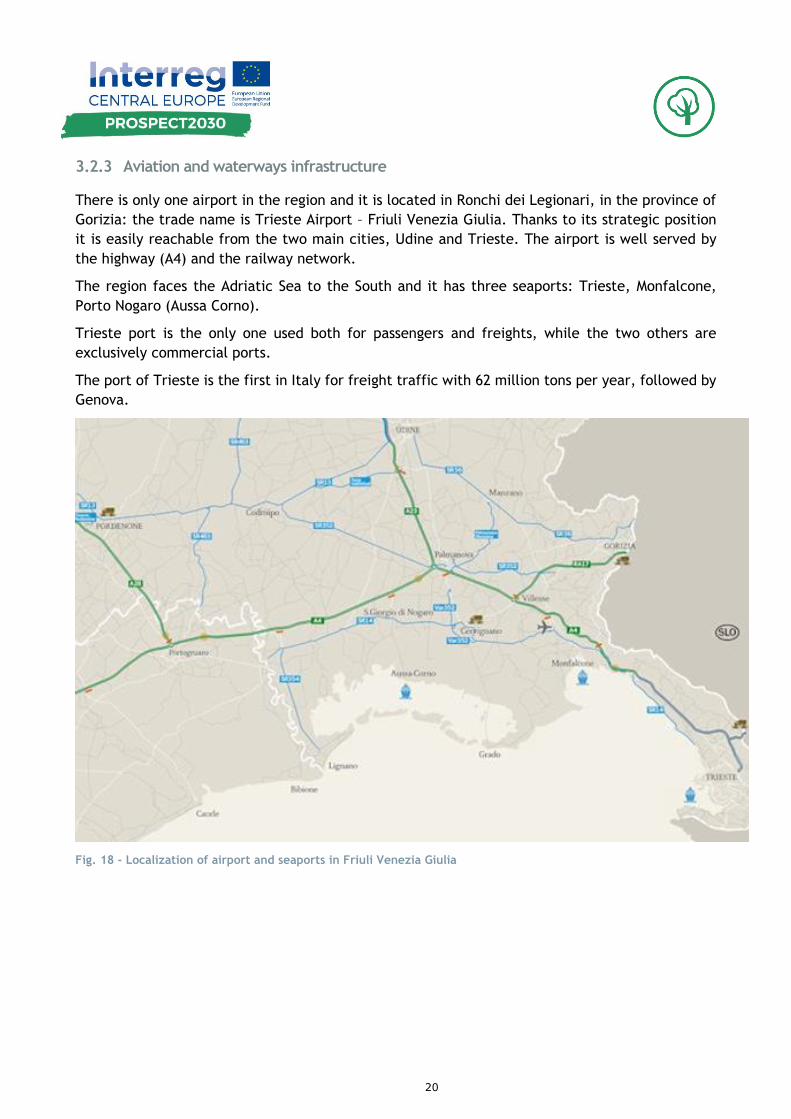
3.2.3 Aviation and waterways infrastructure
There is only one airport in the region and it is located in Ronchi dei Legionari, in the province of
Gorizia: the trade name is Trieste Airport – Friuli Venezia Giulia. Thanks to its strategic position
it is easily reachable from the two main cities, Udine and Trieste. The airport is well served by
the highway (A4) and the railway network.
The region faces the Adriatic Sea to the South and it has three seaports: Trieste, Monfalcone,
Porto Nogaro (Aussa Corno).
Trieste port is the only one used both for passengers and freights, while the two others are
exclusively commercial ports.
The port of Trieste is the first in Italy for freight traffic with 62 million tons per year, followed by
Genova.
Fig. 18 - Localization of airport and seaports in Friuli Venezia Giulia
21
4. Transport
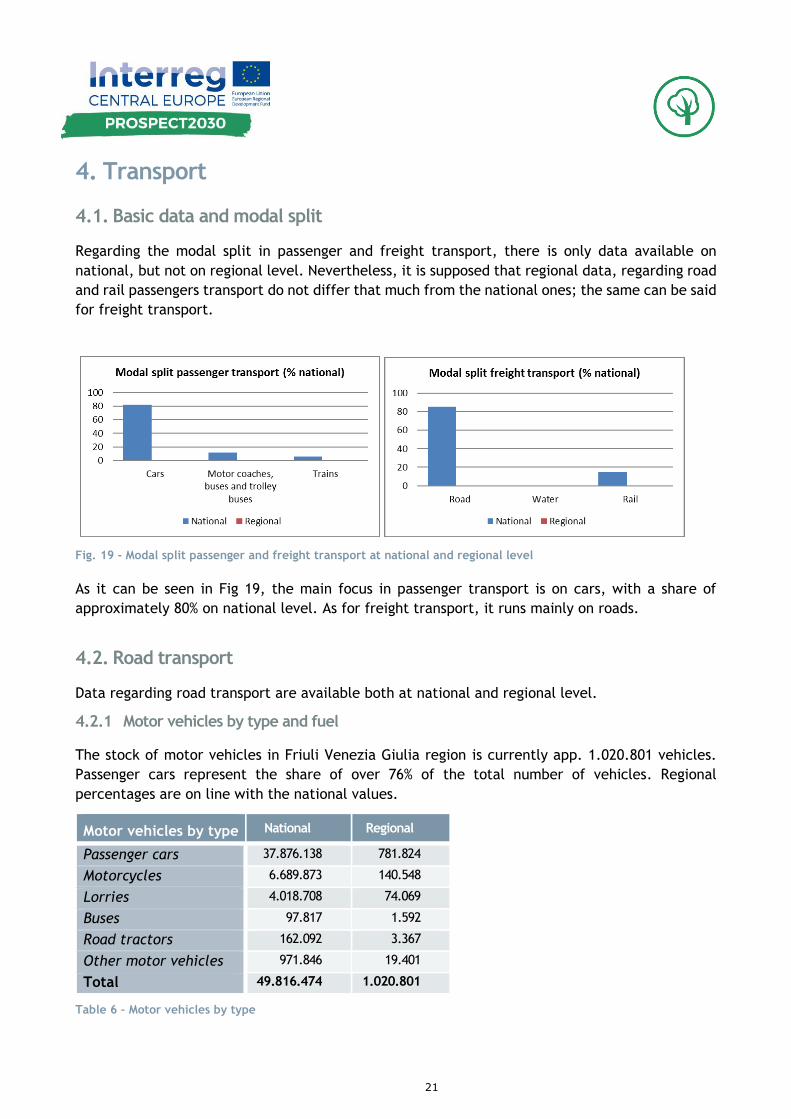
4.1. Basic data and modal split
Regarding the modal split in passenger and freight transport, there is only data available on
national, but not on regional level. Nevertheless, it is supposed that regional data, regarding road
and rail passengers transport do not differ that much from the national ones; the same can be said
for freight transport.
Fig. 19 - Modal split passenger and freight transport at national and regional level
As it can be seen in Fig 19, the main focus in passenger transport is on cars, with a share of
approximately 80% on national level. As for freight transport, it runs mainly on roads.
4.2. Road transport
Data regarding road transport are available both at national and regional level.
4.2.1 Motor vehicles by type and fuel
The stock of motor vehicles in Friuli Venezia Giulia region is currently app. 1.020.801 vehicles.
Passenger cars represent the share of over 76% of the total number of vehicles. Regional
percentages are on line with the national values.
Motor vehicles by type National Regional
Passenger cars 37.876.138 781.824
Motorcycles 6.689.873 140.548
Lorries 4.018.708 74.069
Buses 97.817 1.592
Road tractors 162.092 3.367
Other motor vehicles 971.846 19.401
Total 49.816.474 1.020.801
Table 6 - Motor vehicles by type

22
Fig 20 illustrates the contents of Table 6:
Fig. 20 - Motor vehicles: subdivision by type at national and regional level
4.2.2 Passenger cars by fuel, kilometre and fuel performance
The amount of passenger cars in the region corresponds to a share of 2% of the total fleet of
passenger cars in Italy. The per capita figure at national level is 0,62 and at regional level 0,64
cars per capita. The distribution of cars by fuel is supposed to be equal to the total regional
distribution.
Table 7 provides an overview on the passenger cars by fuel on national and regional level.
Passenger cars by fuel (number) National Regional Average km/car*a
Average Consumption (l/100 km; or kWh/100 km)
Petrol 18.360.105 400.978 7,2
Petrol-flex fuel
Diesel 16.260.625 355.128 6,6
Electric 5.743 77 14,9
Liquefied petroleum gas
-
Natural gas 69,1
Petrol / Liquefied petroleum gas
(bivalent)
2.211.368 19.564
Petrol / natural gas (bivalent) 911.246 3.177
Petrol / electric (hybrid) 117.433 2.745 5,1
Diesel / electric (hybrid) 3.332 65 5,7
Hydrogen / fuel cell
-
Total 37.869.852 781.824
Table 7 - Number of passenger cars by fuel (national and regional level)
23
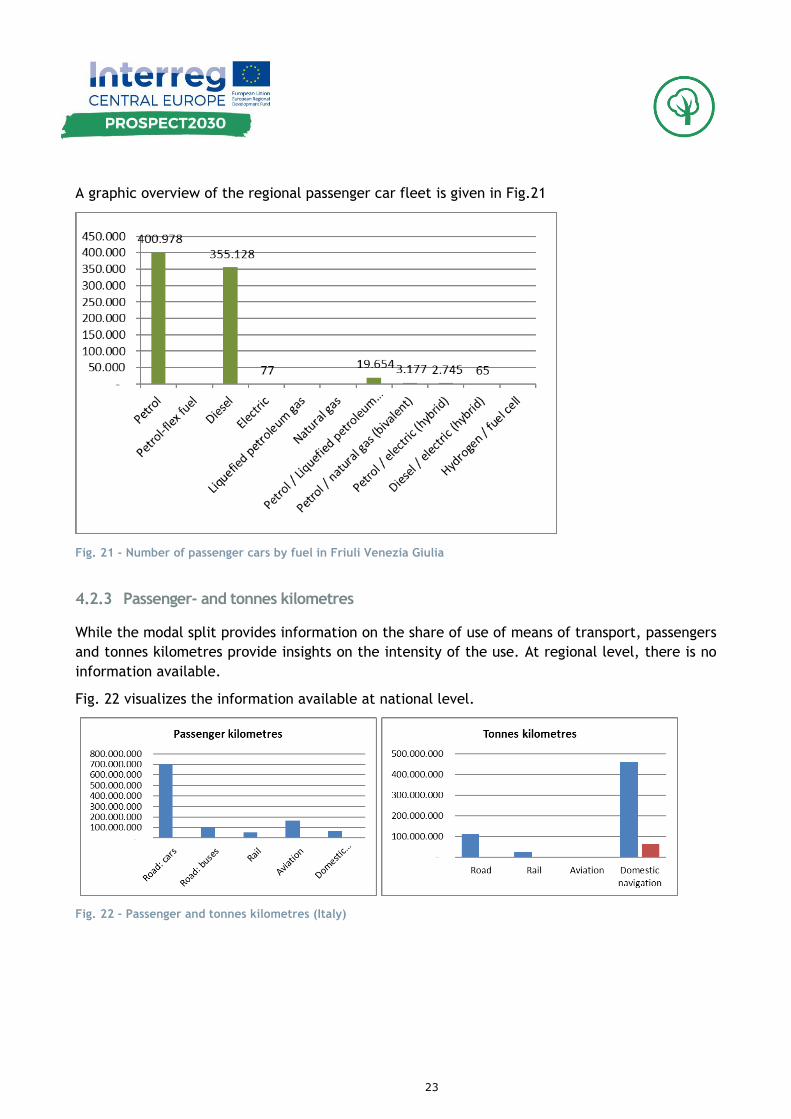
A graphic overview of the regional passenger car fleet is given in Fig.21
Fig. 21 - Number of passenger cars by fuel in Friuli Venezia Giulia
4.2.3 Passenger- and tonnes kilometres
While the modal split provides information on the share of use of means of transport, passengers
and tonnes kilometres provide insights on the intensity of the use. At regional level, there is no
information available.
Fig. 22 visualizes the information available at national level.
Fig. 22 - Passenger and tonnes kilometres (Italy)

24
4.3. Rail transport
4.3.1 Passenger and tonnes kilometres
Information related to passengers and tonnes kilometres is reported in section 4.2.3.
4.3.2 Development of passenger and goods transports
At regional level, there is no such information available.
Fig 23 displays the progress of development at national level
Fig. 23 - Development of rail freight and passenger transport share in % (national level)
4.4. Air and waterway transport
The only data available at regional level on the air and waterway transport are the following:
data on transit passengers (departure + arrivals) for Trieste airport – Friuli Venezia Giulia
which amounted, in 2016, to 726.893 passengers (772.517 in 2018);
data on the annual freight traffic (embarked and unloaded) of the three regional ports, shown
in table 8.
Port Annual freight traffic (t)
Trieste 62.000.000
Monfalcone 4.630.000
Porto Nogaro 1.600.000
Table 8 - Annual freight traffic of three regional ports (tons)
25
5. Energy status
5.1. Energy in the European and national context
The following paragraphs include graphs regarding the main parameters of the respective
simplified energy balances. The abbreviations in the graphs need to be read as follows:
PP: Primary Production (blue bar)
GIC: Gross Inland Consumption (red bar)
TI: Transformation Input (green bar)
TO: Transformation Output (violet bar)
FEC: Final Energy Consumption (light blue bar)
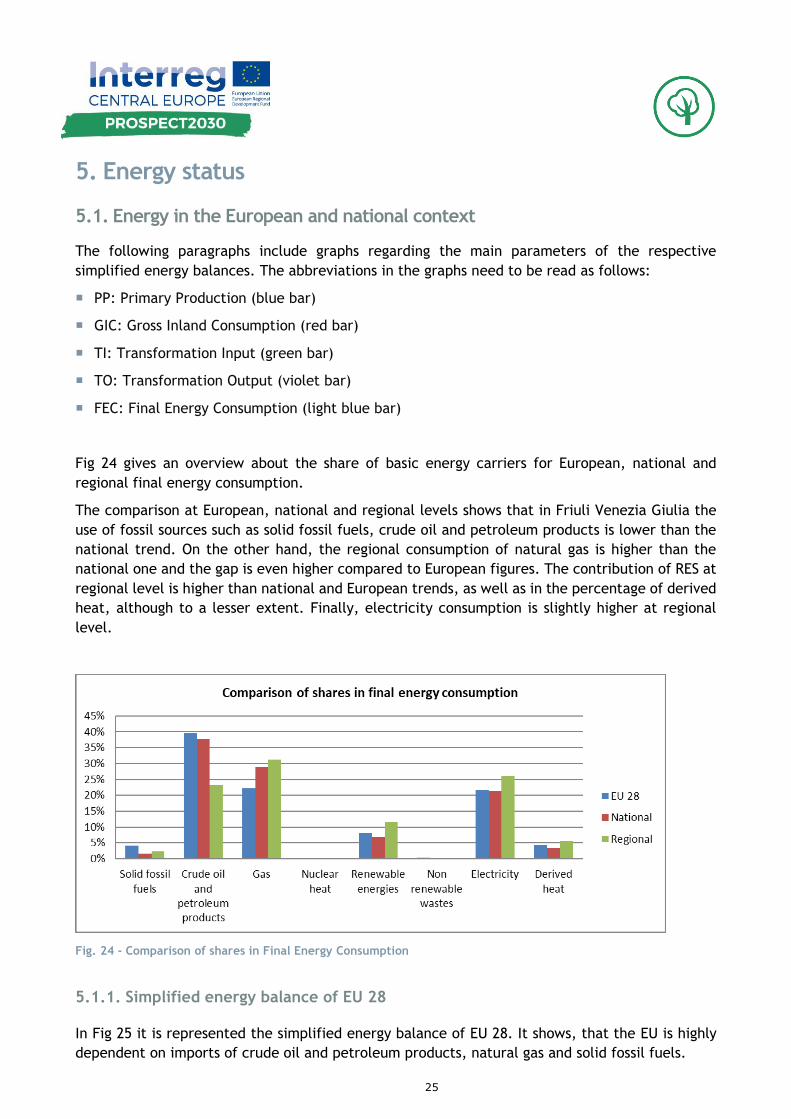
Fig 24 gives an overview about the share of basic energy carriers for European, national and
regional final energy consumption.
The comparison at European, national and regional levels shows that in Friuli Venezia Giulia the
use of fossil sources such as solid fossil fuels, crude oil and petroleum products is lower than the
national trend. On the other hand, the regional consumption of natural gas is higher than the
national one and the gap is even higher compared to European figures. The contribution of RES at
regional level is higher than national and European trends, as well as in the percentage of derived
heat, although to a lesser extent. Finally, electricity consumption is slightly higher at regional
level.
Fig. 24 - Comparison of shares in Final Energy Consumption
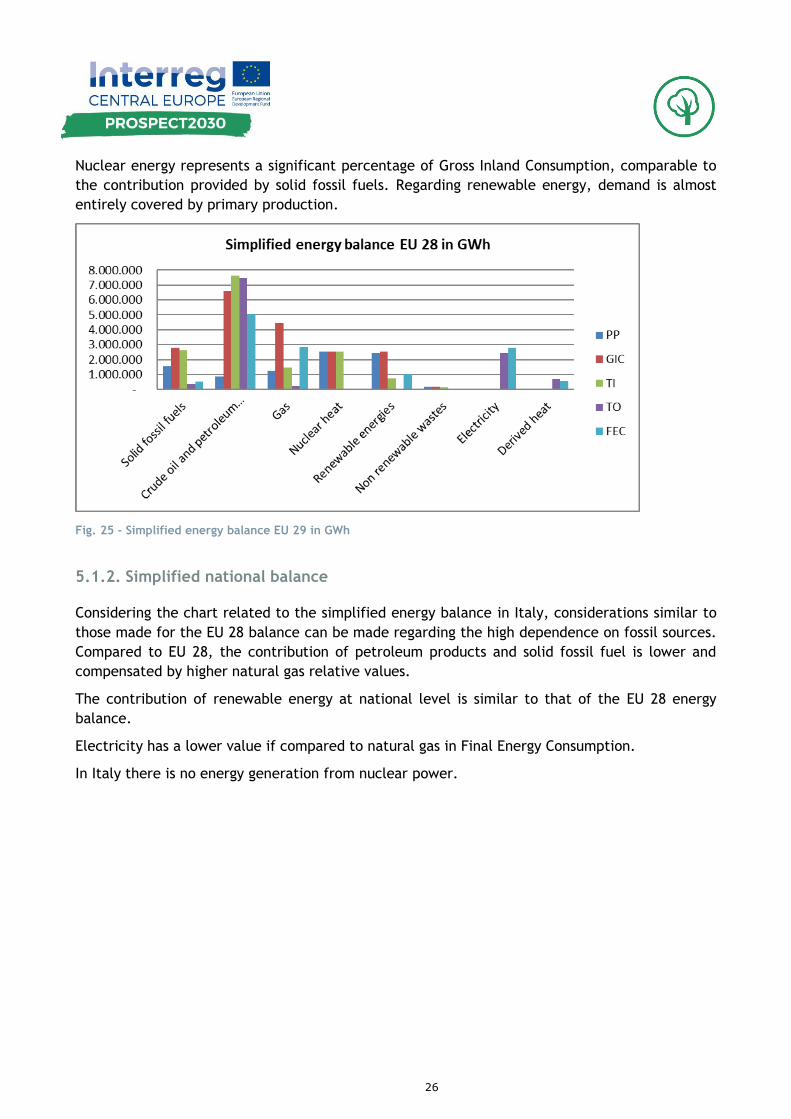
5.1.1. Simplified energy balance of EU 28
In Fig 25 it is represented the simplified energy balance of EU 28. It shows, that the EU is highly
dependent on imports of crude oil and petroleum products, natural gas and solid fossil fuels.
26
Nuclear energy represents a significant percentage of Gross Inland Consumption, comparable to
the contribution provided by solid fossil fuels. Regarding renewable energy, demand is almost
entirely covered by primary production.
Fig. 25 - Simplified energy balance EU 29 in GWh
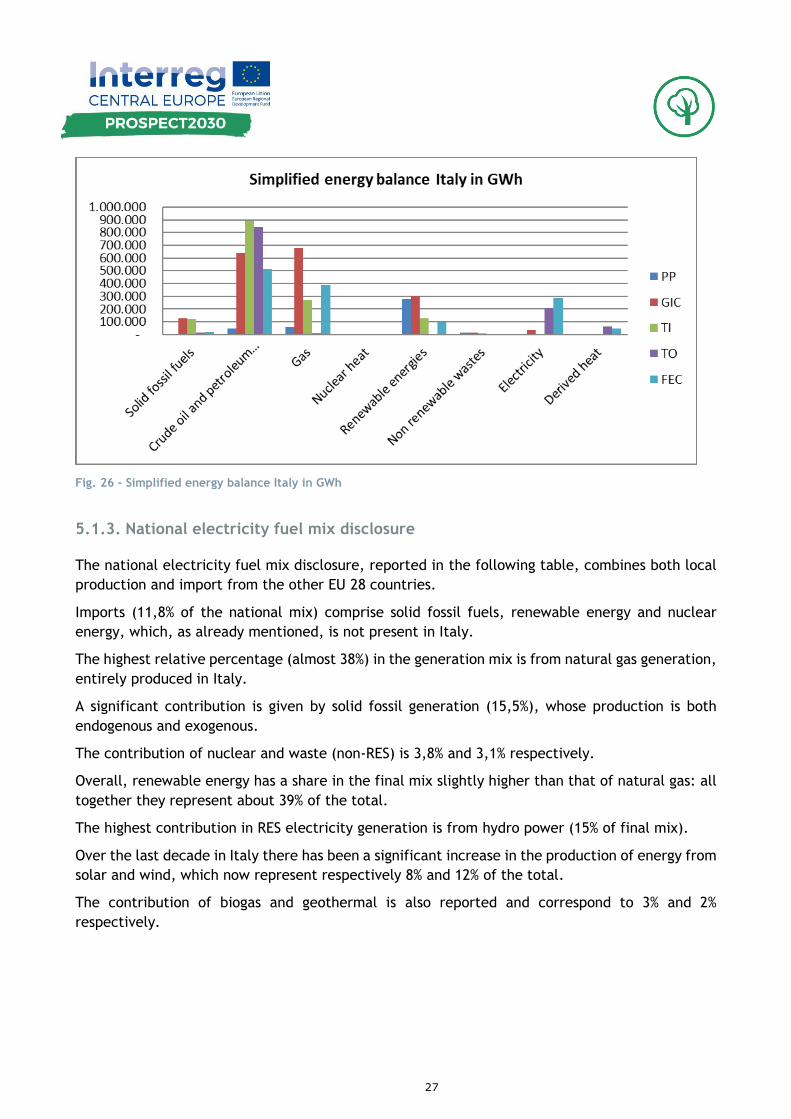
5.1.2. Simplified national balance
Considering the chart related to the simplified energy balance in Italy, considerations similar to
those made for the EU 28 balance can be made regarding the high dependence on fossil sources.
Compared to EU 28, the contribution of petroleum products and solid fossil fuel is lower and
compensated by higher natural gas relative values.
The contribution of renewable energy at national level is similar to that of the EU 28 energy
balance.
Electricity has a lower value if compared to natural gas in Final Energy Consumption.
In Italy there is no energy generation from nuclear power.
27
Fig. 26 - Simplified energy balance Italy in GWh
5.1.3. National electricity fuel mix disclosure
The national electricity fuel mix disclosure, reported in the following table, combines both local
production and import from the other EU 28 countries.
Imports (11,8% of the national mix) comprise solid fossil fuels, renewable energy and nuclear
energy, which, as already mentioned, is not present in Italy.
The highest relative percentage (almost 38%) in the generation mix is from natural gas generation,
entirely produced in Italy.
A significant contribution is given by solid fossil generation (15,5%), whose production is both
endogenous and exogenous.
The contribution of nuclear and waste (non-RES) is 3,8% and 3,1% respectively.
Overall, renewable energy has a share in the final mix slightly higher than that of natural gas: all
together they represent about 39% of the total.
The highest contribution in RES electricity generation is from hydro power (15% of final mix).
Over the last decade in Italy there has been a significant increase in the production of energy from
solar and wind, which now represent respectively 8% and 12% of the total.
The contribution of biogas and geothermal is also reported and correspond to 3% and 2%
respectively.

28
Electricity fuel mix disclosure (national average) %
Hydro 15,26
Tide, wave, ocean -
Wind 6,37
Solar 7,95
Geothermal 2,26
Solid biofuels 1,47
Biogases (incl. sewage-gas) 2,97
Waste (renewable) 0,88
Liquid biofuels 1,69
Solid fossil 15,47
Liquid fossil 0,79
Gaseous fossil 37,97
Nuclear 3,78
Waste (non - renewable) 3,14
TOTAL 100
Table 8 - Electricity fuel mix disclosure (national average)
Fig 27 displays the contents of table 8, while table 9 and fig.28 show the contribution of renewable
sources.
Fig. 27 - National electricity fuel mix: percentage of different source

29
Electricity fuel mix disclosure (national average) %
Renewable 38,85
Non renewable 61,15
Total 100,00
Table 9 Electricity fuel mix disclosure
Fig. 28 - National electricity fuel mix: percentage of renewable and non-renewable sources
5.1.4. Time series of national final energy consumption
This chapter illustrates the development of national FEC (Final Energy Consumption) and the
contribution of the various sources (renewable and non-renewable)
Fig. 29 shows an increase of FEC from 1990 to 2005 and then a progressive reduction until 2014,
when it stabilizes at around 1.4 million GWh
Fig. 29 - Development of FEC in GWh/a
30
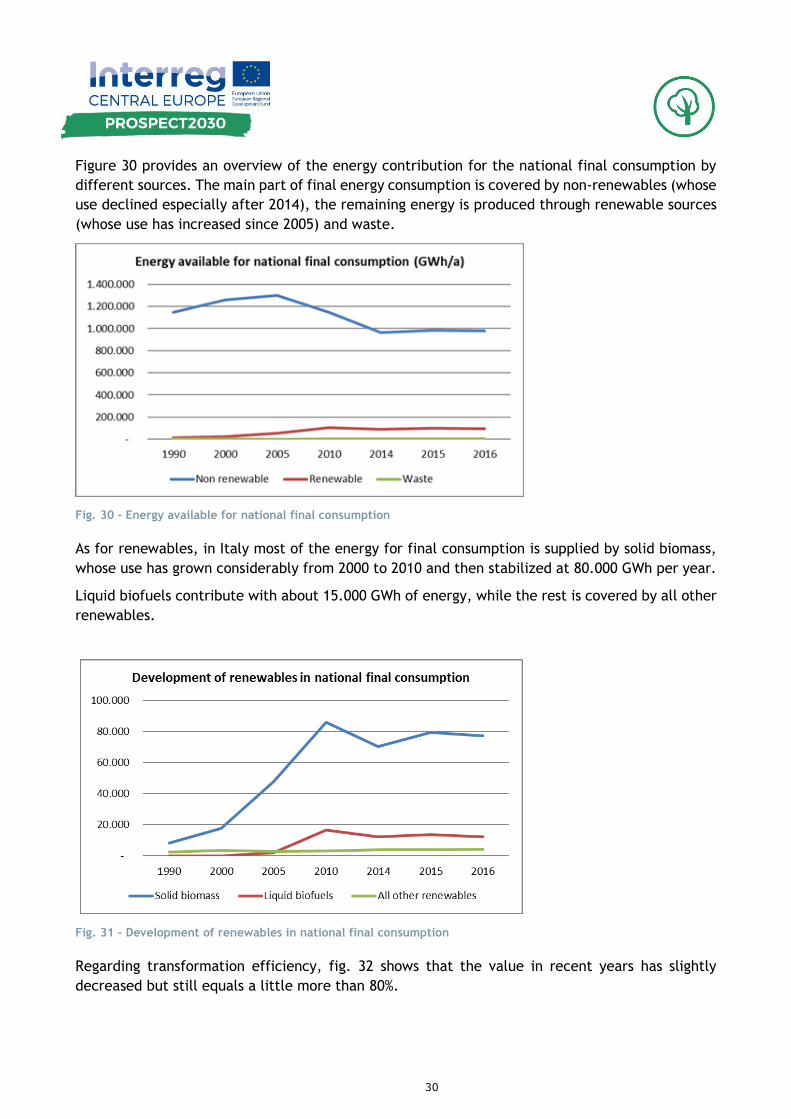
Figure 30 provides an overview of the energy contribution for the national final consumption by
different sources. The main part of final energy consumption is covered by non-renewables (whose
use declined especially after 2014), the remaining energy is produced through renewable sources
(whose use has increased since 2005) and waste.
Fig. 30 - Energy available for national final consumption
As for renewables, in Italy most of the energy for final consumption is supplied by solid biomass,
whose use has grown considerably from 2000 to 2010 and then stabilized at 80.000 GWh per year.
Liquid biofuels contribute with about 15.000 GWh of energy, while the rest is covered by all other
renewables.
Fig. 31 - Development of renewables in national final consumption
Regarding transformation efficiency, fig. 32 shows that the value in recent years has slightly
decreased but still equals a little more than 80%.

31
Fig. 32 - Transformation efficiency
The distribution losses from 1990 to 2016 showed slight fluctuations, in 2016 their value was
estimated at around 1.58%, as it can be seen in fig. 33.
Fig. 33 - Distribution losses
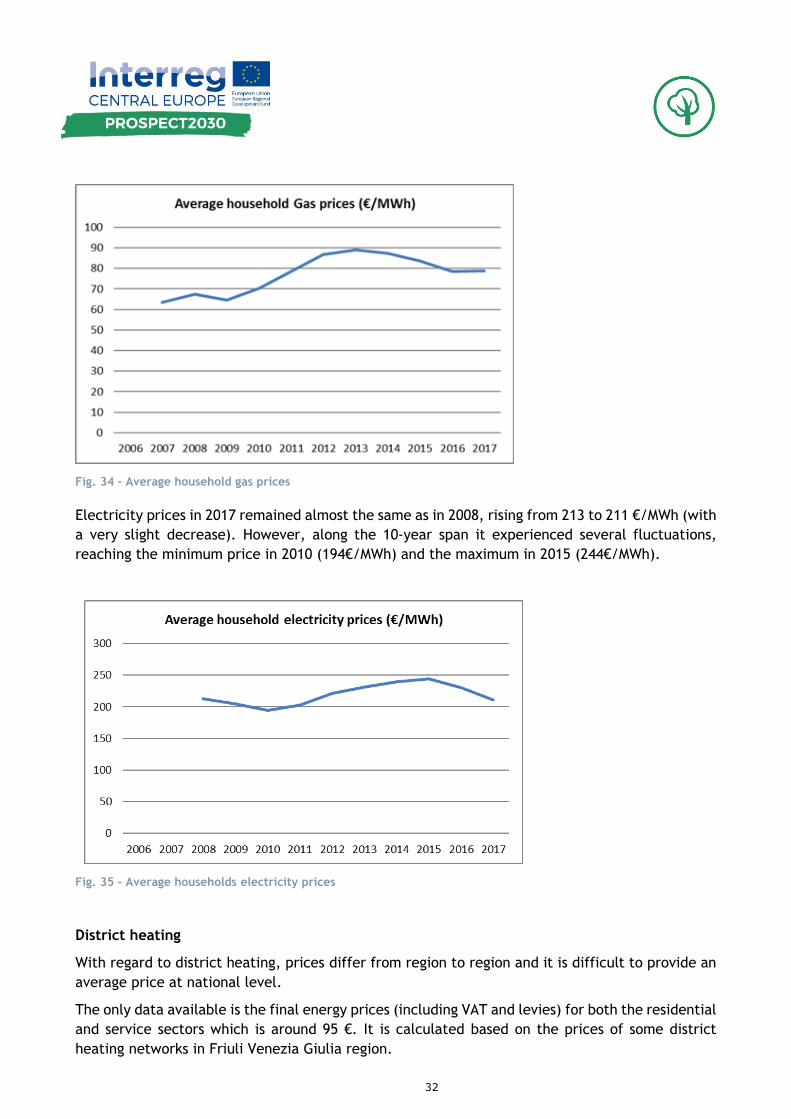
5.1.5. Energy prices – status quo and development 2005 to 2017
Gas and electricity prices
Values shown in figures 33 and 34 take into consideration the final energy price, including VAT
and taxes.
The trend for average household’s gas and electricity prices from 2006 to 2017 (illustrated in
figures 34 and 35) are slightly different.
Gas price showed some fluctuations, and overall it increased by around 25% from 2007 to 2017,
reaching a value of around 80€ / MWh.
32
Fig. 34 - Average household gas prices
Electricity prices in 2017 remained almost the same as in 2008, rising from 213 to 211 €/MWh (with
a very slight decrease). However, along the 10-year span it experienced several fluctuations,
reaching the minimum price in 2010 (194€/MWh) and the maximum in 2015 (244€/MWh).
Fig. 35 - Average households electricity prices
District heating
With regard to district heating, prices differ from region to region and it is difficult to provide an
average price at national level.
The only data available is the final energy prices (including VAT and levies) for both the residential
and service sectors which is around 95 €. It is calculated based on the prices of some district
heating networks in Friuli Venezia Giulia region.
33
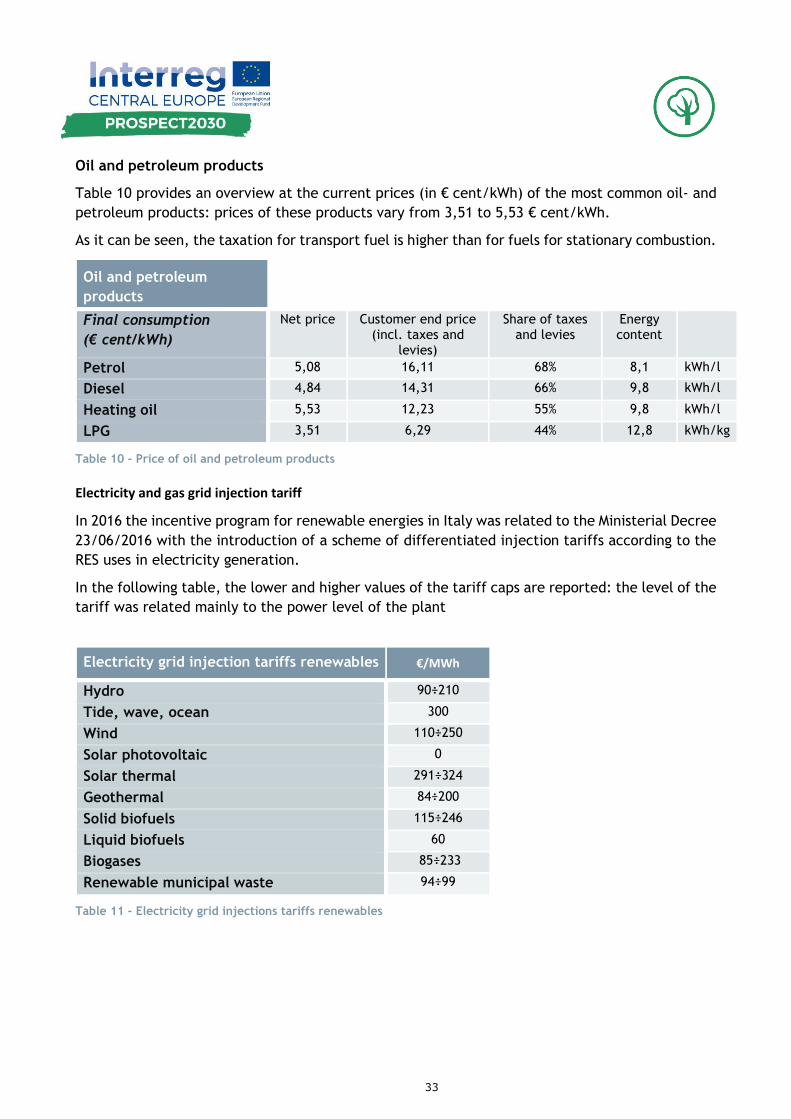
Oil and petroleum products
Table 10 provides an overview at the current prices (in € cent/kWh) of the most common oil- and
petroleum products: prices of these products vary from 3,51 to 5,53 € cent/kWh.
As it can be seen, the taxation for transport fuel is higher than for fuels for stationary combustion.
Oil and petroleum
products
Final consumption
(€ cent/kWh)
Net price Customer end price (incl. taxes and
levies)
Share of taxes and levies
Energy content
Petrol 5,08 16,11 68% 8,1 kWh/l
Diesel 4,84 14,31 66% 9,8 kWh/l
Heating oil 5,53 12,23 55% 9,8 kWh/l
LPG 3,51 6,29 44% 12,8 kWh/kg
Table 10 - Price of oil and petroleum products
Electricity and gas grid injection tariff
In 2016 the incentive program for renewable energies in Italy was related to the Ministerial Decree
23/06/2016 with the introduction of a scheme of differentiated injection tariffs according to the
RES uses in electricity generation.
In the following table, the lower and higher values of the tariff caps are reported: the level of the
tariff was related mainly to the power level of the plant
Electricity grid injection tariffs renewables €/MWh
Hydro 90÷210
Tide, wave, ocean 300
Wind 110÷250
Solar photovoltaic 0
Solar thermal 291÷324
Geothermal 84÷200
Solid biofuels 115÷246
Liquid biofuels 60
Biogases 85÷233
Renewable municipal waste 94÷99
Table 11 - Electricity grid injections tariffs renewables

34
5.2. Regional energy demand
Data reported in the table below relate to regional energy demand and is derived from: (i) the
GSE, the national public-interest company operating in the energy sector, (ii) the burden sharing
program (the national program that gives the different regions binding targets according to the
20-20-20 national objectives), (iii) data collected by Terna’s regional statistics and (iv) from the
bollettino petrolifero – oil bulletin (for crude oil and petroleum products).
5.2.1. Regional energy demand by fuel and sector
Table 12 reports the estimate for final energy consumption in Friuli Venezia Giulia in 2016.
The total amount is 37.775 GWh. Data is divided by energy carrier and production sector.
Estimation of
regional energy
demand (GWh)
Total Solid fossil fuels
Crude oil and
petroleum products
Natural Gas
Renewable energies
Non - renewable
waste Electricity
Derived heat
2016
Final energy
consumption 37.775 913 8.826 11.776 4.343 32 9.790 2.095
Agriculture,
forestry and
fishing
359 238 121
Industry (without
construction),
energy, water
sewage, etc.
12.505 913 969 4.738 236 32 5.607 10
Construction 101 65 36
Transport 7.041 6.133 151 255 502
Services 5.973 295 1.706 227 2.184 1.561
Residential 11.796 1.191 5.116 3.625 1.340 524
Table 12 - Estimate of regional energy demand (GWh)
The most widely used energy source at regional level is natural gas (almost one third of total
consumption), especially in the civil and industrial sectors and only a small percentage in
transport.
Electricity is obviously an energy carrier used in all sectors (including transport, rail and road). Its
consumption at regional level amounts to almost 10,000 GWh, more than 25% of total consumption.
About 23% of consumption is related to crude and petroleum products, used above all in the
transport sector.

35
Considering RES (thermal), the main contribution is related to biomass use in residential sector
for heating purposes. The contribution of renewable energy to total consumption amounts to
around 16%.
The percentage of RES in electricity generation (39% as shown in previous chapters) is not explicitly
shown in the table below as it is included under electricity.
Considering the percentages of the different sectors, fig. 36 shows that the industrial and
residential sectors represent about one third of total consumption each, while the tertiary and
transport sectors cover about 18% each.
Fig. 36 - Final energy consumption by fuel
Fig. 37 - Share of sectors in total regional final energy consumption

36
The distribution of renewable and non - renewable energy within the respective sectors is
visualized in fig 37.
The contribution of renewables is higher in the residential and services sector: for them renewable
energy represents over 40% of the sector's consumption.
For the other energy-intensive sectors (transport and industry) the percentage is lower, but it is
still around 20%.
Fig. 38 - Share of renewables in total sectoral consumption
5.3. Regional energy supply
5.3.1. Regional generation by source, capacity and output
Table 13 shows the energy generation in Friuli Venezia Giulia from electricity and district heating
plants.
The most significant source of electricity generation at regional level is natural gas. Plants with a
total capacity of 865 MWel produce 5.670.000 MWh per year, almost 50% of the electricity produced
in Friuli Venezia Giulia.
On top of this, there is the production of plants powered by solid and liquid fossil, which produce
a quarter of electricity at regional level (650 MW of installed power) and the hydroelectric plants
that produce almost 1.600.000 MWh (total power of the 215 regional plants: about 500 MW)
The other sources (solar photovoltaic, primary solid biofuels, biogases, liquid biomass and waste)
cover the remaining 12% of regional electricity production.
Regarding the production of heat, data reported in table 13 are those related to district heating.
At regional level there are 18 biomass-powered plants (total production of 46.500 MWh) and a
natural gas-fuelled plant in Udine, which produces about 25.000 MWh per year.

37
Source
Electricy only -
Capacity installed
Electricity production
MWh/a
Supply share
electricity (%)
Heat capacity installed
Derived heat
MWh/a
Supply share
heat (%)
Solid biomass (residues)
Hydro 502 1.588.500 13,82
Tide, wave, ocean
Wind
Solar photovoltaic 512 520.200 4,52
Solar thermal
Geothermal (deep)
Primary solid biofuels 6 35.100 0,31 340,8 46.572 65,07
Biogases (incl. sewage-gas) 56 390.300 3,39
Waste (renewable) 21 56.400 0,49
Biogasoline
Biodiesel
Liquid biomass (e.g. black
liquor etc.) 260.600 2,27
Ambient heat (heat pumps)
Solid and Liquid fossil 652 2.874.100 25,00
Gaseous fossil 865 5.668.900 49,31 83,7 25.000 34,93
Waste (notren.) 18 102.700 0,89
TOTAL 2.632 11.946.712 71.572
thereof non - renewable 1.535 8.645.700 75,20 83,7 25.000 34,93
thereof renewable 1.097 3.392.512 24,80 15,2 46.572 65,07
Table 13 - Electricity generation in Friuli Venezia Giulia
Further considerations can be drawn on the percentage of renewables out of the total production.
Regarding electricity production, renewables account for about 25% of the total, while in the
production of heat for heating networks, renewable sources represent about 65% of the total.
The main contents of the table are visualized in fig 38 and fig. 39.

38
Fig. 39 - Regional electricity generation by source
Fig. 40 - Regional district heating generation by source
Location of biomass and hydroelectric plants, and diffusion of photovoltaic solar systems across
the regional territory are shown in the maps of Fig. 41.

39
Fig. 41 - Localization of biomass, hydroelectric and photovoltaic plants on the regional territory
5.3.2. Energy storage
Data regarding energy storage are only available at national level.
Data reported in table 14 are related to year 2016.
Energy storage
National Regional
Number Installed capacity (MWh) Number Installed capacity (MWh)
Battery storage 4 4.017
Pumped hydro storage
Power-to-gas
Compressed air storage
Other
Total 4 4.017
Table 14 - Energy storage: number and installed capacity on national level
5.3.3. Regional key technologies for supply
The first objective pursued in the regional strategy is the reduction of the final energy demand.
However, we are aware that it is not possible to switch entirely to renewables in the short run:
this will require some time. In the meantime, and with respect to key technologies for supply,
there are several drivers that must be followed at regional level:
• improvements of energy efficiency in thermal and electricity generation;
• switch to local and renewable energy sources;
• storage of heat and electricity.
Cogeneration (CHP) and tri-generation (CCHP) represent interesting technologies to improve
energy transformation that can take advantages also from use of local biomasses. There is an
interesting potential for this renewable energy vector since it is wide available in the mountain
areas and in their proximity. As well these technologies can be exploited both with fossil and

40
renewable energy sources and in combination with district heating networks. These are mainly
devoted to urban areas where heat demand per square kilometre is sufficiently high to guarantee
economic sustainability to the investment projects. However, rural areas without natural gas grids
and with adequate and stable density of population can represent potential areas for the
development of small district heating networks supplied with biomasses. Moreover, in sparsely
populated areas, the role of biomass will be central to covering the thermal needs of the
residential sector, through a renovation of the existing park towards appliances and boilers with
greater production efficiency and less pollutant emissions (PM10).
Heat pumps are another key technology that allows significant improvements in heat generation
efficiency provided some conditions that are met in the flatland, almost half of the regional
territory, where the winter climate is mild and the summer is hot. This technology is reversible:
the same machine can be used to produce heat in the winter and cool in the summer, an increasing
requirement with respect to local climate warming trends.
The role of the solar source will be key for future developments in the residential sector. Solar
photovoltaic can spread over all roofs in combination with promising energy storage systems: this
could allow to cover around 60% of final power demand in the civil sector. Large-sized photovoltaic
plants should be limited to marginal lands, those ones under-used or not-used for pollution, low
agricultural fertility, land use conversion from industrial sites, etc. As well, solar thermal is
already well spread over domestic buildings and can still increase especially in combination with
other domestic technologies such as hybrid systems (puffers and heat pumps or condensing boilers)
or with integrated heat systems such as district heating networks and seasonal thermal storages.
Revamping of existing large hydroelectrical power plants with higher performance turbines and
construction of new small hydroelectrical power plants based on innovative turbines and screw
turbines will represent other key technologies interesting for local energy communities.
With respect to the transport system, we deem that the first step in switching to a more
sustainable way of moving will rely on hybrid technologies for the car sector and on natural gas
(bio-methane) engines for lorries. A complete electrification of this sector can be foreseen only
in the very long run, since very important upgrades in local power infrastructures are required
with respect to both power capacity and power transportation and distribution.
5.4. Regional demand-supply balance and development potentials
5.4.1. Regional balance and self-supply rates
In the following table, the regional balance is reported concerning local production and final
energy needs.
The electricity produced in the region is higher than the regional demand: the surplus is 1.706.500
MWh (17%).
Heat production is covered only by 3% with local production related to district heating (the heat
production from CHP at the user is not considered as local production). No official data is available
for heat pump and solar thermal production at the user.
The transport sector fully relies on imported energy sources.

41
Regional balance
(MWh) regarding: NREC REC Electricity Heat
2016
Non-residential sectors
(without transport) - 8.956.000 2.017.278 3.548.700 1.499.428
Residential sector - 6.307.000 -1.144.722 - 10.156.600 - 452.428
Transport sector - 6.284.163 -255.000 -10.994.800 -71.572
Total - 21.547.163 -1.862.722 1.706.500 -2.023.428
Table 15 - Regional balance
5.4.2. Energy efficiency potentials
In Friuli Venezia Giulia, significant energy efficiency potentials can be found in the reduction of
the heat demand of buildings. Some detailed scenarios are available for residential buildings,
which account for 31% of total energy consumption. A basic and economic level of residential
building renovation would lead to a reduction of the energy requirements by 20%. Whereas a more
incisive retrofit scenarios would lead to a reduction of more than 35%. Much more could be
achieved with a deep renovation approach which considers also interventions with longer payback
periods.
The residential use of wood energy for heating purposes can be rationalized through the renewal
of the heat generators stock. This would reduce the specific demand (tons/dwelling*year) of wood
fuels and improve the air quality, making them available to other end users, in a framework of
not increasing production.
Switching to heat pumps is another complementary way to reduce the specific demand of fossil
fuels (natural gas) for heat generation in the flatland and along the coast. However, this is
compensated by an increasing demand of electricity in the summer due to new cooling needs (heat
waves, i.e. number of subsequent days with average temperature over 30°C greater than five, are
becoming more and more frequent).
The service and industry sectors require specific analyses and overall data are not available.
Efficiency in transport implies the spreading of electric mobility, which is an ongoing and long
process. However, this objective will also require a general strengthening of the minor electricity
grid, which in Italy has, by now, a reduced capacity.
5.4.3. Resource potentials
Consumption of wood fuels cannot be increased in households, as it is already significant compared
to sustainable production. However, it could be rationalized and thus replace more fossil fuels.
The production of wood chips for small/medium DH networks, on the other hand, still has ample
growth potential.
42
A conservative approach could also be followed for hydropower, by increasing plant efficiency and
stabilizing the use of water resources. Some minor potential could still be developed along
irrigation channels (the region has one of the most developed networks in North-Italy) and in the
alpine valleys, provided that this will be possible only if local communities will benefit directly
from them, otherwise social acceptance will not be ensured.
Other local and well distributed resources are solar (both photovoltaic and thermal) and
geothermal energy (low enthalpy) as well as urban and agricultural waste for biogas (and bio-
methane) production.
5.4.4. Technology potentials
The waste heat potential in Friuli Venezia Giulia is estimated in 5.550 GWh of primary energy: this
figure includes all production activities of the industrial sector. Several interventions can be taken
in account in the following order:
▪ reduce waste heat production improving the energy efficiency of the specific process;
▪ re-use waste heat in the specific process;
▪ transform waste heat in other useful energy within the same company (e.g. power through
an ORC turbine);
▪ supply waste heat to external clients for a range of different purposes.
A wide range of technologies are potentially interesting to convert waste heat in other useful
energy like heat exchangers for pre-heating, heat exchangers for district heating systems, heat
pumps, absorption chillers, steam and ORC turbines, other thermoelectrical generators.
District heating is another potential option for an efficient renewable heat supply for both urban
and rural areas thus enabling the transition to higher RES share in energy generation and
consumption. A further expansion of DH networks is already part of the regional energy strategy:
beside extended use of biomass, the strategy can focus on enhanced integration of solar thermal
and waste heat to improve air quality as well as foster more efficient use of biomass. As well,
thermal storages solutions and seasonal storages are at stake.
Concerning the exploitation of low enthalpy geothermal energy source in the residential sector, it
could be achieved through geothermal pumps or hybrid thermal heat pump-condensing boilers.
The use of this technology would allow an integration of renewable energy sources in buildings
equipped with autonomous boilers, currently installed in all non-metropolitan areas of the region.
However, from the economic point of view, the investment is sustainable in the short term only
for large buildings, terraced houses or blocks.
The production of bio-methane from urban and agricultural waste is a technological perspective
of great interest for Friuli Venezia Giulia. Small existing plants are trying to aggregate in few value
chains in order to reach critical sizes to produce and distribute bio-methane while waste
management utilities are building new biogas plants to produce power for internal use and heat
for local district heating networks.
A significant challenge will be the modernization of the electricity grid, with extensive integration
of energy communities, prosumers, storage facilities and hydroelectric pumping plants.
43
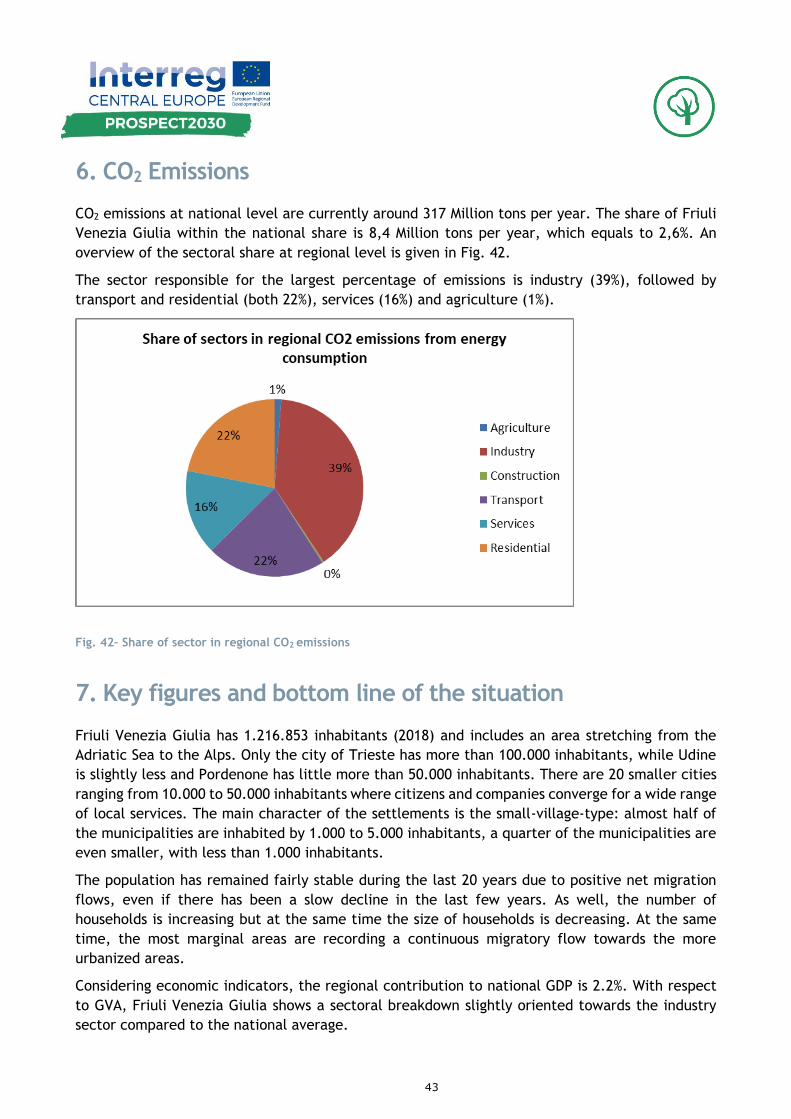
6. CO2 Emissions
CO2 emissions at national level are currently around 317 Million tons per year. The share of Friuli
Venezia Giulia within the national share is 8,4 Million tons per year, which equals to 2,6%. An
overview of the sectoral share at regional level is given in Fig. 42.
The sector responsible for the largest percentage of emissions is industry (39%), followed by
transport and residential (both 22%), services (16%) and agriculture (1%).
Fig. 42– Share of sector in regional CO2 emissions
7. Key figures and bottom line of the situation
Friuli Venezia Giulia has 1.216.853 inhabitants (2018) and includes an area stretching from the
Adriatic Sea to the Alps. Only the city of Trieste has more than 100.000 inhabitants, while Udine
is slightly less and Pordenone has little more than 50.000 inhabitants. There are 20 smaller cities
ranging from 10.000 to 50.000 inhabitants where citizens and companies converge for a wide range
of local services. The main character of the settlements is the small-village-type: almost half of
the municipalities are inhabited by 1.000 to 5.000 inhabitants, a quarter of the municipalities are
even smaller, with less than 1.000 inhabitants.
The population has remained fairly stable during the last 20 years due to positive net migration
flows, even if there has been a slow decline in the last few years. As well, the number of
households is increasing but at the same time the size of households is decreasing. At the same
time, the most marginal areas are recording a continuous migratory flow towards the more
urbanized areas.
Considering economic indicators, the regional contribution to national GDP is 2.2%. With respect
to GVA, Friuli Venezia Giulia shows a sectoral breakdown slightly oriented towards the industry
sector compared to the national average.

44
The development of transport infrastructure is widely developed regarding road transport, while
some territorial areas, especially in more marginal areas, suffer from reduced access to rail
transport services. Data available at regional level, therefore, show a high dependence of freight
and passenger transport on the use of cars and road transport. Three harbours serve the region,
with Trieste first in Italy for freight traffic.
Energy infrastructures are highly developed considering electricity, while the infrastructure for
transporting natural gas, which serves the great part of the region, does not reach all the
municipalities yet, mainly excluding few areas with low population density especially in the
mountains.
The analysis of the regional energy demand highlights a high dependence on fossil fuels import
with high share of natural gas in all sectors and petrol products in the transport sectors. RES
presents a share in FEC of 12% mainly due to hydropower production and thermal contribution of
biomasses and derived heat.
FEC is distributed between industry (33%) and residential (31%), followed by transport (19%) and
services (16%) sectors.
Concerning electricity production, the region has a highly developed electricity generation park,
and cover all its electricity demand. The greatest contribution is given by natural gas
thermoelectric plants operating in cogeneration, while the other sources used, in order of
importance, are liquid fossil fuels, hydropower, solar, biogas and liquid biomasses. Renewables
account for about 25% of the total electricity production.
Regarding thermal energy production, the region has several district heating networks supplied
with wood biomasses and one major district heating in the urban area of Udine supplied with
natural gas and liquid biomasses. The use of wood biomasses for domestic heating is well spread
over the region and it is second only to the use of natural gas. Biomass is a traditional energy
source in the alpine areas thanks to the presence of extended local forests while supply in the
flatland comes from the by-products of the strong furniture industry, aggregated in two industrial
districts, which is among the most developed in Italy and, only in second place, by local woods.
The regional emission of CO2 is estimated in 8.4 Mt/year mainly due to the industrial sector (39%)
followed by transport and residential sectors (22%), service sector (16%) and agriculture sector
(1%).
8. CONCLUSIONS
Regional energy demand shows highly dependence on import of fossil fuels. Only 16% is covered
by renewables, in large part local.
Installed power capacity generates a net surplus of 1.7 GWh per year and is based on natural gas,
followed by solid and liquid fossil and, in third place, by hydropower.
So, electricity generation from RES is developed thanks to the historical hydroelectric sector,
while in recent years (2008÷2016) there has been an increasing percentage of generation from
photovoltaic, biogas and biomass. Nowadays, renewables account for about 25% of the regional
power production.

45
Thermal energy demand of the residential sector is mainly covered by natural gas. However, wood
biomasses are widely used and there is an increasing number of small district heating networks in
rural areas supplied with local woodchips. There is only one big district heating network based on
CCHP in the urban area of Udine supplied with natural gas and liquid biomasses.
Globally, the residential sector however requires energy retrofit actions due to the reduced energy
performance of the regional building stock.
The regional industrial sector is among the most energy intensive in Italy and it is largely
responsible for CO2 emissions. Intervention in this sector is not easy, since activities are well
spread in all fields and require specific evaluations.
In the transport sector there is a very high dependence on fossil fuels. The sector still finds
difficulties to perform a transition to less impacting sources and electrification, except for rail
transport, it is not so exploited for passenger transport even for long-established commuting
routes.
In addition to the growing demand for reduction of CO2 global emissions, climate change scenarios
represent a major challenge for the future of wide areas of the region. Consequently, beside
climate mitigation, climate adaptation will be the other major driver in setting sustainable
development policies.