Energy-landscape network approach to the glass transition
6
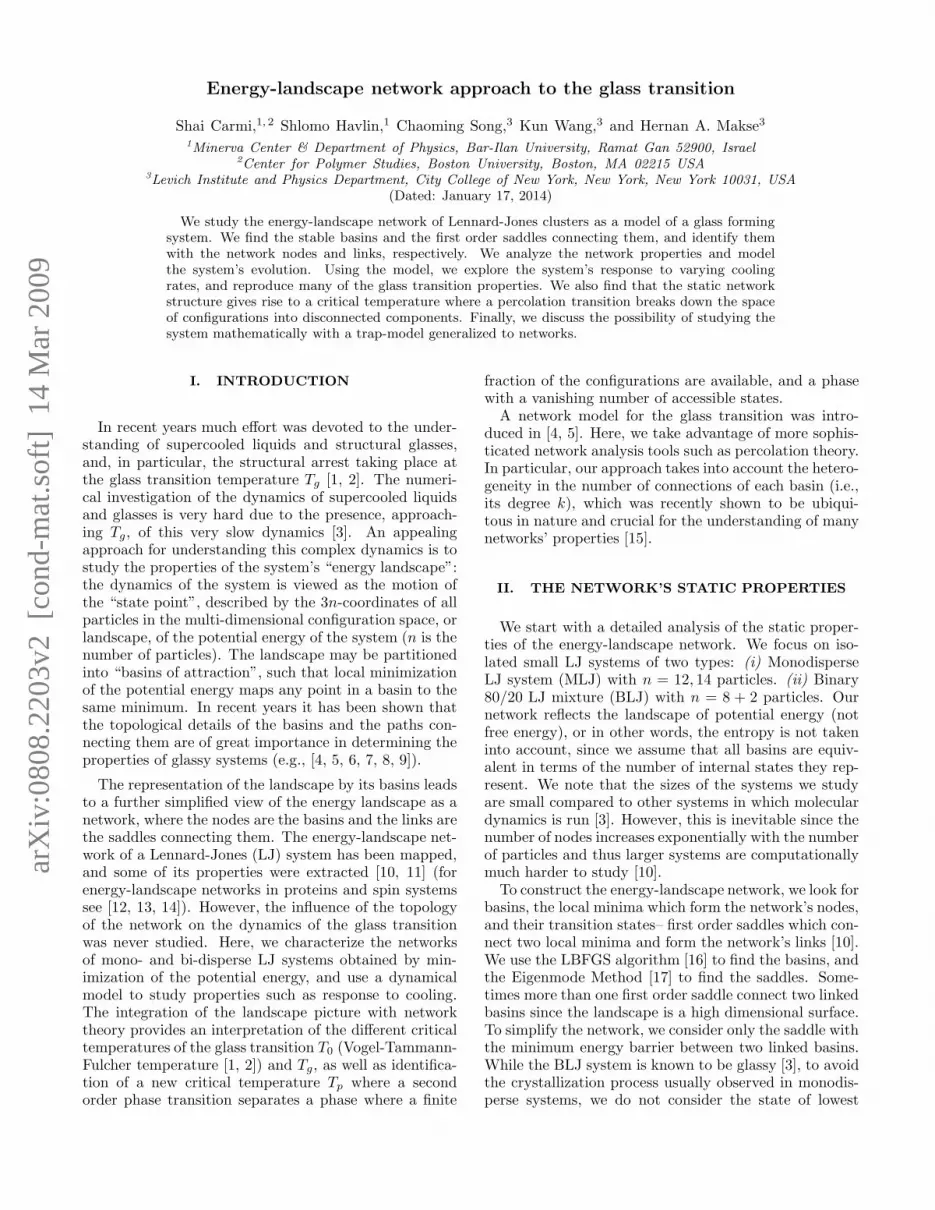
arXiv:0808.2203v2 [cond-mat.soft] 14 Mar 2009 Energy-landscape network approach to the glass transition Shai Carmi, 1, 2 Shlomo Havlin, 1 Chaoming Song, 3 Kun Wang, 3 and Hernan A. Makse 3 1 Minerva Center & Department of Physics, Bar-Ilan University, Ramat Gan 52900, Israel 2 Center for Polymer Studies, Boston University, Boston, MA 02215 USA 3 Levich Institute and Physics Department, City College of New York, New York, New York 10031, USA (Dated: January 17, 2014) We study the energy-landscape network of Lennard-Jones clusters as a model of a glass forming system. We find the stable basins and the first order saddles connecting them, and identify them with the network nodes and links, respectively. We analyze the network properties and model the system’s evolution. Using the model, we explore the system’s response to varying cooling rates, and reproduce many of the glass transition properties. We also find that the static network structure gives rise to a critical temperature where a percolation transition breaks down the space of configurations into disconnected components. Finally, we discuss the possibility of studying the system mathematically with a trap-model generalized to networks. I. INTRODUCTION In recent years much effort was devoted to the under- standing of supercooled liquids and structural glasses, and, in particular, the structural arrest taking place at the glass transition temperature T g [1, 2]. The numeri- cal investigation of the dynamics of supercooled liquids and glasses is very hard due to the presence, approach- ing T g , of this very slow dynamics [3]. An appealing approach for understanding this complex dynamics is to study the properties of the system’s “energy landscape”: the dynamics of the system is viewed as the motion of the “state point”, described by the 3n-coordinates of all particles in the multi-dimensional configuration space, or landscape, of the potential energy of the system (n is the number of particles). The landscape may be partitioned into “basins of attraction”, such that local minimization of the potential energy maps any point in a basin to the same minimum. In recent years it has been shown that the topological details of the basins and the paths con- necting them are of great importance in determining the properties of glassy systems (e.g., [4, 5, 6, 7, 8, 9]). The representation of the landscape by its basins leads to a further simplified view of the energy landscape as a network, where the nodes are the basins and the links are the saddles connecting them. The energy-landscape net- work of a Lennard-Jones (LJ) system has been mapped, and some of its properties were extracted [10, 11] (for energy-landscape networks in proteins and spin systems see [12, 13, 14]). However, the influence of the topology of the network on the dynamics of the glass transition was never studied. Here, we characterize the networks of mono- and bi-disperse LJ systems obtained by min- imization of the potential energy, and use a dynamical model to study properties such as response to cooling. The integration of the landscape picture with network theory provides an interpretation of the different critical temperatures of the glass transition T 0 (Vogel-Tammann- Fulcher temperature [1, 2]) and T g , as well as identifica- tion of a new critical temperature T p where a second order phase transition separates a phase where a finite fraction of the configurations are available, and a phase with a vanishing number of accessible states. A network model for the glass transition was intro- duced in [4, 5]. Here, we take advantage of more sophis- ticated network analysis tools such as percolation theory. In particular, our approach takes into account the hetero- geneity in the number of connections of each basin (i.e., its degree k), which was recently shown to be ubiqui- tous in nature and crucial for the understanding of many networks’ properties [15]. II. THE NETWORK’S STATIC PROPERTIES We start with a detailed analysis of the static proper- ties of the energy-landscape network. We focus on iso- lated small LJ systems of two types: (i) Monodisperse LJ system (MLJ) with n = 12, 14 particles. (ii) Binary 80/20 LJ mixture (BLJ) with n = 8 + 2 particles. Our network reflects the landscape of potential energy (not free energy), or in other words, the entropy is not taken into account, since we assume that all basins are equiv- alent in terms of the number of internal states they rep- resent. We note that the sizes of the systems we study are small compared to other systems in which molecular dynamics is run [3]. However, this is inevitable since the number of nodes increases exponentially with the number of particles and thus larger systems are computationally much harder to study [10]. To construct the energy-landscape network, we look for basins, the local minima which form the network’s nodes, and their transition states– first order saddles which con- nect two local minima and form the network’s links [10]. We use the LBFGS algorithm [16] to find the basins, and the Eigenmode Method [17] to find the saddles. Some- times more than one first order saddle connect two linked basins since the landscape is a high dimensional surface. To simplify the network, we consider only the saddle with the minimum energy barrier between two linked basins. While the BLJ system is known to be glassy [3], to avoid the crystallization process usually observed in monodis- perse systems, we do not consider the state of lowest
Transcript of Energy-landscape network approach to the glass transition
arX
iv:0
808.
2203
v2 [
cond
-mat
.sof
t] 1
4 M
ar 2
009
Energy-landscape network approach to the glass transition
Shai Carmi,1, 2 Shlomo Havlin,1 Chaoming Song,3 Kun Wang,3 and Hernan A. Makse3
1Minerva Center & Department of Physics, Bar-Ilan University, Ramat Gan 52900, Israel2Center for Polymer Studies, Boston University, Boston, MA 02215 USA
3Levich Institute and Physics Department, City College of New York, New York, New York 10031, USA
(Dated: January 17, 2014)
We study the energy-landscape network of Lennard-Jones clusters as a model of a glass formingsystem. We find the stable basins and the first order saddles connecting them, and identify themwith the network nodes and links, respectively. We analyze the network properties and modelthe system’s evolution. Using the model, we explore the system’s response to varying coolingrates, and reproduce many of the glass transition properties. We also find that the static networkstructure gives rise to a critical temperature where a percolation transition breaks down the spaceof configurations into disconnected components. Finally, we discuss the possibility of studying thesystem mathematically with a trap-model generalized to networks.
I. INTRODUCTION
In recent years much effort was devoted to the under-standing of supercooled liquids and structural glasses,and, in particular, the structural arrest taking place atthe glass transition temperature Tg [1, 2]. The numeri-cal investigation of the dynamics of supercooled liquidsand glasses is very hard due to the presence, approach-ing Tg, of this very slow dynamics [3]. An appealingapproach for understanding this complex dynamics is tostudy the properties of the system’s “energy landscape”:the dynamics of the system is viewed as the motion ofthe “state point”, described by the 3n-coordinates of allparticles in the multi-dimensional configuration space, orlandscape, of the potential energy of the system (n is thenumber of particles). The landscape may be partitionedinto “basins of attraction”, such that local minimizationof the potential energy maps any point in a basin to thesame minimum. In recent years it has been shown thatthe topological details of the basins and the paths con-necting them are of great importance in determining theproperties of glassy systems (e.g., [4, 5, 6, 7, 8, 9]).
The representation of the landscape by its basins leadsto a further simplified view of the energy landscape as anetwork, where the nodes are the basins and the links arethe saddles connecting them. The energy-landscape net-work of a Lennard-Jones (LJ) system has been mapped,and some of its properties were extracted [10, 11] (forenergy-landscape networks in proteins and spin systemssee [12, 13, 14]). However, the influence of the topologyof the network on the dynamics of the glass transitionwas never studied. Here, we characterize the networksof mono- and bi-disperse LJ systems obtained by min-imization of the potential energy, and use a dynamicalmodel to study properties such as response to cooling.The integration of the landscape picture with networktheory provides an interpretation of the different criticaltemperatures of the glass transition T0 (Vogel-Tammann-Fulcher temperature [1, 2]) and Tg, as well as identifica-tion of a new critical temperature Tp where a secondorder phase transition separates a phase where a finite
fraction of the configurations are available, and a phasewith a vanishing number of accessible states.
A network model for the glass transition was intro-duced in [4, 5]. Here, we take advantage of more sophis-ticated network analysis tools such as percolation theory.In particular, our approach takes into account the hetero-geneity in the number of connections of each basin (i.e.,its degree k), which was recently shown to be ubiqui-tous in nature and crucial for the understanding of manynetworks’ properties [15].
II. THE NETWORK’S STATIC PROPERTIES
We start with a detailed analysis of the static proper-ties of the energy-landscape network. We focus on iso-lated small LJ systems of two types: (i) MonodisperseLJ system (MLJ) with n = 12, 14 particles. (ii) Binary80/20 LJ mixture (BLJ) with n = 8 + 2 particles. Ournetwork reflects the landscape of potential energy (notfree energy), or in other words, the entropy is not takeninto account, since we assume that all basins are equiv-alent in terms of the number of internal states they rep-resent. We note that the sizes of the systems we studyare small compared to other systems in which moleculardynamics is run [3]. However, this is inevitable since thenumber of nodes increases exponentially with the numberof particles and thus larger systems are computationallymuch harder to study [10].
To construct the energy-landscape network, we look forbasins, the local minima which form the network’s nodes,and their transition states– first order saddles which con-nect two local minima and form the network’s links [10].We use the LBFGS algorithm [16] to find the basins, andthe Eigenmode Method [17] to find the saddles. Some-times more than one first order saddle connect two linkedbasins since the landscape is a high dimensional surface.To simplify the network, we consider only the saddle withthe minimum energy barrier between two linked basins.While the BLJ system is known to be glassy [3], to avoidthe crystallization process usually observed in monodis-perse systems, we do not consider the state of lowest

2
energy when setting up the network [5]. Thus, the twosystems are expected to be comparable in terms of theirglassy behavior.
The MLJ14 network consists of N = 4, 193 nodesand M = 58, 628 links. The energies at the nodes aredistributed approximately normally with mean E(T →∞) = −41.5 (Fig. 1(a)). The energy barriersare distributed approximately exponentially P (∆E) =
1∆E
e−∆E/∆E, where ∆E = 1.64 is the average energy
barrier (Fig. 1(b)). As observed in [10], we confirm thatthe MLJ14 network is scale-free [15], i.e. the degree dis-tribution (the probability for a node to have degree k) isbroad with a tail decaying as P (k) ∼ k−γ with γ ≈ 2.7(Fig. 1(c)). The energy of a node decreases with its de-gree (Fig. 1(d)), meaning that the deepest basins can beidentified with the network hubs, and are thus accessi-ble to/from many other basins [18]. The average barrierheight increases with the degree of the node: ∆E ∼ kǫ
with ǫ ≈ 0.43 (Fig. 1(e)). The average degree of a node’snearest neighbors knn slightly decreases with the node’sdegree (Fig. 1(f)), meaning hubs have many connectionsto low degree nodes. We also studied “slices” of the net-work in the degree (using the q-core method [19]) andenergy planes. In both cases, we found that removingnodes of low degree, or high potential energy, leaves thenetwork connected.
The MLJ12 system is smaller and contains only N =508 nodes and M = 5, 407 links, leading to larger fluc-tuations in its statistics. Yet the properties of MLJ12
are qualitatively similar to MLJ14. For MLJ12 we findE(T → ∞) = −33.87, ∆E = 1.16, γ ≈ 3.1, and ǫ ≈ 0.41(Fig. 1). All the results reported henceforth as MLJ arefor the MLJ14 system, unless explicitly otherwise speci-fied. This picture holds true also for the BLJ network,with N = 613 nodes and M = 6, 150 links. In the BLJnetwork we obtain E(T → ∞) = −30.5, ∆E = 1.86,γ ≈ 3.4, and ǫ ≈ 0.54 (Fig. 1).
III. THE NETWORK DYNAMICS
Next we turn to a characterization of the dynamics ofthe system. We show that application of simple assump-tions about the dynamics reproduces many features ofthe glass transition. At high temperatures, kinetic en-ergy permits access to most states, while for low tem-peratures, mutual access among basins becomes subjectto considerable activation. In low temperatures near thetransition (more precisely, below the so-called dynamicglass transition temperature Td, where an exponentialnumber of meta-stable states appears [2]), the dynamicsis dominated by rare events of collective jumps amongdifferent stable positions involving many atoms. Thus,for low temperatures, we neglect the short time dynam-ics which is dominated by small vibrations within thebasins, and model the dynamics of the system as acti-vated jumps between connected states. We assume thetransition rate between a pair of linked states follows Ar-
−45 −40 −35 −30 −25
10−3
10−2
10−1
100
Potential energy E
PD
F
MLJ14MLJ12BLJ
(a)
0 2 4 6 8 1010
−6
10−4
10−2
100
Barrier height ∆E
PD
F
MLJ14MLJ12BLJ
(b)
100
101
102
10−2
10−1
100
Degree k
CD
F
MLJ14MLJ12BLJ
(c)
100
102
−45
−40
−35
−30
Degree k
Ave
rage
pot
entia
l ene
rgy
E
MLJ14MLJ12BLJ
(d)
100
102
100
101
Degree k
Ave
rage
bar
rier h
eigh
t ∆E
MLJ14MLJ12BLJ
(e)
100
1020
50
100
150
200
Degree k
Ave
rage
nea
rest
nei
ghbo
r deg
ree
MLJ14MLJ12BLJ
(f)
FIG. 1: Properties of the Lennard-Jones energy-landscapenetwork. Shown are results for MLJ14, MLJ12, and BLJ (seetext). In all figures the data was binned and the average isplotted. (a) Distribution of potential energies E of the nodes.(b) Distribution of the heights of the energy barriers ∆E as-sociated with the network links. (c) Cumulative distributionof node degrees k. Straight lines represent power-law decaysof the form P (k) ∼ k−γ , with γ = 2.7, 3.1, 3.4 for MLJ14,MLJ12, and BLJ, respectively. (d) The average potential en-ergy of a node E vs. the degree k. (e) The average energybarrier to escape from a node ∆E vs. the node degree k.(f) The average degree of node neighbors knn vs. the node’sdegree k.
rhenius law:
pij =1
N − 1e−∆Eij/T , (1)
where ∆Eij is the height of the barrier separating i andj (not necessarily equal to ∆Eji) and the 1/(N − 1)factor guarantees that the rate of leaving i, equals to∑
all links (i,j) pij is less than 1 for any node. Note there
is considerable probability for the system to remain atthe current state. This will turn useful in the character-ization of the dynamical slowdown.
Experiments [1, 2] and molecular dynamics simulations[3] show that supercooling below the melting point resultsin a decrease in the system’s energy, up to the temper-ature of the glass transition Tg. At the transition, thesystem becomes frozen in a disordered configuration, andthe rate of change of energy with respect to temperaturedecreases abruptly (but continuously) to a value compa-rable to that of a crystalline solid. We suggest, that thispicture, as well as the identification of the glass transi-

3
FIG. 2: (Color) MLJ10 network schematic. The vertical axisrepresents the energy, such that nodes with deeper energy arelower (and darker) in the schematic. Links’ cusps correspondto the energies of the saddles, and nodes’ sizes are propor-tional to their degree. It can be seen that highly connectednodes usually correspond to deeper basins.
tion temperature Tg can be reproduced using our simplenetwork dynamics.
Φi(t), the probability of the system to be at state i attime t, evolves according to:
dΦi
dt=
1
N − 1
∑
all links (i,j)
Φje−∆Eji/T (t) − Φie
−∆Eij/T (t)
(2)We solve this set of equations numerically by iteratingEq. (2) once in every time step for the MLJ and BLJnetworks. We use different cooling rates T (t) = Ti − λt,where Ti is the initial temperature, and λ is the coolingrate. We then calculate E(T ) =
∑i Φi(T (t))Ei, where
Ei is the energy of node i. For infinitely slow cooling,the system can be assumed to be in equilibrium, suchthat dΦi
dt vanishes for all i. E(T ) is calculated by setting
the Boltzmann distribution Φi(T ) = e−Ei/T /Z, whereZ =
∑i e−Ei/T . The results for BLJ, with λ = 0.01 ×
{1/8, 1/16, ..., 1/512, 0}, are plotted in Fig. 3(a). Indeedwe find that our approach qualitatively reproduces theglass-forming behavior.
We then calculate the heat capacity c = dE/dT (Fig.3(b)). We associate the temperature for which the heatcapacity is maximal with the glass transition temperatureTg. We note that while this association is plausible, itcannot be made rigorous. As expected [1, 2, 3, 20], Tg
decreases as the cooling rate becomes slower, approachingits equilibrium value T 0
g = 0.67(±0.01) for BLJ (Fig.3(b), inset). This value of Tg is a little higher than theglass transition temperature in a large BLJ system (≈0.45) [3]. For MLJ, the picture is similar with T 0
g =0.47(±0.01).
Although in our model, microscopic transition ratesfollow Arrhenius law, we show below that the global re-laxation times deviate from Arrhenius behavior at lowtemperatures, suggesting that LJ glass forming systemsare fragile [1]. A global relaxation time is not naturallydefined for the network. However, we note that as thesystem evolves in time, it explores the phase space in arandom fashion, according to the transition probabilities
0.0 0.4 0.8 1.2 1.6-37
-36
-35
-34
-33
-32
Ene
rgy
E
T
(a)
1E-3 0.01 0.1
0.7
0.8
0.0 0.5 1.0 1.5 2.00
2
4
6
(b)
c=dE
/dT
T
T g
Cooling rate
Tg0
FIG. 3: (a) Super-cooling in BLJ. The average energy ofthe system E is plotted vs. the temperature T = Ti − λt.Ti = 2 and the cooling rates are (top to bottom): λ =0.01 × {1/8, 1/16, ..., 1/512, 0}, where in each time step weiterate Eq. (2) once. Zero cooling rate corresponds to theequilibrium Boltzmann distribution. At t = 0 we assumed allstates are equally probable. Similar results are found for MLJ(not shown). (b) The heat capacity c = dE/dT . λ (bottom totop) is same as in (a). Inset: the glass transition temperatureTg as a function of the cooling rate λ. The horizontal linecorresponds to T 0
g .
0 1 2 310
20
30
ln(M
FPT)
1/T
BLJ MLJ12
(a)
100 101 102 103
0
2
4
6
E(t)
-E(t-
>oo)
t
(b)
FIG. 4: Dynamical properties of the energy-landscape net-work. (a) The mean first passage time (averaged over allsources and destinations) as a function of the inverse tem-perature 1/T , for MLJ12 and BLJ. A super-Arrhenius be-havior is observed (the slope of the curve increases with1/T ), suggesting that the system is fragile. The lines arefits to Vogel-Tammann-Fulcher law. (b) For several temper-atures (top to bottom: T = {2.1, 1.8, ..., 0.3}), the time evo-lution of the average energy E(T ) was calculated. The y-axisshows E(t) − E(t → ∞) (symbols), such that all curves ap-proach zero. Curves were fit with a stretched exponentialE(t) − E(t → ∞) ∝ exp
ˆ
−(t/τ )β˜
(lines). β ≈ 0.8 and τis between [50,700], and increasing with 1/T . The picture issimilar for MLJ (not shown).
given in Eq. (1). Thus, we associate the global relax-ation time with the time it takes a random walker withtransition probabilities as in Eq. (1) starting at node i,to arrive to node j (the first passage time [21]), wherei and j are randomly chosen, uniformly out of all nodes[22]. Given the network and the energy barrier heights,the average first passage time can be calculated analyt-ically [21]. In Fig. 4(a), we plot the mean first passagetime (averaged over randomly selected sources and desti-nations) as a function of the inverse temperature for BLJand MLJ. A super-Arrhenius behavior is evident, classi-fying these systems as a fragile glass [1]. The data seem tofit to Vogel-Tammann-Fulcher law τ ∝ exp [A/(T − T0)]with T0 ≈ 0.1. However, the precise value of T0 highlydepends on the simulation details.
Time dependent quantities can also be studied withthe network. For example, the evolution of the aver-

4
FIG. 5: A schematic of network percolation. (a) The origi-nal network. (b) A fraction q = 1/3 (5/15) of the links areremoved from the network. (c) The network after removalconsists of one large cluster of 10 nodes and 2 small clustersof one node each.
age energy of the system at fixed temperature can becalculated. We use Eq. (1) and assume that initiallyall states are equally probable. The results are pre-sented in Fig. 4(b). For short times (up to about 103
time steps) the decay fits to a stretched exponential,E(t) − E(t → ∞) = A exp[−(t/τ)β ] with β ≈ 0.8 < 1[2]. For longer times (not shown), the decay is exponen-tial. As in [5], the very fast relaxation, correspondingto transitions within a basin, is not represented in ourmodel.
IV. PERCOLATION
In addition to dynamical properties, the network topol-ogy gives rise to a static critical temperature Tp, wherethe phase space of configurations breaks into discon-nected components. This is revealed by percolation the-ory applied to the energy-landscape network [23]. Per-colation theory is a powerful framework for the study oftransport in disordered systems. In its simplest form, itis engaged in the study of conduction in a lattice in whichonly a fraction p of the sites, or bonds, are conducting[24, 25, 26]. This problem is relevant in various contextsin which critical phenomena take place, from supercon-ductors and gelation to forest fires and oil searching. Thetheory predicts the value of a critical fraction pc abovewhich the bulk sample is conducting, as well as the size,dimension, total conductance, diffusion coefficients, andother properties of the percolation clusters.
In recent years, percolation theory has been success-fully applied to networks to derive criteria for networkstability. In a percolation process over a network, a frac-tion q = 1 − p of the network links is removed [27, 28].A percolation transition occurs when a critical fractionqc = 1 − pc of the links is removed such that the net-work disintegrates. The critical point where the networkbreaks down is identified by a vanishing size of the largestconnected cluster as well as a divergence in the size of thesecond largest cluster [24] (Fig. 5).
At least pictorially, the evolution of the connectivity
of the energy landscape as the temperature is loweredresembles a percolation process. At high enough temper-atures, the system has sufficient thermal energy to crossmost energy barriers. Thus, connected basins are acces-sible from each other and the network is intact. At lowtemperatures, links which are associated with a barrierof height ∆E ≫ T can practically not be crossed andthus can be considered as absent. Thus, as the temper-ature is lowered, the network becomes less and less con-nected, until reaching the percolation threshold where itfully disintegrates. At that point, the system is frozen inan isolated region of the landscape, whose size is a zerofraction of the entire phase space. A percolation transi-tion of the phase space has been predicted long ago forspin glasses [23]. Here, we use the network representa-tion of LJ clusters to show explicitly how the percolationtransition is realized.
Since the probability for a link to be “active” decreaseswith decreasing temperature, we suggest that links areexcluded with probability 1 − e−∆E/T , where ∆E is thelink’s barrier energy. This way, for high T , all links re-main and the network is connected, while for low T manylinks are removed. We then measure (Fig. 6) the size ofthe largest and second largest cluster (where we define acluster as a set of nodes mutually accessible from eachother) for MLJ and BLJ. A percolation transition is evi-dent at Tp = 0.26±0.01 for MLJ and Tp = 0.47±0.01 forBLJ, indicating a second order phase transition betweena phase where many configurations are available and aphase with a vanishing number of accessible states.
The percolation transition at Tp is expected to takeplace at the final stages of the glass transition, when bar-riers become almost impossible to cross, and the systemfreezes in the glassy state. Roughly speaking, the per-colation transition temperature Tp could be associatedwith the Kauzmann temperature TK . At TK , the config-urational entropies of the glass and the crystal are equal(had the glass transition not intervened), and thereforethe system is bound to a single, non-crystalline, idealglass state [1, 2]. Similarly, at Tp, the system is boundto a region of vanishing size of the phase space. In asense, this region in phase space corresponds to the idealglass state in which the system is found at the Kauzmanntemperature TK . However we emphasize that this cor-respondence is merely descriptive and cannot be mademore precise.
V. DISCUSSION
The understanding of the nature of the glass transi-tion is a formidable task, particularly since molecular dy-namics cannot approach low enough temperatures. Thus,simplified models which capture the essential propertiesof the phenomena are of great value. Representation ofthe multidimensional energy surface as a network is aparticularly appealing approach, due to recently devel-oped network analysis tools. We applied this concept

5
0 1 20
1000
2000
3000
4000
T
Num
ber
of n
odes
MLJ
Largest clusterSecond largest x 100
(a)
0 1 20
200
400
600
T
Num
ber
of n
odes
BLJ
Largest clusterSecond largest x 10
(b)
FIG. 6: Percolation transition in Lennard-Jones energy land-scape. (a) For MLJ system, we plot the average size of thelargest and second largest cluster after the removal of eachlink with probability 1 − e−∆E/T . Clusters are strongly con-nected (i.e., each node can be reached from any other node inthe cluster). The percolation transition takes place when thelargest cluster size vanishes and the second largest cluster ismaximal. (b) Same as (a) for BLJ.
here, where we studied Lennard-Jones clusters as net-works of the stable basins and the links connecting them,where each link is associated with an energy barrier. Weshowed that the network approach qualitatively repro-duces many properties of the glass transition. It is stillnot known whether quantitative information, such as theprecise values of Tg and other temperatures can also beextracted from this kind of analysis. For that purpose,larger systems will have to be considered. The similarity,in statistical terms, between the networks of n = 12 andn = 14 encourages us to believe that similar results, atleast qualitatively, will be observed in larger systems.
An alternative approach to circumvent the problem ofthe small system size is a mathematical model which cap-tures the main properties of the energy-landscape net-work. A naive attempt would be to construct a “general-ized trap model” [29]. In a regular trap model the config-urations of the system are fully connected, in the sensethat the system can jump from any state to another.However, this is not sufficient to describe the slowingdown of the dynamics, since it allows transitions whichdo not exist in reality [30]. In a trap model adaptedto a network, each configuration is linked to precisely kother configurations, where it is particularly interestingto consider the case of a power-law distribution of de-
grees which is characteristic of LJ (Section II) and othersystems [12]. To complete the description of the model,one can assume the distribution of energy barriers is ex-ponential with mean ∆E (Section II). Despite the at-tractiveness of this simple approach, our analysis shows[31] that it leads to counterintuitive results. For exam-ple, the distribution of time τ the system remains in aconfiguration is a power-law P (τ) ∼ τ−(1+kT/∆E). Thus,according to model, the typical time the system stays atnodes of high degree is small, whereas it expected thatthe system will spend long time at the hubs, since theyare found at low potential energies (Section II). There-fore, alternative approaches should be sought for.
The advantage of the network approach is manifestedin the application of percolation theory, which provides anatural geometrical interpretation of the structural arresttaking place at low temperatures [23]. We studied “bondpercolation”, where we removed links in which the barrierheight was high relative to the temperature, to reveal acritical temperature where the phase space breaks downinto small isolated clusters. The study of glassy systemswith the network approach can be further extended. Forexample, ageing phenomena could be studied, for eitherthe real network or the model, by introducing more com-plex correlation functions. Real-space properties suchas diffusion coefficients and fluctuation-dissipation rela-tions could be studied by complementing the networkwith real-space information for each node. In addition,similar analysis can be pursued to other systems withcomplex energy landscapes such as proteins (e.g., [32])or spin glasses [14].
Acknowledgments
We thank D. ben-Avraham and S.V. Buldyrev for use-ful discussions. Financial support from the National Sci-ence Foundation, Israel Science Foundation, and the Is-rael Center for Complexity Science is gratefully acknowl-edged. S.C. is supported by the Adams Fellowship Pro-gram of the Israel Academy of Sciences and Humanities.
[1] P. G. Debenedetti and F. H. Stillinger, Nature 410, 259(2001).
[2] W. Kob, Supercooled Liquids, the Glass Transition, and
Computer Simulations (Springer, 2004), vol. 77 of Les
Houches, chap. 5, pp. 199–269.[3] S. Sastry, P. G. Debenedetti, and F. H. Stillinger, Nature
393, 554 (1998).[4] L. Angelani, G. Parisi, G. Ruocco, and G. Viliani, Phys.
Rev. Lett. 81, 4648 (1998).[5] L. Angelani, G. Parisi, G. Ruocco, and G. Viliani, Phys.
Rev. E 61, 1681 (2000).[6] L. Angelani, R. DiLeonardo, G. Ruocco, A. Scala, , and
F. Sciortino, Phys. Rev. Lett. 85, 5356 (2000).
[7] S. Buchner and A. Heuer, Phys. Rev. E 60, 6507 (1999).[8] T. S. Grigera, A. Cavagna, I. Giardina, and G. Parisi,
Phys. Rev. Lett. 88, 055502 (2002).[9] B. Doliwa and A. Heuer, Phys. Rev. E 67, 031506 (2003).
[10] J. P. K. Doye, Phys. Rev. Lett. 88, 238701 (2002).[11] J. P. K. Doye and C. P. Massen, J. Chem. Phys. 122,
084105 (2005).[12] F. Rao and A. Caflisch, J. Mol. Biol. 342, 299 (2004).[13] E. Ravasz, S. Gnanakaran, and Z. Toroczkai (2007),
arXiv:0705.0912v1.[14] Z. Burda, A. Krzywicki, and O. C. Martin, Phys. Rev. E
76, 051107 (2007).[15] R. Albert and A.-L. Barabasi, Rev. Mod. Phys. 74, 47

6
(2002).[16] D. C. Liu and J. Nocedal, Mathematical Programming
B 45, 503 (1989).[17] C. J. Tsai and K. D. Jordan, The Journal of Physical
Chemistry 97, 11227 (1993).[18] Interestingly, kinetically constrained models such as fa-
cilitated spins [33], show opposite behavior, in which thelow energy configurations are in many times frozen andhave no access to any other configuraion.
[19] S. Carmi, S. Havlin, S. Kirkpatrick, Y. Shavitt, andE. Shir, Proc. Natl. Acad. Sci. USA 104, 11150 (2007).
[20] R. Bruning and K. Samwer, Phys. Rev. B 46, 11318(1992).
[21] S. Redner, A Guide to First-Passage Processes (Cam-bridge University Press, 2001).
[22] The relaxation time increases with the inverse temper-ature in a super-Arrhenius form even if the initial sitesare weighted by their equilibrium occupation probabilityexp[−Ei/T ].
[23] I. A. Campbell, Phys. Rev. B 33, 3587 (1986).
[24] A. Bunde and S. Havlin, eds., Fractals and Disordered
Systems (Springer, 1996), 2nd ed.[25] D. Stauffer and A. Aharony, Introduction to Percolation
Theory (Taylor and Francis, London, 1992), 2nd ed.[26] S. Kirkpatrick, Rev. Mod. Phys. 45, 574 (1973).[27] R. Cohen, K. Erez, D. ben Avraham, and S. Havlin,
Phys. Rev. Lett. 85, 4626 (2000).[28] S. N. Dorogovtsev, A. V. Goltsev, and J. F. F. Mendes,
Rev. Mod. Phys. 80, 1275 (2008).[29] C. Monthusy and J.-P. Bouchaud, J. Phys. A: Math. Gen.
29, 3847 (1996).[30] Y. Yang and B. Chakraborty (2008), arXiv:0810.2484v2.[31] S. Carmi, S. Havlin, C. Song, K. Wang, and H. A. Makse,
Unpublished results (2008).[32] J. Brujic, R. I. Hermans, K. A. Walther, and J. M. Fer-
nandez, Nature Physics 2, 282 (2006).[33] F. Ritort and P. Sollich, Advances in Physics 52, 219
(2003).