
Energy-Efficient Air-Compressor Sequencing using Non ...
13
1 Energy-Efficient Air-Compressor Sequencing using Non-Linear Optimization. Kelly Kissock, University of California Davis Abinesh Selvacanabady, Sage Energy Consulting ABSTRACT Compressed air systems generate, store and distribute energy in the form of compressed air. In a compressed air system, a single set of compressors can supply power to multiple end users, thereby eliminating the need for numerous and dispersed electric motors. Because of this advantage, compressed air systems are widely used and account for about 10% of U.S. manufacturing electricity use. However, this advantage must be balanced against the relatively low energy efficiency of compressed air systems. For example, this paper develops a method for calculating total compressed air system efficiency as a function of compressor, control, distribution and end- use efficiencies, and demonstrates the method with a case study in which the overall system efficiency is 7%. A major cause of this low overall efficiency is low control efficiency, which is the ratio of useful compressed air power delivered at part-load to the electrical power input. The low control efficiency is a function of low part-load efficiency of individual compressors and losses resulting from the staging of multiple compressors. Multi-compressor control has advanced from pressure band staging to network and automated control. This paper develops a new method of multi- compressor control based on non-linear optimization of compressor performance data. The method uses the non-linear gradient-descent module in a widely available spreadsheet application to create a lookup table for optimum staging at various levels of compressed air demand. The look up table could be easily integrated into supervisory control algorithms. Simulations indicate that the method reduce compressed air system power by 12% compared to traditional automated control. The overall compressor plant control efficiency based on non-linear optimizer control is quite high across the entire range of plant compressed air demand. Overall Efficiency of Compressed Air Systems Compressed air systems generate, store and distribute energy in the form of compressed air. In a compressed air system, a single set of compressors can supply power to multiple end users, thereby eliminating the need for numerous and dispersed electric motors. Because of this advantage, compressed air systems are widely used and account for about 10% of U.S. manufacturing use (Assessment of Market for Compressed Air Energy Services 2001). However, this advantage must be balanced against the relatively low energy efficiency of compressed air systems. To illustrate this point, consider the overall efficiency of a typical compressed air system including a compressor, compressor controls to modify capacity, the compressed air distribution system and the end use.
-
Upload
khangminh22 -
Category
Documents
-
view
0 -
download
0
Transcript of Energy-Efficient Air-Compressor Sequencing using Non ...

1
Energy-Efficient Air-Compressor Sequencing using Non-Linear Optimization.
Kelly Kissock, University of California Davis
Abinesh Selvacanabady, Sage Energy Consulting
ABSTRACT
Compressed air systems generate, store and distribute energy in the form of compressed air. In a
compressed air system, a single set of compressors can supply power to multiple end users, thereby
eliminating the need for numerous and dispersed electric motors. Because of this advantage,
compressed air systems are widely used and account for about 10% of U.S. manufacturing
electricity use. However, this advantage must be balanced against the relatively low energy
efficiency of compressed air systems. For example, this paper develops a method for calculating
total compressed air system efficiency as a function of compressor, control, distribution and end-
use efficiencies, and demonstrates the method with a case study in which the overall system
efficiency is 7%.
A major cause of this low overall efficiency is low control efficiency, which is the ratio of useful
compressed air power delivered at part-load to the electrical power input. The low control
efficiency is a function of low part-load efficiency of individual compressors and losses resulting
from the staging of multiple compressors. Multi-compressor control has advanced from pressure
band staging to network and automated control. This paper develops a new method of multi-
compressor control based on non-linear optimization of compressor performance data. The
method uses the non-linear gradient-descent module in a widely available spreadsheet application
to create a lookup table for optimum staging at various levels of compressed air demand. The
look up table could be easily integrated into supervisory control algorithms. Simulations indicate
that the method reduce compressed air system power by 12% compared to traditional automated
control. The overall compressor plant control efficiency based on non-linear optimizer control is
quite high across the entire range of plant compressed air demand.
Overall Efficiency of Compressed Air Systems Compressed air systems generate, store and distribute energy in the form of compressed air. In a
compressed air system, a single set of compressors can supply power to multiple end users, thereby
eliminating the need for numerous and dispersed electric motors. Because of this advantage,
compressed air systems are widely used and account for about 10% of U.S. manufacturing use
(Assessment of Market for Compressed Air Energy Services 2001). However, this advantage must
be balanced against the relatively low energy efficiency of compressed air systems. To illustrate
this point, consider the overall efficiency of a typical compressed air system including a
compressor, compressor controls to modify capacity, the compressed air distribution system and
the end use.

2
Air Compressor Efficiency
The effectiveness of an air compressor can be calculated as the ratio of the actual to maximum
dimensional efficiencies. The actual dimensional efficiency at full load can be calculated based on
a compressor’s published performance data (CAGI 2004). For example, for a compressor drawing
51 kW to produce 290 cfm at 115 psig at full load, the actual dimensional efficiency is 5.69
cfm/kW. The maximum dimensional efficiency at a compressor’s CAGI rated output pressure can
be calculated from thermodynamic relations. To compress air, the reversible power delivered to
the fluid (air) dWf is the integral of the product of the volume flow rate V and the pressure rise dP.
dWf = ∫ V dP (1)
The integral indicates that the flow work depends on the path of the V dP relationship during
compression (Figure 1). The right compression line represents isentropic compression, in which
air is compressed adiabatically with no internal reversibilities. The left compression line
represents isothermal compression, in which the air is cooled to keep the air temperature constant
during compression. Isentropic compression has no cooling and isothermal compression has the
maximum cooling possible. Actual compression processes lie somewhere in between isentropic
and isothermal compression, and are called polytropic compression. The area to the left of the
compression lines represents the fluid work dWf = ∫ V dP. Isothermal compression requires
minimum compressor work because the cooling is responsible for part of the decrease in volume.
Figure 1. v dP compression.
Substituting the ideal gas relation, Pv = RT, into Equation 1 and integrating for isothermal
compression yields:
Wf = R T ln (P2/P1) (2)
Using Equation 2 at the CAGI rated pressure of P2 = 115 psig and the rated output of 290 cfm, the
maximum dimensional efficiency is 9.53 cfm/kW. Thus, the effectiveness of the compressor at
full load is:
comp = act / max = 5.69 cfm/kW / 9.53 cfm/kW = 0.60 (3)

3
This effectiveness can be considered as the thermal efficiency; the compressor transforms 60% of
the electrical power input into compressed air power.
Control Efficiency
Figure 2 shows typical relationships between fraction input power to the compressor (FP) and
fraction compressed air output (FC) for various types of control. At full output capacity (FC =
1.0), compressors draw full power (FP = 1.0). The power draw at less than full output capacity is a
function of the type of part-load control. The figure shows that at part load, most energy efficient
control mode is on/off, followed by variable speed, load/unload, modulation and blow-off control.
Figure 2. Fraction power versus fraction capacity for different types of part-load control.
Assuming linearity, fraction power, FP, can be calculated from fraction capacity, FC, and fraction
power at no load, FP0, according to the following relationship:
FP = FP0 + (1 – FP0) FC (4)
The control efficiency is the ratio of useful power delivered to required power input at part-load.
Thus, the control efficiency is:
control = Pusefulout / Pinput = FC / [FP0 + (1 – FP0) FC] (5)
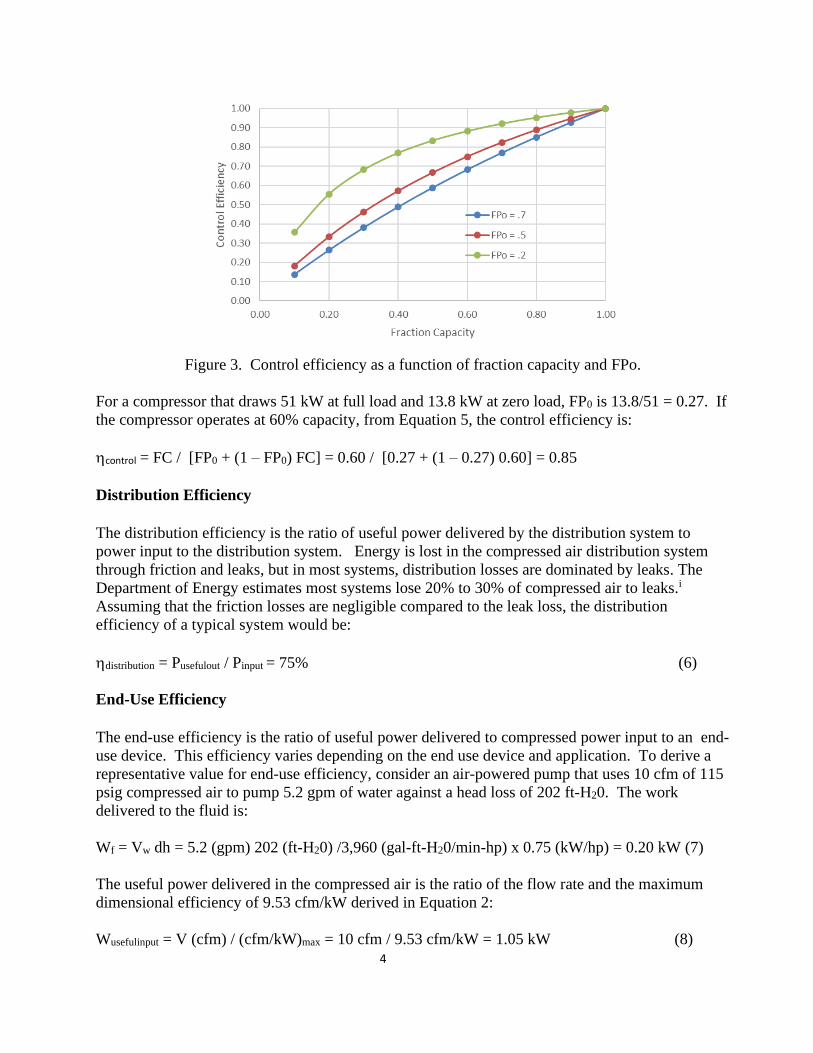
Using this equation, the graph below shows control efficiency versus fraction capacity for control
types with different FP0s. As demonstrated by the graph, air compressor control efficiency varies
widely depending upon compressed air output and the type of part-load control employed.
4
Figure 3. Control efficiency as a function of fraction capacity and FPo.
For a compressor that draws 51 kW at full load and 13.8 kW at zero load, FP0 is 13.8/51 = 0.27. If
the compressor operates at 60% capacity, from Equation 5, the control efficiency is:
control = FC / [FP0 + (1 – FP0) FC] = 0.60 / [0.27 + (1 – 0.27) 0.60] = 0.85
Distribution Efficiency
The distribution efficiency is the ratio of useful power delivered by the distribution system to
power input to the distribution system. Energy is lost in the compressed air distribution system
through friction and leaks, but in most systems, distribution losses are dominated by leaks. The
Department of Energy estimates most systems lose 20% to 30% of compressed air to leaks.i
Assuming that the friction losses are negligible compared to the leak loss, the distribution
efficiency of a typical system would be:
distribution = Pusefulout / Pinput = 75% (6)
End-Use Efficiency
The end-use efficiency is the ratio of useful power delivered to compressed power input to an end-
use device. This efficiency varies depending on the end use device and application. To derive a
representative value for end-use efficiency, consider an air-powered pump that uses 10 cfm of 115
psig compressed air to pump 5.2 gpm of water against a head loss of 202 ft-H20. The work
delivered to the fluid is:
Wf = Vw dh = 5.2 (gpm) 202 (ft-H20) /3,960 (gal-ft-H20/min-hp) x 0.75 (kW/hp) = 0.20 kW (7)
The useful power delivered in the compressed air is the ratio of the flow rate and the maximum
dimensional efficiency of 9.53 cfm/kW derived in Equation 2:
Wusefulinput = V (cfm) / (cfm/kW)max = 10 cfm / 9.53 cfm/kW = 1.05 kW (8)

5
The end-use efficiency is:
enduse = Pusefulout / Pinput = 0.20 kW / 1.05 kW = 0.19 (9)
Overall Compressed Air System Efficiency
Taken together, the overall efficiency of the compressed air system considered here is (Figure 4):
sys = compressor x control x distribution x enduse = 0.60 x 0.85 x 0.75 x 0.91 = 0.07 (10)
Figure 4. Compressed air system efficiency.
The 7% system efficiency in this example does not consider the power requirements for
compressor cooling and compressed air drying, which would further reduce the overall system
efficiency. This example is for a single compressor. Schmidt (Schmidt, Kissock, and Eger 2005)
and Abels (Abels, and Kissock 2011) investigated system performance improvements by
simulating system effects, however those analyses focused on single-compressor systems. In the
sections that follow, we focus on multi-compressor staging, which can increase or decrease the
control efficiency in this example.
Multi-Compressor System Control Multiple-compressor system controls coordinate how individual compressors operate and how
multiple compressors interact to deliver the required pressure and volume of air to a facility. The
three main types of multiple-compressor control strategies are: pressure band control, network
sequencer control, and automatic sequencer control (Murphy, and Kissock 2015).
Pressure-Band Control
The simplest strategy is pressure-band control. Each compressor operates with a distinct control
type (i.e. modulation, load/unload, variable speed as in Figure 2) and makes control decisions based

6
solely on the pressure at the outlet of the compressor. Pressure bands for load/unload compressors
typically span 10 psig with individual compressors overlapping every 5 psig as shown in Figure 5.
This control strategy allows only one compressor to operate at part-load at a time, thus limiting the
quick cycling of load/unload compressors. However, since the lower band of the last cascaded
compressor must still provide high enough pressure to meet plant demand, the lead and lag #1
compressors operate inefficiently at excessively high pressures. This control strategy also results in
very high-pressure fluctuations throughout the compressed air system as the system cascades
between pressure bands.
Figure 5. Cascading Pressure Band Control Strategy
The cascading pressure-band strategy can be modified to accommodate a variable speed compressor
as shown in Figure 6. This strategy achieves energy savings by maximizing the operation of the
VSD compressor at part-load rather than the load/unload compressor. Control gaps can be
minimized by sizing the VSD compressor to have a greater capacity the largest base compressor.
However, this strategy still suffers from large pressure swings, decreased compression efficiency
due to excessively high-pressure bands, and limited compressor response time.
Figure 6. VSD Pressure Band Control Strategy
Network Sequencer Control
Network sequencer control allows individual compressors to communicate with one another by
linking the compressors’ microprocessors together, with one compressor designated as the lead
compressor and all other compressors subordinate, lag compressors. Network sequencer control

7
allows the lead compressor to decide which compressors operate based on which compressors are
currently operating and a single reading of system pressure. This single pressure reading reduces
the variance which often occurs in pressure band control where different compressors sense different
system pressure depending on where they are located throughout the system. Although the system
still makes decisions based primarily on the system pressure, the additional data points of which
compressors are operating allows for tighter overall system pressure control (Figure 7). While
network sequencer control achieves a tighter system pressure band resulting in increased
compression efficiency, it still is not an ideal control strategy. Any of the compressors could operate
partially loaded, regardless of their individual part-load efficiency.
Figure 7. Network Sequencer Control Strategy
Automatic Sequencer Control
Automatic sequencer control ties compressors together at a central controller. In addition to
measuring system pressure, central controllers typically monitor the rate of change of system
pressure, plant air demand, and individual compressor’s output and power draw. Rather than being
responsive to system pressure changes, an automatic sequenced system proactively makes
adjustments based on all of these incoming data. Because of these advantages, automatic sequencer
control is the current state of the art. Previous work has shown savings from automatic sequencer
control compared to other control types of 12%. Thus, this is the baseline against which the non-
linear optimization method developed here is compared.
Non-Linear Multi-compressor Control Optimization The method of non-linear multi-compressor control is applied to three water-cooled, rotary- screw
compressors operating in an actual plant.
Base Data
Compressors 1 and 2 are 200-hp compressors with rated output of 1,000 cfm operating with
modulation to load/unload control. Compressor 3 is a 300-hp compressor with rated output of
1,480 cfm operating with variable-displacement control. The relationship between power input
and compressed air output at part-load conditions can be determined from the published CAGI
performance data (Figure 8). Based on this data, relations between power and fraction full-load
compressed air output (FC) can be developed (Figure 9)

8
Figure 8. Input electrical power versus flow.
Figure 9. Input electrical power versus fraction of full load compressed air capacity (FC).
Optimization
The cost function for the optimization is total power of the three compressors as a function of
compressed air demand based on the relationships shown in Figure 9. Measured data indicated
that plant compressed air demand varied from 600 to 2,400 cfm. A global search for the
configuration of compressors that minimized power over this range of plant demand would be
computationally expensive since each compressor could operate at any capacity within its range.
Thus, a non-linear gradient decent optimization algorithm (Arora 2017) that is available as part of a
popular spreadsheet application was employed. The optimization was constrained to turn on a new
compressor only if there is a call for more compressed air than could be supplied by the compressor(s)
already operating. This constraint simplified the solution so that compressors were not frequently
turned on and off. All default optimization parameters were selected except iteration time was

9
changed from 15 seconds to 30 seconds to reduce the chance that a local minimum would be
falsely accepted as the global minimum. A macro was then developed that looped the optimization
at intervals of 100 scf from 600 to 2,400 scfm by 100 scfm. The optimization took about 7
minutes using a computer with a Pentium i-7 chip and 32 GB of RAM.
Results
The constrained optimization determined compressor combinations for system compressed air demand
between 600 and 2,400 cfm (Figures 10 and 11). The constraint was successful in identifying a
strategy that rarely changed compressor sequences. The results are simple enough to be loaded into a
look-up table for supervisory control of compressor sequencing.
Figure 10: Load vs. Load Distribution (%) Figure 11: Load vs. Load Distribution (scfm)
Non-linear optimization results showing fraction of the full plant compressor load, Figure 10, and
compressed air output supplied by each compressor, Figure 11, for incremental values of plant
compressed air load.
Figures 12 and 13 show actual compressor staging by a third-party air-compressor automation
system. The results are significantly different. At mid loads, the non-linear optimization selected
compressor 3 while the third-party automation system used a variety of compressor combinations.
Similarly, at low loads, the non-linear optimization selected compressor 2 while the automation
system used a variety of compressor combinations.
Figure 12: Load vs. Load Distribution (%) Figure 13: Load vs. Load Distribution (scfm)

10
Third-party sequencer results showing fraction of the full plant compressor load, Figure 12, and
compressed air output supplied by each compressor, Figure 13, for incremental values of plant
compressed air load.
The total compressor power draw for the non-linear and third-party controllers as a function of
load is shown in Figure 14. At plant compressed air demands of 2,400 and 1,500 scfm, the third—
party automatic sequencer selected compressor combinations that resulted in lower total power
draw. At all other compressed air demands, the non-linear optimization found lower power
combinations. The improved performance by the third-party controller at 2,400 and 1,500 scfm
were because the constraint imposed on the non-linear optimization selected simplicity rather than
the absolute minimum.
Figure 14. Total power draw by a third-party sequencer and non-linear optimization for
incremental values of plant compressed air load.
Time trends of measured total compressor power when compressors were controlled by a third-
party sequencer, and simulated total compressor power with compressors were controlled by the
non-linear optimization results are shown in Figure 15. The results are shown in tabular form in
Table 1. The results indicate that the compressor sequencing control from a constrained non-linear
optimization outperform the third-party automatic sequencer.
Figure 15. Time trends of measured (third-party controller) and simulated (non-linear optimization
controller) total compressor power.

11
Table 1. Total measured power draw of third-party and simulated power draw of non-linear
optimization control options, and resulting energy savings.
Estimated Energy Savings (10/13 through 10/27)
3rd Party Optimal Control - Energy Use 124,514 kWh
NLO Control - Energy Use 109,748 kWh
Energy Savings 14,766 kWh
Annual Energy Use Reduction 378,216 kWh
Estimated Savings 12%
Control Efficiency
Multi-compressor control is a way of improving the control efficiency of a compressed air system.
Figure 14 shows fraction full-load power (FP) versus fraction full-load compressed air capacity
(FC) of the air compressors based on CAGI data. Using Equation 5, Figure 15 shows the control
efficiencies (CE) of the compressors versus FC. AC3 has better control efficiency across the entire
capacity range, however the control efficiency is still quite low when the compressor is lightly
loaded.
Figure 14. FP versus FC
Figure 15. Control efficiency (CE) versus FC
The control efficiency of the compressor plant is the FC weighted control efficiencies of all active
compressors. Figure 16 shows the control efficiency of the compressed air plant based on the non-
linear optimized control versus compressed air demand. The relatively high control efficiencies
across the range of plant compressed air demand demonstrates the effectiveness of the non-linear
optimized control.

12
Figure 16. CE based on non-linear optimized control versus compressed air demand.
Summary and Conclusion This paper developed a method for calculating total compressed air system efficiency as a function
of compressor, control, distribution, and end-use efficiencies. The results suggest that the overall
efficiency of compressed air systems for delivering useful power is low. Next, the paper reviewed
traditional pressure-band, network and automated sequencing control options. It then described a
new method to determine compressor sequences that minimized overall power as a function of
compressed air demand using constrained non-linear optimization. The results were simple
enough to be used by supervisory control of compressor sequencing based on system compressed
air demand. The sequences recommended by the non-linear optimization were significantly
different that the actual sequences selected by a third-party automation system. Comparison of the
simulated power from non-linear optimization control with actual power under a third-party
controller suggest that the non-linear optimizer control may reduce overall power consumption.
The overall compressor plant control efficiency based on non-linear optimizer control is quite high
across the entire range of plant compressed air demand.
The next step is to program the look-up table determined by the non-linear optimizer into
supervisory control of these compressors to measure the power draw with this new control. Energy
savings could be then be determined by normalizing power draw by each type of controller by
compressed air system demand. If successful, the work could be extended to optimize and test the
method with different compressor combinations and system demand profiles.
References ——— . 2001. Assessment of Market for Compressed Air Energy Services. DOE/GO-102001-
1197
Compressed Air and Gas Institute (CAGI). www.cagi.org. Last Accessed: April 20th, 2021.
——— . 2004. Compressed Air Tip Sheet #3. DOE/GO-102004-1964

13
Schmidt, C., Kissock, J.K., and Eger, C. 2005. Improving Performance of Compressed Air Systems
Through Calibrated Simulation. West Point, NY: ACEEE Summer Study on Energy in
Industry.
Abels, B. and Kissock, J.K. 2011. “Optimizing Compressed Air Storage for Energy Efficiency.”
SAE International Journal of Materials and Manufacturing.
Murphy, S. and Kissock, J.K. 2015. Simulating Energy Efficient Control of Multiple-Compressor
Compressed Air Systems. New Orleans, LA: Industrial Energy Technology Conference.
Arora, J.S. 2017. More on Numerical Methods for Constrained Optimum Design. Introduction to
Optimum Design. Fourth Edition. IA.